UNITED STATES
SECURITIES AND EXCHANGE COMMISSION
Washington, D.C. 20549
FORM 20-F
(Mark One)
|
☐
|
REGISTRATION STATEMENT PURSUANT TO SECTION 12(b) OR (g) OF THE SECURITIES EXCHANGE ACT OF 1934
|
| OR | |
|
☒
|
ANNUAL REPORT PURSUANT TO SECTION 13 OR 15(d) OF THE SECURITIES EXCHANGE ACT OF 1934
|
|
For the fiscal year ended December 31, 2012
|
|
| OR | |
|
☐
|
TRANSITION REPORT PURSUANT TO SECTION 13 OR 15(d) OF THE SECURITIES EXCHANGE ACT OF 1934
|
|
For the transition period from
to
.
|
|
| OR | |
|
☐
|
SHELL COMPANY REPORT PURSUANT TO SECTION 13 OR 15(d) OF THE SECURITIES
|
|
EXCHANGE ACT OF 1934
|
|
|
Date of event requiring this shell company report
|
|
Commission file number: 001-33356
GAFISA S.A.
(Exact name of Registrant as specified in its charter)
GAFISA S.A.
(Translation of Registrant’s name into English)
The Federative Republic of Brazil
(Jurisdiction of incorporation or organization)
Av. Nações Unidas No. 8,501, 19th Floor
05425-070 – São Paulo, SP – Brazil
phone: + 55 (11) 3025-9000
fax: + 55 (11) 3025-9348
e mail:
ri@gafisa.com
Attn: Alceu Duilio Calciolari – Chief Executive Officer
(Address of principal executive offices)
Securities registered or to be registered pursuant to Section 12(b) of the Act:
|
Title of each class
|
Name of each exchange on which registered
|
|
Common Shares, without par value*
|
New York Stock Exchange
|
* Traded only in the form of American Depositary Shares (as evidenced by American Depositary Receipts), each representing two common shares which are registered under the Securities Act of 1933.
Securities registered or to be registered pursuant to Section 12(g) of the Act:
None
Securities for which there is a reporting obligation pursuant to Section 15(d) of the Act:
None
Indicate the number of outstanding shares of each of the issuer’s classes of capital or common stock as of the close of the period covered by the annual report.
The number of outstanding shares as of December 31, 2012 was:
|
Title of Class
|
Number of Shares Outstanding
|
|
Common Stock
|
433,229,779*
|
* Includes 599,486 common shares that are held in treasury.
Indicate by check mark if the registrant is a well-known seasoned issuer, as defined in Rule 405 of the Securities Act.
|
Yes
☐
|
No
☒
|
If this report is an annual or transition report, indicate by check mark if the registrant is not required to file reports pursuant to Section 13 or 15(d) of the Securities Exchange Act of 1934.
|
Yes
☐
|
No
☒
|
Indicate by check mark whether the registrant (1) has filed all reports required to be filed by Section 13 or 15(d) of the Securities Exchange Act of 1934 during the preceding 12 months (or for such shorter period that the registrant was required to file such reports), and (2) has been subject to such filing requirements for the past 90 days.
|
Yes
x
|
No
o
|
Indicate by check mark whether the registrant has submitted electronically and posted on its corporate Web site, if any, every Interactive Data File required to be submitted and posted pursuant to Rule 405 of Regulation S-T during the preceding 12 months (or for such shorter period that the registrant was required to submit and post such files).
|
Yes
o
|
No
o
|
Indicate by check mark whether the registrant is a large accelerated filer, an accelerated filer, or a non-accelerated filer. See definition of “accelerated filer and large accelerated filer” in Rule 12b-2 of the Exchange Act. (Check one):
|
Large Accelerated Filer
☒
|
Accelerated Filer
☐
|
Non-accelerated Filer
☐
|
Indicate by check mark which basis of accounting the registrant has used to prepare the financial statements included in this filing:
|
☐
|
U.S. GAAP
|
|
☐
|
International Financial Reporting Standards as issued by the International Accounting Standards Board
|
|
☒
|
Other
|
If “Other” has been checked in response to the previous question, indicate by check mark which financial statement item the registrant has elected to follow.
|
☐
Item 17
|
☒
Item 18
|
If this is an annual report, indicate by check mark whether the registrant is a shell company (as defined in Rule 12b-2 of the Exchange Act).
|
Yes
☐
|
No
☒
|
Page
|
|
In this annual report, references to “Gafisa,” “we,” “our,” “us,” “our company” and “the Company” are to Gafisa S.A. and its consolidated subsidiaries (unless the context otherwise requires). In addition, the term “Brazil” refers to the Federative Republic of Brazil, and the phrase “Brazilian government” refers to the federal government of Brazil. All references to “
real
,” “
reais
” or “R$” are to the Brazilian
real
, the official currency of Brazil, and all references to “U.S. dollar,” “U.S. dollars” or “US$” are to U.S. dollars, the official currency of the United States. References to “Brazilian GAAP” or “BR GAAP” are to accounting practices adopted in Brazil and references to “US GAAP” are to generally accepted accounting principles in the United States. Any reference to “financial statement” is related to our consolidated financial statements.
Financial Information
We maintain our books and records in
reais
. Our financial statements were prepared in accordance with Brazilian GAAP, which are based on:
|
|
·
|
Brazilian Law No. 6,404/76, as amended by Brazilian Law No. 9,457/97, Brazilian Law No. 10,303/01, Brazilian Law No. 11,638/07 and Brazilian Law No. 12,431/11, which we refer to hereinafter as “Brazilian corporate law;”
|
|
|
·
|
the rules and regulations of the Brazilian Securities Commission (
Comissão de Valores Mobiliários
), or the “CVM;” and
|
|
|
·
|
the accounting standards issued by the Brazilian Federal Accounting Council (
Conselho Federal de Contabilidade
), or the “CFC” and the Accounting Standards Committee (
Comitê de Pronunciamentos Contábeis
), or the “CPC.”
|
Brazilian corporate law was amended by Law No. 11,638 dated December 28, 2007 in order to facilitate the convergence of Brazilian GAAP with International Financial Reporting Standards, or “IFRS,” and thereafter, the CPC issued new accounting standards that converged Brazilian GAAP with IFRS. Our Brazilian GAAP financial statements as of and for the year ended December 31, 2008 reflect changes introduced by Law 11,638/07 and the new accounting standards issued by the CPC in 2008, which we retroactively applied beginning on January 1, 2006.
Through December 31, 2009, our financial statements were prepared in accordance with Brazilian GAAP in effect at that time. We elected January 1, 2009 as a transition date to full adoption of the new accounting standards (“new CPCs”). Our financial statements as of and for the year ended December 31, 2009 and as of January 1, 2009 have been restated to reflect these adjustments. In preparing our financial statements, we have applied: (1) Guideline OCPC 04 – Application of the Technical Interpretation of ICPC 02 to the Brazilian Real Estate Development Entities – regarding revenue recognition, and the respective costs and expenses arising from real estate development operations over the course of the construction period (percentage of completion method), and (2) CPC 37 (R1), which requires that an entity develops accounting policies based on the standards and interpretations of the CPC. We have adopted all pronouncements, guidelines and interpretations of the CPC issued through December 31, 2012. Consequently, our financial statements are prepared in accordance with Brazilian GAAP, which allows revenue recognition on a percentage of completion basis for construction companies (i.e., revenue is recorded in accordance with the percentage of financial evolution of the construction project), and are therefore not compliant with IFRS as issued by the International Accounting Standards Board (“IASB”), which require revenue recognition on a delivery basis (i.e., revenue is recorded upon transferring the ownership risks and benefits to the purchaser of real estate, usually after the construction is completed and the unit is delivered). We understand that the IASB continues to consider alternatives to its current revenue recognition principles applicable to construction companies and we continue to follow developments as proposed by the CPC and other accounting standards bodies in other jurisdictions.
Reconciliations and descriptions of the effect of the transition to the newly adopted Brazilian GAAP are provided in Note 2.1.3 to our 2010 audited financial statements not included in this annual report.
Brazilian GAAP differs in significant respects from US GAAP and IFRS. The notes to our financial statements included elsewhere in this annual report contain a reconciliation of equity and net income (loss) from Brazilian GAAP to US GAAP. Unless otherwise indicated, all financial information of our company included in this annual report is derived from our Brazilian GAAP financial statements.
Our consolidated financial statements reflect statement of income (loss) and balance sheet information for all of our subsidiaries, and also separately disclose the interest of non-controlling shareholders. With respect to our jointly-controlled entities, in accordance with the applicable shareholders’ agreements, we consolidate statement of income (loss) and balance sheet information relating to those entities in proportion to the equity interest we hold in the capital of such investees for Brazilian GAAP purposes.
Market Information
Certain industry, demographic, market and competitive data, including market forecasts, used in this annual report were obtained from internal surveys, market research, publicly available information and industry publications. We have made these statements on the basis of information from third-party sources that we believe are reliable, such as the Brazilian Property Studies Company (
Empresa Brasileira de Estudos de Patrimônio
), or the “EMBRAESP,” the Association of Managers of Real Estate Companies (
Associação de Dirigentes de Empresas do Mercado Imobiliário
), or the “ADEMI,” the Getulio Vargas Foundation (
Fundaçao Getulio Vargas
), or the “FGV,” the National Bank of Economic and Social Development (
Banco Nacional de Desenvolvimento Econômico e Social
), or “BNDES,” the Real Estate Companies’ Union (
Sindicato das Empresas de Compra, Venda, Locação e Administração de Imóveis Residenciais e Comerciais
), or the “SECOVI,” the Brazilian Institute of Geography and Statistics (
Instituto Brasileiro de Geografia e Estatística
), or the “IBGE” and the Brazilian Central Bank (
Banco Central do Brasil
), or the “Central Bank,” among others. Industry and government publications, including those referenced here, generally state that the information presented therein has been obtained from sources believed to be reliable, but that the accuracy and completeness of such information is not guaranteed. Although we have no reason to believe that any of this information or these reports are inaccurate in any material respect, such information has not been independently verified by us. Accordingly, we do not make any representation as to the accuracy of such information.
Rounding and Other Information
Some percentages and certain figures included in this annual report have been subject to rounding adjustments. Accordingly, figures shown as totals in certain tables in this annual report may not be an arithmetic aggregation of the figures that precede them.
In this annual report, all references to “contracted sales” are to the aggregate amount of sales resulting from all agreements for the sale of units (including residential communities and land subdivisions) entered into during a certain period, including new units and units in inventory. Further, in this annual report we use the term “value of launches” as a measure of our performance. Value of launches is not a GAAP measurement. Value of launches, as used in this annual report, is calculated by multiplying the total numbers of units in a real estate development by the average unit sales price.
All references to “potential sales value” are to our estimates of the total amount obtained or that can be obtained from the sale of all launched units of a certain real estate development, calculated by multiplying the number of units in a development by the sale price of the unit. Investors should be aware that our potential sales value may not be realized or may significantly differ from the amount of contracted sales, since the total number of units actually sold may be lower than the number of units launched and/or the contracted sales price of each unit may be lower than the launching price.
In addition, we present information in square meters in this annual report. One square meter is equal to approximately 10.76 square feet.
The statements contained in this annual report in relation to our plans, forecasts, expectations regarding future events, strategies, and projections, are forward-looking statements which involve risks and uncertainties and which are therefore not guarantees of future results. Our estimates and forward-looking statements are mainly based on our current expectations and estimates on projections of future events and trends, which affect or may affect our businesses and results of operations. Although we believe that these estimates and forward-looking statements are based upon reasonable assumptions, they are subject to several uncertainties and are made in light of information currently available to us. Our estimates and forward-looking statements may be influenced by the following factors, among others:
|
|
·
|
changes in the overall economic conditions, including employment levels, population growth and consumer confidence;
|
|
|
·
|
changes in real estate market prices and demand, estimated budgeted costs and the preferences and financial condition of our customers;
|
|
|
·
|
demographic factors and available income;
|
|
|
·
|
our ability to repay our indebtedness and comply with our financial obligations;
|
|
|
·
|
our ability to arrange financing and implement our expansion plan;
|
|
|
·
|
our ability to compete and conduct our businesses in the future;
|
|
|
·
|
changes in our business;
|
|
|
·
|
inflation and interest rate fluctuations;
|
|
|
·
|
changes in the laws and regulations applicable to the real estate market;
|
|
|
·
|
government interventions, resulting in changes in the economy, taxes, rates or regulatory environment;
|
|
|
·
|
other factors that may affect our financial condition, liquidity and results of our operations; and
|
|
|
·
|
other risk factors discussed under “Item 3. Key Information—D. Risk Factors.”
|
The words “believe,” “may,” “will,” “estimate,” “continue,” “anticipate,” “intend,” “expect” and similar words are intended to identify estimates and forward-looking statements. Estimates and forward-looking statements speak only as of the date they were made, and we undertake no obligation to update or to review any estimate and/or forward-looking statement because of new information, future events or other factors. Estimates and forward-looking statements involve risks and uncertainties and are not guarantees of future performance. Our future results may differ materially from those expressed in these estimates and forward-looking statements. In light of the risks and uncertainties described above, the estimates and forward-looking statements discussed in this annual report might not occur and our future results and our performance may differ materially from those expressed in these forward-looking statements due to, inclusive of, but not limited to, the factors mentioned above.
Not applicable.
Not applicable.
A. Selected Financial Data
The following selected financial data have been derived from our audited consolidated financial statements.
Our financial statements are prepared in accordance with Brazilian GAAP, which differs in significant respects from US GAAP. For a discussion of the significant differences relating to these consolidated financial statements and a reconciliation of net income (loss) and equity from Brazilian GAAP to US GAAP, see notes to our consolidated financial statements included elsewhere in this annual report. See also “Presentation of Financial and Other Information.”
This financial information should be read in conjunction with our consolidated financial statements and the related notes included elsewhere in this annual report.
The following table sets forth financial information as of and for the years ended December 31, 2012, 2011, 2010 and 2009 which has been prepared in accordance with Brazilian GAAP in effect as of December 31, 2012. Certain information below is presented in accordance with US GAAP.
|
As of and for the year ended December 31,
|
||||||||||||||||
|
2012
|
2011
|
2010
|
2009
|
|||||||||||||
|
(in thousands except per share, per ADS
and operating data)
|
||||||||||||||||
|
Consolidated Income Statement Data:
|
||||||||||||||||
|
Brazilian GAAP:
|
||||||||||||||||
|
Net operating revenue
|
R$ | 3,953,282 | R$ | 2,940,506 | R$ | 3,403,050 | R$ | 3,022,346 | ||||||||
|
Operating costs
|
(2,941,025 | ) | (2,678,338 | ) | (2,460,918 | ) | (2,143,762 | ) | ||||||||
|
Gross profit
|
1,012,257 | 262,168 | 942,132 | 878,584 | ||||||||||||
|
Operating expenses, net
|
(840,452 | ) | (865,092 | ) | (549,403 | ) | (600,815 | ) | ||||||||
|
Financial expenses, net
|
(206,940 | ) | (159,903 | ) | (82,117 | ) | (111,006 | ) | ||||||||
|
Income (loss) before income and social contribution taxes
|
(35,135 | ) | (762,827 | ) | 310,612 | 166,763 | ||||||||||
|
Income and social contribution taxes
|
(41,228 | ) | (142,362 | ) | (22,128 | ) | (37,812 | ) | ||||||||
|
Net income (loss) for the year
|
(76,363 | ) | (905,189 | ) | 288,484 | 142,962 | ||||||||||
|
Net income for the year attributable to non-controlling interest
|
48,141 | 39,679 | 23,919 | 41,222 | ||||||||||||
|
Net income (loss) for the year attributable to owners of Gafisa S.A.
|
R$ | (124,504 | ) | R$ | (944,868 | ) | R$ | 264,565 | R$ | 101,740 | ||||||
|
Share and ADS data(1):
|
||||||||||||||||
|
Per common share data— R$ per share:
|
||||||||||||||||
|
Earnings (loss) per share—Basic
|
(0.2880 | ) | (2.1893 | ) | 0.6415 | 0.3808 | ||||||||||
|
Earnings (loss) per share—Diluted
|
(0.2880 | ) | (2.1893 | ) | 0.6109 | 0.3242 | ||||||||||
|
Weighted average number of shares outstanding—in thousands
|
432,246 | 431,586 | 412,434 | 267,174 | ||||||||||||
|
Dividends and interest on shareholders’ equity declared—in thousands of R$
|
— | — | 98,812 | 50,716 | ||||||||||||
|
Earnings (loss) per share—R$ per share
|
(0.2878 | ) | (2.1867 | ) | 0.6140 | 0.6100 | ||||||||||
|
Number of common shares outstanding as at end of period—in thousands*
|
432,630 | 432,099 | 430,915 | 166,778 | ||||||||||||
|
Earnings (loss) per ADS—R$ per ADS(2)
|
(0.5756 | ) | (4.3734 | ) | 1.2279 | 1.2200 | ||||||||||
|
US GAAP:
|
||||||||||||||||
|
Net operating revenue
|
3,930,729 | 3,250,227 | 1,929,130 | 1,700,940 | ||||||||||||
|
Operating costs
|
(3,008,345 | ) | (2,743,144 | ) | (1,472,085 | ) | (1,256,317 | ) | ||||||||
|
Gross profit
|
922,384 | 507,083 | 457,045 | 444,623 | ||||||||||||
|
As of and for the year ended December 31,
|
||||||||||||||||
|
2012
|
2011
|
2010
|
2009
|
|||||||||||||
|
(in thousands except per share, per ADS
and operating data)
|
||||||||||||||||
|
Operating expenses, net
|
(859,657 | ) | (862,975 | ) | (575,776 | ) | (575,024 | ) | ||||||||
|
Financial expenses, net
|
(191,414 | ) | (97,370 | ) | (97,810 | ) | (102,925 | ) | ||||||||
|
Loss before income and social contribution taxes and equity pick-up
|
(128,687 | ) | (453,262 | ) | (216,541 | ) | (233,326 | ) | ||||||||
|
Income and social contribution taxes
|
(68,733 | ) | (334,410 | ) | 100,811 | 40,367 | ||||||||||
|
Equity pick-up
|
108,265 | 59,687 | 42,161 | 88,913 | ||||||||||||
|
Net loss for the year
|
(89,155 | ) | (727,985 | ) | (73,569 | ) | (104,046 | ) | ||||||||
|
Net income attributable to non-controlling interests
|
32,048 | 27,784 | 21,214 | 30,333 | ||||||||||||
|
Net loss attributable to owners of Gafisa S.A.(3)
|
(121,203 | ) | (755,769 | ) | (94,783 | ) | (134,379 | ) | ||||||||
|
Per share and ADS data(1):
|
||||||||||||||||
|
Per common share data—R$ per share:
|
||||||||||||||||
|
Loss per share—Basic
|
(0.2804 | ) | (1.7511 | ) | (0.2298 | ) | (0.5030 | ) | ||||||||
|
Loss per share—Diluted
|
(0.2804 | ) | (1.7511 | ) | (0.2298 | ) | (0.5030 | ) | ||||||||
|
Weighted average number of shares outstanding — in thousands
|
432,246 | 431,586 | 412,434 | 267,174 | ||||||||||||
|
Dividends declared and interest on equity
|
— | — | 98,812 | 50,716 | ||||||||||||
|
Per ADS data—R$ per ADS(2):
|
||||||||||||||||
|
Loss per ADS—Basic(2)
|
(0.5608 | ) | (3.5023 | ) | (0.4596 | ) | (1.006 | ) | ||||||||
|
Loss per ADS—Diluted(2)
|
(0.5608 | ) | (3.5023 | ) | (0.4596 | ) | (1.006 | ) | ||||||||
|
Weighted average number of ADSs outstanding—in thousands
|
216,123 | 215,793 | 206,217 | 133,587 | ||||||||||||
|
Dividends and interest on equity declared
|
— | — | 98,812 | 50,716 | ||||||||||||
|
Consolidated Balance Sheet Data:
|
||||||||||||||||
|
Brazilian GAAP:
|
||||||||||||||||
|
Cash, cash equivalents and short-term investments
|
R$ | 1,681,288 | R$ | 983,660 | R$ | 1,201,148 | R$ | 1,424,053 | ||||||||
|
Current and non-current properties for sale
|
2,460,683 | 2,847,290 | 2,206,072 | 1,748,457 | ||||||||||||
|
Working capital(4)
|
4,339,100 | 2,498,419 | 4,808,337 | 3,195,413 | ||||||||||||
|
Total assets
|
9,070,994 | 9,506,624 | 9,040,791 | 7,455,421 | ||||||||||||
|
Total debt(5)
|
3,916,346 | 3,755,810 | 3,290,109 | 3,122,132 | ||||||||||||
|
Total equity
|
2,692,367 | 2,747,094 | 3,632,172 | 2,384,181 | ||||||||||||
|
US GAAP:
|
||||||||||||||||
|
Cash and cash equivalents, short-term investments and restricted short-term investments
|
1,566,042 | 858,351 | 1,127,382 | 1,395,668 | ||||||||||||
|
Current and non-current properties for sale
|
3,260,711 | 3,847,858 | 3,690,328 | 3,068,738 | ||||||||||||
|
Working capital(4)
|
3,419,171 | 3,353,108 | 3,940,576 | 2,762,165 | ||||||||||||
|
Total assets
|
8,694,612 | 8,861,145 | 8,482,267 | 7,320,057 | ||||||||||||
|
Total debt(5)
|
3,642,920 | 3,444,478 | 3,081,276 | 3,057,792 | ||||||||||||
|
Total Gafisa equity
|
1,619,276 | 1,719,948 | 2,611,844 | 1,679,418 | ||||||||||||
|
Equity of non-controlling interests
|
53,222 | 21,174 | 20,833 | 18,426 | ||||||||||||
|
Total equity
|
1,672,498 | 1,741,122 | 2,632,677 | 1,697,844 | ||||||||||||
|
Consolidated cash flow provided by (used in):
|
||||||||||||||||
|
Brazilian GAAP
|
||||||||||||||||
|
Operating activities
|
650,945 | (808,711 | ) | (1,079,643 | ) | (692,084 | ) | |||||||||
|
Investing activities
|
(322,894 | ) | (6,921 | ) | 122,888 | (762,164 | ) | |||||||||
|
Financing activities
|
161,488 | (696,848 | ) | 920,197 | 1,555,745 | |||||||||||
|
Operating data:
|
||||||||||||||||
|
Number of new developments
|
35 | 49 | 127 | 69 | ||||||||||||
|
Potential sales value(6)
|
2,951,961 | 3,526,298 | 4,491,835 | 2,301,224 | ||||||||||||
|
Number of units launched(7)
|
8,947 | 12,224 | 22,233 | 10,810 | ||||||||||||
|
Launched usable area (m2)(8)
|
3,153,251 | 2,250,725 | 3,008,648 | 1,415,110 | ||||||||||||
|
Units sold
|
7,157 | 9,844 | 20,744 | 21,952 | ||||||||||||
|
*
|
Common shares held in Treasury are not included.
|
|
(1)
|
On February 22, 2010, a stock split of our common shares was approved, giving effect to the split of one existing share into two new issued shares, increasing the number of shares from 167,077,137 to 334,154,274. All Brazilian GAAP and US GAAP information relating to the numbers of shares and ADSs have been adjusted retroactively to reflect the share split on February 22, 2010. All Brazilian GAAP and US GAAP earnings per share and ADS amounts have been adjusted retroactively to reflect the share split on February 22, 2010.
|
|
(2)
|
Earnings (loss) per ADS is calculated based on each ADS representing two common shares.
|
|
(3)
|
The following table sets forth reconciliation from US GAAP net loss to US GAAP net loss available to common shareholders:
|
|
As of and for the year ended December 31,
|
||||||||||||||||
|
2012
|
2011
|
2010
|
2009
|
|||||||||||||
|
Reconciliation from US GAAP net loss attributable to Gafisa to US GAAP net loss available to common shareholders (Basic):
|
||||||||||||||||
|
US GAAP net loss (Basic)
|
(121,203 | ) | (755,769 | ) | (94,783 | ) | (134,379 | ) | ||||||||
|
US GAAP net loss available to common shareholders (Basic loss)
|
(121,203 | ) | (755,769 | ) | (94,783 | ) | (134,379 | ) | ||||||||
|
Reconciliation from US GAAP net loss attributable to Gafisa to US GAAP net loss available to common shareholders (Diluted):
|
||||||||||||||||
|
US GAAP net loss (Diluted)
|
(121,203 | ) | (755,769 | ) | (94,783 | ) | (134,379 | ) | ||||||||
|
US GAAP net loss available to common shareholders (Diluted earnings (loss))
|
(121,203 | ) | (755,769 | ) | (94,783 | ) | (134,379 | ) | ||||||||
|
*
|
Pursuant to ASC 260-10-S99-2 “The Effect on the Calculation of Earnings per Share for the Redemption or Induced Conversion of Preferred Stock,” following the exchange of Class A for Class G Preferred shares, the excess of the fair value of the consideration transferred to the holders of the preferred stock over the carrying amount of the preferred stock in the balance sheet was subtracted from net income to arrive at net earnings available to common shareholders in the calculation of earnings per share. For purposes of displaying earnings per share, the amount is treated in a manner similar to the treatment of dividends paid to the holders of the preferred shares. The conceptual return or dividends on preferred shares are deducted from net earnings to arrive at net earnings available to common shareholders.
|
|
(4)
|
Working capital equals current assets less current liabilities.
|
|
(5)
|
Total debt comprises short-term and long-term of loans, financings and debentures.
|
|
(6)
|
Potential sales value is calculated by multiplying the number of units sold in a development by the unit sales price.
|
|
(7)
|
The units delivered in exchange for land pursuant to swap agreements are not included.
|
|
(8)
|
One square meter is equal to approximately 10.76 square feet.
|
The following table sets forth financial information as of and for the year ended December 31, 2008 and have been prepared in accordance with Brazilian GAAP in effect at such time. See “Presentation of Financial and Other Information.” Significant changes were introduced to Brazilian GAAP in 2010 which were applied retroactively to January 1, 2009 but not to prior periods. Therefore the financial information presented below as of and for the year ended December 31, 2008 is not comparable to the financial information as of and for the years ended December 31, 2012, 2011, 2010 and 2009 presented above. Certain information below is presented in accordance with US GAAP.
|
As of and for the year
ended December 31, 2008(1)
|
||||
|
(in thousands except per share, per ADS and operating data)
|
||||
|
Consolidated Income Statement Data:
|
||||
|
Brazilian GAAP:
|
||||
|
Gross operating revenue
|
R$ | 1,805,468 | ||
|
Net operating revenue
|
1,740,404 | |||
|
Operating costs
|
(1,214,401 | ) | ||
|
Gross profit
|
526,003 | |||
|
Operating expenses, net
|
(357,798 | ) | ||
|
Financial income, net
|
7,815 | |||
|
Income before taxes on income and non-controlling interest
|
176,020 | |||
|
Taxes on income
|
(43,397 | ) | ||
|
As of and for the year
ended December 31, 2008(1)
|
||||
|
(in thousands except per share, per ADS and operating data)
|
||||
|
Non-controlling interest
|
(22,702 | ) | ||
|
Net income
|
109,921 | |||
|
Share and ADS data (2):
|
||||
|
Per common share data—R$ per share:
|
||||
|
Earnings per share—Basic
|
— | |||
|
Earnings per share—Diluted
|
— | |||
|
Weighted average number of shares outstanding—in thousands
|
— | |||
|
Dividends and interest on equity declared
|
26,104 | |||
|
Earnings per share—R$ per share
|
0.8458 | |||
|
Number of common shares outstanding as at end of period—in thousands
|
129,962 | |||
|
Earnings per ADS—R$ per ADS(3)
|
1.6916 | |||
|
US GAAP as restated:
|
||||
|
Net operating revenue
|
1,306,626 | |||
|
Operating costs
|
(979,603 | ) | ||
|
Gross profit
|
327,023 | |||
|
Operating expenses, net
|
(114,658 | ) | ||
|
Financial income, net
|
76,653 | |||
|
Income before income taxes, equity in results and non-controlling interest
|
289,018 | |||
|
Taxes on income
|
(49,279 | ) | ||
|
Equity in results
|
29,873 | |||
|
Net income
|
269,612 | |||
|
Less: Net income attributable to non-controlling interests
|
(17,485 | ) | ||
|
Net income attributable to Gafisa
|
252,127 | |||
|
Per share and ADS data:
|
||||
|
Per preferred share data—R$ per share:
|
||||
|
Earnings per share—Basic
|
— | |||
|
Earnings per share—Diluted
|
— | |||
|
Weighted average number of shares outstanding—in thousands
|
||||
|
Per common share data—R$ per share:
|
||||
|
Earnings per share—Basic
|
0.9977 | |||
|
Earnings per share—Diluted
|
0.5895 | |||
|
Weighted average number of shares outstanding—in thousands
|
259,341 | |||
|
Dividends declared and interest on equity
|
26,104 | |||
|
Per ADS data—R$ per ADS(2):
|
||||
|
Earnings per ADS—Basic(2)
|
1.9954 | |||
|
Earnings per ADS—Diluted(2)
|
1.1790 | |||
|
Weighted average number of ADSs outstanding—in thousands
|
129,671 | |||
|
Dividends and interest on equity declared
|
26,104 | |||
|
Balance sheet data:
|
||||
|
Brazilian GAAP:
|
||||
|
Cash, cash equivalents and short-term investments
|
R$ | 605,502 | ||
|
Current and non-current properties for sale
|
2,028,976 | |||
|
Working capital(3)
|
2,448,305 | |||
|
Total assets
|
5,538,858 | |||
|
Total debt(4)
|
1,552,121 | |||
|
Total equity
|
1,612,419 | |||
|
As of and for the year
ended December 31, 2008(1)
|
||||
|
(in thousands except per share, per ADS and operating data)
|
||||
|
US GAAP:
|
||||
|
Cash and cash equivalents, short-term investments and restricted short-term investments
|
R$ | 587,432 | ||
|
Current and non-current properties for sale
|
2,663,737 | |||
|
Working capital(3)
|
2,653,630 | |||
|
Total assets
|
5,381,926 | |||
|
Total debt(4)
|
1,525,138 | |||
|
Total Gafisa equity
|
1,465,866 | |||
|
Non-controlling interests
|
420,165 | |||
|
Total equity
|
1,886,031 | |||
|
Consolidated cash flow provided by (used in):
|
||||
|
Brazilian GAAP:
|
||||
|
Operating activities
|
(812,512 | ) | ||
|
Investing activities
|
(78,300 | ) | ||
|
Financing activities
|
911,817 | |||
|
Operating data:
|
||||
|
Number of new developments
|
64 | |||
|
Potential sales value(5)
|
2,763,043 | |||
|
Number of units launched(6)
|
10,963 | |||
|
Launched usable area (m2)(7)(8)
|
1,838,000 | |||
|
Sold usable area (m2)(7)(8)
|
1,339,729 | |||
|
Units sold
|
11,803 | |||
|
(1)
|
Our Brazilian GAAP financial statements as of and for the year ended December 31, 2008 reflects the changes introduced by Law 11,638/07 and the new accounting standards issued by the CPC in 2008. The Brazilian GAAP financial information was restated to correct the accounting treatment for net income attributable to non-controlling interest related to an unincorporated venture to financial expenses.
|
|
(2)
|
Earnings per ADS is calculated based on each ADS representing two common shares.
|
|
(3)
|
Working capital equals current assets less current liabilities.
|
|
(4)
|
Total debt comprises loans, financings and short term and long term debentures.
|
|
(5)
|
Potential sales value is calculated by multiplying the number of units sold in a development by the unit sales price.
|
|
(6)
|
The units delivered in exchange for land pursuant to swap agreements are not included.
|
|
(7)
|
One square meter is equal to approximately 10.76 square feet.
|
|
(8)
|
Does not include data for FIT, Tenda and Bairro Novo.
|
Exchange Rates
All transactions involving foreign currency in the Brazilian market, whether carried out by investors resident or domiciled in Brazil or investors resident or domiciled abroad, must now be conducted on the consolidated exchange market through institutions authorized by the Central Bank and subject to the rules of the Central Bank.
The Central Bank has allowed the
real
to float freely against the U.S. dollar since January 15, 1999. Since the beginning of 2001, the Brazilian exchange market has been increasingly volatile, and, until early 2003, the value of the
real
declined relative to the U.S. dollar, primarily due to financial and political instability in Brazil and Argentina. According to the Central Bank, in 2005, 2006 and 2007, however, the period-end value of the
real
appreciated in relation to the U.S. dollar 13.4%, 9.5% and 20.7%, respectively. In 2008, the period-end value of the
real
depreciated in relation to the U.S. dollar by 24.2%. In 2009 and 2010, the period-end value of the
real
appreciated in relation to the U.S. dollar by 34.2% and 4.3%. In 2011, the
real
depreciated against the U.S. dollar by 11.2%. In 2012, the
real
depreciated by 8.9% against the U.S. dollar. On December 31, 2012, the period-end
real
/U.S. dollar exchange rate was R$2.0435 per U.S. $1.00. Although the Central Bank has intervened occasionally to control unstable movements in the foreign exchange rates, the exchange market may continue to be volatile as a result of this instability or other factors, and, therefore, the
real
may substantially decline or appreciate in value in relation to the U.S. dollar in the future.
The following table shows the selling rate, expressed in
reais
per U.S. dollar (R$/US$), for the periods and dates indicated.
|
Period-end
|
Average for period(1)
|
Low
|
High
|
|||||||||||||
|
(per U.S. dollar)
|
||||||||||||||||
|
Year Ended:
|
||||||||||||||||
|
December 31, 2008
|
R$ | 2.337 | R$ | 2.030 | R$ | 1.559 | R$ | 2.500 | ||||||||
|
December 31, 2009
|
1.741 | 2.062 | 1.702 | 2.422 | ||||||||||||
|
December 31, 2010
|
1.665 | 1.759 | 1.655 | 1.880 | ||||||||||||
|
December 31, 2011
|
1.876 | 1.718 | 1.535 | 1.902 | ||||||||||||
|
December 31, 2012
|
2.044 | 1.907 | 1.702 | 2.112 | ||||||||||||
|
Month Ended:
|
||||||||||||||||
|
October 2012
|
2.031 | 2.030 | 2.022 | 2.038 | ||||||||||||
|
November 2012
|
2.107 | 2.069 | 2.031 | 2.107 | ||||||||||||
|
December 2012
|
2.044 | 2.078 | 2.044 | 2.112 | ||||||||||||
|
January 2013
|
1.988 | 2.018 | 1.988 | 2.047 | ||||||||||||
|
February 2013
|
1.975 | 1.973 | 1.957 | 1.989 | ||||||||||||
|
March 2013
|
2.014 | 1.986 | 1.953 | 2.019 | ||||||||||||
|
April 2013 (through April 11)
|
1.973
|
1.998
|
1.973
|
2.024
|
||||||||||||
|
(1)
|
Average of the lowest and highest rates in the periods presented.
|
|
|
Source: Central Bank.
|
On April 11, 2013, the selling rate was R$1.973 to US$1.00. The
real
/dollar exchange rate fluctuates and, therefore, the selling rate at April 11, 2013 may not be indicative of future exchange rates.
Brazilian law provides that, whenever there is a serious imbalance in Brazil’s balance of payments or serious reasons to foresee such imbalance, temporary restrictions may be imposed on remittances of foreign capital abroad. For approximately six months in 1989, and early 1990, for example, the Federal Government froze all dividend and capital repatriations that were owed to foreign equity investors. These amounts were subsequently released in accordance with Federal Government directives. There can be no assurance that similar measures will not be taken by the Federal Government in the future.
Not applicable.
C. Reasons for the Offer and Use of Proceeds
Not applicable.
D. Risk Factors
This section is intended to be a summary of the more detailed discussion included elsewhere in this annual report. Our business, results of operations, financial condition or prospects could be adversely affected if any of these risks occurs, and as a result, the trading price of our common shares and ADSs could decline. The risks described below are those known to us and those that we currently believe may materially affect us.
Risks Relating to Our Business and to the Brazilian Real Estate Industry
Our business, results of operations, financial condition and the market price of our common shares or the ADSs may be adversely affected by weaknesses in general economic, real estate and other conditions.
The residential homebuilding and land development industry is cyclical and is significantly affected by changes in general and local economic conditions, such as:
|
|
·
|
employment levels;
|
|
|
·
|
population growth;
|
|
|
·
|
consumer demand, confidence, stability of income levels and interest rates;
|
|
|
·
|
availability of financing for land home site acquisitions and the availability of construction and permanent mortgages;
|
|
|
·
|
inventory levels of both new and existing homes;
|
|
|
·
|
supply of rental properties; and
|
|
|
·
|
conditions in the housing resale market.
|
Furthermore, the market value of undeveloped land, buildable lots and housing inventories held by us can fluctuate significantly as a result of changing economic and real estate market conditions. If there are significant adverse changes in economic or real estate market conditions, we will have to sell homes at a loss or hold land in inventory longer than planned.
For example, in 2008, the global financial crisis adversely impacted Brazil’s gross domestic product, or “GDP,” resulting in a decrease in both the number of developments launched and the rate of sales of our units. Worldwide financial market volatility may also adversely impact government plans for the Brazilian real estate industry, which may have a material adverse effect on our business, our financial condition and results of operations.
We operate in a highly competitive industry and our failure to compete effectively could adversely affect our business.
The Brazilian real estate industry is highly competitive and fragmented. We compete with several developers on the basis of land availability and location, price, funding, design, quality, and reputation as well as for partnerships with other developers. Because our industry does not have high barriers to entry, new competitors, including international companies working in partnership with Brazilian developers, may enter into the industry, further intensifying this competition. Some of our current potential competitors may have greater financial and other resources than we do. Furthermore, a significant portion of our real estate development and construction activity is conducted in the states of São Paulo Rio de Janeiro, Minas Gerais and Salvador, areas where the real estate market is highly competitive due to a scarcity of properties in desirable locations and the relatively large number of local competitors. If we are not able to compete effectively, our business, our financial condition and the results of our operations could be adversely affected.
Problems with the construction and timely completion of our real estate projects, as well as third party projects for which we have been hired as a contractor, may damage our reputation, expose us to civil liability and decrease our profitability.
The quality of work in the construction of our real estate projects and the timely completion of these projects are major factors that affect our reputation, and therefore our sales and growth. We may experience delays in the construction of our projects or there may be defects in materials and/or workmanship. Any defects could delay the completion of our real estate projects, or, if such defects are discovered after completion, expose us to civil lawsuits by purchasers or tenants. These factors may also adversely affect our reputation as a contractor for third party projects, since we are responsible for our construction services and the building itself for five years. Construction projects often involve delays in obtaining, or the inability to obtain, permits or approvals from the relevant authorities. In addition, construction projects may also encounter delays due to adverse weather conditions, natural disasters, fires, delays in the provision of materials or labor, accidents, labor disputes, unforeseen engineering, environmental or geological problems, disputes with contractors and subcontractors, unforeseen conditions at construction sites, disputes with surrounding landowners, or other events. In addition, we may encounter previously unknown conditions at or near our construction sites that may delay or prevent construction of a particular project. If we encounter a previously unknown condition at or near a site, we may be required to correct the condition prior to continuing construction and there may be a delay in the construction of a particular project. The occurrence of any one or more of these problems in our real estate projects could adversely affect our reputation and our future sales.
We may incur construction and other development costs for a project that exceeds our original estimates due to increases over time in interest rates, real estate taxes or costs associated with materials and labor, among others. We may not be able to pass these increased costs on to purchasers. Construction delays, scarcity of skilled workers, default and or bankruptcy of third party contractors, cost overruns and adverse conditions may also increase project development costs. In addition, delays in the completion of a project may result in a delay in the commencement of cash flow, which would increase our capital needs.
Our inability to acquire adequate capital to finance our projects could delay the launch of new projects and adversely affect our business.
We expect that the continued expansion and development of our business will require significant capital, including working capital, which we may be unable to obtain on acceptable terms, or at all, to fund our capital expenditures and operating expenses, including working capital needs. We may fail to generate sufficient cash flow from our operations to meet our cash requirements. Furthermore, our capital requirements may vary materially from those currently planned if, for example, our revenues do not reach expected levels or we have to incur unforeseen capital expenditures and make investments to maintain our competitive position. If this is the case, we may require additional financing sooner than anticipated, or we may have to delay some of our new development and expansion plans or otherwise forgo market opportunities. Future borrowing instruments such as credit facilities are likely to contain restrictive covenants, particularly in light of the recent economic downturn and unavailability of credit, and/or may require us to pledge assets as security for borrowings under those facilities. Our inability to obtain additional capital on satisfactory terms may delay or prevent the expansion of our business, which would have an adverse effect on our business. As of December 31, 2012, our net debt plus payable to venture partners (indebtedness from debentures, working capital, project financing and payables to venture partners balance, net of our cash position) was R$2,558.8 million: our cash and cash equivalents and short-term investments were R$1,681.3 million and our total debt was R$3,916.3 million and obligations to venture partners were R$323.7 million.
Changing market conditions may adversely affect our ability to sell our property inventories at expected prices, which could reduce our margins and adversely affect the market price of our common shares or the ADSs.
We must constantly locate and acquire new tracts of land for development and development home sites to support our homebuilding operations. There is a lag between the time we acquire land for development or development home sites and the time that we can bring the properties to market and sell homes. As a result, we face the risk that demand for housing may decline, costs of labor or materials may increase, interest rates may increase, currencies may fluctuate and political uncertainties may occur during this period and that we will not be able to dispose of developed properties at expected prices or profit margins or within anticipated time frames or at all. Significant expenditures associated with investments in real estate, such as maintenance costs, construction costs and debt payments, cannot generally be reduced if changes in the economy cause a decrease in revenues from our properties. The market value of property inventories, undeveloped tracts of land and desirable locations can fluctuate
significantly because of changing market conditions. In addition, inventory carrying costs (including interest on funds unused to acquire land or build homes) can be significant and can adversely affect our performance. Because of these factors, we may be forced to sell homes and other real properties at a loss or for prices that generate lower profit margins than we anticipate. We may also be required to make material write-downs of the book value of our real estate assets in accordance with Brazilian and US GAAP if values decline. The occurrence of any of these factors may adversely affect our business and results of operations.
We are subject to risks normally associated with permitting our purchasers to make payments in installments; if there are higher than anticipated defaults or if our costs of providing such financing increase, then our profitability could be adversely affected.
As is common in our industry, we and the special purpose entities, or “SPEs,” in which we participate permit some purchasers of the units in our projects to make payments in installments. As a result, we are subject to the risks associated with this financing, including the risk of default in the payment of principal or interest on the loans we make as well as the risk of increased costs for the funds raised by us. In addition, our term sales agreements usually bear interest and provide for an inflation adjustment. If the rate of inflation increases, the loan payments under these term sales agreements may increase, which may lead to a higher rate of payment default. If the default rate among our purchasers increases, our cash generation and, therefore, our profitability could be adversely affected.
In the case of a payment default after the delivery of financed units, Brazilian law provides for the filing of a collection claim to recover the amount owed or to repossess the unit following specified procedures. The collection of overdue amounts or the repossession of the property is a lengthy process and involves additional costs. It is uncertain that we can recover the full amount owed to us or that if we repossess a unit, we can re-sell the unit at favorable terms or at all.
The affordable entry-level segment is strongly dependent on the availability of financing, including from the
Minha Casa, Minha Vida
program and from
Caixa Econômica Federal
, or the “CEF.” The scarcity of financing, the increase in interest rates, the reduction in financing terms, share of financing per unit and subsidies or any other modification in other financing terms and conditions may adversely affect the performance of the affordable entry-level segment.
If we or the SPEs in which we participate fail to comply with or become subject to more onerous government regulations, our business could be adversely affected.
We and the SPEs in which we participate are subject to various federal, state and municipal laws and regulations, including those relating to construction, zoning, soil use, environmental protection, historical sites, consumer protection and antitrust. We are required to obtain, maintain and renew on a regular basis permits, licenses and authorizations from various governmental authorities in order to carry out our projects. We strive to maintain compliance with these laws and regulations. If we are unable to achieve or maintain compliance with these laws and regulations, we could be subject to fines, project shutdowns, cancellation of licenses and revocation of authorizations or other restrictions on our ability to develop our projects, which could have an adverse impact on our business, financial condition and results of operations. In addition, our contractors and subcontractors are required to comply with various labor and environmental regulations and tax and other regulatory obligations. Because we are secondary obligors to these contractors and subcontractors, if they fail to comply with these regulations or obligations, we may be subject to penalties by the relevant regulatory bodies.
Regulations governing the Brazilian real estate industry as well as environmental laws have tended to become more restrictive over time. We cannot assure you that new and stricter standards will not be adopted or become applicable to us, or that stricter interpretations of existing laws and regulations will not be promulgated. Furthermore, we cannot assure you that any such more onerous regulations would not cause delays in our projects or that we would be able to secure the relevant permits and licenses. Any such event may require us to spend additional funds to achieve compliance with such new rules and therefore make the development of our projects more costly, which can adversely affect our business and the market price of our common shares or the ADSs.
Scarcity of financing and/or increased interest rates could cause a decrease in the demand for real estate properties, which could negatively affect our results of operations, financial condition and the market price of our common shares or the ADSs.
The scarcity of financing and/or an increase in interest rates or in other indirect financing costs may adversely affect the ability or willingness of prospective buyers to purchase our products and services, especially prospective low income buyers. A majority of the bank financing obtained by prospective buyers comes from the Housing Financial System (
Sistema Financeiro de Habitação
), or the “SFH,” which is financed by funds raised from savings account deposits. The Brazilian Monetary Council (
Conselho Monetário Nacional
), or the “CMN,” often changes the amount of such funds that banks are required to make available for real estate financing. If the CMN restricts the amount of available funds that can be used to finance the purchase of real estate properties, or if there is an increase in interest rates, there may be a decrease in the demand for our residential and commercial properties and for the development of lots of land, which may adversely affect our business, financial condition and results of operations.
We and other companies in the real estate industry frequently extend credit to our clients. As a result, we are subject to risks associated with providing financing, including the risk of default on amounts owed to us, as well as the risk of increased costs of funding our operations. An increase in inflation would raise the nominal amounts due from our clients, pursuant to their sales agreements, which may increase their rates of default. If this were to occur, our cash generation and, therefore, our operating results may be adversely affected. In addition, we obtain financings from financial institutions at different rates and subject to different indexes and may be unable to match our debt service requirements with the terms of the financings we grant to our clients. The mismatch of rates and terms between the funds we obtain and the financings we grant may adversely affect us.
Some of our subsidiaries use significant funding from the home financing programs of the CEF, including the Minha Casa, Minha Vida program, and, as a result, are subject to institutional and operating changes in the CEF and enhance customer risk profiles associated with clients eligible for these programs.
The CEF has several home financing programs for the low-income segment, which are used by Construtora Tenda S.A., or “Tenda,” to fund its activities. The CEF is a state-owned financial institution and is subject to political influence, which may change the availability or the terms of the home financing programs. The cancelation, suspension, interruption or a significant change in such programs may affect our growth estimates and our business. Furthermore, the suspension, interruption or slowdown in the CEF’s activities to approve projects, grant financing to our clients and evaluate construction process, among other activities, may adversely impact our business, financial position, results of operations and the market price of our common shares and ADSs.
Also, in March 2009, the Brazilian government announced the creation of a public housing program called “
Minha Casa, Minha Vida
,” with an announcement in 2010 of a second phase of the program from 2011 until 2014, that aims to finance two million houses, twice as much as was financed in the first phase of the program. The program aims to reduce the housing deficit in Brazil, which as of 2010 was estimated to be 5.5 million houses. The program calls for government investment of more than R$30 billion in the first phase and more than R$72 billion during the second phase, to be available made through financing from the “CEF,” and is focused on building one million houses for families with monthly incomes of up to ten times the minimum wage. During the second phase of this program, 800 thousand houses will be built for families with monthly incomes of three to ten times the minimum wage, which make up our target clients under our Tenda brand. This program offers, among other things, long-term financing, lower interest rates, greater share of the property financed to the client, subsidies based on income level, lower insurance costs and the creation of a guarantor fund to refinance debt in case of unemployment. Financing to the affordable entry-level segment is primarily made available through the CEF. Any changes in such financing would force us to seek new sources of financing and the availability of funds under similar conditions is limited, which would have an adverse effect on our results of operations.
We may sell portions of our landbank located in nonstrategic regions, which is in line with our future strategies. As a result, we will prepare an annual analysis for impairment of our landbank.
As part of our strategy to focus our future operations on regions where our developments have historically been successful, and where we believe there is homebuilding potential based on market opportunities, we may sell portions of our landbank located outside of these regions. As a result, we will prepare an annual impairment analysis of our landbank based on the acquisition cost of the land in our portfolio. In 2012 and 2011, we decided to sell a portion of our landbank and our evaluation of impairment on landbank and properties for sale resulted in provisions for impairment in the amount of R$54.4 million and R$92.1 million, respectively.
The real estate industry is dependent on the availability of credit, especially in the affordable entry-level segment.
One of our main strategies is to expand our operations to the affordable entry-level segment in which clients are strongly dependent on bank financing to purchase homes. This financing may not be available on favorable terms to our clients, or at all. Changes in the Real Estate Financing System (
Sistema de Financiamento Imobiliário
), or the “SFI,” and in the SFH rules, the scarcity of available resources or an increase in interest rates may affect the ability or desire of such clients to purchase homes, consequently affecting the demand for homes. These factors would have a material adverse effect on our business, financial condition and results of operations.
Because we recognize sales revenue from our real estate properties under the percentage of completion method of accounting under Brazilian GAAP as generally adopted by construction companies and under US GAAP, when we meet the conditions specified by the respective accounting standards, an adjustment in the cost of a development project may reduce or eliminate previously reported revenue and income.
We recognize revenue from the sale of units in our properties based on the percentage of completion method of accounting, which requires us to recognize revenue as we incur the cost of construction. Total cost estimates are revised on a regular basis as the work progresses, and adjustments based upon such revisions are reflected in our results of operations in accordance with the method of accounting used. To the extent that these adjustments result in an increase, a reduction or an elimination of previously reported income, we will recognize a credit to or a charge against income, which could have an adverse effect on our previously reported revenue and income.
Our participation in SPEs creates additional risks, including potential problems in our financial and business relationships with our partners.
We invest in SPEs with other real estate developers and construction companies in Brazil. The risks involved with SPEs include the potential bankruptcy of our SPE partners and the possibility of diverging or inconsistent economic or business interests between us and our partners. If an SPE partner fails to perform or is financially unable to bear its portion of the required capital contributions, we could be required to make additional investments and provide additional services in order to make up for our partner’s shortfall. In addition, under Brazilian law, the partners of an SPE may be liable for certain obligations of an SPE, including with respect to tax, labor, environmental and consumer protection laws and regulations. These risks could have an adverse effect on us.
We may experience difficulties in finding desirable land tracts and increases in the price of land may increase our cost of sales and decrease our earnings.
Our continued growth depends in large part on our ability to continue to acquire land and to do so at a reasonable cost. As more developers enter or expand their operations in the Brazilian home building industry, land prices could rise significantly and suitable land could become scarce due to increased demand, decreased supply or both. A resulting rise in land prices may increase our cost of sales and decrease our earnings. We may not be able to continue to acquire suitable land at reasonable prices in the future, which could adversely affect our business.
The market value of our inventory of undeveloped land may decrease, thus adversely affecting our results of operations.
We own tracts of undeveloped land that are part of our inventory for future developments. We also intend to increase our inventory and acquire larger tracts of land. The market value of these properties may significantly decrease from the acquisition date to the development of the project as a result of economic downturns or market conditions, which would have an adverse effect on our results of operations.
Increases in the price of raw materials and fixtures may increase our cost of sales and reduce our earnings.
The basic raw materials and fixtures used in the construction of our homes include concrete, concrete block, steel, aluminum, bricks, windows, doors, roof tiles and plumbing fixtures. Increases in the price of these and other raw materials, including increases that may occur as a result of shortages, duties, restrictions, or fluctuations in exchange rates, could increase our cost of sales. Any such cost increases could reduce our earnings and adversely affect our business.
If we are not able to implement our growth strategy as planned, or at all, our business, financial condition and results of operations could be adversely affected.
We plan to grow our business by selectively expanding to meet the growth potential of the Brazilian residential market. We believe that there is increasing competition for suitable real estate development sites. We may not find suitable additional sites for development of new projects or other suitable expansion opportunities.
We anticipate that we will need additional financing to implement our expansion strategy and we may not have access to the funding required for the expansion of our business or such funding may not be available to us on acceptable terms. We may finance the expansion of our business with additional indebtedness or by issuing additional debt or equity securities. For example, in 2012, we issued R$360.0 million in subordinated indebtedness, including: (1) R$150 million in bank credit certificates, or CCBs, on September 5, 2012, (2) R$80 million in our third restricted public issuance of commercial paper in a single series in December 2012 and (3) R$130 million in CCBs issued by our subsidiary Alphaville secured by a pledge of sales receivables and certain ventures. In addition, on October 31, 2012, we amended the terms of certain CCBs in the amount of R$100 million to provide additional security, including a first-priority mortgage of certain real estate ventures, a pledge of sales receivables and to adjust the payment terms of the CCB. We could face financial risks, covenant restrictions and restrictions on our ability to employ are assets associated with incurring additional indebtedness, such as reducing our liquidity and access to financial markets and increasing the amount of cash flow required to service such indebtedness, or associated with issuing additional stock, such as dilution of ownership and earnings.
There are risks for which we do not have insurance coverage or the insurance coverage we have in place may not be sufficient to cover damages that we may suffer.
We maintain insurance policies with coverage for certain risks, including damages arising from engineering defects, fire, landslides, storms, gas explosions and civil liabilities stemming from construction errors. We believe that the level of insurance we have contracted for accidents is consistent with market practice. However, there can be no assurance that such policies will always be available or provide sufficient coverage for certain damages. In addition, there are certain risks that may not be covered by such policies, such as damages resulting from war, force majeure or the interruption of certain activities and, therefore any requirement to pay amounts not covered by our insurance may have a negative impact on our business and our results of operations. Furthermore, we are required to pay penalties and other fines whenever there is delay in the delivery of our units, and such penalties and fines are not covered by our insurance policies.
Moreover, we cannot guarantee that we will be able to renew our current insurance policies under favorable terms, or at all. As a result, insufficient insurance coverage or our inability to renew existing insurance policies could have an adverse effect on our financial condition and results of operations.
Our level of indebtedness could have an adverse effect on our financial health, diminish our ability to raise additional capital to fund our operations and limit our ability to react to changes in the economy or the real estate industry.
As of December 31, 2012, our total debt (loans, financing and debentures) and payables to venture partners was R$4,240.1 million and our short-term debt and payables to venture partners was R$1,320.2 million. In addition, as of December 31, 2012 our cash and cash equivalents and short-term investments available was R$1,681.3 million and our net debt represented 95.0% of our shareholders’ equity including the non-controlling interest. Our indebtedness has variable interest rates. A hypothetical 1% adverse change in interest rates would have had an annualized unfavorable impact of approximately R$42.4 million on our earnings and cash flows, based on the net debt level as of December 31, 2012.
Our level of indebtedness could have important negative consequences for us. For example, it could:
|
|
·
|
require us to dedicate a large portion of our cash flow from operations to fund payments on our debt, thereby reducing the availability of our cash flow to fund working capital, capital expenditures and other general corporate purposes;
|
|
|
·
|
increase our vulnerability to adverse general economic or industry conditions;
|
|
|
·
|
limit our flexibility in planning for, or reacting to, changes in our business or the industry in which we operate;
|
|
|
·
|
limit our ability to raise additional debt or equity capital in the future or increase the cost of such funding;
|
|
|
·
|
restrict us from making strategic acquisitions or exploring business opportunities; and
|
|
|
·
|
place us at a competitive disadvantage compared to our competitors that have less debt.
|
Certain of our debt agreements contain financial and other covenants and any default under such debt agreements may have a material adverse effect on our financial condition and cash flows.
Certain of our existing debt agreements contain restrictions and covenants and require the maintenance or satisfaction of specified financial ratios, ratings and tests. Our ability to meet these financial ratios, ratings and tests can be affected by events beyond our control and we cannot assure that we will meet those tests, especially given the lower yield environment in which the industry currently operates. Failure to meet or satisfy any of these covenants, financial ratios or financial tests could result in an event of default under these and other agreements, as a result of cross-default provisions. If we are unable to comply with our debt covenants, we could be forced to seek waivers.
As of December 31, 2011, the Company and its subsidiary Tenda were in default on the contractual covenants provided for in certain of our debentures, for which we obtained a waiver and renegotiated certain covenant ratios in March 2012. In each of January, April and June 2012, we were in default on restrictive covenants for a bank loan (
cédula de crédito imobiliário
) or CCB in the amount of R$100.0 million as a result of a downgrade in our corporate rating. In each instance, we obtained a waiver to avoid early redemption of this indebtedness. If we are unable to renew these and/or receive other waivers, a large portion of our debt could be subject to acceleration. While we do not believe such occurrence to be likely, if it were to happen, we could be required to renegotiate, restructure or refinance our indebtedness, seek additional equity capital or sell assets, which could materially and adversely affect us.
We cannot guarantee that we will be successful in obtaining any waivers or renewing existing waivers. As of December 31, 2012, the Company and its subsidiaries were not in default on the contractual covenants provided for in our debentures and others credits instruments,
We may not be successful in managing and integrating the businesses and activities of Alphaville, Cipesa and Tenda.
We have acquired controlling stakes in three Brazilian real estate companies: (1) Alphaville Urbanismo S.A., one of the largest residential community development companies in Brazil; (2) Cipesa Empreendimentos Imobiliários S.A., one of the leading homebuilders in the State of Alagoas; and (3) Construtora Tenda S.A., a residential homebuilder with a focus on the affordable entry-level segment. However, we may not be successful in managing and integrating these companies, which could adversely affect our business.
Failures or delays by our third party contractors may adversely affect our reputation and business and expose us to civil liability.
We engage third party contractors to provide services for our projects. Therefore, the quality of work in the construction of our real estate projects and the timely completion of these projects may depend on factors that are beyond our control, including the quality and timely delivery of building materials and the technical skills of the outsourced professionals. Such outsourcing may delay the identification of construction problems and, consequently, the correction of such problems. Any failures, delays or defects in the services provided by our third party contractors may adversely affect our reputation and relationship with our clients, which would adversely affect our business and results of operations.
We may be unable to successfully implement our strategy of reorganizing our operational organization and performance.
We intend to carry out a strategy seeking to reorganize our operational organization and promote performance. This strategy includes the implementation of a new management structure that, among other things, assigns each brand manager direct responsibility for the operating performance of each brand, and implementing a corporate culture shift within our Tenda brand focused on aligning incentives to improve project execution. As a result, we
established a new operating structure organized by brand (Gafisa, Alphaville and Tenda) and appointed divisional executive officers responsible for the profit and loss of each business unit. This strategy is intended to pursue the goal of helping to produce more stable cash flow and contributing toward a return to sustainable growth. However, there we can be no assurance that we will be able to successfully implement such strategy, and therefore we may also be unsuccessful in achieving such goals behind such strategy, which could result in a material adverse effect with respect to our business, financial condition or results of operations.
Unfavorable judicial, administrative or arbitration decisions may adversely affect us.
We currently are, and may be in the future, defendants in several judicial, administrative proceedings related to civil, labor and tax matters as well as certain arbitration proceedings. We cannot assure you that we will obtain favorable decisions in such proceedings, that such proceedings will be dismissed, or that our provisions for such proceedings are sufficient in the event of an unfavorable decision. Unfavorable decisions that impede our operations, as initially planned, or that result in a claim amount that is not adequately covered by provisions in our balance sheet, may adversely affect our business and financial condition.
We may be held responsible for labor liabilities of our third party contractors.
We may be held responsible for the labor liabilities of our third party contractors and obligated to pay for fines imposed by the relevant authorities in the event that our third party contractors do not comply with applicable legislation. As of December 31, 2012, we had a total of R$185.5 million of labor liabilities and provisions for such liabilities in the amount of R$55 million. 88% of the labor claims were commenced by employees of our third party contractors. An adverse result in such claims would cause an adverse effect on our business.
Failure to keep members of our senior management and/or our ability to recruit and retain qualified professionals may have a material adverse effect on our business, financial condition and results of operations.
Our future success depends on the continued service and performance of our senior management and our ability to recruit and retain qualified professionals. None of the members of our senior management are bound to long-term labor contracts or non-compete agreements and there can be no assurance that we will successfully recruit and retain qualified professionals to our management as our business grows. The loss of any key professionals or our inability to recruit or retain qualified professionals may have an adverse effect on our business, financial condition and results of operations.
Changes in Brazilian GAAP due to its migration towards IFRS may adversely affect our results.
Brazilian corporate law was amended by Law No. 11,638 dated December 28, 2007 in order to facilitate the convergence of Brazilian GAAP with IFRS, and thereafter, the CPC issued new accounting standards that converged Brazilian GAAP to IFRS.
Through December 31, 2009, our financial statements were prepared in accordance with Brazilian GAAP in effect at the time. We elected January 1, 2009 as a transition date to full adoption of the new Brazilian GAAP as generally adopted by construction companies in Brazil, and amended certain accounting practices in the Brazilian GAAP financial statements. Our financial statements as of and for the year ended December 31, 2009 have been restated to reflect these adjustments. As the prior period Brazilian GAAP financial statements were not adjusted to the new Brazilian GAAP as generally adopted by construction companies in Brazil, these financial statements are not comparable to the financial statements as at and for the years ended December 31, 2012, 2011, 2010 and 2009. Guideline OCPC 04 - Application of the Technical Interpretation ICPC 02 to the Brazilian Real Estate Development Entities and CPC 37 has been applied in preparing the financial statements for the years ended December 31, 2012, 2011, 2010 and 2009.
Certain matters related to the meaning and application of the continuous transfer of the risks, benefits and control over the real estate unit sales are under consideration by the International Financial Reporting Interpretation Committee or “IFRIC”. The results of this consideration may cause us to revise our accounting practices related to the recognition of our revenues.
There can be no assurance that these modifications will not materially and adversely affect our financial statements, on a retrospective or prospective basis, in particular the recognition of our revenues and related costs and our financial position and results of operations and impact the comparability of our financial statements for future periods with our financial statements presented herein and our financial covenants as defined in our credit facilities.
Material weakness identified in our internal control over financial reporting could result in a material misstatement in our financial statements, which could have a material adverse effect on our business and stock price.
We are required to design, implement and maintain effective controls over financial reporting. A material weakness is a deficiency, or a combination of deficiencies, in internal control over financial reporting such that there is a reasonable possibility that a material misstatement of a company’s annual or interim financial statements will not be prevented or detected on a timely basis. Material weaknesses identified in our internal control over financial reporting could result in a material misstatement in our financial statements, which could have a material adverse effect on our business and stock price. In connection with the preparation of our financial statements as of and for the year ended December, 31, 2012, we identified a material weakness as discussed more fully in Item 15. See “Item 15. Controls and Procedures.”
Risks Relating to Brazil
Brazilian economic, political and other conditions, and Brazilian government policies or actions in response to these conditions, may negatively affect our business and results of operations and the market price of our common shares or the ADSs.
The Brazilian economy has been characterized by frequent and occasionally extensive intervention by the Brazilian government and unstable economic cycles. The Brazilian government has often changed monetary, taxation, credit, tariff and other policies to influence the course of the Brazilian economy. For example, the government’s actions to control inflation have at times involved setting wage and price controls, blocking access to bank accounts, imposing exchange controls and limiting imports into Brazil. We have no control over, and cannot predict, what policies or actions the Brazilian government may take in the future.
Our business, results of operations, financial condition and prospects, as well as the market prices of our common shares or the ADSs, may be adversely affected by, among others, the following factors:
|
|
·
|
exchange rate movements;
|
|
|
·
|
exchange control policies;
|
|
|
·
|
expansion or contraction of the Brazilian economy, as measured by rates of GDP;
|
|
|
·
|
inflation;
|
|
|
·
|
tax policies;
|
|
|
·
|
other economic, political, diplomatic and social developments in or affecting Brazil;
|
|
|
·
|
interest rates;
|
|
|
·
|
energy shortages;
|
|
|
·
|
liquidity of domestic capital and lending markets; and
|
|
|
·
|
social and political instability.
|
Uncertainty over whether the Brazilian government may implement changes in policy or regulations may contribute to economic uncertainty in Brazil and to heightened volatility in the Brazilian securities markets as well as securities issued abroad by Brazilian issuers. As a result, these uncertainties and other future developments in the Brazilian economy may adversely affect us and our business and results of operations and the market price of our common shares and the ADSs.
Inflation, and government measures to curb inflation, may adversely affect the Brazilian economy, the Brazilian securities market, our business and operations and the market prices of our common shares or the ADSs.
At times in the past, Brazil has experienced high rates of inflation. According to the General Market Price Index (
Índice Geral de Preços—Mercado
), or “IGP-M”, inflation rates in Brazil were 3.8% in 2006, 7.8% in 2007, 9.8% in 2008, (1.7)% in 2009, 11.3% in 2010, 5.1% in 2011, 7.8% in 2012 and 0.84% in the three month period ended March 31, 2013. In addition, according to the Expanded Consumer Price Index (
Índice de Preços ao Consumidor Ampliado
), or “IPCA,” Brazilian consumer price inflation rates were 3.1% in 2006, 4.5% in 2007, 5.9% in 2008, 4.3% in 2009, 5.9% in 2010, 6.5% in 2011, 5.8% in 2012 and 1.47% in the two month period ended February 28, 2013. Our term sales agreements usually provide for an inflation adjustment linked to the National Construction Cost Index (
Índice Nacional de Custo de Construção
), or “INCC”. The INCC increased by 6.2% in 2007, 11.9% in 2008, 3.14% in 2009, 7.77% in 2010, 7.49% in 2011, 7.12% in 2012 and 1.25% in the two month period ended February 28, 2013. The Brazilian government’s measures to control inflation have often included maintaining a tight monetary policy with high interest rates, thereby restricting availability of credit and reducing economic growth. Inflation, actions to combat inflation and public speculation about possible additional actions have also contributed materially to economic uncertainty in Brazil and to heightened volatility in the Brazilian securities markets.
Brazil may experience high levels of inflation in future periods. Periods of higher inflation may slow the rate of growth of the Brazilian economy, which could lead to reduced demand for our products in Brazil and decreased net sales. Inflation is also likely to increase some of our costs and expenses, which we may not be able to pass on to our customers and, as a result, may reduce our profit margins and net income. In addition, high inflation generally leads to higher domestic interest rates, and, as a result, the costs of servicing our
reais
-denominated debt may increase, resulting in lower net income. Inflation and its effect on domestic interest rates can, in addition, lead to reduced liquidity in the domestic capital and lending markets, which could affect our ability to refinance our indebtedness in those markets. In addition, increases in inflation rates would increase the outstanding debt of our customers, which could increase default levels and affect our cash flows. Any decline in our net operating revenue or net income and any deterioration in our financial condition would also likely lead to a decline in the market price of our common shares and the ADSs.
Social, political and economic events and the perception of risks, especially in other emerging economies, may adversely affect the Brazilian economy, and consequently, our business, financial condition, results of operations and the market price of our securities.
The Brazilian capital markets are influenced by the Brazilian market and economic conditions and, to a certain extent, by the conditions in other Latin American countries and other emerging market countries. Investors’ reactions to developments in certain countries may have an adverse effect on the market value of the securities of Brazilian issuers. Crises in other Latin American and emerging market countries normally trigger a significant outflow of funds and the reduction of foreign investment in Brazil. For example, in 2001 Argentina announced a moratorium on its public debt after a recession and a period of political instability, which affected investor perceptions towards the Brazilian capital markets for many years. Crises in other Latin American and emerging market countries may diminish investor interest in the securities of Brazilian issuers, including ours, which could negatively affect the market price of our common shares.
The market for securities issued by Brazilian companies is influenced, to a varying degree, by international economic and market conditions generally, especially in the United States. The prices of shares traded on the São Paulo Stock Exchange (
BM&F Bovespa S.A. — Bolsa de Valores Mercadorias e Futuros
), or the “BM&FBOVESPA,” have been historically affected by the fluctuation of interest rates and stock exchange indexes in the United States. Events in other countries or capital markets could have an adverse effect on the price of our shares, which could make it more difficult for us to access the capital markets and obtain financing on acceptable terms in the future, or at all.
Fluctuations in interest rates may have an adverse effect on our business and the market prices of our common shares and the ADSs.
The Central Bank establishes the basic interest rate target for the Brazilian financial system by reference to the level of economic growth of the Brazilian economy, the level of inflation and other economic indicators. Debts of companies in the real estate industry, including ours, are subject to the fluctuation of market interest rates, as
established by the Central Bank. Should such interest rates increase, the costs relating to the service of our debt obligations would also increase.
As of December 31, 2012 our indebtedness was denominated in
reais
and subject to Brazilian floating interest rates, such as the Reference Interest Rate (
Taxa Referencial
), or “TR,” and the Interbank Deposit Certificate Rate (
Certificado de Depósito Interbancário
), or “CDI rate.” Any increase in the TR rate or the CDI rate may have an adverse impact on our financial expenses, our results of operations and on the market price of our common shares or the ADSs. We are not a party to any hedging instruments with respect to our indebtedness.
Restrictions on the movement of capital out of Brazil may adversely affect your ability to receive dividends and distributions on the ADSs and on our common shares, or the proceeds of any sale of our common shares.
Brazilian law permits the Brazilian government to impose temporary restrictions on conversions of Brazilian currency into foreign currencies and on remittances to foreign investors of proceeds from their investments in Brazil whenever there is a serious imbalance in Brazil’s balance of payments or there are reasons to expect a pending serious imbalance. The Brazilian government last imposed remittance restrictions for approximately six months in 1989 and early 1990. The Brazilian government may take similar measures in the future. Any imposition of restrictions on conversions and remittances could hinder or prevent holders of our common shares or the ADSs from converting into U.S. dollars or other foreign currencies and remitting abroad dividends, distributions or the proceeds from any sale in Brazil of our common shares. Exchange controls could also prevent us from making payments on our U.S. dollar-denominated debt obligations and hinder our ability to access the international capital markets. As a result, exchange controls restrictions could reduce the market prices of our common shares and the ADSs.
Changes in tax laws may increase our tax burden and, as a result, adversely affect our profitability.
The Brazilian government regularly implements changes to tax regimes that may increase our and our customers’ tax burdens. These changes include modifications in the rate of assessments and, on occasion, enactment of temporary taxes, the proceeds of which are earmarked for designated governmental purposes. In April 2003, the Brazilian government presented a tax reform proposal, which was mainly designed to simplify tax assessments, to avoid internal disputes within and between the Brazilian states and municipalities, and to redistribute tax revenues. The tax reform proposal provided for changes in the rules governing the federal Social Integration Program (
Programa de Integração Social
), or “PIS,” the federal Contribution for Social Security Financing (
Contribuição para Financiamento da Seguridade Social
), or “COFINS,” the state Tax on the Circulation of Merchandise and Services (
Imposto Sobre a Circulação de Mercadorias e Serviços)
, or “ICMS,” and other taxes. The effects of these proposed tax reform measures and any other changes that result from enactment of additional tax reforms have not been, and cannot be, quantified. However, some of these measures, if enacted, may result in increases in our overall tax burden, which could negatively affect our overall financial performance.
Risks Relating to Our Common Shares and the ADSs
International economic and market conditions, especially in the United States, may adversely affect the market price of the ADSs.
The market for securities issued by Brazilian companies is influenced, to a varying degree, by international economic and market conditions generally. Because our ADSs are listed on the New York Stock Exchange, or the “NYSE,” adverse market conditions and economic and/or political crises, especially in the United States, such as the subprime mortgage lending crisis in 2007 and 2008 and the financial and credit crises in 2008, have at times resulted in significant negative impacts on the market price of our ADSs. Despite the fact that our clients, whether financed by us or by Brazilian banks through resources obtained in the local market, are not directly exposed to the mortgage lending crisis in the United States, there are still uncertainties as to whether such crisis may indirectly affect homebuilders worldwide. The uncertainties generated by the subprime crisis may affect the market prices of our ADSs and could also make it more difficult for us to access the capital markets and finance our operations in the future on acceptable terms or at all.
Developments and the perception of risks in other countries, especially emerging market countries, may adversely affect the market prices of our common shares and the ADSs.
The market for securities issued by Brazilian companies is influenced, to varying degrees, by economic and market conditions in other emerging market countries, especially other Latin American countries. Although
economic conditions are different in each country, the reaction of investors to developments in one country may cause the capital markets in other countries to fluctuate. Developments or adverse economic conditions in other emerging market countries have at times resulted in significant outflows of funds from, and declines in the amount of foreign currency invested in, Brazil. For example, in 2001, after a prolonged recession, followed by political instability, Argentina announced that it would no longer continue to service its public debt. The economic crisis in Argentina negatively affected investors’ perceptions of Brazilian securities for several years. Economic or political crises in Latin America or other emerging markets may significantly affect perceptions of the risk inherent in investing in the region, including Brazil.
The Brazilian economy is also affected by international economic and general market conditions, especially economic and market conditions in the United States. Share prices on the BM&FBOVESPA, for example, have historically been sensitive to fluctuations in U.S. interest rates as well as movements of the major U.S. stock indexes, particularly in the current worldwide economic downturn. Developments in other countries and securities markets could adversely affect the market prices of our common shares and the ADSs and could also make it more difficult for us to access the capital markets and finance our operations in the future on acceptable terms or at all.
The relative volatility and the lack of liquidity of the Brazilian securities market may adversely affect you.
The Brazilian securities market is substantially smaller, less liquid, more concentrated and more volatile than major securities markets in the United States. This may limit your ability to sell our common shares and the common shares underlying your ADSs at the price and time at which you wish to do so. The BM&FBOVESPA, the only Brazilian stock exchange, had a market capitalization of US$1.22 trillion as of March 31, 2013 and an average daily trading volume of US$2.71 billion for 2013. In comparison, the NYSE had a domestic market capitalization of US$16.6 trillion (excluding funds and non-U.S. companies) as of March 31, 2013and an average daily trading volume of approximately US$145 billion for 2013.
There is also a large concentration in the Brazilian securities market. The ten largest companies in terms of market capitalization represented 52% of the aggregate market capitalization of the BM&FBOVESPA as of December 31, 2012. The top ten stocks in terms of trading volume accounted for 55% of all shares traded on the BM&FBOVESPA in 2012. Gafisa’s average daily trading volume on the BM&FBOVESPA and in the NYSE in 2012 was US$56.54 million and US$12.33 million, respectively.
Shares eligible for future sale may adversely affect the market value of our common shares and the ADSs.
Certain of our shareholders have the ability, subject to applicable Brazilian laws and regulations and applicable securities laws in the relevant jurisdictions, to sell our shares and the ADSs. We cannot predict what effect future sales of our shares or ADSs may have on the market price of our shares or the ADSs. Future sales of substantial amounts of such shares or the ADSs, or the perception that such sales could occur, could adversely affect the market prices of our shares or the ADSs.
The economic value of your investment in our company may be diluted.
We may need additional funds in the future, and as a result, we may issue additional common shares and/or convertible securities. Any additional funds obtained by such a capital increase may dilute your interest in our company. We will acquire the remaining 20% of Alphaville’s shares that we currently do not own, which may be acquired through the issuance of common shares, depending on the decision of an arbitration proceeding that is currently ongoing. As a result of these new issuances of shares, you may experience additional dilution of your investment in our company. See “Item 4. Information on the Company—A. History and Development of the Company.”
Holders of our common shares or the ADSs may not receive any dividends or interest on shareholders’ equity.
According to our bylaws, we must generally pay our shareholders at least 25% of our annual net profit as dividends or interest on shareholders’ equity, as calculated and adjusted under the Brazilian corporate law method. This adjusted net profit may be used to absorb losses or for the payment of statutory participation on profits to debenture holders, employees or members of our management, which would ultimately reduce the amount available to be paid as dividends or interest on shareholders’ equity. Additionally, the Brazilian corporate law allows a publicly traded company like us to suspend the mandatory distribution of dividends in any particular year if our board of directors informs our shareholders that such distributions would be inadvisable in view of our financial
condition or cash availability. For 2003, 2004 and 2005, we did not distribute dividends. We distributed dividends in each of 2007, 2008, 2009, 2010 and 2011 with respect to the prior respective fiscal year and based on the negative results of the fiscal year 2011, on May 11, 2012, our shareholders did not approve any distribution of dividends. See “Item 8. Financial Information—A. Consolidated Statements and Other Financial Information—Dividend Policy.
Holders of ADSs may find it difficult to exercise voting rights at our shareholders’ meetings.
Holders of ADSs may exercise voting rights with respect to our common shares represented by ADSs only in accordance with the terms of the deposit agreement governing the ADSs. Holders of ADSs will face practical limitations in exercising their voting rights because of the additional steps involved in our communications with ADS holders. For example, we are required to publish a notice of our shareholders’ meetings in specified newspapers in Brazil. Holders of our common shares will be able to exercise their voting rights by attending a shareholders’ meeting in person or voting by proxy. By contrast, holders of ADSs will receive notice of a shareholders’ meeting from the ADR depositary following our notice to the depositary requesting the depositary to do so. To exercise their voting rights, holders of ADSs must instruct the ADR depositary on a timely basis. This voting process necessarily will take longer for holders of ADSs than for holders of our common shares. Common shares represented by ADSs for which no timely voting instructions are received by the ADR depositary from the holders of ADSs shall not be voted.
Holders of ADSs also may not receive the voting materials in time to instruct the depositary to vote the common shares underlying their ADSs. In addition, the depositary and its agents are not responsible for failing to carry out voting instructions of the holders of ADSs or for the manner of carrying out those voting instructions. Accordingly, holders of ADSs may not be able to exercise voting rights, and they will have little, if any, recourse if the common shares underlying their ADSs are not voted as requested.
No single shareholder or group of shareholders holds more than 50% of our capital stock, which may increase the opportunity for alliances between shareholders as well as conflicts between them.
No single shareholder or group of shareholders holds more than 50% of our capital stock. There is no guidance in Brazilian corporate law for publicly-held companies without an identified controlling shareholder. Due to the absence of a controlling shareholder, we may be subject to future alliances or agreements between our shareholders, which may result in the exercise of a controlling power over our company by them. In the event a controlling group is formed and decides to exercise its controlling power over our company, we may be subject to unexpected changes in our corporate governance and strategies, including the replacement of key executive officers. Additionally, we may be more vulnerable to a hostile takeover bid. The absence of a controlling group may also jeopardize our decision-making process as the minimum quorum required by law for certain decisions by shareholders may not be reached and, as a result, we cannot guarantee that our business plan will be affected. Any unexpected change in our management team, business policy or strategy, any dispute between our shareholders, or any attempt to acquire control of our company may have an adverse impact on our business and result of operations.
Holders of ADSs will not be able to enforce the rights of shareholders under our bylaws and Brazilian corporate law and may face difficulties in protecting their interests because we are subject to different corporate rules and regulations as a Brazilian company.
Holders of ADSs are not direct shareholders of our company and are unable to enforce the rights of shareholders under our bylaws and Brazilian corporate law.
Our corporate affairs are governed by our bylaws and Brazilian corporate law, which differ from the legal principles that would apply if we were incorporated in a jurisdiction in the United States, such as the State of Delaware or New York, or elsewhere outside Brazil. Although insider trading and price manipulation are crimes under Brazilian law, the Brazilian securities markets are not as highly regulated and supervised as the U.S. securities markets or the markets in some other jurisdictions. In addition, rules and policies against self-dealing or for preserving shareholder interests may be less well-defined and enforced in Brazil than in the United States and certain other countries, which may put holders of the ADSs at a potential disadvantage. Corporate disclosures also may be less complete or informative than for a public company in the United States or in certain other countries.
Holders of ADSs may face difficulties in serving process on or enforcing judgments against us and other persons.
We are a corporation organized under the laws of Brazil, and all of our directors and executive officers and our independent public accountants reside or are based in Brazil. Most of the assets of our company and of these other persons are located in Brazil. As a result, it may not be possible for holders of ADSs to effect service of process upon us or these other persons within the United States or other jurisdictions outside Brazil or to enforce against us or these other persons judgments obtained in the United States or other jurisdictions outside Brazil. Because judgments of U.S. courts for civil liabilities based upon the U.S. federal securities laws may be enforced in Brazil only if certain conditions are met, holders may face greater difficulties in protecting their interests in the case of actions by us or our directors or executive officers than would shareholders of a U.S. corporation.
Changes in Brazilian tax laws may have an adverse impact on the taxes applicable to a disposition of the ADSs.
According to Law No. 10,833 of December 29, 2003, the disposition of assets located in Brazil by a non-resident to either a Brazilian resident or a non-resident is subject to taxation in Brazil, regardless of whether the disposition occurs outside or within Brazil. Thus, gains arising from a disposition of our common shares by a non-resident of Brazil to another non-resident of Brazil are subject to income tax.
Our interpretation of Law No. 10,833 is that ADSs should not be regarded as assets located in Brazil. Accordingly, the disposition of our ADSs by a non-resident to either a Brazilian resident or a non-resident should not be subject to taxation in Brazil. However, in the event that a disposition of our ADSs is considered a disposition of assets located in Brazil, this tax law could result in the imposition of withholding taxes on the disposition of our ADSs by a non-resident of Brazil. We are not aware of precedents on the application of Law No. 10,833 to ADSs and, accordingly, we are unable to predict whether Brazilian courts would apply it to a disposition of our ADSs by a non-resident of Brazil. See “Item 10. Additional Information—E. Taxation—Brazilian Tax Considerations—Gains.”
Any gain or loss recognized by a U.S. Holder (as defined in “Item 10. Additional Information—E. Taxation—U.S. Federal Income Tax Considerations”) would be treated as U.S. source gain or loss for all foreign tax credit purposes. U.S. Holders should consult their tax advisers as to whether the Brazilian tax on gain would be creditable against the holder’s U.S. federal income tax on foreign-source income from other sources.
Judgments of Brazilian courts with respect to our common shares will be payable only in reais.
If proceedings are brought in the courts of Brazil seeking to enforce our obligations in respect of the common shares, we will not be required to discharge our obligations in a currency other than
reais
. Under Brazilian exchange control limitations, an obligation in Brazil to pay amounts denominated in a currency other than
reais
may be satisfied in Brazilian currency only at the exchange rate, as determined by the Central Bank, in effect on the date the judgment is obtained, and such amounts are then adjusted to reflect exchange rate variations through the effective payment date. The then, prevailing exchange rate may not afford non-Brazilian investors with full compensation for any claim arising out of or related to our obligations under our common shares or the ADSs.
Holders of ADSs may be unable to exercise preemptive rights with respect to our common shares underlying the ADSs.
Holders of ADSs will be unable to exercise the preemptive rights relating to our common shares underlying ADSs unless a registration statement under the U.S. Securities Act of 1933, as amended, or the “Securities Act,” is effective with respect to those rights or an exemption from the registration requirements of the Securities Act is available. We are not obligated to file a registration statement with respect to the shares relating to these preemptive rights or to take any other action to make preemptive rights available to holders of ADSs. We may decide, in our discretion, not to file any such registration statement. If we do not file a registration statement or if we, after consultation with the ADR depositary, decide not to make preemptive rights available to holders of ADSs, those holders may receive only the net proceeds from the sale of their preemptive rights by the depositary, or if they are not sold, their preemptive rights will be allowed to lapse.
An exchange of ADSs for common shares risks loss of certain foreign currency remittance and Brazilian tax advantages.
The ADSs benefit from the certificate of foreign capital registration, which permits Citibank N.A., as depositary, to convert dividends and other distributions with respect to our common shares into foreign currency, and to remit the proceeds abroad. Holders of ADSs who exchange their ADSs for common shares will then be entitled to rely on the depositary’s certificate of foreign capital registration for five business days from the date of exchange. Thereafter, they will not be able to remit non-Brazilian currency abroad unless they obtain their own certificate of foreign capital registration, or unless they qualify under Resolution CMN 2,689, which entitles certain investors to buy and sell shares on Brazilian stock exchanges without obtaining separate certificates of registration.
If holders of ADSs do not qualify under Resolution CMN 2,689, they will generally be subject to less favorable tax treatment on distributions with respect to our common shares. There can be no assurance that the depositary’s certificate of registration or any certificate of foreign capital registration obtained by holders of ADSs will not be affected by future legislative or regulatory changes, or that additional Brazilian law restrictions applicable to their investment in the ADSs may not be imposed in the future.
A portion of the compensation of our officers and members of the senior management is paid in form of stock options, which could tie their interest to the market price of our shares and ADSs.
We have established stock option plans for our officers and members of our senior management. Potential benefits under the stock option plans are tied to the appreciation of the market price of our shares and ADSs.
As a result, our compensation policy may influence our officers and members of the senior management and their interest to the market price of our shares and ADSs, which may conflict with the interests of our shareholders. Our officers and members of the senior management may be influenced to focus on short-term rather than long-term results because a significant portion of their compensation is tied to our results and the market price of our shares and ADSs. See “Item 6. Directors, Senior Management and Employees—E. Share Ownership—Stock Option Plans” in this annual report.
A. History and Development of the Company
General
Gafisa S.A. is a corporation organized under the laws of Brazil. We were incorporated on November 12, 1996 for an indefinite term. Our registered and principal executive offices are located at Av. Nações Unidas No. 8,501, 19th floor, 05425-070, São Paulo, SP, Brazil, and our general telephone and fax numbers are + 55 (11) 3025-9000 and + 55 (11) 3025-9348, respectively.
We are a leading diversified national homebuilder serving all demographic segments of the Brazilian market. Established over 59 years ago, we have completed and sold more than 1,000 developments and constructed over 12 million square meters of housing under the Gafisa brand, which we believe is more than any other homebuilder in Brazil. Recognized as one of the foremost professionally-managed homebuilders, we are also one of the best-known brands in the real estate development market, enjoying a reputation among potential homebuyers, brokers, lenders, landowners, and competitors for quality, consistency and professionalism. Our brands include Tenda, which serves the affordable entry-level housing segments, Gafisa, which offers a variety of residential options to the mid to higher income segments and Alphaville, which focuses on the identification, development and sale of high quality residential communities. In addition, we provide construction services to third parties.
Our core business is the development of high-quality residential units in attractive locations. For the year ended December 31, 2012, approximately 54% of the value of our launches was derived from high and mid high-level residential developments under the Gafisa brand. We are also engaged in the development of land subdivisions, also known as residential communities, representing approximately 46% of the value of our launches under the Alphaville brand. In addition, we provide construction services to third parties. In 2012, we suspended the launch of additional units in our affordable entry-level housing brand, Tenda.
We are one of Brazil’s most geographically-diversified homebuilders and currently operate in 113 cities, including São Paulo, Rio de Janeiro, Salvador, Fortaleza, Natal, Curitiba, Belo Horizonte, Manaus, Porto Alegre and Belém, across 21 states and the Federal District. Many of these developments are located in markets where few large competitors currently operate. For the year ended December 31, 2012, approximately 38% of the value of our launches was derived from our operations outside the states of São Paulo and Rio de Janeiro.
In the fourth quarter of 2011, we conducted an extensive review of our operations and the operations of our subsidiaries, and our combined business strategy. As a result of this review, the following changes were made: temporary reductions of the activities of the Tenda segment, increase in investments in the Alphaville segment and focus the Gafisa segment on the markets of Sao Paulo and Rio de Janeiro.
Our common shares are listed on the BM&FBOVESPA under the symbol “GFSA3” and the ADSs are listed on the NYSE under the symbol “GFA.”
Our agent for service of process in the United States is National Corporate Research, Ltd. located at 10 East 40th Street, 10th floor, New York, NY 10016.
Historical Background and Recent Developments
Gomes de Almeida Fernandes Ltda., or “GAF,” was established in 1954 in the city of Rio de Janeiro with operations in the real estate markets in the cities of Rio de Janeiro and São Paulo. In December 1997, GP Investimentos S.A. and its affiliates, or “GP,” entered into a partnership with the shareholders of GAF to create Gafisa S.A. In 2004, as a result of a corporate restructuring, GP assumed a controlling position in our company. In 2005, an affiliate of Equity International Management, LLC, or “Equity International,” acquired approximately 32% of our company through a capital contribution. In February 2006, we concluded our initial public offering in Brazil, resulting in a public float of approximately 47% of our total share capital at the conclusion of the offering.
In September 2006, we created Gafisa Vendas Intermediação Imobiliária Ltda., or “Gafisa Vendas,” to function as our internal sales division in the state of São Paulo and in February 2007, we created a branch of Gafisa Vendas in Rio de Janeiro, or “Gafisa Vendas Rio,” to function as our internal sales division in the metropolitan region of Rio de Janeiro.
In October 2006, we entered into an agreement with Alphaville Participações S.A. to acquire 100% of Alphaville Urbanismo S.A. (“Alphaville”), one of the largest residential community development companies in Brazil in terms of units and square meters, focused on the identification, development and sale of high quality residential communities in the metropolitan regions throughout Brazil targeted at upper and upper-middle income families. On January 8, 2007, we successfully completed the acquisition of 60% of Alphaville’s shares for R$198.4 million, of which R$20 million was paid in cash and the remaining R$178.4 million was paid in exchange for 6.4 million common shares of Gafisa. The acquisition agreement provided for the purchase of the remaining 40% in two phases: 20% was purchased in 2010 for R$126.5 million and for the remaining 20%, while the valuation of the capital stock has been agreed by both parties, the number of shares that shall be issued by the Company to settle this transaction is being decided in arbitration proceedings initiated by the noncontrolling holders of Alphaville, according to the material fact we released on July 3, 2012. Alphaville is operating as one of our subsidiaries based in the city of São Paulo.
On March 17, 2007, we concluded our initial public offering of common shares in the United States, resulting in a public float of 78.6% of our total share capital at the conclusion of the offering. Upon completion of the offering, entities related to Equity International and GP controlled 14.2% and 7.3% of our total capital stock, respectively. In June 2007, Brazil Development Equity Investments, LLC, a company affiliated with GP, sold its remaining stake in our company (7.1% of our capital stock at the time).
On March 15, 2007, we created a new wholly-owned subsidiary, Fit Residencial Empreendimentos Imobiliários Ltda., or “FIT,” for the development, construction and management of lower and lower-middle income residential projects. On October 21, 2008, Gafisa and Tenda concluded a business combination in which FIT was merged into Tenda. The purpose of the merger was to consolidate the activities of FIT and Tenda in the lower-income segment in Brazil focused on developing real estate units with an average price of less than R$200.0 million. As a result of the business combination, Gafisa became the owner of 60.0% of the total and voting capital stock of Tenda. On December 30, 2009, the shareholders of Gafisa and Tenda approved a corporate restructuring to consolidate Gafisa’s
non-controlling share ownership in Tenda. The restructuring was accomplished by exchanging all of the remaining Tenda shares not held by Gafisa into Gafisa shares. As a result of the restructuring, Tenda became a wholly-owned subsidiary of Gafisa. On October 26, 2007, Gafisa acquired 70% of Cipesa Engenharia S.A., a leading homebuilder in the State of Alagoas at the time.
On October 1, 2010, Equity International sold its remaining stake in our company. As of December 31, 2012, Fundação dos Economiarios Federais (“FUNCEF”) was the only shareholder holding more than 5.0% of our shares.
On June 8, 2012, according to the material fact then disclosed, the third phase of the Investment Agreement and Other Covenants entered into on October 2, 2006 (“Investment Agreement”), established the rules and conditions for Gafisa related to the acquisition of the remaining 20% interest in the capital stock of Alphaville not held by the Company. While the valuation of the capital stock has been agreed by both parties, the number of shares that shall be issued by the Company to settle this transaction is being decided in arbitration proceedings initiated by the noncontrolling holders of Alphaville, according to the material fact we released on July 3, 2012. There is an embedded derivative component to the Investment Agreement, relating to the Company’s obligation to purchase the Alphaville shares held by the non-controlling interest. As the fair value of this embedded derivative for all reporting periods has no significant value, since the future settlement of the derivative will be based on the fair value of Alphaville’s capital stock, no derivative asset or liability has been recorded. The future settlement to be made in cash or shares represented an amount of R$359.0 million as at December 31, 2012 and 2011. If 70,251,551 common shares of Gafisa are issued to the other shareholders of Alphaville, these shareholders will receive 13.96% of Gafisa’s total capital stock.
Capital Expenditures
In 2010, we invested R$63.5 million in property and equipment, primarily information technology equipment, software, expenses for the construction of sales stands, facilities, model apartments and related furnishings and new office facilities in São Paulo. Our main investments during the period were the construction of sales stands, which totaled R$43.4 million, investments in information technology equipment and software, which totaled R$10.8 million, in construction equipment, which totaled R$4.4 million and in machine and equipment, which totaled R$3.9 million.
In 2011, we invested R$105.6 million in machinery and equipment, information technology equipment, software, project planning, technology information projects, and the refurbishment of new office facilities in Minas Gerais. Our main investments during the period were related to software and hardware acquisitions, which amounted to R$33.2 million and R$7.9 million respectively.
In 2012, we invested R$114.8 million in machinery and equipment, information technology equipment, software, project planning and information technology projects. Our main investments during the period were related to software and hardware acquisitions, which amounted to R$30.7 million and R$5.7 million respectively.
Our capital expenditures are all made in Brazil and are usually funded by financings through local debt capital markets. We currently do not have any significant capital expenditures in progress.
B. Business Overview
General Overview
We believe we are one of Brazil’s leading homebuilders. Over more than 50 years, Gafisa has been recognized as one of the foremost professionally-managed homebuilders, having completed and sold more than 1,000 developments and constructed over 12 million square meters of housing, which we believe is more than any other residential development company in Brazil. We believe our brands “Gafisa,” “Alphaville,” and “Tenda” are well-known brands in the Brazilian real estate development market, enjoying a reputation among potential homebuyers, brokers, lenders, landowners and competitors for quality, consistency and professionalism.
Our core business is the development of high-quality residential units in attractive locations. For the year ended December 31, 2012, approximately 54% of the value of our launches was derived from high and mid high-level residential developments under the Gafisa brand. We are also engaged in the development of land subdivisions, also known as residential communities, representing approximately 46% of the value of our launches under the
Alphaville brand. In addition, we provide construction services to third parties. In 2012, we suspended the launch of additional units in our affordable entry-level housing brand, Tenda.
We are one of Brazil’s most geographically-diversified homebuilders currently operating in more than 113 municipalities, including São Paulo, Rio de Janeiro, Salvador, Fortaleza, Natal, Curitiba, Belo Horizonte, Manaus, Porto Alegre and Belém, across 21 states and the Federal District, which represents approximately 21% of the national population and approximately 78% of the gross domestic product as of December 31, 2012. Many of these developments are located in markets where few large competitors currently operate. For the year ended December 31, 2012 approximately 38% of the value of our launches were derived from our operations outside the states of São Paulo and Rio de Janeiro.
Our Markets
We are present in 113 municipalities, including Abatia, Águas Lindas de Goias, Ananindeua, Anápolis, Aparecida de Goiânia, Aracajú, Barbacena, Barra dos Coqueiros, Barreiro, Barueri, Belém, Belford Roxo, Belo Horizonte, Betim, Brasília, Cabo Frio, Cachoeirinha, Cajamar, Camaçari, Campinas, Campo Grande, Campos dos Goytacazes, Canoas, Caruaru, Caxias, Contagem, Cotia, Cuiabá, Curitiba, Diadema, Duque de Caxias, Eusébio, Feira de Santana, Ferraz de Vasconcelos, Fortaleza, Foz do Iguaçu, Goiânia, Governador Valadares, Gramado, Gravataí, Guarujá, Guarulhos, Iguaraçu, Itaboraí, Itanhaém, Itapevi, Itaquaquecetuba, Itu, Jaboatão dos Guararapes, Jandira, Jardim Primavera, João Pessoa, Juiz de Fora, Jundiaí, Lauro de Freitas, Londrina, Macaé, Maceió, Manaus, Maricá, Mauá, Mirante Campina Grande, Mogi das Cruzes, Montes Claros, Mossoró, Natal, Niterói, Nova Iguaçu, Nova Lima, Novo Gama, Novo Hamburgo, Osasco, Paço do Lumiar, Parnamirim, Petrolina, Pinhais, Piracicaba, Poá, Porto Alegre, Porto Velho, Recife, Resende, Ribeirão das Neves, Ribeirão Preto, Rio das Ostras, Rio de Janeiro, Salvador, Samambaia, Santa Luzia, Santana de Parnaiba, Santo André, Santos, São Bernardo do Campo, São Caetano do Sul, São Gonçalo, São José dos Campos, São Leopoldo, São Luis, São Paulo, São Vicente, Sapucaia do Sul, Serra, Sete Lagoas, Sorocaba, Suzano, Taboão da Serra, Teresina, Valência, Valparaíso, Vespasiano, Vitória da Conquista, Volta Redonda, across 21 states and the Federal District throughout Brazil.
Our Real Estate Activities
Our real estate business includes the following activities:
|
|
·
|
developments for sale of;
|
|
|
·
|
residential units;
|
|
|
·
|
land subdivisions (also known as residential communities);
|
|
|
·
|
commercial buildings;
|
|
|
·
|
construction services to third parties; and
|
|
|
·
|
sale of units through our brokerage subsidiaries, Gafisa Vendas and Gafisa Vendas Rio, jointly referred to as “Gafisa Vendas.”
|
The table below sets forth our potential sales value from new developments generated for each of our real estate activities and as a percentage of total real estate value generated during the periods presented:
|
For year ended December 31,
|
||||||||||||||||||||||||
|
2012
|
2011
|
2010
|
||||||||||||||||||||||
|
(in thousands of R$)
|
(% of total)
|
(in thousands of R$)
|
(% of total)
|
(in thousands of R$)
|
(% of total)
|
|||||||||||||||||||
|
Residential buildings
|
R$ | 1,314,041 | 44.5 | % | R$ | 1,401,666 | 39.7 | % | R$ | 3,751,243 | 83.5 | % | ||||||||||||
|
Land subdivisions
|
1,343,313 | 45.5 | 1,040,071 | 29.5 | 740,592 | 16.5 | ||||||||||||||||||
|
Commercial
|
294,607 | 10.0 | 1,085,099 | 30.8 | — | — | ||||||||||||||||||
|
Potential sales
|
2,951,961 | 100.0 | 3,526,836 | 100.0 | 4,491,835 | 100.0 | ||||||||||||||||||
The table below sets forth our actual sales value from new developments generated for each of our real estate activities and as a percentage of total real estate amount generated during the periods presented:
|
For year ended December 31,
|
||||||||||||||||||||||||
|
2012
|
2011
|
2010
|
||||||||||||||||||||||
|
(in thousands of R$)
|
(% of total)
|
(in thousands of R$)
|
(% of total)
|
(in thousands of R$)
|
(% of total)
|
|||||||||||||||||||
|
Residential buildings
|
R$ | 753,733 | 43.7 | % | R$ | 885,124 | 40.0 | % | R$ | 2,214,134 | 82.9 | % | ||||||||||||
|
Land subdivisions
|
894,176 | 51.9 | 706,573 | 32.0 | 457,966 | 17.1 | ||||||||||||||||||
|
Commercial
|
75,976 | 4.4 | 618,538 | 28.0 | — | — | ||||||||||||||||||
|
Potential sales
|
1,723,885 | 100.0 | 2,210,235 | 100.0 | 2,672,100 | 100.0 | ||||||||||||||||||
Developments for Sale
The table below provides information on our developments for sale activities during the periods presented:
|
As of and for year ended December 31,
|
||||||||||||
|
2012
|
2011
|
2010
|
||||||||||
|
(in thousands of R$, unless otherwise stated)
|
||||||||||||
|
São Paulo
|
||||||||||||
|
Potential sales value of units launched(1)
|
1,338,281 | 1,611,510 | 1,537,604 | |||||||||
|
Developments launched(2)
|
13 | 16 | 26 | |||||||||
|
Usable area (m2)(3)
|
203,636 | 298,133 | 357,699 | |||||||||
|
Units launched(4)
|
2,361 | 3,808 | 3,336 | |||||||||
|
Average sales price (R$/m2)(3)
|
6,572 | 5,405 | 4,568 | |||||||||
|
Rio de Janeiro
|
||||||||||||
|
Potential sales value of units launched(1)
|
270,367 | 557,562 | 158,953 | |||||||||
|
Developments launched(2)
|
2 | 4 | 3 | |||||||||
|
Usable area (m2)(3)
|
33,987 | 134,968 | 36,075 | |||||||||
|
Units launched(4)
|
260 | 1,742 | 285 | |||||||||
|
Average sales price (R$/m2)(3)(5)
|
7,955 | 4,131 | 4,406 | |||||||||
|
Other States(6)
|
||||||||||||
|
Potential sales value of units launched(1)
|
— | (12,354 | ) | 458,766 | ||||||||
|
Developments launched(2)
|
— | 1 | 17 | |||||||||
|
Usable area (m2)(3)
|
— | (2,898 | ) | 221,747 | ||||||||
|
Units launched(4)
|
— | (70 | ) | 1,504 | ||||||||
|
Average sales price (R$/m2)(3)(5)
|
— | 1,716 | 2,068 | |||||||||
|
Total Gafisa
|
||||||||||||
|
Potential sales value of units launched(1)
|
1,608,648 | 2,156,718 | 2,155,323 | |||||||||
|
Developments launched(2)
|
15 | 21 | 46 | |||||||||
|
Usable area (m2)(3)
|
237,624 | 430,203 | 615,521 | |||||||||
|
Units launched(4)
|
2,621 | 5,479 | 5,124 | |||||||||
|
Average sales price (R$/m2)(3)(5)
|
6,770 | 5,013 | 3,626 | |||||||||
|
Alphaville
|
||||||||||||
|
Potential sales value of units launched(1)
|
1,343,313 | 972,385 | 740,592 | |||||||||
|
Developments launched(2)
|
20 | 12 | 15 | |||||||||
|
Usable area (m2)(3)(7)
|
2,915,627 | 1,655,927 | 1,705,121 | |||||||||
|
Units launched(4)
|
6,326 | 3,714 | 3,607 | |||||||||
|
Average sales price (R$/m2)(3)(5)
|
460 | 526 | 434 | |||||||||
|
Tenda
|
||||||||||||
|
Potential sales value of units launched(1)
|
— | 397,733 | 1,595,919 | |||||||||
|
Developments launched(2)
|
— | 16 | 66 | |||||||||
|
Usable area (m2)(3)
|
— | 164,595 | 709,106 | |||||||||
|
Units launched(4)
|
— | 3,030 | 13,502 | |||||||||
|
Average sales price (R$/m2)(3)(5)
|
— | 2,416 | 2,251 | |||||||||
|
(1)
|
Potential sales value is calculated by multiplying the number of units sold in a development by the unit sales price.
|
|
(2)
|
Does not consider acquisitions of additional ownership interests in projects or cancelled projects.
|
|
(3)
|
One square meter is equal to approximately 10.76 square feet; values for Gafisa´s participation on the project. For Gafisa, it includes the usable area of the projects acquired in 2010, Anauá and Igloo Alphaville.
|
|
(4)
|
The units delivered in exchange for land pursuant to barter transactions are not included; values reflect Gafisa’s participation on the project.
|
|
(5)
|
Average sales price per square meter excludes the land subdivisions. Average sales price per square meter (including land subdivisions and excluding Tenda’s ventures) was R$1,011, R$1,373 and R$1,259 R$1,369 in 2012, 2011 and 2010, respectively.
|
|
(6)
|
In 2011, Gafisa launched one project outside São Paulo and Rio de Janeiro and cancelled another which had higher potential sales value, usable area and number of units than the new launch.
|
|
(7)
|
Does not consider the area of Tereno Cajamar, of approximately 5,420,927. In 2011, Gafisa launched one project outside São Paulo and Rio de Janeiro and cancelled another, which had higher potential sales value, usable area and number of units than the new launch.
|
Our developments for sale are divided into three broad categories: (1) residential buildings, (2) land subdivisions, and (3) commercial buildings.
Overview of Residential Buildings
In the residential buildings category, we develop three main types of products: (1) luxury buildings targeted at upper-income customers; (2) buildings targeted at middle-income customers; and (3) affordable entry-level housing targeted at lower-income customers. Quality residential buildings for middle- and upper-income customers are our core products and we have developed them since our inception. A significant portion of our residential developments is located in São Paulo and Rio de Janeiro where we have held a leading position over the past five years based upon area of total construction. However, beginning in 2006, we began our national expansion to pursue highly profitable opportunities in residential buildings outside these cities. For the year ended December 31, 2012, none of the value of our launches was derived from our operations outside the states of São Paulo and Rio de Janeiro and therefore these states are responsible for 100% of our operations.
Luxury Buildings
Luxury buildings are a high margin niche. Units usually have over 180 square meters of private area, at least four bedrooms and three parking spaces. Typically, this product is fitted with modern, top-quality materials designed by brand-name manufacturers. The development usually includes swimming pools, gyms, visitor parking, and other amenities. Average price per square meter generally is higher than approximately R$8,000. Luxury building developments are targeted to families with monthly household incomes in excess of approximately R$30,000.
The table below sets forth our luxury building developments launched between January 1, 2010 and December 31, 2012:
|
Project Description
|
Year Launched
|
Gafisa Participation (%)
|
Usable Area (m2) (1) (2)
|
Completion Year
|
Number of Units (2)
|
Units Sold (%) (As of December 31, 2012)
|
||||||||||||||||
|
Duquesa-Lorian Qd2B
|
2012
|
100 | 34,429 | 2015 | 130 | 69 | ||||||||||||||||
|
Like Brooklin
|
2012
|
100 | 13,298 | 2015 | 146 | 80 | ||||||||||||||||
|
ECLAT (Ferreira de Araujo)
|
2012
|
100 | 13,017 | 2015 | 49 | 58 | ||||||||||||||||
|
Energy
|
2012
|
100 | 9,666 | 2015 | 156 | 85 | ||||||||||||||||
|
Scena Laguna
|
2012
|
80 | 13,728 | 2015 | 62.5 | 51 | ||||||||||||||||
|
LIKE SAUDE
|
2012
|
100 | 14,850 | 2015 | 144 | 49 | ||||||||||||||||
|
SCENA SANTANA (b)
|
2012
|
100 | 17,548 | 2015 | 76 | 33 | ||||||||||||||||
|
ALPHA LAND
|
2012
|
100 | 23,005 | 2015 | 210 | 44 | ||||||||||||||||
|
Easy Vila Romana
|
2011
|
100 | 61,100 | 2014 | 73 | 94 | ||||||||||||||||
|
Riservatto
|
2011
|
100 | 32,553 | 2014 | 174 | 81 | ||||||||||||||||
|
Fradique Coutinho - MOSAICO
|
2010
|
100 | 6,058 | 2012 | (a) | 62 | 98 | |||||||||||||||
|
Smart Perdizes
|
2010
|
100 | 7,310 | 2013 | 82 | 99 | ||||||||||||||||
|
Smart Vila Mariana
|
2010
|
100 | 6,542 | 2012 | (a) | 74 | 100 | |||||||||||||||
|
Anauá
|
2010
|
80 | 11,395 | 2012 | (a) | 25 | 92 | |||||||||||||||
|
Zenith - It Fase 3
|
2010
|
100 | 8,464 | 2013 | 24 | 67 | ||||||||||||||||
|
Vistta Laguna
|
2010
|
80 | 26,287 | 2013 | 129 | 98 | ||||||||||||||||
|
Project Description
|
Year Launched
|
Gafisa Participation (%)
|
Usable Area (m2) (1) (2)
|
Completion Year
|
Number of Units (2)
|
Units Sold (%) (As of December31, 2012)
|
|||||||||||||||
|
iGLOO Vila Olimpia
|
2010
|
50 | 4,544 | 2013 | 89 | 100 | |||||||||||||||
|
Lorian Qd2A
|
2010
|
100 | 34,429 | 2014 | 131 | 97 | |||||||||||||||
|
The Place - Stake Acquisition
|
2010
|
20 | 1,496 | 2012 | (a) | 4 | 100 | ||||||||||||||
|
(1)
|
One square meter is equal to approximately 10.76 square feet.
|
|
(2)
|
Values for 100% of the building development, except on projects with stake acquisition.
|
|
|
(a)
|
Project delivered.
|
|
(b)
|
This project was launched in November 2012 and its sales velocity is in accordance with our business plan.
|
Middle Income Buildings
Buildings targeted at middle-income customers have accounted for the majority of our sales since our inception. Units usually have between 90 and 180 square meters of private area, three or four bedrooms and two to three underground parking spaces. Buildings are usually developed in large tracts of land as part of multi-building developments and, to a lesser extent, in smaller lots in attractive neighborhoods. Average price per square meter ranges from approximately R$4,500 to R$8,000. Developments in Rio de Janeiro tend to be larger due to the large tracts of land available in Barra da Tijuca. Middle-income building developments are tailored to customers with monthly household incomes between approximately R$10,000 and R$30,000.
The table below sets forth our middle-income building developments launched between January 1, 2010 and December 31, 2012:
|
Project Description
|
Year Launched
|
Gafisa Participation (%)
|
Usable Area (m2) (1) (2)
|
Completion Year
|
Number of Units (2)
|
Units Sold (%) (As of December 31, 2012)
|
||||||||||||||||
|
Maraville (Ana Maria Lote A)
|
2012
|
100 | 16,956 | 2015 | 280 | 75 | ||||||||||||||||
|
COLORATTO
|
2012
|
100 | 19,731 | 2015 | 192 | 60 | ||||||||||||||||
|
Mistral
|
2012
|
100 | 6,837 | 2014 | 112 | 77 | ||||||||||||||||
|
Smart Santana
|
2012
|
100 | 7,619 | 2015 | 84 | 63 | ||||||||||||||||
|
EASY MARACA
|
2012
|
100 | 17,113 | 2015 | 147 | 78 | ||||||||||||||||
|
Fantastique (Angá - F1)
|
2011
|
100 | 26,248 | 2014 | 378 | 68 | ||||||||||||||||
|
Avant Garde
|
2011
|
100 | 21,020 | 2015 | 168 | 92 | ||||||||||||||||
|
Alegria - Fase 4
|
2011
|
100 | 14,599 | 2014 | 139 | 100 | ||||||||||||||||
|
Smart Vila Mascote – Lacedemonia
|
2011
|
100 | 10,200 | 2014 | 156 | 84 | ||||||||||||||||
|
Alegria - Fase 5
|
2011
|
100 | 14,599 | 2014 | 139 | 98 | ||||||||||||||||
|
Smart Maracá
|
2011
|
100 | 11,071 | 2014 | 156 | 100 | ||||||||||||||||
|
Royal - Vila Nova São José QC1
|
2011
|
100 | 10,075 | 2013 | 68 | 80 | ||||||||||||||||
|
Vision Anália Franco
|
2011
|
100 | 12,280 | 2014 | 200 | 69 | ||||||||||||||||
|
Station Parada Inglesa (André Campale)
|
2011
|
100 | 13,224 | 2014 | 173 | 93 | ||||||||||||||||
|
Mundi - Residencial Ceramica - Fase I
|
2011
|
100 | 28,749 | 2014 | 192 | 69 | ||||||||||||||||
|
Weekend (Vitória Régia)
|
2010
|
100 | 15,004 | 2013 | 37 | 90 | ||||||||||||||||
|
Reserva Ecoville
|
2010
|
50 | 38,455 | 2014 | 256 | 83 | ||||||||||||||||
|
Pq Barueri Cond Clube F2A -Sabiá
|
2010
|
100 | 15,101 | 2013 | 171 | 80 | ||||||||||||||||
|
Alegria - Fase2B
|
2010
|
100 | 14,599 | 2012 | (a) | 139 | 99 | |||||||||||||||
|
Pátio Condomínio Clube - Harmony
|
2010
|
100 | 10,370 | 2012 | (a) | 96 | 98 | |||||||||||||||
|
Mansão Imperial - Fase 2b
|
2010
|
100 | 19,210 | 2011 | (a) | 89 | 98 | |||||||||||||||
|
Golden Residence
|
2010
|
100 | 6,377 | 2013 | 78 | 99 | ||||||||||||||||
|
Riservato
|
2010
|
100 | 4,078 | 2012 | (a) | 42 | 100 | |||||||||||||||
|
Pateo Mondrian (Mota Paes)
|
2010
|
100 | 16,012 | 2012 | (a) | 115 | 100 | |||||||||||||||
|
Jatiuca - Maceió - AL - Fase 2
|
2010
|
50 | 4,256 | 2011 | (a) | 48 | 91 | |||||||||||||||
|
Grand Park Varandas - FI
|
2010
|
50 | 14,654 | 2014 | 188 | 68 | ||||||||||||||||
|
Canto dos Pássaros_Parte 2 (b)
|
2010
|
80 | 7,428 | 2013 | 112 | 33 | ||||||||||||||||
|
Grand Park Varandas - FII
|
2010
|
50 | 12,242 | 2014 | 150 | 68 | ||||||||||||||||
|
Grand Park Varandas - FIII
|
2010
|
50 | 8,965 | 2015 | 114 | 68 | ||||||||||||||||
|
JARDIM DAS ORQUIDEAS
|
2010
|
50 | 20,811 | 2013 | 204 | 97 | ||||||||||||||||
|
JARDIM DOS GIRASSOIS
|
2010
|
50 | 21,000 | 2013 | 300 | 97 | ||||||||||||||||
|
Pátio Condomínio Clube - Kelvin
|
2010
|
100 | 10,370 | 2012 | (a) | 96 | 100 | |||||||||||||||
|
Portal da Vila - Vila Nova São José QF
|
2010
|
100 | 10,771 | 2013 | 152 | 98 | ||||||||||||||||
|
Project Description
|
Year Launched
|
Gafisa Participation (%)
|
Usable Area (m2) (1) (2)
|
Completion Year
|
Number of Units (2)
|
Units Sold (%) (As of December 31, 2012)
|
||||||||||||||||
|
CWB 34 - PARQUE ECOVILLE Fase1
|
2010
|
50 | 18,326 | 2013 | 204 | 79 | ||||||||||||||||
|
GRAND PARK - GLEBA 05 - F4A
|
2010
|
50 | 6,085 | 2015 | 74 | 68 | ||||||||||||||||
|
Barão de Teffé - Fase1
|
2010
|
100 | 14,479 | 2013 | 142 | 99 | ||||||||||||||||
|
Jardins da Barra Lote 3
|
2010
|
50 | 15,470 | 2012 | (a) | 222 | 98 | |||||||||||||||
|
Luis Seraphico
|
2010
|
100 | 29,990 | 2013 | 233 | 100 | ||||||||||||||||
|
Barão de Teffé - Fase 2
|
2010
|
100 | 12,742 | 2013 | 124 | 100 | ||||||||||||||||
|
Parque Ecoville Fase 2A
|
2010
|
50 | 22,354 | 2013 | 202 | 63 | ||||||||||||||||
|
GRAND PARK - GLEBA 05 - F4B
|
2010
|
50 | 6,085 | 2015 | 75 | 68 | ||||||||||||||||
|
Igloo Alphaville
|
2010
|
80 | 9,705 | 2012 | (a) | 184 | 95 | |||||||||||||||
|
Quadra C13 - direita - Jardim Goiás com outorga
|
2010
|
100 | 11,073 | 2013 | 111 | 64 | ||||||||||||||||
|
Pq Barueri Cond Clube F2B – Rouxinol
|
2010
|
100 | 15,101 | 2013 | 171 | 99 | ||||||||||||||||
|
GRAND PARK - GLEBA 05 - F4C
|
2010
|
50 | 6,085 | 2015 | 89 | 68 | ||||||||||||||||
|
Euclides da Cunha 2
|
2010
|
100 | 14,345 | 2014 | 174 | 84 | ||||||||||||||||
|
BOM RETIRO F1
|
2010
|
100 | 22,393 | 2013 | 252 | 100 | ||||||||||||||||
|
BOM RETIRO F2
|
2010
|
100 | 22,393 | 2013 | 252 | 100 | ||||||||||||||||
|
Prime - Gleba 6 - F1
|
2010
|
50 | 25,714 | 2014 | 222 | 40 | ||||||||||||||||
|
Horizonte - Stake Acquisition
|
2010
|
20 | 1,501 | 2011 | (a) | 6 | 100 | |||||||||||||||
|
Parc Paradiso - Stake Acquisition
|
2010
|
5 | 2,321 | 2012 | (a) | 22 | 98 | |||||||||||||||
|
Reserva Ibiapaba - Stake Acquisition
|
2010
|
20 | 4,603 | 2012 | (a) | 52 | 96 | |||||||||||||||
|
Privilege - Stake Acquisition
|
2010
|
20 | 3,235 | 2011 | (a) | 39 | 99 | |||||||||||||||
|
Carpe Diem - Niterói - Stake Acquisition
|
2010
|
20 | 10,134 | 2011 | (a) | 23 | 99 | |||||||||||||||
|
(1)
|
One square meter is equal to approximately 10.76 square feet.
|
|
(2)
|
Values for 100% of the building development, except on projects with stake acquisition.
|
|
|
(a) Project delivered.
|
|
|
(b) 2
nd
phase of a project located in a non-core market with a lower sales velocity.
|
Affordable Entry-Level Developments
Affordable entry-level housing consists of building and house units. Units usually have between 42 to 60 square meters of indoor private area and two to three bedrooms. Average price per square meter ranges from approximately R$2,400 to R$4,500. Affordable entry-level housing developments are tailored to families with monthly household incomes between approximately R$1,600 and R$5,000.
As part of our strategy of expanding our foothold in the affordable entry-level residential market, on March 15, 2007 we incorporated a wholly-owned subsidiary, FIT, to focus exclusively on this market. The principal emphasis of FIT was on five standardized residential developments in the peripheries of large metropolitan regions. Financing for FIT’s developments primarily came from the CEF, and such financing was structured so that customers paid low monthly installments without increasing our credit risk.
On October 21, 2008, Gafisa and Tenda concluded a business combination in which Gafisa’s wholly-owned subsidiary FIT was merged into Tenda. The purpose of the merger was to consolidate the activities of FIT and Tenda in the lower-income sector in Brazil and to develop real estate units with an average value of less than R$200,000. As a result of the business combination, Gafisa received 60.0% of the total and voting capital stock of Tenda and FIT was merged into Tenda. Because Tenda launched very few units in 2008, we believe the full impact of the merger was not reflected in Gafisa’s results of operations until 2009.
On December 30, 2009, the shareholders of Gafisa and Tenda approved a corporate restructuring to consolidate Gafisa’s non-controlling share ownership in Tenda. The restructuring was accomplished by exchanging all of the remaining Tenda shares not held by Gafisa into Gafisa shares. As a result of the restructuring, Tenda became a wholly-owned subsidiary of Gafisa.
As a result of Tenda’s and Gafisa’s underperformance in 2011 due to high cost overruns and customer dissolutions, our management and the board of directors have undertaken widespread structural and operational changes to avert future losses and strains on the business. Tenda is now operating under a new strategy whereby pre-sales recognition and the remuneration of the sales force is based on the ability to immediately pass mortgages on to financial institutions and the number of third party construction partners has been reduced to a group that has been thoroughly vetted for quality and sustainability. The strategy also consists of a reduction in the number of launches, and in 2012, we suspended the launch of additional Tenda units. We expect to resume the launches of Tenda branded units in the first half of 2013. Moreover, our management has decided to focus its low- to middle-income businesses in São Paulo, Rio de Janeiro, Minas Gerais and Bahia, where it has, historically, had a better supply chain structure and stronger customer demand. As part of our new organizational strategy to manage further risks, our management has assigned a chief executive for each segment pursuant to which, our former CFO, Rodrigo Osmo assumed the position as Tenda CEO during the second half of 2011.
The table below sets forth our affordable entry-level housing developments launched by us between January 1, 2010 and December 31, 2012:
|
Project Description
|
Year Launched
|
Gafisa Participation (%)
|
Usable Area (m2) (1) (2)
|
Completion Year
|
Number of Units (2)
|
Units Sold (%) (As of December 31, 2012)
|
||||||||||||||||
|
Parque Lumiere
|
2011
|
100 | 4,521 | 2012 | (a) | 100 | 98 | |||||||||||||||
|
Araçagy F3
|
2011
|
50 | 19,292 | 2014 | 372 | 67 | ||||||||||||||||
|
Parma Life
|
2011
|
100 | 3,876 | 2013 | 60 | 100 | ||||||||||||||||
|
Parque Arvoredo F3
|
2011
|
100 | 15,490 | 2013 | 210 | 71 | ||||||||||||||||
|
Vale Verde Cotia - Fase 7
|
2011
|
100 | 3,509 | 2013 | 80 | 69 | ||||||||||||||||
|
RESIDENCIAL ATENAS
|
2011
|
100 | 10,829 | 2014 | 260 | 76 | ||||||||||||||||
|
Vista Flamboyant F2
|
2011
|
100 | 7,268 | 2013 | 132 | 96 | ||||||||||||||||
|
Cheverny F4 + F5 (b)
|
2011
|
100 | 14,107 | 2014 | 192 | 24 | ||||||||||||||||
|
Grand Ville das Artes -
Monet Life IV
|
2010
|
100 | 2,983 | 2011 | (a) | 56 | 91 | |||||||||||||||
|
Grand Ville das Artes -
Matisse Life IV
|
2010
|
100 | 2,983 | 2011 | (a) | 60 | 100 | |||||||||||||||
|
Fit Nova Vida – Taboãozinho
|
2010
|
100 | 8,326 | 2011 | (a) | 137 | 88 | |||||||||||||||
|
São Domingos (Fase Única)
|
2010
|
100 | 13,376 | 2013 | 192 | 100 | ||||||||||||||||
|
Espaço Engenho III (Fase Única)
|
2010
|
100 | 9,919 | 2013 | 197 | 99 | ||||||||||||||||
|
Portal do Sol Life IV
|
2010
|
100 | 3,188 | 2011 | (a) | 64 | 100 | |||||||||||||||
|
Grand Ville das Artes -
Matisse Life V
|
2010
|
100 | 5,966 | 2011 | (a) | 120 | 90 | |||||||||||||||
|
Grand Ville das Artes -
Matisse Life VI
|
2010
|
100 | 5,966 | 2011 | (a) | 120 | 94 | |||||||||||||||
|
Grand Ville das Artes -
Matisse Life VII
|
2010
|
100 | 4,972 | 2011 | (a) | 100 | 99 | |||||||||||||||
|
Residencial Buenos Aires Tower
|
2010
|
100 | 6,518 | 2013 | 88 | 80 | ||||||||||||||||
|
Estação do Sol - Jaboatão I
|
2010
|
100 | 9,749 | 2012 | (a) | 159 | 100 | |||||||||||||||
|
Fit Marumbi Fase II
|
2010
|
100 | 24,266 | 2012 | (a) | 335 | 82 | |||||||||||||||
|
Portal do Sol Life V
|
2010
|
100 | 4,883 | 2011 | (a) | 96 | 94 | |||||||||||||||
|
Florença Life I
|
2010
|
100 | 8,731 | 2013 | 199 | 83 | ||||||||||||||||
|
Cotia - Etapa I Fase V
|
2010
|
100 | 11,929 | 2011 | (a) | 272 | 99 | |||||||||||||||
|
Fit Jardim Botânico Paraiba - Stake Acquisition
|
2010
|
50 | 11,716 | 2012 | (a) | 155 | 98 | |||||||||||||||
|
Coronel Vieira Lote Menor (Cenário 2)
|
2010
|
100 | 7,951 | 2014 | 158 | 92 | ||||||||||||||||
|
Portal das Rosas
|
2010
|
100 | 8,158 | 2012 | (a) | 132 | 87 | |||||||||||||||
|
Igara III
|
2010
|
100 | 14,704 | 2013 | 240 | 99 | ||||||||||||||||
|
Portal do Sol - Fase 6
|
2010
|
100 | 3,199 | 2012 | (a) | 64 | 100 | |||||||||||||||
|
Grand Ville das Artes - Fase 9
|
2010
|
100 | 6,709 | 2012 | (a) | 120 | 97 | |||||||||||||||
|
Gran Ville das Artes - Fase 8
|
2010
|
100 | 5,590 | 2012 | (a) | 100 | 94 | |||||||||||||||
|
Vale do Sol Life
|
2010
|
100 | 3,976 | 2013 | 79 | 98 | ||||||||||||||||
|
Engenho Life IV
|
2010
|
100 | 9,919 | 2014 | 197 | 98 | ||||||||||||||||
|
Residencial Club Cheverny
|
2010
|
100 | 28,215 | 2014 | 384 | 71 | ||||||||||||||||
|
Assunção Life
|
2010
|
100 | 30,347 | 2014 | 440 | 79 | ||||||||||||||||
|
Residencial Brisa do Parque II
|
2010
|
100 | 5,678 | 2013 | 105 | 96 | ||||||||||||||||
|
Portal do Sol Life VII
|
2010
|
100 | 3,199 | 2012 | (a) | 64 | 83 | |||||||||||||||
|
Project Description
|
Year Launched
|
Gafisa Participation (%)
|
Usable Area (m2) (1) (2)
|
Completion Year
|
Number of Units (2)
|
Units Sold (%) (As of December 31, 2012)
|
||||||||||||||||
|
Vale Verde Cotia F5B
|
2010
|
100 | 5,182 | 2011 | (a) | 116 | 99 | |||||||||||||||
|
San Martin
|
2010
|
100 | 9,242 | 2013 | 132 | 91 | ||||||||||||||||
|
Jd. Barra - Lote 4
|
2010
|
50 | 9,683 | 2012 | (a) | 224 | 99 | |||||||||||||||
|
Jd. Barra - Lote 5
|
2010
|
50 | 9,683 | 2012 | (a) | 224 | 98 | |||||||||||||||
|
Jd. Barra - Lote 6
|
2010
|
50 | 9,683 | 2012 | (a) | 224 | 99 | |||||||||||||||
|
ESTAÇÃO DO SOL
TOWER - Fase 2
|
2010
|
100 | 9,763 | 2012 | (a) | 160 | 100 | |||||||||||||||
|
Assis Brasil Fit Boulevard
|
2010
|
70 | 19,170 | 2014 | 319 | 69 | ||||||||||||||||
|
Parque Arvoredo - F1
|
2010
|
100 | 24,154 | 2013 | 360 | 89 | ||||||||||||||||
|
GVA 10 a 14
|
2010
|
100 | 31,307 | 2012 | (a) | 559 | 96 | |||||||||||||||
|
Portal do Sol - Fase 8 a 14
|
2010
|
100 | 22,391 | 2012 | (a) | 448 | 97 | |||||||||||||||
|
Flamboyant Fase 1
|
2010
|
100 | 14,536 | 2013 | 264 | 77 | ||||||||||||||||
|
Assunção Fase 3
|
2010
|
100 | 10,412 | 2014 | 158 | 79 | ||||||||||||||||
|
Viver Itaquera
(Agrimensor Sugaya)
|
2010
|
100 | 11,123 | 2012 | (a) | 199 | 100 | |||||||||||||||
|
Firenze Life
|
2010
|
100 | 11,855 | 2013 | 240 | 77 | ||||||||||||||||
|
Villagio Carioca - Cel Lote Maior
|
2010
|
100 | 11,927 | 2014 | 237 | 92 | ||||||||||||||||
|
FIT COQUEIRO I - Stake Acquisition
|
2010
|
20 | 3,336 | 2010 | (a) | 69 | 99 | |||||||||||||||
|
FIT COQUEIRO II - Stake Acquisition
|
2010
|
20 | 2,935 | 2010 | (a) | 50.8 | 98 | |||||||||||||||
|
Alta Vista
|
2010
|
100 | 10,941 | 2012 | (a) | 160 | 99 | |||||||||||||||
|
Bosque dos Pinheiros
|
2010
|
100 | 8,440 | 2013 | 118 | 72 | ||||||||||||||||
|
Cassol F2a
|
2010
|
100 | 12,077 | 2013 | 180 | 93 | ||||||||||||||||
|
Araçagy - F1
|
2010
|
50 | 19,292 | 2013 | 372 | 67 | ||||||||||||||||
|
Colubandê Life (c)
|
2010
|
100 | 7,197 | 2013 | 160 | 44 | ||||||||||||||||
|
Residencial Germânia Life F1
|
2010
|
100 | 22,023 | 2012 | (a) | 340 | 69 | |||||||||||||||
|
São Matheus II
|
2010
|
100 | 7,453 | 2013 | 160 | 70 | ||||||||||||||||
|
Ananindeua (d)
|
2010
|
80 | 22,286 | 2013 | 540 | 38 | ||||||||||||||||
|
FELICITÁ F1
|
2010
|
100 | 9,017 | 2014 | 126 | 69 | ||||||||||||||||
|
FELICITÁ F2
|
2010
|
100 | 9,017 | 2014 | 126 | 70 | ||||||||||||||||
|
FELICITÁ F3
|
2010
|
100 | 9,017 | 2014 | 126 | 72 | ||||||||||||||||
|
Araçagy - F2
|
2010
|
50 | 14,469 | 2013 | 280 | 67 | ||||||||||||||||
|
Guaianazes Life
|
2010
|
100 | 8,849 | 2013 | 168 | 89 | ||||||||||||||||
|
Vivai - Stake Acquisition
|
2010
|
10 | 3,738 | 2012 | (a) | 64 | 94 | |||||||||||||||
|
Mirante do Lago F2 - Stake Acquisition (d)
|
2010
|
30 | 3,550 | 2012 | (a) | 56 | 42 | |||||||||||||||
|
MIRANTE DO LAGO F1 - Stake Acquisition
|
2010
|
30 | 9,315 | 2012 | (a) | 139 | 83 | |||||||||||||||
|
ICOARACI - Stake Acquisition
|
2010
|
20 | 4,002 | 2012 | (a) | 59 | 78 | |||||||||||||||
|
FIT MIRANTE DO PARQUE - Stake Acquisition
|
2010
|
40 | 15,252 | 2012 | (a) | 168 | 90 | |||||||||||||||
|
(1)
|
One square meter is equal to approximately 10.76 square feet.
|
|
(2)
|
Values for 100% of the building development, except on projects with stake acquisition.
|
|
(a)
|
Project delivered.
|
|
(b)
|
Phases 4 and 5 of this project were launched in 2011, however, during 2012 its project sales were suspended by the Company until phases 1 to 3 are 100% sold (as of December 31, 2012, it presents 71% of units sold). We expect to resume sales for this project in 2014.
|
|
|
(c)
|
This project had a high amount of cancellation due to clients that are not eligible for real estate financing at CEF. These units are available for re-sale. We have evaluated this project and have not identified any impairment risk.
|
|
|
(d)
|
This project is located in a non-core market with a lower sales velocity. In addition, we have evaluated this project and have not identified any impairment risk.
|
Land Subdivisions under our Gafisa Brand
In 2001, we started developing residential land subdivisions for sale upon which residential buildings can be developed. Land subdivisions under our Gafisa brand are usually smaller than our Alphaville residential communities and do not include some of the facilities available in our Alphaville residential communities, such as various amenities, shopping centers and schools. We usually provide the infrastructure for a given land subdivision planning such as the electric, water and sewage systems, paved streets, and common recreational areas. Our land
subdivisions are typically located in affluent suburban areas close to major highways leading to the states of São Paulo and Rio de Janeiro. A typical lot has between 250 and 1,500 square meters. Average price per square meter ranges from approximately R$150 to R$800. We target clients with monthly household incomes in excess of approximately R$5,000 for these land subdivisions.
The table below sets forth our land subdivision developments launched between January 1, 2010 and December 31, 2012:
|
Project Description
|
Year Launched
|
Gafisa Participation (%)
|
Usable Area (m2) (1)(2)
|
Completion Year
|
Number of Units(2)
|
Units Sold (%) (As of December 31, 2012)
|
||||||||||||||||
|
Alta Vista—Phase 2
|
2010
|
50 | 168,299 | 2012(a) | 236 | 65 | ||||||||||||||||
|
(1)
|
One square meter is equal to approximately 10.76 square feet.
|
|
(2)
|
Values for 100% of the building development.
|
|
(a)
|
Project delivered. This project is located in a non-core market with a lower sales velocity. According to the Company’s then existing business plan this development’s selling forecast indicated sales of the unsold units within a short time period.
|
Land Subdivisions under our Alphaville Brand
The Alphaville brand was created in the 1970s when the first Alphaville community was developed in the cities of Barueri and Santana do Paranaíba in the metropolitan region of São Paulo. Beginning in the 1990s, Alphaville developed residential communities in several other cities in Brazil, such as Campinas, Goiânia, Curitiba, Londrina, Maringá, Salvador, Fortaleza, Belo Horizonte, Natal, Gramado, Manaus, Cuiabá, Campo Grande, São Luis and Rio de Janeiro.
Whenever we develop a new Alphaville community, we provide all the basic civil works for supporting the construction on the lots, such as electrical, telephone and data communications cabling, hydraulic (water and sewer) mains and treatment facilities, landscaping and gardening, lighting and paving of the streets and driveways and security fencing. In most Alphaville communities, we also build a social and sports club for the residents, with soccer, golf and tennis fields, jogging and bicycle tracks, saunas, swimming pools, ballrooms, restaurants and bars, and other facilities. In addition, most Alphaville projects have a shopping center where residents can shop for clothes and groceries. Additionally, whenever we develop a new Alphaville community far from large urban centers, we seek to assist in establishing schools near the community by forming partnerships with renowned educational institutions. Throughout our Alphaville communities, we also seek to stimulate the local economy by drawing new businesses to that area.
We believe that the maintenance of a development’s quality is essential. For this reason, we impose on every Alphaville community a series of building and occupancy standards that are more rigorous than those required by applicable local legislation. Every Alphaville community has an Alphaville association formed by us before delivery of the community starts, and is funded by maintenance fees paid by the residents. The purpose of the association is to allow community involvement in the management and maintenance of the premises and to ensure orderly and harmonious relationships among the residents.
Upon completion of a sale, a purchaser of an Alphaville property will receive, along with the purchase and sale contract, documentation that sets out the regulations on land use and occupancy, and these will serve as private zoning regulations that are binding on the resident. These regulations set forth, among other things, the maximum number of floors allowed in an Alphaville building, the minimum number of meters between buildings and land coverage limits, thereby maintaining the uniformity and quality of the Alphaville properties.
The table below sets forth our residential communities launched between January 1, 2010 and December 31, 2012:
|
Project Description
|
Year
Launched
|
Gafisa
Participation
(%)
|
Usable
Area (m2)
(1)(2)
|
Completion Year
|
Number of Units(2)
|
Units Sold (%) (As of December 31, 2012)
|
||||||||||||||||
|
Alphaville Juiz de Fora (h)
|
2012
|
65 | 350,649 | 2014 | 564 | 37 | ||||||||||||||||
|
Alphaville Sergipe
|
2012
|
74 | 257,565 | 2014 | 693 | 94 | ||||||||||||||||
|
Alphaville Mossoró F2 (a)
|
2012
|
52 | 33,764 | 2013 | 170 | 54 | ||||||||||||||||
|
Terras Alphaville Anápolis
|
2012
|
73 | 169,150 | 2013 | 601 | 98 | ||||||||||||||||
|
Alphaville Minas Gerais
|
2012
|
61 | 186,336 | 2014 | 557 | 92 | ||||||||||||||||
|
Project Description
|
Year
Launched
|
Gafisa
Participation
(%)
|
Usable
Area (m2)
(1)(2)
|
Completion Year
|
Number of Units(2)
|
Units Sold (%) (As of December 31, 2012)
|
||||||||||||||||
|
Alphaville Brasília Residencial 2 (b)
|
2012
|
47 | 95,044 | 2014 | 426 | 14 | ||||||||||||||||
|
Brasília Alpha Mall(i)
|
2012
|
50 | 0.574 | 2014 | 26 | — | ||||||||||||||||
|
Terras Alphaville Sergipe
|
2012
|
88 | 151,033 | 2014 | 546 | 99 | ||||||||||||||||
|
Nova Esplanada 3
|
2012
|
30 | 94,806 | 2014 | 660 | 94 | ||||||||||||||||
|
Terras Alphaville Teresina (c)
|
2012
|
79 | 296,627 | 2014 | 1075 | 36 | ||||||||||||||||
|
Alphaville Pelotas (d)
|
2012
|
74 | 183,370 | 2014 | 577 | 13 | ||||||||||||||||
|
Alphaville Porto Velho (e)
|
2012
|
76 | 73,126 | 2013 | 215 | 41 | ||||||||||||||||
|
Terras Alphaville Vitória da Conquista
|
2012
|
75 | 160,195 | 2014 | 547 | 91 | ||||||||||||||||
|
Terras Alphaville Resende F2
|
2012
|
76 | 129,818 | 2014 | 414 | 98 | ||||||||||||||||
|
Alphaville Juiz de Fora 2 (h)
|
2012
|
65 | 99,646 | 2014 | 305 | 37 | ||||||||||||||||
|
Alphaville Campo Grande 3
|
2012
|
64 | 152,549 | 2014 | 608 | 93 | ||||||||||||||||
|
Alphaville Araçatuba (e)
|
2012
|
42 | 92,722 | 2014 | 427 | 27 | ||||||||||||||||
|
Alphaville Bauru
|
2012
|
65 | 155,335 | 2014 | 467 | 91 | ||||||||||||||||
|
Terras Alphaville Camaçari
|
2012
|
74 | 139,819 | 2014 | 634 | 80 | ||||||||||||||||
|
Alphaville Cajamar
|
2012
|
55 | 71,000 | 2012 | (j) | 2 | 100 | |||||||||||||||
|
Terreno Cajamar
|
2011
|
55 | 98,000 | 2011 | (j) | 1 | 100 | |||||||||||||||
|
Alphaville Pernambuco F2
|
2011
|
70 | 340,288 | 2013 | 602 | 79 | ||||||||||||||||
|
Alphaville Manaus F3
|
2011
|
100 | 120,242 | 2013 | 249 | 79 | ||||||||||||||||
|
Alphaville Feira de Santana
|
2011
|
72 | 211,82 | 2013 | 422 | 83 | ||||||||||||||||
|
Alphaville Campina Grande F2
|
2011
|
53 | 68,941 | 2011 | (j) | 158 | 81 | |||||||||||||||
|
Barra da Tijuca
|
2011
|
35 | 51,360 | 2012 | (j) | 75 | 100 | |||||||||||||||
|
Petrolina F2(f)
|
2011
|
76 | 117,365 | 2012 | (j) | 377 | 33 | |||||||||||||||
|
São José dos Campos F1 + F2
|
2011
|
57 | 559,766 | 2014 | 1,009 | 93 | ||||||||||||||||
|
Terras Alpha Maricá
|
2011
|
48 | 243,213 | 2013 | 615 | 100 | ||||||||||||||||
|
Terras Alpha Resende
|
2011
|
77 | 183,093 | 2013 | 419 | 98 | ||||||||||||||||
|
Alphaville Campo Grande F2
|
2011
|
66 | 233,539 | 2012 | (j) | 594 | 100 | |||||||||||||||
|
Alphaville Pernambuco
|
2011
|
83 | 323,525 | 2013 | 551 | 84 | ||||||||||||||||
|
Alphaville Ribeirão Preto 1
|
2010
|
60 | 182,253 | 2012 | (j) | 586 | 96 | |||||||||||||||
|
Alphaville Mossoró 2
|
2010
|
53 | 35,417 | 2011 | (j) | 176 | 54 | |||||||||||||||
|
Alphaville Ribeirão Preto 2
|
2010
|
60 | 99,078 | 2012 | (j) | 303 | 62 | |||||||||||||||
|
Alphaville Brasília
|
2010
|
34 | 112,807 | 2011 | (j) | 500 | 85 | |||||||||||||||
|
Alphaville Jacuhy 3(g)
|
2010
|
65 | 103,995 | 2011 | (j) | 368 | 35 | |||||||||||||||
|
Alphaville Brasília Terreneiro
|
2010
|
13 | 44,579 | 2011 | (j) | 426 | 100 | |||||||||||||||
|
Living Solution Burle Marx
|
2010
|
100 | 1,537 | 2011 | (j) | 4 | 50 | |||||||||||||||
|
Alphaville Teresina
|
2010
|
79 | 283,223 | 2012 | (j) | 746 | 98 | |||||||||||||||
|
Alphaville Belém 1
|
2010
|
73 | 168,159 | 2013 | 463 | 93 | ||||||||||||||||
|
Alphaville Belém 2
|
2010
|
72 | 136,696 | 2013 | 402 | 62 | ||||||||||||||||
|
Terras Alpha Petrolina
|
2010
|
75 | 117,241 | 2012 | (j) | 489 | 91 | |||||||||||||||
|
Terras Alpha Foz do Iguaçu 2
|
2010
|
74 | 120,320 | 2012 | (j) | 465 | 73 | |||||||||||||||
|
Reserva Porto Alegre (h)
|
2010
|
92 | 8,075 | 2013 | 21 | 18 | ||||||||||||||||
|
Alphaville Porto Velho
|
2010
|
76 | 292,000 | 2013 | 832 | 41 | ||||||||||||||||
|
(1)
|
One square meter is equal to approximately 10.76 square feet.
|
|
(2)
|
Values for 100% of the building development.
|
|
(a)
|
Project launched in June 2012.
|
|
(b)
|
Project launched in August 2012. It refers to the 2nd phase of the development in a new market. We are developing other projects in this area to strengthen this market region and therefore to increase this project demand.
|
|
(c)
|
Project launched in October 2012.
|
|
(d)
|
Project launched in November 2012. This project is located in a new market area with a lower sales velocity.
|
|
(e)
|
Project launched in December 2012.
|
|
(f)
|
Project launched in September 2011, its low % of units sold is mainly due to a lower sales velocity in this market. Our selling forecasts indicate sales of the unsold units within a short period of time.
|
|
(g)
|
Project launched in June 10, with 100 lots (approximately 30%) yet to be released to sell in the market.
|
|
(h)
|
Project launched in December 2010, its low sales is mainly due to market demand conditions and changes in the original project. However, our selling forecasts indicate sales of the unsold units within a short period of time.
|
|
(i)
|
Project launched in September 2012. It refers to a pilot project of small retail stores. Our selling forecasts indicate sales of the unsold units within a short period of time.
|
|
(j)
|
Project delivered.
|
|
(k)
|
Project launched in February 2012 (Phase 1) and December 2012 (Phase 2). This project has approximately 30% of its lots yet to be released to sell in the market.
|
We have not identified any impairment risk for the above projects.
The table below discloses the projects that were completed in 2012 or in prior years and where the number of units sold as of December 31, 2012 was less than 90%.
|
Project Description
|
Units Sold (%) (As of December 31, 2012)
|
|||
|
GPark Águas (1)
|
86 | |||
|
Fit Maceió (2)
|
83 | |||
|
Jatiuca Trade Residence (3)
|
83 | |||
|
GPark Árvores (4)
|
80 | |||
|
Alta Vistta Fase 1 (5)
|
79 | |||
|
Manhattan Office — Wall Street (6)
|
77 | |||
|
Alta Vistta Fase 2 (7)
|
65 | |||
|
Verdemar — Fase 2 (8)
|
63 | |||
|
O Bosque (9)
|
41 | |||
|
Verdemar — Fase 1 (10)
|
39 | |||
|
Santana Tower I — Fase II (11)
|
89 | |||
|
Portal do Sol Life II (12)
|
89 | |||
|
Residencial Villa Coimbra (13)
|
88 | |||
|
Residencial Villa Bella (14)
|
88 | |||
|
Cittá Lauro de Freitas (15)
|
88 | |||
|
Fit Taboazinho (16)
|
88 | |||
|
Residencial Santo Antonio Life (17)
|
88 | |||
|
Pq Baviera Life F1 (18)
|
87 | |||
|
Res Portal das Rosas (19)
|
87 | |||
|
Pq Maceio F2 (20)
|
87 | |||
|
Marumbi F1 (21)
|
86 | |||
|
Santana Tower II — Fase II (22)
|
85 | |||
|
Portal do Sol Life 7 Etapa (23)
|
83 | |||
|
Mirante do Lago F1 (24)
|
83 | |||
|
Condominio Fit Jardins (25)
|
83 | |||
|
Fit Jacana (26)
|
82 | |||
|
Marumbi F2 (27)
|
82 | |||
|
Residencial Vitoria Regia (28)
|
81 | |||
|
Humaita Garden F1 (29)
|
80 | |||
|
Pq Maceio F1 (30)
|
80 | |||
|
Icoaraci (31)
|
78 | |||
|
Residencial Papa Joao XXIII (32)
|
78 | |||
|
Res Napoli I (33)
|
78 | |||
|
Terra Bonita (34)
|
76 | |||
|
Res Parque das Aroeiras Life (35)
|
76 | |||
|
Pq Baviera Life F2 (36)
|
75 | |||
|
Res Parque Lousa (37)
|
73 | |||
|
Residencial Morada de Ferraz (38)
|
72 | |||
|
Duo Valverde (39)
|
71 | |||
|
Res Germânia Life (40)
|
69 | |||
|
Res Curuca (41)
|
66 | |||
|
Mirante do Lago F2 (42)
|
42 | |||
|
(1)
|
GPark Águas
. This development was 100% completed at December 31, 2012 at which time only 86% of the units had been sold. According to the Company’s then-existing business plan, this development’s selling forecast indicated sales of the unsold units within a short time period.
|
|
(2)
|
Fit Maceió
. This development was 100% completed at December 31, 2012 at which time only 83% of the units had been sold. According to the Company’s then-existing business plan, this development’s selling forecast indicated sales of the unsold units within a short time period.
|
|
(3)
|
Jatiuca Trade Residence
. This development was 100% completed at December 31, 2012 at which time only 83% of the units had been sold. According to the Company’s then-existing business plan, this development’s selling forecast indicated sales of the unsold units within a short time period.
|
|
(4)
|
GPark Árvores
. This development was 100% completed at December 31, 2012 at which time only 80% of the units had been sold. According to the Company’s then-existing business plan, this development’s selling forecast indicated sales of the unsold units within a short time period.
|
|
(5)
|
Alta Vistta Fase 1
. This development was 100% completed at December 31, 2012 at which time only 79% of the units had been sold. According to the Company’s then-existing business plan, this development’s selling forecast indicated sales of the unsold units within a short time period.
|
|
(6)
|
Manhattan Office - Wall Street
. This development was 100% completed at December 31, 2012 at which time only 77% of the units had been sold. According to the Company’s then-existing business plan, this development’s selling forecast indicated sales of the unsold units within a short time period.
|
|
(7)
|
Alta Vistta Fase 2
. This development was 100% completed at December 31, 2012 at which time only 65% of the units had been sold. According to the Company’s then-existing business plan, this development’s selling forecast indicated sales of the unsold units within a short time period.
|
|
(8)
|
Verdemar - Fase 2
. This development was 100% completed at December 31, 2012 at which time only 63% of the units had been sold. According to the Company’s then-existing business plan, this development’s selling forecast indicated sales of the unsold units within a short time period.
|
|
(9)
|
O Bosque
. This development was 100% completed at December 31, 2012 at which time only 41% of the units had been sold. This development is outside of Gafisa core markets of São Paulo e Rio de Janeiro. This region has a slow sales velocity but
according to the Company’s then-existing business plan, this development’s selling forecast indicated sales of the unsold units within a short time period.
|
|
(10)
|
Verdemar - Fase 1
. This development was 100% completed at December 31, 2012 at which time only 39% of the units had been sold. This project’s sales have been paralyzed due to an environmental process. This development was turned active again in 2012 and according to the Company’s then-existing business plan, this development’s selling forecast indicated sales of the unsold units within a short time period.
|
|
(11)
|
Santana Tower I - Fase II
. This development was 100% completed at December 31, 2012 at which time only 89% of the units had been sold. According to the Company’s then-existing business plan, this development’s selling forecast indicated sales of the unsold units within a short time period.
|
|
(12)
|
Portal do Sol Life II
. This development was 100% completed at December 31, 2012 at which time only 89% of the units had been sold. According to the Company’s then-existing business plan, this development’s selling forecast indicated sales of the unsold units within a short time period.
|
|
(13)
|
Residencial Villa Coimbra
. This development was 100% completed at December 31, 2012 at which time only 88% of the units had been sold. According to the Company’s then-existing business plan, this development’s selling forecast indicated sales of the unsold units within a short time period.
|
|
(14)
|
Residencial Villa Bella
. This development was 100% completed at December 31, 2012 at which time only 88% of the units had been sold. According to the Company’s then-existing business plan, this development’s selling forecast indicated sales of the unsold units within a short time period.
|
|
(15)
|
Cittá Lauro de Freitas
. This development was 100% completed at December 31, 2012 at which time only 88% of the units had been sold. According to the Company’s then-existing business plan, this development’s selling forecast indicated sales of the unsold units within a short time period.
|
|
(16)
|
Fit Taboazinho
. This development was 100% completed at December 31, 2012 at which time only 88% of the units had been sold. According to the Company’s then-existing business plan, this development’s selling forecast indicated sales of the unsold units within a short time period.
|
|
(17)
|
Residencial Santo Antonio Life
. This development was 100% completed at December 31, 2012 at which time only 88% of the units had been sold. According to the Company’s then-existing business plan, this development’s selling forecast indicated sales of the unsold units within a short time period.
|
|
(18)
|
Pq Baviera Life F1
. This development was 100% completed at December 31, 2012 at which time only 87% of the units had been sold. According to the Company’s then-existing business plan, this development’s selling forecast indicated sales of the unsold units within a short time period.
|
|
(19)
|
Res Portal das Rosas
. This development was 100% completed at December 31, 2012 at which time only 87% of the units had been sold. According to the Company’s then-existing business plan, this development’s selling forecast indicated sales of the unsold units within a short time period.
|
|
(20)
|
Pq Maceio F2
. This development was 100% completed at December 31, 2012 at which time only 87% of the units had been sold. According to the Company’s then-existing business plan, this development’s selling forecast indicated sales of the unsold units within a short time period.
|
|
(21)
|
Marumbi F1
. This development was 100% completed at December 31, 2012 at which time only 86% of the units had been sold. According to the Company’s then-existing business plan, this development’s selling forecast indicated sales of the unsold units within a short time period.
|
|
(22)
|
Santana Tower II - Fase II
. This development was 100% completed at December 31, 2012 at which time only 85% of the units had been sold. According to the Company’s then-existing business plan, this development’s selling forecast indicated sales of the unsold units within a short time period.
|
|
(23)
|
Portal do Sol Life 7 Etapa
. This development was 100% completed at December 31, 2012 at which time only 83% of the units had been sold. According to the Company’s then-existing business plan, this development’s selling forecast indicated sales of the unsold units within a short time period.
|
|
(24)
|
Mirante do Lago F1
. This development was 100% completed at December 31, 2012 at which time only 83% of the units had been sold. According to the Company’s then-existing business plan, this development’s selling forecast indicated sales of the unsold units within a short time period.
|
|
(25)
|
Condominio Fit Jardins
. This development was 100% completed at December 31, 2012 at which time only 83% of the units had been sold. According to the Company’s then-existing business plan, this development’s selling forecast indicated sales of the unsold units within a short time period.
|
|
(26)
|
Fit Jacana
. This development was 100% completed at December 31, 2012 at which time only 82% of the units had been sold. According to the Company’s then-existing business plan, this development’s selling forecast indicated sales of the unsold units within a short time period.
|
|
(27)
|
Marumbi F2
. This development was 100% completed at December 31, 2012 at which time only 82% of the units had been sold. According to the Company’s then-existing business plan, this development’s selling forecast indicated sales of the unsold units within a short time period.
|
|
(28)
|
Residencial Vitoria Regia
. This development was 100% completed at December 31, 2012 at which time only 81% of the units had been sold. According to the Company’s then-existing business plan, this development’s selling forecast indicated sales of the unsold units within a short time period.
|
|
(29)
|
Humaita Garden F1
. This development was 100% completed at December 31, 2012 at which time only 80% of the units had been sold. According to the Company’s then-existing business plan, this development’s selling forecast indicated sales of the unsold units within a short time period.
|
|
(30)
|
Pq Maceio F1
. This development was 100% completed at December 31, 2012 at which time only 80% of the units had been sold. According to the Company’s then-existing business plan, this development’s selling forecast indicated sales of the unsold units within a short time period.
|
|
(31)
|
Icoaraci
. This development was 100% completed at December 31, 2012 at which time only 78% of the units had been sold. According to the Company’s then-existing business plan, this development’s selling forecast indicated sales of the unsold units within a short time period.
|
|
(32)
|
Residencial Papa Joao XXIII
. This development was 100% completed at December 31, 2012 at which time only 78% of the units had been sold. According to the Company’s then-existing business plan, this development’s selling forecast indicated sales of the unsold units within a short time period.
|
|
(33)
|
Res Napoli I
. This development was 100% completed at December 31, 2012 at which time only 78% of the units had been sold. According to the Company’s then-existing business plan, this development’s selling forecast indicated sales of the unsold units within a short time period.
|
|
(34)
|
Terra Bonita
. This development was 100% completed at December 31, 2012 at which time only 76% of the units had been sold. According to the Company’s then-existing business plan, this development’s selling forecast indicated sales of the unsold units within a short time period.
|
|
(35)
|
Res Parque das Aroeiras Life
. This development was 100% completed at December 31, 2012 at which time only 76% of the units had been sold. According to the Company’s then-existing business plan, this development’s selling forecast indicated sales of the unsold units within a short time period.
|
|
(36)
|
Pq Baviera Life F2
. This development was 100% completed at December 31, 2012 at which time only 75% of the units had been sold. According to the Company’s then-existing business plan, this development’s selling forecast indicated sales of the unsold units within a short time period.
|
|
(37)
|
Res Parque Lousa
. This development was 100% completed at December 31, 2012 at which time only 73% of the units had been sold. According to the Company’s then-existing business plan, this development’s selling forecast indicated sales of the unsold units within a short time period.
|
|
(38)
|
Residencial Morada de Ferraz
. This development was 100% completed at December 31, 2012 at which time only 72% of the units had been sold. According to the Company’s then-existing business plan, this development’s selling forecast indicated sales of the unsold units within a short time period.
|
|
(39)
|
Duo Valverde
. This development was 100% completed at December 31, 2012 at which time only 71% of the units had been sold. According to the Company’s then-existing business plan, this development’s selling forecast indicated sales of the unsold units within a short time period.
|
|
(40)
|
Res Germânia Life
. This development was 100% completed at December 31, 2012 at which time only 69% of the units had been sold. According to the Company’s then-existing business plan, this development’s selling forecast indicated sales of the unsold units within a short time period.
|
|
(41)
|
Res Curuca
. This development was 100% completed at December 31, 2012 at which time only 66% of the units had been sold. According to the Company’s then-existing business plan, this development’s selling forecast indicated sales of the unsold units within a short time period.
|
|
(42)
|
Mirante do Lago F2
. This development was 100% completed at December 31, 2012 at which time only 42% of the units had been sold. This development is outside of Gafisa core markets of São Paulo e Rio de Janeiro. This region has a slow sales velocity but according to the Company’s then-existing business plan, this development’s selling forecast indicated sales of the unsold units within a short time period.
|
Commercial Buildings
In 2009, we launched four commercial buildings: Centro Empresarial Madureira, Paulista Corporate, Reserva Eco Office Life and Global Offices. As of December 31, 2010 we had four commercial buildings under development for sale: Sunplaza Personal Office and Icaraí Corporate, both in the state of Rio de Janeiro, Manhattan Wall Street in Salvador and JTR in Maceió. In 2010, we did not launch any commercial buildings.
In 2011, we launched seven commercial buildings: Comercial Icon, Target – Comercial Capenha, Network Business Tower Phase 1, Network Business Tower Phase 2, Americas Avenue Consolidado, Golden Office and AlphaGreen.
In 2012, we launched two commercial buildings: SAO Square - Way and SAO Square – Gafisa.
Construction Service
We provide construction services to third parties, building residential and commercial projects for some of the most well-known developers in Brazil. This practice allows us to benchmark our construction costs, facilitates our access to new constructions materials, techniques and service providers such as architects and sub-contractors, and provides larger economies of scale. Third-party construction services are a significant, less volatile source of revenues, which does not require us to allocate capital. Our principal construction services clients are large companies, many of them developers that do not build their own projects. As of December 31, 2012 our principal construction services clients were Fibra Empreendimentos Imobiliários S.A., Helbor LM Investimentos Imobiliários Ltda., Incons Champagnat Empreendimento Imobiliário SPE Ltda., Incons Curitiba Empreendimento Imobiliário SPE Ltda., MBigucci Villa Reggio Empreendimentos Imobiliários Ltda., SDI Desenvolvimento Imobiliário Ltda., Tanguá Patrimonial Ltda., Concivil Construtora e Incorporadora Ltda., STAN Portugal Empreendimento Imobiliário SPE Ltda., PP II SPE Empreendimentos Imobiliários Ltda. Reitzfeld Empreendimento Imobiliário Botânico SPE Ltda and KINO Empreendimento Imobiliário SPE S.A. We also provide construction services on certain developments where we retain an equity interest.
The table below sets forth the real estate building developments we have constructed exclusively for third parties between January 1, 2010 and December 31, 2012:
|
Project
|
First Year of Construction
|
Client
|
Type of Project
|
|
Viverde
|
2012
|
Reitzfeld Empreendimento Imobiliário Botânico SPE Ltda
|
Residencial
|
|
One
|
2011
|
Portugal Empreendimentos Imobiliário SPE Ltda.
|
Residential
|
|
Veranda
|
2011
|
Concivil Construtora e Incorporadora Ltda.
|
Residential/ Commercial
|
|
Status
|
2011
|
Villa Reggio Empreendimentos Imobiliários Ltda.
|
Residential
|
|
Panamérica Green Park
|
2011
|
PP II SPE Empreendimentos Imobiliários Ltda.
|
Commercial
|
|
Kino
|
2011
|
Kino Empreedimento Imobiliário SPE S.A.
|
Commercial
|
|
Residencial Helbor Spazio Vita
|
2010
|
LM Investimentos Imobiliários Ltda
|
Residential
|
|
Edifício Monde Champagnat
|
2010
|
Incons Champagnat Empreendimento Imobiliário SPE Ltda
|
Residential
|
|
Essenza
|
2010
|
Villa Reggio Empreendimentos Imobiliarios Ltda
|
Residential
|
|
Neosuperquadra
|
2010
|
Tangua Patrimonial Ltda
|
Residential/ Commercial
|
The table below sets forth the real estate developments we have constructed for third parties, in which we also have an equity interest, between January 1, 2010 and December 31, 2012:
|
Project
|
First Year of Construction
|
Gafisa Participation
(%)
|
Partner
|
Type of Project
|
|
Igloo Vila Olímpia
|
2011
|
80
|
BKO
|
Residential
|
|
Costa Araçagy
|
2011
|
60
|
Franere
|
Residential
|
|
Target
|
2011
|
60
|
Comasa/Polo
|
Commercial
|
|
Jardins da Barra
|
2010
|
50
|
Bueno Neto
|
Residential
|
|
Igloo Alphaville
|
2010
|
50
|
BKO
|
Residential
|
|
Reserva Ecoville Residencial
|
2010
|
50
|
Agre
|
Residential
|
|
Grand Park Prime
|
2010
|
50
|
Franere
|
Residential
|
|
Grand Park Varandas
|
2010
|
50
|
Franere
|
Residential
|
There was no new development in 2012.
Sale of Units Through Our Brokerage Subsidiaries
In September 2006, we created a new subsidiary, Gafisa Vendas, to function as our internal sales division in the state of São Paulo. In February 2007, we created another new subsidiary, Gafisa Vendas Rio, to function as our internal sales division in the metropolitan region of Rio de Janeiro. These wholly-owned subsidiaries promote sales of our projects in the states of São Paulo and Rio de Janeiro and focus their efforts on: (1) launches — our internal sales force focuses on promoting launches of our developments; however, we also use outside brokers, thus creating what we believe to be a healthy competition between our sales force and outside brokers; (2) inventory — Gafisa Vendas and Gafisa Vendas Rio each have a team focused on selling units launched in prior years; and (3) web sales — Gafisa Vendas and Gafisa Vendas Rio each have a sales team dedicated to internet sales as an alternative source of revenues with lower costs.
Our Clients
Our clients consist of development and construction service clients. Development clients are those who purchase units in our developments. As of December 31, 2012, our development-client database was comprised of more than 125,500 individuals. We currently have approximately 75,000 active clients. Our construction-services
clients are large companies, many of them developers that do not build their own projects. As of December 31, 2012, we had, among our main construction services clients, the following companies: Fibra Empreendimentos Imobiliários S.A., Helbor LM Investimentos Imobiliários Ltda., Incons Champagnat Empreendimento Imobiliário SPE Ltda., Incons Curitiba Empreendimento Imobiliário SPE Ltda., MBigucci Villa Reggio Empreendimentos Imobiliários Ltda., SDI Desenvolvimento Imobiliário Ltda., Tanguá Patrimonial Ltda., Concivil Construtora e Incorporadora Ltda., STAN Portugal Empreendimento Imobiliário SPE Ltda., PP II SPE Empreendimentos Imobiliários Ltda. and KINO Empreendimento Imobiliário SPE S.A. No individual client represents more than 5% of our revenues from residential developments or construction services.
Our Operations
The stages of our development process are summarized in the diagrams below:
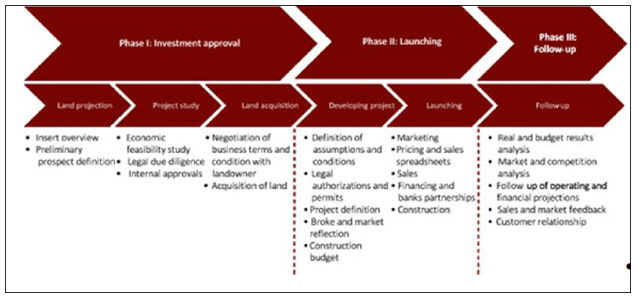
Land Acquisition
We use results from our extensive market research to guide our land reserves strategy and process. Our marketing and development teams monitor market fundamentals and trends. We have developed a sophisticated database to support our search for and analysis of new investment opportunities. Key decision factors used by our management for land acquisition and new developments include location, type of product to be developed, expected demand for the new developments, current inventory of units in the region and acquisition cost of the land.
Whenever we identify an attractive tract of land, we first conduct a study of the project to define the most appropriate use of the space. Afterwards, the basic design of the project enters the economic feasibility study stage, where we consider preliminary revenues and expenses associated with the project. This study will determine project profitability. We collect and analyze information on demand, competition, construction budget, sales policy and funding structure to ensure economic viability of the new development. We then initiate a legal due diligence of the property to identify liens, encumbrances and restrictions, potential solutions to such issues and the relevant costs. Before acquiring the land, we conduct a thorough due diligence process including an environmental review. Each decision to acquire land is analyzed and approved by our investment committee. See “Item 6. Directors, Senior Management and Employees—C. Board Practices” elsewhere in this annual report for further information on the activities of our committees and boards.
We seek to finance land acquisition through barter transactions, in which we grant the seller a certain number of units to be built on the land or a percentage of the proceeds from the sale of units in such development. As a result, we reduce our cash requirements and increase our returns. In the event we cannot do so or in order to obtain better terms or prices, we acquire land for cash, alone or in partnership with other developers. We purchase land both for immediate development and for inventory.
As a new strategy defined by the end of 2011, the Company is selling landbank located in cities and places where there is no intention to run operations with new developments.
As of December 31, 2012, we had an inventory of 123 land parcels in which we estimate we could develop a total of 87,742 residential units with a sales value of R$18.7 billion, of which 36.1% represents land acquired through barter transactions. The table below sets forth the breakdown of our land reserves by location and by the type of development.
|
Gafisa
|
Alphaville
|
Tenda
|
||||||||||||||||||||||
|
Future Sales (% Gafisa)(1)
|
% Bartered
|
Future Sales (% Gafisa)
|
% Bartered
|
Future Sales (% Gafisa)
|
% Bartered
|
|||||||||||||||||||
|
(in thousands
of
reais
)
|
(in thousands
of
reais
)
|
(in thousands
of
reais
)
|
||||||||||||||||||||||
|
São Paulo
|
R$ | 4,133,140 | 31 | % | R$ | 1,850,698 | 99 | % | R$ | 628,049 | 9 | % | ||||||||||||
|
Rio de Janeiro
|
1,210,471 | 50 | % | 771,029 | 100 | % | 232,555 | 2 | % | |||||||||||||||
|
Other states
|
— | — | 8,812,534 | 100 | % | 1,030,193 | 32 | % | ||||||||||||||||
|
Total
|
R$ | 5,343,611 | 35 | % | R$ | 11,434,261 | 99 | % | R$ | 1,890,797 | 23 | % | ||||||||||||
|
(1)
|
Information reflects our interest.
|
Project Design
In order to meet evolving preferences of our customers, we invest considerable resources in creating an appropriate design and marketing strategy for each new development, which includes determining the size, style and price range of units. Our staff, including engineers and marketing and sales professionals, works with recognized independent architects on the planning and design of our developments. Their activities include designing the interior and exterior, drafting plans for the execution of the project, and choosing the finishing construction materials. A team responsible for preparing the business plan and budget and assessing the financial viability for each of our projects is also involved. Simultaneously with the planning and design of our developments, we seek to obtain all the necessary licenses and regulatory approvals from local authorities, which usually take three to twelve months in the case of our residential buildings and three years in the case of our residential communities.
Marketing and Sales
Our marketing efforts are coordinated by our internal staff of approximately 25 professionals. Our specialized team generally coordinates with several outsourced brokerage companies with a combined sales force of more than 80 representatives, monitoring such sales representatives in order to promote loyalty and ensure performance. Our marketing intelligence team is also responsible for gathering information on the needs and preferences of potential customers to provide guidance on our land acquisition and project design activities. Gafisa Vendas was created as our internal sales division and it currently consists of 385 sales consultants and 9 sales managers.
The creation of Gafisa Vendas was intended to establish a strategic channel for us to access our clients and to reduce our dependence on outside brokers for marketing. Because the sales force at Gafisa Vendas is trained to sell our products exclusively, we believe that it is able to focus on the sale of our developments, articulate the unique features of our development, manage our current customers and capture new customers more effectively. Gafisa Vendas was initially established in São Paulo in 2006 and opened a branch in Rio de Janeiro in 2007. In 2008 and 2009, Gafisa Vendas was our most successful sales team, responsible for approximately 34% and 40% of our sales in the states of São Paulo and Rio de Janeiro, respectively. In 2010, Gafisa Vendas was responsible for approximately 37% and 53% of our sales in the states of São Paulo and Rio de Janeiro, respectively. In 2011, Gafisa Vendas was responsible for approximately 34% and 52% of our sales in the states of São Paulo and Rio de Janeiro, respectively. In 2012, Gafisa Vendas was responsible for approximately 47% and 52% of our sales in the states of São Paulo and Rio de Janeiro, respectively.
We will continue to utilize independent real estate brokerage firms as we believe this provides a healthy competition between our internal sales force and outside brokers. Independent brokers provide us with a broad reach, access to a specialized and rich database of prospective customers, and flexibility to accommodate the needs of our diverse offering and clientele. In line with our results-oriented culture, we compensate brokers based on their profit contribution rather than on sales. Brokers are required to attend periodic specialized training sessions where they are updated on customer service and marketing techniques, competing developments, construction schedules,
and marketing and advertising plans. We emphasize a highly transparent sales approach, as opposed to the traditional high-pressure techniques, in order to build customer loyalty and to develop a sense of trust between customers and us. At our showrooms, brokers explain the project and financing plans, answer questions and encourage customers to purchase or sign on to receive a visit or additional information.
We typically initiate our marketing efforts 30 days before the launch of a development. We normally have a showroom on or near the construction site, which includes a model unit furnished with appliances and furniture. We leverage our reputation for quality, consistency, on-time delivery and professionalism to increase sales velocity. We have been successful with this strategy, usually selling approximately 60% of the units before construction starts.
Our subsidiary Alphaville has also been successful in its sales and marketing efforts. For example, in Vitória, Alphaville Jacuhy development with more than 700 lots, was 85% sold within 48 hours after launch; in João Pessoa, Paraiba, the sales team needed only five hours to sell all of its residential lots; in Barra da Tijuca, Rio de Janeiro, 90% of the Alphaville lots available (valued at R$150 million) were sold during the weekend of launch; and Alphaville Caruaru in Recife, Alphaville Teresina in Piaui, Alphaville Granja Viana in São Paulo, Alphaville Piracicaba and Ribeirão Preto, both cities in the State of São Paulo, were 100% sold in the same day of their launch. In Brasilia, Alphaville launched the first phase of a twenty million square meter urban development. All the 600 residential lots were sold within a few hours of launch.
We market our developments through newspapers, direct mail advertising and by distributing leaflets in neighboring areas, as well as through telemarketing and websites. In addition, on a quarterly basis, we publish the magazine “Gafisa Way” which is distributed to our customers and offers news on our most recent developments and progress updates on buildings under construction. The Alphaville developments also publish special magazines geared to their specific communities.
Tenda’s sales and marketing efforts are coordinated through 16 store fronts located across the principal metropolitan areas of the country. A direct sales force is trained to offer advice to first-time home buyers and to assist these buyers in finding the best financing solution. In addition, this sales force provides information on the benefits under the public housing program “
Minha Casa, Minha Vida
,” including the process of obtaining a mortgage through the CEF. Because the Tenda sales force is specially trained to provide information on the affordable entry-level segment, we believe that they are uniquely positioned to provide us with an advantage in this segment.
In addition to direct sales, Tenda markets its developments through telemarketing, which generates more than 55,000 calls per month and results in over 6,000 visits per month to its store fronts. Tenda also gathers information on its customers’ preferences to better tailor its marketing efforts and has implemented a customer relationship management department in order to improve its client satisfaction. Finally, Tenda focuses on improving its sales during the launch of a development using a specific strategy for each type of development. For example, with large developments, Tenda has successfully combined its direct sales force with independent real estate brokerage firms, and the increase in cost associated with such combined efforts was offset by the significant increase in sales during the initial months after launch.
Under Brazilian law, we may establish a term within and the conditions under which we are entitled to cancel the development. According to our regular purchase contracts, if we are not able to sell at least 60% of the units within 180 days of launching, we can cancel the development. In the low income segment we need to have the project with at least 60% of the units sold (sales includes customers who are eligible for mortgages and that can be immediately transferred to financial institutions) and the project needs to be contracted with financial institutions prior to the launching phase, or we can cancel the development. Under those circumstances, we usually consider changing the project or selling the land, but, in any of those cases, we have to return the cash payment made by our customers adjusted for inflation but with no interest. Customers, however, are not entitled to other remedies.
Construction
Gafisa has been engaged in the construction business for over 50 years. Our experience spans across the entire construction chain. Before engaging in each new project, we develop sketches and research and develop projects and plans to create the most appropriate product possible. Our standardized construction techniques and unique control system are designed to optimize productivity and minimize raw material losses. Our monitoring tools are available on our intranet where all employees regularly review costs and key performance indicators of each development such as actual versus budget comparisons, volume consumption for each raw material, and construction schedule.
We use strict quality control methods. We have developed proprietary procedure manuals that describe in significant detail each task of each stage of the construction project. These manuals are also used for the training sessions that we require all of our workers to attend. In addition, we keep quarterly records of projects delivered.
The reviews focus on identifying problems in order to take corrective and preventive actions in projects underway and thus avoid costly repetition. We have adopted a quality management system that was certified for ISO 9002 by
Fundação Bureau Veritas
, from Universidade de São Paulo. In 2007, we received a certification from
Programa Brasileiro de Qualidade e Produtividade do Habitat
(PBQP-H), which is part of the Ministry of Cities. In addition, the Eldorado Business Tower building was certified as a Green Building, category Platinum, by the U.S. Green Building Council, which attests that it is environmentally sustainable, through the rational use of energy, natural lighting and pollution control and recycling. There are only three other buildings in the world that have achieved this category.
We invest in technology. Our research and development costs amounted to R$1.0 million, R$2.9 million and R$2.5 million in each of 2012, 2011 and 2010 respectively. We believe that we have pioneered the adoption of advanced construction techniques in Brazil such as dry wall and plane pre-stressed slabs, which present numerous advantages over traditional techniques. We also optimize costs by synchronizing our projects’ progress so as to coordinate the purchase of raw material and benefit from economies of scale. We have long-term arrangements with a number of suppliers which allow us to build our developments with quality, using brand name construction materials and equipment, and advanced technology. Moreover, our centralized procurement center enables us to achieve significant economies of scale in the purchase of materials and retention of services.
We do not own heavy construction equipment and we employ directly only a small fraction of the labor working on our sites. We generally act as a contractor, supervising construction while subcontracting more labor-intensive activities. Substantially all on-site construction is performed for a fixed price by independent subcontractors. We have policies in place in order to hire reputable, cost-oriented and reliable service providers that are in compliance with labor laws and have performed their work diligently and on time in the past. Hiring subcontractors instead of employing workers directly has some financial and logistical advantages. For instance, we do not need to incur fixed costs to maintain a specialized labor force even when they are not actively working at a construction site and we do not need to pay for frequent transfers of labor to different construction locations.
Our construction engineering group coordinates the activities of service providers and suppliers, monitors compliance with safety and zoning codes, and monitors completion of the project on a timely basis. We provide a five-year limited warranty covering structural defects in all our developments.
Risk Control
Our risk control procedures require that all of our projects be approved by our investment committee, which meets on a monthly basis, or more frequently on an as-needed basis, and consists of our chief executive officer and two members of our board of directors. Our investment committee carefully reviews the various studies conducted by us and described above. In addition, we have a board of officers, which meets monthly, and is in charge of overseeing and approving major decisions. See “Item 6. Directors, Senior Management and Employees—E. Share Ownership” in this annual report.
Customer Financing
The table below sets forth the terms of customer financing we provide for each type of our developments as of December 31, 2012:
|
Sales Term
|
Luxury
|
Middle Income
|
Affordable Entry—Level(1)
|
Land Subdivisions (2)
|
||||||||||||
|
Mortgage lending (delivery)
|
77 | % | 88 | % | — | — | ||||||||||
|
Caixa Econômica Federal
|
— | — | 100 | % | — | |||||||||||
|
Gafisa 36 months
|
22 | % | 11 | % | — | 45 | % | |||||||||
|
Gafisa 60 months
|
— | — | — | 40 | % | |||||||||||
|
Gafisa 120 months
|
1 | % | 1 | % | — | 15 | % | |||||||||
|
(1)
|
Includes Tenda developments. We do not provide any customer financing for these developments.
|
|
(2)
|
Includes both Gafisa and Alphaville land subdivisions.
|
Mortgages
. In 2012, 90% of our sales value was financed by bank mortgages, where the customer paid us approximately 10% to 60% of the sales price of the property during the period of construction, and upon delivery of the property paid the balance of the sales price through a bank mortgage. We analyze the credit history of each customer at the time of sale to see if the customer would qualify for a bank mortgage based on banks’ standard credit rating policies. Although there is no assurance that the customer will qualify for a mortgage at the time of delivery, our analyses have been fairly successful in predicting whether the customer would qualify for a mortgage. The following table sets forth the credit limits established by mortgage sources available in Brazil:
|
Credit Lines
|
Typical Interest rate
|
Maximum Home Value
|
Maximum Loan Value
|
|||
|
Mortgage portfolio (
Carteira Hipotecária
) or CH
|
% annually + TR(1)
|
No limit
|
No limit
|
|||
|
Housing Finance System (
Sistema Financeiro da Habitação
) or SFH
|
% annually + TR
|
R$ 500,000
|
R$ 450,000
|
|||
|
Government Severance Indemnity Fund for Employees (
Fundo de Garantia do Tempo de Serviços
) or FGTS
|
16% annually + TR
|
R$ 130,000
|
R$ 130,000
|
|
(1)
|
TR refers to the daily reference rate.
|
Mortgage financing for Tenda’s developments primarily comes from CEF. The financing is structured so that customers with monthly income of up to ten times the Brazilian minimum wage pay low monthly installments without increasing our credit risk because CEF assumes the credit risk of each customer. Additionally, Tenda is currently working with certain private banks in addition to the CEF to provide financing for homebuyers with monthly income between three and seven times the Brazilian minimum wage which was approximately R$622 as of December 31, 2012 with similar terms as the financing provided by the CEF.
Financing by Gafisa during construction
. We finance some of our own sales during the construction period, with a down payment of 20-30% and financing of the balance through monthly installments up to the delivery of the unit.
Financing by Gafisa after delivery
. In addition, we offer financing plans to prospective customers using our own capital, where we finance purchases for up to 120 months after the completion of the construction. For completed units we require a down payment of 30% and financing of the remaining balance with up to 120 monthly installments. For units under construction we require a down payment of 10% and provide financing of 25-35% with up to 30 monthly installments until the delivery of the unit and financing of the remaining 75-65%, respectively, with up to 120 additional monthly installments. All of our financing plans are guaranteed by a conditional sale of the unit, with the transfer of the full property rights of the unit to the customer upon the full payment of the outstanding installments.
We have developed a strict credit policy in order to minimize risks. We take the following steps whenever we conduct a credit review process:
|
|
·
|
trained independent brokers interview each potential customer to collect personal and financial information and fill out a registration form;
|
|
|
·
|
registration forms are delivered, along with a copy of the property deed, to us and, if the bank providing the financing requests, to an independent company specialized in real estate credit scoring;
|
|
|
·
|
credit is automatically extended by us to the customer if his or her credit analysis is favorable. However, if the credit analysis report raises concerns, we will carefully review the issues and accept or reject the customer’s application depending on the degree of risk. To the extent financing is provided by a bank, such financial institution will follow their own credit review procedures; and
|
|
|
·
|
after approving the application, our staff accepts the down payment which is given as a deposit on the purchase of the unit.
|
Sales contracts
. Our sales contracts generally provide for adjustment of the sales price according to the INCC during construction and at an annual interest rate of 12% plus IGP-M over the receivables balance after a stated date in our sales contracts. We have historically experienced a low rate of customer default on our sales. In February 28, 2013, our clients’ default level was 5,40% of our accounts receivable for Gafisa, 10.83% for Tenda and 3,09% for Alphaville. We attribute our low default rate to the fact that: (1) we conduct database research on the socio-economic background of our prospective customers; (2) our agreements discourage default and cancellation of the purchase by imposing immediate penalty fees, interest and liquidated damages which are adjusted for inflation, and we retain approximately 60-65% (Gafisa), 20% (Tenda) and 20% (Alphaville) of the total purchase price plus expenses incurred by us, which in general represents all or a substantial portion of the amount that the defaulted clients have already paid us; and (3) we offer several options to our customers if they experience financial difficulties, such as offering them a greater number of installment payments or exchanging the unit bought for a less expensive one. When a default occurs, we endeavor to renegotiate the outstanding loan with our customers before taking any legal action. We will only transfer title of the unit to a buyer after the release of the certificate of acceptance of occupancy by local authority and/or the full payment of all outstanding installments. We have increased the percentage of mortgages that our customers obtain from us from approximately 33% in 2006 to 65% in 2012. This increase reflects the growing interest of commercial banks in financing the Brazilian housing industry. See “Item 5. Operating and Financial Review and Prospects—A. Operating Results—Launches and Contracted Sales—Contracted Sales” for a discussion of the sales value of contracts cancelled by our customers and penalties paid in connection with such cancellations.
The table below sets forth the client’s default level breakdown segment, as of February 28, 2013.
|
Gafisa
|
Alphaville
|
Tenda
|
||||||||||
|
Default level by segment
|
5.40 | % | 3.09 | % | 10.83 | % | ||||||
Cancelation of sales contracts
. Gafisa and Tenda sales contracts are irrevocable under Brazilian law. That means that a customer does not have the unilateral ability to terminate a contract once it is executed, nor does the customer have an ability to require a refund of amounts previously paid unless we agree. To the extent that a customer is not in compliance with its obligations under a contract, we may at our option either force compliance through the Brazilian courts, or agree to a “default” by the customer. Should we agree at our sole discretion to refund part of amounts paid to the defaulting party, we will normally apply the penalty set forth in the contract.
In the event either we or the customer do not agree to enter into a commercial negotiation following a customer default there are two courses of action available:
1. The first option is that we may seek to enforce the agreement in Court to collect the amount outstanding and effectively transfer ownership of the unit to the buyer.
2. As provided in the contract and contemplated in Brazilian law we have the right to force the unit to be auctioned. When the unit is purchased in auction by a third party the proceeds from the auction are used in part to settle in full (including interest and penalties for late payments) the amount owed by the customer to Gafisa and the remaining balance is paid to the customer. When no third party is willing to acquire the unit in the auction, the title to the unit returns to Gafisa or Tenda without any disbursement, except for the auctioneers fees. Provisions in the Gafisa contract indicate that when such auction occurs it is without prejudice of the penalties set forth in this contract (meaning that the penalty provisions survive). Upon consultation, our legal counsel advised us that the customer has a right to request that amounts paid by him be returned after the contractual “penalty” has been deducted.
The table below provides the number and sales value of contracts terminated by customers for the periods presented :
|
2012
|
2011
|
2010
|
||||||||||||||||||||||
|
Year Segment
|
Number of contracts
|
Sales value (R$ thousands)
|
Number of contracts
|
Sales value (R$ thousands)
|
Number of contracts
|
Sales value (R$ thousands)
|
||||||||||||||||||
|
Gafisa
|
||||||||||||||||||||||||
|
Contracted sales
|
4,031 | R$ | 2,040,575 | 5,871 | R$ | 2,530,372 | 5,377 | R$ | 2,195,814 | |||||||||||||||
|
Volume/Sales value of terminations
|
(1,074 | ) | (441,047 | ) | (753 | ) | (350,284 | ) | (604 | ) | (221,497 | ) | ||||||||||||
|
Percentage
|
26.6 | % | 21.6 | % | 12.8 | % | 13.8 | % | 11.2 | % | 10.1 | % | ||||||||||||
|
Sales value, net of termination
|
2,957 | 1,599,528 | 5,118 | 2,180,088 | 4,773 | 1,974,317 | ||||||||||||||||||
|
2012
|
2011
|
2010
|
||||||||||||||||||||||
|
Year Segment
|
Number of contracts
|
Sales value (R$ thousands)
|
Number of contracts
|
Sales value (R$ thousands)
|
Number of contracts
|
Sales value (R$ thousands)
|
||||||||||||||||||
|
Tenda
|
||||||||||||||||||||||||
|
Contracted sales
|
9,990 | 1,175,733 | 15,725 | 1,737,721 | 19,616 | 1,962,174 | ||||||||||||||||||
|
Volume/Sales value of terminations(1)
|
(10,852 | ) | (1,250,051 | ) | (14,284 | ) | (1,407,511 | ) | (6,551 | ) | (529,049 | ) | ||||||||||||
|
Percentage(1)
|
108.6 | % | 106.3 | % | 90.8 | % | 81.0 | % | 33.4 | % | 27.0 | % | ||||||||||||
|
Sales value net of terminations
|
(862 | ) | R$ | (74,318 | ) | 1,441 | R$ | 330,210 | 13,065 | R$ | 1,433,125 | |||||||||||||
|
Alphaville
|
||||||||||||||||||||||||
|
Contracted sales
|
5,654 | 1,293,526 | 3,584 | 910,425 | 3,170 | 658,542 | ||||||||||||||||||
|
Volume/Sales value of terminations
|
(591 | ) | (185,633 | ) | (299 | ) | (68,435 | ) | (264 | ) | (59,604 | ) | ||||||||||||
|
Percentage
|
10.5 | % | 14.4 | % | 8.3 | % | 7.5 | % | 8.3 | % | 9.1 | % | ||||||||||||
|
Sales value net of termination
|
5,063 | R$ | 1,107,893 | 3,285 | R$ | 841,991 | 2,906 | R$ | 598,938 | |||||||||||||||
|
Total sales value net of termination
|
7,158 | R$ | 2,633,103 | 9,844 | R$ | 3,352,289 | 20,744 | R$ | 4,006,380 | |||||||||||||||
|
(1)
|
After a detailed analysis of Tenda receivables portfolio, we identified clients who no longer qualified for the mortgage because their contracts had terminated. In 2012, we had R$1.2 billion in sales value of termination and R$1.4 billion in 2011. As of the fourth quarter of 2011, we adopted a new sales policy for Tenda units to avoid contract terminations. The new terms of the contracts increased security in the client’s transfer of their contracts to financial agents. This change led to a longer time period for new sales and for resale of units under contracts entered into during that period.
|
Receivables securitization.
We release capital for new projects by seeking not to maintain receivables after our projects are completed. We have been active in the securitization market and we are capitalizing on an increasing investor demand for mortgage-backed securities. The securitization (mortgage-backed securities) market in Brazil is relatively new but we believe it is rapidly expanding. This expansion is helped significantly by recent development in Brazilian foreclosure laws.
With the growing availability of mortgages from commercial banks and the increasing liquidity of mortgage-backed securities (CRIs), we expect to further reduce our role as a financing provider to our customers. Our goal is to optimize our working capital by transferring the financing activities to securitization companies and banks.
Main Raw Materials and Suppliers
We purchase a wide variety of raw materials for our operations. Even though these raw materials have represented on average, over the last three years, approximately 35% of our total costs of development, aside from land, the only raw material that represents more than approximately 4.5% of our total costs is steel. Prices of some raw materials have significantly increased over the last two years at a rate higher than inflation. The index that measures the fluctuation of construction costs, the INCC, increased 24% during the three year period ended December 31, 2012. During that same period, the IGP-M increased 26%, resulting in an increased/decreased in unit prices. We have been working on the development of new construction techniques and the utilization of alternative materials in order to reduce costs and improve our construction process with advanced technology.
We contract with major suppliers for the materials used in the construction of the buildings. We receive general pricing proposals from various suppliers of raw materials and select the proposal with the best terms and conditions for each development. In addition to pricing, we select our suppliers by the quality of their materials. We set forth specific minimum quality requirements for each construction project, and the chosen supplier must meet this quality requirement. The materials for our developments are readily available from multiple sources and, accordingly, we do not rely on any one supplier for our raw materials.
Our five largest suppliers in terms of volume are Gerdau Aços Longos S.A., Votorantim Cimentos Brasil Ltda., Supermix Concreto S.A., Intercement Brasil S.A. and Elevadores Atlas Schindler S. A. In general terms, we purchase products for our construction based on the scheduled requirements, and we are given approximately 28 days to pay. The products we purchase generally come with a five-year warranty. We do not have any exclusive arrangements with our suppliers. We work closely with suppliers, enabling them to schedule their production in
order to meet our demand or notify us in advance in the event they anticipate delays. We have good relationships with our suppliers and have experienced no significant construction delays due to shortages of materials in recent years. We do not maintain inventories of construction materials.
We achieve significant economies of scale in our purchases because we:
|
|
·
|
use standard construction techniques,
|
|
|
·
|
engage in a large number of projects simultaneously, and
|
|
|
·
|
have long-term relationships with our suppliers. We periodically evaluate our suppliers. In the event of problems, we generally replace the supplier or work closely with them to solve the problems.
|
Customer Service
In our industry, customer satisfaction is based in large part on our ability to respond promptly and courteously to buyers before, during and after the sale of our properties, including providing an owner’s guide. We use innovative and personalized customer service techniques beginning with the initial encounter with a potential customer. We believe we were one of the first homebuilders in Brazil to introduce services such as breakfast for customers at construction sites and providing monthly photos to customers on the progress of the construction. These services are provided with the objective of educating customers on the progress of the construction and improving customers’ experience with the purchase of our units. Other customer service efforts include:
|
|
·
|
a dedicated high performance outsourced call center with consultants and specialists trained to answer our customers’ inquiries;
|
|
|
·
|
the “Gafisa Viver Bem” relationship program, with a web portal, through which our customers can, for example, follow the project’s progress, alter their registration information, simulate unit designs and check their outstanding balances;
|
|
|
·
|
relationship events to engage the customer with the “Gafisa Viver Bem” program, like the “Open House” (inauguration party in the unit) and the “House UP” (refurbish one room of the unit).
|
|
|
·
|
the development of the “Gafisa Personal Line,” through which buyers of certain units are able to customize their units in accordance with plans and finishing touches offered by Gafisa. Such options vary by development.
|
As part of our customer service program in our residential developments, we conduct pre-delivery inspections to promptly address any outstanding construction issues. Prior to the delivery of each unit, we maintain regular contact with the customer by sending the customer our magazine “Gafisa Way.” We also conduct monitored inspections of our developments to allow buyers to gather more information from our technical personnel. In addition, we send a monthly status report on the construction of the unit. We conduct another evaluation of the customer’s satisfaction with his or her unit, as well as the customer’s experience with our sales personnel and our various departments (customer services, construction and title services) 18 months after the release of the certificate of acceptance of occupancy by the relevant local authority. We also provide a five-year limited warranty covering structural defects, which is required by Brazilian law.
In 2013, we plan to engage with our customers by creating positive experiences with the brand Gafisa.
News on our Alphaville communities are posted on Alphaville’s website, which also contains documents and information related to each of our Alphaville developments exclusively for owners of Alphaville developments.
Competition
The real estate market in Brazil is highly fragmented and competitive with low barriers to entry. The main competitive factors include price, financing, design, quality, reputation, reliability, meeting delivery expectations, partnerships with developers and the availability and location of land. Certain of our competitors have greater financial resources than we do, which could provide them an advantage over us in the acquisition of land using cash. In addition, some of our competitors have better brand recognition in certain regions, which could give them a
competitive advantage in increasing the velocity of their sales. Because of our geographic diversification, we believe that we have access to different markets within Brazil that have different demand drivers.
Because of the high fragmentation of the markets in which we operate, no single developer or construction company is likely to obtain a significant market share. With the exception of São Paulo and Rio de Janeiro, where we face competition from major publicly-traded competitors, in other regions we generally face competition from small and medium-sized local competitors that are not as well-capitalized. We expect additional entrants, including foreign companies in partnership with Brazilian entities, into the real estate industry in Brazil, particularly the São Paulo and Rio de Janeiro markets.
The table below sets forth the most recent data available on our market share in the São Paulo and Rio de Janeiro markets:
|
São Paulo (1) — Gafisa’s Market Share
|
||||||||||||
|
Year ended December 31,
|
||||||||||||
|
Year
|
2012
|
2011
|
2010
|
|||||||||
|
(Launches in R$ million)
|
||||||||||||
|
Local market
|
R$ | 28,288 | R$ | 30,311 | R$ | 20,935 | ||||||
|
Gafisa(2)
|
1,306 | 2,227 | 1,069 | |||||||||
|
Gafisa’s market share
|
4.6 | % | 7.3 | % | 5.1 | % | ||||||
|
Source: EMBRAESP and SECOVI.
|
|
Rio de Janeiro (1) — Gafisa’s Market Share
|
||||||||||||
|
Year ended December 31,
|
||||||||||||
|
Year
|
2012
|
2011
|
2010
|
|||||||||
|
(Launches in R$ million)
|
||||||||||||
|
Local market
|
R$ | 12,252 | R$ | 11,544 | R$ | 6,786 | ||||||
|
Gafisa(2)
|
347 | 962 | 159 | |||||||||
|
Gafisa’s market share
|
2.8 | % | 8.3 | % | 2.3 | % | ||||||
|
Source: ADEMI.
|
|
(1)
|
Metropolitan region.
|
|
(2)
|
Gafisa stake.
|
We believe we are the leader in residential community developments. Our subsidiary Alphaville has a sizable and what we believe to be non-replicable land reserves, which will foster our future growth in the upcoming years.
Seasonality
Although the Brazilian real estate market is not generally seasonal, there are a few months of the year when the market slows down (January, February and July) each year. These months coincide with school vacations and result in the postponement of investment decisions. We are impacted similarly as the rest of the market during such periods.
Subsidiaries
We carry out our real estate developments directly or through our subsidiaries or our jointly-controlled entities in partnership with third parties. As of December 31, 2012, we had 222 subsidiaries and 85 jointly-controlled entities under operations, all of such subsidiaries and jointly-controlled entities are incorporated as special purpose entities and headquartered in Brazil. Our subsidiaries and jointly-controlled entities operate exclusively in the real estate sector.
Many of our subsidiaries and joint-ventures are SPEs, many of which have been incorporated by us as joint ventures together with other real estate and construction companies in Brazil. Of our 307 SPEs, 73% are wholly-owned by us and 13% are majority-owned by us, and we hold an interest of 50% or less in the remaining 14%.
Intellectual Property
Trademarks
Our trademarks are filed or registered in Brazil with the Brazilian Institute of Industrial Property (
Instituto Nacional de Propriedade Industrial
), or the “INPI,” which is the competent body for, among others, trademarks’ and patents’ registries in Brazil. Besides, the trademark “Gafisa” is also registered before the competent agency for registering trademarks in the United States.
Currently, the registration process of a trademark takes approximately 30 to 36 months from the date of filing of the application until the definitive registration. From the date of filing of the application to the date of the definitive registration, the applicant has an expectation of right for the use of the trademark in connection with the products and services for which the trademark was applied for.
Each trademark registration is effective for a 10-year period and is renewable for equal and successive periods. The renewal of a trademark registration is granted upon request accompanied by payment of renewal fees during the final year of the trademark’s registration period or within the 6-month waiting period after its expiration. In case of non-payment, the registration is cancelled by INPI.
A trademark registration may be terminated in case (1) of expiration of its validity term; (2) the trademark owner or holder waives in whole or in part the rights granted by registration; (3) of forfeiture, or the applicant’s or the holder’s failure to use a registered trademark in connection with related goods or services for a period longer than five years; or (4) failure to appoint a Brazilian resident with powers to represent the applicant or holder in administrative or judicial proceedings, in cases where the applicant or the holder resides abroad.
As of the date of this annual report, we had approximately 119 pending trademark applications and 130 trademarks registered in Brazil with the INPI of which approximately (a) 97 pending applications and 117 registered trademarks refer to Gafisa, and (b) 22 pending applications and 13 registered trademarks refer to Tenda.
Our most significant trademark is “Gafisa,” which is duly registered with the INPI in the relevant market segment. Other relevant trademark we own, such as “Alphaville” and “Tenda,” are also registered with the INPI in several classes in connection with our daily activities.
Domain Name
As of the date of this annual report, we, together with our subsidiaries, were the owners of approximately 103 domain names including our and our subsidiaries’ principal websites. The term of each domain name registration is one year and is renewable for equal and successive periods. An annual fee payment is necessary for the maintenance of the domain name registrations. Other than non-payment of the annual fee, domain name registration may be cancelled by: (1) express waiver of the owner; (2) irregularities in the data form as requested by the respective agency; (3) non-compliance with applicable regulations; (4) judicial order; or (5) in the case of foreign companies, non-compliance with the obligation to initiate the company’s activities in Brazil. Our domain names will, unless renewed, expire between April 2013 and April 2021. We will seek to renew our domain names expiring in 2013, after evaluating their continuing applicability.
Patents
We have no patents registered in our name.
Software Licenses
Most of the software we use in our daily business refers to common computer programs, such as Windows, SAP and AutoCAD. Additionally, we own all required licenses of use in connection with such software. The use of computer software without the acquisition of proper licenses is considered a felony subject to both criminal and civil liabilities, including the payment of fines and restrictions of future use of the applicable software.
Licenses
Under Brazilian laws, we are required to obtain a variety of licenses for each of our new developments. As of the date of this annual report, we have obtained all necessary licenses and permits to operate our business.
Insurance
We maintain insurance policies with leading Brazilian insurance companies, such as Allianz Seguros S.A., Itaú Unibanco Seguros ACE Seguradora S.A., Zurich Brasil Seguros S.A., Chubb do Brasil Companhia de Seguros, Caixa Seguradora, J. Malluceli Seguros S.A. and Austral Seguradora S.A., with coverage for, among others, (1) potential risks arising from the commencement of construction, including property damages, business interruption, engineering risks, fire, falls, collapse, lightning, and gas explosion; (2) construction errors; (3) performance bonds; and (4) losses arising from damages or defense costs associated with litigation resulting from misconduct of directors and officer. Such insurance policies contain customary specifications, limits and deductibles. Additionally, we do not maintain any insurance policy for our properties after construction is completed.
According to Brazilian Federal Law, it is mandatory that homebuilders have insurance policies in force with coverage for, among others, damages and losses related to civil liabilities and performance bonds. Failure or default in contracting any compulsory insurance required by applicable legislation is subject to a penalty amounting to the higher amount between (1) twice the premium price of the insurance that should have been contracted; and (2) ten percent of the insured property value. Additionally, no operating authorization or license (or the renewal of any existing license) shall be granted to companies subject to compulsory insurance in default of the aforementioned obligations.
Our management believes that the insurance coverage for our properties is adequate and that our insurance policies are customary for our industry in Brazil and adequate for applicable regulations. Although no assurance can be given, we believe that the amount of insurance we carry will be sufficient to protect us from material loss in the future.
Regulatory Framework
Brazilian Government and Real Estate Sector Regulations.
The real estate sector is directly regulated by the Brazilian government and is indirectly impacted by the government’s regulations on the availability of credit. Regulations include development policies, zoning restrictions and environmental laws which can determine the availability of different products offered in the market. For example, city master plans restrict the types of real estate developments that can be constructed in a given area.
As a general rule, the NBCC requires that the transfer of title of real estate properties, as well as the assignment, transfer, change or waiver of rights on real estate properties, be carried out by means of a public deed, except in certain cases, such as when the Real Estate Finance System (
Sistema Financeiro Imobiliario
), or SFI, or the SFH, are involved. The intent of this rule is to increase the security of property transfers.
According to applicable law, transfer of real estate title is only deemed effective upon the registration of the transfer with the relevant Real Estate Registry Office. The procedure for the execution of public deeds and also the respective registration with the Real Estate Registry Office (
Registro Imobiliário
) is regulated by the Brazilian Law of Public Registers (
Lei de Registros Públicos
).
Real estate development
Real estate development activities are regulated by Law No. 4,591 of December 16, 1964, as amended, or Law No. 4,591. The main duties of a developer are to: (1) obtain all required construction approvals and authorizations from the proper authorities; (2) register the development with the Real Estate Registry Office (without registration, the developed units cannot be sold); (3) indicate in the preliminary documents the deadline for the developer to withdraw from the development; (4) indicate in all advertisements and sales contracts the registration number of the development with the Real Estate Registry Office; (5) oversee the construction of the project established by the contract which must be in accordance with the approval granted by the authorities; (6) deliver to the final owner the completed units, in accordance with the contractual specifications, and transfer to the final owner the title of the unit by signing the final sale deed; (7) assume sole responsibility for the delivery of the developed units to the respective
purchasers; (8) assume sole responsibility in the event the construction of the unit is not in accordance with the advertisements and sale contracts; and (9) provide construction blueprints and specifications along with the joint ownership agreement to the proper Real Estate Registry Office. The final owner is obligated, in turn, to pay the price related to the cost of the land and the construction.
The construction of the real estate units may be contracted and paid for by the developer or by the final owners of the units. Brazilian law provides for two pricing methods in real estate development: (1) construction under contract and (2) construction under a system of management. In construction under contract, the contracting parties will either set a fixed price, stipulated before the construction begins, or agree on an adjustable price pegged to an index determined by the contracting parties. In construction under a system of management, an estimated price is agreed upon by the contracting parties, but no fixed final price is provided at the beginning of the construction process. The actual amount that purchasers of the units pay depends on the monthly costs of the developer or contractor.
Urban land subdivisions
Urban land subdivisions consist of subdivisions of urban land parcels into building lots and the construction of new roads and other infrastructure, and are regulated by Law No. 6,766 of December 19, 1979, as amended, or Law No. 6,766. The Urban Land Subdivision Act governs urban land subdivisions and establishes, among other things, the planning and technical requirements for this form of land parceling and the obligations of the developers, and also provides for fines and sanctions in the event of violation of its provisions.
Under the Urban Land Subdivision Act, land subdivisions are intended for the creation of lots in urban areas or urban expansion zones, as defined by the planning director or approved by municipal law, and must comply with Law No. 6,766.
For the construction of land subdivisions, the developer must proceed through the following steps: (1) prior to developing the land subdivision plan, it must request the municipality in which the development will be located to issue directives on use policies specifically to the land, such as the delineation of lots, road and street systems and areas reserved for municipal or community properties; (2) pursuant to the directives issued by the municipality, it must develop a plan for the proposed land subdivision and present it to the municipality for approval, including the plans, designs, descriptions, and schedule for performance of the work, among other documents; and (3) after approval for the land subdivision project is obtained, it must be submitted for recording in the property registry of the appropriate Real Estate Registry Office within 180 days.
In addition to the approval of the project by the municipality in which the development will be located, the approval of other governmental bodies may be necessary in cases where the land subdivision: (1) is located in an area of particular interest, such as a protected cultural heritage site as defined by state or federal legislation; (2) is located in the boundary area of a city, belongs to more than one municipality, or is in a metropolitan region as defined in state or federal law; or (3) has an area greater than 1 million square meters, in which case the state where the development will be located will be responsible for reviewing and approving it prior to the approval by the municipality, and will also determine the regulations to which the development must be subject.
The legal requirements for the approval of the land subdivision by a municipality include: (1) the developer must preserve a percentage of the land used for residential communities as open spaces for public use and for municipal or community properties with the percentage determined by each municipal zoning code; (2) each lot must have a minimum area of 125 square meters and the distance between the building and the street must be at least five meters; and (3) the developer must reserve 15 meters of land on either side of running or still water and of strips of public domain land for roads and highways.
The Urban Land Subdivision Act also sets forth locations where subdivisions are not permitted, such as: (1) on wetlands and lands subject to flooding, until measures have been taken to assure water drainage; (2) on land that has been filled with material that is a public health hazard, unless previously cleaned up; (3) on land that has a slope equal to or greater than 30 degrees, unless the requirements of the appropriate authorities have been met; (4) on lands where geological conditions make buildings inadvisable; and (5) in ecological preserves or areas where pollution creates unacceptable sanitary conditions, until corrected.
In order to offer greater security to the property market, the Urban Land Subdivision Act prohibits the sale or promise of sale of any lot that is the result of a subdivision where the developer has not previously obtained approval by the appropriate municipality and the development has not been recorded with the respective Real Estate Registry Office. If any such lot is sold or contracted to be sold, the developer and any person or legal entity benefiting from such sale or promise of sale shall be jointly liable for the resulting damages to the purchaser and the public authorities.
Assets for Appropriation
Law No. 10,931 of August 2, 2004, as amended, provides for certain protection of real estate assets. Accordingly, such protected assets are segregated from other properties, rights and obligations of the developer, including other assets previously appropriated, and such appropriated assets can only be used to guarantee debts and obligations related to the respective development. The appropriated assets are considered bankruptcy free and will not be affected in the event of bankruptcy or insolvency of the developer. In the event of a bankruptcy or insolvency of the developer, joint ownership of the construction may be instituted by a resolution of the purchasers of the units or by judicial decision. The joint owners of the construction will decide whether the project will proceed or the assets appropriated will be liquidated. Developers may also opt to submit a project to appropriation in order to benefit from a special tax system. Under this system, land and objects built on the land, financial investments in the land, and any other assets and rights with respect to the land are considered to be protected for the benefit of the construction of that development and the delivery of the units to the final owners, and are thus separate from the remaining assets of the developer.
In addition, in order to encourage the use of the appropriation system, Laws No. 11,977 of July 7, 2009 (amended by Law No. 12,249 enacted on June 11, 2010, Law No. 12,424 enacted on June 16, 2011 and Law No. 12,693 enacted on July 24, 2012) and No. 12,024 of August 27, 2009, which granted tax benefits for the adoption of the system by reducing tax rates on appropriated assets from 7% to 6% and, in the case of the appropriated assets under the public housing program “
Minha Casa, Minha Vida
,” from 7% to 1%.
We have not yet utilized the appropriation system for any of our real estate developments. We prefer to use our subsidiaries and our jointly-controlled entities for each specific real estate development. Our subsidiaries and jointly-controlled entities allow us to borrow funds by segregating the credit risk taken on by the financial institutions.
Credit Policy Regulations
The real estate sector is highly dependent on the availability of credit in the market, and the Brazilian government’s credit policy significantly affects the availability of funds for real estate financing, thus influencing the supply of and demand for properties.
Housing Finance System, or “SFH”
Law No. 4,380 of August 21, 1964, as amended, created the SFH to promote the construction and ownership of private homes, especially for low income earners. Financing resources under the SFH’s control are provided by the Government Severance Indemnity Fund for Employees (
Fundo de Garantia do Tempo de Serviço
), or “FGTS,” and from savings account deposits. The FGTS, created by Law No. 5,107 of September 13, 1966 and regulated by Law No. 8,036 of May 11, 1990, imposes a mandatory 8% employee payroll deduction on all employees in Brazil. Employees maintain FGTS accounts, which are similar to pension funds, and are allowed, among other things, to use the funds deposited in the accounts for the acquisition of real estate property under certain circumstances, as set forth by applicable law. The CEF is the agency responsible for managing the funds deposited in the FGTS. In order to be eligible for the financing, the beneficiary must purchase a completed unit or unit under construction priced at up to R$500,000. In addition, the beneficiary shall (1) not own or be the committed purchaser of any residential real estate financed by the SFH within Brazil; (2) not own or be the committed purchaser of, any real estate property built or under construction in both his or her current city of residence and the city where the beneficiary conducts his or her main activities; (3) reside for at least one year in the city where the property is located; (4) pay the FGTS; and (5) be registered for at least three years with the FGTS regime. The unemployed also have access to the FGTS to purchase real estate property provided that he still has funds on the FGTS account (where the 8% payroll deduction was deposited while employed).
Financings that originate from savings account deposits in the entities comprising the Brazilian Saving and Loan System (
Sistema Brasileiro de Poupança e Empréstimo)
, or “SBPE,” are regulated by the Central Bank. Such financings can be obtained through the SFH, which is strictly regulated by the Brazilian government, or through the mortgage portfolio system, where banks are free to set the financing conditions. SFH financing offers fixed interest rates lower than the market rates, capped at around 12% per year, and SFH financing contract terms vary, in general, between 15 and 30 years. The mortgage portfolio system financing offers market interest rates as determined by the financial institutions, generally varying between 18.5% and 12% per year.
CMN Resolution No. 3,932/2010 provides for the allocation of the funds deposited in savings accounts in the entities comprising SBPE and states that the following conditions must be met for SFH financing: (1) the maximum amount of the financing is R$450,000; (2) the maximum appraisal price for the financed unit is R$500,000; (3) the maximum actual cost to the borrower, which includes charges such as interest, fees and other financial costs, except insurance, may not exceed 12% per year; and (4) the borrower is responsible for the potential outstanding balance verified at the end of the financing term, (such term might be extended by half of the initial term).
SFH financings need to be secured by at least one of the following: (1) a first mortgage over the unit that is being financed; (2) a conditional sale over the unit that is being financed, as prescribed by Law No. 9,514 of November 20, 1997, as amended by Law No. 10,931 of August 2, 2004, Law No. 11,076 of December 30, 2004, Law No. 11,481 of May 31, 2007 and Law No. 12,703 of August 07, 2012, (“Law No. 9,514”); or (3) a first mortgage or conditional sale, as determined by Law No. 9,514, of other property owned by the borrower or by a third party; or (4) other guarantees, as established by the financing agent. SFH funds are only released upon the formalization of one of these methods of guaranteeing the loan.
The federal government has announced changes in the regulations on financing and construction in order to promote growth in the real estate market. Among the measures announced are: (1) financial institutions have the option to grant financing with previously fixed rates; (2) lenders have the option of excluding the TR index (
Taxa Referencial
) from the financing and applying only the limit of 12% per year; (3) allowing financing installment payments to be directly deducted from a borrower’s wage; (4) establishing a new credit program from the CEF to real estate developers; and (5) reducing the Tax on Manufactured Products (
Imposto sobre Produtos Industrializados
), or “IPI,” for products utilized in the construction segment.
Mortgage portfolio
While a large portion of the funds in the deposits in saving accounts are allocated to the SFH, some of the funds are allocated to loans granted at market rates. CMN Resolution No. 3,932/10 established that at least 65% of these deposits should be used for real estate financing, with a minimum of 80% of the financing going to housing loans under the SFH and the remaining balance for loans granted at market rates which are usually higher than in SFH loans, including mortgage portfolio used by banks for the concession of housing loans.
In early 2005 the Brazilian government took a number of measures to better regulate the use of the funds raised in savings account deposits in order to promote growth of the real estate sector, these measures included: (1) cancellation of payment to the Central Bank of funds not invested in real estate financing in January, February and March; (2) creation of a real estate interbank deposit market to allow financial institutions with excessive investments in real estate to trade with financial institutions that have capacity for more real estate credits; (3) increase of the operating limits of the SFH to units with a maximum sales price of R$500,000; (4) review of the factors used in the calculation guidelines of the SFH in order to stimulate financing for the acquisition of new real estate properties at a low cost, applicable as of January 1, 2005; and (5) authorization for the SFH to provide financing to legal entities for the construction of development projects for their employees, provided that such entities follow all SFH guidelines. These changes have significantly increased the funds available for investments in the Brazilian real estate sector.
Real Estate Finance System, or “SFI”
The SFI was created by Law No. 9,514 to establish assignment, acquisition and securitization criteria for real estate credits. The system seeks to develop primary (loans) and secondary (trading of securities backed by receivables) markets for the financing of real estate properties by creating advantageous payment conditions and special protection of creditors’ rights. The SFI supervises real estate financing transactions carried out by savings banks, commercial banks, investment banks, real estate credit portfolio banks, housing loan associations, savings
and loan associations, mortgage companies and other entities authorized by the CMN to provide such financing. SFI real estate credits may be freely negotiated by the parties, under the following conditions: (1) the amount loaned and the related adjustments must be fully reimbursed; (2) interest must be paid at the rates established by the contract; (3) interest must be capitalized; and (4) borrowers must purchase life and permanent disability insurance.
Real estate sales, rental, or other real estate property financing in general, can be negotiated with non-financial institutions under the same conditions permitted by authorized entities under the SFI. In these cases, non-financial entities are authorized to charge capitalized interest rates greater than 12% per year.
The following types of guarantees are applicable to loans approved by the SFI: (1) mortgages; (2) fiduciary assignment of credit rights resulting from sales contracts; (3) guarantee of credit rights resulting from contracts of sale or promise of sale of property; and (4) conditional sale of real estate property.
Law No. 9,514 also reformed securitizations of real estate assets provisions, making them less expensive and more attractive. The securitization of credits in the context of the SFI is made through real estate securitization companies, non-financial institutions formed as joint stock companies whose objective is to acquire and securitize real estate credits. Funds raised by the securitizing companies can be made through the issuance of debentures or notes, or the creation of a new type of Real Estate Receivable Certificates (
Certificados de Recebíveis Imobiliários
), or “CRIs.” According to applicable law, CRIs are nominative credit securities issued exclusively by securitizing companies, backed by real estate credits, freely negotiated, and payable in cash. CRIs tend to have, among others, the following characteristics: they are issued in book-entry form, they may have fixed or floating interest rates and can be paid in installments, they may contain adjustment provisions, they are registered and traded through centralized systems of custody and financial settlement of private securities and they can be secured by the assets of the issuing company.
Minha Casa, Minha Vida program
Provisional Measure No. 459 enacted on March 25, 2009, converted into Law No. 11,977 enacted on July 7, 2009, amended by Law No. 12,249 enacted on June 11, 2010, Law No. 12,424 enacted on June 16, 2011 and Law No. 12,693 enacted on July 24, 2012 created a public housing program called “
Minha Casa, Minha Vida
.” Provisional Measure No. 514 enacted on December 1, 2010, converted into Law No. 12,424 of June 16, 2011, modified the aforementioned legislation, which calls for government investment of more than R$30 billion and is focused on building one million houses for families with monthly incomes of up to ten times the minimum wage. Under this program, the government is authorized to finance families purchasing houses with assessed values between R$80,000 and R$170,000.
Municipal Legislation
Municipal planning is regulated by articles 182 and 183 of the Federal Constitution and by Law No. 10,257 of July 10, 2001 (
Estatuto da Cidade
), as amended, or Law No. 10,257. Law No. 10,257 provides, among other things, for the establishment of (1) rules for the parceling, use and occupation of urban tracts of land in each municipality for the collective welfare and environmental balance of the community; and (2) a master plan, which shall be reviewed every 10 years. The master plan is the guiding tool used to plan developments in the urban areas of each municipality and is used as a reference by all public and private agents acting within the municipality. It establishes the strategic goals and general guidelines for urban construction, the objectives and guidelines for differentiated areas of planning and the instruments for their deployment.
We set out below certain details of the laws governing the municipal planning of the two major cities in which we operate, São Paulo and Rio de Janeiro:
São Paulo municipality
City laws govern the zoning, construction, parceling, use and occupation of land in the municipality of São Paulo. They set forth technical and urban planning requirements for parceling, and provide that the division, subdivision or segregation of urban tracts of land are subject to the prior approval of the São Paulo municipal government. Moreover, the zoning laws describe the types of permissible uses for the land and their respective characteristics, by dividing São Paulo into areas of use with fixed locations, limits and boundaries. They also provide for fines and sanctions for noncompliance.
Municipal Law No. 13,430 of September 13, 2002, approved the master plan and created the Planning System of the municipality of São Paulo. In addition, Municipal Law No. 11,228 of June 25, 1992, as amended, approved the Code of Works and Construction, regulated by Decree 32,329 of September 23, 1992, as amended, which governs administrative and executive procedures and sets forth the rules to be followed in the planning, licensing, execution, maintenance and use of public works and construction within properties in the municipality of São Paulo, and provides for sanctions and fines applicable in cases of non-compliance with these rules.
Rio de Janeiro municipality
Decree 322 of March 3, 1976, as amended, of the municipality of Rio de Janeiro, and Decree “E” 3,800 of April 20, 1970, as amended, of the then State of Guanabara, jointly created the municipality’s Zoning Regulation, Land Parceling Regulation and Construction Regulation. These regulations control the use of the municipality land, including urban zoning, use of properties, development of construction sites and conditions for the use of each zone in the municipality. The Ten-Year Master Plan of the municipality, approved pursuant to Supplementary Law No. 111 of January 1, 2011, establishes rules and procedures related to urban policy of the municipality, determines guidelines, provides instruments for its execution and defines area policies and their related programs, aiming at meeting the social needs of the city.
Environmental Issues
We are subject to a variety of Brazilian federal, state and local laws and regulations concerning the protection of the environment, as described below. Applicable environmental laws may vary according to the development’s location, the site’s environmental conditions and the present and former uses of the site. These environmental laws may result in delays, cause us to incur substantial compliance and other costs, and prohibit or severely restrict project development. Before we purchase any real estate, we conduct investigations of all necessary and applicable environmental issues, including the possible existence of hazardous or toxic materials, as well as any inadequately disposed waste substances. During the investigations we also identify the existence of water wells and protected vegetation, observing the proximity of the real estate property to permanent preservation areas. We generally condition the real estate property acquisitions on obtaining the required regulatory approvals prior to closing.
We have adopted certain practices to further our commitment to environmental protection and landscape development. Through our Selective Collection Project, we have partnered in environmental education initiatives with private and governmental entities, including non-governmental organizations. We provide training to all of our outsourced workers (before we begin work on any particular project), that focuses on the importance of preserving the environment and how to effectively collect, store and control materials for recycling. Our subsidiary Alphaville was given the “ECO Award” in 2006 and 2007 (by the American Chamber of Commerce), the “Top Ambiental Award” (Top Environmental Award) in 2007 and 2008 (by the Brazilian Association of Marketing and Sales Agents, in recognition for its environmentally responsible practices) and the “Top Social Award” in 2008 and 2009 (by the Brazilian Association of Marketing and Sales Agents, in recognition for its socially responsible practices). Our Eldorado Business Tower building is the fourth building in the world and the only building in Latin American, to be pre-certified by the U.S. Green Building Council as a Leed CS 2.0 Platinum building for leadership in energy and environmental design.
Environmental licenses and authorizations
Brazilian environmental policy requires environmental licenses and permits for the construction of real estate projects. Environmental licensing is required for both initial construction and alteration in existing developments, and the licenses must be periodically renewed. The Brazilian Institute of Environment and Renewable Natural Resources (
Instituto Brasileiro do Meio Ambiente e dos Recursos Naturais Renováveis
), or the IBAMA, is responsible for granting such licenses for projects with regional or national impact on the environment. In other cases, state or municipal environmental agencies are responsible for granting such environmental licenses, depending on the extent of environmental impacts caused by certain projects.
The environmental licensing process is comprised of three stages: preliminary license, installation license and operational license. The preliminary license, issued during the preliminary planning phase of the project, authorizes the location and basic development, and establishes the conditions and technical requirements to be observed in further stages of development. The installation license authorizes the facility’s construction. The operating license authorizes the commencement and continuation of operational activities. Operating licenses are subject to
compulsory renewal depending on their validity. The licensing of activities that may impact the environment as determined by the competent environmental agency and according to the Environmental Impact Study and Environmental Impact Report (“EIA/RIMA”), requires environmental offset payments, to be invested in conservation units (e.g. national parks, biological reserves etc.), pursuant to Article 36 of Law No. 9,985/00. The value of the environmental offset is established by the environmental agency conducting the licensing proceeding, according to the “ecosystem impact level” of the proposed activity, pursuant to Article 31-A of Federal Decree No. 6,848/09.
The installation, operation or alteration of projects without proper and valid environmental licensing or the non-compliance with the conditions or technical requirements of the respective environmental licenses, may subject the violator to administrative sanctions that may range from fines (R$500 to R$10 million), as well as the suspension of activities and, depending on the specific circumstances, criminal liability (of individuals and companies), pursuant to Federal Law No. 9,605/98.
The construction, maintenance and sale of our projects may be hampered or halted by delays in the issuance of applicable licenses or even by failure to obtaining such licenses.
The construction of real estate developments often requires land moving activities, and in many cases, the cutting down of trees. These activities may require prior authorization of the relevant environmental authorities. As conditions to granting these authorizations, the relevant environmental authorities may require the licensees to plant new trees or acquire forests to repair the affected areas. The removal of vegetation without proper and valid authorization, or non-compliance with the authorization requirements, may subject the transgressor to civil liability (in case environmental damage occurs), administrative sanctions (such as fines) and, according to specific circumstances, criminal liability (of individuals and/or companies), pursuant to Federal Law No. 9,605/98.
In addition to environmental licenses and permits, Brazilian legislation requires specific environmental authorizations for the development of projects, based on the characteristics of the project, its location and the natural features inherent to the area. The development of projects that require the cutting trees or removing vegetation must receive specific authorizations from environmental agencies. Companies that apply for an authorization for vegetation removal are required to perform the reforestation of other areas as a compensatory measure, which may imply additional expenses. Brazilian legislation also requires special protections for certain specific types of flora, imposing additional legal requirements to removal of such vegetation.
The licensing of projects with relevant environmental impacts located in a conservation unit or within its buffer zone will depend on prior authorization from the conservation unit’s managing office, whereby environmental offset payments may be required, as mentioned above. In addition, the development of projects that require water abstraction from bodies of water or groundwater, as well as the discharge of effluents into water bodies, are subject to specific water use grants, to be issued by the relevant authorities. Water use grants are subject to certain conditions and technical requirements, including maximum capacity requirements and effluent treatment standards.
Waste disposal
Brazilian legislation relies on several standards and procedures for waste management. All waste must be properly stored, treated, transported and disposed of, in order to avoid the occurrence of environmental damages – and consequently, environmental liability.
The Brazilian “National Waste Management Policy” and CONAMA Resolution 307/2002 specifically regulates the handling of solid waste generated by the construction sector. Companies are required to present and have a solid waste management plan approved by state environmental agency and must comply with the conditions and obligations set forth in such plan. Failure to comply with such obligations may lead to civil (obligation to repair/indemnify in case of pollution), administrative (e.g. fines, suspension of activities etc.) and, according to specific circumstances, criminal liability.
Regarding civil liability, because Brazilian legislation imposes strict, joint and several liability for environmental damages, companies may be held liable for any environmental damages that may arise as a result of its activities, including waste generated thereof, which must be properly stored, treated, transported and disposed of. Likewise, the hiring of third parties for management of waste generated from our activities does not exempt us from civil environmental liability.
Contaminated areas
We develop and construct projects in several states within Brazil. Each state has its Environmental Secretary and/or Environmental Agency. The São Paulo State Secretary of Environment (
Secretaria de Estado do Meio Ambiente de São Paulo
), or the “SMA,” and the State Environmental Agency of São Paulo (
Companhia Ambiental do Estado de São Paulo
), or “CETESB,” are the principal environmental regulatory entities of the State of São Paulo, and they have adopted procedures with regard to the management of contaminated areas, including the creation of environmental standards to preserve the quality of land and underground water.
In addition, the Rio de Janeiro State Secretary of Environment (
Secretaria de Estado do Meio Ambiente e Desenvolvimento Urbano do Rio de Janeiro
) and the Rio de Janeiro State Environmental Agency, or “INEA,” also maintain their own quality standards, in combination with those established by the National Environmental Council (
Conselho Nacional do Meio Ambiente
), or “CONAMA”. Other states have similar requirements.
If contaminated areas are identified in the development of our projects, we must provide proper disclosure to environmental authorities and registration before real estate property records. Given the strict liability regime, we may be required to proceed with the remedial actions deemed necessary by environmental agencies in order to comply with technical standards set forth for each kind of project. Prior approval from environmental agencies before engaging in remedial actions may be necessary.
Non-compliance with the guidelines established by the environmental and health entities may result in criminal, as well as administrative penalties. Moreover, the owners of properties may be required to pay for costs relating to the clean-up of any contaminated soil or groundwater located in their properties, even if they did not cause the contamination.
Environmental liability
Article 225 of the Brazilian Federal Constitution, provides that “activities that are harmful to the environment shall subject violators, whether individuals or companies, to criminal and administrative sanctions, regardless of the obligation to repair the damage caused.” Therefore, the Brazilian Federal Constitution provided for environmental liability in three distinct fields: civil, administrative and criminal. As an example, payment of an administrative fine does not offer exemption from the duty to make reparations or indemnify for damages that might be caused by harmful conduct, nor does it offer exemption from possible criminal charges prompted by the event.
Civil environmental liability in Brazil is considered by case law as
propter rem
, that is, liability attaches to the real estate property. Therefore, whoever buys environmentally damaged land will succeed in the liability for the clean-up or recovery and for reparation of potential damage to third parties. Although this liability can be contractually allocated between the parties, it cannot be opposed either administratively or before third parties.
In addition, Federal Law No. 6,938/81 establishes strict liability for the recovery of environmental damages or, if not possible, compensation or indemnity for such damages, with joint and several liability established among all those directly or indirectly contributing to environmental degradation, regardless of the degree of participation in the damage. Each of those involved may be held liable for the full amount of the damages.
At the administrative level, environmental liability may be assigned through administrative sanctions imposed by the competent environmental entities, pursuant to Law No. 9,605/98 which “
rules on the criminal and administrative sanctions deriving from conduct and activities that are harmful to the environment
” and pursuant to Federal Decree No. 6,514/08. These sanctions may include, among others: (1) fines of up to R$50 million, tailored to the economic capacity and track record of the offender, in addition to the severity of the facts and past performance, with the possibility of these fines being imposed at double or triple rates for repeated offenses; (2) suspension or interdiction of the activities of the respective enterprise; and (3) withdrawal of tax incentives and benefits. Administrative liability falls on the person engaged in the conduct described as an administrative offense.
Criminal liability is personal, arising directly from the unlawful conduct of the agent, with the crimes necessarily being specifically addressed in the law. Brazilian law allows criminal liability to be assigned to individual persons as well as corporate entities. When liability is assigned to the latter, the individual persons taking the decision that resulted in the criminal conduct (such as directors, officers, administrators, board members, members of technical entities, auditors, managers, agents or representatives) may also be penalized to the extent of their culpability. Moreover, Brazilian environmental legislation determines that the corporate veil may be pierced
whenever the veil is considered to be an obstacle to recovery for environmental damages. Consequently, the controlling legal entity can be found liable despite a limited liability legal status.
Although administrative and/or criminal liability require a direct connection with the action or omission that resulted in breach of environmental legislation or environmental damage, financial penalties may be imposed may pierce the corporate veil under the disregard of legal entity doctrine. Article 4 of Federal Law No. 9,605/1998 expressly provides for the possibility of piercing the corporate veil if necessary for the recovery or compensation of environmental damages.
C. Organizational Structure
The following chart shows our organizational structure for our principal subsidiaries, all of them incorporated in Brazil, as of December 31, 2012:

For more information on our remaining subsidiaries and jointly-controlled entities, see “Item 4. Information on the Company—B. Business Overview—Subsidiaries.” A list of our significant subsidiaries as determined in accordance with Rule 1-02(w) of Regulation S-X is being filed as Exhibit 8.1 to this annual report.
D. Property and Equipment
We lease our headquarters located at Av. Nações Unidas No. 8,501, 19th floor, São Paulo, SP — Brazil. We also lease our branch office located at Avenida das Nações Unidas, 12.495, 9th and 10th floors, in São Paulo, SP — Brazil. Currently, we and our main subsidiaries leased approximately 16,385 square meters. We believe our current facilities are adequate for the full development of our operations.
As of December 31, 2012, our property and equipment recorded on our balance sheet mainly consisted of sales stands, facilities, model apartments, computer equipment, vehicles and leasehold improvements, among others, the balance of which was R$46,7 million.
None.
A. Operating Results
In 2010, we retrospectively applied new Brazilian GAAP accounting pronouncements (new CPCs) as from January 1, 2009. All periods presented from January 1, 2009 reflect such new accounting practices. The financial statements for the years ended December 31, 2012, 2011, 2010 and 2009 were prepared in accordance with the accounting practices adopted in Brazil, which comprise the rules of the Brazilian Securities Commission (CVM), and the standards, interpretations and guidelines of the Accounting Standards Pronouncements Committee (CPC), and are in compliance with the International Financial Reporting Standards (IFRS) adopted in Brazil, including the Guideline OCPC 04—Application of the Technical Interpretation ICPC 02 to the Brazilian Real Estate Development Entities—regarding the revenue recognition, and the respective costs and expenses arising from real estate development operations over the construction progress (percentage of completion method). The new Brazilian GAAP applied by us is not in compliance with IFRS as issued by IASB.
In 2008, we retrospectively applied changes to Brazilian GAAP introduced by the CPC and the provisions of Brazilian Law No. 11,638/07 as from January 1, 2006. All periods presented from January 1, 2007 to December 31, 2008 have been prepared to reflect such accounting practices.
Following the acquisition, formation and incorporation of the entities Alphaville, FIT and Bairro Novo in 2007 and following the merger of FIT into Tenda in 2008, our financial results for 2007 and 2008 included the results of the following segments: Gafisa S.A., Alphaville, Tenda, FIT (merged with Tenda in October 2008) and Bairro Novo. Further, following Gafisa’s withdrawal from Bairro Novo and the exchange of all the remaining Tenda shares not held by Gafisa into Gafisa shares, our financial results for 2012, 2011, 2010 and 2009 included the results of the following segments” Gafisa S.A., Alphaville and Tenda. See “Item 4. Information on the Company—A. History and Development of the Company—Historical Background and Recent Developments.” Our chief executive officer, who is responsible for allocating resources among these businesses and monitoring their progress, uses economic present value data, which is derived from a combination of historical operating results and forecasted operating results, to assess segment information primarily on the basis of different business segments.
Overview
We generate our revenues mainly from the development and sale of real estate developments. We recognize revenues from the sale of real estate developments over the course of their construction periods, based on a financial measure of completion and not at the time that the sales agreements are executed. To a lesser extent, we also generate revenues from real estate services such as construction, technical and real estate management we render to third parties. We structure some of our projects through either our subsidiaries or jointly-controlled entities organized as special purpose vehicles.
Brazilian Economic Environment
Our business and results of operations are significantly affected by changes in the Brazilian economic environment, including changes in employment levels, population growth, consumer confidence, stability of income levels and availability of financing for land home site acquisitions.
The recent crisis in 2008 in the United States mortgage market affected credit markets, which had a negative impact on emerging markets and on stock exchanges throughout the world. During this period, average inflation according to the INPC consumer price index measured by the IBGE, or “INPC,” was 5.9%. The SELIC rate closed the 2008 year at the rate of 11.8%. The
real
depreciated 24.2% in relation to the dollar, reaching R$2.34 per US$1.00 as of December 31, 2008.
In 2009, the Central Bank began gradually reducing the SELIC rate, which attained 9.05% as of December 31, 2009. During this period, average inflation according to the INPC was 3.92%. The
real
appreciated 34.2% in relation to the dollar, reaching R$1.74 per US$1.00 as of December 31, 2009.
In 2010, the Central Bank increased the basic interest rate, which attained 10.75% as of December 31, 2010. During this period, average inflation according to the INPC was 6.46%. In 2010, the
real
appreciated by 4.3% against the U.S. dollar. On December 31, 2010, the period-end
real
/U.S. dollar exchange rate was R$1.666 per US$1.00.
At the end of 2010 and in the beginning of 2011, the Central Bank began implementing more restrictive monetary policies as a precaution against unsustainable economic growth. In the second half of 2011, with growing uncertainty in economic conditions, due in part to ongoing volatility in global financial markets, particularly in Europe, the Central Bank began to implement an easing process. As of December 31, 2011, the Central Bank had set the basic interest rate at 11% and the
real
depreciated by 12.6% relative to the U.S. dollar in 2011. As of December 31, 2011, the
real
/U.S. dollar exchange rate was R$1.87 per US1.00. During this period, inflation according to the INPC was 6.50%.
By the second half of 2011, the Brazilian economy faced growing uncertainty and economic conditions began to deteriorate, due in part to ongoing volatility in global financial markets, particularly in Europe. In order to avoid a contraction in economic growth, the Central Bank began to implement easing measures combining macroprudential policies and interest rate decreases in order to stimulate demand.
As of December 31, 2012, the Central Bank had set the basic interest rate (SELIC) at 7.25%, a historical low. As a result, the
Real
depreciated 9.9% relative to the U.S. dollar in 2012. As of December 31, 2012, the
real
/U.S. dollar exchange rate was R$2.05 per US1.00. During this period, inflation according to the IPCA was 5.1%.
The table below shows the actual growth of the Brazilian GDP, inflation, interest rates and dollar exchange rates for the periods indicated:
|
Year ended December 31,
|
||||||||||||
|
2012
|
2011
|
2010
|
||||||||||
|
(%, unless otherwise stated)
|
||||||||||||
|
Real growth in GDP
|
0.9 | 3.7 | 7.5 | |||||||||
|
Inflation rate (INPC)(1)
|
5.1 | 6.5 | 6.5 | |||||||||
|
Inflation rate (IGP—M)(2)
|
7.8 | 5.1 | 11.3 | |||||||||
|
National Construction Cost Index (INCC)(3)
|
7.1 | 7.3 | 7.8 | |||||||||
|
TJLP rate(4)
|
5.5 | 6.0 | 6.0 | |||||||||
|
CDI rate(5)
|
8.4 | 11.6 | 10.8 | |||||||||
|
Appreciation (devaluation) of the
real
vs. US$
|
9.9 | 12.6 | 4.3 | |||||||||
|
Exchange rate (closing) — US$1.00
|
R$ | 2.05 | R$ | 1.87 | R$ | 1.66 | ||||||
|
Exchange rate (average)(6) — US$1.00
|
R$ | 1.96 | R$ | 1.84 | R$ | 1.76 | ||||||
|
(1)
|
INPC: consumer price index measured by the IBGE.
|
|
(2)
|
General Market Price Index (
Índice Geral de Preços-Mercado
) measured by the FGV.
|
|
(3)
|
National Index of Construction Cost (
Índice Nacional de Custo da Construção
) measured by the FGV.
|
|
(4)
|
Represents the interest rate used by BNDES for long-term financing (end of period).
|
|
(5)
|
Represents an average of interbank overnight rates in Brazil (accumulated for period-end month, annualized).
|
|
(6)
|
Average exchange rate for the last day of each month in the period indicated.
|
Brazilian Real Estate Sector
The Brazilian real estate sector is characterized by cyclical performance influenced by various macroeconomic factors. Demand for housing, the availability of financing and growth in population and incomes are, among others, factors that influence the performance of the real estate market.
Since 1994, Brazil’s ability to control inflation has contributed to the country’s economic recovery (particularly at the lower income level) and allowed Brazil to assert itself more effectively into the global economic context. For example, during the second half of the 1990s, policies that promoted economic liberalization and privatization of public services facilitated a significant influx of foreign investment. This environment generated pressure among the Brazilian financial and business communities to encourage responsible and transparent public management, promoting economic stability. In general, the current and previous presidential administrations have adopted comparatively austere economic policies, characterized by increased independence of the Central Bank, transparency and control over public accounts. Another significant effect of Brazil’s heightened international profile and economic stability was an increase in the competitiveness of various economic sectors, with a notable
improvement in standards of corporate administration and governance. This pattern, along with favorable conditions in the global economy, has contributed to improved economic indicators in Brazil.
In addition, since 2006, the Brazilian government has enacted incentives in the real estate sector, including the following:
|
|
·
|
Provisional Measure No. 321 enacted on September 12, 2006, later converted into Law No. 11,434 enacted on December 28, 2006 and amended by Law No. 12599 enacted on March 23, 2012, gave banks the option to charge fixed interest rates on mortgages;
|
|
|
·
|
Law No. 10,820 enacted on December 17, 2003, amended by Law No. 10,953 enacted on September 27, 2004, regulated by Decree No. 5,892 enacted on September 12, 2006, as amended by Decree No. 4,840 enacted on September 17, 2003, allowed payroll deductible mortgage loans to employees of both public and private entities;
|
|
|
·
|
Decree No. 6,006 enacted on December 28, 2006, replaced by Decree No. 7,660 enacted on December 23, 2011, implemented a 50% tax cut on Tax on Manufactured Products (
Imposto sobre Produtos Industrializados
), or IPI, levied on the acquisition of important construction products, including certain types of tubes, ceilings, walls, doors, toilets and other materials. In 2009, other decrees eliminated the IPI levied on the acquisition of similar products, but were implemented for a limited term only and were set to expire in March 2010, but were extended until December 31, 2012;
|
|
|
·
|
Provisional Measure No. 459 enacted on March 25, 2009, converted into Law No. 11,977 enacted on July 7, 2009, amended by Law No. 12,249 enacted on June 11, 2010, Law No. 12,424 enacted on June 16, 2011 and Law No. 12,693 enacted on July 24, 2012 created a public housing program called “
Minha Casa, Minha Vida
,” which calls for government investment of more than R$30 billion and is focused on building one million houses for families with monthly incomes of up to ten times the minimum wage. Under this program, the government is authorized to finance families purchasing houses with assessed values between R$80,000 and R$170,000; and
|
|
|
·
|
Provisional Measure No. 514 enacted on December 1, 2010, converted into Law No. 12,424 enacted on June 16, 2011 confirmed the extension of “
Minha Casa, Minha Vida
” through 2014, and a total investment of R$72 billion, more than doubled the R$34 billion allocated to the initial program. The goal of the second phase of the “
Minha Casa, Minha Vida
” program is to deliver two million homes in four years encompassing an even lower income segment than previously targeted, but also expanded the current resources available to 40% of the total new amount to be destined to the lower-income segments.
|
Critical Accounting Policies and Estimates
The preparation of financial statements in accordance with Brazilian GAAP requires management to make judgments, estimates and adopts assumptions that affect the reported amounts of revenue, expenses, assets and liabilities, as well as the disclosure of contingent liabilities, at the balance sheet date. Assets and liabilities subject to estimates and assumptions include the useful life of property plant and equipment, impairment of assets, deferred tax assets, provision for uncertainty tax positions, labor and civil risks, and the measurement of the estimated cost of ventures and financial instruments. Estimates are used for, among other things, impairment of non-financial assets, transactions with share-based payment, provisions for tax, labor and civil risks, fair value of financial instruments, estimated costs of ventures and other similar charges. Although we believe that our judgments and estimates are based on reasonable assumptions that are subject to several risks and uncertainties and are made in light of information available to us, our actual results may differ from these judgments and estimates.
In this sense, we set forth below summarized information related to our critical accounting policies. See the note 2.2 to our financial statements, included elsewhere in this annual report for further information on these and other accounting policies we adopt.
Impairment of non-financial assets
We annually review the carrying amount of assets with the objective of evaluating events or changes in the economic, operational or technological circumstances that may indicate a decrease or loss of its recoverable amount.
Should such evidences exist, and the carrying amount exceeds the recoverable amount, a provision for impairment loss is recognized in the income statement by adjusting the carrying amount to the recoverable amount. A test for impairment of intangible assets with indefinite useful lives and goodwill is performed at least annually or when circumstances indicate a decrease in the carrying amount. At December 31, 2012 and 2011, the Company recorded a provision for impairment for land and goodwill related to the Cipesa acquisition.
The recoverable amount of an asset or of a certain cash-generating unit is defined as the highest between its value in use and its fair value less costs to sell. When estimating the value in use of an asset, the estimated future cash flows are discounted to present value using a discount rate before taxes that reflects the weighted average cost of capital for the industry in which the cash-generating unit operates. Cash flows are derived from the budget for the following five years, and do not include restructuring activities for which the Company has not yet committed or future significant investments that will improve the asset basis of the cash-generating unit being tested. The recoverable amount is sensitive to the discount rate adopted under the discounted cash flow method, as well as the estimated future cash inflows and to the growth rate used. The fair value less costs to sell is determined, whenever possible, based on a binding sale agreement in an arm’s length transaction between the knowledgeable and willing parties, adjusted by expenses attributable to the sale of the asset, or, in the absence of a binding sale agreement, based on the market price in an active market, or on a recent transaction with similar assets.
The main assumptions used in the estimate of value in use are the following: Revenue – revenues were projected between 2013 and 2017 considering the growth in sales and client base of the different cash-generating units. Operating costs and expenses – costs and expenses were projected in line with the Company’s historical performance, as well as the historical growth of revenues. The key assumptions were based on the Company’s historical performance and on reasonable macroeconomic assumptions, and supported by the financial market projections, documented and approved by the Company’s management. In the year ended December 31, 2012, the Company recorded a provision for the non-realization of the investment (Company)/ goodwill (consolidated) in the amount of R$11.7 million (R$10.4 million in 2011), totaling R$22.1 million on Cipesa goodwill. For the years ended December 31, 2010 and 2009, the estimated market value is in excess of the net book value on the assessment date.
Properties for sale
Our properties for sale are stated at construction cost, which cannot exceed its net realizable value. In the case of real estate developments in progress, the portion in inventory corresponds to the cost incurred for units that have not yet been sold.
The cost of properties for sale includes expenditures incurred in the acquisition of the land and in construction (including foundation, structure, finishing and the respective costs of construction materials), costs of own and outsourced labor, and financial costs directly related to the ventures.
Land is recorded at acquisition cost. See “Item 4. Information on the Company—B. Business Overview—Our Operations—Land Acquisition”. Land can be acquired in cash, in installments, bartered for units that are completed or in construction of other ventures, or bartered for receivables from future sales of ventures. The cost of land related to bartered units is formed by the estimated sale price in cash, this fair value being recorded as contra-entry to the advances from customers-barter.
The interests of loans and financing directly related to ventures financed by the National Housing System (SFH) and other credit facilities which funds are used to finance the construction and acquisition of land are capitalized over the development and construction stage, and appropriated to statement of operations in the proportion to the units sold.
We adopt the policy of annually conducting tests on the units in construction and completed units, comparing the unit construction cost with the sale value of units in inventory. The assumptions that usually underlie the calculation of the recoverable value of assets are based on expected cash flows, economic viability studies of real estate ventures that show the recoverability of assets or its market value, all discounted to present value.
The classification of land into current or non-current assets is carried out by the Management based on the schedule of the real estate venture launches. Management periodically reviews the estimates of real estate venture launches.
We have evaluated all of our developments for impairment and have not identified any cases of impairment for any of our properties for sale and no impairment provisions have been recorded for any of our developments for the years ended December 31, 2010 and 2009. In accordance with our internal policy, each individual project launched has been internally evaluated taking into consideration the following: (1) assumptions for market, sales forecast, economics and operation conditions; (2) cash flow analysis using the discounted cash flow method; (3) approval by an investment committee; and (4) inclusion in the business plan regarding the timetable and backlog for development releases. This process is part of our corporate governance practices. We update the assumptions on an annual basis and consider the continuing viability for each project for impairment test purposes. During 2011, we made a decision to sell a portion of our landbank given our narrowed geographic focus and our evaluation of impairment resulted in recording a provision for impairment on landbank and properties for sale in the amount of R$92.1 million. As of December 2012, we had R$54.4 million recorded as a provision for impairment on landbank and properties for sale.
Transactions with share-based payment
We measure the cost of transactions with employees to be settled with shares based on the fair value of equity instruments on the grant date. The estimate of the fair value of share-based payments requires the determination of the most adequate pricing model to grant equity instruments, which depends on the grant terms and conditions. It also requires the determination of the most adequate data for the pricing model, including the expected option life, volatility and dividend income, and the corresponding assumptions.
Provisions for legal claims
We recognize a provision for tax, labor and civil claims. The assessment of the probability of a loss includes the evaluation of the available evidences, the hierarchy of Laws, existing case laws, the latest court decisions and their significance in the judicial system, as well as the opinion of external legal counsel. The provisions are reviewed and adjusted to take into account the changes in circumstances, such as the applicable expiration term, findings of tax inspections, or additional exposures found based on new court issues or decisions. The settlement of transactions involving these estimates may result in amounts different from those estimated in view of the inaccuracies inherent in the process for estimating them. The Company reviews its estimates and assumptions at least annually.
Taxes on income
Current income tax and social contribution
Current income tax is the expected tax payable or receivable/to be offset in relation to taxable profit or loss for the year. To calculate the current income tax and social contribution on income, we adopt the Brazilian Transition Tax Regime (RTT), which permits for exclusion of the effect from the changes, to Brazilian accounting standards introduced by Laws No. 16,638/2007 and No. 11,941/2009, from the tax basis of such taxes.
Taxes on income in Brazil comprise income tax (25%) and social contribution (9%), for entities on the standard profit regime, for which the composite statutory rate is 34%. Deferred taxes for these entities are provided on all temporary tax differences at the balance sheet date between the tax bases of assets and liabilities, and their carrying amounts.
As permitted by tax legislation, certain subsidiaries opted for the presumed profit regime, a method under which taxable profit is calculated as a percentage of gross sales. For these companies, income tax is calculated on presumed profits of 8% of gross revenues and social contribution on presumed profits of 12% on gross revenues.
As permitted by tax legislation, the development of certain ventures are subject to the “
afetação
” regime, based on which the land and its features where a real estate will be developed, as well as other binding assets and rights, are separated from the assets of the developer and comprise the “
patrimônio de afetação
” (detached assets) of the corresponding development and which real estate units will be delivered to the buyers. In addition, certain subsidiaries made the irrevocable option for the Special Taxation Regime (RET), adopting the “patrimônio de afetação”, according to which the income and social contribution taxes are calculated at 3.34% on gross revenues (6%, also levying PIS and COFINS on revenues).
Deferred income tax and social contribution
Deferred tax is recognized in relation to tax losses and temporary differences between the carrying amount of assets and liabilities for accounting purposes and the corresponding amounts used for tax purposes. It is recognized to the extent that it is probable that future taxable income will be available to be used to offset deferred tax assets, based on profit projections made with using internal assumptions and considering future economic scenarios that estimate their full or partial use. The recognized amounts are periodically reviewed and the impacts of realization or settlement are reflected in compliance with tax legislation provisions. Tax credits on accumulated tax losses do not have an expiration date, however, they can only be offset against up to 30% of the taxable profit for each year. Companies that opt for the presumed profit tax regime do not record tax losses and do not have temporary differences, and for this reason, deferred taxes are not recognized.
To the extent that the realization of deferred tax assets is not considered to be probable, this amount is not recorded. We record deferred tax on a net basis, determined by a legal entity and same jurisdiction. For entities with cumulative tax losses for the last three years, the Company and its subsidiaries recognized deferred tax assets and liabilities based on the following assumptions:
|
|
·
|
100% of deferred tax liabilities on temporary differences;
|
|
|
·
|
Deferred tax assets on temporary differences that have realization terms similar to deferred tax liabilities, and relate to the same legal entity, are recorded up to the limit of the deferred tax liabilities; and
|
|
|
·
|
In situations where recent losses indicate that future taxable income is uncertain, deferred tax assets are not recognized on deductible temporary differences in excess of deferred tax liabilities recorded on taxable temporary difference liabilities no is an asset recognized for the carry forward of unused tax losses.
|
Provision for non recognition of the deferred tax asset balance
Our projections assume that a significant portion of its business will be conducted in its principal holding companies, and this enables the recovery of a substantial portion of it is accumulated tax losses.
However, several external factors, beyond our control, may affect such tax calculations, in addition to possible requirements to segregate ventures in their own development entities (SPEs, for example) to a greater extent than we intend. There is also the possibility of taxation rulings, relating to new or even ventures that have already been developed within the principal holding companies, which may require the exclusion of such businesses, which would then make their own tax filing, separated from that of the Company.
A reduction in the concentration of projects in holding companies with tax losses carried forward may, therefore, compromise the expected recovery of losses carried forward, which is the reason we did not recognize a portion of deferred income tax asset.
Fair value of financial instruments
When the fair value of the financial assets and liabilities presented in the balance sheet cannot be obtained in the active market, it is determined using valuation techniques, including the discounted cash flow method. The data for such methods is based on those practiced in the market, when possible; however, when it is not viable, a certain level of judgment is required to establish the fair value. The judgment includes considerations on the data used, such as liquidity risk, credit risk, and volatility. Changes in the assumptions about these factors may affect the presented fair value of financial instruments.
Estimated cost of construction
Total estimated costs, mainly comprising the incurred and future costs for completing the construction works, were reviewed in the preparation of these financial statements, and changes to estimates are possible.
Development and sale of real estate
Real estate development and sales
Revenues, as well as costs and expenses directly relating to real estate development units sold and not yet finished, are allocated to the income statement over the construction period and the following procedures are adopted:
(a) For the sales of completed units, revenues are recorded when the sale is completed and the transfer of significant risks and benefits has occurred, regardless of the receipt from the customer of the contracted amount;
(b) For the sales of units under construction, the following applies:
|
|
·
|
The incurred cost, including the cost of land, and other directly related expenditure, that correspond to the units sold is fully recorded into the consolidated statement of operations;
|
|
|
·
|
Incurred costs of units sold (including land) is measured as a percentage of total estimated cost, and this percentage is applied to the total revenues of the units sold, adjusted in accordance with the terms established in the sales contracts, thus determining the amount of revenues to be recognized in direct proportion to cost;
|
|
|
·
|
Any amount of revenue recognized that exceeds the amount actually received from customers is recorded as either a current or non-current asset in the account “Trade accounts receivable”. Any amount received in connection with the sales of units that exceeds the amount of revenues recognized is recorded as “Payables for purchase of land and advances from customers;”
|
|
|
·
|
Interest and inflation-indexation charges on accounts receivable as from the time the units are delivered, as well as the adjustment to present value of account receivable, are appropriated to the income statement on a pro rata basis using the accruals basis of accounting;
|
|
|
·
|
The financial charges on account payable for acquisition of land and those directly associated with the financing of construction are recorded in properties for sale and recorded in the incurred cost of finished units until their completion, and follow the same recognition criteria as for the recognition of the cost of real estate units sold while under construction.
|
|
|
·
|
The taxes due on the difference between real estate revenues recognized for accounting purposes and those revenues subject to tax are calculated and recognized when the difference in revenues is recognized.
|
|
|
·
|
Advertising and publicity expenses are recorded in the consolidated income statement as accrual basis.
|
Construction services
Revenues from real estate services are recognized as services are rendered and consist primarily of amounts received in connection with construction management activities for third parties, and technical advisory services.
Barter transactions
Barter transactions have the objective of receiving land from third parties that are settled with the delivery of apartments. The value of land acquired by the Company is calculated based on the fair value of real estate units to be delivered. The fair value of the land is recorded as a component of inventories of properties for sale against advances from customers, at the time the income from the respective venture is initially recognized. Revenues and costs incurred from barter transactions are appropriated to the income statements over the course of construction period of the projects, as described in item (b).
ICPC 02 – Paragraphs 20 and 21
In compliance with the aforementioned ICPC requirements, the amounts of recognized revenues and incurred costs are presented in the statements of income (loss), and the advances received in the account “payables for purchase of land and advances from customers”.
Allowance for doubtful accounts and cancelled contracts
We annually review its assumptions to set up an allowance for doubtful account and cancelled contracts, in view of the review of the histories of its current operations and improvement of estimates.
We record an allowance for doubtful accounts and cancelled contracts for customer whose installments are over 90 days past due, in several types of construction work: construction works on time, construction works delayed (within the grace period), works that are late (out of the grace period) and for delivered completed units. This allowance is calculated based on the percentage of the construction work completion, a methodology adopted for recognizing income for the year.
Launches and Contracted Sales
Launches
The table below presents detailed information on our launches for the periods presented, including developments launched by our jointly-controlled entities in partnership with third parties:
|
As of and for the year ended December 31,
|
||||||||||||
|
2012
|
2011
|
2010
|
||||||||||
|
Launches (in millions of
reais
)
|
2,952 | 3,526 | 4,491 | |||||||||
|
Number of projects launched
|
35 | 49 | 127 | |||||||||
|
Number of units launched(1)
|
8.947 | 12,223 | 22,233 | |||||||||
|
Launched usable area (m2)(2)(3)
|
3,153,251 | 2,250,725 | 3,029,748 | |||||||||
|
Percentage of Gafisa investment
|
79 | % | 84 | % | 81 | % | ||||||
|
(1)
|
The units delivered in exchange for land pursuant to swap agreements are not included.
|
|
(2)
|
One square meter is equal to approximately 10.76 square feet.
|
|
(3)
|
Does not include Terreno Cajamar Alphaville (aprox. 5,420,927m²).
|
In 2012, we launched 35 residential developments with a total potential sales value of R$3.0 billion, with Gafisa accounting for 54% of launches and Alphaville the remaining 46% in terms of potential sales values (compared to a 28% share in 2011). This sales value was approximately 21% lower than that achieved in 2011, during which we launched 49 residential developments totaling R$3.5 billion. We refocused our business operations in 2012 to prioritize cash flow and reduction of net debt reduction, restructuring the debt profile and reducing launches of new units, while still generating what we consider to be an appropriate volume of business of R$3.0 billion. 17 of the 35 developments we launched in 2012 were located in the state of São Paulo, while another three developments were located in the state of Rio de Janeiro. The remaining 15 residential developments launched were located in the cities of Juiz de Fora, in the state of Minas Gerais, Aracaju, in the state of Sergipe, Anapolis, in the state of Goiás, Mossoró, in the state of Rio Grande do Norte, Vespasiando, in the state of Minas Gerais, Brasília, in the state of Distrito Federal, Barra dos Coqueiros, in the state of Sergipe, Teresina, in the state of Piaui, Pelotas, in the state of Rio Grande do Sul, Porto Velho, in the state of Roraima, Vitória da Conquista, in the state of Bahia, Resende, Campo Grande, in the state of Mato Grosso do Sul and Camaçari, in the state of Bahia.
During 2012, approximately 37.8% of our total sales value was generated from launches outside the states of São Paulo and Rio de Janeiro. The affordable entry-level business accounted for approximately 3% of our total sales value for the year ended December 31, 2012. In the year ended December 31, 2011, the affordable entry-level business represented approximately 10% of our total sales value.
In 2011, sales value was approximately 21.5% lower than that achieved in 2010, during which we launched 127 residential developments totaling R$4.5 billion. This decrease is a reflection of deliberate slowdown in Tenda launches as part of a more conservative growth strategy.
21 of the 49 developments we launched during 2011 were located in the state of São Paulo, while another 9 developments were located in the state of Rio de Janeiro. The remaining 19 residential developments launched were located in the cities of Feira de Santana, state of Bahia, Salvador, state of Bahia, São Luiz, state of Maranhão, Natal,
state of Rio Grande do Norte, Duas Una, state of Pernambuco, Petrolina, state of Pernambuco, Campo Grande, state of Mato Grosso do Sul, Campina Grande, state of Paraíba, Manaus, state of Amazonas, Paço do Lumiar, state of Maranhão, Belo Horizonte, state of Minas Gerais, Curitiba, state of Paraná, Santa Luzia, state of Minas Gerais, Canoas, state of Rio Grande do Sul, Goiânia, state of Goiás, Vespaziano, state of Minas Gerais.
During 2011, approximately 26% of our total sales value was generated from launches outside the states of São Paulo and Rio de Janeiro. The affordable entry-level business accounted for approximately 10% of our total sales value for the year ended December 31, 2011. In the year ended December 31, 2010, the affordable entry-level business represented approximately 36% of our total sales value.
Full-year Tenda launches in 2011 totaled R$398 million, a 75% reduction compared to 2010, and included 17 projects/phases across 8 states and the cancellation in the fourth quarter of 2011 of R$103 million of projects no longer feasible under the Company’s new criteria adopted in the third quarter of 2011. No more than 30% of these projects had been completed. This more conservative approach to Tenda’s operations led to full-year sales of R$330 million, a 77% reduction compared to 2010, in line with the reduced volume of launches. In 2012, we suspended the launch of additional Tenda units but expect to resume launches in the first half of 2013.
In 2010, sales value was approximately 95% higher than that achieved in 2009, during which we launched residential developments totaling R$2.3 billion. This increase is a reflection of the great demand during 2010.
44 of the 127 developments we launched during 2010 were located in the state of São Paulo, while another 17 developments were located in the state of Rio de Janeiro. The remaining 66 residential developments launched were located in the cities of Maceió, state of Alagoas, São Luiz, state of Maranhão, Porto Alegre, state of Rio Grande do Sul, Curitiba, state of Paraná, Aracaju, state of Sergipe, Goiânia, state of Goiás, Belém, state of Pará, Natal, state of Rio Grande do Norte, Vitória, state of Espírito Santo, Teresina, state of Piauí, Lauro de Freitas, state of Bahia, Belo Horizonte, state of Minas Gerais.
During 2010, approximately 44% of our total sales value was generated from launches outside the states of São Paulo and Rio de Janeiro. Our diversification into the affordable entry-level business accounted for approximately 36% of our total sales value for the year ended December 31, 2010. In the year ended December 31, 2009, the affordable entry-level business represented approximately 42% of our total sales value.
Contracted sales
The following table shows the development of our contracted sales by the type of development, according to units sold during the same year that they were launched and the units sold in the years after they were launched, as well as their respective percentages in relation to total sales for the periods presented:
|
For the year ended December 31,
|
||||||||||||
|
2012
|
2011
|
2010
|
||||||||||
|
(in millions of R$, unless otherwise stated)
|
||||||||||||
|
Type of development
|
||||||||||||
|
Luxury buildings
|
R$ | 753.6 | R$ | 706.4 | R$ | 534.6 | ||||||
|
Middle-income buildings
|
633.3 | 784.0 | 1,439.7 | |||||||||
|
Affordable entry-level housing (2)
|
(74.3 | ) | 330.2 | 1,433.1 | ||||||||
|
Commercial
|
173.7 | 657.0 | — | |||||||||
|
Land(1)
|
1,146.8 | 874.7 | 599.0 | |||||||||
|
Total contracted sales
|
R$ | 2,633.1 | R$ | 3,352.3 | R$ | 4,006.4 | ||||||
|
Sale of units launched in the year
|
R$ | 1,723.9 | R$ | 2,210.2 | R$ | 2,676.3 | ||||||
|
Percentage of total contracted sales
|
65 | % | 66 | % | 67 | % | ||||||
|
Sale of units launched during prior years
|
R$ | 909.2 | R$ | 1,142.1 | R$ | 1,334.3 | ||||||
|
Percentage of total contracted sales
|
35 | % | 34 | % | 33 | % | ||||||
|
(1)
|
Includes Gafisa’s participation on the Alphaville Barra da Tijuca project.
|
|
(2)
|
Amount net of sales cancellation.
|
The following table shows our and our main subsidiaries, contracted sales for the periods presented:
|
For the year ended December 31,
|
||||||||||||
|
2012
|
2011
|
2010
|
||||||||||
|
(in millions of R$, unless otherwise stated)
|
||||||||||||
|
Company
|
||||||||||||
|
Gafisa
|
R$ | 1,599.5 | R$ | 2,180.1 | R$ | 1,974.3 | ||||||
|
Tenda (1)
|
(74.3 | ) | 330.2 | 1,433.1 | ||||||||
|
Alphaville
|
1,107.9 | 842.0 | 598.9 | |||||||||
|
Total contracted sales
|
R$ | 2,633.1 | R$ | 3,352.3 | R$ | 4,006.4 | ||||||
|
(1)
|
Amount net of sales cancellation.
|
In 2012, we sold 59% of the units launched during that year, which together with the sales of units launched during prior periods, resulted in total contracted sales of R$2,633.1 million, an decrease of approximately 21% compared to 2011. In 2011, we sold 66% of the units launched during that year, which together with the sales of units launched during prior periods, resulted in total contracted sales of R$3,352.3 million, a decrease of approximately 16% compared to 2010. In 2010, we sold 67% of the units launched during that year, which together with the sales of units launched during prior periods, resulted in total contracted sales of R$4,006.4 million. As a result of our corrective measures taken with respect to Tenda and due to a focus on execution and delivery, no projects were launched during 2012. The decrease in 2012 is a result, among other things, of a reduction of operations for Tenda to allow us to stabilize our control over the financial, operational and construction cycle.
Our sales contracts are irrevocable under Brazilian law, which means a customer does not have a unilateral ability to terminate a contract once it is executed, nor does the customer have an ability to require a refund of amounts previously unpaid unless we agree. To the extent that a customer is not in compliance with its obligations under a contract, we have the option to either force compliance through the Brazilian courts, or agree to “default” by the customer. Should we agree to such default, the customer is then charged penalties as defined in the contracts with any remaining amounts remitted to the customer. Penalties charged by Tenda have historically been 20% of amounts paid, while penalties charged by Gafisa have historically been significantly higher (average about 60-65% of amounts paid).
We provide a limited amount of post-construction client financing, although this financing is not available to Tenda clients. Our default rate was 9.3%, 4.1% and 5.3% as of December 31, 2012, 2011 and 2010, respectively, which represents charge-offs for both these financings and also the remainder of our percentage of completion receivables.
The table below shows the penalties charged to customers that have defaulted and had their contracts cancelled for the periods presented:
|
As of and for the year ended December 31,
|
||||||||||||
|
2012
|
2011
|
2010
|
||||||||||
|
(in millions of R$)
|
||||||||||||
|
Gafisa
|
R$ | 9.3 | R$ | 4.7 | R$ | 6.7 | ||||||
|
Tenda
|
10.5 | 11.0 | 23.4 | |||||||||
|
Alphaville
|
5.3 | 1.7 | 0.6 | |||||||||
The following table sets forth the growth of our contracted sales to be recognized, as well as the amount corresponding to the cost of units sold, and the expected margin, all of them to be recognized in future periods, for the periods presented:
|
As of and for the year ended December 31,
|
||||||||||||
|
2012
|
2011
|
2010
|
||||||||||
|
(in millions of R$, unless otherwise stated)
|
||||||||||||
|
Sales to be recognized—end of the year
|
R$ | 4,039.0 | R$ | 4,686.2 | R$ | 4,112.7 | ||||||
|
Net sales(1)
|
3,891.6 | 4,515.1 | 3,962.6 | |||||||||
|
Cost of units sold to be recognized(2)
|
(2,373.6 | ) | (2,956.3 | ) | (2,423.6 | ) | ||||||
|
Expected gross margin—yet to be recognized(3)
|
R$ | 1,517.9 | R$ | 1,558.8 | R$ | 1,538.8 | ||||||
|
Expected margin percentage
|
39.0 | % | 34.5 | % | 38.9 | % | ||||||
|
(1)
|
Excludes indirect PIS and COFINS taxes of 3.65%. This information includes ventures that are subject to restriction due to a suspensive clause, the legal period of 180 days in which the Company can cancel a development
|
|
(2)
|
The estimated gross profit shown does not consider the tax effects or the present value adjustment, and the costs of lands, financial charges and guarantees, which will be carried out as at the extent they are realized.
|
|
(3)
|
Based on management’s estimates.
|
Gross Operating Revenues
Our revenues are derived mainly from the development and sale of real estate and, to a lesser extent, the rendering of construction services to third parties.
Real estate development and sales
Real estate development revenues, including inflation adjustments and interest from credit sales, make up revenues from the sales of units in the residential buildings we develop, and to a lesser extent, the sales of lots and commercial buildings.
Construction services rendered
Our revenues generated by real estate services consist substantially of amounts received in connection with construction management activities for third parties, technical management and real estate management.
Operating Costs
Our operating costs consist of real estate development costs and, to a lesser extent, costs of services rendered.
Real estate development costs
Real estate development costs consist of costs of land, construction (which includes costs for a broad variety of raw materials and labor), capitalized interest (financial costs) from project specific financing, projects, foundations, structuring and furnishing, as well as costs for outsourced labor. The items making up our costs, as a percentage of our total cost, were as set forth for the periods presented:
|
For the year ended December 31,
|
||||||||||||
|
2012
|
2011
|
2010
|
||||||||||
|
Land
|
15.6 | % | 9.8 | % | 12.3 | % | ||||||
|
Construction costs
|
73.3 | % | 80.4 | % | 79.9 | % | ||||||
|
Financial costs
|
6.2 | % | 5.6 | % | 5.3 | % | ||||||
|
Development costs
|
4.9 | % | 4.2 | % | 2.5 | % | ||||||
|
Total
|
100.0 | % | 100.0 | % | 100.0 | % | ||||||
One of our principal real estate development costs is the cost of land. Over the last five years, land represented, on average, 13% of our total cost of development. However, this is an extremely volatile component, varying according to characteristics of the land, the region where the land is located, the type of development to be launched
and market conditions. Land can be acquired for cash, through the exchange of units once the building is constructed, through a financial swaps (whereby a portion of sales is given to the owner of land as a form of financing for the land), or through a combination of the three options.
No single raw material alone represents a significant portion of our total costs of development, but over the last five fiscal years, raw materials represented, on average, 35% of our total cost of development. The index that measures construction cost variation, the INCC, increased by 7.1%, 7.5% and 7.7% in 2012, 2011 and 2010, respectively. Although some of the principal raw materials, such as steel, have experienced significant price increases well above the level of inflation over the last four years, we have reduced our raw materials costs by developing and using new construction techniques and materials.
During the last five years, labor represented, on average, 55% of our total cost of real estate development.
Over the last five years, we have incurred most of our construction costs from the 1st to the 18th month of construction of a development, as shown in the table below:
|
Period of construction
|
Percentage of costs incurred(1)
|
|||
|
1st to 6th month
|
16 | % | ||
|
7th to 12th month
|
25 | % | ||
|
13th to 18th month
|
31 | % | ||
|
19th to 24th month
|
20 | % | ||
|
25th to 30th month
|
8 | % | ||
|
(1)
|
Including cost of land.
|
Real estate services
Our costs of real estate services consist of direct and indirect labor fees and outsourced services.
Operating Expenses
Our operating expenses include selling, general and administrative expenses and depreciation and amortization expenses and revenues.
Selling expenses
Selling expenses include advertising, promotion, brokerage fees and similar expenses.
General and administrative expenses
General and administrative expenses principally include the following:
|
|
·
|
employee compensation and related expenses;
|
|
|
·
|
fees for outsourced services, such as legal, auditing, consulting and others;
|
|
|
·
|
management fees and expenses;
|
|
|
·
|
stock option plan expenses;
|
|
|
·
|
overhead corporate expenses;
|
|
|
·
|
expenses related to legal claims and commitments; and
|
|
|
·
|
legal expenses related to public notaries and commercial registers, among others.
|
Depreciation and amortization
Depreciation expenses consist of depreciation of our property and equipment. Since January 1, 2009, goodwill is no longer amortized under Brazilian GAAP.
Financial Income and Expenses
Financial income includes income from financial investments. Interest revenues are recognized at the time the effective profit accrues from the asset, based on the accrual method. Financial expenses generally consist of interest payable on loans, financings and debentures.
Taxes on Income
In general, taxes on income in Brazil consist of federal income tax (25%) and social contribution (9%); for a composite statutory tax rate of 34%. We calculate our income and social contribution taxes according to the “taxable profit” regime. Our subsidiaries and jointly-controlled entities, however, with annual billings lower than a specified amount, may calculate their respective income and social contribution taxes through either this “taxable profit” regime or through the “presumed profit” regime, depending on our tax planning. For the companies that opt for the “presumed profit” regime, the income tax basis is calculated as 8% of gross revenues and the social contribution basis is calculated as 12% of gross revenues, to which income tax and social contribution rates of 25% and 9%, respectively, are applied.
As permitted by tax legislation, the development of certain ventures are subject to the “afetação” regime, based on which the land and its features where a real estate will be developed, as well as other binding assets and rights, are separated from the assets of the developer and comprise the “patrimônio de afetação” (detached assets) of the corresponding development and which real estate units will be delivered to the buyers. In addition, certain subsidiaries made the irrevocable option for the Special Taxation Regime (RET), adopting the “patrimônio de afetação”, according to which the income and social contribution taxes are calculated at 3.34% on gross revenues (for a total of 6% considering PIS and COFINS taxes on revenues).
Results of Operations
The following discussion of our results of operations is based on our consolidated financial statements prepared in accordance with Brazilian GAAP. References to increases or decreases in any given period relate to the corresponding preceding period, except unless otherwise indicated.
Results of Operations for the Years Ended December 31, 2012 and 2011
We have made significant structural and managerial changes to position ourselves for long-term growth and improved financial performance. Following these actions, we are at a turning point in our recent history and look forward to successfully executing our strategy to enhance shareholder value. The following remedial actions have been implemented since October of 2011 in order to generate value for our shareholders: (i) established a new operating structure by brands; (ii) temporarily reduced Tenda’s operations until complete control over the financial and operational construction cycle can be achieved and adjusted Tenda’s business model for new launches to ensure certain conditions are met in each strategic market (São Paulo, Rio de Janeiro, Northeast and Minas Gerais); (iii) expanded the contribution of Alphaville’s successful developments in our product mix and; (iv) refocused the Gafisa brand on its core markets of São Paulo and Rio de Janeiro.
Our full-year financial results reflect required corrective actions, including the scaling back of our Tenda business, the dissolution of contracts with potential homeowners who no longer qualify for bank mortgages, the implementation of a tighter credit policy and a reduced geographic focus. Cost overruns, which weighed on the results of the Tenda and Gafisa segments, have been remedied by focusing on geographic regions where the Company has strong supply chains and has completed a stringent vetting of external construction partnerships.
Net operating revenue
On a consolidated basis, Net revenue for the full year 2012, recognized by the Percentage of Completion (“PoC”) method, was R$4.0 billion, a 34.4% increase from R$2.9 billion in the year ended on 2011. During 2012, the Gafisa brand accounted for 51.0% of net revenues; AlphaVille comprised 20.5% and Tenda the remaining 28.5%.
The gross revenue generated from the sale of property and barter transactions, net of the cancellation provision totaled R$4.2 billion in the year ended in 2012, an increase of R$1.0 billion or 33.9% compared with the same period in 2011 of R$3.2 billion. This increase is mainly due to the continuing recognition of revenues from sales contracted in prior periods and reversal of the cancellation provision during the year. The tax deductions from gross revenue reached R$292.0 million in the 2012 financial year, representing an increase of 27.5% from R$229.0 million, in the year ended on December 31, 2011.
Operating costs
Operating costs in 2012 totaled R$2.9 billion, an increase of 10% as compared to R$2.7 billion in 2011. Cost related to construction is the main component of operating cost (R$1.6 billion of which related to Gafisa and R$1.0 billion of which related to Tenda). Operating costs, as a percentage of net operating revenue, decreased from 91.1% in 2011 to 74.4% in 2012, mainly due to the recognition of cost overruns in 2011.
Gross profit
Gross profit in 2012 totaled R$1,012.3 million, representing an increase of 286% as compared to R$262.2 million in 2011, as a result of the cost overruns related to construction, which had a negative effect on the results of the Tenda and Gafisa segments in 2011.
In 2012, the gross margin generated from our activities increased to 25.6% as compared to 8.9% in 2011. This increase was mainly due to higher gross operating revenue as a result of increase operational volume during 2012 and the budget review deviation registered in 2011 which negatively impacted on the margin of Gafisa and Tenda.
Selling expenses
Selling expenses in 2012 totaled R$308.3 million, representing a decrease of 21.6% as compared to R$393.2 million in 2011, mainly due to the reduction in potential sales value of launched units of 16% in the period, from R$3,526.8 million in 2011 to R$2,951.0 million in 2012.
Selling expenses in 2012 represented 7.8% of our net operating revenue compared to 13.4% in 2011, reflecting a lower volume of revenues in the previous year.
General and administrative expenses
Administrative expenses reached R$346.7 million in 2012, a 37.9% increase compared to R$251.5 million in 2011, due to:
(1) a provision related to the distribution of variable compensation and expenses in connection with our stock option plans, in the amounts of R$64.0 million and R$27.6 million, respectively, in 2012, and R$17.2 million and R$19.3 million, in 2011, due to the recognition of the provision for the Company bonus for Gafisa, Tenda and Alphaville. In 2011, the provision related to the distribution of variable compensation was only recognized for the Alphaville;
(2) other expenses related to services rendered in the amount of R$40.3 million in 2012 as compared to R$16.9 million in 2011. This increase is mainly related to nonrecurring fees for auditing and consulting fees, which accounted for 24% of the change in the period.
Depreciation and amortization
Depreciation and amortization in 2012 was R$87.6 million, an increase of R$4.2 million when compared to R$83.4 million in 2011, mainly due to increased depreciation of sales kiosks in 2012.
Financial income and expenses, net
Net financial expenses totaled R$206.9 million in 2012, compared to net financial expenses of R$159.9 million in 2011, primarily as a result of a higher average loan balance (partially mitigated by the SELIC rate reduction), higher securitization-related expenses and higher bank charges and fees. Despite a stronger cash position, financial income decreased R$12.4 million, from R$93.0 million to R$80.6 million, at the end of the year, due to the reduction of the SELIC rate.
Taxes on income
Income, social contribution and deferred taxes for 2012 amounted to R$41.2 million, compared to R$142.4 million in 2011. This decrease is mainly due to a reversal of deferred tax assets in the previous period.
The provision for, or benefit from, income taxes is calculated using the asset and liability method, under which deferred tax assets and liabilities are recorded based on the difference between the financial statement and tax basis of assets and liabilities using enacted tax rates in effect for the year in which the differences are expected to reverse. Deferred tax assets are evaluated on a quarterly basis to determine if adjustments to the valuation allowance are required. The Company assesses whether a valuation allowance should be established based on the consideration of all available evidence using a “more likely than not” standard with respect to whether deferred tax assets will be realized. The ultimate realization of deferred tax assets depends primarily on the generation of future taxable income during the periods in which the differences become deductible. Judgment is required in determining the future tax consequences of events that have been recognized in the Company’s consolidated financial statements and/or tax returns.
Net income for the year attributable to noncontrolling interest
The increase in the stakes of non-controlling shareholders (minorities in subsidiaries in which we hold investments) from R$39.7 million in 2011 to R$48.1 million in 2012, an increase of 21.3% when compared to the previous year, as a result of increased net income at the Alphaville business recognized in the year, which increased from R$128.9 million in 2011 to R$157.3 million in 2012, which reflects the growth of the contribution of Alphaville’s successful developments to our product mix.
Net loss for the year attributable to owners of Gafisa
As a result of the factors above, net loss in the year ended December 31, 2012 totaled R$124.5 million compared to a net loss of R$944.9 million in 2011. Net results for 2012 was impacted by lower gross margin of Tenda and Gafisa projects coupled with the higher volume of financial expenses, higher amount of provision for legal claims in the amount of R$94.9 million as compared to R$57.9 million in 2011, both partially mitigated by Alphaville’s net income of R$157.3 million reported in the period.
Results of Operations for the Years Ended December 31, 2011 and 2010
Since mid-2011, our entire senior management team worked along with our board of directors and outside consultants in a review of our operating units and overall strategy. The results of this review led to a decision in October 2011 to: (i) establish a new operating structure by brands; (ii) reduce risks at Tenda; (iii) expand the contribution of Alphaville’s successful developments in our product mix; and (iv) refocus the Gafisa brand on its core markets of São Paulo and Rio de Janeiro. As a result, we identified important adjustments related to the strategic redirection at Gafisa and the new operating model adopted at Tenda which are reflected in the fourth quarter.
We believe that 2011 was an atypical year due to the impact of the structural changes mentioned above, the recognition of identified cost overruns, cancellations and contract dissolutions at Tenda in addition to our newly adopted sales policy and more targeted strategy.
Net operating revenue
On a consolidated basis, Net revenue for the full year 2011, recognized by the Percentage of Completion (“PoC”) method, was R$2.9 billion, a 13.6% decline from R$3.4 billion in the year ended on 2010 as a result of the revenue reversals related to the adjustments registered in the fourth quarter. During 2011, the Gafisa brand
accounted for 62% of net revenues; AlphaVille comprised 23% and Tenda the remaining 15%. However, we expect to rebook: (1) 60% of the revenue reversal with resale of returned units; and (2) 34% will be recognized in accordance with PoC of the related projects (79% launched< 2008). Only 6% of the total is unrecoverable.
Gross revenue from sales and/or services increased 21.9%, from R$24 million in the year ended on December 31, 2010 to R$30 million in the year ended on December 31, 2011. The gross revenue generated from the sale of property and barter transactions, net of the cancellation provision totaled R$3.1 billion in the year ended in 2011, a decrease of R$512 million or 14% compared with the same period in 2010 of R$3.7 billion. The tax deductions from gross revenue reached R$229 million in the 2011 financial year from R$273 million, representing a decrease of 16%, in the year ended on December 31, 2010 to mainly due to the decrease in revenue as a result of the lower sales volume in the period.
Operating costs
Operating costs in 2011 totaled R$2.7 billion, an increase of 8% as compared to R$2.5 billion in 2010. Cost overruns related to construction of R$587 million (R$231 million in Gafisa and R$356 million in Tenda) equivalent to 8% of the original total cost base of projects. 49% of the preliminary value relates to developments executed by third parties and franchisees, 26% relates to developments in regions that have been discontinued, and 25% from construction managed in-house.
Gross profit
Gross profit in 2011 totaled R$262.2 million, representing a decrease of 72%, from R$942.1 million in 2010 as a result of the revenue reversals related to the adjustments registered in the fourth quarter. In 2011, the gross margin generated from our activities deteriorated to 8.9% as compared to 27.7% in 2010. This sharp fall was due to mainly due to budget review deviation registered in the fourth quarter, 80% attributed to projects launched prior to 2008.
Selling expenses
Selling expenses in 2011 totaled R$393.2 million, representing an increase of 47% as compared to R$266.7 million in 2010. Selling expenses increased 47% to R$393.2 million mainly due to the provision for doubtful debts, of R$87 million recorded as additional expenses. Excluding these amounts, selling expenses totaled R$306.2 million in 2011, a 15% increase over 2010. Selling expenses were also necessary as they characterized new sales after dissolutions, mainly from Tenda.
General and administrative expenses
Administrative expenses reached R$251.5 million, a 6% increase over the R$236.8 million posted in 2010, which is lower than inflation. The IPCA was 6.5% in the same period. These expenses were comprised of profit sharing and other administrative expenses.
Depreciation and amortization
Depreciation and amortization in 2011 was R$83 million, an increase of R$49 million when compared to the R$34 million recorded in 2010, mainly due to higher sales stands depreciation. Depreciation of sales stands accounted for 4% of the expenses in the period.
Financial income and expenses, net
Net financial expenses totaled R$160 million in 2011, compared to net financial expenses of R$82 million in 2010 as a result of a higher level of leverage. The difference is mainly due to the decrease in financial revenues of 27% and to a 20% increase in financial expenses, due to higher leveraging rate and, consequently, higher interest expenses.
Taxes on income
Income, social contribution and deferred taxes for 2011 amounted to R$142 million, compared to R$22 million in 2010. The provision for, or benefit from, income taxes is calculated using the asset and liability method, under which deferred tax assets and liabilities are recorded based on the difference between the financial statement and tax
basis of assets and liabilities using enacted tax rates in effect for the year in which the differences are expected to reverse. Deferred tax assets are evaluated on a quarterly basis to determine if adjustments to the valuation allowance are required. The Company assesses whether a valuation allowance should be established based on the consideration of all available evidence using a “more likely than not” standard with respect to whether deferred tax assets will be realized. The ultimate realization of deferred tax assets depends primarily on the generation of future taxable income during the periods in which the differences become deductible. Judgment is required in determining the future tax consequences of events that have been recognized in the Company’s consolidated financial statements and/or tax returns.
Net income for the year attributable to non-controlling interest
The increase in the stakes of non-controlling shareholders (minorities in subsidiaries in which we hold investments) from R$24 million in 2010 to R$40 million in 2011, an increase of 67% when compared to the previous year, as a result of increased net income at the Alphaville business recognized in the period.
Net loss for the year attributable to owners of Gafisa
Our use of the percentage-of-completion method of accounting resulted in a reduction or reversal of previously recorded revenue and profit due to the adjustments mentioned above, resulting in a net loss in the year ended December 31, 2011 of R$945 million compared to a net profit of R$265 million in 2010.
Business Segments
Our financial results for 2012, 2011 and 2010 included the results of the following segments: Gafisa S.A., Alphaville and Tenda. See “Item 4. Information on the Company—A. History and Development of the Company—Historical Background and Recent Developments.” Our chief executive officer, who is responsible for allocating resources among these businesses and monitoring their progress, uses data derived from a combination of historical operating results and forecasted operating results, to assess segment information primarily on the basis of different business segments.
We provide below a measure of historical results, selected segment assets and other related information for each reporting segment. The information below is derived from our statutory accounting records which are maintained in accordance with Brazilian GAAP. No individual customer represented more than 10% of our net operating revenue.
|
For Year Ended December 31, 2012
|
||||||||||||||||
|
Gafisa (1)
|
Tenda
|
Alphaville
|
Total
|
|||||||||||||
|
(millions of
reais
except for percentages)
|
||||||||||||||||
|
Net operating revenue
|
R$ | 2,018.1 | R$ | 1,125.7 | R$ | 809.5 | R$ | 3,953.3 | ||||||||
|
Operating costs
|
(1,572.9 | ) | (977.5 | ) | (390.6 | ) | (2,941.0 | ) | ||||||||
|
Gross profit
|
445.2 | 148.2 | 418.9 | 1,012.3 | ||||||||||||
|
Gross margin
|
22.1 | % | 13.2 | % | 51.8 | % | 25.6 | % | ||||||||
|
Net income (loss)
|
(158.9 | ) | (122.9 | ) | 157.3 | (124.5 | ) | |||||||||
|
(1)
|
Includes all subsidiaries, except Alphaville and Tenda.
|
|
For Year Ended December 31, 2011
|
||||||||||||||||
|
Gafisa (1)
|
Tenda
|
Alphaville
|
Total
|
|||||||||||||
|
(millions of
reais
except for percentages)
|
||||||||||||||||
|
Net operating revenue
|
R$ | 1,821.9 | R$ | 446.0 | R$ | 672.6 | R$ | 2,940.5 | ||||||||
|
Operating costs
|
(1,601.7 | ) | (725.5 | ) | (351.2 | ) | (2,678.4 | ) | ||||||||
|
Gross profit (loss)
|
220.2 | (279.5 | ) | 321.4 | 262.1 | |||||||||||
|
Gross margin
|
12.1 | % | (62.7 | )% | 47.8 | % | 8.9 | % | ||||||||
|
Net income (loss)
|
(413.7 | ) | (660.1 | ) | 128.9 | (944.9 | ) | |||||||||
|
(1)
|
Includes all subsidiaries, except Alphaville and Tenda.
|
|
For Year Ended December 31, 2010
|
||||||||||||||||
|
Gafisa (1)
|
Tenda
|
Alphaville
|
Total
|
|||||||||||||
|
(millions of
reais
except for percentages)
|
||||||||||||||||
|
Net operating revenue
|
R$ | 1,894.5 | R$ | 1,061.6 | R$ | 447.0 | R$ | 3,403.1 | ||||||||
|
Operating costs
|
(1,477.8 | ) | (732.0 | ) | (251.2 | ) | (2,460.9 | ) | ||||||||
|
Gross profit
|
416.7 | 329.6 | 195.8 | 942.1 | ||||||||||||
|
Gross margin
|
22.0 | % | 31.0 | % | 43.8 | % | 27.7 | % | ||||||||
|
Net income
|
116.8 | 82.5 | 65.3 | 264.6 | ||||||||||||
|
(1)
|
Includes all subsidiaries, except Alphaville and Tenda.
|
Gafisa Segment
Years Ended December 31, 2012 and 2011
Net operating revenue
Net operating revenue for the Gafisa segment was R$2.0 billion in 2012 compared to the net revenue of R$1.8 billion in 2011, which represents an increase of 10.8%. This increase was primarily due to recognition of results from sales contracted in prior periods, since Gafisa recognizes revenues on a percentage of completion basis and the remedial actions that have been implemented in 2011. Revenue recognized in 2011 was negatively impacted due to the cost overruns related to construction.
Operating costs
The costs of the sale and barter transactions in 2012 and 2011 totaled R$1.6 billion. Operating costs, as a percentage of net operating revenue, decreased from 87.9% in 2011 to 77.9% in 2012, mainly due to the recognition of cost overruns in 2011.
Gross profit
The gross profit in 2012 was R$445.2 million, representing an increase of 102.2% compared with the R$220.2 million reported in 2011. The gross margin in 2012 generated by our projects’ sales increased to 22.1% compared to 12.1% in the same period of 2011. This increase was due to the cost overruns related to construction in 2011.
Net income (loss) for the year
Net loss for the Gafisa segment was R$158.9 million in 2012 or 127.6% of our total net loss in 2012, compared to the loss of R$413.7 million or 43.8% of our total net loss in 2011. The decrease in net loss is a result of a higher gross profit in 2012, because net loss in 2011 was a result mainly of a reversal of revenues as a consequence of a review of budget-led costs of projects, impairment costs and reversal of a deferred tax asset. Net income (loss) as a percentage of net operating revenues was negative 7.9% in 2012 as compared to a negative 22.7% in 2011.
Tenda Segment
Years Ended December 31, 2012 and 2011
Net operating revenue
Net revenue of sales/or services during 2012 totaled R$1,125.7 million, compared to R$446.0 million in the previous year, an increase of 152.4% when compared to the previous year. In 2012, Tenda accounted for 28.5% of the consolidated net revenue. The main reason for the result was (i) higher recognition of revenues and (ii) reversal of the cancellation provision in 2012. In addition, net revenue in 2011 was impacted by (i) reversal of revenues as a consequence of review of budget led costs of projects that took place in that year and (ii) cancellation of sales related to clients with high delinquency or without the ability to transfer to the CEF, given Tenda tighter credit police.
Operating costs
The costs of development and sale of property and barter transactions in 2012 totaled R$977.5 million, compared to R$725.5 million reported in 2011. This increase is mainly related to (i) higher recognition of revenues, and consequently costs, (ii) and reversal of the cancellation provision.
Gross profit (loss)
The gross profit in 2012 of R$148.2 million, compared to gross loss in 2011 of R$279.5 million. In 2012, gross margins increased to 13.2% from a gross loss of 62.7% in 2011. The gross profit in 2011 was negatively impacted mainly due to the cost overruns related to construction and provisions for cancellation.
Net loss for the year
Net loss for the Tenda segment was R$122.9 million or 98.7% of our total net loss in 2012, compared to a net loss of R$660.1 million or 69.9% of total net loss for 2011. This decrease of net loss in 2012 when compared to 2011 is a result of better operating results and reversal of cancellation provision in 2012. In addition, net loss in 2011 was due to the revenue reversal related to adjustments that materially impacted Tenda results, cancellations and contract dissolutions on the back of the new sales policy adopted, as well as our more targeted strategy.
Alphaville Segment
Years Ended December 31, 2012 and 2011
Net operating revenue
The net revenue from sales and/or services increased by 20.4%, from R$672.6 million in 2011 to R$809.5 million in 2012. This increase was mainly due to positive demand for Alphaville properties and recognition of the revenues derived from sales contracted in former periods. In 2012, Alphaville contributed for 20.5% of the consolidated net revenue compared to 22.9% in 2011.
Operating costs
The costs of development and sale of property and barter transactions in 2012 totaled R$390.6 million, an increase of 11.2% compared with the R$351.2 million reported in 2011. This increase was mainly due to the higher volume of construction in progress during 2012 compared to 2011.
Gross profit
The gross profit in 2012 was R$418.9 million, representing an increase of 30.3% compared with the R$321.4 million reported in 2011. Increase in the gross profit can be largely attributed to the higher gross revenue derived from the large number of construction projects in progress. The gross margin in 2012 generated by our projects sales increased to 51.8% compared to the increase of 47.8% in the same period of 2011. Such increase derives from the higher sales margins to the extent that we have recognized revenues derived from projects launched in former years.
Net income for the year
Net income for the Alphaville segment was R$157.3 million in 2012 and R$128.9 million in 2011. Net income, as a percentage of net operating revenue, was 19.4% in 2012 as compared to 19.2% in 2011. The increase was mainly attributable to higher operational margins as discussed above.
Gafisa Segment
Years Ended December 31, 2011 and 2010
Net operating revenue
In the last quarter of 2011 we did an extensive review of the budgeted costs of the projects and adjusted the percentage of completion leading to a reversal of revenues, as a consequence the net revenue from sales and/or
services decreased by 5.6%, from R$1.9 billion in 2010 to R$1.8 billion in 2011. In 2011, Gafisa segment accounted for 62% of our consolidated net revenue.
Operating costs
The costs of the sale and barter transactions in 2011 totaled R$1.6 billion, an increase of 6.8% compared with the R$1.5 billion reported in 2010. This increase was mainly due to an impairment of development expenses related to the process of land acquisition in the amount of R$100 million recognized as sunk costs.
Gross profit
The gross profit in 2011 was R$220 million, representing a decrease of 47% compared with the R$417 million reported in 2010. Decrease in the gross profit can be largely attributed to the excessive costs, of which 60% are related to third parties’ constructions overruns and 27% to discontinued sites. The gross margin in 2011 generated by our projects sales reduced to 12% compared to 22% in the same period of 2010.
Net income for the year
Net loss for the Gafisa segment was R$413.7 million in 2011 or 43.9% of our total net loss in 2011, compared to a profit of R$116.8 million or 44.2% of our total net income in 2010. The decrease in net income is a result of reversal of revenues as a consequence of review of budget led costs of projects, increase in net financial expenses, impairment costs and reversal of deferred tax asset. Net income (loss) as a percentage of net operating revenues was negative 22.7% in 2011 as compared to a positive 6.2% in 2010.
Tenda Segment
Years Ended December 31, 2011 and 2010
Net operating revenue
Net revenue of sales/or services during 2011 totaled R$446 million, compared to R$1.1 billion in the previous year, a decrease of 58% when compared to the previous year. In 2011, Construtora Tenda S.A. accounted for 15% of the consolidated net revenue. The main reason for the decrease was (i) reversal of revenues as a consequence of review of budget led costs of projects and (ii) cancellation of sales related to clients with high delinquency or without the ability to transfer to the CEF.
Operating costs
The costs of development and sale of property and barter transactions in 2011 totaled R$725 million, compared to R$732 million reported in 2010. Cost overruns related to construction of R$356 million in Tenda equivalent to approximately 8% of the original total cost base of projects mainly related to the developments executed by third parties and franchisees.
Gross profit (loss)
The gross loss in 2011 of R$279 million, compared to gross profit in 2010 of R$329 million. In 2010, sales margins fell from 31.1% in 2010 to a gross loss of 63% in 2011. The use of the percentage-of-completion method of accounting resulted in a reduction of reversal of previously recorded revenue due to the adjustments mentioned above.
Net income (loss) for the year
Net loss for the Tenda segment was R$660.1 million of our total net loss in 2011, compared to a net income of R$82.5 million or 31.1% of total net income for 2010. This decrease of net income in 2011 when compared to 2010 is a result of revenue reversal related to adjustments registered in the 2011, cancellations and contract dissolutions at Tenda on the back of the new sales policy adopted, as well as our more targeted strategy.
Alphaville Segment
Years Ended December 31, 2011 and 2010
Net operating revenue
The net revenue from sales and/or services increased by 51%, from R$447 million in 2010 to R$673 million in 2011. This increase was mainly due to large continuous demand for Alphaville’s properties and recognition of the revenues derived from sales contracted in former periods. In 2011, Alphaville contributed for 22.9% of the consolidated net revenue.
Operating costs
The costs of development and sale of property and barter transactions in 2011 totaled R$351 million, an increase of 40% compared with the R$251 million reported in 2010. This increase was mainly due to the higher volume of construction in progress during 2011 compared to 2010.
Gross profit
The gross profit in 2011 was R$321 million, representing an increase of 63.8% compared with the R$196 million reported in 2010. Increase in the gross profit can be largely attributed to the higher gross revenue derived from the large number of construction projects in progress. The gross margin in 2011 generated by our projects sales increased to 48% compared to 44% in the same period of 2010. Such increase derives from the higher sales margins to the extent that we have recognized revenues derived from projects launched in former years.
Net income for the year
Net income for the Alphaville segment was R$128.9 million. Net income, as a percentage of net operating revenue, was 19.2% in 2011 as compared to 14.7% in 2010. The increase was mainly attributable to higher operational margins as discussed above.
B. Liquidity and Capital Resources
Our transactions are financed mainly through the contracting of real estate financing and securitization of receivables. When necessary and in accordance with market demands, we carry out long-term financing for the sale of our developments. In order to turn over our capital and accelerate its return, we try to transfer to banks and sell to the market the receivables portfolio of our units.
In 2012, we carried out the following receivables sales:
On May 9, 2012, Gafisa and its subsidiaries enter into a CCI transaction relating to a portfolio comprising select residential real estate receivable from Gafisa and its subsidiaries. The assigned portfolio of receivables amounts to R$64.9 million in exchange for cash at the transfer date, discounted to present value, by R$45.2 million.
On July 6, 2012, Gafisa and its subsidiaries enter into a CCI transaction relating to a portfolio comprising select residential real estate receivable from Gafisa and its subsidiaries. The assigned portfolio of receivables amounts to R$18.2 million in exchange for cash at the transfer date, discounted to present value, for R$11.5 million.
On November 14th, the subsidiary Alphaville, entered into a CCI transaction related to a portfolio comprising selected select residential real estate receivables from Alphaville and its subsidiaries. The assigned gross portfolio of receivables amounts to R$134.6 million in cash exchange as of the date of transfer, discounted to its present value for R$110.7 million.
On December 27, 2012, Gafisa and its subsidiaries enter into a CCI transaction relating to a portfolio comprising select residential real estate receivable from Gafisa and its subsidiaries. The assigned portfolio of receivables amounts to R$72.0 million in exchange for cash at the transfer date, discounted to present value, by R$61.6 million.
We consistently review opportunities for acquisition and investments. We consider different types of investments, either direct or through our subsidiaries and jointly-controlled entities. We finance such investments using capital market financings, capital increase or through a combination thereof.
Construction financing lines of credit are available and we have fulfilled substantially all of our construction financing needs for 2012 at consolidated rates similar to the SELIC rate. In order to mitigate the effects of the 2008 global credit crisis, the Brazilian government has announced additional lines of credit to assist the construction industry and its customers, including R$6 billion from the FGTS (a Government Severance Indemnity Fund for Employees). In 2009 we approved the issue of two series of debentures for Gafisa and Tenda in the total amount of R$1.2 billion. In addition, local financial institutions are financing up to 80% of construction costs, through the Brazilian Saving and Loan System (
Sistema Brasileiro de Poupança e Empréstimo —
SBPE) indexed to TR (
Taxa Referencial
) and a fixed rate spread.
During 2012, our customers’ ability to obtain bank mortgage loans continued to improve, with interest rates in the range of 6%+TR (affordable entry level) to 12%+TR, depending on family income and credit score. Delinquency rates among our customers have increased in 2012 compared to 2011.
The following table shows the balance of our receivables from clients for the development and sale of properties for the periods presented:
|
As of December 31,
|
||||||||||||
|
2012
|
2011
|
2010
|
||||||||||
|
(in millions of
reais
)
|
||||||||||||
|
Real estate development receivables:
|
||||||||||||
|
Current
|
R$ | 2,915.3 | R$ | 3,962.6 | R$ | 3,704.7 | ||||||
|
Long-term
|
976.2 | 863.9 | 1,247.3 | |||||||||
|
Total
|
R$ | 3,891.5 | R$ | 4,826.5 | R$ | 4,952.0 | ||||||
|
Receivables to be recognized on our balance sheet according to percentage of completion method:
|
||||||||||||
|
Current
|
R$ | 1,786.4 | R$ | — | R$ | 2,465.8 | ||||||
|
Long-term
|
2,252.6 | 4,686.2 | 1,646.9 | |||||||||
|
Total
|
4.039.0 | 4,686.2 | 4,112.7 | |||||||||
|
Total receivables from clients
|
R$ | 7,930.5 | R$ | 9,512.7 | R$ | 9,064.7 | ||||||
The total balance of receivables to be recognized on the balance sheet has the following maturity profile:
|
As of December 31, 2012
|
||||
|
(in millions
reais
)
|
||||
|
Maturity
|
||||
|
2013
|
R$ | 4,701.7 | ||
|
2014
|
1,417.8 | |||
|
2015
|
799.5 | |||
|
2016
|
1,011.5 | |||
|
Total
|
R$ | 7,930.5 | ||
Loans made to our clients are generally adjusted on a monthly basis as follows: (1) during construction, by the INCC in São Paulo, Rio de Janeiro and other Brazilian cities; and (2) after delivery set forth in the contract, by the IGP-M plus 12% per annum in all markets.
We limit our exposure to credit risk by selling to a broad customer base and by continuously analyzing the credit of our clients. As of February 28, 2013, our clients’ default level was 5.40% of our accounts receivable for Gafisa, 10.83% for Tenda and 3.09% for Alphaville. We did not record a provision for the years ended December 31, 2010, 2009 and 2008 because we considered the allowance for doubtful accounts not to be necessary, except for Tenda. We review annually our assumptions to set up an allowance for doubtful account and cancelled contracts, in
view of the review of the histories of its current operations and improvement of estimates. The Company records an allowance for doubtful accounts and cancelled contracts for customer whose installments are over 90 past due, in several types of construction work: construction works on time, construction works delayed (within the grace period), works that are late (out of the grace period) and for delivered completed units. This allowance is calculated based on the percentage of the construction work completion, a methodology adopted for recognizing income for the year. The allowance for doubtful accounts and cancelled contracts totaled R$80.1 million as of December 31, 2012 and is considered sufficient by our management to cover expected future losses on the realization of accounts receivable of this subsidiary.
Cash Flows
Operating activities
Net cash generated from operating activities totaled R$650.9 million in 2012 compared to net cash used in R$808.7 million in 2011. The R$650.9 million was primarily composed of: (1) a decrease in trade accounts receivables, totaling R$580.5 million in 2012; (2) a decrease in properties for sale of R$343.5 million attributable to landbank and construction; (3) an increase in payable for purchase of properties and advances from customers in R$168.9 million; and (4) other less significant increases and decreases in other operating categories.
Net cash used in operating activities totaled R$808.7 million in 2011 compared to R$1,079.6 million in 2010. The R$808.7 million was primarily composed of: (1) a decrease in trade accounts receivables, totaling R$58.5 million in 2011; (2) increase in properties for sale of R$826.5 million attributable to an increase of our land bank and completed units; and (3) other less significant increases and decreases in other operating asset and liability captions.
Investing activities
Net cash used in investment activities, including the acquisition of property, equipment and new investments, was R$322.9 million, R$6.9 million and cash generated of R$122.9 million in 2012, 2011 and 2010, respectively.
Net cash used in investing activities, including the acquisition of property, equipment and new investments, was R$322.9 million in 2012 compared to a net cash used in investing activities of R$6.9 million in 2011. Our cash used in 2012 was mainly related to investments in property and equipment in the amount of R$114.8 million, and R$208.1 million related to purchases of short-term investments, net of redemption costs. Our main investments during the period were the construction of sales stands, which totaled R$33.3 million, investments in information technology equipment and software, which totaled R$36.4 million, in third party leasehold improvements and facilities, which totaled R$11.0 million.
Net cash from investing activities, including the acquisition of property, equipment and new investments, was R$6.9 million in 2011 compared to a net cash generated in investing activities of R$122.9 million in 2010. Our cash generated in 2011 was mainly related to investments in property and equipment in the amount of R$105.6 million. Our main investments during the period were the construction of sales stands, which totaled R$30.2 million, investments in information technology equipment and software, which totaled R$44.3 million, in construction equipment, which totaled R$2.8 million and in machines and equipment, which totaled R$3.1 million. These investments were compensated by cash used by investment activities related to short-term investments and restricted cash in the amount of R$98.7 million.
Financing activities
Net cash generated from financing activities in 2012 totaled R$161.5 million, a decrease of 76.8%, compared to the net cash generated from financing activities in 2011 of R$696.8 million. The cash generated in 2012 was mainly attributable to: (1) increase of loans and financing other debt totaling R$1,419.0 million, which was partially offset by amortizations of loans and interests in the amount of R$1,373.5 million, (2) capital increase in the amount R$2 million, and (3) cash inflow due to the CCI transaction in the amount of R$229.1 million. Net cash generated from financing activities in 2011 totaled R$696.8 million, a decrease of 24.3%, compared to the net cash generated from financing activities in 2010 of R$920.2 million. The cash generated in 2011 was mainly attributable to: (1) issuance of debentures and other debt totaling R$1,445.9 million, including CCI transactions, which was partially offset by amortizations of loans and interests in the amount of R$655.2 million and (2) capital increase in the amount R$5.0 million. We also paid R$98.8 million in dividends.
Pledged mortgage receivables and short-term investments
As of December 31, 2012, substantially all of our mortgage receivables totaling R$4,932.4 million are pledged. In addition, R$95.9 million of our short-term investments and collaterals are restricted as they have been pledged.
Capital Expenditures
In 2012, we invested R$114.8 million in property and equipment, primarily information technology equipment, software, the construction of sales stands, facilities, model apartments and related furnishings and office facilities in São Paulo. Our main investments during the period were the construction of sales stands, which totaled R$33.3 million, investments in information technology equipment and software, which totaled R$36.4 million, in third party leasehold improvements and facilities, which totaled R$11.0 million. In 2011, we invested R$94.9 million in property and equipment, primarily information technology equipment, software, the construction of sales stands, facilities, model apartments and related furnishings and new office facilities in São Paulo. Our main investments during the period were the construction of sales stands, which totaled R$30.2 million, investments in information technology equipment and software, which totaled R$44.3 million, in construction equipment, which totaled R$2.8 million and in machines and equipment, which totaled R$3.1 million.
In 2010, we invested R$63.5 million in property and equipment, primarily information technology equipment, software, the construction of sales stands, facilities, model apartments and related furnishings and new office facilities in São Paulo. Our main investments during the period were the construction of sales stands, which totaled R$44.3 million, investments in information technology equipment and software, which totaled R$10.8 million, in construction equipment, which totaled R$4.4 million and in machines and equipment, which totaled R$3.9 million.
Our capital expenditures are all made in Brazil and are usually funded by local debt capital markets. We currently do not have any significant capital expenditures in progress.
Indebtedness
When we consider appropriate, we have incurred indebtedness within SFH, which offers lower interest rates than the private market. When our customers obtain a mortgage, we use the proceeds to redeem our SFH indebtedness. We intend to continue our strategy of maintaining low levels of debt comprised mainly of transactions within SFH or long-term transactions.
As of December 31, 2012, we had outstanding debt in the total amount of R$3,916.3 million, an increase of 4.3% as compared to December 31, 2011. Our indebtedness principally consists of (1) debentures totaling R$1,735.9 million, (2) working capital loans in the total amount of R$1,198.7 million and (3) other loans (mainly SFH) in the total amount of R$981.7 million. In addition, we had outstanding payables to venture partners in the amount of R$323.8 million.
As of December 31, 2011, we had outstanding debt in the total amount of R$3,755.8 million, an increase of 13.5% as compared to December 31, 2010. Our indebtedness principally consists of (1) debentures totaling R$1,899.2 million, (2) working capital loans in the total amount of R$1,168.1 million and (3) other loans (mainly SFH) in the total amount of R$688.5 million. In addition, we had outstanding payables to venture partners in the amount of R$473.2 million.
As of December 31, 2010, we had outstanding debt in the total amount of R$3,290 million, an increase of 5.4% as compared to December 31, 2009. Our indebtedness principally consists of (1) debentures totaling R$1,879.9 million, (2) working capital loans in the total amount of R$664.5 million and (3) other loans (mainly SFH) in the total amount of R$745.7 million. The following table sets forth information on our loans, financing and debentures as of December 31, 2012. In addition, we had outstanding payables to venture partners in the amount of R$404.3 million.
|
Maturity
|
||||||||||||||||||||
|
Total
|
2013
|
2014
|
2015
|
2016 and thereafter
|
||||||||||||||||
|
(in millions of
reais
)
|
||||||||||||||||||||
|
Debentures (Project Finance)
|
R$ | 1,163.2 | R$ | 214.6 | R$ | 248.6 | R$ | 350.0 | R$ | 350.0 | ||||||||||
|
Debentures (Working Capital)
|
572.6 | 131.7 | 280.7 | 150.0 | 10.2 | |||||||||||||||
|
Other Working Capital
|
1,199.9 | 314.3 | 429.2 | 271.2 | 185.2 | |||||||||||||||
|
Housing Finance System (SFH)
|
980.6 | 498.2 | 341.0 | 134.9 | 6.5 | |||||||||||||||
|
Payables to venture partners
|
323.8 | 161.4 | 142.7 | 11.2 | 8.5 | |||||||||||||||
|
Total
|
R$ | 4,240.1 | R$ | 1,320.2 | R$ | 1,442.2 | R$ | 917.3 | R$ | 560.4 | ||||||||||
Payables to venture partners refer to contributions received from venture partners of R$300.0 million in 2008 and R$80.0 million in 2010 and R$80.0 million in 2011 which will be fully redeemed by us until 2017.
In January 2008, we formed an unincorporated venture represented by 13,084,000 Class A quotas fully paid by us and 300,000,000 Class B quotas from our venture partner, of which R$300.0 million was subscribed by our venture partner. The venture, which will use these funds to acquire equity investments in real estate developments, has a term that ends on January 31, 2017 at which time we are required to fully redeem our venture partner’s interest. The venture partner receives an annual dividend substantially equivalent to the variation in the Interbank Certificate of Deposit (CDI) rate. The venture’s charter provides that we must comply with certain covenants in our capacity as lead partner, which include the maintenance of minimum net debt and receivables. We and the venture are currently in compliance with these covenants. The redemption of Class B quotas commenced on January 31, 2012. At a meeting of the venture partners held on February 2, 2012, they decided to reduce the SCP capital by 100,000,000 Class B units and, as consequence of this resolution, the SCP paid R$100.0 million to the partners that held such units. As of December 31, 2012, the SCP and the Company is in compliance with these clauses.
In April 2010, our subsidiary Alphaville paid in the capital of an entity that held interest in other companies, the main objective of which includes the development and carrying out of real estate ventures. This entity subscribed capital and paid in capital reserve totaling R$135.1 million (comprising 81,719,641 common shares held by the Company and 53,333.333 preferred shares held by other shareholders). As a result of this transaction, payables to investors/venture partners are recognized at R$53.3 million, with final maturity on March 31, 2014. The preferred shares shall pay cumulative fixed dividends, substantially equivalent to the variation of the General Market Prices Index (IGP-M) plus 7.25% p.a. The Company’s articles of incorporation set forth that certain matters shall be submitted for approval from preferred shareholders through vote, such as the rights conferred by such shares, increase or reduction in capital, use of profits, set up and use of any profit reserve, and disposal of assets. On April 2, 2012, the Company paid principal in the amount of R$26.7 million and dividend in the amount of R$8.7 million to the holders of preferred shares. As of December 31, 2012, the Company is in compliance with the above-described covenants.
On June 27, 2011, eight certificates of bank credit (CCBs) were issued in the Company, totaling R$65.0 million. CCBs are guaranteed by 30,485,608 shares issued by Gafisa SPE-89 Empreendimentos Imobiliários S.A. In Alphaville, eight CCBs were issued, totaling R$55.0 million. CCBs are guaranteed by 500,000 units shares issued by Alphaville Ribeirão Preto Empreendimentos Imobiliários S.A. Funds from the aforementioned CCBs were allocated to develop residential projects.
As part of the funding through issuance of Certificates of Bank Credit– CCB, the Company and subsidiary Alphaville entered into a paid usufruct agreement in connection with 100% of the preferred shares in SPE-89 Empreendimentos Imobiliários S.A. and Alphaville Ribeirão Preto Empreendimentos Imobiliários S.A., for a period of six years, having raised R$45.0 million and R$35.0 million, respectively, recorded based on the effective interest method of amortization in the consolidated income statement.
On September 5, 2012 we issued a Certificate of Bank Credit (CCB) on a total amount of R$150.0 million due to 2015. The CCB is guaranteed by pledge of to be performed units of selected ventures and real estate receivables.
On October 31, 2012, we amended the Certificates of Bank Credit (CCB), which original amount was R$100.0 million, with the purpose of pledging a secured guarantee, represented by first-priority mortgage of select real estate venture units, and the fiduciary assignment of these real estate receivables, and also renegotiate the payment flow.
On December 20, 2012 we approved our third public distribution with restricted efforts of commercial paper in a single series in the amount of R$80.0 million.
On December 21, 2012 the Alphaville subsidiary issued a Certificate of Bank Credit (CCB) for a total amount of R$130.0 million due to 2016. The CCB is guaranteed by pledge of real estate receivables and it is guaranteed by us.
Debenture program
On May 16, 2008, the CVM approved our third debenture program under which we can issue up to R$1.0 billion in non-convertible debentures. The first issuance under the third debenture program consisted of 25,000 nominal, non-convertible debentures with a face value of R$10,000, which were issued in two series totaling R$250.0 million. The debentures provide for the payment of annual interest corresponding to 107.2% of the CDI rate, which, on March, was renegotiated to 120.0% of the CDI rate, calculated from the subscription date, with a maturity of 5 years. The issuance has certain covenants which would restrict Company’s ability to take certain actions, including incurring additional debt, and may require us to repay or refinance our indebtedness if we are unable to meet certain ratios. The ratios, its parameters and our performance against them are summarized below.
In April 2009, Tenda’s first debenture program was approved, under which we issued R$600.0 million in non-convertible debentures. The debentures provide for payment of annual interest at a rate of 8.0% + TR per annum, calculated from the subscription date, with a maturity of five years. Proceeds from the issuance of the debentures will be used solely to finance real estate ventures focused exclusively on the affordable entry-level segment that meet certain eligibility criteria. Guarantees are comprised of assignments of receivables and bank accounts.
Additionally, certain covenants contained in the agreement governing Tenda’s debenture program restrict its ability to take certain actions, including incurring additional debt, and may require Tenda to repay or refinance the debenture if it is unable to meet certain financial ratios. The ratios, its parameters and our performance against them are summarized below.
In August 2009, the CVM approved our sixth issuance, which consisted of non-convertible simple debentures in two series, secured by a general guarantee, maturing in four years and unit face value at the issuance date of R$10,000, totaling R$250 million. The debentures provide for the payment of annual interest corresponding to the CDI rate
plus
2.00 to 3.25% per annum, calculated from the subscription date. Under the sixth issuance, we are obligated to acquire all outstanding debentures upon the request of debenture holders whenever we raise money through the issuance of non-debt securities in excess of R$500.0 million. We also have the right to repurchase the debentures in the occurrence of a liquidity event. In October 2010, the Company carried out the early redemption of the first series of this placement in the amount of R$150.0 million.
In December 2009, the CVM approved our seventh issuance under which we received R$600 million in non-convertible debentures. The debentures provide for payment of annual interest at a rate of 8.25% to 10.25%
plus
TR per annum, calculated from the subscription date, with a maturity of five years. Proceeds from the issuance of the debentures will be used solely to finance real estate ventures.
In September 2010, the CVM approved our eighth issuance which consisted of non-convertible debentures in two series maturing in five and six years, respectively the first and the second series, with a unit face value at the issuance date of R$1,000, for an aggregate of R$300 million. The debentures provide for the payment of annual interest corresponding to the CDI rate
plus
1.95% in the first series and IPCA plus 7.96% in the second series, calculated from the subscription date.
We have various covenants relating to our debentures issuances described above. These mainly consist of (i) cross default provisions, whereby outstanding indebtedness will become immediately due and payable in the event that the Company or its subsidiaries do not comply with their obligations under any other credit facility for a value in excess of the amounts set forth therein; (ii) restrictions on transfer of control and merger and acquisition transactions; (iii) limitations on our ability to incur debt; (iv) limitations or creating liens on assets; (v) limitations on the distribution of dividends if we are under default and (vi) the following ratios and limits to be calculated on a quarterly basis. The table below sets forth these ratios and limits as amended.
The actual ratios and minimum and maximum amounts stipulated by these restrictive covenants at December 31, 2012 and 2011 are as follows:
|
2012
|
2011
|
|||||||
|
Fifth placement (b)
|
||||||||
|
Total account receivable plus inventory of finished units required to be equal to or 2.2 times over net debt or below zero
|
3.73 times
|
n/a | ||||||
|
Total debt less venture debt (3) less cash and cash equivalents and short-term investments (1) cannot exceed 75% of equity
|
3.58 | % | n/a | |||||
|
Seventh placement (a)
|
||||||||
|
Total account receivable plus inventory required to be below zero or 2.0 times over net debt less venture debt (3)
|
115.86 times
|
14.26 times
|
||||||
|
Total debt less venture debt (3), less cash and cash equivalents and short-term investments (1), cannot exceed 75% of equity plus non-controlling interests
|
3.39 | % | 31.8 | % | ||||
|
Total account receivable plus unappropriated income plus total inventory of finished units required to be 1.5 time over the net debt plus payable for purchase of properties plus unappropriated cost
|
2.03 times
|
1.74 times
|
||||||
|
Eighth placement — first and second series, second issuance of Promissory Notes, first and second series
|
||||||||
|
Total account receivable plus inventory of finished units required to be below zero or 2.0 times over net debt less venture debt
|
91.37 times
|
11.03 times
|
||||||
|
Total debt less venture debt, less cash and cash equivalents and short—term investments (1), cannot exceed 75% of equity plus non-controlling interests
|
3.39 | % | 31.8 | % | ||||
|
First placement – Tenda (a)
|
||||||||
|
Total accounts receivable plus inventory required to be equal to or 2.0 times over net debt less debt with secured guarantee (3) or below, considering that TR(4) plus TE(5) is always above zero
|
–3.29 | – 6.5 | ||||||
|
Net debt less debt with secured guarantee (3) required to be in excess of 50% of equity
|
–44.39 | % | – 40.83 | % | ||||
|
Total account receivable plus unappropriated income plus total inventory of finished units required to be 1.5 times the net debt plus payable for purchase of properties plus unappropriated cost
|
6.63 times
|
2.57 times
|
||||||
|
(1)
|
Cash and cash equivalents and short-term investments refer to cash and cash equivalents and marketable securities.
|
|
(2)
|
Total receivables, whenever mentioned, refers to the amount reflected in the Balance Sheet plus the amount not shown in the Balance Sheet
|
|
(3)
|
Venture debt and general guarantee debt refer to SFH debts, defined as the sum of all disbursed borrowing contracts which funds were provided by SFH, as well as the debt related to the seventh placement.
|
|
(4)
|
Total receivables.
|
|
(5)
|
Total inventory.
|
We expect to comply with the covenants in the agreements governing our outstanding indebtedness which may limit our long-term growth prospects by hindering our ability to incur future indebtedness or grow through acquisitions. See “Item 3. Key Information—D. Risk Factors—Our level of indebtedness could have an adverse effect on our financial health, diminish our ability to raise additional capital to fund our operations and limit our ability to react to changes in the economy or the real estate industry.”
In January 2012, the Company was in default on the restrictive covenants of a CCB in the amount of R$100.0 million because of the corporate rating downgrading. Immediately thereafter, the Company negotiated and obtained from the financial institution a waiver related to early redemption in view of the non-compliance of the contractual covenant.
In April 2012, we were in default on the restrictive covenants of a bank loan (
cédula de crédito bancário
), or CCB in the amount of R$100.0 million because of the corporate rating downgrading. Immediately thereafter, the Company negotiated and obtained from the financial institution a waiver related to early redemption in view of the non-compliance of the contractual covenant.
In June 2012, we were in default on the restrictive covenants of a bank loan (
cédula de crédito Imobiliário
), or CCB in the amount of R$100.0 million because of the corporate rating downgrading. In June, 2012, the Company negotiated and obtained from the financial institution a waiver related to early redemption in view of the non-compliance of the contractual covenants.
Financing through the Housing Finance System (SFH)
Most of our financing is incurred directly or through our subsidiaries or jointly-controlled entities from the principal banks that operate within SFH. As of December 31, 2012, the interest rates on these loans generally varied between 8.3% and 11.5% per annum, plus TR, and the loans generally mature through December 2013 and 2016. This financing is secured by mortgages on property and by security interests on the receivables from clients. As of December 31, 2012 we had 83 loan agreements in effect, with a balance of R$980.7 million. At the same date we also had R$743.4 million in aggregate principal amount of financing agreements with SFH, the funds of which will be released through the date of completion as construction of the corresponding development’s progress.
Securitization Fund — FIDC
On March 31, 2009, we entered into a securitized receivables transaction, whereby we assigned a portfolio of select residential and commercial real estate receivables to “Gafisa FIDC” which issued senior and subordinated quotas. This first issuance of senior quotas was made through an offering restricted to qualified investors. Subordinated quotas were subscribed exclusively by Gafisa S.A. Gafisa FIDC acquired the present value of the portfolio based on an agreed discount rate. We provide Gafisa FIDC with administrative and accounting services including the reconciliation and analysis of receivables and collections and can be replaced by another collection agent in the event of non-fulfillment with contractual parameters. The senior and subordinated quotas are remunerated based on the IGP-M index plus interest of 12% per year. Because the subordinated quotas have a disproportional percentage of the expected losses, Gafisa FIDC was considered a variable interest entity and was fully consolidated in our financial statements as of December 31, 2012, 2011 and 2010.
The receivables portfolio assigned totaled R$119.6 million of which we received the equivalent of the present value of R$88.7 million in cash. We consolidated receivables of R$20.7 million assigned to Gafisa FIDC in our financial statements as of December 31, 2012 and recorded the mandatorily redeemable equity interest in the securitization fund of R$9.6 million as other accounts payable. The balance of our subordinated quotas was eliminated on consolidation.
In June 2009, we issued debt securities backed by real estate sales receivables (Cédula de Crédito Imobiliário), or CCI. The transaction consists of an assignment of a portfolio comprised of select residential real estate receivables from Gafisa and its subsidiaries. We assigned a receivables portfolio in the amount of R$89.1 million in exchange for cash at the transfer date, discounted to present value, totaling R$69.3 million, recorded as “Other accounts payable—Credit Assignments.”
Eight book CCIs were issued, amounting to R$69.3 million at the issuance date. These eight CCIs are backed by receivables which installments fall due on and up to June 2014.
On June 27, 2011, the Company and its subsidiaries entered into a CCI transaction relating to a portfolio comprising select residential real estate receivables from Gafisa and its subsidiaries. The assigned portfolio of receivables amounts to R$203.9 million (R$185.2 million – Gafisa’s interest) in exchange for cash, at the transfer date, discounted to present value, for R$171.7 million (R$155.9 million – Gafisa’s interest), recorded under “Obligations assumed on assignment of receivables”.
On September 29, 2011, the Company and its subsidiaries entered into a Private Instrument for Assignment of Real Estate Receivables and Other Covenants which consist of an assignment of a portfolio comprising select residential real estate receivables from Gafisa and its subsidiaries. The amount of real estate receivables assignment paid by the Assignee amounts to R$238.4 million (R$221.4 million - Gafisa’s interest). The assignment amount will be settled by the Assignee by offsetting the Housing Financial System (SFH) debt balance of the own bank. On
July 6, 2012, the remaining balance was settled by issuance of Bank Deposit Certificate (CDB) guaranteed in favor of the Company.
On December 22, 2011, Gafisa and its subsidiaries entered into a CCI transaction relating to a portfolio comprising select residential real estate receivables from Gafisa and its subsidiaries. The assigned portfolio of receivables amounts to R$72.4 million in exchange for cash at the transfer date, discounted to present value, by R$60.1 million, classified as “Obligations with assignment of receivables”.
On May 9, 2012, Gafisa and its subsidiaries entered into a CCI transaction relating to a portfolio comprising select residential real estate receivables from Gafisa and its subsidiaries. The assigned portfolio of receivables amounts to R$64.9 million in exchange for cash at the transfer date, discounted to present value, by R$45.2 million.
On July 6, 2012, Gafisa and its subsidiaries entered into a CCI transaction relating to a portfolio comprising select residential real estate receivables from Gafisa and its subsidiaries. The assigned portfolio of receivables amounts to R$18.2 million in exchange for cash at the transfer date, discounted to present value, for R$11.5 million.
On November 14, the subsidiary Alphaville, entered into a CCI transaction related to a portfolio comprising selected select residential real estate receivables from Alphaville and its subsidiaries. The assigned gross portfolio of receivables totals R$134.6 million in cash exchange as of the date of transfer, discounted to its present value for R$110.7 million.
On December 27, 2012, Gafisa and its subsidiaries enter into a CCI transaction relating to a portfolio comprising select residential real estate receivables from Gafisa and its subsidiaries. The assigned portfolio of receivables amounts to R$72.0 million in exchange for cash at the transfer date, discounted to present value, by R$61.6 million.
Pursuant to Article 125 of the Brazilian Civil Code, the CCI-Investor carries general guarantees represented by statutory liens on real estate units, effective as soon as the conditional restrictions included in the registration are lifted, as reflected in the real estate deed on (i) the assignment of receivables from the assignors to SPEs, as provided for in Article 167, item II, (21) of Law No. 6,015, of December 31, 1973; and (ii) the issue of CCI-Investor by SPEs, as provided for in Article 18, paragraph 5 of Law No. 10,931/04.
We will be compensated for, among other things, the reconciliation of the receipt of receivables, guarantee the CCIs, and the collection of past due receivables. The transaction structure provides for the substitution of us as collection agent in the event of non-fulfillment of the responsibilities described in the collection service contract.
Working Capital
We believe that our current working capital is sufficient for our present requirements and that our sources of funds from financing activities are sufficient to meet the financing of our activities and cover our need for funds for at least the next twelve months.
US GAAP Reconciliation
We prepare our financial statements in accordance with Brazilian GAAP, which differs in significant respects from US GAAP. Our net loss attributable to owners of Gafisa, in accordance with Brazilian GAAP, was R$124.5 million, R$944.9 million and net income of R$264.6 million in 2012, 2011 and 2010, respectively. Under US GAAP, our net loss was R$121.2 million, R$755.8 million and R$94.8 million in 2012, 2011 and 2010, respectively.
Our equity, in accordance with Brazilian GAAP, was R$2,692.4 million, R$2,747.1 million and R$3,632.2 million, as of December 31, 2012, 2011 and 2010, respectively. Under US GAAP, we recorded total equity of R$1,672.5 million, R$1,741.1 million and R$2,632.7 million as of December 31, 2012, 2011 and 2010, respectively.
The following items generated the most significant differences between Brazilian GAAP and US GAAP in determining net income and shareholders’ equity:
|
|
·
|
revenue recognition;
|
|
|
·
|
business combinations;
|
|
|
·
|
temporary equity;
|
|
|
·
|
effects of deferred taxes on the differences above; and
|
|
|
·
|
non-controlling interest.
|
For a discussion of the principal differences between Brazilian GAAP and US GAAP as they relate to our financial statements and a reconciliation of net income and equity see Note 32 to our consolidated financial statements included elsewhere in this annual report and “Item 3.A. Key Information—Selected Financial Data.”
New Accounting Pronouncements, Interpretations and Guidance
Pronouncements (new or revised) and interpretation adopted from 2012
The Company adopted all of the pronouncements (new or revised) and interpretations issued by the CPC which were effective as of December 31, 2012.
In relation to the adoption of the pronouncements and interpretations listed below, which became effective as of January 1, 2012, they did not have any significant impact on the individual and consolidated financial statements of the Company as of December 31, 2012. They are the following:
|
|
·
|
CPC 17 (R1) – Construction Contracts – CVM Resolution no. 691 of November 8, 2012 (IAS 11);
|
|
|
·
|
CPC 18 (R1) – Investments in Subsidiaries and Affiliates – CVM Resolution no. 688 of October 4, 2012 (IAS 28);
|
|
|
·
|
CPC 30 (R1) – Revenues – CVM Resolution no. 692 of November 8, 2012 (IAS 18);
|
|
|
·
|
CPC 35 (R2) – Separate Financial Statements – CVM Resolution no. 693 of November 8, 2012;
|
|
|
·
|
CPC 40 R1 – Financial Instruments: Supporting Documents – CVM Resolution no. 684 of August 30, 2012 (IFRS 7);
|
|
|
·
|
ICPC 08 (R1) – Accounting of Dividend Payment Proposal – CVM Resolution no. 683 of August 30, 2012; and
|
|
|
·
|
ICPC 09 (R1) – Individual Financial Statements, Separate Financial Statements and Application of the Equity Accounting Method – CVM Resolution no. 687 of October 4, 2012.
|
Pronouncements (new or revised) and interpretation applicable to years beginning January 1, 2013
The pronouncements (new or revised) and the interpretation listed below, issued by CPC and approved by CVM, are mandatory for the years beginning January 1, 2013 or later. They are the following:
|
|
·
|
CPC 18 (R2) – Investments in associates and joint ventures – CVM Resolution no. 696 of December 13, 2012;
|
|
|
·
|
CPC 19 (R2) – Joint arrangements – CVM Resolution no. 694 of November 23, 2012;
|
|
|
·
|
CPC 33 (R1) – Employee benefits –CVM Resolution no. 695 of December 13, 2012;
|
|
|
·
|
CPC 36 (R3) – Consolidated statements – CVM Resolution no. 698 of December 20, 2012;
|
|
|
·
|
CPC 45 – Disclosure of interests in other entities – CVM Resolution no. 697 of December 13, 2012; and
|
|
|
·
|
CPC 46 – Fair value measurement – CVM Resolution no. 699 of December 20, 2012.
|
The Company did not early adopt any of these pronouncements (new or revised) and interpretations in its individual and consolidated financial statements as of December 31, 2012.
Management, based on the preliminary analysis performed thus far, estimates that the adoption of CPCs 19 (R2) and 36 (R3) will exert a significant impact on the consolidated financial statements of the Company for 2013, as
certain investments in jointly-controlled investees will no longer be proportionately consolidated and will be accounted for under the equity method.
As required by CPC 23 – Accounting Practices, Changes in Accounting Estimates and Errors, in its consolidated financial statements for 2013, the Company will adopt CPCs 19 (R2) and 36 (R3) retrospectively (adjusting the comparative balances for 2012) and Management, based on the preliminary analysis performed thus far, shows below the best estimate for the possible impacts on the balances for 2012.
|
Balances reported in 2012
|
Impact of the adoption of CPC 19 (R2) and CPC 36 (R3)
|
2012 balances, after the adoption of CPC 19 (R2) and CPC 36 (R3)
|
||||||||||
|
(in thousands of R$)
|
||||||||||||
|
|
||||||||||||
|
Current assets
|
7,218,690 | (1,118,030 | ) | 6,100,660 | ||||||||
|
Non-current assets
|
1,575,371 | (112,698 | ) | 1,462,673 | ||||||||
|
Investments
|
— | 574,798 | 574,798 | |||||||||
|
Property and equipment and intangible assets
|
276,933 | — | 276,933 | |||||||||
|
Total assets
|
9,070,994 | (655,930 | ) | 8,415,064 | ||||||||
|
Current liabilities
|
2,879,590 | (399,751 | ) | 2,479,839 | ||||||||
|
Non-current liabilities
|
3,499,037 | (256,179 | ) | 3,242,858 | ||||||||
|
Total liabilities
|
6,378,627 | (655,930 | ) | 5,722,697 | ||||||||
|
Equity
|
2,692,367 | — | 2,692,367 | |||||||||
|
Total liabilities and equity
|
9,070,994 | (655,930 | ) | 8,415,064 | ||||||||
|
|
||||||||||||
|
Net operating revenue
|
3,953,282 | (383,752 | ) | 3,569,530 | ||||||||
|
Operating costs
|
(2,941,025 | ) | 293,443 | (2,647,582 | ) | |||||||
|
Operating (expenses) / income
|
(840,452 | ) | 18,123 | (822,329 | ) | |||||||
|
Equity pick-up
|
— | 58,200 | 58,200 | |||||||||
|
Financial income
|
(206,940 | ) | 6,830 | (200,110 | ) | |||||||
|
Income and social contribution taxes
|
(41,228 | ) | 7,156 | (34,072 | ) | |||||||
|
Non-controlling interests
|
(48,141 | ) | — | (48,141 | ) | |||||||
|
Net loss for the year
|
(124,504 | ) | — | (124,504 | ) | |||||||
|
Cash flow
|
||||||||||||
|
Operating activities
|
650,945 | 695,734 | 1,346,679 | |||||||||
|
Investing activities
|
161,488 | (309,281 | ) | (147,793 | ) | |||||||
|
Financing activities
|
(322,894 | ) | (504,966 | ) | (827,860 | ) | ||||||
Except for the potential impacts exerted by the adoption of CPC 19 (R2) and CPC 36 (R3) shown above, Management estimates that the adoption of other pronouncements (new or revised) and interpretations will not have a significant impact on the individual and consolidated financial statements of the Company for 2013.
C. Research and Development, Patents and Licenses, etc.
We have a research and development department for new products, processes and methodologies focused on reducing the construction cycle. As of December 31, 2012, 2011 and 2010, we had 7, 10 and 9 employees engaged in research and development activities, respectively. Our research and development expenditures in 2012, 2011 and 2010 were immaterial.
D. Trend Information
Elsewhere in this annual report, including under “Item 3. Key Information—D. Risk Factors” and “Item 5. Operating and Financial Review and Prospects—A. Operating Results—Brazilian Real Estate Sector,” we discuss trends, uncertainties, demands, commitments or events which could have a material effect upon our net sales or
revenues, income from continuing operations, profitability, liquidity or capital resources, or that could cause reported financial information to not necessarily be indicative of future operating results or financial condition.
In addition, while we believe the long term prospects for the Brazilian housing market have not changed, during 2011 and 2012, we recognized that we needed to adjust how we have approached the demand for high growth and diversification in the market in order to achieve sustainable, profitable growth. In the Brazilian housing market, demand has outstripped supply on all fronts, from units and availability of skilled labor, to reliable and experienced suppliers and building partners, to financing, and to the ability to rapidly issue permits and obtain the necessary approvals to deliver units under the
Minha Casa Minha Vida
program.
In the second half of 2011, our management team conducted a detailed analysis of our operations and profitability by project, region and brand and has developed certain strategies to address the market trends that we have identified. As part of our revised strategies, we plan to continue to simplify and streamline our organizational and operational structure to reinforce the fundamental strengths of each of our brands. In particular, we determined the specific geographic markets where each of our brands has the strongest prospects for performance and where we enjoy supply chain efficiencies, and will focus our efforts for each brand in its respective geographic markets. We also implemented a new management structure that, among other things, assigns each brand manager direct responsibility for the operating performance of each brand. In addition, we are implementing a corporate culture shift within our Tenda brand focused on the transfer of receivables and on aligning incentives across the organization (including from senior management to individual project engineers) to encourage project execution based on high-quality, on-time, under-budget performance.
We also expect to continue to build on the progress we have made in consolidating our back office and establishing shared operations among our three brands. With the implementation of the SAP enterprise application software platform across all of our divisions, we believe we will have the appropriate tools and data to make more effective management and supply decisions. We believe the successful implementation of these initiatives will help produce more stable cash flow and contribute toward a return to sustainable growth.
The implementation of these strategic initiatives could have a material effect upon our net sales or revenues, income from continuing operations, profitability, liquidity or capital resources, or could cause reported financial information to not necessarily be indicative of future operating results or financial condition.
E. Off Balance Sheet Arrangements
We currently do not have any off-balance sheet arrangements or significant transactions with unconsolidated entities not reflected in our consolidated financial statements. All of our interests in and/or relationships with our subsidiaries or jointly-controlled entities are recorded in our consolidated financial statements.
F. Tabular Disclosure of Contractual Obligations
The table below presents the maturity of our significant contractual obligations as of December 31, 2012. The table does not include deferred income tax liability.
|
Maturity Schedule
|
||||||||||||||||||||
|
Total
|
Less than 1 year
|
1-3 years
|
3-5 years
|
More than 5 years
|
||||||||||||||||
|
(in millions of R$)
|
||||||||||||||||||||
|
Loans and financing
|
R$ | 2,180.4 | R$ | 812.5 | R$ | 1,176.3 | R$ | 191.6 | R$ | — | ||||||||||
|
Debentures
|
1,735.9 | 346.4 | 1,029.3 | 360.2 | — | |||||||||||||||
|
Interest (1)
|
682,1 | 257.0 | 335.1 | 90.0 | — | |||||||||||||||
|
Real estate development obligations (2)
|
4,693.1 | 2,843.3 | 1,849.8 | — | — | |||||||||||||||
|
Obligations for land purchase
|
480.1 | 388.3 | 87.8 | 4.0 | — | |||||||||||||||
|
Payables to venture partners (3)
|
323.7 | 161.4 | 160.3 | 2.0 | — | |||||||||||||||
|
Credit assignments
|
336.8 | 176.0 | 115.4 | 41.4 | 4.0 | |||||||||||||||
|
Obligations from operating leases
|
51.3 | 14.0 | 23.8 | 13.5 | — | |||||||||||||||
|
Acquisition of investments
|
21.7 | 2.9 | 18.8 | — | — | |||||||||||||||
|
Securitization Fund – FIDC
|
9.6 | 9.6 | — | — | — | |||||||||||||||
|
Other accounts payable
|
241.3 | 174.4 | 66.9 | — | — | |||||||||||||||
|
Total
|
R$ | 10,756.1 | R$ | 5,185.8 | R$ | 4,857.1 | R$ | 709.2 | R$ | 4.0 | ||||||||||
|
(1)
|
Estimated interest payments are determined using the interest rate as of December 31, 2012. However, our long-term debt is subject to variable interest rates and inflation indices, and these estimated payments may differ significantly from payments actually made.
|
|
(2)
|
Including commitments not reflected in the balance—CFC Resolution No. 963. Pursuant to Brazilian GAAP, and since the adoption of CFC Resolution No. 963, the total costs to be incurred on the units launched but not sold are not recorded on our balance sheet. As of December 31, 2012, the amount of “real estate development obligations” related to units launched but not sold was R$2,308.8 million.
|
|
(3)
|
Payables to venture partners accrues a minimum annual dividend equivalent to the variation in CDI, which is not included in the table above.
|
On June 8, 2012, according to the material fact then disclosed, the third phase of the Investment Agreement and Other Covenants entered into on October 2, 2006 (“Investment Agreement”), established the rules and conditions for Gafisa related to the acquisition of the remaining 20% interest in the capital stock of Alphaville not held by the Company. While the valuation of the capital stock has been agreed by both parties, the number of shares that shall be issued by the Company to settle this transaction is being decided in arbitration proceedings initiated by the noncontrolling holders of Alphaville, according to the material fact we released on July 3, 2012. There is an embedded derivative component to the Investment Agreement, relating to the Company’s obligation to purchase the Alphaville shares held by the non-controlling interest. As the fair value of this embedded derivative for all reporting periods has no significant value, since the future settlement of the derivative will be based on the fair value of Alphaville’s capital stock, no derivative asset or liability has been recorded. The future settlement to be made in cash or shares represented an amount of R$359.0 million as at December 31, 2012 and 2011. In case of issuance of 70,251,551 common shares of Gafisa to the other shareholders of Alphaville, these shareholders of Alphaville will receive 13.96% of Gafisa’s total capital stock and will become relevant shareholders of Gafisa.
We also recorded provisions for contingencies in relation to labor, tax and civil lawsuits in the amounts of R$58.6 million and R$149.8 million in current and non-current liabilities, respectively, as of December 31, 2012.
A. Directors and Senior Management Board of Directors
The table below shows the names, positions, and terms of office of the members of our board of directors:
|
Name
|
Age
|
Position
|
Election Date
|
Term of Office(1)
|
|||||
|
Odair Garcia Senra
|
66 |
Chairman
|
May 11, 2012
|
Annual Shareholders’ General Meeting in 2014
|
|||||
|
Nelson Machado(2)(3)
|
65 |
Director
|
May 11, 2012
|
Annual Shareholders’ General Meeting in 2014
|
|||||
|
Guilherme Affonso Ferreira(2)(3)
|
62 |
Director
|
May 11, 2012
|
Annual Shareholders’ General Meeting in 2014
|
|||||
|
Maurício Marcellini Pereira(2)(3)
|
39 |
Director
|
May 11, 2012
|
Annual Shareholders’ General Meeting in 2014
|
|||||
|
Cláudio José Carvalho de Andrade(2)(3)
|
41 |
Director
|
May 11, 2012
|
Annual Shareholders’ General Meeting in 2014
|
|||||
|
José Écio Pereira da Costa Junior(2)(3)
|
61 |
Director
|
May 11, 2012
|
Annual Shareholders’ General Meeting in 2014
|
|||||
|
Gerald Dinu Reiss(2)(3)
|
68 |
Director
|
May 11, 2012
|
Annual Shareholders’ General Meeting in 2014
|
|||||
|
Rodolpho Amboss(2)(3)
|
50 |
Director
|
May 11, 2012
|
Annual Shareholders’ General Meeting in 2014
|
|||||
|
Henri Phillippe Reichstul(2)(3)
|
64 |
Director
|
May 11, 2012
|
Annual Shareholders’ General Meeting in 2014
|
|||||
|
(1)
|
Under Brazilian corporate law, an annual general shareholders’ meeting must take place within the first four months of the calendar year.
|
|
(2)
|
Independent member pursuant to NYSE rules.
|
|
(3)
|
Independent member pursuant to Brazilian Law. According to Brazilian Law, a director is considered independent when: (1) he/she has no relationship with the company, except for holding shares; (2) he/she is not a controlling shareholder, spouse or relative of the controlling shareholder, has not been in the past three years linked to any company or entity related to the controlling shareholder; (3) he/she has not been in the past three years an employee nor an executive of the company, of the controlling shareholder or of any subsidiary of the company; (4) he/she is not a supplier or buyer, direct or indirect, of the company where the arrangement exceeds a certain amount; (5) he/she is not an employee or manager of any company which renders services to the company or which uses services or products from the company; (6) he/she is not a spouse or relative of any member of the company’s management; and (7) he/she does not receive any compensation from the company, except for the compensation related to its position as a board member.
|
None of our directors is entitled to any severance compensation in the event of dismissal from office, except for unpaid portions related to prior years. Our directors are not subject to mandatory retirement due to age.
The following is a summary of the business experience and principal outside business interests of the current members of our board of directors.
Odair Garcia Senra
. Mr. Garcia Senra is currently the chairman of our board of directors. He started as an intern at former Gomes de Almeida Fernandes and occupied positions in the Company as construction engineer, general manager of construction, construction officer, and institutional relations officer. In the past, he has held, among others, the following positions: Operational Officer of Construtora Tenda S.A.; member of the Board of Directors of Alphaville Urbanismo S.A.; Officer of SECOVI SP – Sindicato das Empresas de Compra, Venda, Locação e Administração de Imóveis Residenciais e Comerciais de São Paulo, union for the companies involved in buying, selling and administrating Real Estate in São Paulo; Vice President of SINDUSCON SP – Sindicato da Indústria da Construção Civil do Estado de São Paulo, union for the construction companies in São Paulo; and member of the Board of Directors of São Carlos Empreendimentos e Participações S.A., a company specialized in asset management of commercial Real Estate. He holds a bachelor’s degree in civil engineering from the Civil Engineering School of Mauá and was also a professor at the Civil Engineering School of Mauá in 1972.
Nelson Machado
. Mr. Machado is a member of our board of directors. In the past, he has held, among others, the following positions: Executive Secretary of the Department of Treasury, governmental entity of the administrative structure, responsible for developing and executing the economic policies; Manager of Rocha e Machado Consultoria Ltda., a consulting company, (1) has been a member of the Boards of Directors of Caixa Econômica Federal, a financial institution; Brasilcap Capitalização S.A., a company specialized in savings bond; Brasilprev Seguros S.A., a company specialized in insurance; FINAME, special agency of industry financing; and Petroquisa S.A., company within the Petrobras group, specialized in petrochemical; and (2) has been a member of the Fiscal Councils of Vale S.A., a company specialized in mining; CESP – Companhia Energética de São Paulo, company of generation of electrical energy; Comgas – Companhia de Gás de São Paulo, a natural gas distributor; (i) Terrafoto S.A. Atividades de Aerolevantamentos, a company specialized in photogrammetry; and Companhia Metropolitana de Habitação de São Paulo – Cohab-SP, an entity specialized in fomenting the access to housing for underprivileged population. He holds a law degree from Brasilia University (UnB), a master’s degree in business from EAESP/FGV – SP and a doctorate in accounting and controlling from FEA/USP.
Guilherme Affonso Ferreira
. Mr. Ferreira is currently a member of our board of directors and the CEO of Bahema Participações S.A., a financial investment company. He is also a member of the board of directors of: Companhia Brasileira de Distribuição (Pão de Açucar), a retail company; SulAmérica S.A., an insurance company Valid Soluções e Serviços de Segurança em Meios de Pagamento e Identificação S.A.; a company that specializes in payment facilitation program, system identification and telecommunication; Tavex Algodonera S.A., a textile company; Arezzo Indústria e Comércio S.A., a shoes retailer; Ideiasnet S.A., a technology, media and telecommunications company and Banco Indusval, a financial institution. He holds a production engineering degree from the University of São Paulo and a master’s degree in economics and political science from Macalester College.
Maurício Marcellini Pereira
. Mr. Pereira is currently a member of our board of directors and has also been a member of the board of directors of Elo Serviços S.A., a debit and credit card administrator and Telemar Participações S.A., a telecommunication company. He has also been Investment Officer of
Fundação dos Economiários Federais – FUNCEF
, a pension fund for the employees of Caixa Econômica Federal; Executive Officer of New Business of Caixa Participações S.A. – CAIXAPAR, a company specialized in strategic corporate stakes; member of the Investment Committee of Fundo de Investimentos em Participações Infra Brasil, an
investment fund created by the IDB, which offers credit to private companies to invest in infra-structure; and Finance and Administrative Officer of Grupo Posadas Caesar Park and Executive Partner of Ria Hotelaria Sustentável, both tourism companies. He holds a degree in business administration from Minas Gerais Federal University, an MBA in Finance from Ibmec Business School and is getting his master’s degree in pension economics from Brasília University (UnB).
Cláudio José Carvalho de Andrade
. Mr. Andrade is currently a member of our board of directors, has been a member of the board of directors of Telefônica Data Holding, a telecommunication company and has also been an alternate member of the fiscal councils of Banco Panamericano S.A., a financial institution, Banco Sofisa S.A., Copel – Companhia Paranaense de Energia; an energy development company. He is also a partner in various real estate management companies. He holds a degree in Business Administration from EAESP Getulio Vargas Foundation University.
José Écio Pereira da Costa Júnior
. Mr. Pereira da Costa is a member of our board of directors. He has also been a member of the board of directors of BRMALLS S.A., a shopping mall management company, Princecampos Participações S.A., a public transportation company and Noster Group, a public transportation, vehicle retailer and energy production company and chairman of the fiscal council of Fibria S.A. He has also been an auditing partner of Deloitte Touche Tohmatsu Auditores Independentes S/C Ltda. and a partner at JEPereira Consultoria em Gestão de Negócios S/S Ltda., a consulting company. He holds a bachelor’s degree in business administration from
Fundação Getúlio Vargas
and a bachelor’s degree in accounting from Faculdade São Judas Tadeu.
Gerald Dinu Reiss
. Mr. Reiss is currently a member of our board of directors. He has also been a member of the board of directors of Odontoprev S.A., a company specialized in dental assistance plans; CAEMI Mineração e Metalúrgica S.A., a mining company; Petróleo Brasileiro S.A. – Petrobrás, a petrochemical company and Companhia Brasileira de Distribuição (Pão de Açucar), a retail company. Mr. Reiss has also been an executive officer of Rotapar Investimentos, Administração e Participações S.A., a business consulting company, and Grupo Ultra, a conglomerate acting in the fuel distribution, chemical industry sectors and in the storage of liquid bulks. He holds a bachelor’s degree in electric engineering from Escola Politécnica da Universidade de São Paulo and a PhD in Business Administration from the University of California, Berkeley.
Rodolpho Amboss
. Mr. Amboss is a member of our board of directors. He is also on the board of directors of BR Properties, a construction company specializing in industrial sheds and large commercial buildings and has been an officer in various companies in the real estate sector, such as the Real Estate Private Equity Group of Lehman Brothers and Silverpeak Real Estate Partners LP. He holds a degree in civil engineering from Rio de Janeiro Federal University and an MBA from the Booth School of Business of the University of Chicago.
Henri Phillippe Reichstul
. Mr. Reichstul is a member of our board of directors. He has been on the board of directors of Repsol YPF S.A., a company specialized in production and distribution of fuel, PSA Peugeot Citroen S.A., Foster Wheeler, an engineering company, Companhia Brasileira de Distribuição (Grupo Pão de Açucar), TAM S.A., Vivo Participações, Telebrás S.A., and Centrais Elétricas Brasileira S.A. – Eletrobrás. In addition, he has also been the CEO of Petróleo Brasileiro S.A. – Petrobrás. Mr. Reichstul has an economics degree from the University of São Paulo and a post-graduate degree from Oxford University’s Hartford College.
The table below shows the names, positions, and terms of office of our executive officers:
|
Name
|
Age
|
Position
|
Election Date
|
Term of Office
|
|||||
|
Alceu Duilio Calciolari
|
50 |
Chief Executive Officer
|
May 25, 2012
|
May 25, 2015
|
|||||
|
Andre Bergstein
|
42 |
Chief Financial Officer and Investor Relations Officer
|
May 25, 2012
|
May 25, 2015
|
|||||
|
Sandro Rogério da Silva Gamba
|
37 |
Executive Officer of Gafisa
|
May 25, 2012
|
May 25, 2015
|
|||||
|
Luiz Carlos Siciliano
|
48 |
Operational Executive Officer
|
May 25, 2012
|
May 25, 2015
|
|||||
|
Fernando Cesar Calamita
|
46 |
Operational Executive Officer
|
May 25, 2012
|
May 25, 2015
|
|||||
|
Rodrigo Ferreira Coimbra Pádua
|
38 |
Operational Executive Officer
|
May 25, 2012
|
May 25, 2015
|
|||||
None of our executive officers is entitled to any severance compensation in the event of dismissal from office, except the unpaid portions related to prior years. The business address of each of our executive officers is Av. Nações Unidas No. 8,501, 19th floor , 05425-070 – São Paulo, SP – Brazil.
The following is a summary of the business experience and principal outside business interests of the current members of our board of executive officers.
Alceu Duilio Calciolari
. Mr. Calciolari is currently our chief executive officer, and his current term commenced in May 2012, with a term of office through May 25, 2015. He is also the coordinator of the Finance Executive Committee and the Investments Executive Committee and member of the board of directors of Construtora Tenda S.A. and Alphaville Urbanismo S.A. He holds a bachelor’s degree in business administration from Faculdades Metropolitanas Unidas and a master’s degree in controllership from Pontifícia Universidade de São Paulo. Mr. Calciolari started his career as a trainee at ABN AMRO Real S.A. in 1978 and worked as an auditor, from 1983 to 1996, at Arthur Andersen LLP. He was also chief finance officer at Tupy S.A., from 1996 to 1998, and ALL—America Latina Logística S.A., from 1998 to 2000. Mr. Calciolari has been our chief financial officer and investor relations since 2000 and has been our chief executive officer since May 9, 2011.
Andre Bergstein
. Mr. Bergstein is currently our chief financial officer and investor relations officer, and his current term commenced in May 2012, with a term of office through May 25, 2015. He is also a member of the board of directors of Construtora Tenda S.A. and Alphaville Urbanismo S.A. In the past five years he has also occupied the following positions: (i) Real Estate Executive of Plural Capital Gestora de Recursos Ltda., an asset management company; (ii) CFO of Brazilian Securities Cia de Securitização S.A., a securitization of financial credits company; (iii) CFO and Investor Relations Officer of Brazilian Finance & Real Estate S.A., holding company of Brazilian Securities Cia de Securitização S.A.
Sandro Rogério da Silva Gamba
. Mr. Gamba is currently the executive officer of our Gafisa segment and his current term commenced in May 2012, with a term of office through May 25, 2015. With over 15 years at Gafisa, having worked as head of business development for Gafisa and Tenda in the São Paulo region, he has significant institutional knowledge and oversaw the growth of our business in São Paulo, our largest region. Previously, he served us in a number of senior roles in the São Paulo region, including head of business development for Gafisa and director and manager of land prospecting. Mr. Gamba holds a degree in civil engineering from Mackenzie University, advanced degrees in engineering and real estate management from the University of São Paulo and
Fundação Armando Alvares Penteado
, and an executive master’s in business administration from IBMEC.
Luiz Carlos Siciliano
. Mr. Siciliano is currently one of our operational executive officers, responsible internally for the supply chain , IT, legal department and shared services center, and his current term commenced in May 2012, with a term of office through May 25, 2015. He is also a member of the investment executive committee. Mr. Siciliano brings considerable sales and marketing managerial expertise to his newly expanded role from both his tenure at Gafisa as well as from his prior professional experiences. He has worked for us since 2005, as head of business development in the state of Rio de Janeiro and director of sales and marketing. Prior to joining us, Mr. Siciliano worked at AmBev from 1992 to 2004 in positions of increasing responsibility, and he holds master’s in business administration degrees from IBMEC and Pontifícia Universidade Católica (PUC) in Rio de Janeiro.
Fernando Cesar Calamita
. Mr. Calamita is currently one of our operational executive officers, responsible internally for the control department, and his current term commenced in May 2012, with a term of office through May 25, 2015. He is also a member of the financial executive committee and ethics executive committee and member of the Board of Directors of Construtora Tenda S.A. Before joining us he was Vice-President of Finance and Administration of Kidde do Brasil S.A., a company specialized in engineering and manufacturing of security equipment.
Rodrigo Ferreira Coimbra Pádua
. Mr. Pádua is currently one of our operational executive officers, responsible internally for the human resources department, and his current term commenced in May 2012, with a term of office through May 25, 2015. He is also the chairman of the ethics executive committee. Before joining us he was (i) Manager of Human Resources and Projects of AmBev, company specialized in commercialization of beverages; and (ii) Manager of Human Resources of Danone S.A., company specialized in the commercialization of food and milky products.
Our Relationship with our Executive Officers and Directors
As of December 31, 2012, there were no contracts of any type or any other material agreements entered into by us with the members of our board of directors and our board of officers. As of December 31, 2011, our board of officers in the aggregate held 0.3% of our share capital and our board of directors in the aggregate held less than a 0.3% direct or indirect interest in our share capital. As of December 31, 2012, our board of officers in the aggregate held 0.3% of our share capital and our board of directors in the aggregate held less than a 0.1% direct or indirect interest in our share capital. Also, as of December 31, 2012, some of our executive officers held interests in our subsidiaries as partners, minority shareholders, and/or directors and executive officers. In none of these cases, as of the referenced date, were the interests held material. In addition, there is no family relationship among our executive officers, directors or controlling shareholders, if any.
B. Compensation
Under Brazilian corporate law, the company’s shareholders are responsible for establishing the aggregate amount paid to members of the board of directors, the executive officers and the members of the fiscal council. Once the shareholders establish an aggregate amount of compensation, the members of the board of directors are then responsible for setting individual compensation levels.
For each of 2012, 2011 and 2010, the aggregate compensation we paid to the members of the board of directors was R$2.2 million, R$1.7 million and R$1.0 million, respectively, considering Gafisa, Tenda and Alphaville.
For each of 2012, 2011 and 2010, the aggregate compensation we paid to the members of the fiscal council was R$249.9 thousand, R$188.3 thousand and R$206.6 thousand, respectively, considering Gafisa, Tenda and Alphaville.
For each of 2012, 2011 and 2010, the aggregate compensation we paid to the executive officers was R$37.5 million, R$20.5 million and R$14.7 million, respectively, which includes fixed compensation, annual bonus amounts and the costs related to Stock Options Programs, considering Gafisa, Tenda and Alphaville.
Approximately 70% of the total compensation paid to our officers is variable. The amounts related to short-term bonuses paid for our officers were, for each of 2012, 2011 and 2010, R$18.9 million, R$5.9 million and R$5.6 million, respectively.
For each of 2012, 2011 and 2010, the individual compensation we paid to members of our board of directors (fixed compensation in 2010; fixed compensation and costs related to Stock Options Programs in 2011 and 2012), fiscal council (fixed compensation) and officers (fixed compensation, short-term bonus and costs related to Stock Options Programs) is set forth in the tables below.
Gafisa
|
2012
|
Board of Directors
|
Fiscal Council
|
Executive Officers
|
|||||||||
|
Number of members (1)
|
9.00 | 3.00 | 5.83 | |||||||||
|
Annual highest individual compensation (in R$)
|
320,824 | 45,600 | 6,123,879 | |||||||||
|
Annual lowest individual compensation (in R$)
|
224,056 | 45,600 | 3,165,013 | |||||||||
|
Annual average individual compensation (in R$)
|
244,561 | 45,980 | 3,575,601 | |||||||||
|
(1)
|
Based on the average number of members during the period.
|
|
(2)
|
Annual lowest individual compensation includes only the members of board of directors, fiscal council and executive officers who served an entire year and does not include members who are also executive officers (if a member is an executive officer, he or she is paid as an executive officer).
|
|
2011
|
Board of Directors
|
Fiscal Council
|
Executive Officers
|
|||||||||
|
Number of members (1)
|
8.00 | 3.00 | 5.92 | |||||||||
|
Annual highest individual compensation (in R$)
|
293,062 | 45,600 | 2,679,168 | |||||||||
|
Annual lowest individual compensation (in R$)
|
129,478 | 45,600 | 1,539,857 | |||||||||
|
Annual average individual compensation (in R$)
|
212,854 | 45,600 | 1,942,100 | |||||||||
|
(1)
|
Based on the average number of members during the period.
|
|
(2)
|
Annual lowest individual compensation includes only the members of board of directors, fiscal council and executive officers who served an entire year and does not include members who are also executive officers (if a member is an executive officer, he or she is paid as an executive officer).
|
|
2010
|
Board of Directors
|
Fiscal Council
|
Executive Officers
|
|||||||||
|
Number of members (1)
|
5.67 | 3.00 | 5.00 | |||||||||
|
Annual highest individual compensation (in R$)
|
242,100 | 45,600 | 2,479,913 | |||||||||
|
Annual lowest individual compensation (in R$)(2)
|
161,400 | 45,600 | 1,453,309 | |||||||||
|
Annual average individual compensation (in R$)
|
168,547 | 45,600 | 1,842,653 | |||||||||
|
(1)
|
Based on the average number of members during the period.
|
|
(2)
|
Annual lowest individual compensation includes only the members of board of directors who served an entire year and does not include members who are also executive officers (if a member is an executive officer, he or she is paid as an executive officer).
|
Tenda
|
2012
|
Board of Directors (3)
|
Fiscal Council
|
Executive Officers
|
|||||||||
|
Number of members(1)
|
3.67 | 3.00 | 7.67 | |||||||||
|
Annual highest individual compensation (in R$)
|
- | 38,400 | 3,918,356 | |||||||||
|
Annual lowest individual compensation (in R$)
|
- | 7,464 | 3,918,356 | |||||||||
|
Annual average individual compensation (in R$)
|
- | 17,776 | 1,460,677 | |||||||||
|
(1)
|
Based on the average number of members during the period.
|
|
(2)
|
Annual lowest individual compensation includes only the members of board of directors, fiscal council and executive officers who served an entire year and does not include members who are also executive officers (if a member is an executive officer, he or she is paid as an executive officer).
|
|
(3)
|
Members of the Board of Directors at Tenda were also Executive Officers at Gafisa and therefore received compensation for this function.
|
|
2011
|
Board of Directors (3)
|
Fiscal Council
|
Executive Officers (3)
|
|||||||||
|
Number of members (1)
|
3.00 | 3.00 | 5.9 | |||||||||
|
Annual highest individual compensation (in R$)
|
- | 25,600 | - | |||||||||
|
Annual lowest individual compensation (in R$)
|
- | 6,530 | - | |||||||||
|
Annual average individual compensation (in R$)
|
- | 17,153 | - | |||||||||
|
(1)
|
Based on the average number of members during the period.
|
|
(2)
|
Annual lowest individual compensation includes only the members of board of directors, fiscal council and executive officers who served an entire year and does not include members who are also executive officers (if a member is an executive officer, he or she is paid as an executive officer).
|
|
(3)
|
Members of the Board of Directors and Executive Officers at Tenda were Executive Officers at Gafisa and therefore received compensation for this function.
|
|
2010
|
Board of Directors
|
Fiscal Council
|
Executive Officers
|
|||||||||
|
Number of members (1)
|
3.67 | 3.00 | 5.08 | |||||||||
|
Annual highest individual compensation (in R$)
|
25,000 | 37,600 | 162,500 | |||||||||
|
Annual lowest individual compensation (in R$)
|
n.a.
|
37,600 |
n.a.
|
|||||||||
|
Annual average individual compensation (in R$)
|
17,045 | 23,253 | 61,803 | |||||||||
|
(1)
|
Based on the average number of members during the period.
|
|
(2)
|
Annual lowest individual compensation includes only the members of board of directors, fiscal council and executive officers who served an entire year and does not include members who are also executive officers (if a member is an executive officer, he or she is paid as an executive officer). And for 2010, the only members of the Board of Directors and Executive Officers that served the entire year were also executive officers at Gafisa, therefore this information is not applicable for this year.
|
Alphaville
|
2012
|
Board of Directors (3)
|
Fiscal Council
|
Executive Officers
|
|||||||||
|
Number of members (1)
|
5.00 | 3.00 | 4.17 | |||||||||
|
Annual highest individual compensation (in R$)
|
- | 19,560 | 2,506,438 | |||||||||
|
Annual lowest individual compensation (in R$)
|
- | 19,560 | 1,326,440 | |||||||||
|
Annual average individual compensation (in R$)
|
- | 19,560 | 1,354,882 | |||||||||
|
(1)
|
Based on the average number of members during the period.
|
|
(2)
|
Annual lowest individual compensation includes only the members of board of directors, fiscal council and executive officers who served an entire year and does not include members who are also executive officers (if a member is an executive officer, he or she is paid as an executive officer).
|
|
(3)
|
Members of th
e
Board of Directors at Alphaville were also Executive Officers at Gafisa and therefore received compensation for this function.
|
|
2011
|
Board of Directors (3)
|
Fiscal Council (4)
|
Executive Officers
|
|||||||||
|
Number of members (1)
|
5.00 | - | 4.00 | |||||||||
|
Annual highest individual compensation (in R$)
|
- | - | 3,375,992 | |||||||||
|
Annual lowest individual compensation (in R$)
|
- | - | 1,445,683 | |||||||||
|
Annual average individual compensation (in R$)
|
- | - | 2,184,555 | |||||||||
|
(1)
|
Based on the average number of members during the period.
|
|
(2)
|
Annual lowest individual compensation includes only the members of board of directors, fiscal council and executive officers who served an entire year and does not include members who are also executive officers (if a member is an executive officer, he or she is paid as an executive officer).
|
|
(3)
|
Members of the Board of Directors at Alphaville were also Executive Officers at Gafisa and therefore received compensation for this function.
|
|
(4)
|
The Fiscal Council was installed in 2012.
|
|
2010
|
Board of Directors (3)
|
Fiscal Council (4)
|
Executive Officers
|
|||||||||
|
Number of members (1)
|
5.00 | - | 3.75 | |||||||||
|
Annual highest individual compensation (in R$)
|
- |
-
|
1,365,695 | |||||||||
|
Annual lowest individual compensation (in R$)
|
- |
-
|
1,023,111 | |||||||||
|
Annual average individual compensation (in R$)
|
- |
-
|
1,323,763 | |||||||||
|
(1)
|
Based on the average number of members during the period.
|
|
(2)
|
Annual lowest individual compensation includes only the members of board of directors, fiscal council and executive officers who served an entire year and does not include members who are also executive officers (if a member is an executive officer, he or she is paid as an executive officer).
|
|
(3)
|
Members of the Board of Directors at Alphaville were also Executive Officers at Gafisa and therefore received compensation for this function.
|
|
(4)
|
The Fiscal Council was installed in 2012.
|
C. Board Practices
General Information
We are managed by a board of directors consisting of at least five and up to nine directors and at least two and up to eight executive officers. Our directors are elected for a two-year term and our executive officers are elected for a three-year term. Reelection of officers and directors is permitted. We also have (1) a fiscal council, which under Brazilian Law is not a permanent body, although currently installed; (2) permanent advisory committees created in accordance with our bylaws, namely: an audit committee, a compensation committee and a nominating and corporate governance committee; and (iii) executive committees established by the Board of Directors, namely: an investment executive committee, a finance executive committee, and an ethics executive committee. See “—A. Directors and Senior Management.”
Board of Directors
Our board of directors is our decision-making body responsible for formulating general guidelines and policies for our business, including our long term strategies. Among other things, our board of directors is responsible for appointing and supervising our executive officers.
Our board of directors meets at least once every two months and at any other times when a meeting is called by its chairman or by at least two other members. The decisions of our board of directors are taken by the majority vote of those members present at the respective meeting and constituting a quorum of at least four members. In the event of a tie vote, the chairman of our board of directors has, in addition to his personal vote, the right to cast a tie-breaking vote. In addition, pursuant to Brazilian corporate law, a member of our board of directors is prevented from voting in any shareholders’ or board of directors’ meeting, or from acting in any business or transaction, in which he may have a conflict of interest with our company.
Under Brazilian corporate law, a company’s board of directors must have at least three members. Our bylaws provide for a board of directors of up to nine members, from which at least 20% shall be independent members, as determined by the Listing Rules of the
Novo Mercado
. Our directors are elected at our annual general shareholders’ meeting for a two-year term of office, with reelection permitted, and are subject to removal at any time by our shareholders at a shareholders’ general meeting. Although the Listing Rules of the
Novo Mercado
require at least 20% independent members, our board of directors currently has eight independent members, out of a total of nine members.
Paragraph 4 of Article 141 of Brazilian corporate law provides that shareholders with at least 10% of a company’s total capital stock may request the adoption of the multiple voting procedure for the election of the board of directors, even where there is no provision for this in the company’s bylaws. The multiple voting procedure grants each share as many votes as the number of board members, and allows shareholders to allocate either all of their votes to a single candidate or to distribute their votes among several candidates.
All the voting proceedings discussed in the previous paragraphs currently apply to our company.
As prescribed by CVM Instruction No. 282, of June 26, 1998, the minimum voting capital percentage required for the adoption of the multiple voting procedure in publicly-held companies may be reduced as a result of the amount of its capital stock. Based on the current amount of our capital stock, shareholders representing 5% of our total capital stock may request the adoption of the multiple voting procedure in order to elect the members to our board of directors. The referred minimum percentage may vary from 5% to 10% depending on the amount of our capital stock, as prescribed in the aforementioned CVM instruction. If the adoption of the multiple voting procedure is not requested, directors are elected by a majority vote of our shareholders, and such shareholders who, individually or collectively, represent at least 10% of our shares, are entitled to appoint, in a separate vote, a director and its alternate.
The Listing Rules of the
Novo Mercado
also provide that all members of our board of directors and our board of officers must comply, by means of the execution of a management compliance statement, with obligations set forth under the
Novo Mercado
Listing Agreement, the Market Arbitration Chamber Rules and the Listing Rules of the
Novo Mercado
, including, but not limited, to: (1) any shareholder that becomes our controlling shareholder, or becomes part of our controlling group, must comply, by means of executing of the controlling shareholder compliance statement, with the obligations set forth under the
Novo Mercado
Listing Agreement, the Market
Arbitration Chamber Rules and the Listing Rules of the
Novo Mercado
; (2) any indirect controlling shareholder of our company must fully comply with the obligations established in the
Novo Mercado
Listing Agreement, the Market Arbitration Chamber Rules, the Listing Rules of the
Novo Mercado
, Brazilian corporate law, Brazilian Securities Regulations and our bylaws; (3) use best efforts to ensure that our shares are widely held through public share offerings; (4) re-establish the minimum percentage of outstanding floating stock, in case additional shares are issued or the controlling power over our company is transferred; (5) inform BM&FBOVESPA with respect to the trading of the securities held by our controlling shareholders; (4) comply with the rules imposed on our directors in the event our public company registration with the CVM is cancelled; and (7) comply with rules and regulations applicable in the event of the delisting of our company from the
Novo Mercado
.
Executive Officers
Under Brazilian corporate law, a company’s board of executive officers must have at least two members, and each of such members must be a resident in Brazil, but is not required to be a shareholder of the company. Furthermore, no more than one-third of our directors may serve as members of our board of officers at any given time. In addition, under the Listing Rules of the
Novo Mercado
, the chief executive officer of our company shall not serve as the chairman of the board of directors.
Our executive officers are our legal representatives and are primarily responsible for managing our day-to-day operations and implementing the general policies and guidelines set forth in our shareholders’ general meetings and by our board of directors. Our bylaws require that our board of officers be composed of at least two members and a maximum of eight members. The members of our board of officers are appointed by our board of directors for a term of three-years, and may be reelected or removed by our board of directors at any time. Our bylaws and our board of directors determine the role of our executive officers. Currently, we have a board of officers comprised of six members: (1) Mr. Alceu Duilio Calciolari, who is the chief executive officer, (2) Mr. Andre Bergstein, who is the chief financial officer and investor relations officer, (3) Mr. Sandro Rogerio da Silva Gamba, who is the executive officer of Gafisa, (4) Mr. Luis Carlos Siciliano, who is an operational executive officer, (5) Mr. Fernando Cesar Calamita, who is an operational executive officer, and (6) Mr. Rodrigo Ferreira Coimbra Pádua, who is an operational executive officer.
The chief executive officer submits the business plan, annual budget, investment plans and new expansion plans for Gafisa and our subsidiaries to the approval of the board of directors. The chief executive officer enacts these plans and develops our strategy and operational plan, including the manner in which we will execute the resolutions approved at the shareholders’ meeting and by the board of directors. Together with the other officers, he also supervises and coordinates our activities. The officer in charge of investor relations supplies our financial information to investors, the CVM and the BM&FBOVESPA, and is also responsible for keeping an updated register based on the applicable regulations.
Fiscal Council
Under Brazilian corporate law, the fiscal council is a corporate body independent from the management of the company and its external auditors. The fiscal council is not a permanent body, and whenever installed, must consist of no less than three and no more than five members. The primary responsibility of the fiscal council is to review management’s activities and the company’s financial statements and to report its findings to the shareholders of the company. The fiscal council is not equivalent to an audit committee as contemplated by the Securities Exchange Act, as amended. Under Brazilian corporate law, a fiscal council must be established at a shareholders’ general meeting upon request of shareholders representing at least 10% of the shares with voting rights, or 5% of the shares with no voting rights, and its members shall remain in office until the annual general shareholders’ meeting of the year following their election. Each member of the fiscal council is entitled to receive compensation in an amount equal to at least 10% of the average amount paid to each executive officer (excluding benefits and profit sharing).
Individuals who are also employees or members of the administrative bodies of our company, of companies controlled by us, or of companies forming a group of companies with us (pursuant to Chapter XXI of Law No. 6,404/76), as well as spouses or parents of our management, cannot serve on the fiscal council.
Our by-laws provide for a non-permanent fiscal council composed of at least three and up to five members, which can be formed and have its members elected at the shareholders’ general meeting, as requested by the
shareholders, in the events set forth by Brazilian corporate law. When in operation, the compensation of our fiscal council is set at the shareholders’ general meeting that elects it.
Our fiscal council has three members (Olavo Fortes Campos Rodrigues Junior, Adriano Rudek de Moura and Luis Fernando Brum de Melo) and two alternates (Marcello Mascotto Iannalfo and Laiza Fabiola Martins de Santa Rosa).
We also have established a permanent audit committee. See “Item 6.C. Directors, Senior Management and Employees—Board Practices—Audit Committee.”
Audit Committee
Our bylaws provide for an Audit Committee that convenes regularly, as often as it determines is appropriate to carry out its responsibilities. The Audit Committee must be comprised of at least three members, all of which must be independent members of our Board of Directors. The Audit Committee is currently comprised by Jose Ecio Pereira da Costa Junior, who is also the chairman, Nelson Machado and Maurício Marcellini Pereira, each of whom is a director of our company. Our board of directors has determined that Jose Ecio Pereira da Costa Junior, Nelson Machado and Maurício Marcellini Pereira are each independent as set forth in the NYSE Listed Companies Manual as well as being independent for the purpose of Rule 10A-3 of the Exchange Act. Our board of directors has determined that Jose Ecio Pereira da Costa Junior is an audit committee financial expert within the meaning of the regulations promulgated by the United States Securities and Exchange Commission.
This committee has responsibility for planning and reviewing our annual and quarterly reports and accounts with the involvement of our auditors, focusing particularly on compliance with legal requirements and accounting standards, and ensuring that an effective system of internal financial controls is maintained, as set forth in the Company’s by-laws. The ultimate responsibility for reviewing and approving our annual and quarterly reports and accounts remains with our directors.
Compensation Committee
Our bylaws provide for a Compensation Committee that convenes regularly, as often as it determines is appropriate to carry out its responsibilities. The Compensation Committee must be comprised of at least three members, all of which must be independent members of our Board of Directors. The Compensation Committee is currently comprised by Henri Philippe Reichstul, who is also the chairman, Guilherme Affonso Ferreira and Cláudio José Carvalho de Andrade. This committee, among other things, reviews and makes recommendations to our directors regarding its compensation policies and all forms of compensation to be provided to our executive officers and other employees.
Nominating and Corporate Governance Committee
Our bylaws provide for a Nominating and Corporate Governance Committee that convenes regularly, as often as it determines is appropriate to carry out its responsibilities. The Nominating and Corporate Governance Committee must be comprised of at least three members, all of which must be independent members of our Board of Directors. The Nominating and Corporate Governance Committee is currently comprised by Gerald Dinu Reiss, who is also the chairman, Rodolpho Amboss and Maurício Marcellini Pereira. This committee, among other things, considers and periodically reports on matters relating to the size, identification, selection and qualification of the board of directors, executive officers and candidates nominated for the board of directors and its committees and is responsible for overseeing compliance with the corporate governance principles applicable to us under our bylaws and other policies, as well as for proposing improvements and changes to such applicable principles.
Investment Executive Committee
On January 13, 2006, our board of directors modified the structure of our incorporation and new businesses committee, renaming it the Investment Committee and on September 9, 2010 it was renamed to Investment Executive Committee, in order to clarify that this is a collegiate body to provide advice and guidance to the Board of Directors, composed solely by members of the Board of Officers (statutory or otherwise). Our Investment Executive Committee is a non-permanent body and its duties are to: (1) analyze, discuss and recommend land acquisitions and new real estate developments; (2) advise our executive officers during the negotiation of new deals and the structuring of new developments; (3) supervise the beginning of new projects and their related cash flows;
and (4) in special cases, assist in the negotiation and structuring of new types of business. Each decision by our investment committee to acquire land is made by ensuring that the investment meets the minimum return threshold set by us and comparing it with other potential investments. Such decision is made independent of the geographical location of the investment in order to maximize return on our capital allocation as a whole.
Currently, our Investment Executive Committee is in operation and is comprised by Alceu Duilio Calciolari (also the Coordinator of the Committee), Andre Bergstein, Sandro Rogério da Silva Gamba, Rodrigo Osmo and Luiz Carlos Siciliano.
Finance Executive Committee
Our directors have established a Finance Executive Committee composed of three members; currently, they are Alceu Duilio Calciolari (also the Coordinator of the Committee), Andre Bergstein and Fernando Cesar Calamita. This committee evaluates and makes periodic recommendations to our board of directors regarding risk and financial investments policies.
Ethics Executive Committee
In September 2010, our board of directors established an Ethics Executive Committee, as a collegiate body to provide advice and guidance to the board of directors, elected by the board of directors, and composed primarily of members of the board of officers (statutory or otherwise). Currently is composed of five members: André Bergstein (Coordinator of the Committee), Rodrigo Ferreira Coimbra Pádua, Fernando Cesar Calamita, Luiz Carlos Siciliano and Norival Zanata Junior. This committee is responsible for the actions related to violation of our Code of Business Conduct and Ethics, solving ethics conflicts and evaluating the adequacy of amendments to the Code of Business Conduct and Ethics and proposing them to the board of directors.
Summary of Significant Differences of Corporate Governance Practices
NYSE Corporate Governance Rules provide that we are required to disclose any significant differences on our corporate governance practices from those required to be followed by U.S. companies under NYSE listing standard. We have summarized these significant differences below.
We are permitted to follow practice in Brazil in lieu of the provisions of the NYSE Corporate Governance Rules, except that we will be required to have a qualifying audit committee under Section 303A.06 of the Rules, or avail ourselves of an appropriate exemption. In addition, Section 303A.12(b) provides that our chief executive officer is obligated to promptly notify the NYSE in writing after any of our executive officers becomes aware of any material non-compliance with any applicable provisions of the NYSE Corporate Governance Rules.
Majority of Independent Directors
NYSE Rule 303A.01 provides that each NYSE-listed company must have a majority of independent directors. Neither Brazilian corporate law nor our by-laws require that we have a majority of independent members. Notwithstanding this, the majority of our board members qualify as independent directors under NYSE rules.
Separate Meetings of Non-Management Directors
NYSE Rule 303A.03 provides that the non-management directors of each NYSE-listed company must meet at regularly scheduled executive sessions without management. According to the Listing Rules of the
Novo Mercado
, the chief executive officer may not serve as the chairman of the Board of Directors. In addition, under Brazilian corporate law, up to one-third of the members of the board of directors can also hold management positions. Under Brazilian corporate law, there is no specific requirement that non-management directors meet regularly without management. Notwithstanding the foregoing, our board of directors consists entirely of non-management directors and as such we believe we are in compliance with the NYSE Rule 303A.03.
Nominating and Corporate Governance Committee
NYSE Rule 303A.04 provides that each U.S. listed company must have a nominating and corporate governance committee composed entirely of independent directors. We are required to have such a committee under our bylaws, which is nevertheless not required under Brazilian law. Therefore, we have a Nominating and Corporate Governance
Committee responsible for considering and periodically reporting on matters relating to the size, identification, selection and qualification of the board of directors and candidates nominated for the board of directors and its committees; and for overseeing compliance with the corporate governance principles applicable to us under our bylaws and other policies, as well as for proposing improvements and changes to such applicable principles.
Compensation Committee
NYSE Rule 303A.05 provides that each U.S. listed company must have a compensation committee composed entirely of independent directors. We are required to have such a committee under our bylaws, which is nevertheless not required under Brazilian law. Therefore, we have a Compensation Committee responsible for reviewing and making recommendations to our directors regarding our compensation policies and all forms of compensation to be provided to our executive officers and other employees. With respect to compensation, under Brazilian corporate law, the shareholders determine the total or individual compensation of our board members and executive officers, including benefits and allowances, at a general shareholders’ meeting. If the shareholders only determine the total compensation, it is incumbent upon the board of directors to establish the individual amounts. The Compensation Committee, is responsible for advising the board of directors in such task. See “Item 6.B. Directors, Senior Management and Employees—Compensation.”
Audit Committee
NYSE Rule 303A.06 and the requirements of Rule 10A-3 of the SEC provide that each U.S. listed company is required to have an audit committee consisting entirely of independent members that comply with the requirements of Rule 10A-3. In addition, the audit committee must have a written charter compliant with the requirements of NYSE Rule 303.A.07(c), have an internal audit function and otherwise fulfill all other requirements of the NYSE and Rule 10A-3. The SEC recognized that due to the local legislation for foreign private issuers, some of the functions of the audit committee could be subordinated by local laws to our other bodies.
We are required to have such a committee under our bylaws, which is nevertheless not required under Brazilian law. Therefore, we have an Audit Committee with the following responsibilities:
|
|
·
|
Pre-approving services to be provided by our independent auditor;
|
|
|
·
|
Choosing and overseeing the work of any accounting firm engaged for the purpose of preparing or issuing an audit report or performing any other service;
|
|
|
·
|
Reviewing auditor independence issues and rotation policy;
|
|
|
·
|
Supervising the appointment of our independent auditors;
|
|
|
·
|
Discussing with management and auditors major audit issues;
|
|
|
·
|
Reviewing financial statements prior to their publication, including the related notes, management’s report and auditor’s opinion;
|
|
|
·
|
Reviewing our annual report and financial statements;
|
|
|
·
|
Providing recommendations to the board of directors on the audit committee’s policies and practices;
|
|
|
·
|
Reviewing recommendations given by our independent auditor and internal audits and management’s responses;
|
|
|
·
|
Evaluating the performance, responsibilities, budget and staffing of our internal audit function and review the internal audit plan;
|
|
|
·
|
Providing recommendations on the audit committee’s bylaws; and
|
|
|
·
|
Reviewing our Code of Business Conduct and Ethics and the procedures for monitoring compliance with it.
|
Equity Compensation Plans
NYSE Rule 303A.08 provides that shareholders must be given the opportunity to vote on all equity compensation plans and material revisions thereto, with certain limited exemptions as described in the rule. Under Brazilian corporate law, shareholder pre-approval is required for the adoption of equity compensation plans and any material revision thereto.
Corporate Governance Guidelines
NYSE Rule 303A.09 provides that each U.S. listed company must adopt and disclose their corporate governance guidelines. Although we do not have a similar requirement under Brazilian law, our bylaws contain a comprehensive list of principles that must be complied with at all times by all of our directors and officers. Our Nominating and Corporate Governance Committee may also propose new principles and amendments to existing principles. In addition, we have listed our common shares in the
Novo Mercado
(New Market) of the São Paulo Stock Exchange (BM&FBOVESPA), which requires adherence to the corporate governance standards established under the Listing Rules of the
Novo Mercado
, as described under “Item 10. Additional Information—B. Memorandum and Bylaws.” Finally, we have adopted a written policy of trading of securities and disclosure matters.
Code of Business Conduct and Ethics
NYSE Rule 303A.10 provides that each U.S. listed company must adopt and disclose a code of business conduct and ethics for directors, officers and employees and promptly disclose any waivers of the code for directors or executive officers. We are required to have a Code of Business Conduct and Ethics under our bylaws and under the Listing Rules of the
Novo Mercado
. We have adopted such a Code on July 10, 2007. See “Item 16B. Code of Business Conduct and Ethics.”
D. Employees
As of December 31, 2012, we had 4,024 employees at Gafisa Group across the following states:
|
States
|
Number of Employees
|
|||
|
Alagoas
|
11 | |||
|
Amazonas
|
6 | |||
|
Bahia
|
364 | |||
|
Goiás
|
47 | |||
|
Maranhão
|
16 | |||
|
Minas Gerais
|
199 | |||
|
Pará
|
177 | |||
|
Paraíba
|
2 | |||
|
Paraná
|
80 | |||
|
Pernambuco
|
46 | |||
|
Piauí
|
8 | |||
|
Rio de Janeiro
|
773 | |||
|
Rio Grande do Sul
|
176 | |||
|
Rondonia
|
8 | |||
|
Sergipe
|
1 | |||
|
São Paulo
|
2,110 | |||
|
Total
|
4,024 | |||
The table below shows the number of employees for the period presented, within the macro areas of the company:
|
Period
|
Operations
|
Administration & Finance
|
Business Development
|
Sales
|
Total
|
|||||||||||||||
|
2012
|
2,551 | 811 | 395 | 267 | 4,024 | |||||||||||||||
|
2011
|
3,459 | 695 | 301 | 332 | 4,787 | |||||||||||||||
|
2010
|
3,202 | 699 | 331 | 394 | 4,626 | |||||||||||||||
|
2009
|
4,721 | 734 | 234 | 464 | 6,153 | |||||||||||||||
|
Note:
|
The numbers presented in the tables above for the year of 2012 refer to the employees of Gafisa Group (Gafisa’s Business Unit, Tenda’s Business Unit, Alphaville’s Business Unit as well as the corporate areas, including the shared services centre).
|
Our administrative employees carry out management, finance, information technology, legal and human resources activities among others. Our construction site employees focus on management and oversight of our construction workers, the majority being outsourced. The outsourced professionals are hired by the contractors to carry out various tasks on the construction sites. As of the date of this annual report, we estimate that around 24,000 outsourced professionals are providing services to Gafisa, Tenda and Alphaville across the following regions:
|
Region
|
Outsourced Professionals
|
|||
|
North/CentralWest
|
1,267 | |||
|
Northeast
|
4,097 | |||
|
South
|
3,161 | |||
|
Southeast
|
16,143 | |||
|
Total
|
24,668 | |||
We offer training programs to our employees, subcontractors and outsourced employees. All of our professionals involved in the construction of our developments are trained prior to the beginning of their work and are supervised directly by our engineers.
The majority of our employees and outsourced professionals of the State of São Paulo are enrolled with the Civil Construction Industries Workers’ Union (SINTRACON). As a rule, the Civil Construction of Large Building Industry in the State of São Paulo (SINDUSCON-SP) annually negotiates with SINTRACON collective bargaining agreements applicable to our employees. The most recent collective bargaining agreement for our employees and outsourced professionals in the State of São Paulo was executed in May 2012, establishing a salary adjustment of 7.47% as of May 2011. This collective bargaining agreement became effective in May 2012 and will expire in April, 2013.
The majority of our employees and outsourced professionals of the State of Rio de Janeiro are members of the Civil Construction, Tiles, Cement, Marble and Granite Products, Road Construction, Paving, and Land Moving and Industrial Maintenance and Assembly Industries’ Workers Union of the Rio de Janeiro Municipality (SINTRACONST-RIO). As a rule, the Civil Construction of Large Building Industry in the State of Rio de Janeiro (SINDUSCON-RIO) annually negotiates with SINTRACONST-RIO the collective bargaining agreements applicable to our employees. The most recent collective bargaining agreement for our employees and outsourced professionals in the State of Rio de Janeiro was executed in March 2012, establishing a salary adjustment of 9% as of March 2011. This collective bargaining agreement became effective in March 2012 and will expire in February 2013.
We believe that our relationship with our employees and workers’ unions is good. In all the regions where we operate, we maintain a stable relationship with the workers unions, which generally decreases the risk of strikes.
The benefits we offer to our permanent employees include life insurance, dental plan, health insurance, meal tickets and profit sharing.
Health and Safety
We are committed to preventing work-related accidents and diseases. Accordingly, we maintain a risk prevention program which seeks to maintain and enhance the health and physical conditions of our employees, by anticipating, recognizing, evaluating and controlling any existing or potential environmental risks in the workplace.
In addition, we have an internal committee for the avoidance of accidents, which seeks to prevent diseases and accidents from occurring in the workplace. We make significant investments in this area, providing frequent training programs for our construction employees as well as for our subcontractors’ employees, and we require our subcontractors to follow strict guidelines.
E. Share Ownership
As of the date of this annual report, our directors and executive officers do not hold, on an aggregate basis, any direct or indirect interest of greater than 0.3463% of our total share capital or of the share capital of any of our subsidiaries or jointly-controlled entities. As of December 31, 2012, some of our executive officers held interests in our subsidiaries and jointly-controlled entities as partners, minority shareholders, and/or directors and executive officers. In none of these cases, as of the date of this annual report, were the interests held material.
The table below sets forth the number of our total shares beneficially owned by each of our directors and executive officers as of the date of this annual report:
|
Name
|
Position
|
Number of Shares Owned
|
||||
|
Alceu Duilio Calciolari
|
Chief Executive Officer
|
992,676 | ||||
|
Gerald Dinu Reiss
|
Director
|
141,102 | ||||
|
Odair Garcia Senra
|
Director
|
233,605 | ||||
|
Luiz Carlos Siciliano
|
Officer
|
48,509 | ||||
|
Sandro Rogério da Silva Gamba
|
Officer
|
66,876 | ||||
|
Rodrigo Osmo
|
Officer
|
39,088 | ||||
|
Fernando Cesar Calamita
|
Officer
|
57,500 | ||||
|
Rodrigo Ferreira Coimbra Pádua
|
Officer
|
41,370 | ||||
|
Cláudio José Carvalho de Andrade
|
Director
|
1,000 | ||||
|
José Écio Pereira da Costa Junior
|
Director
|
2 | ||||
|
Guilherme Affonso Ferreira
|
Director
|
102 | ||||
|
Henri Phillippe Reichstul
|
Director
|
2 | ||||
|
Andre Bergstein
|
Chief Financial Officer and Investor Relations Officer
|
— | ||||
|
Nelson Machado
|
Director
|
— | ||||
|
Maurício Marcellini Pereira
|
Director
|
— | ||||
|
Rodolpho Amboss
|
Director
|
— | ||||
|
Marcelo Renaux Willer
|
Officer
|
— | ||||
|
Total
|
1,621,832 | |||||
Stock Option Plans
Our stock option plans seek to: (1) encourage our expansion and success by allowing our executives and key employees to acquire shares of our capital stock in order to encourage their integration with the company; (2) allow us to obtain and retain the services of executives and key employees by offering them the benefit of becoming one of our shareholders; and (3) align the interests of our executives and key employees with the interests of our shareholders.
We have individual agreements with our key employees and executives, under which they are entitled to purchase shares of our capital stock pursuant to the terms and conditions of the stock option plans and the specific conditions set forth in their agreements.
In 2002, our shareholders ratified the terms and conditions of our stock option plan. A standard stock option program to grant subscription rights related to our preferred shares was approved by our board of directors at a meeting held on April 3, 2000. As a result of our entry in the
Novo Mercado
segment of BM&FBOVESPA, our
preferred shares were converted into common shares, and therefore all options relating to this plan grant subscription rights related to our common shares. Currently, we do not have any stock option grants related to this plan.
On February 3, 2006, our shareholders approved a new stock option plan. Under the 2006 stock option plan, our board of directors may release further programs on a regular basis of options to purchase up to 5% of the total outstanding shares of our company, as set forth in the 2006 stock option plan. Such new programs would grant our executives and key employees the right to subscribe and/or acquire our shares for a set price, under terms and conditions according to the agreements set for each participant. Currently, we don’t have any stock option grants related to this plan.
Our most recent stock option plan was approved on May 18, 2008 during a special shareholders’ general meeting. Under this new stock option plan, our board of directors may create additional programs on a regular basis for options to purchase up to 5% of the total outstanding shares of our company, as set forth in the 2008 stock option plan.
Under this new stock option plan, the board of directors may also grant different types of options to certain beneficiaries, or “B options,” for the exercise price of R$0.01. The exercise of B options, if granted, is subject to the proportional purchase of common shares, or A option under this 2008 plan, according to the terms and conditions set forth in each program, and to lapse two years from the common share purchase date.
As of December 31, 2012, all active stock option Programs follow the Plan approved in 2008.
2009 Programs
Three new stock option programs were approved in 2009 for executive officers and key employees. The first is a standard stock option program to grant subscription rights related to our common shares, which was approved by our board of directors at a meeting held on June 26, 2009. Under this program, the board of directors may grant to certain beneficiaries the right to subscribe and/or acquire our shares for a set price, under the terms and conditions set forth in the stock option plan agreement entered into with each participant.
As of December 31, 2012, 5,400,000 options to purchase shares of our common shares have been granted to executive officers pursuant to this stock option agreement. Of the total options granted, 2,850,000 have been acquired or expired pursuant to such agreements. The options not exercised were replaced by the program approved in 2012.
Under the second program, the board of directors may grant different types of B options for the exercise price of R$0.01. The exercise of B options, if granted, is subject to the proportional exercise of the regular A options granted under this plan, according to the terms and conditions set forth in each program, and to lapse one year from the grant date.
As of December 31, 2012, options to purchase 849,020 shares of our common shares have been granted to key employees and executive officers pursuant to this stock option agreement. The options granted included 482,965 B options. Of the total options granted, 386,962 have been acquired or expired pursuant to such agreements.
After the acquisition of Tenda, the board of directors approved the conversion of Tenda’s existing stock options programs into Gafisa’s programs. As of the date of this annual report, all shares have been expired or purchased pursuant to this stock option programs agreements.
2010 Programs
Two new stock option programs were approved in 2010 for executives and key employees. The first is a standard stock option program to grant subscription rights related to our common shares, which was approved by our board of directors at a meeting held on August 4, 2010. Under this program, the board of directors may grant to certain beneficiaries the right to subscribe and/or acquire our shares for a set price, under the terms and conditions set forth in the stock option plan agreement entered into with each participant.
As of December 31, 2012, 600,000 options to purchase shares of our common shares have been granted to executive officers pursuant to this stock option agreement and none have been acquired or expired pursuant to such agreements. These options were replaced by the program approved in 2012.
Under the second program, the board of directors may grant different types of B options for the exercise price of R$0.01. The exercise of B options, if granted, is subject to the proportional exercise of the regular options granted under this 2010 plan, according to the terms and conditions set forth in each program, and to lapse one year from the grant date.
As of December 31, 2012, options to purchase 26,061 shares of our common shares have been granted to employees and executive pursuant to this stock option plan agreement. The options granted included 17,373 B options. Of the total options granted, 20,486 have been acquired or expired pursuant to such agreements.
2011 Programs
Two new stock option programs were approved in 2011 for the board of directors, executives and key employees.
The first is a standard stock option program granting subscription rights related to our common shares. Under this program, the board of directors may grant to certain beneficiaries the right to subscribe and/or acquire our shares for a set price, under the terms and conditions set forth in the stock option plan agreement entered into with each participant.
As of December 31, 2012, 510,000 options to purchase shares of our common shares have been granted to executive officers and directors pursuant to this agreement. Out of the amount granted, none have been acquired pursuant to such agreements and were replaced by the program approved in 2012; 2,640,000 expired or cancelled.
Under the second program, the board of directors may grant different types of B options for the exercise price of R$0.01. The exercise of B options, if granted, is subject to the proportional exercise of regular options at market price, granted under this program, according to the terms and conditions set forth in each program, and to lapse one year from the grant date.
As of December 31, 2012, options to purchase 2,940,000 shares of our common shares have been granted to employees and executives pursuant to this agreement. The options granted included 2,166,250 “B” options. Out of the total options granted, 1,304,281 have been acquired or expired pursuant to such agreements.
2012 Programs
Two new stock option programs were approved in 2012 for executives and key employees.
The first is a standard stock option program granting subscription rights related to our common shares. Under this program, the board of directors may grant to certain beneficiaries the right to subscribe and/or acquire our shares for a set price, under the terms and conditions set forth in the stock option plan agreement entered into with each participant.
As of December 31, 2012, 3,560,000 options to purchase shares of our common shares have been granted to executive officers pursuant to this agreement. Out of the amount granted, none have been acquired pursuant to such agreements.
Under the second program, the board of directors may grant different types of B options for the exercise price of R$0.01. The exercise of B options, if granted, is subject to the proportional exercise of regular options at market price, granted under this program, according to the terms and conditions set forth in each program, and to lapse one year from the grant date.
As of December 31, 2012, options to purchase 4,079,048 shares of our common shares have been granted to employees and executives pursuant to this agreement. The options granted included 3,005,532 “B” options. Out of the total options granted, none have been acquired or expired pursuant to such agreements.
|
Active Programs
|
Number of Stock Options granted
|
Number of Stock Options Outstanding (Not Expired or exercised)
|
Exercise Price per Stock Option
|
Expiration
|
|||||||||
|
December 2009 (Restricted SOP) (1)
|
849,020 | 462,058 | R$ | 0.01 |
December 2013
|
||||||||
|
August 2010 (Restricted SOP) (1)
|
26,061 | 5,575 | R$ | 0.01 |
August 2014
|
||||||||
|
March 2011 (Restricted Type B) (1)
|
906,250 | 375,719 | R$ | 0.01 |
March 2015
|
||||||||
|
July 2011 (Restricted Type B) (1)
|
1,260,000 | 1,260,000 | R$ | 0.01 |
July 2015
|
||||||||
|
August 2012 (Standard SOP) (1)
|
3,560,000 | 3,560,000 | R$ | 2.73 |
August 2025
|
||||||||
|
August 2012 (Restricted Type A) (1)
|
1,073,516 | 1,073,516 | R$ | 2.73 |
May 2014
|
||||||||
|
August 2012 (Restricted Type B) (1)
|
3,005,532 | 3,005,532 | R$ | 0.01 |
August 2016
|
||||||||
| 9,742,400 | |||||||||||||
|
(1)
|
Options unvested.
|
A. Major Shareholders
As of the date of this annual report, the following shareholder held more than 5.0% of our common shares. The following table sets forth information of our directors and officers as a group, as well as common shares held in treasury and other shares in the public float. Each holder of common shares has the same rights.
|
Shareholders
|
Shares
|
(%)
|
||||||
|
Fundação dos Economiarios Federais (“FUNCEF”)
|
23,835,800 | 5.50 | ||||||
|
Directors and officers(1)
|
1,504,035 | 0.35 | ||||||
|
Other shareholders
|
407,290,458 | 94.01 | ||||||
|
Treasury shares
|
599,486 | 0.14 | ||||||
|
Total
|
433,229,779 | 100.0 | ||||||
|
(1)
|
Does not include shares that may be purchased pursuant to outstanding stock option plans except for shares subject to options that are currently exercisable or exercisable within 60 days of the date of this annual report.
|
We had a total of 100 record shareholders located in the United States, 71% of which hold shares traded at BM&FBOVESPA and 29% of which hold ADSs traded on the NYSE. We are not aware of any shareholders’ agreement currently in force with our main shareholder.
On June 8, 2012, according to the material fact then disclosed, the third phase of the Investment Agreement and Other Covenants entered into on October 2, 2006 (“Investment Agreement”), established the rules and conditions for Gafisa related to the acquisition of the remaining 20% interest in the capital stock of Alphaville not held by the Company. While the valuation of the capital stock has been agreed by both parties, the number of shares that shall be issued by the Company to settle this transaction is being decided in arbitration proceedings initiated by the noncontrolling holders of Alphaville, according to the material fact we released on July 3, 2012. There is an embedded derivative component to the Investment Agreement, relating to the Company’s obligation to purchase the Alphaville shares held by the non-controlling interest. As the fair value of this embedded derivative for all reporting periods has no significant value, since the future settlement of the derivative will be based on the fair value of Alphaville’s capital stock, no derivative asset or liability has been recorded. The future settlement to be made in cash or shares represented an amount of R$359.0 million as at December 31, 2012 and 2011. In case of issuance of 70,251,551 common shares of Gafisa to the other shareholders of Alphaville, these shareholders of Alphaville will receive 13.96% of Gafisa’s total capital stock and will become relevant shareholders of Gafisa.
B. Related Party Transactions
Other than arrangements which are described in “Item 6. Directors, Senior Management and Employees—A. Directors and Senior Management— Our Relationship with our Executive Officers and Directors” and the transaction described below, since January 1, 2007, there has not been, and there is not currently proposed, any material transaction or series of similar transactions to which we were or will be a party in which any director,
executive officer, holder of 5% of our capital stock or any member of their immediate family had or will have a direct or indirect interest.
Under Brazilian corporate law, our directors and executive officers cannot vote on any matter in which they have a conflict of interest and such transactions can only be approved on reasonable and fair terms and under conditions that are no more favorable than the terms and conditions prevailing in the market or offered by third parties.
We participate in the development of real estate ventures with other partners, directly or through related parties, based on the constitutive documents of condominiums and/or consortia. The management structure of these enterprises and the cash management are centralized in the lead partner of the enterprise, which manages the construction schedule and budgets. Thus, the lead partner ensures that the investments of the necessary funds are made and allocated as planned. The sources and uses of resources of the venture are reflected in the balance sheet of the ventures, reflecting the respective participation percentages of the partners, which are not subject to inflation adjustments or financial charges and do not have a predetermined maturity date. The average term for the development and completion of the projects in which the resources are invested is between 24 and 30 months. As of December 31, 2012, 2011 and 2010, we had current accounts receivable from related parties related to real estate ventures of R$188.8 million, R$84.2 million and R$75.2 million, respectively. And we had current accounts payable from related parties related to real estate ventures of R$75.5 million, R$97.9 million and zero, respectively
As of and for the years ended December 31, 2012, 2011 and 2010, we have not entered into any loan or other type of financing agreement with our directors or executive officers.
C. Interests of Experts and Counsel
Not applicable.
A. Consolidated Statements and Other Financial Information
For our consolidated financial statements and notes thereto see “Item 18. Financial Statements.”
Legal Proceedings
We are currently party to several legal and administrative proceedings arising from the normal course of our business, principally relating to civil, environmental, tax and labor claims. We establish provisions in our balance sheets relating to potential losses from litigation based on estimates of probable losses. Brazilian GAAP requires us to establish provisions in connection with probable losses and we record a provision when, in the opinion of our management, we feel that an adverse outcome in a litigation is probable and a loss can be estimated. The determination of the amounts provisioned is based on the amounts involved in the claims and the opinion of our management.
Civil Claims
As of December 31, 2012, we were a party to 8,800 civil actions, totaling R$893.0 million. Of these actions, we were the plaintiff in 557 actions and the defendant in approximately 8,220 actions, with aggregate amounts of R$161.7 million and R$731.3 million, respectively.
Most of these civil claims involve ordinary course matters relating to the development of our properties, including annulment of contractual clauses, termination of agreements with the reimbursement of the amounts paid and indemnification for labor accidents. We also have a few civil claims where we discuss the resolution of the construction partnership.
As of December 31, 2012, the provisions related to civil claims include R$69.8 million related to lawsuits in which the Company is included as successor in enforcement actions, in which the original debtor is a former shareholder of Gafisa, Cimob Companhia Imobiliária (“Cimob”), among other companies. The plaintiff alleges that the Company should be liable for the debts of Cimob. Certain claims, amounting to R$5.3 million, are backed by guarantee insurance, in addition we have made judicial deposits amounting to R$61.2 million, in connection with the
restriction of the usage of our bank accounts; and there is also a restriction on the use of our treasury stock in order to guarantee the enforcement. The Company is filing appeals against all decisions, as it considers that the inclusion of Gafisa in the claims to be legally unreasonable; these appeals aim at releasing amounts and obtaining the recognition that it cannot be held liable for the debt of a company that does not have any relationship with Gafisa. The final decision is on appeal, and cannot be predicted at present.
As of December 31, 2012, the provision for our civil claims amounted to R$138.6 million.
Environmental Claims
As of December 31, 2012, we were the defendants in certain environmental claims alleging harm in a permanent conservation area and we are currently not able to estimate the aggregate amount of such claims.
In addition, we are periodically party to other administrative environmental inquiries or claims by the Public Prosecution Offices of the States of São Paulo and Rio de Janeiro or by other governmental agencies or third parties. These inquiries may result in public environmental claims against us and the findings in these inquires may give rise to other administrative and criminal claims. However, based on currently available information, we do not believe these matters are, or are likely to be in the future, material to our business or financial condition.
In Case No. 0022897-84.2010.4.03.6100, federal prosecutors (
Ministério Público Federal
) argue that due to restrictions on urban and landscape rights it would have been unduly issued by the authorities the approval of project Paulista Corporate Building. This process was intended to prevent the conclusion of construction, but the judiciary, according to our defense, denied the request and the building has already been finalized. There is still an appeal filed by the federal prosecutors awaiting judgment but, we believe, it is unlikely to overturn that judgment. The value attributed to the case by federal prosecutors is R$320.0 million. Based on currently available information, we believe chances of loss for this claim are remote.
As of December 31, 2012, we have made no provisions for environmental claims.
Tax Claims
As of December 31, 2012, we were party to several tax proceedings involving tax liabilities in the aggregate amount of R$223.3 million. As of December 31, 2012, the provision for tax liabilities amounted to R$14.7 million. In addition, we have deposited R$10.8 million with the court in connection with some of these proceedings. These amounts take into consideration the tax liabilities of our subsidiaries, in proportion to our interest in their share capital. The main tax proceedings to which we are a party are described below.
On November 30, 2009, we and our subsidiaries Tenda, Alphaville and Gafisa Vendas joined the program for cash and installment payment of debits with the Federal Revenue Service and the Attorney-General Office of the National Treasury. The Company joined the tax amnesty and refinancing program and opted for the cash payment of tax debits amounting to R$17.3 million, of which R$10.4 million was in cash and R$6.9 million offset tax losses. Our subsidiaries Tenda, Alphaville and Gafisa Vendas opted for the installment payment of tax debits amounting to R$6.6 million, R$980 thousand and R$192 thousand, respectively, recognizing gains of R$568 thousand, R$360 thousand and R$70 thousand, respectively, relating to the offset of tax losses.
Alphaville is a party to legal and administrative claims related to Federal VAT (IPI) and State VAT (ICMS) on two imports of aircraft in 2001 and 2005, respectively, under leasing agreements without purchase options. The likelihood of loss in the ICMS case is rated by legal counsel as (1) probable in regard to the principal and interest, and (2) remote in regard to the fine for noncompliance with accessory liabilities. The amount of the contingency considered by our legal counsel as a probable loss totaled R$12.3 million and was recorded at December 31, 2012.
Several municipalities charge a municipal tax on construction services on an arbitrated basis, which varies depending on the characteristic of the construction. We have filed lawsuits against the municipalities of São Paulo and São Caetano do Sul to challenge the calculation of the arbitrated basis on several of our developments under construction. In these proceedings, we deposited R$9.6 million with the courts and we are awaiting the final decision. In addition, the municipalities of Rio de Janeiro, Niterói, São Paulo and Santo Andre have issued tax assessments against us. We have filed administrative defenses and are awaiting the final administrative decisions. The total amount involved in these proceedings is R$6.9 million.
Labor Claims
As of December 31, 2012, we were a defendant in approximately 5.873 labor claims resulting from our ordinary course of business, of which approximately 88% were filed by outsourced workers and approximately 12% were filed by our former employees. The alleged legal bases for these claims mainly relate to termination benefits, overtime hours, employee relationship and dismissal rights. As of December 31, 2012, the total value involved in the labor claims filed against us was approximately R$185.5 million. As of December 31, 2012, the provision for labor claims amounted to R$55.1 million.
Arbitration
We are also involved in 2 arbitrations proceedings: one of them by a partner seeking to discuss and terminate the partnership to develop a few real estate projects and the other one regarding enforceability of contractual clauses. There is no decision in none of the cases above.
As of December 31, 2012, we have made no provisions for arbitration claims.
Other Developments
On June 14, 2012, we received a subpoena from the SEC Division of Enforcement related to the Matter of Certain 20-F Filer Home Builders (HO-11760). The subpoena requests that we produce all documents from January 1, 2010 to the present related to the preparation of our financial statements, including, among other things, copies of our financial policies and procedures, board and audit committee and operations committee minutes, monthly closing reports and financial packages, any documents relating to possible financial or accounting irregularities or improprieties and internal audit reports. The SEC’s investigation is a non-public, fact-finding inquiry and it is not clear what action, if any, the SEC intends to take with respect to the information it gathers. The SEC subpoena does not specify any charges. The Company has already submitted all the information requested by SEC, which as of the publication of these financial statements has not issued any opinion. We have not received any further notice from the SEC after delivering the requested information in the first half of 2012.
On July 31, 2012, we received a letter from the CVM: CVM/SEP/GEA-5/ Letter No. 208/2012, requesting information related to criteria for measurement and recognition of revenue and enhancement in the disclosure of some notes to our financial information. We have already provided all the information requested by the CVM. In addition, on February 19, 2013, we received a letter from the CVM: CVM/SEP/GEA-5/ Letter No. 040/2013 recommending enhancements to the notes to our financial statements regarding the percentage of assets by venture that is included in the structures of equity segregation of the purchase.
Dividend Policy
The amount of any of our distributions of dividends and/or interest on shareholders’ equity will depend on a series of factors, such as our financial conditions, prospects, macroeconomic conditions, tariff adjustments, regulatory changes, growth strategies and other issues our board of directors and our shareholders may consider relevant, as discussed below.
Amounts Available for Distribution
At each annual general shareholders’ meeting, our board of directors is required to propose to our shareholders how our earnings of the preceding fiscal year are to be allocated. For purposes of Brazilian corporate law, a company’s income after federal income tax for such fiscal year, net of any accumulated losses from prior fiscal years and amounts allocated to debentures, employees’ and management’s participation in earnings and founders’ shares, represents its “net income” for such fiscal year. In accordance with Brazilian corporate law, an amount equal to the company’s “net income” may be affected by the following:
|
|
·
|
reduced by amounts allocated to the legal reserve;
|
|
|
·
|
reduced by amounts allocated to any statutory reserve;
|
|
|
·
|
reduced by amounts allocated to the contingency reserve, if any;
|
|
|
·
|
reduced by amounts allocated to the tax incentives reserve;
|
|
|
·
|
reduced by amounts allocated to the investment reserve;
|
|
|
·
|
increased by reversals of contingency reserves recorded in prior years; and
|
|
|
·
|
increased by amounts allocated to the investment reserve, when realized and if not absorbed by losses.
|
Our calculation of net income and allocation of funds to our reserves for any fiscal year are determined on the basis of our audited unconsolidated financial statements for the immediately preceding fiscal year.
Allocation of Net Income
According to Brazilian corporate law, we have two types of reserve accounts: (1) profit reserves and (2) capital reserve.
Profit Reserves
Our profit reserves consist of the following:
|
|
·
|
Legal Reserve
. Under Brazilian corporate law and our bylaws, we are required to maintain a legal reserve to which we must allocate 5% of our net income for each fiscal year until the aggregate amount of such reserve equals 20% of our share capital. However, we are not required to make any allocations to our legal reserve in a fiscal year in which the legal reserve, when added to our other established capital reserves, exceeds 30% of our total share capital. The portion of our net income allocated to our legal reserve must be approved by our annual general shareholders’ meeting and the balance of such reserve may only be used to increase our share capital or to absorb losses, but is unavailable for the payment of dividends. As of December 31, 2012, there was no amount allocated to a legal reserve since it was absorbed by our loss for the year ended.
|
|
|
·
|
Statutory Reserve
. Under Brazilian corporate law, we are permitted to provide for the allocation of part of our net income to discretionary reserve accounts that may be established in accordance with our bylaws. The allocation of our net income to discretionary reserve accounts may not be made if it serves to prevent distribution of the mandatory distributable amount. According to our bylaws, up to 71.25% of our net income may be allocated to an investment reserve to finance the expansion of our activities and the activities of our controlled companies by subscribing for capital increases, creating new projects or participating in consortia or any other type of association to achieve our corporate purpose. This investment reserve may not exceed 80% of our share capital. As of December 31, 2012, there was no amount allocated to a statutory reserve since it was absorbed by our loss for the year ended.
|
|
|
·
|
Contingency Reserve
. Under Brazilian corporate law, a percentage of our net income may be allocated to a contingency reserve for anticipated losses that are deemed probable in future years. Management must indicate the cause of the anticipated loss and justify the establishment of the reserve for allocation of a percentage of our net income. Any amount so allocated in a prior year either must be reversed in the year in which the justification for the loss ceases to exist or charged off in the event that the anticipated loss occurs. The allocations to the contingency reserve are subject to the approval of our shareholders in a general shareholders’ meeting. As of December 31, 2012, there was no amount allocated to a contingency reserve.
|
|
|
·
|
Investment Reserve
. Under Brazilian corporate law, the amount by which the mandatory distributable amount exceeds the “realized” net income in a given fiscal year, as proposed by the board of directors, may be allocated to the investment reserve. Brazilian corporate law defines “realized” net profits as the amount by which net profits exceed the sum of (1) the net positive results, if any, from the equity method of accounting and (2) the net profits, net gains or net returns resulting from transactions or the accounting of assets and liabilities based on their market value, to be received after the end of the following fiscal year. All amounts allocated to the investment reserve must be paid as mandatory dividends when those “unrealized” profits are realized if they have not been designated to absorb losses in subsequent periods. As
of December 31, 2012, there was no amount allocated to an investment reserve since it was absorbed by our loss for the year ended.
|
|
|
·
|
Retained Earnings Reserve
. Under Brazilian corporate law, a portion of our net income may be reserved for investment projects in an amount based on a capital expenditure budget approved by our shareholders. If such budget covers more than one fiscal year, it might be reviewed annually at the general shareholders’ meeting. The allocation of this reserve cannot jeopardize the payment of the mandatory dividends. As of December 31, 2012, there was no amount allocated to our retained earnings reserve.
|
Capital Reserves
The capital reserve is formed by (a) amounts received by shareholders in excess of the par value of shares issued (premium on capital stock), as well as the part of the issue price of the shares with no par value that exceeds the amount intended to form the capital stock; and (b) proceeds from the sale of founders’ shares and warrants. Under Brazilian corporate law, capital reserve may only be applied to: (1) absorb losses that exceed accumulated earnings and revenue reserves; (2) redeem, reimburse or buy our own shares; and (3) increase our share capital.
As of December 31, 2012, there was no amount allocated to a capital reserve since it was absorbed by our loss from the year ended.
Mandatory Distribution of Dividends
Brazilian corporate law generally requires that the bylaws of each Brazilian company specify a minimum percentage of the amounts available for distribution by such company for each fiscal year that must be distributed to shareholders as dividends or as interest on shareholders’ equity, also known as the mandatory dividend.
The mandatory dividend is based on a percentage of adjusted net income, rather than a fixed monetary amount per share. Under our bylaws, at least 25% of our net income, as calculated under Brazilian GAAP and adjusted under Brazilian corporate law (which differs significantly from net income as calculated under US GAAP), for the preceding fiscal year must be distributed as a mandatory dividend. Adjusted net income means the distributable amount before any deductions for profit retention and statutory reserves.
Under Brazilian corporate law, however, we are allowed to suspend the distribution of the mandatory dividends in any year in which our board of directors report to our general shareholders’ meeting that the distribution would be inadvisable in view of our financial condition. Such suspension is subject to the approval at the shareholders’ meeting and review by members of the fiscal council. In the case of publicly held companies, the board of directors must file a justification for such suspension with the CVM within five days of the relevant general shareholders’ meeting. If the mandatory dividend is not paid, the unpaid amount shall be attributed to a special reserve account. If not absorbed by subsequent losses, those funds shall be paid out as dividends as soon as the financial condition of the company permits.
The mandatory dividend may also be paid in the form of interest attributable to shareholders’ equity, being considered as a deductible expense for purpose of calculating our income and social contribution tax obligations.
Payment of Dividends
We are required by Brazilian corporate law and our bylaws to hold an annual general shareholders’ meeting within the first four months following the end of each fiscal year, at which time, among other things, the shareholders have to decide on the allocation of the results from the preceding year and on the payment of dividends based on our financial results from the previous fiscal year.
Under Brazilian corporate law, dividends are generally required to be paid to the holder of record on the date of the dividend declaration date within 60 days following the date the dividend was declared, unless a shareholders’ resolution sets forth another date of payment, which, in either case, must occur within the fiscal year in which such dividend was declared. A shareholder has a three-year period from the date of the dividend payment to claim dividends, which do not bear interest and are not monetarily restated, after which the aggregate amount of any unclaimed dividends shall legally revert to us.
Our board of directors may declare interim dividends to be deducted from the retained earnings or profit reserves in our semi-annual or annual financial statements. In addition, our board of directors may pay dividends from our net income based on our net income registered on semi-annual or quarterly balance sheet. The dividends paid in each semester may not exceed the amounts accounted for in our capital reserve accounts. Any payment of interim dividends may be set off against the amount of mandatory dividend relating to the net profit earned in the year in which the interim dividends were paid.
In general, shareholders who are not residents of Brazil must register their equity investment with the Central Bank to have dividends, sales proceeds or other amounts with respect to their shares eligible to be remitted outside of Brazil. The common shares underlying the ADSs are held in Brazil by Banco Itaú S.A., also known as the custodian, as agent for the depositary, who is the registered owner on the records of the registrar for our shares. The depositary registers the common shares underlying the ADSs with the Central Bank and, therefore, it is possible to have dividends, sales proceeds or other amounts with respect to the common shares remitted outside Brazil.
Payments of cash dividends and distributions, if any, are made in
reais
to the custodian on behalf of the depositary, which then converts such proceeds into U.S. dollars and causes such U.S. dollars to be delivered to the depositary for distribution to holders of ADSs. In the event that the custodian is unable to convert immediately the
reais
received as dividends into U.S. dollars, the amount of U.S. dollars payable to holders of ADSs may be adversely affected by any depreciation of the real that occurs before the dividends are converted. Under the current Brazilian tax law, dividends paid to persons who are not Brazilian residents, including holders of ADSs, will not be subject to Brazilian withholding tax, except for dividends declared based on profits generated prior to December 31, 1995, which will be subject to Brazilian withholding income tax at varying tax rates. See “Item 10. Additional Information—E. Taxation.”
Holders of ADSs have the benefit of the electronic registration obtained from the Central Bank, which permits the depositary and the custodian to convert dividends and other distributions or sales proceeds with respect to the common shares represented by ADSs into foreign currency and remit the proceeds outside of Brazil. In the event the holder exchanges the ADSs for common shares, the holder will be entitled to continue to rely on the depositary’s certificate of registration for five business days after the exchange. Thereafter, in order to convert foreign currency and remit outside of Brazil the sales proceeds or distributions with respect to the common shares, the holder must obtain a new certificate of registration in its own name that will permit the conversion and remittance of such payments through the commercial exchange rate market.
Under current Brazilian legislation, the Brazilian government may impose temporary restrictions of foreign capital abroad in the event of a serious imbalance or an anticipated serious imbalance of Brazil’s balance of payments. See “Item 3. Key Information—D. Risk Factors—Risks Relating to Our Common Shares and the ADSs.”
Interest on Equity
Under the Brazilian tax legislation effective January 1, 1996, Brazilian companies are permitted to pay “interest” to holders of equity securities and treat such payments as a deductible expense for Brazilian income tax purposes and, from 1997, for social contribution purposes. The purpose of the tax law change is to encourage the use of equity investment, as opposed to debt, to finance corporate activities. Payment of such interest may be made at the discretion of our board of directors. The amount of any such notional “interest” payment to holders of equity securities is generally limited in respect of any particular year to the greater of:
|
|
·
|
50% of net income (after the deduction of the provisions for social contribution on net profits but before taking into account the provision for corporate income tax and the interest attributable to shareholders’ equity) for the period in respect of which the payment is made; or
|
|
|
·
|
50% of the sum of retained earnings and profit reserves as of the beginning of the year in respect to which such payment is made.
|
For tax deduction purposes, the rate applied in calculating interest attributable to shareholders’ equity cannot exceed the
pro rata die
variation of the Long Term Interest Rate (
Taxa de Juros de Longo Prazo
), or TJLP, as determined by the Central Bank from time to time.
For accounting purposes, although the interest should be reflected in the income statement for tax deduction, the charge is reversed before the calculation of the net income in the statutory financial statements and deducted from the shareholders’ equity in the same way as the dividend. Any payment of interest with respect to the common shares is subject to withholding income tax at the rate of 15% or 25% if a holder that is not domiciled in Brazil for purposes of Brazilian taxation is domiciled in a country or location defined as a “tax favorable jurisdiction.” The definition of tax favorable jurisdiction includes countries and locations (a) that do not impose income tax, (b) that impose income tax at a rate of 20% or less, or (c) where local laws do not allow access to information related to shareholding composition, ownership of investments, or the identity of the ultimate beneficiary of earnings that are attributed to non-residents. Please refer to “Item 10. Additional Information—E. Taxation—Brazilian Tax Considerations—Discussion on Low or Nil Tax Jurisdictions” below for a discussion that the definition of “tax favorable jurisdiction” may be broadened by an interpretation of Law No. 11,727.
The amount distributed to shareholders as interest attributable to equity, net of any withholding tax, may be included as part of the minimum mandatory dividend. In accordance with applicable law, we are required to pay to shareholders an amount sufficient to ensure that the net amount they receive in respect of interest attributable to shareholders’ equity, after payment of the applicable withholding tax, plus the amount of declared dividends, is at least equivalent to the amount of the minimum mandatory dividend. A shareholder has a three-year period from the date of the interest payment to claim interest attributable to equity, after which the aggregate amount of any unclaimed interest shall legally revert to us.
If a payment of interest on equity is recorded at net value as part of a mandatory dividend, we will pay the income tax on behalf of our shareholders at the time the payment is distributed. Otherwise, the income tax will be paid by the shareholders, subject to our obligation to retain and collect taxes on the payment.
History of Payment of Dividends and Interest on Equity
In 2008, we distributed dividends in the total amount of R$27.0 million, or R$0.21 per share (without giving effect to the stock split of one existing share into two newly issued shares approved at our shareholders’ meeting on February 22, 2010), for fiscal year 2007. In 2009, we distributed dividends in the total amount of R$26.1 million, or R$0.20 per share (without giving effect to the stock split of one existing share into two newly issued shares approved at our shareholders’ meeting on February 22, 2010), for fiscal year 2008. In 2010, we distributed dividends in the total amount of R$50.7 million, or R$0.12 per share (after giving effect to the stock split of one existing share into two newly issued shares approved at our shareholders’ meeting on February 22, 2010), for fiscal year 2009. In 2011, we distributed dividends in the total amount of R$98.8 million, or R$0.2991 per share, for fiscal year 2010.
In 2012, we did not distributed any dividends, related to fiscal years 2011 and 2012.
B. Significant Changes
None.
A. Offer and Listing Details
Our common shares started trading on the BM&FBOVESPA on February 17, 2006 and the ADSs started trading on the NYSE on March 16, 2007. The table below sets forth, for the indicated periods, the high and low closing prices of the ADSs on the NYSE, in U.S. dollars, and the common shares on the BM&FBOVESPA, in
reais
:
|
New York Stock Exchange
|
São Paulo Stock Exchange
|
|||||||||||||||||||||||
|
High
|
Low
|
Volume(1)
|
High
|
Low
|
Volume(1)
|
|||||||||||||||||||
|
(in US$ per ADS)
|
(in
reais
per common shares)
|
|||||||||||||||||||||||
|
Year Ended
|
||||||||||||||||||||||||
|
December 31, 2008
|
21.00 | 3.35 | 930,018 | 25.04 | 2.67 | 1,238,592 | ||||||||||||||||||
|
December 31, 2009
|
16.16 | 4.26 | 830,509 | 18.81 | 3.54 | 2,077,590 | ||||||||||||||||||
|
December 31, 2010(2)
|
14.83 | 9.31 | 2,210,016 | 18.24 | 10.04 | 4,339,823 | ||||||||||||||||||
|
December 31, 2011
|
12.25 | 4.10 | 3,548,148 | 15.17 | 4.30 | 8,082,453 | ||||||||||||||||||
|
December 31, 2012
|
5.47 | 2.09 | — | 6.78 | 2.05 | — | ||||||||||||||||||
|
New York Stock Exchange
|
São Paulo Stock Exchange
|
|||||||||||||||||||||||
|
High
|
Low
|
Volume(1)
|
High
|
Low
|
Volume(1)
|
|||||||||||||||||||
|
(in US$ per ADS)
|
(in
reais
per common shares)
|
|||||||||||||||||||||||
|
Quarter
|
||||||||||||||||||||||||
|
First quarter 2011
|
12.89 | 12.68 | 1,964,727 | 10.32 | 10.10 | 3,809,000 | ||||||||||||||||||
|
Second quarter 2011
|
15.17 | 11.82 | 2,452,749 | 12.25 | 9.62 | 5,117,548 | ||||||||||||||||||
|
Third quarter 2011
|
8.19 | 5.32 | 4,098,922 | 10.13 | 5.68 | 6,447,629 | ||||||||||||||||||
|
Fourth quarter 2011
|
6.78 | 4.10 | 3,671,459 | 8.10 | 4.30 | 11,172,193 | ||||||||||||||||||
|
First quarter 2012
|
5.47 | 4.12 | 3,705,616 | 6.78 | 4.61 | 13,832,655 | ||||||||||||||||||
|
Second quarter 2012
|
4.29 | 2.09 | 3,056,674 | 4.64 | 2.05 | 15,575,915 | ||||||||||||||||||
|
Third quarter 2012
|
4.83 | 2.20 | 2,669,424 | 4.70 | 2.11 | 17,061,943 | ||||||||||||||||||
|
Fourth quarter 2012
|
4.98 | 3.59 | 2,225,663 | 4.70 | 3.50 | 11,947,754 | ||||||||||||||||||
|
Month
|
||||||||||||||||||||||||
|
October 2012
|
4.68 | 3.66 | 2,606,063 | 4.54 | 3.62 | 13,571,723 | ||||||||||||||||||
|
November 2012
|
4.29 | 3.59 | 1,667,639 | 4.05 | 3.50 | 10,767,142 | ||||||||||||||||||
|
December 2012
|
4.98 | 4.24 | 2,412,170 | 4.70 | 4.06 | 11,209,106 | ||||||||||||||||||
|
January 2013
|
5.35 | 4.56 | 2,717,633 | 5.24 | 4.49 | 12,141,410 | ||||||||||||||||||
|
February 2013
|
5.19 | 3.90 | 2,026,382 | 5.20 | 3.88 | 10,576,400 | ||||||||||||||||||
|
March 2013
|
4.28 | 3.71 | 1,992,835 | 4.54 | 3.62 | 10,749,469 | ||||||||||||||||||
|
April 2013 (through April 11)
|
4.57
|
3.68
|
2,285,136
|
4.57
|
3.75
|
11,731,056
|
||||||||||||||||||
|
(1)
|
Average number of shares traded per day.
|
|
(2)
|
On February 22, 2010, our shareholders approved a stock split of our common shares giving effect to the split of one existing share into new issued shares, increasing the number of shares from 167,077,137 to 334,154,274.
|
In September 2007, we joined the BM&FBOVESPA Index, or “IBM&FBOVESPA,” the main indicator of the Brazilian stock market’s average performance and the IBrX-50, an index measuring the total return on a theoretical portfolio composed of 50 stocks selected among BM&FBOVESPA’s most actively traded securities. Additionally, we are part of the MSCI Emerging Markets Index, which is a free float-adjusted market capitalization index that is designed to measure equity market performance in the global emerging markets. Through the inclusion on these indices, our stock has expanded opportunity for increased liquidity. Prior to joining the indices, we traded at a daily average of R$38.1 million (or 1.3 million shares), and after joining the indices, trading in our shares increased to a daily average of R$57.1 million (or 11.3 million shares).
B. Plan of Distribution
Not applicable.
C. Markets
Our common shares are listed on the BM&FBOVESPA under the symbol “GFSA3” and the ADSs are listed on the NYSE under the symbol “GFA.”
Trading on the BM&FBOVESPA
Trading on the São Paulo Stock Exchange is conducted every business day, from 10:00 a.m. to 5:00 p.m., or from 11:00 a.m. to 6:00 p.m. during daylight saving time in Brazil, on an electronic trading system called “Megabolsa.” Trading is also conducted between 5:45 p.m. and 7:00 p.m., or between 6:45 p.m. and 7:30 p.m. during daylight saving time in Brazil. The “after-market” trading is scheduled after the close of principal trading sessions, when investors may send purchase and sell orders and trade through the home broker system. This after-market trading is subject to regulatory limits on price volatility of securities traded by investors operating on the Internet.
The CVM and the BM&FBOVESPA have discretionary authority to suspend trading in shares of a particular issuer under certain circumstances. Trading in securities listed on the BM&FBOVESPA, including the
Novo Mercado
and Levels 1 and 2 segments, may be effected off the exchanges in the unorganized over-the-counter market in certain circumstances.
The shares of all companies listed on the BM&FBOVESPA, including the
Novo Mercado
and Level 1 and Level 2 companies, are traded together.
Settlement of transactions occurs three business days after the trade date, without adjustments to the purchase price. Delivery of and payment for shares are made through the facilities of separate clearing houses for each exchange, which maintain accounts for brokerage firms, the Central Depositary BM&FBOVESPA (
Central Depositária da BM&FBOVESPA
), formerly the Brazilian Settlement and Custodial Company (
Companhia Brasileira de Liquidação e Custódia
). The seller is ordinarily required to deliver the shares to the BM&FBOVESPA clearing house on the second business day following the trade date.
In order to maintain control over the fluctuation of the BM&FBOVESPA index, the BM&FBOVESPA has adopted a “circuit breaker” system pursuant to which trading sessions may be suspended for a period of 30 minutes or one hour whenever specified indices of the BM&FBOVESPA fall below the limits of approximately 10% and 15%, respectively, in relation to the closing index levels for the previous trading session.
Although the Brazilian equity market is the largest in Latin America in terms of capitalization, it is smaller and less liquid than the major U.S. and European securities markets. The BM&FBOVESPA is significantly less liquid than the NYSE, or other major exchanges in the world. The BM&FBOVESPA, had a market capitalization of US$1.21 trillion as of March 27, 2013 and an average daily trading volume of US$3.6 billion for 2012. In comparison, the NYSE had a market capitalization of US$16.61 trillion as of March 27, 2013 and an average daily trading volume of approximately US$164,196.21 million for 2012. Although any of the outstanding shares of a listed company may trade on the BM&FBOVESPA, in most cases fewer than half of the listed shares are actually available for trading by the public, the remainder being held by small groups of controlling persons, by government entities or by one principal shareholder. The relative volatility and illiquidity of the Brazilian securities markets may substantially limit your ability to sell the common shares at the time and price you desire and, as a result, could negatively impact the market price of these securities.
Trading on Brazilian stock exchanges by non-residents of Brazil is subject to registration procedures. See “—Investment in Our Common Shares by Non-Residents of Brazil.”
Regulation of Brazilian Securities Markets
The Brazilian securities markets are mainly governed by Law No. 6,385, of December 7, 1976, Law No. 4,728, of July 14, 1965 and Brazilian corporate law, each as amended and supplemented, and by regulations issued by the CVM, which has authority over stock exchanges and the securities markets generally; the CMN; and the Central Bank, which has, among other powers, licensing authority over brokerage firms and regulates foreign investment and foreign exchange transactions.
These laws and regulations, among others, provide for licensing and oversight of brokerage firms, governance of the Brazilian stock exchanges, disclosure requirements applicable to issuers of traded securities, restrictions on price manipulation and protection of minority shareholders. They also provide for restrictions on insider trading. However, the Brazilian securities markets may not be considered to be as highly regulated and supervised as the U.S. securities markets or securities markets in some other jurisdictions. Accordingly, any trades or transfers of our equity securities by our officers and directors, our controlling shareholders or any of the officers and directors of our controlling shareholders must comply with the regulations issued by the CVM. See “Item 10. Additional Information—B. Memorandum and Bylaws—Disclosure Requirements.”
We have the option to ask that trading in our securities on the BM&FBOVESPA be suspended in anticipation of a material announcement. Trading may also be suspended on the initiative of the BM&FBOVESPA or the CVM, based on or due to, among other reasons, a belief that a company has provided inadequate information regarding a material event or has provided inadequate responses to inquiries by the CVM or the BM&FBOVESPA.
Under Brazilian corporate law, a corporation is either public, as we are, or closely held. All public companies are registered with the CVM and are subject to reporting requirements. A company registered with the CVM may trade its securities either on the BM&FBOVESPA, if it has registered to have its securities traded at the BM&FBOVESPA, or on the Brazilian over-the-counter market. The shares of a listed company may also be traded privately, subject to several limitations. Our common shares are listed on
Novo Mercado
segment of the BM&FBOVESPA.
The Brazilian over-the-counter market consists of direct trades between individuals in which a financial institution registered with the CVM (and in the relevant over the counter market) serves as intermediary. The Brazilian over-the-counter market is divided into two categories: (i) an organized over the counter market, in which the transactions are supervised by self-regulating entities authorized by the CVM; and (ii) a non-organized over the counter market, in which the transactions are not supervised by self-regulating entities authorized by the CVM. In either case, transactions are directly traded outside of the stock exchange market, through a financial institution authorized by the CVM. No special application, other than registration with the CVM, is necessary for securities of a public company to be traded in this market. The CVM requires that it be given notice of all trades carried out in the Brazilian over-the-counter market by the respective intermediaries.
Investment in Our Common Shares by Non-Residents of Brazil
Portfolio Investment
Investors residing outside Brazil are authorized to purchase equity instruments, including our common shares, in the form of foreign portfolio investments on the BM&FBOVESPA, provided that they comply with the registration requirements set forth in Resolution No. 2,689 of the National Monetary Council (or “Resolution No. 2,689”), and CVM Instruction No. 325.
With certain exceptions, Resolution No. 2,689 investors are permitted to carry out any type of transaction in the Brazilian financial capital market involving a security traded on a stock, futures or organized over-the-counter market authorized by the CVM. Investments and remittances outside Brazil of gains, dividends, profits or other payments under our common shares are made through the foreign exchange market. See “Item 10. Additional Information—D. Exchange Controls.”
In order to become a Resolution No. 2,689 investor, an investor residing outside Brazil must:
|
|
·
|
appoint a representative in Brazil with powers to take actions relating to the investment;
|
|
|
·
|
appoint an authorized custodian in Brazil for the investments, which must be a financial institution duly authorized by the Central Bank and CVM;
|
|
|
·
|
appoint a tax representative in Brazil;
|
|
|
·
|
through its representative in Brazil, register itself as a foreign investor with the CVM and the Central Bank; and
|
|
|
·
|
through its representative in Brazil, register itself with the Brazilian Internal Revenue (Receita Federal) pursuant to the Regulatory Instructions No. 461 and 568, as the case may be.
|
Securities and other financial assets held by foreign investors pursuant to Resolution No. 2,689 must be registered or maintained in deposit accounts or under the custody of an entity duly licensed by the Central Bank or the CVM. In addition, securities trading by foreign investors is generally restricted to transactions carried out in the Brazilian stock exchanges or in organized over-the-counter markets licensed by the CVM. Therefore, as a general rule, no private sale of securities and other financial assets held by foreign investors pursuant to Resolution No. 2,689 are permitted.
Foreign Direct Investment
Foreign direct investors under Law No. 4,131/62 may sell their shares in both private or open market transactions, but these investors will generally be subject to less favorable tax treatment on gains as compared to foreign portfolio investors.
A foreign direct investor under Law No. 4,131/62 must:
|
|
·
|
register itself as a foreign direct investor and the investment with the Central Bank;
|
|
|
·
|
obtain a taxpayer identification number from the Brazilian tax authorities;
|
|
|
·
|
appoint a tax representative in Brazil; and
|
|
|
·
|
appoint a representative in Brazil for service of process in respect of suits based on Brazilian corporate law.
|
Depositary Receipts
Resolutions No. 1,927/92 and 3,485/10 of the National Monetary Council, which restated and amended Annex V to Resolution No. 1,289/87 of the National Monetary Council, provides for the issuance of depositary receipts in foreign markets in respect of shares of Brazilian issuers. Our ADSs program was approved by the CVM on March 8, 2007.
If a holder of ADSs decides to exchange ADSs for the underlying common shares, the holder may (1) sell the common shares on the BM&FBOVESPA and rely on the depositary’s electronic registration for five business days from the date of exchange to obtain and remit U.S. dollars abroad upon the holder’s sale of our common shares; (2) convert its investment into a foreign portfolio investment under Resolution No. 2,689/00, subject to simultaneous foreign exchange transactions (without actual inflow or outflow of funds); or (3) convert its investment into a foreign direct investment under Law No. 4,131/62, subject to simultaneous foreign exchange transactions.
If a holder of ADSs wishes to convert its investment into either a foreign portfolio investment under Resolution No. 2,689/00 or a foreign direct investment under Law No. 4,131/62, it should first comply with such regulations, obtaining his own foreign investor registration with the Central Bank or with the CVM as the case may be, in advance of exchanging the ADSs for common shares and of executing the simultaneous foreign exchange agreements.
The custodian is permitted to update the depositary’s electronic registration to reflect conversions of foreign portfolio investments under Resolution No. 2,689/00 into ADSs. If a foreign direct investor under Law No. 4,131/62 wishes to deposit its shares into the ADR program in exchange for ADSs, such holder will be required to execute simultaneous foreign exchange transactions and to present to the custodian evidence of payment of the applicable taxes. The update and conversion will be effected after obtaining Central Bank’s authorization. Please refer to “Item 10. Additional Information—E. Taxation—Brazilian Tax Considerations” for a description of the tax consequences to an investor residing outside Brazil of investing in our common shares in Brazil.
D. Selling Shareholders
Not applicable.
E. Dilution
Not applicable.
F. Expenses of the Issue
Not applicable.
A. Share Capital
Not applicable.
B. Memorandum and Bylaws
Registration
We are currently a publicly-held company incorporated under the laws of Brazil, registered with the Board of Trade of the State of São Paulo (JUCESP) under NIRE 35300147952 and with the CVM under No. 01610-1, and enrolled with the Brazilian Taxpayer’s Authorities under CNPJ/MF No. 01,545,826/0001-07.
Corporate Purposes
Article 3 of our bylaws provides that our corporate purpose is to: (1) promote and develop any type of real estate project, whether our own or that of a third party, in the latter case as a contractor and agent; (2) purchase and sell any type of real estate; (3) perform civil construction and provide civil engineering services; and (4) develop and implement marketing strategies for any type of real estate project, whether our own or that of a third party.
Issued Share Capital
As of December 31, 2012, our share capital was R$2,735.8 million, all of which was fully subscribed and paid-in. Our share capital is comprised of 433,229,779 registered, book-entry common shares, without par value. Under our bylaws, our board of directors may increase our share capital to the limit of our authorized capital by issuing up to 600 million common shares without the need of specific shareholder approval. Our shareholders must approve any capital increase above that amount at a shareholders’ general meeting. Pursuant to the agreement entered into with the BM&FBOVESPA for the listing of our shares on the
Novo Mercado
, we are not permitted to issue preferred shares.
Novo Mercado
Our shares were accepted for trading on the
Novo Mercado
on February 17, 2006. In order to delist our shares from the
Novo Mercado
and since we currently do not have a controlling shareholder, the general shareholders’ meeting that decides upon the delisting shall appoint among those presents the person that, upon its express acceptance, must conduct a tender offer for the purchase of the shares of our capital stock outstanding in the market. See “—Delisting from the
Novo Mercado
.” In the
Novo Mercado
, listed companies are required to, among others, (1) only issue common shares, (2) maintain a minimum free float equal to at least 25% of the company’s capital, (3) detail and include additional information in the quarterly information and (4) make available the annual financial statements in English and based on international accounting standards.
The rules imposed by the
Novo Mercado
aim at providing transparency in relation to the activities and economic situation of the companies to the market, as well as more power to the minority shareholders in the management of the companies, among other rights. The main rules relating to the
Novo Mercado
, to which the company is subject, are summarized below.
According to CMN Resolution No. 3,792 of September 24, 2009, which governs the closed complementary social security entities’ investment policy (
Entidades Fechadas de Previdência Complementar —
EFPC), such pension funds may invest up to 70% of its variable income investment portfolio (in which are included corporate stakes) in publicly held companies listed in the
Novo Mercado
, which may, therefore, improve the development of this corporate governance segment, benefiting the companies listed therein, taking into account the immense financial equity held by such pension funds in Brazil.
Authorization for Trading in the Novo Mercado
Firstly, the company that is authorized to list its securities on the
Novo Mercado
of BM&FBOVESPA shall keep its listed company register with the CVM updated, which allows the trading of the company’s common shares at the stock market. The Listing Rules of the
Novo Mercado
were recently revised and the new rules are in full force and effect since May 10, 2011. We have already adapted our bylaws to the new rules of the
Novo Mercado
within the scope of the amendment of our bylaws, as approved by the shareholders’ general meeting held on June 9, 2011.
According to the Listing Rules of the
Novo Mercado
, the company willing to negotiate its securities on the
Novo Mercado
shall, among other conditions: (1) along with its controlling shareholder (if any), execute a Listing Agreement in the
Novo Mercado
, (2) adapt its bylaws to comply with the minimum requirements determined in the Listing Rules of the
Novo Mercado
and (3) file the Management Compliance Statements and the Fiscal Council Compliance Statements (if applicable) with BM&FBOVESPA, duly executed by all managers and members of the fiscal council, respectively. The capital of the company shall be exclusively divided into common shares and a minimum free float equal to 25% of the capital stock shall be maintained by the company. The existence of founders’ shares by the companies listed on the
Novo Mercado
is prohibited.
In addition to the previous requirements, the company’s bylaws may not (1) establish any provision which restricts the number of votes of any shareholder or group of shareholders (as defined in the Listing Rules of the
Novo Mercado
) to a percentage inferior to 5% of the company’s corporate capital, (2) determine qualified quorums for matters submitted for the approval of the shareholders’ general meetings, except as provided by law, nor (3) restrict or establish any encumbrance to shareholders who vote favorably to the suppression or amendment of any provision of the company’s bylaws.
Board of Directors
The board of directors of companies authorized to have their shares traded on the
Novo Mercado
shall be comprised of at least five members, of which at least 20% shall be independent, as defined in the Listing Rules of the
Novo Mercado
. The members of the board of directors shall be elected by a shareholders’ general meeting for a maximum two-year term of office, and are eligible for reelection. All new members of the board of directors and of the board of officers shall sign a Management Compliance Statement which shall be filed with BM&FBOVESPA within 15 days of the date such members take office. Through such Compliance Statement, the company’s directors and officers are personally responsible for complying with the Listing Agreement in the
Novo Mercado
, the Rules of the Market Arbitration Chamber, the Listing Rules of the
Novo Mercado
and any other rule issued by BM&FBOVESPA regarding the
Novo Mercado
.
The positions of chairman of the board of directors and of chief executive officer may not be cumulated by the same person, except in the event of (1) a transition period (limited to 3 years as of the date the company was authorized to negotiate on the
Novo Mercado
, except if BM&FBOVESPA authorizes otherwise); or (2) vacancy, for a maximum period of 180 days.
Directors shall inform the company of any other board of directors, executive committee, fiscal council or any other office occupied by them in other companies or entities, which information will be sent by the company to BM&FBOVESPA pursuant to the terms established in the Listing Rules of the
Novo Mercado
.
The board of directors shall always disclose to the market an opinion regarding any tender offer of the company’s shares, informing, among others, their position on the convenience and consequences of such offer in respect to the interests (a) of the shareholders and regarding the liquidity of such securities held by the shareholders and (b) of the company, stating their reasons for being favorable or against the offer.
Other Novo Mercado Characteristics
Novo Mercado
rules cover other areas designed to foster high levels of corporate governance and market transparency. Companies are required to keep the minimum stock percentage floating in the market in order to foster dispersion of share ownership. In addition, companies are obliged to assign tag-along rights to their shareholders in order to ensure equal treatment if a controlling shareholder sells its controlling stake.
The
Novo Mercado
rules require companies to provide quarterly information on the number of shares held by the controlling shareholder, if any, in addition to other information required by the Listing Rules of the
Novo Mercado
. We provide such required information on a quarterly basis and voluntarily on a monthly basis. Companies are also required to give more disclosure regarding related party transactions in which a company may be involved. The Listing Rules of the
Novo Mercado
also require companies to prepare and disclose to BM&FBOVESPA and to the market a Securities Negotiation Policy applicable to the company, its controlling shareholders, directors, officers, members of the fiscal council and members of other committees, as well as a Code of Conduct establishing the company’s principles and values regarding its relationship with its management, employees, service providers and any person or entity with which the company maintains any relation.
Finally, controlling shareholders, other shareholders, directors, officers and members of a company’s fiscal council are required to submit to arbitration any disputes or conflicts related to or arising from the Listing Rules of the
Novo Mercado
, the Listing Agreement in the
Novo Mercado
, the Penalties Regulation and the Arbitration Clause, specifically with regard to their application, validity, effectiveness and interpretation. The arbitrations shall take place before the Market Arbitration Chamber established by the BM&FBOVESPA and shall be conducted in accordance with the Rules of the Market Arbitration Chamber.
Company Management
We are managed by a board of directors (
Conselho de Administração
) and a board of officers (
Diretoria
). See “Item 6. Directors, Senior Management and Employees—C. Board Practices.”
The members of the board of directors and of the board of officers must be individuals, provided that the latter must also be Brazilian residents.
Conflict of Interests
According to the Brazilian corporate law a director or an officer shall not take part in any corporate transaction in which he/she has an interest which conflicts with the interest of the company. In this case, he/she shall disclose his/her disqualification to the other directors or officers and shall cause the nature and extent of his/her interest to be recorded in the minutes of the board of directors or board of officers’ meeting, as the case may be.
With due compliance with the rules above relating to conflict of interests, a director or an officer may only contract with the company under reasonable and fair conditions, identical to those which prevail in the market or under which the corporation would contract with third parties. Any business contracted otherwise is voidable and the director or the officer concerned shall be obliged to transfer to the corporation all benefits which he/she may have obtained in such business.
According to Brazilian corporate law, a director or officer may not:
|
|
·
|
perform any act of generosity to the detriment of the company;
|
|
|
·
|
without prior approval of the shareholders’ general meeting or the board of directors, borrow money or property from the company or use its property, services or take advantage of its standing for his/her own benefit, for the benefit of a company in which he/she has an interest or for the benefit of a third party; and
|
|
|
·
|
by virtue of his or her position, receive any type of direct or indirect personal advantage from third parties, without authorization in the bylaws or from a shareholders’ general meeting.
|
According to our bylaws, any business or agreement between the company and any director or officer must be previously approved by the board of directors, except if specified in our annual budget or business plan.
Rules for Retirement
There is no retirement age relating to directors or officers pursuant to the Brazilian law and our bylaws.
Policy for the Trading of Our Securities
On July 11, 2011, our board of directors approved the amendment of our Conduct Manual on Information Disclosure and Use and Securities Trading Policy passed on July 15, 2009, which establishes the following procedures regarding the policy for the trading of our securities:
|
|
·
|
the company and all of our directors, executive officers, employees, members of the other bodies with technical or consultant duties, our possible controlling shareholders, and whoever by virtue of his/her position, job, or post at our company or our subsidiaries and affiliates, and who have signed the compliance statement and became aware of information of a material transaction or event involving our company, are restricted from trading in our securities until such material transaction or event is disclosed to the market as a material fact, except as regards treasury stock transactions, through private trading, the exercise of options to purchase shares of our capital stock, with stock option plan approved by the shareholders, or a possible buyback, also through private trading, carried out by us, provided that such buyback program. This restriction is extended to periods prior to the announcement of such information or annual or interim financial statements or prior to disclosure of a material fact in accordance with applicable law;
|
|
|
·
|
trading of our securities or transactions related to our securities carried out by the aforementioned persons pursuant to an Individual Investment Program, consisting of long-term investments, as defined in the Trading Policy, is not subject to the aforementioned restrictions; provided that the Individual Investment Program is filed with the investors relations officer at least 30 days in advance;
|
|
|
·
|
the restrictions of the Trading Policy also apply to our former directors and executive officers who resigned prior to the public disclosure of a transaction or fact that began during their administration (a) for the six
month period following the end of their duties with the company, or (b) until the disclosure of the material event or the related financial statements, whichever occurs first; and
|
|
|
·
|
the abovementioned restrictions also apply to indirect trading carried out by such persons, except those conducted by investment funds, provided that the investment funds are not exclusive and the transaction decisions taken by the investment fund officers cannot be influenced by its unit holders.
|
Rights of Common Shares
Each of our common shares entitles its holder to one vote at an annual or special shareholders’ general meeting. A holder of ADSs has the right under the deposit agreement to instruct the depositary to exercise the voting rights for the common shares represented by his/hers ADSs. See “Item 3. Key Information—D. Risk Factors—Risks Relating to Our Common Shares and the ADSs.” Pursuant to our bylaws, Brazilian corporate law and the
Novo Mercado
rules, owners of common shares are entitled to dividends, or other distributions made in respect of common shares, in proportion to their ownership of outstanding shares. See “Item 8. Financial Information—A. Consolidated Statements and Other Financial Information—Dividend Policy” and “Item 9. The Offer and Listing—C. Markets— Investment in Our Common Shares by Non-Residents of Brazil” for a more complete description of payment of dividends and other distributions on our common shares. In addition, upon our liquidation, holders of our shares are entitled to share all our remaining assets, after payment of all our liabilities, ratably in accordance with their respective participation in the total amount of our issued and outstanding shares. Holders of our common shares are entitled to participate on a
pro rata
basis in future capital calls by our company except in some specific circumstances under Brazilian law, as described in “—Preemptive Rights.” Our common shares have tag along rights, which enable their holders to, upon the sale of a controlling interest in us, receive 100% of the price paid per common share of the controlling block by a single or series of transaction.
Options
According to our bylaws, we may, within our authorized share capital and upon resolution of the shareholders’ general meeting, grant stock options to (1) our directors, executive officers and employees, or (2) individuals who provide services to us or to companies we control.
Appraisal Rights
Shareholders who are absent, dissent or abstain from voting on certain actions taken during a shareholders’ general meeting have the right under Brazilian corporate law to withdraw from our company and to receive the value of their shares.
According to Brazilian corporate law, shareholder appraisal rights may be exercised in the following circumstances, among others:
|
|
·
|
a reduction in the percentage of our mandatory dividends;
|
|
|
·
|
a change in our corporate purpose;
|
|
|
·
|
an acquisition, by our company, of a controlling stake in another company if the acquisition price is outside of the limits established by Brazilian corporate law;
|
|
|
·
|
a merger of shares involving our company, a merger of our company into another company, if we are not the surviving entity, or our consolidation with another company; or
|
|
|
·
|
an approval of our participation in a group of companies (as defined in Brazilian corporate law).
|
Brazilian corporate law further provides that any resolution regarding a spin-off will also entitle shareholders to withdraw if the spin-off:
|
|
·
|
causes a change in our corporate purpose, except if the equity is spun-off to a company whose primary activities are consistent with our corporate purposes;
|
|
|
·
|
reduces our mandatory dividends; or
|
|
|
·
|
causes us to join a group of companies (as defined in Brazilian corporate law).
|
In cases where (1) our company merges with another company where we are not the surviving company, or (2) we are consolidated with another company, or (3) we participate in a group of companies (as defined in Brazilian corporate law), our shareholders will not be entitled to withdraw from our company if their respective shares are (a) liquid, i.e. part of the BM&FBOVESPA index or other stock exchange index in Brazil or abroad, (as defined by the CVM), and (b) widely held, such that less than 50% of our shares are held by a controlling shareholder or by companies a controlling shareholder controls. We are currently part of the IBM&FBOVESPA (the BM&FBOVESPA index) and have no controlling shareholder. Therefore, our shares are, at present, considered liquid and widely held for the purposes of this paragraph.
The right to withdraw expires 30 days after publication of the minutes of the relevant shareholders’ general meeting. We are entitled to reconsider any action giving rise to withdrawal rights for 10 days after the expiration of the 30-day period if the redemption of shares of absent, dissenting or non-voting shareholders would jeopardize our financial stability. If shareholders exercise withdrawal rights, they are entitled to receive the economic value of the company’s shares, as determined by a valuation report issued by a specialized firm. If the resolution giving rise to the appraisal rights is made later than 60 days after the date of the last approved balance sheet, the shareholder may demand that his or her shares be valued according to a new balance sheet dated no less than 60 days before the resolution date. In this case, we must immediately pay 80% of the equity value of the shares according to the most recent balance sheet approved by our shareholders, and the remaining balance must be paid within 120 days after the date of the resolution of the shareholders’ general meeting.
Redemption of Shares
According to Brazilian corporate law, we may redeem our shares by a decision taken in a special shareholders’ general meeting by shareholders representing at least 50% of our share capital. The share redemption may be paid with our profit, profit reserves or capital reserves. If the share redemption is not applicable to all shares, the redemption will be made by lottery. If custody shares are picked in the lottery and there are no rules established in the custody agreement, the financial institution will specify on a
pro rata
basis, the shares to be redeemed.
Registration of Shares
Our shares are held in book-entry form with Itaú Unibanco Corretora S.A., which will act as the custodian agent for our shares. Transfer of our shares will be carried out by means of book entry by Itaú Unibanco S.A., debiting the share account of the seller and crediting the share account of the buyer, with the presentation of a written order of the transferor or a judicial authorization or order to effect such transfers.
Preemptive Rights
Except as provided below, our shareholders have a general preemptive right to participate in any issuance of new shares, convertible debentures and warrants, in proportion to their respective shareholding at such time, but the conversion of debentures and subscription warrants into shares, the granting of options to purchase shares and the issuance of shares as a result of its exercise, are not subject to preemptive rights. In addition, Brazilian corporate law allows for companies’ bylaws to give the board of directors the power to exclude preemptive rights or reduce the exercise period of such rights with respect to the issuance of new shares, debentures convertible into shares and subscription warrants up to the limit of the authorized share capital if the distribution of those shares, debentures or subscription warrants is effected through a sale on a stock exchange, through a public offering or through an exchange of shares in a tender offer the purpose of which is to acquire control of another company. Shareholders are allowed to exercise the preemptive rights for a period of at least 30 days following the publication of notice of the issuance of shares, convertible debentures and warrants, and the right may be transferred or disposed of for consideration.
Holders of ADSs may be unable to exercise preemptive rights with respect to our common shares underlying the ADSs. See “Item 3. Key Information—D. Risk Factors—Risks Relating to Our Common Shares and the ADSs—Holders of ADSs may be unable to exercise preemptive rights with respect to our common shares underlying the ADSs.”
Shareholders’ General Meetings
Under Brazilian corporate law, at our shareholders’ meetings, shareholders are empowered to take any action relating to our corporate purpose and to pass any such resolutions as they deem necessary. The approval of our financial statements and the determination of the allocation of our net profits with respect to each fiscal year take place at our annual general shareholders’ meeting immediately following such fiscal year. The election of our directors and, if requested by shareholders, of members of our fiscal council typically takes place at the annual general shareholders’ meeting, although under Brazilian law it may also occur at a special shareholders’ general meeting.
A special shareholders’ general meeting may be held concurrently with the annual general shareholders’ meeting. Pursuant to our bylaws and Brazilian corporate law, the following actions, among others, may only be taken at a general shareholders’ meeting:
|
|
·
|
amendment of our bylaws, including amendment of our corporate purpose;
|
|
|
·
|
election and dismissal, at any time, of our directors and members of our fiscal council;
|
|
|
·
|
determination of the aggregate compensation of our board of directors and board of officers, as well as the fiscal council’s compensation;
|
|
|
·
|
approval of stock splits and reverse stock splits;
|
|
|
·
|
approval of a stock option plan;
|
|
|
·
|
approval of the company’s financial statements;
|
|
|
·
|
resolution upon the destination of our net profits and distribution of dividends;
|
|
|
·
|
election of the fiscal council to function in the event of our dissolution;
|
|
|
·
|
cancellation of our registration with the CVM as a publicly-held company;
|
|
|
·
|
suspension of the rights of a shareholder who has violated Brazilian corporate law or our bylaws;
|
|
|
·
|
acceptance or rejection of the valuation of in-kind contributions offered by a shareholder in consideration for shares of our capital stock;
|
|
|
·
|
approval of our transformation into a limited liability company or any other corporate form;
|
|
|
·
|
delisting of our common shares from the
Novo Mercado
;
|
|
|
·
|
appointment of a financial institution responsible for our valuation, in the event of a mandatory tender offer, specifically in the event that a tender offer for our common shares is carried out in connection with the delisting of our common shares from the
Novo Mercado
or cancellation of our registration as a publicly-held company;
|
|
|
·
|
reduction in the percentage of mandatory dividends;
|
|
|
·
|
participation in a group of companies (as defined in Brazilian corporate law);
|
|
|
·
|
approval of any merger, consolidation with another company or spin-off;
|
|
|
·
|
approval of our dissolution or liquidation, the appointment and dismissal of the respective liquidator and the official review of the reports prepared by him or her; and
|
|
|
·
|
authorization to petition for bankruptcy or request for judicial or extrajudicial restructuring.
|
According to Brazilian corporate law, neither a company’s bylaws nor actions taken at a shareholders’ meeting may deprive a shareholder of specific rights, such as:
|
|
·
|
the right to participate in the distribution of profits;
|
|
|
·
|
the right to participate equally and ratably in any remaining residual assets in the event of liquidation of the company;
|
|
|
·
|
preemptive rights in the event of subscription of shares, convertible debentures or subscription warrants, except in some specific circumstances under Brazilian law described in “—Preemptive Rights;”
|
|
|
·
|
the right to inspect and monitor the management of the company’s business in accordance with Brazilian corporate law; and
|
|
|
·
|
the right to withdraw from the company in the cases specified in Brazilian corporate law, described in “—Appraisal Rights.”
|
Quorum for our Shareholders’ General Meetings
As a general rule, Brazilian corporate law provides that a quorum at a shareholders’ general meeting consists of shareholders representing at least 25% of a company’s issued and outstanding voting capital on the first call and, if that quorum is not reached, any percentage on the second call. A quorum for the purposes of amending our bylaws consists of shareholders representing at least two-thirds of our issued and outstanding voting capital on the first call and any percentage on the second call.
As a general rule, the affirmative vote of shareholders representing at least the majority of our issued and outstanding common shares present in person or represented by proxy at a shareholders’ general meeting is required to ratify any proposed action, with abstentions not taken into account. However, the affirmative vote of shareholders representing one-half of our issued and outstanding voting capital is required to:
|
|
·
|
reduce the percentage of mandatory dividends;
|
|
|
·
|
change our corporate purpose;
|
|
|
·
|
merge or consolidate our company with another company;
|
|
|
·
|
spin-off a portion of our assets or liabilities;
|
|
|
·
|
approve our participation in a group of companies (as defined in Brazilian corporate law);
|
|
|
·
|
apply for cancellation of any voluntary liquidation;
|
|
|
·
|
approve our dissolution; and
|
|
|
·
|
approve the merger of all our shares into another company.
|
A quorum smaller than one-half of our issued and outstanding voting capital may be authorized by the CVM for a publicly-held company with widely-traded and widespread shares that has had less than half of the holders of its voting shares in attendance at its last three shareholders’ meetings. In such case, resolutions may only be taken on a third call.
According to our bylaws and for so long as we are listed on the
Novo Mercado
, we may not issue preferred shares or founders’ shares and we will have to conduct a tender offer in order to delist ourselves from the
Novo Mercado
.
Notice of our Shareholders’ General Meetings
According to Brazilian corporate law, notice of our shareholders’ general meetings must be published at least three times in the
Diário Oficial do Estado de São Paulo
, the official newspaper of the State of São Paulo, and in
another widely circulated newspaper in the same State, previously chosen at an annual shareholders meeting, which, in our case is
O Estado de São Paulo
. The first notice must be published no later than 15 days before the date of the meeting on the first call, and no later than eight days before the date of the meeting on the second call. However, in certain circumstances, upon the request of any shareholder, the CVM may require that the first notice be published 30 days in advance of the meeting if the meeting relates to complex transactions and, accordingly, shareholders need more time to be familiarized with and analyze such transactions. In addition, the CVM may suspend for up to 15 days the required prior notice of the special shareholders’ general meeting so that it may further analyze the proposal to be voted upon at such meeting. Such call notice in all circumstances shall contain the agenda for the meeting and a list of the documents that will be required from our shareholders to be admitted at the meetings. CVM Regulation No. 481 of December 17, 2009 also requires that additional information be disclosed in the call notice for certain matters. For example, in the event of an election of directors, the call notice shall also disclose the minimum percentage of equity participation required from a shareholder to request the adoption of cumulative voting procedures. All documents pertaining to the matters to be discussed at the shareholders’ general meeting shall be made available to the shareholders upon publication of the first call notice, except if the law or CVM regulations provide otherwise.
Location of our Shareholders’ General Meetings
Our shareholders’ meetings shall take place at our head offices at Av. Nações Unidas No. 8,501, 19th floor, 05425-070 – São Paulo, SP – Brazil. Brazilian corporate law allows our shareholders to hold meetings outside our head offices in the event of force majeure, provided that the relevant notice contains a clear indication of the place where the meeting will occur, which, in any case, shall never be held outside the city where the company’s headquarters are located.
Who May Call our Shareholders’ General Meetings
According to Brazilian corporate law, our board of directors may call a shareholders’ general meeting. Shareholders’ general meetings may also be called by:
|
|
·
|
any shareholder, if our directors fail to call a shareholders’ general meeting within 60 days after the date they were required to do so under applicable laws and our bylaws;
|
|
|
·
|
shareholders holding at least 5% of our share capital if our directors fail to call a meeting within eight days after receipt of a request to call the meeting by those shareholders, and such request must indicate the proposed agenda;
|
|
|
·
|
shareholders holding at least 5% of voting share capital or 5% of non-voting share capital if our directors fail to call a meeting within eight days after receipt of a request to call the meeting to convene a fiscal council; and
|
|
|
·
|
our fiscal council (if installed), in the event our board of directors delays calling an annual shareholders’ meeting for more than one month. The fiscal council may also call a special general shareholders’ meeting at any time if it believes that there are significant or urgent matters to be addressed.
|
There is an obligation of the chairman of our board of directors to call a shareholders’ general meeting if: (1) we are not under control of a shareholder holding more than 50% of our voting capital, and (2) BM&FBOVESPA determines that the price of our shares shall be quoted separately or that the trading of our shares on the
Novo Mercado
shall be suspended by reason of non-compliance with the listing rules of
Novo Mercado
. At such a meeting all members of our board of directors must be replaced. In the event the shareholders’ general meeting is not called by the chairman of the board of directors within the time period established in our bylaws, the meeting may be called by any shareholder of the company.
Conditions for Admission at our Shareholders’ General Meetings
A shareholder may be represented at a shareholders’ general meeting by a proxy, as long as the proxy is appointed less than a year before such shareholders’ general meeting. The proxy must be either a shareholder, an executive officer or a director of our company, a lawyer or a financial institution. An investment fund must be represented by its investment fund officer.
Shareholders attending a shareholders’ general meeting must deliver proof of their status as shareholders and proof that they hold the shares they intend to vote by delivery of proper identification and a receipt issued by the custodian agent of our shares.
Arbitration
Any disputes or controversies involving our company, our shareholders, members of our management or our fiscal council relating to or arising from the Listing Agreement on the
Novo Mercado
, Listing Rules, our bylaws, Brazilian corporate law, the rules published by the CMN, the Central Bank, the CVM, any shareholders’ agreement filed at our headquarters, and other rules applicable to the Brazilian capital markets in general, must be submitted to arbitration conducted in accordance with the Rules of the Market Arbitration Chamber established by the BM&FBOVESPA. For arbitration procedures started prior to October 25, 2011, the parties are able to consensually agree to use another arbitration chamber or center to resolve their disputes under
ad hoc
arbitration procedures.
Going Private Process
We may become a private company by the decision of our shareholders only if we conduct a public tender offer to acquire all of our outstanding shares in accordance with the rules and regulations of Brazilian corporate law, the CVM and the
Novo Mercado
regulations which requires:
|
|
·
|
a fair bid price at least equal to the value estimated of the company; and
|
|
|
·
|
shareholders holding more than two thirds of the outstanding shares have specifically approved the process or accepted the offer.
|
The minimum price offered for the shares in the public tender offer will correspond to the economic value of such shares, as determined by a valuation report issued by a specialized firm, and we may only purchase shares from shareholders that have voted in favor of us becoming a private company after purchasing all shares from the other shareholders that did not vote in favor of such deliberation and that have accepted the public tender offer.
The valuation report must be prepared by a specialized and independent firm of recognized experience chosen by the shareholders representing the majority of the outstanding shares present at the relevant shareholders’ meeting (excluding, for such purposes, treasury shares, shares held by our affiliates and by other companies that are a part of our economic group, as well as blank votes) from a list of three institutions presented by our board of directors. All the expenses and costs incurred in connection with the preparation of the valuation report must be paid for by the person making the tender offer.
Shareholders holding at least 10% of our outstanding shares may require our management to call a special shareholders’ general meeting to determine whether to perform another valuation using the same or a different valuation method. This request must be made within 15 days following the disclosure of the price to be paid for the shares in the public offering. The shareholders who make such request as well as those who vote in its favor must reimburse us for any costs involved in preparing the new valuation, if the new valuation price is not higher than the original valuation price. If the new valuation price is higher than the original valuation price, the public offering must be made at the higher price.
Delisting from the
Novo Mercado
We may, at any time, delist our common shares from the
Novo Mercado
, provided that shareholders approve the decision and that the BM&FBOVESPA is notified in writing at least 30 days in advance. Delisting of shares from the
Novo Mercado
does not require delisting from the BM&FBOVESPA.
If our common shares are delisted from the
Novo Mercado
, our controlling shareholders, if any, will be required to conduct a tender offer for the acquisition of our outstanding common shares. In case there are no controlling shareholders, the shareholders’ general meeting deciding on the delisting must also appoint who will be responsible for the mandatory tender offer. The minimum price offered for the shares in the public tender offer will correspond to the economic value of the shares, as determined by a valuation report issued by a specialized firm chosen by the shareholders representing a majority of the outstanding shares (excluding, for such purposes, shares held by the controlling shareholders, if any, and their affiliates, treasury shares, shares held by our affiliates, and blank votes) from a list of three institutions presented by our board of directors. All the expenses and costs incurred in
connection with the preparation of the valuation report must be paid for by the controlling shareholder, if any, or by us.
If our delisting from the
Novo Mercado
occurs due to the cancellation of our registration as a publicly held company, all the other requirements established by such delisting shall be followed. See “—Going Private Process.”
In the event that we delist due to a corporate reorganization where the surviving company is not admitted for listing on the
Novo Mercado
within one hundred and twenty days as of the date of the shareholders’ general meeting that resolved on the corporate reorganization, the then-controlling shareholders will need to carry out a public tender offer for the acquisition of the shares held by the other shareholders, and the minimum price offered per share shall be the economic value of the shares. In case the company does not have controlling shareholders, the shareholders’ general meeting that decided on the delisting must also determine who will be responsible for the mandatory tender offer, and in case the shareholders’ general meeting fails to do so, the shareholders who approved the corporate reorganization will be responsible for the tender offer. The notice of public tender offer shall be given to the BM&FBOVESPA and released to the market immediately after the shareholders’ general meeting that has approved the corporate reorganization.
If our share control is sold within twelve months of our delisting from the
Novo Mercado
, the selling controlling shareholder and the acquirer shall offer to acquire the shares of all other shareholders under the same conditions offered to the selling controlling shareholder.
Sale of a Controlling Stake in our Company
Under the Listing Rules of the
Novo Mercado
, the sale of a controlling interest in our company, either through a single transaction or through successive transactions, takes place under a suspension or resolution condition, where the acquirer agrees to, within the time and pursuant to the conditions specified under Brazilian corporate law and the Listing Rules of the
Novo Mercado
, make a tender offer of the remaining shares of the other shareholders under the same terms and conditions granted to the selling controlling shareholder.
A tender offer is also required under the following conditions:
|
|
·
|
when rights are assigned for a subscription of shares and other securities or rights related to securities convertible into shares that results in the sale of the company’s controlling stake;
|
|
|
·
|
when, if the controlling shareholder is an entity, the control of such controlling entity is transferred; and
|
|
|
·
|
when a controlling stake is acquired through an agreement for the purchase of shares. In this case, the acquirer is obligated to make a tender offer under the same terms and conditions granted to the selling shareholders and reimburse the shareholders from whom he/she had purchased the shares traded on stock exchanges within the six months before the sale date of the company’s share control. The reimbursement value is the difference between the price paid to the selling controlling shareholder and the amount traded on stock exchanges per share, during this period, adjusted by the inflation in the period. Such amount shall be distributed among all persons who sold shares issued by the company in the stock market trading session in which the acquirer made its acquisitions, proportionally to the daily net selling balance of each acquisition, being BM&FBOVESPA responsible for processing such distribution according to its regulations.
|
The buyer, when necessary, must take the necessary measures to recompose the minimum 25% of outstanding shares in the market within the subsequent six months.
Mandatory Tender Offer in Case of Acquisition of a 30% Stake
Under the rules of our bylaws, if any person acquires our shares, or any securities or rights related to such shares, in an amount representing 30% or more of our corporate capital, such acquirer has to carry out a mandatory tender offer for the acquisition of all shares issued by the Company. The minimum price offered for the shares in the public tender offer will correspond to the economic value of such shares, as determined by a valuation report issued by a specialized firm.
The valuation report must be prepared by a specialized and independent firm of recognized experience chosen by the shareholders representing the majority of the outstanding shares present at the relevant shareholders’ meeting (excluding, for such purposes, shares held by the controlling shareholder, if any, by the members of the board of directors and officers appointed, directly or indirectly, by the controlling shareholder, if any, treasury shares, as well as abstentions) from a list of three institutions presented by our board of directors. All the expenses and costs incurred in connection with the preparation of the valuation report must be paid for by the person making the tender offer.
Shareholders holding at least 10% of our outstanding shares may require our management to call a special shareholders’ general meeting to determine whether to perform another valuation using the same or a different valuation method. This request must be made within 15 days following the disclosure of the price to be paid for the shares in the public offering. The shareholders who make such request as well as those who vote in its favor must reimburse us for any costs involved in preparing the new valuation, if the new valuation price is not higher than the original valuation price. If the new valuation price is higher than the original valuation price, the acquirer may either increase the offer price or withdraw the tender offer, in the latter case provided that it shall dispose of the shares in excess of 30% of our corporate capital within 3 months counted from the special general meeting mentioned in this paragraph.
A tender offer as a result of an acquisition of a 30% equity stake is not mandatory in any of the following cases: (1) if we have a controlling shareholder with more than 50% of our shares; (2) if a 30% equity stake is obtained as a result of purchases made under another public tender offer for the acquisition of our shares by their economic value, made in accordance with the
Novo Mercado
Listing Rules or with the applicable law; provided that the offer was made for all shares of the company and at least the minimum price has been paid; (3) if a 30% equity stake is obtained involuntarily as a result of a corporate reorganizations, cancellation of shares in treasury, share redemption, capital reduction, or of a subscription of shares made under a primary public offer for distribution of our shares where the preemptive rights were not exercised by all shareholders who had it or which did not have as subscribers as expected; or (4) in the case of a sale of a controlling stake, which is subject to the rules described above for such case.
Purchases by us of our own Shares
Our bylaws entitle our board of directors to approve the acquisition of our own shares. The decision to acquire our shares for purposes of maintaining the acquired shares in treasury or of cancelling them may not, among other things:
|
|
·
|
result in the reduction of our share capital;
|
|
|
·
|
require the use of resources greater than our profit reserves and other available reserves, as provided in our financial statements;
|
|
|
·
|
create, as a result of any action or inaction, directly or indirectly, any artificial demand, supply or condition relating to share price;
|
|
|
·
|
involve any unfair practice;
|
|
|
·
|
be used for the acquisition of unpaid shares or shares held by our controlling shareholders; or
|
|
|
·
|
when a public offer for acquisition of the shares of the company is being made.
|
We may not keep in treasury more than 10% of our outstanding common shares, including the shares held by our subsidiaries and affiliates.
Any acquisition by us of our own shares must be made on a stock exchange and cannot be made in a private transaction, except if previously approved by the CVM. Moreover, we may acquire or issue put or call options related to our shares upon prior approval of the quotaholders.
Disclosure Requirements
We are subject to the reporting requirements established by Brazilian corporate law and the CVM. Furthermore, because we are listed with the
Novo Mercado
, we must also follow the disclosure requirements provided for in the Listing Rules of the
Novo Mercado
.
Disclosure of Information
The Brazilian securities regulations require that a publicly-held corporation provide the CVM and the relevant stock exchanges with periodic information that includes annual information statements, quarterly financial statements, quarterly management reports, independent auditor reports, notices and minutes of shareholders’ meetings, among others. In addition, we also must disclose any material development related to our business to the CVM and the BM&FBOVESPA.
We observe the
Novo Mercado
disclosure standards and are required to, among other things:
|
|
·
|
present the company’s financial statements, standard financial statements form (DFP), quarterly information form (ITR) and Reference Form (
Formulário de Referência
);
|
|
|
·
|
include a note in the quarterly information form (ITR) regarding all operations with related parties;
|
|
|
·
|
disclose and maintain updated the information presented in the Reference Form regarding any shareholder holding, directly or indirectly, at least 5% of the company’s capital stock, considering the information received by company from the relevant shareholders;
|
|
|
·
|
disclose, monthly, the individual and consolidated amount and characteristics of our securities held directly or indirectly by controlling shareholders (if this is the case); and
|
|
|
·
|
disclose, monthly, the individual and consolidated changes in the amount of securities held by controlling shareholders (if this is the case), as well as their respective spouses or dependents, as per their income tax statements, as the case may be.
|
Disclosure of Trading by Insiders
Pursuant to the rules of the
Novo Mercado
, each of our possible controlling shareholders must disclose to the BM&FBOVESPA information in connection with the total amount and characteristics of securities owned, directly or indirectly, by them and issued by us, or any derivatives referenced in such securities, as well as any subsequent trading of such securities and derivatives. In the case of individuals, such information shall also include securities held by the spouse, companion or dependents of such persons, included in the annual income tax statement of such controlling shareholder. This information must be communicated to the BM&FBOVESPA within 10 days following the end of each month.
CVM regulations require our directors, executive officers, members of the fiscal council, and members of any other technical or advisory body to disclose to us, to the CVM and to the BM&FBOVESPA, the total amount, the characteristics and form of acquisition of securities issued by us, listed companies under our control or the control of our listed controlling shareholders, including derivatives referenced in such securities that are held by each of them, as well as any change in such investments within 10 days after the end of the month when the securities were traded. In the case of individuals, such information shall also include securities held by the spouse, companion or dependents of such persons, included in the annual income tax statement and companies controlled directly or indirectly by such person.
In addition, our controlling shareholders, our shareholders who have caused the election of members of our board of directors or fiscal council, as well as any individual, legal entity or group of persons acting jointly whose direct or indirect participation reaches 5% or more of our shares, must provide to us, and we shall transmit such information to the CVM and the BM&FBOVESPA the following information:
|
|
·
|
the name and qualification of the person providing the information;
|
|
|
·
|
reason and purpose for the acquisition; and
|
|
|
·
|
reason and purpose for the acquisition and amount of securities to be acquired, including, as the case may be, a representation of the acquirer stating that the acquisition does not aim at modifying the management or the controlling structure of the company;
|
|
|
·
|
amount of shares, subscription bonuses, as well as other share subscription rights and call options, by type and/or class, already owned, directly or indirectly, by the acquirer or any person related with the acquirer;
|
|
|
·
|
amount of debentures convertible in shares, already owned, directly or indirectly, by the acquirer or person related to the acquirer, displaying the amount of shares object of the possible conversion by type and class; and information on any agreement regarding the exercise of voting rights or the purchase and sale of our securities.
|
The disclosure requirement referred to above will also apply to any person or group acting jointly, holding participation equal to or in excess of 5%, each time such person increases or decreases its participation in our shares by an amount equal to 5% of our shares.
Disclosure of Material Developments
According to Law No. 6,385 of December 7, 1976, and subsequent amendments, and CVM Instruction No. 358 of January 3, 2002, and subsequent amendments, we must disclose any material development related to our business to the CVM and to the BM&FBOVESPA and must publish a notice of the material development. A development is deemed to be material if it has a material impact on the price of our securities, on the decision of investors to trade in our securities or on the decision of investors to exercise any rights as holders of any of our securities.
Under special circumstances, we may request confidential treatment of certain material developments from the CVM, when our management believes that public disclosure could result in adverse consequences to us.
C. Material Contracts
On December 30, 2009, the shareholders of Gafisa and Tenda approved a corporate restructuring to consolidate Gafisa’s non-controlling share ownership in Tenda. The restructuring was accomplished by exchanging all of the remaining Tenda shares not held by Gafisa into Gafisa shares. As a result of the restructuring, Tenda became a wholly-owned subsidiary of Gafisa.
On May 27, 2010, the shareholders of Gafisa approved the acquisition of 20% of Alphaville’s shares, by means of a merger of the totality of shares issued by Shertis Empreendimentos e Participações S.A. or “Shertis”, which main asset are shares representing 20% of Alphaville’s shares, in the total amount of R$126.5 million. As a consequence of such merger, Gafisa issued 9,797,792 common shares, paid to the former shareholders of Shertis. In addition, we will acquire the remaining 20% of Alphaville’s shares that we currently do not own, which may be acquired through the issuance of common shares, depending on the decision of an arbitration which is ongoing at the moment, as per material fact issued on July 3, 2012.
D. Exchange Controls
There are no restrictions on ownership of our common shares by individual or legal entities domiciled outside Brazil. However, the right to convert dividend payments and proceeds from the sale of our shares into foreign currency and to remit such amounts abroad is subject to requirements under foreign investment legislation which generally establish that the relevant investment be registered with the Central Bank and the CVM. Subject to certain procedures and specific regulatory provisions, the purchase and sale of foreign currency and the international transfer of
reais
by a person or legal entity resident, domiciled or headquartered in Brazil, as the case may be, is allowed, without limitation as to amount, provided that the underlying transaction is legal, legitimate and has economic substance, as evidenced by the applicable supporting documentation submitted to the financial institution in charge of the foreign exchange transaction. In addition, foreign currencies may only be purchased through duly authorized financial institutions headquartered in Brazil. See “Item 3. Key Information—D. Risk Factors—Risks Relating to Brazil—Restrictions on the movement of capital out of Brazil may adversely affect your ability to receive dividends and distributions on the ADSs and on our common shares, or the proceeds of any sale of our common shares” and “Item 9. The Offer and Listing—C. Markets—Investment in Our Common Shares by Non-Residents of Brazil.”
In the past, the Brazilian Central Bank has intervened occasionally to control unstable movements in foreign exchange rates. We cannot predict whether the Brazilian Central Bank or the Brazilian government will continue to let the
real
float freely or will intervene in the exchange rate market through the return of a currency band system or otherwise. The
real
may depreciate or appreciate against the U.S. dollar substantially.
Brazilian law provides that, whenever there is a serious imbalance in Brazil’s balance of payments or there are serious reasons to foresee a serious imbalance, temporary restrictions may be imposed on remittances of funds abroad. We cannot assure you that such measures will not be taken by the Brazilian government in the future. See “Item 3. Key Information—D. Risk Factors—Risks Relating to Brazil—Restrictions on the movement of capital out of Brazil may adversely affect your ability to receive dividends and distributions on the ADSs and on our common shares, or the proceeds of any sale of our common shares” and “Item 9. The Offer and Listing—C. Markets—Investment in Our Common Shares by Non-Residents of Brazil.”
E. Taxation
The following discussion contains a description of material Brazilian and U.S. federal income tax consequences of the acquisition, ownership and disposition of common shares or ADSs. The discussion is based upon the tax laws of Brazil and regulations thereunder and on the tax laws of the United States and regulations thereunder as of the date hereof, which are subject to change.
Although there is at present no income tax treaty between Brazil and the United States, the tax authorities of the two countries have had discussions that may culminate in such a treaty. No assurance can be given, however, as to whether or when a treaty will enter into force or how it will affect the U.S. Holders (as defined below) of common shares or ADSs. Prospective holders of common shares or ADSs should consult their own tax advisers as to the tax consequences of the acquisition, ownership and disposition of common shares or ADSs in their particular circumstances.
Brazilian Tax Considerations
The following discussion summarizes the principal Brazilian tax consequences of the acquisition, ownership and disposition of our common shares or ADSs by a holder that is not domiciled in Brazil for purposes of Brazilian taxation (a “Non-Resident Holder”). This discussion is based on Brazilian law as currently in effect, which is subject to change, possibly with retroactive effect, and subject to different interpretations. Any change in that law may change the consequences described below.
The tax consequences described below do not take into account the effects of any tax treaties or reciprocity agreements for tax treatment entered into by Brazil and other countries. The discussion also does not address any tax consequences under the tax laws of any state or municipality of Brazil. The description below is not intended to constitute a complete analysis of all tax consequences relating to the acquisition, exchange, ownership and disposition of our common shares or ADSs. Each Non-Resident Holder should consult his or her own tax adviser concerning the Brazilian tax consequences of an investment in our common shares or ADSs.
Income tax
Dividends
. Dividends paid by a Brazilian corporation, such as our company, including stock dividends and other dividends paid to a Non-Resident Holder of common shares or ADSs, are currently not subject to income withholding tax in Brazil to the extent that such amounts are related to profits generated after January 1, 1996. Dividends paid from profits generated before January 1, 1996 may be subject to Brazilian income withholding tax at varying rates, according to the tax legislation applicable to each corresponding year. We generally expect to pay dividends from profits generated after January 1, 1996.
Interest on Shareholders’ Equity
. Law No. 9,249, dated December 26, 1995, as amended, permits a Brazilian corporation, such as our company, to make distributions to shareholders of interest on shareholders’ equity as an alternative to making dividend distributions and treat such payments as a deductible expense for purposes of calculating Brazilian corporate income tax and social contribution on net profits, to the extent the limits described below are observed. These distributions may be paid in cash. For tax purposes, this interest is limited to the daily
pro rata
variation of the Brazilian long-term interest rate (“TJLP”), as determined by the Central Bank from time to time, and the amount of the deduction may not exceed the greater of:
|
|
·
|
50% of net income (after the deduction of social contribution on net profits but before taking into account the provision for corporate income tax and the interest on shareholders’ equity) for the period in respect of which the payment is made; and
|
|
|
·
|
50% of the sum of retained profits and profit reserves as of the date of the beginning of the period in respect of which the payment is made.
|
Payment of interest to a Non-Resident Holder is subject to income withholding tax at the rate of 15%, or 25% if the Non-Resident Holder is domiciled in a “tax favorable jurisdiction.” The definition of a “tax favorable jurisdiction” includes countries and locations (1) that do not impose income tax, (2) that impose income tax at a rate of 20% or less, or (3) where local laws do not allow access to information related to shareholder composition, ownership of investments or the identity of the ultimate beneficiary of earnings that are attributed to non-residents. Please refer to “—Discussion on Privileged Tax Regimes” below for a discussion that such concept may be broadened by an interpretation of Law No. 11,727/08. These payments of interest on shareholders’ equity may be included, at their net value, as part of any mandatory dividend. To the extent payment of interest on shareholders’ equity is so included, the corporation is required to distribute to shareholders an additional amount to ensure that the net amount received by them, after payment of the applicable withholding income tax, plus the amount of declared dividends is at least equal to the mandatory dividend.
Gains
According to Law No. 10,833/03, enacted on December 29, 2003, the disposition or sale of assets located in Brazil by a Non-Resident Holder, whether to another non-Brazilian resident or to a Brazilian resident, may be subject to capital gain taxes in Brazil.
With respect to the disposition of common shares, which are treated as assets located in Brazil, the Non-Resident Holder will be subject to income tax on the gains assessed, following the rules described below, regardless of whether the transactions are conducted in Brazil or with a Brazilian resident.
With respect to the ADSs, although the matter is not entirely clear, it is reasonable to argue that ADSs do not constitute assets located in Brazil for the purposes of Article 26 of Law No. 10,833 and, therefore, that the gains realized by a Non-Resident Holder on the disposition of ADSs to another Non-Resident Holder should not be taxed in Brazil. We cannot assure you, however, that the Brazilian tax authorities or the Brazilian courts will agree with this interpretation. Accordingly, gains on a disposition of ADSs by a Non-Resident Holder may be subject to income tax in Brazil in the event that courts determine that ADSs constitute assets located in Brazil. For more information, please refer to “Item 3. Key Information—D. Risks Factors—Risks Relating to Our Common Shares and the ADSs—Changes in Brazilian tax laws may have an adverse impact on the taxes applicable to a disposition of the ADSs.”
As a general rule, gains realized as a result of a disposition or sale transaction of common shares (or ADSs should they be deemed to be “assets located in Brazil”) are the positive difference between the amount realized on the sale or exchange of the securities and their acquisition cost.
Under Brazilian law, however, income tax rules on such gains can vary, depending on the domicile of the Non-Resident Holder, the type of registration of the investment by the Non-Resident Holder with the Central Bank and how the disposition is carried out, as described below.
Gains assessed on a disposition of common shares carried out on a Brazilian stock exchange (which includes the transactions carried out on the organized over-the-counter market) are:
|
|
·
|
exempt from income tax when the gain is earned by a Non-Resident Holder that (1) has registered its investment in Brazil with the Central Bank under the rules of Resolution No. 2,689, dated January 26, 2000 (“2,689 Holder”) and (2) is not a resident in a country that does not tax income or that taxes it at a maximum rate of 20% (“Low or Nil Tax Jurisdiction”); or
|
|
|
·
|
subject to income tax at a rate of up to 25% in any other case, including a case of gains recognized by a Non-Resident Holder that is not a 2,689 Holder, or is a resident in a Low or Nil Tax Jurisdiction. In these cases, a withholding income tax of 0.005% of the sale value will be applicable and can be later offset against any income tax due on the capital gain.
|
Any other gains recognized on a disposition of the common shares that is not carried out on a Brazilian stock exchange are subject to income tax at the rate of 15%, or 25% in the case of a Non-Resident Holder residing in a Low or Nil Tax Jurisdiction or where the local legislation does not allow access to information related to the shareholders composition of legal entities, to their ownership or to the identity of the ultimate beneficiary of the income attributed to non-residents. In the event that these gains are related to transactions conducted on the Brazilian non-organized over-the-counter market with intermediation, the withholding income tax of 0.005% shall also be applicable and can be offset against the eventual income tax due on the capital gain.
In the case of a redemption of common shares (or ADSs, should they be deemed as “assets located in Brazil”) or a capital reduction by a Brazilian corporation, such as our company, the positive difference between the amount received by the Non-Resident Holder and the acquisition cost of the common shares or ADSs redeemed is treated as capital gain derived from the sale or exchange of shares not carried out on a Brazilian stock exchange and is therefore subject to income tax at the rate of 15%, or 25%, as the case may be.
Any exercise of preemptive rights relating to the common shares or ADSs will not be subject to Brazilian income tax. Gains realized by a Non-Resident Holder on the disposition of preemptive rights relating to the common shares (or ADSs, should they be deemed as “assets located in Brazil”) will be subject to Brazilian income tax according to the same rules applicable to the sale or disposition of common shares.
As a Non-Resident Holder of ADSs, you may cancel your ADSs and exchange them for the underlying common shares and no income tax may be levied on such exchange, as long as the appropriate rules are complied with in connection with the registration of the investment with the Central Bank.
The deposit of common shares by Non-Resident Holders in exchange for ADSs may be subject to Brazilian income tax if the acquisition cost of the common shares is lower than (a) the average price per common share on a Brazilian stock exchange on which the greatest number of such common shares were sold on the day of deposit; or (b) if no common shares were sold on that day, the average price on a Brazilian stock exchange on which the greatest number of common shares were sold in the 15 trading sessions immediately preceding such deposit. The difference between the acquisition cost and the average price of the common shares will be considered to be a capital gain subject to income tax at a rate of 15% or 25%, as the case may be. In some circumstances, there may be arguments to claim that this taxation is not applicable in the case of a Non-Resident Holder that is a 2,689 Holder and is not a resident in a tax favorable jurisdiction.
There can be no assurance that the current favorable treatment of 2,689 Holders will continue in the future.
Discussion on Privileged Tax Regimes
On June 24, 2008, Law No. 11,727 introduced the concept of “privileged tax regimes,” which went into effect on January 1, 2009. In principle, the best interpretation of Law No. 11,727/08 leads us to conclude that the new concept of privileged tax regimes should be applied solely for purposes of transfer pricing rules in export and import transactions for the definition of the applicable rate of withholding income tax on the remittance of specific items of income and for certain other Brazilian tax purposes without relevance for an investment of a Non-Resident Holder in our common shares or ADSs. Although we are of the opinion that the concept of privileged tax regimes should not affect the tax treatment of a Non-Resident Holder described above, we cannot assure you whether subsequent legislation or interpretations by the Brazilian tax authorities regarding the definition of “privileged tax regimes” will extend such concept to the tax treatment of a Non-Resident Holder described above.
Tax on Foreign Exchange and Financial Transactions
Foreign Exchange Transactions
. Brazilian law imposes a Tax on Foreign Exchange Transactions (“IOF/Exchange Tax”) on the conversion of
reais
into foreign currency and on the conversion of foreign currency into
reais
. As of October 20, 2009, any inflow of funds related to investments carried out on the Brazilian financial and capital markets by 2,689 Holders is subject to the IOF/Exchange Tax at a rate of 2.0%. However, foreign exchange transactions related to outflows of funds in connection with investments carried out on the Brazilian financial and capital markets are subject to the IOF/Exchange Tax at a rate of zero percent, which also applies to payments of dividends and interest on shareholders’ equity to 2,689 Holders with respect to investments on the Brazilian financial and capital markets.
Nevertheless, the rate applicable to most foreign exchange transactions is 0.38%. In any case, the Brazilian government may increase the rate at any time by up to 25% on the foreign exchange transaction amount. However, any increase in rates will only apply to future transactions.
The purchase of ADSs by a Non-Resident Holder outside Brazil generally does not require the execution of a foreign exchange agreement with the Brazilian Central Bank. If this is the case, the IOF/Exchange Tax is not due.
Tax on Transactions Involving Bonds and Securities
. Brazilian law imposes a Tax on Transactions Involving Bonds and Securities (“IOF/Bonds Tax”) due on transactions involving bonds and securities, including those carried out on a Brazilian stock exchange. Although the rate of IOF/Bonds Tax applicable to transactions involving common shares is currently zero, the rate of the IOF/Bonds Tax applicable to the transfer of shares with the sole purpose of enabling the issuance of ADSs is currently 1.5%. This rate is applied on the product of (a) the number of shares which are transferred, multiplied by (b) the closing price for those shares on the date prior to the transfer or, if such closing price is not available on that date, the last available closing price for those shares, or, in case of a public offer, the price defined in the bookbuilding process. The person responsible for paying the IOF/Bonds Tax is (a) the financial institution that acts as custodian of the shares in Brazil, or (b) in case of public offers, the leading bookrunner. The Brazilian government may increase the rate of the IOF/Bonds Tax at any time by up to 1.5% per day of the transaction amount, but only in respect of future transactions.
Other Brazilian Taxes
There are no Brazilian inheritance, gift or succession taxes applicable to the ownership, transfer or disposition of common shares or ADSs, except for gift and inheritance taxes that may be imposed by some Brazilian states. There are no Brazilian stamp, issue, registration, or similar taxes or duties payable by holders of common shares or ADSs.
U.S. Federal Income Tax Considerations
The following are the material U.S. federal income tax consequences to U.S. Holders described herein of owning and disposing of common shares or ADSs, but it does not purport to be a comprehensive description of all of the tax considerations that may be relevant to a particular person’s decision to hold such securities. The discussion applies only if you hold common shares or ADSs as capital assets for U.S. federal tax purposes and it does not describe all of the tax consequences, including the potential application of the provisions of the Internal Revenue Code of 1986, as amended (the “Code”) known as the Medicare contribution tax, that may be relevant to holders subject to special rules, such as:
|
|
·
|
certain financial institutions;
|
|
|
·
|
dealers or traders in securities who use a mark-to-market method of tax accounting;
|
|
|
·
|
persons holding common shares or ADSs as part of a hedging transaction, straddle, wash sale, conversion transaction or integrated transaction or persons entering into a constructive sale with respect to the common shares or ADSs;
|
|
|
·
|
persons whose functional currency for U.S. federal income tax purposes is not the U.S. dollar;
|
|
|
·
|
entities classified as partnerships for U.S. federal income tax purposes;
|
|
|
·
|
persons liable for the alternative minimum tax;
|
|
|
·
|
tax-exempt entities, including “individual retirement accounts” or “Roth IRAs;”
|
|
|
·
|
persons that own or are deemed to own ten percent or more of our voting stock;
|
|
|
·
|
persons who acquired our ADSs or common shares pursuant to the exercise of any employee stock option or otherwise as compensation; or
|
|
|
·
|
persons holding shares in connection with a trade or business conducted outside of the United States.
|
If an entity that is classified as a partnership for U.S. federal income tax purposes holds common shares or ADSs, the U.S. federal income tax treatment of a partner will generally depend on the status of the partner and upon the activities of the partnership. Partnerships holding common shares or ADSs and partners in such partnerships should consult their tax advisers as to the particular U.S. federal income tax consequences of holding and disposing of common shares or ADSs.
This discussion is based on the Code, administrative pronouncements, judicial decisions and final, temporary and proposed Treasury regulations, all as of the date hereof, any of which is subject to change, possibly with retroactive effect. It is also based in part on representations by the Depositary and assumes that each obligation under the Deposit Agreement and any related agreement will be performed in accordance with its terms.
You are a “U.S. Holder” if you are a beneficial owner of our common shares or ADSs and if you are, for U.S. federal tax purposes:
|
|
·
|
a citizen or individual resident of the United States;
|
|
|
·
|
a corporation, or other entity taxable as a corporation, created or organized in or under the laws of the United States, any state thereof or the district of Columbia; or
|
|
|
·
|
an estate or trust the income of which is subject to U.S. federal income taxation regardless of its source.
|
The summary of U.S. federal income tax consequences set out below is intended for general informational purposes only. You should consult your advisers with respect to the particular tax consequences to you of owning or disposing of common shares or ADSs, including the applicability and effect of state, local, non-U.S. and other tax laws and the possibility of changes in tax laws.
In general, if you own ADSs, you will be treated as the owner of the underlying shares represented by those ADSs for U.S. federal income tax purposes. Accordingly, no gain or loss will be recognized if you exchange ADSs for the underlying shares represented by those ADSs.
The U.S. Treasury has expressed concerns that parties to whom American depositary shares are released before shares are delivered to the depositary (“pre-release”) or intermediaries in the chain of ownership between U.S. holders and the issuer of the security underlying the American depositary shares may be taking actions that are inconsistent with the claiming of foreign tax credits for U.S. holders of American depositary shares. Such actions would also be inconsistent with the claiming of the reduced rate of tax, described below, applicable to dividends received by certain non-corporate holders. Accordingly, the creditability of Brazilian taxes, and the availability of the reduced tax rate for dividends received by certain non-corporate holders, each described below, could be affected by actions taken by such parties or intermediaries.
Please consult your tax adviser concerning the U.S. federal, state, local and foreign tax consequences of purchasing, owning and disposing of common shares or ADSs in your particular circumstances.
This discussion assumes that the Company is not, and will not become, a passive foreign investment company, as described below.
Taxation of Distributions
Distributions paid on ADSs or common shares other than certain
pro rata
distributions of ordinary shares will generally be treated as dividends to the extent paid out of the Company’s current or accumulated earnings and profits as determined under U.S. federal income tax principles. Because the Company does not maintain calculations of its earnings and profits under U.S. federal income tax principles, it is expected that distributions will be reported to you as dividends.
Subject to applicable limitations, dividends paid by qualified foreign corporations to certain non-corporate U.S. Holders may be taxable at rates applicable to long-term capital gains. A foreign corporation is treated as a qualified foreign corporation with respect to dividends paid on stock that is readily tradable on a securities market in the United States, such as the NYSE where the ADSs are traded. You should consult your tax adviser to determine whether the favorable rate will apply to dividends you receive and whether you are subject to any special rules that limit your ability to be taxed at this favorable rate.
The amount of a dividend will include any amounts withheld by the Company in respect of Brazilian taxes on the distribution. The amount of the dividend will be treated as foreign-source dividend income to you and will not be eligible for the dividends-received deduction generally allowed to U.S. corporations under the Code. Dividends will be included in your income on the date of your, or in the case of ADSs, the Depositary’s, receipt of the dividend. The amount of any dividend income paid in
reais
will be the U.S. dollar amount calculated by reference to the
exchange rate in effect on the date of such receipt, regardless of whether the payment is in fact converted into U.S. dollars. If the dividend is converted into U.S. dollars on the date of receipt, you should not be required to recognize foreign currency gain or loss in respect of the dividend income. You may have foreign currency gain or loss if the amount of such dividend is converted into U.S. dollars after the date of such receipt. See “—Brazilian Tax Considerations—Tax on Foreign Exchange and Financial Transactions.”
Subject to applicable limitations that may vary depending upon your circumstances, Brazilian income taxes withheld from dividends on common shares or ADSs will be creditable against your U.S. federal income tax liability. The rules governing foreign tax credits are complex, and you should consult your tax adviser regarding the availability of foreign tax credits in your particular circumstances. Instead of claiming a credit, you may, at your election, deduct such Brazilian taxes in computing your taxable income, subject to generally applicable limitations under U.S. law. An election to deduct foreign taxes instead of claiming foreign tax credits must apply to all taxes paid or accrued in the taxable year to foreign countries and possessions of the United States.
Sale or Other Disposition of Common Shares or ADSs
For U.S. federal income tax purposes, gain or loss you realize on the sale or other disposition of common shares or ADSs will be capital gain or loss, and will be long-term capital gain or loss if you have held the common shares or ADSs for more than one year. The amount of your gain or loss will equal the difference between the amount realized on the disposition and your tax basis in the common shares or ADSs disposed of, in each case as determined in U.S. dollars. If a Brazilian tax is withheld on the sale or disposition of common shares or ADSs, your amount realized will include the gross amount of the proceeds of such sale or disposition before deduction of the Brazilian tax. See “—Brazilian Tax Considerations—Gains” for a description of when a disposition may be subject to taxation by Brazil. Such gain or loss will generally be U.S.-source gain or loss for foreign tax credit purposes. You should consult your tax adviser as to whether the Brazilian tax on gains would be creditable against your U.S. federal income tax on foreign-source income from other sources.
Passive Foreign Investment Company Rules
The Company believes that it was not a “passive foreign investment company” (“PFIC”) for U.S. federal income tax purposes for its 2012 taxable year. However, because PFIC status depends on the composition of a company’s income and assets and the market value of its assets from time to time, which may be determined in large part by reference to the market value of the Company’s stock, there can be no assurance that the Company will not be a PFIC for any taxable year. If the Company were a PFIC for any taxable year during which a U.S. Holder held common shares or ADSs, gain recognized by a U.S. Holder on a sale or other disposition (including certain pledges) of the common shares or ADSs would be allocated ratably over the U.S. Holder’s holding period for the common shares or ADSs. The amounts allocated to the taxable year of the sale or other disposition and to any year before the Company became a PFIC would be taxed as ordinary income. The amount allocated to each other taxable year would be subject to tax at the highest rate in effect for individuals or corporations, as appropriate, for that taxable year, and an interest charge would be imposed on the amount allocated to that taxable year. Further, to the extent that any distribution received by a U.S. Holder on its common shares or ADSs exceeds 125% of the average of the annual distributions on common shares or ADSs received during the preceding three years or the U.S. Holder’s holding period, whichever is shorter, that distribution would be subject to taxation in the same manner as gain, described immediately above. Certain elections may be available that would result in alternative treatments (such as a mark-to-market treatment) of the common shares or ADSs.
Information Reporting and Backup Withholding
Payments of dividends and sales proceeds that are made within the United States or through certain U.S.-related financial intermediaries generally are subject to information reporting and may be subject to backup withholding unless (1) you are an exempt recipient or (2) in the case of backup withholding, you provide a correct taxpayer identification number and certify that you are not subject to backup withholding.
The amount of any backup withholding from a payment to you will be allowed as a credit against your U.S. federal income tax liability and may entitle you to a refund, provided that the required information is timely furnished to the Internal Revenue Service.
Certain U.S. Holders who are individuals may be required to report information relating to their ownership of securities of a non-U.S. person, subject to certain exceptions including an exception for securities held in certain accounts maintained by U.S. financial institutions, such as our ADSs. You should consult your tax adviser regarding the effect, if any, of these rules on your ownership and disposition of common shares or ADSs.
U.S. HOLDERS OF OUR COMMON SHARES OR ADSs SHOULD CONSULT THEIR OWN TAX ADVISERS AS TO THE BRAZILIAN, U.S. FEDERAL, STATE, LOCAL AND OTHER TAX CONSEQUENCES OF THE OWNERSHIP AND DISPOSITION OF OUR COMMON SHARES OR ADSs BASED UPON THEIR PARTICULAR CIRCUMSTANCES.
F. Dividends and Paying Agents
Not applicable.
G. Statement by Experts
Not applicable.
H. Documents on Display
Statements contained in this annual report as to the contents of any contract or other document referred to are not necessarily complete, and each of these statements is qualified in all respects by reference to the full text of such contract or other document filed as an exhibit hereto. A copy of the complete annual report including the exhibits and schedules filed herewith may be inspected without charge at the public reference facilities maintained by the SEC at Room 1024, 100 F Street, N.E., Washington, D.C. 20549. Copies of such materials may be obtained by mail from the Public Reference Section of the SEC, 100 F Street, N.E., Washington, D.C. 20549, at prescribed rates. Such reports and other information may also be inspected at the offices of the NYSE, 11 Wall Street, New York, New York 10005, on which our ADSs are listed. In addition the SEC maintains a website that contains information filed electronically with the SEC, which can be accessed over the Internet at http://www.sec.gov.
We are subject to the information and periodic reporting requirements of the Securities Exchange Act and, in accordance therewith, file periodic reports and other information with the SEC. However, as a foreign private issuer, we are exempt from the rules under the Securities Exchange Act relating to the furnishing and content of proxy statements and relating to short-swing profits reporting and liability.
We furnish to Citibank, N.A., as depositary, copies of all reports we are required to file with the SEC under the Securities Exchange Act, including our annual reports in English, containing a brief description of our operations and our audited annual consolidated financial statements which are prepared in accordance with Brazilian GAAP and include a reconciliation to US GAAP. In addition, we are required under the deposit agreement to furnish the depositary with copies of English translations to the extent required under the rules of the SEC of all notices of meetings of shareholders and other reports and communications that are generally made available to shareholders. Under certain circumstances, the depositary will arrange for the mailing, at our expense, of these notices, other reports and communications to all ADS holders.
We also file financial statements and other periodic reports with the CVM, which are available to the public from CVM’s website at http://www.cvm.gov.br.
I. Subsidiary Information
Not applicable.
We are exposed to market risks arising from the normal course of our business. These market risks mainly involve the possibility that changes in interest rates may impact the value of our financial liabilities. See “Item 3. Key Information—D. Risk Factors—Risks Relating to Brazil.”
Interest rates
Our results of operations and profitability are affected by changes in interest rates due to the impact that these changes have on our interest expenses relating to our variable interest rate debt instruments and on our purchase and sale contracts and on our interest income generated from our financial investments.
The table below provides information about our significant interest rate-sensitive instruments (fixed and variable) as of December 31, 2012.
|
As of December 31, 2012
|
||||||||||||||||||||||||||||
|
Expected Maturity Date
|
||||||||||||||||||||||||||||
|
Total
|
2013
|
2014
|
2015
|
2016 and later
|
Principal Index(1)
|
Fair Value
|
||||||||||||||||||||||
|
(In accordance with Brazilian GAAP) (in millions of R$)
|
||||||||||||||||||||||||||||
|
Liabilities:
|
||||||||||||||||||||||||||||
|
Loans, financing and debentures:
|
||||||||||||||||||||||||||||
|
Debentures
|
1,736.0 | 346.4 | 529.3 | 500.0 | 360.3 |
CDI/TR
|
1,799.1 | |||||||||||||||||||||
|
Average interest rate
|
9.51 | % | 9.66 | % | 9.91 | % | 10.55 | % | 10.96 | % | — | — | ||||||||||||||||
|
Loans and financing (working capital)
|
1,199.8 | 314.3 | 429.2 | 271.2 | 185.1 |
CDI
|
1,275.0 | |||||||||||||||||||||
|
Average interest rate
|
8.76 | % | 8.91 | % | 9.15 | % | 9.79 | % | 10.20 | % | — | — | ||||||||||||||||
|
Loans and financing — SFH
|
980.6 | 498.2 | 341.0 | 134.9 | 6.5 |
TR
|
997.8 | |||||||||||||||||||||
|
Average interest rate
|
9.84 | % | 9.99 | % | 10.23 | % | 10.88 | % | 11.29 | % | — | — | ||||||||||||||||
|
Total loans, financing and debentures
|
3,916.4 | 1,158.9 | 1,299.5 | 906.1 | 551.9 | — | 4,071.9 | |||||||||||||||||||||
|
Obligation to venture partner
|
323.7 | 161.4 | 142.7 | 11.2 | 8.4 |
IGP-M/CDI
|
354.0 | |||||||||||||||||||||
|
Real estate development obligations(2)
|
4,693.1 | 2,843.3 | 1,478.7 | 371.1 | — | — | 4,693.1 | |||||||||||||||||||||
|
Obligations for purchase of land
|
480.1 | 388.3 | 83.3 | 4.5 | 4.0 | — | 480.1 | |||||||||||||||||||||
|
Total
|
9,413.3 | 4,551.9 | 3,004.2 | 1,292.9 | 564.3 | — | 9,599.1 | |||||||||||||||||||||
|
Assets:
|
||||||||||||||||||||||||||||
|
Cash and cash equivalent
|
627.1 | 627.1 | — | — | — | — | 627.1 | |||||||||||||||||||||
|
Marketable securities (current and non-current)
|
1,054.2 | 1,054.2 | — | — | — | — | 1,054.2 | |||||||||||||||||||||
|
Receivables from clients
|
3,891.6 | 2,915.3 | 466.6 | 290.7 | 219.0 | — | 3,891.6 | |||||||||||||||||||||
|
Receivables from clients (2)
|
4,039.0 | 1,786.5 | 951.2 | 508.8 | 792.5 | — | 4,039.0 | |||||||||||||||||||||
|
Total client receivables
|
7,930.6 | 4,701.8 | 1,417.8 | 799.5 | 1,011.5 | — | 7,930.6 | |||||||||||||||||||||
|
Total
|
9,611.9 | 6,383.1 | 1,417.8 | 799.5 | 1,011.5 | — | 9,611.9 | |||||||||||||||||||||
|
(1)
|
See notes 10 and 11 to our consolidated financial statements for information about the interest rates on our loans, financing and debentures. As of December 31, 2012, the annualized index was 6.94% for CDI, 0.00% for TR, 7.12% for INCC and 7.81% for IGPM.
|
|
(2)
|
Includes commitments and receivables arising from units sold after January 1, 2004 for which balances have not been recorded in our balance sheet—CFC Resolution No. 963.
|
We borrow funds at different rates and linked to different indices in order to try to match the financing that we provide to some of our clients. The mismatch between rates and terms on our funds borrowed and the financing we provide may adversely affect our cash flow. We constantly monitor and evaluate the impact of indexation on our assets and liabilities. If we anticipate the possibility of an interest rate mismatch between our assets and obligations, we may use derivative financial instruments in order to hedge against the risk that arises from interest rate variations.
Foreign Exchange Rate
During 2012, we had no derivative financial instruments with the objective of hedging against fluctuations in foreign exchange rates. As of December 31, 2012, we had no debt in foreign currency.
D. American Depositary Shares
Depositary Fees
We and the holders and beneficial owners of our ADSs and the person depositing our common shares or surrendering ADSs for cancellation are responsible for the following fees of the depositary:
|
Service
|
Rate
|
Paid By
|
||
|
Issuance of ADSs upon deposit of Shares (excluding issuances as a result of distributions described in paragraph (4) below).
|
Up to US$5.00 per 100 ADSs (or fraction thereof) issued.
|
Person depositing our common shares or person receiving ADSs.
|
||
|
Delivery of common shares deposited under our deposit agreement against surrender of ADSs.
|
Up to US$5.00 per 100 ADSs (or fraction thereof) issued.
|
Person surrendering ADSs for purpose of withdrawal of common shares deposited under our deposit agreement or person to whom common shares deposited under our deposit agreement are delivered.
|
||
|
Distribution of cash dividends or other cash distributions (i.e., sale of rights and other entitlements).
|
Up to US$2.00 per 100 ADSs (or fraction thereof) held.
|
Person to whom distribution is made.
|
||
|
Distribution of ADSs pursuant to (i) stock dividends or other free stock distributions, or (ii) exercise of rights to purchase additional ADSs.
|
Up to US$2.00 per 100 ADSs (or fraction thereof) held.
|
Person to whom distribution is made.
|
||
|
Distribution of securities other than ADSs or rights to purchase additional ADSs (i.e., spin-off shares).
|
Up to US$2.00 per 100 ADSs (or fraction thereof) held.
|
Person to whom distribution is made.
|
||
|
Depositary services
|
Up to US$4.00 per 100 ADSs (or fraction thereof) held.
|
Person holding ADSs on applicable record date(s) established by the depositary.
|
||
|
Transfer of ADRs
|
US$1.50 per certificate presented for transfer.
|
Person presenting certificate for transfer.
|
The depositary may deduct applicable depositary fees from the funds being distributed in the case of cash distributions. For distributions other than cash, the depositary will invoice the amount of the applicable depositary fees to the applicable holders.
Additional Charges
Holders and beneficial owners of our ADSs and person depositing our common shares for deposit and person surrendering ADSs for cancellation and withdrawal of our common shares will be required to pay the following charges:
|
|
·
|
taxes (including applicable interest and penalties) and other governmental charges;
|
|
|
·
|
such registration fees as may from time to time be in effect for the registration of our common shares or other common shares deposited under our deposit agreement on the share register and applicable to transfers of our common shares or other common shares deposited under our deposit agreement to or from the name of the custodian, the depositary or any nominees upon the making of deposits and withdrawals, respectively;
|
|
|
·
|
such cable, telex and facsimile transmission and delivery expenses as are expressly provided in the deposit agreement to be at the expense of the person depositing or withdrawing our common shares or holders and beneficial owners of ADSs;
|
|
|
·
|
the expenses and charges incurred by the depositary in the conversion of foreign currency;
|
|
|
·
|
such fees and expenses as are incurred by the depositary in connection with compliance with exchange control regulations and other regulatory requirements applicable to our common shares, common shares deposited under our deposit agreement, ADSs and ADRs; and
|
|
|
·
|
the fees and expenses incurred by the depositary, the custodian or any nominee in connection with the servicing or delivery of common shares deposited under our deposit agreement.
|
Direct and Indirect Payments
Citibank N.A., located at 388 Greenwich Ave.- New York - NY 10013, as depositary, has agreed to reimburse certain of our reasonable expenses related to our ADR program and incurred by us in connection with the program. As of December 31, 2012, we received from the depositary of our ADSs US$2.5 million, which was used for general corporate purposes such as the payment of costs and expenses associated with (1) the preparation and distribution of proxy materials, (2) the preparation and distribution of marketing materials and (3) consulting and other services related to investor relations.
None.
None.
(a) Evaluation of Disclosure Controls and Procedures
Under the supervision and with the participation of the Company’s Chief Executive Officer and Chief Financial Officer, management conducted an evaluation of the effectiveness of the design and operation of the Company’s disclosure controls and procedures, as defined in Rules 13a-15(e) and 15d-15(e) under the Securities Exchange Act of 1934, as amended, as of December 31, 2012, the end of the period covered by this report. As a result of the material weakness identified below under item (b) Management’s Annual Report on Internal Control over Financial Reporting, the Company has concluded that its disclosure controls and procedures as of December 31, 2012 were ineffective. However, to address the material weakness in internal control over financial reporting, management performed additional substantive analysis and post-closing procedures in an effort to reasonably assure that the consolidated financial statements included in this Form 20-F for the fiscal year ended December 31, 2012 have been prepared in accordance with Brazilian GAAP, along with a reconciliation of net income (loss) and equity from Brazilian GAAP to US GAAP, in accordance with Item 18 of Form 20-F.
(b) Management’s Annual Report on Internal Control over Financial Reporting
The management of the Company is responsible for establishing and maintaining adequate internal control over financial reporting, as defined in Rule 13a-15(f) and 15d-15(f) promulgated under the Securities Exchange Act of 1934, as a process designed by, or under the supervision of, the Company’s Chief Executive Officer and Chief Financial Officer and effected by the Company’s Board of Directors, management and other personnel, to provide reasonable assurance regarding the reliability of financial reporting, and the preparation of financial statements for external purposes in conformity with Brazilian GAAP, including the reconciliation to US GAAP in accordance with Item 18 of Form 20-F .
Because of its inherent limitations, internal control over financial reporting may not prevent or detect misstatements. Also, projections of any evaluations of effectiveness to future periods are subject to the risk that the controls may become inadequate because of changes in conditions, or that the degree of compliance with the policies or procedures may deteriorate.
The Company’s management assessed the effectiveness of the internal control over financial reporting as of December 31, 2012. This assessment identified a “material weakness” (as defined in Rule 12b-2 under The Exchange Act and Rule 1-02 of Regulation S-X) in internal control over financial reporting as of December 31, 2012, which is discussed in the following paragraph.
A material weakness is a control deficiency, or combination of deficiencies, in internal control over financial reporting, such that there is a reasonable possibility that a material misstatement of the annual financial statements will not be prevented or detected on a timely basis. The following material weakness has been identified and included in management’s assessment of the effectiveness of internal control over financial reporting:
A material weakness is reported due to the lack of effective preparation, review and monitoring controls to ensure that proper accounting treatment was adopted in an accurate and timely manner during the financial statement closing process related to the preparation of the reconciliation of net income (loss) and equity from Brazilian GAAP to US GAAP and required disclosures.
In making this assessment, the Company’s management used the criteria set forth by the Internal Control-Integrated Framework issued by the Committee of Sponsoring Organizations of the Treadway Commission (“COSO”). Based on this assessment, the Company’s management concluded that, as of December 31, 2012, the Company has not maintained effective internal control over financial reporting, based on the COSO criteria.
Our management’s annual report on internal control over financial reporting is included in this annual report on page F-2.
In order to remediate the identified material weakness over the US GAAP conversion process, the Company is evaluating all aspects of preparing the US GAAP disclosures, including but not limited to the following:
|
|
·
|
Increase the use of accounting software with built in controls for the more complex conversion areas;
|
|
|
·
|
Improve the timely capture of changes in the business that could reasonably bear on accounting considerations;
|
|
|
·
|
Improve the US GAAP training of personnel preparing this information; and,
|
|
|
·
|
Ensure the supervisory function is adequate and allows sufficient time to review and address critical issues in order to further strengthen the financial statement closing process.
|
(c) Attestation Report of Independent Registered Public Accounting Firm
The effectiveness of internal control over financial reporting as of December 31, 2012 has been audited by Ernst & Young Terco Auditores Independentes S.S., an independent registered public accounting firm, as stated in its report which is included under Item 18 in this annual report on Form 20-F on page F-5.
(d) Changes in Internal Control over Financial Reporting
There was no change in our internal control over financial reporting that occurred during the period covered by this annual report that has materially affected, or is reasonably likely to materially affect, our internal control over reporting.
For the purposes of the Sarbanes-Oxley Act of 2002, our directors established an Audit Committee that convenes as often as it determines is appropriate to carry out its responsibilities, but at least quarterly. This committee has responsibility for planning and reviewing our annual and quarterly reports and accounts with the involvement of our auditors in that process, focusing particularly on compliance with legal requirements and accounting standards, and ensuring that an effective system of internal financial controls is maintained. The ultimate responsibility for reviewing and approving our annual and quarterly reports and accounts remains with our directors.
The Audit Committee convened 12 times in 2012. The Audit Committee currently comprises Jose Ecio Pereira da Costa Junior, Nelson Machado and Maurício Marcellini Pereira, each of whom is a director of our company. Our board of directors has determined that Jose Ecio Pereira da Costa Junior, Nelson Machado and Maurício Marcellini Pereira, are each independent as set forth in the NYSE Listed Companies Manual as well as being independent for the purpose of Rule 10A-3 of the Securities Exchange Act. Our board of directors has determined that Jose Ecio Pereira da Costa Junior is an audit committee financial expert within the meaning of the regulations promulgated by the Securities and Exchange Commission.
On July 10, 2007, we adopted a Code of Business Conduct and Ethics that applies to our chief executive officer, chief financial officer, principal accounting officer and persons performing similar functions, as well as to our directors, other officers and employees. The objective of this code is (1) to reduce the subjectivity of personal interpretations of ethical principles; (2) to be a formal and institutional benchmark for the professional conduct of the employees, including the ethical handling of actual or apparent conflicts of interests, becoming a standard for the internal and external relationship of the Company with its shareholders, clients, employees, partners, suppliers, service providers, labor unions, competitors, society, government and the communities in which we operate; and (3) to ensure that the daily concerns with efficiency, competitiveness and profitability do not override ethical behavior. Our Code of Business Conduct and Ethics is filed as an exhibit to this annual report and is available, free of charge by requesting a copy from our Investor Relations Department at the following address: Av. Nações Unidas No. 8,501, 19th floor, 05425-070 – São Paulo, SP – Brazil, telephone 55-11-3025-9242, fax 55-11-3025-9348 and e-mail ri@gafisa.com.br.
We have also established a “whistleblower channel” in order to receive “complaints,” by any person (provided such complaint is first reported to the Ethics Committee or Audit Committee), regarding any “dishonest or unethical conduct” and “accounting, internal accounting controls, or auditing matters” and equally confidential and anonymous submissions of “concerns” of the same type by our employees and affiliates. The “whistleblower channel” can be accessed through our intranet or website or a letter may be forwarded to our headquarters under the attention of our Ethics Committee and/or Audit Committee. Since its establishment, 517 issues were reported to our “whistleblower channel,” all of them related to personal conduct and, therefore, without any financial impact on our results of operations.
The relationship with our independent auditors in respect to the contracting of services unrelated to the external audit is based on principles that preserve the independence of the auditor. Our board of directors approves our financial statements, the performance by our auditors of audit and permissible non-audit services, and associated fees, supported by our Audit Committee.
The following table describes the total amount billed to us by and Ernst & Young Terco Auditores Independentes S.S. (“EYT”) for services performed in 2012 and 2011 and the remuneration for these services in each period, respectively.
|
2012
|
2011
|
|||||||
|
(in thousands of
reais
)
|
||||||||
|
Audit fees (1)
|
13,850 | 4,295 | ||||||
|
Audit related fees (2)
|
— | — | ||||||
|
Tax fees (3)
|
— | — | ||||||
|
Total
|
13,850 | 4,295 | ||||||
|
(1)
|
“Audit fees” are the aggregate fees billed by EYT for the audit of our consolidated and annual financial statements including audit of internal control over financial reporting, reviews of interim financial statements and attestation services that are provided in connection with statutory and regulatory filings or engagements.
|
|
(2)
|
“Audit-related fees” are fees billed by EYT for assurance and related services that are reasonably related to the performance of the audit.
|
|
(3)
|
There were no “Tax fees” billed by EYT during either of 2012 or 2011.
|
Audit Committee Pre-Approval Policies and Procedures
Our board of directors has established pre-approval policies and procedures for the engagement of registered public accounting firm for audit and non-audit services. Under such pre-approval policies and procedures, our board of directors reviews the scope of the services to be provided by each registered public accounting firm to be engaged in order to ensure that there are no independence issues and the services are not prohibited services as defined by Sarbanes-Oxley Act of 2002.
None.
None.
None.
See “Item 6. Directors, Senior Management and Employees—C. Board Practices.”
Not applicable.
We have responded to Item 18, in lieu of reporting to this Item.
See our audited consolidated financial statements beginning on page F-1.
We are filing the following documents as part of this Annual Report Form 20-F:
1.1. Bylaws of Gafisa S.A., as amended (English), which is incorporated by reference to our annual report on Form 20-F for the year ended December 31, 2010, filed with the Securities and Exchange Commission on July 5, 2012.
2.1. Deposit Agreement, date March 21, 2007, among Gafisa S.A., Citibank, N.A., as depositary, and the Holders and Beneficial Owners from time to time of American Depositary Shares issued thereunder, which is incorporated by reference to our registration statement on Form F-6 filed with the Securities and Exchange Commission on February 22, 2007.
4.1. Merger of shares agreement dated November 6, 2009 between Gafisa S.A. and Construtora Tenda S.A., which is incorporated by reference to our registration statement on Form F-4 filed with the Securities and Exchange Commission on November 13, 2009.
8.1. List of Subsidiaries*
11.1. Code of Business Conduct and Ethics (English), which is incorporated by reference to our annual report on Form 20-F filed with the Securities and Exchange Commission on June 18, 2008.
12.1. Certification pursuant to section 302 of the Sarbanes-Oxley Act of 2002 of the Chief Executive Officer*
12.2. Certification pursuant to section 302 of the Sarbanes-Oxley Act of 2002 of the Chief Financial Officer*
13.1. Certification pursuant to 18 U.S.C. section 1350, as adopted pursuant to section 906 of the Sarbanes-Oxley Act of 2002, of the Chief Executive Officer*
13.2. Certification pursuant to 18 U.S.C. section 1350, as adopted pursuant to section 906 of the Sarbanes-Oxley Act of 2002, of the Chief Financial Officer*
* Filed herewith.
SIGNATURES
Pursuant to the requirements of Section 12 of the Securities Exchange Act of 1934, the registrant certifies that it meets all requirements for filing on Form 20-F and has duly caused this annual report to be signed on its behalf by the undersigned, thereunto duly authorized.
|
GAFISA S.A.
|
||
|
By:
|
/s/ Alceu Duilio Calciolari
|
|
|
Name:
|
Alceu Duilio Calciolari
|
|
|
Title:
|
Chief Executive Officer
|
|
|
By:
|
/s/ Andre Bergstein
|
|
|
Name:
|
Andre Bergstein
|
|
|
Title:
|
Chief Financial Officer
|
|
Date: April 12, 2013
TABLE OF CONTENTS
Page
Audited Consolidated Financial Statements:
Our management is responsible for establishing and maintaining adequate internal controls over financial reporting as defined in Rules 13a – 15(f) and 15d – 15(f) under the Securities and Exchange Act of 1934. Our internal control over financial reporting is a process designed to provide reasonable assurance regarding the reliability of financial reporting and the preparation of financial statements for external purposes in accordance with accounting principles adopted in Brazil (“Brazilian GAAP”), along with a reconciliation of net income (loss) and equity from Brazilian GAAP to accounting principles generally accepted in the United States of America (“US GAAP”). Our internal control over financial reporting includes those policies and procedures that (i) pertain to the maintenance of records that, in reasonable detail, accurately and fairly reflect the transactions and dispositions of our assets; (ii) provide reasonable assurance that transactions are recorded as necessary to permit preparation of financial statements in accordance with Brazilian GAAP, along with a reconciliation of net income (loss) and equity from Brazilian GAAP to US GAAP, and that our receipts and expenditures are being made only in accordance with authorizations of our management and directors; and (iii) provide reasonable assurance regarding prevention or timely detection of unauthorized acquisition, use or disposition of the our assets that could have a material effect on the financial statements.
Because of its inherent limitations, internal control over financial reporting may not prevent or detect misstatements. Also, projections of any evaluation of effectiveness of internal control to future periods are subject to the risk that controls may become inadequate because of changes in conditions, and that the degree of compliance with the policies or procedures may deteriorate.
Our management has assessed the effectiveness of our internal control over financial reporting as of December 31, 2012. In making this assessment, our management used the criteria set forth by the Committee of Sponsoring Organizations of the Treadway Commission (“COSO”) in “Internal Control – Integrated Framework”. Based on this assessment, our management concluded that, as of December 31, 2012, our internal control over financial reporting was not effective because there was a material weakness in our internal controls.
A material weakness is a control deficiency, or a combination of deficiencies, in internal control over financial reporting, such that there is a reasonable possibility that a material misstatement of the annual financial statements will not be prevented or detected on a timely basis. Based on the evaluation described above, our management has identified the following material weakness in our internal control over financial reporting as of December 31, 2012:
Financial statement closing process
We did not maintain effective preparation, review and monitoring controls to ensure that proper accounting treatment was adopted in an accurate and timely manner during the financial statement closing process related to the preparation of the reconciliation of net income (loss) and equity from Brazilian GAAP to US GAAP and required disclosures.
The aforementioned material weakness is largely attributable to controls that are not designed in sufficient detail and not operated to accomplish their objectives.
This material weakness could result in a material misstatement to our financial statements that would not be prevented or detected.
Notwithstanding management’s assessment that our disclosure controls and procedures were not effective and that there was the material weakness as identified above, we believe that our financial statements contained in this annual report fairly present our financial position, results of operations and cash flows for the year covered thereby in all material respects.
F-2
As of the date of the filling of this report, our management, including our CEO and CFO and the Audit Committee, are evaluating an action plan to address the material weakness in our internal control over financial reporting.
São Paulo, Brazil
April 12, 2013
|
By:
|
/s/ Alceu Duilio Calciolari
|
|
|
Name:
|
Alceu Duilio Calciolari
|
|
|
Title:
|
Chief Executive Officer
|
|
|
By:
|
/s/ Andre Bergstein
|
|
|
Name:
|
Andre Bergstein
|
|
|
Title:
|
Chief Financial Officer
|
|
The Board of Directors and Shareholders of Gafisa S.A.
We have audited the accompanying consolidated balance sheets of Gafisa S.A. as of December 31, 2012 and 2011, and the related consolidated statements of operations, comprehensive income (loss), changes in equity, cash flows and value added for each of the three years in the period ended December 31, 2012. These consolidated financial statements are the responsibility of the Company's management. Our responsibility is to express an opinion on these financial statements based on our audits.
We conducted our audits in accordance with the standards of the Public Company Accounting Oversight Board (United States). Those standards require that we plan and perform the audit to obtain reasonable assurance about whether the financial statements are free of material misstatement. An audit includes examining, on a test basis, evidence supporting the amounts and disclosures in the financial statements. An audit also includes assessing the accounting principles used and significant estimates made by management, as well as evaluating the overall financial statement presentation. We believe that our audits provide a reasonable basis for our opinion.
In our opinion, the consolidated financial statements referred to above present fairly, in all material respects, the consolidated financial position of Gafisa S.A. at December 31, 2012 and 2011 and the consolidated results of its operations, its cash flows and its value added for each of the three years in the period ended December 31, 2012, in conformity with accounting practices adopted in Brazil which differ in certain respects from accounting principles generally accepted in the United States of America (see Note 32 to the consolidated financial statements).
We also have audited, in accordance with the standards of the Public Company Accounting Oversight Board (United States), Gafisa S.A.'s internal control over financial reporting as of December 31, 2012, based on criteria established in Internal Control-Integrated Framework issued by the Committee of Sponsoring Organizations of the Treadway Commission and our report dated April 12, 2013, expressed an opinion that Gafisa S.A. did not maintain effective internal control over financial reporting.
São Paulo, Brazil
April 12, 2013
/s/ ERNST & YOUNG TERCO
ERNST & YOUNG TERCO
Auditores Independentes S.S.
CRC- 2SP015199/O-6
|
/s/ Daniel G. Maranhão Jr.
|
/s/ Marcos Alexandre S. Pupo
|
|
Daniel G. Maranhão Jr.
|
Marcos Alexandre S. Pupo
|
|
Accountant CRC1SP215856/O-5
|
Accountant CRC1SP221749/O-0
|
Report of Independent Registered Public Accounting Firm on Internal Control over Financial Reporting
The Board of Directors and Shareholders of Gafisa S.A.
We have audited Gafisa S.A.’s internal control over financial reporting as of December 31, 2012, based on criteria established in Internal Control - Integrated Framework issued by the Committee of Sponsoring Organizations of the Treadway Commission (the COSO criteria). Gafisa S.A.’s management is responsible for maintaining effective internal control over financial reporting, and for its assessment of the effectiveness of internal control over financial reporting included in the accompanying Management’s Report on Internal Control over Financial Reporting. Our responsibility is to express an opinion on the Company’s internal control over financial reporting based on our audit.
We conducted our audit in accordance with the standards of the Public Company Accounting Oversight Board (United States). Those standards require that we plan and perform the audit to obtain reasonable assurance about whether effective internal control over financial reporting was maintained in all material respects. Our audit included obtaining an understanding of internal control over financial reporting, assessing the risk that a material weakness exists, testing and evaluating the design and operating effectiveness of internal control based on the assessed risk, and performing such other procedures as we considered necessary in the circumstances. We believe that our audit provides a reasonable basis for our opinion.
A company’s internal control over financial reporting is a process designed to provide reasonable assurance regarding the reliability of financial reporting and the preparation of financial statements for external purposes in accordance with accounting practices adopted in Brazil (Brazilian GAAP), including the reconciliation to U.S. generally accepted accounting principles (U.S. GAAP). A company’s internal control over financial reporting includes those policies and procedures that (1) pertain to the maintenance of records that, in reasonable detail, accurately and fairly reflect the transactions and dispositions of the assets of the company; (2) provide reasonable assurance that transactions are recorded as necessary to permit preparation of financial statements in accordance with Brazilian GAAP, including the reconciliation to U.S. GAAP in accordance with Item 18 of Form 20F, and that receipts and expenditures of the Company are being made only in accordance with authorizations of management and directors of the Company; and (3) provide reasonable assurance regarding prevention or timely detection of unauthorized acquisition, use, or disposition of the Company’s assets that could have a material effect on the financial statements.
Because of its inherent limitations, internal control over financial reporting may not prevent or detect misstatements. Also, projections of any evaluation of effectiveness to future periods are subject to the risk that controls may become inadequate because of changes in conditions, or that the degree of compliance with the policies or procedures may deteriorate.
F-5
A material weakness is a deficiency, or combination of deficiencies, in internal control over financial reporting, such that there is a reasonable possibility that a material misstatement of the company’s annual or interim financial statements will not be prevented or detected on a timely basis. Management has identified and included in its management assessment a material weakness in controls related to the Company’s financial statement closing process related to the preparation of the required US GAAP reconciliation and disclosures.
We also have audited, in accordance with the standards of the Public Company Accounting Oversight Board (United States), the consolidated balance sheets of Gafisa S.A. as of December 31, 2012 and 2011, and the related consolidated statements of operations, comprehensive income (loss), changes in equity, cash flows and value added for each of the three years in the period ended December 31, 2012. This material weakness was considered in determining the nature, timing, and extent of audit tests applied in our audit of the 2012 consolidated financial statements, and this report does not affect our report dated April 12, 2013, which expressed an unqualified opinion on those consolidated financial statements.
In our opinion, because of the effect of the material weakness described above on the achievement of the objectives of the control criteria, Gafisa S.A. has not maintained effective internal control over financial reporting as of December 31, 2012, based on the COSO criteria.
São Paulo, Brazil
April 12, 2013
/s/ ERNST & YOUNG TERCO
ERNST & YOUNG TERCO
Auditores Independentes S.S.
CRC- 2SP015199/O-6
|
/s/ Daniel G. Maranhão Jr.
|
/s/ Marcos Alexandre S. Pupo
|
|
Daniel G. Maranhão Jr.
|
Marcos Alexandre S. Pupo
|
|
Accountant CRC1SP215856/O-5
|
Accountant CRC1SP221749/O-0
|
Gafisa S.A.
December 31, 2012 and 2011
(In thousands of Brazilian Reais)
|
Notes
|
2012
|
2011
|
||||||||||
|
Assets
|
||||||||||||
|
Current assets
|
||||||||||||
|
Cash and cash equivalents
|
4.1 | 627,137 | 137,598 | |||||||||
|
Short-term investments
|
4.2 | 1,054,151 | 846,062 | |||||||||
|
Trade accounts receivable, net
|
5 | 2,915,253 | 3,962,574 | |||||||||
|
Properties for sale
|
6 | 2,130,195 | 2,049,084 | |||||||||
|
Receivables from related parties
|
21.1 | 188,817 | 84,207 | |||||||||
|
Land available for sale
|
8 | 173,931 | 93,188 | |||||||||
|
Derivative financial instruments
|
20.i.b
|
9,224 | 7,735 | |||||||||
|
Prepaid expenses
|
- | 63,694 | 73,532 | |||||||||
|
Other
|
7 | 56,288 | 60,378 | |||||||||
|
Total current assets
|
7,218,690 | 7,314,358 | ||||||||||
|
Non-current assets
|
||||||||||||
|
Trade accounts receivable, net
|
5 | 976,253 | 863,874 | |||||||||
|
Properties for sale
|
6 | 330,488 | 798,206 | |||||||||
|
Derivative financial instruments
|
20.i.b
|
10,443 | - | |||||||||
|
Receivables from related parties
|
21.1 | 76,002 | 104,059 | |||||||||
|
Other
|
7 | 182,185 | 143,850 | |||||||||
| 1,575,371 | 1,909,989 | |||||||||||
|
Property and equipment
|
9 | 46,846 | 52,793 | |||||||||
|
Intangible assets
|
10 | 230,087 | 229,484 | |||||||||
| 276,933 | 282,277 | |||||||||||
|
Total non-current assets
|
1,852,304 | 2,192,266 | ||||||||||
|
Total assets
|
9,070,994 | 9,506,624 | ||||||||||
|
Notes
|
2012
|
2011
|
|||||||||
|
Liabilities
|
|||||||||||
|
Current liabilities
|
|||||||||||
|
Loans and financing
|
11 | 812,483 | 843,283 | ||||||||
|
Loans and financing – reclassified as current due to default in 2011
|
11 | - | 292,260 | ||||||||
|
Debentures
|
12 | 346,360 | 303,239 | ||||||||
|
Debentures – reclassified as current due to default in 2011
|
12 | - | 1,595,961 | ||||||||
|
Payables for purchase of properties and advances from customers
|
17 | 527,111 | 610,555 | ||||||||
|
Payables for goods and service suppliers
|
20 (i). | d | 167,008 | 135,720 | |||||||
|
Income tax and social contribution payable
|
- | 18,320 | 13,739 | ||||||||
|
Other tax payable
|
- | 240,840 | 236,839 | ||||||||
|
Salaries, payroll charges and profit sharing
|
- | 105,372 | 75,002 | ||||||||
|
Declared dividends
|
18.2 | 13,389 | 11,774 | ||||||||
|
Provision for legal claims
|
16 | 58,570 | 34,875 | ||||||||
|
Obligations assumed on the assignment of receivables
|
13 | 175,874 | 70,745 | ||||||||
|
Payables to venture partners
|
14 | 161,373 | 219,796 | ||||||||
|
Payables to related parties
|
21.1 | 75,562 | 97,937 | ||||||||
|
Other
|
15 | 177,328 | 274,214 | ||||||||
|
Total current liabilities
|
2,879,590 | 4,815,939 | |||||||||
|
Non-current liabilities
|
|||||||||||
|
Loans and financing
|
11 | 1,367,960 | 721,067 | ||||||||
|
Debentures
|
12 | 1,389,543 | - | ||||||||
|
Payables for purchase of properties and advances from customers
|
17 | 91,706 | 177,135 | ||||||||
|
Deferred income tax and social contribution
|
19 (ii
|
) | 81,477 | 83,002 | |||||||
|
Provision for legal claims
|
16 | 149,790 | 134,914 | ||||||||
|
Obligations assumed on the assignment of receivables
|
13 | 160,906 | 431,226 | ||||||||
|
Payables to venture partners
|
14 | 162,333 | 253,390 | ||||||||
|
Other
|
15 | 95,322 | 142,857 | ||||||||
|
Total non-current liabilities
|
3,499,037 | 1,943,591 | |||||||||
|
Equity
|
|||||||||||
|
Capital
|
18.1 | 2,735,794 | 2,734,157 | ||||||||
|
Treasury shares
|
18.1 | (1,731 | ) | (1,731 | ) | ||||||
|
Capital reserves and options granted
|
- | 36,964 | 18,066 | ||||||||
|
Accumulated losses
|
- | (226,523 | ) | (102,019 | ) | ||||||
| 2,544,504 | 2,648,473 | ||||||||||
|
Non-controlling interest
|
147,863 | 98,621 | |||||||||
|
Total equity
|
2,692,367 | 2,747,094 | |||||||||
|
Total liabilities and equity
|
9,070,994 | 9,506,624 | |||||||||
See accompanying notes to the consolidated financial statements.
Gafisa S.A.
Years ended December 31, 2012, 2011 and 2010
(In thousands of Brazilian Reais, except if stated otherwise)
|
Notes
|
2012
|
2011
|
2010
|
||||||||||||
|
Net operating revenue
|
22 | 3,953,282 | 2,940,506 | 3,403,050 | |||||||||||
|
Operating costs
|
|||||||||||||||
|
Real estate development and sales of properties
|
23 | (2,941,025 | ) | (2,678,338 | ) | (2,460,918 | ) | ||||||||
|
Gross profit
|
1,012,257 | 262,168 | 942,132 | ||||||||||||
|
Operating income (expenses)
|
|||||||||||||||
|
Selling expenses
|
23 | (308,333 | ) | (393,181 | ) | (266,660 | ) | ||||||||
|
General and administrative expenses
|
23 | (346,693 | ) | (251,458 | ) | (236,754 | ) | ||||||||
|
Depreciation and amortization
|
9 and 10
|
(87,584 | ) | (83,428 | ) | (33,816 | ) | ||||||||
|
Provision for legal claims
|
23 | (94,932 | ) | (57,902 | ) | (36,655 | ) | ||||||||
|
Other income (expenses), net
|
23 | (2,910 | ) | 23,362 | 24,482 | ||||||||||
|
Provision for impairment of non-financial assets
|
6, 8 and 10
|
- | (102,485 | ) | - | ||||||||||
|
Income (loss) before financial income and expenses and income tax and social contribution
|
171,805 | (602,924 | ) | 392,729 | |||||||||||
|
Financial expenses
|
24 | (287,569 | ) | (252,876 | ) | (210,202 | ) | ||||||||
|
Financial income
|
24 | 80,629 | 92,973 | 128,085 | |||||||||||
|
Income (loss) before income tax and social contribution
|
(35,135 | ) | (762,827 | ) | 310,612 | ||||||||||
|
Current income tax and social contribution
|
19 (i | ) | (42,753 | ) | (73,207 | ) | (11,834 | ) | |||||||
|
Deferred income tax and social contribution
|
19 (i | ) | 1,525 | (69,155 | ) | (10,294 | ) | ||||||||
|
Total income tax and social contribution
|
(41,228 | ) | (142,362 | ) | (22,128 | ) | |||||||||
|
Net income (loss) for the year
|
(76,363 | ) | (905,189 | ) | 288,484 | ||||||||||
|
Attributable to:
|
|||||||||||||||
|
Owners of Gafisa
|
(124,504 | ) | (944,868 | ) | 264,565 | ||||||||||
|
Non-controlling interests
|
48,141 | 39,679 | 23,919 | ||||||||||||
|
Weighted average number of shares (in thousands)
|
27 | 432,246 | 431,586 | 412,434 | |||||||||||
|
Basic earnings (loss) per thousand weighted average number of shares - R$
|
27 | (0.288 | ) | (2.189 | ) | 0.641 | |||||||||
|
Diluted earnings (loss) per thousand weighted average number of shares - R$
|
27 | (0.288 | ) | (2.189 | ) | 0.610 | |||||||||
See accompanying notes to the consolidated financial statements.
Gafisa S.A.
Years ended December 31, 2012, 2011 and 2010
(In thousands of Brazilian Reais
)
|
2012
|
2011
|
2010
|
||||||||||
|
|
||||||||||||
|
Net income (loss) for the year
|
(76,363 | ) | (905,189 | ) | 288,484 | |||||||
|
|
||||||||||||
|
Total comprehensive income (loss), net of taxes
|
(76,363 | ) | (905,189 | ) | 288,484 | |||||||
|
|
||||||||||||
|
Attributable to
:
|
||||||||||||
|
Owners of Gafisa
|
(124,504 | ) | (944,868 | ) | 264,565 | |||||||
|
Non-controlling interests
|
48,141 | 39,679 | 23,919 | |||||||||
See accompanying notes to the consolidated financial statements.
Gafisa S.A.
Years ended December 31, 2012, 2011 and 2010
(In thousands of Brazilian Reais)
|
Attributable to the equity holders
|
|||||||||||||||||||||||||||||||||||||||||||
|
Income reserves
|
|||||||||||||||||||||||||||||||||||||||||||
|
Note
|
Capital
|
Treasury shares
|
Capital reserves and options granted
|
Legal
reserve
|
Statutory reserve
|
Reserve for future investments
|
Accumulated losses
|
Total – company
|
Non-
controlling interest
|
Total consoli-
dated
|
|||||||||||||||||||||||||||||||||
|
Balances at January 1, 2010
|
1,627,275 | (1,731 | ) | 318,439 | 31,758 | 311,360 | 38,533 | - | 2,325,634 | 58,547 | 2,384,181 | ||||||||||||||||||||||||||||||||
|
Capital increase - Public offering of shares
|
18.1 | 1,063,750 | - | - | - | - | - | - | 1,063,750 | - | 1,063,750 | ||||||||||||||||||||||||||||||||
|
Exercise of stock option
|
18.1 | 17,891 | - | - | - | - | - | - | 17,891 | - | 17,891 | ||||||||||||||||||||||||||||||||
|
Merger of Shertis shares
|
18.1 | 20,282 | - | 1,620 | - | - | - | - | 21,902 | (24,080 | ) | (2,178 | ) | ||||||||||||||||||||||||||||||
|
Gain on capital increase on subsidiary
|
- | - | - | - | - | - | - | - | - | 7,133 | 7,133 | ||||||||||||||||||||||||||||||||
|
Expenses for public offering of shares, net of taxes
|
18.1 | - | - | (33,271 | ) | - | - | - | - | (33,271 | ) | - | (33,271 | ) | |||||||||||||||||||||||||||||
|
Stock option plan
|
18.3 | - | - | 9,091 | - | - | - | - | 9,091 | 194 | 9,285 | ||||||||||||||||||||||||||||||||
|
Purchase of treasury shares
|
- | - | - | - | - | - | - | - | - | (171 | ) | (171 | ) | ||||||||||||||||||||||||||||||
|
Minimum mandatory dividends
|
18.2 | - | - | - | - | - | - | (98,812 | ) | (98,812 | ) | (4,120 | ) | (102,932 | ) | ||||||||||||||||||||||||||||
|
Transfer to legal reserve
|
18.2 | - | - | - | 13,228 | - | - | (13,228 | ) | - | - | - | |||||||||||||||||||||||||||||||
|
Transfer to statutory reserve
|
18.2 | - | - | - | - | 152,525 | - | (152,525 | ) | - | - | ||||||||||||||||||||||||||||||||
|
Net income for the year
|
18.2 | - | - | - | - | - | - | 264,565 | 264,565 | 23,919 | 288,484 | ||||||||||||||||||||||||||||||||
|
Balances at December 31, 2010
|
2,729,198 | (1,731 | ) | 295,879 | 44,986 | 463,885 | 38,533 | - | 3,570,750 | 61,422 | 3,632,172 | ||||||||||||||||||||||||||||||||
|
Capital increase
|
18.1 | 4,959 | - | - | - | - | - | - | 4,959 | - | 4,959 | ||||||||||||||||||||||||||||||||
|
Stock option plan
|
18.3 | - | - | 17,632 | - | - | - | - | 17,632 | 328 | 17,960 | ||||||||||||||||||||||||||||||||
|
Non controlling interest of the SPEs of subsidiaries
|
- | - | - | - | - | - | - | - | - | 4,846 | 4,846 | ||||||||||||||||||||||||||||||||
|
Declared dividends in subsidiaries
|
- | - | - | - | - | - | - | - | - | (7,654 | ) | (7,654 | ) | ||||||||||||||||||||||||||||||
|
Income (loss) for the year
|
18.2 | - | - | - | - | - | - | (944,868 | ) | (944,868 | ) | 39,679 | (905,189 | ) | |||||||||||||||||||||||||||||
|
Absorption of current year loss by capital and income reserves
|
18.2 | - | - | (295,445 | ) | (44,986 | ) | (463,885 | ) | (38,533 | ) | 842,849 | - | - | - | ||||||||||||||||||||||||||||
|
Balances at December 31, 2011
|
2,734,157 | (1,731 | ) | 18,066 | - | - | - | (102,019 | ) | 2,648,473 | 98,621 | 2,747,094 | |||||||||||||||||||||||||||||||
|
Capital increase
|
18.1 | 1,637 | - | - | - | - | - | - | 1,637 | 12,436 | 14,073 | ||||||||||||||||||||||||||||||||
|
Stock option plan
|
18.3 | - | - | 18,898 | - | - | - | - | 18,898 | (1,521 | ) | 17,377 | |||||||||||||||||||||||||||||||
|
Declared dividends in subsidiaries
|
- | - | - | - | - | - | - | - | (9,814 | ) | (9,814 | ) | |||||||||||||||||||||||||||||||
|
Income (loss) for the year
|
18.2 | - | - | - | - | - | - | (124,504 | ) | (124,504 | ) | 48,141 | (76,363 | ) | |||||||||||||||||||||||||||||
|
Balances at December 31, 2012
|
2,735,794 | (1,731 | ) | 39,964 | - | - | - | (226,523 | ) | 2,554,504 | 147,863 | 2,692,367 | |||||||||||||||||||||||||||||||
See accompanying notes to the consolidated financial statements.
Gafisa S.A.
Years ended December 31, 2012, 2011 and 2010
(In thousands of Brazilian Reais)
|
2012
|
2011
|
2010
|
||||||||||
|
Operating activities
|
|
|||||||||||
|
Income (loss) before income and social contribution taxes
|
(35,135 | ) | (762,827 | ) | 310,612 | |||||||
|
Expenses (income) not affecting cash and cash equivalents:
|
||||||||||||
|
Depreciation and amortization (Note 9 and 10)
|
87,584 | 83,428 | 33,816 | |||||||||
|
Stock option expenses (Note 18.3)
|
27,640 | 19,282 | 12,924 | |||||||||
|
Unrealized interests and charges, net
|
114,956 | 111,151 | 217,626 | |||||||||
|
Increase in provision for warranty (Note 15)
|
20,633 | 14,690 | 14,869 | |||||||||
|
Increase in provision for legal claims (Note 16)
|
94,932 | 57,902 | 36,655 | |||||||||
|
Increase in provision for profit sharing (Note 23)
|
64,011 | 17,196 | 36,612 | |||||||||
|
Increase (decrease) in allowance for doubtful accounts and cancelled contracts (Note 5)
|
(39,755 | ) | 67,056 | 9,904 | ||||||||
|
Increase (decrease) in provision for impairment of non-financial assets:
|
||||||||||||
|
Properties for sale (Note 6)
|
(8,744 | ) | 50,049 | - | ||||||||
|
Increase (decrease) in land available for sale (Note 8)
|
(28,876 | ) | 42,006 | - | ||||||||
|
Increase in intangible assets (Note 10)
|
11,690 | 10,430 | - | |||||||||
|
Derivatives financial instruments (Note 20. i.b)
|
(12,014 | ) | (7,735 | ) | - | |||||||
|
Increase (decrease) in provision for penalties for delay in construction works (Note 15)
|
(13,946 | ) | 51,211 | - | ||||||||
|
Write-off of property and equipment and intangible net (Notes 9 and 10)
|
9,471 | 9,579 | - | |||||||||
|
Decrease (increase) in operating assets
|
||||||||||||
|
Trade accounts receivable
|
580,455 | 58,470 | (1,185,231 | ) | ||||||||
|
Properties for sale
|
343,484 | (826,461 | ) | (457,615 | ) | |||||||
|
Prepaid expenses
|
9,838 | (52,317 | ) | (2,450 | ) | |||||||
|
Other
|
(24,229 | ) | (27,682 | ) | (133,689 | ) | ||||||
|
Increase (decrease) in operating liabilities
|
||||||||||||
|
Payables for purchase of properties and advances from customers
|
(168,873 | ) | 189,631 | (23,751 | ) | |||||||
|
Taxes and contributions
|
39,439 | 19,690 | 113,517 | |||||||||
|
Payables for goods and service suppliers
|
31,288 | (54,741 | ) | (3,870 | ) | |||||||
|
Salaries, payroll charges and profit sharing
|
(33,641 | ) | (14,348 | ) | (85,800 | ) | ||||||
|
Transactions with related parties
|
(126,842 | ) | 88,925 | (67,974 | ) | |||||||
|
Income tax and social contribution paid
|
(73,610 | ) | (54,288 | ) | (36,858 | ) | ||||||
|
Other
|
(218,811 | ) | 100,992 | 131,060 | ||||||||
|
|
||||||||||||
|
Cash and cash equivalents provided by (used in) operating activities
|
650,945 | (808,711 | ) | (1,079,643 | ) | |||||||
|
Investing activities
|
||||||||||||
|
Purchase of property and equipment and intangible assets
(Notes 9 and 10)
|
(114,805 | ) | (105,625 | ) | (63,460 | ) | ||||||
|
Purchase of short-term investments
|
(4,781,462 | ) | (2,396,624 | ) | (1,871,140 | ) | ||||||
|
Redemption of short-term investments
|
4,573,373 | 2,495,328 | 2,057,488 | |||||||||
|
Cash and cash equivalents provided by (used in) investing activities
|
(322,894 | ) | (6,921 | ) | 122,888 | |||||||
|
2012
|
2011
|
2010
|
||||||||||
|
Financing activities
|
||||||||||||
|
Capital increase
|
1,637 | 4,959 | 1,101,923 | |||||||||
|
Expenses for public offering
|
- | - | (50,410 | ) | ||||||||
|
Redeemable shares of Credit Rights Investment Fund (FIDC)
|
6,642 | (15,120 | ) | (23,238 | ) | |||||||
|
Proceeds obtained from loans and financing
|
1,419,044 | 1,009,716 | 1,138,232 | |||||||||
|
Payment of loans and financing – principal
|
(1,035,853 | ) | (380,557 | ) | (1,034,744 | ) | ||||||
|
Payment of loans and financing – interest
|
(337,610 | ) | (274,608 | ) | (153,137 | ) | ||||||
|
Obligation assumed on the assignment of receivables, net
|
229,051 | 415,244 | (33,918 | ) | ||||||||
|
Payment to venture partners
|
(149,480 | ) | 68,922 | 80,000 | ||||||||
|
Dividends paid (Note 18.2)
|
- | (98,812 | ) | (50,692 | ) | |||||||
|
Loan transactions with related parties
|
28,057 | (32,896 | ) | (53,819 | ) | |||||||
|
Cash and cash equivalents provided by financing activities
|
161,488 | 696,848 | 920,197 | |||||||||
|
Net increase (decrease) in cash and cash equivalents
|
489,539 | (118,784 | ) | (36,558 | ) | |||||||
|
Cash and cash equivalents
|
||||||||||||
|
At the beginning of the year
|
137,598 | 256,382 | 292,940 | |||||||||
|
At the end of the year
|
627,137 | 137,598 | 256,382 | |||||||||
|
Net increase (decrease) in cash and cash equivalents
|
489,539 | (118,784 | ) | (36,558 | ) | |||||||
See accompanying notes to the consolidated financial statements.
Gafisa S.A.
Years ended December 31, 2012, 2011 and 2010
(In thousands of Brazilian Reais)
|
2012
|
2011
|
2010
|
||||||||||
|
Revenues
|
4,245,202 | 3,169,492 | 4,022,961 | |||||||||
|
Real estate development, sale and transactions barter
|
3,992,209 | 3,456,604 | 4,205,793 | |||||||||
|
Allowance for doubtful accounts
|
252,993 | (287,112 | ) | (182,832 | ) | |||||||
|
Goods and services purchased from third parties (including applicable taxes)
|
(3,136,857 | ) | (2,910,803 | ) | (2,950,637 | ) | ||||||
|
Operating costs - Real estate development, sales and barter transactions
|
(2,544,674 | ) | (2,734,816 | ) | (2,842,830 | ) | ||||||
|
Goods, energy, outsourced labor and other
|
(404,875 | ) | (293,558 | ) | (281,442 | ) | ||||||
|
Provision for cancellations
|
(213,238 | ) | 220,056 | 173,635 | ||||||||
|
Provision for impairment of non-financial assets
|
25,930 | (102,485 | ) | - | ||||||||
|
Gross value added
|
1,108,345 | 258,689 | 1,072,324 | |||||||||
|
Depreciation and amortization
|
(87,584 | ) | (83,428 | ) | (33,816 | ) | ||||||
|
Net value added produced by the Company
|
1,020,761 | 175,261 | 1,038,508 | |||||||||
|
Added value received on transfer
|
||||||||||||
|
Financial income
|
80,629 | 92,973 | 128,085 | |||||||||
|
Total value added to be distributed
|
1,101,390 | 268,234 | 1,166,593 | |||||||||
|
Distribution of value added:
|
||||||||||||
|
Personnel and payroll charges
|
380,055 | 344,443 | 314,910 | |||||||||
|
Taxes and contributions
|
362,200 | 439,418 | 237,920 | |||||||||
|
Interest and rents
|
483,639 | 429,241 | 349,197 | |||||||||
|
Dividends and purchase of treasury shares
|
- | - | 102,767 | |||||||||
|
Net income attributable to non-controlling interests
|
(48,141 | ) | (39,679 | ) | (23,919 | ) | ||||||
|
Net income (loss)
|
(76,363 | ) | (905,189 | ) | 185,718 | |||||||
See accompanying notes to the consolidated financial statements.
Gafisa S.A.
December 31, 2012 and 2011
(Amounts in thousands of Brazilian Reais, except as otherwise stated)
1. Operations
Gafisa S.A. (“Gafisa” or “Company”) is a publicly traded company with headquarter at Avenida das Nações Unidas, 8501, 19º floor, in the City and State of São Paulo, Brazil, and started its commercial operations in 1997 with the objectives of: (a) promoting and managing all forms of real estate ventures on its own behalf or for third parties; (b) purchasing, selling and negotiating real estate properties in general, including provision of financing to real estate customers; (c) carrying out civil construction and civil engineering services; (d) developing and implementing marketing strategies related to its own or third party real estate ventures; and (e) investing in other companies which have similar objectives as the Company’s.
Real estate projects entered into by the Company with third parties are structured through specific purpose partnerships (“Sociedades de Propósito Específico” or “SPEs”) or the formation of consortia and condominiums. Controlled entities substantially share the managerial and operating structures and the corporate, managerial and operating costs with the Company. SPEs, condominiums and consortia operate solely in the real estate industry and are linked to specific ventures.
2. Presentation of financial statements and summary of significant accounting policies
2.1 Basis of presentation and preparation of consolidated financial statements
The Company’s consolidated balance sheets for the years ended December 31, 2012 and 2011 and consolidated statements of operations, comprehensive income (loss), changes in equity, cash flows and value added, accompanied with the notes to the consolidated financial statements for the years ended December 31, 2012, 2011 and 2010 were prepared in accordance with the accounting practices adopted in Brazil, which comprise the rules of the Brazilian Securities and Exchange Commission (“CVM”), and the pronouncements, interpretations and guidelines of the Brazilian Accounting Standards Committee (“CPC”), such practices, rules, interpretations and guidelines being collectively referred to as “Brazilian GAAP” or “BR GAAP”.
Brazilian GAAP differs from International Financial Reporting Standards (“IFRS”) as issued by the International Accounting Standards Board (“IASB”) in certain respects, including the fact that Brazilian GAAP permits the application of percentage of completion accounting by real estate companies in more circumstances than are permitted by IFRS. This application of Brazilian GAAP is commonly referred to in Brazil as “IFRS applicable to real estate development entities in Brazil, as approved by the CPC, the CVM and the CFC, including CPC Guideline 04 – Application of the Technical Interpretation ICPC 02 to the Brazilian Real Estate Development Entities – regarding revenue recognition, and the respective costs and expenses arising from real estate development operations by reference to the stage of completion (percentage of completion method)”. Accordingly, for the purpose of its annual filing with the United States Securities and Exchange Commission, the accompanying consolidated financial statements prepared in accordance with BR GAAP have been reconciled to US GAAP as presented in Note 32. US GAAP balance sheets have been included in Note 32 (d)(i) for 2012 and 2011 and US GAAP statement of operations for the years ended 2012, 2011 and 2010 have been included in Note 32 (d)(ii).
The consolidated financial statements were prepared based on a historical cost basis, except if otherwise stated in the summary of accounting policies.
The financial statements have been prepared on a going concern basis. Management makes an assessment of the Company’s ability to continue as going concern when preparing the financial statements. The Company is in compliance with all its debt covenants at the date of issue of these Financial Statements and management has not identified any material uncertainties over the Company’s ability to continues as a going concern over the next 12 months.
The Board of Directors of the Company has power to amend the consolidated financial statements of the Company after they are issued. On April 12, 2013, the Company’s Board of Directors approved these consolidated financial statements of the Company and has authorized their issuance.
|
|
2.1.1
|
Consolidated financial statements
|
The consolidated financial statements of Gafisa include the individual financial statements of the Company and its direct and indirect subsidiaries, and share of jointly-controlled companies. Control over subsidiaries is obtained when the Company has power to control their financial and operating policies, and is able to enjoy their benefits and is exposed to the risks of their activities. The subsidiaries and jointly-controlled companies are fully and proportionally consolidated, respectively, from the date the full or joint control begins until the date it ceases.
As of December 31, 2012, 2011 and 2010, the consolidated financial statements include the full consolidation of the following companies:
|
Interest %
|
||||||||||||
|
2012
|
2011
|
2010
|
||||||||||
|
Gafisa and subsidiaries (*)
|
100 | 100 | 100 | |||||||||
|
Construtora Tenda and subsidiaries (“Tenda”) (*)
|
100 | 100 | 100 | |||||||||
|
Alphaville Urbanismo and subsidiaries (“AUSA”) (*)
|
80 | 80 | 80 | |||||||||
(*) Does not include jointly-controlled investees, as detailed in the item 2.1.1 (i) (a).
The accounting practices were uniformly adopted in all companies included in the consolidated financial statements and the fiscal year of these companies is the same of the Company.
The Company accounted for the financial statements of the direct jointly-controlled investees listed below, using the proportional consolidation method:
(i)
Ownership interest
(a) Information on subsidiaries and jointly-controlled investees
|
Ownership interest - %
|
||||||||
|
Direct invests
|
2012
|
2011
|
||||||
|
Gafisa SPE 48 S.A.
|
80 | % | 80 | % | ||||
|
SPE Reserva Ecoville/Office - Emp Im. S.A.
|
50 | % | 50 | % | ||||
|
Sítio Jatiuca Emp Im.SPE Ltda.
|
50 | % | 50 | % | ||||
|
GAFISA SPE-116 Emp. Imob. Ltda.
|
50 | % | 50 | % | ||||
|
FIT 13 SPE Emp. Imob. Ltda.
|
50 | % | 50 | % | ||||
|
Gafisa SPE 47 Emp. Imob. Ltda.
|
80 | % | 80 | % | ||||
|
Gafisa SPE 85 Emp. Imob. Ltda.
|
80 | % | 80 | % | ||||
|
Città Ville SPE Emp. Imob. Ltda.
|
50 | % | 0 | % | ||||
|
SPE Pq Ecoville Emp Imob. S.A.
|
50 | % | 50 | % | ||||
|
Gafisa SPE 71 Emp. Imob. Ltda.
|
80 | % | 80 | % | ||||
|
Manhattan Square Emp. Imob. Coml. 1 SPE Ltda.
|
50 | % | 50 | % | ||||
|
Gafisa SPE 65 Emp. Imob. Ltda.
|
80 | % | 80 | % | ||||
|
Alto da Barra de São Miguel Em. Imob SPE Ltda.
|
50 | % | 50 | % | ||||
|
Apoena SPE Emp Imob. S.A.
|
80 | % | 80 | % | ||||
|
Costa Maggiore Emp. Imob. Ltda
|
50 | % | 50 | % | ||||
|
Gafisa SPE 73 Emp. Imob. Ltda.
|
80 | % | 80 | % | ||||
|
Gafisa SPE 46 Emp. Imob. Ltda.
|
60 | % | 60 | % | ||||
|
Dubai Residencial Emp. Imob. Ltda.
|
50 | % | 50 | % | ||||
|
Gafisa SPE 113 Emp. Imob. Ltda.
|
60 | % | 60 | % | ||||
|
Aram SPE Emp. Imob. Ltda
|
80 | % | 80 | % | ||||
|
Grand Park-Parque das Arvores Em. Im. Ltda
|
50 | % | 50 | % | ||||
|
O Bosque Empr. Imob. Ltda.
|
60 | % | 60 | % | ||||
|
Parque do Morumbi Incorporadora Ltda.
|
80 | % | 80 | % | ||||
|
Grand Park - Parque das Aguas Emp Im Ltda.
|
50 | % | 50 | % | ||||
|
Other (*)
|
Various
|
Various
|
||||||
(*) Relates to companies with investment balance below R$3,000.
Information regarding subsidiary – AUSA
In January 2007, upon the acquisition of 60% of AUSA, arising from the acquisition of Catalufa Participações Ltda., a capital increase of R$134,029 was approved upon the issuance for public subscription of 6,358,116 common shares. This transaction generated goodwill of R$170,941 recorded based on expected future profitability, which was amortized up to December 31, 2008. As from January 1, 2009, no subsequent amortization of goodwill was recorded, based on new CPC’s requirements. Goodwill balance at December 31, 2012 and 2011 is R$152,856 (Note 10).
In May 2010, the Company approved the acquisition of the entire issued share capital of Shertis Empreendimentos e Participações S.A., (“Shertis”) whose main asset was 20% of the share capital of AUSA. The acquisition of shares had the purpose of implementing the Second Phase of the schedule for investment planned in the Investment Agreement and other Covenants, signed between the Company and Alphaville Participações S.A. (“Alphapar”) on October 2, 2006, thus increasing the interest of Gafisa in the capital stock of AUSA to 80%. As a result of the acquisition of shares, Shertis was converted into a wholly-owned subsidiary of Gafisa, with the issue of 9,797,792 new common shares to Alphapar, former shareholder of Shertis (Note 18.1).
On June 8, 2012, according to the material fact then disclosed, the third phase of the Investment Agreement and Other Covenants entered into on October 2, 2006 (“Investment Agreement”), established the rules and conditions for Gafisa related to the acquisition of the remaining 20% interest in the capital stock of AUSA not held by the Company. While the valuation of the capital stock has been agreed by
both parties, the number of shares that shall be issued by the Company to settle this transaction is being decided on an arbitration process initiated by the non-controlling interests of AUSA, according to the material fact released on July 3, 2012. There is an embedded derivative component to the Investment Agreement, relating to the Company's obligation to purchase the AUSA shares held by the non-controlling interest. As the fair value of this embedded derivative for all reporting periods has no significant value, since the future settlement of the derivative will be based on the fair value of AUSA’s capital stock, no derivative asset or liability has been recorded. The future settlement to be made in cash or shares represented an amount of R$358,985 as at December 31, 2012 and 2011.
Information regarding subsidiary – CIPESA
On October 26, 2007, Gafisa acquired 70% of Cipesa. Gafisa and Cipesa incorporated a new company, Cipesa Empreendimentos Imobiliários Ltda. (“Nova Cipesa”), in which the Company holds a 70% interest and Cipesa has 30%. Gafisa made a contribution to Nova Cipesa of R$50,000 in cash and acquired the shares which Cipesa held in Nova Cipesa amounting to R$15,000, paid on October 26, 2008. The non-controlling interest holders of Cipesa are entitled to receive from the Company a variable portion corresponding to 2% of the Total Sales Value (VGV), as defined, of the projects launched by Nova Cipesa through 2014, not to exceed R$25,000. Accordingly, the Company’s purchase consideration totaled R$90,000 and goodwill amounting to R$40,686 was recorded, based on expected future profitability. As of December 31, 2012, an impairment of this asset was recorded in the amount of R$11,690 (R$10,430 as of December 31, 2011), totaling R$22,120, due to the decrease on the market price of land, which supported the expected future profitability. The analysis are provided at least annually. As of December 31, 2012, the residual goodwill amount is R$18,567 (R$30,257 in 2011) (Note 10).
Information regarding subsidiary – Tenda
On October 21, 2008, as part of the acquisition of interest in Tenda, Gafisa contributed the net assets of Fit Residencial amounting to R$411,241, acquiring 60% of the Tenda’s equity, at the carrying amount of R$1,036,072, representing an investment of R$621,643 for Gafisa. Such transaction, and according to the previous GAAP, generated negative goodwill of R$210,402, being a bargain purchase. According to CPC 15, this gain was recorded in full in the company’s reserves on transition as at January 1, 2010.
On December 30, 2009, the shareholders of Gafisa and Tenda approved the acquisition by Gafisa of total shares outstanding issued by Tenda, through acquisition of 40%, resulting in an increase of interest on Tenda capital from 60% to 100%. The non-controlling interest holders received shares of Gafisa in exchange for their shares of Tenda in the proportion of 0.205 shares of Gafisa to one share of Tenda. In view of the exchange ratio, 32,889,563 common shares of Gafisa were issued for the total issue price of R$448,844 at carrying amount. This transaction was treated as an equity transaction in accordance with CPC 36 (R2).
|
|
2.1.2
|
Functional and presentation currency
|
The consolidated financial statements are presented in Reais (presentation currency), which is also the functional currency of the Company and its subsidiaries.
2.2 Summary of significant accounting policies
|
|
2.2.1
|
Accounting judgments, estimates and assumptions
|
(i)
Judgments
The preparation of the consolidated financial statements requires management to make judgments, estimates and adopt assumptions that affect the reported amounts of revenue, expenses, assets and liabilities, as well as the disclosure of contingent liabilities, at the balance sheet date. Assets and liabilities subject to estimates and assumptions include the useful life of property and equipment, allowance for doubtful accounts and cancelled contracts, provision for fines due to delay in construction works, impairment of assets, deferred tax assets, provision for warranty, provision for tax, labor and civil risks, and the measurement of the estimated cost of ventures and financial instruments.
(ii)
Estimates and assumptions
The Company
’
s main assumptions related to sources of uncertainty for which future estimates may result in different amounts upon settlement are discussed below:
|
|
a)
|
Impairment of non-financial assets
|
Management annually reviews the carrying amount of assets with the objective of evaluating events or changes in the economic, operational or technological circumstances that may indicate a decrease or loss of its recoverable amount. Should such evidences exist, and the carrying amount exceeds the recoverable amount, a provision for impairment loss is recognized in the income statement by adjusting the carrying amount to the recoverable amount. A test for impairment of intangible assets with indefinite useful lives and goodwill is performed at least annually or when circumstances indicate a decrease in the carrying amount. At December 31, 2012 and 2011, the Company recorded a provision for impairment for land and goodwill related to the Cipesa acquisition.
The recoverable amount of an asset or of a certain cash-generating unit is defined as the highest between its value in use and its fair value less costs to sell.
When estimating the value in use of an asset, the estimated future cash flows are discounted to present value using a discount rate before taxes that reflects the weighted average cost of capital for the industry in which the cash-generating unit operates.
Cash flows are derived from the budget for the following five years, and do not include restructuring activities for which the Company has not yet committed or future significant investments that will improve the asset basis of the cash-generating unit being tested. The recoverable amount is sensitive to the discount rate adopted under the discounted cash flow method, as well as the estimated future cash inflows and to the growth rate used.
The fair value less costs to sell is determined, whenever possible, based on a binding sale agreement in an arm’s length transaction between the knowledgeable and willing parties, adjusted by expenses attributable to the sale of the asset, or, in the absence of a binding sale agreement, based on the market price in an active market, or on a recent transaction with similar assets.
The main assumptions used for determining the recoverable amount of cash-generating unit are detailed in Note 10.
|
b)
|
Inventories of properties for sale
|
Properties for sale are stated at construction cost, which cannot exceed its net realizable value. In the case of real estate developments in progress, the portion in inventory corresponds to the cost incurred for units that have not yet been sold.
The cost of properties for sale includes expenditures incurred in the acquisition of the land and in construction (including foundation, structure, finishing and the respective costs of construction materials), costs of own and outsourced labor, and financial costs directly related to the ventures.
Land can be acquired in cash, in installments, bartered for units that are completed or in construction of other ventures, or bartered for receivables from future sales of ventures. The cost of land related to bartered units is formed by the estimated sale price in cash, this fair value being recorded as contra-entry to the advances from customers-barter.
The interests of loans and financing directly related to ventures financed by the National Housing System (SFH) and other credit facilities which funds are used to finance the construction and acquisition of land are capitalized over the development and construction stage, and appropriated to statement of operations in the proportion to the units sold.
The Company adopts the policy of annually conducting tests on the units in construction and completed units, comparing the unit construction cost with the sale value of units in inventory. The assumptions that usually underlie the calculation of the recoverable value of assets are based on expected cash flows, economic viability studies of real estate ventures that show the recoverability of assets or its market value, all discounted to present value.
The classification of land into current or non-current assets is carried out by the Management based on the schedule of the real estate venture launches. Management periodically reviews the estimates of real estate venture launches.
|
|
c)
|
Share-based payment transactions
|
The Company measures the cost of transactions with employees to be settled with shares based on the fair value of equity instruments on the grant date. The estimate of the fair value of share-based payments requires the determination of the most adequate pricing model to grant equity instruments, which depends on the grant terms and conditions. It also requires the determination of the most adequate data for the pricing model, including the expected option life, volatility and dividend income, and the corresponding assumptions. The assumptions and models used to estimate the fair value of share-based payments are disclosed in Note 18.3.
|
|
d)
|
Provision for legal claims
|
The Company recognizes a provision for tax, labor and civil claims (Note 16). The assessment of the probability of a loss includes the evaluation of the available evidences, the hierarchy of Laws, existing case laws, the latest court decisions and their significance in the judicial system, as well as the opinion of external legal counsel. The provisions are reviewed and adjusted to take into account the changes in circumstances, such as the applicable expiration term, findings of tax inspections, or additional exposures found based on new court issues or decisions. The settlement of transactions involving these estimates may result in amounts different from those estimated in view of the inaccuracies inherent in the process for estimating them. The Company reviews its estimates and assumptions at least annually.
|
|
e)
|
Fair value of financial instruments
|
When the fair value of the financial assets and liabilities presented in the balance sheet cannot be obtained in the active market, it is determined using valuation techniques, including the discounted cash flow method. The data for such methods is based on those practiced in the market, when possible; however, when it is not viable, a certain level of judgment is required to establish the fair value. The judgment includes considerations on the data used, such as liquidity risk, credit risk, and volatility. Changes in the assumptions about these factors may affect the presented fair value of financial instruments.
|
|
f)
|
Estimated cost of construction
|
Total estimated costs, mainly comprising the incurred and future costs for completing the construction works, were reviewed in the preparation of these financial statements, and changes to estimates are possible.
|
|
g)
|
Taxes
|
There are uncertainties in relation to the interpretation of complex tax rules and to the value and timing of future taxable income. The Company and its subsidiaries are subject in the ordinary course of their businesses to assessments, audits, legal claims and administrative proceedings in tax and labor matters. The final result of the investigations, legal claims or administrative proceedings that are filed against the Company and/or its subsidiaries and affiliates may affect us adversely.
|
|
h)
|
Realization of deferred income tax
|
Deferred income tax assets are recorded when it is probable that there are sources of taxable income available in the future to offset the deferred tax asset given consideration to cumulative losses. These include sources of taxable income, based on projections of results prepared using internal assumptions and assumed future economic scenarios.
|
|
2.2.2
|
Recognition of revenue and expenses
|
|
(i)
|
Real estate development and sales
|
Revenues, as well as costs and expenses directly relating to real estate development units sold and not yet finished, are allocated to the income statement over the construction period and the following procedures are adopted:
|
|
(a)
|
For the sales of completed units, revenues are recorded when the sale is completed and the transfer of significant risks and benefits has occurred, regardless of the receipt from the customer of the contracted amount;
|
|
|
(b)
|
For the sales of units under construction, the following applies:
|
|
|
·
|
The incurred cost, including the cost of land, and other directly related expenditure, that correspond to the units sold is fully recorded into the consolidated statement of operations;
|
|
|
·
|
Incurred costs of units sold (including land) is measured as a percentage of total estimated cost, and this percentage is applied to the total revenues of the units sold, adjusted in accordance with the terms established in the sales contracts, thus determining the amount of revenues to be recognized in directly proportion to cost;
|
|
|
·
|
Any amount of revenue recognized that exceeds the amount actually received from customers is recorded as either a current or non-current asset in the account “Trade accounts receivable”. Any amount received in connection with the sales of units that exceeds the amount of revenues recognized is recorded as “Payables for purchase of land and advances from customers”;
|
|
|
·
|
Interest and inflation-indexation charges on accounts receivable as from the time the units are delivered, as well as the adjustment to present value of account receivable, are appropriated to the income statement on a pro rata basis using the accruals basis of accounting;
|
|
|
·
|
The financial charges on account payable for acquisition of land and those directly associated with the financing of construction are recorded in properties for sale and recorded in the incurred cost of finished units until their completion, and follow the same recognition criteria as for the recognition of the cost of real estate units sold while under construction.
|
|
|
·
|
Taxes due on the difference between real estate revenues recognized for accounting purposes and those revenues subject to tax are calculated and recognized when the difference in revenues is recognized.
|
|
|
·
|
Advertising and publicity expenses are recorded in the consolidated statement of operations as accrual basis.
|
|
|
(ii)
|
Construction services
|
Revenues from real estate services are recognized as services are rendered and consist primarily of amounts received in connection with construction management activities for third parties, and technical advisory services.
|
|
(iii)
|
Barter transactions
|
Barter transactions have the objective of receiving land from third parties that are settled with the delivery of apartments. The value of land acquired by the Company is calculated based on the fair value of real estate units to be delivered. The fair value of the land is recorded as a component of inventories of properties for sale against advances from customers, at the time the income from the respective venture is initially recognized. Revenues and costs incurred from barter transactions are appropriated to the income statements over the course of construction period of the projects, as described in item (b).
|
|
(iv)
|
ICPC 02
–
Paragraphs 20 and 21
|
In compliance with the aforementioned ICPC requirements, the amounts of recognized revenues and incurred costs are presented in the statements of income (loss), and the advances received in the account
“
payables for purchase of land and advances from customers
”
.
|
|
2.2.3
|
Financial instruments
|
Financial instruments are recognized only from the date the Company becomes a party to the contractual provisions of financial instruments, which mainly consist of cash and cash equivalents, short-term investments, account receivable, loans and financing, suppliers, and other debts.
Financial assets and liabilities are offset against each other and the net amount is reported in the balance sheet solely when there is a legally enforceable right to offset the recognized amounts and there is an intention to settle them on a net basis, or simultaneously realize the asset and settle the liability.
|
|
(i)
|
Financial instruments at fair value through profit and loss
|
A financial instrument is classified into fair value through profit and loss if held for trading, that is, designated as such when initially recognized.
Financial instruments are designated at fair value through profit and loss if the Company manages these investments and makes decisions on purchase and sale based on their fair value according to the strategy of investment and risk management. After initial recognition, attributable transaction costs are recognized in the consolidated income statement when incurred. Financial instruments at fair value through profit and loss are measured at fair value, and their fluctuations are recognized in the consolidated statement of operations.
In the year ended December 31, 2012, the Company held derivative instruments with the objective of mitigating the risk of its exposure to the volatility of indices and interest rates. In accordance with its treasury policies, the Company does not have or issue derivative financial instruments for purposes other than for protective hedging.
After the initial recognition at fair value, derivatives continued to be measured at fair value and the changes are recognized in the consolidated statement of operations. As of December 31, 2012, the Company has R$19,667 (R$7,735 as of December 31, 2011) in the consolidated balance sheet recognized in assets under the account “Derivative financial instruments” related to the interest rate swap transaction described in Note 20.i.b. The Company does not apply hedge accounting.
|
|
(ii)
|
Financial assets
|
Financial assets are classified into financial assets at fair value through profit or loss, loans and receivables, held-to-maturity investments and available-for-sale financial assets. The Company determines the classification of its financial assets at their initial recognition, when they are included in the contractual provisions of the instrument.
Financial assets are initially recognized at fair value, plus, in the case of investments not designated at fair value through profit or loss, transaction costs that are directly attributable to the acquisition of the financial asset.
The financial assets of the Company include cash and cash equivalents, short-term investments, trade accounts receivable and other accounts receivable, loans and other receivables, and derivative financial instruments.
|
|
(iii)
|
Available-for-sale financial assets
|
For available-for-sale financial assets, the Company assesses if there is any objective evidence that the investment is recoverable at each balance sheet date. After the initial measurement, the available-for-sale financial assets are measured at fair value, with unrealized gains and losses directly recognized in other comprehensive income, when applicable. As of December 31, 2012 and 2011, has no financial assets classified as available for sale.
|
|
Derecognition
|
A financial asset (or, as the case may be, a portion of the financial asset or a portion of a group of similar financial assets) is derecognized when:
|
|
·
|
The rights to receive cash flows from the asset has expired;
|
|
|
·
|
The Company transfers its rights of receiving cash flows of the asset or assumes an obligation of fully paying the cash inflows, without significant delay, to a third party due to a “transfer”; and (a) the Company substantially transfers all risks and rewards of the asset, or (b) the Company does not substantially transfer or retain all risks and rewards of the asset, but transfers the control over the asset.
|
When the Company has transferred its rights to receive cash inflows of an asset and signed an agreement to transfer it, and has not substantially transferred or retained all risks and rewards of the asset, an asset is recognized at the extent of the continuous involvement of the Company with the asset. In this case, the Company also recognized an related liability. The transferred asset and related liability are measured based on the rights and obligations that the Company maintained.
The continuous involvement by guaranteeing the transferred asset is measured at the original carrying value of the asset, or the highest consideration that may be required from the Company, whichever is the lowest.
|
|
Loans and receivables
|
After initial recognition, loans and financing accruing interest are subsequently measured at amortized cost, using the effective interest rate method, less any impairment.
|
|
(iv)
|
Financial liabilities
|
|
|
Loans and financing
|
After initial recognition, loans and financing accruing interest are subsequently measured at amortized cost, using the effective interest rate method. Gains and losses are recognized in statement of operations, at the time liabilities are written-off, as well as during the amortization process using the effective interest rate method.
|
|
Derecognition
|
A financial liability is written-off when the obligation is revoked, cancelled or expires.
When an existing financial liability is substituted by other of the same creditor, under substantially different terms, or when the terms of an existing liability are significantly changed, this substitution or change is treated as a derecognition of the original liability and recognition of a new liability, the difference in the corresponding carrying values being recognized in statement of operations.
|
|
2.2.4
|
Cash and cash equivalents and short-term investments
|
Cash and cash equivalents are substantially composed of demand deposits and bank deposit certificates held under resale agreements, denominated in Reais, with high market liquidity and purchased maturities that do not exceed 90 days or in regard to which there are no penalties or other restrictions for the immediate redemption thereof.
Cash equivalents are classified into financial assets at fair value through profit or loss and are recorded at the original amounts plus income earned through to the closing date of financial statements, on a pro rata basis.
Short-term investments include bank deposit certificates, government bonds, exclusive investment funds that are fully consolidated (except for cash and cash equivalents within the exclusive funds) and restricted cash, in guarantees to loans and restricted cash in guarantees to loans and restricted credits whose fair values approximate their carrying amounts.
|
|
2.2.5
|
Trade account receivable
|
Trade account receivables are stated at amortized cost plus accrued interest and indexation adjustments, net of adjustment to present value. The allowance for doubtful account is recorded at an amount considered sufficient by management to cover estimated losses on realization of accounts receivable.
The installments due are indexed based on the National Civil Construction Index (“INCC”) during the period of construction, and based on the General Market Prices Index (“IGP-M”) and interest, after the delivery of the units.
The balance in current assets is represented by installments receivable in 12 months from the balance sheet date. The remaining balance is recorded in long term, limited to the amount recorded for the financial progress.
The fair value of the revenue from units sold is stated at present value based on the discount rate which fundamentals and assumption are the average rate of the financing obtained by the Company, net of the adjustment for inflation, between the contract signature date and the estimated date of handover of the keys to the completed property to the buyer (from date of the handover of keys, interest of 12% per year plus adjustment for inflation is applied to the accounts receivable).
The discount rates adopted by the Company are within the range of 1.92% to 4.83% for the year ended December 31, 2012 (4.18% in 2011), net of INCC.
Subsequently, as the time goes by, interest is incorporated to fair value to determine the revenue to be recognized under the percentage of completion method.
In compliance with the provisions of item 9 of CPC 30, items 33 and 34 of OCPC01, and item 33 of CPC 12, the Company, in relation to installment sales of unfinished units, recognizes receivables adjusted for inflation, including the portion related to the handover of keys, without interest charges, and these are discounted to present value, as the agreed-upon inflation indexes do not include an interest component. The reversal of the present value adjustment, considering that an important part of the Company operations consists of financing its clients until handover key is recorded as reduction in real estate development revenue. This is consistent with the treatment of interest incurred on the portion of our receivables balance related to the period subsequent to the handover of keys. The discount rate used is based on fundamentals and assumption of an average rate of loans and financing obtained by the Company, net of the inflation effect, as described in Note 2.2.20.
|
|
2.2.6
|
Mortgage-backed securities (CRI)
|
The Company and its subsidiaries carry out the assignment and/or securitization of receivables related to completed real estate projects. This securitization is carried out through the issuance of a “Housing Loan Certificate (“Cédula de Crédito Imobiliário” or “CCI”), which is assigned to financial institutions that grant loans. When there is no right of recourse, this assignment is recorded as a reduction to accounts receivable. When there is right of recourse against the Company, the assigned receivable is maintained in the balance sheet and the funds obtained from assignment are recorded as a liability in the account “Obligations assumed on assignment of receivable”, until the related receivables are settled by customers.
The cost of this transaction is recorded in “financial expenses” in the statements of operations.
The financial guarantees, when a participation is acquired (subordinated CRI) and maintained to secure assigned receivables, are recorded in the balance sheet as “short-term investments” at the realization value, which is equivalent to fair value.
|
|
2.2.7
|
Credit Rights Investment Fund and Housing Loan Certificate
|
The Company consolidates Credit Rights Investment Fund (“Fundo de Investimento em Direitos Creditórios” or “FIDC”) in which it holds subordinated shares, subscribed and paid in by the Company in receivables.
When consolidating the FIDC in its financial statements, the Company records the receivables in the group of account of receivables from customers and the balance of the FIDC net assets are recorded in other accounts payable, with the shares held by the Company being eliminated in the consolidation process. The financial costs of these transactions are appropriated on pro rata basis under the account “financial expenses”.
The Company and its subsidiaries carry out the assignment and/or securitization of receivables related to completed real estate projects. This securitization is carried out through the issuance of a “Housing Loan Certificate (“
Cédula
de Crédito Imobiliário
” or “CCI”
)
, which is assigned to financial institutions that grant loans. The funds from assignment are classified in the account “Obligations assumed on the assignment of receivables”, until the certificates are settled by customers. The transaction cost is recorded under the account “financial expenses” in the consolidated statements of operations in the year that it is carried out.
|
|
2.2.8
|
Properties for sale
|
Land is initially stated at cost of acquisition only once the property deeds have been transferred to the Company. Amounts advanced for the acquisition of land are recorded under the account “Advances to suppliers” when there has been no transfer of the property deeds, not being recognized as land in the financial statements while under negotiation, regardless of the likelihood of success or construction stage. The Company and its subsidiaries acquire a portion of their land through barter transactions, which, in exchange for the land acquired, they undertake to deliver (a) real estate units under development or (b) a portion of the revenues originating from the sale of the real estate units. Land acquired through barter transaction is stated at fair value on the acquisition date, and the revenue and cost are recognized according to the criteria described in Note 2.2.2 (iii). Subsequently, the interest on payables for barter transactions is capitalized to the cost of bartered land, net of the effects to the adjustment to present value.
Properties are stated at construction cost, which cannot exceed net realizable value. In the case of real estate developments in progress, the portion in properties for sale corresponds to the cost incurred for units that have not yet been sold. The incurred cost comprises construction costs (goods, own or outsourced labor, and other related items), and legal expenses relating to the acquisition of land and projects, land costs and financial charges which relate to a project over the construction period.
The Company capitalizes interest on developments during the period of construction, and also on land, while the activities for the preparation of assets for resale are being carried out. These capitalization costs are recognized in the consolidated statements of operations in the proportion to the units sold, using the same criteria as for other costs.
Properties for sale are annually reviewed, at the closing date of the year, to assess the recoverability of the carrying amount of each real estate development, regardless of any events or changes in macroeconomic scenarios indicating that the carrying amount may not be recoverable. When the actual or expected cost of construction of a property for sale (either completed or still under construction) exceeds the expected cash flow from sale, an impairment charge is recorded.
|
|
2.2.9
|
Selling expenses - commissions
|
Brokerage expenses and sales commissions are recorded in the consolidated statement of operations under the account “selling expenses” following the same percentage-of-completion criteria adopted for the recognition of revenues. The charges related to sales commission of the buyer are not recognized as revenue or expense of the Company.
|
|
2.2.10
|
Prepaid expenses
|
These are recorded in the consolidated statements of operations when incurred using the accruals basis of accounting.
|
|
2.2.11
|
Land available for sale
|
Land available for sale is measured based on the lower of the cost and fair value, less cost to sell and is classified as held for sale if its carrying amount is expected to be recovered through a sale of the land, and not through the development of the land. This condition is considered fulfilled only when the sale is highly probable and the group of asset or of disposal is available for immediate sale in its current condition and proceeds of the management undertake to sell it in the year following the classification date.
|
|
2.2.12
|
Investments in subsidiaries and joint-controlled investees
|
If the Company has the power to control the financial and operating policies of an investee, the latter is considered a subsidiary. In situations in which agreements grant another party veto rights over, significant business decisions with regards to the investee, the latter is considered to a jointly-controlled investee. Jointly-controlled investees are accounted for by the Company using the proportionate consolidation method, based on the ownership interest of the Company.
|
|
2.2.13
|
Property and equipment
|
Property and equipment are recorded at cost, less any accumulated depreciation and impairment losses.
A property and equipment item is derecognized when no future economic benefits are expected from its use or disposal. The gain or loss arising from derecognition of an asset (calculated as the difference between the net disposal proceeds and the carrying amount of the asset) is recorded in the consolidated income statement when the asset is derecognized.
Depreciation is calculated based on the straight-line method considering the estimated useful life of the assets, as mentioned as follow:
|
Useful life
|
Annual depreciation rate %
|
||||
|
Installations
|
10 years
|
10 | |||
|
Leasehold improvements
|
4 years
|
25 | |||
|
Furniture and fixture
|
10 years
|
10 | |||
|
Hardware
|
5 years
|
20 | |||
|
Machinery and equipment
|
10 years
|
10 | |||
|
Aircraft
|
10 years
|
10 | |||
|
Vehicles
|
5 years
|
20 | |||
|
Molding
|
10 years
|
10 | |||
|
Sales stands
|
1 year
|
100 | |||
The residual value, useful life, and depreciation methods are reviewed at the end of each year; no change was made in relation to the information for the prior year.
Expenditures incurred for the construction of sales stands, facilities, display apartments and related furnishings are capitalized as property and equipment of the Company. Depreciation of these assets commences upon launch of the development and is recorded over the average term of one year.
Property and equipment are reviewed for indicators of impairment at the end of each period. As of December 31, 2012 and 2011, there were no impairment indicators regarding property and equipment.
|
|
2.2.14
|
Intangible assets
|
Expenditures related to the acquisition and development of computer systems and software licenses, are recorded at acquisition cost and amortized over a period of up to five years, and are subject to periodic assessments of impairment of assets.
The goodwill recorded at December 31, 2012 and 2011, refers to acquisitions before the date of transition to the new Brazilian accounting standards (CPC) on January 1, 2009. At this date, the Company applied the exemption not to retrospectively adjust the accounting for acquisitions made before the transition date.
An impairment test of goodwill is carried out annually (at December 31) or whenever circumstances indicate an impairment loss.
|
|
2.2.15
|
Payables for purchase of properties and advances from customer due to barter transaction
|
Payables for purchase of land are recognized at amounts corresponding to the contractual obligations assumed. Subsequently they are stated at amortized cost plus interest and charges proportional to the period (pro rata basis), when applicable, net of adjustment to present value.
The obligations related to barter transactions of land in exchange for real estate units are stated at fair value at the acquisition date and subsequently adjusted based on the compensation agreed between the parties, with a corresponding entry to the statement of operations.
|
|
2.2.16
|
Income tax and social contribution
|
|
|
(i)
|
Current income tax and social contribution
|
Current income tax is the expected tax payable or receivable/to be offset in relation to taxable profit or loss for the year. To calculate the current income tax and social contribution on income, the Company adopts the Brazilian Transition Tax Regime (RTT), which permits for exclusion of the effect from the changes, to Brazilian accounting standards introduced by Laws No. 16,638/2007 and No. 11,941/2009, from the tax basis of such taxes.
Taxes on income in Brazil comprise income tax (25%) and social contribution (9%), for entities on the standard profit regime, for which the composite statutory rate is 34%. Deferred taxes for these entities are provided on all temporary tax differences at the balance sheet date between the tax bases of assets and liabilities, and their carrying amounts.
As permitted by tax legislation, certain subsidiaries opted for the presumed profit regime, a method under which taxable profit is calculated as a percentage of gross sales. For these companies, income tax is calculated on presumed profits of 8% of gross revenues and social contribution on presumed profits of 12% on gross revenues.
As permitted by tax legislation, the development of certain ventures are subject to the “afetação” regime, based on which the land and its features where a real estate will be developed, as well as other binding assets and rights, are separated from the assets of the developer and comprise the “patrimônio de afetação” (detached assets) of the corresponding development and which real estate units will be delivered to the buyers. In addition, certain subsidiaries made the irrevocable option for the Special Taxation Regime (RET), adopting the "patrimônio de afetação", according to which the income and social contribution taxes are calculated at 3.34% on gross revenues (6% also levying PIS and COFINS on revenues).
|
|
(ii)
|
Deferred income tax and social contribution
|
Deferred tax is recognized in relation to tax losses and temporary differences between the carrying amount of assets and liabilities for accounting purposes and the corresponding amounts used for tax purposes. It is recognized to the extent that it is probable that future taxable income will be available to be used to offset deferred tax assets, based on profit projections made with using internal assumptions and considering future economic scenarios that estimate their full or partial use. The recognized amounts are periodically reviewed and the impacts of realization or settlement are reflected in compliance with tax legislation provisions. Tax credits on accumulated tax losses do not have an expiration date, however, they can only be offset against up to 30% of the taxable profit for each year. Companies that opt for the presumed profit tax regime do not record tax losses and do not have temporary differences, and for this reason, deferred taxes are not recognized.
To the extent that the realization of deferred tax assets is not considered to be probable, this amount is not recorded. As of December 31, 2012 and 2011, the Company did not fully recognize deferred tax assets calculated on tax loss carryforwards (Note 19). The Company records deferred tax on a net basis, determined by a legal entity and same jurisdiction. For entities with cumulative tax losses for the last three years, the Company and its subsidiaries recognized deferred tax assets and liabilities based on the following assumptions:
|
|
·
|
100% of deferred tax liabilities on temporary differences;
|
|
|
·
|
Deferred tax assets on temporary differences that have realization terms similar to deferred tax liabilities, and relate to the same legal entity, are recorded up to the limit of the deferred tax liabilities; and
|
|
|
·
|
In situations where recent losses indicate that future taxable income is uncertain, deferred tax assets are not recognized on deductible temporary differences in excess of deferred tax liabilities recorded on taxable temporary difference liabilities; nor is an asset recognized for the carryforward of unused tax losses.
|
|
|
(iii)
|
Provision for non recognition of the deferred tax asset balance
|
The Company’s projections assume that a significant portion of its business will be conducted in its principal holding companies, and this enables the recovery of a substantial portion of it is accumulated tax losses.
However, several external factors, beyond the control of the Company, may affect such tax calculations, in addition to possible requirements to segregate ventures in their own development entities (SPEs, for example) to a greater extent than the Company intends. There is also the possibility of taxation rulings, relating to new or even ventures that have already been developed within the principal holding companies, which may require the exclusion of such businesses, which would then make their own tax filing, separated from that of the Company.
A reduction in the concentration of projects in holding companies with tax losses carried forward may, therefore, compromise the expected recovery of losses carried forward, which is the reason we did not recognize a portion of deferred income tax asset (Note 19).
|
|
2.2.17
|
Other current and non-current liabilities
|
These liabilities are stated at their known or estimated amounts, plus, when applicable, the corresponding charges and inflation-indexed variations through the balance sheet date, which contra-entry is included in income for the year. Where applicable, current and non-current liabilities are recorded at present value based on interest rates that reflect the term, currency and risk of each transaction.
|
|
2.2.18
|
Stock option plans
|
As approved by its Board of Directors, the Company offers to selected executives and employees share-based incentives (“Stock Options”), according to which services are received as consideration for granted options.
The fair value of services received from the plan, in exchange for options, is determined in relation to the fair value of the options, on the grant date of each program, and recognized as expense with a corresponding entry against shareholders’ equity as service is rendered throughout the vesting period.
In an equity-settled transaction, in which the plan is modified, a minimum expense is recognized corresponding to the expense that would have been recorded if the terms have not been changed. An additional expense is recognized for any modification that increases the total fair value of granted options, or that otherwise benefits, the employee, measured on the modification date. In case of cancellation of a stock option program or an amount of options from a determined program, this is treated as if it had been granted on the cancellation date, and any unrecognized expense is immediately recognized. However, if a new program replaces the cancelled one, and a substitute program is designated on the grant date, the cancelled program and the new one are treated as if they were a modification of the original program, as previously mentioned.
|
|
2.2.19
|
Other employee benefits
|
The benefits granted to the Company’s employees and management include fixed compensation (salaries, social security contributions (“INSS”), Government Severance Indemnity Fund for Employees (“FGTS”), vacation and 13th monthly salary) and variable compensation such as profit sharing, bonus, and share-based incentives. These benefits are recorded in the statement of operations for the year, under the account “General and administrative expenses”, as they are incurred.
The bonus system operates with individual corporate targets, structured based on the efficiency of corporate goals, followed by the business ones and, finally, individual goals. The Company and its subsidiaries do not offer private pension or retirement plans or other post-employment benefits.
|
|
2.2.20
|
Present value adjustment
–
assets and liabilities
|
Assets and liabilities arising from long or short-term transactions, are adjusted to present value if significant.
In installment sales of incomplete units, real estate development entities have receivables adjusted by inflation, including the installment related to the delivery of units, without accrual of interest, and so these receivables are discounted to present value, as the agreed inflation indexes do not include interest. The reversal of the adjustment to present value, considering that an important part of the Company’s activities is to finance its customers, is recorded as a reduction in revenue, consistent with the interest accrued on the portion of account receivable related to the period after the release period.
Borrowing costs for amounts used to finance the construction of real estate ventures are capitalized. Therefore, the reversal of the present value adjustment of an obligation related to these items is appropriated to the cost of real estate unit sold or to the inventories of properties for sale, as the case may be, until the period of construction of the project is completed.
Accordingly, certain asset and liability items are adjusted to present value based on discount rates that reflect management’s best estimate of the value of the money over time. The applied discount rate’s underlying economic basis and assumption is the average rate of the financing and loans obtained by the Company, net of the inflation-index effect (Note 5.i).
|
|
2.2.21
|
Debenture and public offering costs
|
Transaction costs and premiums on the issuance of equity instruments, as well as share issuance expenses, are accounted for as a direct reduction of capital raised. In addition, transaction costs and premiums on issuance of debt securities are amortized over the terms of the instrument and the net balance is classified as reduction of the respective transaction (Notes 11 and 18.1).
|
|
2.2.22
|
Borrowing costs
|
The borrowing costs directly attributable to ventures during the construction period and land, when the development of the asset for sale is being performed, shall be capitalized as part of the cost of that asset, since there are borrowings outstanding, which are recognized in income to the extent units are sold, the same criteria for other costs. All other borrowing costs are recorded as on expense when incurred. Borrowing costs comprise interest and other related costs incurred, including those for raising finance.
|
|
2.2.23
|
Provisions
|
Provisions are recognized when the Company has a present obligation as a result of a past event, and it is probable future economic benefits are required to settle the payable, and a reliable estimate can be made of the amount of the obligation.
|
|
(i)
|
Provision for legal claims
|
The Company is party to various lawsuits and administrative proceedings. Provisions are recognized for all contingencies related to lawsuits, in which it is probable that an outflow of resources will be made to settle the claim, and a reliable estimate can be made. The assessment of the probability of loss includes the evaluation of available evidence, the hierarchy of Laws, available case law, the most recent court decisions, and their relevance in the legal system, as well as the opinion of external legal counsel. Provisions are reviewed and adjusted to take into account the change in circumstances, such as the statute of limitations, findings of tax inspections, or additional identified exposures based on new issues or court decisions.
Contingent liabilities for which losses are considered possible are only disclosed in a note to consolidated financial statements, and those for which losses are considered remote are neither accrued nor disclosed. Contingent assets are recognized only when there are real guarantees or favorable final and unappealable court decisions. Contingent assets with probable favorable decisions are only disclosed in the notes.
|
|
(ii)
|
Allowance for doubtful account and cancelled contracts
|
The Company reviews annually its assumptions to set up an allowance for doubtful account and cancelled contracts, in view of the review of the histories of its current operations and improvement of estimates.
The Company records an allowance for doubtful accounts and cancelled contracts for customer whose installments are over 90 past due, in several types of construction work: construction works on time, construction works delayed (within the grace period), works that are late (out of the grace period) and for delivered completed units. This allowance is calculated based on the percentage of the construction work completion, a methodology adopted for recognizing income for the year (Note 2.2.2 and recorded as a reduction of operating revenue).
|
|
(iii)
|
Provision for penalties due to delay in constructions work
|
As provided for in contract, the Company adopts the practice of provisioning the charges payable to customers for projects with over 180 days of delay to their handover, according to the respective contractual clause. This provision is recorded within “Other operating expenses” in the consolidated statement of operations.
|
|
(iv)
|
Warranty provision
|
The Company and its subsidiaries recognize a provision to cover expenditures for repairing construction defects covered during the warranty period, except for the subsidiaries that operate with outsourced companies, which are the direct guarantors of the constructions services provided. In case of the outsourced companies do not cover the related costs, the Company is the guarantor. The warranty period is five years from the delivery of the unit and is recorded within “Cost of real estate and development and sale” in the consolidated statement of operations.
|
|
(v)
|
Provision for impairment of non-financial assets
|
Management reviews annually, at each balance sheet date, the carrying amount of non-financial assets with the objective of evaluating events or changes in economic and operational circumstances that may indicate impairment. When such evidence is found, the carrying amount exceeds the recoverable amount, so a provision for impairment is recorded, adjusting the carrying to the recoverable amount. Goodwill and intangible assets with indefinite useful lives have the recovery of their amounts tested annually, regardless of whether there are any indications of impairment. This test is performed determining the recoverable amount of the asset, using a discount rate before taxes that reflect the weighted average cost of capital.
|
|
2.2.24
|
Sales taxes
|
Revenues, expenses and assets are recognized net of sales taxes, except the following:
|
|
·
|
When the sales taxes incurred in the purchase of goods or services are not recoverable from tax authorities, in which event sales taxes are recognized as a portion of the acquisition cost of the asset or expense item, as the case may be; and
|
|
|
·
|
When the amounts receivable and payable are shown together with the sales taxes.
|
The amount of net sales taxes, recoverable or payable, is included as a receivables or payable item in the balance sheet.
Under the non-cumulative taxation regime, the PIS and COFINS contribution rates are 1.65% and 7.6%, respectively, for companies under the taxable profit taxation regime, levied on gross revenue and discounting certain credits determined based on incurred costs and expenses. For companies that opt for the presumed profit taxation regime, the PIS and COFINS contribution rates are 0.65% and 3%, respectively, on gross revenue, without discounts of credits in relation to incurred costs and expenses.
|
|
2.2.25
|
Consolidated statements of cash flows and value added
|
The statement of cash flows is prepared and presented in accordance with CVM Resolution No. 641, enacted on October 7, 2010, which approved the accounting pronouncement CPC No. 03 (R2) – Statement of Cash Flows, issued by the CPC.
Certain debt agreements require the Company maintain short-term investments as guarantee for outstanding balances. Such investments are restricted while held in guarantee. The Company accounts for the purchases and sales of such investments as investing activities in the consolidated statement of cash flows.
The consolidated statement of value added is prepared and presented I accordance with CVM Resolution N° 557, enacted on November 12, 2008, which approved the accounting pronouncement CPC N° 09 – Statement of Value Added, issued by CPC.
|
|
2.2.26
|
Treasury shares
|
Own equity instruments that are repurchased (treasury shares) are recognized at cost and deducted from equity. No gain or loss is recognized in the income statements upon purchase, sale, issue or cancellation of the Company
’
s own equity instruments.
|
|
2.2.27
|
Earnings (loss) per share
–
basic and diluted
|
Earnings (loss) per share are calculated by dividing the net income available to ordinary shareholders by the average number of shares outstanding over the period.
Diluted earnings per share are calculated similarly to the basic ones, except for the fact that the numbers of shares outstanding are increased to include the additional shares, which would have been considered in the basic earnings calculation, in case the shares with dilutive potential had been converted, as described in Note 27.
|
|
2.2.28
|
Consolidated statement of comprehensive income (loss)
|
In order to meet the statutory provisions (CPC 26 (R1)), the Company reported the consolidated statement of comprehensive income (loss) in its consolidated financial statements. The Company does not have other comprehensive income (loss), other than the income (loss) for the year.
|
|
3. Pronouncements (new or revised) and interpretation adopted in 2012 or applicable as of January 1, 2013
|
|
|
3.1 Pronouncements (new or revised) and interpretation adopted in 2012
|
The Company adopted all of the pronouncements (new or revised) and interpretations issued by the CPC which were effective as of December 31, 2012.
In relation to the adoption of the pronouncements and interpretations listed below, which became effective as of January 1, 2012, they did not have any significant impact on the Company's consolidated financial statements as of December 31, 2012. They are the following:
|
|
·
|
CPC 17 (R1) – Construction Contracts – CVM Resolution no. 691 of November 8, 2012 (IAS 11);
|
|
|
·
|
CPC 18 (R1) – Investments in Subsidiaries and Affiliates – CVM Resolution no. 688 of October 4, 2012 (IAS 28);
|
|
|
·
|
CPC 30 (R1) – Revenues – CVM Resolution no. 692 of November 8, 2012 (IAS 18);
|
|
|
·
|
CPC 35 (R2) – Separate Financial Statements – CVM Resolution no. 693 of November 8, 2012;
|
|
|
·
|
CPC 40 R1 – Financial Instruments: Supporting Documents – CVM Resolution no. 684 of August 30, 2012 (IFRS 7);
|
|
|
·
|
ICPC 08 (R1) – Accounting of Dividend Payment Proposal – CVM Resolution no. 683 of August 30, 2012; and
|
|
|
·
|
ICPC 09 (R1) – Individual Financial Statements, Separate Financial Statements and Application of the Equity Accounting Method – CVM Resolution no. 687 of October 4, 2012.
|
|
|
3.2. Pronouncements (new or revised) and interpretation applicable to years beginning on January 1, 2013
|
The pronouncements (new or revised) and the interpretation listed below, issued by CPC and approved by CVM, are mandatory for the years beginning on January 1, 2013 or later. They are the following:
|
|
·
|
CPC 18 (R2) – Investments in associates and joint ventures – CVM Resolution no. 696 of December 13, 2012;
|
|
|
·
|
CPC 19 (R2) – Joint arrangements – CVM Resolution no. 694 of November 23, 2012;
|
|
|
·
|
CPC 33 (R1) – Employee benefits –CVM Resolution no. 695 of December 13, 2012;
|
|
|
·
|
CPC 36 (R3) – Consolidated statements – CVM Resolution no. 698 of December 20, 2012;
|
|
|
·
|
CPC 45 – Disclosure of interests in other entities – CVM Resolution no. 697 of December 13, 2012; and
|
|
|
·
|
CPC 46 – Fair value measurement – CVM Resolution no. 699 of December 20, 2012.
|
|
|
3.2. Pronouncements (new or revised) and interpretation applicable to years beginning on January 1, 2013
– Continued
|
The Company did not early adopt any of the standards (new or revised) and interpretations in its consolidated financial statements as of December 31, 2012.
Management, based on the preliminary analysis performed thus far, estimates that the adoption of CPCs 19 (R2) and 36 (R3) will exert a significant impact on the Company's consolidated financial statements for 2013, as certain investments in jointly-controlled investees will no longer be proportionately consolidated and will be accounted for under the equity method.
As required by CPC 23 – Accounting Practices, Changes in Accounting Estimates and Errors, in its consolidated financial statements for 2013, the Company will adopt CPCs 19 (R2) and 36 (R3) retrospectively (adjusting the comparative balances for 2012) and management, based on the preliminary analysis performed thus far, shows below the best estimate for the possible impacts on the balances for 2012.
|
Balances reported in 2012
|
Impact of the adoption of CPC 19 (R2) and CPC 36 (R3)
|
2012 balances, after the adoption of CPC 19 (R2) and CPC 36 (R3)
|
||||||||||
|
Balance sheet
|
||||||||||||
|
Current assets
|
7,218,690 | (1,118,030 | ) | 6,100,660 | ||||||||
|
Non-current assets
|
1,575,371 | (112,698 | ) | 1,462,673 | ||||||||
|
Investments
|
- | 574,798 | 574,798 | |||||||||
|
Property and equipment and Intangible assets
|
276,933 | - | 276,933 | |||||||||
|
Total assets
|
9,070,994 | (655,930 | ) | 8,415,064 | ||||||||
|
Current liabilities
|
2,879,590 | (399,751 | ) | 2,479,839 | ||||||||
|
Non-current liabilities
|
3,499,037 | (256,179 | ) | 3,242,858 | ||||||||
|
Total liabilities
|
6,378,627 | (655,930 | ) | 5,722,697 | ||||||||
|
Equity
|
2,692,367 | - | 2,692,367 | |||||||||
|
Total liabilities and equity
|
9,070,994 | (655,930 | ) | 8,415,064 | ||||||||
|
Statement of operations
|
||||||||||||
|
Net operating revenue
|
3,953,282 | (383,752 | ) | 3,569,530 | ||||||||
|
Operating costs
|
(2,941,025 | ) | 293,443 | (2,647,582 | ) | |||||||
|
Operating (expenses) / income
|
(840,452 | ) | 18,123 | (822,329 | ) | |||||||
|
Equity pick-up
|
- | 58,200 | 58,200 | |||||||||
|
Financial income
|
(206,940 | ) | 6,830 | (200,110 | ) | |||||||
|
Income tax and social contribution
|
(41,228 | ) | 7,156 | (34,072 | ) | |||||||
|
Non-controlling interests
|
(48,141 | ) | - | (48,141 | ) | |||||||
|
Net loss for the year
|
(124,504 | ) | - | (124,504 | ) | |||||||
|
Cash flows
|
||||||||||||
|
Operating activities
|
650,945 | 695,734 | 1,346,679 | |||||||||
|
Investing activities
|
161,488 | (309,281 | ) | (147,793 | ) | |||||||
|
Financing activities
|
(322,894 | ) | (504,966 | ) | (827,860 | ) | ||||||
Except for the potential impacts exerted by the adoption of CPC 19 (R2) and CPC 36 (R3) shown above, management estimates that the adoption of other pronouncements (new or revised) and interpretations will not have a significant impact on the
Company's
consolidated financial statements for 2013.
4. Cash and cash equivalents and short-term investments
4.1 Cash and cash equivalents
|
2012
|
2011
|
|||||||
|
Cash and banks
|
252,073 | 86,628 | ||||||
|
Securities purchased under agreement to resell (a) (Note 20.i.d)
|
375,064 | 50,970 | ||||||
|
Total cash and cash equivalents (Note 20.ii.a)
|
627,137 | 137,598 | ||||||
|
(a)
|
Securities purchased under agreement to resell are securities issued by Banks with a repurchase commitment given by the bank, and resale commitment by the customer, at rates and terms agreed upon, backed by private or government securities, depending on the bank and are registered with the Central of Custody and Financial Settlement of Securities “CETIP”.
|
As of December 31, 2012 the securities purchased under agreement to resell earn interest from 75% to 102.5% of Interbank Deposit Certificates (CDIs) rate (from 70% to 102% of CDI in 2011). All transactions are made with financial institutions considered by management to be first class.
4.2 Short-term investments
|
2012
|
2011
|
|||||||
|
Investment funds
|
1,190 | 2,686 | ||||||
|
Bank deposit certificates (a)
|
655,208 | 466,753 | ||||||
|
Restricted cash in guarantee to loans (b)
|
95,887 | 59,497 | ||||||
|
Restricted credits (c)
|
296,028 | 306,268 | ||||||
|
Other
|
5,838 | 10,858 | ||||||
|
Total short-term investments (Note 20.i.d)
|
1,054,151 | 846,062 | ||||||
|
(a)
|
In 2012, Bank Deposit Certificates (CDBs) include interest earned varying from 70% to 104% (from 75% to 110% in 2011) of Interbank Deposit Certificates (CDIs). The CDBs in which the Company invests earn interest that is usually above 98% of CDI. However, we invest in short term (up to 20 working days) through securities purchased under agreement to resell for which interest is lower (from 75% of CDI). On the other hand, these investments are exempt from the tax on financial transactions (IOF), which is not the case for CDBs.
|
|
(b)
|
Restricted cash in guarantee to loans are investments in fixed-income funds, whose shares represent investments only in federal government bonds, indexed to fixed rates or to price and inflation rates, and pledged to guarantee a portion of the Company’s issuances. These amounts are periodically released, when there is a surplus of guarantee in the issuance and/or as provided for in the indenture. See Notes 12 and 16(b).
|
|
(c)
|
Restricted credits are represented by onlending of the funds from associate credit (“
crédito associativo
”), a type of government real estate financing, which are in process of approval at the Caixa Econômica Federal (a federally owned Brazilian bank used for real estate financing). These approvals are made to the extent that contracts signed with clients at the financial institutions are regularized, which the Company expects to be in up to 90 days.
|
5. Trade accounts receivable, net
|
2012
|
2011
|
|||||||
|
Real estate development and sales (i) (Note 29.1)
|
4,212,142 | 5,438,850 | ||||||
|
( - ) Allowance for doubtful accounts and cancelled contracts (i)
|
(261,661 | ) | (514,654 | ) | ||||
|
( - ) Adjustments to present value
|
(83,854 | ) | (109,152 | ) | ||||
|
Other receivables
|
24,879 | 11,404 | ||||||
| 3,891,506 | 4,826,448 | |||||||
|
Current
|
2,915,253 | 3,962,574 | ||||||
|
Non-current
|
976,253 | 863,874 | ||||||
The current and non-current portions fall due as follows:
|
Maturity
|
2012
|
2011
|
||||||
|
2012
|
- | 4,586,380 | ||||||
|
2013
|
3,260,768 | 545,882 | ||||||
|
2014
|
466,585 | 208,766 | ||||||
|
2015
|
290,699 | 27,429 | ||||||
|
2016
|
57,211 | 21,300 | ||||||
|
2017 onwards
|
161,758 | 60,497 | ||||||
|
|
4,237,021 | 5,450, 254 | ||||||
|
(-) Adjustment to present value
|
(83,854 | ) | (109,152 | ) | ||||
|
( - ) Allowance for doubtful account and cancelled contracts
|
(261,661 | ) | (514,654 | ) | ||||
|
|
3,891,506 | 4,826,448 | ||||||
|
|
(i)
|
The balance of accounts receivable from units sold and not yet delivered is not fully reflected in financial statements. Such receivables are only recorded to the extent that revenues have been recognized, net of installments already received.
|
Advances from clients (development and services), which exceed the revenues recorded in the period, at December 31, 2012, amount to R$138,787 (R$215,042 in 2011) without effect of adjustment to present value, and are classified in
“
Payables for purchase of land and advances from customers
”
(Note 17).
Accounts receivable from completed real estate units delivered are in general subject to annual interest of 12% plus IGP-M variation, the financial income being recorded in income under the account
“
Revenue
”
; the amounts recognized for the years ended December 31, 2012 and 2011 totaled R$65,749 and R$44,016, respectively.
The balance of allowance for doubtful account and cancelled contracts, net of real estate cost accounted for as properties for sale, is recorded in the amount of R$80,069 at December 31, 2012 and R$119,824 in 2011, and is considered sufficient by the Company's management to cover the estimate of future losses on realization of the accounts receivable balance.
During the year ended December 31, 2012 and 2011, the changes in the allowance for doubtful accounts and cancelled contracts are summarized as follows:
|
Receivables
|
Properties for sale (Note 6)
|
Net
|
||||||||||
|
|
||||||||||||
|
Balance at December 31, 2010
|
(227,542 | ) | 174,774 | (52,768 | ) | |||||||
|
Additions (Notes 22 and 23)
|
(287,112 | ) | 220,056 | (67,056 | ) | |||||||
|
Balance at December 31, 2011
|
(514,654 | ) | 394,830 | (119,824 | ) | |||||||
|
Additions (Notes 22)
|
(11,444 | ) | - | (11,444 | ) | |||||||
|
Write-offs (Notes 22 and 23)
|
264,437 | (213,238 | ) | 51,199 | ||||||||
|
Balance at December 31, 2012
|
(261,661 | ) | 181,592 | (80,069 | ) | |||||||
The reversal of the adjustment to present value recognized in revenue from real estate development for the year ended December 31, 2012 totaled R$25,298 (R$(4,486) in 2011), respectively.
Receivables from real estate units not yet finished were measured at present value considering the discount rate determined according to the criterion described in Note 2.22. The rate applied by the Company and its subsidiaries varied from 1.92 to 4.83% for 2012 (4.18% in 2011), net of Civil Construction National Index (INCC).
|
|
(ii)
|
On March 31, 2009, the Company entered into a Credit Rights Investment Funds (FIDC) transaction, which consists of assignment of a portfolio comprising select residential and commercial real estate receivables arising from Gafisa and its subsidiaries. This portfolio was assigned and transferred to
“
Gafisa FIDC
”
which issued Senior and Subordinate shares. This first issuance of senior shares was made through an offering restricted to qualified investors. Subordinated shares were subscribed for exclusively by Gafisa. Gafisa FIDC acquired the portfolio of receivables with a discount rate equivalent to the interest rate on financing contracts.
|
Gafisa was hired by Gafisa FIDC and will be remunerated for performing, among other duties, the reconciliation of the receipt of receivables owned by the fund and the collection of past due receivables. The transaction structure provides for the substitution of the Company as a collection agent in case of non-fulfillment of the responsibilities described in the collection service contract.
The Company assigned its receivables portfolio amounting to R$119,622 to Gafisa FIDC in exchange for cash, at the transfer date, discounted to present value, for R$88,664. The subordinated shares represented approximately 21% of the amount issued, totaling R$18,958 (present value). At the shareholders’ meeting held on March 12, 2012, the extraordinary amortization of subordinated shares in the amount of R$10,000 on March 22, 2012 was approved. At December 31, 2012, it totaled R$11,125 (R$17,466 in 2011). Senior and Subordinated shares receivable are indexed by IGP-M and incur interest at 12% per year.
In the consolidated financial statements as of December 31, 2012, receivables amounting to R$20,717 (R$20,416 in 2011) classified as “Trade accounts receivable” and R$9,592 (R$2,950 in 2011) classified as “Other payables and provisions” (Note 15). The balance of subordinated shares held by the Company is eliminated in the consolidation process.
|
|
(iii)
|
On June 26, 2009, the Company entered into a CCI transaction, which consists of an assignment of a portfolio comprising select residential real estate receivables from Gafisa and its subsidiaries. The Company assigned its receivables portfolio amounting to R$89,102 in exchange for cash, at the transfer date, discounted to present value, of R$69,315, classified under the account
“
Obligations assumed on assignments of receivable
”
. At December 31, 2012, it amounts to R$14,666 (R$24,791 in 2011) (Note 13).
|
|
|
(iv)
|
On June 27, 2011, the Company and its subsidiaries entered into a CCI transaction relating to a portfolio comprising select residential real estate receivables from Gafisa and its subsidiaries. The assigned portfolio of receivables amounts to R$203,915 (R$185,210
–
Gafisa
’
s interest) in exchange for cash, at the transfer date, discounted to present value, for R$171,694 (R$155,889
–
Gafisa
’
s interest), recorded under the account
“
Obligations assumed on assignment of receivables
”
(Note 13). As of December 31, 2012, the balance of this transaction is R$78,242, R$169,793 (in 2011) in the consolidated financial statements (Note 13).
|
|
|
(v)
|
On September 29, 2011, the Company and its subsidiaries entered into a Private Instrument for Assignment of Real Estate Receivables and Other Covenants, which consist of an assignment of a portfolio comprising select residential real estate receivable from Gafisa and its subsidiaries. The amount of real estate receivables assignment paid by the Assignee amounts to R$238,356 (R$221,376 - Gafisa
’
s interest). The assignment amount will be settled by the Assignee by offsetting the Housing Financial System (SFH) debt balance of the own bank. On July 6, 2012, the remaining balance was settled by issuance of Bank Deposit Certificate (CDB) guaranteed in favor of the Company. As of December 31, 2012, the balance of this transaction amounts to R$8,729 (R$188,191 in 2011) in the consolidated financial statements (Note 13).
|
|
|
(vi)
|
On December 22, 2011, Gafisa and its subsidiaries enter into a CCI transaction relating to a portfolio comprising select residential real estate receivable from Gafisa its subsidiaries. The assigned portfolio of receivables amounts to R$72,384 in exchange for cash at the transfer date, discounted to present value, by R$60,097, classified into the account
“
Obligations with assignment of receivables
”
. As of December 31, 2012, the balance of this transaction is R$16,864 (R$72,384 in 2011) in the consolidated financial statements (Note 13).
|
|
|
(vii)
|
On May 9, 2012,
Gafisa and its subsidiaries enter into a CCI transaction relating to a portfolio comprising select residential real estate receivable from Gafisa its subsidiaries.
The assigned portfolio of receivables amounts to R$64,887 in exchange for cash at the transfer date, discounted to present value, by R$45,225, classified into the account “obligations assumed on assignment of receivables”, and the subscription of Subordinated CRI for the unit value of R$1,809. As of December 31, 2012, the balance of this transaction is R$22,818 in the consolidated
financial
statements (Note 13).
|
|
|
(viii)
|
On July 6, 2012,
Gafisa and its subsidiaries enter into a CCI transaction relating to a portfolio comprising select residential real estate receivable from Gafisa its subsidiaries.
The assigned portfolio of receivables amounts to R$18,207 in exchange for cash at the transfer date, discounted to present value, by R$11,489, classified under
“
Obligations assumed on assignment of receivables
”
. As of December 31, 2012, the balance of this transaction was R$10,458 in the consolidated
financial
statements (Note 13).
|
|
|
(ix)
|
On November 14, 2012, AUSA and its subsidiaries entered into a CCI transaction relating to a portfolio
comprising select residential
real estate
receivable from AUSA and subsidiaries
.
The assigned gross portfolio of receivables totals R$134,609 in the consolidated
financial
statements and in exchange for cash, at the transfer date, discounted to present value, by R$110,689 classified into the account
“
Obligations assumed on assignment of receivables
”
. As of December 31, 2012, the balance of this transaction is R$113,462 in the consolidated
financial
statements (Note 13).
|
|
|
(x)
|
On December 27, 2012,
Gafisa and its subsidiaries enter into a CCI transaction relating to a portfolio comprising select residential real estate receivable from Gafisa its subsidiaries.
The assigned portfolio of receivables amounts to R$72,021 in exchange for cash at the transfer date, discounted to present value, by R$61,647, classified into the account “Obligations assumed on assignment of receivables”. As of December 31, 2012, the balance of this transaction is R$62,235 in the consolidated
financial
statements (Note 13).
|
Gafisa was engaged to perform, among other duties, the management of the receipt of receivables, CCIs underlying assets, and the collection of defaulting customers.
The cost of these transactions was recorded in the consolidated statement of operations for the year in which the transaction was made under the account “Financial expenses”.
6. Properties for sale
|
2012
|
2011
|
|||||||
|
Land
|
975,989 | 1,209,400 | ||||||
|
(-) Provision for realization of land (Note 29.1)
|
(7,663 | ) | (50,049 | ) | ||||
|
(-) Adjustment to present value
|
(6,213 | ) | (8,183 | ) | ||||
|
Property under construction (Note 29.1)
|
936,436 | 1,181,950 | ||||||
|
Completed units
|
380,542 | 119,342 | ||||||
|
Real estate cost on the recognition of provision for cancelled contracts (Note 5 (i))
|
181,592 | 394,830 | ||||||
|
|
2,460,683 | 2,847,290 | ||||||
|
Current portion
|
2,130,195 | 2,049,084 | ||||||
|
Non-current portion
|
330,488 | 798,206 | ||||||
In the
years ended
December
31, 2012 and 2011,
the movement in the provision for realization of land is summarized as follows
:
|
Balance at 2010
|
- | |||
|
Additions
|
(50,049 | ) | ||
|
Balance at 2011
|
(50,049 | ) | ||
|
Additions
|
(373 | ) | ||
|
Write-offs
|
9,117 | |||
|
Transfer to land available for sale (Note 8) (a)
|
33,642 | |||
|
Balance at 2012
|
(7,663 | ) | ||
|
(a)
|
Land not included in the business plan of the Company and reclassified into land available for sale (Note 8).
|
The Company has undertaken commitments to build units in exchange for land, accounted for based on the fair value of the bartered units. At December 31, 2012, the balance of land acquired through barter transactions totaled R$187,041 (R$83,506 in 2011) (Note 17).
As disclosed in Note 12, the balance of capitalized financial charges as of December 31, 2012, amounts to R$252,756 (R$221,814 in 2011) in the consolidated financial statements.
The adjustment to present value in the property for sale balance refers to the contra-entry to the adjustment to present value of payables for purchase of land with no income statement effect. The total amount of the reversal of the adjustment to value recognized in the costs of real estate development in the year ended December 31, 2012 amounts to R$(710) and R$(602) in 2011.
7. Other
|
2012
|
2011
|
|||||||
|
Advances to suppliers
|
5,536 | 7,309 | ||||||
|
Recoverable taxes (IRRF, PIS, COFINS, among others)
|
79,917 | 85,057 | ||||||
|
Judicial deposits (Note 16)
|
130,543 | 108,436 | ||||||
|
Other
|
22,477 | 3,426 | ||||||
|
|
238,473 | 204,228 | ||||||
|
Current portion
|
56,288 | 60,378 | ||||||
|
Non-current portion
|
182,185 | 143,850 | ||||||
8. Land available for sale
The Company, in line with the new strategic direction implemented in the end of 2011 and during 2012, opted to sell land not included in the Business Plan approved for 2013 and the next four years. Therefore, it formalised a plan for the sale of this land in 2012 and 2013. The carrying amount of this land, adjusted to market value when applicable, after the test for impairment, is shown by the Company as follows:
|
Segment
|
Cost
|
Provision for impairment
|
Net balance
|
|||||||||
|
Balance at December 31, 2010
|
- | - | - | |||||||||
|
Additions
|
135,194 | (42,006 | ) | 93,188 | ||||||||
|
Balance at December 31, 2011
|
135,194 | (42,006 | ) | 93,188 | ||||||||
|
Transfer from properties for sale (Note 6)
|
153,685 | (33,642 | ) | 120,043 | ||||||||
|
Reversal/Write-offs
|
(68,176 | ) | 28,876 | (39,300 | ) | |||||||
|
Balance at December 31, 2012
|
220,703 | (46,772 | ) | 173,931 | ||||||||
|
Gafisa and SPEs
|
29,021 | (5,554 | ) | 23,467 | ||||||||
|
Tenda and SPEs
|
191,682 | (41,218 | ) | 150,464 | ||||||||
9. Property and equipment
|
Type
|
2010
|
Addition
|
Write-off
|
2011
|
Addition
|
Write-off
|
2012
|
|||||||||||||||||||||
|
Cost
|
||||||||||||||||||||||||||||
|
Hardware
|
17,209 | 11,107 | (3,182 | ) | 25,134 | 5,720 | (1,414 | ) | 29,440 | |||||||||||||||||||
|
Vehicles and aircrafts
|
5,888 | 351 | - | 6,239 | 1,388 | - | 7,627 | |||||||||||||||||||||
|
Leasehold improvements and installations
|
16,997 | 7,590 | (1,645 | ) | 22,942 | 10,982 | (548 | ) | 33,376 | |||||||||||||||||||
|
Furniture and fixtures
|
7,188 | 664 | (53 | ) | 7,799 | 23 | - | 7,822 | ||||||||||||||||||||
|
Machinery and equipment
|
3,176 | 278 | (13 | ) | 3,441 | 795 | (62 | ) | 4,174 | |||||||||||||||||||
|
Molds
|
8,130 | - | - | 8,130 | - | - | 8,130 | |||||||||||||||||||||
|
Sales stands
|
132,097 | 30,220 | - | 162,317 | 33,323 | - | 195,640 | |||||||||||||||||||||
| 190,685 | 50,210 | (4,893 | ) | 236,002 | 52,231 | (2,024 | ) | 286,209 | ||||||||||||||||||||
|
|
||||||||||||||||||||||||||||
|
Accumulated depreciation
|
||||||||||||||||||||||||||||
|
Hardware
|
(11,359 | ) | (4,110 | ) | 179 | (15,290 | ) | (4,234 | ) | 61 | (19,463 | ) | ||||||||||||||||
|
Vehicles and aircrafts
|
(5,038 | ) | (549 | ) | - | (5,587 | ) | (451 | ) | - | (6,038 | ) | ||||||||||||||||
|
Leasehold improvements and installations
|
(11,044 | ) | (2,360 | ) | 2 | (13,402 | ) | (3,823 | ) | 16 | (17,209 | ) | ||||||||||||||||
|
Furniture and fixtures
|
(2,950 | ) | (723 | ) | - | (3,673 | ) | (735 | ) | - | (4,408 | ) | ||||||||||||||||
|
Machinery and equipment
|
(59 | ) | (326 | ) | - | (385 | ) | (353 | ) | 4 | (734 | ) | ||||||||||||||||
|
Molds
|
(3,277 | ) | (1,994 | ) | - | (5,271 | ) | (1,981 | ) | - | (7,252 | ) | ||||||||||||||||
|
Sales stands
|
(87,981 | ) | (51,620 | ) | - | (139,601 | ) | (44,658 | ) | - | (184,259 | ) | ||||||||||||||||
| (121,708 | ) | (61,682 | ) | 181 | (183,209 | ) | (56,235 | ) | 81 | (239,363 | ) | |||||||||||||||||
| 68,977 | (11,472 | ) | (4,712 | ) | 52,793 | (4,004 | ) | (1,943 | ) | 46,846 | ||||||||||||||||||
10. Intangible assets
The breakdown is as follows:
|
2011
|
Addition
|
Write-off/ Amortization
|
2012
|
|||||||||||||
|
Goodwill
|
||||||||||||||||
|
AUSA (Note 9)
|
152,856 | - | - | 152,856 | ||||||||||||
|
Cipesa (Note 9)
|
40,687 | - | - | 40,687 | ||||||||||||
|
Provision for non-realization / Write-off – sale of land (Note 9)
|
(10,430 | ) | (11,690 | ) | - | (22,120 | ) | |||||||||
| 183,113 | (11,690 | ) | - | 171,423 | ||||||||||||
|
Software – Cost
|
60,490 | 30,710 | (7,447 | ) | 83,753 | |||||||||||
|
Software – Depreciation
|
(27,839 | ) | (13,859 | ) | 2,505 | (39,193 | ) | |||||||||
|
Other
|
13,720 | 34,889 | (34,505 | ) | 14,104 | |||||||||||
| 46,371 | 51,740 | (39,447 | ) | 58,664 | ||||||||||||
|
|
||||||||||||||||
| 229,484 | 40,050 | (39,447 | ) | 230,087 | ||||||||||||
|
2010
|
Addition
|
Write-off/ Amortization
|
2011
|
|||||||||||||
|
Goodwill
|
||||||||||||||||
|
AUSA (Note 9)
|
152,856 | - | - | 152,856 | ||||||||||||
|
Cipesa (Note 9)
|
40,687 | - | - | 40,687 | ||||||||||||
|
Provision for non-realization / Write-off – sale of land (Note 9)
|
- | (10,430 | ) | - | (10,430 | ) | ||||||||||
| 193,543 | (10,430 | ) | - | 183,113 | ||||||||||||
|
Other intangible assets
|
||||||||||||||||
|
Software – Cost
|
32,335 | 33,185 | (5,030 | ) | 60,490 | |||||||||||
|
Software – Accumulated depreciation
|
(19,196 | ) | (8,806 | ) | 163 | (27,839 | ) | |||||||||
|
Other
|
15,147 | 11,513 | (12,940 | ) | 13,720 | |||||||||||
| 28,286 | 35,892 | (17,807 | ) | 46,371 | ||||||||||||
|
|
||||||||||||||||
| 221,829 | 25,462 | (17,807 | ) | 229,484 | ||||||||||||
During the year 2012 there was a write-off in the amount of R$7.4 million of intangible assets (R$5.0 million in 2011).
Other intangible assets refer to expenditures on acquisition and implementation of information systems and software licenses, amortized in five years (20% per year).
Goodwill arises from the acquisition of subsidiaries, being the difference between the consideration transferred and the fair value of net assets of acquired, calculated on the acquisition date, and is based on expected future economic benefits. These amounts are tested annually for impairment purposes (Note 2.1.1).
The Company evaluated the recovery of the carrying amount of goodwill using the “value in use” concept, through discounted cash flow models of the cash-generating units. The process for determining value in use involves the use of assumptions, judgments and estimates on cash flows, such as growth rate of revenues, costs and expenses, estimates of investment and future working capital, and discount rates. The assumptions on projections of growth, cash flow and future cash flows are based on the Company’s business plan, approved by the management, as well as on comparable market data, and represent the Management’s best estimate of the economic conditions that will prevail during the economic life of the different cash-generating units, group of assets that provides the generation of cash flows. The future cash flows were discounted based on the rate representative of the cost of capital. Consistent with the economic valuation techniques, the evaluation of the value in use is made for a five-year period, and after such period, considering the perpetuity of assumptions in view of the capacity for indefinite business continuity. The main assumptions used in the estimate of value in use are the following: Revenue – revenues were projected between 2013 and 2017 considering the growth in sales and client base of the
different cash-generating units. Operating costs and expenses – costs and expenses were projected in line with the Company’s historical performance, as well as the historical growth of revenues. The key assumptions were based on the Company’s historical performance and on reasonable macroeconomic assumptions, and supported by the financial market projections, documented and approved by the Company’s management. The recovery test of Company’s intangible assets resulted in the need to recognize a write-off in the year ended December 31, 2012, in the amount of R$11,690 (R$10,430 in 2011), totaling R$22,120, related to the goodwill on acquisition of CIPESA. As of December 31, 2012, the residual goodwill amount is R$18,567 (R$30,257 in 2011). The goodwill recorded in CIPESA was evaluated comparing the market values of land.
|
11.
|
Loans and financing
|
|
Type
|
Maturity
|
Annual interest rate
|
2012
|
2011
|
||||||
|
Certificate of Bank Credit – CCB (i)
|
August 2013 to June 2017
|
1.30 % to 3.04% + CDI / 13.20%
|
1,118,553 | 937,019 | ||||||
|
Promissory notes (ii)
|
December 2013
|
125% of CDI
|
80,159 | 231,068 | ||||||
|
National Housing System - SFH (iii)
|
January 2013 to September 2016
|
TR + 8.30 % to 11.50%
|
980,667 | 684,642 | ||||||
|
Assumption of debt in connection with inclusion of subsidiaries’ debt and other
|
April 2013
|
TR + 12%
|
1,064 | 3,881 | ||||||
| 2,180,443 | 1,856,610 | |||||||||
|
|
||||||||||
|
Current portion
|
812,483 | 1,135,543 | ||||||||
|
Non-current portion
|
1,367,960 | 721,067 | ||||||||
|
(i)
|
On June 27, 2011, eight Certificates of Bank Credit (CCBs) were issued by the Company, totaling R$65,000. CCBs are guaranteed by 30,485,608 shares issued by Gafisa SPE-89 Empreendimentos Imobiliários S.A. On the same date,
eight CCBs were issued in AUSA, totaling R$55,000. CCBs are guaranteed by 500,000 units issued by Alphaville Ribeirão Preto Empreendimentos Imobiliários S.A
.
|
On September 5, 2012, the Company issued Certificates of Bank Credit (CCB) in the amount of R$150,000, with secured guarantee, represented by first-priority mortgage of select real estate venture units of the Company, and by the fiduciary assignment of these real estate receivables. The amount of R$150,000 was released on December 6, 2012, after the formalization of the guarantees of the issue.
On October 31, 2012, the Company amended the Certificates of Bank Credit (CCB), for which the original amount was R$100,000, with the purpose of pledging a secured guarantee, represented by first-priority mortgage of select real estate venture units of the Company, and by the fiduciary assignment of these real estate receivables, and also renegotiate the payment flow.
On December 21, 2012, CCBs amounting to R$130,000 were issued by the subsidiary AUSA. The CCB is guaranteed by the pledging of receivables and endorsement by the Company in the amount of 100% of the debt balance of the transaction.
Funds from these CCBs were allocated to fund real estate developments. The CCBs contain restrictive covenants related mainly to the leverage and liquidity ratios of the Company. These covenants were complied with as of December
31, 2012.
|
(ii)
|
On December 5, 2011, the public distribution of the 2
nd
issuance of commercial promissory notes was approved in two series, the 1
st
in the amount of R$150,000 and the 2
nd
in the amount of R$80,000, totaling R$230,000. In December 2012, the Company paid the total balance of the transaction in the amount of R$247,614. On December 20, 2012, the public distribution of the 3
rd
issuance of commercial promissory notes, in sole series, in the amount of R$80,000 was approved. As of December 31, 2012, the issuance balance is R$80,159. The issuance counts on covenants mainly related to the fulfillment of leverage and liquidity ratios of the Company. These covenants were complied with as of December 31, 2012.
|
|
(iii)
|
The financing of ventures (SFH), working capital and CCB correspond to credit lines by financial institutions to raise the necessary funds to develop the ventures of the Company and subsidiaries.
|
|
|
Rates
|
|
|
·
|
CDI - Interbank Deposit Certificate
;
|
|
|
·
|
TR - Referential Rate
.
|
The current and non-current installments fall due as follows, considering the loans and financing reclassified into short term as of December 31, 2011 by default
.
As of December 31, 2012, the Company projected the contractual cash flow of obligations adding to the contractual amortization the amount of variable interest of its contracts, based on market estimates, as shown below:
|
Maturity
|
2012
|
2011
|
||||||||||
|
Carrying value
|
Contractual cash flow
|
Carrying value
|
||||||||||
|
2012
|
- | - | 1,135,543 | |||||||||
|
2013
|
812,483 | 952,186 | 215,263 | |||||||||
|
2014
|
770,228 | 854,269 | 222,693 | |||||||||
|
2015
|
406,085 | 442,299 | 152,006 | |||||||||
|
2016
|
161,883 | 177,385 | - | |||||||||
|
2017
forwards
|
29,764 | 51,104 | 131,105 | |||||||||
| 2,180,443 | 2,477,243 | 1,856,610 | ||||||||||
The Company and its subsidiaries have restrictive covenants under certain loans and financing that limit its ability to perform certain actions, such as the issuance of debt, and that could require the early redemption or refinancing of loans if the Company does not fulfill such covenants. The ratio and minimum and maximum amounts required under such restrictive covenants as of December 31, 2012 and 2011 are disclosed in Note 12.
As of December 31, 2011, the Company was in default on the restrictive covenants of a CCB amounting to R$100,000 due to the corporate rating downgrade. Immediately thereafter, the Company negotiated and obtained a waiver from the financial institutions of the early redemption due to the defaults on covenants. As of December 31, 2012, the Company is compliant with these covenants.
Financial expenses of loans
Financial expense of loans, financing and debentures (Note 12) are capitalized at cost of each venture and land, according to the use of funds, and appropriated to the statements of operations based on the criteria adopted for recognizing revenue, as shown below. The capitalization rate used in the determination of costs of loans eligible to capitalization varied from 9.14% to 10.14% as of December 31, 2012 (11.61% in 2011).
The following table shows the summary of financial charges (expensed or capitalized) related to the account “Properties for sale”.
|
2012
|
2011
|
2010
|
||||||||||
|
|
||||||||||||
|
Total financial expenses for the year
|
381,344 | 388,124 | 343,026 | |||||||||
|
Capitalized financial charges
|
(214,055 | ) | (238,850 | ) | (193,970 | ) | ||||||
|
|
||||||||||||
|
Financial expenses (Note 24)
|
167,289 | 149,274 | 149,056 | |||||||||
|
|
||||||||||||
|
Financial charges included in “Properties for sale””
|
||||||||||||
|
|
||||||||||||
|
Opening balance
|
221,814 | 146,542 | 91,568 | |||||||||
|
Capitalized financial charges
|
214,055 | 238,850 | 193,970 | |||||||||
|
Charges appropriated to statement of operations (Note 23)
|
(183,113 | ) | (163,578 | ) | (138,996 | ) | ||||||
|
|
||||||||||||
|
Closing balance (Note 6)
|
252,756 | 221,814 | 146,542 | |||||||||
12. Debentures
|
Program/placement
|
Principal - R$
|
Annual interest
|
Original final maturity
|
2012
|
2011
|
|||||||||
|
|
||||||||||||||
|
Third program /first placement – Fifth placement (i)
|
250,000 |
120% of CDI
|
May 2013/ May 2018
|
129,569 | 253,592 | |||||||||
|
Sixth placement (ii)
|
100,000 |
CDI + 1.30%
|
August 2014
|
137,763 | 124,851 | |||||||||
|
Seventh placement (iii)
|
600,000 |
TR + 10.09%
|
December 2017
|
601,200 | 601,234 | |||||||||
|
Eighth placement /first placement (v)
|
288,427 |
CDI + 1.95%
|
October 2015
|
291,956 | 293,819 | |||||||||
|
Eighth placement / second placement (v)
|
11,573 |
IPCA + 7.96%
|
October 2016
|
13,411 | 12,680 | |||||||||
|
First placement (Tenda) (iv)
|
600,000 |
TR + 9.54%
|
October 2015
|
562,004 | 613,024 | |||||||||
| 1,735,903 | 1,899,200 | |||||||||||||
|
|
||||||||||||||
|
Current portion
|
346,360 | 1,899,200 | ||||||||||||
| Non-current portion |
1,389,543
|
- | ||||||||||||
| - |
|
(i)
|
On May 16, 2008, the Company obtained approval for its 3
rd
Debenture Placement Program, which allows it to place R$1,000,000 in simple debentures with a general guarantee maturing in five years.
|
Under the 3
rd
Debenture Placement Program, the Company placed a series of 25,000 debentures in the total amount of R$250,000. On April 26, 2012, the Company set the conditions for the scheduled price adjustment, as provided for in the indenture, which was not accepted by 12,138 debenture holders; accordingly, the Company acquired on May 5, 2012 all debentures from those who did not accept the fixed conditions for R$123,192.
|
(ii)
|
On August 12, 2009, the Company obtained approval for its 6
th
Placement of non-convertible simple debentures in two series, which have general guarantee, maturing in two years and unit face value at the issuance date of R$10,000, totaling R$250,000. In May 2010, the Company amended this indenture, changing the maturity from four to ten months, and the interest of the 1st series was adjusted to CDI+1.50%-2.00%, and that of the 2
nd
series to CDI+1.50%-3.25% . In October 2010, the Company made the early redemption of the 1
st
series of this placement in the amount of R$150,000.
|
|
(iii)
|
On November 16, 2009, the Company obtained approval for its 7
th
Placement of nonconvertible simple debentures in a single and undivided lot, sole series, secured by a floating and additional guarantee, in the total amount of R$600,000, with semi-annual amortization between June 2013 and December 2015 over five years. The funds raised through this placement shall be used in the finance of real estate ventures.
|
|
(iv)
|
On April 14, 2009, the subsidiary Tenda obtained approval for its 1
st
Debenture Placement Program, which allowed it to place up to R$600,000 in non-convertible simple subordinated debentures, in a single and undivided lot, secured by a floating and additional guarantee, with semi-annual amortizations between October 1, 2012 and October 1, 2015. The funds raised through the placement shall be exclusively used in the finance of real estate ventures focused only in the popular segment.
|
|
(v)
|
On September 17, 2010, the Company obtained approval for its 8
th
Placement of nonconvertible simple debentures, in the amount of R$300,000, in two series, the first maturing on October 15, 2015, and the second on October 15, 2016.
|
The Company has restrictive debenture covenants which limit its ability to perform certain actions, such as the issuance of debt, and that could require the early redemption or refinancing of loans if the Company does not fulfill these.
Current and non-current installments fall due as follows, considering the balances reclassified into current as of December 31, 2011 by default
of covenants, as mentioned in Note 11 and below
.
As of December 31, 2011, the Company exceeded what was provided for in the restrictive covenants of the First Placement of Tenda and the Seventh Placement of Gafisa because the EBIT was lower than zero, and of the Fifth Placement of Gafisa because the ratio was higher than 75% of equity. In 2012, the Company renegotiated certain restrictive covenants and, as of December 31, 2012, it is in compliance with the new covenants arising from such renegotiation.
As of December 31, 2012, the Company projected the contractual cash flows of obligations adding to the contractual amortization the amount of variable interest of its contracts, based on market estimates, as shown below:
|
Maturity
|
2012
|
2011
|
||||||||||
|
Carrying value
|
Contractual cash flows
|
Carrying value
|
||||||||||
|
2012
|
- | - | 1,899,200 | |||||||||
|
2013
|
346,360 | 463,912 | - | |||||||||
|
2014
|
529,281 | 666,517 | - | |||||||||
|
2015
|
500,000 | 577,785 | - | |||||||||
|
2016
|
156,642 | 193,296 | - | |||||||||
|
2017
forwards
|
203,620 | 219,719 | - | |||||||||
| 1,735,903 | 2,121,229 | 1,899,200 | ||||||||||
As mentioned in Note 4.2, as of December 31, 2012, the balance of cash in guarantee to loans in investment funds in the amount of R$95,887 (R$59,497 in 2011) in the consolidated financial statements, is pledged as part of the calculation of the guarantee of 1
st
debenture placement of the subsidiary Tenda and the 7
th
placement of the Company.
The actual ratios and minimum and maximum amounts stipulated by these restrictive covenants at December 31, 2012 and 2011 are as follows:
|
2012
|
2011
|
|
|
Fifth placement
|
||
|
Total account receivable plus inventory of finished units required to be equal to or 2.2 times over net debt or below zero
|
3.73 times
|
n/a
|
|
Total debt less venture debt
(3)
less cash and cash equivalents and short-term investments
(1)
cannot exceed 75% of equity
|
3.58%
|
n/a
|
|
Seventh placement
|
||
|
Total account receivable plus inventory required to be below zero or 2.0 times over net debt less venture debt
(3)
|
115.86 times
|
14.26 times
|
|
Total debt less venture debt
(3)
, less cash and cash equivalents and short-term investments
(1)
, cannot exceed 75% of equity plus non-controlling interests
|
3.39%
|
31.8%
|
|
Total account receivable plus unappropriated income plus total inventory of finished units required to be 1.5 time over the net debt plus payable for purchase of properties plus unappropriated cost
|
2.03 times
|
1.74
times
|
|
Eighth placement - first and second series, second issuance of Promissory Notes, first and second series
|
||
|
Total account receivable plus inventory of finished units required to be below zero or 2.0 times over net debt less venture debt
|
91.37 times
|
11.03 times
|
|
Total debt less venture debt, less cash and cash equivalents and short-term investments
(1)
, cannot exceed 75% of equity plus non-controlling interests
|
3.39%
|
31.8%
|
|
First placement
– Tenda
|
||
|
Total accounts receivable plus inventory required to be equal to or 2.0 times over net debt less debt with secured guarantee
(3)
or below, considering that TR
(4)
plus TE
(5)
is always above zero.
|
-3.29
|
-6.50
|
|
Net debt less debt with secured guarantee
(3)
required to be in excess of 50% of equity.
|
-44.39%
|
-40.83%
|
|
Total account receivable plus unappropriated income plus total inventory of finished units required to be 1.5 times the net debt plus payable for purchase of properties plus unappropriated cost
|
6.63 times
|
2.57
times
|
|
(1)
|
Cash and cash equivalents and short-term investments refer to cash and cash equivalents and marketable securities.
|
|
(2)
|
Total receivables, whenever mentioned, refers to the amount reflected in the Balance Sheet plus the amount not shown in the Balance Sheet
|
|
(3)
|
Venture debt and general guarantee debt refer to SFH debts, defined as the sum of all disbursed borrowing contracts which funds were provided by SFH, as well as the debt related to the seventh placement.
|
|
(4)
|
Total receivables.
|
|
(5)
|
Total inventory.
|
13. Obligations assumed on the assignment of receivables
The Company’s transactions of assignment of receivables portfolio, described in Notes 5(iii) to 5(ix) are as follows:
|
2012
|
2011
|
|||||||
|
Assignment of receivables:
|
|
|||||||
|
CCI obligation Jun/09 (Note 5(iii))
|
14,666 | 24,791 | ||||||
|
CCI obligation Jun/11 (Note 5(iv))
|
78,242 | 169,793 | ||||||
|
CCI obligation Sep/11 (Note 5(v))
|
8,729 | 188,191 | ||||||
|
CCI obligation Dec/11 (Note 5(vi))
|
16,864 | 72,384 | ||||||
|
CCI obligation May/12 (Note 5(vii))
|
22,818 | - | ||||||
|
CCI obligation Jul/12 (Note 5(viii))
|
10,458 | - | ||||||
|
CCI obligation Nov/12 (Note 5(ix (a)))
|
113,462 | - | ||||||
|
CCI obligation Dec/12 (Note 5(x))
|
62,325 | - | ||||||
|
Other
|
9,216 | 46,812 | ||||||
|
|
336,780 | 501,971 | ||||||
|
|
||||||||
|
Current portion
|
175,874 | 70,745 | ||||||
|
Non-current potion
|
160,906 | 431,226 | ||||||
Regarding the above transactions, except for item (a), the assignor is required to fully formalize the guarantee instruments of receivables in favor of the assignee. Until it is fully fulfilled, these amounts will be classified into a separate account in current and non-current liabilities.
The obligation of item (a), is guaranteed by the issuance of Subordinated CRI limited to 4% of the issuance amount, not having right of recourse above this limit.
14. Payables to venture partners
|
2012
|
2011
|
|||||||
|
Payable to venture partners (a)
|
266,565 | 401,931 | ||||||
|
Usufruct of shares (b)
|
57,141 | 71,255 | ||||||
| 323,706 | 473,186 | |||||||
|
Current portion
|
161,373 | 219,796 | ||||||
|
Non-current portion
|
162,333 | 253,390 | ||||||
|
(a)
|
In January 2008, the Company formed an unincorporated venture (SCP), the main objective of which is to hold interest in other real estate development companies. As of December 31, 2012, the SCP received contributions of R$213,084 (represented by 13,084,000 Class A units of interest fully paid-in by the Company and 200,000,000 Class B units of interest from the other venture partners). The SCP will preferably use these funds to acquire equity investments and increase the capital of its investees. As a result of this operation, considering that the decision to invest or not is made jointly by all members, thus independent from the Company’s management decision, as of December 31, 2011, payables to venture partners was recognized in the amount of R$200,000 maturing on January 31, 2014. The venture partners receive an annual minimum dividend substantially equivalent to the variation in the Interbank Deposit Certificate (CDI) rate, as of December 31, 2012, the amount accrued totaled R$6,373 (R$14,963 in 2011). The SCP’s charter provides for the compliance with certain covenants by the Company, in its capacity as lead partner, which include the maintenance of minimum indices of net debt and receivables. As of December 31, 2012 and 2011, the SCP and the Company were in compliance with these clauses.
|
|
|
In April 2010, subsidiary Alphaville Urbanismo S.A. paid-in the capital of an entity, the main objective of which is the holding of interest in other companies, which shall have as main objective the development and carrying out of real estate ventures. As of December 31, 2012, this entity subscribed capital and paid-in capital reserve amounting to R$135,054 (comprising 81,719,641 common shares held by the Company and 53,333,333 preferred shares held by other shareholders). As a result of this transaction, taking into consideration the rights to which the holders of preferred shares are entitled, such as payment of fixed dividends and redemption, as of December 31, 2012, payables to investors/venture partners are recognized at R$53,333, with final maturity on March 31, 2014. The preferred shares shall pay cumulative fixed dividends, substantially equivalent to the variation of the General Market Prices Index (IGP-M) plus 7.25% p.a., as of December 31, 2012, the provisioned amount totals R$6,859 (R$6,969 in 2011). The Company’s articles of incorporation sets out that certain matters shall be submitted for approval from preferred shareholders through vote, such as the rights conferred by such shares, increase or reduction in capital, use of profits, set up and use of any profit reserve, and disposal of assets. As of December 31, 2012 and 2011, the Company is in compliance with the above-described clauses.
|
|
|
Dividend amounts are reclassified as financial expenses in the consolidated financial statements.
|
|
(b)
|
As part of the funding through issuance of Certificates of Bank Credit– CCB, described in Note 11, the Company and subsidiary AUSA entered into a paid usufruct agreement in connection with 100% of the preferred shares in SPE-89 Empreendimentos Imobiliários S.A. and Alphaville Ribeirão Preto Empreendimentos Imobiliários S.A., for a period of six years, having raised R$45,000 and R$35,000, respectively, recorded based on the effective interest method of amortization in the consolidated income statement. As of December 31, 2012, the amount of paid dividends to the holders of preferred shares through SPE-89 Empreendimentos Imobiliários S.A. and Alphaville Ribeirão Preto Empreendimentos Imobiliários S.A. amounted to R$13,400 and R$8,600, respectively.
|
|
2012
|
2011
|
|||||||||||
|
Carrying value
|
Contractual cash flows
|
Carrying value
|
||||||||||
|
2012
|
- | - | 219,796 | |||||||||
|
2013
|
161,373 | 171,145 | 126,723 | |||||||||
|
2014
|
142,713 | 154,837 | 126,667 | |||||||||
|
2015
|
11,179 | 14,700 | - | |||||||||
|
2016
|
6,388 | 8,400 | - | |||||||||
|
2017
forwards
|
2,053 | 2,700 | - | |||||||||
|
Total
|
323,706 | 351,782 | 473,186 | |||||||||
15. Other payables and provisions
|
2012
|
2011
|
|||||||
|
Acquisition of interests
|
21,680 | 20,560 | ||||||
|
Provision for penalties for delays in construction works
|
37,265 | 51,211 | ||||||
|
Payables related to cancelled contracts (b)
|
42,473 | 88,279 | ||||||
|
FIDC payable (a)
|
9,592 | 2,950 | ||||||
|
Provision for warranty
|
74,348 | 53,715 | ||||||
|
Deferred sales taxes (PIS and COFINS)
|
33,018 | 137,074 | ||||||
|
Other accounts payable
|
54,274 | 63,282 | ||||||
|
|
272,650 | 417,071 | ||||||
|
|
||||||||
|
Current portion
|
177,328 | 274,214 | ||||||
|
Non-current portion
|
95,322 | 142,857 | ||||||
|
(a)
|
Refers to the operation on assignment of receivables portfolio (see Note 5(ii))
|
|
(b)
|
Refers to a contractual percentage of the amount paid by the clients that had their contracts cancelled.
|
16. Provisions for legal claims
The Company and its subsidiaries are party to lawsuits and administrative claims at various courts and government agencies that arise from the ordinary course of business, involving tax, labor, civil lawsuits and other matters. Management, based on information provided by its legal counsel and analysis of the pending claims and, with respect to the labor claims, based on past experience regarding the amounts claimed, recognized a provision in an amount considered sufficient to cover probable losses. The Company does not expect reimbursements as an outcome from those claims.
In the year ended December 31, 2012, 2011 and 2010, changes in the provision are summarized as follows:
|
Consolidated
|
Civil claims (i)
|
Tax claims (ii)
|
Labor
claims (iii)
|
Total
|
||||||||||||
|
Balance at December 31, 2009
|
92,821 | 10,894 | 17,624 | 121,339 | ||||||||||||
|
Additional provision (Note 23)
|
18,432 | 1,869 | 16,354 | 36,655 | ||||||||||||
|
Provision utilized
|
(8,425 | ) | (655 | ) | (10,222 | ) | (19,302 | ) | ||||||||
|
Balance at December 31, 2010
|
102,828 | 12,108 | 23,756 | 138,692 | ||||||||||||
|
Additional provision (Note 23)
|
22,874 | 4,379 | 30,649 | 57,902 | ||||||||||||
|
Provision utilized
|
(11,525 | ) | (635 | ) | (14,645 | ) | (26,805 | ) | ||||||||
|
Balance at December 31, 2011
|
114,177 | 15,852 | 39,760 | 169,789 | ||||||||||||
|
Additional provision (Note 23)
|
51,696 | 837 | 42,399 | 94,932 | ||||||||||||
|
Provision utilized
|
(27,258 | ) | (2,019 | ) | (27,084 | ) | (56,361 | ) | ||||||||
|
Balance at December 31, 2012
|
138,615 | 14,670 | 55,075 | 208,360 | ||||||||||||
|
Current portion
|
39,788 | 372 | 18,410 | 58,570 | ||||||||||||
|
Non-current portion
|
98,827 | 14,298 | 36,665 | 149,790 | ||||||||||||
Due to the uncertain nature of a number of the claims, it is not possible to reliably predict the timing of the related cash outflow. Thus, the segregation between current and long term amounts is determined based on historical losses and outflows.
|
|
(a)
|
Civil, tax and labor claims
|
|
|
(i)
|
As of December 31, 2012 and 2011, provisions related to civil claims include R$69,797 and R$73,722, respectively, related to lawsuits in which the Company is included as successor in enforcement actions, in which the original debtor is a former shareholder of Gafisa, Cimob Companhia Imobili
á
ria (
“
Cimob
”
), among other companies. The plaintiff understands that the Company should be liable for the debts of Cimob. Some lawsuits, amounting to R$5,337, are backed by guarantee insurance. In addition, there are judicial deposits amounting to R$61,157, in connection with the restriction of the usage of the Gafisa
’
s bank account; and there is also the restriction referring to the use of Gafisa
’
s treasury stock to guarantee the enforcement as well (Note 18.1).
|
The Company is filing appeals against all decisions, as it considers that the inclusion of Gafisa in the claims is legally unreasonable; these appeals aim at releasing amounts and obtaining the recognition that it cannot be held liable for the debt of a company that does not have any relationship with Gafisa. The final decision on the Company’s appeal, however, cannot be predicted at present.
|
|
(ii)
|
The subsidiary AUSA is a party to legal and administrative claims related to Federal VAT (IPI) and State VAT (ICMS) on two imports of aircraft in 2001 and 2005, respectively, under leasing agreements without purchase option.
|
The likelihood of loss in the ICMS case is rated by legal counsel as (i) probable in regard to the principal and interest, and (ii) remote in regard to the fine for noncompliance with accessory liabilities. The amount of the contingency rated by legal counsel as a probable loss reaches R$12,327 is recorded at December 31, 2012 (R$11,801 in 2011).
Based on average past outcomes adjusted to current estimates, for which the Company’s management believes it is not necessary to recognize a provision for occasional losses.
|
|
(iii)
|
Environmental risk
|
There are various environmental laws at the federal, state and municipal levels. These environmental laws may result in delays for the Company in connection of adjustments for compliance and other costs, and impede or restrict ventures. Before acquiring land, the Company assesses all necessary and applicable environmental issues, including the possible existence of hazardous or toxic materials, residual substance, trees, vegetation and the proximity of the land to permanent preservation areas. Therefore, before acquiring land, the Company obtains all governmental approvals, including environmental licenses and construction permits.
In addition, the environmental legislation establishes criminal, civil and administrative sanctions to individuals and legal entities for activities considered as environmental infringements or offense. The penalties include the cessation of development activities, loss of tax benefits, confinement and fines.
|
(iv)
|
Judicial deposits
|
As of December 31, 2012, the Company and its subsidiaries have judicially deposited the amount of R$130,543 (R$108,436 in 2011) in the consolidated financial statements (Note 7) in connection with the aforementioned legal claims.
|
|
(v)
|
Lawsuits in which likelihood of loss is rated as possible
|
The Company and its subsidiaries are aware of other claims and civil, labor and tax risks at December 31, 2012, based on the assessment of the legal counsel, in which loss is possible, but not probable, in the amount of R$705,939 (R$489,549 in 2011) based on the historical average of processes, for which the Company understands that it is not appropriate to record a provision.
|
2012
|
2011
|
|||||||
|
Civil claims
|
529,000 | 346,800 | ||||||
|
Tax claims
|
53,033 | 54,284 | ||||||
|
Labor claims
|
123,906 | 88,465 | ||||||
|
|
705,939 | 489,549 | ||||||
|
|
(b)
|
Payables related to the completion of real estate ventures
|
The Company and its subsidiaries are committed to deliver real estate units that will be built in exchange for the acquired land, and to guarantee the release of financing, in addition to guarantee the installments of the financing to clients over the construction period.
The Company is also committed to complete units sold and to comply with the Laws regulating the civil construction sector, including the obtainment of licenses from the proper authorities, and compliance with the terms for starting and delivering the ventures, being subject to legal and contractual penalties.
As described in Note 4.2, at December 31, 2012, the Company and its subsidiaries have resources approved and recorded as financial investments guaranteed by temporary cash investments, lands and receivables, corresponding to 120% of remaining debt, which will be released as projects progress in the total amount of R$95,887(R$59,497 in 2011) to meet these commitments (Note 12).
|
|
(c)
|
Commitments
|
In addition to the commitments mentioned in Notes 2.1.1, 6, 11 and 12, the Company has the following other commitments:
|
|
(i)
|
As of December 31, 2012, the Company has contracts for the rental of 29 properties where its facilities are located, the monthly cost amounting to R$1,164 adjusted by the IGP-M/FGV variation. The rental term is ten years and there is a fine in case of cancelled contracts corresponding to three-month rent or in proportion to the contract expiration time (2011
–
contracts for the rental of 28 properties at a monthly cost of R$1,116).
|
|
|
(ii)
|
As of December 31, 2012, the Company, through its subsidiaries, has long-term obligations in the amount of R$163 (R$24,858 in 2011), related to the supply of the raw material used in the development of its real estate ventures.
|
17. Payables for purchase of properties and advances from customers
|
2012
|
2011
|
|||||||
|
Obligations for purchase of land
|
294,343 | 493,176 | ||||||
|
Adjustment to present value (Note 6)
|
(1,354 | ) | (4,034 | ) | ||||
|
Advances from customers
|
||||||||
|
development and sales (Note 5(i) and 29.1)
|
138,787 | 215,042 | ||||||
|
Barter transaction – land (Note 6)
|
187,041 | 83,506 | ||||||
| 618,817 | 787,690 | |||||||
|
Current portion
|
527,111 | 610,555 | ||||||
|
Non-current portion
|
91,706 | 177,135 | ||||||
18. Equity
18.1. Capital
As of December 31, 2012, the Company’s authorized and paid-in capital totaled R$2,735,794 (R$2,734,157 in 2011 and R$2,729,298 in 2010), represented by 433,229,779 (432,699,559 in 2011 and 431,515,375 in 2010) registered common shares without par value, of which 599,486 were held in treasury in order to guarantee the performance of claims (Note 16 (a)(i)).
According to the Company’s articles of incorporation, capital may be increased without need of making amendment to it, upon resolution of the Board of Directors, which shall set the conditions for issuance until the limit of 600,000,000 (six hundred million) common shares.
On February 22, 2010, the split of our common shares was approved in the ratio of one existing share to two newly-issued shares, thus increasing the number of shares from 167,077,137 to 334,154,274.
In March 2010, the Company completed an Initial Public Offering (“IPO”) of common shares, resulting in a capital increase of R$1,063,750 with the issuance of 85,100,000 common shares, comprising 46,634,420 shares in Brazil and 38,465,580 ADSs (Note 1). The expenditures with this IPO was R$33,271, net of taxes, which were recorded in equity.
On May 27, 2010, the increase in capital was approved in the amount of R$20,282 with the issuance of 9,797,792 common shares, arising from the acquisition of Shertis’ shares (Notes 2.1.1).
During 2012, 2011 and 2010, capital increase was approved by R$1,637, R$4,959 and R$17,891, respectively, related to the stock option plan and the exercise of 530,220, 1,184,184 and 2,463,309 common shares, respectively (Note 18.3.(i)).
In 2012, there was no movement in common shares held in treasury.
|
Treasury shares – 2012
|
||||||||||
|
Symbol Type
|
GFSA3 Common
|
R$
|
%
|
R$ thousand
|
R$ thousand
|
|||||
|
Acquisition date
|
Number
|
Weighted average price
|
% on shares outstanding
|
Market value(*)
|
Carrying amount
|
|||||
|
11/20/2001
|
599,486
|
2.8880
|
0.14%
|
2,824
|
1,731
|
|||||
(*) Market value calculated based on the closing share price at December 31, 2012 of R$4.71, not considering volatilities.
|
Treasury shares – 2011
|
||||||||||
|
Symbol Type
|
GFSA3 Common
|
R$
|
%
|
R$ thousand
|
R$ thousand
|
|||||
|
Acquisition date
|
Number
|
Weighted average price
|
% on shares outstanding
|
Market value(*)
|
Carrying amount
|
|||||
|
11/20/2001
|
599,486
|
2.8880
|
0.14%
|
2,470
|
1,731
|
|||||
(*) Market value calculated based on the closing share price at December 31, 2011 of R$4.12, not considering volatilities.
|
Treasury shares – 2010
|
||||||||||
|
Symbol Type
|
GFSA3 Common
|
R$
|
%
|
R$ thousand
|
R$ thousand
|
|||||
|
Acquisition date
|
Number
|
Weighted average price
|
% on shares outstanding
|
Market value(*)
|
Carrying amount
|
|||||
|
11/20/2001
|
599,486
|
2.8880
|
0.14%
|
7,218
|
1,731
|
|||||
(*) Market value calculated based on the closing share price at December 31, 2010 of R$12.04, not considering relativities.
The Company holds shares in treasury in order to guarantee the performance of claims (Note 16(a)(i)).
The change in the number of outstanding shares was as follows:
|
Common shares – in thousands
|
|||||
|
December 31, 2010
|
430,915 | ||||
|
Exercise of stock option at 2011
|
1,184 | ||||
|
|
|||||
|
December 31, 2011
|
432,099 | ||||
|
Treasury shares
|
600 | ||||
|
Authorized shares at December 31, 2011
|
432,699 | ||||
|
Exercise of stock option at 2012
|
, 530 | ||||
|
Authorized shares at December 31, 2012
|
433,229 | ||||
|
|
|||||
|
Weighted average shares outstanding
|
432,246 | ||||
18.2 Allocation of income (loss) for the year
According to the Company’s by-laws, net income for the year was allocated as follows: (i) 5% to legal reserve, reaching up to 20% of capital stock or when the legal reserve balance plus that of capital reserves is in excess of 30% of capital stock, and (ii) 25% of the remaining balance to pay mandatory dividends.
As provided for in Article 36 of the Company’s Bylaws, amended on March 21, 2007, the setting up of a statutory reserve became a requirement. Accordingly, the setting up of such reserve shall be carried out at an amount not in excess of 71.25% of net income, with the purpose of financing the expansion of the Company and its subsidiaries operations, including through subscription of capital increases or creation of new ventures, in consortia or other types of partnership in order to fulfill corporate objective.
On April 29, 2011, the distribution of declared dividends for 2010 was approved in the amount of R$98,812, which were paid on December 28, 2011. The allocation of net income for 2010 and the absorption of loss for 2011 by profit reserves, legal reserve and capital reserve were as follows:
|
2012
|
2011
|
2010
|
||||||||||
|
Net income (loss) for the year
|
(124,504 | ) | (944,868 | ) | 264,565 | |||||||
|
Retained earnings
|
- | - | - | |||||||||
|
(-) Legal reserve (5%)
|
- | 44,986 | (13,228 | ) | ||||||||
|
(-) Reserve of income
|
- | 502,418 | - | |||||||||
|
(-) Capital reserve
|
- | 295,445 | - | |||||||||
|
(-) Statutory reserve
|
- | - | (152,525 | ) | ||||||||
|
(-) Declared dividends
|
- | - | (98,812 | ) | ||||||||
|
Balance of accumulated losses
|
(124,504 | ) | (102,019 | ) | - | |||||||
On December 31,2012, the Company has recorded R$ 13,389 related to dividends payable (R$ 11,774 in 2011).
18.3 Stock option plan
Expenses for granting stocks recorded under the account “General and administrative expenses” (Note 23) in the years ended December 31 are as follows:
|
2012
|
2011
|
2010
|
||||||||||
|
Gafisa
|
18,318 | 15,429 | 8,135 | |||||||||
|
Tenda
|
580 | 2,203 | 3,820 | |||||||||
|
|
18,898 | 17,632 | 11,955 | |||||||||
|
Alphaville
|
8,741 | 1,640 | 969 | |||||||||
|
|
27,639 | 19,272 | 12,924 | |||||||||
|
|
(i)
|
Gafisa
|
The Company has a total of four active stock option programs comprising common shares, launched in 2009, 2010, 2011 and 2012, which follows the rules established in the Stock Option Plan of the Company.
The granted options entitle their holders (executives and key employees) to subscribe common shares of the Company’s capital, after periods that vary from one to five years of employment in the Company (essential condition to exercise the option), and expire ten years after the vesting date.
As of December 31, 2012, 2011 and 2010, the changes in the number of stock options and corresponding weighted average exercise prices are as follows:
|
2012
|
2011
|
2010
|
||||||||||||||||||||||
|
Number of
options
|
Weighted
average
exercise
price (Reais)
|
Number of
options
|
Weighted
average
exercise
price (Reais)
|
Number of
options
|
Weighted
average
exercise
price (Reais)
|
|||||||||||||||||||
|
Options outstanding at the beginning of the year
|
16,634,974 | 9.81 | 8,787,331 | 11.97 | 10,245,394 | 12.18 | ||||||||||||||||||
|
Transfer of options of Tenda plans
|
- | - | - | - | 2,338,380 | 4.39 | ||||||||||||||||||
|
Options granted
|
7,639,048 | 1.66 | 12,855,000 | 10.60 | 626,061 | 12.10 | ||||||||||||||||||
|
Options exercised (i) (Note 18.1)
|
(530,220 | ) | 3.09 | (1,184,184 | ) | 12.29 | (2,463,309 | ) | 8.30 | |||||||||||||||
|
Options exchanged
|
(9,264,253 | ) | 8.28 | - | - | - | - | |||||||||||||||||
|
Options expired
|
(579,774 | ) | 8.49 | (36,110 | ) | 8.12 | - | - | ||||||||||||||||
|
Options forfeited
|
(4,157,375 | ) | 7.58 | (3,787,063 | ) | 13.88 | (1,959,195 | ) | 4.54 | |||||||||||||||
|
Options outstanding at the end of the year
|
9,742,400 | 1.32 | 16,634,974 | 8.94 | 8,787,331 | 11.97 | ||||||||||||||||||
|
Options exercisable at the end of the year
|
- | - | 1,991,712 | 9.81 | 1,364,232 | 12.18 | ||||||||||||||||||
|
|
(i)
|
In the years ended December 31, 2012, 2011 and 2010, the amount received through exercised options was R$1,637, R$4,959 and R$ 17,891, respectively.
|
As of December 31, 2012, the dilution percentage of the Company was 0.89% (0.59% in 2011 and 0.74% in 2010) corresponding to an earnings
(loss) of R$(0.2880) (R$(2.2282) in 2011 and R$0.9571 in 2010).
As of December 31, 2012, the stock options outstanding and exercisable are as follows:
|
Outstanding options
|
Exercisable options
|
||||||||||||
|
Number of options
|
Weighted
average
remaining
contractual
life (years)
|
Weighted
average
exercise
price (R$)
|
Number of
options
|
Weighted
average
exercise
price (R$)
|
|||||||||
| 9,742,400 | 5.25 | 1.32 | - | - | |||||||||
During the year ended December 31, 2012, the Company granted 7,639,048 options in connection with its stock option plan comprising common shares, of which 5,628,500 refer to the substitution of 9,264,253 options of past programs (12,855,000 options granted in 2011).
The granted incremental fair value as a result of these changes is R$4,277. The fair value of the new options granted over 2012 totaled R$11,063, and they were determined based on the following assumptions:
|
2012
|
||||||||
|
Pricing model
|
Binomial
|
Monte Carlo
|
||||||
|
Exercise price of options (R$)
|
R$2.73 | R$2.73 and R$0.01 | ||||||
|
Weighted average price of options (R$)
|
R$2.73 | R$0.73 | ||||||
|
Expected volatility (%) – (*)
|
40 | % | 40 | % | ||||
|
Expected option life (years)
|
11.03 years
|
1.97 years
|
||||||
|
Dividend income (%)
|
1.90 | % | 1.90 | % | ||||
|
Risk-free interest rate (%)
|
7.85 | % | 7.85 | % | ||||
(*) The volatility was determined based on regression analysis of the ratio of the share volatility of the parent company, Gafisa S.A., to the Ibovespa index.
In the year ended December 31, 2012, the Company recognized stock option compensation expense of R$18,318 (R$15,429 in 2011 and R$8,135 in 2010), classified as operating expenses with a corresponding entry to capital reserve in equity.
|
|
(ii)
|
Tenda
|
Due to the acquisition by Gafisa of the total shares outstanding issued by Tenda, the stock option programs related to Tenda shares were transferred to Gafisa, responsible for share issuance. As of December 31, 2012, the amount of R$14,784 (R$14,203 in 2011 and R$11,989 in 2010), related to the reserve for granting options of Tenda is recognized under the account “Related Parties” of Gafisa.
As of December 31, 2012, Tenda recorded stock option programs expenses amounting to R$580 (R$2,203 in 2011 and R$3,820 in 2010).
During the years ended December 31, 2012, 2011 and 2010, the Company did not grant options in connection with its stock option plans comprising common shares.
|
|
(iii)
|
AUSA
|
The subsidiary AUSA has a total of four stock option plans in Phantom Stocks models, launched in 2007, 2008, 2010 and 2011.
The granted options entitle their holders (employees) to subscribe the preferred shares of the Company’s capital, after periods that vary from one to five years of employment in the Company (essential condition to exercise the option), and expire ten years after the grant date.
Changes in the stock options outstanding in the years ended December 31, 2012 and 2011, including the respective weighted average exercise prices are as follows:
|
2012
|
2011
|
2010
|
||||||||||||||||||||||
|
Number of
options
|
Weighted
average
exercise
price (Reais)
|
Number of
options
|
Weighted
average
exercise
price (Reais)
|
Number of
options
|
Weighted
average
exercise
price (Reais)
|
|||||||||||||||||||
|
Options outstanding at the beginning of the year
|
1,629,000 | 8.71 | 1,932,000 | 8.01 | 1,557,000 | 6.47 | ||||||||||||||||||
|
Options granted
|
- | - | 364,000 | 10.48 | 738,000 | 10.48 | ||||||||||||||||||
|
Options exercised
|
(210,000 | ) | 7.61 | (133,000 | ) | 7.81 | (46,000 | ) | 7.61 | |||||||||||||||
|
Options forfeited /sold
|
(23,000 | ) | 7.61 | (534,000 | ) | 7.61 | (317,000 | ) | 7.61 | |||||||||||||||
|
Options outstanding at the end of the year
|
1,396,000 | 7.31 | 1,629,000 | 10.48 | 1,932,000 | 8.01 | ||||||||||||||||||
The dilution percentage at December 31, 2012 was (0.50%), corresponding to earnings per share after dilution of R$1.6958 (R$1.7043 before dilution).
As of December 31, 2012, the stock options outstanding and exercisable are as follows:
|
Options outstanding
|
Exercisable options
|
||||||||||||
|
Number of Options
|
Weighted average remaining contractual life (years)
|
Weighted average
exercise price
(R$)
|
Number of Options
|
Weighted average
exercise price
(R$)
|
|||||||||
| 1,396,000 | 7.2 | 7.31 | 854,000 | 9.62 | |||||||||
During the year ended December 31, 2012, the Company did not grant options in
connection with its stock option plans comprising common shares (364,000 options granted in 2011).
The fair value of the new options granted over 2011 totaled R$1,654, and they were determined based on the following assumptions:
|
2011
|
||||
|
Pricing model
|
Binomial
|
|||
|
Exercise price of options(R$)
|
10.48 | |||
|
Weighted average price of options(R$)
|
10.48 | |||
|
Expected volatility (%) – (*)
|
40 | % | ||
|
Expected option life (years)
|
7.2 | |||
|
Dividend income (%)
|
1.90 | % | ||
|
Risk-free interest rate (%)
|
10.64 | % | ||
|
(*)
|
The volatility was determined based on regression analysis of the ratio of the share volatility of the parent company, Gafisa S.A., to the Ibovespa index.
|
AUSA recorded expenses for the stock option plan amounting to R$8,741 in the year ended December 31, 2012 (R$1,640 in 2011 and R$969 in 2010).
19. Income tax and social contribution
(i)
Current income tax and social contribution
The reconciliation of the effective tax rate for the years ended December 31, 2012, 2011 and 2010, is as follows:
|
2012
|
2011
|
2010
|
||||||||||
|
Income (loss) before income tax and social contribution
|
(35,135 | ) | (762,827 | ) | 310,612 | |||||||
|
Income tax calculated at the applicable rate – 34%
|
11,946 | 259,362 | (105,608 | ) | ||||||||
|
Net effect of subsidiaries whose taxable profit is calculated as a percentage of gross sales
|
92,581 | (97,474 | ) | 96,428 | ||||||||
|
Tax losses carryforwards
|
11,193 | 1,142 | 1,344 | |||||||||
|
Stock option plan
|
(9,398 | ) | (5,877 | ) | (4,394 | ) | ||||||
|
Other permanent differences
|
- | 993 | (2,771 | ) | ||||||||
|
Dividend paid to venture partners
|
(1,512 | ) | 14,233 | 7,638 | ||||||||
|
Deferred income tax and social contribution not recognized
|
(146,038 | ) | (314,741 | ) | (14,765 | ) | ||||||
| (41,228 | ) | (142,362 | ) | (22,128 | ) | |||||||
|
Total tax expenses current
|
(42,753 | ) | (73,207 | ) | (11,834 | ) | ||||||
|
Total tax expenses deferred
|
1,525 | (69,155 | ) | (10,294 | ) | |||||||
|
Effective tax rate
|
- | - | 7.12 | % | ||||||||
Segregation current tax – standard taxable profit regime and presumed profit regime:
|
2012
|
2011
|
2010
|
||||||||||
|
Standard taxable profit regime
|
(11,946 | ) | (11,908 | ) | (6,840 | ) | ||||||
|
Presumed profit regime
|
(30,807 | ) | (61,299 | ) | (4,994 | ) | ||||||
|
Total
|
(42,753 | ) | (73,207 | ) | (11,834 | ) | ||||||
(ii)
Deferred income tax and social contribution
The Company recognized tax assets on losses on income tax and social contribution carryforwards for prior years, which have no expiration, and for which offset is limited to 30% of annual taxable profit, to the extent the taxable profit is likely to be available for offsetting temporary differences, based on the assumptions and conditions established in the business model of the Company.
The initial recognition and subsequent estimates of deferred income tax are carried out when it is probable that a taxable profit for the following years will be available to be used to offset the deferred tax asset, based on projections of results prepared and on internal assumptions and future economic scenarios that enable its total or partial use.
In 2012, the Company has not recognized deferred income taxes assets in the amount of R$521,621 (R$343,982 in 2011) due to cumulative losses in three years ended as of December 31, 2012.
As of December 31, 2012 and 2011, deferred income tax and social contribution are from the following sources:
|
2012
|
2011
|
|||||||
|
Assets
|
||||||||
|
Provisions for legal claims
|
70,842 | 57,728 | ||||||
|
Temporary differences – PIS and COFINS
|
18,682 | 35,755 | ||||||
|
Provisions for realization of non-financial assets
|
15,902 | 31,672 | ||||||
|
Temporary differences – CPC adjustments
|
36,668 | 85,865 | ||||||
|
Other provisions
|
110,112 | 102,002 | ||||||
|
Income tax and social contribution loss carryforwards
|
327,582 | 247,872 | ||||||
|
Tax credits from downstream acquisition
|
11,799 | 8,793 | ||||||
|
Unrecognized deferred income tax and social contribution
|
(521,621 | ) | (343,982 | ) | ||||
| 69,966 | 225,705 | |||||||
|
Liabilities
|
||||||||
|
Negative goodwill
|
(96,347 | ) | (95,125 | ) | ||||
|
Temporary differences –CPC adjustments
|
(3,594 | ) | (14,862 | ) | ||||
|
Differences between income taxed on cash basis and recorded on an accrual basis
|
(51,502 | ) | (198,720 | ) | ||||
| (151,443 | ) | (308,707 | ) | |||||
|
Total net
|
(81,477 | ) | (83,002 | ) | ||||
The Company and its subsidiaries has income and social contribution tax loss carryforwards for offset limited to 30% of annual taxable profit, which have no expiration, in the following amounts:
|
2012
|
2011
|
|||||||||||||||||||||||
|
Income tax
|
Social contribution
|
Total
|
Income tax
|
Social contribution
|
Total
|
|||||||||||||||||||
|
Balance of income and social contribution tax loss carryforwards
|
958,359 | 958,359 | - | 740,667 | 740,667 | - | ||||||||||||||||||
|
Deferred tax asset (25%/9%)
|
239,590 | 86,252 | 325,842 | 185,167 | 66,660 | 251,827 | ||||||||||||||||||
|
Recognized deferred tax asset
|
22,647 | 8,153 | 30,800 | 20,116 | 7,242 | 27,358 | ||||||||||||||||||
|
Unrecognized deferred tax asset
|
216,943 | 78,099 | 295,042 | 165,051 | 59,418 | 224,469 | ||||||||||||||||||
20. Financial instruments
The Company and its subsidiaries participate in operations involving financial instruments. These instruments are managed through operational strategies and internal controls aimed at liquidity, return and safety. The use of financial instruments with objective of hedge is made through a periodical analysis of exposure to the risk that the management intends to cover (exchange, interest rate, etc) which is approved by the Board of Directors for authorization and performance of the proposed strategy. The policy on control consists of permanently following up the contracted conditions in relation to the conditions prevailing in the market. The Company and its subsidiaries do not invest for speculation in derivatives or any other risky assets. The result from these operations is consistent with the policies and strategies devised by the Company’s management. The Company’s and its subsidiaries operations are subject to the risk factors described below:
i.
Risk considerations
a)
Credit risk
The Company and its subsidiaries restrict their exposure to credit risks associated with cash and cash equivalents, investing in financial institutions considered highly rated and in short-term securities.
With regards to accounts receivable, the Company restricts its exposure to credit risks through sales to a broad base of customers and ongoing credit analysis. Additionally, there is no history of losses due to the existence of liens for the recovery of its products in the cases of default during the construction period. As of December 31, 2012 and 2011, there was no significant credit risk concentration associated with clients. The book value of financing assets represents the maximum credit risk.
b)
Derivative financial instruments
The Company adopts the policy of participating in operations involving derivative financial instruments with the objective of mitigating or eliminating currency risks, as described below:
The Company holds derivative instruments to mitigate its exposure to index and interest volatility recognized at their fair value directly as part of the year income. Pursuant to its treasury policies, the Company does not own or issue derivative financial instruments other than for hedging purposes.
As of December 31, 2012, the Company had derivative contracts for hedging purposes in relation to interest fluctuations, with final maturity in from March 2013 and June 2017. The derivative contracts are as follows:
|
Reais
|
Percentage
|
Validity
|
||||||||||||||||||
|
Gain (loss) unrealized by derivative instruments - net
|
||||||||||||||||||||
|
Companies
|
Swap agreements
(Pre for CDI)
|
Face Value
|
Original Index
|
"Swap"
|
Beginning
|
End
|
2012
|
2011
|
||||||||||||
|
Alphaville Urbanismo S/A
|
Banco Votorantim S.A.
|
90.000 |
Pré 12,1556%
|
CDI 0,31%
|
15/06/2011
|
19/12/2011
|
- | (16 | ) | |||||||||||
|
Alphaville Urbanismo S/A
|
Banco Votorantim S.A.
|
90.000 |
Pré 13,0074%
|
CDI 0,31%
|
19/12/2011
|
30/03/2012
|
- | 505 | ||||||||||||
|
Alphaville Urbanismo S/A
|
Banco Votorantim S.A.
|
90.000 |
Pré 12,3600%
|
CDI 0,31%
|
30/03/2012
|
28/09/2012
|
- | 856 | ||||||||||||
|
Alphaville Urbanismo S/A
|
Banco Votorantim S.A.
|
90.000 |
Pré 12,7901%
|
CDI 0,31%
|
28/09/2012
|
28/03/2013
|
2,198 | 815 | ||||||||||||
|
Alphaville Urbanismo S/A
|
Banco Votorantim S.A.
|
90.000 |
Pré 12,0559%
|
CDI 0,31%
|
28/03/2013
|
30/09/2013
|
1,938 | 238 | ||||||||||||
|
Alphaville Urbanismo S/A
|
Banco Votorantim S.A.
|
90.000 |
Pré 14,2511%
|
CDI 2,41%
|
30/09/2013
|
28/03/2014
|
1,641 | 117 | ||||||||||||
|
Alphaville Urbanismo S/A
|
Banco Votorantim S.A.
|
67.500 |
Pré 12,619
0
%
|
CDI 0,31%
|
28/03/2014
|
30/09/2014
|
1,123 | 251 | ||||||||||||
|
Alphaville Urbanismo S/A
|
Banco Votorantim S.A.
|
67.500 |
Pré 15,0964%
|
CDI 2,41%
|
30/09/2014
|
30/03/2015
|
923 | 297 | ||||||||||||
|
Alphaville Urbanismo S/A
|
Banco Votorantim S.A.
|
45.000 |
Pré 11,3249%
|
CDI 0,31%
|
30/03/2015
|
30/09/2015
|
332 | (54 | ) | |||||||||||
|
Alphaville Urbanismo S/A
|
Banco Votorantim S.A.
|
45.000 |
Pré 14,7577%
|
CDI 2,41%
|
30/09/2015
|
31/03/2016
|
414 | 97 | ||||||||||||
|
Alphaville Urbanismo S/A
|
Banco Votorantim S.A.
|
22.500 |
Pré 10,7711%
|
CDI 0,31%
|
31/03/2016
|
30/09/2016
|
94 | (55 | ) | |||||||||||
|
Alphaville Urbanismo S/A
|
Banco Votorantim S.A.
|
22.500 |
Pré 17,2387%
|
CDI 2,41%
|
30/09/2016
|
30/03/2017
|
436 | 266 | ||||||||||||
|
Gafisa S/A
|
Banco Votorantim S.A.
|
110.000 |
Pré 12,3450%
|
CDI 0,2801%
|
28/06/2011
|
29/12/2011
|
- | 13 | ||||||||||||
|
Gafisa S/A
|
Banco Votorantim S.A.
|
110.000 |
Pré 13,3385%
|
CDI 0,2801%
|
29/12/2011
|
20/06/2012
|
- | 1,316 | ||||||||||||
|
Gafisa S/A
|
Banco Votorantim S.A.
|
110.000 |
Pré 12,4481%
|
CDI 0,2801%
|
20/06/2012
|
20/12/2012
|
- | 1,074 | ||||||||||||
|
Gafisa S/A
|
Banco Votorantim S.A.
|
110.000 |
Pré 12,8779%
|
CDI 0,2801%
|
20/12/2012
|
20/06/2013
|
2,722 | 836 | ||||||||||||
|
Gafisa S/A
|
Banco Votorantim S.A.
|
110.000 |
Pré 12,144
0
%
|
CDI 0,2801%
|
20/06/2013
|
20/12/2013
|
2,366 | 324 | ||||||||||||
|
Gafisa S/A
|
Banco Votorantim S.A.
|
110.000 |
Pré 14,0993%
|
CDI 1,6344%
|
20/12/2013
|
20/06/2014
|
2,096 | 324 | ||||||||||||
|
Gafisa S/A
|
Banco Votorantim S.A.
|
82.500 |
Pré 11,4925%
|
CDI 0,2801%
|
20/06/2014
|
22/12/2014
|
865 | 19 | ||||||||||||
|
Gafisa S/A
|
Banco Votorantim S.A.
|
82.500 |
Pré 13,7946%
|
CDI 1,6344%
|
22/12/2014
|
22/06/2015
|
907 | 284 | ||||||||||||
|
Gafisa S/A
|
Banco Votorantim S.A.
|
55.000 |
Pré 11,8752%
|
CDI 0,2801%
|
22/06/2015
|
21/12/2015
|
492 | (64 | ) | |||||||||||
|
Gafisa S/A
|
Banco Votorantim S.A.
|
55.000 |
Pré 14,2672%
|
CDI 1,6344%
|
21/12/2015
|
20/06/2016
|
584 | 213 | ||||||||||||
|
Gafisa S/A
|
Banco Votorantim S.A.
|
27.500 |
Pré 11,1136%
|
CDI 0,2801%
|
20/06/2016
|
20/12/2016
|
170 | (45 | ) | |||||||||||
|
Gafisa S/A
|
Banco Votorantim S.A.
|
27.500 |
Pré 15,1177%
|
CDI 1,6344%
|
20/12/2016
|
20/06/2017
|
366 | 124 | ||||||||||||
| 19,667 | 7,735 | |||||||||||||||||||
|
Current portion
|
9,224 | 7,735 | ||||||||||||||||||
|
Non-current portion
|
10,443 | - | ||||||||||||||||||
During the year ended December 31, 2012, the amount of R$12,014 (R$7,735 in 2011) in the consolidated statements, which refers to net result of the interest swap transaction, was recognized in line “financial income (loss)” allowing correlation between the impact of such transactions and interest rate fluctuation on the Company’s balance sheet (Note 24).
The estimated fair value of derivative financial instruments contracted by the Company was determined based on information available in the market and specific evaluation methodologies. However, considerable judgment was necessary for interpreting market data to produce the estimated fair value of each transaction. Accordingly, the estimates above do not necessarily indicate the actual amounts to be realized upon the financial settlement of transactions.
c)
Interest rate risk
It arises from the possibility that the Company and its subsidiaries earn gains or incur losses because of fluctuations in the interest rates of its financial assets and liabilities. Aiming to mitigate this kind of risk, the Company and its subsidiaries seek to diversify funding in terms of fixed and floating rates. The interest rates on loans, financing and debentures are disclosed in Notes 11 and 12. The interest rates contracted on financial investments are disclosed in Note 4. Accounts receivable from real estate units delivered, as disclosed in Note 5, are subject to annual interest rate of 12%, appropriated on pro rata basis.
d)
Liquidity risk
The liquidity risk consists of the possibility that the Company and its subsidiaries do not have sufficient funds to meet their commitments in view of settlement terms of their rights and obligations.
To mitigate the liquidity risks, and the optimization of the weighted average cost of capital, the Company and its subsidiaries permanently monitor the indebtedness levels according to the market standards and the fulfillment of covenants provided for in loan, financing and debenture agreements, in order to guarantee that the operating-cash generation and the advance funding, when necessary, are sufficient to maintain the schedule of commitments, not posing liquidity risk to the Company or its subsidiaries (Notes 11 and 12).
The maturities of financial instruments, loans, financing, suppliers and debentures are as follows:
|
Year ended December 31, 2012
|
Less than
1 year
|
1 to 3 years
|
4 to 5 years
|
More than
5 years
|
Total
|
|||||||||||||||
|
Loans and financing (Note 11)
|
812,483 | 1,176,313 | 191,647 | - | 2,180,443 | |||||||||||||||
|
Debentures (Note 12)
|
346,360 | 1,029,281 | 356,642 | 3,620 | 1,735,903 | |||||||||||||||
|
Payables to venture partners (Note 14)
|
161,373 | 153,892 | 8,441 | - | 323,706 | |||||||||||||||
|
Payables for goods and service suppliers
|
167,008 | - | - | - | 167,008 | |||||||||||||||
| 1,487,224 | 2,359,486 | 556,730 | 3,620 | 4,407,060 | ||||||||||||||||
|
Year ended December 31, 2011
|
Less than
1 year
|
1 to 3 years
|
4 to 5 years
|
More than
5 years
|
Total
|
|||||||||||||||
|
Loans and financing (Note 11)
|
1,135,543 | 437,232 | 283,835 | - | 1,856,610 | |||||||||||||||
|
Debentures (Note 12)
|
1,899,200 | - | - | - | 1,899,200 | |||||||||||||||
|
Payables to venture partners (Note 14)
|
219,796 | 233,771 | 19,619 | - | 473,186 | |||||||||||||||
|
Payables for goods and service suppliers
|
135,720 | - | - | - | 135,720 | |||||||||||||||
| 3,390,259 | 671,003 | 303,454 | - | 4,364,716 | ||||||||||||||||
e)
Fair value classification
The Company uses the following classification to determine and disclose the fair value of financial instruments by the valuation technique:
Level 1: quoted prices (without adjustments) in active markets for identical assets or liabilities;
Level 2: other techniques for which all data that may have a significant effect on the recognized fair value are observable, direct or indirectly.
Level 3: techniques that use data which has significant effect on the recognized fair value, not based on observable market data.
The classification level of fair value for financial instruments measured at fair value through profit or loss of the Company, presented in the financial statements for the year ended December 31, 2012 and 2011, is as follows:
|
Fair value classification
|
||||||||||||
|
As of December 31, 2012
|
Level 1
|
Level 2
|
Level 3
|
|||||||||
|
Financial assets
|
|
|
|
|||||||||
|
Cash equivalents (Note 4.1)
|
- | 375,064 | - | |||||||||
|
Short-term investments (Note 4.2)
|
- | 1,054,151 | - | |||||||||
|
Derivatives financial instruments (Note 20(i)(b))
|
- | 19,667 | - | |||||||||
|
Trade accounts receivable, net (Note 5)
|
- | 3,891,506 | - | |||||||||
|
Fair value classification
|
||||||||||||
|
As of December 31, 2011
|
Level 1
|
Level 2
|
Level 3
|
|||||||||
|
Financial assets
|
|
|
|
|||||||||
|
Cash equivalents (Note 4.1)
|
- | 50,970 | - | |||||||||
|
Short-term investments (Note 4.2)
|
- | 846,062 | - | |||||||||
|
Derivatives financial instruments (Note 20(i)(b))
|
- | 7,735 | - | |||||||||
|
Trade accounts receivable, net (Note 5)
|
- | 4,826,448 | - | |||||||||
In the years ended December 31, 2012 and 2011, there were not any transfers between the levels 1 and 2 fair value valuation, nor transfers between levels 3 and 2 fair value valuation. As permitted by CPC 37, the Company did not disclose any comparative information on fair value classification or liquidity disclosures.
Additionally, we present the fair value hierarchy for financial instruments liabilities:
|
Fair value classification
|
||||||||||||
|
As of December 31, 2012
|
Level 1
|
Level 2
|
Level 3
|
|||||||||
|
Financial liabilities
|
|
|
|
|||||||||
|
Loans and financing (Note 20.ii.a)
|
- | 2,272,776 | - | |||||||||
|
Debentures (Note 20.ii.a)
|
- | 1,799,105 | - | |||||||||
|
Payables to venture partners (Note 20.ii.a)
|
- | 353,970 | - | |||||||||
|
Payables for materials and service suppliers
|
- | 167,008 | - | |||||||||
|
Fair value classification
|
||||||||||||
|
As of December 31, 2011
|
Level 1
|
Level 2
|
Level 3
|
|||||||||
|
Financial liabilities
|
||||||||||||
|
Loans and financing (Note 20.ii.a)
|
- | 1,860,995 | - | |||||||||
|
Debentures (Note 20.ii.a)
|
- | 1,907,463 | - | |||||||||
|
Payables to venture partners (Note 20.ii.a)
|
- | 473,186 | - | |||||||||
|
Payables for materials and service suppliers
|
- | 135,720 | - | |||||||||
ii.
Fair value of financial instruments
a)
Fair value measurement
The following estimate fair values were determined using available market information and proper measurement methodologies. However, considerable judgment is necessary to interpret market information and estimate fair value. Accordingly, the estimates presented in this document are not necessarily indicative of amounts that the Company could realize in the current market. The use of different market assumptions and/or estimates methodology may have a significant effect on estimated fair values.
The following methods and assumptions were used in order to estimate the fair value for each financial instrument type for which the estimate of values is practicable. The amounts of cash and cash equivalents, short-term investments, accounts receivable and other receivables and suppliers, and other current liabilities approximate their fair values, recorded in the financial statements.
See below the main carrying amounts and fair values of financial assets and liabilities at December 31, 2012 and 2011:
|
2012
|
2011
|
|||||||||||||||
|
Carrying amount
|
Fair value
|
Carrying amount
|
Fair value
|
|||||||||||||
|
Financial assets:
|
|
|||||||||||||||
|
Cash and cash equivalents (Note 4.1)
|
627,137 | 627,137 | 137,598 | 137,598 | ||||||||||||
|
Short-term investments (Note 4.2)
|
1,054,151 | 1,054,151 | 846,062 | 846,062 | ||||||||||||
|
Financial derivative instruments (Note 20 (i) (b))
|
19,667 | 19,667 | 7,335 | 7,335 | ||||||||||||
|
Trade account receivable,
net
(Note 5)
|
3,891,506 | 3,891,506 | 4,826,448 | 4,826,448 | ||||||||||||
|
|
||||||||||||||||
|
Financial liabilities:
|
||||||||||||||||
|
Loans and financing (Note 11)
|
2,180,443 | 2,272,776 | 1,856,610 | 1,860,995 | ||||||||||||
|
Debentures (Note 12)
|
1,735,903 | 1,799,105 | 1,899,200 | 1,907,463 | ||||||||||||
|
Payables to venture partners (Note 14)
|
323,706 | 353,970 | 473,186 | 473,186 | ||||||||||||
|
Payables for materials and service suppliers
|
167,008 | 167,008 | 135,720 | 135,720 | ||||||||||||
b)
Risk of debt acceleration
As of December 31, 2011, the Company has loans and financing in effect, with restrictive covenants related to cash generation, indebtedness ratio and other. These restrictive covenants have been complied with by the Company and do not limit its ability to conduct its business as usual. As mentioned in Notes 10 and 11, in view of the cross restrictive covenants and the non-compliance with the covenants of the Fifth and Seventh Placement of Gafisa and the First Placement of Tenda, the non-current portions of all debenture placements and some CCB issues were fully reclassified into short term. No financial penalty (fine) was imposed or change in the interest rate was made at the renegotiation of covenants, as mentioned in Note 12. As of December 31, 2012, the Company was in compliance with the covenants of all loans and debentures.
c)
Market risk
The Company carries out the development, construction and sales of real estate ventures. In addition to the risks that affect the real estate market as a whole, such as supply disruptions and volatility in the prices of construction materials and equipment, changes in the supply and demand for ventures in certain regions, strikes and environmental rules and zoning, the Company’s operations are particularly affected by the following risks:
|
·
|
The state of the economy of Brazil, which may inhibit the development of the real estate industry as a whole, through the slowdown in economy, increase in interest rates, fluctuation of currency and political instability, besides other factors.
|
|
·
|
Impediment in the future, as a result of a new regulation or market conditions, to adjust for inflation receivables using certain inflation indexes, as currently permitted, which could make a venture financially or economically unviable;
|
|
·
|
The level of interest of buyers in a new venture launched or the sale price per unit necessary to sell all units may be below expectations, making the venture less profitable than expected.
|
|
·
|
In the event of bankruptcy or significant financial difficulties of a large company of the real estate industry, the industry as a whole may be adversely affected, which could decrease the customer confidence in other companies operating in the industry.
|
|
·
|
Local and regional real estate market conditions, such as oversupply, land shortage or significant increase in land acquisition cost.
|
|
·
|
Risk of buyers having a negative perception of the security, convenience and activities of the Company’s properties, as well as about their location.
|
|
·
|
The Company’s profit margins may be affected by the increase in operating costs, including investments, insurance premium, real estate taxes and government rates.
|
|
·
|
The opportunities for development may decrease.
|
|
·
|
The building and sale of real estate units may not be completed as scheduled, thus increasing the construction costs or cancelled contracts of sale contracts.
|
|
·
|
Delinquency after the delivery of units acquired on credit. The Company has the right to file a collection action to receive the amounts due and/or repossess the real estate unit from the delinquent buyer, not being possible to guarantee that it will be able to recover the total amount of the debt balance or, once the real estate unit is repossessed, its sale in satisfactory conditions.
|
|
·
|
Occasional change in the policies of the National Monetary Council (CMN) on the investment of funds in the National Housing System (SFH) may reduce the supply of financing to customers.
|
|
·
|
Drop in the market value of land held in inventory, before the development of a real estate venture to which it was intended, and the incapacity to maintain the margins that were previously projected for such developments.
|
iii.
Capital stock management
The objective of the Company’s capital stock management is to guarantee that a strong credit rating is maintained in institutions and an optimum capital ratio, in order to support the Company’s businesses and maximize the value to shareholders.
The Company controls its capital structure making adjustments to the current economic conditions. In order to maintain its structure adjusted, the Company may pay dividends, return on capital to shareholders raise new loans, issue debentures.
There were no changes in objectives, policies or procedures during the years ended December 31, 2012 and 2011.
The Company included in its net debt structure: loans and financing, debentures and obligations to venture partners less cash and cash equivalents and marketable securities (cash and cash equivalents and short-investments):
|
2012
|
2011
|
|||||||
|
Loans and financing (Note 11)
|
2,180,443 | 1,856,610 | ||||||
|
Debentures (Note 12)
|
1,735,903 | 1,899,200 | ||||||
|
Obligation assumed on assignment of receivables (Note 13)
|
336,780 | 501,971 | ||||||
|
Payables to venture partners (Note 14)
|
323,706 | 473,186 | ||||||
|
(-)Cash and cash equivalents and short-term investments (Notes 4.1 and 4.2)
|
(1,681,288 | ) | (983,660 | ) | ||||
|
Net debt
|
2,895,544 | 3,747,307 | ||||||
|
Equity
|
2,692,367 | 2,747,094 | ||||||
|
Equity and net debt
|
5,587,911 | 6,494,401 | ||||||
iv.
Sensitivity analysis
The chart below shows the sensitivity analysis of financial instruments describing the risks that may incur material losses to the Company, considering the most probable scenario (scenario I), according to the assessment made by the Company. In addition, two other scenarios are described as provided for by CVM, through Rule No. 475/08, in order to show a deterioration of 25% and 50% in the risk variable considered, respectively (scenarios II and III).
At December 31, 2012, the Company has the following financial instruments:
|
|
a)
|
Financial investments, loans and financing, and debentures linked to the Interbank Deposit Certificates (CDI);
|
|
|
b)
|
Loans and financing and debentures linked to the Referential Rate (TR) and CDI, and debentures indexed to the CDI, National Consumer Price Index – Extended (IPCA) and TR;
|
|
|
c)
|
Trade accounts receivable and properties for sale, linked to the National Civil Construction Index (INCC) and General Market Prices Index (IGP-M).
|
To the sensitivity analysis of the interest rates of investments, loans and accounts receivables, the Company considered the CDI rate at 6.94%, the TR at 0.00% and the INCC rate at 7.12%, IGP-M rate at 7.81% and IPCA rate at 5.84%.
The scenarios considered were as follows:
Scenario I: Probable – management considered a 50% increase in the variables used for pricing
Scenario II: Possible – 25% increase/decrease in the risk variables used for pricing
Scenario III: Remote – 50% decrease in the risk variables used for pricing
The chart below shows the sensitivity analysis of financial instruments describing the risks that may incur material losses to the Company, considering the most probable scenario (scenario I), according to the assessment made by the Management. In addition, two other scenarios are described as provided for by CVM, through Rule No. 475/08, in order to show a deterioration of 25% and 50% in the risk variable considered, respectively (scenarios II and III).
|
At December 31, 2012:
|
Scenario
|
|||||||||||||||||
|
Expected
|
I |
II
|
III
|
|||||||||||||||
|
Instrument
|
Risk
|
Increase 50%
|
Increase 25%
|
Decrease 25%
|
Decrease 50%
|
|||||||||||||
|
Short-term investments
|
Increase/Decrease of CDI
|
36,787 | 18,394 | (18,394 | ) | (36,787 | ) | |||||||||||
|
Loans and financing
|
Increase/Decrease of CDI
|
(36,373 | ) | (18,186 | ) | 18,186 | 36,373 | |||||||||||
|
Debentures
|
Increase/Decrease of CDI
|
(18,158 | ) | (9,079 | ) | 9,079 | 18,158 | |||||||||||
|
Obligations to investors
|
Increase/Decrease of CDI
|
(6,700 | ) | (3,350 | ) | 3,350 | 6,700 | |||||||||||
|
Financial derivative
|
Increase/Decrease of CDI
|
(24,394 | ) | (11,607 | ) | 16,898 | 32,823 | |||||||||||
|
Net effect of CDI variation
|
|
(48,838 | ) | (23,828 | ) | 29,119 | 57,267 | |||||||||||
|
|
|
|||||||||||||||||
|
Loans and financing
|
Increase/Decrease of TR
|
- | - | - | - | |||||||||||||
|
Debentures
|
Increase/Decrease of TR
|
- | - | - | - | |||||||||||||
|
Net effect of TR variation
|
|
- | - | - | - | |||||||||||||
|
|
|
|||||||||||||||||
|
Loans and financing
|
Increase/Decrease of IPCA
|
(370 | ) | (185 | ) | 185 | 370 | |||||||||||
|
Net effect of IPCA variation
|
|
(370 | ) | (185 | ) | 185 | 370 | |||||||||||
|
|
|
|||||||||||||||||
|
Accounts receivable
|
Increase/Decrease of INCC
|
202,674 | 101,337 | (101,337 | ) | (202,674 | ) | |||||||||||
|
Properties for sale
|
Increase/Decrease of INCC
|
71,532 | 35,766 | (35,766 | ) | (71,532 | ) | |||||||||||
|
Net effect of INCC variation
|
|
274,206 | 137,103 | (137,103 | ) | (274,206 | ) | |||||||||||
|
|
|
|||||||||||||||||
|
Accounts receivable
|
Increase/Decrease of IGP-M
|
66,359 | 33,180 | (33,180 | ) | (66,359 | ) | |||||||||||
|
Obligations to investors
|
Increase/Decrease of IGP-M
|
(2,181 | ) | (1,090 | ) | 1,090 | 2,181 | |||||||||||
|
Net effect of IGP-M variation
|
|
(64,178 | ) | (32,090 | ) | 32,090 | 64,178 | |||||||||||
|
At December 31, 2011:
|
Scenario
|
|||||||||||||||||
|
Expected
|
I |
II
|
III
|
|||||||||||||||
|
Instrument
|
Risk
|
Increase 50%
|
Increase 25%
|
Decrease 25%
|
Decrease 50%
|
|||||||||||||
|
Short-term investments
|
Increase/Decrease of CDI
|
28,366 | 14,183 | (14,183 | ) | (28,366 | ) | |||||||||||
|
Loans and financing
|
Increase/Decrease of CDI
|
(48,302 | ) | (24,151 | ) | 24,151 | 48,302 | |||||||||||
|
Debentures
|
Increase/Decrease of CDI
|
(32,279 | ) | (16,140 | ) | 16,140 | 32,279 | |||||||||||
|
Payables to partners
|
Increase/Decrease of CDI
|
(15,123 | ) | (7,562 | ) | 7,562 | 15,123 | |||||||||||
|
SWAP
|
Increase/Decrease of CDI
|
(16,135 | ) | (8,538 | ) | 9,613 | 20,503 | |||||||||||
|
Net effect of CDI variation
|
|
(83,473 | ) | (42,208 | ) | 43,283 | 87,841 | |||||||||||
|
|
|
|||||||||||||||||
|
Loans and financing
|
Increase/Decrease of TR
|
(3,915 | ) | (1,958 | ) | 1,958 | 3,915 | |||||||||||
|
Debentures
|
Increase/Decrease of TR
|
(7,051 | ) | (3,526 | ) | 3,526 | 7,051 | |||||||||||
|
Net effect of TR variation
|
|
(10,966 | ) | (5,484 | ) | 5,484 | 10,966 | |||||||||||
|
|
|
|||||||||||||||||
|
Loans and financing
|
Increase/Decrease of IPCA
|
(318 | ) | (159 | ) | 159 | 318 | |||||||||||
|
Net effect of IPCA variation
|
|
(318 | ) | (159 | ) | 159 | 318 | |||||||||||
|
|
|
|||||||||||||||||
|
Trade accounts receivable
|
Increase/Decrease of INCC
|
164,861 | 82,430 | (82,430 | ) | (164,861 | ) | |||||||||||
|
Inventory
|
Increase/Decrease of INCC
|
75,018 | 37,509 | (37,509 | ) | (75,018 | ) | |||||||||||
|
Assignment of receivables
|
Increase/Decrease of INCC
|
(5,964 | ) | (2,982 | ) | 2,982 | 5,964 | |||||||||||
|
Net effect of INCC variation
|
|
233,915 | 116,957 | (116,957 | ) | (233,915 | ) | |||||||||||
|
|
|
|||||||||||||||||
|
Assignment of receivables
|
Increase/Decrease of IGP-M
|
(4,984 | ) | (2,492 | ) | 2,492 | 4,984 | |||||||||||
|
Net effect of IGP-M variation
|
|
(4,984 | ) | (2,492 | ) | 2,492 | 4,984 | |||||||||||
v.
Embedded derivative
The purchase agreement includes an obligation for the Company to purchase in 2012 the remaining 20% of AUSA’s ordinary shares which are held by non-controlling interest shareholders. The purchase price will be based on the fair value of the shares and will be settled in cash or shares, at the Company’s sole discretion. There is an embedded derivative component to the shareholders’ agreement, relating to the obligation to purchase additional AUSA shares. As the fair value of this embedded derivative for all reporting periods has no significant value, since the future settlement of the derivative will be based on the fair value of AUSA’s capital stock, no derivative asset or liability has been recorded. The future settlement in cash, or shares represented an estimated amount of R$358,985 as at December 31, 2012 and 2011.
21. Related parties
21.1 Balances with related parties
The balances between parent and jointly-controlled companies are realized under conditions and prices established between the parties.
|
Current account
|
2012
|
2011
|
||||||
|
Assets
|
|
|||||||
|
Current account (c):
|
|
|||||||
|
Total SPEs
|
115,258 | 50,694 | ||||||
|
Condominium and consortia (b) and
Thirty party’s works (a)
|
73,559 | 33,513 | ||||||
|
Loan receivable (d)
|
76,002 | 104,059 | ||||||
|
|
264,819 | 188,266 | ||||||
|
|
||||||||
|
Current portion
|
188,817 | 84,207 | ||||||
|
Non-current portion
|
76,002 | 104,059 | ||||||
|
|
||||||||
|
Liabilities
|
||||||||
|
Current account (c):
|
||||||||
|
Condominium and consortia (b)
|
- | (30,717 | ) | |||||
|
Purchase/sale of interests
|
(36,172 | ) | (25,000 | ) | ||||
|
Total SPEs
|
(39,390 | ) | (42,220 | ) | ||||
|
|
(75,562 | ) | (97,937 | ) | ||||
|
|
||||||||
|
Current portion
|
(75,562 | ) | (97,937 | ) | ||||
|
Non-current portion
|
- | - | ||||||
|
(a)
|
Refers to operations in third-party’s works.
|
|
(b)
|
Refers to transactions between the consortium leader and partners and condominiums.
|
|
(c)
|
The Company participates in the development of real estate ventures with other partners, directly or through related parties, based on the formation of condominiums and/or consortia. The management structure of these enterprises and the cash management are centralized in the lead partner of the enterprise, which manages the construction schedule and budgets. Thus, the lead partner ensures that the investments of the necessary funds are made and allocated as planned. The sources and use of resources of the venture are reflected in these balances, observing the respective interest of each investor, which are not subject to indexation or financial charges and do not have a fixed maturity date. Such transactions aim at simplifying business relations that demand the joint management of amounts reciprocally owed by the involved parties and, consequently, the control over the change of amounts reciprocally granted which offset against each other at the time the current account is closed. The average term for the development and completion of the projects in which the resources are invested is between 24 and 30 months. The Company receives a compensation for the management of these ventures.
|
|
(d)
|
The loans of the Company and its subsidiaries, shown below, are made because these subsidiaries need cash for carrying out their respective activities, being subject to the respective financial charges. It shall be noted that the Company’s operations and businesses with related parties follow the market practices (arm’s length). The businesses and operations with related parties are carried out based on conditions that are strictly on arm’s length transaction basis and appropriate, in order to protect the interests of the both parties involved in the business. The composition and nature of the loan receivable by the Company is shown below.
|
|
2012
|
2011
|
Nature
|
Interest rate
|
|||||
|
Laguna Di Mare - Tembok Planej. e Desenv. Imob. Ltda.
|
7,108
|
9,389
|
Construction
|
12% p.a. fixed rate + IGPM
|
||||
|
Vistta Laguna - Tembok Planej. e Desenv. Imob. Ltda.
|
15,330
|
7,276
|
Construction
|
12% p.a. fixed rate + IGPM
|
||||
|
Gafisa SPE 65 Emp. Imobiliários Ltda.
|
2,605
|
1,636
|
Construction
|
3% p.a. fixed rate + CDI
|
||||
|
Gafisa SPE-46 Emp. Imobiliários Ltda.
|
884
|
860
|
Construction
|
12% p.a. fixed rate + IGPM
|
||||
|
Gafisa SPE-73 Emp. Imobiliários Ltda.
|
-
|
3,443
|
Construction
|
12% p.a. fixed rate + IGPM
|
||||
|
Gafisa SPE-71 Emp. Imobiliários Ltda.
|
4,992
|
2,119
|
Construction
|
3% p.a. fixed rate + CDI
|
||||
|
Gafisa SPE- 76 Emp. Imobiliários Ltda.
|
3,435
|
11
|
Construction
|
4% p.a. fixed rate + CDI
|
||||
|
Acquarelle - Civilcorp Incorporações Ltda.
|
-
|
946
|
Construction
|
12% p.a. fixed rate + IGPM
|
||||
|
Manhattan Residencial I
|
-
|
29,541
|
Construction
|
10% p.a. fixed rate + TR
|
||||
|
Manhattan Comercial I
|
-
|
2,622
|
Construction
|
10% p.a. fixed rate + TR
|
||||
|
Manhattan Residencial II
|
-
|
113
|
Construction
|
10% p.a. fixed rate + TR
|
||||
|
Manhattan Comercial II
|
-
|
54
|
Construction
|
10% p.a. fixed rate + TR
|
||||
|
Target
|
-
|
1,056
|
Construction
|
12% p.a. fixed rate + IGPM
|
||||
|
Scena Laguna - Tembok Planej. E Desenv. Imob. Ltda.
|
894
|
-
|
Construction
|
12% p.a. fixed rate + IGPM
|
||||
|
Fit Jardim Botanico SPE Emp. Imob. Ltda
|
17,190
|
16,429
|
Construction
|
113.5% of 126.5% of CDI
|
||||
|
Fit 09 SPE Emp. Imob. Ltda
|
6,354
|
5,585
|
Construction
|
120% of 126.5% of CDI
|
||||
|
Fit 08 SPE Emp. Imob. Ltda
|
-
|
875
|
Construction
|
110.65% of 126.5% of CDI
|
||||
|
Fit 19 SPE Emp. Imob. Ltda
|
3,977
|
3,977
|
Construction
|
113.5% of 126.5% of CDI
|
||||
|
Acedio SPE Emp. Imob. Ltda.
|
3,224
|
2,908
|
Construction
|
113.5% of 126.5% of CDI
|
||||
|
Ac Participações Ltda.
|
3,264
|
1,251
|
Construction
|
12% p.a. fixed rate + IGPM
|
||||
|
Jardins da Barra Desenv. Imob. Ltda.
|
4,771
|
4,800
|
Construction
|
6% p.a. fixed rate
|
||||
|
Fit Roland Garros Emp. Imob. Ltda.
|
-
|
4,461
|
Construction
|
-
|
||||
|
Other
|
1,974
|
4,707
|
-
|
Several
|
||||
|
Total consolidated
|
76,002
|
104,059
|
Construction
|
|
In the year ended December 31, 2012 the recognized financial income from interest on loans amounted to R$3,137 (R$7,667 in 2011 and R$3,074 in 2010) (Note 24).
Information regarding management transactions and compensation is described in Note 25.
21.2 Endorsements, guarantees and guarantees
The financial transactions of the wholly-owned subsidiaries or special purpose entities of the Company have the endorsement or surety in proportion to the interest of the Company in the capital stock of such companies, except certain specific cases in which the Company provide guaranties for its partners in the amount of R$2,341,658 as of December 31, 2012 (R$1,486,326 in 2011).
22. Net operating revenue
|
2012
|
2011
|
2010
|
||||||||||
|
Gross operating revenue
|
|
|||||||||||
|
Real estate development, sale and barter transactions
|
3,992,209 | 3,456,604 | 3,858,519 | |||||||||
|
(Recognition) Reversal of allowance for doubtful accounts and provision for cancelled contracts (Note 5.i)
|
252,993 | (287,112 | ) | (182,832 | ) | |||||||
|
Taxes
|
(291,920 | ) | (228,986 | ) | (272,637 | ) | ||||||
|
Net operating revenue
|
3,953,282 | 2,940,506 | 3,403,050 | |||||||||
23. Costs and expenses by nature
These are represented by the following:
|
2012
|
2011
|
2010
|
||||||||||
|
Cost of real estate development and sale:
|
||||||||||||
|
Construction cost
|
(1,878,800 | ) | (2,291,389 | ) | (2,089,774 | ) | ||||||
|
Land cost
|
(456,995 | ) | (283,867 | ) | (324,813 | ) | ||||||
|
Development cost
|
(147,615 | ) | (119,935 | ) | (66,101 | ) | ||||||
|
Capitalized financial charges (Note 11)
|
(183,113 | ) | (163,578 | ) | (138,996 | ) | ||||||
|
Maintenance / warranty
|
(61,264 | ) | (39,625 | ) | (14,869 | ) | ||||||
|
Provision for cancelled contracts (Note 5.i)
|
(213,238 | ) | 220,056 | 173,635 | ||||||||
| (2,941,025 | ) | (2,678,338 | ) | (2,460,918 | ) | |||||||
|
Commercial expenses:
|
||||||||||||
|
Marketing expenses
|
(168,611 | ) | (179,709 | ) | (124,103 | ) | ||||||
|
Brokerage and sale commission
|
(104,428 | ) | (157,762 | ) | (95,549 | ) | ||||||
|
Institutional marketing expenses
|
(14,915 | ) | (25,023 | ) | (16,923 | ) | ||||||
|
Customer Relationship Management expenses
|
(13,558 | ) | (22,748 | ) | (13,162 | ) | ||||||
|
Other
|
(6,821 | ) | (7,939 | ) | (16,923 | ) | ||||||
| (308,333 | ) | (393,181 | ) | (266,660 | ) | |||||||
|
General and administrative expenses:
|
||||||||||||
|
Salaries and payroll charges
|
(137,175 | ) | (126,635 | ) | (110,282 | ) | ||||||
|
Employee benefits
|
(11,575 | ) | (11,404 | ) | (9,931 | ) | ||||||
|
Travel and utilities
|
(10,853 | ) | (11,115 | ) | (9,680 | ) | ||||||
|
Services
|
(40,268 | ) | (16,947 | ) | (14,759 | ) | ||||||
|
Rents and condominium fees
|
(12,957 | ) | (12,182 | ) | (10,609 | ) | ||||||
|
IT
|
(14,575 | ) | (12,787 | ) | (11,136 | ) | ||||||
|
Organizational development
|
(7,215 | ) | (7,288 | ) | (6,347 | ) | ||||||
|
Stock option plan (Note 18.3)
|
(27,639 | ) | (19,272 | ) | (12,924 | ) | ||||||
|
Reserve for profit sharing (Note 25 (iii))
|
(64,011 | ) | (17,196 | ) | (36,612 | ) | ||||||
|
Other
|
(20,425 | ) | (16,632 | ) | (14,474 | ) | ||||||
| (346,693 | ) | (251,458 | ) | (236,754 | ) | |||||||
|
Other income / (expenses), net
|
||||||||||||
|
Provision for legal claims (Note 16)
|
(94,932 | ) | (57,902 | ) | (36,655 | ) | ||||||
|
Other
|
(2,910 | ) | 23,362 | 24,482 | ||||||||
| (97,842 | ) | (34,540 | ) | (12,173 | ) | |||||||
24. Financial expenses, net
|
2012
|
2011
|
2010
|
||||||||||
|
Financial income
|
||||||||||||
|
Income from financial investments
|
50,873 | 62,724 | 107,225 | |||||||||
|
Financial income on loan with related parties (Note 21.1)
|
3,137 | 7,667 | 3,074 | |||||||||
|
Other interest income
|
3,375 | 15,289 | 7,009 | |||||||||
|
Other financial income
|
23,244 | 7,293 | 10,777 | |||||||||
|
|
80,629 | 92,973 | 128,085 | |||||||||
|
Financial expenses
|
||||||||||||
|
Interest on funding, net of capitalization (Note 11)
|
(167,289 | ) | (149,274 | ) | (149,056 | ) | ||||||
|
Amortization of debenture cost
|
(3,684 | ) | (3,348 | ) | (6,560 | ) | ||||||
|
Interest on payables to venture partners
|
(23,846 | ) | (42,088 | ) | (29,432 | ) | ||||||
|
Banking expenses
|
(18,853 | ) | (13,108 | ) | (10,441 | ) | ||||||
|
Derivative transactions (Note 20 (i) (b))
|
12,014 | 7,735 | - | |||||||||
|
Discount on securitization transaction
|
(47,559 | ) | (11,169 | ) | - | |||||||
|
Discounts and other financial expenses
|
(38,352 | ) | (41,624 | ) | (14,713 | ) | ||||||
|
|
(287,569 | ) | (252,876 | ) | (210,202 | ) | ||||||
25. Transactions with management and employees
(i)
Management compensation
The amounts recorded in the account “General and administrative expenses” in the years ended December 31, 2012, 2011 e 2010 related to the compensation of the Company’s key management personnel are as follows:
|
Total
|
||||||||||||||||||||
|
Statutory Board
|
Board of Directors
|
2012
|
2011
|
2010
|
||||||||||||||||
|
Number of members
|
6 | 9 | 15 | 14 | 11 | |||||||||||||||
|
Annual fixed compensation (in R$)
|
3,924 | 1,791 | 5,715 | 4,970 | 3,912 | |||||||||||||||
|
Salary / Fees
|
3,710 | 1,772 | 5,482 | 4,767 | 3,722 | |||||||||||||||
|
Direct and indirect benefits
|
214 | 19 | 233 | 203 | 190 | |||||||||||||||
|
Variable compensation (in R$)
|
- | - | - | - | 5,250 | |||||||||||||||
|
Bonus
|
- | - | - | - | 5,250 | |||||||||||||||
|
Share-based payment
|
- | - | - | - | 3,787 | |||||||||||||||
|
Monthly compensation (in R$)
|
149 | 302 | 451 | 414 | 1,079 | |||||||||||||||
|
Total compensation
|
3,924 | 1,791 | 5,715 | 4,970 | 12,949 | |||||||||||||||
|
Fiscal Council
|
||||||||||||
|
2012
|
2011
|
2010
|
||||||||||
|
Number of members
|
3 | 3 | 3 | |||||||||
|
Annual fixed compensation (in R$)
|
138 | 137 | 137 | |||||||||
|
Salary / Fees
|
138 | 137 | 137 | |||||||||
|
Monthly compensation (in R$)
|
11 | 11 | 11 | |||||||||
|
Total compensation
|
138 | 137 | 137 | |||||||||
The annual aggregate amount to be distributed among the Company’s key management personnel for 2012, as fixed and variable compensation is R$17,285 according to the Annual Shareholders’ Meeting held on May 11, 2012.
(ii)
Sales
As of December 31, 2012, the total sales of units sold to the management is R$3,817 (R$3,165 in 2011 and R$3,673 in 2010), and total receivables is R$5,471 (R$4,668 in 2011 and R$9,842 in 2010).
(iii)
Profit sharing
The Company has a profit sharing plan that entitles its employees and those of its subsidiaries to participate in the distribution of profits of the Company.
This plan is tied to the achievement of specific targets, established, agreed-upon and approved by the Board of Directors at the beginning of each year.
The recognition of the provision for the Company bonus for 2012 takes into consideration a set of targets, among which are two mandatory metrics: (1) operating cash generation and (2) indebtedness ratio (net debt + payables to venture partners) / (equity). Accordingly, as of December 31, 2012, the Company recorded a provision for profit sharing amounting to R$64,011 in the consolidated statement (R$17,196 in 2011 related to the subsidiary AUSA and (R$ 36,612 in 2010) under the account “General and Administrative Expenses” (Note 23).
Of this amount, R$10,603 refers to expenses for profit sharing of the statutory boards and Directors of the Company. In 2011, the metrics used to recognize the provision for bonus were different, and these were only attained by the subsidiary AUSA.
As shown in the previous tables and paragraphs, the aggregate compensation of Management and Fiscal Council members of the Company is according to the limit approved at the Annual Shareholders’ Meeting, held on May 11, 2012, corresponding to R$17,285.
26. Insurance
Gafisa S.A. and its subsidiaries maintain insurance policies against engineering risk, barter guarantee, guarantee for the completion of the work and civil liability related to unintentional personal damages caused to third parties and material damages to tangible assets, as well as against fire hazards, lightning strikes, electrical damages, natural disasters and gas explosion. The contracted coverage is considered sufficient by management to cover possible risks involving its assets and/or responsibilities.
The assumptions adopted, given their nature, are not included in the scope of the audit of financial statements. Accordingly, they were not audited by our independent public accountants.
27. Earnings (loss) per share
In accordance with CPC 41, the Company shall present basic and diluted earnings per share. The comparison data of basic and diluted earnings per share shall be based on the weighted average number of shares outstanding for the year, and all dilutive potential shares outstanding for each year presented, respectively.
Diluted earnings per share is computed similarly to basic earnings per share except that the outstanding shares are increased to include the number of additional shares that would have been outstanding if the potential dilutive shares attributable to stock options and redeemable noncontrolling interest (see Note 2.1.1. Information regarding subsidiary - AUSA) had been issued during the respective periods, utilizing the weighted average stock price.
As mentioned in Note 1, on February 22, 2010, the split of our common shares was approved at the ratio of one share to two new shares issued, increasing the number of shares to 334,154,274 from 167,077,137. All information related to the number of shares was retrospectively adjusted in order to reflect the split of shares of February 22, 2010.
The following table shows the calculation of basic and diluted earnings (loss) per share. In view of the loss for the year, according to CPC 41, shares with dilutive potential are not considered when there is a loss, because the impact would be antidilutive.
|
2012
|
2011
|
2010
|
||||||||||
|
Basic numerator
|
|
|||||||||||
|
Declared dividends
|
- | - | 98,812 | |||||||||
|
Undistributed earnings (loss)
|
(124,504 | ) | (944,868 | ) | 165,753 | |||||||
|
Undistributed earnings (loss), available for the holders of common shares
|
(124,504 | ) | (944,868 | ) | 264,565 | |||||||
|
|
||||||||||||
|
Basic denominator (in thousands of shares)
|
||||||||||||
|
Weighted average number of shares (i)
|
432,246 | 431,586 | 412,434 | |||||||||
|
|
||||||||||||
|
Basic earnings (loss) per shares – R$
|
(0.288 | ) | (2.189 | ) | 0.641 | |||||||
|
|
||||||||||||
|
Diluted numerator
|
||||||||||||
|
Declared dividends
|
- | - | 98,812 | |||||||||
|
Undistributed earnings (loss)
|
(124,504 | ) | (944,868 | ) | 165,753 | |||||||
|
|
||||||||||||
|
Undistributed earnings (loss), available for the holders of common shares
|
(124,504 | ) | (944,868 | ) | 264,565 | |||||||
|
Diluted denominator (in thousands of shares)
|
||||||||||||
|
Weighted average number of shares (i)
|
432,246 | 431,586 | 412,434 | |||||||||
|
Stock options
|
3,868 | 2,566 | 3,198 | |||||||||
|
Non-controlling interest shares
|
70,252 | 70,252 | 17,465 | |||||||||
|
Antidilutive effect
|
(74,120 | ) | (72,818 | ) | - | |||||||
|
Weighted average number of shares (i)
|
432,246 | 431,586 | 433,097 | |||||||||
|
Diluted earnings per share – R$
|
(0.288 | ) | (2.189 | ) | 0.610 | |||||||
28. Segment information
Starting in 2007, following the respective acquisition, formation and merger of AUSA, FIT Residencial, Bairro Novo and Tenda, the Company’s management assesses segment information on the basis of different business segments and economic data rather than based on the geographical regions of operations.
The Company operates in the following segments: Gafisa for ventures targeted at high and medium income; Alphaville for land subdivision; and Tenda for ventures targeted at low income.
The Company’s chief executive officer, who is responsible for allocating resources to businesses and monitoring their progresses, uses economic present value data, which is derived from a combination of historical and forecasted operating results. The Company provides below a measure of historical profit or loss, segment assets and other related information for each reporting segment.
This information is gathered internally in the Company and used by management to develop economic present value estimates, provided to the chief executive officer for making operating decisions, including the allocation of resources to operating segments. The information is derived from the statutory accounting records which are maintained in accordance with the accounting practices adopted in Brazil. The reporting segments analyze operating expenses, total assets and depreciation. No revenues from an individual client represented more than 10% of net sales and/or services.
|
Gafisa S.A. (i)
|
Tenda
|
AUSA
|
2012
|
|||||||||||||
|
Net operating revenue
|
2,018,100 | 1,125,670 | 809,512 | 3,953,282 | ||||||||||||
|
Operating costs
|
(1,572,948 | ) | (977,472 | ) | (390,605 | ) | (2,941,025 | ) | ||||||||
|
|
||||||||||||||||
|
Gross profit
|
445,152 | 148,198 | 418,907 | 1,012,257 | ||||||||||||
|
|
||||||||||||||||
|
Depreciation and amortization
|
(69,155 | ) | (16,167 | ) | (2,262 | ) | (87,584 | ) | ||||||||
|
Financial expenses
|
(203,024 | ) | (33,680 | ) | (50,865 | ) | (287,569 | ) | ||||||||
|
Financial income
|
31,856 | 36,903 | 11,870 | 80,629 | ||||||||||||
|
Tax expenses
|
(20,695 | ) | (5,748 | ) | (14,785 | ) | (41,228 | ) | ||||||||
|
|
||||||||||||||||
|
Net income (loss) for the year
|
(158,915 | ) | (122,857 | ) | 157,268 | (124,504 | ) | |||||||||
|
|
||||||||||||||||
|
Customers (short and long term)
|
2,068,157 | 1,111,185 | 712,164 | 3,891,506 | ||||||||||||
|
Inventories (short and long term)
|
1,309,990 | 856,461 | 294,232 | 2,460,683 | ||||||||||||
|
Other assets
|
959,243 | 1,357,140 | 402,422 | 2,718,805 | ||||||||||||
|
|
||||||||||||||||
|
Total assets
|
4,337,390 | 3,324,786 | 1,408,818 | 9,070,994 | ||||||||||||
|
|
||||||||||||||||
|
Total liabilities
|
4,043,879 | 1,477,912 | 856,836 | 6,378,627 | ||||||||||||
|
Gafisa S.A. (i)
|
Tenda
|
AUSA
|
2011
|
|||||||||||||
|
Net operating revenue
|
1,821,925 | 445,982 | 672,599 | 2,940,506 | ||||||||||||
|
Operating costs
|
(1,601,727 | ) | (725,459 | ) | (351,152 | ) | (2,678,338 | ) | ||||||||
|
|
||||||||||||||||
|
Gross profit (loss)
|
220,198 | (279,477 | ) | 321,447 | 262,168 | |||||||||||
|
|
||||||||||||||||
|
Depreciation and amortization
|
(67,653 | ) | (14,444 | ) | (1,331 | ) | (83,428 | ) | ||||||||
|
Financial expenses
|
(206,638 | ) | (13,147 | ) | (33,091 | ) | (252,876 | ) | ||||||||
|
Financial income
|
51,986 | 28,804 | 12,183 | 92,973 | ||||||||||||
|
Tax expenses
|
(78,409 | ) | (39,339 | ) | (24,614 | ) | (142,362 | ) | ||||||||
|
|
||||||||||||||||
|
Net income (loss) for the year
|
(413,727 | ) | (660,058 | ) | 128,917 | (944,868 | ) | |||||||||
|
Gafisa S.A. (i)
|
Tenda
|
AUSA
|
2011
|
|||||||||||||
|
Customers (short and long term)
|
2,793,045 | 1,476,882 | 556,521 | 4,826,448 | ||||||||||||
|
Inventories (short and long term)
|
1,420,194 | 1,188,319 | 238,777 | 2,847,290 | ||||||||||||
|
Other assets
|
851,265 | 813,610 | 168,011 | 1,832,886 | ||||||||||||
|
Total assets
|
5,064,504 | 3,478,811 | 963,309 | 9,506,624 | ||||||||||||
|
Total liabilities
|
4,166,655 | 1,949,379 | 643,456 | 6,759,530 | ||||||||||||
|
Gafisa S.A. (i)
|
Tenda
|
AUSA
|
2010
|
|||||||||||||
|
Net operating revenue
|
1,894,498 | 1,061,588 | 446,964 | 3,403,050 | ||||||||||||
|
Operating cost
|
(1,477,751 | ) | (731,991 | ) | (251,176 | ) | (2,460,918 | ) | ||||||||
|
|
||||||||||||||||
|
Gross profit
|
416,747 | 329,597 | 195,788 | 942,132 | ||||||||||||
|
|
||||||||||||||||
|
Depreciation and amortization
|
(19,224 | ) | (13,588 | ) | (1,004 | ) | (33,816 | ) | ||||||||
|
Financial expenses
|
(146,539 | ) | (40,159 | ) | (23,504 | ) | (210,202 | ) | ||||||||
|
Financial income
|
106,869 | 12,542 | 8,674 | 128,085 | ||||||||||||
|
Tax expenses
|
(13,084 | ) | 5,982 | (15,026 | ) | (22,128 | ) | |||||||||
|
|
||||||||||||||||
|
Net income for the year
|
116,824 | 82,495 | 65,246 | 264,565 | ||||||||||||
|
|
||||||||||||||||
|
Customers (short and long term)
|
2,752,589 | 1,835,541 | 363,844 | 4,951,974 | ||||||||||||
|
Inventories (short and long term)
|
1,323,170 | 695,663 | 187,239 | 2,206,072 | ||||||||||||
|
Other assets
|
1,241,859 | 524,045 | 116,841 | 1,882,745 | ||||||||||||
|
|
||||||||||||||||
|
Total assets
|
5,317,618 | 3,055,249 | 667,924 | 9,040,791 | ||||||||||||
|
|
||||||||||||||||
|
Total liabilities
|
3,556,134 | 1,386,320 | 466,165 | 5,408,619 | ||||||||||||
|
(i)
|
Includes all direct subsidiaries, except for Tenda and AUSA.;
|
29. Real estate properties under construction – information and commitments
In order to enhance its notes and in line with items 20 and 21 of ICPC 02, the Company describes below some information on properties under construction as of December 31, 2012:
|
29.1
|
The contracted revenue deducted from the appropriated sales revenue is the unappropriated revenue (net revenue calculated by the continuous transfer approach, according to OCPC 04). The unappropriated revenue of properties under construction plus the accounts receivable of completed properties plus the advance from clients less cumulative receipts, comprise the receivables from developments, as follows:
|
|
Properties under construction:
|
||||
|
Contracted revenue (*)
|
7,683,127 | |||
|
Appropriated revenue (A) (**)
|
(4,005,101 | ) | ||
|
Unappropriated revenue – external properties management (*)
|
46,709 | |||
|
Unappropriated revenue (B) (*)
|
3,724,735 | |||
|
Completed properties (C)
|
2,411,174 | |||
|
Cumulative receipts (D) (**)
|
(2,342,920 | ) | ||
|
Advances from clients
|
||||
|
Appropriated revenue surplus (Note 17) (E)
|
138,787 | |||
|
Total accounts receivable from developments (Note 5)
(-A+C+D+E)
|
4,212,142 | |||
(*)Information used to determine the appropriateness of the revenue recorded under the percentage-of-completion method (PoC).
(**) Amounts stated cumulatively. Accordingly, they do not reflect the impacts on the statement of operations for the year.
The information on unappropriated revenue and contracted revenue do not include properties that are subject to restriction due to a suspensive clause, the legal period of 180 days in which the Company can cancel a development and therefore is not appropriated to the result.
The real estate development revenue from units sold and under construction of real estate development is appropriated to statement of operations over the construction period of properties, in compliance with the requirements of item 14 of CPC 30 – Revenue. The procedures adopted in the appropriation to statement of operations over the construction period are described in Note 2 – Presentation of Financial Statements and summary of significant accounting practices.
|
29.2
|
As of December 31, 2012, the total cost incurred and to be incurred in connection with units sold or in inventory, estimated until the completion of properties under construction, is as follows:
|
|
Properties under construction:
|
||||
|
Incurred cost of units in inventory, net of provision (Note 6)
|
928,773 | |||
|
Estimated cost to be incurred with units in inventory (*)
|
1,284,071 | |||
|
Total estimated cost incurred and to be incurred with units in inventory
(a)
(F)
|
2,212,844 | |||
|
Estimated cost of units sold (*) (G)
|
5,255,068 | |||
|
Incurred cost of units sold (H) (**)
|
(3,059,114 | ) | ||
|
Unappropriated estimated cost of units sold (*) (I)
|
2,195,954 | |||
|
Total cost incurred and to be incurred (F+G)
|
7,467,912 | |||
(a) The amount of R$591,877 refers to units of cancelled developments not yet cancelled with the respective customers.
(*)Information used to determine the appropriateness of the revenue recorded under the percentage-of-completion method (PoC).
(**)Amounts stated cumulatively. Accordingly, they do not reflect the impacts on the statement of operations for the year.
|
29.3
|
As of December 31, 2012, the estimated income to be earned until the completion of properties under construction in connection with units sold is as follows:
|
|
Unappropriated revenue (B)
|
3,724,735 | |||
|
Unappropriated barter for land
|
51,478 | |||
| 3,776,213 | ||||
|
Unappropriated cost of units sold (I)
|
(2,195,954 | ) | ||
|
Estimated gross profit
|
1,580,259 |
Information used to determine the appropriateness of the revenue recorded under the percentage-of-completion method (PoC).
The estimated gross profit shown does not consider the tax effects or the present value adjustment, and the costs of lands, financial charges and guarantees, which will be carried out as at the extent they are realized.
|
29.4
|
As of December 31, 2012, the retained profit of properties under construction in connection with units sold is as follows:
|
|
Appropriated revenue (A) (**)
|
4,005,101 | |||
|
Appropriated barter for land (**)
|
277,505 | |||
| 4,282,606 | ||||
|
Incurred cost of units sold (H) (**)
|
(3,059,114 | ) | ||
|
Gross profit (**)
|
1,223,492 |
(**)Amounts stated cumulatively. Accordingly, they do not reflect the impacts on the statement of operations for the year.
The above gross profit do not include the impact of taxes and present value adjustment (“AVP”).
|
29.5
|
The Company shows below a table of the percentage of asset related to the Company’s properties in comparison with total assets, as of December 31, 2012.
|
|
2012
|
||||
|
Total assets related to the Company’s properties (*)
|
9,061,725 | |||
|
Total consolidated assets
|
9,070,994 | |||
|
Percentage
|
99.90 | % | ||
(*) Total assets of the Company, except for the subsidiary Gafisa Vendas, a company that sells the properties of Gafisa.
|
30.
|
Communication with regulatory bodies
|
On June 14, 2012, the Company received a subpoena from the Securities Exchange Commission’s Division of Enforcement related to the Matter of Certain 20-F Filer Home Builders listed at SEC, Foreign Private Issuers (FPI). The subpoena requests that the Company produces all documents from January 1, 2010 to the Company’s reply date related to the preparation of our financial statements, including, among other things, copies of our financial policies and procedures, board and audit committee and operations committee minutes, monthly closing reports and financial packages, any documents relating to possible financial or accounting irregularities or improprieties and internal audit reports. The SEC’s investigation is a non-public, fact-finding inquiry and is not clear what action, if any, the SEC intends to take with respect to the information it gathers. The SEC subpoena does not specify any charges. The Company has already submitted all the information requested by SEC, which as of the publication of these financial statements has not issued any opinion.
On July 31, 2012, the Company received the CVM/SEP/GEA-5/ Letter No. 208/2012, requesting information related to criteria for measurement and recognition of revenue and enhancement in the disclosure of some notes to information, as mentioned in Notes 2 and 29. The Company has already provided all information requested by the CVM. In addition, on February 19, 2013, the Company received the CVM/SEP/GEA-5/ Letter No. 040/2013 recommending the enhancement of its Notes to the consolidated financial statements regarding the percentage of assets by venture that is included in the structures of equity segregation of the purchase, and this additional disclosure was included in Note 29.
|
31.
|
Analysis of strategic options for AUSA
|
On September 10, 2012, the Company released a material fact announcing that it had begun an analysis of strategic options for the AUSA segment in order to maximize shareholders value. The process to capture this value may involve Alphaville’s going public, the sale of a stake in the company or even maintenance of its current condition. Gafisa hired a financial and strategic advisor for analysis of available options for the business considering the best interest of its shareholders and will inform the market as soon as a decision on this matter is made.
|
32.
|
Supplemental Information - Summary of Principal Differences between Brazilian GAAP and US GAAP for the years ended December 31, 2012, 2011 and 2010
|
(a) Description of the GAAP differences
The Company’s accounting policies comply with, and its consolidated financial statements are prepared in accordance with Brazilian GAAP.
A summary of the Company’s principal accounting policies under Brazilian GAAP that differ significantly from US GAAP is set forth below.
Principles of consolidation
Under Brazilian GAAP, the consolidated financial statements include the accounts of Gafisa S.A. and those of all its subsidiaries as mentioned in Note 2. The proportional consolidation method is used for investments in jointly-controlled investees, which are all governed by shareholders’ agreements; accordingly, the assets, liabilities, revenues and costs are consolidated based on the proportion of the equity interest held in the capital of the corresponding investee.
Under US GAAP, because such investments provide substantive participating rights granted to the noncontrolling shareholder, they preclude the Company from consolidating the entities. Accordingly, for purposes of US GAAP these investments are accounted for on the equity method of accounting.
Under US GAAP, proportional consolidation is permitted only in limited circumstances, including for the construction sector. Accordingly, for purposes of US GAAP the remaining investments are accounted for on the equity method of accounting. Although these differences in GAAP do not affect the Company’s net income (loss) or shareholders’ equity, the line items in the consolidated balance sheet and statement of income are affected.
(i) Revenue recognition
Under Brazilian GAAP, real estate development and retail land sales revenues, costs and related expenses are recognized using the percentage-of-completion method of accounting, by project measuring progress towards completion in terms of actual costs incurred versus total budgeted expenditures for each stage of a development. Land is treated as a portion of budgeted construction costs and is appropriated proportionally to each real estate development. Under the percentage-of-completion method of accounting, revenues for work completed are recognized prior to receipt of actual cash proceeds or vice-versa. Revenues starts to be recognized under the percentage-of-completion, when the Company is no longer able to cancel the launched project, after the sales period established by law.
Under US GAAP for sale of individual units in a building the Company follows the guidance of ASC 360-20-40-50 to recognize the sale by the percentage-of-completion method, only when the individual units in condominium projects are sold separately and all the following criteria are met:
a. Construction is beyond a preliminary stage: Construction is not beyond a preliminary stage if engineering and design work, execution of construction contracts, site clearance and preparation, excavation, and completion of the building foundation are incomplete.
b. The buyer is committed to the extent of being unable to require a refund except for non delivery of the unit.
c. Sufficient units have already been sold to assure that the entire property will not revert to rental property.
d. Sales prices are collectible.
e. Aggregate sales proceeds and costs can be reasonably estimated.
Collectability of the sales price is demonstrated by the buyer’s commitment to pay for the property, and there is a reasonable likelihood that the Company will collect the receivable which in turn is supported by substantial initial and continuing investments. When determining if the buyer’s initial and continuing investments are adequate, the potentially refundable amount, through judicial or other means, is considered determined based on contractual termination clauses, is excluded, pursuant to U.S. GAAP
ASC 360.20.40, This standard requires amounts potentially refundable to a customer to be excluded from the initial and continuing investment test required by ASC 306.20.20, applicable prospectively as from January 1, 2008.
Under US GAAP for retail land sales of lots that are subdivisions of large tracts of land the Company recognize the sale by the percentage-of-completion method following ASC 976 605-25-4 and 25-6 – Retail Land, which criteria are as follows:
|
a.
|
The period of cancellation with refund has expired;
|
|
b.
|
Cumulative payments equal or exceed 10 percent;
|
|
c.
|
Receivables are collectible;
|
|
d.
|
Receivables are not subject to subordination;
|
|
e.
|
There has been progress on improvements. The project’s improvements have progressed beyond preliminary stages, and there are indications that the work will be completed according to plan;
|
|
f.
|
Development is practical. There is a reasonable expectation that the land can be developed for the purposes represented and the properties will be useful for those purposes at the end of the normal payment period.
|
Additionally, as part of the analysis of this adjustment, the Company also determined the effect over the minority interest from their consolidated subsidiaries. The reclassification to the minority interest for this adjustment was R$16,545, R$11,894 and R$2,704 for the years ended December 31, 2012, 2011 and 2010, respectively.
The Company also determined the effect for their investments in affiliates that are recognized trough the equity method under US GAAP. This reclassification resulted in R$(48,198) in 2012 (R$(1,512) in 2011) as a consequence of the increased affiliated entities in 2012 and 2011 that are recognized trough the equity method.
(ii) Stock option plan
Under Brazilian GAAP, the rights to acquire shares granted to employees and executive officers under the stock options programs were recorded as an expense as from January 1, 2006, the transition date for the adoption of Law 11638/2007. Previously, under Brazilian GAAP, stock option programs did not result in any expense being recorded. The purchase of the stock by the employees is recorded as an increase in capital stock for the amount of the purchase price. Under Law 11638/2007 and the accounting guidance provided by CPC No. 10, the stock option programs are treated as equity awards and measured at fair value at the grant date, no further adjustments are made at the balance sheet dates to reflect changes in fair values.
Under US GAAP, beginning in 2006, the Company adopted the new US GAAP standard for Share-based Payment. Until December 31, 2011, as the awards were indexed to the IGP-M plus annual interest of 3%, the employee share options have been accounted for as liability awards under the terms of US GAAP. The liability-classified awards were remeasured at fair value through the statement of operations at each reporting period until settlement. Remeasurement of liability awards could either result in the recognition of additional, or the reversal of compensation expense. The fair value of employee share options and similar instruments is estimated using the Black-Scholes option-pricing model for the years ended December 31, 2008 and 2007, and thereafter using the Binomial and Monte Carlo models. As of December 31, 2012, there are no differences between Brazilian GAAP and US GAAP, as the awards are no longer indexed to the IGP-M and annual interest.
For purposes of the US GAAP net income (loss) and equity reconciliations, stock option compensation expenses of R$7,804, R$23,750 and R$10,106 for the years ended December 31, 2012, 2011 and 2010, respectively, comprised of (i) a reversal of stock option expenses recognized under Brazilian GAAP of R$19,272 and R$12,924 for the years ended December 31, 2011 and 2010, respectively; and (ii) recording of stock option compensation income (expense) under US GAAP of R$7,804, R$4,478 and R$(2,818) for the years ended December 31, 2012, 2011 and 2010, respectively. A reduction of equity of R$7,804 and R$12,272 was recorded at December 31, 2011 and 2010.
(iii) Earnings (loss) per share
Under US GAAP, the presentation of earnings (loss) per share is required for public companies, including earnings (loss) per share from continuing operations and net income (loss) per share on the face of the statement of income (loss), and the per share effect of changes in accounting principles, discontinued operations and extraordinary items either on the face of the income statement or in a note. A dual presentation is required: basic and diluted. Computations of basic and diluted earnings per share data should be based on the weighted average number of shares outstanding during the period and all dilutive potential shares outstanding during each period presented, respectively. There is no difference between Brazilian GAAP and US GAAP.
In addition, considering the Company has the option to settle the future purchase of the AUSA non-controlling interest in shares there is a potential dilutive effect on earnings per shares. For earnings per share calculation the company includes 100% of its share in the income or loss of AUSA, which affects the numerator. Also the denominator was affected by the increase in weighted numbers per share, incorporating the number of shares necessary to purchase the AUSA non-controlling interest dilutive. The impact of these potential shares was not reflected for 2009, as the impact would be anti-dilutive. See for the impact of dilutive effect on the earnings per share calculation, the column “adjustment due to dilutive effect AUSA” in the tables below.
On February 22, 2010, a stock split of our common shares was approved, giving effect to the split of one existing share into two new issued shares, increasing the number of then outstanding shares from 167,077,137 to 334,154,274. As required by BR and US GAAP and, all information relating to the numbers of shares and ADSs have been adjusted retroactively to reflect the stock split on February 22, 2010.
The Company has issued employee stock options (Note 18.3), the dilutive effects of which are reflected in diluted earnings per share by application of the “treasury stock method”. Under the treasury stock method, earnings per share are calculated as if options were exercised at the beginning of the period, or at time of issuance, if later, and as if the funds received were used to purchase the Company’s own stock. When the stock options’ exercise price was greater than the average market price of shares, diluted earnings per share are not affected by the stock options. Under US GAAP, potentially dilutive securities are not considered in periods where there is a loss as the impact would be anti-dilutive. For the years ended December 31, 2012, 2011 and 2010 potentially dilutive stock options were not considered.
The table below presents the determination of net income available (loss) allocated to Common shareholders and weighted average Common shares outstanding used to calculate basic and diluted earnings (loss) per share.
|
2012
|
2011
|
2010
|
||||||||||
|
Basic numerator
|
||||||||||||
|
Declared dividends
|
- | - | 98,812 | |||||||||
|
U.S. GAAP undistributed loss
|
(121,203 | ) | (755,769 | ) | (193,595 | ) | ||||||
|
Allocated U.S. GAAP undistributed loss available for Common shareholders
|
(121,203 | ) | (755,769 | ) | (94,783 | ) | ||||||
|
Basic denominator (in thousands of shares)
|
||||||||||||
|
Weighted-average number of shares (i)
|
432,246 | 431,586 | 412,434 | |||||||||
|
Basic loss per share – U.S. GAAP - R$
|
(0.2804 | ) | (1.7511 | ) | (0.2298 | ) | ||||||
|
2012
|
2011
|
2010
|
||||||||||
|
Diluted numerator
|
||||||||||||
|
Dividends proposed
|
- | - | 98,812 | |||||||||
|
U.S. GAAP undistributed loss
|
(121,203 | ) | (755,769 | ) | (193,595 | ) | ||||||
|
Allocated U.S. GAAP undistributed loss available for Common shareholders
|
(121,203 | ) | (755,769 | ) | (94,783 | ) | ||||||
|
2012
|
2011
|
2010
|
||||||||||
|
Diluted denominator (in thousands of shares)
|
||||||||||||
|
Weighted-average number of shares (i)
|
432,246 | 431,586 | 412,434 | |||||||||
|
Stock options
|
3,868 | 2,566 | 3,198 | |||||||||
|
Non-controlling interest shares
|
70,252 | 70,252 | 17,465 | |||||||||
|
Antidilutive effect
|
(74,120 | ) | (72,818 | ) | (20,663 | ) | ||||||
|
Diluted weighted-average number of shares
|
432,246 | 431,586 | 412,434 | |||||||||
|
Diluted loss per share – U.S. GAAP - R$
|
(0.2804 | ) | (1.7511 | ) | (0.2298 | ) | ||||||
|
(i)
|
All share amounts have been adjusted retrospectively to reflect the 1:2 stock split approved by the shareholders’ meeting on February 22, 2010.
|
(iv) Business combinations
Up until December 31, 2008, under Brazilian GAAP, goodwill arose from the difference between the amount paid and the Brazilian GAAP book value (normally also the tax basis) of the net assets acquired. This goodwill was normally attributed to the difference between the book value and the market value of assets acquired or justified based on expectation of future profitability and is amortized over the remaining useful lives of the assets or up to ten years. Effective January 1, 2009, goodwill is no longer amortized under Brazilian GAAP and also, no accounting differences for new acquisitions exist, when comparing new Brazilian GAAP and US GAAP. Negative goodwill arises under Brazilian GAAP when the book value of assets acquired exceeds the purchase consideration; negative goodwill is not generally amortized but is realized upon disposal of the investment, except when it is based on future results. For US GAAP purpose, when a business combination process generates negative goodwill, this amount is allocated first to non-current assets acquired and any remaining amount is recognized as an extraordinary gain. Additionally, investments in affiliates, including the corresponding goodwill on the acquisition of such affiliates are tested, at least, annually for impairment.
Under US GAAP, fair values are assigned to acquired assets and liabilities in business combinations, including identifiable assets. Any residual amount is allocated to goodwill. Goodwill is not amortized but, instead, is assigned to an entity’s reporting unit and tested for impairment at least annually. The differences in relation to Brazilian GAAP arise principally from the measurement of the consideration paid under US GAAP using the fair value of shares and put options issued, and the effects of amortization which are not recorded for US GAAP purposes (goodwill amortization is also no longer recorded for Brazilian GAAP purposes effective January 1, 2009).
For Brazilian GAAP purposes, the net balance of goodwill at December 31, 2012 was R$171,423 (2011 - R$183,113 and 2010 – R$193,543), which was being amortized to income over a period of up to 10 years until December 31, 2008.
For US GAAP purposes, the total net balance of goodwill at December 31, 2012 was R$39,469 and R$62,536 in 2011 and 2010. Decrease, due to the recognition of impairment (write-off) of CIPESA goodwill was recognized.
(a) Tenda transaction
Under Brazilian GAAP, the acquisition was consummated on October 21, 2008. As part of the acquisition of a controlling interest in Tenda, the Company contributed the net assets of FIT Residencial amounting to R$411,241, acquiring 60% of the shareholders’ equity of Tenda (book value of the 60% interest representing an investment in net assets of R$621,643), which had a total shareholders’ equity book value of R$1,036,072.
Under Brazilian GAAP, the sale of the 40% ownership interest in FIT Residencial to Tenda shareholders in exchange for the Tenda shares generated negative goodwill of R$210,402, reflecting the gain on the sale of the interest in FIT Residencial. From October 22 to December 31, 2008 under Brazilian GAAP, the Company amortized the total amount of R$210,402 of the negative goodwill, represented by the gain on the partial sale of Fit Residencial, as required by the adoption of the new CPC’s.
Under US GAAP, the Company recorded the transfer of Fit Residencial as a partial sale to the noncontrolling shareholders of Tenda and a gain of R$205,527 was recorded in the net income for the year ended December 31, 2008. The recognition of gain upon exchange of 40% ownership interest in FIT Residencial for 60% ownership interest in Tenda is presented as follows:
|
Tenda purchase consideration
|
367,703 | |||
|
FIT Residencial US GAAP book value (40%)
|
(162,176 | ) | ||
|
|
205,527 |
Under US GAAP, the total cost of the acquisition has been allocated to the assets acquired and the liabilities assumed based on their respective fair values. Acquired intangible assets include, R$73,038 assigned to existing development contracts, which are amortized in straight-line over the estimated useful lives up to 5 years. For the years ended December 31, 2012, 2011 and 2010, the amount of R$11,851 were amortized per year. At December 31, 2012, accumulated amortization was R$49,740, and the remaining net book value of R$23,298 will be amortized ratably through October 2014. And R$54,741 was assigned to registered trademarks, which were determined to have indefinite useful lives, and are not amortized, but are tested for impairment at least annually.
The fair value allocation on the assets acquired and liabilities assumed at the acquisition date are as follows:
|
Fair value
|
||||||||
|
At 100%
|
At 60%
|
|||||||
|
Current assets
|
539,741 | 323,845 | ||||||
|
Long-term receivables
|
252,453 | 151,472 | ||||||
|
Properties for sale - non current
|
174,168 | 104,501 | ||||||
|
Intangible assets
|
42,449 | 25,469 | ||||||
|
Other assets
|
101,191 | 60,714 | ||||||
|
|
||||||||
|
Total assets acquired
|
1,110,002 | 666,001 | ||||||
|
|
||||||||
|
Total liabilities assumed
|
(497,164 | ) | (298,298 | ) | ||||
|
|
||||||||
|
Net assets acquired
|
612,838 | 367,703 | ||||||
On December 31, 2009, the shareholders of Gafisa and Tenda approved the merger by Gafisa of total outstanding shares issued by Tenda. Because of the merger, Tenda became a wholly-owned subsidiary of Gafisa on this date.
(b) AUSA transaction
On October 2, 2006, the Company signed an agreement to acquire 100% of the capital of AUSA, a company which develops and sells residential lots throughout Brazil. This transaction was consummated on January 8, 2007 and it was approved by the Brazilian anti-trust authority (CADE) on June 18, 2007, without any restriction. The Company initially acquired 60% of Alphaville’s shares for R$198,400, of which R$20,000 was paid in cash and the remaining R$178,400 in the Company’s own shares. In connection with the acquisition, the Company issued 6,358,616 new Common shares with a book value of R$134,029, which were contributed in full settlement of the amount due in shares as part of the purchase consideration. For purpose of determining the purchase consideration, the fair value of these shares was based on the average BM&FBOVESPA quoted stock price over a thirty day period prior to the date the agreement was signed.
The Company reevaluated the AUSA purchase contract and determined that the non-controlling interest was redeemable. The non-controlling interest is redeemable in two blocks of 20% of the shares in 2010 and 2012. The company has the option to redeem the non-controlling interest either in shares or in cash. This redeemable non-controlling interest falls within the scope of ASC 480-10-S99-3A and is recorded as mezzanine equity. The initial recognition should be its issuance date fair value, with a corresponding entry in retained earnings. Subsequent re-measurements to fair value of the redemption amount following the allocation of NCI profit or loss for the period are adjusted against retained earnings of the company in accordance with ASC 480-10-S99-3A-15 and 3A-16C. On June 8, 2012, according to the material fact
then disclosed, the third phase of the Investment Agreement and Other Covenants entered into on October 2, 2006 (“Investment Agreement”), established the rules and conditions for Gafisa related to the acquisition of the remaining 20% interest in the capital stock of AUSA not held by the Company. While the valuation of the capital stock has been agreed by both parties, the number of shares that shall be issued by the Company to settle this transaction is being decided on an arbitration process initiated by the noncontrolling interests of AUSA, according to the material fact released on July 3, 2012. There is an embedded derivative component to the Investment Agreement, relating to the Company's obligation to purchase the AUSA shares held by the non-controlling interest. As the fair value of this embedded derivative for all reporting periods has no significant value, since the future settlement of the derivative will be based on the fair value of AUSA’s capital stock, no derivative asset or liability has been recorded. The future settlement to be made in cash or shares represented an amount of R$358,985 as at December 31, 2012 and 2011.
On March 8, 2010, the Company announced the increase of its participation in Alphaville’s capital in 20%, as per the purchase agreement. The acquisition of 20% of Alphaville’s capital corresponds to an amount of R$126,490 which was paid based on issuance of 9,797,792 common shares (after the effect of the February 22, 2010 stock split) of Gafisa’s capital.
Under US GAAP, the total cost of the acquisition has been allocated to the assets acquired and the liabilities assumed based on their respective fair values. Goodwill, none of which is deductible for tax purposes, and other intangibles recorded in connection with the acquisition totaled R$20,902 and R$184,656, respectively.
Under US GAAP, acquired intangible assets include, R$168,072 assigned to existing development contracts, which is being amortized as developments are sold and R$16,853 assigned to registered trademarks, which were determined to have indefinite useful lives, and are not amortized, but are tested for impairment at least annually.
The fair values of assets acquired and liabilities assumed at the acquisition date are as follows:
|
Fair value
|
||||||||
|
At 100 %
|
At 60 %
|
|||||||
|
Current assets
|
69,371 | 41,623 | ||||||
|
Long-term receivables
|
73,478 | 44,087 | ||||||
|
Other assets
|
17,379 | 10,427 | ||||||
|
Intangible assets
|
307,760 | 184,656 | ||||||
|
Total assets acquired
|
467,988 | 280,793 | ||||||
|
Total liabilities assumed
|
(144,064 | ) | (86,438 | ) | ||||
|
Income taxes
|
(28,095 | ) | (16,857 | ) | ||||
|
Total liabilities assumed
|
(172,159 | ) | (103,295 | ) | ||||
|
Net assets acquired
|
295,829 | 177,498 | ||||||
For the year ended December 31, 2012, the Company amortized R$22,881 (2011 - R$23,664 and 2010 – R$33,116) of the fair value assigned in the purchase price allocation.
(c) Cipesa transaction
On October 26, 2007, the Company acquired 70% of Cipesa. The Company and Cipesa formed a new company, Cipesa Empreendimentos Imobiliários Ltda. (“Nova Cipesa”), in which Gafisa has 70% of the capital and Cipesa has 30%. Gafisa contributed to Nova Cipesa R$50,000 in cash and acquired shares of Cipesa in Nova Cipesa in the amount of R$15,000 payable over one year. Additionally, Cipesa is entitled to receive from the Company a variable portion of 2% of the Total Sales Value (“VGV”) of the projects launched by Nova Cipesa through 2014, not to exceed R$25,000 plus monetary correction of (R$36,172 with accrued interest as of December 31, 2012), totaling the acquisition amount of R$90,000 and goodwill amounting to R$40,687 was recorded, based on expected future profitability under BR GAAP.
Under US GAAP, the total cost of the acquisition has been allocated to the assets acquired and the liabilities assumed based on their respective fair values. Goodwill, none of which is deductible for tax purposes had a total amount of R$41,634. As of December 31, 2012, goodwill and inventory recorded in connection with the acquisition totaled R$18,567 and R$51,597, respectively. As of December 31, 2012, the total amount of inventory was amortized.
The fair values of assets acquired and liabilities assumed at the acquisition date are as follows:
|
Fair value
|
||||||||
|
At 100%
|
At 70%
|
|||||||
|
Current assets
|
96,675 | 67,673 | ||||||
|
Other assets
|
8 | 5 | ||||||
|
Total assets acquired
|
96,683 | 67,678 | ||||||
|
Total liabilities assumed
|
(2,527 | ) | (1,769 | ) | ||||
|
Income taxes
|
(25,061 | ) | (17,543 | ) | ||||
|
Total liabilities assumed
|
(27,588 | ) | (19,312 | ) | ||||
|
Net assets acquired
|
69,095 | 48,366 | ||||||
For the year ended December 31, 2012, the Company amortized R$30,458, including partial impairment of goodwill, (zero in 2011 and R$9,119 in 2010) of the fair value assigned in the purchase price allocation.
(d) Redevco transaction
Through November 2007, the Company held interests in investees together with Redevco through special purpose entities, as follow: Blue I (66.67%), Blue II (50%), Jardim Lorena (50%) and Sunplace (50%). In November 2007, the Company acquired the remaining interests in each entity for R$40,000.
Under US GAAP, the total cost of the acquisition has been allocated to the assets acquired and the liabilities assumed based on their respective fair values. Negative goodwill for those entities totaled R$11,434, which was allocated as a
pro rata
reduction to the acquired assets. This negative goodwill results primarily from market and business conditions, in which the fair value assigned mainly to inventories and receivables exceeded the respective acquisition cost.
The combined fair values of assets acquired and liabilities assumed at the acquisition date are as follows:
|
Combined fair value at 100%
|
||||
|
Current assets
|
139,983 | |||
|
Long-term receivables
|
16,813 | |||
|
Other assets
|
170 | |||
|
|
||||
|
Total assets acquired
|
156,966 | |||
|
|
||||
|
Total liabilities assumed
|
(76,745 | ) | ||
|
|
||||
|
Net assets acquired
|
80,221 | |||
(vi) Classification of balance sheet line items
Under Brazilian GAAP, the classification of certain balance sheet items is presented differently from US GAAP. The Company has recast its consolidated balance sheet under Brazilian GAAP to present a condensed consolidated balance sheet in accordance with US GAAP (Note 32(d)(i)). The reclassifications are summarized as follows:
|
·
|
Under US GAAP, the proportional consolidation of investees and subsidiaries is eliminated and in its place the associated companies are presented using the equity method of accounting and controlled subsidiaries are fully consolidated presenting their respective noncontrolling interests.
|
|
·
|
Under Brazilian GAAP, restricted cash is presented as short-term investment in the balance sheet. For US GAAP purposes, restricted cash is presented separately outside of short-term investment.
|
|
·
|
Under BR GAAP accounts receivable present value adjustment and monetary variation are recorded in the operating revenue. For US GAAP purpose the realization of accounts receivable present value adjustment and monetary variation are classified in the financial income/expense.
|
|
·
|
Under Brazilian GAAP, debt issuance costs are netted against the loan balance, whereas under US GAAP such costs are presented net of accumulated amortization, as deferred expenses in current and non-current assets.
|
|
·
|
Under Brazilian GAAP, deferred income taxes are netted and classified as non-current liabilities. For US GAAP purposes, deferred tax assets and liabilities are netted and classified as current or non-current based on the classification of the underlying temporary difference.
|
|
·
|
As of December 31, 2011, the Company and its subsidiary Tenda were in default on the contractual covenants provided for in certain debentures, including debentures with cross default provisions, for which a waiver was obtained and certain covenant ratios were renegotiated in March 2012 (Note 12). For Brazilian GAAP purposes, such debt was classified as a current liability as required since the violations were not cured as of the balance sheet date. For US GAAP, such amounts are not classified as current, as provided for in ASC 470.10, as the waiver and amendment were obtained prior to issuance of the financial statements.
|
Temporary equity
Under BR GAAP, as described in Note 20, the Company has recorded as non-controlling interest the portion of AUSA’s capital stock for which it does not have legal ownership at December 31, 2010. Although it has a forward contract to acquire these equity interests at set dates in the future at fair value, no liability has been recorded for the redemption value as there is no liability to transfer cash or financial assets as the Company can use its own equity instruments as consideration. The Company has therefore accounted for this transaction based on embedded derivative component. As the fair value of this embedded derivative has no significant value, no derivative asset or liability is recorded.
Under US GAAP, as described in Note 32 a) b), the redeemable noncontrolling interest falls within the scope of ASC 480-10-S99-3A and is recorded as temporary equity. At issuance the initial recognition based on fair value was recorded as temporary equity with a corresponding entry in retained earnings; subsequent re-measurements to fair value of the redemption amount are adjusted against retained earnings.
(vii) Classification of statement of income (operations) line items
Under Brazilian GAAP, in addition to the issues noted above, the classification of certain income and expense items is presented differently from US GAAP. The Company has recast its statement of income (loss) prepared under the Brazilian GAAP to present a condensed consolidated statement of income (loss) in accordance with US GAAP (Note 32(d)(ii)). The reclassifications are summarized as follows:
|
·
|
Brazilian listed companies are required to present the investment in jointly-controlled associated companies on the proportional consolidation method. For purposes of US GAAP, the Company has eliminated the effects of the proportional consolidation and reflected its interest in the results of investees on a single line item (Equity in results) in the recast consolidated statement of income (loss) under US GAAP.
|
|
·
|
Interest income and interest expense, together with other financial charges, are disclosed within operating income in the consolidated statement of operations presented in accordance with Brazilian GAAP. Such amounts have been reclassified to non-operating income and expenses in the condensed consolidated statement of operations (loss) in accordance with US GAAP.
|
|
·
|
The net income differences between Brazilian GAAP and US GAAP (Note 32(b)(i)) were incorporated in the consolidated statement of operations in accordance with US GAAP.
|
(b) Reconciliation of significant differences between Brazilian GAAP and US GAAP
(i) Net income (loss)
|
Note
|
2012
|
2011
|
2010
|
||||||||||
|
Net income (loss) under Brazilian GAAP attributable to owners of Gafisa S.A.
|
(124,504 | ) | (944,868 | ) | 264,565 | ||||||||
|
Revenue recognition - net operating revenue
|
32(a)(i) | 534,156 | 711,821 | (1,049,492 | ) | ||||||||
|
Revenue recognition - operating costs
|
32(a)(i) | (491,167 | ) | (312,409 | ) | 655,186 | |||||||
|
Stock compensation reversal
|
32(a)(ii)
|
7,804 | 23,750 | 10,106 | |||||||||
|
Business Combination of Tenda, Redevco and Cipesa
|
32(a)(iv)
|
(54,431 | ) | (10,575 | ) | (14,964 | ) | ||||||
|
Business Combination of Alphaville
|
32(a)(iv)
|
(24,490 | ) | (25,348 | ) | (34,960 | ) | ||||||
|
Non-controlling interests on adjustments above
|
32(a)(i) | 16,545 | 11,894 | 2,704 | |||||||||
|
Equity pick-up
|
32(a)(i) | 48,198 | (1,512 | ) | (34,114 | ) | |||||||
|
Deferred income tax on adjustments above
|
(33,314 | ) | (208,523 | ) | 106,186 | ||||||||
|
Net loss attributable to Gafisa under US GAAP
|
(121,203 | ) | (755,769 | ) | (94,783 | ) | |||||||
|
Net income attributable to the non-controlling interests under US GAAP
|
32,048 | 27,784 | 21,214 | ||||||||||
|
Net loss under US GAAP
|
(89,155 | ) | (727,985 | ) | (73,569 | ) | |||||||
|
Weighted-average number of shares outstanding in the year (in thousands) (i)
|
|||||||||||||
|
Common shares
|
432,246 | 431,586 | 412,434 | ||||||||||
|
Loss per share attributable to Gafisa Common (i)
|
|||||||||||||
|
Basic
|
32(a)(iii)
|
(0.2804 | ) | (1.7511 | ) | (0.2298 | ) | ||||||
|
Diluted
|
32(a)(iii)
|
(0.2804 | ) | (1.7511 | ) | (0.2298 | ) | ||||||
|
(i)
|
All share amounts have been adjusted retrospectively to reflect the 1 for 2 share split on February 22, 2010.
|
(ii) Equity
|
Note
|
2012
|
2011
|
2010
|
||||||||||
|
Equity under Brazilian GAAP
|
2,544,504 | 2,648,473 | 3,570,750 | ||||||||||
|
Revenue recognition - net operating revenue
|
32(a)(i) | (1,942,802 | ) | (2,476,959 | ) | (3,188,782 | ) | ||||||
|
Revenue recognition - operating costs
|
32(a)(i) | 1,313,745 | 1,804,912 | 2,117,322 | |||||||||
|
Liability-classified stock options
|
32(a)(ii)
|
- | (7,804 | ) | (12,272 | ) | |||||||
|
Reversal of goodwill amortization of Alphaville
|
32(a)(iv)
|
18,234 | 18,234 | 18,234 | |||||||||
|
Reversal of negative goodwill amortization of Redevco and Tenda
|
32(a)(iv)
|
(232,327 | ) | (232,327 | ) | (232,327 | ) | ||||||
|
Gain on the transfer of FIT Residencial
|
32(a)(iv)
|
205,527 | 205,527 | 205,527 | |||||||||
|
Business Combination – Tenda, Redevco and Cipesa
|
32(a)(iv)
|
(444 | ) | 53,986 | 64,560 | ||||||||
|
Business Combination – Alphaville
|
32(a)(iv)
|
(123,686 | ) | (99,196 | ) | (73,848 | ) | ||||||
|
Other, net
|
- | (1,124 | ) | (1,117 | ) | (1,844 | ) | ||||||
|
Non-controlling interests on adjustments above
|
32(a)(i) | 80,213 | 63,668 | 51,773 | |||||||||
|
US GAAP adjustment equity accounted investees
|
32(a)(i) | (11,760 | ) | (59,958 | ) | (58,441 | ) | ||||||
|
AUSA – redeemable noncontrolling interest
|
32(a)(v) | (319,802 | ) | (319,802 | ) | (179,303 | ) | ||||||
|
Deferred income tax on adjustments above
|
88,998 | 122,312 | 330,495 | ||||||||||
|
Gafisa equity under US GAAP
|
1,619,276 | 1,719,948 | 2,611,844 | ||||||||||
|
Non-controlling interests under US GAAP
|
53,222 | 21,174 | 20,833 | ||||||||||
|
Equity under US GAAP
|
1,672,498 | 1,741,122 | 2,632,677 | ||||||||||
Condensed changes in total equity under US GAAP
|
2012
|
2011
|
2010
|
||||||||||
|
At beginning of the year
|
1,741,122 | 2,632,677 | 1,697,844 | |||||||||
|
Changes in equity, BRGAAP
|
4,259 | 20,121 | 1,062,439 | |||||||||
|
Stock options
|
17,377 | (15,946 | ) | 2,166 | ||||||||
|
Net loss attributable to Gafisa
|
(121,203 | ) | (755,769 | ) | (94,783 | ) | ||||||
|
Minimum mandatory dividend
|
- | - | (102,932 | ) | ||||||||
|
Non-controlling interests
|
32,048 | 341 | 2,407 | |||||||||
|
AUSA – redeemable non-controlling interest
|
- | (140,499 | ) | 67,195 | ||||||||
|
Other
|
(1,105 | ) | 197 | (1,659 | ) | |||||||
|
At end of the year
|
1,672,498 | 1,741,122 | 2,632,677 | |||||||||
Condensed equity under US GAAP
|
2012
|
2011
|
2010
|
||||||||||
|
Equity
|
||||||||||||
|
Common shares, comprising 432,630,293 shares outstanding
(2010 – 432,100,073; 2010 – 430,915,889)
|
2,735,794 | 2,734,157 | 2,654,836 | |||||||||
|
Treasury shares
|
(1,731 | ) | (1,731 | ) | (1,731 | ) | ||||||
|
Accumulated losses
|
(1,114,787 | ) | (1,012,478 | ) | (41,261 | ) | ||||||
|
|
||||||||||||
|
Total Gafisa equity
|
1,619,276 | 1,719,948 | 2,611,844 | |||||||||
|
|
||||||||||||
|
Non-controlling interests
|
53,222 | 21,174 | 20,833 | |||||||||
|
|
||||||||||||
|
Total equity
|
1,672,498 | 1,741,122 | 2,632,677 | |||||||||
(i) Recent US GAAP accounting pronouncements
In May 2011, the FASB issued Accounting Standards Update No. 2011-04, “Fair Value Measurement (“ASU 2011-04”), which amended Accounting Standards Codification (ASC) 820 to clarify existing guidance and minimize differences between US GAAP and IFRS. ASU 2011-04 requires entities to provide information about valuation techniques and unobservable inputs used in Level 3 fair value measurements and provide additional disclosure for classes of assets and liabilities as disclosed at fair value. We adopted ASU 2011 as of January 1, 2012, which did not have a material impact on our consolidated financial statements.
In June 2011, the FASB issued Accounting Standards Updat No. 2011-05, “Statement of Comprehensive Income” (“ASU 2011-05), which requires entities to present net income and other comprehensive income in either a single continuous statement or in two separate, but consecutive, statements of net income and other comprehensive income. ASU 2011-05 was effective for our fiscal year beginning January 1, 2012. The standard did not impact our reported results of operations and our financial statement presentation.
In December 2011, the FASB issues ASU 2011-11, “Disclosures about Offsetting Assets and Liabilities” (“ASU 2011-11”), which requires entities to disclosure information about offsetting and related arrangements of financial instruments and derivatives instruments. The guidance is effective for our fiscal year beginning January 1, 2013 and is to be applied retrospectively. The adoption of this guidance, which is related to disclosure only, is not expected to have a material impact on our consolidated financial statements.
In July 2012, the FASB issued ASU 2012-02, “Intangible – Goodwill and Other”, which provides the option to perform a qualitative, rather than quantitative, assessment to determine whether it is more likely than not an indefinite-lived intangible asset is impaired. If the asset is considered impaired, an entity is required to perform the quantitative assessment under the existing guidance. The guidance is effective for our fiscal year beginning January 1, 2013. The adoption of this guidance, which is intended to simplify the impairment testing, is not expected to have a material impact on our consolidated financial statements.
In February 2013, the FASB issued guidance on the presentation and disclosure of reclassification adjustments out of accumulated other comprehensive income, or AOCI. The standard requires an entity to present information about significant items reclassified out of AOCI by component either on the face of the statement where net income is presented or as a separate disclosure in the notes to financial statements. The guidance is effective for calendar year-end public companies in 2013 beginning in the first quarter and is to be applied on a prospective basis. Early adoption of the guidance is permitted. Adoption of this guidance will not have a material impact on our consolidated financial statements.
(d) US GAAP condensed consolidated financial information
Based on the reconciling items and discussion above, the Gafisa S.A. consolidated balance sheets, statements of income (loss), and statement of changes in shareholders’ equity (see b(ii)) under US GAAP have been recast in condensed format as follows:
(i) Condensed consolidated balance sheets under US GAAP
|
2012
|
2011
|
2010
|
||||||||||
|
Assets
|
||||||||||||
|
Current assets
|
||||||||||||
|
Cash and cash equivalents
|
580,456 | 82,592 | 217,328 | |||||||||
|
Short-term investments
|
690,053 | 409,993 | 285,367 | |||||||||
|
Restricted short-term investments
|
295,533 | 365,766 | 624,687 | |||||||||
|
Trade accounts receivable, net
|
1,970,051 | 2,444,323 | 1,753,908 | |||||||||
|
Land available for sale
|
2,930,363 | 3,049,652 | 3,219,903 | |||||||||
|
Prepaid expenses
|
59,785 | 55,001 | 18,637 | |||||||||
|
Other
|
141,784 | 100,141 | 191,518 | |||||||||
| 6,668,025 | 6,507,468 | 6,311,348 | ||||||||||
| Non-current assets | ||||||||||||
|
Investments
|
466,094 | 394,221 | 314,132 | |||||||||
|
Property and equipment
|
90,706 | 96,669 | 79,576 | |||||||||
|
Intangibles assets
|
212,775 | 235,151 | 259,244 | |||||||||
|
Goodwill
|
39,469 | 62,536 | 62,536 | |||||||||
|
Trade accounts receivable, net
|
547,362 | 421,640 | 580,813 | |||||||||
|
Land available for sale
|
330,348 | 798,206 | 470,425 | |||||||||
|
Deferred income tax and social contribution
|
- | - | 219,942 | |||||||||
|
Other
|
339,833 | 345,254 | 184,251 | |||||||||
| 2,026,587 | 2,353,677 | 2,170,919 | ||||||||||
|
Total assets
|
8,694,612 | 8,861,145 | 8,482,267 | |||||||||
|
2012
|
2011
|
2010
|
||||||||||
|
Liabilities
|
||||||||||||
|
Current liabilities
|
||||||||||||
|
Loans and financing
|
609,098 | 650,306 | 639,265 | |||||||||
|
Debentures
|
349,059 | 311,875 | 29,488 | |||||||||
|
Payables for purchase of properties
|
371,051 | 361,268 | 239,980 | |||||||||
|
Payables for goods and services suppliers
|
154,657 | 110,985 | 160,275 | |||||||||
|
Taxes and labor contributions
|
179,612 | 128,402 | 99,704 | |||||||||
|
Advances from customers
|
890,016 | 866,428 | 886,055 | |||||||||
|
Obligations assumed on the assignment of receivables
|
132,916 | 54,825 | 72,572 | |||||||||
|
Payables for acquisition of investments
|
21,680 | 20,560 | 23,062 | |||||||||
|
Declared dividends
|
12,667 | 11,774 | 99,424 | |||||||||
|
Other
|
528,098 | 637,937 | 120,947 | |||||||||
| 3,248,854 | 3,154,360 | 2,370,772 | ||||||||||
|
Non-current liabilities
|
||||||||||||
|
Loans and financing
|
1,292,060 | 886,336 | 551,546 | |||||||||
|
Debentures
|
1,392,703 | 1,595,961 | 1,860,977 | |||||||||
|
Deferred income tax and social contribution
|
116,069 | 97,380 | - | |||||||||
|
Payables for purchase of properties
|
70,234 | 140,227 | 118,456 | |||||||||
|
Obligations assumed on the assignment of receivables
|
155,976 | 431,226 | - | |||||||||
|
Payables to venture partners
|
162,333 | 253,390 | 380,000 | |||||||||
|
Provisions for legal claims
|
149,790 | 134,914 | 124,537 | |||||||||
|
Other
|
75,110 | 67,244 | 242,502 | |||||||||
| 3,414,275 | 3,606,678 | 3,278,018 | ||||||||||
|
Alphaville redeemable non-controlling interest
|
358,985 | 358,985 | 200,800 | |||||||||
|
Total Gafisa equity
|
1,619,276 | 1,719,948 | 2,611,844 | |||||||||
|
Non-controlling interest
|
53,222 | 21,174 | 20,833 | |||||||||
|
Total equity
|
1,672,498 | 1,741,122 | 2,632,677 | |||||||||
|
Total liabilities and equity
|
8,694,612 | 8,861,145 | 8,482,267 | |||||||||
(ii) Condensed consolidated statements of operations under US GAAP
|
2012
|
2011
|
2010
|
||||||||||
|
Gross operating revenue
|
||||||||||||
|
Real estate development and sales of properties
|
4,233,696 | 3,481,714 | 2,141,267 | |||||||||
|
Taxes on services and revenues
|
(302,967 | ) | (231,487 | ) | (212,137 | ) | ||||||
|
Net operating revenue
|
3,930,729 | 3,250,227 | 1,929,130 | |||||||||
|
Operating costs
|
(3,008,345 | ) | (2,743,144 | ) | (1,472,085 | ) | ||||||
|
Gross profit
|
922,384 | 507,083 | 457,045 | |||||||||
|
Operating income (expenses)
|
||||||||||||
|
Selling general and administrative expenses
|
(619,117 | ) | (610,055 | ) | (477,146 | ) | ||||||
|
Other
|
(240,540 | ) | (252,920 | ) | (98,630 | ) | ||||||
|
Income (loss) before financial income and expenses and income tax and social contribution
|
62,727 | (355,892 | ) | (118,731 | ) | |||||||
|
Financial income
|
67,793 | 80,760 | 120,419 | |||||||||
|
Financial expenses
|
(259,207 | ) | (178,130 | ) | (218,229 | ) | ||||||
|
Loss before income tax and social contribution
|
(128,687 | ) | (453,262 | ) | (216,541 | ) | ||||||
|
Current income tax and social contribution
|
(30,662 | ) | (89,495 | ) | (2,498 | ) | ||||||
|
Deferred income tax and social contribution
|
(38,071 | ) | (244,915 | ) | 103,309 | |||||||
|
Income tax benefit (expense)
|
(68,733 | ) | (334,410 | ) | 100,811 | |||||||
|
Loss before equity in results and
|
||||||||||||
|
non-controlling interests
|
(197,420 | ) | (787,672 | ) | (115,730 | ) | ||||||
|
Equity pick-up in associates
|
108,265 | 59,687 | 42,161 | |||||||||
|
Net loss for the year
|
(89,155 | ) | (727,985 | ) | (73,569 | ) | ||||||
|
Net income attributable to the non-controlling interests
|
32,048 | 27,784 | 21,214 | |||||||||
|
Net loss attributable to Gafisa
|
(121,203 | ) | (755,769 | ) | (94,783 | ) | ||||||
(iii) Condensed consolidated statements of comprehensive income (loss)
|
2012
|
2011
|
2010
|
||||||||||
|
Net loss for the year
|
(89,155 | ) | (727,985 | ) | (73,569 | ) | ||||||
|
Total comprehensive loss, net of taxes
|
(89,155 | ) | (727,985 | ) | (73,569 | ) | ||||||
|
Attributable to:
|
||||||||||||
|
Non-controlling interests
|
32,048 | 27,784 | 21,214 | |||||||||
|
Owners of Gafisa
|
(121,203 | ) | (755,769 | ) | (94,783 | ) | ||||||
(iv) Additional information – income taxes
Change in the valuation allowance for net operating losses and temporary differences was as follows:
|
2012
|
2011
|
2010
|
||||||||||
|
Opening balance at January 1
|
(411,458 | ) | (29,241 | ) | (14,476 | ) | ||||||
|
Change in valuation allowance
|
(208,213 | ) | (382,307 | ) | (14,765 | ) | ||||||
|
Closing balance at December 31
|
(619,671 | ) | (411,548 | ) | (29,241 | ) | ||||||
The Company adopted the provisions of FASB Interpretation 48, “Accounting for Uncertainty in Income Taxes” (“FIN 48”), on January 1, 2007, which requires it to record the financial statement effects of an income tax position when it is more likely than not, based on the technical merits, that it will be sustained upon examination. A tax position that meets the more-likely-than-not recognition threshold is measured and recorded as the largest amount of tax benefit that is greater than 50 percent likely of being realized upon ultimate settlement with a taxing authority.
As of December 31, 2012, 2011 and 2010, the Company has no amount recorded for any uncertainty in income taxes.
Gafisa S.A. and its subsidiaries file income tax returns in Brazil and other foreign federal and state jurisdictions. Brazilian income tax returns are subject to inspections by tax authorities within 5 years after the filing.
(v) Statement of comprehensive income (loss)
Comprehensive income (loss) is comprised of net income (loss) and other comprehensive income (loss) that include charges or credits directly to equity which are not the result of transactions with owners. In the case of the Company, comprehensive income (loss) is the same as net income (loss) for the year.
For each period for which an statement of operations is presented and required to be reconciled to US GAAP, SEC rules require that the Company provide either a statement of cash flows prepared in accordance with US GAAP or IFRS; or furnish in a note to the financial statements a qualified description of the material differences between cash or funds flows reported in the primary financial statements and cash flows that would be reported in a statement of cash flows, prepared in accordance with US GAAP.
The Company’s primary differences in net income (loss) between Brazilian GAAP and net loss for US GAAP are explained in items 32(a) (ii) to (vii) above. The statement of cash flows for Brazilian GAAP was prepared based on CPC 3(R2) - Statement of Cash Flows, which conforms with IAS 7.
(vii) Statement of value added
The statement of value added for new Brazilian GAAP was prepared based on CPC 09 - “Demonstração do Valor Adicionado.” For US GAAP, this statement is not required.
* * *
F-85
TABLE OF CONTENTS
Part IItem 1. Identity Of Directors, Senior Management and AdvisersItem 2. Offer Statistics and Expected TimetableItem 3. Key InformationItem 4. Information on The CompanyItem 4A. Unresolved Staff CommentsItem 5. Operating and Financial Review and ProspectsItem 6. Directors, Senior Management and EmployeesItem 7. Major Shareholders and Related Party TransactionsItem 8. Financial InformationItem 9. The Offer and ListingItem 10. Additional InformationItem 11. Quantitative and Qualitative Disclosures About Market RiskItem 12. Description Of Securities Other Than Equity SecuritiesPart IIItem 13. Defaults, Dividend Arrearages and DelinquenciesItem 14. Material Modifications To The Rights Of Security Holders and Use Of ProceedsItem 15. Controls and ProceduresItem 16. ReservedItem 16A. Audit Committee Financial ExpertItem 16B. Code Of Business Conduct and EthicsItem 16C. Principal Accountant Fees and ServicesItem 16D. Exemptions From The Listing Standards For Audit CommitteesItem 16E. Purchases Of Equity Securities By The Issuer and Affiliated PurchasersItem 16F. Change in Registrant S Certifying AccountantItem 16G. Corporate GovernanceItem 16H. Mine Safety DisclosurePart IIIItem 17. Financial StatementsItem 18. Financial StatementsItem 19. Exhibits