GRIFFON CORP
10-Ks and 10-Qs
|
|
|
|
|
|
|
|
|
|
|
|
|
|
|
|
|
|
|
|
|
|
|
|
|
|
|
|
|
|
|
|
|
|
|
|
|
|
|
|
|
|
|
|
|
|
|
|
|
|
UNITED STATES
SECURITIES AND EXCHANGE COMMISSION
Washington, D.C. 20549
FORM 10-K
|
x
|
ANNUAL REPORT PURSUANT TO SECTION 13 OR 15(d) OF THE SECURITIES EXCHANGE ACT OF 1934
|
|
For the year ended
September 30, 2017
OR
|
o
|
TRANSITION REPORT PURSUANT TO SECTION 13 or 15(d) OF THE SECURITIES EXCHANGE ACT OF 1934
|
|
Commission File No. 1-06620
GRIFFON CORPORATION
(Exact name of registrant as specified in its charter)
|
Delaware
|
|
11-1893410
|
|
(State or other jurisdiction of incorporation or organization)
|
|
(I.R.S. Employer Identification No.)
|
|
712 Fifth Avenue, 18
th
Floor, New York, New York
|
|
10019
|
|
(Address of Principal Executive Offices)
|
|
(Zip Code)
|
|
|
|
|
|
Registrant’s telephone number, including area code:
(212) 957-5000
|
||
Securities registered pursuant to Section 12(b) of the Act:
|
|
Title of each class
|
|
Name of each exchange on
which registered
|
|
|
|
Common Stock, $0.25 par value
|
|
New York Stock Exchange
|
|
Securities registered pursuant to Section 12(g) of the Act:
None
Indicate by check mark if the registrant is a well-known seasoned issuer, as defined in Rule 405 of the Securities Act. Yes
o
No
x
Indicate by check mark if the registrant is not required to file reports pursuant to Section 13 or Section 15(d) of the Act. Yes
o
No
x
Indicate by check mark whether the registrant (1) has filed all reports required to be filed by Section 13 or 15(d) of the Securities Exchange Act of 1934 during the preceding 12 months (or for such shorter period that the registrant was required to file such reports), and (2) has been subject to such filing requirements for the past 90 days. Yes
x
No
o
Indicate by check mark whether the registrant has submitted electronically and posted on its corporate web site, if any, every Interactive Data File required to be submitted and posted pursuant to Rule 405 of Regulation S-T during the preceding 12 months (or for such period that the registrant was required to submit and post such files). Yes
x
No
o
Indicate by check mark if disclosure of delinquent filers pursuant to Item 405 of Regulation S-K is not contained herein, and will not be contained, to the best of registrant’s knowledge, in definitive proxy or information statements incorporated by reference in Part III of this Form 10-K or any amendment to this Form 10-K.
x
Indicate by check mark whether the registrant is a large accelerated filer, an accelerated filer, a non-accelerated filer, or a smaller reporting company. See definitions of “large accelerated filer”, “accelerated filer” and “smaller reporting company” in Rule 12b-2 of the Exchange Act. (Check one):
|
|
Large accelerated filer
x
|
Accelerated filer
o
|
|
|
Non-accelerated filer
o
(Do not check if a smaller reporting company)
|
Smaller reporting company
o
|
Indicate by check mark whether the registrant is a shell company (as defined in Rule 12b-2 of the Act). Yes
o
No
S
The aggregate market value of the voting and non-voting common stock held by non-affiliates of the registrant as of the close of business March 31, 2017, the registrant’s most recently completed second quarter, was approximately $882,000,000. The registrant’s closing price as reported by the New York Stock Exchange-Composite Transactions for March 31, 2017 was $24.65. The number of the registrant’s outstanding shares was 47,219,519 as of October 31, 2017.
DOCUMENTS INCORPORATED BY REFERENCE:
Part III — (Items 10, 11, 12, 13 and 14). Registrant’s definitive proxy statement to be filed pursuant to Regulation 14A of the Securities Exchange Act of 1934.
Special Notes Regarding Forward-Looking Statements
This Annual Report on Form 10-K, especially “Management’s Discussion and Analysis”, contains certain “forward-looking statements” within the meaning of the Securities Act of 1933, as amended, the Securities Exchange Act of 1934, as amended, and the Private Securities Litigation Reform Act of 1995. Such statements relate to, among other things, income (loss), earnings, cash flows, revenue, changes in operations, operating improvements, industries in which Griffon Corporation (the “Company” or “Griffon”) operates and the United States and global economies. Statements in this Form 10-K that are not historical are hereby identified as “forward-looking statements” and may be indicated by words or phrases such as “anticipates,” “supports,” “plans,” “projects,” “expects,” “believes,” “should,” “would,” “could,” “hope,” “forecast,” “management is of the opinion,” “may,” “will,” “estimates,” “intends,” “explores,” “opportunities,” the negative of these expressions, use of the future tense and similar words or phrases. Such forward-looking statements are subject to inherent risks and uncertainties that could cause actual results to differ materially from those expressed in any forward-looking statements. These risks and uncertainties include, among others: current economic conditions and uncertainties in the housing, credit and capital markets; Griffon’s ability to achieve expected savings from cost control, integration and disposal initiatives; the ability to identify and successfully consummate and integrate value-adding acquisition opportunities; increasing competition and pricing pressures in the markets served by Griffon’s operating companies; the ability of Griffon’s operating companies to expand into new geographic and product markets, and to anticipate and meet customer demands for new products and product enhancements and innovations; reduced military spending by the government on projects for which Griffon's Telephonics Corporation supplies products, including as a result of defense budget cuts or other government actions; the ability of the federal government to fund and conduct its operations; increases in the cost of raw materials such as resin, wood and steel; changes in customer demand or loss of a material customer at one of Griffon’s operating companies; the potential impact of seasonal variations and uncertain weather patterns on certain of Griffon’s businesses; political events that could impact the worldwide economy; a downgrade in Griffon’s credit ratings; changes in international economic conditions including interest rate and currency exchange fluctuations; the reliance by certain of Griffon’s businesses on particular third party suppliers and manufacturers to meet customer demands; the relative mix of products and services offered by Griffon’s businesses, which impacts margins and operating efficiencies; short-term capacity constraints or prolonged excess capacity; unforeseen developments in contingencies, such as litigation and environmental matters; unfavorable results of government agency contract audits of Telephonics Corporation; Griffon’s ability to adequately protect and maintain the validity of patent and other intellectual property rights; the cyclical nature of the businesses of certain of Griffon’s operating companies; and possible terrorist threats and actions and their impact on the global economy. Readers are cautioned not to place undue reliance on these forward-looking statements. These forward-looking statements speak only as of the date made. Griffon undertakes no obligation to publicly update or revise any forward-looking statements, whether as a result of new information, future events or otherwise, except as required by law.
1
(Unless otherwise indicated, any reference to years or year-end refers to the fiscal year ending
September 30
and US dollars and non-US currencies are in thousands, except per share data)
Item 1.
Business
The Company
Griffon Corporation (the “Company” or “Griffon”) is a diversified management and holding company that conducts business through wholly-owned subsidiaries. Griffon oversees the operations of its subsidiaries, allocates resources among them and manages their capital structures. Griffon provides direction and assistance to its subsidiaries in connection with acquisition and growth opportunities as well as in connection with divestitures. In order to further diversify, Griffon also seeks out, evaluates and, when appropriate, will acquire additional businesses that offer potentially attractive returns on capital.
Headquartered in New York, N.Y., the Company was founded in 1959 and is incorporated in Delaware. Griffon is listed on the New York Stock Exchange and trades under the symbol GFF.
On September 5, 2017, Griffon announced it will explore strategic alternatives for Clopay Plastic Products Company, Inc. ("PPC") and on November 16, 2017, announced it entered into a definitive agreement to sell PPC to Berry Global Group, Inc. (NYSE:BERY) ("Berry") for $475 million in cash. The transaction is subject to regulatory approval and customary closing conditions, and is expected to close in the first quarter of calendar 2018. As a result, Griffon classified the results of operations of the PPC business as discontinued operations in the Consolidated Statements of Operations for all periods presented and classified the related assets and liabilities associated with the discontinued operations as held for sale in the consolidated balance sheets. All results and information presented exclude PPC unless otherwise noted.
On October 2, 2017, Griffon acquired ClosetMaid LLC ("ClosetMaid"). ClosetMaid, founded in 1965, is a leading North American manufacturer and marketer of closet organization, home storage, and garage storage products, and sells to some of the largest home center retail chains, mass merchandisers, and direct-to-builder professional installers in North America. Due to the acquisition of ClosetMaid occurring subsequent to Griffon's fiscal year end, ClosetMaid's results of operations, assets and liabilities were not included in Griffon's 2017 financial results or 2017 year-end balance sheet.
Griffon now conducts its continuing operations through two reportable segments, as follows:
|
•
|
Home & Building Products ("HBP") consists of three companies, The AMES Companies, Inc. (“AMES”), Clopay Building Products Company, Inc. (“CBP”) and ClosetMaid. HBP revenue accounted for
73%
of Griffon’s consolidated revenue in
2017
and
71%
in both
2016
and
2015
:
|
|
◦
|
AMES, founded in 1774, is the leading U.S. manufacturer and a global provider of long-handled tools and landscaping products for homeowners and professionals. AMES’ revenue was
36%
,
35%
, and
36%
of Griffon’s consolidated revenue in
2017
,
2016
and
2015
, respectively.
|
|
◦
|
CBP, since 1964, is a leading manufacturer and marketer of residential and commercial garage doors and sells to professional dealers and some of the largest home center retail chains in North America. CBP’s revenue was
37%
,
36%
and
35%
of Griffon’s consolidated revenue in
2017
,
2016
and
2015
, respectively.
|
|
◦
|
ClosetMaid was acquired on October 2, 2017. ClosetMaid's 2017 revenue was $298,737, or 16% of Griffon's pro forma 2017 revenue of $1,823,734 (unaudited), giving effect to the acquisition of ClosetMaid as if it had occurred on October 1, 2016. With the inclusion of ClosetMaid, HBP pro forma revenue would have accounted for 77% of Griffon's 2017 consolidated pro forma revenue.
|
|
•
|
Telephonics Corporation ("Telephonics"), founded in 1933, is recognized globally as a leading provider of highly sophisticated intelligence, surveillance and communications solutions for defense, aerospace and commercial customers. Telephonics’ revenue was
27%
of Griffon’s consolidated revenue in
2017
and
29%
in both
2016
and
2015
.
|
PPC, classified as a discontinued operation, is a global leader in the development and production of embossed, laminated and printed specialty plastic films for hygienic, health-care and industrial products and sells to some of the world's largest consumer products companies. Griffon acquired PPC in 1986 as part of the acquisition of Clopay Corporation.
2
We are focused on acquiring, owning and operating businesses in a variety of industries. We are long-term investors that have substantial experience in a variety of industries. Our intent is to continue the growth of our existing segments and diversify further through investments and acquisitions.
As a result of the decline in the U.S. housing market, in May 2008, we announced the divestiture of our Installation Services business, which was consummated by September 2008. In September 2008, Griffon strengthened its balance sheet by raising $248,600 in equity through a common stock rights offering and a related investment by GS Direct L.L.C., an affiliate of The Goldman Sachs Group, Inc. Since that time, Griffon has continued to refine and enhance the strategic direction and operating performance of its companies, while strengthening its balance sheet. During this period, Griffon has grown revenue and earnings through organic growth, cost containment and acquisitions, while returning capital to its shareholders through dividends and stock buybacks.
From October 2008 through May 10, 2017, Griffon's Employee Stock Ownership Plan ("ESOP") purchased 4,562,371 shares of Griffon's common stock, for a total of $54,186 or $11.88 per share. During the year ended September 30, 2017, Griffon's ESOP purchased
621,875
shares of common stock for a total of
$10,908
or
$17.54
per share, under a borrowing line that has now been fully utilized. At September 30, 2017, the ESOP held allocated and unallocated shares totaling
5,802,336
, or 12% of Griffon's outstanding shares, with a related loan balance of
$42,365
, net of issuance costs.
On September 30, 2010, Griffon purchased AMES for $542,000. Subsequently, Griffon acquired seven businesses complementary to AMES: the pots and planters business of Southern Sales & Marketing ("Southern Patio"), Northcote Pottery ("Northcote"), the Australian Garden and Tools division of Illinois Tool Works, Inc. ("Cyclone"), Hills Home Living ("Hills"), La Hacienda Limited ("La Hacienda"), Tuscan Landscape Group Ltd ("Tuscan Path") and Harper Brush Works (“Harper”).
On October 17, 2011, AMES acquired Southern Patio for approximately $23,000. Southern Patio, is a leading designer, manufacturer and marketer of landscape accessories.
In January 2013, AMES announced its intention to close certain U.S. manufacturing facilities and consolidate affected operations primarily into its Camp Hill and Carlisle, PA locations. These actions, which were completed at the end of the first quarter of 2015, improved manufacturing and distribution efficiencies, allowed for in-sourcing of certain production previously performed by third party suppliers, and improved material flow and absorption of fixed costs. Management continues to estimate that AMES' initiative resulted in annualized cash savings exceeding $10,000. Realization of savings began in the 2015 second quarter.
On December 31, 2013, AMES acquired Northcote, founded in 1897 and a leading brand in the Australian outdoor planter and decor market, for approximately $22,000.
On May 21, 2014, AMES acquired Cyclone for approximately $40,000. Cyclone offers a full range of quality garden and hand tool products sold under various leading brand names including Cyclone®, Nylex® and Trojan®, designed to meet the requirements of both the Do-it-Yourself and professional trade segments. The Northcote and Cyclone acquisitions complement Southern Patio and add to AMES' existing lawn and garden operations in Australia.
On December 30, 2016, AMES Australia acquired Hills for approximately $6,051 (AUD 8,400). Hills, founded in 1946, is a market leader in the supply of clothesline, laundry and garden products. The Hills acquisition adds to AMES' existing broad category of products and enhances its lawn and garden product offerings in Australia. Hills is expected to generate approximately AUD 10,000 of revenue in the first twelve months after acquisition.
On July 31, 2017 AMES acquired La Hacienda, a leading United Kingdom outdoor living brand of unique heating and garden decor products, for approximately
$11,400
(GBP
9,175
). The acquisition of La Hacienda broadens AMES' global outdoor living and lawn and garden business and supports AMES' UK expansion strategy. La Hacienda is expected to generate approximately GBP
14,000
of revenue in the first twelve months after the acquisition.
On September 29, 2017, AMES Australia acquired Tuscan Path for approximately
$18,000
(AUD
22,250
). Tuscan Path is a leading Australian provider of pots, planters, pavers, decorative stone, and garden decor products. The acquisition of Tuscan Path broadens AMES' outdoor living and lawn and garden business, and will strengthen AMES' industry leading position in Australia. Tuscan Path is expected to generate approximately AUD
25,000
in revenue in the first twelve months after the acquisition.
On November 6, 2017, AMES acquired Harper Brush Works (“Harper”), a division of Horizon Global, for approximately $5,000. Harper is a leading U.S. manufacturer of cleaning products for professional, home, and industrial use. The acquisition will broaden AMES’ long-handle tool offering in North America to include brooms, brushes, and other cleaning tools and accessories. The acquisition is expected to contribute approximately $10,000 in revenue in the first twelve months after the acquisition.
3
From August 2011 through September 30, 2017, Griffon repurchased
20,429,298
shares of its common stock, for a total of
$261,621
or $12.81 per share. This includes the repurchase of
15,984,854
shares on the open market, as well as the December 10, 2013 repurchase of 4,444,444 shares from GS Direct for $50,000 or
$11.25
per share. In each of August 2011, May 2014, March 2015, July 2015, and August 2016, Griffon's Board of Directors authorized the repurchase of up to $50,000 of Griffon's outstanding common stock. Under these programs, the Company may purchase shares in the open market, including pursuant to a 10b5-1 plan, or in privately negotiated transactions. At September 30, 2017,
$49,437
remains under Board repurchase authorizations.
On November 17, 2011, the Company began declaring quarterly dividends. During 2017, 2016 and 2015, the Company declared and paid dividends per share of
$0.24
,
$0.20
and
0.16
, respectively, for a total of $26,777 dividends paid during the period. On November 15, 2017, the Board of Directors declared a cash dividend of
$0.07
per share, payable on December 21, 2017 to shareholders of record as of the close of business on November 29, 2017.
During 2014, Griffon issued $600,000 of 5.25% Senior Notes due 2022, the proceeds of which were used to redeem $550,000 of 7.125% senior notes due 2018. On May 18, 2016, the Company completed an add-on offering of $125,000 principal amount of 5.25% Senior Notes due 2022; as of that date, outstanding Senior Notes due 2022 totaled $725,000. On October 2, 2017, Griffon completed an add-on offering of $275,000 aggregate principal amount of 5.25% senior notes due 2022 in an unregistered offering through a private placement. The $275,000 senior notes were issued under the same indenture pursuant to which Griffon previously issued $725,000 in aggregate principal amount of its 5.25% Senior Notes due 2022. The proceeds were used, among other things, to purchase ClosetMaid and for general corporate purposes (including, without limitation, to temporarily reduce the outstanding balance of Griffon's Revolving Credit Facility).
On October 15, 2015, CBP announced plans to expand its manufacturing facility in Troy, Ohio. The expansion reflects increased customer demand for its core products, and its success in bringing new technologies to market. The project included improvements to its existing one million square foot building, as well as adding 250,000 square feet and new manufacturing equipment. The project is complete.
In January 2016, Griffon launched its new website, www.griffon.com.
On March 22, 2016, Griffon amended its Revolving Credit Facility to increase borrowing availability from $250,000 to $350,000, extend its maturity date from March 13, 2020 to March 22, 2021 and modify certain other provisions of the facility.
On January 17, 2017, Griffon settled its $100,000 principal amount of 4% convertible subordinated notes due 2017 for $173,855, with $125,000 in cash and $48,858, or 1,954,993 shares of common stock issued from treasury.
On September 5, 2017, Griffon announced that after having received from qualified parties unsolicited inquiries to acquire PPC, Griffon will explore strategic alternatives for PPC, and on November 16, 2017, announced it entered into a definitive agreement to sell PPC to Berry for $475 million in cash.
On October 2, 2017, Griffon completed the acquisition of ClosetMaid, a market leader of home storage and organization products, for approximately $200,000, or $175,000 inclusive of the net present value of tax benefits. ClosetMaid adds to Griffon's Home and Building Products segment, complementing and diversifying Griffon's portfolio of leading consumer brands and products. ClosetMaid is expected to generate approximately $300,000 in revenue in the first twelve months after the acquisition.
Griffon makes available, free of charge through its website at
www.griffon.com
, its annual report on Form 10-K, quarterly reports on Form 10-Q, current reports on Form 8-K and amendments to those reports filed or furnished pursuant to Section 13(a) of the Securities Exchange Act of 1934, as soon as reasonably practicable after such materials are filed with or furnished to the Securities and Exchange Commission (the “SEC”).
For information regarding revenue, profit and total assets of each segment, see the Reportable Segments footnote in the Notes to Consolidated Financial Statements.
4
Reportable Segments:
Home & Building Products
Home & Building Products consists of three companies, AMES, CBP and ClosetMaid, described below.
AMES
AMES, founded in 1774, is the leading United States ("U.S.") manufacturer and a global provider of long-handled tools and landscaping products that make work easier for homeowners and professionals. AMES has approximately
2,000
employees.
Brands
AMES' brands are among the most recognized across primary product categories in the North American and Australian long-handled tools and landscaping product markets. Our brand portfolio includes AMES®, True Temper®, Garant®, Harper®, UnionTools®, Hound Dog®, Westmix™, Trojan®, Cyclone®, Southern Patio®, Northcote Pottery™, Nylex®, Hills®, Tuscan Path, La Hacienda®, Kelso™, Darby™ and Dynamic Design™, as well as contractor-oriented brands including Razor-Back® Professional Tools and Jackson® Professional Tools. This strong portfolio of brands enables AMES to build and maintain long-standing relationships with leading retailers and distributors. In addition, given the breadth of its brand portfolio and product category depth, AMES is able to offer specific, differentiated branding strategies for key retail customers. These strategies have focused on enhancement of brand value, with the goal of de-commoditizing AMES products through the introduction of identity and functionality elements that will make each top brand unique, attractive and visually recognizable by the consumer. The visual brand transformation of the AMES® and Razor-Back® brands were completed in 2015 and the True Temper® line roll-out was completed in 2016. In addition to the brands listed, AMES also sells private label branded products further enabling channel management and customer differentiation.
Products
AMES manufactures and markets a broad portfolio of long-handled tools and landscaping products. This portfolio is anchored by four core product categories: long handle tools, wheelbarrows, snow tools, and decorative plastic and ceramic pots and planters. As a result of brand portfolio recognition, high product quality, industry leading service and strong customer relationships, AMES has earned market-leading positions in its four core product categories. The following is a brief description of AMES' primary product lines:
|
•
|
Long Handled Tools:
An extensive line of engineered tools including shovels, spades, scoops, rakes, hoes, cultivators, weeders, post hole diggers, scrapers, edgers and forks, marketed under leading brand names including AMES®, True Temper®, Harper®, UnionTools®, Garant®, Cyclone® and Kelso™, as well as contractor-oriented brands including Razor-Back® Jackson® and Darby™.
|
|
•
|
Wheelbarrows:
AMES designs, develops and manufactures a full line of wheelbarrows and lawn carts, primarily under the AMES®, True Temper®, Jackson® Professional Tools, UnionTools®, Garant® and Westmix™ brand names. The products range in size, material (poly and steel), tray form, tire type, handle length and color based on the needs of homeowners, landscapers and contractors.
|
|
•
|
Snow Tools:
A complete line of snow tools is marketed under the True Temper®, Garant® and Union Tools® brand names. The snow tool line includes shovels, pushers, roof rakes, sled sleigh shovels, scoops and ice scrapers.
|
|
•
|
Planters and Lawn Accessories:
AMES is a designer, manufacturer and distributor of indoor and outdoor planters and accessories, sold under the Southern Patio®, Northcote Pottery™, Tuscan Path, La Hacienda®, Hills® and Dynamic Design™ brand names, as well as various private label brands. The range of planter sizes (from 6 to 32 inches) is available in various designs, colors and materials.
|
|
•
|
Striking Tools:
Axes, picks, mattocks, mauls, wood splitters, sledgehammers, pry bars and repair handles make up the striking tools product line. These products are marketed under the True Temper®, Cyclone®, Garant®, Jackson® Professional Tools and Razor-Back® Professional Tools brand names.
|
|
•
|
Hand Tools:
Hammers, screwdrivers, pliers, adjustable wrenches, handsaws, tape measures, levels, clamps, and other traditional long-handled tools make up this product line. These products are marketed under the Trojan®, Cyclone®
|
5
and Supercraft® brand names. In addition, gardening hand tools, such as trowels, cultivators, weeders and other specialty garden hand tools, are marketed under the AMES® brand name.
|
•
|
Pruning:
The pruning line is made up of pruners, loppers, shears and other tools sold primarily under the True Temper®, Cyclone® and Garant® brand names.
|
|
•
|
Garden Hose and Storage:
AMES offers a wide range of manufactured and sourced garden hoses and hose reels under the AMES®, NeverLeak®, Nylex®, Hills® and Jackson® Professional Tools brand names.
|
Customers
AMES sells products throughout North America, Australia, New Zealand and Europe through (1) retail centers, including home and garden centers and mass merchandisers, such as The Home Depot, Inc. (“Home Depot”), Lowe’s Companies Inc. (“Lowe’s”), Wal-Mart Stores Inc. ("Walmart"), Canadian Tire Corporation, Limited, Costco Wholesale Corporation, Rona Inc., Bunnings Warehouse ("Bunnings") and Woodies; (2) wholesale chains, including hardware stores and garden centers, such as Ace, Do-It-Best and True Value Company; and (3) industrial distributors, such as W.W. Grainger, Inc. and ORS Nasco.
Home Depot, Lowe's and Bunnings are significant customers of AMES. The loss of any of these customers would have a material adverse effect on the AMES business and on Griffon.
Product Development
AMES product development efforts focus on both new products and product line extensions. Products are developed through in-house industrial design and engineering staffs to introduce new products and product line extensions timely and cost effectively.
Sales and Marketing
AMES' sales organization is structured by distribution channel in the U.S., and by country internationally. In the U.S., a dedicated team of sales professionals is provided for each of the large retail customers. Offices are maintained adjacent to each of the three largest customers’ headquarters, supported by dedicated in-house sales analysts. In addition, sales professionals are assigned to domestic, wholesale and industrial distribution channels. Sales teams located in Canada, Australia, the United Kingdom and Ireland handle sales in each of their respective regions. In Australia, a dedicated team of sales professionals is provided for the largest retail customer.
Raw Materials and Suppliers
AMES' primary raw material inputs include resin (primarily polypropylene and high density polyethylene), wood (mainly ash, hickory and poplar logs) and steel (hot rolled and cold rolled). In addition, some key materials and components are purchased, such as heavy forged components and wheelbarrow tires; most final assembly is completed internally in order to ensure consistent quality. All raw materials are generally available from a number of sources.
Competition
The long-handled tools and landscaping product industry is highly competitive and fragmented. Most competitors consist of small, privately-held companies focusing on a single product category. Some competitors, such as Fiskars Corporation in the hand tool and pruning tool market and Truper Herramientas S.A. de C.U. in the long-handled and garden tool space, compete in various tool categories. Suncast Corporation competes in the hose reel and accessory market, and more recently in the long-handled plastic snow shovel category and Swan Hose competes in the garden hose market. In addition, there is competition from imported or sourced products from China, India and other low-cost producing countries, particularly in long-handled tools, wheelbarrows, planters, striking tools and pruning tools.
The principal factors by which AMES differentiates itself and provides the best value to customers are innovation, service, quality, and product performance. AMES' size, depth and breadth of product offering, category knowledge, research and development (“R&D”) investment, service and its ability to react to sudden changes in demand from seasonal weather patterns, especially during harsh winter months, are competitive advantages. Offshore manufacturers lack sufficient product innovation, capacity, proximity to market and distribution capabilities to service large retailers or to compete in highly seasonal, weather related product categories.
6
Manufacturing & Distribution
AMES has two distribution facilities in the U.S., a 1.2 million square foot facility in Carlisle, Pennsylvania and a 400,000 square foot facility in Reno, Nevada. Finished goods are transported to these facilities from AMES' manufacturing sites by both an internal fleet, as well as over the road trucking and rail. Additionally, light assembly is performed at the Carlisle and Reno locations. Distribution centers are also maintained in Canada, Australia, the United Kingdom and Ireland. AMES has a combination of internal and external, and domestic and foreign manufacturing sources from which it sources products for sale in the markets it serves.
In January 2013, AMES undertook to close certain of its U.S. manufacturing facilities and consolidate affected operations primarily into its Camp Hill and Carlisle, PA locations. The actions, completed at the end of the 2015 first quarter, improved manufacturing and distribution efficiencies, allowed for in-sourcing of certain production previously performed by third party suppliers, and improved material flow and absorption of fixed costs. AMES' initiative resulted in annual cash savings exceeding $10,000. Realization of savings began in the 2015 second quarter.
Clopay Building Products
Since 1964, CBP has grown, organically and through tuck-in acquisitions, to become the leading manufacturer and marketer of residential garage doors, and among the largest manufacturers of commercial sectional doors, in the U.S. In addition, CBP manufactures a complete line of entry door systems uniquely designed to complement its popular residential garage door styles. The majority of CBP’s sales come from home remodeling and renovation projects, with the balance from new residential housing construction and commercial building markets. Sales into the home remodeling market are driven by the aging of the housing stock, existing home sales activity, and the trends of improving both home appearance and energy efficiency. CBP has approximately
1,600
employees.
According to the U.S. census, calendar year 2017 new construction single-family home starts will
increase
by
5.9%
. The repair and remodel market rose 5% for the trailing twelve months ending September 2017, with modest growth expectations for the balance of the calendar year. The commercial segment saw spending rise 8% for the year (according to estimates from McGraw Hill Construction Dodge). According to industry sources, the residential and commercial sectional garage door market for calendar year 2016 was estimated to be
$2,000,000
, an
increase
of
$100,000
over the prior year.
Brands
CBP brings over 50 years of experience and innovation to the garage door industry. Our market-leading brands include Clopay®, America’s Favorite Garage Doors®, Holmes Garage Door Company® and IDEAL Door®. In past years, Clopay has been the only residential garage door brand to hold the Good Housekeeping Seal of Approval.
Products and Service
CBP manufactures a broad line of residential sectional garage doors with a variety of options, at varying prices. CBP offers garage doors made primarily from steel, plastic composite and wood, and also sells related products, such as garage door openers manufactured by third parties.
CBP also markets commercial sectional doors, which are similar to residential garage doors, but are designed to meet the more demanding performance specifications of a commercial application.
CBP has a complete line of entry door systems uniquely designed to complement its popular residential garage door styles.
Customers
CBP is currently the exclusive supplier of residential garage doors throughout North America to Home Depot and Menards. The loss of either of these customers would have a material adverse effect on CBP’s and Griffon’s business. CBP distributes its garage doors directly to customers from its manufacturing facilities and through its distribution centers located throughout the U.S. and Canada. These distribution centers allow CBP to maintain an inventory of garage doors near installing dealers and provide quick-ship service to retail and professional dealer customers.
7
Product Development
CBP product development efforts focus on both new products and improvements to existing products. Products are developed through in-house design and engineering staffs.
CBP operates a technical development center where its research engineers design, develop and implement new products and technologies and perform durability and performance testing of new and existing products, materials and finishes. CBP continually improves its garage door offerings through these development efforts, focusing on characteristics such as strength, design and energy efficiency. Also at this facility, the process engineering team works to develop new manufacturing processes and production techniques aimed at improving manufacturing efficiencies and ensuring quality-made products.
Sales and Marketing
The CBP sales and marketing organization supports our customers, consults on new product development and aggressively markets garage door solutions, with a primary focus on the North American market. CBP maintains a strong promotional presence, in both traditional and digital media. CBP developed a web application that guides consumers through an easy to use visualization and pricing program, allowing them to select the optimal door for their home.
Raw Materials and Suppliers
The principal raw material used in CBP’s manufacturing is galvanized steel. CBP also utilizes certain hardware components, as well as wood and insulated foam. All raw materials are generally available from a number of sources.
Competition
The garage door industry includes several large national manufacturers and many smaller, regional and local manufacturers. CBP competes on the basis of service, quality, price, brand awareness and product design.
CBP’s brand names are widely recognized in the building products industry. CBP believes that it has earned a reputation among installing dealers and retailers for producing a broad range of innovative, high-quality doors with industry leading lead times. CBP’s market position and brand recognition are key marketing tools for expanding its customer base, leveraging its distribution network and increasing its market share.
Distribution
CBP distributes its products through a wide range of distribution channels, including a national network of
51
distribution centers. Additionally, products are sold to approximately
2,000
independent professional installing dealers and to major home center retail chains. CBP maintains strong relationships with its installing dealers and believes it is the largest supplier of residential garage doors to the retail and professional installing channels in North America.
Manufacturing
CBP has completed a 250,000 square foot expansion of its state-of-the-art manufacturing facility in Troy, Ohio. This expansion reflects increased customer demand for its core products, and CBP's success in bringing new technologies to market. The Troy facility now has 1.23 million square feet of combined manufacturing and office space. CBP’s Russia, Ohio facility provides additional production capacity, particularly for specialized and custom products.
ClosetMaid
ClosetMaid, founded in 1965 and acquired by Griffon on October 2, 2017, is a leading North American manufacturer and marketer of closet organization, home storage, and garage storage products, and sells to some of the largest home center retail chains, mass merchandisers, and direct-to-builder professional installers in North America. ClosetMaid designs, manufactures and sells a comprehensive portfolio of wire and laminate shelving, containers, storage cabinets and other closet and home organization accessories under the highly recognized ClosetMaid brand name and other private label brands. ClosetMaid is headquartered in Ocala, Florida, and currently employs approximately 1,500 people. None of ClosetMaid’s employees in the U.S. are represented by a union or covered by a collective bargaining agreement.
Due to the acquisition of ClosetMaid occurring subsequent to Griffon's fiscal year end, ClosetMaid's results of operations, assets and liabilities were not included in Griffon's results of operations or balance sheet.
8
ClosetMaid offers a diversified and well-balanced mix of wood and wire storage and organizational solutions. ClosetMaid’s wood solutions include closet systems, cube storage, storage furniture and cabinets targeted at customers looking for functional storage with a strong aesthetic appeal and the look of quality furniture. Selected wood product brands include MasterSuite, Suite Symphony, Impressions, ExpressShelf, and SpaceCreations.
ClosetMaid’s wire solutions include wire shelving and hardware, wire accessories and kitchen storage products that provide affordable, customizable, versatile and durable solutions for single and multi-family homes. Selected wire product brands include Maximum Load, SuperSlide and ShelfTrack.
Raw Materials and Suppliers
ClosetMaid’s primary raw materials are particleboard wood and wire rod. ClosetMaid purchases its wood supply primarily from three suppliers in the United States and Mexico (for its particleboard) and Asia (for its finished goods). Wire supply comes primarily from Jacksonville, Florida (for wire rod used in shelving) and Asia (for small wire).
Manufacturing, Distribution and Operations
ClosetMaid has two manufacturing facilities in the United States; a 620,000 square foot facility in Ocala, Florida used for manufacturing wire shelving, and a 155,000 square foot facility in Grantsville, Maryland used for wood manufacturing. ClosetMaid also has manufacturing facilities in two low-cost locations, a 102,000 square foot facility in Reynosa, Mexico used for wood manufacturing and a 157,000 square foot facility in Jiangmen, China used for small wire manufacturing.
Finished goods are transported by truck and rail to ClosetMaid’s distribution/warehousing centers, strategically located in Ocala, Florida, Chino, California, Belle Vernon, Pennsylvania and Pharr, Texas.
In response to its rapid growth in e-commerce, ClosetMaid has implemented wave picking at distribution centers. Orders are grouped into batches, or “waves”, enabling employees to collect items all at once for multiple orders (split order capability vs. pickers checking out individual orders as they come in). Order pickers gather items within the wave using a consolidated pick list, reducing travel time by allowing them to make picks for multiple orders in the same area. Warehouse Management System (WMS) tools support organizing the daily flow of work and enable fulfillment processing, picking efficiencies, improvements in product flow, and simplified/visible order pulls.
Competition
The home storage and organizational solutions industry is highly fragmented. ClosetMaid sells through retail, direct to consumer (e-commerce category) and direct to installer (building) channels and competes with a significant number of companies across each of these unique channels. ClosetMaid’s strengths are its highly recognized brand, broad portfolio of quality products and services, product differentiation, successful history of innovation, dependable supply-chain and high on-time delivery rates. ClosetMaid’s leading industry position and brand recognition are key to expanding its customer base, entering new adjacencies and driving continued growth. We believe that ClosetMaid is approximately twice the size of its two largest competitors.
Customers
ClosetMaid’s large customer base is diversified among various industries. Key retail customers of ClosetMaid include Home Depot, Target, Lowes and Walmart and building customers include D.R. Horton, KB Home, Lennar and NVR. In 2017, Home Depot and Target accounted for approximately 48% and 10% of ClosetMaid’s sales, respectively. No other customer accounted for 10% or more of ClosetMaid’s sales during such period.
9
Research and Development
ClosetMaid continually improves existing products as well as develops new products to satisfy consumer needs, expand revenue opportunities, maintain or extend competitive advantages, increase market share and reduce production costs.
Telephonics Corporation
Telephonics, founded in 1933, is recognized globally as a leading provider of highly sophisticated intelligence, surveillance and communications solutions that are deployed across a wide range of land, sea and air applications. Telephonics designs, develops, manufactures and provides logistical support and lifecycle sustainment services to defense, aerospace and commercial customers worldwide. In 2017, approximately
66%
of the segment’s sales were to the U.S. Government and agencies thereof, as a prime or subcontractor,
29%
to international customers and
5%
to U.S. commercial customers. Telephonics is headquartered in Farmingdale, New York and currently has approximately
1,000
employees.
Telephonics is organized into five primary business lines: Radar Systems, Communications and Surveillance, Systems Engineering Commercial Products and Telephonics Large Scale Integration (TLSI). Radar Systems specializes in maritime surveillance, search and rescue, and weather surveillance solutions. Communications and Surveillance Systems provides intercommunication systems with wireless extensions that distribute voice and data on a variety of platforms, Identification Friend or Foe (IFF) interrogators, border surveillance systems and Air Traffic Management (ATM) products. Telephonics’ Systems Engineering Group (SEG) provides highly technical threat and radar systems engineering as well as analytic support to a wide range of customers, including the United States Missile Defense Agency and Ballistic Missile Defense Program. Commercial Products specializes in commercial audio products. TLSI is a full-service designer and provider of high-voltage, high-temperature, low-power, mixed-signal System-on-Chip (SoC) and custom Application Specific Integrated Circuits (ASICs).
To meet the unique challenges of operating in an increasingly complex industry that is faced with continued economic and budgetary pressure on U.S. defense procurement, Telephonics has adapted its core surveillance and communications products, typically used by the U.S. government and its agencies, to meet the needs of international customers in both defense and commercial markets. Telephonics' two largest product lines include maritime surveillance radar and aircraft intercommunication management systems and as Telephonics continues to concentrate on adjacent markets to grow these product lines both domestically and internationally, the company remains focused on delivering high-quality products and services that protect military personnel and civilian interests world-wide.
Telephonics’ leading-edge products and services are well-positioned to address the needs of a fully integrated and modernized battlefield with an emphasis on providing complete situational awareness to the warfighter whether on the ground, in the air or at sea, providing timely, secure and accurate intelligence. Telephonics anticipates that the need for secure, integrated surveillance and communications capabilities will continue to increase as the U.S. and foreign militaries expand their role in fighting terrorism both at home and abroad. Telephonics has also invested in design and development of technologies focused on advanced intelligence and surveillance sensors with applications in both manned and unmanned systems, as well as border and perimeter security markets.
Telephonics is a partner in Mahindra Telephonics Integrated Systems, a Joint Venture (JV) with Mahindra Defense Systems in India. The business is focused on providing the Indian defense and civil sectors with surveillance, communications and IFF systems. The JV also intends to provide ATM, border and perimeter security and other surveillance technologies to meet emerging demands.
Programs and Products
Based on long-established relationships supported by existing contractual arrangements, Telephonics is a first-tier supplier to prime contractors in the defense industry such as Lockheed Martin Corporation ("Lockheed Martin"), The Boeing Company ("Boeing"), Northrop Grumman Corporation ("Northrup Grumman"), MacDonald Dettwiler and Associates Ltd., Airbus Military, Airbus Helicopters, Leonardo (Agusta Westland) Helicopters, and SAAB, and is at times a prime contractor to the U.S. Department of Defense. The significance of each of these customers to Telephonics’ revenue fluctuates on an annual basis, based on the timing and funding of the Original Equipment Manufacturers (“OEM”) contract award, and the technological scope of the work required. The significant contraction and consolidation in the U.S. and international defense industry provides opportunities for established first-tier suppliers to capitalize on existing relationships with major prime contractors and to play a larger role in defense systems development and procurement for the foreseeable future.
Telephonics continues to direct resources towards border surveillance and critical infrastructure security initiatives. These opportunities represent strategic advances for Telephonics by enabling it to expand its core technical expertise into the nascent and growing border and perimeter security markets, both in the U.S. and abroad. With many of these programs, system specifications
10
and operational and test requirements are challenging, exacerbated by demanding delivery schedules. Telephonics believes that the technological capabilities these systems encompass will also be able to serve and protect the most complex borders.
In 2016, Telephonics was awarded a contract from Oshkosh Defense, LLC for NetCom™ Vehicle Intercommunications Systems to be integrated onto the company's Joint Light Tactical Vehicle (JLTV) for the U.S. Army and Marine Corps. The faster and more agile JLTV will replace a portion of the military's current fleet of up-armored HMMWVs. With the additional capabilities of NetCom, these vehicles will further enhance the situational awareness and safety of U.S. troops via clear and secure communications.
In 2015, Telephonics received a contract award from the Metropolitan Transportation Authority via the Long Island Rail Road, as well as continued performance under existing contracts and additional awards from the Federal Aviation Administration. We believe these recent customer relationships will position Telephonics to continue growing in these adjacent commercial markets through leveraging its core technology and production capabilities.
Backlog
The funded backlog for Telephonics approximated
$350,900
at
September 30, 2017
, compared to
$420,000
at
September 30, 2016
. Approximately
70%
of the current backlog is expected to be filled during
2018
.
Backlog represents the dollar value of funded orders for which work has not been performed. Backlog generally increases with bookings and converts into revenue as we incur costs related to contractual commitments or the shipment of product. The decrease in backlog was primarily attributed to the timing of various international contract awards associated with radar and surveillance opportunities that were not received by the end of the reporting period. Given the nature of our business and a larger dependency on international customers, our bookings, and therefore our backlog, is impacted by the longer maturation cycles resulting in delays in the timing and amounts of such awards, which are subject to numerous factors, including fiscal constraints placed on customer budgets; political uncertainty; the timing of customer negotiations; and the timing of governmental approvals.
Customers
The U.S. Government, through prime contractors like Lockheed Martin, Northrop Grumman and Boeing, is a significant customer of Telephonics. The loss of the U.S. Government or any of its prime contractors as a customer could have a material adverse effect on Telephonics’ business. Notwithstanding the significance of Lockheed Martin, Northrop Grumman and Boeing, Telephonics sells to a diverse group of other domestic and international defense industry contractors, as well as others who use Telephonics products for commercial use.
Telephonics participates in a range of long-term defense and non-military government programs, both in the U.S. and internationally. Telephonics has developed a base of installed products that generate significant recurring revenue from product enhancements and retrofits, as well as providing spare parts and customer support. Due to the inherent complexity of these electronic systems, Telephonics believes that its incumbent status on major platforms provides a competitive advantage in the selection process for platform upgrades and enhancements. Furthermore, Telephonics believes that its ability to leverage and apply its advanced technology to new platforms provides a competitive advantage when bidding for new business.
Research and Development ("R&D")
In order to continue to offer affordable solutions that provide relevant and required features, Telephonics works closely with prime customers to ensure that there is a future market for its products by investing R&D funds in desired enhancements. Telephonics continually updates its core technologies through internally funded R&D while coordinating with customers at the earliest stages of new program development in an effort to provide solutions well in advance of its competitors. Internally funded R&D costs include basic and applied research initiatives, development activities, and other conceptual formulation studies. Telephonics is a technological leader in its core markets and pursues new growth opportunities by leveraging its systems design and engineering capabilities, and incumbent position, on key platforms.
In addition to products for defense programs, Telephonics' technology is also used in commercial applications such as airborne weather, search and rescue radar, and air traffic management systems. Telephonics’ reputation for innovative product design and engineering capabilities, especially in the areas of voice and data communications, radio frequency design, digital signal processing, networking systems, inverse synthetic aperture radar and analog, digital and mixed-signal integrated circuits, will continue to enhance its ability to secure, retain and expand its participation in defense programs and commercial opportunities.
11
Telephonics often designs its products to exceed customers’ minimum specifications, providing its customers with greater performance, flexibility, and value. Telephonics believes that early participation and communication with its customers in the requirements definition stages of new program development increases the likelihood that its products will be selected and integrated as part of a total system solution.
Sales and Marketing
Telephonics has technical business development personnel who act as the focal point for its marketing activities and sales representatives who introduce its products and systems to customers worldwide.
Competition
Telephonics competes with major manufacturers of electronic information and communication systems, as well as several smaller manufacturers of similar products. Telephonics endeavors to design high quality and reliable products with greater performance and flexibility than its competitors while competing on the basis of technology, innovative solutions, and price.
Manufacturing Facilities
Telephonics’ facilities are located in the U.S., primarily in New York. Telephonics also maintains a Technical Support Services Center in Elizabeth City, North Carolina, which supports aircraft integration and upgrade activities in addition to providing support services to customers.
Clopay Plastic Products - Discontinued Operations
On September 5, 2017, Griffon announced that after having received from qualified parties unsolicited inquiries to acquire PPC, Griffon will explore strategic alternatives for PPC, and on November 16, 2017, announced it entered into a definitive agreement to sell PPC to Berry for $475 million in cash. The transaction is subject to regulatory approval and customary closing conditions, and is expected to close in the first quarter of calendar 2018. As a result, Griffon classified the results of operations of the PPC business as discontinued operations in the Consolidated Statements of Operations for all periods presented and classified the related assets and liabilities associated with the discontinued operations as held for sale in the consolidated balance sheets. All results and information presented exclude PPC unless otherwise noted.
PPC traces its history to the 1860s as a paper wholesaler, and was incorporated under the Clopay name in 1934 when it was primarily a manufacturer of paper products. In the 1950s, PPC expanded its product line to include extruded plastic products, and today PPC is a global leader in the development and production of embossed, laminated and printed specialty plastic films for hygienic, health-care and industrial products. Products include thin gauge embossed and printed films, elastomeric films, laminates of film and non-woven fabrics, and perforated films and non-wovens. These products are used as moisture barriers in disposable infant diapers, adult incontinence products and feminine hygiene products, protective barriers in single-use surgical and industrial gowns, drapes and equipment covers, fluid transfer/distribution layers in absorbent products, components to enhance comfort and fit in infant diaper and adult incontinence products, and as packaging for hygienic products, house wrap and other products. PPC products are sold through a direct sales force, primarily to multinational consumer and medical products companies. PPC employs approximately
1,500
employees.
The markets in which PPC participates have been affected by several key trends over the past
five years
. These trends include increased use of disposable products in developing countries and favorable demographics, including increasing immigration in major global economies. Other trends representing significant opportunities include the continued demand for innovative products such as cloth-like, breathable, laminated and printed products, and large consumer products companies’ needs for global supply partners. Notwithstanding positive trends affecting the industry, product design changes by the customer can change the products manufactured by PPC and associated demand.
PPC believes that its business development activities targeting major multinational and regional producers of hygiene, healthcare and related products, and its investments in its technology development capability and capacity increases, will lead to additional sales of new and related products.
Products
PPC specialty plastic film is a thin-gauge film engineered to provide certain performance characteristics and is manufactured from polymer resins. A laminate is the combination of a plastic film and a woven or non-woven fabric. These products are produced using both cast and blown extrusion and various laminating processes. High speed, multi-color custom printing of films, customized
12
embossing patterns, siliconization and proprietary perforation technology further differentiate our products. Specialty plastic film products typically provide a unique combination of performance characteristics, such as breathability, barrier properties, fluid flow management, elastic properties, processability and aesthetic appeal that meet specific, proprietary customer needs.
Customers
PPC largest customer is The Procter & Gamble Company (“P&G”), which has accounted for approximately half of PPC's revenue over the last
five years
. The loss of this customer would have a material adverse effect on each of PPC's and Griffon's business. Notwithstanding the significance of P&G, PPC sells to a diverse group of other leading consumer, health care and industrial companies.
Product Development
PPC is an industry leader in the research, design and development of specialty plastic film and laminate products. PPC operates a technical center where polymer chemists, scientists and engineers work independently and in partnership with customers to develop new technologies, products, processes and product applications.
PPC's R&D efforts have resulted in many inventions covering embossing patterns, improved processing methods, product formulations, product applications and other proprietary technology. Products developed include microporous breathable films and cost-effective printed films and laminates. Microporous breathability provides for moisture vapor transmission and airflow while maintaining barrier properties resulting in improved comfort and skin care. Elastic laminates provide the user with improved comfort and fit. Printed films and laminates provide consumer preferred aesthetics, such as softness and visual appeal. Perforated films and non-wovens provide engineered fluid transfer with unique softness and aesthetics. Siliconization provides a mechanism to release hygiene product from film without damaging the product. PPC holds a number of patents for its specialty film and laminate products and related manufacturing processes. While patents play a significant role, PPC believes that its proprietary know-how and the knowledge, ability and experience of its employees are more significant to its long-term success.
In April 2016, PPC announced a Sof-flex® breathable film investment which will expand breathable film capacity in North America, Europe and Brazil, increase PPC's extrusion and print capacity, and enhance its innovation and technology capabilities. We expect the project to be completed in fiscal 2018. These investments will allow PPC to maintain and extend its technological advantage and allow PPC to differentiate itself from competitors, while meeting increasing customer demand for lighter, softer, more cost effective and more environmentally friendly products.
Sales and Marketing
PPC sells its products primarily in North America, Europe, and South and Central America with additional sales in Asia Pacific, the Middle East and Africa. PPC primarily utilizes an internal direct sales force, with senior management actively participating in developing and maintaining close contacts with customers.
PPC seeks to expand its market presence by providing innovative products and services to major international consumer products companies. Specifically, PPC believes that it can continue to increase its North American sales and expand internationally through ongoing product development and enhancement, and by marketing its technologically-advanced films, laminates and printed films for use in all of its markets.
Raw Materials and Suppliers
Plastic resins, such as polyethylene and polypropylene, and non-woven fabrics are the basic raw materials used in the manufacture of substantially all PPC products. The price of resin has fluctuated dramatically over the past
five years
primarily due to volatility in oil and natural gas prices, foreign exchange and producer capacity. PPC customer contracts generally provide for adjusting selling prices based on underlying resin costs on a delayed basis. Resins are purchased in pellet form from several suppliers. Sources for raw materials are believed to be adequate for current and anticipated needs.
Competition
PPC has a number of competitors, some of whom are larger, in the specialty plastic films and laminates market. PPC competes on quality, service and price using its technical expertise, product development capabilities and broad international footprint to enhance its market position, build and maintain long-term customer relationships and meet changing customer needs.
13
Manufacturing
Specialty plastic film and laminate products are manufactured using high-speed equipment designed to meet stringent tolerances. The manufacturing process consists of melting a mixture of polymer resins and additives, and forcing this mixture through a combination of die and rollers to produce thin films. Laminates of films and non-wovens are manufactured by a variety of techniques to meet customer needs. In addition, films and laminates can be printed.
PPC's U.S. manufacturing facilities are in Augusta, Kentucky and Nashville, Tennessee from which it sells plastic films and laminates throughout the U.S. and various parts of the world. PPC has two manufacturing facilities in Germany from which it sells plastic films throughout Europe, the Middle East and Africa. PPC also has operations in Brazil and China, which manufacture plastic hygienic and specialty films.
In 2016, PPC recorded $5,900 in restructuring charges, primarily related to headcount reductions at PPC's Dombuhl, Germany facility, other location headcount reductions and the shutdown of PPC's Turkey facility. The Dombuhl charges were related to an optimization plan to drive innovation and enhance our industry leading position in printed breathable backsheet. The facility is being transformed into a state of the art hygiene products facility focused on breathable printed film and siliconized products. In conjunction with this effort, PPC's customer base will be streamlined, and PPC will dispose of old assets and reduce overhead costs, allowing for gains in efficiencies.
Intellectual Property
Patents are significant to PPC. Technology evolves rapidly in the plastics business, and PPC's customers are constantly striving to offer products with innovative features at a competitive price to the end consumer. As a result, PPC constantly seeks to offer new and innovative products to its customers. PPC has 22 issued patents and 9 pending patent applications in the U.S., and 125 corresponding foreign patents and patent applications, primarily covering breathable and elastic polymer films and laminates for use in personal hygiene applications, as well as innovative technologies that are extensions of our core capabilities.
Griffon Corporation
Employees
As of September 30, 2017, Griffon and its subsidiaries employ approximately
4,700
people located primarily throughout the U.S., Canada, Europe, Australia and China. Approximately
200
of these employees are covered by collective bargaining agreements in the U.S., with the United Steel, Paper and Forestry, Rubber, Manufacturing, Energy, Allied Industrial and Service Workers International Union (an affiliate of the American Federation of Labor and Congress of Industrial Organizations), and the United Food & Commercial Workers International Union. Additionally, approximately
200
employees in Canada are represented by the Trade Union Advisory Committee. Griffon believes its relationships with its employees are satisfactory. With the inclusion of the ClosetMaid acquisition on October 2, 2017, Griffon and its subsidiaries employ approximately 6,200 people.
Generally, the total number of employees of Griffon and its subsidiaries does not significantly fluctuate throughout the year. However, acquisition activity or the opening of new branches or lines of business may increase the number of employees or fluctuations in the level of Griffon's business activity, which could in turn require staffing level adjustments in response to actual or anticipated customer demand.
Regulation
Griffon’s operations are subject to various environmental, health, and employee safety laws and regulations. Griffon believes that it is in material compliance with these laws and regulations. Historically, compliance with environmental laws has not materially affected, and is not expected to materially affect, Griffon’s capital expenditures, earnings or competitive position in the future. Nevertheless, Griffon cannot guarantee that, in the future, it will not incur additional costs for compliance or that such costs will not be material.
Telephonics, which sells directly and indirectly to the U.S. government, is subject to certain regulations, laws and standards set by the U.S. government. Additionally, Telephonics is subject to routine audits and investigations by U.S. Government Agencies such as the Defense Contract Audit Agency, the Defense Security Service, with respect to its classified contracts, and other Inspectors General. These agencies review a contractor’s performance under its contracts, cost structure and compliance with applicable laws, regulations and standards, including those relating to facility and personnel security clearances. These agencies also review the adequacy of, and a contractor’s compliance with, its internal control systems and policies, including the contractor’s management, purchasing, property, estimating, compensation, and accounting and information systems.
14
Customers
A small number of customers account for, and are expected to continue to account for, a substantial portion of Griffon’s consolidated revenue from continuing operations. In
2017
:
|
a.
|
The U.S. Government and its agencies, through prime and subcontractor relationships, represented 18% of Griffon’s consolidated revenue and 66% of Telephonics' revenue.
|
|
b.
|
Home Depot represented 17% of Griffon’s consolidated revenue and 23% of HBP's revenue.
|
No other customer accounted for
10%
or more of consolidated revenue. Future operating results will continue to substantially depend on the success of Griffon’s largest customers and our relationships with them. Orders from these customers are subject to change and may fluctuate materially. The loss of all or a portion of volume from any one of these customers could have a material adverse impact on Griffon’s financial results, liquidity and operations.
Seasonality
Historically, Griffon’s revenue and income were lowest in our
first
and
fourth
quarters ending
December 31,
and
September 30,
respectively, and highest in our
second
and
third
quarters ending
March 31,
and
June 30,
respectively, primarily due to the seasonality of AMES' business. In 2017,
55%
of AMES' sales occurred during the second and third quarters compared to
56%
in both 2016 and 2015. CBP’s business is driven by residential renovation and construction during warm weather, which is generally at reduced levels during the winter months, generally in our second quarter.
ClosetMaid’s revenue and income has historically been the lowest in the second quarter ended March 31 and highest in the first quarter ended December 30, due to the holiday season.
Griffon's revenue is still expected to be lowest in the first and fourth quarters, subject to variations in weather and the related impact on AMES.
Demand for lawn and garden products is influenced by weather, particularly weekend weather during peak gardening season. AMES' sales volume can be adversely affected by certain weather patterns such as unseasonably cool or warm temperatures, hurricanes, water shortages or floods. In addition, lack of snow or lower than average snowfall during the winter season may result in reduced sales of certain AMES products, such as snow shovels and other snow tools. As a result, AMES' results of operations, financial results and cash flows could be adversely impacted.
Financial Information About Geographic Areas
Segment and operating results are included in Item 7, Management’s Discussion and Analysis of Financial Condition and Results of Operations.
For geographic financial information, see the Reportable Segment footnote in the Notes to Consolidated Financial Statements in Item 8, Financial Statements and Supplementary Data.
Griffon’s non-U.S. businesses are primarily in Canada, Australia, the United Kingdom, Mexico and China.
Research and Development
Griffon’s businesses are encouraged to improve existing products as well as develop new products to satisfy customer needs; expand revenue opportunities; maintain or extend competitive advantages; increase market share and reduce production costs. R&D costs, not recoverable under contractual arrangements, are charged to expense as incurred. R&D costs for Griffon were
$17,700
in
2017
,
$18,000
in
2016
and
$15,800
in
2015
.
Intellectual Property
Griffon follows a practice of actively protecting and enforcing its proprietary rights in the U.S. and throughout the world where Griffon’s products are sold. All intellectual property information presented in this section is as of September 30, 2017.
Trademarks are of significant importance to Griffon’s HBP business. With 50 years of experience and innovation in the garage door industry, and with Clopay being the only residential garage door brand to hold the Good Housekeeping Seal of Approval, CBP has a significant level of goodwill in its strong family of brands, including: Clopay®, America’s Favorite Garage Doors®; Holmes Garage Door Company® and IDEAL Door®. Principal global and regional trademarks used by AMES include AMES®, True Temper®, Garant®, UnionTools®, Hound Dog®, Westmix™, Cyclone®, Trojan®, Southern Patio®, Northcote Pottery™,
15
Kelso™, Dynamic Design™, Razor-Back® Professional Tools and Jackson® Professional Tools. With over 50 years of experience and innovation in the storage and organization industry, ClosetMaid has numerous brands that are well-recognized and valued by consumers, including ClosetMaid, ShelfTrack, Cubeicals, Selectives and MasterSuite. The HBP business has approximately 949 registered trademarks and approximately 86 pending trademark applications around the world. Griffon’s rights in these trademarks endure for as long as they are used and registered.
Patents are also important to our HBP business. CBP holds 18 issued patents in the U.S., as well as 11 corresponding foreign patents, primarily related to garage door system components. AMES protects its designs and product innovation through the use of patents, and currently has 272 issued patents and 28 pending patent applications in the U.S., as well as 290 and 28 corresponding foreign patents and patent applications, respectively. ClosetMaid has 64 issued patents and 9 pending patent applications in the U.S., as well as 4 and 3 corresponding foreign patents and pending patent applications, respectively. ClosetMaid’s patents are in various stages of their terms of validity. Design patents are generally valid for fourteen years, and utility patents are generally valid for twenty years, from the date of filing. Our patents are in various stages of their terms of validity.
In the government and defense business, formal intellectual property rights are of limited value. Therefore, our Telephonics business tends to hold most of its important intellectual property as trade secrets, which it protects through the use of contract terms and carefully restricting access to its technology.
Executive Officers of the Registrant
The following is a current list of Griffon’s executive officers:
|
Name
|
Age
|
Positions Held and Prior Business Experience
|
||
|
Ronald J. Kramer
|
59
|
Chief Executive Officer since April 2008, Director since 1993, Vice Chairman of the Board since November 2003. From 2002 through March 2008, President and a Director of Wynn Resorts, Ltd., a developer, owner and operator of destination casino resorts. From 1999 to 2001, Managing Director at Dresdner Kleinwort Wasserstein, an investment banking firm, and its predecessor Wasserstein Perella & Co. Member of the board of directors of Business Development Corporation of America. Formerly on the board of directors of Leap Wireless International, Inc. (NASDAQ: LEAP). Mr. Kramer is the son-in-law of Harvey R. Blau, Griffon’s Chairman of the Board.
|
||
|
Robert F. Mehmel
|
55
|
President and Chief Operating Officer since December 2012. From August 2008 to October 2012, President and Chief Operating Officer of DRS Technologies (“DRS”), a supplier of integrated products, services and support to military forces, intelligence agencies and prime contractors worldwide. From May 2006 to August 2008, Executive Vice President and Chief Operating Officer of DRS and from January 2001 to May 2006, Executive Vice President, Business Operations and Strategy, of DRS.
|
||
|
Brian G. Harris
|
48
|
Senior Vice President and Chief Financial Officer since August 2015. From November 2012 to July 2015, Vice President and Controller of Griffon. From July 2009 to July 2015, Griffon's Chief Accounting Officer. From May 2005 to June 2009, Assistant Controller of Dover Corporation, a diversified global manufacturer (NYSE: DOV). Prior to this time, held various finance and accounting roles with Hearst Argyle Television (Formerly NYSE: HTV), John Wiley and Sons, Inc. (NYSE: JW.A) and Arthur Andersen, LLP.
|
||
|
Seth L. Kaplan
|
48
|
Senior Vice President, General Counsel and Secretary since May 2010. From July 2008 to May 2010, Assistant General Counsel and Assistant Secretary at Hexcel Corporation, a manufacturer of advanced composite materials for space and defense, commercial aerospace and wind energy applications. From 2000 to July 2008, Senior Corporate Counsel and Assistant Secretary at Hexcel. From 1994 to 2000, associate at the law firm Winthrop, Stimson, Putnam & Roberts (now Pillsbury Winthrop Shaw Pittman LLP).
|
||
Griffon’s business, financial condition, operating results and cash flows can be impacted by a number of factors which could cause Griffon’s actual results to vary materially from recent or anticipated future results. The risk factors discussed in this section should be carefully considered with all of the information in this Annual Report on Form 10-K. These risk factors should not be considered the only risk factors facing Griffon. Additional risks and uncertainties not presently known or that are currently deemed immaterial may also materially impact Griffon’s business, financial condition, operating results and cash flows in the future.
In general, Griffon is subject to the same general risks and uncertainties that impact other diverse manufacturing companies including, but not limited to, general economic, industry and/or market conditions and growth rates; impact of natural disasters
16
and their effect on global markets; continued events in the Middle East and Asia and possible future terrorist threats and their effect on the worldwide economy; and changes in laws or accounting rules. Griffon has identified the following specific risks and uncertainties that it believes have the potential to materially affect its business and financial condition.
Current worldwide economic uncertainty and market volatility could adversely affect Griffon’s businesses.
The current worldwide economic uncertainty and market volatility could continue to have an adverse effect on Griffon during
2018
, particularly in HBP, which is substantially linked to the U.S. housing market and the U.S. economy in general. Purchases of AMES' products are discretionary for consumers who are generally more willing to purchase products during periods in which favorable macroeconomic conditions prevail. Additionally, the current condition of the credit markets could impact Griffon’s ability to refinance expiring debt, obtain additional credit for investments in current businesses or for acquisitions, with favorable terms, or may render financing unavailable. Griffon is also exposed to basic economic risks including a decrease in the demand for the products and services it offers or a higher likelihood of default on its receivables.
Adverse trends in the housing sector and in general economic conditions will directly impact Griffon’s business.
HBP’s business is influenced by market conditions for new home construction and renovation of existing homes. For the year ended
September 30, 2017
, approximately
73%
of Griffon’s consolidated revenue was derived from the HBP segment, which is heavily dependent on new home construction and renovation of existing homes. The strength of the U.S. economy, the age of existing home stock, job growth, interest rates, consumer confidence and the availability of consumer credit, as well as demographic factors such as migration into the U.S. and migration of the population within the U.S., also have an effect on HBP. To the extent market conditions for new home construction and renovation of existing home are weaker than expected, this will likely have an adverse impact on the performance and financial results of the HBP business.
Griffon operates in highly competitive industries and may be unable to compete effectively.
Griffon’s operating companies face intense competition in each of the markets served. Griffon competes primarily on the basis of technical expertise, product differentiation quality of products and services, and competitive prices. There are a number of competitors to Griffon, some of which are larger and have greater resources than Griffon’s operating companies. As the economy continues to become more global, Griffon's operating companies may face additional competition from companies that operate in countries with significantly lower operating costs.
Many of HBP’s customers are large mass merchandisers, such as discount stores, home centers, warehouse clubs, office superstores, commercial distributors and e-commerce companies. The growing share of the market represented by these large mass merchandisers, together with changes in consumer shopping patterns, has contributed to the increase of multi-category retailers and e-commerce companies that have strong negotiating power with suppliers. Many of these retailers import products directly from foreign sources to source and sell products under their own private label brands to compete with HBP’s products, which puts increasing price pressure on our products. In addition, the intense competition in the retail and e-commerce sectors, combined with the overall increasingly competitive economic environment, may result in a number of customers experiencing financial difficulty, or failing in the future. The loss of, or a failure by, one of HBP’s large customers could adversely impact HBP’s sales and operating cash flows.
To address all of these challenges, HBP must be able to respond to these competitive pressures, and the failure to respond effectively could result in a loss of sales, reduced profitability and a limited ability to recover cost increases through price increases. In addition, there can be no assurance that Griffon will not encounter increased competition in the future, which could have a material adverse effect on Griffon’s financial results.
The loss of large customers can harm financial results.
A small number of customers account for, and are expected to continue to account for, a substantial portion of Griffon's consolidated revenue. Home Depot, Lowe’s, Menards and Bunnings are significant customers of HBP with Home Depot accounting for approximately
17%
of consolidated revenue and
23%
of HBP's revenue for the year ended
September 30, 2017
. The U.S. Government and its agencies and subcontractors, including Lockheed Martin and Boeing, is a significant customer of Telephonics, and together accounts for approximately
18%
of consolidated revenue and
66%
of Telephonics segment revenue (Lockheed Martin and Boeing each represent less than 10% of consolidated revenue inclusive of such sales to the U.S. Government). Future operating results will continue to substantially depend on the success of Griffon’s largest customers, as well as Griffon’s relationship with them. Orders from these customers are subject to fluctuation and may be reduced materially due to changes in customer needs or other factors. Any reduction or delay in sales of products to one or more of these customers could significantly reduce Griffon’s
17
revenue. Griffon’s operating results will also depend on successfully developing relationships with additional key customers. Griffon cannot assure that its largest customers will be retained or that additional key customers will be recruited. Also, HBP extends credit to its customers, which exposes it to credit risk. HBP’s largest customer accounted for approximately
26%
and
19%
of HBP’s and Griffon’s net accounts receivable as of
September 30, 2017
, respectively. If this customer were to become insolvent or otherwise unable to pay its debts, the financial condition, results of operations and cash flows of HBP and Griffon could be adversely affected.
Reliance on third party suppliers and manufacturers may impair AMES
'
ability to meet its customer demands.
AMES relies on a limited number of domestic and foreign companies to supply components and manufacture certain of its products. The percentage of AMES products sourced, based on revenue, approximated
40%
in
2017
. Reliance on third party suppliers and manufacturers may reduce control over the timing of deliveries and quality of AMES' products. Reduced product quality or failure to deliver products timely may jeopardize relationships with certain of AMES' key customers. In addition, reliance on third party suppliers or manufacturers may result in the failure to meet AMES' customer demands. Continued turbulence in the worldwide economy may affect the liquidity and financial condition of AMES' suppliers. Should any of these parties fail to manufacture sufficient supply, go out of business or discontinue a particular component, alternative suppliers may not be found in a timely manner, if at all. Such events could impact AMES' ability to fill orders, which could have a material adverse effect on customer relationships.
If Griffon is unable to obtain raw materials for products at favorable prices it could adversely impact operating performance.
HBP’s suppliers primarily provide resin, wood, steel and wire rod. These segments could experience shortages of raw materials or components for products or be forced to seek alternative sources of supply. If temporary shortages due to disruptions in supply caused by weather, transportation, production delays or other factors require raw materials to be secured from sources other than current suppliers, the terms may not be as favorable as current terms or certain materials may not be available at all. In recent years, HBP has experienced price increases in steel and plastic resins.
While most key raw materials used in Griffon’s businesses are generally available from numerous sources, raw materials are subject to price fluctuations. Because raw materials in the aggregate constitute a significant component of the cost of goods sold, price fluctuations could have a material adverse effect on Griffon’s results of operations. Griffon’s ability to pass raw material price increases to customers is limited due to supply arrangements and competitive pricing pressure, and there is generally a time lag between increased raw material costs and implementation of corresponding price increases for Griffon’s products. In particular, sharp increases in raw material prices are more difficult to pass through to customers and may negatively affect short-term financial performance.
AMES and ClosetMaid are subject to risks associated with sourcing from Asia.
A substantial amount of AMES finished goods sourcing is done through supply agreements with China based vendors, and ClosetMaid sources a substantial amount of raw material from China. China does not have a well-developed, consolidated body of laws governing agreements with international customers. Enforcement of existing laws or contracts based on existing law may be uncertain and sporadic, and it may be difficult to obtain swift and equitable enforcement or to obtain enforcement of a judgment by a court of another jurisdiction. The relative inexperience of China’s judiciary on matters of international trade in many cases creates additional uncertainty as to the outcome of any litigation. In addition, interpretation of statutes and regulations may be subject to government policies reflecting domestic political changes. Products entering from China may be subject to import quotas, import duties and other restrictions. Any inability to import these products into the U.S. and any tariffs that may be levied with respect to these products may have a material adverse result on AMES' or ClosetMaid's business and results of operations, financial position and cash flows.
Griffon’s businesses are subject to seasonal variations and the impact of uncertain weather patterns.
Historically, Griffon’s revenue and income are lowest in our
first
and
fourth
quarters ending
December 31,
and
September 30,
respectively, and highest in our
second
and
third
quarters ending
March 31,
and
June 30,
respectively, primarily due to the seasonality of AMES' business. With the 2014 acquisition of Northcote and Cyclone, and the 2017 acquisitions of Hills, La Hacienda and Tuscan Path, AMES' revenue is less susceptible to seasonality. In
2017
,
55%
of AMES' sales occurred during the second and third quarters compared to
56%
in both 2016 and 2015. CBP’s business is driven by residential renovation and construction during warm weather, which is generally at reduced levels during the winter months, generally in our second quarter.
18
tMaid’s revenue and income are historically the lowest in the second quarter ended March 31 and highest in the first quarter ended December 30, primarily due to the holiday season.
Griffon's revenue is still expected to be lowest in the first and fourth quarters, subject to variations in weather and the related impact on AMES.
Demand for lawn and garden products is influenced by weather, particularly weekend weather during the peak gardening season. AMES sales volumes could be adversely affected by certain weather patterns such as unseasonably cool or warm temperatures, hurricanes, water shortages or floods. In addition, lack of snow or lower than average snowfall during the winter season may result in reduced sales of certain AMES products, such as snow shovels and other snow tools. As a result, AMES' results of operations, financial results and cash flows could be adversely impacted.
Each of our Griffon's businesses faces risks related to the disruption of its primary manufacturing facilities.
The manufacturing facilities for each of our Griffon's businesses are concentrated in just a few locations, and in the case of ClosetMaid, some of these are located abroad in low-cost locations. Any of our manufacturing facilities are subject to disruption for a variety of reasons, such as natural or man-made disasters, terrorist activities, disruptions of our information technology resources, and utility interruptions. Such disruptions may cause delays in shipping products, which could result in the loss of business or customer trust, adversely affecting Griffon’s businesses and operating results.
Manufacturing capacity constraints or increased manufacturing costs may have a material adverse effect on our business, results of operations, financial condition and cash flows.
Griffon’s current manufacturing resources may be inadequate to meet significantly increased demand for some of its products. Griffon’s ability to increase its manufacturing capacity depends on many factors, including the availability of capital, steadily increasing consumer demand, equipment delivery, construction lead-times, installation, qualification, regulatory permitting and regulatory requirements. Increasing capacity through the use of third party manufacturers may depend on Griffon’s ability to develop and maintain such relationships and the ability of such third parties to devote additional capacity to fill its orders.
A lack of sufficient manufacturing capacity to meet demand could cause our customer service levels to decrease, which may negatively affect customer demand for our products and customer relations generally, which in turn could have a material adverse effect on our business, results of operations, financial condition and cash flows. In addition, operating facilities at or near capacity may also increase production and distribution costs and negatively affect relations with our employees or contractors, which could result in disruptions in our operations.
In addition, our manufacturing costs may increase significantly and we may not be able to successfully recover these cost increases with increased pricing to its customers.
If Ames and ClosetMaid do not continue to develop and maintain leading brands or realize the anticipated benefits of increased advertising and promotion spend, their operating results may suffer.
The ability of each of Ames and ClosetMaid to compete successfully depends in part on each such company’s ability to develop and maintain leading brands so that such company’s retail and other customers will need its products to meet consumer demand. Leading brands allow each of Ames and ClosetMaid to realize economies of scale in its operations. The development and maintenance of such brands require significant investment in brand-building and marketing initiatives. While each of Ames and ClosetMaid plans to continue to increase its expenditures for advertising and promotion and other brand-building and marketing initiatives over the long term, the initiatives may not deliver the anticipated results and the results of such initiatives may not cover the costs of the increased investment.
Unionized employees could strike or participate in a work stoppage.
At September 30, 2017, Griffon employed approximately
4,700
people on a full-time basis, approximately
9%
of whom are covered by collective bargaining or similar labor agreements (all within Telephonics and AMES). If unionized employees engage in a strike or other work stoppage, or if Griffon is unable to negotiate acceptable extensions of agreements with labor unions, a significant disruption of operations and increased operating costs could occur. In addition, any renegotiation or renewal of labor agreements could result in higher wages or benefits paid to unionized employees, which could increase operating costs and could have a material adverse effect on profitability. With the inclusion of the ClosetMaid acquisition on October 2, 2017, Griffon and its subsidiaries employ approximately 6,200 people.
19
Griffon may be required to record impairment charges for goodwill and indefinite-lived intangible assets.
Griffon is required to assess goodwill and indefinite-lived intangible assets annually for impairment or on an interim basis if changes in circumstances or the occurrence of events suggest impairment exists. If impairment testing indicates that the carrying value of reporting units or indefinite-lived intangible assets exceeds the respective fair value, an impairment charge would be recognized. If goodwill or indefinite-lived intangible assets were to become impaired, the results of operations could be materially and adversely affected.
Telephonics’ business depends heavily upon government contracts and, therefore, the defense budget.
Telephonics sells products to the U.S. government and its agencies both directly and indirectly as a first-tier supplier to prime contractors in the defense industry such as Lockheed Martin, Boeing and Northrop Grumman. In the year ended
September 30, 2017
, U.S. government contracts and subcontracts accounted for approximately
18%
of Griffon’s consolidated revenue. Contracts involving the U.S. government may include various risks, including:
|
•
|
Termination for default or for convenience by the government;
|
|
•
|
Reduction or modification in the event of changes in the government’s requirements or budgetary constraints;
|
|
•
|
Increased or unexpected costs, causing losses or reduced profits under contracts where Telephonics’ prices are fixed, or determinations that certain costs are not allowable under particular government contracts;
|
|
•
|
The failure or inability of the prime contractor to perform its contract in circumstances where Telephonics is a subcontractor;
|
|
•
|
Failure to observe and comply with government business practice and procurement regulations such that Telephonics could be suspended or barred from bidding on or receiving awards of new government contracts;
|
|
•
|
The failure of the government to exercise options for additional work provided for in contracts;
|
|
•
|
The inherent discretion of government agencies in determining whether Telephonics has complied with all specifications set forth in a government contract; and
|
|
•
|
The government’s right, in certain circumstances, to freely use technology developed under these contracts.
|
All of Telephonics’ U.S. Government end-user contracts contain a termination for convenience clause, regardless if Telephonics is the prime contractor or the subcontractor. This clause generally entitles Telephonics, upon a termination for convenience, to receive the purchase price for delivered items, reimbursement of allowable work-in-process costs, and an allowance for profit. Allowable costs would include the costs to terminate existing agreements with suppliers.
The programs in which Telephonics participates may extend for several years, and may be funded on an incremental basis. Decreases in the U.S. defense budget, in particular with respect to programs to which Telephonics supplies materials, could have a material adverse impact on Telephonics' financial conditions, results of operations and cash flows. The U.S. government may not continue to fund programs to which Telephonics’ development projects apply. Even if funding is continued, Telephonics may fail to compete successfully to obtain funding pursuant to such programs. Reductions to funding on existing programs or delays in the funding of new opportunities could affect the timing of revenue recognition, and impact Telephonics' and Griffon's results of operations.
Ability of government to fund and conduct its operations
The impact of a government shutdown for any duration could have a material adverse effect on Telephonics’ revenues, profits and cash flows. Telephonics relies on government personnel to conduct routine business processes related to the inspection and delivery of products for various programs, to approve and pay certain billings and invoices, to process export licenses and for other administrative services that, if disrupted, could have an immediate impact on Telephonics’ business.
Telephonics’ business could be adversely affected by a negative audit by the U.S. Government
As a government contractor, and a subcontractor to government contractors, Telephonics is subject to audits and investigations by U.S. Government Agencies such as the Defense Contract Audit Agency, the Defense Security Service, with respect to its classified contracts, other Inspectors General and the Department of Justice. These agencies review a contractor’s performance under its contracts, its cost structure and compliance with applicable laws and standards as well as compliance with applicable regulations, including those relating to facility and personnel security clearances. These agencies also review the adequacy of, and a contractor’s compliance with, its internal control systems and policies, including the contractor’s management, purchasing, property, estimating, compensation, and accounting and information systems. Any costs found to be misclassified or improperly allocated to a specific contract will not be reimbursed, or must be refunded if already billed and collected. Griffon could incur significant expenses in complying with audits and subpoenas issued by the government in aid of inquiries and investigations. If an audit or an investigation uncovers improper or illegal activities, Telephonics may be subject to civil and criminal penalties and/or administrative sanctions, which could include contract termination, forfeiture of profit, suspension of payments, fines, including
20
treble damages, and suspension or prohibition from doing business with the U.S. Government. In addition, if allegations of impropriety are made, Telephonics and Griffon could suffer serious harm to their reputation.
Many of our contracts contain performance obligations that require innovative design capabilities, are technologically complex, or are dependent upon factors not wholly within our control. Failure to meet these obligations could adversely affect customer relations, future business opportunities, and our overall profitability.
Telephonics designs, develops and manufactures advanced and innovative surveillance and communication products for a broad range of applications for use in varying environments. As with many of our programs, system specifications, operational requirements and test requirements are challenging, exacerbated by the need for quick delivery schedules. Technical problems encountered and delays in the development or delivery of such products, as well as the inherent discretion involved in government approval related to compliance with applicable specifications of products supplied under government contracts, could prevent us from meeting contractual obligations, which could subject us to termination for default. Under a termination for default, the company is entitled to negotiate payment for undelivered work if the Government requests the transfer of title and delivery of partially completed supplies and materials. Conversely, if the Government does not make this request, there is no obligation to reimburse the company for its costs incurred. We may also be subject to the repayment of advance and progress payments, if any. Additionally, the company may be liable to the Government for any of its excess costs incurred in acquiring supplies and services similar to those terminated for default, and for other damages. Should any of the foregoing events occur, it could result in a material adverse effect on our financial position.
Our business could be negatively affected by cyber or other security threats or other disruptions.
As a U.S. defense contractor, Telephonics may be the target of cyber security threats to its information technology infrastructure and unauthorized attempts to gain access to sensitive information. The types of threats could vary from attacks common to most industries to more advanced and persistent, highly organized adversaries who target us because of national security information in our possession. If we are unable to protect sensitive information, our customers or governmental authorities could question the adequacy of our security processes and procedures and our compliance with evolving government cyber security requirements for government contractors. Due to the evolving nature of these security threats, however, the impact of any future incident cannot be predicted.
The costs related to cyber or other security threats or disruptions could be significant. Security events such as these could adversely affect our internal operations, our future financial results, our reputation, as well as result in the loss of competitive advantages derived from our research and development efforts and other intellectual property.
If our subcontractors or suppliers fail to perform their obligations, our performance and our ability to win future business could be harmed.
We rely on other companies to provide materials, major components and products to fulfill our contractual obligations. Such arrangements may involve subcontracts, teaming arrangements, or supply agreements with other companies. There is a risk that we may have disputes regarding the quality and timeliness of work performed. In addition, changes in the economic environment, including defense budgets and constraints on available financing, may adversely affect the financial stability of our supply chain and their ability to meet their performance requirements or to provide needed supplies on a timely basis. A disruption or failure of any supplier could have an adverse effect on the business resulting in an impact to profitability, possible termination of a contract, imposition of fines or penalties, and harm to our reputation impacting our ability to secure future business.
Griffon’s companies must continually improve existing products, design and sell new products and invest in research and development in order to compete effectively.
The markets for Griffon’s products are characterized by rapid technological change, evolving industry standards and continuous improvements in products. Due to constant changes in these markets, future success depends on our ability to develop new technologies, products, processes and product applications.
Our long-term success in the competitive retail environment and the industrial and commercial markets depends on our ability to develop and commercialize a continuing stream of innovative new products that are appealing to our ultimate end users and create demand. New product development and commercialization efforts, including efforts to enter markets or product categories in which Griffon has limited or no prior experience, have inherent risks. These risks include the costs involved, such as development and commercialization, product development or launch delays, and the failure of new products and line extensions to achieve anticipated levels of market acceptance or growth in sales or operating income.
21
Griffon also faces the risk that its competitors will introduce innovative new products that compete with Griffon’s products. In addition, sales generated by new products could cause a decline in sales of Griffon’s other existing products. If new product development and commercialization efforts are not successful, Griffon’s financial results could be adversely affected.
Product and technological developments are accomplished both through internally-funded R&D projects, as well as through strategic partnerships with customers. Because it is not generally possible to predict the amount of time required and costs involved in achieving certain R&D objectives, actual development costs may exceed budgeted amounts and estimated product development schedules may be extended. Griffon’s financial condition and results of operations may be materially and adversely affected if:
|
•
|
Product improvements are not completed on a timely basis;
|
|
•
|
New products are not introduced on a timely basis or do not achieve sufficient market penetration;
|
|
•
|
There are budget overruns or delays in R&D efforts; or
|
|
•
|
New products experience reliability or quality problems, or otherwise do not meet customer preferences or requirements.
|
Griffon may be unable to implement its acquisition growth strategy, which may result in added expenses without a commensurate increase in revenue and income and divert management’s attention.
Making strategic acquisitions is a significant part of Griffon’s growth plans. The ability to successfully complete acquisitions depends on identifying and acquiring, on acceptable terms, companies that either complement or enhance currently held businesses or expand Griffon into new profitable businesses, and, for certain acquisitions, obtaining financing on acceptable terms. Additionally, Griffon must properly integrate acquired businesses in order to maximize profitability. The competition for acquisition candidates is intense and Griffon cannot assure that it will successfully identify acquisition candidates and complete acquisitions at reasonable purchase prices, in a timely manner, or at all. Further, there is a risk that acquisitions will not be properly integrated into Griffon’s existing structure. Griffon closed the acquisitions of La Hacienda, Tuscan Path, ClosetMaid and Harper Brush in the months of July through November 2017, and this integration risk may be exacerbated when numerous acquisitions are consummated in a short time period.
In implementing an acquisition growth strategy, the following may be encountered:
|
•
|
Costs associated with incomplete or poorly implemented acquisitions;
|
|
•
|
Expenses, delays and difficulties of integrating acquired companies into Griffon’s existing organization;
|
|
•
|
Dilution of the interest of existing stockholders;
|
|
•
|
Diversion of management’s attention; or
|
|
•
|
Difficulty in obtaining financing on acceptable terms, or at all.
|
An unsuccessful implementation of Griffon’s acquisition growth strategy could have an adverse impact on Griffon’s results of operations, cash flows and financial condition.
The loss of certain key officers or employees could adversely affect Griffon’s business.
The success of Griffon is materially dependent upon the continued services of certain key officers and employees. The loss of such key personnel could have a material adverse effect on Griffon’s operating results or financial condition.
Griffon is exposed to a variety of risks relating to non-U.S. sales and operations, including non-U.S. economic and political conditions and fluctuations in exchange rates.
Griffon and its companies conduct operations in Canada, Australia, United Kingdom and China, and sell their products in many countries around the world. Following the ClosetMaid acquisition on October 2, 2017, Griffon now has significant manufacturing operations in Mexico and additional manufacturing operations in China. Sales of products through non-U.S. subsidiaries accounted for approximately
15%
of consolidated revenue for the year ended
September 30, 2017
. These sales could be adversely affected by changes in political and economic conditions, trade protection measures, the ability of the Company to enter into industrial cooperation agreements (off-set agreements), differing intellectual property rights laws and changes in regulatory requirements that restrict the sales of products or increase costs in such locations. Enforcement of existing laws in such jurisdictions can be uncertain, and the lack of a sophisticated body of laws can create various uncertainties, including with respect to customer and supplier contracts. Currency fluctuations between the U.S. dollar and the currencies in the non-U.S. regions in which Griffon does business may also have an impact on future reported financial results.
22
Our international sales and operations are subject to applicable laws relating to trade, export controls and foreign corrupt practices, the violation of which could adversely affect our operations. We are subject to various anti-corruption laws that prohibit improper payments or offers of payments to foreign governments and their officials for the purpose of obtaining or retaining business. In addition, we are subject to export controls, laws and regulations applicable to us, including the Arms Export Control Act, the International Traffic in Arms Regulation and the Export Administration Regulations, and economic sanctions laws and embargoes imposed by various governments or organizations, including the U.S. and the European Union or member countries. Violations of anti-corruption, export controls, or sanctions laws may result in severe criminal or civil sanctions and penalties, including debarments from export privileges, loss of authorizations needed to conduct our international business, or harm our ability to enter into contracts with the U.S. Government, and we may be subject to other liabilities, which could have a material adverse effect on our business, results of operations and financial condition.
Griffon may not be able to protect its proprietary rights.
Griffon relies on a combination of patent, copyright and trademark laws, common law, trade secrets, confidentiality and non-disclosure agreements and other contractual provisions to protect proprietary rights. Such measures do not provide absolute protection and Griffon cannot give assurance that measures for protecting these proprietary rights are and will be adequate, or that competitors will not independently develop similar technologies.
Griffon may inadvertently infringe on, or may be accused of infringing on, proprietary rights held by another party.
Griffon is regularly improving its technology and employing existing technologies in new ways. Though Griffon takes reasonable precautions to ensure it does not infringe on the rights of others, it is possible that Griffon may inadvertently infringe on, or be accused of infringing on, proprietary rights held by others. If Griffon is found to have infringed on the propriety rights held by others, any related litigation or settlement relating to such infringement may have a material effect on Griffon’s business, results of operations and financial condition.
Griffon is exposed to product liability and warranty claims.
Griffon is subject to product liability and warranty claims in the ordinary course of business, including with respect to former businesses now included within discontinued operations. These claims relate to the conformity of its products with required specifications, and to alleged or actual defects in Griffon’s products (or in end-products in which Griffon’s products were a component part) that cause damage to property or persons. There can be no assurance that the frequency and severity of product liability claims brought against Griffon will not increase, which claims can be brought either by an injured customer of an end product manufacturer who used one of Griffon's products as a component or by a direct purchaser. There is also no assurance that the number and value of warranty claims will not increase as compared to historical claim rates, or that our warranty reserve at any particular time is sufficient. No assurance can be given that indemnification from customers or coverage under insurance policies will be adequate to cover future product liability claims against Griffon; for example, product liability insurance typically does not cover claims for punitive damages. Warranty claims are typically not covered by insurance at all. Product liability insurance can be expensive, difficult to maintain and may be unobtainable in the future on acceptable terms. The amount and scope of any insurance coverage may be inadequate if a product liability claim is successfully asserted. Furthermore, if any significant claims are made, the business and the related financial condition of Griffon may be adversely affected by negative publicity.
Griffon has been, and may in the future be, subject to claims and liabilities under environmental laws and regulations.
Griffon’s operations and assets are subject to environmental laws and regulations pertaining to the discharge of materials into the environment, the handling and disposal of wastes, including solid and hazardous wastes, or otherwise relating to health, safety and protection of the environment, in various jurisdictions in which it operates. Griffon does not expect to make any expenditure with respect to ongoing compliance with or remediation under these environmental laws and regulations that would have a material adverse effect on its business, operating results or financial condition. However, the applicable requirements under environmental laws and regulations may change at any time.
Griffon can incur environmental costs related to sites that are no longer owned or operated, as well as third-party sites to which hazardous materials are sent. It cannot be assured that material expenditures or liabilities will not be incurred in connection with such claims. See the Commitment and Contingencies footnote in the Notes to Consolidated Financial Statements for further information on environmental contingencies. Based on facts presently known, the outcome of current environmental matters are not expected to have a material adverse effect on Griffon’s results of operations and financial condition. However, presently unknown environmental conditions, changes in environmental laws and regulations or other unanticipated events may give rise to claims that may involve material expenditures or liabilities.
23
Changes in income tax laws and regulations or exposure to additional income tax liabilities could adversely affect profitability.
Griffon is subject to Federal, state and local income taxes in the U.S. and in various taxing jurisdictions outside the U.S. Tax provisions and liabilities are subject to the allocation of income among various U.S. and international tax jurisdictions. Griffon’s effective tax rate could be adversely affected by changes in the mix of earnings in countries with differing statutory tax rates, changes in any valuation allowance for deferred tax assets or the amendment or enactment of tax laws. The amount of income taxes paid is subject to audits by U.S. Federal, state and local tax authorities, as well as tax authorities in the taxing jurisdictions outside the U.S. If such audits result in assessments different from recorded income tax liabilities, Griffon’s future financial results may include unfavorable adjustments to its income tax provision.
Compliance with restrictions and covenants in Griffon’s debt agreements may limit its ability to take corporate actions.
The credit agreement entered into by, and the terms of the senior notes issued by, Griffon each contain covenants that restrict the ability of Griffon and its subsidiaries to, among other things, incur additional debt, pay dividends, incur liens and make investments, acquisitions, dispositions, restricted payments and capital expenditures. Under the credit agreement, Griffon is also required to comply with specific financial ratios and tests. Griffon may not be able to comply in the future with these covenants or restrictions as a result of events beyond its control, such as prevailing economic, financial and industry conditions or a change in control of Griffon. If Griffon defaults in maintaining compliance with the covenants and restrictions in its credit agreement or the senior notes, its lenders could declare all of the principal and interest amounts outstanding due and payable and, in the case of the credit agreement, terminate their commitments to extend credit to Griffon in the future. If Griffon or its subsidiaries are unable to secure credit in the future, its business could be harmed.
Griffon may be unable to raise additional financing if needed
Griffon may need to raise additional financing in the future in order to implement its business plan, refinance debt, or to acquire new or complimentary businesses or assets. Any required additional financing may be unavailable, or only available at unfavorable terms, due to uncertainties in the credit markets. If Griffon raises additional funds by issuing equity securities, current holders of its common stock may experience significant ownership interest dilution and the holders of the new securities may have rights senior to the rights associated with current outstanding common stock.
Griffon’s indebtedness and interest expense could limit cash flow and adversely affect operations and Griffon’s ability to make full payment on outstanding debt.
Griffon’s indebtedness poses potential risks such as:
|
•
|
A substantial portion of cash flows from operations could be used to pay principal and interest on debt, thereby reducing the funds available for working capital, capital expenditures, acquisitions, product development and other general corporate purposes;
|
|
•
|
Insufficient cash flows from operations may force Griffon to sell assets, or seek additional capital, which Griffon may not be able to accomplish on favorable terms, if at all; and
|
|
•
|
The level of indebtedness may make Griffon more vulnerable to economic or industry downturns.
|
Griffon has the ability to issue additional equity securities, which would lead to dilution of issued and outstanding common stock.
The issuance of additional equity securities or securities convertible into equity securities would result in dilution to existing stockholders’ equity interests. Griffon is authorized to issue, without stockholder vote or approval,
3,000,000
shares of preferred stock in one or more series, and has the ability to fix the rights, preferences, privileges and restrictions of any such series. Any such series of preferred stock could contain dividend rights, conversion rights, voting rights, terms of redemption, redemption prices, liquidation preferences or other rights superior to the rights of holders of Griffon’s common stock. While there is no present intention of issuing any such preferred stock, Griffon reserves the right to do so in the future. In addition, Griffon is authorized to issue, without stockholder approval, up to
85,000,000
shares of common stock, of which
47,106,202
shares, net of treasury shares, were outstanding as of
September 30, 2017
. Additionally, Griffon is authorized to issue, without stockholder approval, securities convertible into either shares of common stock or preferred stock.
None.
24
Griffon occupies approximately
6,700,000
square feet of general office, factory and warehouse space throughout the U.S., Canada, Australia, United Kingdom and China. For a description of the encumbrances on certain of these properties, see the Notes Payable, Capitalized Leases and Long-Term Debt footnote in the Notes to Consolidated Financial Statements. The following table sets forth certain information related to Griffon’s major facilities:
|
Location
|
Business Segment
|
Primary Use
|
Approx.
Square
Footage
|
Owned/
Leased
|
Lease
End Year
|
||||||
|
New York, NY
|
Corporate
|
Headquarters
|
20,000
|
|
Leased
|
2025
|
|||||
|
Jericho, NY
|
Corporate
|
Office
|
6,900
|
|
Leased
|
2018
|
|||||
|
Farmingdale, NY
|
Telephonics
|
Manufacturing/R&D
|
180,000
|
|
Owned
|
|
|||||
|
Huntington, NY
|
Telephonics
|
Manufacturing
|
90,000
|
|
Owned
|
|
|||||
|
Huntington, NY
|
Telephonics
|
Manufacturing
|
100,000
|
|
Leased
|
2021
|
|||||
|
Columbia, MD
|
Telephonics
|
Engineering
|
33,000
|
|
Leased
|
2023
|
|||||
|
Elizabeth City, NC
|
Telephonics
|
Repair and Service
|
22,000
|
|
Leased
|
2039
|
|||||
|
Troy, OH
|
Home & Building Products
|
Office, Manufacturing
|
1,230,000
|
|
Leased
|
2021
|
|||||
|
Russia, OH
|
Home & Building Products
|
Manufacturing
|
250,000
|
|
Owned
|
|
|||||
|
Carlisle, PA
|
Home & Building Products
|
Manufacturing, Distribution
|
1,227,000
|
|
Leased
|
2020
|
|||||
|
Reno, NV
|
Home & Building Products
|
Manufacturing, Distribution
|
400,000
|
|
Leased
|
2022
|
|||||
|
Camp Hill, PA
|
Home & Building Products
|
Office, Manufacturing
|
380,000
|
|
Owned
|
||||||
|
Harrisburg, PA
|
Home & Building Products
|
Manufacturing
|
264,000
|
|
Owned
|
|
|||||
|
St. Francois, Quebec
|
Home & Building Products
|
Manufacturing, Distribution
|
353,000
|
|
Owned
|
|
|||||
|
Falls City, NE
|
Home & Building Products
|
Manufacturing
|
82,000
|
|
Owned
|
||||||
|
Cork, Ireland
|
Home & Building Products
|
Manufacturing, Distribution
|
74,000
|
|
Owned
|
|
|||||
|
Victoria, Australia
|
Home & Building Products
|
Manufacturing
|
29,000
|
|
Leased
|
2019
|
|||||
|
Champion, PA
|
Home & Building Products
|
Wood Mill
|
225,000
|
|
Owned
|
||||||
|
Victoria, Australia
|
Home & Building Products
|
Distribution
|
174,000
|
|
Leased
|
2023
|
|||||
|
Queensland, Australia
|
Home & Building Products
|
Distribution
|
50,000
|
|
Leased
|
2018
|
|||||
|
New South Wales, Australia
|
Home & Building Products
|
Distribution
|
76,000
|
|
Leased
|
2020
|
|||||
|
Regency Park, South Australia
|
Home & Building Products
|
Distribution
|
62,000
|
|
Leased
|
2019
|
|||||
|
Welshpool, Western Australia
|
Home & Building Products
|
Distribution
|
97,000
|
|
Leased
|
2019
|
|||||
|
New South Wales, Australia
|
Home & Building Products
|
Distribution
|
32,000
|
|
Leased
|
2019
|
|||||
|
Gloucestershire, UK
|
Home & Building Products
|
Distribution
|
46,000
|
|
Leased
|
2022
|
|||||
Griffon also leases approximately
990,000
square feet of space for the CBP distribution centers in numerous facilities throughout the U.S. and in Canada. In addition, AMES owns approximately
200,000
square feet of additional space for operational wood mills in the U.S.
25
As of September 30, 2017, Griffon classified the following Clopay Plastics Products properties in discontinued operations:
|
Location
|
Business Segment
|
Primary Use
|
Approx.
Square Footage |
Owned/
Leased |
Lease
End Year |
||||||
|
Mason, OH
|
Home & Building Products/ Clopay Plastic Products
|
Office/R&D
|
131,000
|
|
Owned
|
||||||
|
Aschersleben, Germany
|
Clopay Plastic Products
|
Manufacturing
|
289,000
|
|
Owned
|
||||||
|
Dombuhl, Germany
|
Clopay Plastic Products
|
Manufacturing
|
124,000
|
|
Owned
|
||||||
|
Augusta, KY
|
Clopay Plastic Products
|
Manufacturing
|
354,000
|
|
Owned
|
||||||
|
Nashville, TN
|
Clopay Plastic Products
|
Manufacturing
|
210,000
|
|
Owned
|
||||||
|
Nashville, TN
|
Clopay Plastic Products
|
Manufacturing
|
190,000
|
|
Leased
|
2019
|
|||||
|
Jundiai, Brazil
|
Clopay Plastic Products
|
Manufacturing
|
114,000
|
|
Owned
|
||||||
|
Hangzhou, China
|
Clopay Plastic Products
|
Manufacturing
|
66,000
|
|
Leased
|
2024
|
|||||
As of October 2, 2017, Griffon occupies the following ClosetMaid properties:
|
Location
|
Business Segment
|
Primary Use
|
Approx.
Square Footage |
Owned/
Leased |
Lease
End Year |
||||||
|
Ocala, FL
|
Home & Building Products
|
Headquarters
|
620,000
|
|
Leased
|
2020
|
|||||
|
Grantsville, MD
|
Home & Building Products
|
Manufacturing
|
155,000
|
|
Owned
|
||||||
|
Reynosa, MX
|
Home & Building Products
|
Manufacturing (owned), Distribution (leased)
|
133,000
|
|
Owned / Leased
|
2020
|
|||||
|
Chino, CA
|
Home & Building Products
|
Distribution
|
202,000
|
|
Leased
|
2021
|
|||||
|
Pharr, TX
|
Home & Building Products
|
Distribution
|
80,000
|
|
Leased
|
2018
|
|||||
|
Belle Vernon, PA
|
Home & Building Products
|
Distribution
|
233,000
|
|
Leased
|
2022
|
|||||
All facilities are generally well maintained and suitable for the operations conducted.
26
Griffon is involved in litigation, investigations and claims arising out of the normal conduct of business, including those relating to commercial transactions, product liability and warranty claims, environmental, employment, and health and safety matters. Griffon estimates and accrues liabilities resulting from such matters based on a variety of factors, including the stage of the proceeding; potential settlement value; assessments by internal and external counsel; and assessments by environmental engineers and consultants of potential environmental liabilities and remediation costs. Such estimates are not discounted to reflect the time value of money due to the uncertainty in estimating the timing of the expenditures, which may extend over several years.
While it is impossible to ascertain the ultimate legal and financial liability with respect to certain contingent liabilities and claims, Griffon believes, based upon examination of currently available information, experience to date, and advice from legal counsel, that the individual and aggregate liabilities resulting from the ultimate resolution of these contingent matters, after taking into consideration our existing insurance coverage and amounts already provided for, will not have a material adverse impact on consolidated results of operations, financial position or cash flows.
27
Griffon’s Common Stock is listed for trading on the New York Stock Exchange under the symbol “GFF”. The following table shows, for the periods indicated, the quarterly range in the high and low sales prices for Griffon’s Common Stock and the amount of dividends paid during the last two years:
|
|
Fiscal 2017
|
Fiscal 2016
|
|
||||||||||||||||||||
|
|
Market Prices
|
Dividends
|
Market Prices
|
Dividends
|
|||||||||||||||||||
|
|
High
|
Low
|
Per Share
|
High
|
Low
|
Per Share
|
|||||||||||||||||
|
Quarter ended December 31,
|
$
|
26.95
|
|
$
|
16.18
|
|
$
|
0.06
|
|
$
|
19.24
|
|
$
|
15.58
|
|
$
|
0.05
|
|
|||||
|
Quarter ended March 31,
|
27.15
|
|
23.30
|
|
0.06
|
|
17.58
|
|
13.45
|
|
0.05
|
|
|||||||||||
|
Quarter ended June 30,
|
25.15
|
|
21.15
|
|
0.06
|
|
17.30
|
|
14.69
|
|
0.05
|
|
|||||||||||
|
Quarter ended September 30,
|
22.58
|
|
17.65
|
|
0.06
|
|
17.87
|
|
15.88
|
|
0.05
|
|
|||||||||||
|
|
|
|
|
|
$
|
0.24
|
|
|
|
|
|
$
|
0.20
|
|
|||||||||
Dividends
During 2017, 2016 and 2015, the Company declared and paid dividends totaling $0.24 per share, $0.20 per share and $0.16 per share, respectively. The Company currently intends to pay dividends each quarter; however, payment of dividends is determined by the Board of Directors at its discretion based on various factors, and no assurance can be provided as to the payment of future dividends.
On November 15, 2017, the Board of Directors declared a cash dividend of
$0.07
per share, payable on December 21, 2017 to shareholders of record as of the close of business on November 29, 2017.
Holders
As of October 31, 2017, there were approximately 8,000 record holders of Griffon’s Common Stock.
Securities Authorized for Issuance Under Equity Compensation Plans
Information regarding securities authorized for issuance under Griffon’s equity compensation plans is contained in Part III, Item 12 of this Form 10-K.
28
Issuer Purchase of Equity Securities
The table below presents shares of Griffon Stock which were acquired by Griffon during the fourth quarter of
2017
:
ISSUER PURCHASES OF EQUITY SECURITIES
|
Period
|
(a) Total Number
of Shares (or
Units) Purchased
|
(b) Average
Price Paid Per
Share (or Unit)
|
(c) Total Number of
Shares (or Units)
Purchased as Part of
Publicly Announced
Plans or Programs
(1)
|
(d) Maximum Number
(or Approximate
Dollar Value) of
Shares (or Units) That
May Yet Be Purchased
Under the Plans or
Programs
|
|
||||||||||
|
July 1 - 31, 2017
|
2,150
|
|
(2)
|
$
|
21.04
|
|
—
|
|
|
|
|
||||
|
August 1 - 31, 2017
|
—
|
|
|
—
|
|
—
|
|
|
|
|
|||||
|
September 1 - 30, 2017
|
—
|
|
|
—
|
|
—
|
|
|
|
|
|||||
|
Total
|
2,150
|
|
$
|
21.04
|
|
—
|
|
$
|
49,437
|
|
(1)
|
||||
|
1.
|
Shares were purchased by the Company in open market purchases pursuant to share repurchases authorized by the Company’s Board of Directors. On August 3, 2016, the Company’s Board of Directors authorized the repurchase of up to $50,000 of Griffon common stock; as of
September 30, 2017
,
$49,437
remained available for purchase under the Board authorization program.
|
|
2.
|
Shares acquired by the Company from holders of restricted stock upon vesting of the restricted stock to satisfy tax withholding obligations of the holders.
|
29
Performance Graph
The performance graph does not constitute soliciting material, is not deemed filed with the SEC and is not incorporated by reference in any of Griffon’s filings under the Securities Act of 1933 or the Exchange Act of 1934, whether made before or after the date of this Annual Report on Form 10-K and irrespective of any general incorporation language in any such filings, except to the extent Griffon specifically incorporates this performance graph by reference therein.
The following graph sets forth the cumulative total return to Griffon’s stockholders during the five years ended
September 30, 2017
, as well as an overall stock market (S&P Small Cap 600 Index) and Griffon’s peer group index (Dow Jones U.S. Diversified Industrials Index). Assumes $100 was invested on September 30, 2012, including the reinvestment of dividends, in each category.
COMPARISON OF 5 YEAR CUMULATIVE TOTAL RETURN
Among Griffon Corporation, the S&P Smallcap 600 Index
and the Dow Jones US Diversified Industrials Index
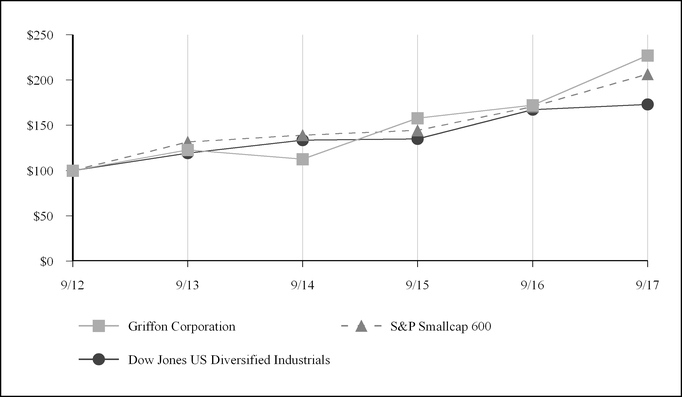
30
Item 6.
Selected Financial Data
|
|
For the Years Ended September 30,
|
||||||||||||||||||
|
(in thousands, except per share amounts)
|
2017
|
2016
|
2015
|
2014
|
2013
|
||||||||||||||
|
Revenue
|
$
|
1,524,997
|
|
$
|
1,477,035
|
|
$
|
1,483,291
|
|
$
|
1,398,448
|
|
$
|
1,308,136
|
|
||||
|
Income (loss) before taxes and discontinued operations
|
$
|
16,698
|
|
$
|
32,213
|
|
$
|
19,066
|
|
$
|
(20,957
|
)
|
$
|
11,779
|
|
||||
|
Provision (benefit) for income taxes
|
(1,085
|
)
|
12,432
|
|
6,772
|
|
(10,151
|
)
|
5,981
|
|
|||||||||
|
Income (loss) from continuing operations
|
17,783
|
|
19,781
|
|
12,294
|
|
(10,806
|
)
|
5,798
|
|
|||||||||
|
Income (loss) from discontinued operations
|
(2,871
|
)
|
10,229
|
|
21,995
|
|
10,629
|
|
(2,031
|
)
|
|||||||||
|
Net Income (loss)
|
$
|
14,912
|
|
$
|
30,010
|
|
$
|
34,289
|
|
$
|
(177
|
)
|
$
|
3,767
|
|
||||
|
Basic earnings (loss) per share:
|
|
|
|
|
|
|
|
|
|
|
|||||||||
|
Continuing operations
|
$
|
0.43
|
|
$
|
0.48
|
|
$
|
0.28
|
|
$
|
(0.22
|
)
|
$
|
0.11
|
|
||||
|
Discontinued operations
|
(0.07
|
)
|
0.25
|
|
0.49
|
|
0.22
|
|
(0.04
|
)
|
|||||||||
|
Net income (loss)
|
$
|
0.36
|
|
$
|
0.73
|
|
$
|
0.77
|
|
$
|
—
|
|
$
|
0.07
|
|
||||
|
Weighted average shares outstanding
|
41,005
|
|
41,074
|
|
44,608
|
|
49,367
|
|
54,428
|
|
|||||||||
|
Diluted earnings (loss) per share:
|
|
|
|
|
|
|
|
|
|
|
|||||||||
|
Continuing operations
|
$
|
0.41
|
|
$
|
0.45
|
|
$
|
0.26
|
|
$
|
(0.22
|
)
|
$
|
0.10
|
|
||||
|
Discontinued operations
|
(0.07
|
)
|
0.23
|
|
0.47
|
|
0.22
|
|
(0.04
|
)
|
|||||||||
|
Net income (loss)
|
$
|
0.35
|
|
$
|
0.68
|
|
$
|
0.73
|
|
$
|
—
|
|
$
|
0.07
|
|
||||
|
Weighted average shares outstanding
|
43,011
|
|
44,109
|
|
46,939
|
|
49,367
|
|
56,563
|
|
|||||||||
|
Cash dividends declared per common share
|
$
|
0.24
|
|
$
|
0.20
|
|
$
|
0.16
|
|
$
|
0.12
|
|
$
|
0.10
|
|
||||
|
Capital expenditures
|
$
|
34,937
|
|
$
|
59,276
|
|
$
|
46,308
|
|
$
|
57,392
|
|
$
|
41,932
|
|
||||
|
Depreciation and amortization
|
$
|
47,878
|
|
$
|
46,342
|
|
$
|
45,834
|
|
$
|
39,986
|
|
$
|
44,011
|
|
||||
|
Total assets
|
$
|
1,873,541
|
|
$
|
1,782,096
|
|
$
|
1,712,813
|
|
$
|
1,808,826
|
|
$
|
1,777,608
|
|
||||
|
Current portion of debt
|
$
|
11,078
|
|
$
|
13,932
|
|
$
|
8,170
|
|
$
|
4,580
|
|
$
|
3,029
|
|
||||
|
Long term portion of debt, net
|
968,080
|
|
896,946
|
|
803,617
|
|
791,301
|
|
666,904
|
|
|||||||||
|
Total debt, net
|
$
|
979,158
|
|
$
|
910,878
|
|
$
|
811,787
|
|
$
|
795,881
|
|
$
|
669,933
|
|
||||
|
Notes:
|
Results of operations from acquired businesses are included from the date of acquisition forward. The fair value of assets and liabilities, inclusive of changes resulting from operating the businesses, are included in the first period ended after the date of each acquisition, and all periods thereafter.
|
Excludes results of operations and assets and liabilities of discontinued operations for all periods presented.
2017 includes
$9,617
of acquisition related costs (
$6,145,000
, net of tax, or
$0.14
per share),
$5,137
of contract settlement charges (
$3,300
, net of tax, or
$0.08
per share) and discrete tax benefits, net, of
$8,274
, or
$0.19
per share.
2016 includes discrete tax benefits, net, of
$857
or
$0.02
per share.
2015 includes discrete tax benefits, net, of $219 or $0.00 per share.
2014 includes
$6,136
of restructuring charges (
$3,804
, net of tax, or $0.07 per share),
$3,161
of acquisition costs (
$1,960
, net of tax, or
$0.04
per share), $38,890 loss on debt extinguishment ($24,964, net of tax, or $0.49 per share) and discrete tax benefits, net, of $4,179 or $0.08 per share.
2013 includes
$13,262
of restructuring charges (
$8,266
, net of tax, or
$0.15
per share), a loss on pension settlement of
$2,142
(
$1,392
, net of tax, or
$0.02
per share) and discrete tax benefits, net, of
$325
or
$0.01
per share.
Due to rounding, the sum of earnings per share of Continuing operations and Discontinued operations may not equal earnings per share or Net income.
31
Item 7.
Management’s Discussion and Analysis of Financial Condition and Results of Operations
(Unless otherwise indicated, all references to years or year-end refers to the fiscal year ending
September 30
and dollars are in thousands, except per share data)
OVERVIEW
The Company
Griffon Corporation (the “Company” or “Griffon”) is a diversified management and holding company that conducts business through wholly-owned subsidiaries. Griffon oversees the operations of its subsidiaries, allocates resources among them and manages their capital structures. Griffon provides direction and assistance to its subsidiaries in connection with acquisition and growth opportunities as well as in connection with divestitures. In order to further diversify, Griffon also seeks out, evaluates and, when appropriate, will acquire additional businesses that offer potentially attractive returns on capital.
On September 5, 2017, Griffon announced it will explore strategic alternatives for Clopay Plastic Products Company, Inc. ("PPC") and on November 16, 2017, announced it entered into a definitive agreement to sell PPC to Berry Global Group, Inc. (NYSE:BERY) ("Berry") for $475 million in cash. The transaction is subject to regulatory approval and customary closing conditions, and is expected to close in the first quarter of calendar 2018. As a result, Griffon classified the results of operations of the PPC business as discontinued operations in the Consolidated Statements of Operations for all periods presented and classified the related assets and liabilities associated with the discontinued operations as held for sale in the consolidated balance sheets. All results and information presented exclude PPC unless otherwise noted. PPC, incorporated in 1934, is a global leader in the development and production of embossed, laminated and printed specialty plastic films for hygienic, health-care and industrial products and sells to some of the world's largest consumer products companies. Griffon acquired PPC in 1986 as part of the acquisition of Clopay Corporation. See Note 6, Discontinued Operations to the Notes of the Financial Statements.
On October 2, 2017, Griffon acquired ClosetMaid LLC ("ClosetMaid"). ClosetMaid, founded in 1965, is a leading North American manufacturer and marketer of closet organization, home storage, and garage storage products, and sells to some of the largest home center retail chains, mass merchandisers, and direct-to-builder professional installers in North America. Due to the acquisition of ClosetMaid occurring subsequent to Griffon's fiscal year end, ClosetMaid's results of operations, assets and liabilities were not included in Griffon's 2017 financial results or 2017 year-end balance sheet.
Griffon currently conducts its continuing operations through two reportable segments:
|
•
|
Home & Building Products ("HBP") consists of three companies, The AMES Companies, Inc. (“AMES”), Clopay Building Products Company, Inc. (“CBP”) and ClosetMaid LLC ("ClosetMaid"). HBP revenue accounted for
73%
of Griffon’s consolidated revenue in
2017
and
71%
in both
2016
and
2015
:
|
|
◦
|
AMES, founded in 1774, is the leading U.S. manufacturer and a global provider of long-handled tools and landscaping products for homeowners and professionals. AMES’ revenue was
36%
,
35%
, and
36%
of Griffon’s consolidated revenue in
2017
,
2016
and
2015
, respectively.
|
|
◦
|
CBP, since 1964, is a leading manufacturer and marketer of residential and commercial garage doors and sells to professional dealers and some of the largest home center retail chains in North America. CBP’s revenue was
37%
,
36%
and
35%
of Griffon’s consolidated revenue in
2017
,
2016
and
2015
, respectively.
|
|
◦
|
ClosetMaid was acquired on October 2, 2017. ClosetMaid's 2017 revenue was $298,737, or 16% of Griffon's pro forma 2017 revenue of $1,823,734 (unaudited), giving effect to the acquisition of ClosetMaid as if it had occurred on October 1, 2016. With the inclusion of ClosetMaid, HBP pro forma revenue would have accounted for 77% of Griffon's 2017 consolidated pro forma revenue.
|
|
•
|
Telephonics Corporation ("Telephonics"), founded in 1933, is recognized globally as a leading provider of highly sophisticated intelligence, surveillance and communications solutions for defense, aerospace and commercial customers. Telephonics’ revenue was
27%
of Griffon’s consolidated revenue in
2017
and
29%
in both
2016
and
2015
.
|
32
CONSOLIDATED RESULTS OF OPERATIONS
2017
Compared to
2016
Revenue from continuing operations for the year ended
September 30, 2017
was
$1,524,997
, compared to
$1,477,035
in the prior year, an increase of 3%, with increased revenue at Home & Building Products was partially offset by decreased revenue at Telephonics. Gross profit for
2017
was
$408,116
compared to
$400,693
in
2016
, with gross margin as a percent of sales (“gross margin”) of
26.8%
and
27.1%
, respectively.
Selling, general and administrative (“SG&A”) expenses from continuing operations of
$339,089
increased 7% from the prior year amount
of
$318,353
. SG&A for 2017, as a percent of revenue, was
22.2%
, compared to
21.6%
in the prior year, primarily due to the inclusion of $9,617 of acquisition related expenditures.
Interest expense from continuing operations in
2017
of
$51,513
increased 3% compared to the prior year of $49,943 primarily as a result of increased debt levels related to the May 2016 add-on offering of $125,000 of 5.25% senior notes due 2022 and higher outstanding borrowings on our Revolving Credit Facility.
Other income (expense) from continuing operations of
$(880)
in
2017
and
$(250)
in
2016
consists primarily of currency exchange transaction gains and losses from receivables and payables held in non-functional currencies, and net gains on investments.
Griffon reported pretax income from continuing operations of
$16,698
for the year ended September 30, 2017 compared to
$32,213
for the prior year. In 2017, the Company recognized a tax benefit of
(6.5)%
compared to a tax provision of
38.6%
in
2016
. The 2017 tax rates included
$8,274
of discrete and certain other tax benefits, net, related primarily to excess tax benefits from the vesting of equity awards within income tax expense, a federal domestic production activities deduction and a federal R&D credit. The 2016 tax rates included an
$857
of discrete and certain other tax benefits, net, related primarily to excess tax benefits from the vesting of equity awards within income tax expense and the release of unrecognized tax benefits.
Excluding the discrete and certain other tax benefits, net, and certain other items from continuing operations, as listed below, the effective tax rates for the year ended September 30, 2017 and 2016 were
39.7%
and
41.3%
, respectively. These rates reflect the impact of tax reserves and changes in earnings mix between U.S. and non-U.S. operations.
Income from continuing operations was
$17,783
, or
$0.41
per share, for
2017
compared to
$19,781
, or
$0.45
per share in the prior year.
The current year results included the following from continuing operations:
|
–
|
Acquisition costs of $9,617 (
$6,145
, net of tax, or
$0.14
per share);
|
|
–
|
Contract settlement charges of $5,137 (
$3,300
, net of tax, or
$0.08
per share); and
|
|
–
|
Discrete and certain other tax benefits, net, of
$8,274
, or
$0.19
per share.
|
The prior year results included discrete and certain other tax benefits, net, of
$857
or
$0.02
per share from continuing operations.
Excluding these items from both reporting periods,
2017
Income from continuing operations would have been
$18,954
, or
$0.44
per share compared to
$18,924
, or
$0.43
per share, in
2016
.
Net income was
$14,912
, or
$0.35
per share, for 2017 compared to
$30,010
, or
$0.68
per share in the prior year.
The current year results included the following:
|
–
|
Acquisition costs of $9,617 (
$6,145
, net of tax, or
$0.14
per share);
|
|
–
|
Contract settlement charges of $5,137 (
$3,300
, net of tax, or
$0.08
per share);
|
|
–
|
Environmental and warranty reserves of $5,700 (
$3,703
, net of tax, or
$0.09
per share); and
|
|
–
|
Discrete and certain other tax provisions, net, of
$9,385
, or
$0.22
per share.
|
The prior year results included the following:
33
|
–
|
Restructuring charges of $5,900 (
$4,247
net of tax, or
$0.10
per share); and
|
|
–
|
Discrete and certain other tax provisions
$2,658
or
$0.06
per share.
|
Excluding these items from both reporting periods,
2017
Net income would have been
$37,445
, or
$0.87
per share compared to
$36,915
, or
$0.84
per share, in
2016
.
The tax provisions on all pre-tax income inclusive of discontinued operations for the years ended September 30, 2017 and 2016 resulted in tax rates of 61.7% and 43.6%, respectively. These 2017 and 2016 tax rates included
$9,385
and
$2,658
, respectively, of discrete and certain other tax provisions. Excluding these tax items and certain other items, as listed above, the effective tax rates for the year ended September 30, 2017 and 2016 were 37.0% and 37.5%, respectively.
2016 Compared to 2015
Revenue from continuing operations for the year ended September 30,
2016
of
$1,477,035
was in line with the
$1,483,291
in the prior year. Excluding the unfavorable impact of foreign currency at HBP, revenue trailed the prior year by 1%. Gross profit from continuing operations for 2016 was
$400,693
compared to
$392,347
in 2015, with gross margin of
27.1%
and
26.5%
, respectively.
Selling, general and administrative (“SG&A”) expenses from continuing operations for 2016 of
$318,353
decreased 2% from the prior year amount of
$325,435
. SG&A for 2016, as a percent of revenue, was
21.6%
, compared to
21.9%
in the prior year due to plant and distribution center consolidations and management cost control measures in the HBP segment.
Interest expense from continuing operations in 2016 totaled
$49,943
, a 5% increase from the prior year primarily due to the May 2016 add-on offering of $125,000 of 5.25% senior notes due 2022.
Other income (expense) of
$(250)
in 2016 and
$(331)
in 2015 consists primarily of currency exchange transaction gains and losses from receivables and payables held in non-functional currencies, and net gains on investments.
Griffon reported pretax income from continuing operations of
$32,213
for the year ended September 30, 2016 compared to $19,066 for the prior year. In 2016, the Company recognized a tax provision of
38.6%
compared to 35.5% in 2015. The 2016 tax rates included
$857
of net discrete tax benefits related primarily to excess tax benefits from the vesting of equity awards within income tax expense. The 2015 tax rate included a net discrete benefit of
$219
.
Excluding the above discrete tax and certain other items, from continuing operations, as listed below, the effective tax rates for the year ended September 30, 2016 and 2015 were
41.3%
and
36.7%
, respectively. These rates reflect the impact of tax reserves and changes in earnings mix between U.S. and non-U.S. operations.
Income from continuing operations was
$19,781
, or
$0.45
per share, for 2016 compared to
$12,294
, or
$0.26
per share in the prior year. The 2016 results included a discrete tax benefit, net, of
$(857)
or
$(0.02)
per share. The 2015 results included discrete tax benefits, net, of
$(219)
or
$0.00
per share. Excluding discrete items from both reporting periods,
2016
Income from continuing operations would have been
$18,924
, or
$0.43
per share compared to
$12,075
, or
$0.26
per share, in 2015.
Net income was
$30,010
, or
$0.68
per share, for 2016 compared to
$34,289
, or
$0.73
per share in the prior year.
The 2016 results included the following:
|
–
|
Restructuring charges of $5,900 (
$4,247
, net of tax, or
$0.10
per share); and
|
|
–
|
Discrete tax provisions, net, of
$2,658
or
$0.06
per share.
|
The 2015 results included discrete tax benefits, net, of
$(62)
or
$0.00
per share.
Excluding these items from both reporting periods, 2016 Net income would have been
$36,915
, or
$0.84
per share compared to
$34,227
, or
$0.73
per share, in 2015.
Griffon evaluates performance based on Earnings per share and Net income excluding restructuring charges, loss on debt extinguishment, acquisition related expenses, discrete and certain other tax items, as well other items that may affect comparability, as applicable. Griffon believes this information is useful to investors for the same reason.
34
The following table provides a reconciliation of Income from continuing operations to Adjusted income from continuing operations and Earnings per common share from continuing operations to Adjusted earnings per common share from continuing operations:
GRIFFON CORPORATION AND SUBSIDIARIES
RECONCILIATION OF INCOME FROM CONTINUING OPERATIONS
TO ADJUSTED INCOME FROM CONTINUING OPERATIONS
(Unaudited)
|
For the Years Ended September 30,
|
|||||||||||
|
|
2017
|
|
2016
|
|
2015
|
||||||
|
Income from continuing operations
|
$
|
17,783
|
|
|
$
|
19,781
|
|
|
$
|
12,294
|
|
|
Adjusting items, net of tax:
|
|
|
|
|
|
|
|
|
|||
|
Acquisition costs
|
6,145
|
|
|
—
|
|
|
—
|
|
|||
|
Contract settlement charges
|
3,300
|
|
|
—
|
|
|
—
|
|
|||
|
Discrete tax benefits
|
(8,274
|
)
|
|
(857
|
)
|
|
(219
|
)
|
|||
|
Adjusted income from continuing operations
|
$
|
18,954
|
|
|
$
|
18,924
|
|
|
$
|
12,075
|
|
|
|
|
|
|
|
|
|
|
|
|||
|
Earnings per common share from continuing operations
|
$
|
0.41
|
|
|
$
|
0.45
|
|
|
$
|
0.26
|
|
|
|
|
|
|
|
|
|
|
|
|||
|
Adjusting items, net of tax:
|
|
|
|
|
|
|
|
|
|||
|
Acquisition costs
|
0.14
|
|
|
—
|
|
|
—
|
|
|||
|
Contract settlement charges
|
0.08
|
|
|
—
|
|
|
—
|
|
|||
|
Discrete tax benefits
|
(0.19
|
)
|
|
(0.02
|
)
|
|
—
|
|
|||
|
Adjusted earnings per share from continuing operations
|
$
|
0.44
|
|
|
$
|
0.43
|
|
|
$
|
0.26
|
|
|
Weighted-average shares outstanding (in thousands)
|
43,011
|
|
|
44,109
|
|
|
46,939
|
|
|||
35
The following table provides a reconciliation of Net income to Adjusted net income and Earnings per common share to Adjusted earnings per common share:
GRIFFON CORPORATION AND SUBSIDIARIES
RECONCILIATION OF NET INCOME
TO ADJUSTED NET INCOME
(Unaudited)
|
For the Years Ended September 30,
|
|||||||||||
|
|
2017
|
|
2016
|
|
2015
|
||||||
|
Net Income
|
$
|
14,912
|
|
|
$
|
30,010
|
|
|
$
|
34,289
|
|
|
Adjusting items, net of tax:
|
|
|
|
|
|
|
|
|
|||
|
Acquisition costs
|
6,145
|
|
|
—
|
|
|
—
|
|
|||
|
Contract settlement charges
|
3,300
|
|
|
—
|
|
|
—
|
|
|||
|
Environmental and warranty reserves
|
3,703
|
|
—
|
|
—
|
|
|||||
|
Restructuring
|
—
|
|
|
4,247
|
|
|
—
|
|
|||
|
Discrete tax provisions (benefits)
|
9,385
|
|
|
2,658
|
|
|
(62
|
)
|
|||
|
Adjusted net income
|
$
|
37,445
|
|
|
$
|
36,915
|
|
|
$
|
34,227
|
|
|
|
|
|
|
|
|
|
|
|
|||
|
Earnings per common share
|
$
|
0.35
|
|
|
$
|
0.68
|
|
|
$
|
0.73
|
|
|
|
|
|
|
|
|
|
|
|
|||
|
Adjusting items, net of tax:
|
|
|
|
|
|
|
|
|
|||
|
Acquisition costs
|
0.14
|
|
|
—
|
|
|
—
|
|
|||
|
Contract settlement charges
|
0.08
|
|
|
—
|
|
|
—
|
|
|||
|
Environmental and warranty reserves
|
0.09
|
|
—
|
|
—
|
|
|||||
|
Restructuring
|
—
|
|
|
0.10
|
|
|
—
|
|
|||
|
Discrete tax provisions (benefits)
|
0.22
|
|
|
0.06
|
|
|
—
|
|
|||
|
Adjusted earnings per share
|
$
|
0.87
|
|
|
$
|
0.84
|
|
|
$
|
0.73
|
|
|
Weighted-average shares outstanding (in thousands)
|
43,011
|
|
|
44,109
|
|
|
46,939
|
|
|||
36
REPORTABLE SEGMENTS
The following table provides a reconciliation of Segment operating profit to Income (loss) before taxes and discontinued operations:
|
|
For the Years Ended September 30,
|
||||||||||
|
INCOME BEFORE TAXES FROM CONTINUING OPERATIONS
|
2017
|
2016
|
2015
|
||||||||
|
Segment operating profit:
|
|
|
|
||||||||
|
Home & Building Products
|
$
|
89,495
|
|
$
|
79,682
|
|
$
|
58,883
|
|
||
|
Telephonics
|
29,943
|
|
42,801
|
|
43,006
|
|
|||||
|
PPC
|
25,291
|
|
20,313
|
|
33,137
|
|
|||||
|
Segment operating profit
|
144,729
|
|
|
142,796
|
|
|
135,026
|
|
|||
|
Less: Operating (profit) from discontinued operations
|
25,291
|
|
|
20,313
|
|
|
33,137
|
|
|||
|
Segment operating profit from continuing operations
|
119,438
|
|
|
122,483
|
|
|
101,889
|
|
|||
|
Net interest expense
|
(51,449
|
)
|
(49,877
|
)
|
(47,515
|
)
|
|||||
|
Unallocated amounts
|
(42,398
|
)
|
(40,393
|
)
|
(35,308
|
)
|
|||||
|
Acquisition costs
|
(8,893
|
)
|
—
|
|
—
|
|
|||||
|
Income before taxes from continuing operations
|
$
|
16,698
|
|
$
|
32,213
|
|
$
|
19,066
|
|
||
Griffon evaluates performance and allocates resources based on each segment's operating results from continuing operations before interest income and expense, income taxes, depreciation and amortization, unallocated amounts (mainly corporate overhead), restructuring charges, loss on debt extinguishment and acquisition related expenses, as well as other items that may affect comparability, as applicable (“Segment adjusted EBITDA”, a non-GAAP measure). Griffon believes this information is useful to investors.
The following table provides a reconciliation of Segment adjusted EBITDA to Income (loss) before taxes and discontinued operations:
|
|
For the Years Ended September 30,
|
||||||||||
|
|
2017
|
2016
|
2015
|
||||||||
|
Segment adjusted EBITDA:
|
|
|
|
|
|
|
|||||
|
Home & Building Products
|
$
|
126,766
|
|
$
|
114,949
|
|
$
|
94,226
|
|
||
|
Telephonics
|
45,931
|
|
53,385
|
|
53,028
|
|
|||||
|
PPC
|
52,760
|
|
50,079
|
|
57,103
|
|
|||||
|
Segment adjusted EBITDA
|
225,457
|
|
|
218,413
|
|
|
204,357
|
|
|||
|
Less: EBITDA from discontinued operations
|
52,760
|
|
|
50,079
|
|
|
57,103
|
|
|||
|
Total Segment adjusted EBITDA from continuing operations
|
172,697
|
|
|
168,334
|
|
|
147,254
|
|
|||
|
Net interest expense
|
(51,449
|
)
|
(49,877
|
)
|
(47,515
|
)
|
|||||
|
Segment depreciation and amortization
|
(47,398
|
)
|
(45,851
|
)
|
(45,365
|
)
|
|||||
|
Unallocated amounts
|
(42,398
|
)
|
(40,393
|
)
|
(35,308
|
)
|
|||||
|
Acquisition costs
|
(9,617
|
)
|
—
|
|
—
|
|
|||||
|
Contract settlement charges
|
(5,137
|
)
|
—
|
|
—
|
|
|||||
|
Income before taxes from continuing operations
|
$
|
16,698
|
|
$
|
32,213
|
|
$
|
19,066
|
|
||
37
Home & Building Products
|
|
For the Years Ended September 30,
|
|||||||||||||||||||
|
|
2017
|
2016
|
2015
|
|||||||||||||||||
|
Revenue:
|
|
|
|
|
|
|
||||||||||||||
|
AMES
|
$
|
545,269
|
|
|
$
|
513,973
|
|
|
$
|
535,881
|
|
|
||||||||
|
CBP
|
568,001
|
|
|
527,370
|
|
|
516,320
|
|
|
|||||||||||
|
Home & Building Products
|
$
|
1,113,270
|
|
|
$
|
1,041,343
|
|
|
$
|
1,052,201
|
|
|
||||||||
|
Segment operating profit
|
$
|
89,495
|
|
8.0
|
%
|
$
|
79,682
|
|
7.7
|
%
|
$
|
58,883
|
|
5.6
|
%
|
|||||
|
Depreciation and amortization
|
36,547
|
|
|
35,267
|
|
|
35,343
|
|
|
|||||||||||
|
Acquisition costs
|
724
|
|
|
—
|
|
|
—
|
|
|
|||||||||||
|
Segment adjusted EBITDA
|
$
|
126,766
|
|
11.4
|
%
|
$
|
114,949
|
|
11.0
|
%
|
$
|
94,226
|
|
9.0
|
%
|
|||||
2017
Compared to
2016
Segment revenue
increased
$71,927
, or
7%
, compared to the prior year period. AMES revenue
increased
6%
, primarily due to increased UK market expansion and contributions from the La Hacienda and Hills acquisitions, and increased Canadian snow and lawn tools sales. CBP revenue
increased
8%
from the prior year period, primarily due to increased volume, pricing and favorable mix.
Segment operating profit in 2017 was
$89,495
compared to
$79,682
in 2016, an increase of $9,813, or 12% driven by the increased revenue noted above and favorable product mix, partially offset by increased steel and resin costs. Segment depreciation and amortization increased $1,280 from the prior year period.
On November 6, 2017, AMES acquired Harper Brush Works (“Harper”), a division of Horizon Global, for approximately $5,000. Harper is a leading U.S. manufacturer of cleaning products for professional, home, and industrial use. The acquisition will broaden AMES’ long-handle tool offering in North America to include brooms, brushes, and other cleaning tools and accessories. The acquisition is expected to contribute approximately $10,000 in revenue in the first twelve months after the acquisition.
On October 2, 2017, Griffon completed the acquisition of ClosetMaid, a market leader of home storage and organization products, for approximately $200,000, or $175,000 inclusive of the net present value of tax benefits. ClosetMaid adds to Griffon's Home and Building Products segment, complementing and diversifying Griffon's portfolio of leading consumer brands and products. ClosetMaid is expected to generate approximately $300,000 in revenue in the first twelve months after the acquisition.
On September 29, 2017, AMES Australia completed the acquisition of Tuscan Landscape Group Pty, Ltd. ("Tuscan Path"), a leading Australian provider of pots, planters, pavers, decorative stone, and garden decor products, for approximately
$18,000
(AUD
22,250
). The acquisition of Tuscan Path broadens AMES' outdoor living and lawn and garden business, and will strengthen AMES' industry leading position in Australia. Tuscan Path is expected to generate approximately AUD
25,000
of revenue in the first twelve months after the acquisition.
On July 31, 2017, The AMES Companies, Inc. acquired La Hacienda Limited, a leading United Kingdom outdoor living brand of unique heating and garden decor products, for approximately
$11,400
(GBP
9,175
). The acquisition of La Hacienda broadens AMES' global outdoor living and lawn and garden business and supports AMES' UK expansion strategy. La Hacienda is expected to generate approximately GBP
14,000
of revenue in the first twelve months after the acquisition.
On December 30, 2016, AMES Australia acquired Home Living ("Hills") for approximately $6,051 (AUD 8,400). Hills, founded in 1946, is a market leader in the supply of clothesline, laundry and garden products. The Hills acquisition adds to AMES' existing broad category of products and enhances its lawn and garden product offerings in Australia. Hills is expected to generate approximately AUD 10,000 of revenue in the first twelve months after acquisition.
On February 14, 2016, AMES Australia acquired substantially all of the Intellectual Property (IP) assets of Australia-based Nylex Plastics Pty Ltd. for $1,744 (AUD 2,452). Through this acquisition, AMES and Griffon secured the ownership of the trademark “Nylex” for certain categories of AMES products, principally in the country of Australia. Previously, the Nylex name was licensed. The acquisition of the Nylex IP was contemplated as a post-closing activity of the Cyclone acquisition and supports AMES' Australian watering products strategy.
38
On October 15, 2015, CBP announced plans to expand its manufacturing facility in Troy, Ohio. In the second quarter of 2017, CBP completed this 250,000 square foot expansion of its state-of-the-art facility, which reflects increased customer demand for its core products, and CBP's success in bringing new technologies to market. The Troy facility now has 1.23 million square feet of combined manufacturing and office space. CBP’s Russia, Ohio facility provides additional production capacity, particularly for specialized and custom products.
2016
Compared to
2015
Segment revenue decreased $10,858, or 1%, compared to the prior year period. Excluding a $14,900 or 1% unfavorable foreign currency impact, revenue remained consistent with the prior year period. AMES revenue decreased 4%, mainly driven by a combination of a warm winter and a cold and wet spring in both the U.S. and Canada, resulting in reduced snow and spring tool category sales, respectively, partially offset by improved sales of North American pots and planters and increased product offerings in Australia; foreign currency was 2% unfavorable. CBP revenue increased 2% compared to the prior year period, primarily due to improved volume and favorable mix; the impact of foreign currency was not material.
Segment operating profit in 2016 was $79,682 compared to $58,883 in 2015, an increase of $20,799, or 35% driven by operational efficiency improvements, cost control measures at AMES and increased volume and favorable mix at CBP and decreased material costs, which more than offset the impact of reduced revenue at AMES; foreign currency was 4% unfavorable. Segment depreciation and amortization remained consistent with the prior year.
Telephonics
|
|
For the Years Ended September 30,
|
|||||||||||||||||||
|
|
2017
|
2016
|
2015
|
|||||||||||||||||
|
Revenue
|
$
|
411,727
|
|
|
$
|
435,692
|
|
|
$
|
431,090
|
|
|
||||||||
|
Segment operating profit
|
$
|
29,943
|
|
7.3
|
%
|
$
|
42,801
|
|
9.8
|
%
|
$
|
43,006
|
|
10.0
|
%
|
|||||
|
Depreciation and amortization
|
10,851
|
|
|
10,584
|
|
|
10,022
|
|
|
|||||||||||
|
Contract settlement charges
|
5,137
|
|
|
—
|
|
|
—
|
|
|
|||||||||||
|
Segment adjusted EBITDA
|
$
|
45,931
|
|
11.2
|
%
|
$
|
53,385
|
|
12.3
|
%
|
$
|
53,028
|
|
12.3
|
%
|
|||||
2017
Compared to
2016
Revenue in
2017
decreased $23,965, or 6%, compared to the prior year period, primarily due to decreased multi-mode radar revenue and certain ground surveillance systems, partially offset by favorable performance on electronic countermeasure systems revenue.
Segment operating profit decreased $12,858 from the prior year period. During 2017, Telephonics recorded a $5,137 charge, consisting of a settlement in the amount of $4,250 plus 2% interest and associated legal costs, related to certain amounts the civil division of the US Department of Justice indicated it believed it was owed from Telephonics with respect to certain US government contracts, performed during the 2005 to 2013 time period, in which Telephonics acted as a subcontractor. Excluding these charges, segment operating profit in the current year would have been $35,080, a $7,721 decrease from the prior year period primarily due to the decreased revenue noted above, unfavorable program mix and the impact of revised estimates to complete remaining performance obligations on certain radar and communication programs.
During 2017, Telephonics was awarded several new contracts and incremental funding on existing contracts approximating
$342,400
. Contract backlog was
$350,900
at September 30, 2017 with
70%
expected to be fulfilled in the next 12 months; backlog was
$420,000
at September 30, 2016. Backlog is defined as unfilled firm orders for products and services for which funding has been both authorized and appropriated by the customer or Congress, in the case of the U.S. government agencies. The decrease in backlog was primarily due to the timing of various U.S. and international contract awards associated with radar and surveillance opportunities.
In December 2015, Telephonics invested an additional $2,726 increasing its equity stake from 26% to 49% in Mahindra Telephonics Integrated Systems (MTIS), a joint venture with Mahindra Defence Systems, a Mahindra Group Company. MTIS is an aerospace and defense manufacturing and development facility in Prithla, India.
39
2016
Compared to
2015
Revenue in 2016 increased $4,602, or 1%, compared to the prior year period, due to mobile ground surveillance systems and dismounted Electronic Countermeasure systems, partially offset by airborne maritime and Identification Friend or Foe ("IFF") radar systems.
Segment operating profit remained consistent with the prior year period.
Unallocated Amounts
For
2017
, unallocated amounts, consisting primarily of corporate overhead costs, totaled
$42,398
compared to
$40,393
in 2016, with the increase primarily due to compensation and incentive costs.
For
2016
, unallocated amounts, which consist primarily of corporate overhead costs, totaled
$40,393
compared to
$35,308
in 2015 primarily due to expenses related to the pursuit of acquisition opportunities, expenses relating to an intellectual property legal claim (in which Griffon is the plaintiff) and increased insurance costs.
Segment Depreciation and Amortization
Segment depreciation and amortization of
$47,398
in
2017
compared to the prior year of
$45,851
, increased $1,547 primarily due to depreciation for new assets placed in service.
Segment depreciation and amortization of
$45,851
in
2016
remained consistent with the prior year of
$45,365
.
Comprehensive Income (Loss)
During 2017, total other comprehensive income, net of taxes, of
$20,760
consisted of a
$10,667
income on Foreign currency translation adjustments primarily due to the strengthening of the Euro, Canadian, British Pound, Brazilian and Australian currencies, all in comparison to the U.S. Dollar, a
$9,203
gain from Pension and other post-retirement benefits, primarily due to higher assumed discount rates compared to the prior year and a
$890
gain on cash flow hedges.
During 2016, total other comprehensive income, net of taxes, of $9,947 consisted of a $17,284 income on Foreign currency translation adjustments primarily due to the strengthening of the Euro, Canadian, Brazilian and Australian currencies, all in comparison to the U.S. Dollar, a $5,651 loss from Pension and other post-retirement benefits, primarily due to lower assumed discount rates compared to the prior year and a $1,686 loss on cash flow hedges.
DISCONTINUED OPERATIONS
Plastic Products Company
On September 5, 2017, Griffon announced it will explore strategic alternatives for Clopay Plastic Products Company, Inc. ("PPC") and on November 16, 2017, announced it entered into a definitive agreement to sell PPC to Berry for $475 million in cash. As a result, the following PPC results have been classified PPC as a discontinued operation.
|
|
For the Years Ended September 30,
|
|||||||||||||||||||
|
|
2017
|
2016
|
2015
|
|||||||||||||||||
|
Revenue
|
$
|
460,914
|
|
|
$
|
480,126
|
|
|
$
|
532,741
|
|
|
||||||||
|
Segment operating profit
|
$
|
25,291
|
|
5.5
|
%
|
$
|
20,313
|
|
4.2
|
%
|
$
|
33,137
|
|
6.2
|
%
|
|||||
|
Depreciation and amortization
|
27,469
|
|
|
23,866
|
|
|
23,966
|
|
|
|||||||||||
|
Restructuring charges
|
—
|
|
|
5,900
|
|
|
—
|
|
|
|||||||||||
|
Segment adjusted EBITDA
|
$
|
52,760
|
|
11.4
|
%
|
$
|
50,079
|
|
10.4
|
%
|
$
|
57,103
|
|
10.7
|
%
|
|||||
40
2017
Compared to
2016
Revenue in
2017
decreased $19,212 or 4%, in comparison to 2016, primarily due to unfavorable volume of 4% driven by Europe, partially offset by increased volume in North America and Brazil, as well as unfavorable mix of 2%. These decreases were partially offset by a favorable resin impact of $3,600, or 1% and favorable foreign currency of 1%. PPC adjusts selling prices based on underlying resin costs on a delayed basis.
Segment operating profit
increased
$4,978
or 25%, compared to the prior year. During 2016, PPC recorded restructuring charges of $5,900 primarily related to headcount reductions at PPC’s Dombuhl, Germany facility, other location headcount reductions and the shut down of PPC's Turkey facility. Excluding these charges, prior year Segment operating profit was $26,213 compared to the current year of $25,291, a decrease of $922 or 4%, due to reduced volume, unfavorable mix, a $2,100 change in the impact of resin pricing pass through and increased depreciation of $3,603 resulting from investment in worldwide breathable film and printing capacity, partially offset by improved operations.
During April 2016, PPC announced a breathable film investment, which will expand breathable film capacity in North America, Europe and Brazil, increase PPC's extrusion and print capacity, and enhance PPC's innovation and technology capabilities. Griffon expect the project to be completed in fiscal 2018. These investments will allow PPC to maintain and extend its technological advantage and allow it to differentiate itself from competitors, while meeting increasing customer demand for lighter, softer, more cost effective and more environmentally friendly products.
2016
Compared to
2015
Revenue in 2016 decreased $52,615 or 10%, in comparison to 2015, primarily due to decreased volume of 4% driven by reduced North America and Europe baby care orders, unfavorable mix of 3% and a $17,100 or 3% unfavorable foreign currency impact. Resin pricing had no material impact on revenue in the current year. PPC adjusts selling prices based on underlying resin costs on a delayed basis.
Segment operating profit decreased $12,824 or 39%, compared to the prior year. During 2016, PPC recorded restructuring charges of $5,900 primarily related to headcount reductions at PPC’s Dombuhl, Germany facility, other location headcount reductions and the shut down of PPC's Turkey facility. Excluding these charges, current year Segment operating profit was $26,213, a decrease of $6,924 or 21%, compared to the prior year, due to reduced volume and unfavorable mix, partially offset by decreased SG&A spending. Resin pricing and foreign currency did not have a material impact on Segment operating profit for the year. Segment depreciation and amortization remained consistent with the prior year.
Restructuring
In 2016, PPC incurred pre-tax restructuring and related exit costs approximating $5,900 primarily related to headcount reductions at PPC’s Dombuhl, Germany facility, other location headcount reductions and the shut down of PPC's Turkey facility. These actions resulted in the elimination of approximately 86 positions. The Dombuhl charges were related to an optimization plan that will drive innovation and enhance PPC's industry leading position in printed breathable back sheet. In conjunction with this effort, PPC's customer base will be streamlined, and PPC will dispose of old assets and reduce overhead costs, allowing for gains in efficiencies. Management estimates that these actions will result in annual cash savings of $4,000 based on current operating levels.
Installation Services and Other Discontinued Activities
In 2008, as a result of the downturn in the residential housing market, Griffon exited substantially all operating activities of its Installation Services segment which sold, installed and serviced garage doors and openers, fireplaces, floor coverings, cabinetry and a range of related building products, primarily for the new residential housing market. Griffon sold eleven units, closed one unit and merged two units into CBP. Operating results of substantially this entire segment have been reported as discontinued operations in the Consolidated Statements of Operations and Comprehensive Income (Loss) for all periods presented; Installation Services is excluded from segment reporting.
Griffon substantially concluded remaining disposal activities in 2009. There was no reported revenue in 2017, 2016 and 2015. Future net cash outflows to satisfy liabilities related to disposal activities accrued as of September 30, 2017 are estimated to be
$5,679
.
41
During the year ended September 30, 2017, Griffon recorded
$5,700
of reserves in discontinued operations related to historical environmental remediation efforts and to increase the reserve for homeowner association claims (HOA) related to installation services.
At September 30, 2017, Griffon’s assets and liabilities for discontinued operations primarily related to income taxes and product liability, warranty and environmental reserves.
LIQUIDITY AND CAPITAL RESOURCES
Management assesses Griffon’s liquidity in terms of its ability to generate cash to fund its operating, investing and financing activities. Significant factors affecting liquidity are: cash flows from operating activities, capital expenditures, acquisitions, dispositions, bank lines of credit and the ability to attract long-term capital under satisfactory terms. Griffon believes it has sufficient liquidity available to invest in existing businesses and strategic acquisitions while managing its capital structure on both a short-term and long-term basis.
The following table is derived from the Consolidated Statements of Cash Flows:
|
Cash Flows from Continuing Operations
|
Years Ended September 30,
|
||||||
|
(in thousands)
|
2017
|
2016
|
|||||
|
Net Cash Flows Provided By (Used In):
|
|
|
|
|
|||
|
Operating activities
|
$
|
49,151
|
|
$
|
80,118
|
|
|
|
Investing activities
|
(71,337
|
)
|
(62,261
|
)
|
|||
|
Financing activities
|
(700
|
)
|
15,414
|
|
|||
Cash flows provided by operating activities from continuing operations for
2017
decreased
$30,967
, to
$49,151
compared to
$80,118
in
2016
, with the decrease driven by increased working capital, primarily from increased inventory.
Cash used in investing activities from continuing operations for 2017 increased $9,076, to
$71,337
compared to
$62,261
in
2016
, with the increase primarily driven by acquisitions. On September 29, 2017, Ames Australia competed the acquisition of Tuscan Landscape Group Pty, Ltd., a leading Australian provider of pots, planters, pavers, decorative stone, and garden decor products for approximately
$18,000
(AUD
22,250
). On July 31, 2017 AMES acquired La Hacienda, a leading United Kingdom outdoor living brand of unique heating and garden decor products, for approximately
$11,400
(GBP
9,175
). On December 30, 2016, AMES Australia acquired Hills Home Living, a market leader in the supply of clothesline, laundry and garden products, for approximately $6,051 (AUD 8,400). On February 14, 2016, AMES Australia acquired substantially all of the Intellectual Property assets of Australia-based Nylex Plastics Pty Ltd. for approximately $1,700 (AUD 2,452). Previously, the Nylex name was licensed. In December 2015, Telephonics invested an additional $2,726 increasing its equity stake from 26% to 49% in Mahindra Telephonics Integrated Systems (MTIS), a joint venture with Mahindra Defence Systems, a Mahindra Group Company. In
2017
, capital expenditures, net, totaled
$34,794
compared to
$58,506
in
2016
.
Cash used in financing activities from continuing operations in
2017
totaled
$700
compared to a source of
$15,414
in the prior year. The current year included net proceeds from debt of
$62,989
, a share premium payment of
$24,997
related to the settlement of Griffon's 4% convertible subordinated notes,
$15,841
for the repurchase of common stock,
$10,908
for the purchase of common stock for Griffon's ESOP plan and
$10,325
for the payment of dividends.
At September 30, 2017, there were
$144,216
in outstanding borrowings under the Credit Agreement compared to no outstanding borrowings at the same date in the prior year. On January 17, 2017, Griffon settled its $100,000 principal amount of 4% convertible subordinated notes due 2017 for $173,855 with $125,000 in cash, utilizing the Credit Agreement, and $48,858, or 1,954,993 shares of common stock issued from treasury. On each of March 20, 2015, July 29, 2015 and August 3, 2016, Griffon’s Board of Directors authorized the repurchase of up to $50,000 of Griffon’s outstanding common stock. Under these share repurchase programs, the Company may purchase shares in the open market, including pursuant to a 10b5-1 plan, or in privately negotiated transactions. During 2017, Griffon purchased 129,000 shares of common stock under these programs, for a total of $2,201 or $17.06 per share. At September 30, 2017,
$49,437
remains under the August 2016 Board authorized repurchase program. In addition to the repurchases under Board authorized programs, during
2017
, 586,219 shares, with a market value of $13,640, or $23.27 per share, were withheld to settle employee taxes due upon the vesting of restricted stock, and were added to treasury stock. Furthermore, during 2017, Griffon's ESOP purchased 621,875 shares of common stock for a total of $10,908 or $17.54 per share with proceeds from a Line Note.
42
In 2016, cash used in financing activities from continuing operations primarily consisted of
$65,307
for the repurchase of common stock and
$8,798
for the payment of dividends, partially offset by net proceeds from debt of $93,848. On May 18, 2016, Griffon completed an add-on offering of $125,000 principal amount of its 5.25% Senior Notes due 2022, at 98.76% of par, to Griffon's previously issued $600,000 principal amount of its 5.25% Senior Notes due 2022, at par. The net proceeds were used to pay down outstanding borrowings on the Revolving Credit Facility.
During
2017
, the Board of Directors approved four quarterly cash dividends each for $0.06 per share. On November 15, 2017, the Board of Directors declared a cash dividend of
$0.07
per share, payable on December 21, 2017 to shareholders of record as of the close of business on November 29, 2017.
As of September 30, 2017, the amount of cash, cash equivalents and marketable securities held by foreign subsidiaries was $26,500. Our intent is to permanently reinvest these funds outside the U.S., and we do not currently anticipate that we will need funds generated from foreign operations to fund our domestic operations. In the event we determine that funds from foreign operations are needed to fund operations in the U.S., we will be required to accrue and pay U.S taxes to repatriate these funds (unless U.S. taxes have already been paid).
Payments related to Telephonics revenue are received in accordance with the terms of development and production subcontracts; certain of such receipts are progress or performance based payments. With respect to HBP, uncollected receivables have been immaterial in amount.
A small number of customers account for, and are expected to continue to account for, a substantial portion of Griffon’s consolidated revenue. In
2017
:
|
a.
|
The U.S. Government and its agencies, through prime and subcontractor relationships, represented
18%
of Griffon’s consolidated revenue and
66%
of Telephonics' revenue.
|
|
b.
|
Home Depot represented
17%
of Griffon’s consolidated revenue and
23%
of HBP's revenue.
|
No other customer exceeded 10% or more of consolidated revenue. Future operating results will continue to substantially depend on the success of Griffon’s largest customers and our relationships with them. Orders from these customers are subject to change and may fluctuate materially. The loss of all or a portion of volume from any one of these customers could have a material adverse impact on Griffon’s liquidity and operations.
At September 30,
2017
, Griffon had debt, net of cash and equivalents, as follows:
|
Cash and Equivalents and Debt
|
At September 30,
|
At September 30,
|
|||||
|
(in thousands)
|
2017
|
2016
|
|||||
|
Cash and equivalents
|
$
|
47,681
|
|
$
|
72,553
|
|
|
|
Notes payables and current portion of long-term debt
|
11,078
|
|
13,932
|
|
|||
|
Long-term debt, net of current maturities
|
968,080
|
|
896,946
|
|
|||
|
Debt discount and issuance costs
|
13,243
|
|
15,971
|
|
|||
|
Total debt
|
992,401
|
|
926,849
|
|
|||
|
Debt, net of cash and equivalents
|
$
|
944,720
|
|
$
|
854,296
|
|
|
On May 18, 2016, in an unregistered offering through a private placement under Rule 144A, Griffon completed the add-on offering of $125,000 principal amount of its 5.25% senior notes due 2022, at 98.76% of par, to Griffon's previous issuance of
$600,000
5.25%
senior notes due in
2022
, at par, which was completed on February 27, 2014 (collectively the “Senior Notes”). As of September 30, 2017, outstanding Senior Notes due totaled $725,000; interest is payable semi-annually on March 1 and September 1. The net proceeds of the add-on offering were used to pay down outstanding borrowings under Griffon's Revolving Credit Facility (the "Credit Agreement").
Proceeds from the $600,000 5.25% senior notes due in 2022 were used to redeem
$550,000
of
7.125%
senior notes due 2018, to pay a call and tender offer premium of
$31,530
and to make interest payments of
$16,716
, with the balance used to pay a portion of the related transaction fees and expenses. In connection with the issuance of the Senior Notes, all obligations under the
$550,000
of
7.125%
senior notes due in 2018 were discharged.
43
The Senior Notes are senior unsecured obligations of Griffon guaranteed by certain domestic subsidiaries, and subject to certain covenants, limitations and restrictions. On July 20, 2016 and June 18, 2014, Griffon exchanged all of the $125,000 and $600,000 Senior Notes, respectively, for substantially identical Senior Notes registered under the Securities Act of 1933 via an exchange offer. The fair value of the Senior Notes approximated
$737,688
on September 30, 2017 based upon quoted market prices (level 1 inputs). In connection with the issuance and exchange of the $125,000 senior notes, Griffon capitalized $3,016 of underwriting fees and other expenses, which will amortize over the term of such notes; Griffon capitalized
$10,313
in connection with the previously issued $600,000 senior notes.
On October 2, 2017, Griffon completed an add-on offering of $275,000 aggregate principle amount of 5.25% senior notes due 2022 in an unregistered offering through a private placement. The $275,000 senior notes were issued under the same indenture pursuant to which Griffon previously issued $725,000 in aggregate principal amount of its 5.25% Senior Notes due 2022. As of October 2, 2017, outstanding Senior Notes due totaled $1,000,000; interest is payable semi-annually on March 1 and September 1. The net proceeds of the add-on offering were used to acquire ClosetMaid, with the remaining proceeds used to pay down outstanding borrowings under Griffon's Credit Agreement.
On March 22, 2016, Griffon amended the Credit Agreement to increase the credit facility from
$250,000
to
$350,000
, extend its maturity from March 13, 2020 to March 22, 2021, and modify certain other provisions of the facility. The facility includes a letter of credit sub-facility with a limit of
$50,000
and a multi-currency sub-facility of
$50,000
. The Credit Agreement provides for same day borrowings of base rate loans. Borrowings under the Credit Agreement may be repaid and re-borrowed at any time, subject to final maturity of the facility or the occurrence of an event of default under the Credit Agreement. Interest is payable on borrowings at either a LIBOR or base rate benchmark rate, in each case without a floor, plus an applicable margin, which adjusts based on financial performance. Current margins are
1.25%
for base rate loans and
2.25%
for LIBOR loans. The Credit Agreement has certain financial maintenance tests including a maximum total leverage ratio, a maximum senior secured leverage ratio and a minimum interest coverage ratio, as well as customary affirmative and negative covenants and events of default. The negative covenants place limits on Griffon's ability to, among other things, incur indebtedness, incur liens, and make restricted payments and investments. Borrowings under the Credit Agreement are guaranteed by Griffon’s material domestic subsidiaries and are secured, on a first priority basis, by substantially all domestic assets of the Company and the guarantors, and a pledge of not greater than
65%
of the equity interest in Griffon’s material, first-tier foreign subsidiaries (except that a lien on the assets of Griffon’s material domestic subsidiaries securing a limited amount of the debt under the credit agreement relating to Griffon's Employee Stock Ownership Plan ("ESOP") ranks pari passu with the lien granted on such assets under the Credit Agreement). On October 2, 2017, Griffon further amended the Credit Agreement to modify the maximum total leverage covenant for the quarters ending December 31, 2017, through March 31, 2019, to provide additional financial and operating flexibility. At
September 30, 2017
, there were
$144,216
outstanding borrowings and standby letters of credit were
$13,890
under the Credit Agreement;
$191,894
was available, subject to certain loan covenants, for borrowing at that date.
On December 21, 2009, Griffon issued
$100,000
principal of
4%
convertible subordinated notes due 2017 (the “2017 Notes”). On July 14, 2016, Griffon announced that it would settle, upon conversion, up to $125,000 of the conversion value of the 2017 Notes in cash, with amounts in excess of $125,000, if any, to be settled in shares of Griffon common stock. On January 17, 2017, Griffon settled the convertible debt for $173,855 with $125,000 in cash, utilizing borrowings under the Credit Agreement, and $48,858, or 1,954,993 shares of common stock issued from treasury.
In September 2015 and March 2016, Griffon entered into mortgage loans in the amounts of
$32,280
and $8,000, respectively. The mortgage loans are secured by
four
properties occupied by Griffon's subsidiaries. The loans mature in
September 2025
, and April 2018, respectively, are collateralized by the specific properties financed and are guaranteed by Griffon. The loans bear interest at a rate of LIBOR plus
1.50%
. At September 30, 2017, mortgage loans outstanding related to continuing operations was
$23,322
, net of issuance costs.
In August 2016, Griffon’s ESOP entered into an agreement that refinanced the existing ESOP loan into a new Term Loan in the amount of
$35,092
(the "Agreement"). The Agreement also provided for a Line Note with
$10,908
available to purchase shares of Griffon common stock in the open market. During 2017, Griffon's ESOP purchased
621,875
shares of common stock for a total of
$10,908
or
$17.54
per share, with proceeds from the Line Note. The remaining amount available on the authorization is
$0
. On June 30, 2017, the Term Loan and Line Note were combined into a single Term Loan. The Term Loan bears interest at LIBOR plus
2.50%
. The Term Loan requires a quarterly principal payment of $655 on September 30, 2017 and $569 thereafter, with a balloon payment due at maturity on March 22, 2020. As of
September 30, 2017
,
$42,365
, net of issuance costs, was outstanding under the Term Loan. The Term Loan is secured by shares purchased with the proceeds of the loan and with a lien on a specific amount of Griffon assets (which lien ranks pari passu with the lien granted on such assets under the Credit Agreement) and is guaranteed by Griffon.
44
In October 2006, CBP entered into a capital lease totaling
$14,290
for real estate in Troy, Ohio. The lease matures in
2022
, bears interest at a fixed rate of
5.0%
, is secured by a mortgage on the real estate and is guaranteed by Griffon. As of September 30,
2017
,
$5,207
was outstanding, net of issuance costs.
In November 2012, Garant G.P. (“Garant”) entered into a CAD
15,000
($12,033 as of September 30, 2017) revolving credit facility. The facility accrues interest at LIBOR (USD) or the Bankers Acceptance Rate (CDN) plus
1.3%
per annum (
2.63%
LIBOR USD and
2.65%
Bankers Acceptance Rate CDN as of
September 30, 2017
). The revolving facility matures in October 2019. Garant is required to maintain a certain minimum equity. As of
September 30, 2017
, there were
no
borrowings under the revolving credit facility with CAD
15,000
(
$12,033
as of
September 30, 2017
) available for borrowing.
In July 2016, Griffon Australia Holdings Pty Ltd and its Australian subsidiaries ("Griffon Australia") entered into an AUD 30,000 term loan and an AUD 10,000 revolver. The term loan refinanced two existing term loans and the revolver replaced two existing lines. In December 2016, the amount available under the revolver was increased from AUD 10,000 to AUD 20,000 and, in March 2017 the term loan commitment was increased by AUD 5,000 to AUD 33,500. In September 2017, the term loan commitment was increased by AUD 15,000 to AUD 46,750. The term loan requires quarterly principal payments of AUD
1,250
plus interest, with a balloon payment of AUD
37,125
due upon maturity in June 2019, and accrues interest at Bank Bill Swap Bid Rate “BBSY” plus
2.00%
per annum (
3.76%
at
September 30, 2017
). As of
September 30, 2017
, the term had an outstanding balance of AUD
45,875
(
$35,943
as of September 30, 2017). The revolving facility matures in November 2017, but is renewable upon mutual agreement with the bank, and accrues interest at BBSY plus 2.0% per annum (3.67% at September 30, 2017). At September 30, 2017, the revolver had an outstanding balance of AUD
12,000
(
$9,402
at September 30, 2017). The revolver and the term loan are both secured by substantially all of the assets of Griffon Australia and its subsidiaries. Griffon guarantees the term loan. Griffon Australia is required to maintain a certain minimum equity level and is subject to a maximum leverage ratio and a minimum fixed charges cover ratio.
Other long-term debt primarily consists of a loan with the Pennsylvania Industrial Development Authority and capital leases.
At
September 30, 2017
, Griffon and its subsidiaries were in compliance with the terms and covenants of its credit and loan agreements.
On each of March 20, 2015, July 29, 2015 and August 3, 2016, Griffon’s Board of Directors authorized the repurchase of up to $50,000 of Griffon’s outstanding common stock. Under these share repurchase programs, the Company may purchase shares in the open market, including pursuant to a 10b5-1 plan, or in privately negotiated transactions. During 2017, Griffon purchased 129,000 shares of common stock under these programs, for a total of $2,201 or $17.06 per share. From August 2011 through September 30, 2017, Griffon repurchased
20,429,298
shares of its common stock, for a total of
$261,621
or $12.81 per share. This includes the repurchase of
15,984,854
shares on the open market, as well as the December 10, 2013 repurchase of 4,444,444 shares from GS Direct for $50,000 or
$11.25
per share. At September 30, 2017,
$49,437
remains under Board repurchase authorizations.
On December 10, 2013, Griffon repurchased 4,444,444 shares of its common stock for $50,000 from GS Direct. The repurchase was effected in a private transaction at a per share price of $11.25, an approximate 9.2% discount to the stock’s closing price on November 12, 2013, the day before announcement of the transaction. The transaction was exclusive of the Company’s August 2011 $50,000 authorized share repurchase program. GS Direct continues to hold approximately 5.6 million shares of Griffon’s common stock. Subject to certain exceptions, if GS Direct intends to sell its remaining shares of Griffon common stock at any time prior to December 31, 2018, it will first negotiate in good faith to sell such shares to the Company.
In addition to the repurchases under Board authorized programs, during
2017
,
586,219
shares, with a market value of
$13,640
, or
$23.27
per share, were withheld to settle employee taxes due upon the vesting of restricted stock.
During 2017, 2016 and 2015, the Company declared and paid dividends totaling $0.24 per share, $0.20 per share and $0.16 per share, respectively. The Company currently intends to pay dividends each quarter; however, payment of dividends is determined by the Board of Directors at its discretion based on various factors, and no assurance can be provided as to the payment of future dividends.
On November 15, 2017, the Board of Directors declared a cash dividend of
$0.07
per share, payable on December 21, 2017 to shareholders of record as of the close of business on November 29, 2017.
During the year ended September 30,
2017
, Griffon used cash for discontinued operations from operating, investing and financing activities of $2,150, primarily related to PPC operations and the settling of certain Installation Services and environmental liabilities. Cash flows from investing activities of $45,075 for discontinued operations related primarily driven by capital expenditures.
45
Contractual Obligations
At September 30,
2017
, payments to be made pursuant to significant contractual obligations are as follows:
|
|
Payments Due by Period
|
||||||||||||||||||||||
|
(in thousands)
|
Total
|
Less Than 1 Year
|
1-3 Years
|
3-5 Years
|
More than 5
Years
|
Other
|
|||||||||||||||||
|
Long-term debt (a)
|
$
|
992,401
|
|
$
|
11,078
|
|
$
|
54,646
|
|
$
|
10,559
|
|
$
|
916,118
|
|
$
|
—
|
|
|||||
|
Interest expense
|
302,938
|
|
61,732
|
|
120,915
|
|
119,296
|
|
995
|
|
—
|
|
|||||||||||
|
Rental commitments
|
106,152
|
|
27,282
|
|
44,912
|
|
19,399
|
|
14,559
|
|
—
|
|
|||||||||||
|
Purchase obligations (b)
|
221,621
|
|
209,924
|
|
11,123
|
|
574
|
|
—
|
|
—
|
|
|||||||||||
|
Capital expenditures
|
2,406
|
|
2,406
|
|
—
|
|
—
|
|
—
|
|
—
|
|
|||||||||||
|
Supplemental & post-retirement benefits (c)
|
30,790
|
|
4,057
|
|
7,768
|
|
6,930
|
|
12,035
|
|
—
|
|
|||||||||||
|
Uncertain tax positions (d)
|
1,486
|
|
—
|
|
—
|
|
—
|
|
—
|
|
1,486
|
|
|||||||||||
|
Total obligations
|
$
|
1,657,794
|
|
$
|
316,479
|
|
$
|
239,364
|
|
$
|
156,758
|
|
$
|
943,707
|
|
$
|
1,486
|
|
|||||
______________
|
(a)
|
Included in long-term debt are capital leases of: $1,787 (less than 1 year), $3,636 (1-3 years), $1,984 (3-5 years) and $0 (more than 5 years).
|
|
(b)
|
Purchase obligations are generally for the purchase of goods and services in the ordinary course of business. Griffon uses blanket purchase orders to communicate expected requirements to certain vendors. Purchase obligations reflect those purchase orders where the commitment is considered to be firm. Purchase obligations that extend beyond 2017 are principally related to long-term contracts received from customers of Telephonics.
|
|
(c)
|
Griffon funds required payouts under its non-qualified supplemental defined benefit plan from its general assets and the expected payments are included in each period, as applicable.
|
|
(d)
|
Due to the uncertainty of the potential settlement of future uncertain tax positions, management is unable to estimate the timing of related payments, if any, that will be made subsequent to
2017
. These amounts do not include any potential indirect benefits resulting from deductions or credits for payments made to other jurisdictions.
|
46
Off-Balance Sheet Arrangements
Except for operating leases and purchase obligations as disclosed herein, Griffon is not a party to any off-balance sheet arrangements.
Off-Set Agreements
Telephonics may enter into industrial cooperation agreements, sometimes referred to as offset agreements, as a condition to obtaining orders for its products and services from customers in foreign countries. These agreements promote investment in the country, and may be satisfied through activities that do not require Griffon to use its cash, including transferring technology, providing manufacturing and other consulting support. These agreements may also be satisfied through the use of cash for such activities as purchasing supplies from in-country vendors, setting up support centers, research and development investments, acquisitions, and building or leasing facilities for in-country operations, if applicable. The amount of the offset requirement is determined by contract value awarded and negotiated percentages with customers. At September 30,
2017
, Telephonics had outstanding offset agreements approximating $56,000, primarily related to its Radar Systems division, some of which extend through 2029. Offset programs usually extend over several years and in some cases provide for penalties in the event Telephonics fails to perform in accordance with contract requirements. Historically, Telephonics has not been required to pay any such penalties and as of September 30,
2017
, no such penalties are estimable or probable.
ACCOUNTING POLICIES AND PRONOUNCEMENTS
Critical Accounting Policies
The preparation of Griffon’s consolidated financial statements in conformity with accounting principles generally accepted in the U.S. of America (“GAAP”) requires the use of estimates, assumptions, judgments and subjective interpretations of accounting principles that have an impact on assets, liabilities, revenue and expenses. These estimates can also affect supplemental information contained in public disclosures of Griffon, including information regarding contingencies, risk and its financial condition. These estimates, assumptions and judgments are evaluated on an ongoing basis and based on historical experience, current conditions and various other assumptions, and form the basis for estimating the carrying values of assets and liabilities, as well as identifying and assessing the accounting treatment for commitments and contingencies. Actual results may materially differ from these estimates.
An estimate is considered to be critical if it is subjective and if changes in the estimate using different assumptions would result in a material impact on Griffon’s financial position or results of operations. The following have been identified as the most critical accounting policies and estimates:
Revenue Recognition
Revenue is recognized when the following circumstances are satisfied: a) persuasive evidence of an arrangement exists, b) delivery has occurred, title has transferred or services are rendered, c) price is fixed and determinable and d) collectability is reasonably assured. Goods are sold on terms that transfer title and risk of loss at a specified location. Revenue recognition from product sales occurs when all factors are met, including transfer of title and risk of loss, which occurs either upon shipment or upon receipt by customers at the location specified in the terms of sale. Other than standard product warranty provisions, sales arrangements provide for no other significant post-shipment obligations. From time to time and for certain customers, rebates and other sales incentives, promotional allowances or discounts are offered, typically related to customer purchase volumes, all of which are fixed or determinable and are classified as a reduction of revenue and recorded at the time of sale. Griffon provides for sales returns allowances based upon historical returns experience.
Telephonics earns a substantial portion of its revenue as either a prime or subcontractor from contract awards with the U.S. Government, as well as non-U.S. governments and other commercial customers. These formal contracts are typically long-term in nature, usually greater than one year. Revenue and profits from these long-term fixed price contracts are recognized under the percentage-of-completion method of accounting. Revenue and profits on fixed-price contracts that contain engineering as well as production requirements are recorded based on the ratio of total actual incurred costs to date to the total estimated costs for each contract (cost-to-cost method). Using the cost-to-cost method, revenue is recorded at amounts equal to the ratio of actual cumulative costs incurred divided by total estimated costs at completion, multiplied by the total estimated contract revenue, less the cumulative revenue recognized in prior periods. The profit recorded on a contract using this method is equal to the current estimated total profit margin multiplied by the cumulative revenue recognized, less the amount of cumulative profit previously recorded for the contract in prior periods. As this method relies on the substantial use of estimates, these projections may be revised throughout the life of a contract. Components of this formula and ratio that may be estimated include gross profit margin and total costs at
47
completion. The cost performance and estimates to complete on long-term contracts are reviewed, at a minimum, on a quarterly basis, as well as when information becomes available that would necessitate a review of the current estimate. Adjustments to estimates for a contract's estimated costs at completion and estimated profit or loss often are required as experience is gained, and as more information is obtained, even though the scope of work required under the contract may or may not change, or if contract modifications occur. The impact of such adjustments or changes to estimates is made on a cumulative basis in the period when such information has become known. In 2017, 2016 and 2015, income from operations included net favorable/(unfavorable) catch-up adjustments approximating
$600
,
$(700)
and
$(400)
, respectively. Gross profit is affected by a variety of factors, including the mix of products, systems and services, production efficiencies, price competition and general economic conditions.
Revenue and profits on cost-reimbursable type contracts are recognized as allowable costs are incurred on the contract at an amount equal to the allowable costs plus the estimated profit on those costs. The estimated profit on a cost-reimbursable contract may be fixed or variable based on the contractual fee arrangement. Incentive and award fees on these contracts are recorded as revenue when the criteria under which they are earned are reasonably assured of being met and can be estimated.
For contracts whose anticipated total costs exceed total expected revenue, an estimated loss is recognized in the period when identifiable. A provision for the entire amount of the estimated loss is recorded on a cumulative basis. The estimated remaining costs to complete loss contracts, as of September 30, 2017 was
$9,900
and is recorded as a reduction to gross margin on the Consolidated Statements of Operations and Comprehensive Income (Loss). This loss had an immaterial impact to Griffon's Consolidated Financial Statements.
Amounts representing contract change orders or claims are included in revenue only when they can be reliably estimated and their realization is probable, and are determined on a percentage-of-completion basis measured by the cost-to-cost method.
From time to time, Telephonics may combine contracts if they are negotiated together, have specific requirements to combine, or are otherwise closely related. Contracts are segmented based on customer requirements.
Inventories
Inventories, stated at the lower of cost (first-in, first-out or average) or market, include material, labor and manufacturing overhead costs.
Griffon’s businesses typically do not require inventory that is susceptible to becoming obsolete or dated. In general, Telephonics sells products in connection with programs authorized and approved under contracts awarded by the U.S. Government or agencies thereof, and in accordance with customer specifications. PPC primarily produces fabricated materials used by customers in the production of their products and these materials are produced against orders from those customers. HBP produces doors and long-handled tools and landscaping products in response to orders from customers of retailers and dealers or based on expected orders, as applicable.
Warranty Accruals
Direct customer and end-user warranties are provided on certain products. These warranties cover manufacturing defects that would prevent the product from performing in line with its intended and marketed use. The terms of such warranties vary by product line and generally provide for the repair or replacement of the defective product. Warranty claims data is collected and analyzed with a focus on the historical amount of claims, the products involved, the amount of time between the warranty claims and the products’ respective sales and the amount of current sales. Based on such analysis, warranty accruals are recorded as an increase to cost of sales and regularly reviewed for adequacy.
Stock-based Compensation
Griffon has issued stock-based compensation to certain employees, officers and directors in the form of restricted stock and restricted stock units.
Compensation expense for restricted stock and restricted stock units is recognized ratably over the required service period based on the fair value of the grant, calculated as the number of shares or units granted multiplied by the stock price on the date of grant, and for performance shares or units, the likelihood of achieving the performance criteria. The Company recognizes forfeitures as they occur.
48
Allowances for Discount, Doubtful Account and Returns
Trade receivables are recorded at their stated amount, less allowances for discounts, doubtful accounts and returns. The allowances represent estimated uncollectible receivables associated with potential customer defaults on contractual obligations (usually due to customers’ potential insolvency), discounts related to early payment of accounts receivables by customers and estimates for returns. The allowance for doubtful accounts includes amounts for certain customers in which a risk of default has been specifically identified, as well as an amount for customer defaults, based on a formula, when it is determined the risk of some default is probable and estimable, but cannot yet be associated with specific customers. Allowance for discounts and returns are recorded as a reduction of revenue and the provision related to the allowance for doubtful accounts is recorded in SG&A expenses.
Acquisitions
Acquired businesses are accounted for using the acquisition method of accounting which requires, among other things, that most assets acquired and liabilities assumed be recognized at their fair values as of the acquisition date and that the fair value of acquired in-process research and development be recorded on the balance sheet. Related transaction costs are expensed as incurred. Any excess of the purchase price over the assigned values of the net assets acquired is recorded as goodwill.
Goodwill, Long-Lived Intangible and Tangible Assets, and Impairment
Griffon has significant intangible and tangible long-lived assets on its balance sheet that includes goodwill and other intangible assets related to acquisitions. Goodwill represents the excess of the cost of net assets acquired in business combinations over the fair value of the identifiable tangible and intangible assets acquired and liabilities assumed in a business combination. As required under GAAP, goodwill and indefinite-lived intangibles are reviewed for impairment annually, for Griffon as of September 30, or more frequently whenever events or circumstances change that would more likely than not reduce the fair value of a reporting unit below its carrying amount, using discounted future cash flows for each reporting unit. The testing of goodwill and indefinite-lived intangibles for impairment involves significant use of judgment and assumptions in the determination of a reporting unit’s fair market value. Based upon the results of the annual impairment review, it was determined that the fair value of each reporting unit substantially exceeded the carrying value of the assets, and no impairment existed as of September 30, 2017.
Long-lived amortizable intangible assets, such as customer relationships and software, and tangible assets, primarily Property, plant and equipment, are amortized over their expected useful lives, which involve significant assumptions and estimates. Long-lived intangible and tangible assets are tested for impairment by comparing estimated future undiscounted cash flows to the carrying value of the asset when an impairment indicator, such as change in business, customer loss or obsolete technology, exists. With the sale of PPC, Griffon determined that there was no impairment of PPC's long-lived assets as of September 30, 2017.
Fair value estimates are based on assumptions believed to be reasonable at the time, but such assumptions are subject to inherent uncertainty. Actual results may differ materially from those estimates. Any changes in key assumptions or management judgment with respect to a reporting unit or its prospects, which may result from a decline in Griffon’s stock price, a change in market conditions, market trends, interest rates or other factors outside of Griffon’s control, or significant underperformance relative to historical or projected future operating results, could result in a significantly different estimate of the fair value of Griffon’s reporting units, which could result in an impairment charge in the future.
Restructuring Reserves
From time to time, Griffon will establish restructuring reserves at an operation. These reserves, for both termination and other exit costs, require the use of estimates. Though Griffon believes the estimates made are reasonable, they could differ materially from the actual costs.
Income Taxes
Griffon’s effective tax rate is based on income, statutory tax rates and tax planning opportunities available in the various jurisdictions in which Griffon operates. For interim financial reporting, the annual tax rate is estimated based on projected taxable income for the full year, and a quarterly income tax provision is recorded in accordance with the anticipated annual rate. As the year progresses, the annual tax rate is refined as new information becomes available, including year-to-date financial results. This process often results in changes to the effective tax rate throughout the year. Significant judgment is required in determining the effective tax rate and in evaluating tax positions.
Deferred tax assets and liabilities are recognized based on the differences between the financial statement carrying amounts and the tax basis of assets and liabilities. Deferred tax assets represent items to be used as a tax deduction or credit in future tax returns
49
for which a tax benefit has been recorded in the income statement. The Company assesses whether a valuation allowance should be established against its deferred tax assets based on consideration of all available evidence, both positive and negative, using a more likely than not standard. This assessment considers, among other matters, the nature, frequency and severity of recent losses; a forecast of future profitability; the duration of statutory carryback and carryforward periods; the Company's experience with tax attributes expiring unused; and tax planning alternatives. The likelihood that the deferred tax asset balance will be recovered from future taxable income is assessed at least quarterly, and the valuation allowance, if any, is adjusted accordingly.
Tax benefits are recognized for an uncertain tax position when, in management’s judgment, it is more likely than not that the position will be sustained upon examination by a taxing authority. For a tax position that meets the more-likely-than-not recognition threshold, the tax benefit is measured as the largest amount that is judged to have a greater than 50% likelihood of being realized upon ultimate settlement with a taxing authority. The liability associated with unrecognized tax benefits is adjusted periodically due to changing circumstances, such as the progress of tax audits, case law developments and new or emerging legislation. Such adjustments are recognized in the period in which they are identified. The effective tax rate includes the net impact of changes in the liability for unrecognized tax benefits and subsequent adjustments as considered appropriate by management. A number of years may elapse before a particular matter for which Griffon has recorded a liability related to an unrecognized tax benefit is audited and finally resolved. The number of years with open tax audits varies by jurisdiction. While it is often difficult to predict the final outcome or the timing of resolution of any particular tax matter, Griffon believes its liability for unrecognized tax benefits is adequate. Favorable resolution of an unrecognized tax benefit could be recognized as a reduction in Griffon’s tax provision and effective tax rate in the period of resolution. Unfavorable settlement of an unrecognized tax benefit could increase the tax provision and effective tax rate and may require the use of cash in the period of resolution. The liability for unrecognized tax benefits is generally presented as non-current. However, if it is anticipated that a cash settlement will occur within one year, that portion of the liability is presented as current. Interest and penalties recognized on the liability for unrecognized tax benefits is recorded as income tax expense.
Pension Benefits
Griffon sponsors defined and supplemental benefit pension plans for certain active and retired employees. Annual amounts relating to these plans are recorded based on actuarial projections, which include various actuarial assumptions, including discount rates, assumed rates of return, compensation increases and turnover rates. The actuarial assumptions used to determine pension liabilities, assets and expense are reviewed annually and modified based on current economic conditions and trends. The expected return on plan assets is determined based on the nature of the plans’ investments and expectations for long-term rates of return. The discount rate used to measure obligations is based on a corporate bond spot-rate yield curve that matches projected future benefit payments, with the appropriate spot rate applicable to the timing of the projected future benefit payments. Assumptions used in determining Griffon’s obligations under the defined benefit pension plans are believed to be reasonable, based on experience and advice from independent actuaries; however, differences in actual experience or changes in the assumptions may materially affect Griffon’s financial position or results of operations.
All of the defined benefit plans are frozen and have ceased accruing benefits.
Newly issued but not yet effective accounting pronouncements
In May 2017, the FASB issued guidance to address the situation when a company modifies the terms of a stock compensation award previously granted to an employee. This guidance is effective, and should be applied prospectively, for fiscal years beginning after December 15, 2017. Early adoption is permitted as of the beginning of an annual period. The new guidance is effective for the Company beginning in 2019. We are currently evaluating the impact of the guidance on the Company's financial condition, results of operations and related disclosures.
In March 2017, the FASB issued amendments to the Compensation - Retirement Benefits guidance which requires companies to retrospectively present the service cost component of net periodic benefit cost for pension and retiree medical plans along with other compensation costs in operating income and present the other components of net periodic benefit cost below operating income in the income statement. The guidance also allows only the service cost component of net periodic benefit cost to be eligible for capitalization within inventory or fixed assets on a prospective basis. This guidance is effective, and should be applied retroactively, for fiscal years beginning after December 15, 2017. Early adoption is permitted as of the beginning of an annual period. The new guidance is effective for the Company beginning in 2019. We are currently evaluating the impact of the guidance on the Company's financial condition, results of operations and related disclosures.
In January 2017, the FASB issued guidance that simplifies how an entity is required to test goodwill for impairment by eliminating Step 2 from the goodwill impairment test. Step 2 measures a goodwill impairment loss by comparing the implied fair value of a reporting unit's goodwill with the carrying amount of that goodwill. This guidance is effective for annual periods beginning after
50
December 15, 2019, including interim periods within those periods and will be effective for the Company beginning in 2020. Early adoption is permitted for interim or annual goodwill impairment tests performed on testing dates after January 1, 2017. We are currently evaluating the impact of the guidance on the Company's financial condition, results of operations and related disclosures.
In January 2017, the FASB issued guidance that clarifies the definition of a business, which will impact many areas of accounting including acquisitions, disposals, goodwill, and consolidation. The new standard is intended to help companies and other organizations evaluate whether transactions should be accounted for as acquisitions (or disposals) of assets or businesses. This guidance is effective for annual periods beginning after December 15, 2017, including interim periods within those periods and will be effective for the Company beginning in 2019. We are currently evaluating the impact of the guidance on the Company's financial condition, results of operations and related disclosures.
In August 2016, the Financial Accounting Standards Board ("FASB") issued guidance on the Statement of Cash Flows Classification of certain cash receipts and cash payments (a consensus of the FASB Emerging Issues Task Force). This guidance addresses the following eight specific cash flow issues: Debt prepayment or debt extinguishment costs; settlement of zero-coupon debt instruments or other debt instruments with coupon interest rates that are insignificant in relation to the effective interest rate of the borrowing; contingent consideration payments made after a business combination; proceeds from the settlement of insurance claims; proceeds from the settlement of corporate-owned life insurance policies (including bank-owned life insurance policies); distributions received from equity method investees; beneficial interests in securitization transactions; and separately identifiable cash flows and application of the predominance principle. This guidance will be effective for the Company beginning in fiscal 2019. We are currently evaluating the impact of the guidance on the Company's financial condition, results of operations and related disclosures.
In February 2016, the FASB issued guidance on lease accounting requiring lessees to recognize a right-of-use asset and a lease liability for long-term leases. The liability will be equal to the present value of lease payments. This guidance must be applied using a modified retrospective transition approach to all annual and interim periods presented and is effective for the company beginning in fiscal 2019. We are currently evaluating the impact of the guidance on the Company's financial condition, results of operations and related disclosures.
In May 2014, the FASB issued guidance on revenue from contracts with customers. The underlying principle is that an entity will recognize revenue to depict the transfer of goods or services to customers at an amount that the entity expects to be entitled to in exchange for those goods or services. The guidance provides a five-step analysis of transactions to determine when and how revenue is recognized. Other major provisions include capitalization of certain contract costs, consideration of time value of money in the transaction price, and allowing estimates of variable consideration to be recognized before contingencies are resolved, in certain circumstances. The guidance also requires enhanced disclosures regarding the nature, amount, timing and uncertainty of revenue and cash flows arising from an entity's contracts with customers. This guidance permits the use of either the retrospective or cumulative effect transition method and is effective for the Company beginning in 2019; early adoption is permitted beginning in 2018. We have not yet selected a transition method and are currently evaluating the impact of the guidance on the Company's financial condition, results of operations and related disclosures. The FASB has also issued the following additional guidance clarifying certain issues on revenue from contracts with customers; Revenue from Contracts with Customers: Narrow-Scope Improvements and Practical Expedients and Revenue from Contracts with Customers: Identifying Performance Obligations and Licensing. The Company is currently evaluating this guidance to determine the impact it will have on its consolidated financial statements.
Recently adopted accounting pronouncements
In March 2016, the FASB issued guidance on Stock Compensation: Improvements to Employee Share-Based Payment Accounting. The guidance changes how companies account for certain aspects of share-based payment awards to employees, including the accounting for income taxes, forfeitures, and statutory tax withholding requirements, as well as the classification of related matters in the statement of cash flows. The amendments are effective for annual periods, and interim reporting periods within those annual periods, beginning after December 15, 2016 using either prospective, retrospective or modified retrospective transition method, depending on the area covered in this update. The Company early adopted this guidance for fiscal 2016 in order to simplify the accounting for employee share-based payments.
Under this guidance all excess tax benefits (“windfalls”) and deficiencies (“shortfalls”) related to employee stock compensation was recognized within income tax expense for the year ended September 30, 2016. Under prior guidance, windfalls were recognized to Capital in excess of par value and shortfalls were only recognized to the extent they exceed the pool of windfall tax benefits. As a result of the adoption, a tax benefit of $2,193 was recognized within income tax expense reflecting the excess tax benefits for the year ended September 30, 2016. The adoption was on a prospective basis and therefore had no impact on prior years.
51
Additionally, income tax benefits at settlement of an award were previously reported as a reduction to operating cash flows and an increase to financing cash flows to the extent that those benefits exceeded the income tax benefits reported in earnings during the award's vesting period. Griffon has elected to apply that change in cash flow classification on a prospective basis, which has resulted in a $2,271 increase to net cash provided by operating activities and a corresponding decrease to net cash used in financing activities in the accompanying Consolidated Statement of Cash Flows for the year ended September 30, 2016, as compared to the amounts previously reported. The remaining provisions of this accounting standard did not have a material impact on the accompanying condensed consolidated financial statements.
In November 2015, the FASB issued guidance on simplifying the presentation of deferred income taxes, requiring deferred income tax liabilities and assets to be classified as non-current in the statement of financial position. The guidance is effective for annual and interim reporting periods within those annual periods beginning after December 15, 2016 and may be applied retrospectively or prospectively. The Company early adopted this guidance in fiscal 2016 in order to simplify balance sheet presentation and applied it retrospectively for all periods presented in the financial statements.
In August 2014, the FASB issued guidance on management's responsibility in evaluating whether there is substantial doubt about a company's ability to continue as a going concern and related footnote disclosures. Management is required to evaluate, at each reporting period, whether there are conditions or events that raise substantial doubt about a company's ability to continue as a going concern within one year from the date the financial statements are issued. This guidance was effective prospectively for annual and interim reporting periods beginning in 2017; implementation of this guidance did not have a material effect on the Company’s financial condition or results of operations.
The Company has implemented all new accounting pronouncements that are in effect and that may impact its financial statements.
Interest Rates
Griffon’s exposure to market risk for changes in interest rates relates primarily to variable interest rate debt and investments in cash and equivalents.
The revolving credit facility and certain other of Griffon’s credit facilities have a LIBOR- and EURIBOR- based variable interest rate. Due to the current and expected level of borrowings under these facilities, a 100 basis point change in LIBOR or EURIBOR would not have a material impact on Griffon’s results of operations or liquidity.
Foreign Exchange
Griffon conducts business in various non-U.S. countries, primarily in Germany, Canada, Brazil, Australia, and China; therefore, changes in the value of the currencies of these countries affect the financial position and cash flows when translated into U.S. Dollars. Griffon has generally accepted the exposure to exchange rate movements relative to its non-U.S. operations. Griffon may, from time to time, hedge its currency risk exposures. A change of 10% or less in the value of all applicable foreign currencies would not have a material effect on Griffon’s financial position and cash flows.
52
The financial statements of Griffon and its subsidiaries and the report thereon of Grant Thornton LLP are included herein:
|
▪
|
Report of Independent Registered Public Accounting Firm.
|
|
▪
|
Consolidated Balance Sheets at September 30, 2017 and 2016.
|
|
▪
|
Consolidated Statements of Operations and Comprehensive Income (Loss) for the years ended September 30, 2017, 2016 and 2015.
|
|
▪
|
Consolidated Statements of Cash Flows for the years ended September 30, 2017, 2016 and 2015.
|
|
▪
|
Consolidated Statements of Shareholders’ Equity for the years ended September 30, 2017, 2016 and 2015.
|
|
▪
|
Notes to Consolidated Financial Statements.
|
|
▪
|
Schedule II – Valuation and Qualifying Account.
|
53
REPORT OF INDEPENDENT REGISTERED PUBLIC ACCOUNTING FIRM
Board of Directors and Shareholders
Griffon Corporation
We have audited the accompanying consolidated balance sheets of Griffon Corporation (a Delaware corporation) and subsidiaries (the “Company”) as of
September 30, 2017
and
2016
, and the related consolidated statements of operations and comprehensive income(loss), shareholders’ equity, and cash flows for each of the three years in the period ended
September 30, 2017
. We also have audited the Company’s internal control over financial reporting as of
September 30, 2017
, based on criteria established in the 2013
Internal Control-Integrated Framework
issued by the Committee of Sponsoring Organizations of the Treadway Commission (COSO). Our audits of the basic consolidated financial statements included the financial statement schedule listed in the index appearing under Item 15(a)(2). The Company’s management is responsible for these financial statements, financial statement schedule, for maintaining effective internal control over financial reporting, and for its assessment of the effectiveness of internal control over financial reporting, included in the accompanying Management’s Report on Internal Control over Financial Reporting. Our responsibility is to express an opinion on these financial statements, financial statement schedule and an opinion on the Company’s internal control over financial reporting based on our audits.
We conducted our audits in accordance with the standards of the Public Company Accounting Oversight Board (United States). Those standards require that we plan and perform the audits to obtain reasonable assurance about whether the financial statements are free of material misstatement and whether effective internal control over financial reporting was maintained in all material respects. Our audits of the financial statements included examining, on a test basis, evidence supporting the amounts and disclosures in the financial statements, assessing the accounting principles used and significant estimates made by management, and evaluating the overall financial statement presentation. Our audit of internal control over financial reporting included obtaining an understanding of internal control over financial reporting, assessing the risk that a material weakness exists, and testing and evaluating the design and operating effectiveness of internal control based on the assessed risk. Our audits also included performing such other procedures as we considered necessary in the circumstances. We believe that our audits provide a reasonable basis for our opinions.
A company’s internal control over financial reporting is a process designed to provide reasonable assurance regarding the reliability of financial reporting and the preparation of financial statements for external purposes in accordance with generally accepted accounting principles. A company’s internal control over financial reporting includes those policies and procedures that (1) pertain to the maintenance of records that, in reasonable detail, accurately and fairly reflect the transactions and dispositions of the assets of the company; (2) provide reasonable assurance that transactions are recorded as necessary to permit preparation of financial statements in accordance with generally accepted accounting principles, and that receipts and expenditures of the company are being made only in accordance with authorizations of management and directors of the company; and (3) provide reasonable assurance regarding prevention or timely detection of unauthorized acquisition, use, or disposition of the company’s assets that could have a material effect on the financial statements.
Because of its inherent limitations, internal control over financial reporting may not prevent or detect misstatements. Also, projections of any evaluation of effectiveness to future periods are subject to the risk that controls may become inadequate because of changes in conditions, or that the degree of compliance with the policies or procedures may deteriorate.
In our opinion, the consolidated financial statements referred to above present fairly, in all material respects, the financial position of Griffon Corporation and subsidiaries as of September 30,
2017
and
2016
, and the results of their operations and their cash flows for each of the three years in the period ended
September 30, 2017
in conformity with accounting principles generally accepted in the United States of America. Also in our opinion, the related financial statement schedule, when considered in relation to the basic consolidated financial statements taken as a whole, present fairly, in all material respects, the information set forth therein. In addition, in our opinion, the Company maintained, in all material respects, effective internal control over financial reporting as of
September 30, 2017
, based on criteria established in the 2013
Internal Control-Integrated Framework
issued by COSO.
/s/ GRANT THORNTON LLP
New York, New York
November 20, 2017
54
GRIFFON CORPORATION AND SUBSIDIARIES
(in thousands, except per share data)
|
At September 30, 2017
|
At September 30, 2016
|
||||||
|
CURRENT ASSETS
|
|
|
|
|
|||
|
Cash and equivalents
|
$
|
47,681
|
|
$
|
72,553
|
|
|
|
Accounts receivable, net of allowances of $5,966 and $4,692
|
208,229
|
|
184,339
|
|
|||
|
Contract costs and recognized income not yet billed, net of progress payments of $4,407 and $8,001
|
131,662
|
|
126,961
|
|
|||
|
Inventories, net
|
299,437
|
|
261,317
|
|
|||
|
Prepaid and other current assets
|
40,067
|
|
23,429
|
|
|||
|
Assets of discontinued operations held for sale
|
370,724
|
|
112,139
|
|
|||
|
Assets of discontinued operations not held for sale
|
329
|
|
219
|
|
|||
|
Total Current Assets
|
1,098,129
|
|
780,957
|
|
|||
|
PROPERTY, PLANT AND EQUIPMENT, net
|
232,135
|
|
236,905
|
|
|||
|
GOODWILL
|
319,139
|
|
306,163
|
|
|||
|
INTANGIBLE ASSETS, net
|
205,127
|
|
197,949
|
|
|||
|
OTHER ASSETS
|
16,051
|
|
7,569
|
|
|||
|
ASSETS OF DISCONTINUED OPERATIONS HELD FOR SALE
|
—
|
|
|
250,585
|
|
||
|
ASSETS OF DISCONTINUED OPERATIONS NOT HELD FOR SALE
|
2,960
|
|
1,968
|
|
|||
|
Total Assets
|
$
|
1,873,541
|
|
$
|
1,782,096
|
|
|
|
CURRENT LIABILITIES
|
|
|
|
|
|||
|
Notes payable and current portion of long-term debt
|
$
|
11,078
|
|
$
|
13,932
|
|
|
|
Accounts payable
|
183,951
|
|
148,130
|
|
|||
|
Accrued liabilities
|
83,258
|
|
84,059
|
|
|||
|
Liabilities of discontinued operations held for sale
|
84,450
|
|
|
70,458
|
|
||
|
Liabilities of discontinued operations not held for sale
|
8,342
|
|
1,684
|
|
|||
|
Total Current Liabilities
|
371,079
|
|
318,263
|
|
|||
|
LONG-TERM DEBT, net
|
968,080
|
|
896,946
|
|
|||
|
OTHER LIABILITIES
|
132,537
|
|
123,163
|
|
|||
|
LIABILITIES OF DISCONTINUED OPERATIONS HELD FOR SALE
|
—
|
|
|
31,071
|
|
||
|
LIABILITIES OF DISCONTINUED OPERATIONS NOT HELD FOR SALE
|
3,037
|
|
1,706
|
|
|||
|
Total Liabilities
|
1,474,733
|
|
1,371,149
|
|
|||
|
COMMITMENTS AND CONTINGENCIES - See Note 13
|
|
|
|
|
|||
|
SHAREHOLDERS’ EQUITY
|
|
|
|
|
|||
|
Preferred stock, par value $0.25 per share, authorized 3,000 shares, no shares issued
|
—
|
|
—
|
|
|||
|
Common stock, par value $0.25 per share, authorized 85,000 shares, issued 80,663 shares and 79,966 shares
|
20,166
|
|
19,992
|
|
|||
|
Capital in excess of par value
|
487,077
|
|
529,980
|
|
|||
|
Retained earnings
|
480,347
|
|
475,760
|
|
|||
|
Treasury shares, at cost, 33,557 common shares and 34,797 common shares
|
(489,225
|
)
|
(501,866
|
)
|
|||
|
Accumulated other comprehensive loss
|
(60,481
|
)
|
(81,241
|
)
|
|||
|
Deferred compensation
|
(39,076
|
)
|
(31,678
|
)
|
|||
|
Total Shareholders’ Equity
|
398,808
|
|
410,947
|
|
|||
|
Total Liabilities and Shareholders’ Equity
|
$
|
1,873,541
|
|
$
|
1,782,096
|
|
|
The accompanying notes to consolidated financial statements are an integral part of these statements.
55
GRIFFON CORPORATION AND SUBSIDIARIES
COMPREHENSIVE INCOME (LOSS)
(in thousands, except per share data)
|
|
Years Ended September 30,
|
||||||||||
|
|
2017
|
|
2016
|
|
2015
|
||||||
|
Revenue
|
$
|
1,524,997
|
|
$
|
1,477,035
|
|
$
|
1,483,291
|
|
||
|
Cost of goods and services
|
1,116,881
|
|
1,076,342
|
|
1,090,944
|
|
|||||
|
Gross profit
|
408,116
|
|
400,693
|
|
392,347
|
|
|||||
|
Selling, general and administrative expenses
|
339,089
|
|
318,353
|
|
325,435
|
|
|||||
|
Income from continuing operations
|
69,027
|
|
82,340
|
|
66,912
|
|
|||||
|
Other income (expense)
|
|
|
|
|
|
|
|||||
|
Interest expense
|
(51,513
|
)
|
(49,943
|
)
|
(47,776
|
)
|
|||||
|
Interest income
|
64
|
|
66
|
|
261
|
|
|||||
|
Other, net
|
(880
|
)
|
(250
|
)
|
(331
|
)
|
|||||
|
Total other income (expense)
|
(52,329
|
)
|
(50,127
|
)
|
(47,846
|
)
|
|||||
|
Income before taxes from continuing operations
|
16,698
|
|
32,213
|
|
19,066
|
|
|||||
|
Provision (benefit) for income taxes
|
(1,085
|
)
|
12,432
|
|
6,772
|
|
|||||
|
Income from continuing operations
|
$
|
17,783
|
|
$
|
19,781
|
|
$
|
12,294
|
|
||
|
Discontinued operations:
|
|
|
|
|
|
|
|||||
|
Income from operations of discontinued businesses
|
22,276
|
|
20,952
|
|
34,570
|
|
|||||
|
Provision from income taxes
|
25,147
|
|
10,723
|
|
12,575
|
|
|||||
|
Income (loss) from discontinued operations
|
(2,871
|
)
|
10,229
|
|
21,995
|
|
|||||
|
Net income
|
$
|
14,912
|
|
$
|
30,010
|
|
$
|
34,289
|
|
||
|
Income from continuing operations
|
$
|
0.43
|
|
$
|
0.48
|
|
$
|
0.28
|
|
||
|
Income from discontinued operations
|
(0.07
|
)
|
0.25
|
|
0.49
|
|
|||||
|
Basic earnings per common share
|
$
|
0.36
|
|
$
|
0.73
|
|
$
|
0.77
|
|
||
|
Weighted-average shares outstanding
|
41,005
|
|
41,074
|
|
44,608
|
|
|||||
|
Income from continuing operations
|
$
|
0.41
|
|
$
|
0.45
|
|
$
|
0.26
|
|
||
|
Income from discontinued operations
|
(0.07
|
)
|
0.23
|
|
0.47
|
|
|||||
|
Diluted earnings per common share
|
$
|
0.35
|
|
$
|
0.68
|
|
$
|
0.73
|
|
||
|
Weighted-average shares outstanding
|
43,011
|
|
44,109
|
|
46,939
|
|
|||||
|
Net income
|
$
|
14,912
|
|
$
|
30,010
|
|
$
|
34,289
|
|
||
|
Other comprehensive income (loss), net of taxes:
|
|
|
|
|
|
|
|||||
|
Foreign currency translation adjustments
|
10,667
|
|
17,284
|
|
(56,358
|
)
|
|||||
|
Pension and other post-retirement plans
|
9,203
|
|
(5,651
|
)
|
(4,326
|
)
|
|||||
|
Change in available-for-sale securities
|
—
|
|
—
|
|
(870
|
)
|
|||||
|
Gain (loss) on cash flow hedge
|
890
|
|
(1,686
|
)
|
430
|
|
|||||
|
Total other comprehensive income (loss), net of taxes
|
20,760
|
|
9,947
|
|
(61,124
|
)
|
|||||
|
Comprehensive income (loss), net
|
$
|
35,672
|
|
$
|
39,957
|
|
$
|
(26,835
|
)
|
||
The accompanying notes to consolidated financial statements are an integral part of these statements.
56
GRIFFON CORPORATION AND SUBSIDIARIES
(in thousands)
|
|
Years Ended September 30,
|
||||||||||
|
|
2017
|
2016
|
2015
|
||||||||
|
CASH FLOWS FROM OPERATING ACTIVITIES - CONTINUING OPERATIONS:
|
|
|
|
|
|
|
|||||
|
Net income
|
$
|
14,912
|
|
$
|
30,010
|
|
$
|
34,289
|
|
||
|
Net (income) loss from discontinued operations
|
2,871
|
|
|
(10,229
|
)
|
|
(21,995
|
)
|
|||
|
Adjustments to reconcile net income to net cash provided by operating activities of continuing operations:
|
|
|
|
|
|
|
|||||
|
Depreciation and amortization
|
47,878
|
|
46,342
|
|
45,834
|
|
|||||
|
Stock-based compensation
|
8,090
|
|
10,136
|
|
11,110
|
|
|||||
|
Provision for losses on accounts receivable
|
271
|
|
351
|
|
60
|
|
|||||
|
Amortization of deferred financing costs and debt discounts
|
4,511
|
|
7,321
|
|
6,982
|
|
|||||
|
Deferred income tax
|
2,341
|
|
6,044
|
|
3,674
|
|
|||||
|
Gain on sale/disposal of assets and investments
|
(126
|
)
|
(319
|
)
|
(338
|
)
|
|||||
|
Change in assets and liabilities, net of assets and liabilities acquired:
|
|
|
|
|
|
|
|||||
|
(Increase) decrease in accounts receivable and contract costs and recognized income not yet billed
|
(19,131
|
)
|
(35,933
|
)
|
22,375
|
|
|||||
|
(Increase) decrease in inventories
|
(29,299
|
)
|
16,103
|
|
(41,604
|
)
|
|||||
|
(Increase) decrease in prepaid and other assets
|
(4,781
|
)
|
1,462
|
|
(2,019
|
)
|
|||||
|
Increase (decrease) in accounts payable, accrued liabilities and income taxes payable
|
17,541
|
|
4,829
|
|
(27,071
|
)
|
|||||
|
Other changes, net
|
4,073
|
|
4,001
|
|
559
|
|
|||||
|
Net cash provided by operating activities - continuing operations
|
49,151
|
|
80,118
|
|
31,856
|
|
|||||
|
CASH FLOWS FROM INVESTING ACTIVITIES - CONTINUING OPERATIONS:
|
|
|
|
|
|
|
|||||
|
Acquisition of property, plant and equipment
|
(34,937
|
)
|
(59,276
|
)
|
(46,308
|
)
|
|||||
|
Acquired business, net of cash acquired
|
(34,719
|
)
|
(4,470
|
)
|
(2,225
|
)
|
|||||
|
Investment sales (purchases)
|
(1,824
|
)
|
715
|
|
8,891
|
|
|||||
|
Proceeds from sale of property, plant and equipment
|
143
|
|
770
|
|
203
|
|
|||||
|
Net cash used in investing activities - continuing operations
|
(71,337
|
)
|
(62,261
|
)
|
(39,439
|
)
|
|||||
|
CASH FLOWS FROM FINANCING ACTIVITIES - CONTINUING OPERATIONS:
|
|
|
|
|
|
|
|||||
|
Proceeds from issuance of common stock
|
—
|
|
—
|
|
371
|
|
|||||
|
Dividends paid
|
(10,325
|
)
|
(8,798
|
)
|
(7,654
|
)
|
|||||
|
Purchase of shares for treasury
|
(15,841
|
)
|
(65,307
|
)
|
(82,343
|
)
|
|||||
|
Proceeds from long-term debt
|
233,443
|
|
302,362
|
|
203,216
|
|
|||||
|
Payments of long-term debt
|
(170,454
|
)
|
(208,514
|
)
|
(187,735
|
)
|
|||||
|
Share premium payment on settled debt
|
(24,997
|
)
|
—
|
|
—
|
|
|||||
|
Financing costs
|
(1,548
|
)
|
(4,384
|
)
|
(888
|
)
|
|||||
|
Purchase of ESOP shares
|
(10,908
|
)
|
—
|
|
—
|
|
|||||
|
Tax effect from exercise/vesting of equity awards, net
|
—
|
|
—
|
|
345
|
|
|||||
|
Other, net
|
(70
|
)
|
55
|
|
347
|
|
|||||
|
Net cash provided by (used) in financing activities - continuing operations
|
(700
|
)
|
15,414
|
|
(74,341
|
)
|
|||||
|
CASH FLOWS FROM DISCONTINUED OPERATIONS:
|
|
|
|
|
|
|
|||||
|
Net cash provided by operating activities
|
47,193
|
|
24,264
|
|
43,362
|
|
|||||
|
Net cash used in investing activities
|
(45,075
|
)
|
|
(31,343
|
)
|
|
(27,180
|
)
|
|||
57
GRIFFON CORPORATION AND SUBSIDIARIES
CONSOLIDATED STATEMENTS OF CASH FLOWS
(in thousands)
|
Net cash provided by (used in) financing activities
|
(4,268
|
)
|
|
(6,526
|
)
|
|
29,490
|
|
|||
|
Net cash provided by (used in) discontinued operations
|
(2,150
|
)
|
(13,605
|
)
|
45,672
|
|
|||||
|
Effect of exchange rate changes on cash and equivalents
|
164
|
|
886
|
|
(4,152
|
)
|
|||||
|
NET INCREASE (DECREASE) IN CASH AND EQUIVALENTS
|
(24,872
|
)
|
20,552
|
|
(40,404
|
)
|
|||||
|
CASH AND EQUIVALENTS AT BEGINNING OF PERIOD
|
72,553
|
|
52,001
|
|
92,405
|
|
|||||
|
CASH AND EQUIVALENTS AT END OF PERIOD
|
$
|
47,681
|
|
$
|
72,553
|
|
$
|
52,001
|
|
||
|
Supplemental Disclosure of Cash Flow Information:
|
|
|
|
|
|
|
|||||
|
Cash paid for interest
|
$
|
48,137
|
|
$
|
43,208
|
|
$
|
41,269
|
|
||
|
Cash paid for taxes
|
20,998
|
|
3,431
|
|
16,446
|
|
|||||
The accompanying notes to consolidated financial statements are an integral part of these statements.
58
GRIFFON CORPORATION AND SUBSIDIARIES
CONSOLIDATED STATEMENTS OF SHAREHOLDERS' EQUITY
(in thousands)
|
|
COMMON STOCK
|
CAPITAL IN
EXCESS OF
PAR VALUE
|
RETAINED
EARNINGS
|
TREASURY SHARES
|
ACCUMULATED OTHER
COMPREHENSIVE
INCOME (LOSS)
|
DEFERRED
COMPENSATION
|
Total
|
||||||||||||||||||||||||||
|
(in thousands)
|
SHARES
|
PAR VALUE
|
SHARES
|
COST
|
|||||||||||||||||||||||||||||
|
Balance at 9/30/2014
|
78,484
|
|
$
|
19,621
|
|
$
|
506,090
|
|
$
|
427,913
|
|
25,335
|
|
$
|
(354,216
|
)
|
$
|
(30,064
|
)
|
$
|
(37,317
|
)
|
$
|
532,027
|
|
||||||||
|
Net income
|
—
|
|
|
—
|
|
|
—
|
|
|
34,289
|
|
|
—
|
|
|
—
|
|
|
—
|
|
|
—
|
|
|
34,289
|
|
|||||||
|
Dividends
|
—
|
|
|
—
|
|
|
—
|
|
|
(7,654
|
)
|
|
—
|
|
|
—
|
|
|
—
|
|
|
—
|
|
|
(7,654
|
)
|
|||||||
|
Tax effect from exercise/vesting of equity awards, net
|
—
|
|
|
—
|
|
|
345
|
|
|
—
|
|
|
—
|
|
|
—
|
|
|
—
|
|
|
—
|
|
|
345
|
|
|||||||
|
Amortization of deferred compensation
|
—
|
|
|
—
|
|
|
—
|
|
|
—
|
|
|
—
|
|
|
—
|
|
|
—
|
|
|
2,786
|
|
|
2,786
|
|
|||||||
|
Common stock issued
|
69
|
|
|
17
|
|
|
354
|
|
|
—
|
|
|
—
|
|
|
—
|
|
|
—
|
|
|
—
|
|
|
371
|
|
|||||||
|
Common stock acquired
|
—
|
|
|
—
|
|
|
—
|
|
|
—
|
|
|
5,402
|
|
|
(82,343
|
)
|
|
—
|
|
|
—
|
|
|
(82,343
|
)
|
|||||||
|
Equity awards granted, net
|
527
|
|
|
132
|
|
|
(384
|
)
|
|
—
|
|
|
—
|
|
|
—
|
|
|
—
|
|
|
—
|
|
|
(252
|
)
|
|||||||
|
ESOP purchase of common stock
|
—
|
|
|
—
|
|
|
—
|
|
|
|
|
|
|
|
|
|
|
|
|
|
|
|
|
|
—
|
|
|||||||
|
ESOP allocation of common stock
|
—
|
|
|
—
|
|
|
970
|
|
|
—
|
|
|
—
|
|
|
—
|
|
|
—
|
|
|
—
|
|
|
970
|
|
|||||||
|
Stock-based compensation
|
—
|
|
|
—
|
|
|
11,110
|
|
|
—
|
|
|
—
|
|
|
—
|
|
|
—
|
|
|
—
|
|
|
11,110
|
|
|||||||
|
Other comprehensive loss, net of tax
|
—
|
|
|
—
|
|
|
—
|
|
|
—
|
|
|
—
|
|
|
—
|
|
|
(61,124
|
)
|
|
—
|
|
|
(61,124
|
)
|
|||||||
|
Balance at 9/30/2015
|
79,080
|
|
|
$
|
19,770
|
|
|
$
|
518,485
|
|
|
$
|
454,548
|
|
|
30,737
|
|
|
$
|
(436,559
|
)
|
|
$
|
(91,188
|
)
|
|
$
|
(34,531
|
)
|
|
$
|
430,525
|
|
|
Net income
|
—
|
|
—
|
|
—
|
|
$
|
30,010
|
|
—
|
|
—
|
|
—
|
|
—
|
|
30,010
|
|
||||||||||||||
|
Dividends
|
—
|
|
—
|
|
—
|
|
(8,798
|
)
|
—
|
|
—
|
|
—
|
|
—
|
|
(8,798
|
)
|
|||||||||||||||
|
Amortization of deferred compensation
|
—
|
|
—
|
|
—
|
|
—
|
|
—
|
|
—
|
|
—
|
|
2,853
|
|
2,853
|
|
|||||||||||||||
|
Common stock issued
|
41
|
|
10
|
|
(10
|
)
|
—
|
|
—
|
|
—
|
|
—
|
|
—
|
|
—
|
|
|||||||||||||||
|
Common stock acquired
|
—
|
|
—
|
|
—
|
|
—
|
|
4,060
|
|
(65,307
|
)
|
—
|
|
—
|
|
(65,307
|
)
|
|||||||||||||||
|
Equity awards granted, net
|
845
|
|
212
|
|
52
|
|
—
|
|
—
|
|
—
|
|
—
|
|
—
|
|
264
|
|
|||||||||||||||
|
ESOP allocation of common stock
|
—
|
|
—
|
|
1,317
|
|
—
|
|
—
|
|
—
|
|
—
|
|
—
|
|
1,317
|
|
|||||||||||||||
|
Stock-based compensation
|
—
|
|
—
|
|
10,136
|
|
—
|
|
—
|
|
—
|
|
—
|
|
—
|
|
10,136
|
|
|||||||||||||||
|
Other comprehensive income, net of tax
|
—
|
|
—
|
|
—
|
|
—
|
|
—
|
|
—
|
|
9,947
|
|
—
|
|
9,947
|
|
|||||||||||||||
|
Balance at 9/30/2016
|
79,966
|
|
$
|
19,992
|
|
$
|
529,980
|
|
$
|
475,760
|
|
34,797
|
|
$
|
(501,866
|
)
|
$
|
(81,241
|
)
|
$
|
(31,678
|
)
|
$
|
410,947
|
|
||||||||
|
Net income
|
—
|
|
—
|
|
—
|
|
14,912
|
|
—
|
|
—
|
|
—
|
|
—
|
|
14,912
|
|
|||||||||||||||
|
Dividends
|
—
|
|
—
|
|
—
|
|
(10,325
|
)
|
—
|
|
—
|
|
—
|
|
—
|
|
(10,325
|
)
|
|||||||||||||||
|
Tax effect from exercise/vesting of equity awards, net
|
—
|
|
—
|
|
(97
|
)
|
—
|
|
586
|
|
(13,641
|
)
|
—
|
|
—
|
|
(13,738
|
)
|
|||||||||||||||
|
Amortization of deferred compensation
|
—
|
|
—
|
|
—
|
|
—
|
|
—
|
|
—
|
|
—
|
|
3,510
|
|
3,510
|
|
|||||||||||||||
|
Common stock issued
|
3
|
|
—
|
|
22
|
|
—
|
|
—
|
|
—
|
|
—
|
|
—
|
|
22
|
|
|||||||||||||||
|
Common stock acquired
|
—
|
|
—
|
|
—
|
|
—
|
|
129
|
|
(2,201
|
)
|
—
|
|
—
|
|
(2,201
|
)
|
|||||||||||||||
|
Equity awards granted, net
|
694
|
|
174
|
|
(174
|
)
|
—
|
|
—
|
|
—
|
|
—
|
|
—
|
|
—
|
|
|||||||||||||||
|
Premium on settlement of convertible debt
|
—
|
|
—
|
|
(73,855
|
)
|
—
|
|
—
|
|
—
|
|
—
|
|
—
|
|
(73,855
|
)
|
|||||||||||||||
|
Issuance of treasury stock in settlement of convertible debt
|
—
|
|
—
|
|
20,375
|
|
—
|
|
(1,955
|
)
|
28,483
|
|
—
|
|
—
|
|
48,858
|
|
|||||||||||||||
|
ESOP purchase of common stock
|
—
|
|
—
|
|
—
|
|
—
|
|
—
|
|
—
|
|
—
|
|
(10,908
|
)
|
(10,908
|
)
|
|||||||||||||||
59
GRIFFON CORPORATION AND SUBSIDIARIES
CONSOLIDATED STATEMENTS OF SHAREHOLDERS' EQUITY
(in thousands)
|
ESOP allocation of common stock
|
—
|
|
—
|
|
2,736
|
|
—
|
|
—
|
|
—
|
|
—
|
|
—
|
|
2,736
|
|
|||||||||||||||
|
Stock-based compensation
|
—
|
|
—
|
|
8,090
|
|
—
|
|
—
|
|
—
|
|
—
|
|
—
|
|
8,090
|
|
|||||||||||||||
|
Other comprehensive income, net of tax
|
—
|
|
—
|
|
—
|
|
—
|
|
—
|
|
—
|
|
20,760
|
|
—
|
|
20,760
|
|
|||||||||||||||
|
Balance at 9/30/2017
|
80,663
|
|
$
|
20,166
|
|
$
|
487,077
|
|
$
|
480,347
|
|
33,557
|
|
$
|
(489,225
|
)
|
$
|
(60,481
|
)
|
$
|
(39,076
|
)
|
$
|
398,808
|
|
||||||||
The accompanying notes to consolidated financial statements are an integral part of these statements.
60
GRIFFON CORPORATION
NOTES TO CONSOLIDATED FINANCIAL STATEMENTS
(US dollars and non US currencies in thousands, except per share data)
(Unless otherwise indicated, all references to years or year-end refer to Griffon’s fiscal period ending
September 30,
)
Description of business
Griffon Corporation (the “Company” or “Griffon”) is a diversified management and holding company that conducts business through wholly-owned subsidiaries. Griffon oversees the operations of its subsidiaries, allocates resources among them and manages their capital structures. Griffon provides direction and assistance to its subsidiaries in connection with acquisition and growth opportunities as well as in connection with divestitures. In order to further diversify, Griffon also seeks out, evaluates and, when appropriate, will acquire additional businesses that offer potentially attractive returns on capital.
Headquartered in New York, N.Y., the Company was founded in 1959 and is incorporated in Delaware. Griffon is listed on the New York Stock Exchange and trades under the symbol GFF.
On September 5, 2017, Griffon announced it will explore strategic alternatives for Clopay Plastic Products Company, Inc. ("PPC") and on November 16, 2017, announced it entered into a definitive agreement to sell PPC to Berry Global Group, Inc. (NYSE:BERY) ("Berry") for
$475 million
in cash. The transaction is subject to regulatory approval and customary closing conditions, and is expected to close in the first quarter of calendar 2018. As a result, Griffon classified the results of operations of the PPC business as discontinued operations in the Consolidated Statements of Operations for all periods presented and classified the related assets and liabilities associated with the discontinued operations as held for sale in the consolidated balance sheets. All results and information presented exclude PPC unless otherwise noted. PPC is a global leader in the development and production of embossed, laminated and printed specialty plastic films for hygienic, health-care and industrial products and sells to some of the world's largest consumer products companies. See Note 6, Discontinued Operations.
On October 2, 2017, Griffon acquired ClosetMaid LLC ("ClosetMaid"). ClosetMaid, founded in 1965, is a leading North American manufacturer and marketer of closet organization, home storage, and garage storage products, and sells to some of the largest home center retail chains, mass merchandisers, and direct-to-builder professional installers in North America. Due to the acquisition of ClosetMaid occurring subsequent to Griffon's fiscal year end, ClosetMaid's results of operations, assets and liabilities were not included in Griffon's 2017 financial results or 2017 year-end balance sheet. See Note 2, Acquisitions.
Griffon currently conducts its continuing operations through
two
reportable segments:
|
•
|
Home & Building Products (“HBP”) consists of
three
companies, The AMES Companies, Inc. (“AMES”) and Clopay Building Products (“CBP”):
|
|
◦
|
AMES is the leading U.S. manufacturer and a global provider of long-handled tools and landscaping products for homeowners and professionals.
|
|
◦
|
CBP is a leading manufacturer and marketer of residential and commercial garage doors and sells to professional dealers and some of the largest home center retail chains in North America.
|
|
◦
|
ClosetMaid LLC ("ClosetMaid"), founded in 1965, is a leading North American manufacturer and marketer of closet organization, home storage, and garage storage products, and sells to some of the largest home center retail chains, mass merchandisers, and direct-to-builder professional installers.
|
|
•
|
Telephonics Corporation ("Telephonics") is recognized globally as a leading provider of highly sophisticated intelligence, surveillance and communications solutions for defense, aerospace and commercial customers.
|
Consolidation
The consolidated financial statements include the accounts of Griffon and all subsidiaries. Intercompany accounts and transactions have been eliminated in consolidation. The results of operations of acquired businesses are included from the dates of acquisitions.
61
GRIFFON CORPORATION
NOTES TO CONSOLIDATED FINANCIAL STATEMENTS – (Continued)
(US dollars and non US currencies in thousands, except per share data)
Earnings per share
Due to rounding, the sum of earnings per share may not equal earnings per share of Net income.
Discontinued operations
Installation Services
In 2008, as a result of the downturn in the residential housing market, Griffon exited substantially all operating activities of its Installation Services segment which sold, installed and serviced garage doors and openers, fireplaces, floor coverings, cabinetry and a range of related building products, primarily for the new residential housing market. Operating results of substantially all of this segment have been reported as discontinued operations in the Consolidated Statements of Operations and Comprehensive Income (Loss) for all periods presented; Installation Services is excluded from segment reporting.
During the year ended September 30, 2017, Griffon recorded
$5,700
of reserves in discontinued operations related to historical environmental remediation efforts and to increase the reserve for homeowner association claims related to the Clopay Services Corporation discontinued operations in 2008.
Clopay Plastic Products Company, Inc. ("PPC")
On September 5, 2017, Griffon announced it will explore strategic alternatives for PPC and on November 16, 2017, announced it entered into a definitive agreement to sell PPC to Berry for
$475 million
in cash. The transaction is subject to regulatory approval and customary closing conditions, and is expected to close in the first quarter of calendar 2018. As a result, Griffon classified the results of operations of the PPC business as discontinued operations in the Consolidated Statements of Operations for all periods presented and classified the related assets and liabilities associated with the discontinued operations as held for sale in the consolidated balance sheets. All results and information presented exclude PPC unless otherwise noted. See Note 6, Discontinued Operations to the Notes of the Financial Statements.
At
September 30, 2017
, Griffon’s assets and liabilities for discontinued operations not held for sale related to its installation business primarily related to insurance claims, income taxes and product liability, warranty and environmental reserves and assets and liabilities for discontinued operations held for sale related to its PPC business.
Reclassifications
Certain amounts in prior years have been reclassified to conform to the current year presentation.
Use of estimates
The preparation of financial statements in conformity with accounting principles generally accepted in the United States requires management to make estimates and assumptions that affect the reported amounts of assets and liabilities, disclosure of contingent assets and liabilities at the date of the financial statements, and the reported amounts of revenue and expenses during the reporting periods. These estimates may be adjusted due to changes in economic, industry or customer financial conditions, as well as changes in technology or demand. Significant estimates include allowances for doubtful accounts receivable and returns, net realizable value of inventories, restructuring reserves, valuation of goodwill and intangible assets, percentage of completion method of accounting, pension assumptions, useful lives associated with depreciation and amortization of intangible and fixed assets, warranty reserves, sales incentive accruals, stock based compensation assumptions, income taxes and tax valuation reserves, environmental reserves, legal reserves, insurance reserves, the valuation of assets and liabilities of discontinued operations, acquisition assumptions used and the accompanying disclosures. These estimates are based on management’s best knowledge of current events and actions Griffon may undertake in the future. Actual results may ultimately differ from these estimates.
62
GRIFFON CORPORATION
NOTES TO CONSOLIDATED FINANCIAL STATEMENTS – (Continued)
(US dollars and non US currencies in thousands, except per share data)
Cash and equivalents
Griffon considers all highly liquid investments purchased with an initial maturity of
three months
or less to be cash equivalents. Cash equivalents primarily consist of overnight commercial paper, highly-rated liquid money market funds backed by U.S. Treasury securities and U.S. Agency securities, as well as insured bank deposits. Griffon had cash in non-U.S. bank accounts of approximately
$26,500
and
$24,000
at
September 30, 2017
and
2016
, respectively. Substantially all U.S. cash and equivalents are in excess of FDIC insured limits. Griffon regularly evaluates the financial stability of all institutions and funds that hold its cash and equivalents.
Fair value of financial instruments
The carrying values of cash and cash equivalents, accounts receivable, accounts and notes payable and revolving credit debt approximate fair value due to either the short-term nature of such instruments or the fact that the interest rate of the revolving credit debt is based upon current market rates.
The fair value hierarchy, as outlined in the applicable accounting guidance, establishes a fair value hierarchy that requires the Company to maximize the use of observable inputs and minimize the use of unobservable inputs when measuring fair value. A financial instrument’s categorization within the hierarchy is based on the lowest level of input that is significant to the fair value measurement. The accounting guidance establishes three levels of inputs that may be used to measure fair value, as follows:
|
•
|
Level 1 inputs are measured and recorded at fair value based upon quoted prices in active markets for identical assets.
|
|
•
|
Level 2 inputs include inputs other than Level 1 that are observable, either directly or indirectly, such as quoted prices in active markets for similar assets and liabilities, quoted prices for identical or similar assets or liabilities in markets that are not active, or other inputs that are observable or can be corroborated by observable market data for substantially the full term of assets or liabilities.
|
|
•
|
Level 3 inputs are unobservable inputs in which little or no market data exists, therefore requiring an entity to develop its own assumptions.
|
The fair value of Griffon’s 2022 senior notes approximated
$725,000
, on
September 30, 2017
. Fair values were based upon quoted market prices (level 1 inputs).
Insurance contracts with a value of
$3,083
at
September 30, 2017
are measured and recorded at fair value based upon quoted prices in active markets for similar assets (level 2 inputs) and are included in Other current assets on the consolidated balance sheet.
Items Measured at Fair Value on a Recurring Basis
At
September 30, 2017
and 2016, trading securities, measured at fair value based on quoted prices in active markets for similar assets (level 2 inputs), with a fair value of
$3,352
(
$1,000
cost basis) and
$1,314
(
$1,000
cost basis) were included in Prepaid and other current assets on the Consolidated Balance Sheets. During the year ended September 30, 2016, the Company settled trading securities with proceeds totaling
$715
and recognized a loss of
$13
in Other income (expense). During the year ended September 30, 2015, the Company settled all outstanding available-for-sale securities with proceeds totaling
$8,891
and recognized a gain of
$489
in Other income, and accordingly, a gain of
$870
, net of tax, on available-for-sale securities was reclassified out of Accumulated other comprehensive income (loss) ("AOCI"). Realized and unrealized gains and losses on trading securities and realized gains and losses on available-for-sale securities are included in Other income in the Consolidated Statements of Operations and Comprehensive Income (Loss).
In the normal course of business, Griffon’s operations are exposed to the effect of changes in foreign currency exchange rates. To manage these risks, Griffon may enter into various derivative contracts such as foreign currency exchange contracts, including forwards and options. During 2017 and 2016, Griffon entered into several such contracts in order to lock into a foreign currency rate for planned settlements of trade and inter-company liabilities payable in USD.
At September 30, 2017 and 2016, Griffon had
$14,500
and
$25,500
of Australian dollar contracts at a weighted average rate of
$1.28
and
$1.30
, respectively, which qualified for hedge accounting. These hedges were all deemed effective as cash flow hedges with gains and losses related to changes in fair value deferred and recorded in Other comprehensive income (loss) and Prepaid
63
GRIFFON CORPORATION
NOTES TO CONSOLIDATED FINANCIAL STATEMENTS – (Continued)
(US dollars and non US currencies in thousands, except per share data)
and other current assets, or Accrued liabilities, until settlement. Upon settlement, gains and losses were recognized in the Consolidated Statements of Operations and Comprehensive Income (Loss) in Cost of goods and services. AOCI included deferred losses of
$175
(
$114
, net of tax) and deferred gains of
$1,545
(
$1,004
, net of tax) at
September 30, 2017
and 2016, respectively. Upon settlement, losses of
$(1,458)
and
$(752)
were recognized in the Consolidated Statements of Operations and Comprehensive Income (Loss) in Cost of goods and services ("COGS") during the years ended
September 30, 2017
and September 30, 2016, respectively. All contracts expire in
13
to
269 days
.
At
September 30, 2017
and 2016, Griffon had
$4,690
and
$4,855
, respectively, of Canadian dollar contracts at a weighted average rate of
$1.25
and
$1.31
. These contracts, which protect Canadian operations from currency fluctuations for U.S. dollar based purchases, do not qualify for hedge accounting and fair value losses of
$378
and
$157
were recorded in Other assets and to Other income for the outstanding contracts, based on similar contract values (level 2 inputs), for the years ended
September 30, 2017
and 2016, respectively. Realized gains of
$200
and
$136
, were recorded in Other income during the years ended
September 30, 2017
and September 30, 2016, respectively. All contracts expire in
30
to
358
days
.
Pension plan assets with a fair value of
$150,822
at
September 30, 2017
, are measured and recorded at fair value based upon quoted prices in active markets for identical assets (level 1 inputs) and quoted market prices for similar assets (level 2 inputs).
Non-U.S. currency translation
Assets and liabilities of non-U.S. subsidiaries, where the functional currency is not the U.S. dollar, have been translated at year-end exchange rates and profit and loss accounts have been translated using weighted average exchange rates. Adjustments resulting from currency translation have been recorded in the equity section of the balance sheet in AOCI as cumulative translation adjustments. Cumulative translation adjustments were gains (losses) of
$32,227
and
$42,894
at
September 30, 2017
and
2016
, respectively. Assets and liabilities of an entity that are denominated in currencies other than that entity’s functional currency are remeasured into the functional currency using period end exchange rates, or historical rates where applicable to certain balances. Gains and losses arising on remeasurements are recorded within the Consolidated Statement of Operations and Comprehensive Income (Loss) as a component of Other income (expense).
Revenue recognition
Revenue is recognized when the following circumstances are satisfied: a) persuasive evidence of an arrangement exists, b) delivery has occurred, title has transferred or services are rendered, c) price is fixed and determinable and d) collectability is reasonably assured. Goods are sold on terms that transfer title and risk of loss at a specified location. Revenue recognition from product sales occurs when all factors are met, including transfer of title and risk of loss, which occurs either upon shipment or upon receipt by customers at the location specified in the terms of sale. Other than standard product warranty provisions, sales arrangements provide for no other significant post-shipment obligations. From time to time and for certain customers, rebates and other sales incentives, promotional allowances or discounts are offered, typically related to customer purchase volumes, all of which are fixed or determinable and are classified as a reduction of revenue and recorded at the time of sale. Griffon provides for sales returns allowances based upon historical returns experience.
Telephonics earns a substantial portion of its revenue as either a prime or subcontractor from contract awards with the U.S. Government, as well as non-U.S. governments and other commercial customers. These formal contracts are typically long-term in nature, usually greater than
one year
. Revenue and profits from these long-term fixed price contracts are recognized under the percentage-of-completion method of accounting. Revenue and profits on fixed-price contracts that contain engineering as well as production requirements are recorded based on the ratio of total actual incurred costs to date to the total estimated costs for each contract (cost-to-cost method). Using the cost-to-cost method, revenue is recorded at amounts equal to the ratio of actual cumulative costs incurred divided by total estimated costs at completion, multiplied by the total estimated contract revenue, less the cumulative revenue recognized in prior periods. The profit recorded on a contract using this method is equal to the current estimated total profit margin multiplied by the cumulative revenue recognized, less the amount of cumulative profit previously recorded for the contract in prior periods. As this method relies on the substantial use of estimates, these projections may be revised throughout the life of a contract. Components of this formula and ratio that may be estimated include gross profit margin and total costs at completion. The cost performance and estimates to complete on long-term contracts are reviewed, at a minimum, on a quarterly basis, as well as when information becomes available that would necessitate a review of the current estimate. Adjustments to estimates for a contract’s estimated costs at completion and estimated profit or loss often are required as experience is gained, and as more information is obtained, even though the scope of work required under the contract may or may not change, or if contract
64
GRIFFON CORPORATION
NOTES TO CONSOLIDATED FINANCIAL STATEMENTS – (Continued)
(US dollars and non US currencies in thousands, except per share data)
modifications occur. The impact of such adjustments or changes to estimates is made on a cumulative basis in the period when such information has become known. In 2017, 2016 and 2015, income from operations included net favorable/(unfavorable) catch-up adjustments approximating
$600
,
$(700)
and
$(400)
, respectively. Gross profit is affected by a variety of factors, including the mix of products, systems and services, production efficiencies, price competition and general economic conditions.
Revenue and profits on cost-reimbursable type contracts are recognized as allowable costs, and are incurred on the contract at an amount equal to the allowable costs plus the estimated profit on those costs. The estimated profit on a cost-reimbursable contract may be fixed or variable based on the contractual fee arrangement. Incentive and award fees on these contracts are recorded as revenue when the criteria under which they are earned are reasonably assured of being met and can be estimated.
For contracts in which anticipated total costs exceed the total expected revenue, an estimated loss is recognized in the period when identifiable. A provision for the entire amount of the estimated loss is recorded on a cumulative basis. The estimated remaining costs to complete loss contracts as of September 30, 2017 was
$9,900
and is recorded as a reduction to gross margin on the Consolidated Statements of Operations and Comprehensive Income (Loss). This loss had an immaterial impact on Griffon's Consolidated Financial Statements.
Amounts representing contract change orders or claims are included in revenue only when they can be reliably estimated and their realization is probable, and are determined on a percentage-of-completion basis measured by the cost-to-cost method.
From time to time, Telephonics may combine contracts if they are negotiated together, have specific requirements to combine, or are otherwise closely related. Contracts are segmented based on customer requirements.
Accounts receivable, allowance for doubtful accounts and concentrations of credit risk
Accounts receivable is composed principally of trade accounts receivable that arise from the sale of goods or services on account, and is stated at historical cost. A substantial portion of Griffon’s trade receivables are from customers of HBP, of which the largest customer is Home Depot, whose financial condition is dependent on the construction and related retail sectors of the economy. As a percentage of consolidated accounts receivable, U.S. Government related programs were
16%
and Home Depot was
19%
. Griffon performs continuing evaluations of the financial condition of its customers, and although Griffon generally does not require collateral, letters of credit may be required from customers in certain circumstances.
Trade receivables are recorded at the stated amount, less allowance for doubtful accounts and, when appropriate, for customer program reserves and cash discounts. The allowance represents estimated uncollectible receivables associated with potential customer defaults on contractual obligations (usually due to customers’ potential insolvency). The allowance for doubtful accounts includes amounts for certain customers where a risk of default has been specifically identified, as well as an amount for customer defaults based on a formula when it is determined the risk of some default is probable and estimable, but cannot yet be associated with specific customers. The provision related to the allowance for doubtful accounts is recorded in Selling, general and administrative ("SG&A") expenses. The Company writes-off accounts receivable when they are deemed to be uncollectible.
Customer program reserves and cash discounts are netted against accounts receivable when it is customer practice to reduce invoices for these amounts. The amounts netted against accounts receivable in
2017
and
2016
were
$11,249
and
$8,509
, respectively.
All accounts receivable amounts are expected to be collected in less than one year.
The Company does not currently have customers or contracts that prescribe specific retainage provisions.
Contract costs and recognized income not yet billed
Contract costs and recognized income not yet billed consists of amounts accounted for under the percentage of completion method of accounting, recoverable costs and accrued profit that cannot yet be invoiced under the terms of certain long-term contracts. Amounts will be invoiced when applicable contract terms, such as the achievement of specified milestones or product delivery, are met. At September 30,
2017
and
2016
, approximately
$20,100
and
$12,000
, respectively, of contract costs and recognized income not yet billed were expected to be collected after one year. As of September 30,
2017
and
2016
, the unbilled receivable balance included $
2,850
and
$2,600
, respectively, of reserves for contract risk.
65
GRIFFON CORPORATION
NOTES TO CONSOLIDATED FINANCIAL STATEMENTS – (Continued)
(US dollars and non US currencies in thousands, except per share data)
Inventories
Inventories, stated at the lower of cost (first-in, first-out or average) or market, include material, labor and manufacturing overhead costs.
Griffon’s businesses typically do not require inventory that is susceptible to becoming obsolete or dated. In general, Telephonics sells products in connection with programs authorized and approved under contracts awarded by the U.S. Government or agencies thereof and in accordance with customer specifications. HBP produces doors and long-handled tools and landscaping products in response to orders from customers of retailers and dealers or based on expected orders, as applicable.
Property, plant and equipment
Property, plant and equipment includes the historical cost of land, buildings, equipment and significant improvements to existing plant and equipment or, in the case of acquisitions, a fair market value appraisal of such assets completed at the time of acquisition. Expenditures for maintenance, repairs and minor renewals are expensed as incurred. When property or equipment is sold or otherwise disposed of, the related cost and accumulated depreciation is removed from the respective accounts and the gain or loss is recognized. No event or indicator of impairment occurred during the three years ended
September 30, 2017
, which would require additional impairment testing of property, plant and equipment.
Depreciation expense, which includes amortization of assets under capital leases, was
$41,220
,
$39,734
and
$39,120
for the years ended
September 30, 2017
,
2016
and
2015
, respectively, and was calculated on a straight-line basis over the estimated useful lives of the assets. Depreciation included in SG&A expenses was
$12,995
,
$11,721
and
$11,769
for the years ended
September 30, 2017
,
2016
and
2015
. The remaining components of depreciation, attributable to manufacturing operations, are included in Cost of goods and services. Estimated useful lives for property, plant and equipment are as follows: buildings and building improvements,
25
to
40 years
; machinery and equipment,
2
to
15 years
and leasehold improvements, over the term of the lease or life of the improvement, whichever is shorter.
Capitalized interest costs included in Property, plant and equipment were
$4,807
,
$3,844
and
$4,165
for the years ended
September 30, 2017
,
2016
and
2015
, respectively. The original cost of fully-depreciated property, plant and equipment remaining in use at
September 30, 2017
was approximately
$286,056
.
Goodwill and indefinite-lived intangibles
Goodwill is the excess of the acquisition cost of a business over the fair value of the identifiable net assets acquired. Goodwill is not amortized, but is subject to an annual impairment test unless during an interim period, impairment indicators such as a significant change in the business climate exist.
Griffon performed its annual impairment testing of goodwill as of
September 30, 2017
. The performance of the test involves a two-step process. The first step involves comparing the fair value of Griffon’s reporting units with the reporting unit’s carrying amount, including goodwill. Griffon generally determines the fair value of its reporting units using the income approach methodology of valuation that includes the present value of expected future cash flows. This method uses market assumptions specific to Griffon’s reporting units. If the carrying amount of a reporting unit exceeds the reporting unit’s fair value, Griffon performs the second step of the goodwill impairment test to determine the amount of impairment loss. The second step compares the implied fair value of the reporting unit’s goodwill with the carrying amount of that goodwill.
Griffon defines its reporting units as its
two
reportable segments: HBP and Telephonics. Before Griffon classified PPC into discontinued operations, it had considered PPC to be both a reportable segment and reporting unit and tested PPC separately as part of its annual impairment testing of goodwill as of September 30, 2017. At September 30, 2017, HBP consisted of
two
components, AMES and CBP, which due to their similar economic characteristics, are aggregated into
one
reporting unit for goodwill testing.
Griffon used
5
year projections and a
3.0%
terminal value to which discount rates between
7.5%
and
9.5%
were applied to calculate each unit’s fair value. To substantiate fair values derived from the income approach methodology of valuation, the implied fair value was compared to the marketplace fair value of a comparable industry grouping for reasonableness. Further, the fair values were reconciled to Griffon’s market capitalization. Both market comparisons supported the implied fair values. Any changes in
66
GRIFFON CORPORATION
NOTES TO CONSOLIDATED FINANCIAL STATEMENTS – (Continued)
(US dollars and non US currencies in thousands, except per share data)
key assumptions or management judgment with respect to a reporting unit or its prospects, which may result from a decline in Griffon’s stock price, a change in market conditions, market trends, interest rates or other factors outside Griffon’s control, or significant underperformance relative to historical or project future operating results, could result in a significantly different estimate of the fair value of the reporting units, which could result in a future impairment charge (level 3 inputs).
Based upon the results of the annual impairment review, it was determined that the fair value of each reporting unit substantially exceeded the carrying value of the assets, as performed under step one, and
no
impairment existed.
Similar to goodwill, Griffon tests indefinite-lived intangible assets at least annually and when indicators of impairment exist. Griffon uses a discounted cash flow method to calculate and compare the fair value of the intangible to its book value. This method uses market assumptions specific to Griffon’s reporting units, which are reasonable and supportable. If the fair value is less than the book value of the indefinite-lived intangibles, an impairment charge would be recognized.
There was
no
impairment related to any goodwill or indefinite-lived intangible at September 30, 2017, 2016 or 2015.
Definite-lived long-lived assets
Amortizable intangible assets are carried at cost less accumulated amortization. For financial reporting purposes, definite-lived intangible assets are amortized on a straight-line basis over their useful lives, generally
eight
to
twenty-five years
.
Long-lived assets and certain identifiable intangible assets to be held and used are reviewed for impairment whenever events or changes in circumstances indicate that the carrying amount of such assets may not be recoverable. Determination of recoverability is based on an estimate of undiscounted future cash flows resulting from the use of the asset and its eventual disposition.
There were
no
indicators of impairment during the three years ending
September 30, 2017
.
Income taxes
Income taxes are accounted for under the liability method. Deferred taxes reflect the tax consequences on future years of differences between the tax basis of assets and liabilities and their financial reporting amounts. The carrying value of Griffon’s deferred tax assets is dependent upon Griffon’s ability to generate sufficient future taxable income in certain tax jurisdictions. Should Griffon determine that it is more likely than not that some portion of the deferred tax assets will not be realized, a valuation allowance against the deferred tax assets would be established in the period such determination was made.
Griffon provides for uncertain tax positions and any related interest and penalties based upon Management’s assessment of whether a tax benefit is more likely than not of being sustained upon examination by tax authorities. At
September 30, 2017
Griffon believes that it has appropriately accounted for all unrecognized tax benefits. As of
September 30, 2017
,
2016
and
2015
, Griffon has recorded unrecognized tax benefits in the amount of
$4,825
,
$4,709
and
$6,613
, respectively. Accrued interest and penalties related to income tax matters are recorded in the provision for income taxes.
Research and development costs, shipping and handling costs and advertising costs
Research and development costs not recoverable under contractual arrangements are charged to SG&A expense as incurred and amounted to
$17,700
,
$18,000
and
$15,800
in
2017
,
2016
and
2015
, respectively.
SG&A expenses include shipping and handling costs of
$32,500
in
2017
,
$30,600
in
2016
and
$33,100
in
2015
and advertising costs, which are expensed as incurred, of
$22,000
in
2017
,
$23,000
in
2016
and
$23,000
in
2015
.
Risk, retention and insurance
Griffon’s property and casualty insurance programs contain various deductibles that, based on Griffon’s experience, are reasonable and customary for a company of its size and risk profile. Griffon generally maintains deductibles for claims and liabilities related primarily to workers’ compensation, general, product and automobile liability as well as property damage and business interruption losses resulting from certain events. Griffon does not consider any of the deductibles to represent a material risk to Griffon. Griffon accrues for claim exposures that are probable of occurrence and can be reasonably estimated. Insurance is maintained to transfer risk beyond the level of self-retention and provides protection on both an individual claim and annual aggregate basis.
67
GRIFFON CORPORATION
NOTES TO CONSOLIDATED FINANCIAL STATEMENTS – (Continued)
(US dollars and non US currencies in thousands, except per share data)
Pension benefits
Griffon sponsors defined and supplemental benefit pension plans for certain retired employees. Annual amounts relating to these plans are recorded based on actuarial projections, which include various actuarial assumptions, including discount rates, assumed rates of return, compensation increases and turnover rates. Actuarial assumptions used to determine pension liabilities, assets and expense are reviewed annually and modified based on current economic conditions and trends. The expected return on plan assets is determined based on the nature of the plan's investments and expectations for long-term rates of return. The discount rate used to measure obligations is based on a corporate bond spot-rate yield curve that matches projected future benefit payments, with the appropriate spot rate applicable to the timing of the projected future benefit payments. Assumptions used in determining Griffon’s obligations under the defined benefit pension plans are believed to be reasonable, based on experience and advice from independent actuaries; however, differences in actual experience or changes in assumptions may materially impact Griffon’s financial position or results of operations.
All of the defined benefit plans are frozen and have ceased accruing benefits.
Newly issued but not yet effective accounting pronouncements
In May 2017, the FASB issued guidance to address the situation when a company modifies the terms of a stock compensation award previously granted to an employee. This guidance is effective, and should be applied prospectively, for fiscal years beginning after December 15, 2017. Early adoption is permitted as of the beginning of an annual period. The new guidance is effective for the Company beginning in 2019. We are currently evaluating the impact of the guidance on the Company's financial condition, results of operations and related disclosures.
In March 2017, the FASB issued amendments to the Compensation - Retirement Benefits guidance which requires companies to retrospectively present the service cost component of net periodic benefit cost for pension and retiree medical plans along with other compensation costs in operating income and present the other components of net periodic benefit cost below operating income in the income statement. The guidance also allows only the service cost component of net periodic benefit cost to be eligible for capitalization within inventory or fixed assets on a prospective basis. This guidance is effective, and should be applied retroactively, for fiscal years beginning after December 15, 2017. Early adoption is permitted as of the beginning of an annual period. The new guidance is effective for the Company beginning in 2019. We are currently evaluating the impact of the guidance on the Company's financial condition, results of operations and related disclosures.
In January 2017, the FASB issued guidance that simplifies how an entity is required to test goodwill for impairment by eliminating Step 2 from the goodwill impairment test. Step 2 measures a goodwill impairment loss by comparing the implied fair value of a reporting unit's goodwill with the carrying amount of that goodwill. This guidance is effective for annual periods beginning after December 15, 2019, including interim periods within those periods and will be effective for the Company beginning in 2020. Early adoption is permitted for interim or annual goodwill impairment tests performed on testing dates after January 1, 2017. We are currently evaluating the impact of the guidance on the Company's financial condition, results of operations and related disclosures.
In January 2017, the FASB issued guidance that clarifies the definition of a business, which will impact many areas of accounting including acquisitions, disposals, goodwill, and consolidation. The new standard is intended to help companies and other organizations evaluate whether transactions should be accounted for as acquisitions (or disposals) of assets or businesses. This guidance is effective for annual periods beginning after December 15, 2017, including interim periods within those periods and will be effective for the Company beginning in 2019. We are currently evaluating the impact of the guidance on the Company's financial condition, results of operations and related disclosures.
In August 2016, the Financial Accounting Standards Board ("FASB") issued guidance on the Statement of Cash Flows Classification of certain cash receipts and cash payments (a consensus of the emerging issues take force). This guidance addresses the following eight specific cash flow issues: Debt prepayment or debt extinguishment costs; settlement of zero-coupon debt instruments or other debt instruments with coupon interest rates that are insignificant in relation to the effective interest rate of the borrowing; contingent consideration payments made after a business combination; proceeds from the settlement of insurance claims; proceeds from the settlement of corporate-owned life insurance policies (including bank-owned life insurance policies); distributions received from equity method investees; beneficial interests in securitization transactions; and separately identifiable cash flows and
68
GRIFFON CORPORATION
NOTES TO CONSOLIDATED FINANCIAL STATEMENTS – (Continued)
(US dollars and non US currencies in thousands, except per share data)
application of the predominance principle. This guidance will be effective for the Company beginning in fiscal 2019. We are currently evaluating the impact of the guidance on the Company's financial condition, results of operations and related disclosures.
In February 2016, the FASB issued guidance on lease accounting requiring lessees to recognize a right-of-use asset and a lease liability for long-term leases. The liability will be equal to the present value of lease payments. This guidance must be applied using a modified retrospective transition approach to all annual and interim periods presented and is effective for the company beginning in fiscal 2019. We are currently evaluating the impact of the guidance on the Company's financial condition, results of operations and related disclosures.
In May 2014, the FASB issued guidance on revenue from contracts with customers. The underlying principle is that an entity will recognize revenue to depict the transfer of goods or services to customers at an amount that the entity expects to be entitled to in exchange for those goods or services. The guidance provides a five-step analysis of transactions to determine when and how revenue is recognized. Other major provisions include capitalization of certain contract costs, consideration of time value of money in the transaction price, and allowing estimates of variable consideration to be recognized before contingencies are resolved, in certain circumstances. The guidance also requires enhanced disclosures regarding the nature, amount, timing and uncertainty of revenue and cash flows arising from an entity's contracts with customers. This guidance permits the use of either the retrospective or cumulative effect transition method and is effective for the Company beginning in 2019; early adoption is permitted beginning in 2018. We have not yet selected a transition method and are currently evaluating the impact of the guidance on the Company's financial condition, results of operations and related disclosures. The FASB has also issued the following additional guidance clarifying certain issues on revenue from contracts with customers; Revenue from Contracts with Customers: Narrow-Scope Improvements and Practical Expedients and Revenue from Contracts with Customers: Identifying Performance Obligations and Licensing. The Company is currently evaluating this guidance to determine the impact it will have on its consolidated financial statements.
Recently adopted accounting pronouncements
In March 2016, the FASB issued guidance on Stock Compensation: Improvements to Employee Share-Based Payment Accounting. The guidance changes how companies account for certain aspects of share-based payment awards to employees, including the accounting for income taxes, forfeitures, and statutory tax withholding requirements, as well as the classification of related matters in the statement of cash flows. The amendments are effective for annual periods, and interim reporting periods within those annual periods, beginning after December 15, 2016 using either prospective, retrospective or modified retrospective transition method, depending on the area covered in this guidance. The Company early adopted this guidance in fiscal 2016 in order to simplify the accounting for employee share-based payments..
Under this guidance all excess tax benefits (“windfalls”) and deficiencies (“shortfalls”) related to employee stock compensation was recognized within income tax expense for the year ended September 30, 2016. Under prior guidance, windfalls were recognized to Capital in excess of par value and shortfalls were only recognized to the extent they exceed the pool of windfall tax benefits. As a result of the adoption, a tax benefit of
$2,193
was recognized within income tax expense reflecting the excess tax benefits for the year ended September 30, 2016. The adoption was on a prospective basis and therefore had no impact on prior years. Additionally, income tax benefits at settlement of an award were previously reported as a reduction to operating cash flows and an increase to financing cash flows to the extent that those benefits exceeded the income tax benefits reported in earnings during the award's vesting period. Griffon has elected to apply that change in cash flow classification on a prospective basis, which has resulted in a
$2,291
increase to net cash provided by operating activities and a corresponding increase to net cash used in financing activities in the accompanying condensed consolidated statement of cash flows for the year ended September 30, 2016, as compared to the amounts previously reported. The remaining provisions of this accounting standard did not have a material impact on the accompanying condensed consolidated financial statements.
In November 2015, the FASB issued guidance on simplifying the presentation of deferred income taxes, requiring deferred income tax liabilities and assets to be classified as non-current in the statement of financial position. The guidance is effective for annual and interim reporting periods within those annual periods beginning after December 15, 2016 and may be applied retrospectively or prospectively. The Company early adopted this guidance in fiscal 2016 in order to simplify balance sheet presentation and applied it retrospectively for all periods presented in the financial statements. Accordingly, we reclassified current deferred taxes to non-current on the Consolidated Balance Sheet as of September 30, 2015 resulting in a decrease to both non-current deferred tax assets and non-current tax liabilities of
$3,793
and
$14,827
, respectively.
69
GRIFFON CORPORATION
NOTES TO CONSOLIDATED FINANCIAL STATEMENTS – (Continued)
(US dollars and non US currencies in thousands, except per share data)
In August 2014, the FASB issued guidance on management's responsibility in evaluating whether there is substantial doubt about a company's ability to continue as a going concern and related footnote disclosures. Management is required to evaluate, at each reporting period, whether there are conditions or events that raise substantial doubt about a company's ability to continue as a going concern within one year from the date the financial statements are issued. This guidance was effective prospectively for annual and interim reporting periods beginning in 2017; implementation of this guidance did not have a material effect on the Company’s financial condition or results of operations.
The Company has implemented all new accounting pronouncements that are in effect and that may impact its financial statements.
Griffon accounts for acquisitions under the acquisition method, in which assets acquired and liabilities assumed are recorded at fair value as of the date of acquisition using a method substantially similar to the goodwill impairment test methodology (level 3 inputs). The operating results of the acquired companies are included in Griffon’s consolidated financial statements from the date of acquisition; in each instance, Griffon is in the process of finalizing the initial purchase price allocation.
On November 6, 2017, AMES acquired Harper Brush Works (“Harper”), a division of Horizon Global, for approximately
$5,000
. Harper is a leading U.S. manufacturer of cleaning products for professional, home, and industrial use. The acquisition will broaden AMES’ long-handle tool offering in North America to include brooms, brushes, and other cleaning tools and accessories.
On October 2, 2017, Griffon Corporation completed the acquisition of ClosetMaid, a market leader of home storage and organization products, for approximately
$200,000
, or
$175,000
inclusive of the net present value of tax benefits. ClosetMaid adds to Griffon's Home and Building Products segment, complementing and diversifying Griffon's portfolio of leading consumer brands and products. SG&A expenses included
$8,055
of related acquisition costs in 2017.
The accounts of ClosetMaid, after adjustments to reflect fair market values assigned to assets purchased, will be included in the consolidated financial statements from the date of acquisition of October 2, 2017, and as such will be included in Griffon's first quarter 2018 results. The Company has recorded an allocation of the purchase price to the Company’s tangible and identifiable intangible assets acquired and liabilities assumed based on their fair market values (level 3 inputs) at the acquisition date. The excess of the purchase price over the fair value of the net tangible and intangible assets was recorded as goodwill and is deductible for tax purposes. Goodwill recognized at the acquisition date represents the other intangible benefits that the Company will derive from the ownership of ClosetMaid, however, such intangible benefits do not meet the criteria for recognition of separately identifiable intangible assets. The calculation of the purchase price allocation, which is pending finalization of tax-related items and completion of the related final valuation, is as follows:
|
Cash and cash equivalents
|
$
|
8,833
|
|
|
Accounts receivable, net
|
31,967
|
|
|
|
Inventories, net
|
36,354
|
|
|
|
Property, plant and equipment, net
|
44,134
|
|
|
|
Intangible assets, net
|
83,773
|
|
|
|
Goodwill
|
40,786
|
|
|
|
Other current and non-current assets
|
8,929
|
|
|
|
Total assets acquired
|
254,776
|
|
|
|
Accounts payable and accrued liabilities
|
54,776
|
|
|
|
Total liabilities assumed
|
54,776
|
|
|
|
Total
|
$
|
200,000
|
|
The amounts assigned to goodwill and major intangible asset classifications, all of which are tax deductible, for the ClosetMaid acquisition are as follows:
70
GRIFFON CORPORATION
NOTES TO CONSOLIDATED FINANCIAL STATEMENTS – (Continued)
(US dollars and non US currencies in thousands, except per share data)
|
|
Average
Life (Years) |
|||||
|
Goodwill
|
$
|
40,786
|
|
N/A
|
||
|
Indefinite-lived intangibles
|
53,290
|
|
N/A
|
|||
|
Definite-lived intangibles
|
30,483
|
|
15
|
|||
|
Total goodwill and intangible assets
|
$
|
124,559
|
|
|
||
On September 29, 2017, AMES Australia completed the acquisition of Tuscan Landscape Group Pty, Ltd. ("Tuscan Path") for approximately
$18,000
(AUD
22,250
). Tuscan Path is a leading Australian provider of pots, planters, pavers, decorative stone, and garden decor products. The acquisition of Tuscan Path broadens AMES' outdoor living and lawn and garden business, and will strengthen AMES' industry leading position in Australia. The purchase price was primarily allocated to intangible assets of AUD
3,900
and inventory and accounts receivable of AUD
7,900
. SG&A expenses included
$311
of related acquisition costs in 2017.
On July 31, 2017, The AMES Companies, Inc. acquired La Hacienda Limited, a leading United Kingdom outdoor living brand of unique heating and garden decor products, for approximately
$11,400
(GBP
9,175
), including an approximate contingent earn out payment of
$790
(GBP
600
). The acquisition of La Hacienda broadens AMES' global outdoor living and lawn and garden business and supports AMES' UK expansion strategy. The purchase price allocation was primarily allocated to intangible assets of approximately GBP
3,100
. SG&A expenses included
$647
of related acquisition costs in 2017.
On December 30, 2016, AMES Australia acquired Home Living ("Hills") for approximately
$6,051
(AUD
8,400
). Hills, founded in 1946, is a market leader in the supply of clothesline, laundry and garden products. The Hills acquisition adds to AMES' existing broad category of products and enhances its lawn and garden product offerings in Australia. The purchase price was primarily allocated to intangible assets of approximately AUD
6,400
.
On February 14, 2016, AMES Australia acquired substantially all of the Intellectual Property (IP) assets of Australia-based Nylex Plastics Pty Ltd. for
$1,744
(AUD
2,452
). Through this acquisition, AMES and Griffon secured the ownership of the trademark “Nylex” for certain categories of AMES products, principally in the country of Australia. Previously, the Nylex name was licensed. The acquisition of the Nylex IP was contemplated as a post-closing activity of the Cyclone acquisition and supports AMES' Australian watering products strategy. The purchase price was allocated to indefinite lived trademarks and is not deductible for income taxes.
In December 2015, Telephonics invested an additional
$2,726
increasing its equity stake from
26%
to
49%
in Mahindra Telephonics Integrated Systems ("MTIS"), a joint venture with Mahindra Defence Systems, a Mahindra Group Company. MTIS is an aerospace and defense manufacturing and development facility in Prithla, India.
This investment is accounted for using the equity method.
On April 16, 2015, AMES acquired the assets of an operational wood mill in Champion, PA from the Babcock Lumber Company for
$2,225
. The purchase price was allocated to property, plant and equipment. The wood mill secures wood supplies, lowers overall production costs and mitigates risk associated with manufacturing handles for wheelbarrows and long-handled tools.
The following table details the components of inventory:
|
At September 30,
2017 |
At September 30,
2016 |
||||||
|
Raw materials and supplies
|
$
|
67,990
|
|
$
|
59,207
|
|
|
|
Work in process
|
78,846
|
|
69,164
|
|
|||
|
Finished goods
|
152,601
|
|
132,946
|
|
|||
|
Total
|
$
|
299,437
|
|
$
|
261,317
|
|
|
71
GRIFFON CORPORATION
NOTES TO CONSOLIDATED FINANCIAL STATEMENTS – (Continued)
(US dollars and non US currencies in thousands, except per share data)
The following table details the components of property, plant and equipment, net:
|
At September 30,
2017 |
At September 30,
2016 |
||||||
|
Land, building and building improvements
|
$
|
71,764
|
|
$
|
65,615
|
|
|
|
Machinery and equipment
|
462,173
|
|
444,250
|
|
|||
|
Leasehold improvements
|
43,040
|
|
37,414
|
|
|||
|
|
576,977
|
|
547,279
|
|
|||
|
Accumulated depreciation and amortization
|
(344,842
|
)
|
(310,374
|
)
|
|||
|
Total
|
$
|
232,135
|
|
$
|
236,905
|
|
|
The following table provides changes in carrying value of goodwill by segment through the year ended
September 30, 2017
:
|
|
At September 30,
2015 |
Foreign currency translation adjustments
|
September 30,
2016 |
Goodwill from acquisitions
|
Foreign currency translation adjustments
|
September 30,
2017 |
|||||||||||||||||
|
Home & Building Products
|
$
|
285,825
|
|
$
|
1,793
|
|
$
|
287,618
|
|
$
|
12,417
|
|
$
|
559
|
|
$
|
300,594
|
|
|||||
|
Telephonics
|
18,545
|
|
—
|
|
18,545
|
|
—
|
|
—
|
|
18,545
|
|
|||||||||||
|
Total
|
$
|
304,370
|
|
$
|
1,793
|
|
$
|
306,163
|
|
$
|
12,417
|
|
$
|
559
|
|
$
|
319,139
|
|
|||||
The following table provides the gross carrying value and accumulated amortization for each major class of intangible asset:
|
|
At September 30, 2017
|
|
At September 30, 2016
|
||||||||||||||
|
|
Gross Carrying Amount
|
Accumulated Amortization
|
Average
Life
(Years)
|
Gross Carrying
Amount
|
Accumulated Amortization
|
||||||||||||
|
Customer relationships & other
|
$
|
152,025
|
|
$
|
43,421
|
|
25
|
$
|
148,288
|
|
$
|
36,867
|
|
||||
|
Unpatented technology
|
6,193
|
|
4,719
|
|
12.5
|
6,073
|
|
4,061
|
|
||||||||
|
Total amortizable intangible assets
|
158,218
|
|
48,140
|
|
|
154,361
|
|
40,928
|
|
||||||||
|
Trademarks
|
95,049
|
|
—
|
|
|
84,516
|
|
—
|
|
||||||||
|
Total intangible assets
|
$
|
253,267
|
|
$
|
48,140
|
|
|
$
|
238,877
|
|
$
|
40,928
|
|
||||
Amortization expense for intangible assets subject to amortization was
$6,658
,
$6,608
and
$6,713
for the years ended
September 30, 2017
,
2016
and
2015
, respectively. Amortization expense for each of the next
five years
and thereafter, based on current intangible balances and classifications, is estimated as follows:
2018
-
$6,556
;
2019
-
$6,513
;
2020
-
$6,027
;
2021
-
$6,027
and
2022
-
$6,027
; thereafter -
$78,928
.
No event or indicator or impairment occurred during the current year, which would require impairment testing of long-lived intangible assets including goodwill.
PPC
On September 5, 2017, Griffon announced it will explore strategic alternatives for PPC and on November 16, 2017, announced it entered into a definitive agreement to sell PPC to Berry for
$475 million
in cash. The transaction is subject to regulatory approval and customary closing conditions, and is expected to close in the first quarter of calendar 2018. As a result, Griffon classified the results of operations of the PPC business as discontinued operations in the Consolidated Statements of Operations for all periods
72
GRIFFON CORPORATION
NOTES TO CONSOLIDATED FINANCIAL STATEMENTS – (Continued)
(US dollars and non US currencies in thousands, except per share data)
presented and classified the related assets and liabilities associated with the discontinued operations as held for sale in the consolidated balance sheets. All results and information presented exclude PPC unless otherwise noted. PPC is a global leader in the development and production of embossed, laminated and printed specialty plastic films for hygienic, health-care and industrial products and sells to some of the world's largest consumer products companies.
The following amounts related to the PPC segment have been segregated from Griffon's continuing operations and are reported as discontinued operations:
|
For the Year Ended September 30,
|
||||||||||||
|
2017
|
2016
|
2015
|
||||||||||
|
Revenue
|
$
|
460,914
|
|
$
|
480,126
|
|
$
|
532,741
|
|
|||
|
Cost of goods and services
|
389,416
|
|
407,385
|
|
449,310
|
|
||||||
|
Gross profit
|
71,498
|
|
72,741
|
|
83,431
|
|
||||||
|
Selling, general and administrative expenses
|
43,518
|
|
45,673
|
|
49,324
|
|
||||||
|
Restructuring charges
|
—
|
|
5,900
|
|
—
|
|
||||||
|
Total operating expenses
|
43,518
|
|
51,573
|
|
49,324
|
|
||||||
|
Income from discontinued operations
|
27,980
|
|
21,168
|
|
34,107
|
|
||||||
|
Other income (expense)
|
|
|
|
|
|
|
||||||
|
Interest expense, net
|
63
|
|
1,234
|
|
358
|
|
||||||
|
Other, net
|
(59
|
)
|
(1,018
|
)
|
(821
|
)
|
||||||
|
Total other income (expense)
|
4
|
|
216
|
|
(463
|
)
|
||||||
|
Income from operations of discontinued operations
|
27,976
|
|
20,952
|
|
34,570
|
|
||||||
During the third quarter of 2016, PPC incurred pre-tax restructuring and related exit costs approximating
$5,900
primarily related to headcount reductions at PPC’s Dombuhl, Germany facility, other location headcount reductions and the shut down of PPC's Turkey facility. These actions resulted in the elimination of approximately
86
positions. The Dombuhl charges are related to an optimization plan that will drive innovation and enhance our industry leading position in printed breathable back sheet. The facility will be transformed into a state of the art hygiene products facility focused on breathable printed film and siliconized products. In conjunction with this effort, our customer base will be streamlined, and we will dispose of old assets and reduce overhead costs, allowing for gains in efficiencies.
A summary of the restructuring and other related charges included in the line item “Restructuring and other related charges” in the Consolidated Statements of Operations recognized for 2016 was as follows:
|
|
Workforce
Reduction
|
Facilities &
Exit Costs
|
Other Related
Costs
|
Non-cash
Facility and
Other
|
Total
|
|||||||||
|
Amounts incurred in the year ended:
|
||||||||||||||
|
September 30, 2016
|
3,337
|
|
659
|
|
1,073
|
|
831
|
|
5,900
|
|
||||
In 2017 and 2015,
no
restructuring and other related charges were incurred.
73
GRIFFON CORPORATION
NOTES TO CONSOLIDATED FINANCIAL STATEMENTS – (Continued)
(US dollars and non US currencies in thousands, except per share data)
The activity in the restructuring accrual recorded in Accrued liabilities consisted of the following:
|
|
Workforce
Reduction
|
Facilities &
Exit Costs
|
Other Related
Costs
|
Total
|
|||||||||||
|
Accrued liability at September 30, 2015
|
$
|
163
|
|
$
|
—
|
|
$
|
—
|
|
$
|
163
|
|
|||
|
Charges
|
3,337
|
|
659
|
|
1,073
|
|
5,069
|
|
|||||||
|
Payments
|
(1,331
|
)
|
(659
|
)
|
(69
|
)
|
(2,059
|
)
|
|||||||
|
Accrued liability at September 30, 2016
|
$
|
2,169
|
|
$
|
—
|
|
$
|
1,004
|
|
$
|
3,173
|
|
|||
|
Payments
|
(1,761
|
)
|
—
|
|
(856
|
)
|
(2,617
|
)
|
|||||||
|
Accrued liability at September 30, 2017
|
$
|
408
|
|
$
|
—
|
|
$
|
148
|
|
$
|
556
|
|
|||
The following amounts related to the PPC segment have been segregated from Griffon's continuing operations and are reported as assets and liabilities of discontinued operations in the consolidated balance sheets:
|
At September 30, 2017
|
At September 30, 2016
|
|||||||
|
ASSETS
|
|
|
|
|
||||
|
Accounts receivable, net
|
$
|
51,768
|
|
$
|
49,412
|
|
||
|
Inventories, net
|
45,742
|
|
47,551
|
|
||||
|
Prepaid and other current assets
|
11,000
|
|
15,176
|
|
||||
|
PROPERTY, PLANT AND EQUIPMENT, net
|
185,940
|
|
168,500
|
|
||||
|
GOODWILL
|
57,087
|
|
55,022
|
|
||||
|
INTANGIBLE ASSETS, net
|
12,298
|
|
12,650
|
|
||||
|
OTHER ASSETS
|
6,889
|
|
14,413
|
|
||||
|
Total Assets Held for Sale
|
$
|
370,724
|
|
362,724
|
|
|||
|
LIABILITIES
|
|
|
|
|
||||
|
Notes payable and current portion of long-term debt
|
$
|
11,163
|
|
$
|
8,712
|
|
||
|
Accounts payable
|
36,619
|
|
42,211
|
|
||||
|
Accrued liabilities
|
14,553
|
|
19,535
|
|
||||
|
LONG-TERM DEBT, net
|
10,549
|
|
16,968
|
|
||||
|
OTHER LIABILITIES
|
11,566
|
|
14,103
|
|
||||
|
Total Liabilities Held for Sale
|
$
|
84,450
|
|
$
|
101,529
|
|
||
In September 2015, Griffon entered into mortgage loans in the amount of
$32,280
, secured by
four
properties occupied by Griffon's subsidiaries.
Two
of the
four
properties belong to PPC. The loan matures in
September 2025
, are collateralized by the specific properties financed and are guaranteed by Griffon. The loans bear interest at a rate of LIBOR plus
1.50%
. At September 30, 2017, the loan related to the two PPC properties had an outstanding balance of
$11,601
, net of issuance costs.
In September 2015, Clopay Europe GmbH (“Clopay Europe”) entered into a EUR 5,000 ($5,884 as of September 30, 2017) revolving credit facility and a EUR 15,000 term loan. The term loan is payable in twelve quarterly installments of EUR 1,250, bears interest at a fixed rate of 2.5% and matures in September 2018. The revolving facility matures in September 2018, but is renewable upon mutual agreement with the bank. The revolving credit facility accrues interest at EURIBOR plus 2.55% per annum (2.55% at September 30, 2017). The revolver and the term loan are both secured by substantially all of the assets of Clopay Europe and its subsidiaries. Griffon guarantees the revolving facility and term loan. The term loan had an outstanding balance of EUR 5,000 ($5,884 at September 30, 2017) and the revolver had outstanding borrowings of EUR 2,500 ($2,942) at September 30, 2017. Clopay Europe is required to maintain a certain minimum equity to assets ratio and is subject to a maximum debt leverage ratio (defined as the ratio of total debt to EBITDA). Clopay Europe is in compliance with these covenants.
Clopay do Brasil maintains a line of credit of approximately R$7,000 ($2,210 as of September 30, 2017). Interest on borrowings accrues at various fixed rates (approximately 14.26% at September 30, 2017). As of September 30, 2017, there was approximately R$4,317 ($1,363 as of September 30, 2017) borrowed under the line. PPC guarantees the line.
74
GRIFFON CORPORATION
NOTES TO CONSOLIDATED FINANCIAL STATEMENTS – (Continued)
(US dollars and non US currencies in thousands, except per share data)
Installation Services and Other Discontinued Activities
In 2008, as a result of the downturn in the residential housing market, Griffon exited substantially all operating activities of its Installation Services segment which sold, installed and serviced garage doors and openers, fireplaces, floor coverings, cabinetry
and a range of related building products, primarily for the new residential housing market. In 2008, Griffon sold
eleven
units, closed
one
unit and merged
two
units into CBP. Griffon substantially concluded its remaining disposal activities in 2009.
Installation Services operating results have been reported as discontinued operations in the Consolidated Statements of Operations and Comprehensive Income (Loss) for all periods presented; Installation Services is excluded from segment reporting. There was
no
reported revenue in 2017, 2016 and 2015.
During the year ended September 30, 2017, Griffon recorded
$5,700
of reserves in discontinued operations related to historical environmental remediation efforts and to increase the reserve for homeowner association claims (HOA) related to the Clopay Services Corporation discontinued operations in 2008.
At
September 30, 2017
, Griffon’s assets and liabilities for discontinued operations primarily related to insurance claims, income taxes and product liability, warranty and environmental reserves. The following amounts related primarily to the installation services segment and other discontinued activities have been segregated from Griffon’s continuing operations and are reported as assets and liabilities of discontinued operations in the consolidated balance sheets:
|
|
At September 30,
2017 |
At September 30,
2016 |
|||||
|
Assets of discontinued operations:
|
|
|
|
|
|||
|
Prepaid and other current assets
|
$
|
329
|
|
$
|
219
|
|
|
|
Other long-term assets
|
2,960
|
|
1,968
|
|
|||
|
Total assets of discontinued operations
|
$
|
3,289
|
|
$
|
2,187
|
|
|
|
Liabilities of discontinued operations:
|
|
|
|
|
|||
|
Accrued liabilities, current
|
$
|
8,342
|
|
$
|
1,684
|
|
|
|
Other long-term liabilities
|
3,037
|
|
1,706
|
|
|||
|
Total liabilities of discontinued operations
|
$
|
11,379
|
|
$
|
3,390
|
|
|
The following table details the components of accrued liabilities:
|
|
At September 30,
2017 |
At September 30,
2016 |
|||||
|
Compensation
|
$
|
37,692
|
|
$
|
38,551
|
|
|
|
Interest
|
3,671
|
|
4,011
|
|
|||
|
Warranties and rebates
|
6,236
|
|
6,322
|
|
|||
|
Insurance
|
12,216
|
|
13,131
|
|
|||
|
Rent, utilities and freight
|
2,149
|
|
1,525
|
|
|||
|
Income and other taxes
|
6,291
|
|
10,687
|
|
|||
|
Marketing and advertising
|
1,859
|
|
1,961
|
|
|||
|
Other
|
13,144
|
|
7,871
|
|
|||
|
Total
|
$
|
83,258
|
|
$
|
84,059
|
|
|
NOTE 8 –
WARRANTY LIABILITY
Telephonics offers warranties against product defects for periods generally ranging from
one
to
two years
, depending on the specific product and terms of the customer purchase agreement. CBP also offers warranties against product defects for periods generally ranging from
one
to
ten
years, with limited lifetime warranties on certain door models. Typical warranties require CBP and Telephonics to repair or replace the defective products during the warranty period at no cost to the customer. At the time revenue is recognized, Griffon records a liability for warranty costs, estimated based on historical experience, and periodically assesses its
75
GRIFFON CORPORATION
NOTES TO CONSOLIDATED FINANCIAL STATEMENTS – (Continued)
(US dollars and non US currencies in thousands, except per share data)
warranty obligations and adjusts the liability as necessary. AMES offers an express limited warranty for a period of
ninety days
on all products unless otherwise stated on the product or packaging from the date of original purchase.
Changes in Griffon’s warranty liability, included in Accrued liabilities, were as follows:
|
|
Years Ended September 30,
|
||||||
|
|
2017
|
2016
|
|||||
|
Balance, beginning of period
|
$
|
6,322
|
|
$
|
6,040
|
|
|
|
Warranties issued and changes in estimated pre-existing warranties
|
6,393
|
|
6,501
|
|
|||
|
Actual warranty costs incurred
|
(6,479
|
)
|
(6,219
|
)
|
|||
|
Balance, end of period
|
$
|
6,236
|
|
$
|
6,322
|
|
|
The present value of the net minimum payments on capitalized leases as of
September 30, 2017
was follows:
|
|
At September 30,
2017 |
||
|
Total minimum lease payments
|
$
|
8,213
|
|
|
Less amount representing interest payments
|
(806
|
)
|
|
|
Present value of net minimum lease payments
|
7,407
|
|
|
|
Current portion
|
(1,787
|
)
|
|
|
Capitalized lease obligation, less current portion
|
$
|
5,620
|
|
Minimum payments under capital leases for the next
five years
are as follows:
$2,120
in
2018
,
$1,967
in
2019
,
$2,073
in
2020
,
$1,761
in
2021
,
$291
in
2022
and
$1
thereafter.
Included in the consolidated balance sheet at
September 30, 2017
under Property, plant and equipment, are costs and accumulated depreciation subject to capitalized leases of
$19,238
and
$11,831
, respectively, and included in Other assets are deferred interest charges of
$105
.
Included in the consolidated balance sheet at
September 30, 2016
, under Property, plant and equipment are costs and accumulated depreciation subject to capitalized leases of
$18,039
and
$10,148
, respectively, and included in Other assets are deferred interest charges of
$131
. Amortization expense was
$1,683
,
$1,628
, and
$1,765
in
2017
,
2016
and
2015
, respectively.
In October 2006, a subsidiary of Griffon entered into a capital lease totaling
$14,290
for real estate it occupies in Troy, Ohio. Approximately
$10,000
was used to acquire the building and the remaining amount was used for improvements. The lease matures in
2022
, bears interest at a fixed rate of
5.0%
, is secured by a mortgage on the real estate and is guaranteed by Griffon.
76
GRIFFON CORPORATION
NOTES TO CONSOLIDATED FINANCIAL STATEMENTS – (Continued)
(US dollars and non US currencies in thousands, except per share data)
Debt at
September 30, 2017
and
2016
consisted of the following:
|
|
|
At September 30, 2017
|
||||||||||||||||||
|
|
|
Outstanding
Balance
|
Original
Issuer
Discount
|
Capitalized Fees & Expenses
|
Balance
Sheet
|
Coupon
Interest Rate
|
||||||||||||||
|
Senior note due 2022
|
(a)
|
$
|
725,000
|
|
(1,177
|
)
|
$
|
(9,220
|
)
|
$
|
714,603
|
|
5.25
|
%
|
||||||
|
Revolver due 2020
|
(b)
|
144,216
|
|
—
|
|
(1,951
|
)
|
142,265
|
|
n/a
|
|
|||||||||
|
Real estate mortgages
|
(d)
|
23,642
|
|
—
|
|
(320
|
)
|
23,322
|
|
n/a
|
|
|||||||||
|
ESOP Loans
|
(e)
|
42,675
|
|
—
|
|
(310
|
)
|
42,365
|
|
n/a
|
|
|||||||||
|
Capital lease - real estate
|
(f)
|
5,312
|
|
—
|
|
(105
|
)
|
5,207
|
|
5.00
|
%
|
|||||||||
|
Non U.S. lines of credit
|
(g)
|
9,402
|
|
|
|
(31
|
)
|
9,371
|
|
n/a
|
|
|||||||||
|
Non U.S. term loans
|
(g)
|
35,943
|
|
—
|
|
(108
|
)
|
35,835
|
|
n/a
|
|
|||||||||
|
Other long term debt
|
(h)
|
6,211
|
|
—
|
|
(21
|
)
|
6,190
|
|
n/a
|
|
|||||||||
|
Totals
|
|
992,401
|
|
(1,177
|
)
|
(12,066
|
)
|
979,158
|
|
|
|
|||||||||
|
less: Current portion
|
|
(11,078
|
)
|
—
|
|
—
|
|
(11,078
|
)
|
|
|
|||||||||
|
Long-term debt
|
|
$
|
981,323
|
|
$
|
(1,177
|
)
|
$
|
(12,066
|
)
|
$
|
968,080
|
|
|
|
|||||
|
|
|
At September 30, 2016
|
||||||||||||||||||
|
|
|
Outstanding
Balance
|
Original
Issuer
Discount
|
Capitalized
Fees & Expenses |
Balance
Sheet
|
Coupon
Interest Rate
|
||||||||||||||
|
Senior notes due 2022
|
(a)
|
$
|
725,000
|
|
$
|
(1,447
|
)
|
$
|
(9,799
|
)
|
$
|
713,754
|
|
5.25
|
%
|
|||||
|
Revolver due 2020
|
(b)
|
—
|
|
—
|
|
(2,425
|
)
|
(2,425
|
)
|
n/a
|
|
|||||||||
|
Convert. debt due 2017
|
(c)
|
100,000
|
|
(1,248
|
)
|
(148
|
)
|
98,604
|
|
4.00
|
%
|
|||||||||
|
Real estate mortgages
|
(d)
|
25,280
|
|
—
|
|
(418
|
)
|
24,862
|
|
n/a
|
|
|||||||||
|
ESOP Loans
|
(e)
|
34,387
|
|
—
|
|
(237
|
)
|
34,150
|
|
n/a
|
|
|||||||||
|
Capital lease - real estate
|
(f)
|
6,447
|
|
—
|
|
(131
|
)
|
6,316
|
|
5.00
|
%
|
|||||||||
|
Non U.S. lines of credit
|
(g)
|
9,260
|
|
|
|
(1
|
)
|
9,259
|
|
n/a
|
|
|||||||||
|
Non U.S. term loans
|
(g)
|
22,446
|
|
—
|
|
(97
|
)
|
22,349
|
|
n/a
|
|
|||||||||
|
Other long term debt
|
(h)
|
4,029
|
|
—
|
|
(20
|
)
|
4,009
|
|
|
|
|||||||||
|
Totals
|
|
926,849
|
|
(2,695
|
)
|
(13,276
|
)
|
910,878
|
|
|
|
|||||||||
|
less: Current portion
|
|
(13,932
|
)
|
—
|
|
—
|
|
(13,932
|
)
|
|
|
|||||||||
|
Long-term debt
|
|
$
|
912,917
|
|
$
|
(2,695
|
)
|
$
|
(13,276
|
)
|
$
|
896,946
|
|
|
|
|||||
77
GRIFFON CORPORATION
NOTES TO CONSOLIDATED FINANCIAL STATEMENTS – (Continued)
(US dollars and non US currencies in thousands, except per share data)
Interest expense consists of the following for the years ended
September 30, 2017
,
2016
and
2015
.
|
|
|
Year Ended September 30, 2017
|
||||||||||||||||||
|
|
|
Effective
Interest Rate
|
Cash Interest
|
Amort. Debt
Discount
|
Amort.
Deferred Cost
& Other Fees
|
Total Interest
Expense
|
||||||||||||||
|
Senior notes due 2022
|
(a)
|
5.55
|
%
|
38,063
|
|
270
|
|
1,857
|
|
40,190
|
|
|||||||||
|
Revolver due 2018
|
(b)
|
n/a
|
|
4,951
|
|
—
|
|
567
|
|
5,518
|
|
|||||||||
|
Convert. debt due 2017
|
(c)
|
8.9
|
%
|
1,167
|
|
1,248
|
|
148
|
|
2,563
|
|
|||||||||
|
Real estate mortgages
|
(d)
|
2.6
|
%
|
582
|
|
—
|
|
58
|
|
640
|
|
|||||||||
|
ESOP Loans
|
(e)
|
4.2
|
%
|
1,557
|
|
—
|
|
133
|
|
1,690
|
|
|||||||||
|
Capital lease - real estate
|
(f)
|
5.5
|
%
|
296
|
|
—
|
|
25
|
|
321
|
|
|||||||||
|
Non U.S. lines of credit
|
(g)
|
n/a
|
|
76
|
|
—
|
|
128
|
|
204
|
|
|||||||||
|
Non U.S. term loans
|
(g)
|
n/a
|
|
860
|
|
—
|
|
67
|
|
927
|
|
|||||||||
|
Other long term debt
|
(h)
|
n/a
|
|
245
|
|
|
|
10
|
|
255
|
|
|||||||||
|
Capitalized interest
|
|
|
|
(795
|
)
|
|
|
|
|
(795
|
)
|
|||||||||
|
Totals
|
|
|
|
$
|
47,002
|
|
$
|
1,518
|
|
$
|
2,993
|
|
$
|
51,513
|
|
|||||
|
|
|
Year Ended September 30, 2016
|
||||||||||||||
|
|
|
Effective
Interest Rate
|
Cash Interest
|
Amort. Debt
Discount
|
Amort.
Deferred Cost
& Other Fees
|
Total Interest
Expense
|
||||||||||
|
Senior notes due 2022
|
(a)
|
5.48
|
%
|
33,906
|
|
103
|
|
1,481
|
|
35,490
|
|
|||||
|
Revolver due 2018
|
(b)
|
n/a
|
|
2,564
|
|
—
|
|
512
|
|
3,076
|
|
|||||
|
Convert. debt due 2017
|
(c)
|
9.0
|
%
|
4,000
|
|
4,346
|
|
443
|
|
8,789
|
|
|||||
|
Real estate mortgages
|
(d)
|
2.2
|
%
|
439
|
|
—
|
|
62
|
|
501
|
|
|||||
|
ESOP Loans
|
(e)
|
3.1
|
%
|
1,090
|
|
—
|
|
236
|
|
1,326
|
|
|||||
|
Capital lease - real estate
|
(f)
|
5.5
|
%
|
353
|
|
—
|
|
25
|
|
378
|
|
|||||
|
Non U.S. lines of credit
|
(g)
|
n/a
|
|
553
|
|
—
|
|
91
|
|
644
|
|
|||||
|
Non U.S. term loan
|
(g)
|
n/a
|
|
659
|
|
—
|
|
13
|
|
672
|
|
|||||
|
Other long term debt
|
(h)
|
|
|
260
|
|
|
|
9
|
|
269
|
|
|||||
|
Capitalized interest
|
|
|
|
(1,202
|
)
|
|
|
|
|
(1,202
|
)
|
|||||
|
Totals
|
|
|
|
42,622
|
|
4,449
|
|
2,872
|
|
49,943
|
|
|||||
78
GRIFFON CORPORATION
NOTES TO CONSOLIDATED FINANCIAL STATEMENTS – (Continued)
(US dollars and non US currencies in thousands, except per share data)
|
|
|
Year Ended September 30, 2015
|
||||||||||||||||||
|
|
|
Effective
Interest Rate
|
Cash Interest
|
Amort. Debt
Discount
|
Amort.
Deferred Cost
& Other Fees
|
Total Interest
Expense
|
||||||||||||||
|
Senior notes due 2018
|
(a)
|
n/a
|
|
|
|
|
|
|
|
$
|
—
|
|
||||||||
|
Senior notes due 2022
|
(a)
|
5.46
|
%
|
31,500
|
|
1,289
|
|
32,789
|
|
|||||||||||
|
Revolver due 2018
|
(b)
|
n/a
|
|
2,301
|
|
—
|
|
520
|
|
2,821
|
|
|||||||||
|
Convert. debt due 2017
|
(c)
|
9.1
|
%
|
4,000
|
|
3,989
|
|
444
|
|
8,433
|
|
|||||||||
|
Real estate mortgages
|
(d)
|
3.8
|
%
|
468
|
|
—
|
|
576
|
|
1,044
|
|
|||||||||
|
ESOP Loans
|
(e)
|
2.9
|
%
|
1,025
|
|
—
|
|
69
|
|
1,094
|
|
|||||||||
|
Capital lease - real estate
|
(f)
|
5.3
|
%
|
405
|
|
—
|
|
25
|
|
430
|
|
|||||||||
|
Non U.S. lines of credit
|
(g)
|
n/a
|
|
95
|
|
—
|
|
—
|
|
95
|
|
|||||||||
|
Non U.S. term loan
|
(g)
|
n/a
|
|
1,335
|
|
—
|
|
57
|
|
1,392
|
|
|||||||||
|
Other long term debt
|
(h)
|
135
|
|
—
|
|
13
|
|
148
|
|
|||||||||||
|
Capitalized interest
|
|
|
(470
|
)
|
—
|
|
—
|
|
(470
|
)
|
||||||||||
|
Totals
|
|
|
|
$
|
40,794
|
|
$
|
3,989
|
|
$
|
2,993
|
|
$
|
47,776
|
|
|||||
Minimum payments under debt agreements for the next five years are as follows:
$11,078
in
2018
,
$48,381
in
2019
,
$6,265
in
2020
,
$5,990
in
2021
,
$4,569
in
2022
and
$916,118
thereafter.
|
(a)
|
On May 18, 2016, in an unregistered offering through a private placement under Rule 144A, Griffon completed the add-on offering of
$125,000
principal amount of its
5.25%
senior notes due 2022, at
98.76%
of par, to Griffon's previous issuance of
$600,000
5.25%
senior notes due in
2022
, at par, which was completed on February 27, 2014 (collectively the “Senior Notes”). As of September 30, 2017, outstanding Senior Notes due totaled
$725,000
; interest is payable semi-annually on March 1 and September 1. The net proceeds of the add-on offering were used to pay down outstanding borrowings under Griffon's Revolving Credit Facility (the "Credit Agreement").
|
Proceeds from the
$600,000
5.25%
senior notes due in 2022 were used to redeem
$550,000
of
7.125%
senior notes due 2018, to pay a call and tender offer premium of
$31,530
and to make interest payments of
$16,716
, with the balance used to pay a portion of the related transaction fees and expenses. In connection with the issuance of the Senior Notes, all obligations under the
$550,000
of
7.125%
senior notes due in 2018 were discharged.
The Senior Notes are senior unsecured obligations of Griffon guaranteed by certain domestic subsidiaries, and subject to certain covenants, limitations and restrictions. On July 20, 2016 and June 18, 2014, Griffon exchanged all of the
$125,000
and
$600,000
Senior Notes, respectively, for substantially identical Senior Notes registered under the Securities Act of 1933 via an exchange offer. The fair value of the Senior Notes approximated
$737,688
on September 30, 2017 based upon quoted market prices (level 1 inputs). In connection with the issuance and exchange of the
$125,000
senior notes, Griffon capitalized
$3,016
of underwriting fees and other expenses in the quarter, which will amortize over the term of such notes; Griffon capitalized
$10,313
in connection with the previously issued
$600,000
senior notes.
On October 2, 2017, Griffon completed an add-on offering of
$275,000
aggregate principal amount of
5.25%
senior notes due 2022 in an unregistered offering through a private placement. The
$275,000
senior notes were issued under the same indenture pursuant to which Griffon previously issued
$725,000
in aggregate principal amount of its
5.25%
Senior Notes due 2022. As of October 2, 2017, outstanding Senior Notes due totaled
$1,000,000
; interest is payable semi-annually on March 1 and September 1. The net proceeds of the add-on offering were used to acquire ClosetMaid, with the remaining proceeds used to pay down outstanding borrowings under Griffon's Credit Agreement.
|
(b)
|
On March 22, 2016, Griffon amended its Credit Agreement to increase the credit facility from
$250,000
to
$350,000
, extend its maturity from March 13, 2020 to March 22, 2021, and modify certain other provisions of the facility. The facility includes a letter sub-facility with a limit of
$50,000
and a multi-currency sub-facility of
$50,000
. The Credit Agreement provides for
|
79
GRIFFON CORPORATION
NOTES TO CONSOLIDATED FINANCIAL STATEMENTS – (Continued)
(US dollars and non US currencies in thousands, except per share data)
same day borrowings of base rate loans. Borrowings under the Credit Agreement may be repaid and re-borrowed at any time, subject to final maturity of the facility or the occurrence or event of default under the Credit Agreement. Interest is payable on borrowings at either a LIBOR or base rate benchmark rate, in each case without a floor, plus an applicable margin, which adjusts based on financial performance. Current margins are
1.25%
for base rate loans and
2.25%
for LIBOR loans. The Credit Agreement has certain financial maintenance tests including a maximum total leverage ratio, a maximum senior secured leverage ratio and a minimum interest coverage ratio, as well as customary affirmative and negative covenants and events of default. The negative covenants place limits on Griffon's ability to, among other things, incur indebtedness, incur liens, and make restricted payments and investments. Borrowings under the Credit Agreement are guaranteed by Griffon’s material domestic subsidiaries and are secured, on a first priority basis, by substantially all domestic assets of the Company and the guarantors, and a pledge of not greater than
65%
of the equity interest in Griffon’s material, first-tier foreign subsidiaries (except that a lien on the assets of Griffon’s material domestic subsidiaries securing a limited amount of the debt under the credit agreement relating to Griffon's Employee Stock Ownership Plan ("ESOP") ranks pari passu with the lien granted on such assets under the Credit Agreement; see footnote (d) below). On October 2, 2017, Griffon further amended the Credit Agreement to modify the maximum total leverage covenant for the quarters ending December 31, 2017, through March 31, 2019, to provide additional financial and operating flexibility. At
September 30, 2017
, there were
$144,216
outstanding borrowings and standby letters of credit were
$13,890
under the Credit Agreement;
$191,894
was available, subject to certain loan covenants, for borrowing at that date.
|
(c)
|
On December 21, 2009, Griffon issued
$100,000
principal of
4%
convertible subordinated notes due 2017 (the “2017 Notes”). On July 14, 2016, Griffon announced that it would settle, upon conversion, up to
$125,000
of the conversion value of the 2017 Notes in cash, with amounts in excess of
$125,000
, if any, to be settled in shares of Griffon common stock. On January 17, 2017, Griffon settled the convertible debt for
$173,855
with
$125,000
in cash, utilizing borrowings under the Credit Agreement, and
$48,858
, or
1,954,993
shares of common stock issued from treasury.
|
|
(d)
|
In September 2015 and March 2016, Griffon entered into mortgage loans in the amount of
$32,280
and
$8,000
, respectively. The mortgage loans are secured by
four
properties occupied by Griffon's subsidiaries. The loans mature in
September 2025
, and April 2018, respectively, are collateralized by the specific properties financed and are guaranteed by Griffon. The loans bear interest at a rate of LIBOR plus
1.50%
. At September 30, 2017, mortgage loans outstanding relating to continuing operations was
$23,322
, net of issuance costs.
|
|
(e)
|
In August 2016, Griffon’s ESOP entered into an agreement that refinanced the existing ESOP loan into a new Term Loan in the amount of
$35,092
(the "Agreement"). The Agreement also provided for a Line Note with
$10,908
available to purchase shares of Griffon common stock in the open market. During 2017, Griffon's ESOP purchased
621,875
shares of common stock for a total of
$10,908
or
$17.54
per share, under a borrowing line that has now been fully utilized. On June 30, 2017, the Term Loan and Line Note were combined into a single Term Loan. The Term Loan bears interest at LIBOR plus
2.50%
. The Term Loan requires quarterly principal payments of
$569
with a balloon payment due at maturity on March 22, 2020. As of
September 30, 2017
,
$42,365
, net of issuance costs, was outstanding under the Term Loan. The Term Loan is secured by shares purchased with the proceeds of the loan and with a lien on a specific amount of Griffon assets (which lien ranks pari passu with the lien granted on such assets under the Credit Agreement) and is guaranteed by Griffon.
|
|
(f)
|
In October 2006, CBP entered into a capital lease totaling
$14,290
for real estate in Troy, Ohio. The lease matures in
2022
, bears interest at a fixed rate of
5.0%
, is secured by a mortgage on the real estate and is guaranteed by Griffon. As of September 30, 2016,
$5,207
was outstanding, net of issuance costs.
|
|
(g)
|
In November 2012, Garant G.P. (“Garant”) entered into a CAD
15,000
(
$12,033
as of September 30, 2017) revolving credit facility. The facility accrues interest at LIBOR (USD) or the Bankers Acceptance Rate (CDN) plus
1.3%
per annum (
2.63%
LIBOR USD and
2.65%
Bankers Acceptance Rate CDN as of
September 30, 2017
). The revolving facility matures in October 2019. Garant is required to maintain a certain minimum equity. As of
September 30, 2017
, there were
no
borrowings under the revolving credit facility with CAD
15,000
(
$12,033
as of
September 30, 2017
) available for borrowing.
|
In July 2016, Griffon Australia Holdings Pty Ltd and its Australian subsidiaries ("Griffon Australia") entered into an AUD
30,000
term loan and an AUD
10,000
revolver. The term loan refinanced
two
existing term loans and the revolver replaced two existing lines. In December 2016, the amount available under the revolver was increased from AUD
10,000
to AUD
20,000
and, in March 2017 the term loan commitment was increased by AUD
5,000
to AUD
33,500
. In September 2017, the term loan commitment was increased by AUD
15,000
to AUD
46,750
. The term loan requires quarterly principal payments
80
GRIFFON CORPORATION
NOTES TO CONSOLIDATED FINANCIAL STATEMENTS – (Continued)
(US dollars and non US currencies in thousands, except per share data)
of AUD
1,250
plus interest with a balloon payment of AUD
37,125
due upon maturity in June 2019, and accrues interest at Bank Bill Swap Bid Rate “BBSY” plus
2.00%
per annum (
3.76%
at
September 30, 2017
). As of
September 30, 2017
, the term had an outstanding balance of AUD
45,875
(
$35,943
as of September 30, 2017). The revolving facility matures in November 2018, but is renewable upon mutual agreement with the bank, and accrues interest at BBSY plus
2.0%
per annum (
3.65%
at September 30, 2017). At September 30, 2017, the revolver had an outstanding balance of AUD
12,000
(
$9,402
at September 30, 2017). The revolver and the term loan are both secured by substantially all of the assets of Griffon Australia and its subsidiaries. Griffon guarantees the term loan. Griffon Australia is required to maintain a certain minimum equity level and is subject to a maximum leverage ratio and a minimum fixed charges cover ratio.
(h) Other long-term debt primarily consists of a loan with the Pennsylvania Industrial Development Authority and capital leases.
At
September 30, 2017
, Griffon and its subsidiaries were in compliance with the terms and covenants of its credit and loan agreements.
Griffon offers defined contribution plans to most of its U.S. employees. In addition to employee contributions to the plans, Griffon makes contributions based upon various percentages of compensation and/or employee contributions, which were
$8,714
in
2017
,
$8,301
in
2016
and
$7,988
in
2015
.
The Company also provides healthcare and life insurance benefits for certain groups of retirees through several plans. For certain employees, the benefits are at fixed amounts per retiree and are partially contributory by the retiree. The post-retirement benefit obligation was
$2,014
and
$2,081
as of
September 30, 2017
and
2016
. The accumulated other comprehensive income (loss) for these plans was
$(107)
and
($140)
as of
September 30, 2017
and
2016
, respectively, and the
2017
and
2016
benefit expense was
$41
and
$57
, respectively. It is the Company’s practice to fund these benefits as incurred.
Griffon also has qualified and non-qualified defined benefit plans covering certain employees with benefits based on years of service and employee compensation. Over time, these amounts will be recognized as part of net periodic pension costs in the Consolidated Statements of Operations and Comprehensive Income (Loss).
Griffon is responsible for overseeing the management of the investments of the qualified defined benefit plan and uses the services of an investment manager to manage these assets based on agreed upon risk profiles. The primary objective of the qualified defined benefit plan is to secure participant retirement benefits. As such, the key objective in this plan’s financial management is to promote stability and, to the extent appropriate, growth in the funded status. Financial objectives are established in conjunction with a review of current and projected plan financial requirements. The fair values of a majority of the plan assets were determined by the plans’ trustee using quoted market prices for identical instruments (level 1 inputs) as of
September 30, 2017
and
2016
. The fair value of various other investments was determined by the plan’s trustee using direct observable market corroborated inputs, including quoted market prices for similar assets (level 2 inputs). There were no pension assets measured using level 3 inputs.
Effective January 1, 2012, the Clopay Pension Plan merged with the Ames True Temper Inc. Pension Plan. The merged qualified defined benefit plan was named the Clopay Ames Pension Plan (the “Clopay AMES Plan”).
The Clopay portion of the Clopay AMES Plan has been frozen to new entrants since December 2000. Certain employees who were part of the plan prior to December 2000 continued to accrue a service benefit through December 2010, at which time all plan participants stopped accruing service benefits.
The AMES portion of the Clopay AMES Plan has been frozen to all new entrants since November 2009 and stopped accruing benefits in December 2009.
The AMES supplemental executive retirement plan was frozen to new entrants and participants in the plan stopped accruing benefits in 2008.
In 2016, the Company changed the method used to estimate the service and interest components of net periodic benefit cost for pension and other post-retirement benefits from the single weighted-average discount rate to the spot rate method. There was no impact on the total benefit obligation.
81
GRIFFON CORPORATION
NOTES TO CONSOLIDATED FINANCIAL STATEMENTS – (Continued)
(US dollars and non US currencies in thousands, except per share data)
Griffon uses judgment to establish the assumptions used in determining the future liability of the plan, as well as the investment returns on the plan assets. The expected return on assets assumption used for pension expense was developed through analysis of historical market returns, current market conditions and past experience of plan investments. The long-term rate of return assumption represents the expected average rate of earnings on the funds invested, or to be invested, to provide for the benefits included in the benefit obligations. The assumption is based on several factors including historical market index returns, the anticipated long-term asset allocation of plan assets and the historical return. The discount rate assumption is determined by developing a yield curve based on high quality bonds with maturities matching the plans’ expected benefit payment stream. The plans’ expected cash flows are then discounted by the resulting year-by-year spot rates. A
10%
change in the discount rate, average wage increase or return on assets would not have a material effect on the financial statements of Griffon.
Net periodic costs (benefits) were as follows:
|
|
Defined Benefits for the Years Ended
September 30,
|
Supplemental Benefits for the Years
Ended September 30,
|
|||||||||||||||||||||
|
|
2017
|
2016
|
2015
|
2017
|
2016
|
2015
|
|||||||||||||||||
|
Net periodic (benefits) costs:
|
|
|
|
|
|
|
|
|
|
|
|
|
|||||||||||
|
Interest cost
|
$
|
4,892
|
|
$
|
5,465
|
|
$
|
7,526
|
|
$
|
715
|
|
$
|
1,243
|
|
$
|
1,302
|
|
|||||
|
Expected return on plan assets
|
(10,943
|
)
|
(10,934
|
)
|
(11,728
|
)
|
—
|
|
—
|
|
—
|
|
|||||||||||
|
Amortization of:
|
|
|
|
|
|
|
|
|
|
|
|
|
|||||||||||
|
Prior service costs
|
1
|
|
1
|
|
1
|
|
15
|
|
19
|
|
16
|
|
|||||||||||
|
Actuarial loss
|
1,980
|
|
1,131
|
|
1,008
|
|
1,347
|
|
1,224
|
|
1,157
|
|
|||||||||||
|
Total net periodic (benefits) costs
|
$
|
(4,070
|
)
|
$
|
(4,337
|
)
|
$
|
(3,193
|
)
|
$
|
2,077
|
|
$
|
2,486
|
|
$
|
2,475
|
|
|||||
The tax benefits in
2017
,
2016
and
2015
for the amortization of pension costs in Other comprehensive income (loss) were
$1,170
,
$831
and
$764
, respectively.
The estimated net actuarial loss and prior service cost that will be amortized from AOCI into Net periodic pension cost during
2018
is
$2,132
and
$21
, respectively.
The weighted-average assumptions used in determining the net periodic (benefits) costs were as follows:
|
|
Defined Benefits for the Years Ended
September 30,
|
Supplemental Benefits for the Years
Ended September 30,
|
|||||||||||||||
|
|
2017
|
2016
|
2015
|
2017
|
2016
|
2015
|
|||||||||||
|
Discount rate
|
3.64
|
%
|
3.42
|
%
|
3.98
|
%
|
3.18
|
%
|
2.86
|
%
|
3.50
|
%
|
|||||
|
Expected return on assets
|
7.25
|
%
|
7.50
|
%
|
8.00
|
%
|
—
|
%
|
—
|
%
|
—
|
%
|
|||||
82
GRIFFON CORPORATION
NOTES TO CONSOLIDATED FINANCIAL STATEMENTS – (Continued)
(US dollars and non US currencies in thousands, except per share data)
Plan assets and benefit obligation of the defined and supplemental benefit plans were as follows:
|
|
Defined Benefits at
September 30,
|
Supplemental Benefits at
September 30,
|
|||||||||||||
|
|
2017
|
2016
|
2017
|
2016
|
|||||||||||
|
Change in benefit obligation:
|
|
|
|
|
|
|
|
|
|||||||
|
Benefit obligation at beginning of fiscal year
|
$
|
189,156
|
|
$
|
184,846
|
|
$
|
35,774
|
|
$
|
37,305
|
|
|||
|
Interest cost
|
4,892
|
|
5,465
|
|
715
|
|
1,243
|
|
|||||||
|
Benefits paid
|
(10,393
|
)
|
(10,460
|
)
|
(4,057
|
)
|
(4,060
|
)
|
|||||||
|
Actuarial (gain) loss
|
(9,318
|
)
|
9,305
|
|
195
|
|
1,286
|
|
|||||||
|
Benefit obligation at end of fiscal year
|
174,337
|
|
189,156
|
|
32,627
|
|
35,774
|
|
|||||||
|
Change in plan assets:
|
|
|
|
|
|
|
|
|
|||||||
|
Fair value of plan assets at beginning of fiscal year
|
144,316
|
|
144,625
|
|
—
|
|
—
|
|
|||||||
|
Actual return on plan assets
|
13,152
|
|
10,151
|
|
—
|
|
—
|
|
|||||||
|
Company contributions
|
3,747
|
|
—
|
|
4,057
|
|
4,060
|
|
|||||||
|
Benefits paid
|
(10,393
|
)
|
(10,460
|
)
|
(4,057
|
)
|
(4,060
|
)
|
|||||||
|
Fair value of plan assets at end of fiscal year
|
150,822
|
|
144,316
|
|
—
|
|
—
|
|
|||||||
|
Projected benefit obligation in excess of plan assets
|
$
|
(23,515
|
)
|
$
|
(44,840
|
)
|
$
|
(32,627
|
)
|
$
|
(35,774
|
)
|
|||
|
Amounts recognized in the statement of financial position consist of:
|
|
|
|
|
|
|
|
|
|||||||
|
Accrued liabilities
|
$
|
—
|
|
$
|
—
|
|
$
|
(3,984
|
)
|
$
|
(4,030
|
)
|
|||
|
Other liabilities (long-term)
|
(23,515
|
)
|
(44,840
|
)
|
(28,646
|
)
|
(31,744
|
)
|
|||||||
|
Total Liabilities
|
(23,515
|
)
|
(44,840
|
)
|
(32,630
|
)
|
(35,774
|
)
|
|||||||
|
Net actuarial losses
|
24,608
|
|
38,115
|
|
20,045
|
|
21,195
|
|
|||||||
|
Prior service cost
|
—
|
|
1
|
|
42
|
|
56
|
|
|||||||
|
Deferred taxes
|
(9,069
|
)
|
(13,341
|
)
|
(7,486
|
)
|
(7,438
|
)
|
|||||||
|
Total Accumulated other comprehensive loss, net of tax
|
15,539
|
|
24,775
|
|
12,601
|
|
13,813
|
|
|||||||
|
Net amount recognized at September 30,
|
$
|
(7,976
|
)
|
$
|
(20,065
|
)
|
$
|
(20,029
|
)
|
$
|
(21,961
|
)
|
|||
|
Accumulated benefit obligations
|
$
|
174,337
|
|
$
|
189,156
|
|
$
|
32,627
|
|
$
|
35,774
|
|
|||
|
Information for plans with accumulated benefit obligations in excess of plan assets:
|
|
|
|
|
|
|
|
|
|||||||
|
ABO
|
$
|
174,337
|
|
$
|
189,156
|
|
$
|
32,627
|
|
$
|
35,774
|
|
|||
|
PBO
|
174,337
|
|
189,156
|
|
32,627
|
|
35,774
|
|
|||||||
|
Fair value of plan assets
|
150,822
|
|
144,316
|
|
—
|
|
—
|
|
|||||||
The weighted-average assumptions used in determining the benefit obligations were as follows:
|
|
Defined Benefits at
September 30,
|
Supplemental Benefits at
September 30,
|
|||||||||
|
|
2017
|
2016
|
2017
|
2016
|
|||||||
|
Weighted average discount rate
|
3.64
|
%
|
3.42
|
%
|
3.18
|
%
|
2.86
|
%
|
|||
83
GRIFFON CORPORATION
NOTES TO CONSOLIDATED FINANCIAL STATEMENTS – (Continued)
(US dollars and non US currencies in thousands, except per share data)
The actual and weighted-average asset allocation for qualified benefit plans were as follows:
|
|
At September 30,
|
|
||||||
|
|
2017
|
2016
|
Target
|
|||||
|
Cash and equivalents
|
18.0
|
%
|
18.0
|
%
|
—
|
%
|
||
|
Equity securities
|
58.0
|
%
|
57.7
|
%
|
63.0
|
%
|
||
|
Fixed income
|
19.3
|
%
|
19.3
|
%
|
37.0
|
%
|
||
|
Other
|
4.7
|
%
|
5.0
|
%
|
—
|
%
|
||
|
Total
|
100.0
|
%
|
100.0
|
%
|
100.0
|
%
|
||
Estimated future benefit payments to retirees, which reflect expected future service, are as follows:
|
For the years ending September 30,
|
Defined
Benefits
|
Supplemental Benefits
|
|||||
|
2018
|
$
|
10,568
|
|
$
|
4,057
|
|
|
|
2019
|
10,694
|
|
3,984
|
|
|||
|
2020
|
10,836
|
|
3,784
|
|
|||
|
2021
|
10,934
|
|
3,574
|
|
|||
|
2022
|
10,913
|
|
3,356
|
|
|||
|
2023 through 2027
|
53,926
|
|
12,035
|
|
|||
During 2018, Griffon expects to contribute
$4,057
in payments related to Supplemental Benefits that will be funded from the general assets of Griffon. Griffon expects to contribute
$2,449
to the Defined Benefit plan in
2018
.
The Clopay AMES Plan is covered by the Pension Protection Act of 2006. The Adjusted Funding Target Attainment Percent for the plan as of January 1, 2017 was
95.5%
. Since the plan was in excess of the
80%
funding threshold there were no plan restrictions. The expected level of
2018
catch up contributions is
$0
.
The following is a description of the valuation methodologies used for plan assets measured at fair value:
Short-term investment funds
– The fair value is determined using the Net Asset Value (“NAV”) provided by the administrator of the fund. The NAV is based on the value of the underlying assets owned by the fund, minus its liabilities, and then divided by the number of shares outstanding. The NAV is a quoted price in a market that is not active and is primarily classified as Level 2. These investments can be liquidated on demand.
Government and agency securities
– When quoted market prices are available in an active market, the investments are classified as Level 1. When quoted market prices are not available in an active market, the investments are classified as Level 2.
Equity securities
– The fair values reflect the closing price reported on a major market where the individual mutual fund securities are traded in equity securities. These investments are classified within Level 1 of the valuation hierarchy.
Debt securities
– The fair values are based on a compilation of primarily observable market information or a broker quote in a non-active market where the individual mutual fund securities are invested in debt securities. These investments are primarily classified within Level 2 of the valuation hierarchy.
Commingled funds
– The fair values are determined using NAV provided by the administrator of the fund. The NAV is based on the value of the underlying assets owned by the trust/entity, minus its liabilities, and then divided by the number of shares outstanding. These investments are generally classified within Level 2 of the valuation hierarchy and can be liquidated on demand.
Interest in limited partnerships and hedge funds
- One limited partnership investment is a private equity fund and the fair value is determined by the fund managers based on the estimated value of the various holdings of the fund portfolio. These investments are classified within Level 2 of the valuation hierarchy.
84
GRIFFON CORPORATION
NOTES TO CONSOLIDATED FINANCIAL STATEMENTS – (Continued)
(US dollars and non US currencies in thousands, except per share data)
The following table presents the fair values of Griffon’s pension and post-retirement plan assets by asset category:
|
At September 30, 2017
|
Quoted Prices in
Active Markets for
Identical Assets
(Level 1)
|
Significant Other
Observable Inputs
(Level 2)
|
Significant
Unobservable
Inputs
(Level 3)
|
Total
|
|||||||||||
|
Cash and equivalents
|
$
|
27,156
|
|
$
|
—
|
|
$
|
—
|
|
$
|
27,156
|
|
|||
|
Short-term investment funds
|
—
|
|
—
|
|
—
|
|
—
|
|
|||||||
|
Government agency securities
|
—
|
|
—
|
|
—
|
|
—
|
|
|||||||
|
Debt instruments
|
14,520
|
|
—
|
|
—
|
|
14,520
|
|
|||||||
|
Equity securities
|
40,423
|
|
—
|
|
—
|
|
40,423
|
|
|||||||
|
Commingled funds
|
—
|
|
62,907
|
|
—
|
|
62,907
|
|
|||||||
|
Limited partnerships and hedge fund investments
|
—
|
|
5,816
|
|
—
|
|
5,816
|
|
|||||||
|
Total
|
$
|
82,099
|
|
$
|
68,723
|
|
$
|
—
|
|
$
|
150,822
|
|
|||
|
At September 30, 2016
|
Quoted Prices in
Active Markets for
Identical Assets
(Level 1)
|
Significant Other
Observable Inputs
(Level 2)
|
Significant
Unobservable
Inputs
(Level 3)
|
Total
|
|||||||||||
|
Cash and equivalents
|
$
|
26,008
|
|
$
|
—
|
|
$
|
—
|
|
$
|
26,008
|
|
|||
|
Debt instruments
|
14,122
|
|
—
|
|
—
|
|
14,122
|
|
|||||||
|
Equity securities
|
44,759
|
|
—
|
|
—
|
|
44,759
|
|
|||||||
|
Commingled funds
|
—
|
|
53,703
|
|
—
|
|
53,703
|
|
|||||||
|
Limited partnerships and hedge fund investments
|
—
|
|
5,724
|
|
—
|
|
5,724
|
|
|||||||
|
Total
|
$
|
84,889
|
|
$
|
59,427
|
|
$
|
—
|
|
$
|
144,316
|
|
|||
Griffon has an ESOP that covers substantially all domestic employees. All U.S. employees of Griffon, who are not members of a collective bargaining unit, automatically become eligible to participate in the plan on the October 1
st
following completion of
one year
of service. Securities are allocated to participants’ individual accounts based on the proportion of each participant’s aggregate compensation (not to exceed
$270
for the plan year ended
September 30, 2017
), to the total of all participants’ compensation. Shares of the ESOP which have been allocated to employee accounts are charged to expense based on the fair value of the shares transferred and are treated as outstanding in determining earnings per share. Dividends paid on shares held by the ESOP are used to offset debt service on ESOP Loans. Dividends paid on shares held in participant accounts are utilized to allocate shares from the aggregate number of shares to be released, equal in value to those dividends, based on the closing price of Griffon common stock on the dividend payment date. Compensation expense under the ESOP was
$5,643
in
2017
,
$3,689
in
2016
and
$3,400
in
2015
. The cost of the shares held by the ESOP and not yet allocated to employees is reported as a reduction of Shareholders’ Equity. The fair value of the unallocated ESOP shares as of
September 30, 2017
and
2016
based on the closing stock price of Griffon’s stock was
$69,394
and
$47,366
, respectively. The ESOP shares were as follows:
|
|
At September 30,
|
||||
|
|
2017
|
2016
|
|||
|
Allocated shares
|
2,676,486
|
|
2,596,016
|
|
|
|
Unallocated shares
|
3,125,850
|
|
2,784,579
|
|
|
|
|
5,802,336
|
|
5,380,595
|
|
|
85
GRIFFON CORPORATION
NOTES TO CONSOLIDATED FINANCIAL STATEMENTS – (Continued)
(US dollars and non US currencies in thousands, except per share data)
Income taxes have been based on the following components of Income before taxes from continuing operations:
|
|
For the Years Ended September 30,
|
||||||||||
|
|
2017
|
2016
|
2015
|
||||||||
|
Domestic
|
$
|
(1,339
|
)
|
$
|
23,163
|
|
$
|
6,184
|
|
||
|
Non-U.S.
|
18,037
|
|
9,050
|
|
12,882
|
|
|||||
|
|
$
|
16,698
|
|
$
|
32,213
|
|
$
|
19,066
|
|
||
Provision (benefit) for income taxes on income was comprised of the following from continuing operations:
|
|
For the Years Ended September 30,
|
||||||||||
|
|
2017
|
2016
|
2015
|
||||||||
|
Current
|
$
|
(3,426
|
)
|
$
|
6,388
|
|
$
|
3,098
|
|
||
|
Deferred
|
2,341
|
|
6,044
|
|
3,674
|
|
|||||
|
Total
|
$
|
(1,085
|
)
|
$
|
12,432
|
|
$
|
6,772
|
|
||
|
U.S. Federal
|
$
|
(6,689
|
)
|
$
|
4,358
|
|
$
|
1,643
|
|
||
|
State and local
|
3,307
|
|
3,287
|
|
2,237
|
|
|||||
|
Non-U.S.
|
2,297
|
|
4,787
|
|
2,892
|
|
|||||
|
Total provision
|
$
|
(1,085
|
)
|
$
|
12,432
|
|
$
|
6,772
|
|
||
Griffon's Income tax provision for the years ended September 30, 2017 and 2016 included a
$4,440
and
$2,193
benefit, respectively, from the early adoption of the new FASB accounting guidance which now requires excess tax benefits from vesting of equity awards to be recognized within income tax expense. Under this guidance all excess tax benefits (“windfalls”) and deficiencies (“shortfalls”) related to employee stock compensation are recognized within income tax expense. Under prior guidance windfalls were recognized to Additional Paid In Capital and shortfalls were only recognized to the extent they exceed the pool of windfall tax benefits.
Griffon’s Income tax provision included benefits of
($122)
in
2017
,
($2,172)
in
2016
, and
($517)
in
2015
reflecting the reversal of previously recorded tax liabilities primarily due to the resolution of various tax audits and the closing of certain statutes for prior years’ tax returns.
86
GRIFFON CORPORATION
NOTES TO CONSOLIDATED FINANCIAL STATEMENTS – (Continued)
(US dollars and non US currencies in thousands, except per share data)
Differences between the effective income tax rate applied to Income and U.S. Federal income statutory rate from continuing operations were as follows:
|
|
For the Years Ended September 30,
|
|||||||
|
|
2017
|
2016
|
2015
|
|||||
|
U.S. Federal income tax provision (benefit) rate
|
35.0
|
%
|
35.0
|
%
|
35.0
|
%
|
||
|
State and local taxes, net of Federal benefit
|
12.4
|
%
|
6.6
|
%
|
13.0
|
%
|
||
|
Non-U.S. taxes - foreign permanent items and taxes
|
(12.4
|
)%
|
(1.6
|
)%
|
(8.0
|
)%
|
||
|
Non-U.S. tax true-up
|
(11.4
|
)%
|
—
|
%
|
—
|
%
|
||
|
Change in domestic manufacturing deduction
|
(5.8
|
)%
|
—
|
%
|
—
|
%
|
||
|
Change in tax contingency reserves
|
0.7
|
%
|
(6.3
|
)%
|
(1.7
|
)%
|
||
|
Repatriation of foreign earnings
|
—
|
%
|
—
|
%
|
2.5
|
%
|
||
|
Change in valuation allowance
|
(0.6
|
)%
|
(0.6
|
)%
|
(12.5
|
)%
|
||
|
Non-deductible/non-taxable items, net
|
8.3
|
%
|
2.6
|
%
|
(2.3
|
)%
|
||
|
Research and U.S. foreign tax credits
|
(3.6
|
)%
|
8.8
|
%
|
(0.9
|
)%
|
||
|
Share based compensation
|
(26.6
|
)%
|
(5.7
|
)%
|
—
|
%
|
||
|
Other
|
(2.5
|
)%
|
(0.2
|
)%
|
10.4
|
%
|
||
|
Effective tax provision (benefit) rate
|
(6.5
|
)%
|
38.6
|
%
|
35.5
|
%
|
||
The tax effect of temporary differences that give rise to future deferred tax assets and liabilities are as follows:
|
|
At September 30,
|
||||||
|
|
2017
|
2016
|
|||||
|
Deferred tax assets:
|
|
|
|
|
|||
|
Bad debt reserves
|
$
|
2,509
|
|
$
|
2,156
|
|
|
|
Inventory reserves
|
7,615
|
|
9,158
|
|
|||
|
Deferred compensation (equity compensation and defined benefit plans)
|
27,430
|
|
39,866
|
|
|||
|
Compensation benefits
|
6,111
|
|
5,770
|
|
|||
|
Insurance reserve
|
2,985
|
|
3,285
|
|
|||
|
Restructuring reserve
|
29
|
|
431
|
|
|||
|
Warranty reserve
|
2,893
|
|
2,352
|
|
|||
|
Net operating loss
|
37,383
|
|
31,732
|
|
|||
|
Tax credits
|
1,866
|
|
3,573
|
|
|||
|
Other reserves and accruals
|
7,658
|
|
4,238
|
|
|||
|
|
96,479
|
|
102,561
|
|
|||
|
Valuation allowance
|
(17,466
|
)
|
(12,832
|
)
|
|||
|
Total deferred tax assets
|
79,013
|
|
89,729
|
|
|||
|
Deferred tax liabilities:
|
|
|
|
|
|||
|
Deferred income
|
(1,862
|
)
|
(3,389
|
)
|
|||
|
Goodwill and intangibles
|
(70,560
|
)
|
(72,907
|
)
|
|||
|
Property, plant and equipment
|
(51,488
|
)
|
(46,391
|
)
|
|||
|
Interest
|
—
|
|
(496
|
)
|
|||
|
Deferred gain on assets held for sale
|
(16,300
|
)
|
—
|
|
|||
|
Other
|
(1,016
|
)
|
(551
|
)
|
|||
|
Total deferred tax liabilities
|
(141,226
|
)
|
(123,734
|
)
|
|||
|
Net deferred tax liabilities
|
$
|
(62,213
|
)
|
$
|
(34,005
|
)
|
|
The increase in the valuation allowance of
$4,634
is primarily the result of a valuation allowance on accumulated Germany net operating losses resulting from management's assessment of current and future operational performance and related restructuring
87
GRIFFON CORPORATION
NOTES TO CONSOLIDATED FINANCIAL STATEMENTS – (Continued)
(US dollars and non US currencies in thousands, except per share data)
efforts partially offset by a release related to expired tax credits. The deferred tax gain on assets held for sale results from the book versus tax outside basis difference. The Company has allocated this deferred tax liability and related tax expense to discontinued operations.
The components of the net deferred tax liability, by balance sheet account, were as follows:
|
|
At September 30,
|
||||||
|
|
2017
|
2016
|
|||||
|
Other assets
|
$
|
6
|
|
$
|
3
|
|
|
|
Assets of discontinued operations held for sale
|
6,745
|
|
7,271
|
|
|||
|
Other liabilities
|
(58,505
|
)
|
(30,476
|
)
|
|||
|
Liabilities of discontinued operations held for sale
|
(12,584
|
)
|
(11,449
|
)
|
|||
|
Liabilities of discontinued operations not held for sale
|
2,125
|
|
646
|
|
|||
|
Net deferred liability
|
$
|
(62,213
|
)
|
$
|
(34,005
|
)
|
|
At both
September 30, 2017
and
2016
, Griffon has a policy election to indefinitely reinvest the undistributed earnings of foreign subsidiaries with operations outside the U.S. Griffon considers the earnings of these foreign subsidiaries to be indefinitely invested outside the U.S. on the basis of estimates that future domestic cash generation will be sufficient to meet future domestic cash needs. The majority of the amounts held outside the U.S. are generally utilized to support non U.S. liquidity needs in order to fund operations and growth of the foreign subsidiaries, and for funding of acquisitions. Griffon has not recorded deferred income taxes on the undistributed earnings of its non-U.S. subsidiaries because of management’s ability and intent to indefinitely reinvest such earnings outside the U.S. At
September 30, 2017
, Griffon’s share of the undistributed earnings of the non-U.S. subsidiaries amounted to approximately
$49,659
. It is not practicable to estimate the amount of deferred tax liability related to investments in these foreign subsidiaries. If a determination is made to repatriate some or all of these foreign earnings, the income tax provision would be adjusted in the period of that determination to accrue for the taxes payable on such earnings.
At
September 30, 2017
and
2016
, Griffon had loss carryforwards for U.S. tax purposes of
$1,264
and
$0
, respectively, and non-U.S. tax purposes of
$7,941
and
$6,900
, respectively. The U.S. losses expire beginning in 2029. The non-U.S. loss carryforwards are available for carryforward indefinitely.
At
September 30, 2017
and
2016
, Griffon had state and local loss carryforwards of
$114,837
and
$104,254
, respectively, which expire in varying amounts through
2036
.
At
September 30, 2017
and
2016
, Griffon had federal tax credit carryforwards of
$1,762
and
$3,199
, respectively, which expire beginning in
2020
.
We believe it is more likely than not that the benefit from certain state net operating losses and federal tax credits will not be realized. In recognition of this risk, we have provided a valuation allowance as of September 30, 2017 and 2016 of
$1,343
and
$1,752
, respectively, on the deferred tax assets relating to these state net operating loss carryforwards and federal credits. If our assumptions change and we determine we will be able to realize these state net operating loss carryforwards or federal credits, the benefits relating to the reversal of the valuation allowance will be recognized as a reduction of income tax expense.
If certain substantial changes in Griffon's ownership occur, there would be an annual limitation on the amount of carryforward(s) that can be utilized.
Griffon files U.S. Federal, state and local tax returns, as well as applicable returns in Canada, Australia, Ireland and other non-U.S. jurisdictions. Griffon’s U.S. Federal income tax returns are no longer subject to income tax examination for years before 2012. Griffon's major U.S. state and other non-U.S. jurisdictions are no longer subject to income tax examinations for years before 2011. Various U.S. state and non-U.S. statutory tax audits are currently underway.
The following is a roll forward of unrecognized tax benefits:
88
GRIFFON CORPORATION
NOTES TO CONSOLIDATED FINANCIAL STATEMENTS – (Continued)
(US dollars and non US currencies in thousands, except per share data)
|
Balance at September 30, 2015
|
$
|
6,613
|
|
|
Additions based on tax positions related to the current year
|
263
|
|
|
|
Reductions based on tax positions related to prior years
|
(1,082
|
)
|
|
|
Lapse of Statutes
|
(1,085
|
)
|
|
|
Balance at September 30, 2016
|
4,709
|
|
|
|
Additions based on tax positions related to the current year
|
177
|
|
|
|
Additions based on tax positions related to prior years
|
69
|
|
|
|
Reductions based on tax positions related to prior years
|
(8
|
)
|
|
|
Lapse of Statutes
|
(122
|
)
|
|
|
Balance at Balance at September 30, 2017
|
$
|
4,825
|
|
If recognized, the amount of potential tax benefits that would impact Griffon’s effective tax rate is
$1,553
. Griffon recognizes potential accrued interest and penalties related to unrecognized tax benefits in income tax expense. At
September 30, 2017
and
2016
, the combined amount of accrued interest and penalties related to tax positions taken or to be taken on Griffon’s tax returns and recorded as part of the reserves for uncertain tax positions was
$174
and
$166
, respectively. Griffon cannot reasonably estimate the extent to which existing liabilities for uncertain tax positions may increase or decrease within the next twelve months as a result of the progression of ongoing tax audits or other events. Griffon believes that it has adequately provided for all open tax years by tax jurisdiction.
During
2017
,
2016
and 2015, the Company declared and paid dividends totaling
$0.24
per share,
$0.20
per share and
$0.16
per share, respectively. The Company currently intends to pay dividends each quarter; however, payment of dividends is determined by the Board of Directors at its discretion based on various factors, and no assurance can be provided as to the payment of future dividends.
On November 15, 2017, the Board of Directors declared a cash dividend of
$0.07
per share, payable on December 21, 2017 to shareholders of record as of the close of business on November 29, 2017.
On January 29, 2016, shareholders approved the Griffon Corporation 2016 Equity Incentive Plan ("Incentive Plan") under which awards of performance shares, performance units, stock options, stock appreciation rights, restricted shares, restricted stock units, deferred shares and other stock-based awards may be granted. Options granted under the Incentive Plan may be either “incentive stock options” or nonqualified stock options, generally expire
ten years
after the date of grant and are granted at an exercise price of not less than
100%
of the fair market value at the date of grant. The maximum number of shares of common stock available for award under the Incentive Plan is
2,350,000
(
600,000
of which may be issued as incentive stock options), plus (i) any shares reserved for issuance under the 2011 Equity Incentive Plan as of the effective date of the Incentive Plan, and (ii) any shares underlying awards outstanding on such effective date under the 2011 Incentive Plan that are canceled or forfeited. As of
September 30, 2017
,
1,276,824
shares were available for grant.
All grants outstanding under former equity plans will continue under their terms;
no
additional awards will be granted under such plans.
Compensation expense for restricted stock and restricted stock units ("RSUs") is recognized ratably over the required service period based on the fair value of the grant, calculated as the number of shares (or RSUs) granted multiplied by the stock price on date of grant, and for performance shares (or performance RSUs), the likelihood of achieving the performance criteria. Compensation cost related to stock-based awards with graded vesting, generally over a period of
three
to
four years
, is recognized using the straight-line attribution method and recorded within Selling, general and administrative expenses. The following table summarizes the Company’s compensation expense relating to all stock-based incentive plans:
89
GRIFFON CORPORATION
NOTES TO CONSOLIDATED FINANCIAL STATEMENTS – (Continued)
(US dollars and non US currencies in thousands, except per share data)
|
For the Years Ended September 30,
|
|||||||||||
|
2017
|
2016
|
2015
|
|||||||||
|
Pre-tax compensation expense
|
$
|
8,090
|
|
$
|
10,136
|
|
$
|
11,110
|
|
||
|
Tax benefit
|
(2,836
|
)
|
(3,553
|
)
|
(4,000
|
)
|
|||||
|
Total stock-based compensation expense, net of tax
|
$
|
5,254
|
|
$
|
6,583
|
|
$
|
7,110
|
|
||
All stock options are vested. A summary of stock option activity for the year ended
September 30, 2017
is as follows:
|
|
Options
|
|||||||||||
|
|
Shares
|
Weighted
Average
Exercise
Price
|
Weighted
Average
Contractual
Term (Years)
|
Aggregated
Intrinsic Value |
||||||||
|
Outstanding and Exercisable at September 30, 2016
|
356,000
|
|
$
|
19.91
|
|
|
|
|
||||
|
Exercised
|
(5,000
|
)
|
14.78
|
|
||||||||
|
Forfeited/Expired
|
(1,000
|
)
|
14.78
|
|
|
|
|
|||||
|
Outstanding and Exercisable at September 30, 2017
|
350,000
|
|
20.00
|
|
1.0
|
$
|
770
|
|
||||
|
|
Options Outstanding & Exercisable
|
||||||
|
Range of
Exercises Prices
|
Shares
|
Weighted
Average
Exercise
Price
|
Weighted
Average
Contractual
Term (Years)
|
||||
|
$20.00
|
350,000
|
|
20.00
|
|
1.0
|
||
A summary of restricted stock activity, inclusive of restricted stock units, for the year ended
September 30, 2017
, is as follows:
|
|
Shares
|
Weighted Average
Grant- Date Fair Value
|
||||
|
Unvested at September 30, 2016
|
2,868,520
|
|
$
|
12.10
|
|
|
|
Granted
|
869,194
|
|
17.87
|
|
||
|
Vested
|
(1,259,561
|
)
|
23.42
|
|
||
|
Forfeited
|
(222,357
|
)
|
15.72
|
|
||
|
Unvested at September 30, 2017
|
2,255,796
|
|
13.65
|
|
||
The fair value of restricted stock which vested during the year ended September 30, 2017, 2016, and 2015 was
$29,508
,
$23,965
and
$5,068
, respectively.
Unrecognized compensation expense related to non-vested shares of restricted stock was
$16,132
at
September 30, 2017
and will be recognized over a weighted average vesting period of
2.5
years.
At
September 30, 2017
, a total of approximately
3,882,620
shares of Griffon’s authorized Common Stock were reserved for issuance in connection with stock compensation plans.
During the first quarter of 2017, Griffon granted
300,494
shares of restricted stock, subject to certain performance conditions, with vesting periods of
three years
, with a total fair value of
$6,055
, or a weighted average fair value of
$20.15
per share. During the second quarter of 2017, Griffon granted
528,000
shares of restricted stock to
two
senior executives with a vesting period of
four
years and a
two
year post-vesting holding period, subject to the achievement of certain absolute and relative performance conditions
90
GRIFFON CORPORATION
NOTES TO CONSOLIDATED FINANCIAL STATEMENTS – (Continued)
(US dollars and non US currencies in thousands, except per share data)
relating to the price of Griffon's common stock. The Monte Carlo Simulation model was chosen to value the two senior executive awards; the total fair value of these restricted shares is approximately
$8,500
, or a weighted average fair value of
$16.10
. The grants issued to two senior executive are subject to the achievement of certain absolute and relative performance conditions relating to the price of Griffon’s common stock. So long as the minimum performance condition is attained, the amount of shares that can vest will range from
384,000
to
528,000
. Also, during the second quarter Griffon granted
40,700
shares with a vesting period of
three
years and a fair value of
$618
, or a weighted average fair value of
$15.18
per share. During the third and fourth quarters of 2017,
no
shares of restricted stock were granted.
On each of July 30, 2015 and August 3, 2016, Griffon’s Board of Directors authorized the repurchase of up to
$50,000
of Griffon’s outstanding common stock. Under these share repurchase programs, the Company may purchase shares of its common stock, depending upon market conditions, in open market or privately negotiated transactions, including pursuant to a 10b5-1 plan. Shares repurchased are recorded at cost. During 2017, Griffon purchased
129,000
shares of common stock under the these repurchase programs, for a total of
$2,201
or
$17.06
per share. From August 2011 and through September 30, 2017, Griffon repurchased
20,429,298
shares of common stock, for a total of
$261,621
or
$12.81
per share, under Board authorized share repurchase programs (which repurchases included exhausting the remaining availability under a Board authorized repurchase program that was in existence prior to 2011). This included the repurchase of
15,984,854
shares on the open market, as well as the December 10, 2013 repurchase of
4,444,444
shares from GS Direct for
$50,000
, or
$11.25
per share. At September 30, 2017, an aggregate of
$49,437
remains under Griffon's Board authorized repurchase authorizations.
In addition to the repurchases under Board authorized programs, during
2017
,
586,219
shares, with a market value of
$13,640
, or
$23.27
per share, were withheld to settle employee taxes due upon the vesting of restricted stock.
On December 10, 2013, Griffon repurchased
4,444,444
shares of its common stock for
$50,000
from GS Direct, L.L.C. (“GS Direct”), an affiliate of The Goldman Sachs Group, Inc. The repurchase was effected in a private transaction at a per share price of
$11.25
, an approximate
9.2%
discount to the stock’s closing price on November 12, 2013, the day before announcement of the transaction. The transaction was exclusive of the Company´s August 2011,
$50,000
authorized share repurchase program. After closing the transaction, GS Direct continued to hold approximately
5.56
million shares (approximately
10%
of the shares outstanding at such time) of Griffon’s common stock. Subject to certain exceptions, if GS Direct intends to sell its remaining shares of Griffon common stock at any time prior to December 31, 2018, it will first negotiate in good faith to sell such shares to the Company.
During the year ended September 30, 2017 , Griffon's ESOP purchased
621,875
shares of common stock for a total of
$10,908
or
$17.54
per share, under a borrowing line that has now been fully utilized.
Operating leases
Griffon rents real property and equipment under operating leases expiring at various dates. Most of the real property leases have escalation clauses related to increases in real property taxes. Rent expense for all operating leases totaled approximately
$26,297
,
$26,180
and
$26,273
in
2017
,
2016
and
2015
, respectively. Aggregate future minimum lease payments for operating leases at
September 30, 2017
are
$27,282
in
2018
,
$24,808
in
2019
,
$20,104
in
2020
,
$11,692
in
2021
,
$7,707
in
2022
and
$14,559
thereafter.
Purchase Commitments
Purchase obligations are generally for the purchase of goods and services in the ordinary course of business. Griffon uses blanket purchase orders to communicate expected requirements to certain vendors. Purchase obligations reflect those purchase orders where the commitment is considered to be firm. Purchase obligations that extend beyond 2017 are principally related to long-term contracts received from customers of Telephonics. Aggregate future minimum purchase obligations at September 30, 2017 are
$209,924
in 2018,
$10,943
in 2019,
$180
in 2020,
$573
in 2021 and
$1
in 2022.
Legal and environmental
Department of Environmental Conservation of New York State (“DEC”), with ISC Properties, Inc.
Lightron Corporation (“Lightron”), a wholly-owned subsidiary of Griffon, once conducted operations at a location in Peekskill in the Town of Cortlandt, New York (the “Peekskill Site”) owned by ISC Properties, Inc. (“ISC”), a wholly-owned subsidiary of Griffon. ISC sold the Peekskill Site in November 1982.
91
GRIFFON CORPORATION
NOTES TO CONSOLIDATED FINANCIAL STATEMENTS – (Continued)
(US dollars and non US currencies in thousands, except per share data)
Subsequently, ISC was advised by the DEC that random sampling at the Peekskill Site and in a creek near the Peekskill Site indicated concentrations of solvents and other chemicals common to Lightron’s prior plating operations. ISC then entered into a consent order with the DEC in 1996 (the “Consent Order”) to perform a remedial investigation and prepare a feasibility study. After completing the initial remedial investigation pursuant to the Consent Order, ISC was required by the DEC, and did accordingly conduct over the next several years, supplemental remedial investigations, including soil vapor investigations, under the Consent Order.
In April 2009, the DEC advised ISC’s representatives that both the DEC and the New York State Department of Health had reviewed and accepted an August 2007 Remedial Investigation Report and an Additional Data Collection Summary Report dated January 30, 2009. With the acceptance of these reports, ISC completed the remedial investigation required under the Consent Order and was authorized, accordingly, by the DEC to conduct the Feasibility Study required by the Consent Order. Pursuant to the requirements of the Consent Order and its obligations thereunder, ISC, without acknowledging any responsibility to perform any remediation at the Site, submitted to the DEC in August 2009, a draft feasibility study which recommended for the soil, groundwater and sediment media, remediation alternatives having a current net capital cost value, in the aggregate, of approximately
$5,000
. In February 2011, DEC advised ISC it has accepted and approved the feasibility study. Accordingly, ISC has
no
further obligations under the consent order.
Upon acceptance of the feasibility study, DEC issued a Proposed Remedial Action Plan (“PRAP”) that sets forth the proposed remedy for the site. The PRAP accepted the recommendation contained in the feasibility study for remediation of the soil and groundwater media, but selected a different remediation alternative for the sediment medium. The approximate cost and the current net capital cost value of the remedy proposed by DEC in the PRAP is approximately
$10,000
. After receiving public comments on the PRAP, the DEC issued a Record of Decision (“ROD”) that set forth the specific remedies selected and responded to public comments. The remedies selected by the DEC in the ROD are the same remedies as those set forth in the PRAP.
It is now expected that DEC will enter into negotiations with potentially responsible parties to request they undertake performance of the remedies selected in the ROD, and if such parties do not agree to implement such remedies, then the State of New York may use State Superfund money to remediate the Peekskill site and seek recovery of costs from such parties. Griffon does not acknowledge any responsibility to perform any remediation at the Peekskill Site.
Improper Advertisement Claim involving Union Tools
®
Products.
Beginning in December 2004, a customer of AMES had been named in various litigation matters relating to certain Union Tools products. The plaintiffs in those litigation matters asserted causes of action against the customer of AMES for improper advertisement to end consumers. The allegations suggested that advertisements led the consumers to believe that Union Tools’ hand tools were wholly manufactured within boundaries of the United States. The complaints asserted various causes of action against the customer of AMES under federal and state law, including common law fraud. At some point, the customer may seek indemnity (including recovery of its legal fees and costs) against AMES for an unspecified amount. Presently, AMES cannot estimate the amount of loss, if any, if the customer were to seek legal recourse against AMES.
Union Fork and Hoe, Frankfort, NY site.
The former Union Fork and Hoe property in Frankfort, NY was acquired by Ames in 2006 as part of a larger acquisition, and has historic site contamination involving chlorinated solvents, petroleum hydrocarbons and metals. AMES has entered into an Order on Consent with the New York State Department of Environmental Conservation. While the Order is without admission or finding of liability or acknowledgment that there has been a release of hazardous substances at the site, AMES is required to perform a remedial investigation of certain portions of the property and to recommend a remediation option. At the conclusion of the remediation phase to the satisfaction of the DEC, the DEC will issue a Certificate of Completion. AMES has performed significant investigative and remedial activities in the last few years under work plans approved by the DEC, and the DEC has approved the final remedial investigation report. AMES submitted a Feasibility Study, evaluating a number of remedial options, and recommending excavation and offsite disposal of lead contaminated soils, capping of other areas of the site impacted by other metals and performing limited groundwater monitoring. The Company is now awaiting a DEC decision on the Feasibility Study and the issuance of a Record of Decision. Implementation of the selected remedial alternative is expected to occur following regulatory approval. AMES has a number of defenses to liability in this matter, including its rights under a previous Consent Judgment entered into between the DEC and a predecessor of AMES relating to the site.
U.S. Government investigations and claims
Defense contracts and subcontracts, including Griffon’s contracts and subcontracts, are subject to audit and review by various agencies and instrumentalities of the United States government, including among others, the Defense Contract Audit Agency (“DCAA”), the Defense Criminal Investigative Service (“DCIS”), and the Department of Justice ("DOJ") which has responsibility
92
GRIFFON CORPORATION
NOTES TO CONSOLIDATED FINANCIAL STATEMENTS – (Continued)
(US dollars and non US currencies in thousands, except per share data)
for asserting claims on behalf of the US government. During 2017, Telephonics and the civil department of the US Department of Justice (“DOJ”) settled a claim, pursuant to which Telephonics paid an amount of
$4,250
, related to certain amounts the DOJ indicated it believed it was owed from Telephonics with respect to certain US government contracts, performed during the 2005 to 2013 time period, in which Telephonics acted as a subcontractor.
In general, departments and agencies of the US Government have the authority to investigate various transactions and operations of Griffon, and the results of such investigations may lead to administrative, civil or criminal proceedings, the ultimate outcome of which could be fines, penalties, repayments or compensatory or treble damages. US Government regulations provide that certain findings against a contractor may lead to suspension or debarment from future US Government contracts or the loss of export privileges for a company or an operating division or subdivision. Suspension or debarment could have a material adverse effect on Telephonics because of its reliance on government contracts.
General legal
Griffon is subject to various laws and regulations relating to the protection of the environment and is a party to legal proceedings arising in the ordinary course of business. Management believes, based on facts presently known to it, that the resolution of the
matters above and such other matters will not have a material adverse effect on Griffon’s consolidated financial position, results of operations or cash flows.
Basic and diluted EPS for the years ended
September 30, 2017
,
2016
and
2015
were determined using the following information (in thousands):
|
|
2017
|
2016
|
2015
|
|||||
|
Weighted average shares outstanding - basic
|
41,005
|
|
41,074
|
|
44,608
|
|
||
|
Incremental shares from stock based compensation
|
1,642
|
|
2,326
|
|
2,011
|
|
||
|
Convertible debt due 2017
|
364
|
|
709
|
|
320
|
|
||
|
Weighted average shares outstanding - diluted
|
43,011
|
|
44,109
|
|
46,939
|
|
||
|
Anti-dilutive options excluded from diluted EPS computation
|
—
|
|
6
|
|
493
|
|
||
Shares of the ESOP that have been allocated to employee accounts are treated as outstanding in determining earnings per share.
On May 10, 2017, Griffon entered into an engagement letter with Goldman Sachs & Co. LLC (“Goldman Sachs”) pursuant to which Goldman Sachs agreed to act as Griffon’s financial advisor in connection with the acquisition of ClosetMaid. Griffon subsequently paid a customary financial advisory fee to Goldman Sachs under the terms of this engagement letter following consummation of the acquisition.
On September 5, 2017, Griffon entered into an engagement letter with Goldman Sachs pursuant to which Goldman Sachs agreed to act as Griffon’s financial advisor in connection with the exploration of strategic alternatives for Clopay Plastics. On November 15, 2017, Griffon signed an agreement to sell Clopay Plastics for
$475,000
to Berry Global Group, Inc. Under the terms of the engagement letter, upon the closing of the transaction a customary advisory fee will be payable by Griffon to Goldman Sachs.
Goldman Sachs acted as a joint lead manager and as an initial purchaser in connection with Griffon’s add-on offering of
$275,000
aggregate principal amount of
5.25%
senior notes due 2022 that closed on October 2, 2017, and received a customary fee upon closing of the offering.
On December 10, 2013, Griffon repurchased
4,444,444
shares of its common stock for
$50,000
from GS Direct. The repurchase was effected in a private transaction at a per share price of
$11.25
, an approximate
9.2%
discount to the stock’s closing price on November 12, 2013, the day before announcement of the transaction. After closing the transaction, GS Direct continued to hold approximately
5.56
million shares (approximately
10%
of the shares outstanding at such time) of Griffon’s common stock. Subject to certain exceptions, if GS Direct intends to sell its remaining shares of Griffon common stock at any time prior to December 31,
93
GRIFFON CORPORATION
NOTES TO CONSOLIDATED FINANCIAL STATEMENTS – (Continued)
(US dollars and non US currencies in thousands, except per share data)
2018, it will first negotiate in good faith to sell such shares to the Company.
Quarterly results of operations for the years ended
September 30, 2017
and
2016
were as follows:
|
Quarter ended
|
Revenue
|
Gross Profit
|
Net Income
(loss)
|
Per Share -
Basic
|
Per Share -
Diluted
|
||||||||||||||
|
2017
|
|
|
|
|
|
|
|
|
|
|
|||||||||
|
December 31, 2016
|
$
|
352,277
|
|
$
|
96,745
|
|
$
|
12,264
|
|
$
|
0.31
|
|
$
|
0.29
|
|
||||
|
March 31, 2017
|
383,807
|
|
97,981
|
|
5,045
|
|
0.12
|
|
0.12
|
|
|||||||||
|
June 30, 2017
|
358,114
|
|
98,870
|
|
9,553
|
|
0.23
|
|
0.22
|
|
|||||||||
|
September 30, 2017
|
430,799
|
|
114,520
|
|
(11,950
|
)
|
(0.29
|
)
|
(0.28
|
)
|
|||||||||
|
|
$
|
1,524,997
|
|
$
|
408,116
|
|
$
|
14,912
|
|
$
|
0.36
|
|
$
|
0.35
|
|
||||
|
2016
|
|
|
|
|
|
|
|
|
|
|
|||||||||
|
December 31, 2015
|
$
|
370,235
|
|
$
|
98,454
|
|
$
|
10,788
|
|
$
|
0.26
|
|
$
|
0.24
|
|
||||
|
March 31, 2016
|
385,108
|
|
95,661
|
|
6,095
|
|
0.15
|
|
0.14
|
|
|||||||||
|
June 30, 2016
|
347,327
|
|
102,267
|
|
7,596
|
|
0.19
|
|
0.18
|
|
|||||||||
|
September 30, 2016
|
374,365
|
|
104,311
|
|
5,531
|
|
0.14
|
|
0.13
|
|
|||||||||
|
|
$
|
1,477,035
|
|
$
|
400,693
|
|
$
|
30,010
|
|
$
|
0.73
|
|
$
|
0.68
|
|
||||
Notes to Quarterly Financial Information (unaudited):
|
•
|
Earnings (loss) per share are computed independently for each quarter and year presented; as such the sum of the quarters may not be equal to the full year amounts.
|
|
•
|
Prior year quarterly net income (loss) amounts were restated to reflect the adoption of stock compensation as of October 1, 2015.
|
|
•
|
2017 Net income, and the related per share earnings, included, net of tax, acquisition related costs of
$6,145
and contract settlement charges of
$3,300
.
|
|
•
|
2016 Net income, and the related per share earnings, included, net of tax, restructuring and other related charges of
$4,247
for the third quarter.
|
Griffon’s reportable segments from continuing operations are as follows:
|
•
|
HBP is a leading manufacturer and marketer of residential and commercial garage doors to professional dealers and to some of the largest home center retail chains in North America, as well as a global provider of long-handled tools and landscaping products for homeowners and professionals and is a leading North American manufacturer and marketer of closet organization, home storage, and garage storage products to home center retail chains, mass merchandisers, and direct-to builder professional installers.
|
|
•
|
Telephonics is recognized globally as a leading provider of highly sophisticated intelligence, surveillance and communications solutions for defense, aerospace and commercial customers.
|
On September 5, 2017, Griffon announced it will explore strategic alternatives for PPC and on November 15 ,2017, announced it entered into a definitive agreement to sell PPC to Berry for
$475 million
in cash. The transaction is subject to regulatory approval and customary closing conditions, and is expected to close in the first quarter of calendar 2018. As a result, Griffon classified the results of operations of the PPC business as discontinued operations in the Consolidated Statements of Operations for all periods presented and classified the related assets and liabilities associated with the discontinued operations as held for sale in the consolidated balance sheets. As a result, Griffon has classified PPC as a discontinued operation and all results and information presented exclude PPC unless otherwise noted. PPC is a global leader in the development and production of embossed, laminated and printed specialty plastic films for hygienic, health-care and industrial products and sells to some of the world's largest consumer products companies. See Note 6, Discontinued Operations to the Notes of the Financial Statements.
94
GRIFFON CORPORATION
NOTES TO CONSOLIDATED FINANCIAL STATEMENTS – (Continued)
(US dollars and non US currencies in thousands, except per share data)
On October 2, 2017, Griffon acquired ClosetMaid. ClosetMaid, founded in 1965, is a leading North American manufacturer and marketer of closet organization, home storage, and garage storage products, and sells to some of the largest home center retail chains, mass merchandisers, and direct-to-builder professional installers in North America. Due to the acquisition of ClosetMaid occurring subsequent to Griffon's fiscal year end, ClosetMaid's results of operations, assets and liabilities were not included in Griffon's 2017 financial results or 2017 year-end balance sheet. ClosetMaid will be include in the HBP segment.
Information on Griffon’s reportable segments from continuing operations is as follows:
|
|
For the Years Ended September 30,
|
||||||||||
|
REVENUE
|
2017
|
2016
|
2015
|
||||||||
|
Home & Building Products:
|
|
|
|
|
|
|
|||||
|
AMES
|
$
|
545,269
|
|
$
|
513,973
|
|
$
|
535,881
|
|
||
|
CBP
|
568,001
|
|
527,370
|
|
516,320
|
|
|||||
|
Home & Building Products
|
1,113,270
|
|
1,041,343
|
|
1,052,201
|
|
|||||
|
Telephonics
|
411,727
|
|
$
|
435,692
|
|
$
|
431,090
|
|
|||
|
Total consolidated net sales
|
$
|
1,524,997
|
|
$
|
1,477,035
|
|
$
|
1,483,291
|
|
||
|
For the Years Ended September 30,
|
|||||||||||
|
INCOME BEFORE TAXES FROM CONTINUING OPERATIONS
|
2017
|
2016
|
2015
|
||||||||
|
Segment operating profit:
|
|
|
|
||||||||
|
Home & Building Products
|
$
|
89,495
|
|
$
|
79,682
|
|
$
|
58,883
|
|
||
|
Telephonics
|
29,943
|
|
42,801
|
|
43,006
|
|
|||||
|
PPC
|
25,291
|
|
20,313
|
|
33,137
|
|
|||||
|
Segment operating profit
|
144,729
|
|
|
142,796
|
|
|
135,026
|
|
|||
|
Less: Operating (profit) from discontinued operations
|
25,291
|
|
|
20,313
|
|
|
33,137
|
|
|||
|
Segment operating profit from continuing operations
|
119,438
|
|
|
122,483
|
|
|
101,889
|
|
|||
|
Net interest expense
|
(51,449
|
)
|
(49,877
|
)
|
(47,515
|
)
|
|||||
|
Unallocated amounts
|
(42,398
|
)
|
(40,393
|
)
|
(35,308
|
)
|
|||||
|
Acquisition costs
|
(8,893
|
)
|
—
|
|
—
|
|
|||||
|
Income before taxes from continuing operations
|
$
|
16,698
|
|
$
|
32,213
|
|
$
|
19,066
|
|
||
Griffon evaluates performance and allocates resources based on each segment's operating results from continuing operations before interest income and expense, income taxes, depreciation and amortization, unallocated amounts (mainly corporate overhead), restructuring charges, loss on debt extinguishment and acquisition related expenses, as well as other items that may affect comparability, as applicable (“Segment adjusted EBITDA”, a non-GAAP measure).
95
GRIFFON CORPORATION
NOTES TO CONSOLIDATED FINANCIAL STATEMENTS – (Continued)
(US dollars and non US currencies in thousands, except per share data)
The following table provides a reconciliation of Segment adjusted EBITDA to Income before taxes and discontinued operations:
|
|
For the Years Ended September 30,
|
||||||||||
|
|
2017
|
2016
|
2015
|
||||||||
|
Segment adjusted EBITDA:
|
|
|
|
|
|
|
|||||
|
Home & Building Products
|
$
|
126,766
|
|
$
|
114,949
|
|
$
|
94,226
|
|
||
|
Telephonics
|
45,931
|
|
53,385
|
|
53,028
|
|
|||||
|
PPC
|
52,760
|
|
50,079
|
|
57,103
|
|
|||||
|
Segment adjusted EBITDA
|
225,457
|
|
|
218,413
|
|
|
204,357
|
|
|||
|
Less: EBITDA from discontinued operations
|
52,760
|
|
|
50,079
|
|
|
57,103
|
|
|||
|
Total Segment adjusted EBITDA from continuing operations
|
172,697
|
|
|
168,334
|
|
|
147,254
|
|
|||
|
Net interest expense
|
(51,449
|
)
|
(49,877
|
)
|
(47,515
|
)
|
|||||
|
Segment depreciation and amortization
|
(47,398
|
)
|
(45,851
|
)
|
(45,365
|
)
|
|||||
|
Unallocated amounts
|
(42,398
|
)
|
(40,393
|
)
|
(35,308
|
)
|
|||||
|
Acquisition costs
|
(9,617
|
)
|
—
|
|
—
|
|
|||||
|
Contract settlement charges
|
(5,137
|
)
|
—
|
|
—
|
|
|||||
|
Income before taxes from continuing operations
|
$
|
16,698
|
|
$
|
32,213
|
|
$
|
19,066
|
|
||
|
For the Years Ended September 30,
|
|||||||||||
|
DEPRECIATION and AMORTIZATION
|
2017
|
2016
|
2015
|
||||||||
|
Segment:
|
|
|
|
||||||||
|
Home & Building Products
|
$
|
36,547
|
|
$
|
35,267
|
|
$
|
35,343
|
|
||
|
Telephonics
|
10,851
|
|
10,584
|
|
10,022
|
|
|||||
|
Total segment depreciation and amortization
|
47,398
|
|
45,851
|
|
45,365
|
|
|||||
|
Corporate
|
480
|
|
491
|
|
469
|
|
|||||
|
Total consolidated depreciation and amortization
|
$
|
47,878
|
|
$
|
46,342
|
|
$
|
45,834
|
|
||
|
CAPITAL EXPENDITURES
|
|
|
|
|
|
|
|||||
|
Segment:
|
|
|
|
|
|
|
|||||
|
Home & Building Products
|
$
|
24,476
|
|
$
|
49,351
|
|
$
|
38,896
|
|
||
|
Telephonics
|
8,204
|
|
9,007
|
|
6,347
|
|
|||||
|
Total segment
|
32,680
|
|
58,358
|
|
45,243
|
|
|||||
|
Corporate
|
2,257
|
|
918
|
|
1,065
|
|
|||||
|
Total consolidated capital expenditures
|
$
|
34,937
|
|
$
|
59,276
|
|
$
|
46,308
|
|
||
|
ASSETS
|
At September 30, 2017
|
At September 30, 2016
|
At September 30, 2015
|
||||||||
|
Segment assets:
|
|
|
|
|
|
|
|||||
|
Home & Building Products
|
$
|
1,084,103
|
|
$
|
1,020,297
|
|
$
|
1,034,032
|
|
||
|
Telephonics
|
343,445
|
|
334,631
|
|
302,560
|
|
|||||
|
Total segment assets
|
1,427,548
|
|
1,354,928
|
|
1,336,592
|
|
|||||
|
Corporate
|
71,980
|
|
62,257
|
|
36,030
|
|
|||||
|
Total continuing assets
|
1,499,528
|
|
1,417,185
|
|
1,372,622
|
|
|||||
|
Assets of discontinued operations
|
374,013
|
|
364,911
|
|
340,191
|
|
|||||
|
Consolidated total
|
$
|
1,873,541
|
|
$
|
1,782,096
|
|
$
|
1,712,813
|
|
||
96
GRIFFON CORPORATION
NOTES TO CONSOLIDATED FINANCIAL STATEMENTS – (Continued)
(US dollars and non US currencies in thousands, except per share data)
Segment information by geographic region was as follows:
|
|
For the Years Ended September 30,
|
||||||||||
|
REVENUE BY GEOGRAPHIC AREA - DESTINATION
|
2017
|
|
2016
|
|
2015
|
||||||
|
United States
|
$
|
1,164,958
|
|
$
|
1,149,448
|
|
$
|
1,118,206
|
|
||
|
Europe
|
67,048
|
|
68,604
|
|
80,580
|
|
|||||
|
Canada
|
106,080
|
|
102,333
|
|
120,862
|
|
|||||
|
Australia
|
124,757
|
|
106,780
|
|
110,338
|
|
|||||
|
All other countries
|
62,154
|
|
49,870
|
|
53,305
|
|
|||||
|
Consolidated revenue
|
$
|
1,524,997
|
|
$
|
1,477,035
|
|
$
|
1,483,291
|
|
||
|
For the Years Ended September 30,
|
|||||||||||
|
LONG-LIVED ASSETS BY GEOGRAPHIC AREA
|
2017
|
2016
|
2015
|
||||||||
|
United States
|
$
|
358,795
|
|
$
|
370,332
|
|
$
|
367,248
|
|
||
|
Canada
|
36,383
|
|
35,984
|
|
36,449
|
|
|||||
|
Australia
|
35,917
|
|
26,196
|
|
22,136
|
|
|||||
|
United Kingdom
|
4,144
|
|
—
|
|
—
|
|
|||||
|
All other countries
|
2,023
|
|
2,342
|
|
2,872
|
|
|||||
|
Consolidated long-lived assets, net
|
$
|
437,262
|
|
$
|
434,854
|
|
$
|
428,705
|
|
||
As a percentage of consolidated revenue from continuing operations, HBP sales to Home Depot approximated
17%
in
2017
and
17%
in
2016
and
16%
in
2015
, respectively; and Telephonics aggregate sales to the United States Government and its agencies approximated
18%
in
2017
,
21%
in
2016
and
19%
in
2015
.
Other income (expense) included
($723)
,
($550)
and
$(516)
for the years ended
September 30, 2017
,
2016
and
2015
, respectively, of currency exchange gains (losses) in connection with the translation of receivables and payables denominated in currencies other than the functional currencies of Griffon and its subsidiaries, as well as
$53
,
$316
and
$424
, respectively, of investment income.
The amounts recognized in other comprehensive income (loss) were as follows:
|
|
|||||||||||||||||||||||||||||
|
Years Ended September 30,
|
|||||||||||||||||||||||||||||
|
|
2017
|
2016
|
2015
|
||||||||||||||||||||||||||
|
|
Pre-tax
|
Tax
|
Net of tax
|
Pre-tax
|
Tax
|
Net of tax
|
Pre-tax
|
Tax
|
Net of tax
|
||||||||||||||||||||
|
Foreign currency translation adjustments
|
$
|
10,667
|
|
$
|
—
|
|
$
|
10,667
|
|
$
|
17,284
|
|
$
|
—
|
|
$
|
17,284
|
|
$
|
(56,358
|
)
|
$
|
—
|
|
$
|
(56,358
|
)
|
||
|
Pension and other defined benefit plans
|
14,160
|
|
(4,957
|
)
|
9,203
|
|
(8,694
|
)
|
3,043
|
|
(5,651
|
)
|
(6,655
|
)
|
2,329
|
|
(4,326
|
)
|
|||||||||||
|
Cash flow hedge
|
1,370
|
|
(480
|
)
|
890
|
|
(2,593
|
)
|
907
|
|
(1,686
|
)
|
662
|
|
(232
|
)
|
430
|
|
|||||||||||
|
Available-for-sale securities
|
—
|
|
—
|
|
—
|
|
—
|
|
—
|
|
—
|
|
(1,370
|
)
|
500
|
|
(870
|
)
|
|||||||||||
|
Total other comprehensive income (loss)
|
$
|
26,197
|
|
$
|
(5,437
|
)
|
$
|
20,760
|
|
$
|
5,997
|
|
$
|
3,950
|
|
$
|
9,947
|
|
$
|
(63,721
|
)
|
$
|
2,597
|
|
$
|
(61,124
|
)
|
||
97
GRIFFON CORPORATION
NOTES TO CONSOLIDATED FINANCIAL STATEMENTS – (Continued)
(US dollars and non US currencies in thousands, except per share data)
The components of Accumulated other comprehensive income (loss) are as follows:
|
At September 30,
|
|||||||
|
2017
|
2016
|
||||||
|
Foreign currency translation adjustments
|
$
|
(32,227
|
)
|
$
|
(42,894
|
)
|
|
|
Pension and other defined benefit plans
|
(28,140
|
)
|
(37,343
|
)
|
|||
|
Cash flow hedge
|
(114
|
)
|
(1,004
|
)
|
|||
|
$
|
(60,481
|
)
|
$
|
(81,241
|
)
|
||
Total comprehensive income (loss) were as follows:
|
For the Years Ended September 30,
|
|||||||||||
|
2017
|
2016
|
2015
|
|||||||||
|
Net income (loss)
|
$
|
14,912
|
|
$
|
30,010
|
|
$
|
34,289
|
|
||
|
Other comprehensive income (loss), net of taxes
|
20,760
|
|
9,947
|
|
(61,124
|
)
|
|||||
|
Comprehensive income (loss)
|
$
|
35,672
|
|
$
|
39,957
|
|
$
|
(26,835
|
)
|
||
Amounts reclassified from accumulated other comprehensive income (loss) to income (loss) were as follows:
|
|
For the Years Ended September 30,
|
||||||||||
|
Gain (Loss)
|
2017
|
2016
|
2015
|
||||||||
|
Pension amortization
|
$
|
(3,343
|
)
|
$
|
(2,375
|
)
|
$
|
(2,182
|
)
|
||
|
Available-for-sale securities
|
—
|
|
—
|
|
1,370
|
|
|||||
|
Cash flow hedges
|
(1,458
|
)
|
(752
|
)
|
1,223
|
|
|||||
|
Total before tax
|
(4,801
|
)
|
(3,127
|
)
|
411
|
|
|||||
|
Tax
|
2
|
|
225
|
|
(164
|
)
|
|||||
|
Net of tax
|
$
|
(4,799
|
)
|
$
|
(2,902
|
)
|
$
|
247
|
|
||
Griffon’s Senior Notes are fully and unconditionally guaranteed, jointly and severally, on a senior secured basis by the domestic assets of Clopay Building Products Company, Inc., Clopay Plastic Products Company, Inc., Telephonics Corporation, The AMES Companies, Inc., ATT Southern, Inc., and Clopay Ames True Temper Holding, Corp., all of which are indirectly
100%
owned by Griffon. In accordance with Rule 3-10 of Regulation S-X promulgated under the Securities Act of 1933, presented below are condensed consolidating financial information as of September 30, 2017 and
2016
, and for the years ended September 30, 2017,
2016
and
2015
. The financial information may not necessarily be indicative of results of operations or financial position had the guarantor companies or non-guarantor companies operated as independent entities. The guarantor companies and the non-guarantor companies include the consolidated financial results of their wholly owned subsidiaries accounted for under the equity method.
The indenture relating to the Senior Notes (the “Indenture”) contains terms providing that, under certain limited circumstances, a guarantor will be released from its obligations to guarantee the Senior Notes. These circumstances include (i) a sale of at least a majority of the stock, or all or substantially all the assets, of the subsidiary guarantor as permitted by the Indenture; (ii) a public equity offering of a subsidiary guarantor that qualifies as a “Minority Business” as defined in the Indenture (generally, a business the EBITDA of which constitutes less than
50%
of the segment adjusted EBITDA of the Company for the most recently ended four fiscal quarters), and that meets certain other specified conditions as set forth in the Indenture; (iii) the designation of a guarantor as an “unrestricted subsidiary” as defined in the Indenture, in compliance with the terms of the Indenture; (iv) Griffon exercising its right to defease the Senior Notes, or to otherwise discharge its obligations under the Indenture, in each case in accordance with the terms of the Indenture; and (v) upon obtaining the requisite consent of the holders of the Senior Notes.
98
GRIFFON CORPORATION
NOTES TO CONSOLIDATED FINANCIAL STATEMENTS – (Continued)
(US dollars and non US currencies in thousands, except per share data)
CONDENSED CONSOLIDATING BALANCE SHEETS
At
September 30, 2017
|
|
Parent Company
|
Guarantor Companies
|
Non-Guarantor Companies
|
Elimination
|
Consolidation
|
|||||||||
|
CURRENT ASSETS
|
|
|
|
|
|
|
|
|
|
|
||||
|
Cash and equivalents
|
3,240
|
|
8,066
|
|
36,375
|
|
—
|
|
47,681
|
|
||||
|
Accounts receivable, net of allowances
|
—
|
|
168,731
|
|
59,929
|
|
(20,431
|
)
|
208,229
|
|
||||
|
Contract costs and recognized income not yet billed, net of progress payments
|
—
|
|
131,383
|
|
279
|
|
—
|
|
131,662
|
|
||||
|
Inventories, net
|
—
|
|
246,605
|
|
52,759
|
|
73
|
|
299,437
|
|
||||
|
Prepaid and other current assets
|
21,131
|
|
15,854
|
|
3,002
|
|
80
|
|
40,067
|
|
||||
|
Assets of discontinued operations held for sale
|
—
|
|
168,306
|
|
202,418
|
|
—
|
|
370,724
|
|
||||
|
Assets of discontinued operations not held for sale
|
—
|
|
—
|
|
329
|
|
—
|
|
329
|
|
||||
|
Total Current Assets
|
24,371
|
|
738,945
|
|
355,091
|
|
(20,278
|
)
|
1,098,129
|
|
||||
|
PROPERTY, PLANT AND EQUIPMENT, net
|
645
|
|
200,362
|
|
31,128
|
|
—
|
|
232,135
|
|
||||
|
GOODWILL
|
—
|
|
280,797
|
|
38,342
|
|
—
|
|
319,139
|
|
||||
|
INTANGIBLE ASSETS, net
|
93
|
|
143,415
|
|
61,619
|
|
—
|
|
205,127
|
|
||||
|
INTERCOMPANY RECEIVABLE
|
552,017
|
|
757,608
|
|
915,551
|
|
(2,225,176
|
)
|
—
|
|
||||
|
EQUITY INVESTMENTS IN SUBSIDIARIES
|
863,149
|
|
877,641
|
|
1,613,891
|
|
(3,354,681
|
)
|
—
|
|
||||
|
OTHER ASSETS
|
12,171
|
|
12,054
|
|
(1,002
|
)
|
(7,172
|
)
|
16,051
|
|
||||
|
ASSETS OF DISCONTINUED OPERATIONS HELD FOR SALE
|
—
|
|
—
|
|
—
|
|
—
|
|
—
|
|
||||
|
ASSETS OF DISCONTINUED OPERATIONS NOT HELD FOR SALE
|
—
|
|
—
|
|
2,960
|
|
—
|
|
2,960
|
|
||||
|
Total Assets
|
1,452,446
|
|
3,010,822
|
|
3,017,580
|
|
(5,607,307
|
)
|
1,873,541
|
|
||||
|
CURRENT LIABILITIES
|
|
|
|
|
|
|
|
|
|
|
||||
|
Notes payable and current portion of long-term debt
|
2,854
|
|
1,471
|
|
6,753
|
|
—
|
|
11,078
|
|
||||
|
Accounts payable and accrued liabilities
|
14,683
|
|
199,784
|
|
46,111
|
|
6,631
|
|
267,209
|
|
||||
|
Liabilities of discontinued operations held for sale
|
—
|
|
47,426
|
|
37,024
|
|
—
|
|
84,450
|
|
||||
|
Liabilities of discontinued operations
|
—
|
|
—
|
|
8,342
|
|
—
|
|
8,342
|
|
||||
|
Total Current Liabilities
|
17,537
|
|
248,681
|
|
98,230
|
|
6,631
|
|
371,079
|
|
||||
|
LONG-TERM DEBT, net
|
903,609
|
|
6,044
|
|
58,427
|
|
—
|
|
968,080
|
|
||||
|
INTERCOMPANY PAYABLES
|
84,068
|
|
1,259,413
|
|
854,518
|
|
(2,197,999
|
)
|
—
|
|
||||
|
OTHER LIABILITIES
|
48,424
|
|
76,036
|
|
14,135
|
|
(6,058
|
)
|
132,537
|
|
||||
|
LIABILITIES OF DISCONTINUED OPERATIONS HELD FOR SALE
|
—
|
|
—
|
|
—
|
|
—
|
|
—
|
|
||||
|
LIABILITIES OF DISCONTINUED OPERATIONS NOT HELD FOR SALE
|
—
|
|
—
|
|
3,037
|
|
—
|
|
3,037
|
|
||||
|
Total Liabilities
|
1,053,638
|
|
1,590,174
|
|
1,028,347
|
|
(2,197,426
|
)
|
1,474,733
|
|
||||
|
SHAREHOLDERS’ EQUITY
|
398,808
|
|
1,420,648
|
|
1,989,233
|
|
(3,409,881
|
)
|
398,808
|
|
||||
|
Total Liabilities and Shareholders’ Equity
|
1,452,446
|
|
3,010,822
|
|
3,017,580
|
|
(5,607,307
|
)
|
1,873,541
|
|
||||
99
GRIFFON CORPORATION
NOTES TO CONSOLIDATED FINANCIAL STATEMENTS – (Continued)
(US dollars and non US currencies in thousands, except per share data)
CONDENSED CONSOLIDATING BALANCE SHEETS
At
September 30, 2016
|
|
Parent
Company
|
Guarantor
Companies
|
Non-Guarantor
Companies
|
Elimination
|
Consolidation
|
||||||||||||||
|
CURRENT ASSETS
|
|
|
|
|
|
|
|
|
|
|
|||||||||
|
Cash and equivalents
|
$
|
6,517
|
|
$
|
27,692
|
|
$
|
38,344
|
|
$
|
—
|
|
$
|
72,553
|
|
||||
|
Accounts receivable, net of allowances
|
—
|
|
157,738
|
|
32,243
|
|
(5,642
|
)
|
184,339
|
|
|||||||||
|
Contract costs and recognized income not yet billed, net of progress payments
|
—
|
|
126,959
|
|
2
|
|
—
|
|
126,961
|
|
|||||||||
|
Inventories, net
|
—
|
|
217,143
|
|
44,174
|
|
—
|
|
261,317
|
|
|||||||||
|
Prepaid and other current assets
|
39,763
|
|
26,744
|
|
5,718
|
|
(48,796
|
)
|
23,429
|
|
|||||||||
|
Assets of discontinued operations held for sale
|
—
|
|
45,731
|
|
66,408
|
|
—
|
|
112,139
|
|
|||||||||
|
Assets of discontinued operations not held for sale
|
—
|
|
—
|
|
219
|
|
—
|
|
219
|
|
|||||||||
|
Total Current Assets
|
46,280
|
|
602,007
|
|
187,108
|
|
(54,438
|
)
|
780,957
|
|
|||||||||
|
PROPERTY, PLANT AND EQUIPMENT, net
|
957
|
|
207,801
|
|
28,147
|
|
—
|
|
236,905
|
|
|||||||||
|
GOODWILL
|
—
|
|
280,797
|
|
25,366
|
|
—
|
|
306,163
|
|
|||||||||
|
INTANGIBLE ASSETS, net
|
92
|
|
147,867
|
|
49,990
|
|
—
|
|
197,949
|
|
|||||||||
|
INTERCOMPANY RECEIVABLE
|
539,938
|
|
708,093
|
|
307,051
|
|
(1,555,082
|
)
|
—
|
|
|||||||||
|
EQUITY INVESTMENTS IN SUBSIDIARIES
|
824,889
|
|
866,595
|
|
1,669,799
|
|
(3,361,283
|
)
|
—
|
|
|||||||||
|
OTHER ASSETS
|
6,436
|
|
10,905
|
|
1,314
|
|
(11,086
|
)
|
7,569
|
|
|||||||||
|
ASSETS OF DISCONTINUED OPERATIONS HELD FOR SALE
|
—
|
|
100,094
|
|
150,491
|
|
—
|
|
250,585
|
|
|||||||||
|
ASSETS OF DISCONTINUED OPERATIONS NOT HELD FOR SALE
|
—
|
|
—
|
|
1,968
|
|
—
|
|
1,968
|
|
|||||||||
|
Total Assets
|
$
|
1,418,592
|
|
$
|
2,924,159
|
|
$
|
2,421,234
|
|
$
|
(4,981,889
|
)
|
$
|
1,782,096
|
|
||||
|
CURRENT LIABILITIES
|
|
|
|
|
|
|
|
|
|
|
|||||||||
|
Notes payable and current portion of long-term debt
|
$
|
3,153
|
|
$
|
1,408
|
|
$
|
9,371
|
|
$
|
—
|
|
$
|
13,932
|
|
||||
|
Accounts payable and accrued liabilities
|
65,750
|
|
176,912
|
|
29,212
|
|
(39,685
|
)
|
232,189
|
|
|||||||||
|
Liabilities of discontinued operations held for sale
|
—
|
|
26,643
|
|
43,815
|
|
—
|
|
70,458
|
|
|||||||||
|
Liabilities of discontinued operations not held for sale
|
—
|
|
—
|
|
1,684
|
|
—
|
|
1,684
|
|
|||||||||
|
Total Current Liabilities
|
68,903
|
|
204,963
|
|
84,082
|
|
(39,685
|
)
|
318,263
|
|
|||||||||
|
LONG-TERM DEBT, net
|
848,588
|
|
7,366
|
|
40,992
|
|
—
|
|
896,946
|
|
|||||||||
|
INTERCOMPANY PAYABLES
|
57,648
|
|
732,955
|
|
725,900
|
|
(1,516,503
|
)
|
—
|
|
|||||||||
|
OTHER LIABILITIES
|
32,506
|
|
102,666
|
|
19,777
|
|
(31,786
|
)
|
123,163
|
|
|||||||||
|
LIABILITIES OF DISCONTINUED OPERATIONS HELD FOR SALE
|
—
|
|
23,331
|
|
7,740
|
|
—
|
|
31,071
|
|
|||||||||
|
LIABILITIES OF DISCONTINUED OPERATIONS NOT HELD FOR SALE
|
—
|
|
—
|
|
1,706
|
|
—
|
|
1,706
|
|
|||||||||
|
Total Liabilities
|
1,007,645
|
|
1,071,281
|
|
880,197
|
|
(1,587,974
|
)
|
1,371,149
|
|
|||||||||
|
SHAREHOLDERS’ EQUITY
|
410,947
|
|
1,852,878
|
|
1,541,037
|
|
(3,393,915
|
)
|
410,947
|
|
|||||||||
|
Total Liabilities and Shareholders’ Equity
|
$
|
1,418,592
|
|
$
|
2,924,159
|
|
$
|
2,421,234
|
|
$
|
(4,981,889
|
)
|
$
|
1,782,096
|
|
||||
100
GRIFFON CORPORATION
NOTES TO CONSOLIDATED FINANCIAL STATEMENTS – (Continued)
(US dollars and non US currencies in thousands, except per share data)
CONDENSED CONSOLIDATING STATEMENTS OF OPERATIONS AND COMPREHENSIVE INCOME (LOSS)
For the Year Ended
September 30, 2017
|
|
Parent Company
|
Guarantor Companies
|
Non-Guarantor Companies
|
Elimination
|
Consolidation
|
||||||||||||||
|
Revenue
|
$
|
—
|
|
$
|
1,284,189
|
|
$
|
270,520
|
|
$
|
(29,712
|
)
|
$
|
1,524,997
|
|
||||
|
Cost of goods and services
|
—
|
|
966,293
|
|
181,634
|
|
(31,046
|
)
|
1,116,881
|
|
|||||||||
|
Gross profit
|
—
|
|
317,896
|
|
88,886
|
|
1,334
|
|
408,116
|
|
|||||||||
|
Selling, general and administrative expenses
|
42,273
|
|
232,720
|
|
64,466
|
|
(370
|
)
|
339,089
|
|
|||||||||
|
Restructuring and other related charges
|
—
|
|
—
|
|
—
|
|
—
|
|
—
|
|
|||||||||
|
Total operating expenses
|
42,273
|
|
232,720
|
|
64,466
|
|
(370
|
)
|
339,089
|
|
|||||||||
|
Income (loss) from operations
|
(42,273
|
)
|
85,176
|
|
24,420
|
|
1,704
|
|
69,027
|
|
|||||||||
|
Other income (expense)
|
|
|
|
|
|
|
|
|
|
|
|||||||||
|
Interest income (expense), net
|
(13,804
|
)
|
(24,242
|
)
|
(13,403
|
)
|
—
|
|
(51,449
|
)
|
|||||||||
|
Other, net
|
59
|
|
1,395
|
|
(630
|
)
|
(1,704
|
)
|
(880
|
)
|
|||||||||
|
Total other income (expense)
|
(13,745
|
)
|
(22,847
|
)
|
(14,033
|
)
|
(1,704
|
)
|
(52,329
|
)
|
|||||||||
|
Income (loss) before taxes from continuing operations
|
(56,018
|
)
|
62,329
|
|
10,387
|
|
—
|
|
16,698
|
|
|||||||||
|
Provision (benefit) for income taxes
|
(11,338
|
)
|
24,560
|
|
(14,307
|
)
|
—
|
|
(1,085
|
)
|
|||||||||
|
Income (loss) before equity in net income of subsidiaries
|
(44,680
|
)
|
37,769
|
|
24,694
|
|
—
|
|
17,783
|
|
|||||||||
|
Equity in net income (loss) of subsidiaries
|
59,592
|
|
(25,231
|
)
|
37,770
|
|
(72,131
|
)
|
—
|
|
|||||||||
|
Income (loss) from continuing operations
|
14,912
|
|
12,538
|
|
62,464
|
|
(72,131
|
)
|
17,783
|
|
|||||||||
|
Income from operations of discontinued businesses
|
—
|
|
16,827
|
|
5,449
|
|
—
|
|
22,276
|
|
|||||||||
|
Provision (benefit) from income taxes
|
—
|
|
4,476
|
|
20,671
|
|
—
|
|
25,147
|
|
|||||||||
|
Loss from discontinued operations
|
—
|
|
12,351
|
|
(15,222
|
)
|
—
|
|
(2,871
|
)
|
|||||||||
|
Net income (loss)
|
$
|
14,912
|
|
$
|
24,889
|
|
$
|
47,242
|
|
$
|
(72,131
|
)
|
$
|
14,912
|
|
||||
|
Comprehensive income (loss)
|
$
|
35,672
|
|
$
|
35,575
|
|
$
|
38,337
|
|
$
|
(73,912
|
)
|
$
|
35,672
|
|
||||
101
GRIFFON CORPORATION
NOTES TO CONSOLIDATED FINANCIAL STATEMENTS – (Continued)
(US dollars and non US currencies in thousands, except per share data)
CONDENSED CONSOLIDATING STATEMENTS OF OPERATIONS AND COMPREHENSIVE INCOME (LOSS)
For the Year Ended
September 30, 2016
|
|
Parent Company
|
Guarantor Companies
|
Non-Guarantor Companies
|
Elimination
|
Consolidation
|
||||||||||||||
|
Revenue
|
$
|
—
|
|
$
|
1,277,241
|
|
$
|
228,350
|
|
$
|
(28,556
|
)
|
$
|
1,477,035
|
|
||||
|
Cost of goods and services
|
—
|
|
952,296
|
|
154,181
|
|
(30,135
|
)
|
1,076,342
|
|
|||||||||
|
Gross profit
|
—
|
|
324,945
|
|
74,169
|
|
1,579
|
|
400,693
|
|
|||||||||
|
Selling, general and administrative expenses
|
26,427
|
|
228,961
|
|
63,335
|
|
(370
|
)
|
318,353
|
|
|||||||||
|
Restructuring and other related charges
|
—
|
|
1,299
|
|
(1,299
|
)
|
—
|
|
—
|
|
|||||||||
|
Total operating expenses
|
26,427
|
|
230,260
|
|
62,036
|
|
(370
|
)
|
318,353
|
|
|||||||||
|
Income (loss) from operations
|
(26,427
|
)
|
94,685
|
|
12,133
|
|
1,949
|
|
82,340
|
|
|||||||||
|
Other income (expense)
|
|
|
|
|
|
|
|
|
|
|
|||||||||
|
Interest income (expense), net
|
(12,549
|
)
|
(24,050
|
)
|
(13,278
|
)
|
—
|
|
(49,877
|
)
|
|||||||||
|
Other, net
|
337
|
|
1,862
|
|
(500
|
)
|
(1,949
|
)
|
(250
|
)
|
|||||||||
|
Total other income (expense)
|
(12,212
|
)
|
(22,188
|
)
|
(13,778
|
)
|
(1,949
|
)
|
(50,127
|
)
|
|||||||||
|
Income (loss) before taxes
|
(38,639
|
)
|
72,497
|
|
(1,645
|
)
|
—
|
|
32,213
|
|
|||||||||
|
Provision (benefit) for income taxes
|
4,964
|
|
29,445
|
|
(21,977
|
)
|
—
|
|
12,432
|
|
|||||||||
|
Income (loss) before equity in net income of subsidiaries
|
(43,603
|
)
|
43,052
|
|
20,332
|
|
—
|
|
19,781
|
|
|||||||||
|
Equity in net income (loss) of subsidiaries
|
73,613
|
|
(2,858
|
)
|
43,052
|
|
(113,807
|
)
|
—
|
|
|||||||||
|
Income (loss) from continuing operations
|
$
|
30,010
|
|
$
|
40,194
|
|
$
|
63,384
|
|
$
|
(113,807
|
)
|
$
|
19,781
|
|
||||
|
Income from operations of discontinued businesses
|
—
|
|
15,625
|
|
5,327
|
|
—
|
|
20,952
|
|
|||||||||
|
Provision (benefit) from income taxes
|
—
|
|
4,720
|
|
6,003
|
|
—
|
|
10,723
|
|
|||||||||
|
Income (loss) from discontinued operations
|
—
|
|
10,905
|
|
(676
|
)
|
—
|
|
10,229
|
|
|||||||||
|
Net income (loss)
|
$
|
30,010
|
|
$
|
51,099
|
|
$
|
62,708
|
|
$
|
(113,807
|
)
|
$
|
30,010
|
|
||||
|
Comprehensive income (loss)
|
$
|
39,957
|
|
$
|
44,391
|
|
$
|
90,560
|
|
$
|
(134,951
|
)
|
$
|
39,957
|
|
||||
102
GRIFFON CORPORATION
NOTES TO CONSOLIDATED FINANCIAL STATEMENTS – (Continued)
(US dollars and non US currencies in thousands, except per share data)
CONDENSED CONSOLIDATING STATEMENTS OF OPERATIONS AND COMPREHENSIVE INCOME (LOSS)
For the Year Ended September 30, 2015
|
|
Parent Company
|
Guarantor Companies
|
Non-Guarantor Companies
|
Elimination
|
Consolidation
|
||||||||||||||
|
Revenue
|
$
|
—
|
|
$
|
1,265,201
|
|
$
|
258,733
|
|
$
|
(40,643
|
)
|
$
|
1,483,291
|
|
||||
|
Cost of goods and services
|
—
|
|
957,461
|
|
175,449
|
|
(41,966
|
)
|
1,090,944
|
|
|||||||||
|
Gross profit
|
—
|
|
307,740
|
|
83,284
|
|
1,323
|
|
392,347
|
|
|||||||||
|
Selling, general and administrative expenses
|
22,637
|
|
236,777
|
|
66,391
|
|
(370
|
)
|
325,435
|
|
|||||||||
|
Income (loss) from operations
|
(22,637
|
)
|
70,963
|
|
16,893
|
|
1,693
|
|
66,912
|
|
|||||||||
|
Other income (expense)
|
|
|
|
|
|
|
|
|
|
|
|||||||||
|
Interest income (expense), net
|
(8,741
|
)
|
(24,322
|
)
|
(14,452
|
)
|
—
|
|
(47,515
|
)
|
|||||||||
|
Other, net
|
438
|
|
1,847
|
|
(923
|
)
|
(1,693
|
)
|
(331
|
)
|
|||||||||
|
Total other income (expense)
|
(8,303
|
)
|
(22,475
|
)
|
(15,375
|
)
|
(1,693
|
)
|
(47,846
|
)
|
|||||||||
|
Income (loss) before taxes
|
(30,940
|
)
|
48,486
|
|
1,520
|
|
—
|
|
19,066
|
|
|||||||||
|
Provision (benefit) for income taxes
|
(31,241
|
)
|
21,408
|
|
16,605
|
|
—
|
|
6,772
|
|
|||||||||
|
Income (loss) before equity in net income of subsidiaries
|
301
|
|
27,078
|
|
(15,085
|
)
|
—
|
|
12,294
|
|
|||||||||
|
Equity in net income (loss) of subsidiaries
|
33,987
|
|
(38,487
|
)
|
27,078
|
|
(22,578
|
)
|
—
|
|
|||||||||
|
Income (loss) from continuing operations
|
34,288
|
|
(11,409
|
)
|
11,993
|
|
(22,578
|
)
|
12,294
|
|
|||||||||
|
Income (loss) from operations of discontinued businesses
|
2
|
|
33,175
|
|
1,393
|
|
—
|
|
34,570
|
|
|||||||||
|
Provision (benefit) from income taxes
|
1
|
|
11,890
|
|
684
|
|
—
|
|
12,575
|
|
|||||||||
|
Income (loss) from discontinued operations
|
1
|
|
21,285
|
|
709
|
|
—
|
|
21,995
|
|
|||||||||
|
Net Income (loss)
|
$
|
34,289
|
|
$
|
9,876
|
|
$
|
12,702
|
|
$
|
(22,578
|
)
|
$
|
34,289
|
|
||||
|
Comprehensive income (loss)
|
$
|
(26,835
|
)
|
$
|
(14,316
|
)
|
$
|
(21,980
|
)
|
$
|
36,296
|
|
$
|
(26,835
|
)
|
||||
103
GRIFFON CORPORATION
NOTES TO CONSOLIDATED FINANCIAL STATEMENTS – (Continued)
(US dollars and non US currencies in thousands, except per share data)
CONDENSED CONSOLIDATING STATEMENTS OF CASH FLOWS
For the Year Ended September 30, 2017
|
|
Parent Company
|
Guarantor Companies
|
Non-Guarantor Companies
|
Elimination
|
Consolidation
|
||||||||||||||
|
CASH FLOWS FROM OPERATING ACTIVITIES:
|
|
|
|
|
|
|
|
|
|
|
|||||||||
|
Net income (loss)
|
$
|
14,912
|
|
$
|
24,889
|
|
$
|
47,242
|
|
$
|
(72,131
|
)
|
$
|
14,912
|
|
||||
|
Net (income) loss from discontinued operations
|
—
|
|
(12,351
|
)
|
15,222
|
|
—
|
|
2,871
|
|
|||||||||
|
Net cash provided by operating activities
|
(10,771
|
)
|
56,320
|
|
3,602
|
|
—
|
|
49,151
|
|
|||||||||
|
CASH FLOWS FROM INVESTING ACTIVITIES:
|
|||||||||||||||||||
|
Acquisition of property, plant and equipment
|
(15
|
)
|
(27,902
|
)
|
(7,020
|
)
|
—
|
|
(34,937
|
)
|
|||||||||
|
Acquired business, net of cash acquired
|
—
|
|
—
|
|
(34,719
|
)
|
—
|
|
(34,719
|
)
|
|||||||||
|
Purchase of securities
|
(1,824
|
)
|
—
|
|
—
|
|
—
|
|
(1,824
|
)
|
|||||||||
|
Proceeds from sale of property, plant and equipment
|
—
|
|
144
|
|
(1
|
)
|
—
|
|
143
|
|
|||||||||
|
Net cash used in investing activities
|
(1,839
|
)
|
(27,758
|
)
|
(41,740
|
)
|
—
|
|
(71,337
|
)
|
|||||||||
|
CASH FLOWS FROM FINANCING ACTIVITIES:
|
|||||||||||||||||||
|
Purchase of shares for treasury
|
(15,841
|
)
|
—
|
|
—
|
|
—
|
|
(15,841
|
)
|
|||||||||
|
Proceeds from long-term debt
|
201,124
|
|
—
|
|
32,319
|
|
—
|
|
233,443
|
|
|||||||||
|
Payments of long-term debt
|
(149,109
|
)
|
(1,282
|
)
|
(20,063
|
)
|
—
|
|
(170,454
|
)
|
|||||||||
|
Share premium payment on settled debt
|
(24,997
|
)
|
—
|
|
—
|
|
—
|
|
(24,997
|
)
|
|||||||||
|
Change in short-term borrowings
|
—
|
|
—
|
|
—
|
|
—
|
|
—
|
|
|||||||||
|
Financing costs
|
(1,548
|
)
|
—
|
|
—
|
|
—
|
|
(1,548
|
)
|
|||||||||
|
Purchase of ESOP shares
|
(10,908
|
)
|
—
|
|
—
|
|
—
|
|
(10,908
|
)
|
|||||||||
|
Dividends paid
|
(10,325
|
)
|
—
|
|
—
|
|
—
|
|
(10,325
|
)
|
|||||||||
|
Other, net
|
20,937
|
|
(34,806
|
)
|
13,799
|
|
—
|
|
(70
|
)
|
|||||||||
|
Net cash used in financing activities
|
9,333
|
|
(36,088
|
)
|
26,055
|
|
—
|
|
(700
|
)
|
|||||||||
|
CASH FLOWS FROM DISCONTINUED OPERATIONS:
|
|||||||||||||||||||
|
Net cash provided by (used in) discontinued operations
|
—
|
|
(12,100
|
)
|
9,950
|
|
—
|
|
(2,150
|
)
|
|||||||||
|
Effect of exchange rate changes on cash and equivalents
|
—
|
|
—
|
|
164
|
|
—
|
|
164
|
|
|||||||||
|
NET INCREASE (DECREASE) IN CASH AND EQUIVALENTS
|
(3,277
|
)
|
(19,626
|
)
|
(1,969
|
)
|
—
|
|
(24,872
|
)
|
|||||||||
|
CASH AND EQUIVALENTS AT BEGINNING OF PERIOD
|
6,517
|
|
27,692
|
|
38,344
|
|
—
|
|
72,553
|
|
|||||||||
|
CASH AND EQUIVALENTS AT END OF PERIOD
|
$
|
3,240
|
|
$
|
8,066
|
|
$
|
36,375
|
|
$
|
—
|
|
$
|
47,681
|
|
||||
104
GRIFFON CORPORATION
NOTES TO CONSOLIDATED FINANCIAL STATEMENTS – (Continued)
(US dollars and non US currencies in thousands, except per share data)
CONDENSED CONSOLIDATING STATEMENTS OF CASH FLOWS
For the Year Ended
September 30, 2016
|
|
Parent Company
|
Guarantor Companies
|
Non-Guarantor Companies
|
Elimination
|
Consolidation
|
||||||||||||||
|
CASH FLOWS FROM OPERATING ACTIVITIES:
|
|
|
|
|
|
|
|
|
|
|
|||||||||
|
Net income (loss)
|
$
|
30,010
|
|
$
|
51,099
|
|
$
|
62,708
|
|
$
|
(113,807
|
)
|
$
|
30,010
|
|
||||
|
Net income (loss) from discontinued operations
|
—
|
|
10,905
|
|
(676
|
)
|
—
|
|
10,229
|
|
|||||||||
|
Net cash provided by (used in) operating activities
|
(11,879
|
)
|
87,252
|
|
4,745
|
|
—
|
|
80,118
|
|
|||||||||
|
CASH FLOWS FROM INVESTING ACTIVITIES:
|
|
|
|
|
|
|
|
|
|
|
|||||||||
|
Acquisition of property, plant and equipment
|
(259
|
)
|
(62,176
|
)
|
3,159
|
|
—
|
|
(59,276
|
)
|
|||||||||
|
Intercompany distributions
|
—
|
|
(2,726
|
)
|
(1,744
|
)
|
—
|
|
(4,470
|
)
|
|||||||||
|
Proceeds from sale of property, plant and equipment
|
—
|
|
763
|
|
7
|
|
—
|
|
770
|
|
|||||||||
|
Investment purchases
|
715
|
|
—
|
|
—
|
|
—
|
|
715
|
|
|||||||||
|
Net cash provided by (used in) investing activities
|
456
|
|
(64,139
|
)
|
1,422
|
|
—
|
|
(62,261
|
)
|
|||||||||
|
CASH FLOWS FROM FINANCING ACTIVITIES:
|
|
|
|
|
|
|
|
|
|
|
|||||||||
|
Purchase of shares for treasury
|
(65,307
|
)
|
—
|
|
—
|
|
—
|
|
(65,307
|
)
|
|||||||||
|
Proceeds from long-term debt
|
271,340
|
|
2,311
|
|
28,711
|
|
—
|
|
302,362
|
|
|||||||||
|
Payments of long-term debt
|
(177,513
|
)
|
(1,237
|
)
|
(29,764
|
)
|
—
|
|
(208,514
|
)
|
|||||||||
|
Change in short-term borrowings
|
—
|
|
—
|
|
—
|
|
—
|
|
—
|
|
|||||||||
|
Financing costs
|
(4,277
|
)
|
—
|
|
(107
|
)
|
—
|
|
(4,384
|
)
|
|||||||||
|
Tax effect from exercise/vesting of equity awards, net
|
—
|
|
—
|
|
—
|
|
—
|
|
—
|
|
|||||||||
|
Dividends paid
|
(8,798
|
)
|
—
|
|
—
|
|
—
|
|
(8,798
|
)
|
|||||||||
|
Other, net
|
55
|
|
(1,926
|
)
|
1,926
|
|
—
|
|
55
|
|
|||||||||
|
Net cash provided by (used in) financing activities
|
15,500
|
|
(852
|
)
|
766
|
|
—
|
|
15,414
|
|
|||||||||
|
CASH FLOWS FROM DISCONTINUED OPERATIONS:
|
|
|
|
|
|
|
|
|
|
|
|||||||||
|
Net cash provided by (used in) discontinued operations
|
—
|
|
(5,241
|
)
|
(8,364
|
)
|
—
|
|
(13,605
|
)
|
|||||||||
|
Effect of exchange rate changes on cash and equivalents
|
—
|
|
—
|
|
886
|
|
—
|
|
886
|
|
|||||||||
|
NET DECREASE IN CASH AND EQUIVALENTS
|
4,077
|
|
17,020
|
|
(545
|
)
|
—
|
|
20,552
|
|
|||||||||
|
CASH AND EQUIVALENTS AT BEGINNING OF PERIOD
|
2,440
|
|
10,672
|
|
38,889
|
|
—
|
|
52,001
|
|
|||||||||
|
CASH AND EQUIVALENTS AT END OF PERIOD
|
$
|
6,517
|
|
$
|
27,692
|
|
$
|
38,344
|
|
$
|
—
|
|
$
|
72,553
|
|
||||
105
GRIFFON CORPORATION
NOTES TO CONSOLIDATED FINANCIAL STATEMENTS – (Continued)
(US dollars and non US currencies in thousands, except per share data)
CONDENSED CONSOLIDATING STATEMENTS OF CASH FLOWS
For the Year Ended September 30, 2015
|
|
Parent Company
|
|
Guarantor Companies
|
|
Non-Guarantor Companies
|
|
Elimination
|
|
Consolidation
|
||||||||||
|
CASH FLOWS FROM OPERATING ACTIVITIES:
|
|
|
|
|
|
|
|
|
|
|
|
|
|
|
|||||
|
Net income (loss)
|
$
|
34,289
|
|
|
$
|
9,876
|
|
|
$
|
12,702
|
|
|
$
|
(22,578
|
)
|
|
$
|
34,289
|
|
|
Net (income) loss from discontinued operations
|
(1
|
)
|
(21,285
|
)
|
(709
|
)
|
—
|
|
(21,995
|
)
|
|||||||||
|
Net cash provided by (used in) operating activities
|
59,245
|
|
|
11,686
|
|
|
(39,075
|
)
|
|
—
|
|
|
31,856
|
|
|||||
|
CASH FLOWS FROM INVESTING ACTIVITIES:
|
|
|
|
|
|
|
|
|
|
|
|
|
|
|
|||||
|
Acquisition of property, plant and equipment
|
(274
|
)
|
|
(27,281
|
)
|
|
(18,753
|
)
|
|
—
|
|
|
(46,308
|
)
|
|||||
|
Acquired business, net of cash acquired
|
—
|
|
|
(2,225
|
)
|
|
—
|
|
|
—
|
|
|
(2,225
|
)
|
|||||
|
Intercompany distributions
|
—
|
|
|
—
|
|
|
—
|
|
|
—
|
|
|
—
|
|
|||||
|
Investment sales
|
8,891
|
|
|
—
|
|
|
—
|
|
|
—
|
|
|
8,891
|
|
|||||
|
Proceeds from sale of property, plant and equipment
|
—
|
|
141
|
|
62
|
|
—
|
|
203
|
|
|||||||||
|
Net cash provided by (used in) investing activities
|
8,617
|
|
|
(29,365
|
)
|
|
(18,691
|
)
|
|
—
|
|
|
(39,439
|
)
|
|||||
|
CASH FLOWS FROM FINANCING ACTIVITIES:
|
|
|
|
|
|
|
|
|
|
|
|
|
|
|
|||||
|
Proceeds from issuance of common stock
|
371
|
|
—
|
|
—
|
|
—
|
|
371
|
|
|||||||||
|
Purchase of shares for treasury
|
(82,343
|
)
|
|
—
|
|
|
—
|
|
|
—
|
|
|
(82,343
|
)
|
|||||
|
Proceeds from long-term debt
|
124,500
|
|
|
13,596
|
|
|
65,120
|
|
|
—
|
|
|
203,216
|
|
|||||
|
Payments of long-term debt
|
(116,702
|
)
|
|
(364
|
)
|
|
(70,669
|
)
|
|
—
|
|
|
(187,735
|
)
|
|||||
|
Change in short-term borrowings
|
—
|
|
|
—
|
|
|
—
|
|
|
—
|
|
|
—
|
|
|||||
|
Financing costs
|
(615
|
)
|
|
(196
|
)
|
|
(77
|
)
|
|
—
|
|
|
(888
|
)
|
|||||
|
Tax effect from exercise/vesting of equity awards, net
|
345
|
|
|
—
|
|
|
—
|
|
|
—
|
|
|
345
|
|
|||||
|
Dividends paid
|
2,346
|
|
|
(10,000
|
)
|
|
—
|
|
|
—
|
|
|
(7,654
|
)
|
|||||
|
Other, net
|
347
|
|
|
6,341
|
|
|
(6,341
|
)
|
|
—
|
|
|
347
|
|
|||||
|
Net cash provided by (used in) financing activities
|
(71,751
|
)
|
|
9,377
|
|
|
(11,967
|
)
|
|
—
|
|
|
(74,341
|
)
|
|||||
|
CASH FLOWS FROM DISCONTINUED OPERATIONS:
|
|
|
|
|
|
|
|
|
|
|
|
|
|
|
|||||
|
Net cash used in discontinued operations
|
—
|
|
|
5,139
|
|
|
40,533
|
|
|
—
|
|
|
45,672
|
|
|||||
|
Effect of exchange rate changes on cash and equivalents
|
—
|
|
|
—
|
|
|
(4,152
|
)
|
|
—
|
|
|
(4,152
|
)
|
|||||
|
NET INCREASE (DECREASE) IN CASH AND EQUIVALENTS
|
(3,889
|
)
|
|
(3,163
|
)
|
|
(33,352
|
)
|
—
|
|
|
(40,404
|
)
|
||||||
|
CASH AND EQUIVALENTS AT BEGINNING OF PERIOD
|
6,329
|
|
|
13,835
|
|
|
72,241
|
|
|
—
|
|
|
92,405
|
|
|||||
|
CASH AND EQUIVALENTS AT END OF PERIOD
|
$
|
2,440
|
|
|
$
|
10,672
|
|
|
$
|
38,889
|
|
|
$
|
—
|
|
|
$
|
52,001
|
|
106
GRIFFON CORPORATION
NOTES TO CONSOLIDATED FINANCIAL STATEMENTS – (Continued)
(US dollars and non US currencies in thousands, except per share data)
On November 15, 2017, the Board of Directors declared a cash dividend of
$0.07
per share, payable on December 21, 2017 to shareholders of record as of the close of business on November 29, 2017. Griffon currently intends to pay dividends each quarter; however, payment of dividends is determined by the Board of Directors, at its discretion, based on various factors, and no assurance can be provided as to the payment of future dividends.
*****
107
SCHEDULE II
GRIFFON CORPORATION
VALUATION AND QUALIFYING ACCOUNTS
For the Years Ended September 30, 2017, 2016 and 2015
(in thousands)
|
Description
|
Balance at
Beginning of
Year
|
Recorded to
Cost and
Expense
|
Accounts
Written Off,
net
|
Other
|
Balance at
End of Year
|
||||||||||||||
|
FOR THE YEAR ENDED SEPTEMBER 30, 2017
|
|
|
|
|
|
|
|
|
|||||||||||
|
Allowance for Doubtful Accounts
|
|
|
|
|
|
|
|
|
|
|
|||||||||
|
Bad debts
|
$
|
1,217
|
|
$
|
279
|
|
(387
|
)
|
$
|
—
|
|
$
|
1,109
|
|
|||||
|
Sales returns and allowances
|
3,475
|
|
1,401
|
|
(19
|
)
|
—
|
|
4,857
|
|
|||||||||
|
|
$
|
4,692
|
|
$
|
1,680
|
|
$
|
(406
|
)
|
$
|
—
|
|
$
|
5,966
|
|
||||
|
Inventory valuation
|
$
|
15,338
|
|
$
|
(2,954
|
)
|
$
|
4,008
|
|
$
|
27
|
|
$
|
16,419
|
|
||||
|
Deferred tax valuation allowance
|
$
|
12,832
|
|
$
|
4,634
|
|
$
|
—
|
|
$
|
—
|
|
$
|
17,466
|
|
||||
|
FOR THE YEAR ENDED SEPTEMBER 30, 2016
|
|
|
|
|
|
|
|
|
|||||||||||
|
Allowance for Doubtful Accounts
|
|
|
|
|
|
|
|
|
|
|
|||||||||
|
Bad debts
|
$
|
1,628
|
|
$
|
349
|
|
$
|
(759
|
)
|
$
|
(1
|
)
|
$
|
1,217
|
|
||||
|
Sales returns and allowances
|
2,277
|
|
1,205
|
|
(7
|
)
|
—
|
|
3,475
|
|
|||||||||
|
|
$
|
3,905
|
|
$
|
1,554
|
|
$
|
(766
|
)
|
$
|
(1
|
)
|
$
|
4,692
|
|
||||
|
Inventory valuation
|
$
|
13,003
|
|
$
|
10,835
|
|
$
|
(8,743
|
)
|
$
|
243
|
|
$
|
15,338
|
|
||||
|
Deferred tax valuation allowance
|
$
|
10,462
|
|
$
|
2,370
|
|
$
|
—
|
|
$
|
—
|
|
$
|
12,832
|
|
||||
|
FOR THE YEAR ENDED SEPTEMBER 30, 2015
|
|
|
|
|
|
|
|
|
|||||||||||
|
Allowance for Doubtful Accounts
|
|
|
|
|
|
|
|
|
|
|
|||||||||
|
Bad debts
|
$
|
2,333
|
|
$
|
66
|
|
$
|
(769
|
)
|
$
|
(2
|
)
|
$
|
1,628
|
|
||||
|
Sales returns and allowances
|
3,047
|
|
(748
|
)
|
(22
|
)
|
—
|
|
2,277
|
|
|||||||||
|
|
$
|
5,380
|
|
$
|
(682
|
)
|
$
|
(791
|
)
|
$
|
(2
|
)
|
$
|
3,905
|
|
||||
|
Inventory valuation
|
$
|
15,358
|
|
$
|
5,368
|
|
$
|
(6,822
|
)
|
$
|
(901
|
)
|
$
|
13,003
|
|
||||
|
Deferred tax valuation allowance
|
$
|
15,649
|
|
$
|
(5,187
|
)
|
$
|
—
|
|
$
|
—
|
|
$
|
10,462
|
|
||||
108
Item 9.
Changes in and Disagreements with Accountants on Accounting and Financial Disclosure
Not applicable.
Item 9A.
Controls and Procedures
Evaluation and Disclosure Controls and Procedures
Griffon’s management, with the participation of its Chief Executive Officer and Chief Financial Officer, conducted an evaluation of the effectiveness of the design and operation of Griffon’s disclosure controls and procedures, as defined by Exchange Act Rule 13a-15(e). Based on that evaluation, the Chief Executive Officer and Chief Financial Officer have concluded that, as of the end of the period covered by this report, Griffon’s disclosure controls and procedures were effective to ensure that information required to be disclosed by Griffon in the reports that it files or submits under the Exchange Act are recorded, processed, summarized and reported within the time periods specified by the SEC’s rules and forms and such information is accumulated and communicated to management as appropriate to allow timely decisions regarding required disclosures.
Management’s Report on Internal Control over Financial Reporting
Griffon’s management is responsible for establishing and maintaining adequate internal control over financial reporting. Griffon’s internal control over financial reporting is a process designed under the supervision of its Chief Executive Officer and Chief Financial Officer to provide reasonable assurance regarding the reliability of financial reporting and the preparation of Griffon’s financial statements for external reporting in accordance with accounting principles generally accepted in the United States of America. Management evaluates the effectiveness of Griffon’s internal control over financial reporting using the criteria set forth by the 2013 Committee of Sponsoring Organizations of the Treadway Commission (COSO) in Internal Control—Integrated Framework. Management, under the supervision and with the participation of Griffon’s Chief Executive Officer and Chief Financial Officer, assessed the effectiveness of Griffon’s internal control over financial reporting as of
September 30, 2017
and concluded that it is effective.
Griffon’s independent registered public accounting firm, Grant Thornton LLP, has audited the effectiveness of Griffon’s internal control over financial reporting as of
September 30, 2017
, and has expressed an unqualified opinion in their report which appears in this Annual Report on Form 10-K.
Changes in Internal Controls
There were no changes in Griffon’s internal control over financial reporting identified in connection with the evaluation referred to above that occurred during the fourth quarter of the year ended
September 30, 2017
that have materially affected, or are reasonably likely to materially affect, the registrant’s internal control over financial reporting.
Inherent Limitations on the Effectiveness of Controls
Griffon’s internal control over financial reporting is designed to provide reasonable assurance regarding the reliability of financial reporting and the preparation of financial statements for external purposes in accordance with generally accepted accounting principles. Griffon’s internal control over financial reporting includes those policies and procedures that:
|
(i)
|
pertain to the maintenance of records that, in reasonable detail, accurately and fairly reflect the transactions and dispositions of Griffon’s assets;
|
|
(ii)
|
provide reasonable assurance that transactions are recorded as necessary to permit preparation of financial statements in accordance with generally accepted accounting principles, and that Griffon’s receipts and expenditures are being made only in accordance with authorizations of Griffon’s management and directors; and
|
|
(iii)
|
provide reasonable assurance regarding prevention or timely detection of unauthorized acquisition, use or disposition of Griffon’s assets that could have a material effect on the financial statements.
|
Management, including Griffon’s Chief Executive Officer and Chief Financial Officer, does not expect that Griffon’s internal controls will prevent or detect all errors and all fraud. A control system, no matter how well designed and operated, can provide only reasonable, not absolute, assurance that the objectives of the control system are met. Further, the design of a control system must reflect the fact that there are resource constraints, and the benefits of controls must be considered relative to their costs. Because of the inherent limitations in all control systems, no evaluation of internal controls can provide absolute assurance that all control issues and instances of fraud, if any, have been detected. Also, any evaluation of the effectiveness of controls in future
109
periods is subject to the risk that those internal controls may become inadequate because of changes in business conditions, or that the degree of compliance with the policies or procedures may deteriorate.
Item 9B.
Other Information
None.
110
The information required by
Part III: Item 10,
Directors, and Executive Officers and Corporate Governance
; Item 11,
Executive Compensation
; Item 13,
Certain Relationships and Related Transactions and Director Independence
; and Item 14,
Principal Accountant Fees and Services
is included in and incorporated by reference to Griffon’s definitive proxy statement in connection with its Annual Meeting of Stockholders scheduled to be held in January, 2018, to be filed with the Securities and Exchange Commission within 120 days following the end of Griffon’s year ended
September 30, 2017
. Information relating to the executive officers of the Registrant appears under Item 1 of this report.
Item 12.
Security Ownership of Certain Beneficial Owners and Management and Related Stockholder Matters
The information regarding security ownership of certain beneficial owners and management that is required to be included pursuant to this Item 12 is included in and incorporated by reference to Griffon’s definitive proxy statement in connection with its Annual Meeting of Stockholders scheduled to be held in January, 2018.
The following sets forth information relating to Griffon’s equity compensation plans as of
September 30, 2017
:
|
|
(a)
|
(b)
|
(c)
|
||||||
|
Plan Category
|
Number of
securities to be
issued upon
exercise of
outstanding options,
warrants and rights
|
Weighted-
average exercise
price of
outstanding
options, warrants
and rights
|
Number of securities
remaining available for
future issuance under
equity plans (excluding
securities reflected in
column (a))
|
||||||
|
Equity compensation plans approved by security
holders (1)
|
350,000
|
|
$
|
20.00
|
|
1,276,824
|
|
||
|
Equity compensation plans not approved by security holders
|
—
|
|
$
|
—
|
|
—
|
|
||
|
(1)
|
Excludes restricted shares and restricted stock units issued in connection with Griffon’s equity compensation plans. The total reflected in Column (c) includes shares available for grant as any type of equity award under the Incentive Plan.
|
111
Item 15.
Exhibits and Financial Statement Schedules
|
(a)
|
(1)
|
Financial Statements
– Covered by Report of Independent Registered Public Accounting Firm
|
||
|
|
(A)
|
Consolidated Balance Sheets at September 30, 2017 and 2016
|
||
|
|
(B)
|
Consolidated Statements of Operations and Comprehensive Income (Loss) for the Fiscal Years Ended September 30, 2017, 2016 and 2015
|
||
|
|
(C)
|
Consolidated Statements of Cash Flows for the Fiscal Years Ended September 30, 2017, 2016 and 2015
|
||
|
|
(D)
|
Consolidated Statements of Shareholders’ Equity for the Fiscal Years Ended September 30, 2017, 2016 and 2015
|
||
|
|
(E)
|
Notes to the Consolidated Financial Statements
|
||
|
|
(2)
|
Financial Statement Schedule
– Covered by Report of Independent Registered Public Accounting Firm
|
||
|
|
|
Schedule II – Valuation and Qualifying Accounts
|
||
|
|
|
All other schedules are not required and have been omitted.
|
||
|
(3)
|
The information required by this Section (a)(3) of Item 15 is set forth on the exhibit index that follows the signatures page of this Form 10-K.
|
|||
|
|
(b)
|
Reference is made to the exhibit index that follows the signatures page of this Form 10-K.
|
||
112
Exhibit Index
|
Exhibit
No.
|
|
|
|
3.1
|
|
|
|
3.2
|
|
|
|
4.1
|
|
|
|
4.2
|
||
|
4.3
|
||
|
10.1**
|
|
|
|
10.2**
|
|
|
|
10.3
|
|
|
|
10.4**
|
|
|
|
10.5**
|
|
|
|
10.6**
|
|
|
|
10.7**
|
|
|
|
10.8**
|
|
|
|
10.9**
|
|
|
|
10.10**
|
|
|
|
10.11**
|
||
113
|
Exhibit
No.
|
|
|
|
10.12
|
||
|
10.13**
|
||
|
10.14**
|
||
|
10.15**
|
||
|
10.16**
|
||
|
10.17**
|
||
|
10.18**
|
||
|
10.19**
|
||
|
10.20**
|
||
|
10.21
|
||
|
10.22
|
||
|
10.23**
|
||
|
10.24**
|
||
|
10.25**
|
|
|
|
10.26**
|
||
|
10.27**
|
||
|
10.28
|
||
|
10.29
|
||
|
10.30**
|
||
|
10.31**
|
||
|
10.32**
|
||
|
10.33**
|
||
114
|
Exhibit
No. |
||
|
10.34
|
||
|
10.35
|
||
|
10.36*
|
||
|
10.37**
|
||
|
10.38**
|
||
|
10.39
|
||
|
10.40
|
||
|
10.41
|
||
|
10.42
|
||
|
10.43
|
||
|
10.44
|
||
|
10.45
|
||
|
10.46
|
||
|
10.47
|
||
115
|
Exhibit
No. |
||
|
10.48
|
||
|
14.1
|
|
|
|
21*
|
|
|
|
23*
|
|
|
|
31.1*
|
|
|
|
31.2*
|
|
|
|
32*
|
|
|
|
|
|
|
|
101.INS
|
XBRL Instance Document***
|
|
|
|
|
|
|
101.SCH
|
XBRL Taxonomy Extension Schema Document***
|
|
|
|
|
|
|
101.CAL
|
XBRL Taxonomy Extension Calculation Document***
|
|
|
|
|
|
|
101.DEF
|
XBRL Taxonomy Extension Definitions Document***
|
|
|
|
|
|
|
101.LAB
|
XBRL Taxonomy Extension Labels Document***
|
|
|
|
|
|
|
101.PRE
|
XBRL Taxonomy Extension Presentation Document***
|
|
|
_______________________
|
|
|
*
|
Filed herewith. All other exhibits are incorporated herein by reference to the exhibit indicated in the parenthetical references.
|
|
**
|
Indicates a management contract or compensatory plan or arrangement.
|
|
***
|
In accordance with Regulation S-T, the XBRL-related information in Exhibit 101 to this Annual Report on Form 10-K shall be deemed to be “furnished” and not “filed.”
|
116
Pursuant to the requirements of Section 13 or 15(d) of the Securities Exchange Act of 1934, Griffon has duly caused this report to be signed on its behalf by the undersigned, thereunto duly authorized on the 20th day of November 2017.
|
|
Griffon Corporation
|
|
|
|
By:
|
/s/ Ronald J. Kramer
|
|
|
|
Ronald J. Kramer,
|
|
|
|
Chief Executive Officer
|
Pursuant to the requirements of the Securities Exchange Act of 1934, this report has been signed below on November 20, 2017 by the following persons on behalf of the Registrant in the capacities indicated:
|
/s/ Harvey R. Blau
|
|
Chairman of the Board
|
|
Harvey R. Blau
|
|
|
|
/s/ Ronald J. Kramer
|
|
Chief Executive Officer
|
|
Ronald J. Kramer
|
|
(Principal Executive Officer)
|
|
/s/ Brian G. Harris
|
|
Senior Vice President and Chief Financial Officer
|
|
Brian G. Harris
|
|
(Principal Financial Officer)
|
|
/s/ W. Christopher Durborow
|
Vice President, Controller and Chief Accounting Officer
|
|
|
W. Christopher Durborow
|
(Principal Accounting Officer)
|
|
|
/s/ Henry A. Alpert
|
|
Director
|
|
Henry A. Alpert
|
|
|
|
/s/ Thomas Brosig
|
|
Director
|
|
Thomas Brosig
|
|
|
|
/s/ Blaine V. Fogg
|
|
Director
|
|
Blaine V. Fogg
|
|
|
|
/s/ Louis J. Grabowsky
|
|
Director
|
|
Louis J. Grabowsky
|
|
|
|
/s/ Bradley J. Gross
|
|
Director
|
|
Bradley J. Gross
|
|
|
|
/s/ Robert G. Harrison
|
|
Director
|
|
Robert G. Harrison
|
|
|
|
/s/ Donald J. Kutyna
|
|
Director
|
|
Donald J. Kutyna
|
|
|
|
/s/ Victor Eugene Renuart
|
Director
|
|
|
Victor Eugene Renuart
|
||
|
/s/ Kevin F. Sullivan
|
Director
|
|
|
Kevin F. Sullivan
|
||
|
/s/ William H. Waldorf
|
|
Director
|
|
William H. Waldorf
|
||
117
TABLE OF CONTENTS
Part IItem 1. BusinessItem 1A. Risk FactorsItem 1B. Unresolved Staff CommentsItem 2. PropertiesItem 3. Legal ProceedingsItem 4. ReservedPart IIItem 5. Market For Registrant S Common Equity, Related Stockholder Matters and Issuer Purchases Of Equity SecuritiesItem 6. Selected Financial DataItem 7. Management S Discussion and Analysis Of Financial Condition and Results Of OperationsItem 7A. Quantitative and Qualitative Disclosures About Market RiskItem 8. Financial Statements and Supplementary DataNote 1 Description Of Business and Summary Of Significant Accounting PoliciesNote 2 AcquisitionsNote 3 InventoriesNote 4 Property, Plant and EquipmentNote 5 Goodwill and Other IntangiblesNote 6 Discontinued OperationsNote 7 Accrued LiabilitiesNote 8 Warranty LiabilityNote 9 Notes Payable, Capitalized Leases and Long-term DebtNote 9 Notes Payable, Capitalized LeasesNote 10 Employee Benefit PlansNote 11 Income TaxesNote 12 Stockholders Equity and Equity CompensationNote 12 StockholdersNote 13 Commitments and Contingent LiabilitiesNote 14 Earnings Per ShareNote 15 Related PartiesNote 16 Quarterly Financial Information (unaudited)Note 17 Reportable SegmentsNote 18 Other Income (expense)Note 19 - Other Comprehensive Income (loss)Note 20 Consolidating Guarantor and Non-guarantor Financial InformationNote 22 Subsequent EventsItem 9. Changes in and Disagreements with Accountants on Accounting and Financial DisclosureItem 9A. Controls and ProceduresItem 9B. Other InformationPart IIIPart Iii: Item 10,Item 12. Security Ownership Of Certain Beneficial Owners and Management and Related Stockholder MattersPart IVItem 15. Exhibits and Financial Statement Schedules