|
|
|
|
|
|
|
|
|
|
|
|
|
|
|
|
|
|
|
|
|
|
|
|
|
|
|
|
|
|
|
|
|
|
|
|
|
|
|
|
|
|
|
|
|
|
|
|
|
|
|
|
|
|
|
|
Table of Contents
UNITED STATES
SECURITIES AND EXCHANGE COMMISSION
WASHINGTON, D.C. 20549
FORM 10-K
| [X] | Annual Report Pursuant to Section 13 or 15(d) of the Securities Exchange Act of 1934 |
| for the fiscal year ended December 27, 2013 , or |
| [ ] | Transition report pursuant to Section 13 or 15(d) of the Securities Exchange Act of 1934 |
| for the transition period from to . |
Commission File No. 001-09249
Graco Inc.
(Exact name of Registrant as specified in its charter)
| Minnesota | 41-0285640 | |
| (State or other jurisdiction of incorporation or organization) | (I.R.S. Employer Identification No.) |
88 –11th Avenue Northeast
Minneapolis, MN 55413
(Address of principal executive offices) (Zip Code)
(612) 623-6000
(Registrant’s telephone number, including area code)
Securities registered pursuant to Section 12(b) of the Act:
Common Stock, par value $1.00 per share
Shares registered on the New York Stock Exchange.
Securities registered pursuant to Section 12(g) of the Act:
None
Indicate by check mark if the registrant is a well-known seasoned issuer, as defined in Rule 405 of the Securities Act. Yes X No
Indicate by check mark if the registrant is not required to file reports pursuant to Section 13 or Section 15(d) of the Act. Yes No X
Indicate by check mark whether the registrant (1) has filed all reports required to be filed by Section 13 or 15(d) of the Securities Exchange Act of 1934 during the preceding 12 months (or for such shorter period that the registrant was required to file such reports), and (2) has been subject to such filing requirements for the past 90 days. Yes X No
Indicate by check mark whether the registrant has submitted electronically and posted on its corporate Web site, if any, every Interactive Data file required to be submitted and posted pursuant to Rule 405 of Regulation S-T during the preceding 12 months (or for such shorter period that the registrant was required to submit and post such files). Yes X No
Indicate by check mark if disclosure of delinquent filers pursuant to Item 405 of Regulation S-K is not contained herein, and will not be contained, to the best of registrant’s knowledge, in definitive proxy or information statements incorporated by reference in Part III of this Form 10-K or any amendment to this Form 10-K. [X]
Indicate by check mark whether the registrant is a large accelerated filer, an accelerated filer, a non-accelerated filer or a smaller reporting company. See the definitions of “large accelerated filer” and “accelerated filer” in Rule 12b-2 of the Exchange Act (Check one):
Large accelerated filer X Accelerated filer Non-accelerated filer Smaller reporting company
Indicate by check mark whether the registrant is a shell company (as defined by Rule 12b-2 of the Act).
Yes No X
The aggregate market value of 60,501,329 shares of common stock held by non-affiliates of the registrant was $3,824,289,015 as of June 28, 2013.
60,862,154 shares of common stock were outstanding as of February 4, 2014.
DOCUMENTS INCORPORATED BY REFERENCE
Portions of the Company’s definitive Proxy Statement for its Annual Meeting of Shareholders to be held on April 25, 2014, are incorporated by reference into Part III, as specifically set forth in said Part III.
1
Table of Contents
ON FORM 10-K
| Page | ||||||
| Part I | ||||||
|
Item 1 |
3 | |||||
|
Item 1A |
7 | |||||
|
Item 1B |
9 | |||||
|
Item 2 |
10 | |||||
|
Item 3 |
12 | |||||
|
Item 4 |
12 | |||||
| 12 | ||||||
| Part II | ||||||
|
Item 5 |
14 | |||||
|
Item 6 |
15 | |||||
|
Item 7 |
Management’s Discussion and Analysis of Financial Condition and Results of Operations |
16 | ||||
|
Item 7A |
27 | |||||
|
Item 8 |
28 | |||||
|
Management’s Report on Internal Control Over Financial Reporting |
28 | |||||
| 29 | ||||||
| 31 | ||||||
| 31 | ||||||
| 32 | ||||||
| 33 | ||||||
| 34 | ||||||
|
Item 9 |
Changes in and Disagreements With Accountants on Accounting and Financial Disclosure |
56 | ||||
|
Item 9A |
56 | |||||
|
Item 9B |
56 | |||||
| Part III | ||||||
|
Item 10 |
57 | |||||
|
Item 11 |
57 | |||||
|
Item 12 |
Security Ownership of Certain Beneficial Owners and Management and Related Stockholder Matters |
57 | ||||
|
Item 13 |
Certain Relationships and Related Transactions, and Director Independence |
57 | ||||
|
Item 14 |
57 | |||||
| Part IV | ||||||
|
Item 15 |
58 | |||||
| 61 | ||||||
|
ACCESS TO REPORTS
Investors may obtain access free of charge to the Graco Inc. Annual Report on Form 10-K, quarterly reports on Form 10-Q, current reports on Form 8-K, other reports and amendments to the reports by visiting the Graco website at www.graco.com. These reports will be available as soon as reasonably practicable following electronic filing with, or furnishing to, the Securities and Exchange Commission.
|
2
Table of Contents
Graco Inc. and its subsidiaries (“Graco,” “us,” “we,” or “our Company”) design, manufacture and market premium equipment to pump, meter, mix and dispense a wide variety of fluids and coatings. Our equipment is used around the world in a broad range of industries, including construction; automotive; industrial and machinery; mining, oil and gas; public works and other industries.
We sell our products in the following geographic markets: North, Central and South America (the Americas); Europe, Middle East and Africa (EMEA); and Asia Pacific. Sales in the Americas represent approximately 54 percent of our Company’s total sales; sales in EMEA approximately 26 percent; and sales in Asia Pacific approximately 20 percent. Part II, Item 7, Results of Operations and Note B to the Consolidated Financial Statements of this Form 10-K contain financial information about these geographic markets. We provide marketing and product design in each of these geographic regions. Our Company also provides application assistance to distributors and employs sales personnel in each of these geographic regions.
We classify our business into three reportable segments, each with a worldwide focus: Industrial, Contractor and Lubrication. Financial information concerning these segments is set forth in Part II, Item 7, Results of Operations and Note B to the Consolidated Financial Statements of this Form 10-K.
Graco Inc. is a Minnesota corporation and was incorporated in 1926. For more information about our Company and our products, services and solutions, visit our website at www.graco.com. The information on the website is not part of this report nor any other report filed or furnished to the Securities and Exchange Commission (“SEC”).
Our Company’s Strengths and Objectives
We specialize in providing fluid handling equipment solutions for difficult-to-handle materials with high viscosities, abrasive or corrosive properties and multiple component materials that require precise ratio control. We aim to serve niche markets, providing high customer value through product differentiation. Our products enable customers to reduce their use of labor, material and energy, improve quality and achieve environmental compliance.
We strive for, and we believe we achieve, manufacturing and engineering excellence. We centralize our manufacturing operations, which allows for leveraging overhead. Graco has a continuous improvement culture, and we make ongoing capital investments in our manufacturing facilities. Our high quality manufacturing and engineering drive cost savings, reliability and quality in our products.
Our strategies for long-term growth include investing in new products, expanding geographically, targeting new industries and making acquisitions. We make significant investments in developing innovative, high quality products. We strategically add commercial resources focused on expanding third party distribution in growing and emerging markets. We leverage our product technologies for new applications and markets. We make targeted acquisitions, including one small acquisition in 2013 and a second small acquisition in early fiscal year 2014. We coordinate and drive these long-term growth strategies across our geographic regions.
We have strong relationships with material suppliers, end users and channel partners. Our channel partners, which include independent distributors and selective retailers, are present and active throughout our geographic regions. We have been successful in growing third party distribution with experience in specialized end user applications. We intend to further add and develop specialized third party distribution in all geographic regions to reach the new end user markets and applications that are the focus of many of our new product development initiatives.
Our Company’s financial performance has been consistently strong, in part due to an ability to leverage our operations. Our management strives to provide excellent returns for our shareholders.
Manufacturing and Distribution
We manufacture most of our products in the United States. We also manufacture some of our products in Belgium, Romania, Switzerland and the People’s Republic of China (“P.R.C.”). Our manufacturing is aligned with our business segments and is co-located with product development to accelerate technology improvements and improve our cost structure. We do critical machining, assembly and testing in-house for most of our products to control quality, improve response time and maximize cost-effectiveness. We make our products in focused factories and product cells. We source raw materials and components from suppliers around the world.
We sell our equipment primarily through third party distributors worldwide. We primarily distribute our products from our warehouses to distributors, who sell our products to end users. Outside of the United States, our subsidiaries located in Australia,
3
Table of Contents
Belgium, Japan, Italy, Korea, Mexico, the P.R.C. and Switzerland distribute our Company’s products. Significant operations in Maasmechelen, Belgium; St. Gallen, Switzerland; and Shanghai, P.R.C. reinforce our commitment to their regions.
During 2013, manufacturing capacity met business demand. Production requirements in the immediate future are expected to be met through existing facilities, the installation of new automatic and semi-automatic machine tools, efficiency and productivity improvements, the use of leased space and available subcontract services.
For more details on our facilities, see Item 2, Properties .
Product Development
Our primary product development efforts are carried out in facilities located in Minneapolis, Anoka and Rogers, Minnesota; North Canton, Ohio; St. Gallen, Switzerland; and Suzhou, P.R.C. The product development and engineering groups focus on new product design, product improvements, new applications for existing products and strategic technologies for their specific customer base. Our product development efforts focus on bringing new and supplemental return-on-investment value to end users of our products. Total product development expenditures for all segments were $51 million in 2013, $49 million in 2012, and $42 million in 2011.
Our Company consistently makes significant investments in new products, and in 2013 we invested $51 million, or 4.6 percent of sales, in our product development activities. Our product development activities are focused both on upgrades to our current product lines to provide features and benefits that will provide a return-on-investment to our end user customers and on development of products that will reach into new industries and applications to incrementally grow our sales. Sales of products that refresh and upgrade our product lines are measured and compared to planned results. Sales of products that provide entry into new industries and applications are also measured, with additional focus on commercial resources and activities to build specialized third party distribution and market acceptance by end users.
Business Segments
Industrial Segment
The Industrial segment is the largest of our Company’s businesses and represents approximately 59 percent of our total sales. This segment includes the Applied Fluid Technologies division, Industrial Products division and Process division. The Industrial segment primarily makes products for industrial customers that manufacture their own products (such as appliances, vehicles, airplanes and furniture).
Most Industrial segment equipment is sold worldwide through specialized third party distributors, integrators, design centers, original equipment manufacturers and material suppliers. Some products are sold directly to end users. We work with material suppliers to develop or adapt our equipment for use with specialized and hard-to-handle materials. Distributors promote and sell the equipment, hold inventory, provide product application expertise and offer on-site service, technical support and integration capabilities. Integrators implement large individual installations in manufacturing plants where products and services from a number of different manufacturers are aggregated into a single system. Design centers engineer systems for their customers using our products. Original equipment manufacturers incorporate our Company’s Industrial segment products into systems and assemblies that they then supply to their customers.
Applied Fluid Technologies
In addition to making products for use by industrial customers, the Applied Fluid Technologies division also sells equipment for use by construction contractors. The Applied Fluid Technologies division makes equipment to pump, meter, mix and dispense high performance protective coatings and polyurethane foam (protective coatings and foam); and equipment to pump, meter, mix and dispense sealants and adhesives and composites (advanced fluid dispense).
We make plural component proportioning equipment that applies polyurethane foam to insulate walls, roofing, water heaters, refrigerators, hot tubs and other items. This equipment is used in packaging, architectural design and cavity filling. We also make equipment that applies two-component polyurea coatings to tanks, pipes, roofs, truck beds and concrete. In 2013, we purchased EcoQuip Inc. EcoQuip manufactures vapor-abrasive blasting equipment, which is a product category complementary to protective coatings equipment.
Our advanced fluid dispense products include pumps, meters, applicators and valves that meter, mix and dispense sealant and adhesives. This equipment bonds, molds, seals, vacuum encapsulates, laminates and gaskets parts and devices in a wide variety of industrial applications. We also offer advanced composites equipment, which includes gel coat equipment, chop and wet-out systems, resin transfer molding systems and applicators. This equipment is used, for example, in the manufacture of vehicles, aircraft, boats, wind turbines and bridge materials.
4
Table of Contents
A key product strategy of the Applied Fluid Technologies division is to create and sell technologically superior equipment. We also strive to offer a full range of best-value standard products by using a standardized, modular product structure, with pre-engineered products to cover a broad range of configurations and applications.
Industrial Products
The Industrial Products division makes finishing equipment that applies paint and other coatings to products such as motor vehicles, appliances, furniture and other industrial and consumer products. Our finishing equipment includes liquid and powder finishing products. Our finishing equipment pumps, meters and applies liquids on wood, metals and plastics, and coats powder finish on metals. Finishing strategies include creating and selling technologically superior equipment, providing environmental compliance solutions and providing excellent end user service through specialized third party distribution.
Our liquid finishing equipment includes paint circulating and paint supply pumps, paint circulating advanced control systems, plural component coating proportioners, various accessories to filter, transport, agitate and regulate fluid, and spare parts such as spray tips, seals and filter screens. We also offer a variety of applicators that use different methods of atomizing and spraying the paint or other coatings depending on the viscosity of the fluid, the type of finish desired, and the need to maximize transfer efficiency, minimize overspray and minimize the release of volatile organic compounds into the air. Manufacturers in the automotive, automotive feeder, commercial and recreational vehicle, military and utility vehicle, aerospace, farm, construction, wood and general metals industries use our liquid finishing products.
Our powder finishing products are sold under the Gema® trademark. Gema powder systems coat window frames, metallic furniture, automotive components and sheet metal. Primary end-users of our Gema powder finishing products include manufacturers in the construction, home appliance, automotive component and custom coater industries. We strive to provide innovative production solutions in powder coating for end users in emerging and developed markets.
Process
Our Process division makes pumps that move chemicals, petroleum, food and other fluids. The Process division strives to provide high quality, long lasting products with differentiated technology for specified applications. Manufacturers and processors in the food and beverage, dairy, pharmaceutical, cosmetic, oil and gas, electronics, wastewater, mining and ceramics industries use our pumps. We offer pumps for sanitary applications including FDA-compliant 3-A sanitary pumps, diaphragm pumps, transfer pumps and drum and bin unloaders. Our pumps provide a mechanized solution to a traditionally manual process in a factory of moving fluids from large barrels into equipment that dispenses the fluid into jars or other containers. Subsequent to the 2013 fiscal year end, we purchased QED Environmental Systems, Inc. QED Environmental Systems is a manufacturer of fluid management solutions for the environmental monitoring and remediation industries, an industry in which we have had little previous presence.
Contractor Segment
The Contractor segment generated approximately 31 percent of our Company’s 2013 total sales. The Contractor segment directs its product development, sales and marketing efforts toward three broad applications: paint, texture and pavement maintenance. The Contractor segment markets airless paint and texture sprayers (air, gas, hydraulically- and electrically-powered), accessories (spray guns, hoses and filters) and spare parts (tips and seals) to professional painters in the construction and maintenance industries, tradesmen and do-it-yourselfers. The products are distributed primarily through distributor outlets whose main products are paint and other coatings. Contractor products are also sold through general equipment distributors outside of North America. Certain sprayers and accessories are distributed globally through the home center channel.
Contractor equipment includes a wide variety of sprayers, such as sprayers that apply markings on roads, parking lots, fields, bike paths, crosswalks and floors; texture to walls and ceilings; highly viscous coatings to roofs; and paint to walls and structures. Contractor equipment includes scarifiers that remove markings on roads and other surfaces. We also offer several models of professional grade handheld paint sprayers.
Our Contractor segment sells broad product families with multiple offerings. Our Contractor segment strives for technological innovation in its products. Painters are encouraged to upgrade their equipment regularly to take advantage of the new and/or more advanced features. The Contractor segment strives to expand base markets using new and core technologies.
Contractor products are marketed and sold in all major geographic areas. We continue to add distributors throughout the world that specialize in the sale of Contractor products. Throughout the world, we are pursuing a broad strategy of converting contractors accustomed to manually applying paint and other coatings by brush-and-roller to spray technology.
5
Table of Contents
Lubrication Segment
The Lubrication segment represented approximately 10 percent of our Company’s sales during 2013. The Lubrication segment focuses its engineering, marketing and sales efforts on two main applications: vehicle services and industrial lubrication. The Lubrication segment markets and sells our lubrication equipment worldwide, although the bulk of its sales come from North America. Our lubrication products are sold through independent third party distributors and directly to original equipment manufacturers. Our key Lubrication segment strategies are to provide products with differentiated features that are unique to the industries served and to develop products for geographic expansion. We continue to expand our Lubrication segment sales and marketing resources in EMEA, Asia Pacific, and South and Central America.
In vehicle services, we supply pumps, hose reels, meters, valves and accessories. Our customers include fast oil change facilities, service garages, fleet service centers, automobile dealerships, auto parts stores, service truck builders and heavy equipment service centers.
In industrial lubrication, we offer systems, components and accessories for the automatic lubrication of industrial and commercial equipment, compressors, turbines and on- and off-road vehicles. We offer products that automatically lubricate bearings, gears and generators, and products that evacuate and dispense lubricants. Industries served include gas transmission and petrochemical, pulp and paper, mining and construction, agricultural equipment, food and beverage, material handling, metal manufacturing, wind energy and oil and gas exploration. In 2013, we introduced new electric grease pumps for the mining and heavy equipment industries.
Raw Materials
The primary materials and components in our products are steel of various alloys, sizes and hardness; specialty stainless steel and aluminum bar stock, tubing and castings; tungsten carbide; electric and gas motors; injection molded plastics; sheet metal; forgings; powdered metal; hoses; and electronic components. The materials and components that we use are generally adequately available through multiple sources of supply. To manage cost, we engage in significant global sourcing of materials and components, primarily in the Asia Pacific region.
In 2013, our raw material costs were fairly stable, although we experienced price decreases in copper, stainless steel, aluminum and rare earth metals. These price decreases were somewhat offset by price increases in certain specialty resins and steels. We did not experience any significant shortages of materials in 2013.
We endeavor to address fluctuations in the price and availability of various materials and components through adjustable surcharges and credits, close management of current suppliers, price negotiations and an intensive search for new suppliers. We have performed risk assessments of our key suppliers, and we factor the risks identified into our commodity plans.
Intellectual Property
We own a number of patents and have patent applications pending both in the United States and in other countries, license our patents to others, and are a licensee of patents owned by others. In our opinion, our business is not materially dependent upon any one or more of these patents or licenses. Our Company also owns a number of trademarks in the United States and foreign countries, including registered trademarks for “GRACO,” “Gema,” several forms of a capital “G,” and various product trademarks that are material to our business, inasmuch as they identify Graco and our products to our customers.
Competition
We encounter a wide variety of competitors that vary by product, industry and geographic area. Each of our segments generally has several competitors. Our competitors are both U.S. and foreign companies and range in size. We believe that our ability to compete depends upon product quality, product reliability, innovation, design, customer support and service, personal relationships, specialized engineering and competitive pricing. Although no competitor duplicates all of our products, some competitors are larger than our Company, both in terms of sales of directly competing products and in terms of total sales and financial resources. We also face competitors with different cost structures and expectations of profitability and these companies may offer competitive products at lower prices. We may have to refresh our product line and continue development of our distribution channel to stay competitive. We are also facing competitors who illegally sell counterfeits of our products or otherwise infringe on our intellectual property rights. We may have to increase our intellectual property enforcement activities.
Environmental Protection
Our compliance with federal, state and local environmental laws and regulations did not have a material effect upon our capital expenditures, earnings or competitive position during the fiscal year ended December 27, 2013.
6
Table of Contents
Employees
As of December 27, 2013, we employed approximately 2,700 persons, excluding the employees of the held separate Liquid Finishing businesses (see below). Of this total, approximately 850 were employees based outside the United States, and 800 were hourly factory workers in the United States. None of our Company’s United States employees are covered by a collective bargaining agreement. Various national industry-wide labor agreements apply to certain employees in various countries outside the United States. Compliance with such agreements has no material effect on our Company or our operations.
Acquisition and Planned Divestiture of ITW Liquid Finishing Businesses
We purchased the finishing businesses of Illinois Tool Works Inc. (“ITW Finishing Group”) in April 2012 (the “Finishing Brands Acquisition”). The acquisition included powder and liquid finishing equipment operations, technologies and brands. In liquid finishing, brands include Binks® spray finishing equipment, DeVilbiss® spray guns and accessories, Ransburg® electrostatic equipment and accessories and BGK curing technology (“Liquid Finishing”). In powder finishing, we acquired the Gema® business (“Powder Finishing”). In March 2012, the Federal Trade Commission (“FTC”) issued an order for our Company to hold the Liquid Finishing assets separate from our other businesses. In May 2012, the FTC issued a proposed decision and order that requires us to sell the held separate Liquid Finishing business assets no later than 180 days from the date the order becomes final. The FTC has not yet issued a final decision and order. We believe that the FTC will require us to sell all of the Liquid Finishing assets that are currently held separate. We have retained the services of an investment bank to help us market the held separate businesses and identify potential buyers.
Changes in Laws and Regulations – Changes may impact how we can do business and the cost of doing business around the world.
The speed and frequency of implementation and the complexity of new or revised laws and regulations globally appear to be increasing. In addition, as our business grows and/or geographically expands, we may become subject to laws and regulations previously inapplicable to our business. These laws and regulations increase our costs of doing business, may affect the manner in which our products will be produced or delivered and may impact our long-term ability to provide returns to our shareholders.
Economic Environment – Demand for our products depends on the level of commercial and industrial activity worldwide.
An economic downturn or financial market turmoil may depress demand for our equipment in all major geographies and markets. If our distributors and original equipment manufacturers are unable to purchase our products because of unavailable credit or unfavorable credit terms or are simply unwilling to purchase our products, our net sales and earnings will be adversely affected. An economic downturn may affect our ability to satisfy the financial covenants in the terms of our financing arrangements.
Growth Strategies – Our growth strategies may not provide the return on investment desired if we are not successful in implementation of these strategies.
Making acquisitions, investing in new products, expanding geographically and targeting new industries are among our growth strategies. We may not obtain the return on investment desired if we are not successful in implementing these growth strategies. Suitable acquisitions must be located, completed and effectively integrated into or added to our existing businesses or corporate structure for this growth strategy to be successful. We may not be able to obtain financing at a reasonable cost. We may be unsuccessful in acquiring and effectively integrating into or adding businesses to our current operations or corporate structure, and may not realize projected efficiencies and cost-savings from the businesses we acquire. We cannot predict how customers, competitors, suppliers and employees will react to the acquisitions that we make. We make significant investments in developing products that have innovative features and differentiated technology in their industries and in niche markets. We are expanding the geographies in which we do business with third party distributors. We cannot predict whether and when we will be able to realize the expected financial results and accretive effect of the acquisitions that we make, the new products that we develop and the channel expansions that we make.
Acquisition - Our acquisition of the finishing businesses of ITW includes a requirement that we divest the acquired Liquid Finishing businesses, which has not been completed and remains subject to FTC approval.
On April 2, 2012, the Company closed its $650 million acquisition of the ITW finishing businesses. The acquisition added the Gema business, a global leader in powder coating technology, which represented approximately one-third of the businesses purchased. The remaining two-thirds of the acquisition is a collection of Liquid Finishing businesses, which the FTC has ordered to be held separate
7
Table of Contents
from Gema and other Graco businesses while the FTC investigates and considers a settlement proposal from Graco. In compliance with the FTC’s order, the Liquid Finishing businesses are being run independently by existing management under the supervision of a trustee who reports directly to the FTC. In May 2012, the FTC issued a proposed decision and order, subject to a 30-day comment period, which requires Graco to sell the Liquid Finishing business assets, including business activities related to the development, manufacture, and sale of Liquid Finishing products under the Binks®, DeVilbiss®, Ransburg® and BGK brand names, no later than 180 days from the date the order becomes final. The FTC has not yet issued its final decision and order. The Company has retained the services of an investment bank to help it market the Liquid Finishing businesses and identify potential buyers. Until the sale of the Liquid Finishing business assets is completed, Graco must continue to hold the Liquid Finishing business assets separate from its other businesses and maintain them as viable and competitive. The hold separate order requires the Company to provide sufficient resources to maintain the viability, competitiveness and marketability of the Liquid Finishing businesses, including general funds, capital, working capital and reimbursement of losses. We cannot predict to what extent or when the required regulatory approvals will be obtained. We cannot predict the extent of the acquired businesses required to be divested, although we believe that the FTC will require us to sell all of the Liquid Finishing business assets that are currently held separate. Additional risk factors include whether the Company will be able to find a suitable purchaser(s) and structure the divestiture on acceptable terms, and whether the Company will be able to complete a divestiture in a time frame that is satisfactory to the FTC.
Political Instability – Uncertainty surrounding political leadership may limit our growth opportunities.
Domestic political instability, including government shut downs, may limit our ability to grow our business. International political instability may prevent us from expanding our business into certain geographies and may also limit our ability to grow our business. Terrorist activities and civil disturbances may harm our business.
Intellectual Property – Demand for our products may be affected by new entrants who copy our products and/or infringe on our intellectual property.
From time to time, our Company has been faced with instances where competitors have infringed or improperly used our intellectual property and/or taken advantage of our design and development efforts. The ability to enforce intellectual property varies across jurisdictions. Asian copiers are becoming more prevalent. If our Company is unable to effectively meet these challenges, they could adversely affect our revenues and profits and hamper our ability to grow.
Suppliers – Risks associated with foreign sourcing, supply interruption, delays in raw material or component delivery, supply shortages and counterfeit components may adversely affect our production or profitability.
We are sourcing an increasing percentage of our materials and components from suppliers outside the United States, and from suppliers within the United States who engage in foreign sourcing. Long lead times or supply interruptions associated with a global supply base may reduce our flexibility and make it more difficult to respond promptly to fluctuations in demand or respond quickly to product quality problems. Changes in exchange rates between the U.S. dollar and other currencies and fluctuations in the price of commodities may impact the manufacturing costs of our products and affect our profitability. Protective tariffs, unpredictable changes in duty rates, and trade regulation changes may make certain foreign-sourced parts no longer competitively priced. Long supply chains may be disrupted by environmental events or other political factors. Raw materials may become limited in availability from certain regions. Port labor disputes may delay shipments. We source a large volume and a variety of electronic components, which exposes us to an increased risk of counterfeit components entering our supply chain. If counterfeit components unknowingly become part of our products, we may need to stop delivery and rebuild our products. We may be subject to warranty claims and may need to recall products.
Foreign Operations – Conducting business internationally exposes our Company to risks that could harm our business.
In 2013, approximately 55 percent of our sales were generated by customers located outside the United States. We are increasing our presence in advancing economies. Operating and selling outside of the United States exposes us to certain risks that could adversely impact our sales volume, rate of growth or profitability. These risks include: complying with foreign legal and regulatory requirements, international trade factors (export controls, trade sanctions, duties, tariff barriers and other restrictions), protection of our proprietary technology in certain countries, potentially burdensome taxes, potential difficulties staffing and managing local operations, and changes in exchange rates. Changes in exchange rates will impact our reported sales and earnings and may make it difficult for some of our distributors to purchase products.
Competition – Our success depends upon our ability to develop, market and sell new products that meet our customers’ needs, and anticipate industry changes.
Our profitability will be affected if we do not develop new products and technologies that meet our customers’ needs. Our ability to develop, market and sell products that meet our customers’ needs depends upon a number of factors, including anticipating the
8
Table of Contents
features and products that our customers will need in the future, identifying and entering into new markets, and training our distributors. Changes in industries in which we participate, including consolidation of competitors and customers, could affect our success. Price competition and competitor strategies could affect our success.
Legal Proceedings – Costs associated with claims, litigation, administrative proceedings and regulatory reviews, and potentially adverse outcomes, may affect our profitability.
As our Company grows, we are at an increased risk of being a target in litigation, administrative proceedings and regulatory reviews. The cost of defending such matters appears to be increasing, particularly in the United States. We may also need to pursue claims or litigation to protect our interests. Such costs may adversely affect our Company’s profitability. Our businesses expose us to potential toxic tort, product liability and commercial claims. Successful claims against the Company may adversely affect our results.
Anti-Corruption Laws – We may incur costs and suffer damages if our employees, agents, distributors or suppliers violate anti-bribery, anti-corruption or trade laws and regulations.
Bribery, corruption and trade laws and regulations, and enforcement thereof, is increasing in frequency and severity on a global basis. If our internal controls and compliance program do not successfully prevent our employees, agents, distributors, suppliers and other third parties with whom we do business from violating anti-corruption laws, we may incur defense costs, fines, penalties and reputational damage.
Major Customers – Our Contractor segment depends on a few large customers for a significant portion of its sales. Significant declines in the level of purchases by these customers could reduce our sales and impact segment profitability.
Our Contractor segment derives a significant amount of revenue from a few large customers. Substantial decreases in purchases by these customers, difficulty in collecting amounts due or the loss of their business would adversely affect the profitability of this segment. The business of these customers is dependent upon the economic vitality of the construction and home maintenance markets. If these markets decline, the business of our customers could be adversely affected and their purchases of our equipment could decrease.
Variable Industries – Our success may be affected by variations in the construction and automotive industries.
Our business may be affected by fluctuations in residential, commercial and institutional building and remodeling activity. Changes in construction materials and techniques may also impact our business. Our business may also be affected by fluctuations in the automotive industry.
Security Breaches – Intrusion into our information systems may impact our business.
Security breaches or intrusion into our information systems, and the breakdown, interruption in or inadequate upgrading or maintenance of our information processing software, hardware or networks may impact our business. Security breaches or intrusion into the systems or data of the third parties with whom we conduct business may also harm our business.
Natural Disasters – Our operations are at risk of damage or destruction by natural disasters.
The loss of, or substantial damage to, one of our facilities could make it difficult to supply our customers with product and provide our employees with work. Flooding, tornadoes, typhoons, unusually heavy precipitation or earthquakes could adversely impact our operations.
None.
9
Table of Contents
Our facilities are in satisfactory condition, suitable for their respective uses, and are generally adequate to meet current needs. A description of our principal facilities is set forth in the chart below. Facilities are used by all segments, unless otherwise noted.
|
|
||||||||||
| Facility |
Owned or Leased |
Square Footage |
Facility Activities | |||||||
|
|
||||||||||
|
North America
|
||||||||||
| Tlalnepantla, State of Mexico, Mexico | Leased | 4,000 |
Manufacturing, warehouse and office for Industrial segment
|
|||||||
| Oakland, California, United States | Leased | 1,500 |
Warehouse for Industrial segment
|
|||||||
| San Leandro, California, United States | Leased | 12,100 |
Manufacturing, warehouse and office for Industrial segment
|
|||||||
| Indianapolis, Indiana, United States | Owned | 63,500 |
Warehouse, office, product development and application laboratory for Industrial segment
|
|||||||
| Dexter, Michigan, United States | Leased | 31,300 |
Manufacturing, warehouse, office, and product development for Industrial segment
|
|||||||
| Minneapolis, Minnesota, United States | Owned | 142,000 |
Corporate office; office and product development for Industrial segment
|
|||||||
| Minneapolis, Minnesota, United States | Owned | 42,000 |
Office for Information Systems, Accounting Services and Purchasing Departments
|
|||||||
| Minneapolis, Minnesota, United States | Owned | 405,000 |
Manufacturing, warehouse and office for Industrial segment
|
|||||||
| Minneapolis, Minnesota, United States | Owned | 86,700 |
Warehouse
|
|||||||
| Anoka, Minnesota, United States | Owned | 207,000 |
Manufacturing, warehouse, office and product development for Lubrication segment
|
|||||||
| Rogers, Minnesota, United States | Owned | 333,000 |
Manufacturing, warehouse, office and product development for Contractor segment
|
|||||||
| Rogers, Minnesota, United States | Leased | 227,100 |
Warehouse and office
|
|||||||
| Rogers, Minnesota, United States | Leased | 42,900 |
Warehouse and office
|
|||||||
| North Canton, Ohio, United States | Owned | 132,000 |
Manufacturing, warehouse, office, product development and application laboratory for Industrial segment
|
|||||||
| Sioux Falls, South Dakota, United States | Owned | 149,000 |
Manufacturing, warehouse and office for Industrial and Contractor segment spray guns and accessories
|
|||||||
| Chesapeake, Virginia, United States | Leased | 9,600 |
Manufacturing and office for Industrial segment
|
|||||||
| Chesapeake, Virginia, United States | Leased | 3,300 |
Warehouse for Industrial segment
|
|||||||
|
Europe
|
||||||||||
| Maasmechelen, Belgium | Owned | 175,000 | Warehouse, office and assembly; European training, testing and education center | |||||||
10
Table of Contents
| Valence, France | Leased | 3,900 |
Office for Industrial segment
|
|||||||||
| Rödermark, Germany | Leased | 8,600 |
Warehouse and office for Industrial segment
|
|||||||||
| Milan, Italy | Leased | 7,500 |
Office and warehouse for Industrial segment
|
|||||||||
| Sibiu, Romania | Leased | 31,000 |
Manufacturing for Industrial segment
|
|||||||||
| St. Gallen, Switzerland | Owned | 78,000 |
Manufacturing, warehouse, office, product development and application laboratory for Industrial segment
|
|||||||||
| St. Gallen, Switzerland | Leased | 9,000 |
Manufacturing for Industrial segment
|
|||||||||
| Poole, Dorset, United Kingdom | Leased | 3,500 |
Office and warehouse for Industrial segment
|
|||||||||
|
Asia Pacific
|
||||||||||||
| Bundoora, Australia | Leased | 2,500 |
Office
|
|||||||||
| Derrimut, Australia | Leased | 7,500 |
Warehouse
|
|||||||||
| Shanghai, P.R.C. | Leased | 29,000 |
Office; Asia Pacific training, testing and education center
|
|||||||||
|
Shanghai Waiqaoqiao Free Trade Zone, P.R.C. |
Leased | 13,700 |
Warehouse
|
|||||||||
| Shanghai, P.R.C. | Leased | 27,000 |
Office and warehouse for Industrial segment
|
|||||||||
| Suzhou, P.R.C. | Owned | 79,000 |
Manufacturing, warehouse, office and product development
|
|||||||||
| Yokohama, Japan | Leased | 18,500 |
Office
|
|||||||||
| Anyang, South Korea | Leased | 5,100 |
Office
|
|||||||||
| Gwangjoo, South Korea | Leased | 10,700 |
Warehouse
|
|||||||||
11
Table of Contents
Our Company is engaged in routine litigation, administrative proceedings and regulatory reviews incident to our business. It is not possible to predict with certainty the outcome of these unresolved matters, but management believes that they will not have a material effect upon our operations or consolidated financial position.
Not applicable.
Executive Officers of Our Company
The following are all the executive officers of Graco Inc. as of February 18, 2014:
Patrick J. McHale, 52, is President and Chief Executive Officer, a position he has held since June 2007. He served as Vice President and General Manager, Lubrication Equipment Division from June 2003 to June 2007. He was Vice President, Manufacturing and Distribution Operations from April 2001 to June 2003. He served as Vice President, Contractor Equipment Division from February 2000 to April 2001. From September 1999 to February 2000, he was Vice President, Lubrication Equipment Division. Prior to September 1999, he held various manufacturing management positions in Minneapolis, Minnesota; Plymouth, Michigan; and Sioux Falls, South Dakota. Mr. McHale joined the Company in 1989.
David M. Ahlers, 55, became Vice President, Human Resources and Corporate Communications in April 2010. From September 2008 through March 2010, he served as the Company’s Vice President, Human Resources. Prior to joining Graco, Mr. Ahlers held various human resources positions, including, most recently, Chief Human Resources Officer and Senior Managing Director of GMAC Residential Capital, from August 2003 to August 2008. He joined the Company in 2008.
Caroline M. Chambers, 49, was elected Vice President, Corporate Controller and Information Systems on December 6, 2013. She has also served as the Company’s principal accounting officer since September 2007. From April 2009 to December 2013, she was Vice President and Corporate Controller. She served as Vice President and Controller from December 2006 to April 2009. She was Corporate Controller from October 2005 to December 2006 and Director of Information Systems from July 2003 through September 2005. Prior to becoming Director of Information Systems, she held various management positions in the internal audit and accounting departments. Prior to joining Graco, Ms. Chambers was an auditor with Deloitte & Touche in Minneapolis, Minnesota and Paris, France. Ms. Chambers joined the Company in 1992.
Mark D. Eberlein, 53, is Vice President and General Manager, Process Division, a position he has held since January 2013. From November 2008 to December 2012, he was Director, Business Development, Industrial Products Division. He was Director, Manufacturing Operations, Industrial Products Division from January to October 2008. From 2001 to 2008, he was Manufacturing Operations Manager of a variety of Graco business divisions. Prior to joining Graco, Mr. Eberlein worked as an engineer at Honeywell and at Sheldahl. He joined the Company in 1996.
Karen Park Gallivan, 57, became Vice President, General Counsel and Secretary in September 2005. She was Vice President, Human Resources from January 2003 to September 2005. Prior to joining Graco, she was Vice President of Human Resources and Communications at Syngenta Seeds, Inc. from January 1999 to January 2003. From 1988 through January 1999, she was the general counsel of Novartis Nutrition Corporation. Prior to joining Novartis, Ms. Gallivan was an attorney with the law firm of Rider, Bennett, Egan & Arundel, L.L.P. She joined the Company in 2003.
James A. Graner, 69, became Chief Financial Officer in September 2005, a position he held in conjunction with Treasurer from September 2005 to June 2011. He served as Vice President and Controller from March 1994 to September 2005. He was Treasurer from May 1993 through February 1994. Prior to becoming Treasurer, he held various managerial positions in the treasury, accounting and information systems departments. He joined the Company in 1974.
Dale D. Johnson, 59, became Vice President and General Manager, Contractor Equipment Division in April 2001. From January 2000 through March 2001, he served as President and Chief Operating Officer. From December 1996 to January 2000, he was Vice President, Contractor Equipment Division. Prior to becoming the Director of Marketing, Contractor Equipment Division in June 1996, he held various marketing and sales positions in the Contractor Equipment division and the Industrial Equipment division. He joined the Company in 1976.
Jeffrey P. Johnson, 54, became Vice President and General Manager, EMEA in January 2013. From February 2008 to December 2012 he was Vice President and General Manager, Asia Pacific. He served as Director of Sales and Marketing, Applied Fluid Technologies Division, from June 2006 until February 2008. Prior to joining Graco, he held various sales and marketing positions,
12
Table of Contents
including, most recently, President of Johnson Krumwiede Roads, a full-service advertising agency, and European sales manager at General Motors Corp. He joined the Company in 2006.
David M. Lowe, 58, became Executive Vice President, Industrial Products Division in April 2012. From February 2005 to April 2012, he was Vice President and General Manager, Industrial Products Division. He was Vice President and General Manager, European Operations from September 1999 to February 2005. Prior to becoming Vice President, Lubrication Equipment Division in December 1996, he was Treasurer. Mr. Lowe joined the Company in 1995.
Bernard J. Moreau, 53, is Vice President and General Manager, South and Central America, a position he has held since January 2013. From November 2003 to December 2012, he was Sales and Marketing Director, EMEA, Industrial/Automotive Equipment Division. From January 1997 to October 2003, he was Sales Manager, Middle East, Africa and East Europe. Prior to 1997, he worked in various Graco sales engineering and sales management positions, mainly to support Middle East, Africa and southern Europe territories. He joined the Company in 1985.
Peter J. O’Shea, 49, became Vice President and General Manager, Asia Pacific in January 2013. From January 2012 until December 2012, he was Director of Sales and Marketing, Industrial Products Division, and from 2008 to 2012, he was Director of Sales and Marketing, Industrial Products Division and Applied Fluid Technologies Division. He was Country Manager, Australia - New Zealand from 2005 to 2008, and from 2002 to 2005 he served as Business Development Manager, Australia - New Zealand. Prior to becoming Business Development Manager, Australia - New Zealand, he worked in various Graco sales management positions. Mr. O’Shea joined the Company in 1995.
Charles L. Rescorla, 62, was elected Vice President, Corporate Manufacturing, Distribution Operations and Corporate Development on December 6, 2013. From June 2011 to December 2013, he was Vice President, Corporate Manufacturing, Information Systems and Distribution Operations. He was Vice President, Manufacturing, Information Systems and Distribution Operations from April 2009 to June 2011. He served as Vice President, Manufacturing and Distribution Operations from September 2005 to April 2009. From June 2003 to September 2005, he was Vice President, Manufacturing/Distribution Operations and Information Systems. From April 2001 until June 2003, he was Vice President and General Manager, Industrial/Automotive Equipment Division. Prior to April 2001, he held various positions in manufacturing and engineering management. Mr. Rescorla joined the Company in 1988.
Christian E. Rothe, 40, became Vice President and Treasurer in June 2011. Prior to joining Graco, he held various positions in business development, accounting and finance, including, most recently, at Gardner Denver, Inc., a manufacturer of highly engineered products, as Vice President, Treasurer from January 2011 to June 2011, Vice President - Finance, Industrial Products Group from October 2008 to January 2011, and Director, Strategic Planning and Development from October 2006 to October 2008. Mr. Rothe joined the Company in 2011.
Mark W. Sheahan, 49, became Vice President and General Manager, Applied Fluid Technologies Division in February 2008. He served as Chief Administrative Officer from September 2005 until February 2008, and was Vice President and Treasurer from December 1998 to September 2005. Prior to becoming Treasurer in December 1996, he was Manager, Treasury Services. He joined the Company in 1995.
Brian J. Zumbolo, 44, became Vice President and General Manager, Lubrication Equipment Division in August 2007. He was Director of Sales and Marketing, Lubrication Equipment and Applied Fluid Technologies, Asia Pacific, from November 2006 through July 2007. From February 2005 to November 2006, he was the Director of Sales and Marketing, High Performance Coatings and Foam, Applied Fluid Technologies Division. Mr. Zumbolo was the Director of Sales and Marketing, Finishing Equipment from May 2004 to February 2005. Prior to May 2004, he held various marketing positions in the Industrial Equipment division. Mr. Zumbolo joined the Company in 1999.
Except as otherwise noted above, the Board of Directors elected or re-elected the above executive officers to their current positions on December 7, 2012, effective January 1, 2013.
13
Table of Contents
Graco Common Stock
Graco common stock is traded on the New York Stock Exchange under the ticker symbol “GGG.” As of February 4, 2014, the share price was $67.67 and there were 60,862,154 shares outstanding and 2,767 common shareholders of record, which includes nominees or broker dealers holding stock on behalf of an estimated 42,000 beneficial owners.
High and low sales prices for the Company’s common stock and dividends declared for each quarterly period in the past two years were as follows:
|
First
Quarter |
Second
Quarter |
Third
Quarter |
Fourth
Quarter |
|||||||||||||
|
2013 |
||||||||||||||||
|
Stock price per share |
||||||||||||||||
|
High |
$ | 59.81 | $ | 65.43 | $ | 74.70 | $ | 79.66 | ||||||||
|
Low |
52.45 | 53.90 | 62.84 | 72.39 | ||||||||||||
|
Dividends declared per share |
0.25 | 0.25 | 0.25 | 0.28 | ||||||||||||
|
2012 |
||||||||||||||||
|
Stock price per share |
||||||||||||||||
|
High |
$ | 53.25 | $ | 56.66 | $ | 52.69 | $ | 53.25 | ||||||||
|
Low |
39.79 | 43.19 | 41.09 | 44.91 | ||||||||||||
|
Dividends declared per share |
0.23 | 0.23 | 0.23 | 0.25 | ||||||||||||
The graph below compares the cumulative total shareholder return on the common stock of the Company for the last five fiscal years with the cumulative total return of the S&P 500 Index and the Dow Jones Industrial Machinery Index over the same period (assuming the value of the investment in Graco common stock and each index was $100 on December 26, 2008, and all dividends were reinvested).
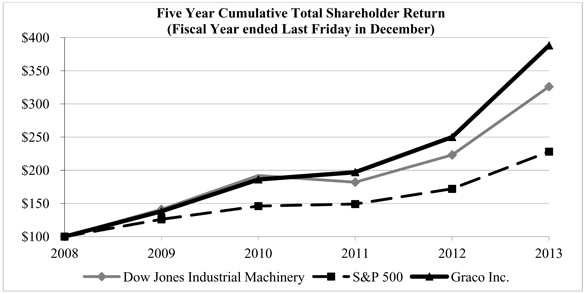
| 2008 | 2009 | 2010 | 2011 | 2012 | 2013 | |||||||
|
Dow Jones Industrial Machinery |
100 | 141 | 192 | 182 | 223 | 326 | ||||||
|
S&P 500 |
100 | 126 | 146 | 149 | 172 | 228 | ||||||
|
Graco Inc. |
100 | 138 | 186 | 197 | 250 | 388 |
14
Table of Contents
Issuer Purchases of Equity Securities
On September 14, 2012, the Board of Directors authorized the Company to purchase up to 6,000,000 shares of its outstanding common stock, primarily through open-market transactions. The authorization expires on September 30, 2015.
In addition to shares purchased under the Board authorization, the Company purchases shares of common stock held by employees who wish to tender owned shares to satisfy the exercise price or tax withholding on stock option exercises.
Information on issuer purchases of equity securities follows:
|
Period |
Total Number of Shares Purchased |
Average
Price Paid per Share |
Total Number of Shares Purchased as Part of Publicly Announced Plans or Programs |
Maximum Number of Shares that May Yet Be Purchased Under the Plans or Programs (at end of period) |
||||||||||||
|
Sep 28, 2013 - Oct 25, 2013 |
100,000 | $ | 75.70 | 100,000 | 5,469,918 | |||||||||||
|
Oct 26, 2013 - Nov 22, 2013 |
200,000 | $ | 77.63 | 200,000 | 5,269,918 | |||||||||||
|
Nov 23, 2013 - Dec 27, 2013 |
229,800 | $ | 76.59 | 229,800 | 5,040,118 | |||||||||||
Graco Inc. and Subsidiaries (in thousands, except per share amounts)
| 2013 | 2012 | 2011 | 2010 | 2009 | ||||||||||||||||
|
Net sales |
$ | 1,104,024 | $ | 1,012,456 | $ | 895,283 | $ | 744,065 | $ | 579,212 | ||||||||||
|
Net earnings |
210,822 | 149,126 | 142,328 | 102,840 | 48,967 | |||||||||||||||
|
Per common share |
||||||||||||||||||||
|
Basic net earnings |
$ | 3.44 | $ | 2.47 | $ | 2.36 | $ | 1.71 | $ | 0.82 | ||||||||||
|
Diluted net earnings |
3.36 | 2.42 | 2.32 | 1.69 | 0.81 | |||||||||||||||
|
Cash dividends declared |
1.03 | 0.93 | 0.86 | 0.81 | 0.77 | |||||||||||||||
|
Total assets |
$ | 1,327,228 | $ | 1,321,734 | $ | 874,309 | $ | 530,474 | $ | 476,434 | ||||||||||
|
Long-term debt (including current portion) |
408,370 | 556,480 | 300,000 | 70,255 | 86,260 | |||||||||||||||
Net sales in 2012 included $93 million from Powder Finishing operations acquired in April 2012. The Company used long-term borrowings and available cash balances to complete the $668 million purchase of Powder Finishing and Liquid Finishing businesses in 2012.
15
Table of Contents
The following Management’s Discussion and Analysis reviews significant factors affecting the Company’s consolidated results of operations, financial condition and liquidity. This discussion should be read in conjunction with our financial statements and the accompanying notes to the financial statements. The discussion is organized in the following sections:
| • | Overview |
| • | Acquisition |
| • | Results of Operations |
| • | Segment Results |
| • | Financial Condition and Cash Flow |
| • | Critical Accounting Estimates |
| • | Recent Accounting Pronouncements |
Overview
Graco designs, manufactures and markets systems and equipment to pump, meter, mix and dispense a wide variety of fluids and coatings. The Company specializes in equipment for applications that involve difficult-to-handle materials with high viscosities, materials with abrasive or corrosive properties and multiple-component materials that require precise ratio control. Graco sells primarily through independent third-party distributors worldwide to industrial and contractor end-users. More than half of our sales are outside of the United States. Graco’s business is classified by management into three reportable segments, each responsible for product development, manufacturing, marketing and sales of their products.
Graco’s key strategies include developing and marketing new products, leveraging products and technologies into additional, growing end user markets, expanding distribution globally and completing strategic acquisitions that provide additional channel and technologies. Long-term financial growth targets accompany these strategies, including our expectation of 10 percent revenue growth and 12 percent consolidated net earnings growth. In 2013, the Process division was created within the Industrial segment to provide specific focus on development of product and channel related to industrial in-plant applications. In addition, a regional management team was formed to focus on building commercial resources in South and Central America. We continued to develop new products in each division including products that are expected to drive incremental sales growth, such as the development of equipment for packaging applications as well as continued refresh and upgrades of existing product lines. We acquired EcoQuip and QED, with combined annual revenues of approximately $30 million. Both acquisitions were completed in December 2013, although the QED acquisition closed subsequent to fiscal year end.
Manufacturing is a key competency of the Company. Our management team in Minneapolis provides strategic manufacturing expertise, and is also responsible for factories not fully aligned with a single division. Our primary manufacturing facilities are in the United States and Switzerland, and our primary distribution facilities are located in the United States, Belgium, Switzerland, P.R.C., Japan, Korea and Australia.
Finishing Brands Acquisition
On April 2, 2012, we completed the Finishing Brands acquisition, including Powder Finishing operations and Liquid Finishing operations. Results of the Powder Finishing business have been included in the Industrial segment since the date of acquisition. Pursuant to the hold separate order issued by the FTC, the Liquid Finishing business is being held separate from the rest of Graco’s businesses until the FTC has issued its final order and the divestiture of the Liquid Finishing business is completed.
We have retained the services of an investment bank to help us market the Liquid Finishing businesses and identify potential buyers. While we seek a buyer, we must continue to hold the Liquid Finishing business assets separate from our other businesses and maintain them as viable and competitive. In accordance with the hold separate order, the Liquid Finishing businesses are managed independently by experienced Liquid Finishing business managers, under the supervision of a trustee appointed by the FTC, who reports directly to the FTC.
Under terms of the hold separate order, the Company does not have the power to direct the activities of the Liquid Finishing businesses that most significantly impact the economic performance of those businesses. Therefore, we have determined that the Liquid Finishing businesses are variable interest entities for which the Company is not the primary beneficiary and that they should not be consolidated. Furthermore, the Company does not have a controlling interest in the Liquid Finishing businesses, nor is it able to exert significant influence over the Liquid Finishing businesses. Consequently, our investment in the shares of the Liquid Finishing businesses has been reflected as a cost-method investment on our Consolidated Balance Sheets as of December 27, 2013 and December 28, 2012, and their results of operations have not been consolidated with those of the Company. As a cost-method investment, income is recognized based on dividends received from current earnings of Liquid Finishing. Dividends of $28 million
16
Table of Contents
and $12 million received in 2013 and 2012, respectively, are included in other expense (income) on the Consolidated Statements of Earnings. We evaluate our cost-method investment for other-than-temporary impairment at each reporting period. As of December 27, 2013, we evaluated our investment in Liquid Finishing and determined that there was no impairment.
Results of Operations
Net sales, operating earnings, net earnings and earnings per share were as follows (in millions except per share amounts):
| 2013 | 2012 | 2011 | ||||||||||
|
Net Sales |
$ | 1,104 | $ | 1,012 | $ | 895 | ||||||
|
Operating Earnings |
280 | 225 | 220 | |||||||||
|
Net Earnings |
211 | 149 | 142 | |||||||||
|
Diluted Net Earnings per Common Share |
$ | 3.36 | $ | 2.42 | $ | 2.32 | ||||||
2013 Summary:
| • | Net sales grew by 9 percent, including increases of 11 percent in the Americas, 10 percent in EMEA and 3 percent in Asia Pacific. Sales in the Industrial segment grew by 8 percent, sales in the Contractor segment grew by 15 percent and sales in the Lubrication segment decreased by 1 percent. |
| • | First quarter 2013 sales from acquired Powder Finishing operations contributed approximately 3 percentage points to 2013 sales growth. |
| • | Changes in currency translation rates did not have a significant impact on sales or earnings in 2013. |
| • | Gross profit margin as a percentage of sales increased to 55 percent from 54 percent. The effects of realized price increases and higher production volume offset the unfavorable effect of changes in product mix, including the effect of increased Powder Finishing equipment and Contractor segment sales. In 2012, non-recurring purchase accounting effects reduced gross margin for the year by approximately 1 percentage point. |
| • | Investment in new product development was $51 million or 5 percent of sales in 2013. |
| • | Total operating expenses increased $2 million over 2012, with increases in product development and selling and marketing activities largely offset by decreases in general and administrative expenses, including a $14 million decrease in acquisition and divestiture costs. |
| • | Operating earnings were 25 percent of sales in 2013 as compared to 22 percent in 2012. |
| • | Other expense (income) included dividends received from the Liquid Finishing businesses that are held separate from the Company’s other businesses. Dividends for 2013 and 2012 totaled $28 million and $12 million, respectively. |
| • | The effective tax rate was 27 percent, down from 31 percent in 2012. The lower rate for 2013 reflected the effects of higher after-tax dividend income received from the Liquid Finishing businesses and the federal R&D credit that was renewed in 2013, effective retroactive to the beginning of 2012. There was no R&D credit recognized in 2012. |
| • | Cash flows from operations grew to $243 million compared to $190 million in the prior year, with increases in working capital in line with volume growth. |
| • | Long-term debt was $408 million at December 27, 2013, compared to $556 million at December 28, 2012. |
| • | Dividends paid totaled $61 million in 2013. |
| • | The Company repurchased $68 million of its stock in 2013 compared to $1 million in 2012. |
2012 Summary:
| • | Our net sales grew by 13 percent, including increases of 13 percent in the Americas, 22 percent in EMEA and 5 percent in Asia Pacific. Sales in the Industrial segment grew by 20 percent, sales in the Contractor segment grew by 3 percent and sales in the Lubrication segment increased by 7 percent. |
| • | Sales from acquired Powder Finishing operations totaled $93 million since April 2012, or 10 percentage points of our total growth in 2012 sales, and included $19 million in the Americas, $52 million in EMEA and $22 million in Asia Pacific. |
| • | Foreign currency translation rates decreased sales by approximately $15 million and decreased earnings by approximately $5 million when compared to 2011 rates. |
| • | Operating earnings were 22 percent of sales in 2012 as compared to 25 percent in 2011. |
| • | Gross profit margin as a percentage of sales decreased 1 1 ⁄ 2 percentage points. Non-recurring purchase accounting effects related to acquired inventory totaled $7 million, reducing gross margin percentage for the year by approximately 1 percentage point. The effects of strong operational performance in legacy businesses offset the unfavorable effect of lower margin rates on acquired Powder Finishing operations. |
| • | Investment in new product development was $49 million or 5 percent of sales in 2012. |
| • | Total operating expenses were $45 million higher than 2011, including $25 million from Powder Finishing operations, an $8 million increase in acquisition and divestiture costs, $5 million from additional product development expenditures and an increase of $5 million in pension costs. |
17
Table of Contents
| • | The April purchase of Powder Finishing and Liquid Finishing operations had significant impacts on interest expense, an increase of $10 million for the year, and other expense (income), which included dividend income of $12 million received from the Liquid Finishing businesses held as a cost-method investment. |
| • | The effective tax rate was 31 percent as compared to 32 percent in 2011. The rate in 2012 was reduced by the effect of after-tax dividend income received from the Liquid Finishing investment. |
| • | Cash flows from operations grew to $190 million compared to $162 million in the prior year, with modest changes in working capital. |
| • | We paid $668 million to complete the Finishing Brands acquisition, which included the Powder Finishing operations that have been included in the Industrial segment since the date of acquisition and the Liquid Finishing operations that are held separate, using available cash and $350 million of borrowings on a new credit agreement. |
| • | Dividends paid totaled $54 million in 2012. |
The following table presents net sales by geographic region (in millions):
| 2013 | 2012 | 2011 | ||||||||||
|
Americas 1 |
$ | 595 | $ | 536 | $ | 476 | ||||||
|
EMEA 2 |
283 | 257 | 211 | |||||||||
|
Asia Pacific |
226 | 219 | 208 | |||||||||
|
|
|
|
|
|
|
|||||||
|
Total |
$ | 1,104 | $ | 1,012 | $ | 895 | ||||||
|
|
|
|
|
|
|
|||||||
| 1 | North, South and Central America, including the United States. Sales in the United States were $498 million in 2013, $441 million in 2012 and $394 million in 2011. |
| 2 | Europe, Middle East and Africa |
In 2013, sales in the Americas increased by 11 percent in total, with increases of 6 percent in the Industrial segment, 22 percent in the Contractor segment and flat in the Lubrication segment as compared to the prior year. The increase in the Americas was led by the Contractor segment, which benefited from growth in U.S. housing starts and construction spending. Increased sales in the Industrial segment were driven by improvement in a variety of general industrial, construction and process-related end-markets. Sales in the Lubrication segment reflected modest demand growth in vehicle service applications and a low rate of investment by industrial lubrication customers.
In 2013, sales in EMEA increased by 10 percent (8 percent at consistent translation rates). Sales in the Industrial segment increased by 12 percent (9 percent at consistent translation rates). Sales increased by 4 percent in the Contractor segment (2 percent at consistent translation rates) and increased by 14 percent in the Lubrication segment (12 percent at consistent translation rates). We continued to see growth during 2013 in the emerging markets of EMEA, though end-markets in many industries remained weak in Western Europe throughout much of the year.
In 2013, sales in Asia Pacific grew by 3 percent (5 percent at consistent translation rates). Sales increased by 7 percent in the Industrial segment (10 percent at consistent translation rates). Sales in the Contractor segment decreased by 4 percent (3 percent at consistent translation rates) and sales in the Lubrication segment decreased by 13 percent (10 percent at consistent translation rates). Industrial project activity was strong in the fourth quarter, which brought the Industrial segment back to modest growth for the year. However, we continue to see lack of growth in a number of markets throughout Asia Pacific, including shipyards, container manufacturing, heavy machinery, manufacturing, housing, paint and mining, and we face an increased level of competition in the region.
In 2012, sales in the Americas increased by 13 percent, with increases of 19 percent in the Industrial segment, 5 percent in the Contractor segment and 13 percent in the Lubrication segment as compared to the prior year. Growth related to the acquired Powder Finishing business was 4 percentage points. The increase in the Americas reflected strength across a range of product lines with growth in a number of industrial end-markets as well as growth in the housing and construction industries.
In 2012, sales in EMEA increased by 22 percent (28 percent at consistent translation rates), primarily due to the sales from Powder Finishing of $52 million since the acquisition. Sales of legacy Graco products in the Industrial segment decreased by 2 percent during 2012 (increased by 3 percent at consistent translation rates). Sales decreased by 5 percent in the Contractor segment (flat at consistent translation rates) and increased by 2 percent in the Lubrication segment (7 percent at consistent translation rates). We continued to see growth during 2012 in the emerging markets of Eastern Europe and the Middle East, though end-markets in many industries remained weak in Western Europe.
In 2012, sales in Asia Pacific grew by 5 percent overall. Sales of Powder Finishing equipment were $22 million from the date of acquisition. Sales decreased by 7 percent in 2012 for legacy Graco products in the Industrial segment. Sales in the Contractor
18
Table of Contents
segment grew by 4 percent and sales in the Lubrication segment decreased by 10 percent. Activity levels in many end-markets remained challenging throughout the region and across product categories throughout 2012.
The following table presents components of net sales change:
| 2013 | ||||||||||||||||||||||||||||||||
| Segment | Region | |||||||||||||||||||||||||||||||
| Industrial | Contractor | Lubrication | Americas | Europe | Asia Pacific | Consolidated | ||||||||||||||||||||||||||
|
Volume and Price |
3 % | 14 % | - % | 10 % | 2 % | 1 % | 6 % | |||||||||||||||||||||||||
|
Acquisitions |
5 % | - % | - % | 1 % | 6 % | 4 % | 3 % | |||||||||||||||||||||||||
|
Currency |
- % | 1 % | (1) % | - % | 2 % | (2) % | - % | |||||||||||||||||||||||||
|
|
|
|
|
|
|
|
|
|
|
|
|
|
|
|||||||||||||||||||
|
Total |
8 % | 15 % | (1) % | 11 % | 10 % | 3 % | 9 % | |||||||||||||||||||||||||
|
|
|
|
|
|
|
|
|
|
|
|
|
|
|
|||||||||||||||||||
| 2012 | ||||||||||||||||||||||||||||||||
| Segment | Region | |||||||||||||||||||||||||||||||
| Industrial | Contractor | Lubrication | Americas | Europe | Asia Pacific | Consolidated | ||||||||||||||||||||||||||
|
Volume and Price |
3 % | 4 % | 8 % | 9 % | 2 % | (5) % | 4 % | |||||||||||||||||||||||||
|
Acquisitions |
19 % | - % | - % | 4 % | 26 % | 10 % | 10 % | |||||||||||||||||||||||||
|
Currency |
(2) % | (1) % | (1) % | - % | (6) % | - % | (1) % | |||||||||||||||||||||||||
|
|
|
|
|
|
|
|
|
|
|
|
|
|
|
|||||||||||||||||||
|
Total |
20 % | 3 % | 7 % | 13 % | 22 % | 5 % | 13 % | |||||||||||||||||||||||||
|
|
|
|
|
|
|
|
|
|
|
|
|
|
|
|||||||||||||||||||
The following table presents an overview of components of operating earnings as a percentage of net sales:
| 2013 | 2012 | 2011 | ||||||||||
|
Net Sales |
100.0 % | 100.0 % | 100.0 % | |||||||||
|
Cost of products sold |
45.0 | 45.6 | 44.1 | |||||||||
|
|
|
|
|
|
|
|||||||
|
Gross profit |
55.0 | 54.4 | 55.9 | |||||||||
|
Product development |
4.7 | 4.8 | 4.7 | |||||||||
|
Selling, marketing and distribution |
16.1 | 16.2 | 16.9 | |||||||||
|
General and administrative |
8.9 | 11.2 | 9.8 | |||||||||
|
|
|
|
|
|
|
|||||||
|
Operating earnings |
25.3 | 22.2 | 24.5 | |||||||||
|
Interest expense |
1.6 | 1.9 | 1.0 | |||||||||
|
Other expense (income), net |
(2.5) | (1.1) | 0.1 | |||||||||
|
|
|
|
|
|
|
|||||||
|
Earnings before income taxes |
26.2 | 21.4 | 23.4 | |||||||||
|
Income taxes |
7.1 | 6.7 | 7.5 | |||||||||
|
|
|
|
|
|
|
|||||||
|
Net Earnings |
19.1 % | 14.7 % | 15.9 % | |||||||||
|
|
|
|
|
|
|
|||||||
2013 Compared to 2012
Operating earnings as a percentage of sales were 25 percent in 2013 as compared to 22 percent in 2012. Expense leverage and reductions of acquisition and divestiture costs led to the improvements in operating earnings as a percentage of sales.
Gross profit margin as a percentage of sales was 55 percent in 2013 as compared to 54 percent in 2012. The favorable effect of realized price increases and higher production volume offset the unfavorable effect of changes in product mix, including increased sales of powder finishing equipment and Contractor segment sales. For 2012, non-recurring purchase accounting effects reduced the gross margin percentage by approximately 1 percentage point.
Operating expenses for the year increased $2 million over 2012 with business activity-related increases largely offset by decreases in acquisition and divestiture costs in 2013. Acquisition and divestiture costs were $2 million in 2013, as compared to $16 million in 2012. Overall, product development spending was 5 percent of sales in 2013, consistent with 2012.
Interest expense was $18 million in 2013, a decrease of $1 million from 2012. Other expense (income) included dividends received from the Liquid Finishing businesses that are held separate from the Company’s other businesses. Dividends for the year totaled $28 million in 2013 and $12 million in 2012.
19
Table of Contents
The effective income tax rate was 27 percent for the year as compared to 31 percent in 2012. The lower rate for 2013 reflected the effects of higher after-tax dividend income received from the Liquid Finishing businesses and the federal R&D credit that was renewed in 2013, effective retroactive to the beginning of 2012. There was no R&D credit recognized in 2012.
2012 Compared to 2011
Operating earnings as a percentage of sales were 22 percent in 2012 as compared to 25 percent in 2011. The impact of purchase accounting related to the Powder Finishing acquisition, higher acquisition/divestiture costs and an increase in pension costs were partially offset by other operating improvements.
Gross profit margin as a percentage of sales was 54 percent in 2012 as compared to 56 percent in 2011. Non-recurring purchase accounting effects totaling $7 million related to acquired inventory with the Powder Finishing operations reduced the gross margin percentage by approximately 1 percentage point. Strong operating performance and cost management improved margins on the legacy Graco operations, partially offsetting the lower margin rates on acquired Powder Finishing operations.
Operating expenses for the year increased $45 million, including $25 million from Powder Finishing operations, an increase of $8 million for acquisition and divestiture costs, an increase of $5 million in product development spending and an increase of $5 million in pension expense. Overall, product development spending was 5 percent of sales in 2012, consistent with 2011.
The purchase of Powder Finishing and Liquid Finishing operations had significant impacts on interest expense (an increase of $10 million for the year) and other expense (income), which included dividend income of $12 million received from the Liquid Finishing businesses held as a cost-method investment.
The effective income tax rate was 31 percent for the year as compared to 32 percent in 2011. The 2012 effective tax rate was reduced by the effect of the investment income from the Liquid Finishing businesses held separate and the effect of a tax rate change on deferred liabilities related to a tax holiday received in a foreign jurisdiction.
Segment Results
The following table presents net sales and operating earnings by business segment (in millions):
| 2013 | 2012 | 2011 | ||||||||||
|
Sales |
||||||||||||
|
Industrial |
$ | 652 | $ | 603 | $ | 502 | ||||||
|
Contractor |
343 | 299 | 291 | |||||||||
|
Lubrication |
109 | 110 | 102 | |||||||||
|
|
|
|
|
|
|
|||||||
|
Total |
$ | 1,104 | $ | 1,012 | $ | 895 | ||||||
|
|
|
|
|
|
|
|||||||
|
Operating Earnings |
||||||||||||
|
Industrial |
$ | 211 | $ | 186 | $ | 174 | ||||||
|
Contractor |
72 | 54 | 51 | |||||||||
|
Lubrication |
23 | 23 | 19 | |||||||||
|
Unallocated corporate |
(26) | (38) | (24) | |||||||||
|
|
|
|
|
|
|
|||||||
|
Total |
$ | 280 | $ | 225 | $ | 220 | ||||||
|
|
|
|
|
|
|
|||||||
Management looks at economic and financial indicators relevant to each segment and geography to gauge the business environment, as noted in the discussion below for each segment.
20
Table of Contents
Industrial
The following table presents net sales, components of net sales change and operating earnings as a percentage of sales for the Industrial segment (dollars in millions):
| 2013 | 2012 | 2011 | ||||||||||
|
Sales |
||||||||||||
|
Americas |
$ | 276 | $ | 261 | $ | 220 | ||||||
|
EMEA |
206 | 184 | 135 | |||||||||
|
Asia Pacific |
170 | 158 | 147 | |||||||||
|
|
|
|
|
|
|
|||||||
|
Total |
$ | 652 | $ | 603 | $ | 502 | ||||||
|
|
|
|
|
|
|
|||||||
|
Components of Net Sales Change |
||||||||||||
|
Volume and Price |
3 % | 3 % | 20 % | |||||||||
|
Acquisitions |
5 % | 19 % | - % | |||||||||
|
Currency |
- % | (2) % | 3 % | |||||||||
|
|
|
|
|
|
|
|||||||
|
Total |
8 % | 20 % | 23 % | |||||||||
|
|
|
|
|
|
|
|||||||
|
Operating Earnings as a Percentage of Sales |
32 % | 31 % | 35 % | |||||||||
|
|
|
|
|
|
|
|||||||
In 2013, sales in the Industrial segment totaled $652 million, an increase of 8 percent from the prior year. First quarter 2013 sales from the acquired Powder Finishing operations contributed approximately 5 percentage points to the 2013 sales growth. Overall for the Industrial segment, sales increased by 6 percent in the Americas, increased 12 percent in EMEA (9 percent at consistent translation rates) and increased 7 percent in Asia Pacific (10 percent at consistent translation rates).
Operating earnings as a percentage of sales were 32 percent in 2013 as compared to 31 percent in 2012. The effects of purchase accounting related to inventory reduced the operating margin rate for 2012 by approximately 1 percentage point.
In 2012, sales in the Industrial segment totaled $603 million, an increase of 20 percent from the prior year, including $93 million from Powder Finishing operations acquired in April 2012. Without Powder Finishing, sales increased by 10 percent in the Americas, decreased 2 percent in EMEA (3 percent increase at consistent translation rates) and decreased 7 percent in Asia Pacific.
Operating earnings as a percentage of sales were 31 percent in 2012 as compared to 35 percent in 2011. Powder Finishing operations contributed to segment earnings, but at a lower rate on sales, which drove the decrease in the operating margin for the Industrial segment.
In this segment, sales in each geographic region are significant and management looks at economic and financial indicators in each region, including gross domestic product, industrial production, capital investment rates, automobile production, building construction and the level of the U.S. dollar versus the euro, the Canadian dollar, the Australian dollar and various Asian currencies.
21
Table of Contents
Contractor
The following table presents net sales, components of net sales change and operating earnings as a percentage of sales for the Contractor segment (dollars in millions):
| 2013 | 2012 | 2011 | ||||||||||
|
Sales |
||||||||||||
|
Americas |
$ | 237 | $ | 194 | $ | 184 | ||||||
|
EMEA |
67 | 64 | 68 | |||||||||
|
Asia Pacific |
39 | 41 | 39 | |||||||||
|
|
|
|
|
|
|
|||||||
|
Total |
$ | 343 | $ | 299 | $ | 291 | ||||||
|
|
|
|
|
|
|
|||||||
|
Components of Net Sales Change |
||||||||||||
|
Volume and Price |
14 % | 4 % | 11 % | |||||||||
|
Currency |
1 % | (1) % | 2 % | |||||||||
|
|
|
|
|
|
|
|||||||
|
Total |
15 % | 3 % | 13 % | |||||||||
|
|
|
|
|
|
|
|||||||
|
Operating Earnings as a Percentage of Sales |
21 % | 18 % | 17 % | |||||||||
|
|
|
|
|
|
|
|||||||
In 2013, sales in the Contractor segment increased 15 percent as compared to 2012. By geography, sales increased by 22 percent in the Americas, increased 4 percent in Europe (2 percent at consistent translation rates) and decreased 4 percent in Asia Pacific.
Operating earnings as a percentage of sales were 21 percent in 2013 as compared to 18 percent in 2012. Higher sales and the leveraging of expenses drove the improvement of operating earnings as a percentage of sales.
In 2012, sales in the Contractor segment increased 3 percent. By geography, sales increased by 5 percent in the Americas, decreased 5 percent in Europe (flat at consistent translation rates) and increased 4 percent in Asia Pacific.
Higher sales and the leveraging of expenses led to improvements in operating earnings as a percentage of sales.
In this segment, sales in all regions are significant and management reviews economic and financial indicators in each region, including levels of residential, commercial and institutional construction, remodeling rates and interest rates. Management also reviews gross domestic product for the regions and the level of the U.S. dollar versus the euro and other currencies.
Lubrication
The following table presents net sales, components of net sales change and operating earnings as a percentage of sales for the Lubrication segment (dollars in millions):
| 2013 | 2012 | 2011 | ||||||||||
|
Sales |
||||||||||||
|
Americas |
$ | 82 | $ | 81 | $ | 72 | ||||||
|
EMEA |
10 | 9 | 8 | |||||||||
|
Asia Pacific |
17 | 20 | 22 | |||||||||
|
|
|
|
|
|
|
|||||||
|
Total |
$ | 109 | $ | 110 | $ | 102 | ||||||
|
|
|
|
|
|
|
|||||||
|
Components of Net Sales Change |
||||||||||||
|
Volume and Price |
- % | 8 % | 30 % | |||||||||
|
Currency |
(1) % | (1) % | 2 % | |||||||||
|
|
|
|
|
|
|
|||||||
|
Total |
(1) % | 7 % | 32 % | |||||||||
|
|
|
|
|
|
|
|||||||
|
Operating Earnings as a Percentage of Sales |
21 % | 20 % | 18 % | |||||||||
|
|
|
|
|
|
|
|||||||
In 2013, sales in the Lubrication segment decreased by 1 percentage point compared to 2012. By geography, sales were flat in the Americas, increased 14 percent in EMEA, and decreased 13 percent in Asia Pacific.
22
Table of Contents
In 2012, sales in the Lubrication segment increased 7 percent. By geography, sales increased by 13 percent in the Americas, 2 percent in Europe (7 percent at consistent translation rates) and decreased 10 percent in Asia Pacific.
Operating earnings were $23 million or 20 percent of sales as compared to $19 million or 18 percent of sales in 2011. Improved gross margin rates and leveraging of expenses led to improvement in operating earnings as a percentage of sales.
Although the Americas represent the substantial majority of sales for the Lubrication segment and indicators in that region are the most significant, management monitors indicators such as levels of gross domestic product, capital investment, industrial production and mining activity worldwide.
Unallocated corporate
(in millions)
| 2013 | 2012 | 2011 | ||||||||||
|
Unallocated corporate (expense) |
$ | (26) | $ | (38) | $ | (24) | ||||||
Unallocated corporate includes items such as stock compensation, non-service portion of pension expense, bad debt expense, contributions to the Company’s charitable foundation and certain other charges or credits driven by corporate decisions, including expense related to acquisition/divestiture activities. In 2013, unallocated corporate included $16 million of stock compensation, $6 million related to the non-service cost portion of pension expense, $2 million related to acquisition/divestiture activities, and $2 million of contributions to the Company’s charitable foundation. In 2012, acquisition/divestiture expense totaled $16 million, stock compensation totaled $12 million, the non-service portion of pension expense was $8 million and contributions to the Company’s charitable foundation totaled $2 million.
Financial Condition and Cash Flow
Working Capital. The following table highlights several key measures of asset performance (dollars in millions):
| 2013 | 2012 | |||||||
|
Working capital |
$ | 624 | $ | 625 | ||||
|
Current ratio |
4.7 | 5.1 | ||||||
|
Days of sales in receivables outstanding |
60 | 62 | ||||||
|
Inventory turnover (LIFO) |
3.8 | 4.0 | ||||||
In 2013, the Company’s financial condition was strong. Cash flows from operations were $243 million, a 28 percent increase over 2012. Changes in receivables and inventories increased in line with volume growth. Primary uses of cash included net payments on long-term debt of $148 million, share repurchases of $68 million, dividends of $61 million, capital expenditures of $23 million and business acquisitions of $12 million.
Cash flows from operations totaled $190 million in 2012. Changes in receivables and inventories moderated during 2012 after increasing in 2011. Primary uses of cash included investments in businesses held separately of $427 million, business acquisitions of $240 million, payments on long-term lines of credit of $393 million, capital expenditures of $18 million and dividends of $54 million.
Capital Structure. At December 27, 2013, the Company’s capital structure included current notes payable of $10 million, long-term debt of $408 million and shareholders’ equity of $634 million. At December 28, 2012, the Company’s capital structure included current notes payable of $8 million, long-term debt of $556 million and shareholders’ equity of $454 million.
Shareholders’ equity increased by $180 million in 2013. The key components of changes in shareholders’ equity include current year earnings of $211 million, reduced by $70 million of shares repurchased and $63 million of dividends declared, and increased by $42 million for shares issued and increases in other comprehensive income due mainly to pension and post-retirement medical liability adjustments.
Liquidity and Capital Resources . The Company had cash totaling $20 million at December 27, 2013 and $31 million at December 28, 2012, held in deposit accounts.
There were no changes to the Company’s credit agreements during 2013. On March 27, 2012, the Company’s $250 million credit agreement was terminated in connection with the execution of a new unsecured revolving credit agreement. The current credit agreement is with a syndicate of lenders and expires in March 2017. It provides up to $450 million of committed credit,
23
Table of Contents
available for general corporate purposes, working capital needs, share repurchases and acquisitions. The Company may borrow up to $50 million under the swingline portion of the facility for daily working capital needs.
Under terms of the revolving credit agreement, loans denominated in U.S. dollars bear interest, at the Company’s option, at either a base rate or a LIBOR-based rate. Loans denominated in currencies other than U.S. dollars bear interest at a LIBOR-based rate. The base rate is an annual rate equal to a margin ranging from zero percent to 1 percent, depending on the Company’s cash flow leverage ratio (debt to earnings before interest, taxes, depreciation, amortization and extraordinary non-operating or non-cash charges and expenses) plus the highest of (i) the bank’s prime rate, (ii) the federal funds rate plus 0.5 percent or (iii) one-month LIBOR plus 1.5 percent. In general, LIBOR-based loans bear interest at LIBOR plus 1 percent to 2 percent, depending on the Company’s cash flow leverage ratio. The Company is also required to pay a fee on the undrawn amount of the loan commitment at an annual rate ranging from 0.15 percent to 0.40 percent, depending on the Company’s cash flow leverage ratio.
The agreement requires the Company to maintain certain financial ratios as to cash flow leverage and interest coverage. The Company is in compliance with all financial covenants of its debt agreements.
On April 2, 2012, the Company paid $660 million to complete the Finishing Brands acquisition, using available cash and $350 million of borrowings on the new credit agreement. In July 2012, the Company made an additional payment of $8 million, representing the difference between cash balances acquired and the amount estimated at the time of closing. Assets acquired in the acquisition included $18 million of cash, of which $6 million was available to Powder Finishing operations.
In May 2012, the FTC issued a proposed decision and order which requires Graco to sell the Liquid Finishing business assets, including Liquid Finishing business activities related to the development, manufacture, and sale of products under the Binks, DeVilbiss, Ransburg and BGK brand names, no later than 180 days from the date the order becomes final. The FTC has not yet issued its final decision and order. The Company has retained the services of an investment bank to help it market the Liquid Finishing businesses and identify potential buyers. The Company believes its investment in the Liquid Finishing businesses, carried at a cost of $422 million, is not impaired.
Under terms of the FTC’s hold separate order, the Company is required to provide sufficient resources to maintain the viability, competitiveness and marketability of the Liquid Finishing businesses, including general funds, capital, working capital and reimbursement of losses. To the extent that the Liquid Finishing businesses generate funds in excess of financial resources needed, the Company has access to such funds consistent with practices in place prior to the acquisition. During 2013 and 2012, the Company received a total of $28 million and $12 million, respectively, of dividends from current earnings of the Liquid Finishing businesses.
On December 27, 2013, the Company had $502 million in lines of credit, of which $355 million was unused. Internally generated funds and unused financing sources are expected to provide the Company with the flexibility to meet its liquidity needs in 2014, including its capital expenditure plan of approximately $25-30 million, planned dividends (estimated at $67 million) and acquisitions. If acquisition opportunities increase, the Company believes that reasonable financing alternatives are available for the Company to execute on those opportunities.
In December 2013, the Company’s Board of Directors increased the Company’s regular common dividend from an annual rate of $1.00 to $1.10 per share, a 10 percent increase.
Cash Flow. A summary of cash flow follows (in millions):
| 2013 | 2012 | 2011 | ||||||||||
|
Operating Activities |
$ | 243 | $ | 190 | $ | 162 | ||||||
|
Investing Activities |
(31) | (695) | (28) | |||||||||
|
Financing Activities |
(226) | 233 | 160 | |||||||||
|
Effect of exchange rates on cash |
3 | - | - | |||||||||
|
|
|
|
|
|
|
|||||||
|
Net cash provided (used) |
(11) | (272) | 294 | |||||||||
|
|
|
|
|
|
|
|||||||
|
Cash and cash equivalents at year-end |
$ | 20 | $ | 31 | $ | 303 | ||||||
|
|
|
|
|
|
|
|||||||
Cash Flows From Operating Activities . Net cash provided by operating activities was $243 million in 2013 and $190 million in 2012. During 2013, changes in receivables and inventories increased in line with volume growth. Net cash provided by operating activities in 2013 was driven by net income of $211 million and adjustments for depreciation and amortization and share-based compensation.
24
Table of Contents
Net cash provided by operating activities was $190 million in 2012 and $162 million in 2011. During 2012, changes in receivables and inventories moderated after increasing in 2011.
Cash Flows Used in Investing Activities. During 2013, cash used in investing activities was $31 million compared to $695 million in 2012. During 2013, cash outflows consisted of $23 million of additions to property, plant and equipment, and business acquisitions of $12 million. During 2012, cash outflows included an investment in businesses held separate of $427 million, business acquisitions of $240 million and $18 million of additions of property, plant and equipment.
Cash Flows Used in Financing Activities . During 2013, cash used in financing activities was $226 million. Net payments on outstanding lines of credit were $148 million, share repurchases totaled $68 million and cash dividends paid were $61 million in 2013. These cash uses were offset by the issuance of stock of $42 million. During 2012, cash provided by financing activities was $233 million. We used $350 million of borrowings on a $450 million revolving credit facility to fund business acquisitions and investments. Net payments on outstanding lines of credit, subsequent to the acquisition transaction, were $94 million in 2012 and cash dividends paid totaled $54 million.
In September 2012, the Board of Directors authorized the Company to purchase up to 6 million shares of its outstanding stock, primarily through open-market transactions. This authorization will expire on September 30, 2015. Under the current authorization, 5 million shares remain available for purchase as of December 27, 2013.
The Company repurchased and retired nearly 1 million shares at a cost of $68 million in 2013. We made $1 million and $43 million of share repurchases in 2012 and 2011, respectively. Share repurchases will continue in 2014.
Off-Balance Sheet Arrangements and Contractual Obligations . As of December 27, 2013, the Company is obligated to make cash payments in connection with its long-term debt, operating leases and purchase obligations in the amounts listed below. The Company has no significant off-balance sheet debt or other unrecorded obligations other than the items noted in the following table. In addition to the commitments noted in the following table, the Company could be obligated to perform under standby letters of credit totaling $3 million at December 27, 2013. The Company has also guaranteed the debt of its subsidiaries up to $10 million. All debt of subsidiaries is reflected in the consolidated balance sheets.
| Payments due by period (in millions) | ||||||||||||||||||||
| Total |
Less than
1 year |
1-3
years |
3-5
years |
More than
5 years |
||||||||||||||||
|
Long-term debt |
$ | 408 | $ | - | $ | - | $ | 183 | $ | 225 | ||||||||||
|
Operating leases |
24 | 5 | 7 | 4 | 8 | |||||||||||||||
|
Purchase obligations 1 |
100 | 100 | - | - | - | |||||||||||||||
|
Interest on long-term debt |
127 | 16 | 32 | 27 | 52 | |||||||||||||||
|
Unfunded pension and postretirement medical benefits 2 |
30 | 2 | 5 | 6 | 17 | |||||||||||||||
|
|
|
|
|
|
|
|
|
|
|
|||||||||||
|
Total |
$ | 689 | $ | 123 | $ | 44 | $ | 220 | $ | 302 | ||||||||||
|
|
|
|
|
|
|
|
|
|
|
|||||||||||
| 1 | The Company is committed to pay suppliers under the terms of open purchase orders issued in the normal course of business. The Company also has commitments with certain suppliers to purchase minimum quantities, and under the terms of certain agreements, the Company is committed for certain portions of the supplier’s inventory. The Company does not purchase, or commit to purchase, quantities in excess of normal usage or amounts that cannot be used within one year. |
| 2 | The amounts and timing of future Company contributions to the funded qualified defined benefit pension plan are unknown because they are dependent on pension fund asset performance. |
Critical Accounting Estimates
The Company prepares its consolidated financial statements in conformity with generally accepted accounting principles in the United States of America (“U.S. GAAP”). The Company’s most significant accounting policies are disclosed in Note A to the consolidated financial statements. The preparation of the consolidated financial statements, in conformity with U.S. GAAP, requires management to make estimates and judgments that affect the amounts reported in the consolidated financial statements and accompanying notes. Actual amounts will differ from those estimates. The Company considers the following policies to involve the most judgment in the preparation of the Company’s consolidated financial statements.
Excess and Discontinued Inventory . The Company’s inventories are valued at the lower of cost or market. Reserves for excess and discontinued products are estimated. The amount of the reserve is determined based on projected sales information, plans for discontinued products and other factors. Though management considers these balances adequate, changes in sales volumes due to unanticipated economic or competitive conditions are among the factors that would result in materially different amounts for this item.
25
Table of Contents
Goodwill and Other Intangible Assets. The Company performs impairment testing for goodwill and other intangible assets annually, or more frequently if events or changes in circumstances indicate that the asset might be impaired. For goodwill, the Company performs impairment reviews for the Company’s reporting units using a fair-value method based on management’s judgments and assumptions. The Company estimates the fair value of the reporting units by an allocation of market capitalization value, cross-checked by a present value of future cash flows calculation. The estimated fair value is then compared with the carrying amount of the reporting unit, including recorded goodwill. Based on our most recent goodwill impairment assessment performed during the fourth quarter of 2013, the fair value of each reporting unit significantly exceeded its carrying value. Accordingly, step two of the impairment analysis was not required.
The Company also performs a separate impairment test for each other intangible asset with indefinite life, based on estimated future use and discounting estimated future cash flows. A considerable amount of management judgment and assumptions are required in performing the impairment tests. Though management considers its judgments and assumptions to be reasonable, changes in economic or market conditions, product offerings or marketing strategies could change the estimated fair values and result in impairment charges.
Product Warranty. A liability is established for estimated warranty claims to be paid in the future that relate to current and prior period sales. The Company estimates these costs based on historical claim experience, changes in warranty programs and other factors, including evaluating specific product warranty issues. The establishment of reserves requires the use of judgment and assumptions regarding the potential for losses relating to warranty issues. Though management considers these balances adequate, changes in the Company’s warranty policy or a significant change in product defects versus historical averages are among the factors that would result in materially different amounts for this item.
Income Taxes. In the preparation of the Company’s consolidated financial statements, management calculates income taxes. This includes estimating current tax liability as well as assessing temporary differences resulting from different treatment of items for tax and financial statement purposes. These differences result in deferred tax assets and liabilities, which are recorded on the balance sheet using statutory rates in effect for the year in which the differences are expected to reverse. These assets and liabilities are analyzed regularly and management assesses the likelihood that deferred tax assets will be recoverable from future taxable income. A valuation allowance is established to the extent that management believes that recovery is not likely. Liabilities for uncertain tax positions are also established for potential and ongoing audits of federal, state and international issues. The Company routinely monitors the potential impact of such situations and believes that liabilities are properly stated. Valuations related to amounts owed and tax rates could be impacted by changes to tax codes, changes in statutory rates, the Company’s future taxable income levels and the results of tax audits.
Retirement Obligations. The measurements of the Company’s pension and postretirement medical obligations are dependent on a number of assumptions including estimates of the present value of projected future payments, taking into consideration future events such as salary increase and demographic experience. These assumptions may have an impact on the expense and timing of future contributions.
The assumptions used in developing the required estimates for pension obligations include discount rate, inflation, salary increases, retirement rates, expected return on plan assets and mortality rates. The assumptions used in developing the required estimates for postretirement medical obligations include discount rates, rate of future increase in medical costs and participation rates.
For U.S. plans, the Company establishes its discount rate assumption by reference to a yield curve published by an actuary and projected plan cash flows. For plans outside the U.S., the Company establishes a rate by country by reference to highly rated corporate bonds. These reference points have been determined to adequately match expected plan cash flows. The Company bases its inflation assumption on an evaluation of external market indicators. The salary assumptions are based on actual historical experience, the near-term outlook and assumed inflation. Retirement rates are based on experience. The investment return assumption is based on the expected long-term performance of plan assets. In setting this number, the Company considers the input of actuaries and investment advisors, its long-term historical returns, the allocation of plan assets and projected returns on plan assets. The Company maintained its investment return assumption for its U.S. plan at 8.5 percent for 2014 and set the return assumption for its Swiss plan at 2.0 percent. Mortality rates are based on a common group mortality table for males and females.
26
Table of Contents
Net pension cost in 2013 was $14 million and was allocated to cost of products sold and operating expenses based on salaries and wages. At December 27, 2013, a one-half percentage point decrease in the indicated assumptions would have the following effects (in millions):
|
Assumption |
Funded Status |
Expense |
||||||
|
Discount rate |
$ | (25) | $ | 3 | ||||
|
Expected return on assets |
- | 1 | ||||||
Recent Accounting Pronouncements
The accounting standards updates issued by The Financial Accounting Standards Board (FASB) that will be effective for the Company in 2014 will not have a significant impact on the Company’s consolidated financial statements.
The Company sells and purchases products and services in currencies other than the U.S. dollar and pays variable interest rates on borrowings under certain credit facilities. Consequently, the Company is subject to profitability risk arising from exchange and interest rate movements. The Company may use a variety of financial and derivative instruments to manage foreign currency and interest rate risks. The Company does not enter into any of these instruments for trading purposes to generate revenue. Rather, the Company’s objective in managing these risks is to reduce fluctuations in earnings and cash flows associated with changes in foreign currency exchange and interest rates.
The Company may use forward exchange contracts, options and other hedging activities to hedge the U.S. dollar value resulting from anticipated currency transactions and net monetary asset and liability positions. At December 27, 2013, the currencies to which the Company had the most significant balance sheet exchange rate exposure were the euro, Swiss franc, Canadian dollar, British pound, Japanese yen, Australian dollar, Chinese yuan renminbi and South Korean won. It is not possible to determine the true impact of currency rate changes; however, the direct translation effect on net sales and net earnings can be estimated. Changes in translation rates had no significant effect on 2013 net sales or earnings. In 2012, the effect of the stronger U.S. dollar compared to other currencies (primarily the euro) resulted in a decrease in sales and net earnings of approximately $15 million and $5 million, respectively. In 2011, the calculated translation effect resulted in an increase in net sales and net earnings of approximately $17 million and $7 million, respectively.
2014 Outlook
We expect growth in every region of the world in 2014. In the Americas, the continued recovery in the construction market should provide a tailwind for both our Contractor and Industrial segments. Further, we expect the general economic environment for industrial manufacturing to remain stable in the United States through 2014. Although the economies of Western Europe are still struggling to find their footing, we expect growth from the emerging markets of Eastern Europe to drive moderate growth in the EMEA region in 2014. While our Asia Pacific region will continue to face weak economic conditions and difficult comparables into the first half of 2014, we are hopeful that the business will gain momentum as the year progresses. With a modest increase in volumes, we expect factory performance in 2014 to remain solid and continue to drive profitability. The Graco team is focused on executing our strategies for growth in 2014.
The Company’s backlog is typically small compared to annual sales and is not a good indicator of future business levels. In addition to economic growth, the successful launch of new products and expanded distribution coverage, the sales outlook is dependent on many factors, including realization of price increases and stable foreign currency exchange rates.
27
Table of Contents
Forward-Looking Statements
The Company desires to take advantage of the “safe harbor” provisions regarding forward-looking statements of the Private Securities Litigation Reform Act of 1995 and is filing this Cautionary Statement in order to do so. From time to time various forms filed by our Company with the Securities and Exchange Commission, including this Form 10-K and our Form 10-Qs and Form 8-Ks, and other disclosures, including our 2013 Overview report, press releases, earnings releases, analyst briefings, conference calls and other written documents or oral statements released by our Company, may contain forward-looking statements. Forward-looking statements generally use words such as “expect,” “foresee,” “anticipate,” “believe,” “project,” “should,” “estimate,” “will,” and similar expressions, and reflect our Company’s expectations concerning the future. All forecasts and projections are forward-looking statements. Forward-looking statements are based upon currently available information, but various risks and uncertainties may cause our Company’s actual results to differ materially from those expressed in these statements. The Company undertakes no obligation to update these statements in light of new information or future events.
Future results could differ materially from those expressed, due to the impact of changes in various factors. These risk factors include, but are not limited to: changes in laws and regulations; economic conditions in the United States and other major world economies; our Company’s growth strategies, which include making acquisitions, investing in new products, expanding geographically and targeting new industries; whether we are able to effectively complete a divestiture of the acquired Liquid Finishing businesses, which has not been completed and remains subject to FTC approval; political instability; new entrants who copy our products or infringe on our intellectual property; supply interruptions or delays; risks incident to conducting business internationally; the ability to meet our customers’ needs and changes in product demand; results of and costs associated with, litigation, administrative proceedings and regulatory reviews incident to our business; compliance with anti-corruption laws; the possibility of decline in purchases from few large customers of the Contractor segment; variations in activity in the construction and automotive industries; security breaches and natural disasters. Please refer to Item 1A of this Annual Report on Form 10-K for fiscal year 2013 for a more comprehensive discussion of these and other risk factors. Shareholders, potential investors and other readers are urged to consider these factors in evaluating forward-looking statements and are cautioned not to place undue reliance on such forward-looking statements.
Investors should realize that factors other than those identified above and in Item 1A might prove important to the Company’s future results. It is not possible for management to identify each and every factor that may have an impact on the Company’s operations in the future as new factors can develop from time to time.
Management’s Report on Internal Control Over Financial Reporting
Management is responsible for establishing and maintaining adequate internal control over financial reporting. The internal control system was designed to provide reasonable assurance to management and the board of directors regarding the reliability of financial reporting and preparation of financial statements in accordance with generally accepted accounting principles.
Management assessed the effectiveness of the Company’s internal control over financial reporting as of December 27, 2013. In making this assessment, management used the criteria set forth by the Committee of Sponsoring Organizations of the Treadway Commission (COSO) in Internal Control-Integrated Framework (1992).
Based on our assessment and those criteria, management believes the Company’s internal control over financial reporting is effective as of December 27, 2013.
The Company’s independent auditors have issued an attestation report on the Company’s internal control over financial reporting. That report appears in this Form 10-K.
28
Table of Contents
REPORTS OF INDEPENDENT REGISTERED PUBLIC ACCOUNTING FIRM
Internal Control Over Financial Reporting
To the Shareholders and Board of Directors of
Graco Inc.
We have audited the internal control over financial reporting of Graco Inc. and Subsidiaries (the “Company”) as of December 27, 2013, based on criteria established in Internal Control — Integrated Framework (1992) issued by the Committee of Sponsoring Organizations of the Treadway Commission. The Company’s management is responsible for maintaining effective internal control over financial reporting and for its assessment of the effectiveness of internal control over financial reporting, included in the accompanying Management’s Report on Internal Control Over Financial Reporting. Our responsibility is to express an opinion on the Company’s internal control over financial reporting based on our audit.
We conducted our audit in accordance with the standards of the Public Company Accounting Oversight Board (United States). Those standards require that we plan and perform the audit to obtain reasonable assurance about whether effective internal control over financial reporting was maintained in all material respects. Our audit included obtaining an understanding of internal control over financial reporting, assessing the risk that a material weakness exists, testing and evaluating the design and operating effectiveness of internal control based on the assessed risk, and performing such other procedures as we considered necessary in the circumstances. We believe that our audit provides a reasonable basis for our opinion.
A company’s internal control over financial reporting is a process designed by, or under the supervision of, the company’s principal executive and principal financial officers, or persons performing similar functions, and effected by the company’s board of directors, management, and other personnel to provide reasonable assurance regarding the reliability of financial reporting and the preparation of financial statements for external purposes in accordance with generally accepted accounting principles. A company’s internal control over financial reporting includes those policies and procedures that (1) pertain to the maintenance of records that, in reasonable detail, accurately and fairly reflect the transactions and dispositions of the assets of the company; (2) provide reasonable assurance that transactions are recorded as necessary to permit preparation of financial statements in accordance with generally accepted accounting principles, and that receipts and expenditures of the company are being made only in accordance with authorizations of management and directors of the company; and (3) provide reasonable assurance regarding prevention or timely detection of unauthorized acquisition, use, or disposition of the company’s assets that could have a material effect on the financial statements.
Because of the inherent limitations of internal control over financial reporting, including the possibility of collusion or improper management override of controls, material misstatements due to error or fraud may not be prevented or detected on a timely basis. Also, projections of any evaluation of the effectiveness of the internal control over financial reporting to future periods are subject to the risk that the controls may become inadequate because of changes in conditions, or that the degree of compliance with the policies or procedures may deteriorate.
In our opinion, the Company maintained, in all material respects, effective internal control over financial reporting as of December 27, 2013, based on the criteria established in Internal Control — Integrated Framework (1992) issued by the Committee of Sponsoring Organizations of the Treadway Commission.
We have also audited, in accordance with the standards of the Public Company Accounting Oversight Board (United States), the consolidated financial statements and financial statement schedule as of and for the year ended December 27, 2013, of the Company and our report dated February 18, 2014, expressed an unqualified opinion on those consolidated financial statements and financial statement schedule.
/s/ DELOITTE & TOUCHE LLP
Minneapolis, Minnesota
February 18, 2014
29
Table of Contents
Consolidated Financial Statements
To the Shareholders and Board of Directors of
Graco Inc.
We have audited the accompanying consolidated balance sheets of Graco Inc. and Subsidiaries (the “Company”) as of December 27, 2013 and December 28, 2012, and the related consolidated statements of earnings, comprehensive income, shareholders’ equity, and cash flows for each of the three years in the period ended December 27, 2013. Our audits also included the financial statement schedule listed in the Index at Item 15. These financial statements and financial statement schedule are the responsibility of the Company’s management. Our responsibility is to express an opinion on the financial statements and financial statement schedule based on our audits.
We conducted our audits in accordance with the standards of the Public Company Accounting Oversight Board (United States). Those standards require that we plan and perform the audit to obtain reasonable assurance about whether the financial statements are free of material misstatement. An audit includes examining, on a test basis, evidence supporting the amounts and disclosures in the financial statements. An audit also includes assessing the accounting principles used and significant estimates made by management, as well as evaluating the overall financial statement presentation. We believe that our audits provide a reasonable basis for our opinion.
In our opinion, such consolidated financial statements present fairly, in all material respects, the financial position of Graco Inc. and Subsidiaries as of December 27, 2013 and December 28, 2012, and the results of their operations and their cash flows for each of the three years in the period ended December 27, 2013, in conformity with accounting principles generally accepted in the United States of America. Also, in our opinion, such financial statement schedule, when considered in relation to the basic consolidated financial statements taken as a whole, presents fairly, in all material respects, the information set forth therein.
We have also audited, in accordance with the standards of the Public Company Accounting Oversight Board (United States), the Company’s internal control over financial reporting as of December 27, 2013, based on the criteria established in Internal Control—Integrated Framework (1992) issued by the Committee of Sponsoring Organizations of the Treadway Commission and our report dated February 18, 2014, expressed an unqualified opinion on the Company’s internal control over financial reporting.
/s/ DELOITTE & TOUCHE LLP
Minneapolis, Minnesota
February 18, 2014
30
Table of Contents
CONSOLIDATED STATEMENTS OF EARNINGS
(In thousands except per share amounts)
| Years Ended | ||||||||||||
|
December 27,
2013 |
December 28,
2012 |
December 30,
2011 |
||||||||||
|
Net Sales |
$ | 1,104,024 | $ | 1,012,456 | $ | 895,283 | ||||||
|
Cost of products sold |
496,569 | 461,926 | 395,078 | |||||||||
|
|
|
|
|
|
|
|||||||
|
Gross Profit |
607,455 | 550,530 | 500,205 | |||||||||
|
Product development |
51,428 | 48,921 | 41,554 | |||||||||
|
Selling, marketing and distribution |
177,853 | 163,523 | 151,276 | |||||||||
|
General and administrative |
98,405 | 113,409 | 87,861 | |||||||||
|
|
|
|
|
|
|
|||||||
|
Operating Earnings |
279,769 | 224,677 | 219,514 | |||||||||
|
Interest expense |
18,147 | 19,273 | 9,131 | |||||||||
|
Other expense (income), net |
(27,200) | (11,922) | 655 | |||||||||
|
|
|
|
|
|
|
|||||||
|
Earnings Before Income Taxes |
288,822 | 217,326 | 209,728 | |||||||||
|
Income taxes |
78,000 | 68,200 | 67,400 | |||||||||
|
|
|
|
|
|
|
|||||||
|
Net Earnings |
$ | 210,822 | $ | 149,126 | $ | 142,328 | ||||||
|
|
|
|
|
|
|
|||||||
|
Basic Net Earnings per Common Share |
$ | 3.44 | $ | 2.47 | $ | 2.36 | ||||||
|
Diluted Net Earnings per Common Share |
$ | 3.36 | $ | 2.42 | $ | 2.32 | ||||||
|
Cash Dividends Declared per Common Share |
$ | 1.03 | $ | 0.93 | $ | 0.86 | ||||||
See notes to consolidated financial statements.
(In thousands)
| Years Ended | ||||||||||||
|
December 27,
2013 |
December 28,
2012 |
December 30,
2011 |
||||||||||
|
Net Earnings |
$ | 210,822 | $ | 149,126 | $ | 142,328 | ||||||
|
Other comprehensive income (loss) |
||||||||||||
|
Cumulative translation adjustment |
7,812 | (3,206) | - | |||||||||
|
Pension and postretirement medical liability adjustment |
46,955 | (6,171) | (36,760) | |||||||||
|
Gain (loss) on interest rate hedge contracts |
- | - | 454 | |||||||||
|
Income taxes |
||||||||||||
|
Pension and postretirement medical liability adjustment |
(17,371) | 2,113 | 12,436 | |||||||||
|
Gain (loss) on interest rate hedge contracts |
- | - | (168) | |||||||||
|
|
|
|
|
|
|
|||||||
|
Other comprehensive income (loss) |
37,396 | (7,264) | (24,038) | |||||||||
|
|
|
|
|
|
|
|||||||
|
Comprehensive Income |
$ | 248,218 | $ | 141,862 | $ | 118,290 | ||||||
|
|
|
|
|
|
|
|||||||
See notes to consolidated financial statements.
31
Table of Contents
(In thousands, except share and per share amounts)
|
December 27,
2013 |
December 28,
2012 |
|||||||
|
ASSETS |
||||||||
|
Current Assets |
||||||||
|
Cash and cash equivalents |
$ | 19,756 | $ | 31,120 | ||||
|
Accounts receivable, less allowances of $6,300 and $6,600 |
183,293 | 172,143 | ||||||
|
Inventories |
133,787 | 121,549 | ||||||
|
Deferred income taxes |
18,827 | 17,742 | ||||||
|
Investment in businesses held separate |
422,297 | 426,813 | ||||||
|
Other current assets |
14,633 | 7,629 | ||||||
|
|
|
|
|
|||||
|
Total current assets |
792,593 | 776,996 | ||||||
|
Property, Plant and Equipment, net |
151,717 | 151,544 | ||||||
|
Goodwill |
189,967 | 181,228 | ||||||
|
Other Intangible Assets, net |
147,940 | 151,773 | ||||||
|
Deferred Income Taxes |
20,366 | 38,550 | ||||||
|
Other Assets |
24,645 | 21,643 | ||||||
|
|
|
|
|
|||||
|
Total Assets |
$ | 1,327,228 | $ | 1,321,734 | ||||
|
|
|
|
|
|||||
|
LIABILITIES AND SHAREHOLDERS’ EQUITY |
||||||||
|
Current Liabilities |
||||||||
|
Notes payable to banks |
$ | 9,584 | $ | 8,133 | ||||
|
Trade accounts payable |
34,282 | 28,938 | ||||||
|
Salaries and incentives |
38,939 | 34,001 | ||||||
|
Dividends payable |
16,881 | 15,206 | ||||||
|
Other current liabilities |
69,167 | 65,393 | ||||||
|
|
|
|
|
|||||
|
Total current liabilities |
168,853 | 151,671 | ||||||
|
Long-term Debt |
408,370 | 556,480 | ||||||
|
Retirement Benefits and Deferred Compensation |
94,705 | 137,779 | ||||||
|
Deferred Income Taxes |
20,935 | 21,690 | ||||||
|
Commitments and Contingencies (Note K) |
||||||||
|
Shareholders’ Equity |
||||||||
|
Common stock, $1 par value; 97,000,000 shares authorized; 61,003,203 and 60,766,849 shares outstanding in 2013 and 2012 |
61,003 | 60,767 | ||||||
|
Additional paid-in-capital |
347,058 | 287,795 | ||||||
|
Retained earnings |
272,653 | 189,297 | ||||||
|
Accumulated other comprehensive income (loss) |
(46,349) | (83,745) | ||||||
|
|
|
|
|
|||||
|
Total shareholders’ equity |
634,365 | 454,114 | ||||||
|
|
|
|
|
|||||
|
Total Liabilities and Shareholders’ Equity |
$ | 1,327,228 | $ | 1,321,734 | ||||
|
|
|
|
|
|||||
See notes to consolidated financial statements.
32
Table of Contents
(In thousands)
| Years Ended | ||||||||||||
|
December 27,
2013 |
December 28,
2012 |
December 30,
2011 |
||||||||||
|
Cash Flows From Operating Activities |
||||||||||||
|
Net earnings |
$ | 210,822 | $ | 149,126 | $ | 142,328 | ||||||
|
Adjustments to reconcile net earnings to net cash provided by operating activities |
||||||||||||
|
Depreciation and amortization |
37,316 | 38,762 | 32,483 | |||||||||
|
Deferred income taxes |
(1,715) | (10,786) | (1,814) | |||||||||
|
Share-based compensation |
16,545 | 12,409 | 10,994 | |||||||||
|
Excess tax benefit related to share-based payment arrangements |
(8,347) | (4,217) | (2,195) | |||||||||
|
Change in |
||||||||||||
|
Accounts receivable |
(11,880) | (2,752) | (26,767) | |||||||||
|
Inventories |
(10,186) | 5,941 | (13,440) | |||||||||
|
Trade accounts payable |
2,436 | (952) | 5,974 | |||||||||
|
Salaries and incentives |
2,022 | (4,251) | (3,469) | |||||||||
|
Retirement benefits and deferred compensation |
3,629 | 3,209 | 7,228 | |||||||||
|
Other accrued liabilities |
5,556 | 3,288 | 8,148 | |||||||||
|
Other |
(3,143) | (95) | 2,574 | |||||||||
|
|
|
|
|
|
|
|||||||
|
Net cash from operating activities |
243,055 | 189,682 | 162,044 | |||||||||
|
|
|
|
|
|
|
|||||||
|
Cash Flows From Investing Activities |
||||||||||||
|
Property, plant and equipment additions |
(23,319) | (18,234) | (23,854) | |||||||||
|
Acquisition of businesses, net of cash acquired |
(11,560) | (240,068) | (2,139) | |||||||||
|
Investment in businesses held separate |
4,516 | (426,813) | - | |||||||||
|
Proceeds from sale of assets |
1,600 | - | - | |||||||||
|
Other |
(2,475) | (9,405) | (2,004) | |||||||||
|
|
|
|
|
|
|
|||||||
|
Net cash used in investing activities |
(31,238) | (694,520) | (27,997) | |||||||||
|
|
|
|
|
|
|
|||||||
|
Cash Flows From Financing Activities |
||||||||||||
|
Borrowings (payments) on short-term lines of credit, net |
1,280 | (619) | 497 | |||||||||
|
Borrowings on notes and long-term line of credit |
419,905 | 649,325 | 402,175 | |||||||||
|
Payments on long-term line of credit |
(568,122) | (392,845) | (172,430) | |||||||||
|
Payments of debt issuance costs |
- | (1,921) | (1,131) | |||||||||
|
Excess tax benefit related to share-based payment arrangements |
8,347 | 4,217 | 2,195 | |||||||||
|
Common stock issued |
41,664 | 30,194 | 22,231 | |||||||||
|
Common stock repurchased |
(67,827) | (1,378) | (43,250) | |||||||||
|
Cash dividends paid |
(61,139) | (54,302) | (50,646) | |||||||||
|
|
|
|
|
|
|
|||||||
|
Net cash from (used in) financing activities |
(225,892) | 232,671 | 159,641 | |||||||||
|
|
|
|
|
|
|
|||||||
|
Effect of exchange rate changes on cash |
2,711 | 137 | (129) | |||||||||
|
|
|
|
|
|
|
|||||||
|
Net increase (decrease) in cash and cash equivalents |
(11,364) | (272,030) | 293,559 | |||||||||
|
Cash and Cash Equivalents |
||||||||||||
|
Beginning of year |
31,120 | 303,150 | 9,591 | |||||||||
|
|
|
|
|
|
|
|||||||
|
End of year |
$ | 19,756 | $ | 31,120 | $ | 303,150 | ||||||
|
|
|
|
|
|
|
|||||||
See notes to consolidated financial statements.
33
Table of Contents
CONSOLIDATED STATEMENTS OF SHAREHOLDERS’ EQUITY
(In thousands)
|
Common
Stock |
Additional
Paid-In Capital |
Retained
Earnings |
Accumulated
Other Compre- hensive Income (Loss) |
Total | ||||||||||||||||
|
Balance December 31, 2010 |
$ | 60,048 | $ | 212,073 | $ | 44,436 | $ | (52,443) | $ | 264,114 | ||||||||||
|
Shares issued |
898 | 22,360 | - | - | 23,258 | |||||||||||||||
|
Shares repurchased |
(1,199) | (4,236) | (37,815) | - | (43,250) | |||||||||||||||
|
Stock compensation cost |
- | 10,142 | - | - | 10,142 | |||||||||||||||
|
Tax benefit related to stock options exercised |
- | 2,695 | - | - | 2,695 | |||||||||||||||
|
Restricted stock issued |
- | (1,027) | - | - | (1,027) | |||||||||||||||
|
Net earnings |
- | - | 142,328 | - | 142,328 | |||||||||||||||
|
Dividends declared |
- | - | (51,482) | - | (51,482) | |||||||||||||||
|
Other comprehensive income (loss) |
- | - | - | (24,038) | (24,038) | |||||||||||||||
|
|
|
|
|
|
|
|
|
|
|
|||||||||||
|
Balance December 30, 2011 |
59,747 | 242,007 | 97,467 | (76,481) | 322,740 | |||||||||||||||
|
Shares issued |
1,048 | 29,146 | - | - | 30,194 | |||||||||||||||
|
Shares repurchased |
(28) | (116) | (1,234) | - | (1,378) | |||||||||||||||
|
Stock compensation cost |
- | 11,941 | - | - | 11,941 | |||||||||||||||
|
Tax benefit related to stock options exercised |
- | 4,817 | - | - | 4,817 | |||||||||||||||
|
Net earnings |
- | - | 149,126 | - | 149,126 | |||||||||||||||
|
Dividends declared |
- | - | (56,062) | - | (56,062) | |||||||||||||||
|
Other comprehensive income (loss) |
- | - | - | (7,264) | (7,264) | |||||||||||||||
|
|
|
|
|
|
|
|
|
|
|
|||||||||||
|
Balance December 28, 2012 |
60,767 | 287,795 | 189,297 | (83,745) | 454,114 | |||||||||||||||
|
Shares issued |
1,196 | 41,146 | - | - | 42,342 | |||||||||||||||
|
Shares repurchased |
(960) | (4,545) | (64,652) | - | (70,157) | |||||||||||||||
|
Stock compensation cost |
- | 14,693 | - | - | 14,693 | |||||||||||||||
|
Tax benefit related to stock options exercised |
- | 8,647 | - | - | 8,647 | |||||||||||||||
|
Restricted stock issued |
- | (678) | - | - | (678) | |||||||||||||||
|
Net earnings |
- | - | 210,822 | - | 210,822 | |||||||||||||||
|
Dividends declared |
- | - | (62,814) | - | (62,814) | |||||||||||||||
|
Other comprehensive income (loss) |
- | - | - | 37,396 | 37,396 | |||||||||||||||
|
|
|
|
|
|
|
|
|
|
|
|||||||||||
|
Balance December 27, 2013 |
$ | 61,003 | $ | 347,058 | $ | 272,653 | $ | (46,349) | $ | 634,365 | ||||||||||
|
|
|
|
|
|
|
|
|
|
|
|||||||||||
See notes to consolidated financial statements.
34
Table of Contents
NOTES TO CONSOLIDATED FINANCIAL STATEMENTS
Graco Inc. and Subsidiaries
Years Ended December 27, 2013, December 28, 2012 and December 30, 2011
A. Summary of Significant Accounting Policies
Fiscal Year . The fiscal year of Graco Inc. and Subsidiaries (the “Company”) is 52 or 53 weeks, ending on the last Friday in December. The years ended December 27, 2013, December 28, 2012 and December 30, 2011, were 52-week years.
Basis of Statement Presentation . The consolidated financial statements include the accounts of the parent company and its subsidiaries after elimination of intercompany balances and transactions. As of December 27, 2013, all subsidiaries are 100 percent owned.
As more fully described in Note L, the Company purchased the Powder Finishing and Liquid Finishing businesses in April 2012. The FTC issued an order requiring the Company to hold the Liquid Finishing businesses separate from the rest of the Company’s businesses until the FTC determines which portions of the businesses must be divested. Under terms of the hold separate order, the Company does not have the power to direct the activities of the Liquid Finishing businesses that most significantly impact the economic performance of those businesses. Therefore, the Company has determined that the Liquid Finishing businesses are variable interest entities for which the Company is not the primary beneficiary, and that they should not be consolidated. Furthermore, the Company does not have a controlling interest in the Liquid Finishing businesses, nor is it able to exert significant influence over the Liquid Finishing businesses. Consequently, the Company’s investment in the shares of the Liquid Finishing businesses, totaling $422 million, has been reflected as a cost-method investment on the Consolidated Balance Sheet as of December 27, 2013, and their results of operations have not been consolidated with those of the Company.
Foreign Currency Translation . The functional currency of certain subsidiaries is the local currency. Accordingly, adjustments resulting from the translation of those subsidiaries’ financial statements into U.S. dollars are charged or credited to accumulated other comprehensive income (loss). The U.S. dollar is the functional currency for all other foreign subsidiaries. Accordingly, gains and losses from the translation of foreign currency balances and transactions of those subsidiaries are included in other expense, net.
Accounting Estimates . The preparation of financial statements in conformity with generally accepted accounting principles requires management to make estimates and assumptions that affect the reported amounts of assets and liabilities and disclosure of contingent assets and liabilities at the date of the financial statements. Such estimates and assumptions also affect the reported amounts of revenues and expenses during the reporting period. Actual results could differ from those estimates.
Fair Value Measurements. The three levels of inputs in the fair value measurement hierarchy are as follows:
Level 1 – based on quoted prices in active markets for identical assets
Level 2 – based on significant observable inputs
Level 3 – based on significant unobservable inputs
Assets and liabilities measured at fair value on a recurring basis and fair value measurement level were as follows (in thousands):
| Level | 2013 | 2012 | ||||||||
|
Assets |
||||||||||
|
Cash surrender value of life insurance |
2 | $ | 12,611 | $ | 9,483 | |||||
|
Forward exchange contracts
|
2 | 291 | 491 | |||||||
|
|
|
|
|
|||||||
|
Total assets at fair value |
$ | 12,902 | $ | 9,974 | ||||||
|
|
|
|
|
|||||||
|
Liabilities |
||||||||||
|
Deferred compensation |
2 | $ | 2,296 | $ | 1,759 | |||||
|
|
|
|
|
|||||||
Contracts insuring the lives of certain employees who are eligible to participate in certain non-qualified pension and deferred compensation plans are held in trust. Cash surrender value of the contracts is based on performance measurement funds that shadow the deferral investment allocations made by participants in certain deferred compensation plans. The deferred compensation liability balances are valued based on amounts allocated by participants to the underlying performance measurement funds.
The Company’s policy and accounting for forward exchange contracts are described below, in Derivative Instruments and Hedging Activities.
35
Table of Contents
Disclosures related to non-recurring fair value measurements are included below in Impairment of Long-Lived Assets, in Note F (Debt) and in Note J (Retirement Benefits).
Cash Equivalents . All highly liquid investments with a maturity of three months or less at the date of purchase are considered to be cash equivalents.
Accounts Receivable. Accounts receivable includes trade receivables of $178 million in 2013 and $161 million in 2012. Other receivables totaled $5 million in 2013 and $11 million in 2012.
Inventory Valuation . Inventories are stated at the lower of cost or market. The last-in, first-out (LIFO) cost method is used for valuing most U.S. inventories. Inventories of foreign subsidiaries are valued using the first-in, first-out (FIFO) cost method.
Other Current Assets. Amounts included in other current assets were (in thousands):
| 2013 | 2012 | |||||||
|
Prepaid income taxes |
$ | 7,894 | $ | 2,155 | ||||
|
Prepaid expenses and other |
6,739 | 5,474 | ||||||
|
|
|
|
|
|||||
|
Total |
$ | 14,633 | $ | 7,629 | ||||
|
|
|
|
|
|||||
Property, Plant and Equipment . For financial reporting purposes, plant and equipment are depreciated over their estimated useful lives, primarily by using the straight-line method as follows:
| Buildings and improvements | 10 to 30 years | |
| Leasehold improvements | lesser of 5 to 10 years or life of lease | |
| Manufacturing equipment | lesser of 5 to 10 years or life of equipment | |
| Office, warehouse and automotive equipment | 3 to 10 years |
Goodwill and Other Intangible Assets. Goodwill has been assigned to reporting units. Changes in the carrying amounts of goodwill for each reportable segment were (in thousands):
| Industrial | Contractor | Lubrication | Total | |||||||||||||
|
December 27, 2013 |
||||||||||||||||
|
Beginning balance |
$ | 148,999 | $ | 12,732 | $ | 19,497 | $ | 181,228 | ||||||||
|
Additions from business acquisitions |
6,626 | - | - | 6,626 | ||||||||||||
|
Foreign currency translation |
2,998 | - | - | 2,998 | ||||||||||||
|
Other |
(885) | - | - | (885) | ||||||||||||
|
|
|
|
|
|
|
|
|
|||||||||
|
Ending balance |
$ | 157,738 | $ | 12,732 | $ | 19,497 | $ | 189,967 | ||||||||
|
|
|
|
|
|
|
|
|
|||||||||
|
December 28, 2012 |
||||||||||||||||
|
Beginning balance |
$ | 61,171 | $ | 12,732 | $ | 19,497 | $ | 93,400 | ||||||||
|
Additions from business acquisitions |
89,044 | - | - | 89,044 | ||||||||||||
|
Foreign currency translation |
(1,216) | - | - | (1,216) | ||||||||||||
|
|
|
|
|
|
|
|
|
|||||||||
|
Ending balance |
$ | 148,999 | $ | 12,732 | $ | 19,497 | $ | 181,228 | ||||||||
|
|
|
|
|
|
|
|
|
|||||||||
36
Table of Contents
Components of other intangible assets were (dollars in thousands):
|
Estimated
Life (years) |
Cost |
Accumulated
Amortization |
Foreign
Currency Translation |
Book
Value |
||||||||||||||
|
December 27, 2013 |
||||||||||||||||||
|
Customer relationships |
3 - 14 | $ | 121,205 | $ | (26,377) | $ | 1,458 | $ | 96,286 | |||||||||
|
Patents, proprietary technology and product documentation |
3 - 11 | 16,125 | (5,869) | 118 | 10,374 | |||||||||||||
|
Trademarks, trade names and other |
5 | 175 | (9) | - | 166 | |||||||||||||
|
|
|
|
|
|
|
|
|
|||||||||||
| 137,505 | (32,255) | 1,576 | 106,826 | |||||||||||||||
|
Not Subject to Amortization |
||||||||||||||||||
|
Brand names |
40,400 | - | 714 | 41,114 | ||||||||||||||
|
|
|
|
|
|
|
|
|
|||||||||||
|
Total |
$ | 177,905 | $ | (32,255) | $ | 2,290 | $ | 147,940 | ||||||||||
|
|
|
|
|
|
|
|
|
|||||||||||
|
December 28, 2012 |
||||||||||||||||||
|
Customer relationships |
2 - 14 | $ | 132,245 | $ | (30,041) | $ | (1,510) | $ | 100,694 | |||||||||
|
Patents, proprietary technology and product documentation |
3 - 11 | 20,830 | (9,679) | (147) | 11,004 | |||||||||||||
|
Trademarks, trade names and other |
1 - 5 | 85 | (27) | - | 58 | |||||||||||||
|
|
|
|
|
|
|
|
|
|||||||||||
| 153,160 | (39,747) | (1,657) | 111,756 | |||||||||||||||
|
Not Subject to Amortization |
||||||||||||||||||
|
Brand names |
40,580 | - | (563) | 40,017 | ||||||||||||||
|
|
|
|
|
|
|
|
|
|||||||||||
|
Total |
$ | 193,740 | $ | (39,747) | $ | (2,220) | $ | 151,773 | ||||||||||
|
|
|
|
|
|
|
|
|
|||||||||||
Amortization of intangibles was $12.5 million in 2013, $15.0 million in 2012 and $10.9 million in 2011. Estimated future annual amortization is as follows: $10.0 million in 2014, $9.5 million in 2015, $9.2 million in 2016, $9.0 million in 2017, $8.9 million in 2018 and $60.2 million thereafter.
Other Assets. Components of other assets were (in thousands):
| 2013 | 2012 | |||||||
|
Cash surrender value of life insurance |
$ | 12,611 | $ | 9,483 | ||||
|
Capitalized software |
3,448 | 3,291 | ||||||
|
Equity method investment |
5,569 | 5,224 | ||||||
|
Deposits and other |
3,017 | 3,645 | ||||||
|
|
|
|
|
|||||
|
Total |
$ | 24,645 | $ | 21,643 | ||||
|
|
|
|
|
|||||
The Company paid $1.5 million in each of 2013 and 2012 for contracts insuring the lives of certain employees who are eligible to participate in certain non-qualified pension and deferred compensation plans. These insurance contracts will be used to fund the non-qualified pension and deferred compensation arrangements. The insurance contracts are held in a trust and are available to general creditors in the event of the Company’s insolvency. Changes in cash surrender value are recorded in operating expense and were not significant in 2012 and 2011. In 2013, increases in cash surrender value totaled $1.6 million and were offset by expenses related to the non-qualified pension and deferred compensation plans funded by the insurance contracts.
Capitalized software is amortized over its estimated useful life (generally 2 to 5 years) beginning at date of implementation.
Impairment of Long-Lived Assets. The Company evaluates long-lived assets (including property and equipment, goodwill and other intangible assets) for impairment whenever events or changes in business circumstances indicate the carrying value of the assets may not be recoverable. Goodwill and other intangible assets not subject to amortization are also reviewed for impairment annually in the fourth quarter. There were no write-downs of long-lived assets in the periods presented.
37
Table of Contents
Other Current Liabilities. Components of other current liabilities were (in thousands):
| 2013 | 2012 | |||||||
|
Accrued self-insurance retentions |
$ | 6,381 | $ | 6,952 | ||||
|
Accrued warranty and service liabilities |
7,771 | 7,943 | ||||||
|
Accrued trade promotions |
7,245 | 5,669 | ||||||
|
Payable for employee stock purchases |
7,908 | 7,203 | ||||||
|
Customer advances and deferred revenue |
11,693 | 10,617 | ||||||
|
Income taxes payable |
4,561 | 4,305 | ||||||
|
Other |
23,608 | 22,704 | ||||||
|
|
|
|
|
|||||
|
Total |
$ | 69,167 | $ | 65,393 | ||||
|
|
|
|
|
|||||
Self-Insurance. The Company is self-insured for certain losses and costs relating to product liability, workers’ compensation and employee medical benefits claims. The Company has purchased stop-loss coverage in order to limit its exposure to significant claims. Accrued self-insured retentions are based on claims filed and estimates of claims incurred but not reported.
Product Warranties. A liability is established for estimated future warranty and service claims that relate to current and prior period sales. The Company estimates warranty costs based on historical claim experience and other factors including evaluating specific product warranty issues. Following is a summary of activity in accrued warranty and service liabilities (in thousands):
| 2013 | 2012 | |||||||
|
Balance, beginning of year |
$ | 7,943 | $ | 6,709 | ||||
|
Assumed in business acquisition |
- | 1,121 | ||||||
|
Charged to expense |
6,119 | 6,182 | ||||||
|
Margin on parts sales reversed |
3,819 | 2,244 | ||||||
|
Reductions for claims settled |
(10,110) | (8,313) | ||||||
|
|
|
|
|
|||||
|
Balance, end of year |
$ | 7,771 | $ | 7,943 | ||||
|
|
|
|
|
|||||
Revenue Recognition . Sales are recognized when revenue is realized or realizable and has been earned. The Company’s policy is to recognize revenue when risk and title passes to the customer. This is generally on the date of shipment, however certain sales have terms requiring recognition when received by the customer. In cases where there are specific customer acceptance provisions, revenue is recognized at the later of customer acceptance or shipment (subject to shipping terms). Payment terms are established based on the type of product, distributor capabilities and competitive market conditions. Rights of return are typically contractually limited, amounts are estimable, and the Company records provisions for anticipated returns and warranty claims at the time revenue is recognized. Historically, sales returns have been approximately 2 percent of sales. Provisions for sales returns are recorded as a reduction of net sales, and provisions for warranty claims are recorded in selling, marketing and distribution expenses. From time to time, the Company may promote the sale of new products by agreeing to accept returns of superseded products. In such cases, provisions for estimated returns are recorded as a reduction of net sales.
Trade promotions are offered to distributors and end users through various programs, generally with terms of one year or less. Such promotions include cooperative advertising arrangements, rebates based on annual purchases, coupons and reimbursement for competitive products. Payment of incentives may take the form of cash, trade credit, promotional merchandise or free product. Under cooperative advertising arrangements, the Company reimburses the distributor for a portion of its advertising costs related to the Company’s products; estimated costs are accrued at the time of sale and classified as selling, marketing and distribution expense. Rebates are accrued based on the program rates and progress toward the estimated annual sales amount, and are recorded as a reduction of sales (cash, trade credit) or cost of products sold (free goods). The estimated costs related to coupon programs are accrued at the time of sale and classified as selling, marketing and distribution expense or cost of products sold, depending on the type of incentive offered.
Shipping and Handling. Shipping and handling costs incurred for the delivery of goods to customers are included in cost of goods sold in the accompanying Consolidated Statements of Income. Amounts billed to customers for shipping and handling are included in net sales.
Earnings Per Common Share . Basic net earnings per share is computed by dividing earnings available to common shareholders by the weighted average number of shares outstanding during the year. Diluted net earnings per share is computed after giving effect to the exercise of all dilutive outstanding option grants.
38
Table of Contents
Comprehensive Income. Comprehensive income is a measure of all changes in shareholders’ equity except those resulting from investments by and distributions to owners, and includes such items as net earnings, certain foreign currency translation items, changes in the value of qualifying hedges and pension liability adjustments.
Derivative Instruments and Hedging Activities . The Company accounts for all derivatives, including those embedded in other contracts, as either assets or liabilities and measures those financial instruments at fair value. The accounting for changes in the fair value of derivatives depends on their intended use and designation.
As part of its risk management program, the Company may periodically use forward exchange contracts and interest rate swaps to manage known market exposures. Terms of derivative instruments are structured to match the terms of the risk being managed and are generally held to maturity. The Company does not hold or issue derivative financial instruments for trading purposes. All other contracts that contain provisions meeting the definition of a derivative also meet the requirements of, and have been designated as, normal purchases or sales. The Company’s policy is to not enter into contracts with terms that cannot be designated as normal purchases or sales.
The Company periodically evaluates its monetary asset and liability positions denominated in foreign currencies. The Company enters into forward contracts or options, or borrows in various currencies, in order to hedge its net monetary positions. These instruments are recorded at fair value and the gains and losses are included in other expense, net. The notional amounts of contracts outstanding as of December 27, 2013 totaled $22 million. The Company believes it uses strong financial counterparts in these transactions and that the resulting credit risk under these hedging strategies is not significant.
The Company uses significant other observable inputs (level 2 in the fair value hierarchy) to value the derivative instruments used to hedge interest rate volatility and net monetary positions, including reference to market prices and financial models that incorporate relevant market assumptions. The fair market value and balance sheet classification of such instruments follows (in thousands):
| Balance Sheet Classification | 2013 | 2012 | ||||||||
|
Gain (loss) on foreign currency forward contracts |
||||||||||
|
Gains |
$ | 306 | $ | 553 | ||||||
|
Losses |
(15) | (62) | ||||||||
|
|
|
|
|
|||||||
|
Net |
Accounts receivable | $ | 291 | $ | 491 | |||||
|
|
|
|
|
|||||||
Recent Accounting Pronouncements. The accounting standards updates issued by The Financial Accounting Standards Board (FASB) that will be effective for the Company in 2014 will not have a significant impact on the Company’s consolidated financial statements.
B. Segment Information
The Company has three reportable segments: Industrial (which aggregates four operating segments), Contractor and Lubrication. The Industrial segment markets equipment and pre-engineered packages for moving and applying paints, coatings, sealants, adhesives and other fluids. Markets served include automotive and truck assembly and components plants, wood and metal products, rail, marine, aerospace, farm, construction, bus, recreational vehicles, and various other industries. The Contractor segment markets sprayers for architectural coatings for painting, corrosion control, texture, and line striping. The Lubrication segment markets products to move and dispense lubricants for fast oil change facilities, service garages, fleet service centers, automobile dealerships, the mining industry and industrial lubrication applications. All segments market parts and accessories for their products.
The accounting policies of the segments are the same as those described in the summary of significant accounting policies. The cost of manufacturing for each segment is based on product cost, and expenses are based on actual costs incurred along with cost allocations of shared and centralized functions based on activities performed, sales or space utilization. Depreciation expense is charged to the manufacturing or operating cost center that utilizes the asset, and is then allocated to segments on the same basis as other expenses within that cost center.
Reportable segments are defined by product. Segments are responsible for development, manufacturing, marketing and sales of their products. This allows for focused marketing and efficient product development. The segments share common purchasing, certain manufacturing, distribution and administration functions.
39
Table of Contents
|
Reportable Segments (in thousands) |
2013 |
2012 |
2011 |
|||||||||
|
Net Sales |
||||||||||||
|
Industrial |
$ | 652,344 | $ | 603,398 | $ | 501,841 | ||||||
|
Contractor |
342,546 | 298,811 | 290,732 | |||||||||
|
Lubrication |
109,134 | 110,247 | 102,710 | |||||||||
|
|
|
|
|
|
|
|||||||
|
Total |
$ | 1,104,024 | $ | 1,012,456 | $ | 895,283 | ||||||
|
|
|
|
|
|
|
|||||||
|
Operating Earnings |
||||||||||||
|
Industrial |
$ | 211,265 | $ | 186,129 | $ | 173,694 | ||||||
|
Contractor |
72,245 | 54,310 | 50,581 | |||||||||
|
Lubrication |
22,512 | 22,535 | 18,928 | |||||||||
|
Unallocated corporate (expense) |
(26,253) | (38,297) | (23,689) | |||||||||
|
|
|
|
|
|
|
|||||||
|
Total |
$ | 279,769 | $ | 224,677 | $ | 219,514 | ||||||
|
|
|
|
|
|
|
|||||||
|
Assets |
||||||||||||
|
Industrial |
$ | 591,135 | $ | 567,879 | ||||||||
|
Contractor |
152,300 | 141,094 | ||||||||||
|
Lubrication |
82,503 | 84,079 | ||||||||||
|
Unallocated corporate |
501,290 | 528,682 | ||||||||||
|
|
|
|
|
|||||||||
|
Total |
$ | 1,327,228 | $ | 1,321,734 | ||||||||
|
|
|
|
|
|||||||||
Unallocated corporate (expense) is not included in management’s measurement of segment performance and includes such items as acquisition and divestiture transaction costs, stock compensation, bad debt expense, charitable contributions and certain portions of pension expense. Unallocated assets include cash, allowances and valuation reserves, deferred income taxes, certain capital items and other assets.
|
Geographic Information (in thousands) |
2013 |
2012 |
2011 |
|||||||||
|
Net Sales (based on customer location) |
||||||||||||
|
United States |
$ | 498,478 | $ | 440,757 | $ | 394,318 | ||||||
|
Other countries |
605,546 | 571,699 | 500,965 | |||||||||
|
|
|
|
|
|
|
|||||||
|
Total |
$ | 1,104,024 | $ | 1,012,456 | $ | 895,283 | ||||||
|
|
|
|
|
|
|
|||||||
|
Long-lived Assets |
||||||||||||
|
United States |
$ | 120,262 | $ | 119,331 | ||||||||
|
Other countries |
31,455 | 32,213 | ||||||||||
|
|
|
|
|
|||||||||
|
Total |
$ | 151,717 | $ | 151,544 | ||||||||
|
|
|
|
|
|||||||||
Sales to Major Customers
There were no customers that accounted for 10 percent or more of consolidated sales in 2013, 2012 or 2011.
C. Inventories
Major components of inventories were as follows (in thousands):
| 2013 | 2012 | |||||||
|
Finished products and components |
$ | 65,963 | $ | 58,703 | ||||
|
Products and components in various stages of completion |
41,458 | 44,001 | ||||||
|
Raw materials and purchased components |
69,051 | 59,190 | ||||||
|
|
|
|
|
|||||
| 176,472 | 161,894 | |||||||
|
Reduction to LIFO cost |
(42,685) | (40,345) | ||||||
|
|
|
|
|
|||||
|
Total |
$ | 133,787 | $ | 121,549 | ||||
|
|
|
|
|
|||||
Inventories valued under the LIFO method were $76.9 million in 2013 and $72.6 million in 2012. All other inventory was valued on the FIFO method.
40
Table of Contents
D. Property, Plant and Equipment
Property, plant and equipment were as follows (in thousands):
| 2013 | 2012 | |||||||
|
Land and improvements |
$ | 16,506 | $ | 16,261 | ||||
|
Buildings and improvements |
118,460 | 115,774 | ||||||
|
Manufacturing equipment |
222,810 | 214,073 | ||||||
|
Office, warehouse and automotive equipment |
35,887 | 33,388 | ||||||
|
Additions in progress |
14,224 | 9,571 | ||||||
|
|
|
|
|
|||||
|
Total property, plant and equipment |
407,887 | 389,067 | ||||||
|
Accumulated depreciation |
(256,170) | (237,523) | ||||||
|
|
|
|
|
|||||
|
Net property, plant and equipment |
$ | 151,717 | $ | 151,544 | ||||
|
|
|
|
|
|||||
Depreciation expense was $23.4 million in 2013, $22.2 million in 2012 and $20.6 million in 2011.
E. Income Taxes
Earnings before income tax expense consist of (in thousands):
| 2013 | 2012 | 2011 | ||||||||||
|
Domestic |
$ | 238,928 | $ | 184,132 | $ | 186,374 | ||||||
|
Foreign |
49,894 | 33,194 | 23,354 | |||||||||
|
|
|
|
|
|
|
|||||||
|
Total |
$ | 288,822 | $ | 217,326 | $ | 209,728 | ||||||
|
|
|
|
|
|
|
|||||||
Income tax expense consists of (in thousands):
| 2013 | 2012 | 2011 | ||||||||||
|
Current |
||||||||||||
|
Domestic |
||||||||||||
|
Federal |
$ | 64,753 | $ | 61,989 | $ | 58,192 | ||||||
|
State and local |
2,470 | 5,180 | 3,920 | |||||||||
|
Foreign |
11,569 | 11,218 | 7,161 | |||||||||
|
|
|
|
|
|
|
|||||||
| 78,792 | 78,387 | 69,273 | ||||||||||
|
|
|
|
|
|
|
|||||||
|
Deferred |
||||||||||||
|
Domestic |
(553) | (5,431) | (1,496) | |||||||||
|
Foreign |
(239) | (4,756) | (377) | |||||||||
|
|
|
|
|
|
|
|||||||
| (792) | (10,187) | (1,873) | ||||||||||
|
|
|
|
|
|
|
|||||||
|
Total |
$ | 78,000 | $ | 68,200 | $ | 67,400 | ||||||
|
|
|
|
|
|
|
|||||||
Income taxes paid were $78.0 million, $71.7 million and $61.3 million in 2013, 2012 and 2011.
A reconciliation between the U.S. federal statutory tax rate and the effective tax rate follows:
| 2013 | 2012 | 2011 | ||||||||||
|
Statutory tax rate |
35 % | 35 % | 35 % | |||||||||
|
Tax effect of international operations |
(1) | (1) | - | |||||||||
|
State taxes, net of federal effect |
1 | 1 | 1 | |||||||||
|
U.S. general business tax credits |
(2) | - | (2) | |||||||||
|
Domestic production deduction |
(3) | (2) | (3) | |||||||||
|
Dividends from Liquid Finishing |
(3) | (2) | - | |||||||||
|
Other |
- | - | 1 | |||||||||
|
|
|
|
|
|
|
|||||||
|
Effective tax rate |
27 % | 31 % | 32 % | |||||||||
|
|
|
|
|
|
|
|||||||
41
Table of Contents
Deferred income taxes are provided for temporary differences between the financial reporting and the tax basis of assets and liabilities. The deferred tax assets (liabilities) resulting from these differences are as follows (in thousands):
| 2013 | 2012 | |||||||
|
Inventory valuations |
$ | 8,825 | $ | 8,289 | ||||
|
Self-insurance retention accruals |
1,887 | 2,035 | ||||||
|
Warranty reserves |
2,089 | 2,091 | ||||||
|
Vacation accruals |
2,740 | 2,406 | ||||||
|
Bad debt reserves |
1,961 | 1,753 | ||||||
|
Other |
1,325 | 1,168 | ||||||
|
|
|
|
|
|||||
|
Deferred income taxes, current |
18,827 | 17,742 | ||||||
|
Included in other current liabilities |
(1,095) | (1,042) | ||||||
|
|
|
|
|
|||||
|
Total Current |
17,732 | 16,700 | ||||||
|
|
|
|
|
|||||
|
Unremitted earnings of consolidated foreign subsidiaries |
(6,316) | (4,016) | ||||||
|
Excess of tax over book depreciation |
(42,322) | (42,195) | ||||||
|
Pension liability |
20,798 | 36,821 | ||||||
|
Postretirement medical |
8,097 | 7,998 | ||||||
|
Acquisition costs |
3,644 | 4,024 | ||||||
|
Stock compensation |
14,401 | 13,046 | ||||||
|
Deferred compensation |
1,193 | 982 | ||||||
|
Other |
(64) | 200 | ||||||
|
|
|
|
|
|||||
|
Total Non-current |
(569) | 16,860 | ||||||
|
|
|
|
|
|||||
|
Net deferred tax assets |
$ | 17,163 | $ | 33,560 | ||||
|
|
|
|
|
|||||
Total deferred tax assets were $78.6 million and $93.2 million, and total deferred tax liabilities were $61.4 million and $59.6 million on December 27, 2013 and December 28, 2012.
The Company files income tax returns in the U.S. federal jurisdiction, and various states and foreign jurisdictions. With few exceptions, the Company is no longer subject to U.S. federal, state and local, or non-U.S. income tax examinations by tax authorities for years before 2007.
The Company records penalties and accrued interest related to uncertain tax positions in income tax expense. Total reserves for uncertain tax positions were not material.
A summary of debt follows (dollars in thousands):
|
Average
Interest Rate December 27, 2013 |
Maturity | 2013 | 2012 | |||||||||||||
|
Private placement unsecured fixed-rate notes |
||||||||||||||||
|
Series A |
4.00 % | March 2018 | $ | 75,000 | $ | 75,000 | ||||||||||
|
Series B |
5.01 % | March 2023 | 75,000 | 75,000 | ||||||||||||
|
Series C |
4.88 % | January 2020 | 75,000 | 75,000 | ||||||||||||
|
Series D |
5.35 % | July 2026 | 75,000 | 75,000 | ||||||||||||
|
Unsecured revolving credit facility |
1.42 % | March 2017 | 108,370 | 256,480 | ||||||||||||
|
Notes payable to banks |
0.81 % | 2014 | 9,584 | 8,133 | ||||||||||||
|
|
|
|
|
|||||||||||||
|
Total debt, including current portion |
$ | 417,954 | $ | 564,613 | ||||||||||||
|
|
|
|
|
|||||||||||||
The estimated fair value of debt with fixed interest rates was $320 million on December 27, 2013 and $330 million on December 28, 2012. The fair value of variable rate borrowings approximates carrying value. The Company uses significant other observable inputs to estimate fair value (level 2 of the fair value hierarchy) based on the present value of future cash flows and rates that would be available for issuance of debt with similar terms and remaining maturities.
42
Table of Contents
On March 27, 2012, the Company’s $250 million credit agreement was terminated in connection with the execution of an amendment to a new unsecured revolving credit agreement. The new agreement is with a syndicate of lenders and expires in March 2017. It provides up to $450 million of committed credit, available for general corporate purposes, working capital needs, share repurchases and acquisitions. The Company may borrow up to $50 million under the swingline portion of the facility for daily working capital needs.
Under terms of the revolving credit agreement, loans denominated in U.S. dollars bear interest, at the Company’s option, at either a base rate or a LIBOR-based rate. Loans denominated in currencies other than U.S. dollars bear interest at a LIBOR-based rate. The base rate is an annual rate equal to a margin ranging from zero percent to 1 percent, depending on the Company’s cash flow leverage ratio (debt to earnings before interest, taxes, depreciation, amortization and extraordinary non-operating or non-cash charges and expenses) plus the highest of (i) the bank’s prime rate, (ii) the federal funds rate plus 0.5 percent or (iii) one-month LIBOR plus 1.5 percent. In general, LIBOR-based loans bear interest at LIBOR plus 1 percent to 2 percent, depending on the Company’s cash flow leverage ratio. The Company is also required to pay a fee on the undrawn amount of the loan commitment at an annual rate ranging from 0.15 percent to 0.40 percent, depending on the Company’s cash flow leverage ratio.
On December 27, 2013, the Company had $502 million in lines of credit, including the $450 million in committed credit facilities described above and $52 million with foreign banks. The unused portion of committed credit lines was $355 million as of December 27, 2013. In addition, the Company has unused, uncommitted lines of credit with foreign banks totaling $32 million. Borrowing rates under these credit lines vary with the prime rate, rates on domestic certificates of deposit and the London Interbank market. The Company pays facility fees of up to 0.15 percent per annum on certain of these lines. No compensating balances are required.
Various debt agreements require the Company to maintain certain financial ratios as to cash flow leverage and interest coverage. The Company is in compliance with all financial covenants of its debt agreements.
Annual maturities of debt are as follows (in thousands):
|
2014 |
$ | 9,584 | ||||
|
2015 |
- | |||||
|
2016 |
- | |||||
|
2017 |
108,370 | |||||
|
2018 |
75,000 | |||||
|
Thereafter |
225,000 | |||||
Interest paid on debt during 2013, 2012 and 2011 was $18.3 million, $19.0 million and $8.7 million.
G. Shareholders’ Equity
At December 27, 2013, the Company had 22,549 authorized, but not issued, cumulative preferred shares, $100 par value. The Company also has authorized, but not issued, a separate class of 3 million shares of preferred stock, $1 par value.
The Company maintained a plan in which one preferred share purchase right (“Right”) existed for each common share of the Company. Each Right entitled its holder to purchase one one-thousandth of a share of a new series of junior participating preferred stock at an exercise price of $150, subject to adjustment. The Rights were exercisable only if a person or group acquired beneficial ownership of 15 percent or more of the Company’s outstanding common stock. On February 15, 2013, the Company terminated the plan and all of the Rights expired.
43
Table of Contents
Changes in components of accumulated other comprehensive income (loss), net of tax were (in thousands):
|
Pension
and Post- retirement Medical |
Cumulative
Translation Adjustment |
Gain (Loss)
on Interest Rate Hedge Contracts |
Total | |||||||||||||
|
2011 |
||||||||||||||||
|
Beginning balance |
$ | (51,334) | $ | (823) | $ | (286) | $ | (52,443) | ||||||||
|
Other comprehensive income (loss) before reclassifications |
(28,112) | - | - | (28,112) | ||||||||||||
|
Amounts reclassified from accumulated other comprehensive income |
3,788 | - | 286 | 4,074 | ||||||||||||
|
|
|
|
|
|
|
|
|
|||||||||
|
Ending balance |
$ | (75,658) | $ | (823) | $ | - | $ | (76,481) | ||||||||
|
|
|
|
|
|
|
|
|
|||||||||
|
2012 |
||||||||||||||||
|
Beginning balance |
$ | (75,658) | $ | (823) | $ | - | $ | (76,481) | ||||||||
|
Other comprehensive income (loss) before reclassifications |
(10,993) | (3,206) | - | (14,199) | ||||||||||||
|
Amounts reclassified from accumulated other comprehensive income |
6,935 | - | - | 6,935 | ||||||||||||
|
|
|
|
|
|
|
|
|
|||||||||
|
Ending balance |
$ | (79,716) | $ | (4,029) | $ | - | $ | (83,745) | ||||||||
|
|
|
|
|
|
|
|
|
|||||||||
|
2013 |
||||||||||||||||
|
Beginning balance |
$ | (79,716) | $ | (4,029) | $ | - | $ | (83,745) | ||||||||
|
Other comprehensive income (loss) before reclassifications |
23,103 | 7,812 | - | 30,915 | ||||||||||||
|
Amounts reclassified from accumulated other comprehensive income |
6,481 | - | - | 6,481 | ||||||||||||
|
|
|
|
|
|
|
|
|
|||||||||
|
Ending balance |
$ | (50,132) | $ | 3,783 | $ | - | $ | (46,349) | ||||||||
|
|
|
|
|
|
|
|
|
|||||||||
Amounts related to pension and postretirement medical adjustments are reclassified to pension cost, which is allocated to cost of products sold and operating expenses based on salaries and wages, approximately as follows (in thousands):
| 2013 | 2012 | 2011 | ||||||||||
|
Cost of products sold |
$ | 3,635 | $ | 3,900 | $ | 2,122 | ||||||
|
Product development |
1,699 | 1,728 | 901 | |||||||||
|
Selling, marketing and distribution |
2,828 | 2,886 | 1,636 | |||||||||
|
General and administrative |
2,124 | 2,032 | 1,065 | |||||||||
|
|
|
|
|
|
|
|||||||
|
Total before tax |
$ | 10,286 | $ | 10,546 | $ | 5,724 | ||||||
|
Income tax (benefit) |
(3,805) | (3,611) | (1,936) | |||||||||
|
|
|
|
|
|
|
|||||||
|
Total after tax |
$ | 6,481 | $ | 6,935 | $ | 3,788 | ||||||
|
|
|
|
|
|
|
|||||||
44
Table of Contents
H. Share-Based Awards, Purchase Plans and Compensation Cost
Stock Option and Award Plan. The Company has a stock incentive plan under which it grants stock options and share awards to directors, officers and other employees. Option price is the market price on the date of grant. Options become exercisable at such time, generally over three or four years, and in such installments as set by the Company, and expire ten years from the date of grant.
Restricted share awards have been made to certain key employees under the plan. The market value of restricted stock at the date of grant is charged to operations over the vesting period. Compensation cost charged to operations for restricted share awards was $528,000 in 2013, $408,000 in 2012 and $291,000 in 2011. Individual nonemployee directors of the Company may elect to receive, either currently or deferred, all or part of their annual retainer, and/or payment for attendance at Board or Committee meetings, in the form of shares of the Company’s common stock instead of cash. Under this arrangement, the Company issued 6,079 shares in 2013, 7,656 shares in 2012 and 8,190 shares in 2011. The expense related to this arrangement is not significant. The Company has a stock appreciation plan that provides for payments of cash to eligible foreign employees based on the change in the market price of the Company’s common stock over a period of time. Compensation cost related to this plan was $1,900,000 in 2013, $470,000 in 2012 and $851,000 in 2011.
Options on common shares granted and outstanding, as well as the weighted average exercise price, are shown below (in thousands, except per share amounts):
|
Option
Shares |
Weighted
Average Exercise Price |
Options
Exercisable |
Weighted
Average Exercise Price |
|||||||||||||
|
Outstanding, December 31, 2010 |
5,509 | $ | 30.42 | 2,980 | $ | 31.99 | ||||||||||
|
Granted |
569 | 43.15 | ||||||||||||||
|
Exercised |
(553) | 26.19 | ||||||||||||||
|
Canceled |
(47) | 35.55 | ||||||||||||||
|
|
|
|
|
|
|
|
|
|||||||||
|
Outstanding, December 30, 2011 |
5,478 | 32.12 | 3,211 | 32.27 | ||||||||||||
|
Granted |
566 | 50.33 | ||||||||||||||
|
Exercised |
(805) | 27.14 | ||||||||||||||
|
Canceled |
(47) | 35.24 | ||||||||||||||
|
|
|
|
|
|
|
|
|
|||||||||
|
Outstanding, December 28, 2012 |
5,192 | 34.85 | 3,194 | 32.99 | ||||||||||||
|
Granted |
969 | 65.97 | ||||||||||||||
|
Exercised |
(990) | 33.04 | ||||||||||||||
|
Canceled |
(22) | 40.71 | ||||||||||||||
|
|
|
|
|
|
|
|
|
|||||||||
|
Outstanding, December 27, 2013 |
5,149 | $ | 41.03 | 3,311 | $ | 33.20 | ||||||||||
|
|
|
|
|
|
|
|
|
|||||||||
The following table summarizes information for options outstanding and exercisable at December 27, 2013 (in thousands, except per share and contractual term amounts):
|
Range of
|
Options
|
Options
|
Options
|
Options
|
Options
|
|||||||||||||||
| $ | 16-30 | 1,469 | 5 | $ | 23.62 | 1,295 | $ | 23.16 | ||||||||||||
| $ | 30-45 | 2,062 | 5 | 38.97 | 1,805 | 38.50 | ||||||||||||||
| $ | 45-60 | 1,211 | 8 | 53.97 | 211 | 49.44 | ||||||||||||||
| $ | 60-76 | 407 | 10 | 75.88 | - | - | ||||||||||||||
|
|
|
|
|
|
|
|
|
|
|
|
||||||||||
| $ | 16-76 | 5,149 | 6 | $ | 41.03 | 3,311 | $ | 33.20 | ||||||||||||
|
|
|
|
|
|
|
|
|
|
|
|
||||||||||
The aggregate intrinsic value of exercisable option shares was $147.7 million as of December 27, 2013, with a weighted average contractual term of 4.9 years. There were approximately 5.1 million vested share options and share options expected to vest as of December 27, 2013, with an aggregate intrinsic value of $71.3 million, a weighted average exercise price of $40.71 and a weighted average contractual term of 6.2 years.
45
Table of Contents
Information related to options exercised follows (in thousands):
| 2013 | 2012 | 2011 | ||||||||||
|
Cash received |
$ | 32,630 | $ | 21,687 | $ | 14,476 | ||||||
|
Aggregate intrinsic value |
33,028 | 18,195 | 10,485 | |||||||||
|
Tax benefit realized |
11,200 | 6,200 | 3,500 | |||||||||
Stock Purchase Plan. Under the Company’s Employee Stock Purchase Plan, the purchase price of the shares is the lesser of 85 percent of the fair market value on the first day or the last day of the plan year. The Company issued 196,913 shares under this plan in 2013, 238,621 shares in 2012 and 313,013 shares in 2011.
Authorized Shares. Shares authorized for issuance under the stock option and purchase plans are shown below (in thousands):
|
Total Shares
Authorized |
Available for Future
Issuance as of December 27, 2013 |
|||||||
|
Stock Incentive Plan (2010) |
5,100 | 2,473 | ||||||
|
Employee Stock Purchase Plan (2006) |
7,000 | 5,288 | ||||||
|
|
|
|
|
|||||
|
Total |
12,100 | 7,761 | ||||||
|
|
|
|
|
|||||
Amounts available for future issuance exclude outstanding options. Options outstanding as of December 27, 2013, include options granted under three plans that were replaced by subsequent plans. No shares are available for future grants under those plans.
Share-based Compensation. The Company recognized share-based compensation cost of $16.5 million in 2013, $12.4 million in 2012 and $11.0 million in 2011, which reduced net income by $12.6 million, or $0.20 per weighted common share in 2013, $9.5 million, or $0.15 per weighted common share in 2012 and $8.4 million, or $0.14 per weighted common share in 2011. As of December 27, 2013, there was $15.2 million of unrecognized compensation cost related to unvested options, expected to be recognized over a weighted average period of approximately two years.
The fair value of each option grant is estimated on the date of grant using the Black-Scholes option-pricing model with the following weighted average assumptions and results:
| 2013 | 2012 | 2011 | ||||||||||
|
Expected life in years |
5.9 | 6.5 | 6.5 | |||||||||
|
Interest rate |
1.3 % | 1.3 % | 2.8 % | |||||||||
|
Volatility |
35.4 % | 36.6 % | 33.7 % | |||||||||
|
Dividend yield |
1.6 % | 1.8 % | 2.0 % | |||||||||
|
Weighted average fair value per share |
$ | 19.44 | $ | 15.60 | $ | 13.35 | ||||||
Expected life is estimated based on vesting terms and exercise and termination history. Interest rate is based on the U.S. Treasury rate on zero-coupon issues with a remaining term equal to the expected life of the option. Expected volatility is based on historical volatility over a period commensurate with the expected life of options.
The fair value of employees’ purchase rights under the Employee Stock Purchase Plan was estimated on the date of grant. The benefit of the 15 percent discount from the lesser of the fair market value per common share on the first day and the last day of the plan year was added to the fair value of the employees’ purchase rights determined using the Black-Scholes option-pricing model with the following assumptions and results:
| 2013 | 2012 | 2011 | ||||||||||
|
Expected life in years |
1.0 | 1.0 | 1.0 | |||||||||
|
Interest rate |
0.2 % | 0.2 % | 0.3 % | |||||||||
|
Volatility |
26.0 % | 40.6 % | 27.8 % | |||||||||
|
Dividend yield |
1.7 % | 1.7 % | 2.1 % | |||||||||
|
Weighted average fair value per share |
$ | 14.16 | $ | 15.58 | $ | 10.05 | ||||||
46
Table of Contents
I. Earnings per Share
The following table sets forth the computation of basic and diluted earnings per share (in thousands, except per share amounts):
| 2013 | 2012 | 2011 | ||||||||||
|
Net earnings available to common shareholders |
$ | 210,822 | $ | 149,126 | $ | 142,328 | ||||||
|
|
|
|
|
|
|
|||||||
|
Weighted average shares outstanding for basic earnings per share |
61,203 | 60,451 | 60,286 | |||||||||
|
Dilutive effect of stock options computed based on the treasury stock method using the average market price |
1,587 | 1,260 | 1,084 | |||||||||
|
|
|
|
|
|
|
|||||||
|
Weighted average shares outstanding for diluted earnings per share |
62,790 | 61,711 | 61,370 | |||||||||
|
|
|
|
|
|
|
|||||||
|
Basic earnings per share |
$ | 3.44 | $ | 2.47 | $ | 2.36 | ||||||
|
Diluted earnings per share |
$ | 3.36 | $ | 2.42 | $ | 2.32 | ||||||
Stock options to purchase 0.4 million, 0.6 million and 1.6 million shares were not included in the 2013, 2012 and 2011 computations of diluted earnings per share, respectively, because they would have been anti-dilutive.
J. Retirement Benefits
The Company has a defined contribution plan, under Section 401(k) of the Internal Revenue Code, which provides retirement benefits to most U.S. employees. For all employees who choose to participate, the Company matches employee contributions at a 100 percent rate, up to 3 percent of the employee’s compensation. For employees not covered by a defined benefit plan, the Company contributes an amount equal to 1.5 percent of the employee’s compensation. Employer contributions totaled $6.3 million in 2013, $5.6 million in 2012 and $4.2 million in 2011.
The Company’s postretirement medical plan provides certain medical benefits for retired U.S. employees. Employees hired before January 1, 2005, are eligible for these benefits upon retirement and fulfillment of other eligibility requirements as specified by the plan.
The Company has both funded and unfunded noncontributory defined benefit pension plans that together cover most U.S. employees hired before January 1, 2006, certain directors and some of the employees of the Company’s non-U.S. subsidiaries. For U.S. plans, benefits are based on years of service and the highest five consecutive years’ earnings in the ten years preceding retirement. The Company funds annually in amounts consistent with minimum funding levels and maximum tax deduction limits.
In 2012, the Company assumed the obligations and assets of a defined contribution plan with a guaranteed return that covers employees of an acquired business in Switzerland. The Swiss plan is funded by company and employee contributions. In 2013, the Company transferred responsibility for pension coverage under Swiss law to an insurance company. To effect the change, plan assets were converted to cash and deposited with the insurance company for investment under an insurance contract. Assets of the plan are valued at the amount of benefits liability of the insurance company and classified in the “other” assets category, level 2 in the fair value hierarchy. The transfer of responsibility for current retirees to the new plan carrier was treated as a settlement under ASC 715 and resulted in a reduction of plan obligations and assets, and a small settlement gain.
Investment policies and strategies of the U.S. funded pension plan are based on a long-term view of economic growth and heavily weighted toward equity securities. The primary goal of the plan’s investments is to ensure that the plan’s liabilities are met over time. In developing strategic asset allocation guidelines, an emphasis is placed on the long-term characteristics of individual asset classes, and the benefits of diversification among multiple asset classes. The plan invests primarily in domestic and international equities, fixed income securities, which include treasuries, highly-rated corporate bonds and high-yield bonds and real estate. The midpoints of the ranges of strategic target allocations for plan assets are 65 percent equity securities, 22 percent fixed income securities and 13 percent real estate and alternative investments.
Plan assets are held in a trust for the benefit of plan participants and are invested in various commingled funds, most of which are sponsored by the trustee. Equity securities are valued using quoted prices in active markets. The fair values for commingled equity and fixed-income funds, international equity funds, and real estate investments are measured using net asset values, which take into consideration the value of underlying fund investments, as well as the other accrued assets and liabilities of a fund, in order to determine a per share market value. Commingled fund and international equity funds are classified as level 2 because the net asset value is not directly traded on an active exchange. Certain trustee-sponsored funds allow redemptions monthly or quarterly, with 10 or 60 days advance notice, while most of the funds allow redemptions daily.
Level 3 assets consist of investments in real estate investment trust funds whose assets are valued at least annually by independent appraisal firms, using market, income and cost approaches. Significant unobservable quantitative inputs used in determining the fair
47
Table of Contents
value of each investment include cash flow assumptions, capitalization rates and discount rates. These inputs are subject to change based on changes in economic and market conditions and/or changes in use or timing of exit. Changes in cash flows, discount rates and terminal capitalization rates will result in increases or decreases in the fair values of these investments. It is not possible for us to predict the effect of future economic or market conditions on the estimated fair values of plan assets.
Plan assets by category and fair value measurement level were as follows (in thousands):
| Total | Level 1 | Level 2 | Level 3 | |||||||||||||
|
December 27, 2013 |
||||||||||||||||
|
Equity |
||||||||||||||||
|
U.S. Large Cap |
$ | 95,025 | $ | - | $ | 95,025 | $ | - | ||||||||
|
U.S. Small/Mid Cap |
18,020 | - | 18,020 | - | ||||||||||||
|
International |
69,140 | - | 69,140 | - | ||||||||||||
|
|
|
|
|
|
|
|
|
|||||||||
|
Total Equity |
182,185 | - | 182,185 | - | ||||||||||||
|
Fixed income |
48,718 | - | 40,158 | 8,560 | ||||||||||||
|
Real estate and other |
49,704 | 1,149 | 31,271 | 17,284 | ||||||||||||
|
|
|
|
|
|
|
|
|
|||||||||
|
Total |
$ | 280,607 | $ | 1,149 | $ | 253,614 | $ | 25,844 | ||||||||
|
|
|
|
|
|
|
|
|
|||||||||
|
December 28, 2012 |
||||||||||||||||
|
Equity |
||||||||||||||||
|
Graco common stock |
$ | 7,196 | $ | 7,196 | $ | - | $ | - | ||||||||
|
U.S. Large Cap |
78,263 | - | 78,263 | - | ||||||||||||
|
U.S. Small/Mid Cap |
12,282 | - | 12,282 | - | ||||||||||||
|
International |
67,459 | - | 67,459 | - | ||||||||||||
|
|
|
|
|
|
|
|
|
|||||||||
|
Total Equity |
165,200 | 7,196 | 158,004 | - | ||||||||||||
|
Fixed income |
63,592 | - | 63,592 | - | ||||||||||||
|
Real estate and other |
17,814 | 2,676 | - | 15,138 | ||||||||||||
|
|
|
|
|
|
|
|
|
|||||||||
|
Total |
$ | 246,606 | $ | 9,872 | $ | 221,596 | $ | 15,138 | ||||||||
|
|
|
|
|
|
|
|
|
|||||||||
A reconciliation of the beginning and ending balances of level 3 plan assets follows:
| 2013 | 2012 | |||||||
|
Balance, beginning of year |
$ | 15,138 | $ | 9,247 | ||||
|
Pension assets of acquired businesses |
- | 5,216 | ||||||
|
Purchases |
14,277 | 4,443 | ||||||
|
Redemptions |
(5,351) | (4,891) | ||||||
|
Change in unrealized gains (losses) |
1,780 | 1,123 | ||||||
|
|
|
|
|
|||||
|
Balance, end of year |
$ | 25,844 | $ | 15,138 | ||||
|
|
|
|
|
|||||
48
Table of Contents
The Company uses a year-end measurement date for all of its plans. The following provides a reconciliation of the changes in the plans’ benefit obligations and fair value of assets over the periods ending December 27, 2013, and December 28, 2012, and a statement of the funded status as of the same dates (in thousands):
| Pension Benefits | Postretirement Medical Benefits | |||||||||||||||
| 2013 | 2012 | 2013 | 2012 | |||||||||||||
|
Change in benefit obligation |
||||||||||||||||
|
Obligation, beginning of year |
$ | 359,701 | $ | 278,611 | $ | 23,472 | $ | 23,445 | ||||||||
|
Pension obligation of acquired businesses |
- | 39,139 | - | - | ||||||||||||
|
Service cost |
7,447 | 6,414 | 626 | 589 | ||||||||||||
|
Interest cost |
14,149 | 13,729 | 961 | 986 | ||||||||||||
|
Actuarial loss (gain) |
(15,653) | 31,869 | (2,582) | (294) | ||||||||||||
|
Plan changes |
3,197 | - | - | - | ||||||||||||
|
Benefit payments |
(10,762) | (9,717) | (1,135) | (1,254) | ||||||||||||
|
Settlements |
(7,430) | - | - | - | ||||||||||||
|
Exchange rate changes |
1,622 | (344) | - | - | ||||||||||||
|
|
|
|
|
|
|
|
|
|||||||||
|
Obligation, end of year |
$ | 352,271 | $ | 359,701 | $ | 21,342 | $ | 23,472 | ||||||||
|
|
|
|
|
|
|
|
|
|||||||||
|
Change in plan assets |
||||||||||||||||
|
Fair value, beginning of year |
$ | 246,606 | $ | 181,319 | $ | - | $ | - | ||||||||
|
Pension assets of acquired businesses |
- | 32,132 | - | - | ||||||||||||
|
Actual return on assets |
40,280 | 30,861 | - | - | ||||||||||||
|
Employer contributions |
10,728 | 12,437 | 1,135 | 1,254 | ||||||||||||
|
Benefit payments |
(10,762) | (9,717) | (1,135) | (1,254) | ||||||||||||
|
Settlements |
(7,241) | - | - | - | ||||||||||||
|
Exchange rate changes |
996 | (426) | - | - | ||||||||||||
|
|
|
|
|
|
|
|
|
|||||||||
|
Fair value, end of year |
$ | 280,607 | $ | 246,606 | $ | - | $ | - | ||||||||
|
|
|
|
|
|
|
|
|
|||||||||
|
Funded status |
$ | (71,664) | $ | (113,095) | $ | (21,342) | $ | (23,472) | ||||||||
|
|
|
|
|
|
|
|
|
|||||||||
|
Amounts recognized in consolidated balance sheets |
||||||||||||||||
|
Current liabilities |
$ | 1,116 | $ | 850 | $ | 1,256 | $ | 1,254 | ||||||||
|
Non-current liabilities |
70,548 | 112,245 | 20,086 | 22,218 | ||||||||||||
|
|
|
|
|
|
|
|
|
|||||||||
|
Total liabilities |
$ | 71,664 | $ | 113,095 | $ | 21,342 | $ | 23,472 | ||||||||
|
|
|
|
|
|
|
|
|
|||||||||
The accumulated benefit obligation as of year-end for all defined benefit pension plans was $326 million for 2013 and $330 million for 2012. Information for plans with an accumulated benefit obligation in excess of plan assets follows (in thousands):
| 2013 | 2012 | |||||||
|
Projected benefit obligation |
$ | 352,271 | $ | 359,701 | ||||
|
Accumulated benefit obligation |
326,030 | 329,530 | ||||||
|
Fair value of plan assets |
280,607 | 246,606 | ||||||
The components of net periodic benefit cost for the plans for 2013, 2012 and 2011 were as follows (in thousands):
| Pension Benefits | Postretirement Medical Benefits | |||||||||||||||||||||||
| 2013 | 2012 | 2011 | 2013 | 2012 | 2011 | |||||||||||||||||||
|
Service cost-benefits earned during the period |
$ | 7,447 | $ | 6,414 | $ | 4,429 | $ | 626 | $ | 589 | $ | 602 | ||||||||||||
|
Interest cost on projected benefit obligation |
14,149 | 13,729 | 13,072 | 961 | 986 | 1,219 | ||||||||||||||||||
|
Expected return on assets |
(18,508) | (15,907) | (15,802) | - | - | - | ||||||||||||||||||
|
Amortization of prior service cost (credit) |
8 | (5) | (5) | (658) | (658) | (658) | ||||||||||||||||||
|
Amortization of net loss (gain) |
10,456 | 10,814 | 5,819 | 480 | 395 | 568 | ||||||||||||||||||
|
Cost of pension plans which are not significant and have not adopted ASC 715 |
94 | 121 | 97 | N/A | N/A | N/A | ||||||||||||||||||
|
|
|
|
|
|
|
|
|
|
|
|
|
|||||||||||||
|
Net periodic benefit cost |
$ | 13,646 | $ | 15,166 | $ | 7,610 | $ | 1,409 | $ | 1,312 | $ | 1,731 | ||||||||||||
|
|
|
|
|
|
|
|
|
|
|
|
|
|||||||||||||
49
Table of Contents
Amounts recognized in other comprehensive (income) loss in 2013 and 2012 were as follows (in thousands):
| Pension Benefits | Postretirement Medical Benefits | |||||||||||||||
| 2013 | 2012 | 2013 | 2012 | |||||||||||||
|
Net loss (gain) arising during the period |
$ | (37,284) | $ | 17,011 | $ | (2,582) | $ | (294) | ||||||||
|
Prior service cost (credit) arising during the period |
3,197 | - | - | - | ||||||||||||
|
Amortization of net gain (loss) |
(10,456) | (10,814) | (480) | (395) | ||||||||||||
|
Amortization of prior service credit (cost) |
(8) | 5 | 658 | 658 | ||||||||||||
|
|
|
|
|
|
|
|
|
|||||||||
|
Total |
$ | (44,551) | $ | 6,202 | $ | (2,404) | $ | (31) | ||||||||
|
|
|
|
|
|
|
|
|
|||||||||
Amounts included in accumulated other comprehensive (income) loss as of December 27, 2013 and December 28, 2012, that had not yet been recognized as components of net periodic benefit cost, were as follows (in thousands):
| Pension Benefits | Postretirement Medical Benefits | |||||||||||||||
| 2013 | 2012 | 2013 | 2012 | |||||||||||||
|
Prior service cost (credit) |
$ | 3,271 | $ | (123) | $ | (2,444) | $ | (3,101) | ||||||||
|
Net loss |
73,200 | 121,146 | 3,325 | 6,385 | ||||||||||||
|
|
|
|
|
|
|
|
|
|||||||||
|
Net before income taxes |
76,471 | 121,023 | 881 | 3,284 | ||||||||||||
|
Income taxes |
(26,903) | (43,409) | (317) | (1,182) | ||||||||||||
|
|
|
|
|
|
|
|
|
|||||||||
|
Net |
$ | 49,568 | $ | 77,614 | $ | 564 | $ | 2,102 | ||||||||
|
|
|
|
|
|
|
|
|
|||||||||
Amounts included in accumulated other comprehensive (income) loss that are expected to be recognized as components of net periodic benefit cost in 2014 were as follows (in thousands):
|
Pension
Benefits |
Postretirement
Medical Benefits |
|||||||
|
Prior service cost (credit) |
$ | 330 | $ | (658) | ||||
|
Net loss (gain) |
4,883 | 149 | ||||||
|
|
|
|
|
|||||
|
Net before income taxes |
5,213 | (509) | ||||||
|
Income taxes |
(1,877) | 183 | ||||||
|
|
|
|
|
|||||
|
Net |
$ | 3,336 | $ | (326) | ||||
|
|
|
|
|
|||||
Assumptions used to determine the Company’s benefit obligations are shown below:
| Pension Benefits | Postretirement Medical Benefits | |||||||||||||||
|
Weighted average assumptions |
2013 |
2012 |
2013 |
2012 |
||||||||||||
|
U.S. Plans |
||||||||||||||||
|
Discount rate |
5.0 % | 4.2 % | 5.0 % | 4.2 % | ||||||||||||
|
Rate of compensation increase |
3.0 % | 3.0 % | N/A | N/A | ||||||||||||
|
Non-U.S. Plans |
||||||||||||||||
|
Discount rate |
2.5 % | 2.3 % | N/A | N/A | ||||||||||||
|
Rate of compensation increase |
1.3 % | 1.3 % | N/A | N/A | ||||||||||||
50
Table of Contents
Assumptions used to determine the Company’s net periodic benefit cost are shown below:
| Pension Benefits | Postretirement Medical Benefits | |||||||||||||||||||||||
|
Weighted average assumptions |
2013 |
2012 |
2011 |
2013 |
2012 |
2011 |
||||||||||||||||||
|
U.S. Plans |
||||||||||||||||||||||||
|
Discount rate |
4.2 % | 4.6 % | 5.5 % | 4.2 % | 4.6 % | 5.5 % | ||||||||||||||||||
|
Rate of compensation increase |
3.0 % | 3.0 % | 3.8 % | N/A | N/A | N/A | ||||||||||||||||||
|
Expected return on assets |
8.5 % | 8.5 % | 8.5 % | N/A | N/A | N/A | ||||||||||||||||||
|
Non-U.S. Plans |
||||||||||||||||||||||||
|
Discount rate |
2.3 % | 2.9 % | 4.7 % | N/A | N/A | N/A | ||||||||||||||||||
|
Rate of compensation increase |
1.2 % | 1.2 % | 3.0 % | N/A | N/A | N/A | ||||||||||||||||||
|
Expected return on assets |
3.0 % | 3.0 % | N/A | N/A | N/A | N/A | ||||||||||||||||||
Several sources of information are considered in determining the expected rate of return assumption, including the allocation of plan assets, the input of actuaries and professional investment advisors, and historical long-term returns. In setting the return assumption, the Company recognizes that historical returns are not always indicative of future returns and also considers the long-term nature of its pension obligations.
The Company’s U.S. retirement medical plan limits the annual cost increase that will be paid by the Company to 3 percent. In measuring the accumulated postretirement benefit obligation (APBO), the annual trend rate for health care costs was assumed to be 7.4 percent for 2014, decreasing each year to a constant rate of 4.5 percent for 2026 and thereafter, subject to the plan’s annual increase limitation.
At December 27, 2013, a one percent change in assumed health care cost trend rates would not have a significant impact on the service and interest cost components of net periodic postretirement health care benefit cost or the APBO for health care benefits.
The Company expects to contribute $2.3 million to its unfunded pension plans and $1.3 million to the postretirement medical plan in 2014. The Company expects that contributions to the funded pension plan under minimum funding requirements for 2014 will not exceed $9 million, and that the amounts payable in 2014 may be eliminated by available credits. Estimated future benefit payments are as follows (in thousands):
|
Pension
Benefits |
Postretirement
Medical Benefits |
|||||||
|
2014 |
$ | 13,999 | $ | 1,256 | ||||
|
2015 |
15,045 | 1,314 | ||||||
|
2016 |
17,926 | 1,361 | ||||||
|
2017 |
16,675 | 1,395 | ||||||
|
2018 |
18,007 | 1,458 | ||||||
|
Years 2019 - 2023 |
104,174 | 8,032 | ||||||
51
Table of Contents
K. Commitments and Contingencies
Lease Commitments . Aggregate annual rental commitments under operating leases with noncancelable terms of more than one year were $13.2 million at December 27, 2013, payable as follows (in thousands):
| Buildings |
Vehicles &
Equipment |
Total | ||||||||||
|
2014 |
$ | 2,170 | $ | 3,214 | $ | 5,384 | ||||||
|
2015 |
1,914 | 2,083 | 3,997 | |||||||||
|
2016 |
1,350 | 1,250 | 2,600 | |||||||||
|
2017 |
1,338 | 841 | 2,179 | |||||||||
|
2018 |
1,360 | 555 | 1,915 | |||||||||
|
Thereafter |
7,655 | 764 | 8,419 | |||||||||
|
|
|
|
|
|
|
|||||||
|
Total |
$ | 15,787 | $ | 8,707 | $ | 24,494 | ||||||
|
|
|
|
|
|
|
|||||||
Total rental expense was $3.6 million for 2013, $3.3 million for 2012 and $3.0 million for 2011.
Other Commitments. The Company is committed to pay suppliers under the terms of open purchase orders issued in the normal course of business totaling approximately $57 million at December 27, 2013. The Company also has commitments with certain suppliers to purchase minimum quantities, and under the terms of certain agreements, the Company is committed for certain portions of the supplier’s inventory. The Company does not purchase, or commit to purchase, quantities in excess of normal usage or amounts that cannot be used within one year. The Company estimates that the maximum commitment amount under such agreements does not exceed $43 million. In addition, the Company could be obligated to perform under standby letters of credit totaling $3 million at December 27, 2013. The Company has also guaranteed the debt of its subsidiaries for up to $10 million. All debt of subsidiaries is reflected in the consolidated balance sheets.
Contingencies. The Company is party to various legal proceedings arising in the normal course of business. The Company is actively pursuing and defending these matters and has recorded an estimate of the probable costs. Management does not expect that resolution of these matters will have a material adverse effect on the Company, although the ultimate outcome cannot be determined based on available information.
As more fully described in Note L, under terms of orders issued by the FTC, the Company is required to separately maintain the Liquid Finishing businesses as viable and competitive while it seeks a buyer for those businesses. The Company’s maximum exposure to loss as a result of its involvement with the Liquid Finishing businesses would include the entirety of its investment of $422 million and reimbursement of losses of the operations of the Liquid Finishing businesses in accordance with the hold separate order, which cannot be quantified. The operating earnings of the Liquid Finishing businesses exceed $100 million (unaudited) since the date of acquisition, and no additional financial resources were required to be funded by the Company.
L. Acquisitions
On April 2, 2012, the Company completed the purchase of the finishing businesses of Illinois Tool Works Inc. The acquisition includes powder and liquid finishing equipment operations, technologies and brands. In Powder Finishing, Graco acquired the Gema® businesses. Gema is a global leader in powder coating technology, a market in which Graco had no previous product offerings, with global manufacturing and distribution capabilities. Results of the Powder Finishing businesses have been included in the Industrial segment since the date of acquisition. In Liquid Finishing, Graco acquired the Binks® spray finishing equipment businesses, DeVilbiss® spray guns and accessories businesses, Ransburg® electrostatic equipment and accessories businesses, and BGK curing technology businesses.
Sales of the ITW Finishing Group were $375 million in 2011, of which Powder Finishing contributed approximately one-third and Liquid Finishing contributed approximately two-thirds. Acquisition and divestiture-related expenses are included in general and administrative expense in the Company’s consolidated statements of earnings, and totaled $2 million in 2013, $16 million in 2012 and $8 million in 2011.
In December 2011, the FTC filed a formal complaint to challenge the proposed acquisition on the grounds that the addition of the Liquid Finishing businesses to Graco would be anti-competitive, a position which Graco denied. In March 2012, the FTC issued an order that allowed the acquisition to proceed to closing on April 2, 2012, subject to certain conditions, while it evaluated a settlement proposal from Graco. Pursuant to the order, the Liquid Finishing businesses were to be held separate from the rest of Graco’s businesses until the FTC determined which portions of the Liquid Finishing businesses Graco must divest.
52
Table of Contents
In May 2012, the FTC issued a proposed decision and order which requires Graco to sell the Liquid Finishing business assets, including business activities related to the development, manufacture, and sale of products under the Binks, DeVilbiss, Ransburg and BGK brand names, no later than 180 days from the date the order becomes final. The FTC has not yet issued its final decision and order.
The Company has retained the services of an investment bank to help it market the Liquid Finishing businesses and identify potential buyers. While it seeks a buyer, Graco must continue to hold the Liquid Finishing business assets separate from its other businesses and maintain them as viable and competitive. In accordance with the hold separate order, the Liquid Finishing business is managed independently by experienced Liquid Finishing business managers, under the supervision of a trustee appointed by the FTC, who reports directly to the FTC.
The hold separate order requires the Company to provide sufficient resources to maintain the viability, competitiveness and marketability of the Liquid Finishing businesses, including general funds, capital, working capital and reimbursement of losses. To the extent that the Liquid Finishing businesses generate funds in excess of financial resources needed, the Company has access to such funds consistent with practices in place prior to the acquisition.
Under terms of the hold separate order, the Company does not have a controlling interest in the Liquid Finishing businesses, nor is it able to exert significant influence over the Liquid Finishing businesses. Consequently, the Company’s investment in the shares of the Liquid Finishing businesses, totaling $422 million, has been reflected as a cost-method investment on the Consolidated Balance Sheet as of December 27, 2013, and its results of operations have not been consolidated with those of the Company.
As a cost-method investment, income is recognized based on dividends received from current earnings of Liquid Finishing. Dividends of $28 million received in 2013 and $12 million received in 2012 are included in other expense (income) on the Consolidated Statements of Earnings. Once the FTC issues its final decision and order, and the Company completes the sale of its investment, there will be no further dividends from Liquid Finishing.
The Company evaluates its cost-method investment for other-than-temporary impairment at each reporting period. As of December 27, 2013, the Company evaluated its investment in Liquid Finishing and determined that there is no impairment.
Sales and operating earnings of the Liquid Finishing businesses for the years 2013 and 2012 were as follows (unaudited, in thousands):
| 2013 | 2012 | |||||||||
|
Net Sales |
$ | 278,543 | $ | 269,099 | ||||||
|
Operating Earnings |
61,174 | 52,256 | ||||||||
53
Table of Contents
The Company transferred cash purchase consideration of $660 million to the seller on April 2, 2012. In July 2012, the Company transferred additional cash purchase consideration of $8 million, representing the difference between cash balances acquired and the amount estimated at the time of closing. In 2013, the seller reimbursed Graco approximately $5 million for payments of pre-acquisition tax liabilities paid by Liquid Finishing businesses after the acquisition date. This reimbursement was recorded as a reduction of the cost-method investment.
Purchase consideration was allocated to assets acquired and liabilities assumed based on estimated fair values as follows (in thousands):
|
Cash and cash equivalents |
$ | 6,007 | ||||
|
Accounts receivable |
17,835 | |||||
|
Inventories |
21,733 | |||||
|
Other current assets |
2,534 | |||||
|
Property, plant and equipment |
18,359 | |||||
|
Other non-current assets |
50 | |||||
|
Identifiable intangible assets |
150,500 | |||||
|
Goodwill |
86,056 | |||||
|
|
|
|||||
|
Total assets acquired |
303,074 | |||||
|
Current liabilities assumed |
(27,434) | |||||
|
Non-current liabilities assumed |
(7,984) | |||||
|
Deferred income taxes |
(26,105) | |||||
|
|
|
|||||
|
Net assets acquired, Powder Finishing |
241,551 | |||||
|
Investment in businesses held separate |
426,813 | |||||
|
|
|
|||||
|
Total purchase consideration |
$ | 668,364 | ||||
|
|
|
|||||
Identifiable intangible assets and estimated useful life are as follows (dollars in thousands):
|
Estimated
Life (years) |
||||||||
|
Customer relationships |
$ | 103,500 | 14 | |||||
|
Developed technology |
9,600 | 11 | ||||||
|
Trade names |
37,400 | Indefinite | ||||||
|
|
|
|||||||
|
Total identifiable intangible assets |
$ | 150,500 | ||||||
|
|
|
|||||||
The Company adjusted the preliminary purchase price allocation in the fourth quarter of 2012 to recognize deferred tax liability on certain identifiable intangible assets, which resulted in an $8 million increase in goodwill. Substantially none of the goodwill acquired in 2012 is deductible for tax purposes. The Company completed other business acquisitions in 2013, 2012 and 2011 that were not material to the consolidated financial statements.
Subsequent to the end of fiscal year 2013, the Company completed the acquisition of a manufacturer of fluid management solutions for environmental monitoring and remediation, markets where Graco had little or no previous exposure. This business acquisition will not be material to the consolidated financial statements.
The following unaudited pro forma information reflects the combined results of Graco and Powder Finishing operations as if the acquisition had occurred at the beginning of 2011 (unaudited, in thousands, except per share amounts):
| 2012 | 2011 | |||||||||
|
Net Sales |
$ | 1,042,701 | $ | 1,020,823 | ||||||
|
Operating Earnings |
249,789 | 236,284 | ||||||||
|
Net Earnings |
153,008 | 147,290 | ||||||||
|
Basic earnings per share |
2.53 | 2.44 | ||||||||
|
Diluted earnings per share |
2.48 | 2.40 | ||||||||
54
Table of Contents
Additional depreciation and amortization of $2 million and $8 million are reflected in the 2012 and 2011 pro forma results, respectively, as if the acquisition of Powder Finishing had occurred at the beginning of 2011. Non-recurring acquisition expenses of $16 million were eliminated from the 2012 pro forma results, and $8 million were eliminated from the 2011 pro forma results. Purchase accounting effects of $7 million related to inventory were removed from 2012 and reflected in 2011. For pro forma purposes, dividend income from Liquid Finishing of $12 million was eliminated from other income in 2012.
M. Quarterly Financial Information (unaudited)
|
First
Quarter |
Second
Quarter |
Third
Quarter |
Fourth
Quarter |
|||||||||||||
|
2013 |
||||||||||||||||
|
Net Sales |
$ | 269,046 | $ | 286,020 | $ | 277,035 | $ | 271,923 | ||||||||
|
Gross Profit |
150,644 | 158,739 | 150,873 | 147,199 | ||||||||||||
|
Net Earnings |
52,130 | 57,843 | 56,101 | 44,748 | ||||||||||||
|
Basic Net Earnings per Common Share |
$ | 0.86 | $ | 0.94 | $ | 0.91 | $ | 0.73 | ||||||||
|
Diluted Net Earnings per Common Share |
0.84 | 0.92 | 0.89 | 0.71 | ||||||||||||
|
Cash Dividends Declared per Common Share |
0.25 | 0.25 | 0.25 | 0.28 | ||||||||||||
|
2012 |
||||||||||||||||
|
Net Sales |
$ | 234,122 | $ | 268,184 | $ | 256,472 | $ | 253,678 | ||||||||
|
Gross Profit |
132,179 | 139,530 | 139,933 | 138,888 | ||||||||||||
|
Net Earnings |
35,381 | 34,352 | 37,131 | 42,262 | ||||||||||||
|
Basic Net Earnings per Common Share |
$ | 0.59 | $ | 0.57 | $ | 0.61 | $ | 0.70 | ||||||||
|
Diluted Net Earnings per Common Share |
0.58 | 0.56 | 0.60 | 0.68 | ||||||||||||
|
Cash Dividends Declared per Common Share |
0.23 | 0.23 | 0.23 | 0.25 | ||||||||||||
55
Table of Contents
None.
Evaluation of Disclosure Controls and Procedures
As of the end of the fiscal year covered by this report, the Company carried out an evaluation of the effectiveness of the design and operation of its disclosure controls and procedures. This evaluation was done under the supervision and with the participation of the Company’s President and Chief Executive Officer, the Chief Financial Officer, the Vice President, Corporate Controller and Information Systems, and the Vice President, General Counsel and Secretary. Based upon that evaluation, they concluded that the Company’s disclosure controls and procedures are effective.
Management’s Annual Report on Internal Control Over Financial Reporting
The information under the heading “Management’s Report on Internal Control Over Financial Reporting” in Part II, Item 8, of this 2013 Annual Report on Form 10-K is incorporated herein by reference.
Reports of Independent Registered Public Accounting Firm
The information under the heading “Reports of Independent Registered Public Accounting Firm: Internal Control Over Financial Reporting” in Part II, Item 8, of this 2013 Annual Report on Form 10-K is incorporated herein by reference.
Changes in Internal Control Over Financial Reporting
During the fourth quarter, there was no change in the Company’s internal control over financial reporting that has materially affected or is reasonably likely to materially affect the Company’s internal control over financial reporting.
On February 14, 2014, upon recommendation of the Governance Committee, the Board of Directors of our Company approved an amendment and restatement of our Company’s Restated Bylaws to reflect amendments to the Minnesota Business Corporation Act and modernize the Restated Bylaws.
The amendments include the following, among others: (i) providing the flexibility, but not the requirement, for our Company to hold “virtual” or “hybrid-virtual” shareholder meetings; (ii) requiring a shareholder who seeks to bring business before an annual shareholder meeting to disclose additional information regarding the proponent’s and any beneficial holder’s economic interests in our Company; (iii) clarifying that the role of Chairman of the Board is not itself an officer position; (iv) granting the Chief Executive Officer the power to appoint and remove certain corporate officers, other than the Chief Financial Officer and other executive officers; (v) clarifying certain procedural matters related to adjournment of shareholder meetings and setting of record dates for shareholder meetings; and (vi) clarifying that various notices and consents may be given by electronic communication.
The Restated Bylaws, as amended, are filed as Exhibit 3.2 hereto and incorporated herein by reference.
56
Table of Contents
The information under the heading “Executive Officers of Our Company” in Part I of this 2013 Annual Report on Form 10-K and the information under the heading “Board of Directors” in our Company’s Proxy Statement for its 2014 Annual Meeting of Shareholders to be held on April 25, 2014 (the “Proxy Statement”), is incorporated herein by reference.
Audit Committee Members and Audit Committee Financial Expert
The information under the heading “Committees of the Board of Directors” in our Company’s Proxy Statement is incorporated herein by reference.
Corporate Governance Guidelines, Committee Charters and Code of Ethics
Our Company has adopted Corporate Governance Guidelines and Charters for each of the Audit, Governance, and Management Organization and Compensation Committees of the Board of Directors. We have also issued a Code of Ethics and Business Conduct (“Code of Ethics”) that applies to our principal executive officer, principal financial officer, principal accounting officer, all officers, directors, and employees of Graco Inc. and all of its subsidiaries, representative offices and branches worldwide. The Corporate Governance Guidelines, Committee Charters, and Code of Ethics, with any amendments or waivers thereto, may be accessed free of charge by visiting the Graco website at www.graco.com.
Our Company intends to post on the Graco website any amendment to, or waiver from, a provision of the Code of Ethics that applies to our principal executive officer, principal financial officer, principal accounting officer, controller and other persons performing similar functions within four business days following the date of such amendment or waiver.
Section 16(a) Reporting Compliance
The information under the heading “Section 16(a) Beneficial Ownership Reporting Compliance” in the Company’s Proxy Statement is incorporated herein by reference.
The information contained under the headings “Director Compensation,” “Executive Compensation,” “Compensation Committee Interlocks and Insider Participation” and “Report of the Management Organization and Compensation Committee” in the Proxy Statement is incorporated herein by reference.
The information contained under the headings “Equity Compensation Plan Information” and “Beneficial Ownership of Shares” in the Proxy Statement is incorporated herein by reference.
The information under the headings “Related Person Transaction Approval Policy” and “Director Independence” in the Proxy Statement is incorporated herein by reference.
The information under the headings “Independent Registered Public Accounting Firm Fees and Services” and “Pre-Approval Policies” in the Proxy Statement is incorporated herein by reference.
57
Table of Contents
| (a) | The following documents are filed as part of this report: |
| (1) | Financial Statements | |||||
| See Part II | ||||||
| (2) | Financial Statement Schedule | |||||
| Schedule II – Valuation and Qualifying Accounts | 59 | |||||
| All other schedules are omitted because they are not applicable, or are not required, or because the required information is included in the Consolidated Financial Statements or Notes thereto. | ||||||
| (3) |
Management Contract, Compensatory Plan or Arrangement. (See Exhibit Index) Those entries marked by an asterisk are Management Contracts, Compensatory Plans or Arrangements. |
61 | ||||
58
Table of Contents
Schedule II - Valuation and Qualifying Accounts
Graco Inc. and Subsidiaries
(in thousands)
|
Balance at
beginning of year |
Additions
charged to costs and expenses |
Deductions
from reserves 1 |
Other
add (deduct) 2 |
Balance at
end of year |
||||||||||||||||
|
Year ended |
||||||||||||||||||||
|
December 27, 2013 |
||||||||||||||||||||
|
Allowance for doubtful accounts |
$ | 2,100 | $ | 600 | $ | 1,400 | $ | - | $ | 1,300 | ||||||||||
|
Allowance for returns and credits |
4,500 | 17,300 | 16,800 | - | 5,000 | |||||||||||||||
|
|
|
|
|
|
|
|
|
|
|
|||||||||||
| $ | 6,600 | $ | 17,900 | $ | 18,200 | $ | - | $ | 6,300 | |||||||||||
|
|
|
|
|
|
|
|
|
|
|
|||||||||||
|
December 28, 2012 |
||||||||||||||||||||
|
Allowance for doubtful accounts |
$ | 1,400 | $ | 500 | $ | 100 | $ | 300 | $ | 2,100 | ||||||||||
|
Allowance for returns and credits |
4,100 | 13,700 | 13,300 | - | 4,500 | |||||||||||||||
|
|
|
|
|
|
|
|
|
|
|
|||||||||||
| $ | 5,500 | $ | 14,200 | $ | 13,400 | $ | 300 | $ | 6,600 | |||||||||||
|
|
|
|
|
|
|
|
|
|
|
|||||||||||
|
December 30, 2011 |
||||||||||||||||||||
|
Allowance for doubtful accounts |
$ | 1,300 | $ | 500 | $ | 400 | $ | - | $ | 1,400 | ||||||||||
|
Allowance for returns and credits |
4,300 | 12,500 | 12,700 | - | 4,100 | |||||||||||||||
|
|
|
|
|
|
|
|
|
|
|
|||||||||||
| $ | 5,600 | $ | 13,000 | $ | 13,100 | $ | - | $ | 5,500 | |||||||||||
|
|
|
|
|
|
|
|
|
|
|
|||||||||||
| 1 | For doubtful accounts, represents amounts determined to be uncollectible and charged against reserve, net of collections on accounts previously charged against reserves. For returns and credits, represents amounts of credits issued and returns processed. |
| 2 | Includes amounts assumed or established in connection with acquisitions and effects of foreign currency translation. |
59
Table of Contents
Signatures
Pursuant to the requirements of Section 13 or 15(d) of the Securities Exchange Act of 1934, the Registrant has duly caused this report to be signed on its behalf by the undersigned, thereunto duly authorized.
| Graco Inc. | ||||
|
/s/ P ATRICK J. M C H ALE |
February 18, 2014 | |||
| Patrick J. McHale | ||||
| President and Chief Executive Officer | ||||
Pursuant to the requirements of the Securities Exchange Act of 1934, this report has been signed by the following persons on behalf of the Registrant and in the capacities and on the dates indicated.
|
/s/ P ATRICK J. M C H ALE |
February 18, 2014 | |||
| Patrick J. McHale | ||||
| President and Chief Executive Officer | ||||
| (Principal Executive Officer) | ||||
|
/s/ J AMES A. G RANER |
February 18, 2014 | |||
| James A. Graner | ||||
| Chief Financial Officer | ||||
| (Principal Financial Officer) | ||||
|
/s/ C AROLINE M. C HAMBERS |
February 18, 2014 | |||
| Caroline M. Chambers | ||||
| Vice President, Corporate Controller and Information Systems | ||||
| (Principal Accounting Officer) | ||||
| Lee R. Mitau | Director, Chairman of the Board | |
| William J. Carroll | Director | |
| Jack W. Eugster | Director | |
| Eric P. Etchart | Director | |
| J. Kevin Gilligan | Director | |
| Patrick J. McHale | Director | |
| Martha A. Morfitt | Director | |
| William G. Van Dyke | Director | |
| R. William Van Sant | Director |
Patrick J. McHale, by signing his name hereto, does hereby sign this document on behalf of himself and each of the above named directors of the Registrant pursuant to powers of attorney duly executed by such persons.
|
/s/ P ATRICK J. M C H ALE |
February 18, 2014 | |||
| Patrick J. McHale | ||||
| (For himself and as attorney-in-fact) |
60
Table of Contents
|
Exhibit
|
Description |
|
|
2.1 |
Asset Purchase Agreement, dated April 14, 2011, by and among Graco Inc., Graco Holdings Inc., Graco Minnesota Inc., Illinois Tool Works Inc. and ITW Finishing LLC (excluding schedules and exhibits, which the Registrant agrees to furnish supplementally to the Securities and Exchange Commission upon request). (Incorporated by reference to Exhibit 2.1 to the Company’s Report on Form 8-K filed April 15, 2011.) First Amendment dated April 2, 2012. (Incorporated by reference to Exhibit 2.1 to the Company’s Report on Form 8-K filed April 2, 2012.) | |
|
3.1 |
Restated Articles of Incorporation as amended April 26, 2013. (Incorporated by reference to Exhibit 3.1 to the Company’s Report on Form 8-K filed April 30, 2013.) | |
|
3.2 |
Restated Bylaws as amended February 14, 2014. | |
|
*10.1 |
Graco Inc. Incentive Bonus Plan. (Incorporated by reference to Appendix A to the Company’s Definitive Proxy Statement on Schedule 14A filed March 7, 2012.) | |
|
*10.2 |
Employee Stock Incentive Plan, as adopted by the Board of Directors on February 19, 1999. (Incorporated by reference to Exhibit 10.23 to the Company’s 2002 Annual Report on Form 10-K.) Amended and restated June 18, 2004. (Incorporated by reference to Exhibit 10.3 to the Company’s Report on Form 10-Q for the thirteen weeks ended April 1, 2005.) | |
|
*10.3 |
Graco Inc. Stock Incentive Plan. (Incorporated by reference to Exhibit 10.1 to the Company’s Report on Form 10-Q for the thirteen weeks ended June 29, 2001.) Amended and restated June 18, 2004. (Incorporated by reference to Exhibit 10.2 to the Company’s Report on Form 10-Q for the thirteen weeks ended April 1, 2005.) | |
|
*10.4 |
Graco Inc. Amended and Restated Stock Incentive Plan (2006). (Incorporated by reference to Appendix A to the Company’s Definitive Proxy Statement on Schedule 14A filed March 14, 2006.) | |
|
*10.5 |
Graco Inc. 2010 Stock Incentive Plan. (Incorporated by reference to Appendix A to the Company’s Definitive Proxy Statement on Schedule 14A filed March 11, 2010.) | |
|
*10.6 |
Deferred Compensation Plan Restated, effective December 1, 1992. (Incorporated by reference to Exhibit 2 to the Company’s Report on Form 8-K dated March 11, 1993.) First Amendment dated September 1, 1996. (Incorporated by reference to Exhibit 10.2 to the Company’s Report on Form 10-Q for the thirteen weeks ended June 27, 1997.) Second Amendment dated May 27, 2000. (Incorporated by reference to Exhibit 10.7 to the Company’s 2005 Annual Report on Form 10-K.) Third Amendment adopted on December 19, 2002. (Incorporated by reference to Exhibit 10.7 to the Company’s 2005 Annual Report on Form 10-K.) Fourth Amendment adopted June 14, 2007. (Incorporated by reference to Exhibit 10.2 to the Company’s Report on Form 10-Q for the thirteen weeks ended June 29, 2007.) | |
|
*10.7 |
Deferred Compensation Plan (2005 Statement) as amended and restated on April 4, 2005. (Incorporated by reference to Exhibit 10.1 of the Company’s Report on Form 10-Q for the thirteen weeks ended July 1, 2005.) Second Amendment dated November 1, 2005. (Incorporated by reference to Exhibit 10.8 to the Company’s 2005 Annual Report on Form 10-K.) Third Amendment adopted on December 29, 2008. (Incorporated by reference to Exhibit 10.8 to the Company’s 2008 Annual Report on Form 10-K.) Second Amendment dated October 25, 2012. (Incorporated by reference to Exhibit 10.9 to the Company’s 2012 Annual Report on Form 10-K.) | |
|
*10.8 |
Graco Restoration Plan (2005 Statement). (Incorporated by reference to Exhibit 10.1 to the Company’s Report on Form 10-Q for the thirteen weeks ended September 29, 2006.) First Amendment adopted December 8, 2006. (Incorporated by reference to Exhibit 10.12 to the Company’s 2006 Annual Report on Form 10-K.) Second Amendment adopted August 15, 2007. (Incorporated by reference to Exhibit 10.1 to the Company’s Report on Form 10-Q for the thirteen weeks ended September 28, 2007.) Third Amendment adopted March 27, 2008. (Incorporated by reference to Exhibit 10.1 to the Company’s Report on Form 10-Q for the thirteen weeks ended March 28, 2008.) Fourth Amendment adopted December 29, 2008. (Incorporated by reference to Exhibit 10.11 to the Company’s 2008 Annual Report on Form 10-K.) Fifth Amendment adopted September 16, 2010. (Incorporated by reference to Exhibit 10.1 to the Company’s Report on Form 10-Q for the thirteen weeks ended September 24, 2010.) | |
|
*10.9 |
Graco Inc. Retirement Plan for Nonemployee Directors. (Incorporated by reference to Attachment C to Item 5 to the Company’s Report on Form 10-Q for the thirteen weeks ended March 29, 1991.) First Amendment adopted on December 29, 2008. (Incorporated by reference to Exhibit 10.10 to the Company’s 2008 Annual Report on Form 10-K.) | |
61
Table of Contents
|
*10.10 |
Form of Amendment to Executive Officer and Non-Employee Director Stock Options to Permit Net Exercises, as adopted by the Board of Directors February 17, 2012. (Incorporated by reference to Exhibit 10.1 of the Company’s Report on Form 10-Q for the thirteen weeks ended March 30, 2012.) | |
|
*10.11 |
Stock Option Agreement. Form of agreement for award of nonstatutory stock options to nonemployee directors under the Graco Inc. Stock Incentive Plan. (Incorporated by reference to Exhibit 10.3 to the Company’s Report on Form 10-Q for the thirteen weeks ended March 26, 2004.) | |
|
*10.12 |
Stock Option Agreement. Form of agreement used for award of nonstatutory stock options to nonemployee directors under the Graco Inc. Amended and Restated Stock Incentive Plan (2006). (Incorporated by reference to Exhibit 10.3 to the Company’s Report on Form 10-Q for the thirteen weeks ended June 29, 2007.) Amended form of agreement for awards made to nonemployee directors in 2008. (Incorporated by reference to Exhibit 10.2 to the Company’s Report on Form 10-Q for the thirteen weeks ended June 27, 2008.) Amended and restated form of agreement for awards made to nonemployee directors in 2009. (Incorporated by reference to Exhibit 10.14 to the Company’s 2009 Annual Report on Form 10-K/A.) | |
|
*10.13 |
Stock Option Agreement. Form of agreement used for award of nonstatutory stock options to nonemployee directors under the Graco Inc. 2010 Stock Incentive Plan in 2011. (Incorporated by reference to Exhibit 10.16 to the Company’s 2010 Annual Report on Form 10-K.) Amended form of agreement for awards made to nonemployee directors commencing in 2012. (Incorporated by reference to Exhibit 10.4 of the Company’s Report on Form 10-Q for the thirteen weeks ended March 30, 2012.) | |
|
*10.14 |
Stock Option Agreement. Form of agreement for award of non-incentive stock options to executive officers under the Graco Inc. Stock Incentive Plan in 2005 and 2006. (Incorporated by reference to Exhibit 10.2 to the Company’s Report on Form 10-Q for the thirteen weeks ended March 26, 2004.) | |
|
*10.15 |
Stock Option Agreement. Form of agreement used for award of non-incentive stock options to executive officers under the Graco Inc. Amended and Restated Stock Incentive Plan (2006) in 2007. (Incorporated by reference to Exhibit 10.1 to the Company’s Report on Form 10-Q for the thirteen weeks ended March 30, 2007.) Amended form of agreement for awards made to executive officers in 2008, 2009 and 2010. (Incorporated by reference to Exhibit 10.2 to the Company’s Report on Form 10-Q for the thirteen weeks ended March 28, 2008.) | |
|
*10.16 |
Stock Option Agreement. Form of agreement used for award of non-incentive stock options to executive officers under the Graco Inc. 2010 Stock Incentive Plan in 2011. (Incorporated by reference to Exhibit 10.4 to the Company’s Report on Form 10-Q for the thirteen weeks ended April 1, 2011.) Amended form of agreement for awards made to executive officers commencing in 2012. (Incorporated by reference to Exhibit 10.3 of the Company’s Report on Form 10-Q for the thirteen weeks ended March 30, 2012.) | |
|
*10.17 |
Stock Option Agreement. Form of agreement used for award of non-incentive stock options to Chief Executive Officer under the Graco Inc. Amended and Restated Stock Incentive Plan (2006) in 2007. (Incorporated by reference to Exhibit 10.1 to the Company’s Report on Form 10-Q for the thirteen weeks ended March 30, 2007.) Amended form of agreement for awards made to Chief Executive Officer in 2008, 2009 and 2010. (Incorporated by reference to Exhibit 10.2 to the Company’s Report on Form 10-Q for the thirteen weeks ended March 28, 2008.) | |
|
*10.18 |
Stock Option Agreement. Form of agreement used for award of non-incentive stock options to Chief Executive Officer under the Graco Inc. 2010 Stock Incentive Plan in 2011. (Incorporated by reference to Exhibit 10.3 to the Company’s Report on Form 10-Q for the thirteen weeks ended April 1, 2011.) Amended form of agreement for awards made to Chief Executive Officer commencing in 2012. (Incorporated by reference to Exhibit 10.2 of the Company’s Report on Form 10-Q for the thirteen weeks ended March 30, 2012.) | |
|
*10.19 |
Executive Officer Restricted Stock Agreement. Form of agreement used to award restricted stock to selected executive officers. (Incorporated by reference to Exhibit 10.20 to the Company’s 2007 Annual Report on Form 10-K.) | |
|
*10.20 |
Chief Executive Officer Restricted Stock Agreement. Form of agreement used to award performance-based restricted stock to the Chief Executive Officer. (Incorporated by reference to Exhibit 10.1 to the Company’s Report on Form 8-K filed March 2, 2011.) | |
|
*10.21 |
Nonemployee Director Stock and Deferred Stock Program. (Incorporated by reference to Exhibit 10.22 to the Company’s 2009 Annual Report on Form 10-K/A.) | |
62
Table of Contents
|
*10.22 |
Key Employee Agreement. Form of agreement used with Chief Executive Officer. (Incorporated by reference to Exhibit 10.24 to the Company’s 2007 Annual Report on Form 10-K.) | |
|
*10.23 |
Key Employee Agreement. Form of agreement used with executive officers other than the Chief Executive Officer. (Incorporated by reference to Exhibit 10.25 to the Company’s 2007 Annual Report on Form 10-K.) | |
|
*10.24 |
Executive Group Long-Term Disability Policy as revised in 1995. (Incorporated by reference to Exhibit 10.23 to the Company’s 2004 Annual Report on Form 10-K.) Enhanced by Supplemental Income Protection Plan in 2004. (Incorporated by reference to Exhibit 10.28 to the Company’s 2007 Annual Report on Form 10-K.) | |
|
*10.25 |
Amendment to the 2003 through 2006 Nonstatutory Stock Option Agreements of one nonemployee director. (Incorporated by reference to Exhibit 10.27 to the Company’s 2009 Annual Report on Form 10-K/A.) | |
|
10.26 |
Credit Agreement, dated May 23, 2011, among Graco Inc., the borrowing subsidiaries from time to time party thereto, the banks from time to time party thereto and U.S. Bank National Association, as administrative agent. (Incorporated by reference to Exhibit 10.1 to the Company’s Report on Form 8-K filed May 26, 2011.) Amendment No. 1 dated as of August 15, 2011 to Pledge Agreement. (Incorporated by reference to Exhibit 10.2 to the Company’s Report on Form 10-Q for the thirteen weeks ended September 30, 2011.) First Amendment to Credit Agreement dated March 27, 2012. (Incorporated by reference to Exhibit 10.1 to the Company’s Report on Form 8-K filed April 2, 2012.) Amendment No. 2 to Pledge Agreement dated as of April 2, 2012. (Incorporated by reference to Exhibit 10.1 to the Company’s Report on Form 10-Q for the thirteen weeks ended June 29, 2012.) Amendment No. 3 to Pledge Agreement dated as of April 13, 2012. (Incorporated by reference to Exhibit 10.2 to the Company’s Report on Form 10-Q for the thirteen weeks ended June 29, 2012.) | |
|
10.27 |
Note Agreement, dated March 11, 2011, between Graco Inc. and the Purchasers listed on the Purchaser Schedule attached thereto, which includes as exhibits the form of Senior Notes. (Incorporated by reference to Exhibit 10.1 to the Company’s Report on Form 8-K filed March 16, 2011.) Amendment No. 1 dated May 23, 2011. (Incorporated by reference to Exhibit 10.2 to the Company’s Report on Form 10-Q for the thirteen weeks ended July 1, 2011.) Amendment and Restatement No. 1 to Note Agreement dated as of March 27, 2012. (Incorporated by reference to Exhibit 10.2 to the Company’s Report on Form 8-K filed April 2, 2012.) | |
|
10.28 |
Agreement between Graco Inc., Illinois Tool Works Inc., and ITW Finishing LLC, as the Respondents, and Counsel for the Federal Trade Commission. (Incorporated by reference to Exhibit 10.1 to the Company’s Report on Form 8-K filed March 27, 2012.) | |
|
10.29 |
Agreement Containing Consent Orders, by and between Graco Inc., Illinois Tool Works Inc., and ITW Finishing LLC, as the Respondents, and Counsel for the Federal Trade Commission. (Incorporated by reference to Exhibit 10.1 to the Company’s Report on Form 8-K filed June 6, 2012.) | |
|
11 |
Statement of Computation of Earnings per share included in Note I on page 47. | |
|
21 |
Subsidiaries of the Registrant included herein on page 65. | |
|
23 |
Independent Registered Public Accounting Firm’s Consent included herein on page 66. | |
|
24 |
Power of Attorney included herein on page 67. | |
|
31.1 |
Certification of President and Chief Executive Officer pursuant to Rule 13a-14(a) included herein on page 68. | |
|
31.2 |
Certification of Chief Financial Officer pursuant to Rule 13a-14(a) included herein on page 69. | |
|
32 |
Certification of President and Chief Executive Officer and Chief Financial Officer pursuant to Section 1350 of Title 18, U.S.C. included herein on page 70. | |
|
101 |
Interactive Data File. | |
Except as otherwise noted, all documents incorporated by reference above relate to File No. 001-09249.
*Management Contracts, Compensatory Plans or Arrangements.
63
Table of Contents
Pursuant to Item 601(b)(4)(iii) of Regulation S-K, copies of certain instruments defining the rights of holders of certain long-term debt of the Company and its subsidiaries are not filed as exhibits because the amount of debt authorized under any such instrument does not exceed 10 percent of the total assets of the Company and its subsidiaries. The Company agrees to furnish copies thereof to the Securities and Exchange Commission upon request.
64