UNITED STATES
SECURITIES AND EXCHANGE COMMISSION
WASHINGTON, DC 20549
_____________________
FORM 10-K
_____________________
(Mark One)
|
x
|
ANNUAL REPORT PURSUANT TO SECTION 13 OR 15(d) OF THE SECURITIES EXCHANGE ACT OF 1934
|
For the fiscal year ended
December 31, 2018
OR
|
o
|
TRANSITION REPORT PURSUANT TO SECTION 13 OR 15(d) OF THE SECURITIES EXCHANGE ACT OF 1934
|
For the transition period from to
Commission File Number: 001-38683
_____________________
GUARDANT HEALTH, INC.
(Exact Name of Registrant as Specified in its Charter)
_____________________
|
Delaware
|
45-4139254
|
|
|
(State or other jurisdiction of
incorporation or organization)
|
(I.R.S. Employer
Identification No.)
|
|
|
505 Penobscot Dr.
Redwood City, California
|
94063
|
|
|
(Address of principal executive offices)
|
(Zip Code)
|
|
Registrant’s telephone number, including area code: (855) 698-8887
Securities registered pursuant to Section 12(b) of the Act:
|
Title of each class
|
Name of each exchange on which registered
|
|
|
Common Stock, par value $0.00001
|
The Nasdaq Stock Market LLC
|
|
Securities registered pursuant to Section 12(g) of the Act:
None
___________________
Indicate by check mark if the registrant is a well-known seasoned issuer, as defined in Rule 405 of the Securities Act. Yes
o
No
x
Indicate by check mark if the registrant is not required to file reports pursuant to Section 13 or Section 15(d) of the Exchange Act. Yes
o
No
x
Indicate by check mark whether the registrant (1) has filed all reports required to be filed by Section 13 or 15(d) of the Securities Exchange Act of 1934 during the preceding 12 months (or for such shorter period that the registrant was required to file such reports), and (2) has been subject to such filing requirements for the past 90 days. Yes
x
No
o
Indicate by check mark whether the registrant has submitted electronically every Interactive Data File required to be submitted pursuant to Rule 405 of Regulation S-T (§232.405 of this chapter) during the preceding 12 months (or for such shorter period that the registrant was required to submit such files). Yes
x
No
o
Indicate by check mark if disclosure of delinquent filers pursuant to Item 405 of Regulation S-K (§229.405 of this chapter) is not contained herein, and will not be contained, to the best of registrant’s knowledge, in definitive proxy or information statements incorporated by reference in Part III of this Form 10-K or any amendment to this Form 10-K.
o
Indicate by check mark whether the registrant is a large accelerated filer, an accelerated filer, a non-accelerated filer, a smaller reporting company, or an emerging growth company. See the definitions of “large accelerated filer,” “accelerated filer,” “smaller reporting company,” and “emerging growth company” in Rule 12b-2 of the Exchange Act.
|
Large accelerated filer
|
o
|
Accelerated filer
|
o
|
|
Non-accelerated filer
|
x
|
Smaller reporting company
|
o
|
|
Emerging growth company
|
x
|
||
If an emerging growth company, indicate by check mark if the registrant has elected not to use the extended transition period for complying with any new or revised financial accounting standards provided pursuant to Section 13(a) of the Exchange Act.
o
Indicate by check mark whether the registrant is a shell company (as defined in Rule 12b-2 of the Exchange Act). Yes
o
No
x
As of June 30, 2018, the last business day of the registrant’s most recently completed second fiscal quarter, the
registrant was not a public company, there was no established public market for the registrant’s common stock.
As of
March 4, 2019
, the registrant had 85,928,193 shares of common stock, $0.00001 par value per share, outstanding.
DOCUMENTS INCORPORATED BY REFERENCE
Portions of the registrant’s definitive proxy statement relating to its annual meeting of stockholders to be held in 2019 (the
“
2019 Annual Meeting
”
), to be filed with the Securities and Exchange Commission (the
“
SEC
”
) within 120 days after the end of the fiscal year to which this Annual Report on Form 10-K relates, are incorporated herein by reference where indicated. Except with respect to information specifically incorporated by reference in this Annual Report on Form 10-K, such proxy statement is not deemed to be filed as part hereof.
GUARDANT HEALTH, INC.
FORM 10-K
For the Fiscal Year Ended December 31, 2018
TABLE OF CONTENTS
|
Page
|
||
|
Business
|
||
|
Risk Factors
|
||
|
Unresolved Staff Comments
|
||
|
Properties
|
||
|
Legal Proceedings
|
||
|
Mine Safety Disclosures
|
||
|
PART
II
|
||
|
Market for Registrant’s Common Equity, Related Stockholder Matters and Issuer Purchases of Equity Securities
|
||
|
Selected Financial Data
|
||
|
Management’s Discussion and Analysis of Financial Condition and Results of Operations
|
||
|
Quantitative and Qualitative Disclosures About Market Risk
|
||
|
Financial Statements and Supplementary Data
|
||
|
Changes in and Disagreements with Accountants on Accounting and Financial Disclosure
|
||
|
Controls and Procedures
|
||
|
Other Information
|
||
|
PART II
I
|
||
|
Directors, Executive Officers and Corporate Governance
|
||
|
Executive Compensation
|
||
|
Security Ownership of Certain Beneficial Owners and Management and Related Stockholder Matters
|
||
|
Certain Relationships and Related Transactions, and Director Independence
|
||
|
Principal Accounting Fees and Services
|
||
|
PART I
V
|
||
|
Exhibits, Financial Statement Schedules
|
||
|
Form 10-K Summary
|
||
|
Signatures
|
||
FORWARD-LOOKING STATEMENTS
This Annual Report on Form 10-K, including the sections titled "Business" and “Management's Discussion and Analysis of Financial Condition and Results of Operations,” contains forward-looking statements regarding future events and our future results that are based on our current expectations, estimates, forecasts and projections about our business, our results of operations, the industry in which we operate and the beliefs and assumptions of our management. Words such as “believe,” “may,” “will,” “estimate,” “continue,” “anticipate,” “would,” “could,” “should,” “intend” and “expect,” variations of these words, and similar expressions are intended to identify forward-looking statements. These forward-looking statements are only predictions and are subject to risks, uncertainties and assumptions that are difficult to predict. Therefore, actual results may differ materially and adversely from those expressed in any forward-looking statements. Factors that might cause or contribute to such differences include, but are not limited to, those discussed in Part I, Item 1A,“Risk Factors,” of this Annual Report on Form 10-K and elsewhere herein, and in other reports we file with the U.S. Securities and Exchange Commission, or the SEC. While forward-looking statements are based on the reasonable expectations of our management at the time that they are made, you should not rely on them. We undertake no obligation to revise or update publicly any forward-looking statements for any reason, whether as a result of new information, future events or otherwise, except as may be required by law.
Each of the terms the “Company,” “we,” “our,” “us” and similar terms used herein refer collectively to Guardant Health, Inc., a Delaware corporation, and its consolidated subsidiaries, unless otherwise stated.
PART I
Item 1. Business
Overview
We are a leading precision oncology company focused on helping conquer cancer globally through use of our proprietary blood-based tests, vast data sets and advanced analytics. We believe that the key to conquering cancer is unprecedented access to its molecular information throughout all stages of the disease, which we intend to enable by a routine blood draw, or liquid biopsy. Our Guardant Health Oncology Platform is designed to leverage our capabilities in technology, clinical development, regulatory and reimbursement to drive commercial adoption, improve patient clinical outcomes and lower healthcare costs. In pursuit of our goal to manage cancer across all stages of the disease, we have launched our Guardant360 and GuardantOMNI tests for advanced stage cancer. These tests fuel our LUNAR programs, which include our recently launched our LUNAR assay for research use only, or RUO, by biopharmaceutical and academic researchers, and the tests we are developing for minimal residual disease and recurrence as well as for early detection and screening. Our Guardant360 test launched in 2014, as a laboratory-developed test, has been used by more than 6,000 oncologists, over 50 biopharmaceutical companies and all 28 National Comprehensive Cancer Network, or NCCN, Centers in the United States, and we believe it is the world’s market leading comprehensive liquid biopsy test based on public disclosure of the number of comprehensive liquid biopsy tests sold in
2018
.
Precision oncology, as it is practiced today, is primarily focused on matching cancer patients to personalized treatments based on the underlying molecular profile of their tumors. T
here is a critical need to expand the scope of precision oncology to enable precise detection, monitoring and selection of the appropriate intervention as early in the disease state as possible. We believe a
major challenge to achieving this is the limited access to cancer’s molecular information. Traditionally, tissue tests that require physical access to tumor tissue through a biopsy or surgery have been used to gain access to this information. A tissue biopsy or surgery procedure, however, is often invasive, time-consuming and costly, which limits the utility of tissue tests. Tissue tests are also not feasible for certain applications such as screening for early detection of cancer.
Our liquid biopsy tests address many of the challenges of tissue biopsies. We believe our tests can expand the scope of precision oncology to earlier stages of the disease, improve patient outcomes and lower healthcare costs. We estimate the market opportunity for our current commercial and pipeline products is over $35 billion in the United States, comprising applications for clinicians and biopharmaceutical customers to address early to late-stage disease, including:
Therapy selection in advanced stage cancer patients
-
We are pioneering the clinical comprehensive liquid biopsy market with our Guardant360 and GuardantOMNI tests. Based on SEER Cancer Registry statistics we estimate the total number of metastatic cancer patients in the United States to be approximately 700,000. Using publicly available pricing for tissue-based therapy selection tests, and assuming patients are tested an average of two times over their course of their disease, we estimate the potential market opportunity for therapy selection among these patients to be approximately $4 billion. Additionally, based on the number of targeted therapy and immuno-oncology therapy programs in the current clinical pipeline, prevalence data, and typical pricing for our tests when used by our biopharmaceutical
1
company customers in connection with their clinical trials, we estimate that the potential market opportunity for our products in use by biopharmaceutical companies is approximately $2 billion. By combining these two, we estimate the aggregate market opportunity for therapy selection in late-stage cancer patients to be approximately $6 billion. Our Guardant360 test is a molecular diagnostic test measuring 73 cancer-related genes and our GuardantOMNI test has a broader 500-gene panel, both of which analyze circulating tumor DNA in blood. Our Guardant360 test has been used over 80,000 times by clinicians to help inform which therapy may be effective for advanced stage cancer patients with solid tumors. It is also used by biopharmaceutical companies for a range of applications, including identifying target patient populations to accelerate translational science research, clinical trial enrollment, and drug development, and post-approval commercialization. Our GuardantOMNI test, launched in 2017 for RUO, is specifically built for our biopharmaceutical customers as a comprehensive genomic profiling tool to help accelerate clinical development programs in both immuno-oncology and targeted therapy.
Recurrence detection in cancer survivors
- We are developing tests from our LUNAR-1 program for minimal residual disease and recurrence detection in cancer survivors. The American Cancer Society estimated that in 2016 there were approximately 15 million solid tumor cancer survivors. We believe that these individuals are candidates for screening tests for minimal residual disease and recurrence of their cancer and that this reflects a potential market opportunity of approximately $15 billion. Our LUNAR-1 program leverages data and learnings from Guardant360 and GuardantOMNI tests and is designed to develop tests that enable clinicians to detect minimal residual disease for adjuvant treatment and detect cancer recurrence at a stage when intervention may have a higher chance of success. We believe minimal residual disease and cancer recurrence detection may help biopharmaceutical companies identify new drug development opportunities in adjuvant and early stage settings. In return, these relationships could help us establish clinical utility for our tests and create new testing opportunities related to emerging therapies. In the last quarter of 2018, we successfully launched our LUNAR assay for RUO by biopharmaceutical customers and academic researchers.
Early detection of cancer in higher risk individuals
-
We are also developing screening tests from our LUNAR-2 program intended for early detection of cancer. We are initially focused on developing tests for asymptomatic individuals at a higher risk of developing cancer due to multiple factors, including moderate to heavy smoking, hereditary risk and pre-existing infections and/or inflammatory conditions. Based on various industry sources, we estimate there are approximately 35 million individuals that satisfy one of three criteria for being susceptible to high risk cancer. These include individuals with moderate to high familial risk of developing cancer, smokers over the age of 50 and individuals with hepatitis C. Given the significantly larger potential patient population, we estimate an average selling price below that of tests for recurrence, and we believe this represents a potential market opportunity of approximately $18 billion. We believe that developing a blood test for early detection of cancer requires a vast amount of molecular and clinical data across all stages of the disease in order to better understand the biology and clinical relevance of tumor-specific biomarkers in blood. We further believe that we can accelerate the collection of this data pool and the development of our LUNAR-2 program for an early detection test in a capital-efficient manner by commercializing Guardant360, GuardantOMNI and LUNAR-1 tests. Specifically, we are using the recently launched LUNAR assay in exploratory studies for our development-stage LUNAR-2 program. While we believe the benefits of early detection on clinical outcomes are widely known, early cancer or precancerous detection may also benefit biopharmaceutical companies by identifying a much larger at-risk population who may benefit from early therapeutic intervention or from preventative medicines.
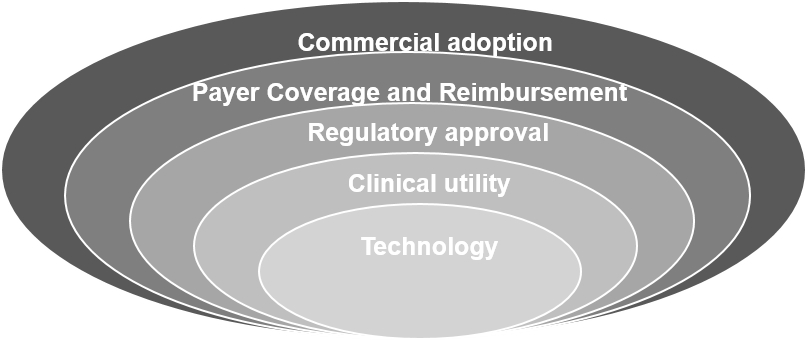
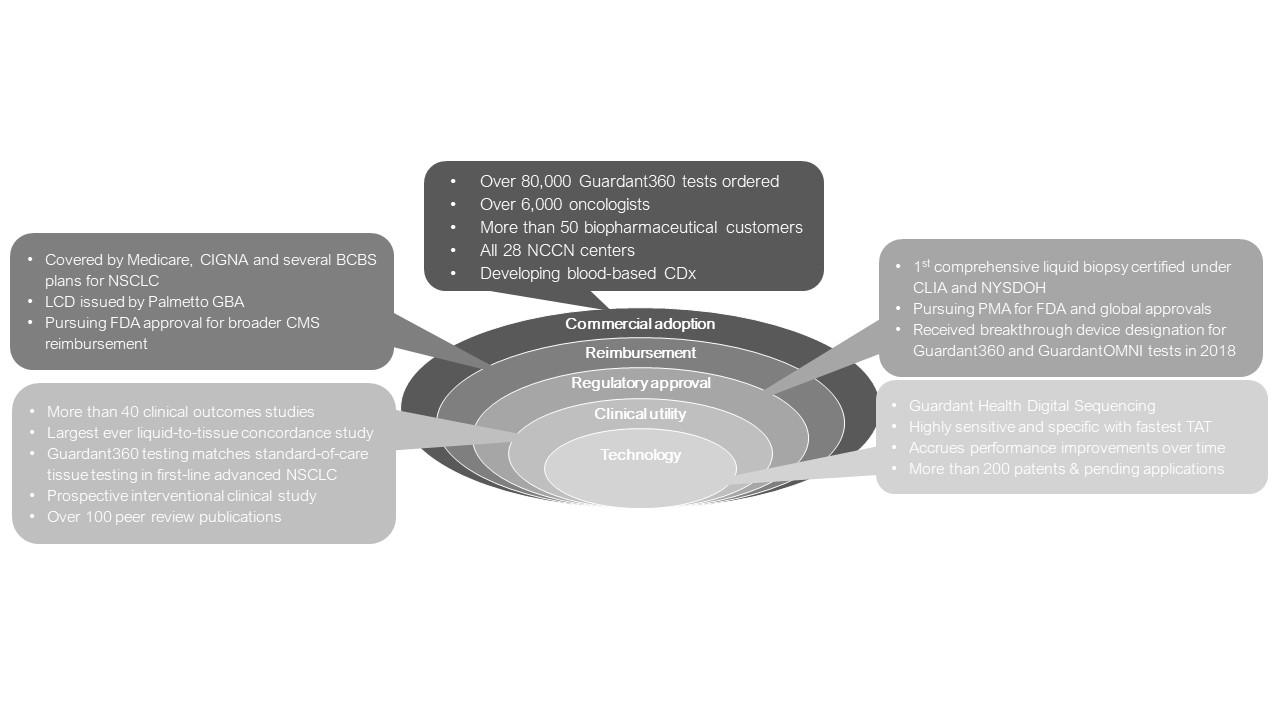
We believe that best-in-class technology is required to address these market opportunities, but is only one of many strengths required to create a market leading liquid biopsy platform. We believe our Guardant Health Oncology Platform has developed strengths across five critical layers, each of which facilitates success in the adjacent layers, and together the five layers form a barrier to entry and provide us a competitive advantage and a platform we can efficiently leverage across multiple products. These five layers include:
Technology
- Our proprietary Guardant Health Digital Sequencing Technology combines cutting edge capabilities from
2
multiple disciplines including biochemistry, next-generation sequencing, signal processing, bioinformatics, machine learning and process engineering to enable what we believe to be the world's market leading comprehensive liquid biopsy test with a typical turnaround time of less than seven days after we receive the sample and enable our high performing liquid biopsy tests intended for different market segments. Furthermore, our machine learning capability enables performance improvement as we incorporate additional data. We currently seek to protect our growing technology with more than 60 issued patents and more than 140 pending patent applications in different jurisdictions.
Clinical utility
- We believe that success in the clinical utility layer requires both independent investments in clinical research and strategic relationships with market-leading biopharmaceutical companies. We have invested heavily in clinical studies, including more than 40 clinical outcomes studies, what we believe to be the largest-ever liquid-to-tissue concordance study and a prospective interventional clinical utility study demonstrating biomarker detection rates in line with standard of care tissue testing. Our clinical research collaborations have resulted in more than 100 peer-reviewed publications. We also have relationships with over 50 biopharmaceutical customers that have provided rigorous clinical validation of our technology and early insights into test opportunities for emerging therapeutics.
Regulatory approval
- We believe Guardant360 test was the first comprehensive liquid biopsy approved by the New York State Department of Health, or NYSDOH. In addition, based on our review of publicly available records, we believe our facility was the first comprehensive liquid biopsy laboratory to be certified pursuant to the Clinical Laboratory Improvement Amendments of 1988, or CLIA, accredited by the College of American Pathologists, or CAP, and NYSDOH-permitted. While approval by the U.S. Food and Drug Administration, or FDA, is currently not required to market our tests in the United States, we intend to submit to the FDA a premarket approval, or PMA, application for each of our Guardant360 and GuardantOMNI tests. The FDA granted our Guardant360 and GuardantOMNI tests breakthrough device designation, in January and December 2018, respectively, which offers potentially faster review for breakthrough medical devices that address unmet medical needs. We believe that FDA approval will become increasingly important for diagnostic tests to gain commercial adoption both in the United States and abroad. We also intend to pursue regulatory approvals in specific markets outside of the United States, including in Japan and China.
Payer coverage and reimbursement
- The analytical and clinical data that we have generated in our efforts to establish clinical utility, combined with the support we have developed with key opinion leaders, or KOLs, in the oncology space have led to positive coverage decisions by a number of commercial payers. Our Guardant360 test is currently covered by Cigna, Priority Health and multiple regional Blue Cross Blue Shield plans, which have adopted reimbursement policies that specifically cover our Guardant360 test for non-small cell lung cancer, or NSCLC, which we believe gives us a competitive advantage with these payers with respect to NSCLC patients. Payment from commercial payers differs depending on whether we have entered into a contract with the payers as a “participating provider.” Payers often reimburse non-participating providers, if at all, at a lower amount than participating providers. When we are not contracted with these payers, they determine the amount they are willing to reimburse us for tests. When we contract with a payer to serve as a participating provider, reimbursements by the payer are generally made pursuant to a negotiated fee schedule and are limited to only covered indications or where prior approval has been obtained. With respect to Medicare, in July 2018, Palmetto GBA, the Medicare Administrative Contractor, or MAC, responsible for administering Medicare’s Molecular Diagnostic Services Program, or MolDx, issued a local coverage determination, or LCD, for our Guardant360 test with respect to NSCLC patients who meet certain clinical criteria. We worked with Palmetto GBA to obtain this positive coverage decision through the submission of a detailed dossier of analytical and clinical data to substantiate that our Guardant360 test meets Medicare’s medical necessity requirements. Noridian Healthcare Solutions, the MAC responsible for adjudicating claims in California, where our laboratory is located, and a participant in the MolDx, recently finalized its LCD for our Guardant360 test. In September 2018, Palmetto GBA notified us that it had set the reimbursement rate for Guardant360 at $3,500 per test and we began to submit claims for reimbursement for Guardant360 clinical testing performed for Medicare beneficiaries covered under the LCDs, and in October 2018, we began to receive payments from Medicare. We anticipate approval by the FDA, if obtained, may support further improvements in coverage and reimbursement for our Guardant360 test.
Commercial adoption
- Success in each of the layers above is important for commercial adoption of our tests by clinicians and biopharmaceutical companies. Additionally, for clinicians, endorsement by KOLs, utilization by academic centers and inclusion in national treatment guidelines are important, especially for adoption in the local community setting where 80% of cancer treatment occurs. Our relationships with key stakeholders across the oncology space, clinical data we believe to support use of Guardant360 test ahead of tissue based testing, as well as the inclusion of liquid biopsy as a potential alternative under certain circumstances to tissue biopsy in NCCN guidelines, have helped facilitate the use of our tests by 6,000 oncologists, who have collectively ordered our Guardant360 test over 80,000 times, and over 50 biopharmaceutical companies. We sold 29,592 tests to clinical customers in the year ended
December 31, 2018
, an increase from 25,626 and 18,663 in the year ended
December 31, 2017
and
2016
, respectively. We sold 10,370 tests to biopharmaceutical customers in the year ended
December 31, 2018
, an increase from 6,286 and 1,830 in the year ended
December 31, 2017
and
2016
, respectively.
3
In the United States, we market our tests to clinical customers through our targeted sales organization, which is engaged in sales efforts and promotional activities primarily to oncologists and cancer centers. Outside the United States, we market our tests to clinical customers through distributors and direct contracts with healthcare institutions. We market our tests to biopharmaceutical customers globally through our business development team, which promotes the broad utility of our tests for drug development and commercialization. Additionally, we have established a joint venture with SoftBank to accelerate commercialization of our products including in Asia, the Middle East and Africa, with our initial focus being on Japan. Our products are currently marketed in approximately 40 countries.
We generated total revenue of
$90.6 million
in the years ended
December 31, 2018
, an increase from
$49.8 million
and
$25.2 million
in the years ended
December 31, 2017
and
2016
, respectively. We also incurred net losses of
$84.3 million
,
$83.2 million
and
$46.1 million
in the years ended
December 31, 2018
,
2017
and
2016
, respectively.
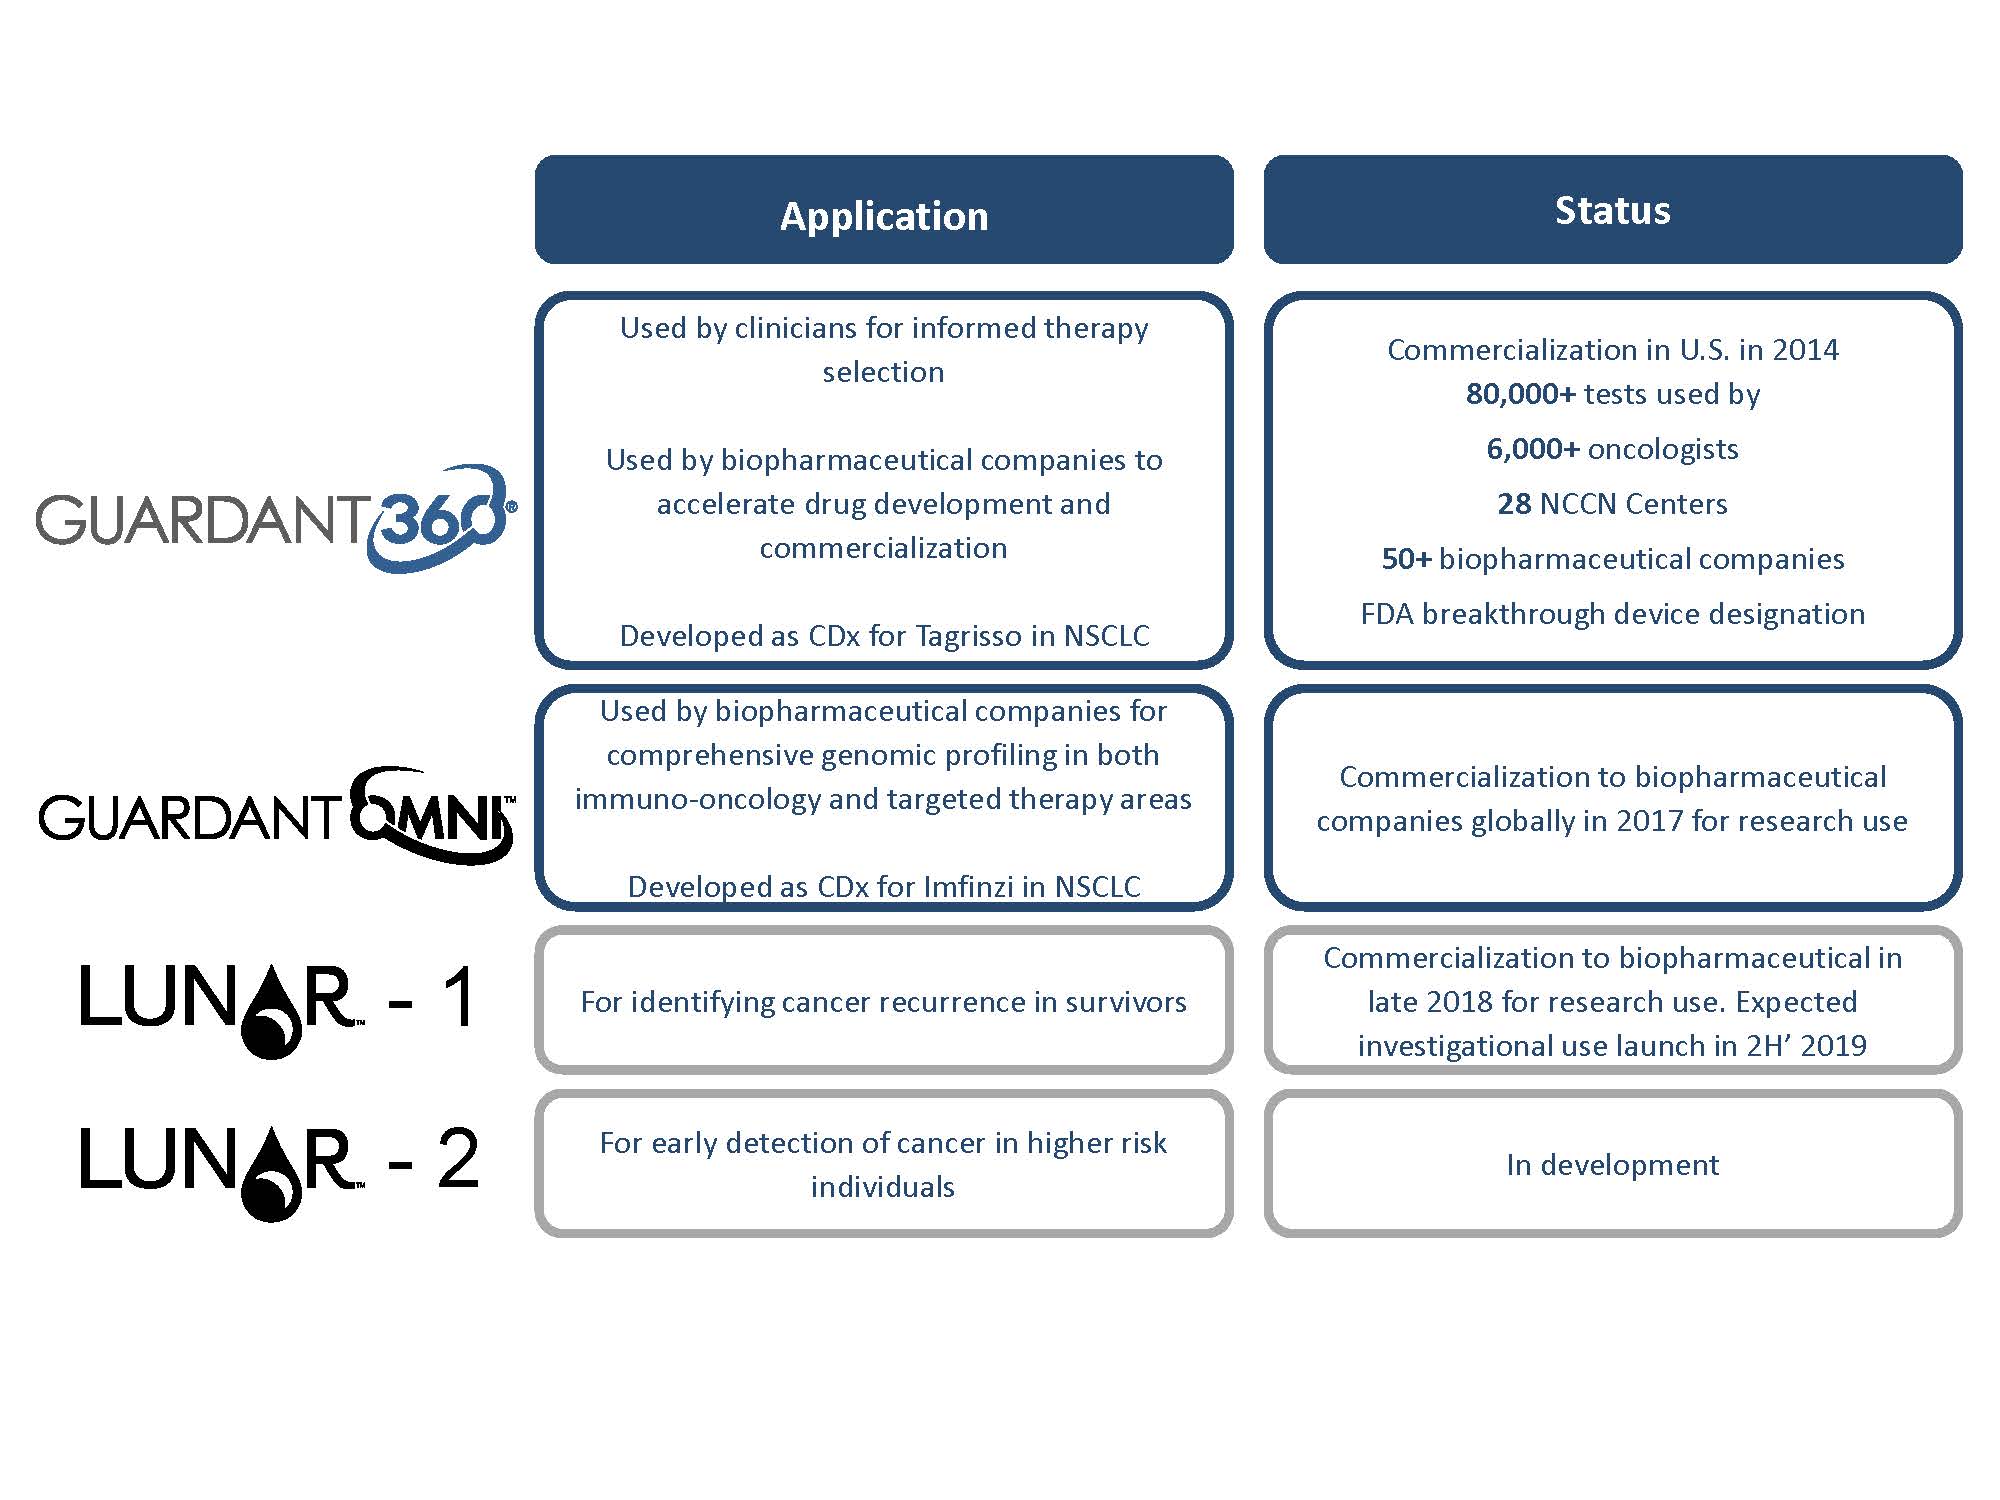
Summary of our product portfolio
Our product portfolio is built upon the same principle as our platform, in that success with each facilitates success for the next. Data and learnings from our Guardant360 test have benefited us in developing our GuardantOMNI test, both of which fuel development of our LUNAR-1 and LUNAR-2 programs.
The table below illustrates our current products and development programs:
Our strategy
Our objective is to be the leading provider of precision oncology products for cancer management across all stages of the disease and drive commercial adoption of our products. To achieve this, we intend to:
|
•
|
Increase awareness of our products by:
|
|
•
|
building awareness of liquid biopsy and pioneering a blood-first paradigm for genotyping cancer patients;
|
|
•
|
educating biopharmaceutical companies, KOLs and advocacy groups;
|
|
•
|
advocating for inclusion of our tests in treatment guidelines; and
|
4
|
•
|
expanding access to our products globally through direct investment and by leveraging our global network of partners.
|
|
•
|
Expand clinical utility and increase reimbursement for our products by:
|
|
•
|
working with private and public payers to establish coverage and reimbursement for our tests;
|
|
•
|
investing in clinical evidence directly and through relationships with academia and biopharmaceutical companies to establish expanded indications for use;
|
|
•
|
demonstrating improved clinical utility and health economics from use of our tests to patients, physicians and payers; and
|
|
•
|
pursuing FDA approval of our Guardant360 and future tests to facilitate reimbursement and global market access.
|
|
•
|
Strengthen our relationships with biopharmaceutical and academia customers by:
|
|
•
|
demonstrating the utility of our products in connection with standard of care biopharmaceutical treatments thereby encouraging clinical adoption;
|
|
•
|
developing and seeking approval of our products as companion diagnostics for targeted therapies and immuno-oncology therapies; and
|
|
•
|
providing earlier insights into emerging clinically relevant biomarkers.
|
|
•
|
Leverage our Guardant Health Oncology Platform to expand our product portfolio by:
|
|
•
|
using our commercial engine as a force multiplier of returns on research and development investment to generate data and analytical insights to enable development of new products;
|
|
•
|
taking a disciplined and systematic approach to product and market development, by starting with therapy selection and then expanding sequentially towards early cancer detection;
|
|
•
|
utilizing our data, sample biobank and insights into biology of circulating tumor-related biomarkers in blood to develop our LUNAR programs;
|
|
•
|
building on our regulatory and commercial infrastructure to accelerate new product launches and drive commercial efficiencies; and
|
|
•
|
using our strategic relationships, including our joint venture with SoftBank, to drive global commercialization of our products, with a near-term focus on Japan.
|
Our industry
Despite enormous investment in research and the introduction of new treatments, cancer remains a critical area of unmet medical need. According to the Centers for Disease Control and Prevention, or CDC, cancer is the second leading cause of death in the United States, exceeded only by heart disease. The American Cancer Society reported that in 2016 there were more than 15.5 million Americans with a history of cancer and that approximately 1.7 million new cancer cases would be diagnosed in 2018. Furthermore, approximately 610,000 Americans were expected to die of cancer in 2018. The International Agency for Research on Cancer predicted that the annual global burden of cancer would reach 22 million new cases and 13 million cancer deaths by 2030. The World Health Organization estimated that the total annual economic cost of cancer in 2010 was approximately $1.2 trillion.
The promise of precision oncology
Traditionally, cancer has been classified by the specific organ in which it is located and treated independently of its molecular profile. However, cancer treatment is seeing a significant shift towards precision oncology, the practice of which seeks to match patients to personalized, targeted therapies based on the specific molecular profile of their tumors. Major cancer types, including lung, breast, colorectal and melanoma, for example, have become increasingly classified and treated on the basis of molecular profile.
Discovery of new molecular biomarkers continues to result in further sub-classification of cancer patient populations, which increases complexity of diagnosing and treating the disease for clinicians. This has led to increasing clinical utility and adoption of comprehensive genomic profiling, or CGP. Unlike tests that focus on a single or limited set of biomarkers, commonly referred to as hotspot testing, CGP provides a more comprehensive view of the tumor’s molecular
5
information. Specifically, a comprehensive genomic test must be able to identify all four classes of genetic alterations, namely single nucleotide variants, copy number variants, insertions/deletions and fusions, across multiple genes. The NCCN treatment guidelines now support multi-biomarker testing across several cancer types, which has led to increased adoption of CGP. For example, for NSCLC, NCCN treatment guidelines now include recommendations for testing across eight genes, each associated with FDA-approved targeted therapies.
While precision oncology is improving clinical outcomes for patients across many cancer types, it is also benefiting oncology drug development. Biopharmaceutical companies are able to increase chances of a drug’s success in clinical trials by identifying and selecting patients whose cancer has the right molecular profile. This enables them to potentially require fewer patients for the trial and shorten the duration of late-stage clinical trials. According to GlobalData, approximately 66% of the solid tumor oncology clinical pipeline in 2016 was for targeted therapies and immuno-oncology therapy agents, many of which are targeting a cancer with a specific molecular profile or biomarker.
Despite improvements to clinical outcomes and oncology drug development, primarily in the advanced cancer setting, precision oncology has not significantly impacted earlier stage cancer care. For example, precision oncology has yet to fully impact adjuvant treatment management, recurrence detection in cancer survivors or early detection in higher risk asymptomatic individuals. Many early stage cancer patients receive only non-targeted chemotherapy post-surgical resection of the tumor in the adjuvant setting and ad-hoc, symptomatic monitoring for recurrence. For early detection of cancer in asymptomatic individuals, the current standard of care is comprised of single protein biomarker tests or radiographic imaging, which can have challenges with high false positive rates when used for screening. For example, according to the results from the national lung screening trial reported in
The New England Journal of Medicine
, low-dose CT, or LDCT, imaging may identify lung nodules in heavy smokers, out of which 95% are benign. Furthermore, these tests are generally only applicable to specific cancers and incapable of broad screening for multi-cancer detection.
Limitations of tissue biopsies
We believe that precision oncology, as it is practiced currently, suffers from the major challenge of limited access to molecular information, largely resulting from a reliance on tissue biopsies. This has impeded progress on both early disease diagnosis and effective treatment selection. For a tissue biopsy to be performed, the patient typically must undergo an imaging procedure to locate the tumor, following which a biopsy of the tumor is taken using interventional procedures, such as a core needle biopsy or fine needle aspiration. As part of this procedure, the needle is placed into the tumor and cells are aspirated into a syringe. The cells are placed on a microscope slide, stained and examined by a pathologist to determine the diagnosis and classification of the disease. If genotyping is required, which could include testing with next-generation sequencing, additional slides with tumor tissue would need to be prepared for this analysis.
The tissue biopsy process holds significant challenges, including:
Adverse event risks -
Tissue biopsies require use of an invasive tool to access the tumor within the body and are frequently associated with morbidity and mortality. For instance, a study published in
The Journal of Oncology Practice
/
Clinical Lung Cancer
reported that, according to Medicare claims data from 2009 to 2011, a lung biopsy was associated with a 19.3% complication rate. Complications included pneumothorax, respiratory failure and hemorrhage.
Delay
in care
- Collection of tissue biopsy often requires a medical imaging procedure to locate the cancer and coordination amongst an interventional radiologist, surgical oncologist and pathologist to interpret the imaging and collect and analyze the tissue. A traditional tissue biopsy can take several weeks to schedule and additional time to process the sample, which can be burdensome on the patient and delay the collection of critical molecular information.
Cost -
According to a study published in
The Journal of Oncology Practice
/
Clinical Lung Cancer
, the average total cost of a lung biopsy is $14,670, due largely to the required imaging, biopsy or surgical procedure to obtain the tissue, and associated morbidity.
Limited tissue availability -
Tissue sampling has variable but significant failure rates due to procedural or sampling failure and may be exhausted by pathology tests for cancer diagnosis. In NSCLC, this has been documented across many institutions and happens as often as 60% of the time.
In addition, tissue sampling is unavailable for a minority of patients due to medical contraindication, patient unwillingness or logistical concerns.
Limited to a small portion of a single tumor
- A tissue biopsy is often limited to a small portion of a single tumor site, which may not accurately represent the entire tumor or all clinically relevant biomarkers due to tumor heterogeneity. This could lead to a tissue biopsy missing mutations targetable by therapy for patients with advanced solid tumors. This limitation has been demonstrated in many tumor types, including lung, breast, gastric, renal and cholangiocarcinoma.
6
Inability to address applications for early stage cancer patients
- For disease recurrence detection or screening for early detection of cancer, tissue tests are impractical or not feasible.
The potential for our liquid biopsy technology
We believe that our liquid biopsy technology can liberate molecular information across all stages of cancer and broaden the scope of precision oncology to earlier stages of the disease. Furthermore, we believe our liquid biopsy can potentially lead to dramatically greater rates of data generation and shorten cycles of learning, thereby accelerating progress in improving clinical outcomes. Relative to a tissue biopsy, a routine blood draw is:
|
•
|
minimally invasive;
|
|
•
|
rapidly administered;
|
|
•
|
cost effective; and
|
|
•
|
readily available.
|
In addition, we believe our liquid biopsy technology is:
Able to provide timely insight into tumor genomic alterations
- Our liquid biopsy tests are convenient and fast. With a routine blood draw, and for example, typically less than seven days turn-around-time with our Guardant360 test, we believe our Guardant Health Oncology Platform can comprehensively genotype cancer patients and other populations to enable rapid initiation of effective treatment and potential clinical trial enrollment.
More representative of the molecular profile of the tumor in its entirety
- Our test results could represent an overall summary of the entire molecular profile of the tumor or tumors and not just a subset of a single tumor that may be represented in a tissue sample. This may enable insight into potentially more targetable mutations than tissue testing.
Able to monitor response to therapy
– We believe recent data suggests that changes in tumor burden can be monitored through the use of our liquid biopsy technology and successive blood draws to potentially provide quicker information as to the effectiveness of a chosen treatment than current approaches using radiographic imaging.
Able to address all stages of the disease
– We believe ready access to molecular information and the ability to potentially detect cancer at early stages in blood enable our liquid biopsy technology to be used for applications, such as for minimal residual disease and recurrence detection or screening higher risk asymptomatic individuals.
Able to match standard-of-care tissue testing
– In a recent head-to-head comparison of Guardant360 test to standard-of-care tissue testing for biomarker identification in first-line advanced NSCLC patients, our liquid biopsy technology produced biomarker detection rates in line with standard of care tissue testing.
History of liquid biopsy and challenges
The concept of a liquid biopsy is not new, and we believe that a minimally invasive tool, such as a liquid biopsy, has been an aspiration of the oncology field for many decades. Multiple modalities have been pursued to access a patient’s molecular information through blood, including ctDNA, circulating tumor cells, or CTCs, and exosomes. It has been shown that modalities using ctDNA may have distinct advantages over other known modalities. For example, ctDNA has a concentration in blood that may be over 100 times higher than CTCs, which can enable increased test sensitivity and accuracy.
However, despite this promise of higher concentration and, therefore, higher theoretical sensitivity of a ctDNA test, these fragments are still found at very low concentrations which can make their analysis challenging by conventional methods. For example, circulating cell-free fetal DNA, which is the target for a variety of non-invasive prenatal testing applications for women during pregnancy, makes up a median of 10% of the total cell-free DNA in maternal blood. By contrast, the median concentration of ctDNA genomic alterations detected in blood of advanced cancer patients is 0.46% and can be present at levels below 0.01% in early stage cancer patients.
Although the sensitivity and specificity of conventional next-generation sequencing is sufficient for tissue biopsy based tumor profiling, this performance is inadequate for liquid biopsies due to the low concentrations of ctDNA in blood. Moreover, comprehensive genomic profiling for precision oncology requires detection across all four classes of genomic alterations below, which can be especially challenging with ctDNA:
Single-nucleotide variants (SNVs)
- variation(s) in a single nucleotide in a DNA molecule
Insertions/deletions (Indels) -
short nucleotide section(s) of a DNA molecule inserted or deleted
7
Copy number amplifications (CNVs) -
regions(s), typically spanning one or more genes of the genome that are repeated
Genomic rearrangements
- involve gross alterations of chromosomes or large chromosomal regions and can take the form of deletions, duplications, insertions, inversions or translocations
The market opportunity and our vision for the standard of cancer care
We believe that liquid biopsy tests can solve critical challenges of tissue-based tests, expand the scope of precision oncology across the cancer care continuum to earlier stage disease, and empower clinicians to make better decisions to improve clinical outcomes, lower healthcare costs and enable biopharmaceutical companies to advance new therapies. We believe liquid biopsy has application in the following areas, representing a market opportunity we estimate to be more than $35 billion in the United States:
Therapy selection in advanced cancers.
Clinicians require genomic information in order to properly match advanced cancer patients with the appropriate treatment across multiple lines of therapy. Given the limitations of tissue biopsies, we believe a blood test that is capable of accessing the comprehensive genomic profile of the patient’s cancer represents a significant breakthrough, especially in the local community setting, where 80% of cancer patients are treated, infrastructure and expertise to access tissue may be especially limited. We also believe a comprehensive liquid biopsy test for therapy selection can benefit biopharmaceutical companies across a range of applications, including patient selection and recruitment for clinical trials and commercialization once the drug is approved, as well as identification of new molecular targets for drug development. For example, better access to molecular information can speed clinical trial enrollment and increase the probability of success of drug development in a target patient population.
We estimate this is an up to $6 billion total market opportunity in the clinical and biopharmaceutical markets. This includes a near-term clinical opportunity of $2 billion, based on an estimated 700,000 metastatic patients in the United States and an assumed average reimbursement rate of $3,000, a similar amount covered by Medicare for a comprehensive genomic profiling test. We estimate the number of metastatic patients in the United States based on the number of deaths attributable to cancer annually in the United States as reported in
A Cancer Journal for Clinicians
and the number of patients who are diagnosed with advanced cancer in the United States and are alive a year after diagnosis as reported in the SEER Cancer Registry. We believe this opportunity may expand by up to an additional $2 billion, as metastatic patients may require multiple tests to inform subsequent lines of therapy.
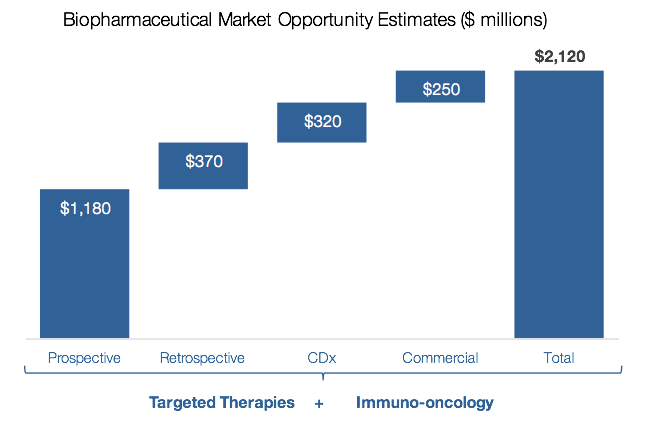
We estimate that the market opportunity with biopharmaceutical companies in the United States is over $2 billion including an opportunity of over 400,000 tests based on the industry’s current clinical pipeline of over 900 immuno-oncology and over 300 targeted therapy programs, involving more than 130,000 patients. These programs represent two distinct testing opportunities: (1) prospective screening to identify candidate patients for clinical trial enrollment and (2) retrospective analysis of patient samples. In addition, we estimate there is a market opportunity of $500 million in companion diagnostics development and other commercial opportunities.
The chart below represents the breakdown of the total estimated market opportunity across both the targeted therapy and immuno-oncology opportunities for the therapy selection markets:
8
Minimal residual disease and recurrence detection in cancer survivors.
We believe cancer survivors would benefit from tests that could improve minimal residual disease and recurrence detection. Follow-up testing for surveillance in cancer survivors is often ad-hoc, leaving patients guessing as to if and when their cancer may recur. A portion of this market is currently served by prognostic and predictive molecular tests that can classify whether a patient may be at low-risk or high-risk of recurrence. We believe that a definitive diagnostic test for cancer would benefit this patient population both immediately following surgical resection of the tumor and as a monitoring tool in subsequent years. Furthermore, a liquid biopsy test in this setting could help biopharmaceutical companies identify new opportunities in adjuvant drug development and therapies targeting earlier stage cancers.
We estimate this is an approximately $15 billion market opportunity, consisting of an estimated 15 million solid tumor cancer survivors, excluding survivors of blood cancers, including leukemia and Non-Hodgkin’s lymphoma, in the United States as reported by the American Cancer Society, and assuming an average price of $1,000 per test for each solid tumor cancer survivor, which is consistent with the cost to screen a patient for lung cancer as reported in the
New England Journal of Medicine
.
Early detection of cancer in higher risk individuals.
Earlier detection of cancer is generally correlated with better clinical outcomes and a higher cure rate for many cancer types. We believe that a test that can accurately detect cancer at its earliest stages or even pre-cancer in a largely asymptomatic population will need to overcome high technological, clinical and regulatory challenges. However, such a test can have significant benefits on mortality and perhaps eventually reduce incidence rates of cancer, if the information provided can be effectively paired with the right preventative medicine or curative intervention.
We estimate this is an approximately $18 billion market opportunity, based on an estimated 35 million individuals at higher risk for cancer in the United States and assuming an average price of $500 per test. The estimated 35 million individuals at higher risk for cancer in the United States consist of approximately 17 million individuals at moderate to high hereditary risk of developing breast, ovarian, colorectal, endometrial or prostate cancer, based on prevalence statistics reported in
Genetics in Medicine
and U.S. Census Data; approximately 14.5 million people over the age of 50 who are moderate to heavy smokers, as reported by the Centers for Disease Control and Prevention; and approximately 3.5 million individuals in the United States at high risk of developing liver cancer due to Hepatitis C infection, based on data reported in
Hepatology
.
9
The graphic below depicts the potential opportunities of liquid biopsy across the cancer continuum of care:
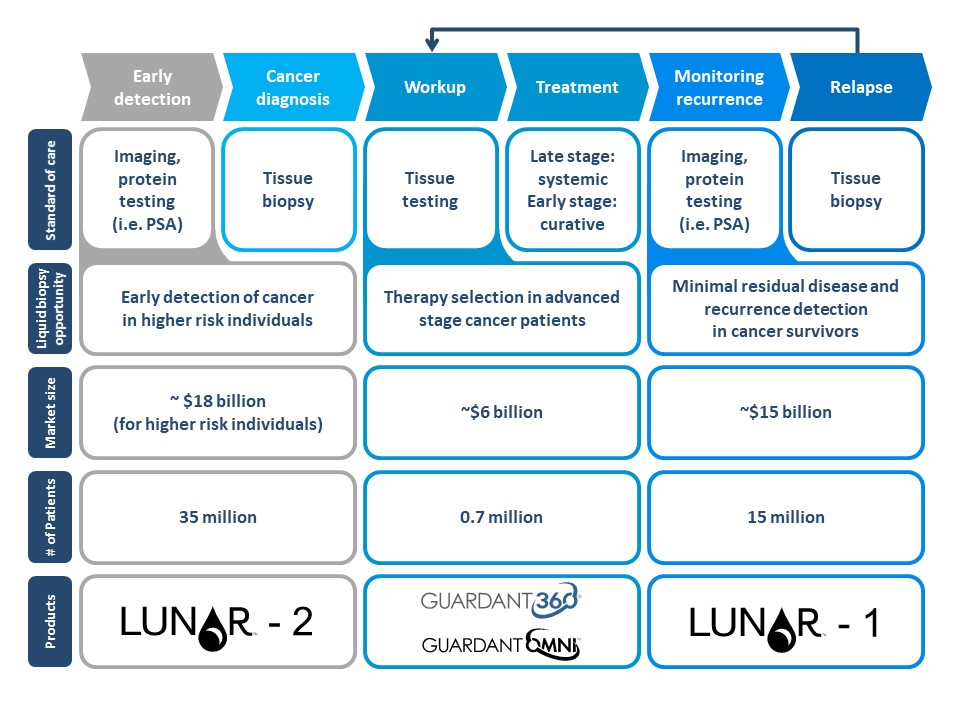
10
The Guardant Health Oncology Platform
The Guardant Health Oncology Platform is comprised of strengths across five critical layers, each of which is tightly coupled with the others, and we believe success in each facilitates success in adjacent layers. We believe our platform and our position as a pioneer of comprehensive liquid biopsy provide us with a competitive advantage and form a barrier to entry. The following diagram depicts the five layers of our oncology platform:
Technology – Guardant Health Digital Sequencing
Guardant Health Digital Sequencing combines state-of-the-art technology from multiple disciplines and is enabled by robust, high-efficiency biochemistry at the front-end, next-generation sequencing and a machine learning augmented bioinformatics pipeline. The combination of all of these technologies onto one platform has enabled our programs in liquid biopsy and what we believe is the highest performing clinical comprehensive liquid biopsy, with a turnaround time of typically less than seven days after we receive the sample. We believe our platform is able to detect all four classes of genomic alterations and microsatellite instability, or MSI, at sensitivity levels beyond comparable platforms.
Two specific enhancements we employ throughout the workflow include:
High-efficiency chemistry
- Our proprietary ctDNA sample preparation biochemistry is able to convert the vast majority of extracted ctDNA molecules into a sequencing library. This enables enhanced sensitivity to detect mutations present at ultra-low variant frequency and the ability to work with limited sample volumes.
Error suppression via proprietary bioinformatics engine
- Our bioinformatics pipeline reduces the sequencing error rate by 1000-fold over conventional next-generation sequencing and by 30-fold over other sequencing assays relying on molecular barcoding alone. Furthermore, the machine learning capability enables performance improvement as we incorporate data from additional blood samples.
Clinical utility
We believe that the measure of the clinical utility provided by a given diagnostic test or technology lies in the ability to enable the physician to match intervention with the patient to select the treatment likely to produce a more favorable outcome for the patient. We also believe that success in the clinical utility layer requires both independent, systematic investments in clinical research, and strategic relationships with market-leading biopharmaceutical companies. We aim to generate publications in independently peer-reviewed scientific journals to demonstrate clinical utility of our technology. For this reason, we have invested in directly sponsoring or participating in prospective, interventional clinical trials with leading academic cancer centers and biopharmaceutical companies, including over three dozen published clinical outcomes studies, including what we believe to be the largest-ever liquid-to-tissue concordance study and prospective interventional clinical utility studies demonstrating clinical overall detection rates of our non-invasive blood testing in line with tissue testing. We have built an internal clinical development team that can efficiently run
11
clinical utility studies and continue to invest in such studies spanning many indications within the advanced cancer setting, including completed outcomes studies (20 in lung cancer, 10 in gastrointestinal cancers and several in other cancer types). We are also investing heavily in studies involving earlier stage disease.
The strength of our technology facilitates strategic relationships with academia and over 50 biopharmaceutical customers, to help them advance the development of their drug pipelines and expand the utilization of currently commercialized treatments. In return, these relationships provide rigorous clinical validation of our technology and early insights into emerging therapeutically relevant test targets.
Regulatory
We believe that Guardant360 test was the first comprehensive liquid biopsy approved by the NYSDOH. In addition, based on our review of publicly available records, we believe our facility was the first comprehensive liquid biopsy laboratory to become CLIA-certified, CAP-accredited and NYSDOH-permitted. While FDA approval is currently not required to market our tests in the United States, we intend to seek a PMA for Guardant360 test. In January 2018, the FDA granted Guardant360 Expedited Access Pathway, or EAP, designation, which offers potentially faster review for breakthrough medical devices. The FDA has indicated that medical devices that received EAP designation automatically receive Breakthrough Device designation, which, among other things, provides for priority review and more interactive communication with the FDA during the development process. FDA approval therefore provides a path to reimbursement by Medicare through CMS. In March 2018, CMS published a Decision Memorandum for next-generation sequencing, or NGS, tests, or the NGS Decision Memorandum, for patients with advanced cancer who meet certain clinical criteria. The NGS Decision Memorandum states, among other things, that coverage would be available for next-generation sequencing FDA-approved tests offered within the FDA-approved companion in vitro diagnostic test labeling. We believe that this establishes a competitive advantage for tests receiving FDA approval and that FDA approval will be increasingly necessary for diagnostic tests to gain adoption, both in the United States and abroad, by clinicians, payers and biopharmaceutical companies. In December 2018, we announced our partnership with AstraZeneca to develop Guardant360 as a companion diagnostic for Tagrisso and GuardantOMNI as a companion diagnostic for Imfinzi.
Payer coverage
Coverage from public and commercial payers is primarily influenced by clinical evidence, endorsement by KOLs and treatment guidelines. The analytical and clinical data that we have generated, combined with our support from KOLs, has led to a number of positive coverage decisions from commercial payers. Guardant360 test is currently covered by Cigna, Priority Health and multiple regional Blue Cross Blue Shield plans, which have adopted reimbursement policies that specifically cover Guardant360 test for NSCLC, which we believe gives us a competitive advantage with these payers. With respect to Medicare, in July 2018, Palmetto GBA, the MAC responsible for administering the MolDx, issued an LCD for our Guardant360 test with respect to NSCLC patients who meet certain clinical criteria. We worked with Palmetto GBA to obtain this positive coverage decision through the submission of a detailed dossier of analytical and clinical data to substantiate that the test meets Medicare’s medical necessity requirements. Noridian Healthcare Solutions, the MAC responsible for adjudicating claims in California, where our laboratory is located, and a participant in the MolDx, recently finalized its LCD for our Guardant360 test. We anticipate FDA approval of our Guardant360 test, if obtained, may support improvements in coverage and reimbursement, including Medicare according to the NGS Decision Memorandum.
Commercial adoption
Success in each of the layers above is important for commercial adoption by clinicians and biopharmaceutical companies. Additionally, for clinicians, endorsement by KOLs traction at academic centers and inclusion in national treatment guidelines is important, especially for clinical adoption in the local community setting where 80% of cancer treatment occurs. Our relationships with key stakeholders across the oncology space, as well as the recent inclusion of liquid biopsy under certain circumstances as a potential alternative to tissue biopsy in NCCN treatment guidelines has helped facilitate adoption of our tests by 6,000 oncologists, who have collectively ordered our Guardant360 test over 80,000 times, and by over 50 biopharmaceutical companies.
Our products and development programs
We have launched our Guardant360 and GuardantOMNI tests and are developing additional tests under our LUNAR programs, including having launched our LUNAR assay for RUO. We believe our product portfolio, once completed, will address the full continuum of care and has utility in both the clinical and biopharmaceutical markets.
12
Therapy Selection
The increasing diversity of targeted therapies and associated molecular biomarkers has given rise to comprehensive genomic profiling, particularly in tumor types where multiple genomic targets can be found and treated effectively. For example, NSCLC, like other tumors, has multiple effective treatment options targeting different genomic mutations. There are eight targetable genomic mutations in NSCLC, which are comprised of alterations across all four genomic variant classes (SNVs, indels, CNVs, and fusions). Five of these targets are on-label approved biomarkers for FDA-approved therapies. The NCCN treatment guidelines recently recommended testing for all of the eight genomic mutations or alterations across different cancer types, which demonstrates the requirement for broader genomic profiling.
Despite NCCN guidelines, a recent 800 patient study of NSCLC patients reported that only a minority of patients actually were tested for the guideline-recommended targetable genomic mutations, and only 8% of patients were comprehensively genotyped. Such “undergenotyping” had multiple causes in the study, and primary reasons for not testing were lack of sufficient tissue, poor patient performance status or infeasibility to undergo a repeat biopsy for additional tissue.
Guardant360 Test
We believe Guardant360 test is the market leading comprehensive liquid biopsy test, based on the number of tests ordered. Guardant360 test is a 73 gene test that supports treatment selection for advanced stage cancer patients with solid tumors. The testing process requires two 10 milliliter blood samples that are sent to our laboratory in Redwood City, California, where we process and analyze the samples using proprietary, next-generation sequencing-based Guardant Health Digital Sequencing Technology. Results are typically delivered in seven days following receipt of sample and delivered by a clinical report through fax, portal or mobile device.
Since we launched our Guardant360 test in 2014, it has been ordered over 80,000 times by more than 6,000 oncologists across dozens of cancer types, by more than 50 biopharmaceutical companies and by all 28 NCCN centers. Guardant360 test is also currently being developed as a companion diagnostic for Tagrisso, a treatment for metastatic NSCLC patients, under a collaboration with AstraZeneca.
Guardant360 clinical report
A typical Guardant360 clinical report contains somatic mutations detected in patient blood samples, associated treatment options and available clinical trials in the vicinity of the patient’s location. Additionally, the report depicts a proprietary visual representation that shows the evolution of somatic mutations in longitudinal blood samples.
Analytical validation
We believe there are two key performance characteristics that are critical for a liquid biopsy test. The first is sensitivity, which refers to the level of ctDNA in circulation at which the technology reliably detects variants for a given input sample amount. The second is specificity, which is the probability that a given test result is accurate. These metrics are critical for effective treatment selection based on the results of liquid biopsy testing. It can be especially challenging to maintain high specificity at detection levels below 0.25% due to the high error rates of standard next-generation sequencing protocols at these levels and the broad genomic footprint tested simultaneously in a comprehensive liquid biopsy test. In order to assess these key performance characteristics for Guardant360 test, we conducted analytical validation studies against orthogonally validated methods. The results, as published in Clinical Cancer Research, demonstrated that Guardant360 test has a detection threshold of one to two molecules across multiple alteration types, including all four classes of genomic alterations and MSI, with very high specificity which results in accurate and sensitive detection of somatic mutations in patient samples.
Clinical trials and publications
The goal of our clinical development with Guardant360 test is to support its use for comprehensive genomic profiling across multiple tumor types, including as a preferred alternative to tissue testing to inform first line treatment right after diagnosis and at time of disease progression. We publish peer-reviewed studies in order to influence treatment guidelines, to educate clinicians and other oncology stakeholders about the value proposition of our test and to set the stage for reimbursement with private and public payers. We have over 40 approved, completed or active clinical outcomes studies, more than 100 peer-reviewed publications and more than 300 scientific abstracts.
The following summarizes the results of our key clinical studies:
Genotyping concordance with matched tumor tissue -
Results of a blinded retrospective study comprising 6,948 consecutive NSCLC samples to assess the concordance between Guardant360 test and tissue genotyping of samples received for clinical testing at our laboratory showed high positive predictive value, which is the probability that a
13
variant detected by Guardant360 test in blood was in fact present in the corresponding tissue sample.
Detection rate of ctDNA in patient samples -
We observed a test success rate of 99.6% in a study comprising 10,593 consecutive samples to provide insights into Guardant360 test performance in real-world clinical specimens. Overall detection rates of ctDNA were consistently high (85.9%), predominantly driven by NSCLC (87.7%), colorectal (85.0%) and breast (86.8%). We believe this cohort demonstrates the need for a highly sensitive liquid biopsy as the median variant allele frequency, or VAF, found was only 0.46%.
Prospective clinical response rate -
A prospective, interventional, multi-cancer clinical utility study of Guardant360 test across 193 patients with no tissue genotyping options showed an objective response rate of 87% (95% CI, 58%-98%) with disease control rate of 100% (95% CI, 75%-100%). In the NSCLC cohort, 73 patients were tested, 34 were matched with pre-specified therapy, of which 17 patients were treated with matched therapy, of which 15 patients were evaluable. Importantly, the response rate was independent the VAF of mutations found in the blood.
Clinical relevance of actionable mutations detected at ultra-low concentrations
- We analyzed the clinical response of a multi-center case series of Guardant360 test-detected targetable driver alterations in advanced NSCLC with VAFs of less than 0.2%. Twelve patients were selected who had targetable driver alterations in
EGFR
(n=7, VAF range 0.045%-0.14%),
MET
exon 14 skipping mutation (n=1, VAF = 0.06%),
BRAF
V600E (n=1, VAF = 0.1%),
EML-ALK
fusions (n=3, VAF range 0.07-0.16%). All patients responded to targeted therapy with median progression-free survival of 52 weeks. Of particular significance, 7 out of 12 patients were undergenotyped, largely due to tissue insufficiency.
Biomarker discovery rate
. We are proactively pursuing studies to support the use of our Guardant360 test as a preferred alternative to tissue testing to inform first line treatment right after diagnosis, with the goal to provide evidence that our Guardant360 test detects genomic alterations at a similar rate compared to standard of care tissue testing in the United States, Europe and Asia. Such a strategy is predicated on the Guardant360 test’s ability to offer accurate, reliable and fast guideline-directed comprehensive genotyping for all adult solid tumors without exposing patients to invasive biopsy procedures’ risks, delays or chance of failure. For example, the MedSIR-sponsored SLLIP study was the first prospective study comparing our Guardant360 test to unspecified tissue-testing modalities.
The primary endpoint for the study was the non-inferiority of our Guardant360 test, as compared to standard tissue testing, in detecting eight NCCN (E
GFR, ALK, ROS, BRAF, MET, RET, ERBB2
and
NTRK
) biomarkers in first-line advanced, non-squamous NSCLC. Among more than 180 total samples, investigators found that tissue-based testing identified biomarkers in 48 subjects, while the Guardant360 test identified biomarkers in 47 subjects, meeting the study’s primary endpoint (P<0.002). We expect a final analysis on the treatment plans and outcomes for these patients to be completed by the middle of 2019. Additionally, in the first quarter of 2019, we announced results from our NILE study after it met its primary endpoint of demonstrating that Guardant360 test detected targetable genomic biomarkers in advanced, non-squamous NSCLC at a similar rate to standard of care tissue testing. Our Guardant360 test identified guideline-recommended biomarkers in 77 of the 282 patients enrolled in the study, while tissue testing identified such biomarkers in 60 of those patients. In the study, the median time to results for Guardant360 testing was much shorter than for tissue testing, as Guardant360 test results were reported in an average of 9 days, while tissue testing results were reported in an average of 15 days. We believe these data support the use of our testing ahead of tissue testing for all newly diagnosed advanced NSCLC patients.
GuardantConnect
Because metastatic cancer patients often exhaust standard of care treatment options as the disease progresses and guidelines recommend clinical trials for advanced cancer patients, clinical trial matching is an acute need in oncology. At the same time, biopharmaceutical companies need to fill clinical trials that require screening hundreds of thousands of patients. Despite these needs, clinical trial enrollment in oncology has severely lagged, with only 3-6% of cancer patients enrolling in clinical trials. GuardantConnect is our integrated software solution designed for our clinical and biopharmaceutical customers, seeking to connect patients in need tested with Guardant360 test with clinical trials.
GuardantOMNI Test
Our GuardantOMNI test is built on Guardant Health Digital Sequencing Technology and learnings from our Guardant360 test. The GuardantOMNI test, launched in 2017 for RUO, has a significantly larger genomic panel footprint than the Guardant360 test and has achieved comparable analytical performance in clinical studies, including for translational science applications in collaboration with several biopharmaceutical companies, including Merck MSD, Merck KGaA, Pfizer, AstraZeneca and Bristol-Myers Squibb.
It covers 500 genes, including genes associated with homologous recombination repair deficiency and biomarkers for immuno-oncology applications, such as tumor mutational burden and microsatellite instability.
In order to preserve performance characteristics of our Guardant360 test across a broader gene panel, we implemented additional enhancements to the assay efficiency and bioinformatics analysis to improve the sensitivity of our
14
GuardantOMNI test. These enhancements are critical in the context of using the GuardantOMNI test in the retrospective testing of clinical trial samples for translational science applications in collaboration with biopharmaceutical customers, as those samples are often available with only a limited volume of plasma.
Validation data indicates that the GuardantOMNI test exceeds the Guardant360 test’s sensitivity for detecting clinically actionable biomarkers. At the same time, broader panel-wide performance of small variants is roughly similar to that of Guardant360 test. The broad genomic footprint of our GuardantOMNI test enables accurate measurement of tumor mutational burden. The GuardantOMNI test received breakthrough device designation from the FDA in December 2018 and is currently being developed, including as a potential companion diagnostic, to identify patients who may benefit from immuno-oncology therapeutics. Our GuardantOMNI test is also currently being developed as a potential companion diagnostic for Imfinzi, an immuno-oncology therapy, under our collaboration with AstraZeneca, where the GuardantOMNI test is expected to be used to identify patients that may more likely respond to immuno-oncology agents based on tumor mutational burden or TMB. At the European Society for Medical Oncology’s Immuno Oncology 2018 Congress, AstraZeneca presented data from the Phase III MYSTIC trial showing that our GuardantOMNI test was able to identify TMB from blood for more patients than tissue-based approaches, which contributed to improved overall survival over standard-of-care chemotherapy for high TMB patients treated with immuno-oncology agents.
LUNAR Programs
We believe that there is a critical need to develop products to expand precision oncology to post-cancer monitoring and earlier stage settings. Such products would enable clinicians to precisely detect, monitor and select the appropriate intervention at the right times in the disease’s evolution, key to significantly improving patient clinical outcomes. In order to systematically address this need, we launched our LUNAR programs to pursue two opportunities. The first, our LUNAR-1 program, is related to minimal residual disease and recurrence detection for cancer survivors. The second, our LUNAR-2 program, is related to early-stage cancer detection in higher risk asymptomatic patients.
We believe that detection of minimal residual disease in the blood of cancer patients after surgery and surveillance of patients who have completed curative cancer treatment to potentially detect recurrence at an earlier stage may identify a population of patients with minimal residual disease who are likely to benefit from adjuvant chemotherapy treatment.
Early cancer detection in higher-risk individuals is challenging, especially with respect to clinical specificity. There is a minimal amount of ctDNA in patients with low-disease burden. Additionally, naturally-occurring genomic aberrations in blood as well as signals from non-cancer related diseases can add biological noise obfuscating detection of circulating tumor-related biomarkers. We believe we have the unique capability to overcome these challenges by leveraging our:
|
•
|
Vast data sets and deep insights:
We have targeted deep sequencing data in combination with low-coverage sequencing of whole genome from tens of thousands of cancer patients. This data has enabled discovery of novel epigenomic variations across multiple cancer types. We believe augmenting genomic with epigenomic signatures can enhance the clinical sensitivity and specificity of our tests significantly. Moreover, we developed a database of biological noise sources such as clonal hematopoiesis of indeterminate potential, which enables us to further enhance the sensitivity and specificity of our tests.
|
|
•
|
Extensive blood biobank:
We have a biobank of tens of thousands of cancer samples that we use for discovery and, more importantly, biomarker verification and validation. For example, we are analyzing these samples with whole genome sequencing to identify and confirm tumor associated signatures. Also, we have been collecting additional samples through multiple on-going research collaborations.
|
Our LUNAR assay is currently available for research use by academic and biopharmaceutical researchers.
LUNAR-1 Program: Minimal residual disease and recurrence detection in cancer survivors
Tests from our LUNAR-1 program could provide cancer survivors with quantitative peace of mind through a test for recurrence. We also believe it could help physicians determine those patients that may still have minimal residual disease and be candidates for adjuvant treatment. Though we believe that our technology is extensible to a broad array of cancer types, our LUNAR-1 program will initially focus on 4 cancer types: lung, colorectal, breast and ovarian cancers. These potential markets are significant, from an estimate of up to $1 billion for adjuvant treatment selection and up to $5 billion for surveillance in the four cancers of our initial focus. We estimate the broader total potential market opportunity for our LUNAR-1 program to be approximately $15 billion as we expand to other indications.
Clinical studies have demonstrated the added value of adjuvant chemotherapy after surgery to kill residual disease and prevent recurrence
when cancer is present and at low burden
. However, studies have shown that adjuvant chemotherapy given empirically to operated stage II colon cancer patients will only benefit the 15% of patients likely to have a cancer recurrence. Thus, many more patients endure cytotoxic chemotherapy who do not need it, so that the few may benefit.
15
Additionally, an adjuvant drug development study can cost significantly more, typically require more patients, last longer and have a lower probability of success relative to a trial in a metastatic setting. Identification of those most likely to benefit from adjuvant therapy is therefore an important clinical challenge. We believe a near-term opportunity for our LUNAR-1 program is in partnering with biopharmaceutical companies to identify these patients for adjuvant trial enrollment and also monitor treatment effectiveness.
LUNAR-2 Program: Early detection in higher risk individuals
Although cancer is the second leading cause of death in the United States, it can be cured if detected and treated at its earliest stages. For example, the introduction of the Pap smear reduced cervical cancer mortality by more than 80% from 1950 to 2005. However, despite the benefit of screening, which is recommended by the U.S. Preventive Services Task Force for cervical, breast, lung and colorectal cancers, a significant number of people do not receive screening today. For example, greater than 30% of eligible Americans are not up-to-date on screening for colorectal cancer.
We believe some of the major challenges lie in the limited efficacy of existing screening modalities:
Protein testing -
Current screening tests using protein biomarkers for various cancers, including prostate (PSA), pancreatic (CA19-9) and ovarian (CA125), lack sensitivity and specificity.
Imaging -
While
radiographic imaging is sensitive, it lacks clinical specificity. For lung cancer screening, as an example, the landmark National Lung Cancer Screening Trial reported that low-dose computed tomography, or LDCT, lung cancer screening of heavy smokers significantly increased cancer diagnosis rate and decreased overall mortality. However, a recent practice survey reported that only 3.9% of the estimated 6.8 million eligible patients had received LDCT screening. An important barrier to adoption of LDCT screening has been its greater than 95% false positive rate, which results in many unnecessary biopsies or inaction on positive findings.
The goal for our LUNAR-2 program is to develop an accurate, affordable test with potential for high compliance for use in higher risk asymptomatic individuals. To support this development, we have collaborated with multiple institutions, including the University of San Francisco, the University of Colorado and the University of Pennsylvania. We have other clinical research collaborations studying similar applications of our LUNAR-2 program for different cancer types. Our research and development results to date indicate that somatic signatures alone may be insufficient for detection of early stage cancers with high sensitivity. For this reason, our LUNAR-2 program is exploring the incorporation of epigenomic and other signatures to enhance the performance of our LUNAR assay in this setting.
Commercialization
U.S. clinical commercial efforts
We commercialize our products in the United States to clinicians through our targeted sales organization. As of
December 31, 2018
, our clinician-focused sales organization in the United States is engaged in sales efforts and promotional activities primarily targeting oncologists and cancer centers. Our sales representatives typically have extensive backgrounds in laboratory testing, therapeutics and oncology. We have supplemented the team with clinical oncology specialists with extensive medical affairs experience for molecular information support in the field.
Our clinical commercial efforts are focused on driving adoption with academic research institutions and with community oncology practices, including through leading physician networks. As we continue to grow our sales organization, we are also expanding our reach to include large community practices, community oncology networks, integrated delivery/ payer-owned systems and government medical facilities that are looking for a reliable partner for comprehensive molecular information testing.
International clinical commercial efforts
We currently offer our tests in countries outside the United States primarily through distributor relationships or direct contracts with hospitals.
Currently, all customer samples are shipped globally to our laboratory in Redwood City, California. We are conducting studies in various jurisdictions in an effort to secure reimbursement. As these studies progress and we near commercial opportunities there, we may seek to establish an in-country laboratory and direct sales organization. Specifically, we have already demonstrated the ability to deploy our technology to partner laboratories such as cancer centers, for the development of liquid biopsy assays based on our technology platform. We believe that this capability will be important in accelerating adoption of our platform and the performance of liquid biopsy testing in certain countries.
Together with SoftBank, we formed a joint venture, Guardant Health AMEA, Inc., which we refer to as the Joint Venture, relating to the sale, marketing and distribution of our tests in all areas worldwide outside of North America, Central
16
America, South America, the United Kingdom, all other member states of the European Union as of May 2017, Iceland, Norway, Switzerland and Turkey, or the JV Territory. Depending on the market opportunity in a country, the Joint Venture may create direct operations or conduct its operations through either a distribution model or a licensing model. Direct operations would entail full operations including a laboratory, sales and marketing and regulatory among other functions. Under the distribution model, our tests would be marketed and sold by the Joint Venture or third-party distributors in relevant countries within the JV Territory, and the tests would be performed by or on behalf of us or our affiliates outside of such countries on samples obtained by the Joint Venture or third-party distributors in such countries. Under the license model, the Joint Venture, or an entity designated by the Joint Venture, would be licensed to market and sell the tests in relevant countries within the JV Territory, and the Joint Venture, or an entity designated by the Joint Venture, would perform the tests on samples obtained in such countries. Following a determination by the board of directors of the Joint Venture on the appropriate model for an individual country, we will enter into an agreement with the Joint Venture with respect to the individual country that is based on either the distribution or license model. We expect to rely on the Joint Venture to accelerate commercialization of our products in Asia, the Middle East, and Africa.
Currently, we and the Joint Venture are primarily focused on expanding our commercial capabilities in Asia, with an initial focus on Japan. There are over 350,000 deaths from solid tumor cancers annually in Japan with a significant portion relating to lung and gastric cancers. We are involved in several nationwide clinical programs that help establish clinical utility of our Guardant360 test in the Japanese population with the first patient tested in late 2018.
Biopharmaceutical commercial efforts
Our business development team is focused on enterprise selling to biopharmaceutical companies in the United States and internationally. Our strategy with each biopharmaceutical customer is to demonstrate the value proposition of the Guardant Health Oncology Platform and expand its utilization across the organization from early stage research through clinical development to commercialization. Given the broad and differentiated utility of our platform, we believe we can support our biopharmaceutical customers across many applications, including:
|
•
|
discovery of new targets and mechanisms of acquired resistance;
|
|
•
|
retrospective sample analysis to rapidly identify biomarkers associated with response and lack of response;
|
|
•
|
prospective screening and referral services to accelerate clinical trial enrollment; and
|
|
•
|
companion diagnostic development to support the approval and commercialization of therapeutics.
|
We also expect to be able to capture other commercial opportunities from our genomic data, which can be used in combination with clinical outcomes or claims data for multiple applications, including novel target identification.
Payer coverage and reimbursement
We believe our tests and services provide solutions that enhance the safety, efficacy and guide cost-effective treatment selection of cancer therapeutics, as evidenced by the adoption from key stakeholders in the healthcare ecosystem. Evidence-based analytical validity, clinical validity and clinical utility studies are key drivers of both clinical adoption and reimbursement from commercial and government payers. Peer-reviewed evidence of our products and services will continue to be a center piece of our reimbursement strategy.
We believe our products offer significant health economic value to payers in the following ways:
•
reduce undergenotyping, thereby matching health plan members to targeted therapies that are both less costly and more effective than potential alternatives such as immunotherapy; and
•
reduce the need for a repeat invasive biopsy, thereby avoiding the associated high costs and risks of tissue biopsy complications.
In sum, we believe our tests help payers reduce both diagnostic and treatment costs, while simultaneously and most importantly improving clinical outcomes.
Commercial third-party payers and patient billing
Payment from third-party payers differs depending on whether we have entered into a contract with the payers as a “participating provider” or do not have a contract and are considered a “non-participating provider.” Payers will often reimburse non-participating providers at a lower amount than participating providers or not at all. Where we are not reimbursed in full or at all, we may elect to appeal the insurer’s underpayment or denial of payment or seek payment from the patient. However, insurer appeal and patient collection efforts take a substantial amount of time and resources and are often unsuccessful. Additionally, there are several national third-party commercial payers that have adopted
17
non-coverage policies that treat both tissue and liquid comprehensive genomic profiling, or CGP, testing, including our Guardant360 test, as experimental or investigational at this time.
We have provided testing services to patients with many cancer types and indications, most of the time as a non-participating provider through 2018. We received reimbursement for tests across the spectrum of these patients, though for amounts that on average were significantly lower than for participating providers.
When we contract to serve as a participating provider, reimbursements are made pursuant to a negotiated fee schedule and are limited to only covered indications. Becoming a participating provider generally results in higher reimbursement for covered indications and lack of reimbursement for non-covered indications. The impact of becoming a participating provider with a specific payer will vary based on historical reimbursement as a non-participating provider for that payer, and in some situations, the benefit of increased reimbursement for covered testing could be offset by the loss of reimbursement on tests for non-covered indications previously received when we served as a non-participating provider. In addition, we have experienced situations where commercial payers proactively reduced the amounts they were willing to reimburse for our tests, and where commercial payers have determined that the amounts previously paid were too high and sought to recover those perceived excess payments by deducting such amounts from payments owed to us.
Coverage from commercial payers has been focused on NSCLC, which represented approximately 46% of our U.S. clinical testing volume in both
2018
and
2017
. To date, the benefit of increased reimbursement for covered NSCLC Guardant360 testing as a participating provider has been approximately offset by the loss of reimbursement on tests for non-covered indications previously received when we served as a non-participating provider. Therefore, the net result of receiving coverage for a particular indication, including NSCLC, may be little to no change in our average revenue per test for all our patients served by these insurance payers.
We are actively engaged to expand coverage among existing contracted providers and to achieve coverage with the remaining key commercial payers, laboratory benefit managers and evidence review organizations. This includes addressing variable coverage requirements and evidence required, and the need for enhanced guideline support. Our existing contracted payers, which include Cigna, Priority Health and multiple Blue Cross Blue Shield regional plans, have determined that the analytical validity, clinical validity and clinical utility evidence requirements for medical policy inclusion of our Guardant360 test in NSCLC have been met. In total, along with Medicare, we estimate these payers currently cover more than 120 million lives.
As we broaden our coverage amongst existing providers to include additional tests, we may begin to experience increases in average revenue per test performed; however, we cannot make any assurances that we will be successful in broadening our coverage on a timely basis or at all. Similarly, as we have experienced with our existing contracted payers, we cannot assure you that the addition of new contracted payers will increase our average selling price or revenue.
In addition to our existing contracted payers, various laboratory benefit managers and national expert opinion organizations who work with these plans have endorsed coverage of our Guardant360 test. The analytical validity, clinical validity and clinical utility evidence requirements for medical policy inclusion of our Guardant360 test in NSCLC have been met by multiple commercial payers and laboratory benefit managers.
Government payers
Medicare coverage is limited to items and services that are within the scope of a Medicare benefit category that are reasonable and necessary for the diagnosis or treatment of an illness or injury. National coverage determinations are made through an evidence-based process by CMS, with opportunities for public participation. Medicare released an NGS Decision Memorandum (CAG-00450N) for advanced cancer patients in the first quarter of 2018 that provides, among other things, that coverage is available for FDA-approved companion in vitro diagnostic NGS, tests offered within their FDA-approved labeling. The NGS Decision Memorandum covers molecular diagnostic tests similar to our Guardant360 test if the product has a companion diagnostic, or CDx, label and is FDA approved for that disease state. We believe an expedient path to obtain pan-cancer Medicare coverage is to obtain FDA approval for the Guardant360 test as a CDx with a pan-cancer tumor profiling label.
In July 2018, Palmetto GBA, the MAC responsible for administering the MolDx, issued an LCD for the Guardant360 test for NSCLC patients who meet certain clinical criteria. We worked with Palmetto GBA to obtain this positive coverage decision through the submission of a detailed dossier of analytical and clinical data to substantiate that the test meets Medicare’s medical necessity requirements. The LCD was made effective for patients with a date of service on or after August 27, 2018 and accordingly Palmetto released claims edits for all MolDx participating MACs. Noridian Healthcare Solutions, or Noridian, the MAC responsible for adjudicating claims in California, where our laboratory is located, is a participant in the MolDx. Noridian published an LCD that adopts the positive coverage decision from Palmetto in the Noridian jurisdiction, effective as of October 20, 2018.
18
Under Medicare, payment for laboratory tests like ours is generally made under the Clinical Laboratory Fee Schedule, or CLFS, with payment amounts assigned to specific procedure billing codes. In April 2014, Congress passed the Protecting Access to Medicare Act of 2014, or PAMA, which included substantial changes to the way in which clinical laboratory services are paid under Medicare. On June 23, 2016, CMS published the final rule implementing the reporting and rate-setting requirements under PAMA. Under PAMA, laboratories that receive the majority of their Medicare revenue from payments made under the CLFS were required to report to CMS, beginning in 2017 and every three years thereafter (or annually for “advanced diagnostic laboratory tests”), commercial payer payment rates and volumes for each test they perform. CMS uses this data to calculate a weighted median payment rate for each test, which is used to establish revised Medicare CLFS reimbursement rates for the test. As we have begun billing Medicare for our tests, we are subject to reporting requirements under PAMA and the Medicare rate for our tests will be calculated in the future based on our private payer rates. For tests furnished on or after January 1, 2018, Medicare payments for clinical diagnostic laboratory tests are based upon these reported commercial payer rates.
State Medicaid programs make individual coverage decisions for diagnostic tests and have taken steps to control the cost, utilization and delivery of healthcare services.
We believe that additional state and federal health care reform measures may be adopted in the future, any of which could have a material adverse effect on the clinical laboratory industry and our ability to successfully commercialize our tests. Any of these or other changes could substantially impact our revenues and increase costs. We cannot predict how future healthcare policy changes, if any, will affect our business and financial success.
Operations
We perform the Guardant360 and GuardantOMNI tests in our clinical laboratory located in Redwood City, California. Our laboratory is CAP-accredited, CLIA-certified, NYSDOH-permitted and also licensed in California, Florida, Maryland, Pennsylvania and Rhode Island.
The proprietary validated methods utilize robust semi-automated workflows designed for high throughput sample testing. This methodology allows for rapid scaling of testing volume without impacting performance metrics. These processes allow us to successfully deliver greater than 98% of results successfully. The workflows allow for rapid generation of reports delivering greater than 80% of results within seven calendar days from the day of sample receipt.
Our Guardant360 testing process includes blood collection, laboratory processing, analysis and reporting. All major processing steps utilize quality control to ensure consistent and reproducible results.
Guardant Health Digital Sequencing Technology
Guardant Health Digital Sequencing Technology combines state-of-the-art technology from multiple disciplines and is enabled by robust, high-efficiency biochemistry at the front-end, next-generation sequencing and a machine learning augmented bioinformatics pipeline. The technology, through machine learning, has accrued performance improvements by incorporating learnings generated from the data collected from additional samples.
Two specific enhancements achieved by Guardant Health Digital Sequencing Technology are:
|
•
|
High-efficiency chemistry
: Overall efficiency of Guardant Health Digital Sequencing in recovery of ctDNA molecules from starting input amount of ctDNA to the post-sequencing analysis of reconstructed molecules indicates the vast majority of extracted ctDNA molecules are converted into a sequencing library, which exceeds most other next-generation sequencing preparations by more than 100%;
|
|
•
|
Error suppression via proprietary bioinformatics engine
: Error suppression through Guardant Health Digital Sequencing corresponds to a typical error rate of approximately one error per 3,000,000 reconstructed molecule nucleotides of high quality. This should be compared to the simplest single-end sequencing error rate of approximately one error per 1,000 sequenced nucleotides and approximately one error per 100,000 nucleotides that could be achieved by other assays relying on molecular barcoding alone.
|
Supply chain
We utilize industry leading vendors for our supply chain. Most reagents and materials are sourced from a single vendor and would require qualification to transition to a different vendor. To mitigate risk, we employ a multi-month, multi-lot safety stock strategy to ensure an uninterrupted supply of reagent and material to our laboratory. In the event that a latent defect is identified, the lot of material in use is expected to be timely quarantined and changed for a new vendor lot that has been previously qualified for use. The experience with our vendors during last five years has provided us confidence in their ability to produce consistent and quality instrumentation, reagents and materials.
19
In September 2014, we entered into a supply agreement with Illumina, Inc., or Illumina, for Illumina to provide products and services that can be used for certain research and clinical activities, including certain sequencers, equipment and other materials that we use in our laboratory operations. Subsequently, we and Illumina amended the supply agreement to, among other things, update the specific products and services to be provided, and pricing terms therefor, and to extend the initial term of the supply agreement. During the term of the supply agreement, as amended, Illumina will supply us with sequencers, reagents, and other consumables for use with the Illumina sequencers, as well as service contracts for the maintenance and repair of the sequencers.
During the term of the supply agreement, as amended, we are required to make a rolling, non-binding forecast of our expected needs for reagents and other consumables, and place purchase orders for reagents and other consumables, and Illumina may not unreasonably reject conforming purchase orders. Subject to discounts that vary depending on the volume of hardware and reagents and other consumables ordered, the price for sequencers and for service contracts is based on Illumina list prices, and the price for reagents and other consumables is based on contract prices that are fixed for a set period of time and may increase thereafter subject to limitations. The supply agreement does not require us to order minimum amounts of hardware, or to use exclusively the Illumina platform for conducting our sequencing.
The supply agreement contains negotiated use limitations, representations and warranties, indemnification, limitations of liability, and other provisions. The initial term of the supply agreement, as amended, continues until December 2021, and the supply agreement automatically renews for additional one-year terms thereafter unless either we or Illumina provide the other with notice of termination one year in advance of the date when such termination is to take effect. Either we or Illumina may terminate the supply agreement for the other’s uncured material breach, bankruptcy or insolvency-related events, or in the event a regulatory authority notifies such party that continued performance under the supply agreement would violate applicable laws or regulations.
Competition
Growing understanding of the importance of biomarkers linked with therapy selection and response is leading to more companies offering services in genomic profiling. The promise of liquid biopsy is also leading to more companies attempting to enter the space and compete with us. Our main competition is from diagnostic companies with products and services to profile genes in cancers based on either single-marker or comprehensive genomic profile testing, based on next-generation sequencing in either blood or tissue.
Our competitors within the liquid biopsy space include Foundation Medicine, Inc., which was acquired by Roche Holdings, Inc. in July 2018, Roche Molecular Systems, Inc., Thermo Fisher Scientific, Inc., Illumina, Inc., Personal Genome Diagnostics, Inc., Qiagen N.V. and Sysmex Inostics. In addition, GRAIL, Inc. and Natera, Inc., among others, are developing early detection tests.
Competitors within the broader genomics profiling space based on tissue include laboratory companies such as Bio-Reference Laboratories, Inc., Laboratory Corporation of America and Quest Diagnostics, Inc., as well as companies such as Foundation Medicine, Inc., Caris Life Science and Myriad Genetics, Inc. that sell molecular diagnostic tests for cancer to physicians and have or may develop tests that compete with Guardant360 and GuardantOMNI tests. In addition, we aware that certain of our customers are also developing their own tests and may decide to enter our market or otherwise stop using our tests.
In addition to developing kits, certain diagnostic companies also provide next-generation sequencing platforms that could be used for liquid biopsy testing. These include Illumina, Inc., Thermo Fisher Scientific Inc. and other companies developing next-generation sequencing platforms that are sold directly to biopharmaceutical companies, clinical laboratories and research centers. While many of the applications for these platforms are focused on research and development applications, each of these companies has launched and could continue to commercialize products focused on the clinical oncology market. These tests could include FDA-approved diagnostic kits, which can be sold to the clients who have purchased their platforms.
Furthermore, many companies are developing information technology-based tools to support the integration of next-generation sequencing testing into the clinical setting. These companies may also use their own tests or others to develop an integrated system which could limit our access to certain networks.
We believe key competitive factors affecting our success are the price and performance of our products, evidence of clinical differentiation, support by KOLs, commercial competitiveness, turnaround time and scope and quality of payer contracts. Our Guardant Health Oncology Platform has developed strengths across five layers, which we believe form a barrier to entry and a competitive advantage. However, we cannot assure you that we will continue to compete effectively on each of those layers.
20
Intellectual property
Protection of our intellectual property is fundamental to the long-term success of our business. We seek to ensure that investments made into the development of our technology are protected by relying on a combination of patents, trademarks, copyrights, trade secrets (such as know-how), license agreements, confidentiality agreements and procedures, non-disclosure agreements, invention disclosure and assignment agreements and
other
contractual rights.
Our patent strategy is focused on seeking coverage for our core technology, our digital sequencing platform, and specific follow-on applications and implementations for detecting and monitoring cancer or other diseases by determining genetic variations in patient samples. In addition, we file for patent protection on our on-going research and development particularly into early stage cancer detection, including on pattern recognition based, for example, on analyzing our extensive patient blood sample database.
Our patent portfolio includes owned and licensed patents and patent applications, generally falling into three broad categories:
|
•
|
applications and patents relating to our digital sequencing platform, including claims directed to methods for sequencing cell-free DNA, identifying CNVs, SNVs, indels and fusions in cell-free DNA and techniques for enriching nucleic acid samples;
|
|
•
|
applications and patents relating to detecting and monitoring cancer and other diseases by determining genetic variations in biological samples; and
|
|
•
|
applications and patents relating to early-stage cancer detection.
|
Issued U.S. patents and their international counterparts currently in our patent portfolio that relate to various aspects of our technology and products are expected to expire between 2026 and 2037.
Our proprietary technology is also bolstered by our acquisition of, and procurement of licenses to, technologies developed by third parties. While we developed our digital sequencing platform internally, we believe the technologies underlying our licenses from third parties, which typically relate to improvements to next-generation sequencing technologies, are potentially valuable and of possible strategic importance to us or our competitors. Under some of these agreements, we are obligated to pay low single-digit percentage running royalties on net sales where the licensed technology is used in the product or service sold, subject to minimum annual royalties or fees in certain agreements.
Our customers and partners recognize us as being a leader in the liquid biopsy field. Thus, just as patent and trade secret protection is essential to protecting our technology, we believe that it is equally as important for us to protect our brand and identity. We have filed for trademark protection in our name, logo and initial products in the United States, including Guardant Health, Guardant360 and GuardantOMNI.
We intend to pursue additional intellectual property protection to the extent we believe it would advance our business objectives. Despite our efforts to protect our intellectual property rights, they may not be respected in the future or may be invalidated, circumvented or challenged. In addition, laws of various foreign countries where our products are or expected to be sold may not protect our intellectual property rights to the same extent as laws in the United States.
We also rely on trade secrets, including know-how, unpatented technology and other proprietary information, to maintain and strengthen our competitive position. We have determined that certain technologies, such as aspects of our sample preparation methods and some bioinformatic analysis techniques, are better kept as trade secrets. To mitigate the chance of trade secret misappropriation, it is our policy to
enter into nondisclosure and confidentiality agreements with parties who have access to our trade secrets, such as our employees, collaborators, outside scientific collaborators, consultants, advisors and other third parties. We also enter into invention disclosure and assignment agreements with our employees and consultants that obligate them to assign to us any inventions they have developed while working for us.
License agreement
In January 2017, we obtained a field exclusive, worldwide, license from KeyGene N.V., or KeyGene, under certain patent rights related to, among other things, next-generation sequencing technologies, to perform activities covered by the issued claims of the licensed patents. The license is sublicensable only with the written approval of KeyGene.
We paid KeyGene a signing fee and issued KeyGene shares of our Series D convertible preferred stock in connection with the execution of the license agreement. In October 2017, we paid KeyGene a success fee upon the achievement of a specified milestone. Additionally, we are obligated to pay to KeyGene a low single-digit percentage running royalty on net sales of licensed activities, provided that each year we are subject to a staggered minimum annual royalty. If the royalty paid by us on net sales is less than the applicable minimum annual royalty for a contract year, we must pay
21
KeyGene the difference between the minimum annual royalty and the net sales royalty we paid. Such minimum annual royalty increases each year, subject to a cap of €1,750,000. The license agreement specifies that if we challenge the validity or enforceability of a licensed patent right and elect not to terminate the license agreement, we will become obligated to pay an increased royalty to KeyGene, and our minimum annual royalty will also increase. Additionally, we are obligated to pay KeyGene a percentage of all sublicensing revenue, which percentage is in the mid-twenties.
The term of the license agreement continues until the expiration of the last to expire licensed patent. KeyGene may terminate the license agreement if we challenge the validity or enforceability of a licensed patent. KeyGene may terminate the license agreement for our bankruptcy or insolvency-related events. We may terminate the license agreement for convenience, subject to a termination fee. Either we or KeyGene may terminate the license agreement for a material breach by the other party that remains uncured 90 days or more after notice of the breach.
Government regulations
Federal and state laboratory licensing requirements
Under CLIA, a laboratory is any facility that performs laboratory testing on specimens derived from humans for the purpose of providing information for the diagnosis, prevention or treatment of disease, or the impairment of or assessment of health. CLIA requires that a laboratory hold a certificate applicable to the type of laboratory examinations it performs and that it complies with, among other things, standards covering operations, personnel, facilities administration, quality systems and proficiency testing, which are intended to ensure, among other things, that clinical laboratory testing services are accurate, reliable and timely.
To renew our CLIA certificate, we are subject to survey and inspection every two years to assess compliance with program standards. Because we are a CAP accredited laboratory, CMS does not perform this survey and inspection and relies on our CAP survey and inspection. We also may be subject to additional unannounced inspections. Laboratories performing high complexity testing are required to meet more stringent requirements than laboratories performing less complex tests. In addition, a laboratory that is certified as “high complexity” under CLIA may develop, manufacture, validate and use proprietary tests referred to as laboratory developed tests, or LDTs. CLIA requires analytical validation including accuracy, precision, specificity, sensitivity and establishment of a reference range for any LDT used in clinical testing. The regulatory and compliance standards applicable to any testing we perform may change over time and any such changes could have a material effect on our business.
CLIA provides that a state may adopt laboratory regulations that are more stringent than those under federal law, and a number of states have implemented their own more stringent laboratory regulatory requirements. For example, state laws may require that nonresident laboratories, or out-of-state laboratories, maintain an in-state laboratory license to perform tests on samples from patients who reside in that state. As a condition of state licensure, these state laws may require that laboratory personnel meet certain qualifications, specify certain quality control procedures or facility requirements or prescribe record maintenance requirements. Because our laboratory is located in the State of California, we are required to and do maintain a California state laboratory license. We maintain a current license with NYSDOH for our laboratory. In addition, our laboratory is licensed in a few states where nonresident laboratories are required to obtain state laboratory licenses under certain circumstances, including Florida, Maryland, Pennsylvania and Rhode Island. Other states may currently have or adopt similar licensure requirements in the future, which may require us to modify, delay or stop its operations in those states.
Failure to comply with CLIA certification and state clinical laboratory licensure requirements may result in a range of enforcement actions, including certificate or license suspension, limitation, or revocation, directed plan of action, onsite monitoring, civil monetary penalties, criminal sanctions, and revocation of the laboratory’s approval to receive Medicare and Medicaid payment for its services, as well as significant adverse publicity.
CLIA and state laws and regulations, operating together, sometimes limit the ability of laboratories to offer consumer-initiated testing (also known as “direct access testing”). CLIA certified laboratories are permitted to perform testing only upon the order of an “authorized person,” defined as an individual authorized under state law to order tests or receive test results, or both. Many states do not permit persons other than licensed healthcare providers to order tests. Thus, in such states, we are not able to offer direct access testing.
Regulatory framework for medical devices in the United States
Pursuant to its authority under the Federal Food, Drug and Cosmetic Act, or the FDCA, the FDA has jurisdiction over medical devices, which are defined to include, among other things, in vitro diagnostic devices, or IVDs. The FDA regulates, among other things, the research, design, development, pre-clinical and clinical testing, manufacturing, safety, effectiveness, packaging, labeling, storage, recordkeeping, pre-market clearance or approval, adverse event reporting, marketing, promotion, sales, distribution and import and export of medical devices. Unless an exemption applies, each
22
new or significantly modified medical device we seek to commercially distribute in the United States will require either a premarket notification to the FDA requesting permission for commercial distribution under Section 510(k) of the FDCA, also referred to as a 510(k) clearance, or approval from the FDA of a PMA. Both the 510(k) clearance and PMA processes can be resource intensive, expensive, and lengthy, and require payment of significant user fees.
Device classification
Under the FDCA, medical devices are classified into one of three classes-Class I, Class II or Class III-depending on the degree of risk associated with each medical device and the extent of control needed to provide reasonable assurances with respect to safety and effectiveness.
Class I includes devices with the lowest risk to the patient and are those for which safety and effectiveness can be reasonably assured by adherence to a set of FDA regulations, referred to as the General Controls for Medical Devices, which require compliance with the applicable portions of the FDA’s quality system regulation, or QSR, facility registration and product listing, reporting of adverse events and malfunctions, and appropriate, truthful and non-misleading labeling and promotional materials. Some Class I devices also require premarket clearance by the FDA through the 510(k) premarket notification process described below. Most Class I products are exempt from the premarket notification requirements.
Class II devices are those that are subject to the General Controls, as well as special controls as deemed necessary by the FDA to ensure the safety and effectiveness of the device. These special controls can include performance standards, patient registries, FDA guidance documents and post-market surveillance. Most Class II devices are subject to premarket review and clearance by the FDA. Premarket review and clearance by the FDA for Class II devices is accomplished through the 510(k) premarket notification process.
Class III devices include devices deemed by the FDA to pose the greatest risk such as life-supporting or life-sustaining devices, or implantable devices, in addition to those deemed novel and not substantially equivalent following the 510(k) process. The safety and effectiveness of Class III devices cannot be reasonably assured solely by the General Controls and special controls described above. Therefore, these devices are subject to the PMA process, which is generally more costly and time-consuming than the 510(k) process. As part of the PMA process, the applicant must submit data and information demonstrating reasonable assurance of the safety and effectiveness of the device for its intended use to the FDA’s satisfaction. Accordingly, a PMA application typically includes, but is not limited to, extensive technical information regarding device design and development, pre-clinical and clinical trial data, manufacturing information, labeling and financial disclosure information for the clinical investigators in device studies. A PMA application must also provide valid scientific evidence that demonstrates to the FDA’s satisfaction a reasonable assurance of the safety and effectiveness of the device for its intended use.
The investigational device exemption (IDE) process
In the United States, absent certain limited exceptions, human clinical trials intended to support medical device clearance or approval require an IDE application. Some types of studies deemed to present “non-significant risk” are deemed to have an approved IDE once certain requirements are addressed and institutional review board, or IRB, approval is obtained. If the device presents a “significant risk” to human health, as defined by the FDA, the sponsor must submit an IDE application to the FDA and obtain IDE approval prior to commencing the human clinical trials. The IDE application must be supported by appropriate data, such as animal and laboratory testing results, showing that it is safe to test the device in humans and that the testing protocol is scientifically sound. Generally, clinical trials for a significant risk device may begin only after the IDE application is approved by the FDA and the study protocol and informed consent are approved by appropriate IRBs at the clinical trial sites. There can be no assurance that submission of an IDE will result in the ability to commence clinical trials, and although the FDA’s approval of an IDE allows clinical testing to go forward for a specified number of subjects, it does not bind the FDA to accept the results of the trial as sufficient to prove the product’s safety and efficacy, even if the trial meets its intended success criteria.
Such clinical trials must be conducted in accordance with the FDA’s IDE regulations that govern investigational device labeling, prohibit promotion and specify an array of recordkeeping, reporting and monitoring responsibilities of study sponsors and study investigators. Such clinical trials must also comply with the FDA’s good clinical practice regulations for IRB approval and for informed consent and other human subject protections. Required records and reports are subject to inspection by the FDA. The results of clinical testing may be unfavorable, or, even if the intended safety and efficacy success criteria are achieved, may not be considered sufficient for the FDA to grant marketing approval or clearance of a product. The commencement or completion of any clinical trial may be delayed or halted, or be inadequate to support approval of a PMA application, for numerous reasons, including, but not limited to, the following:
|
•
|
the FDA or other regulatory authorities do not approve a clinical trial protocol or a clinical trial, or place a clinical trial on hold;
|
23
|
•
|
patients do not enroll in clinical trials at the rate expected;
|
|
•
|
patients do not comply with trial protocols;
|
|
•
|
patient follow-up is not at the rate expected;
|
|
•
|
patients experience adverse events;
|
|
•
|
patients die during a clinical trial, even though their death may not be related to the products that are part of the trial;
|
|
•
|
device malfunctions occur with unexpected frequency or potential adverse consequences;
|
|
•
|
side effects or device malfunctions of similar products already in the market that change the FDA’s view toward approval of new or similar PMAs or result in the imposition of new requirements or testing;
|
|
•
|
institutional review boards and third-party clinical investigators may delay or reject the trial protocol;
|
|
•
|
third-party clinical investigators decline to participate in a trial or do not perform a trial on the anticipated schedule or consistent with the clinical trial protocol, investigator agreement, investigational plan, good clinical practices, the IDE regulations or other FDA or IRB requirements;
|
|
•
|
third-party investigators are disqualified by the FDA;
|
|
•
|
we or third-party organizations do not perform data collection, monitoring and analysis in a timely or accurate manner or consistent with the clinical trial protocol or investigational or statistical plans, or otherwise fail to comply with the IDE regulations governing responsibilities, records and reports of sponsors of clinical investigations;
|
|
•
|
third-party clinical investigators have significant financial interests related to us or our study such that the FDA deems the study results unreliable, or the company or investigators fail to disclose such interests;
|
|
•
|
regulatory inspections of our clinical trials or manufacturing facilities, which may, among other things, require us to undertake corrective action or suspend or terminate our clinical trials;
|
|
•
|
changes in government regulations or administrative actions;
|
|
•
|
the interim or final results of the clinical trial are inconclusive or unfavorable as to safety or efficacy; or
|
|
•
|
the FDA concludes that our trial designs are unreliable or inadequate to demonstrate safety and efficacy.
|
The 510(k) clearance process
Under the 510(k) clearance process, the manufacturer must submit to the FDA a premarket notification, demonstrating that the device is “substantially equivalent” to a legally marketed predicate device. A predicate device is a legally marketed device that is not subject to a PMA, i.e., a device that was legally marketed prior to May 28, 1976 (pre-amendments device) and for which a PMA is not required, a device that has been reclassified from Class III to Class II or I, or a device that was previously found substantially equivalent through the 510(k) process. To be “substantially equivalent,” the proposed device must have the same intended use as the predicate device, and either have the same technological characteristics as the predicate device or have different technological characteristics and not raise different questions of safety or effectiveness than the predicate device. Clinical data is sometimes required to support substantial equivalence.
In addition, in November 2018, FDA officials announced forthcoming steps that the FDA intends to take to modernize the premarket notification pathway under Section 510(k) of the FDCA. Among other things, the FDA announced that it plans to develop proposals to drive manufacturers utilizing the 510(k) pathway toward the use of newer predicate devices. These proposals include plans to potentially sunset certain older devices that were previously used as predicates under the 510(k) clearance pathway, and to potentially publish a list of devices that have been cleared on the basis of demonstrated substantial equivalence to predicate devices that are more than 10 years old. The FDA also announced that it intends to finalize guidance to establish a premarket review pathway for “manufacturers of certain well-understood device types” as an alternative to the 510(k) clearance pathway and that such premarket review pathway would allow manufacturers to rely on objective safety and performance criteria recognized by the FDA to demonstrate substantial equivalence, obviating the need for manufacturers to compare the safety and performance of their medical devices to specific predicate devices in the clearance process. These proposals have not yet been finalized or adopted, and the FDA announced that it would seek public feedback prior to publication of any such proposals, and may work with Congress to implement such proposals through legislation.
24
After a 510(k) premarket notification is submitted, the FDA determines whether to accept it for substantive review. If it lacks necessary information for substantive review, the FDA will refuse to accept the 510(k) notification. If it is accepted for filing, the FDA begins a substantive review. By statute, the FDA is required to complete its review of a 510(k) notification within 90 days of receiving the 510(k) notification. As a practical matter, clearance often takes longer, and clearance is never assured. Although many 510(k) premarket notifications are cleared without clinical data, the FDA may require further information, including clinical data, to make a determination regarding substantial equivalence, which may significantly prolong the review process. If the FDA agrees that the device is substantially equivalent, it will grant clearance to commercially market the device.
If the FDA determines that the device is not “substantially equivalent” to a predicate device, or if the device is automatically classified into Class III, the device sponsor must then fulfill the much more rigorous pre-marketing requirements of the PMA approval process, or seek reclassification of the device through the
de novo
process. The
de novo
classification process is an alternate pathway to classify medical devices that are automatically classified into Class III but which are low to moderate risk. A manufacturer can submit a petition for direct
de novo
review if the manufacturer is unable to identify an appropriate predicate device and the new device or new use of the device presents a moderate or low risk.
De novo
classification may also be available after receipt of a “not substantially equivalent” letter following submission of a 510(k) to FDA.
After a device receives 510(k) clearance, any modification that could significantly affect its safety or effectiveness, or that would constitute a new or major change in its intended use, will require a new 510(k) clearance or, depending on the modification, could require a PMA application. The FDA requires each manufacturer to determine whether the proposed change requires a new submission in the first instance, but the FDA can review any such decision and disagree with a manufacturer’s determination. Many minor modifications are accomplished by a letter-to-file in which the manufacture documents the change in an internal letter-to-file. The letter-to-file is in lieu of submitting a new 510(k) to obtain clearance for such change. The FDA can always review these letters to file in an inspection. If the FDA disagrees with a manufacturer’s determination regarding whether a new premarket submission is required for the modification of an existing 510(k)-cleared device, the FDA can require the manufacturer to cease marketing and/or recall the modified device until 510(k) clearance or approval of a PMA application is obtained. In addition, in these circumstances, the FDA can impose significant regulatory fines or penalties for failure to submit the requisite application(s).
The PMA process
Following receipt of a PMA application, the FDA conducts an administrative review to determine whether the application is sufficiently complete to permit a substantive review. If it is not, the agency will refuse to file the PMA. If it is, the FDA will accept the application for filing and begin the review. The FDA has 180 days to review a filed PMA application, although the review of an application more often occurs over a significantly longer period of time. During this review period, the FDA may request additional information or clarification of information already provided and may issue a major deficiency letter to the applicant, requesting the applicant’s response to deficiencies communicated by the FDA.
Before approving or denying a PMA, an FDA advisory committee may review the PMA at a public meeting and provide the FDA with the committee’s recommendation on whether the FDA should approve the submission, approve it with specific conditions, or not approve it. The FDA is not bound by the recommendations of an advisory committee, but it considers such recommendations carefully when making decisions.
Prior to approval of a PMA, the FDA may conduct inspections of the clinical trial data and clinical trial sites, as well as inspections of the manufacturing facility and processes. Overall, the FDA review of a PMA application generally takes between one and three years, but may take significantly longer. The FDA can delay, limit or deny approval of a PMA application for many reasons, including:
|
•
|
the device may not be shown safe or effective to the FDA’s satisfaction;
|
|
•
|
the data from pre-clinical studies and/or clinical trials may be found unreliable or insufficient to support approval;
|
|
•
|
the manufacturing process or facilities may not meet applicable requirements; and
|
|
•
|
changes in FDA approval policies or adoption of new regulations may require additional data.
|
If the FDA evaluation of a PMA is favorable, the FDA will issue either an approval letter, or an approvable letter, the latter of which usually contains a number of conditions that must be met in order to secure final approval of the PMA. When and if those conditions have been fulfilled to the satisfaction of the FDA, the agency will issue a PMA approval letter authorizing commercial marketing of the device, subject to the conditions of approval and the limitations established in the approval letter. If the FDA’s evaluation of a PMA application or manufacturing facilities is not
25
favorable, the FDA will deny approval of the PMA or issue a not approvable letter. The FDA may also determine that additional tests or clinical trials are necessary, in which case the PMA approval may be delayed for several months or years while the trials are conducted and data is submitted in an amendment to the PMA, or the PMA is withdrawn and resubmitted when the data are available. The PMA process can be expensive, uncertain and lengthy and a number of devices for which the FDA approval has been sought by other companies have never been approved for marketing.
New PMA applications or PMA supplements are required for modification to the manufacturing process, equipment or facility, quality control procedures, sterilization, packaging, expiration date, labeling, device specifications, ingredients, materials or design of a device that has been approved through the PMA process. PMA supplements often require submission of the same type of information as an initial PMA application, except that the supplement is limited to information needed to support changes from the device covered by a PMA and may or may not require as extensive technical or clinical data or the convening of an advisory panel, depending on the nature of the proposed change.
In approving a PMA application, as a condition of approval, the FDA may require some form of post-approval study or post-market surveillance, whereby the applicant conducts a follow-up study or follows certain patient groups for a number of years and makes periodic reports to the FDA on the clinical status of those patients when necessary to protect the public health or to provide additional or longer term safety and effectiveness data for the device. The FDA may also approve a PMA application with other post-approval conditions intended to ensure the safety and effectiveness of the device, such as restrictions on labeling, promotion, sale, distribution and use. New PMA applications or PMA supplements may also be required for modifications to approved diagnostic tests, including modifications to manufacturing processes, device labeling and device design, based on the findings of post-approval studies.
FDA regulation of laboratory developed tests
Although the FDA regulates medical devices, including IVDs, the FDA has historically exercised its enforcement discretion and not enforced applicable provisions of the FDCA and FDA regulations with respect to LDTs, which are a subset of IVDs that are intended for clinical use and are developed, validated and offered within a single laboratory for use only in that laboratory. We currently market our Guardant360 test as an LDT and therefore currently do not expect the FDA to enforce its medical device regulations and the applicable FDCA provisions on Guardant360 testing.
Legislative and administrative proposals addressing oversight of LDTs were introduced in recent years and we expect that new legislative and administrative proposals will be introduced from time to time. It is possible that legislation could be enacted into law or regulations or guidance could be issued by the FDA which may result in new or increased regulatory requirements for us to continue to offer our LDTs or to develop and introduce new tests as LDTs. For example, in 2014 the FDA issued two draft guidance documents proposing a risk-based framework with respect to applying the FDA’s oversight over LDTs. The Framework Guidance stated that the FDA intended to modify its policy of enforcement discretion with respect to LDTs in a risk-based manner consistent with the existing classification of medical devices. Thus, we believe the FDA planned to begin to enforce its medical device requirements, including premarket submission requirements, on LDTs that have historically been marketed without FDA premarket review and oversight. In November 2016, the FDA announced its intention not to finalize the 2014 draft guidance to allow for further public discussion on an appropriate oversight approach to LDTs and to give congressional authorizing committees the opportunity to develop a legislative solution. In January 2017, the FDA issued a discussion paper on possible approaches to LDT regulation.
Although the FDA halted finalization of the guidance in November 2016 to allow for further public discussion on an appropriate oversight approach to LDTs and to give congressional authorizing committees the opportunity to develop a legislative solution, the FDA could ultimately modify its current approach to LDTs in a way that would subject our products marketed as LDTs to the enforcement of regulatory requirements. Moreover, legislative measures have recently been proposed in Congress that, if ultimately enacted, could provide the FDA with additional authority to require premarket review of and regulate LDTs.
Research use only devices
Our GuardantOMNI test and LUNAR assay are currently marketed as research use only, or RUO, devices. A RUO device is one that is not intended for use in a clinical investigation or for clinical diagnostic use outside an investigation and must be labeled “For Research Use Only. Not for use in diagnostic procedures.” Products that are intended for RUO and are properly labeled as RUO are exempt from compliance with the FDA requirements discussed above, including the approval or clearance and QSR requirements. A product labeled RUO but intended to be used diagnostically may be viewed by the FDA as adulterated and misbranded under the FDCA and is subject to FDA enforcement activities. The FDA may consider the totality of the circumstances surrounding distribution and use of an RUO product, including how the product is marketed, when determining its intended use.
26
EAP (Expedited Access Program)/Breakthrough Devices Program
The EAP was a voluntary program for certain medical devices that demonstrate the potential to address unmet medical needs for life threatening or irreversibly debilitating diseases or conditions that are subject to premarket submissions. Under the EAP, the FDA worked with device sponsors to try to reduce the time and cost from development to marketing decision without changing the FDA’s PMA standard of reasonable assurance of safety and effectiveness or any other standards of valid scientific evidence. Components of the EAP include priority review, more interactive review, senior management involvement, and assignment of a case manager.
Pursuant to the 21st Century Cures Act, the Breakthrough Devices provisions were added to the FDCA. The Breakthrough Devices Program is a voluntary program intended to expedite the review, development, assessment and review of certain medical devices that provide for more effective treatment or diagnosis of life-threatening or irreversibly debilitating human diseases or conditions for which no approved or cleared treatment exists or that offer significant advantages over existing approved or cleared alternatives. For Breakthrough Devices, the FDA intends to provide interactive and timely communication with the sponsor during device development and throughout the review process. FDA also intends to assign staff to be available within a reasonable time to address questions by institutional review committees concerning the conditions and clinical testing expectations applicable to the investigational use of a Breakthrough Device. In addition, all submissions for devices designated as Breakthrough Devices will receive priority review, meaning that the review of the submission is placed at the top of the appropriate review queue and receives additional review resources, as needed. The Breakthrough Devices Program superseded the EAP and the previous priority review program for medical device submissions. The FDA has indicated that all participants previously granted EAP designation will have designation as breakthrough devices, and that no separate action will necessary for sponsors of EAP-designated devices to receive breakthrough device designation for such devices.
In January 2018, we received EAP designation from the FDA for our Guardant360 test. In December 2018, we received breakthrough device designation from the FDA for our GuardantOMNI test.
Companion Diagnostics
For certain of our tests, we are pursuing development as
in vitro
companion diagnostics for use in selecting the patients that may respond to our partners’ pharmaceutical products. Companion diagnostics are regulated by the FDA as medical devices. The FDA issued a final guidance document in July 2014 addressing agency policy in relation to
in vitro
companion diagnostic tests. The guidance explains that for some drugs and therapeutic biologics, the use of a companion diagnostic test is essential for the safe and effective use of the product, such as when the use of a product is limited to a specific patient subpopulation that can be identified by using the test. According to the guidance, the FDA generally requires the therapeutic product and the companion diagnostic to be developed and approved or cleared contemporaneously. In July 2016, the FDA issued a draft guidance intended to assist sponsors of the drug therapeutic and
in vitro
companion diagnostic device on issues related to co-development of the products, and in December 2018, FDA issued a draft guidance describing considerations for the development and labeling of in vitro companion diagnostic devices to support the indicated uses of multiple drug or biological oncology products.
Pervasive and continuing FDA regulation
After a device enters commercial distribution, numerous regulatory requirements continue to apply. These include:
|
•
|
the FDA’s QSR, which requires manufacturers, including third-party manufacturers, to follow stringent design, testing, production, control, supplier/contractor selection, complaint handling, documentation and other quality assurance procedures during all aspects of the manufacturing process;
|
|
•
|
labeling regulations, unique device identification requirements and FDA prohibitions against the promotion of products for uncleared, unapproved or off-label uses;
|
|
•
|
advertising and promotion requirements;
|
|
•
|
restrictions on sale, distribution or use of a device;
|
|
•
|
PMA annual reporting requirements;
|
|
•
|
PMA approval of product modifications, or the potential for new 510(k) clearances for certain modifications to 510(k)-cleared devices;
|
|
•
|
medical device reporting regulations, which require that manufacturers report to the FDA if their device may have caused or contributed to a death or serious injury or malfunctioned in a way that would likely cause or contribute to a death or serious injury if the malfunction were to recur;
|
27
|
•
|
medical device correction and removal reporting regulations, which require that manufacturers report to the FDA field corrections and product recalls or removals if undertaken to reduce a risk to health posed by the device or to remedy a violation of the FDCA that may present a risk to health;
|
|
•
|
recall requirements, including a mandatory recall if there is a reasonable probability that the device would cause serious adverse health consequences or death;
|
|
•
|
an order of repair, replacement or refund;
|
|
•
|
device tracking requirements; and
|
|
•
|
post-market surveillance regulations, which apply when necessary to protect the public health or to provide additional safety and effectiveness data for the device.
|
The FDA has broad post-market and regulatory enforcement powers. Medical device manufacturers are subject to unannounced inspections by the FDA and other state, local and foreign regulatory authorities to assess compliance with the QSR and other applicable regulations, and these inspections may include the manufacturing facilities of any suppliers. Failure to comply with applicable regulatory requirements can result in enforcement action by the FDA, which may include sanctions such as: warning letters, fines, injunctions, consent decrees and civil penalties; unanticipated expenditures, repair, replacement, refunds, recall or seizure of our products; operating restrictions, partial suspension or total shutdown of production; the FDA’s refusal of our requests for 510(k) clearance or premarket approval of new products, new intended uses or modifications to existing products; the FDA’s refusal to issue certificates to foreign governments needed to export products for sale in other countries; and withdrawing 510(k) clearance or premarket approvals that have already been granted and criminal prosecution.
Federal and state fraud and abuse laws
We are subject to federal fraud and abuse laws such as the federal Anti-Kickback Statute, or AKS, the federal prohibition against physician self-referral, or Stark Law, and the federal false claims law, or the False Claims Act, or FCA. We are also subject to similar state and foreign fraud and abuse laws.
The AKS prohibits knowingly and willfully offering, paying, soliciting, or receiving remuneration, directly or indirectly, overtly or covertly, in cash or in kind, in return for or to induce such person to refer an individual, or to purchase, lease, order, arrange for, or recommend purchasing, leasing or ordering, any good, facility, item or service that is reimbursable, in whole or in part, under a federal healthcare program.
The Stark Law and similar state laws, including California’s Physician Ownership and Referral Act, generally prohibit, among other things, clinical laboratories and other entities from billing a patient or any governmental or commercial payer for any diagnostic services when the physician ordering the service, or any member of such physician’s immediate family, has a direct or indirect investment interest in or compensation arrangement with us, unless the arrangement meets an exception to the prohibition.
Other federal fraud and abuse laws to which we are subject include but are not limited to the federal civil and criminal false claims laws including the FCA, which imposes liability on any person or entity that, among other things, knowingly presents, or causes to be presented, a false or fraudulent claim for payment to the federal government, and the federal Civil Monetary Penalties Law, which prohibits, among other things, the offering or transfer of remuneration to a Medicare or state healthcare program beneficiary if the person knows or should know it is likely to influence the beneficiary’s selection of a particular provider, practitioner, or supplier of services reimbursable by Medicare or a state healthcare program, unless an exception applies. Under the FCA, private citizens can bring claims on behalf of the government through qui tam actions. We must also operate within the bounds of the fraud and abuse laws of the states in which we do business which may apply to items or services reimbursed by non-governmental third-party payers, including private insurers.
Efforts to ensure that our business arrangements with third parties comply with applicable laws and regulations will involve substantial costs. If our operations are found to be in violation of any of these laws or any other governmental regulations that may apply to us, we may be subject to significant civil, criminal and administrative penalties, damages, fines, imprisonment, exclusion from government-funded healthcare programs, such as Medicare and Medicaid, disgorgement, contractual damages, reputational harm, diminished profits and future earnings, additional reporting or oversight obligations if we become subject to a corporate integrity agreement or other agreement to resolve allegations of non-compliance with the law and the curtailment or restructuring of our operations, any of which could adversely affect our ability to operate our business and our results of operations. If any physicians or other healthcare providers or entities with whom we do business is found to be not in compliance with applicable laws, they may be subject to criminal, civil or administrative sanctions, including exclusions from government-funded healthcare programs.
28
Privacy and Security
Under the administrative simplification provisions of the Health Insurance Portability and Accountability Act of 1996, or HIPAA, as amended by the Health Information Technology for Economic and Clinical Health Act, or HITECH, the U.S. Department of Health and Human Services, or HHS, issued regulations that establish uniform standards governing the conduct of certain electronic healthcare transactions and requirements for protecting the privacy and security of protected health information, or PHI, used or disclosed by covered entities. Covered entities and their business associates are subject to HIPAA and HITECH. Because we are a health care provider that electronically transmits health care information to payers, we are a covered entity under HIPAA. Our subcontractors that create, receive, maintain or transmit or otherwise process PHI on our behalf must also comply with HIPAA as business associates thereunder.
HIPAA and HITECH include the privacy and security rules, breach notification requirements and electronic transaction standards. The privacy rule covers the use and disclosure of PHI by covered entities and business associates. The privacy rule generally prohibits the use or disclosure of PHI except as permitted under the rule. The rule also sets forth individual patient rights, such as the right to access or amend certain records containing his or her PHI, or to request restrictions on the use or disclosure of his or her PHI. The security rule requires covered entities and business associates to safeguard the confidentiality, integrity, and availability of electronically transmitted or stored PHI by implementing administrative, physical and technical safeguards. Under HITECH’s breach notification rule, a covered entity must notify individuals, the Secretary of the HHS, and in some circumstances, the media of breaches of unsecured PHI.
Entities, which are found to be in violation of HIPAA as the result of a breach of unsecured PHI, a complaint about their privacy practices or an audit by HHS, may be subject to significant civil and criminal fines and penalties and/or additional reporting and oversight obligations if such entities are required to enter into a resolution agreement and corrective action plan with HHS to settle allegations of HIPAA non-compliance.
In addition, we may be subject to state health information privacy, security and data breach notification laws, which may govern the collection, use, disclosure and protection of health-related and other personal information. State laws may be more stringent, broader in scope or offer greater individual rights with respect to PHI than HIPAA. California, for example, has enacted the Confidentiality of Medical Information Act, which sets forth standards in addition to HIPAA and HITECH with which all California health care providers like us must abide. In addition, the California Consumer Privacy Act, or the CCPA, was signed into law on June 28, 2018, and largely takes effect January 1, 2020. The CCPA contains new disclosure obligations for businesses that collect personal information about California residents and affords those individuals new rights relating to their personal information that may affect our ability to use personal information. The CCPA has substantial penalties for non-compliance and we continue to assess its impact on our business. Complying with these various state laws and regulations, which may differ from state to state, requires significant resources and may complicate our compliance efforts. Penalties for violation of any of these laws and regulations may include sanctions against a laboratory's licensure, as well as civil and/or criminal penalties.
U.S. healthcare reform
In the United States, there have been a number of legislative and regulatory changes at the federal and state levels which seek to reduce healthcare costs and improve the quality of healthcare. For example, in March 2010, the Patient Protection and Affordable Care Act, as amended by the Health Care and Education Affordability Reconciliation Act, or the ACA, became law. The ACA substantially changed the way healthcare is financed by both commercial and government payers and contains a number of provisions expected to impact our business and operations, some of which in ways we cannot currently predict, including those governing enrollment in federal and state healthcare programs, reimbursement changes and fraud and abuse. For instance, the ACA requires each medical device manufacturer to pay a sales tax equal to 2.3% of the price for which the medical device is sold, and began to apply to sales of taxable medical devices after December 31, 2012. Through a series of legislative amendments, the tax was suspended for 2016 through 2019. Absent further legislative action, the device excise tax will be reinstated on medical device sales starting January 1, 2020.
Since 2016 there have been efforts to repeal all or part of the ACA, and the current Presidential Administration and U.S. Congress have taken action to roll certain provisions of the ACA. For example, the Tax Cuts and Jobs Act, among other things, removes penalties for not complying with the ACA’s individual mandate to carry health insurance. The current Presidential Administration and the U.S. Congress may take further action regarding the ACA, including, but not limited to, repeal or replacement. Additionally, all or a portion of the ACA and related subsequent legislation may be modified, repealed or otherwise invalidated through judicial challenge, which could result in lower numbers of insured individuals, reduced coverage for insured individuals and adversely affect our business and results of operations.
The device excise tax imposed by the ACA and the expansion in the government’s role in the U.S. healthcare industry may result in decreased profits to us and lower reimbursement by payers for our tests, any of which may have a material adverse impact on our business, financial condition, results of operations or cash flows.
29
In addition, other legislative changes have been proposed and adopted since the ACA was enacted. On August 2, 2011, the Budget Control Act of 2011 was signed into law, which, among other things, reduced Medicare payments to providers by 2% per fiscal year, effective on April 1, 2013 and, due to subsequent legislative amendments to the statute, will remain in effect through 2027 unless additional Congressional action is taken.
We anticipate there will continue to be proposals by legislators at both the federal and state levels, regulators and commercial payers to reduce costs while expanding individual healthcare benefits. Certain of these changes could impose additional limitations on the prices we will be able to charge for our tests, the coverage of or the amounts of reimbursement available for our tests from payers, including commercial and government payers.
Employees
As of
December 31, 2018
, we had 454 full-time employees, with
345 in technology, research and development, business development and laboratory and commercial operations, and 109 in general and administrative functions. Of these full-time employees, 93 work remotely and the remainder work in our headquarters in Redwood City, California. None of our employees is represented by a labor union with respect to his or her employment with us. We consider our relationship with our employees to be good.
Corporate information
We were incorporated in Delaware in 2011 as Guardant Health, Inc.
Available information
Our website is located at
https://guardanthealth.com
. Our Annual Reports on Form 10-K, Quarterly Reports on Form 10-Q, Current Reports on Form 8-K, including their exhibits, proxy and information statements, and amendments to those reports filed or furnished pursuant to Sections 13(a), 14, and 15(d) of the Securities Exchange Act of 1934, as amended, are available through the “Investors” portion of our website free of charge as soon as reasonably practicable after we electronically file such material with, or furnish it to, the SEC. Information on our website is not part of this Annual Report on Form 10-K or any of our other securities filings unless specifically incorporated herein by reference. In addition, our filings with the SEC may be accessed through the SEC’s Interactive Data Electronic Applications system at
http://www.sec.gov.
All statements made in any of our securities filings, including all forward-looking statements or information, are made as of the date of the document in which the statement is included, and we do not assume or undertake any obligation to update any of those statements or documents unless we are required to do so by law.
30
Item 1A. Risk Factors
Our operations and financial results are subject to various risks and uncertainties including those described below. You should consider carefully the risks and uncertainties described below, in addition to other information contained in this Annual Report on Form 10-K, including our consolidated financial statements and related notes. The risks and uncertainties described below are not the only ones we face. Additional risks and uncertainties that we are unaware of, or that we currently believe are not material, may also become important factors that adversely affect our business. If any of the following risks or others not specified below materialize, our business, financial condition and results of operations could be materially and adversely affected. In that case, the trading price of our common stock could decline.
Risks related to our business and strategy
We have incurred significant losses since inception, we expect to incur losses in the future and we may not be able to generate sufficient revenue to achieve and maintain profitability.
We have incurred significant losses since our inception. For the years ended
December 31, 2018
,
2017
and
2016
, we incurred net losses of
84.3 million
,
83.2 million
and
46.1 million
, respectively. As of December 31, 2018, we had an accumulated deficit of
280.8 million
. To date, we have financed our operations principally from the sale of stock and revenue from precision oncology testing and our development services. We have devoted substantially all of our resources to the development and commercialization of our Guardant360 and GuardantOMNI tests and to research and development activities related to our LUNAR programs, including clinical and regulatory initiatives to obtain marketing approval and sales and marketing activities. We will need to generate significant additional revenue to achieve and then sustain profitability, and even if we achieve profitability, we cannot be sure that we will remain profitable for any period of time. Our failure to achieve or maintain profitability could negatively impact the value of our common stock.
We may not be able to generate sufficient revenue to achieve and maintain profitability and our current or future products may not achieve or maintain significant commercial market acceptance.
We are currently not profitable. Even if we succeed in increasing adoption of our existing services by physicians, obtaining additional coverage decisions from commercial and government payers, maintaining and creating relationships with our existing and new biopharmaceutical partners, and developing and commercializing additional products and services, we may not be able to generate sufficient revenue to achieve profitability.
We believe our commercial success is dependent upon our ability to continue to successfully market and sell our liquid biopsy tests, including our Guardant360 and GuardantOMNI tests and our future products, to continue to expand our current relationships and develop new relationships with clinicians and biopharmaceutical customers and to develop and commercialize new products based on our Guardant Health Oncology Platform. Our ability to achieve and maintain commercial market acceptance of our existing and future products will depend on a number of factors, including:
|
•
|
our ability to increase awareness of our tests and the benefits of liquid biopsy;
|
|
•
|
the rate of adoption and/or endorsement of our tests by clinicians, KOLs, advocacy groups and biopharmaceutical companies;
|
|
•
|
the timing and scope of any approval by the FDA for our tests;
|
|
•
|
our ability to obtain positive coverage decisions for our tests from additional commercial payers and to broaden the scope of indications included in such coverage decisions;
|
|
•
|
our ability to obtain reimbursement from government payers, including Medicare, which accounted for approximately 38% of our U.S. clinical test volume in
2018
;
|
|
•
|
the impact of our investments in product innovation and commercial growth;
|
|
•
|
negative publicity regarding ours or our competitors’ products resulting from defects or errors; and
|
|
•
|
our ability to further validate our technology through clinical research and accompanying publications.
|
31
We cannot assure you that we will be successful in addressing each of these criteria or other criteria that might affect the market acceptance of our products. If we are unsuccessful in achieving and maintaining market acceptance of our products, our business and results of operations will suffer.
Our operating results may fluctuate significantly, which makes our future operating results difficult to predict and could cause our operating results to fall below expectations or any guidance we may provide.
Our quarterly and annual operating results may fluctuate significantly, which makes it difficult for us to predict our future operating results. These fluctuations may occur due to a variety of factors, many of which are outside of our control, including, but not limited to:
|
•
|
the level of demand for any of our products, which may vary significantly;
|
|
•
|
the timing and cost of, and level of investment in, research, development, regulatory approval and commercialization activities relating to our products, which may change from time to time;
|
|
•
|
the volume and customer mix of our precision oncology testing;
|
|
•
|
the start and completion of projects in which our development services are utilized;
|
|
•
|
the introduction of new products or product enhancements by us or others in our industry;
|
|
•
|
coverage and reimbursement policies with respect to our products and products that compete with our products;
|
|
•
|
expenditures that we may incur to acquire, develop or commercialize additional products and technologies;
|
|
•
|
changes in governmental regulations or in the status of our regulatory approvals or applications;
|
|
•
|
future accounting pronouncements or changes in our accounting policies;
|
|
•
|
developments or disruptions in the business and operations of our clinical, commercial and other partners; and
|
|
•
|
general market conditions and other factors, including factors unrelated to our operating performance or the operating performance of our competitors.
|
Additionally, it is difficult to predict the amount we are able to collect for our tests from commercial payers. We receive reimbursement for our tests from several commercial payers for whom we are not a participating provider. Because we are not contracted with these payers, they determine the amount they are willing to reimburse us for tests. We have provided testing services to patients with many cancer types and indications, most of the time as a non-participating provider through 2018. When we have received payment as a non-participating provider, the amounts, on average, were significantly lower than for participating providers. Even when these payers have paid a claim, they may elect at any time to review previously paid claims and determine the amount they paid was too much. In these situations, the payer will typically notify us of their decision and then offset whatever amount they determine they overpaid against amounts they owe us on current claims. We have limited abilities to dispute these retroactive adjustments and we cannot predict when, or how often, a payer might engage in these reviews. A significant amount of these offsets by one or more payers in any given quarter could have a material effect on our results of operations and cause them to fall below expectations or guidance we may provide. We have sought to become a participating provider of a number of commercial payers; but that effort may not be successful and could be time-consuming and costly. Even when we have obtained positive coverage decisions for our tests from commercial payers and entered into agreements with them, such agreements typically are standard form contracts and may allow payers to terminate coverage on short notice, impose significant obligations on us and create additional regulatory and compliance risks and costs for us.
The cumulative effects of factors discussed above could result in large fluctuations and unpredictability in our quarterly and annual operating results. As a result, comparing our operating results on a period-to-period basis may not be meaningful. Investors should not rely on our past results as an indication of our future performance.
This variability and unpredictability could also result in our failing to meet the expectations of industry or financial analysts or investors for any period. If our revenue or operating results fall below the expectations of analysts or investors or below any guidance we may provide, or if the guidance we provide is below the expectations of analysts or investors,
32
the price of our common stock could decline substantially. Such a stock price decline could occur even when we have met any previously publicly stated guidance we may provide.
New product development and commercialization involve a lengthy and complex process and we may be unable to develop or commercialize new products on a timely basis, or at all.
We began offering our GuardantOMNI
test to biopharmaceutical companies
in the United States in 2017. Many biopharmaceutical companies have existing relationships with companies that develop molecular diagnostic tests, including our competitors, and may continue to use their tests instead of ours. It could be different, expensive and time-consuming for biopharmaceutical companies to switch diagnostic tests for their products. Despite our business development efforts, GuardantOMNI
test may not be accepted by our customers in next future, if at all. If we are unable to achieve commercial success for GuardantOMNI
test, we would not be able to recoup our investment in developing such test, and our business, results of operations and financial condition would be materially and adversely affected.
Products from our LUNAR programs have taken time and considerable resources to develop and are available for research use only, and we may not be able to complete development and commercialize them for clinical use on a timely basis, or at all. There can be no assurance that our LUNAR programs will produce commercial products for recurrence detection of cancer or for early detection of cancer. Before we can commercialize any new products, we will need to expend significant funds in order to:
|
•
|
conduct substantial research and development, including validation studies and clinical trials;
|
|
•
|
further develop and scale our laboratory processes to accommodate different products; and
|
|
•
|
further develop and scale our infrastructure to be able to analyze increasingly large amounts of data.
|
Our product development process involves a high degree of risk, and product development efforts may fail for many reasons, including:
|
•
|
failure of the product to perform as expected, including defects and errors;
|
|
•
|
lack of validation data; or
|
|
•
|
failure to demonstrate the clinical utility of the product.
|
Our development plan involves using data and analytical insights generated from our current products as a force multiplier of returns on research and development investment in our LUNAR programs. However, if we are unable to generate additional or compatible data and insights, then we may not be able to advance these programs as quickly, or at all, or without significant additional investment.
As we develop products, we will have to make significant investments in product development, marketing and selling resources.
Our current revenue is primarily generated from sales of our Guardant360 test and we are highly dependent on it for our success.
We began selling our Guardant360 test in the United States in 2014. Sales of our Guardant360 test accounted for primarily all of our revenue for the years ended December 31, 2016 and 2017, respectively, and a majority of our revenue for the year ended December 31, 2018. We expect that sales of our Guardant360 test will continue to account for the substantial majority of our revenue going forward. Our ability to execute our growth strategy and become profitable will therefore depend largely upon the adoption of Guardant360 test by our customers. Continued adoption and use of our Guardant360 and other tests will depend on several factors, including the prices we charge for our tests, the scope of coverage and amount of reimbursement available from third-party payers for our tests, the availability of clinical data that supports the value of our tests and the inclusion of our tests in industry treatment guidelines. We cannot assure you that Guardant360 will continue to maintain or gain market acceptance, and any failure to do so would materially harm our business and results of operations.
33
If our products, or our competitors’ liquid biopsy-based products, do not meet the expectations of patients and our customers, our operating results, reputation and business could suffer.
Our success depends on the market’s confidence that we can provide reliable, high-quality precision oncology products that will improve clinical outcomes, lower healthcare costs and enable better biopharmaceutical development. We believe that patients, clinicians and biopharmaceutical companies are likely to be particularly sensitive to product defects and errors in the use of our products, including if our products fail to detect genomic alterations with high accuracy from samples or if we fail to list or inaccurately include certain treatment options and available clinical trials in our test reports, and there can be no guarantee that our products will meet their expectations. Furthermore, if our competitors’ liquid-biopsy based products do not perform to expectations, it may result in lower confidence in liquid biopsy-based tests in general. As a result, the failure of our products or our competitors’ products to perform as expected could significantly impair our operating results and our reputation. In addition, we may be subject to legal claims arising from any defects or errors in our products.
If we are unable to support demand for Guardant360 and GuardantOMNI tests and our future products, including ensuring that we have adequate capacity to meet increased demand, or we are unable to successfully manage our anticipated growth, our business could suffer.
As our volume of test sales grows, we will need to continue to increase our workflow capacity for sample intake, customer service, billing and general process improvements, expand our internal quality assurance program and extend our platform to support comprehensive genomic analysis at a larger scale within expected turnaround times. We will need additional certified laboratory scientists and other scientific and technical personnel to process higher volumes of our precision oncology products. Portions of our process are not automated and will require additional personnel to scale. We will also need to purchase additional equipment, some of which can take several months or more to procure, setup and validate, and increase our software and computing capacity to meet increased demand. There is no assurance that any of these increases in scale, expansion of personnel, equipment, software and computing capacities or process enhancements will be successfully implemented, if at all, or that we will have adequate space in our laboratory facility to accommodate such required expansion.
As we commercialize additional products, we will need to incorporate new equipment, implement new technology systems and laboratory processes, and hire new personnel with different qualifications. Failure to manage this growth or transition could result in turnaround time delays, higher product costs, declining product quality, deteriorating customer service and slower responses to competitive challenges. A failure in any one of these areas could make it difficult for us to meet market expectations for our products, and could damage our reputation and the prospects for our business.
If we cannot maintain our current relationships, or enter into new relationships, with biopharmaceutical companies, our revenue prospects could be reduced.
Biopharmaceutical customers collaborate with us for analysis of whole blood or plasma samples for multiple applications primarily to support clinical trials, including patient identification, companion diagnostics and retrospective testing. In the years ended
December 31, 2018
,
2017
and
2016
, revenue from our top five biopharmaceutical customers as measured by revenue accounted for
36.1%
, 29.7% and 19.4% of our total revenue, respectively, with AstraZeneca PLC representing
18.0%
in
2018
,
13.4%
in
2017
and less than 10% in
2016
. The revenue attributable to our biopharmaceutical customers may also fluctuate in the future, which could have an adverse effect on our financial condition and results of operations. In addition, the termination of these relationships could result in a temporary or permanent loss of revenue. Adverse speculation about our existing or potential relationships with biopharmaceutical companies may be a catalyst for adverse speculation about us, our products and our technology, which can adversely affect our reputation and business.
Our future success depends in part on our ability to maintain relationships and to enter into new relationships with biopharmaceutical customers. This can be difficult due to many factors, including the type of biomarker support required and our ability to deliver it and our biopharmaceutical customers’ satisfaction with our products or services, internal and external constraints placed on these organizations and other factors that may be beyond our control. Furthermore, our biopharmaceutical customers may decide to decrease or discontinue their use of Guardant360 test, GuardantOMNI test or our future products due to changes in their research and product development plans, failures in their clinical trials, financial constraints, or utilization of internal testing resources or tests performed by other parties, or other circumstances outside of our control. Continued usage of our tests by particular biopharmaceutical customers may also depend on whether the partner obtains positive data in its clinical trials, is able to successfully obtain regulatory approval and subsequently commercializes a therapy for which we have partnered with them to develop a companion diagnostic, or other administrative factors that are outside our control. Some of our biopharmaceutical customers have contracted
34
with us to provide testing for large numbers of samples, which could strain our testing capacity and restrict our ability to perform tests for other customers. Furthermore, biopharmaceutical companies may decline to do business with us or decrease or discontinue their use of our tests due to their broad strategic collaboration with any of our competitors. In addition to reducing our revenue, the loss of one or more of these relationships may reduce our exposure to research and clinical trials that facilitate the collection and incorporation of new information into our platform and tests. We engage in conversations with biopharmaceutical companies regarding potential commercial opportunities on an ongoing basis. There is no assurance that any of these conversations will result in a commercial agreement, that the resulting relationship will be successful, or that clinical trials conducted as part of the engagement will produce successful outcomes. If we cannot maintain our current relationships, or enter into new relationships, with biopharmaceutical companies, our product development could be delayed and revenue and results of operations could be adversely affected.
Our payer concentration may materially adversely affect our financial condition and results of operations.
We receive a substantial portion of our revenue from a limited number of third-party commercial payers, most of which have not contracted with us to be a participating provider. For example, revenue attributable to our largest commercial payer represented
9.4%
,
12.5%
and
18.7%
of our total revenue in the years ended
December 31, 2018
,
2017
and
2016
, respectively. If this payer were to significantly reduce, or cease to pay, the amount it reimburses us for tests we perform, or if it does not reach favorable coverage and reimbursement decisions for our tests, it could have a material adverse effect on our business, financial condition and results of operations. Historically, we have experienced situations where commercial payers proactively reduced the amounts they were willing to reimburse for our tests, and in other situations, commercial payers have determined that the amounts they previously paid were too high and have sought to recover those perceived excess payments by deducting such amounts from payments otherwise being made. If our largest current commercial payers were to decide not to include us as a participating provider, cease paying us altogether, drastically reduce the amount they were willing to pay us or attempt to recover any amounts they had already paid, it could cause significant fluctuations in our quarterly results and could harm our business and results of operations.
If we cannot compete successfully with our competitors, we may be unable to increase or sustain our revenue or to achieve and then sustain profitability.
Growing understanding of the importance of biomarkers linked with therapy selection and response is leading to more companies offering services in genomic profiling. The promise of liquid biopsy is also leading to more companies attempting to enter the space and compete with us. Our main competition is from diagnostic companies with products and services to profile genes in cancers based on either single-marker or comprehensive genomic profile testing, based on next-generation sequencing in either blood or tissue.
Our competitors within the liquid biopsy space include Foundation Medicine, Inc., which was acquired by Roche Holdings, Inc. in July 2018, Roche Molecular Systems, Inc., Thermo Fisher Scientific Inc., Illumina, Inc., Personal Genome Diagnostics, Inc., Qiagen N.V. and Sysmex Inostics. In addition, GRAIL, Inc. and Natera Inc., among others, are developing early detection tests.
Competitors within the broader genomics profiling space based on tissue include laboratory companies such as Bio-Reference Laboratories, Inc., Laboratory Corporation of America and Quest Diagnostics, Inc., as well as companies such as Foundation Medicine, Inc., Caris Life Sciences, Inc. and Myriad Genetics, Inc., that sell molecular diagnostic tests for cancer to physicians and have or may develop tests which compete with Guardant360 and GuardantOMNI tests. In addition, we are aware that certain of our customers are also developing their own tests and may decide to enter our market or otherwise stop using our tests.
Some of our competitors and potential competitors may have longer operating histories; larger customer bases; greater brand recognition and market penetration; substantially greater financial, technological and research and development resources and selling and marketing capabilities; and more experience dealing with third-party payers. As a result, they may be able to respond more quickly to changes in customer requirements, devote greater resources to the development, promotion and sale of their tests than we do or sell their tests at prices designed to win significant levels of market share. We may not be able to compete effectively against these organizations. Increased competition and cost-saving initiatives on the part of governmental entities and other third-party payers are likely to result in pricing pressures, which could harm our sales, profitability or ability to gain market share. In addition, competitors may be acquired by, receive investments from or enter into other commercial relationships with larger, well-established and well-financed companies. Certain of our competitors may be able to secure key inputs from vendors on more favorable terms, devote greater resources to marketing and promotional campaigns, adopt more aggressive pricing policies and devote substantially more resources to product development than we can. In addition, companies or governments that control access to genetic testing through umbrella contracts or regional preferences could promote our competitors or prevent
35
us from performing certain services. If we are unable to compete successfully against current and future competitors, we may be unable to increase market acceptance and sales of our tests, which could prevent us from increasing our revenue or achieving profitability and could cause our stock price to decline.
In addition to developing kits, certain diagnostic companies also provide next-generation sequencing platforms that could be used for liquid biopsy testing. These include Illumina, Inc., Thermo Fisher Scientific Inc. and other companies developing next-generation sequencing platforms that are sold directly to biopharmaceutical companies, clinical laboratories and research centers. While many of the applications for these platforms are focused on research and development applications, each of these companies has launched and will continue to commercialize products focused on the clinical oncology market. These tests could include FDA-approved diagnostic kits, which can be sold to the clients who have purchased their sequencing platforms.
Furthermore, many companies are developing information technology-based tools to support the integration of next-generation sequencing testing into the clinical setting. These companies may also use their own tests or others to develop an integrated system which could limit access for us to certain networks.
The sizes of the markets for our current and future products have not been established with precision, and may be smaller than we estimate.
Our estimates of the annual total addressable markets for our current products and products under development in our LUNAR programs are based on a number of internal and third-party estimates, including, without limitation, the number of patients with late-stage, solid tumor cancer, the number of individuals who are at a higher risk for developing cancer, and the assumed prices at which we can sell tests for markets that have not been established. While we believe our assumptions and the data underlying our estimates are reasonable, these assumptions and estimates may not be correct and the conditions supporting our assumptions or estimates may change at any time, thereby reducing the predictive accuracy of these underlying factors. As a result, our estimates of the annual total addressable market for our current or future products may prove to be incorrect. If the actual number of patients who would benefit from our products, the price at which we can sell our products, or the annual total addressable market for our products is smaller than we have estimated, it may impair our sales growth and have an adverse impact on our business.
The precision oncology industry is subject to rapid change, which could make our Guardant Health Oncology Platform, Guardant360 and GuardantOMNI tests and future products we may develop, obsolete.
Our industry is characterized by rapid changes, including technological and scientific breakthroughs, frequent new product introductions and enhancements and evolving industry standards, all of which could make our current products and future products we may develop obsolete. Our future success will depend on our ability to keep pace with the evolving needs of our customers on a timely and cost-effective basis and to pursue new market opportunities that develop as a result of scientific and technological advances. In recent years, there have been numerous advances in technologies relating to the diagnosis and treatment of cancer. There have also been advances in methods used to analyze very large amounts of molecular information. We must continuously enhance our Guardant Health Oncology Platform and develop new products to keep pace with evolving standards of care. If we do not update our product offerings to reflect new scientific knowledge about cancer biology, information about new cancer therapies or relevant clinical trials, our products could become obsolete and sales of our current products and any new products we may develop could decline or fail to grow as expected.
We may be unable to manage our future growth effectively, which could make it difficult to execute our business strategy.
Since our inception, we have experienced rapid growth and anticipate further growth in our business operations. Our future growth could create strain on our organizational, administrative and operational infrastructure, including laboratory operations, quality control, customer service and sales organization management. We expect to continue to increase headcount and to hire more specialized personnel in the future as we grow our business. We will need to continue to hire, train and manage additional qualified scientists, laboratory personnel, client and account services personnel, as well as sales and marketing staff, and improve and maintain our technology to properly manage our growth. If our new hires perform poorly, if we are unsuccessful in hiring, training, managing and integrating these new employees or if we are not successful in retaining our existing employees, our business may be harmed.
In addition, we may not be able to maintain the quality or expected turnaround times of our products, or satisfy customer demand as it grows, and our business may be harmed. Our ability to manage our growth properly will also require us to continue to improve our operational, financial and management controls, as well as our reporting systems and
36
procedures. The time and resources required to implement these new systems and procedures is uncertain and could be demanding, and failure to complete this in a timely and efficient manner could adversely affect our operations.
We have limited experience in marketing and selling our products, and if we are unable to expand our sales organization to adequately address our customers’ needs, our business may be adversely affected.
We have limited experience in marketing and selling our Guardant360 and GuardantOMNI tests and other products we may develop. We may not be able to market, sell or distribute such tests or other products we may develop effectively enough to support our planned growth. We currently sell to clinicians in the United States through our own sales organization and to biopharmaceutical companies through our business development team.
Each of our target markets is large, distinctive and diverse. As a result, we believe it is necessary for our sales representatives and business development managers to have established oncology-focused expertise. Competition for such employees within the precision oncology industry is intense. We may not be able to attract and retain personnel or be able to build an efficient and effective sales organization or business development team, which could negatively impact sales and market acceptance of our products and limit our revenue growth and potential profitability.
Our expected future growth will impose significant added responsibilities on members of management, including the need to identify, recruit, maintain and integrate additional employees. Our future financial performance and our ability to commercialize our products, to increase our sales and to compete effectively will depend, in part, on our ability to manage this potential future growth effectively, without compromising quality.
Outside the United States, we established the Joint Venture with SoftBank for sales of our products throughout Asia, the Middle East and Africa. We share a measure of control of the Joint Venture, and if its sales and marketing efforts for our products in those regions are not successful, our business would be materially and adversely affected. In other territories, such as Europe, we sell our tests primarily through distributor relationships or direct contracts with hospitals. Locating, qualifying, engaging and maintaining relationships with distribution partners and local hospitals with local industry experience and knowledge will be necessary to effectively market and sell our products outside the United States. We may not be successful in finding, attracting and retaining distribution partners or hospitals, or we may not be able to enter into such arrangements on favorable terms. Sales practices utilized by any such parties that are locally acceptable may not comply with sales practices standards required under U.S. laws that apply to us, which could create additional compliance risk. If our international sales and marketing efforts are not successful, we may not achieve market acceptance for our products outside the United States, which would materially and adversely impact our business.
We rely on a limited number of suppliers or, in some cases, sole suppliers, for some of our laboratory instruments and materials and may not be able to find replacements or immediately transition to alternative suppliers.
We rely on several sole suppliers, including Illumina for certain sequencers and other equipment and materials that we use in our laboratory operations, as well as separate sole suppliers for reagents and for blood tubes. An interruption in our laboratory operations could occur if we encounter delays or difficulties in securing these laboratory instruments and materials, and if we cannot then obtain an acceptable substitute. Any such interruption could significantly and adversely affect our business, financial condition, results of operations and reputation. We rely on Illumina as the sole supplier of the sequencers, and as the sole provider of maintenance and repair services for these sequencers. Any disruption in operations of Illumina or the suppliers of our reagents or blood tubes or termination or suspension of our relationships with them could materially and adversely impact our supply chain and laboratory operations of our precision oncology platform and thus our ability to conduct our business and generate revenue.
We believe that there are only a few other equipment manufacturers that are currently capable of supplying and servicing the equipment necessary for our laboratory operations, including sequencers and various associated reagents. The use of equipment or materials furnished by these replacement suppliers would require us to alter our laboratory operations. Transitioning to a new supplier would be time-consuming and expensive, may result in interruptions in our laboratory operations, could affect the performance specifications of our laboratory operations or could require that we revalidate our tests. There can be no assurance that we will be able to secure alternative equipment, reagents and other materials, bring such equipment, reagents and materials on line, and revalidate our tests without experiencing interruptions in our workflow. In the case of an alternative supplier for Illumina, for example, there can be no assurance that replacement sequencers and various associated reagents will be available or will meet our quality control and performance requirements for our laboratory operations. If we should encounter delays or difficulties in securing, reconfiguring or integrating the equipment and reagents we require for our products or in revalidating our products, our business, financial condition, results of operations and reputation could be materially and adversely affected.
37
If our sole laboratory facility becomes damaged or inoperable or we are required to vacate our existing facility, our ability to perform our tests and pursue our research and development efforts may be jeopardized.
We currently derive the majority of our revenue from tests performed at a single laboratory facility located in Redwood City, California. Our facility and equipment could be harmed or rendered inoperable by natural or man-made disasters, including war, fire, earthquake, power loss, communications failure or terrorism, which may render it difficult or impossible for us to operate our Guardant Health Oncology Platform for some period of time. The inability to perform our tests or to reduce the backlog that could develop if our facility is inoperable, for even a short period of time, may result in the loss of customers or harm to our reputation, and we may be unable to regain those customers or repair our reputation. Furthermore, our facility and the equipment we use to perform our research and development work could be unavailable or costly and time-consuming to repair or replace. It would be difficult, time-consuming and expensive to rebuild our facility, to locate and qualify a new facility or license or transfer our proprietary technology to a third-party, particularly in light of licensure and accreditation requirements. Even if we are able to find a third party with such qualifications to perform our tests, the parties may be unable to agree on commercially reasonable terms.
We carry insurance for damage to our property and the disruption of our business, but this insurance may not cover all of the risks associated with damage or disruption to our facility and business, may not provide coverage in amounts sufficient to cover our potential losses and may not continue to be available to us on acceptable terms, if at all.
The loss of any member of our senior management team or our inability to attract and retain highly skilled scientists, clinicians and sales people could adversely affect our business.
Our success depends on the skills, experience and performance of key members of our senior management team, including Helmy Eltoukhy, our Chief Executive Officer, and AmirAli Talasaz, our President and Chief Operating Officer and the chairman of our board of directors. The individual and collective efforts of these employees will be important as we continue to develop our platform and additional products, and as we expand our commercial activities. The loss or incapacity of existing members of our executive management team could adversely affect our operations if we experience difficulties in hiring qualified successors. Our executive officers signed offer letters when first joining our company, but do not have employment agreements, and we cannot guarantee their retention for any period of time. We do not maintain “key person” insurance on any of our employees.
Our research and development programs and laboratory operations depend on our ability to attract and retain highly skilled scientists and technicians. We may not be able to attract or retain qualified scientists and technicians in the future due to the competition for qualified personnel among life science businesses, particularly near our headquarters in Redwood City, California. We also face competition from universities and public and private research institutions in recruiting and retaining highly qualified scientific personnel. In addition, we may have difficulties locating, recruiting or retaining qualified sales people. Recruiting and retention difficulties can limit our ability to support our research and development and sales programs. All of our employees are at-will, which means that either we or the employee may terminate their employment at any time.
If we were to be sued for product liability or professional liability, we could face substantial liabilities that exceed our resources.
The marketing, sale and use of our products could lead to the filing of product liability claims were someone to allege that our products identified inaccurate or incomplete information regarding the genomic alterations of the tumor or malignancy analyzed, reported inaccurate or incomplete information concerning the available therapies for a certain type of cancer, or otherwise failed to perform as designed. We may also be subject to professional liability for errors in, a misunderstanding of, or inappropriate reliance upon, the information we provide in the ordinary course of our business activities. A product liability or professional liability claim could result in substantial damages and be costly and time-consuming for us to defend.
We maintain product and professional liability insurance, but this insurance may not fully protect us from the financial impact of defending against product liability or professional liability claims. Any product liability or professional liability claim brought against us, with or without merit, could increase our insurance rates or prevent us from securing insurance coverage in the future. Additionally, any product liability or professional liability lawsuit could damage our reputation, or cause current clinical partners to terminate existing agreements and potential clinical partners to seek other partners, any of which could adversely impact our results of operations.
38
We are exposed to risks associated with our joint venture with SoftBank, and may not realize the advantages we expect from it.
We have a 50% ownership interest in the Joint Venture, Guardant Health AMEA, Inc., we formed with SoftBank in May 2018 to accelerate the commercialization of our products in Asia, the Middle East and Africa, with a near-term focus on Japan. However, the Joint Venture may not be successful in the timeframe we expect, or at all.
Additionally, SoftBank shares a measure of control over the operations of the Joint Venture. As a result, our investment in our joint venture involves risks that are different from the risks involved in owning facilities and operations independently. These risks include the possibility that our joint venture or SoftBank has economic or business interests or goals that are or become inconsistent with our economic or business interests or goals; is in a position to take action contrary to our instructions, requests, policies or objectives; subjects us to unexpected liabilities; takes actions that reduce our return on investment; or takes actions that harm our reputation or restrict our ability to run our business.
The joint venture agreement between us and SoftBank includes a put-call arrangement with respect to the shares of the Joint Venture held by SoftBank and its affiliates. Under certain circumstances and on terms specified in the joint venture agreement, including timely written notice, SoftBank has a put right to cause us to purchase all such shares, and we have a call right to purchase all such shares. Such circumstances include a material change in our business model; certain disagreements between SoftBank and us relating to the operation of the joint venture; a material breach of the joint venture agreement by the other party that goes unremedied within 20 business days; and the effectiveness of our initial public offering, or the IPO, a change in control of our company, the seventh anniversary of the formation of the Joint Venture, and each subsequent anniversary of each of the foregoing events. We may pay the purchase price for those shares in cash (including in the form of a promissory note), in shares of our common stock, or using a combination of cash and our common stock. In the event SoftBank exercises its put right, we will choose the form of consideration. In the event we exercise our call right, SoftBank will choose the form of consideration. If we are required or choose to purchase those shares from SoftBank, we could experience significant cash outflow, our other stockholders could see their holdings diluted, and our financial condition and the price of our common stock may be adversely affected.
We may acquire other businesses or form other joint ventures or make investments in other companies or technologies that could negatively affect our operating results, distract management’s attention from other business concerns, dilute our stockholders’ ownership, and significantly increase our debt, costs, expenses, liabilities and risks.
We may pursue acquisitions of businesses, technologies and assets. We also may pursue strategic alliances and additional joint ventures that leverage our Guardant Health Oncology Platform and industry experience to expand our product offerings or distribution. We have limited experience with acquisitions and forming strategic partnerships. We compete for those opportunities with others including our competitors, some of which have greater financial or operational resources than we do. We may not be able to identify suitable acquisition candidates or strategic partners, we may have inadequate access to information or insufficient time to complete due diligence, and we may not be able to complete such transactions on favorable terms, if at all. If we make any acquisitions, we may not be able to integrate these acquisitions successfully into our existing business, and we could assume unknown or contingent liabilities. Difficulties in assimilating acquired businesses include redeployment or loss of key employees and their severance, combination of teams and processes in various functional areas, reorganization or closures of facilities, relocation or disposition of excess equipment, and increased litigation, regulatory and compliance risks, any of which could be expensive and time consuming and adversely affect us. Integration of an acquired business also may disrupt our ongoing operations and require management resources that we would otherwise focus on developing our existing business. In addition, any acquisition could result in the incurrence of debt, contingent liabilities or future write-offs of intangible assets or goodwill, any of which could have a material adverse effect on our financial condition, results of operations and cash flows. We may also experience losses related to investments in other companies, which could have a material negative effect on our results of operations and financial condition. We may not realize the anticipated benefits of any acquisition, technology license, strategic alliance or joint venture.
To finance any acquisitions, joint ventures or investments, we may choose to issue shares of our common stock as consideration, which would dilute the ownership of our stockholders. Additional funds may not be available on terms that are favorable to us, or at all. If the price of our common stock is low or volatile, we may not be able to acquire other companies or fund a joint venture project using our stock as consideration.
39
International expansion of our business exposes us to business, regulatory, political, operational, financial, and economic risks associated with doing business outside of the United States.
We currently have limited international operations, but our business strategy incorporates potentially significant international expansion, including through our joint venture with SoftBank, which we formed to accelerate the commercialization of our products in Asia, the Middle East and Africa, with a near-term focus on Japan.
We plan to maintain distributor relationships, to conduct physician and patient association outreach activities, to extend laboratory capabilities and to expand payer relationships, outside of the United States, both directly and through our joint venture. Doing business internationally involves a number of risks, including:
|
•
|
multiple, conflicting and changing laws and regulations such as privacy regulations, tax laws, export and import restrictions, economic sanctions and embargoes, employment laws, regulatory requirements and other governmental approvals, permits and licenses;
|
|
•
|
failure by us, our distributors, our local partners or the Joint Venture with SoftBank to obtain regulatory approvals for the use of our products in various countries;
|
|
•
|
additional potentially blocking or relevant third-party patent or other intellectual property rights;
|
|
•
|
complexities and difficulties in obtaining intellectual property protection and enforcing our intellectual property;
|
|
•
|
difficulties in staffing and managing foreign operations;
|
|
•
|
complexities associated with managing multiple payer reimbursement regimes, government payers, or patient self-pay systems;
|
|
•
|
logistics and regulations associated with shipping blood samples, including infrastructure conditions and transportation delays;
|
|
•
|
limits in our ability to penetrate international markets if we are not able to perform our tests locally;
|
|
•
|
financial risks, such as longer payment cycles, difficulty collecting accounts receivable, the impact of local and regional financial crises on demand and payment for our products and exposure to foreign currency exchange rate fluctuations, currency controls and cash repatriation restrictions;
|
|
•
|
natural disasters, political and economic instability, including wars, terrorism, and political unrest, outbreak of disease, boycotts, curtailment of trade and other business restrictions; and
|
|
•
|
regulatory and compliance risks that relate to maintaining accurate information and control over sales and distributors’ activities that may fall within the purview of the U.S. Foreign Corrupt Practices Act, or FCPA, its books and records provisions, or its anti-bribery provisions.
|
Any of these factors could significantly harm our future international expansion and operations and, consequently, our revenue and results of operations.
40
We could be adversely affected by violations of the FCPA and other anti-bribery laws.
International customers may currently order Guardant360 and GuardantOMNI tests, either directly from us or through the Joint Venture with SoftBank, and we are subject to the FCPA, which prohibits companies and their intermediaries from making payments in violation of law to non-U.S. government officials for the purpose of obtaining or retaining business or securing any other improper advantage. Our reliance on independent distributors to sell Guardant360 and GuardantOMNI tests internationally demands a high degree of vigilance in maintaining our policy against participation in corrupt activity, because these distributors could be deemed to be our agents and we could be held responsible for their actions. Other U.S. companies in the medical device and biopharmaceutical field have faced criminal penalties under the FCPA for allowing their agents to deviate from appropriate practices in doing business with these individuals. We are also subject to similar anti-bribery laws in the jurisdictions in which we operate, including the United Kingdom’s Bribery Act of 2010, which also prohibits commercial bribery and makes it a crime for companies to fail to prevent bribery. These laws are complex and far-reaching in nature, and, as a result, we cannot assure you that we would not be required in the future to alter one or more of our practices to be in compliance with these laws or any changes in these laws or the interpretation thereof. Any violations of these laws, or allegations of such violations, could disrupt our operations, involve significant management distraction, cause us to incur significant costs and expenses, including legal fees, and result in a material adverse effect on our business, prospects, financial condition and results of operations. We could also suffer severe penalties, including criminal and civil penalties, disgorgement and other remedial measures.
Our employees, principal investigators, consultants and commercial partners may engage in misconduct or other improper activities, including non-compliance with regulatory standards and requirements and insider trading.
We are exposed to the risk of fraud or other misconduct by our employees, principal investigators, consultants and commercial partners. Misconduct by these parties could include intentional failures to comply with the regulations of the FDA, CMS and non-U.S. regulators, comply with healthcare fraud and abuse laws and regulations in the United States and abroad, report financial information or data accurately or disclose unauthorized activities to us. In particular, sales, marketing, and business arrangements in the healthcare industry are subject to extensive laws and regulations intended to prevent fraud, misconduct, kickbacks, self-dealing and other abusive practices. These laws and regulations may restrict or prohibit a wide range of pricing, discounting, marketing and promotion, sales commission, customer incentive programs and other business arrangements. Such misconduct could also involve the improper use of information obtained in the course of clinical studies, which could result in regulatory sanctions and cause serious harm to our reputation. We currently have a code of conduct applicable to all of our employees, but it is not always possible to identify and deter employee misconduct, and our code of conduct and the other precautions we take to detect and prevent this activity may not be effective in controlling unknown or unmanaged risks or losses, or in protecting us from governmental investigations, lawsuits or other actions stemming from a failure to comply with these laws or regulations. If any such actions are instituted against us, and we are not successful in defending ourselves or asserting our rights, those actions could result in the imposition of significant civil, criminal and administrative penalties, including, without limitation, damages, monetary fines, individual imprisonment, disgorgement of profits, possible exclusion from participation in Medicare, Medicaid and other federal healthcare programs or from coverage of commercial payers, contractual damages, reputational harm, diminished profits and future earnings, additional reporting or oversight obligations if we become subject to a corporate integrity agreement or other agreement to resolve allegations of non-compliance with the law and curtailment or restructuring of our operations, which could have a significantly adverse impact on our business. Whether or not we are successful in defending against such actions, we could incur substantial costs and expenses, including legal fees, and divert the attention of management from the operation of our business.
We may need to raise additional capital to fund our existing operations, develop our platform, commercialize new products or expand our operations.
Based on our current business plan, we believe our current cash, cash equivalents and marketable securities, including the net proceeds from the IPO, and anticipated cash flow from operations, will be sufficient to meet our anticipated cash requirements over at least the next 12 months from the date of this report. If our available cash balances, net proceeds from the IPO and anticipated cash flow from operations are insufficient to satisfy our liquidity requirements including because of lower demand for our products, lower than currently expected rates of reimbursement from commercial third-party payers and government payers or other risks described in this report, we may seek to sell equity or convertible securities, enter into a credit facility or another form of third-party funding, or seek other debt financing.
41
We may consider raising additional capital in the future to expand our business, to meet existing obligations, to pursue acquisitions or strategic investments, to take advantage of financing opportunities or for other reasons, including to:
|
•
|
increase our sales and marketing efforts to drive market adoption of Guardant360 and GuardantOMNI tests and address competitive developments;
|
|
•
|
fund development and marketing efforts of products from our LUNAR programs or any other future products we may develop;
|
|
•
|
expand our technologies into other types of cancer management and detection products;
|
|
•
|
acquire, license or invest in technologies;
|
|
•
|
acquire or invest in complementary businesses or assets; and
|
|
•
|
finance capital expenditures and general and administrative expenses.
|
Our present and future funding requirements will depend on many factors, including:
|
•
|
our ability to achieve revenue growth;
|
|
•
|
our rate of progress in establishing payer coverage and reimbursement arrangements with domestic and international commercial payers and government payers;
|
|
•
|
the cost of expanding our laboratory operations and product offerings, including our sales and marketing efforts;
|
|
•
|
our rate of progress in, and costs of our sales and marketing activities associated with, establishing adoption of and reimbursement for our Guardant360 and GuardantOMNI tests;
|
|
•
|
our rate of progress in, and costs of our research and development activities associated with, products in research and early development;
|
|
•
|
the effect of competing technological and market developments;
|
|
•
|
costs related to our international expansion; and
|
|
•
|
the potential costs of and delays in product development as a result of any existing or new regulatory oversight applicable to our products.
|
The various ways we could raise additional capital carry potential risks. If we raise funds by issuing equity or convertible securities, dilution to our stockholders could result. Any preferred equity securities issued also could provide for rights, preferences or privileges senior to those of holders of our common stock. If we raise funds by issuing debt securities, those debt securities would have rights, preferences and privileges senior to those of holders of our common stock. The terms of debt securities issued or borrowings pursuant to a credit agreement could impose significant restrictions on our operations. If we raise funds through collaborations and licensing arrangements, we might be required to relinquish significant rights to our platform technologies or products or grant licenses on terms that are not favorable to us. These alternatives of raising additional capital may not be available to us on acceptable or commercially reasonable terms, if at all, or in amounts sufficient to meet our needs. The failure to obtain any required future financing may require us to reduce or curtail existing operations and could contribute to negative market perceptions about us or our securities.
We are dependent on third parties for the collection of blood samples for our tests.
We rely on third-party phlebotomy providers, including physician offices, to collect blood samples for our tests. Our current third-party phlebotomy providers may refuse to continue to collect samples for us in the future, in particular if they have agreements or arrangements with one of our competitors to collect samples for their tests, or if the phlebotomy provider is owned or controlled by a laboratory that offers tests that compete with ours. There has been a trend towards consolidation of independent phlebotomy providers. Independent phlebotomy providers, once acquired by our competitors, may terminate their relationships with us. If our patients are unable to readily access a phlebotomy provider to collect a blood sample for our tests, we may be unable to compete effectively with other laboratories that have greater access to phlebotomy providers and our business, financial condition and results of operations may be harmed.
42
In addition, if third-party phlebotomy providers fail to adequately and properly obtain and collect viable blood samples from patients and to properly package and ship the samples to us, our patients and their physicians may experience problems and delays in receiving test results, which could lead to dissatisfaction with our tests, therefore harming our reputation and adversely affecting our business, financial condition and results of operations. Similarly, our contracts with third-party phlebotomy providers to collect blood could be scrutinized under federal and state healthcare laws such as the federal Anti-Kickback Statute, or AKS, and the federal law prohibiting physician self-referral, or Stark Law, to the extent these services to us are deemed to provide a financial benefit to or relieve a financial burden for a potential referral source, or are subsequently found not to be for fair market value. If our operations are found to be in violation of any of these laws and regulations, we may be subject to administrative, civil and criminal penalties, damages, fines, individual imprisonment, exclusion from participation in federal healthcare programs or from coverage of commercial payers, refunding of payments received by us, and curtailment or cessation of our operations, any of which could harm our reputation and adversely affect our business, financial condition and results of operations.
We rely on commercial courier delivery services to transport samples to our laboratory facility in a timely and cost-efficient manner and if these delivery services are disrupted, our business will be harmed.
Our business depends on our ability to quickly and reliably deliver test results to our customers. Blood samples are typically received within days from the United States and outside the United States for analysis at our Redwood City, California facility. Disruptions in delivery services to transport samples to that facility, whether due to labor disruptions, bad weather, natural disaster, terrorist acts or threats or for other reasons could adversely affect specimen integrity and our ability to process samples in a timely manner, delay our provision of test results to our customers, and ultimately our reputation and our business. In addition, if we are unable to continue to obtain expedited delivery services to transport samples to us on commercially reasonable terms, our operating results may be adversely affected.
Our ability to use our net operating loss carryforwards and certain other tax attributes may be limited.
We have incurred net losses since our inception and we may never achieve or sustain profitability. Generally, losses incurred will carry forward until such losses expire (for losses generated prior to January 1, 2018) or are used to offset future taxable income, if any. Under Sections 382 and 383 of the Internal Revenue Code of 1986, as amended, or the IRC, if a corporation undergoes an “ownership change,” generally defined as a greater than 50 percentage point change (by value) in its equity ownership by certain stockholders over a three-year period, the corporation’s ability to use its pre-change net operating loss, or NOL, carryforwards and other pre-change tax attributes (such as research tax credits) to offset its post-change income or taxes may be limited. We have not completed a study to assess whether an ownership change for purposes of Section 382 or 383 has occurred, or whether there have been multiple ownership changes since our inception. For purposes of Section 382 or 383, we may have experienced ownership changes in the past and may experience ownership changes in the future as a result of shifts in our stock ownership (some of which shifts are outside our control). As a result, if we earn net taxable income, our ability to use our pre-change NOL carryforwards to offset such taxable income will be subject to limitations. Similar provisions of state tax law may also apply to limit our use of accumulated state tax attributes. Therefore, if we attain profitability, we may be unable to use a material portion of our NOL carryforwards and other tax attributes, which could adversely affect our future cash flows. In addition, the Tax Cuts and Jobs Act of 2017, or TCJA imposes a reduction to the maximum deduction allowed for NOLs generated in tax years beginning after December 31, 2017, but allow such NOLs to be carried forward indefinitely. These changes may adversely affect our future cash flow.
Changes in tax laws may adversely affect us.
Changes in applicable tax laws and regulations, or their interpretation and application, could have an adverse effect on our business, financial condition and results of operations. For example, the TCJA made significant changes to the U.S. Internal Revenue Code, including a reduction in the corporate tax rate, implementation of a territorial tax regime, and limitations on certain corporate deductions and credits. The reduction in the corporate tax rate under the TCJA resulted in a provisional $21.3 million reduction in our deferred tax assets in 2017, which was offset by a corresponding reduction in the valuation allowance. Generally, future changes in applicable tax laws and regulations, or their interpretation and application, could have an adverse effect on our business, financial condition and results of operations.
We depend on information technology systems, and any failure of these systems could harm our business.
We depend on information technology and telecommunications systems for significant elements of our operations, including our laboratory information management system, our computational biology system, our knowledge management system, our customer reporting and our GuardantConnect software platform. We have installed, and expect to expand, a number of enterprise software systems that affect a broad range of business processes and functional areas,
43
including for example, systems handling human resources, financial controls and reporting, contract management, regulatory compliance and other infrastructure operations. In addition to the aforementioned business systems, we intend to extend the capabilities of both our preventative and detective security controls by augmenting the monitoring and alerting functions, the network design and the automatic countermeasure operations of our technical systems. These information technology and telecommunications systems support a variety of functions, including laboratory operations, test validation, sample tracking, quality control, customer service support, billing and reimbursement, research and development activities, scientific and medical curation and general administrative activities. In addition, our third-party billing and collections provider depends upon technology and telecommunications systems provided by outside vendors.
Information technology and telecommunications systems are vulnerable to damage from a variety of sources, including telecommunications or network failures, malicious human acts and natural disasters. Moreover, despite network security and back-up measures, some of our servers are potentially vulnerable to physical or electronic break-ins, computer viruses and similar disruptive problems. For example, in the past few months, we identified security incidents involving an unauthorized actor obtaining access to our email system and sending phishing messages. Despite the precautionary measures we have taken in response to such incidents and to prevent other unanticipated problems that could affect our information technology and telecommunications systems, failures or significant downtime of our information technology or telecommunications systems or those used by our third-party service providers could prevent us from performing our comprehensive genomic analysis, preparing and providing reports to pathologists and oncologists, billing payers, processing reimbursement appeals, handling patient or physician inquiries, conducting research and development activities and managing the administrative aspects of our business. Any disruption or loss of information technology or telecommunications systems on which critical aspects of our operations depend could have an adverse effect on our business and our reputation, and we may be unable to regain or repair our reputation.
Despite the security and maintenance measures we and our vendors and distributors have in place to help protect against system failures, our systems, and those of our vendors and distributors, remain vulnerable to delays, disruptions, data corruption, programming and/or human errors or other similar events, such as those due to system updates, natural disasters, malicious attacks, accidents, power disruptions, telecommunications failures, acts of terrorism or war, computer viruses, physical or electronic break-ins or similar events. Such incidents may disrupt our operations, result in losses, damage our reputation, and expose us to the risks of litigation and liability (including regulatory liability); and may have a material adverse effect on our business, results of operations and financial condition.
Risks related to our highly regulated industry
We conduct business in a heavily regulated industry, and changes in regulations or violations of regulations may, directly or indirectly, reduce our revenue, adversely affect our results of operations and financial condition, and harm our business.
The clinical laboratory testing industry is highly regulated, and there can be no assurance that the regulatory environment in which we operate will not change significantly and adversely to us in the future. Areas of the regulatory environment that may affect our ability to conduct business include, without limitation:
|
•
|
federal and state laws applicable to test ordering, documentation of tests ordered, billing practices and claims payment and/or regulatory agencies enforcing those laws and regulations;
|
|
•
|
federal and state health care fraud and abuse laws;
|
|
•
|
federal and state laboratory anti-mark-up laws;
|
|
•
|
coverage and reimbursement levels by Medicare, Medicaid, other governmental payers and private insurers;
|
|
•
|
restrictions on coverage of and reimbursement for tests;
|
|
•
|
federal and state laws governing laboratory testing, including CLIA, and state licensing laws;
|
|
•
|
federal and state laws and enforcement policies governing the development, use and distribution of diagnostic medical devices, including laboratory developed tests, or LDTs;
|
|
•
|
federal, state and local laws governing the handling and disposal of medical and hazardous waste;
|
44
|
•
|
federal and state Occupational Safety and Health Administration rules and regulations; and
|
|
•
|
the Health Insurance Portability and Accountability Act of 1996, or HIPAA, and similar state data privacy and security laws.
|
In particular, the laws and regulations governing the marketing of clinical laboratory tests are extremely complex and in many instances there are no sufficient regulatory or judicial interpretations of these laws and regulations. For example, some of our clinical laboratory tests are, or may in the future be, actively regulated by the FDA pursuant to the medical device provisions of the Federal Food, Drug and Cosmetic Act, or FDCA. The FDA defines a medical device to include any instrument, apparatus, implement, machine, contrivance, implant, in vitro reagent or other similar or related article, including a component, part or accessory, intended for use in the diagnosis of disease or other conditions, or in the cure, mitigation, treatment or prevention of disease, in man or other animals. Our clinical laboratory tests are in vitro diagnostic products that are considered by the FDA to be medical devices. Among other things, pursuant to the FDCA and its implementing regulations, the FDA regulates the research, design, testing, manufacturing, safety, labeling, storage, recordkeeping, premarket clearance or approval, marketing and promotion and sales and distribution of medical devices in the United States to ensure that medical devices distributed domestically are safe and effective for their intended uses. In addition, the FDA regulates the import and export of medical devices. If we do not comply with these requirements or later become subject to these requirements and fail to adequately comply, our business may be harmed.
Certain of our tests are currently marketed as LDTs, and future changes in FDA enforcement discretion for LDTs could subject our operations to much more significant regulatory requirements.
The FDA has a policy of enforcement discretion with respect to LDTs whereby the FDA does not actively enforce its regulatory requirements for such tests. However, the FDA has stated its intention to modify its enforcement discretion policy with respect to LDTs. If there are changes in FDA policy, or if the FDA disagrees that we are marketing our tests as LDTs within the scope of its policy of enforcement discretion, we may become subject to extensive regulatory requirements and may be required to stop selling our existing tests or launching any other tests we may develop and to conduct additional clinical trials or take other actions prior to continuing to market our tests. This could significantly increase the costs and expenses of conducting, or otherwise harm, our business.
We currently market our Guardant360 test as an LDT and may in the future market our other tests as LDTs. While we believe that we are currently in material compliance with applicable laws and regulations as historically enforced by the FDA, we cannot assure you that the FDA will agree with our determination. A determination that we have violated these laws and regulations, or a public announcement that we are being investigated for possible violations, could adversely affect our business, prospects, results of operations and financial condition.
On July 31, 2014, the FDA notified Congress of its intent to modify, in a risk-based manner, its policy of enforcement discretion with respect to LDTs. On October 3, 2014, FDA issued two draft guidances, entitled “Framework for Regulatory Oversight of Laboratory Developed Tests (LDTs),” or the Framework Guidance, and “FDA Notification and Medical Device Reporting for Laboratory Developed Tests (LDTs).” The Framework Guidance stated that the FDA intended to modify its policy of enforcement discretion with respect to LDTs in a risk-based manner consistent with the existing classification of medical devices. Thus, pursuant to the Framework Guidance, the FDA planned to begin to enforce its medical device requirements, including premarket submission requirements, on LDTs that have historically been marketed without FDA premarket review and oversight. Although the FDA halted finalization of the guidance in November 2016 to allow for further public discussion on an appropriate oversight approach to LDTs and to give congressional authorizing committees the opportunity to develop a legislative solution, the FDA could ultimately modify its current approach to LDTs in a way that would subject our products marketed as LDTs to the enforcement of regulatory requirements. If and when such changes to the regulatory framework occur, we could for the first time be subject to enforcement of regulatory requirements as a device manufacturer such as registration and listing requirements, medical device reporting requirements and the requirements of the FDA’s Quality System Regulation. Additionally, if and when the FDA begins to actively enforce its premarket submission regulations with respect to LDTs, we may be required to obtain premarket clearance or approval for our Guardant360 test and other products we plan to commercialize as LDTs. Moreover, legislative measures have recently been proposed in Congress that, if ultimately enacted, could provide the FDA with additional authority to require premarket review of and regulate LDTs.
There is no guarantee that the FDA will grant 510(k) clearance or a premarket approval of our products and failure to obtain necessary clearances or approvals for our products would adversely affect our ability to grow our business.
Before we begin to label and market our products for use as clinical diagnostics in the United States, including as companion diagnostics, we may be required to obtain either 510(k) clearance or a premarket approval, or PMA, from
45
the FDA, unless an exemption applies or FDA exercises its enforcement discretion and refrains from enforcing its medical device requirements. For example, the FDA has a policy of refraining from enforcing such requirements with respect to LDTs, which the FDA considers to be a type of
in vitro
diagnostic test that is designed, manufactured and used within a single laboratory. Although we market Guardant360 test as an LDT pursuant to FDA’s policy of enforcement discretion, we currently intend to seek FDA approval of Guardant360 test through a PMA application and we may pursue clearances or approvals from the FDA for our other tests, including future products we may develop.
The process of obtaining a PMA is much more rigorous, costly, lengthy and uncertain than the 510(k) clearance process. In the PMA process, the FDA must determine that a proposed device is safe and effective for its intended use based, in part, on extensive data, including, but not limited to, technical, pre-clinical, clinical trial, manufacturing and labeling data. In the 510(k) clearance process, the FDA must determine that a proposed device is “substantially equivalent” to a device legally on the market, known as a “predicate” device, in order to clear the proposed device for marketing. To be “substantially equivalent,” the proposed device must have the same intended use as the predicate device, and either have the same technological characteristics as the predicate device or have different technological characteristics and not raise different questions of safety or effectiveness than the predicate device. Clinical data is sometimes required to support a substantial equivalence determination.
The FDA’s 510(k) clearance process usually takes from three to twelve months from submission, but may last longer. The process of obtaining a PMA generally takes from one to three years, or even longer, from the time the PMA is submitted to the FDA until an approval is obtained. Any delay or failure to obtain necessary regulatory approvals or clearances would have a material adverse effect on our business, prospects, financial condition and results of operations.
The FDA can delay, limit or deny clearance or approval of a device for many reasons, including:
|
•
|
our inability to demonstrate to the satisfaction of the FDA that our products are safe or effective for their intended uses;
|
|
•
|
the disagreement of the FDA with the design, conduct or implementation of our clinical trials or the analysis or interpretation of data from our pre-clinical studies or clinical trials;
|
|
•
|
serious and unexpected adverse effects experienced by participants in our clinical trials;
|
|
•
|
the data from our pre-clinical studies and clinical trials may be insufficient to support clearance or approval, where required;
|
|
•
|
our inability to demonstrate that the clinical and other benefits of any of our tests outweigh the risks;
|
|
•
|
an advisory committee, if convened by the FDA, may recommend against approval of our PMA or other application for any of our tests or may recommend that the FDA require, as a condition of approval, additional pre-clinical studies or clinical trials, limitations on approved labeling or distribution and use restrictions, or even if an advisory committee, if convened, makes a favorable recommendation, the FDA may still not approve the test;
|
|
•
|
the FDA may identify deficiencies in our marketing application, and in our manufacturing processes, facilities or analytical methods or those of our third-party contract manufacturers;
|
|
•
|
the potential for approval policies or regulations of the FDA to change significantly in a manner rendering our clinical data or regulatory filings insufficient for the clearance or approval; and
|
|
•
|
the FDA may audit our clinical trial data and conclude that the data is not sufficiently reliable to support a PMA application.
|
If we are unable to obtain clearance or approval for any tests for which we plan to seek clearance or approval, our business may be harmed.
Modifications to our FDA-cleared or approved products may require new 510(k) clearances or premarket approvals, or may require us to cease marketing or recall the modified products until clearances are obtained.
For any product approved pursuant to a PMA, we are required to seek supplemental approval for many types of changes to the approved product, for which we will need to determine whether a PMA supplement or other regulatory filing is needed or whether the change may be reported via the PMA Annual Report. Similarly, any modification to a 510(k)-
46
cleared device that could significantly affect its safety or effectiveness, or that would constitute a major change in its intended use, design, or manufacture, requires new 510(k) clearance or, possibly, approval of a new PMA. The FDA requires us to make this determination in the first instance, but the FDA may review and may not agree with our determination. If the FDA disagrees with our determination and requires us to seek approvals or clearances for modifications to our previously approved or cleared products, for which we concluded that new approvals or clearances are unnecessary, we may be required to cease marketing or distribution of our products or to recall the modified product until we obtain the approval or clearance, and we may be subject to significant regulatory fines or penalties.
If third-party payers, including commercial payers and government healthcare programs, do not provide coverage of, or adequate reimbursement for, our tests, our business and results of operations will be negatively affected.
Our revenue and commercial success depend on achieving broad coverage and reimbursement for our tests from payers, including both commercial and government payers. If payers do not provide coverage of, or do not provide adequate reimbursement for, a substantial portion of our tests, we may need to seek payment from the patient, which may adversely affect demand for our tests. Coverage determinations by a payer may depend on a number of factors, including but not limited to a payer’s determination that a test is appropriate, medically necessary or cost-effective. If we are unable to provide payers with sufficient evidence of the clinical utility and validity of our test, they may not provide coverage, may provide limited coverage or may terminate coverage, which will adversely affect our revenues and our financial condition. To the extent that more competitors enter our markets, the availability of coverage and the reimbursement rate for our tests may decrease as we encounter pricing pressure from our competitors.
Each payer makes its own decision as to whether to provide coverage for our tests, whether to enter into a contract with us and how much it will reimburse for a test. Negotiating with payers could be a time-consuming and costly process, and payers often insist on their standard form contracts, which typically contain requirements that apply to ordering physicians. There is no guarantee that a payer will provide adequate coverage or reimbursement for our tests or that we can reach an agreement with the payer on reasonable terms without being subject to additional regulatory and compliance risks. In addition, the determination by a payer to cover or not cover our tests and the amount it will reimburse for them are often made on an indication-by-indication basis. In cases where there is no coverage, or we do not have a contracted rate for reimbursement as a participating provider, with the payer, the patient is typically responsible for a greater share of the cost of the test, which may result in further delay of our revenue, increase our collection costs or decrease the likelihood of collection. We maintain a financial assistance program, the Guardant Access Fee Assistance Program, under which we provide tests without charge or at a significant discount to certain patients meeting income based eligibility standards. This may result in payers requiring us to prove eligibility of such patients to pay no or reduced test fees, and if the payers disagree with such eligibility, they may recoup amounts previously paid for such tests, terminate coverage or seek to renegotiate the rate for reimbursement.
Our claims for reimbursement from payers may be denied upon submission, and we may need to take additional steps to receive payment, such as appealing the denials. Such appeals and other processes are time-consuming and expensive, and may not result in payment. Payers may perform audits of historically paid claims and attempt to recoup funds years after the funds were initially distributed if the payers believe the funds were paid in error or determine that our tests were medically unnecessary. If a payer audits our claims and issues a negative audit finding, and we are not able to overturn the audit findings through appeal, the subsequent recoupment may result in a material adverse effect on our revenue. Additionally, in some cases commercial payers for whom we are not a participating provider may elect at any time to review claims previously paid and determine the amount they paid was excessive. In these situations, the payer typically notifies us of its decision and then offsets the amount it determines to be overpaid against amounts it owes us on current claims. We do not have a mechanism to dispute these retroactive adjustments, and we cannot predict when, or how often, a payer might engage in these reviews.
When we contract with a payer to serve as a participating provider, reimbursements by the payer are generally made pursuant to a negotiated fee schedule and are limited to only covered indications or where prior approval has been obtained. Becoming a participating provider generally results in higher reimbursement for covered indications and lack of reimbursement for non-covered indications. As a result, the impact of becoming a participating provider with a specific payer will vary based on historical reimbursement as a non-participating provider for that payer, and in some situations, the benefit of increased reimbursement for covered testing could be offset by the loss of reimbursement on tests for non-covered indications previously received when we served as a non-participating provider.
Although we are a participating provider with some commercial payers, including Cigna, Priority Health, and multiple Blue Cross Blue Shield regional plans, certain large, national commercial payers, including Anthem, Aetna and Humana, have issued non-coverage policies that treat both tissue and liquid CGP testing, including our Guardant360 test, as experimental or investigational. If we are not successful in obtaining coverage from such payers, including in reversing
47
their existing non-coverage policies, or if other payers issue similar non-coverage policies, our business and results of operations could be materially and adversely affected.
In March 2018, CMS issued the NGS Decision Memorandum for Medicare beneficiaries. In the NGS Decision Memorandum, CMS states that next-generation sequencing, or NGS, tests, such as our Guardant360 test, are covered by Medicare nationally, when: (1) performed in a CLIA-certified laboratory, (2) ordered by a treating physician, (3) the patient meets certain clinical and treatment criteria, including having recurrent, relapsed, refractory, metastatic, or advanced stages III or IV cancer, (4) the test is approved or cleared by the FDA as a companion in vitro diagnostic for an FDA approved or cleared indication for use in that patient’s cancer, and (5) results are provided to the treating physician for management of the patient using a report template to specify treatment options. The NGS Decision Memorandum also states that each Medicare Administrative Contractor, or MAC, may provide local coverage of other next-generation sequencing tests for cancer patients only when the test is performed by a CLIA-certified laboratory, ordered by a treating physician and the patient meets the same clinical and treatment criteria required of nationally covered next-generation sequencing tests under the NGS Decision Memorandum. An NGS test is not covered by Medicare when cancer patients do not have the above-noted indications for cancer under either national or local coverage criteria. In July 2018, Palmetto GBA, the MAC responsible for administering Medicare’s Molecular Diagnostic Services Program, or MolDx, issued a local coverage determination, or LCD, for our Guardant360 test for non-small cell lung cancer patients who meet certain clinical and treatment criteria. We worked with Palmetto GBA to obtain this positive coverage decision through the submission of a detailed dossier of analytical and clinical data to substantiate that the test meets Medicare’s medical necessity requirements. Noridian Healthcare Solutions, the MAC responsible for adjudicating claims in California, where our laboratory is located, and a participant in the MolDx, recently finalized its LCD for Guardant360 test. In September 2018, we began to submit claims to Medicare for reimbursement for Guardant360 clinical testing performed for Medicare beneficiaries covered under the LCDs, and in October 2018, we began to receive payments from Medicare for these clinical tests.
Under Medicare, payment for laboratory tests like ours is generally made under the Clinical Laboratory Fee Schedule, or CLFS, with payment amounts assigned to specific procedure billing codes. In April 2014, Congress passed the Protecting Access to Medicare Act of 2014, or PAMA, which included substantial changes to the way in which clinical laboratory services are paid under Medicare. Under PAMA, laboratories that receive the majority of their Medicare revenue from payments made under the CLFS were required to report to CMS, beginning in 2017 and every three years thereafter (or annually for “advanced diagnostic laboratory tests”), private payer payment rates and volumes for each test they perform. CMS uses this data to calculate a weighted median payment rate for each test, which is used to establish revised Medicare CLFS reimbursement rates for the test. Laboratories that fail to report the required payment information may be subject to substantial civil monetary penalties. As we have begun billing Medicare for our tests, we are subject to reporting requirements under PAMA and the Medicare rate for our tests will be calculated in the future based on our private payer rates. For clinical diagnostic laboratory tests furnished on or after January 1, 2018, their Medicare CLFS reimbursement rates are established upon these reported private payer rates. If we are unable to obtain and maintain favorable reimbursement rates from commercial payers for our tests, this may adversely affect the tests' Medicare reimbursement rates. We believe that our tests do not meet the current definition of advanced diagnostic laboratory tests, and we will be required to report private payer rates for our tests every three years; but this determination may change. It is unclear what impact new Medicare pricing structures, such as those adopted under PAMA, may have on our business, financial condition, results of operations or cash flows.
The U.S. federal government continues to show significant interest in pursuing health care reform and reducing health care costs. Similarly, private payers may seek to reduce costs by reducing coverage or reimbursement for our tests. Any government-adopted reform measures or changes to commercial payer coverage and policies could cause significant pricing pressure on reimbursement for health care products and services, including our tests, which could decrease demand for our tests, and adversely affect our sales, revenue and financial condition.
Some payers have implemented, or are in the process of implementing, laboratory benefit management programs, often using third-party benefit managers to manage these programs. The stated goals of these programs are to help improve the quality of outpatient laboratory services, support evidence-based guidelines for patient care and lower costs. The impact on laboratories, such as us, of active laboratory benefit management by third parties is unclear, and we expect that it would have a negative impact on our revenue in the short term. Payers may resist reimbursement for our tests in favor of less expensive tests, require pre-authorization for our tests, or impose additional pricing pressure on and substantial administrative burden for reimbursement for our tests. We expect to continue to focus substantial resources on increasing adoption of, and coverage and reimbursement for, our current tests and any future tests we may develop. We believe it may take several years to achieve broad coverage and adequate contracted reimbursement with a majority of payers for our tests. However, we cannot predict whether, under what circumstances, or at what price levels payers
48
will cover and reimburse our tests. If we fail to establish and maintain broad adoption of, and coverage and reimbursement for, our tests, our ability to generate revenue could be harmed and our business and prospects could suffer.
Our products may in the future be subject to product recalls. A recall of our products, either voluntarily or at the direction of the FDA or another governmental authority, or the discovery of serious safety issues with our products, could have a significant adverse impact on us.
The FDA has the authority to require the recall of commercialized products that are subject to FDA regulation in the event of material deficiencies or defects in design or manufacture. The authority to require a recall must be based on an FDA finding that there is reasonable probability that the device would cause serious, adverse health consequences or death. We may also, on our own initiative, recall a product. The FDA requires that certain classifications of recalls be reported to the FDA within ten working days after the recall is initiated. If we obtain FDA approval for one of our tests, a government-mandated or voluntary recall by us or one of our distributors could occur as a result of an unacceptable risk to health, component failures, malfunctions, manufacturing errors, design or labeling defects or other deficiencies and issues. Recalls of any of our products could divert managerial and financial resources and impair our ability to produce our products in a cost-effective and timely manner in order to meet our customers’ demands, which would have an adverse effect on our reputation, results of operations and financial condition. We may be subject to liability claims, may be required to bear costs or may take other actions that may have a negative impact on our future sales and our ability to generate profits. Companies are required to maintain certain records of recalls, even if they are not reportable to the FDA. We may initiate voluntary recalls involving our products in the future that we determine do not require notification of the FDA. If the FDA disagrees with our determinations, the FDA could require us to report those actions and take enforcement action for failing to report the recalls when they were conducted. A future recall announcement could harm our reputation with customers and negatively affect our sales and financial condition.
If we initiate a correction or removal for one of our tests, issue a safety alert or undertake a field action or recall to reduce a risk to health imposed by the test, this could lead to increased scrutiny by the FDA and our customers regarding the quality and safety of our tests and to negative publicity, including FDA alerts, press releases or administrative or judicial actions. Furthermore, circulation of any such negative publicity could harm our reputation, be used by competitors against us in competitive situations and cause customers to delay purchase decisions or cancel orders.
Clinical development involves a lengthy and expensive process with an uncertain outcome, and results of earlier studies and trials may not be predictive of future trial results.
Our ongoing research and development and clinical trial activities are subject to extensive regulation and review by numerous governmental authorities both in the United States and abroad. We are currently conducting pre-and post-market clinical studies of some of our tests. In the future we may conduct clinical trials to support approvals of new products. The commencement of clinical trials may be delayed due to insufficient patient enrollment, which is a function of many factors, including the size of the patient population, the nature of the protocol, the proximity of patients to clinical sites and the trial eligibility criteria. Clinical studies may need to be conducted in compliance with FDA regulations or the FDA may take enforcement action. The data collected from these clinical studies may ultimately be used to support marketing authorization for these products. Even if our clinical trials are completed as planned, we cannot be certain that their results will support our marketing claims or that the FDA or foreign authorities will agree with our conclusions regarding them. Success in pre-clinical studies and early clinical trials does not ensure that later clinical trials will be successful, and we cannot be sure that the later trials will replicate the results of prior trials and studies. The clinical trial process may fail to demonstrate that our tests are safe and effective for the proposed indicated uses, which could cause us to abandon or delay development of our tests. Any delay or termination of our clinical trials will delay the filing of our marketing applications. Many of the factors that may cause or lead to a delay in the commencement or completion of clinical trials may also ultimately lead to delay or denial of regulatory clearance or approval, and any such event may render us unable to commercialize our tests and generate revenue.
We may find it necessary to engage contract research organizations to perform data collection and analysis and other aspects of our clinical trials, which might increase the cost and complexity of our trials. We may also depend on clinical investigators, medical institutions and contract research organizations to perform the trials, and would control only certain aspects of their activities. Nevertheless, we would be responsible for ensuring that each of our trials is conducted in accordance with the applicable protocol, legal, regulatory and scientific standards, and our reliance on these third parties would not relieve us of our regulatory responsibilities. We and our third-party contractors are required to comply with good clinical practices, or GCPs, which are regulations and guidelines enforced by the FDA, and comparable regulations enforced by foreign regulatory authorities for products in clinical development. Regulatory authorities enforce these GCPs through periodic inspections of trial sponsors, principal investigators and trial sites. If we or any third-party contractor fails to comply with applicable GCPs, the clinical data generated in clinical trials may be deemed
49
unreliable and the FDA or comparable foreign regulatory authorities may require us to perform additional clinical trials before clearing or approving our marketing applications. A failure to comply with these regulations may require us to repeat clinical trials, which would delay the regulatory clearance or approval process. In addition, if these parties do not successfully carry out their contractual duties or obligations or meet expected deadlines, or if the quality, completeness or accuracy of the clinical data they obtain is compromised due to the failure to adhere to our clinical protocols or for other reasons, our clinical trials may have to be extended, delayed or terminated.
Many of these factors would be beyond our control. We may not be able to undertake additional trials, repeat trials or enter into new arrangements with third parties without undue delays or considerable expenditures. If there are delays in testing or clearances or approvals as a result of the failure to perform by third parties, our research and development costs would increase and we may not be able to obtain regulatory clearance or approval for our tests. In addition, we may not be able to establish or maintain relationships with these parties on favorable terms, if at all. Each of these outcomes would harm our ability to market our tests, generate revenue or to achieve sustained profitability.
Our “research use only” products could become subject to more onerous regulation by the FDA or other regulatory agencies in the future, which could increase our costs and delay our commercialization efforts, thereby materially and adversely affecting our business and results of operations.
In the United States, our GuardantOMNI test is currently labeled and sold as for research use only, or RUO, and not for clinical or diagnostic purposes. We sell this product to a variety of parties, including biopharmaceutical companies. Our LUNAR assay is now also available for RUO by biopharmaceutical and academic researchers. Because RUO products are not intended for use in clinical practice and cannot be advertised or promoted for clinical or diagnostic claims, they are exempt from many regulatory requirements otherwise applicable to medical devices. In particular, while the FDA regulations require that RUO products be labeled, “For Research Use Only. Not for use in diagnostic procedures,” such products are not subject to the FDA's pre- and post-market controls for medical devices.
A significant change in the laws governing RUO products or how they are enforced may require us to change our business model in order to maintain compliance. For instance, in November 2013 the FDA issued a guidance document entitled “Distribution of In Vitro Diagnostic Products Labeled for Research Use Only or Investigational Use Only,” or the RUO Guidance, which highlights the FDA’s interpretation that distribution of RUO products with any labeling, advertising or promotion that suggests that clinical laboratories can validate the test through their own procedures and subsequently offer it for clinical diagnostic use as an LDT is in conflict with RUO status. The RUO Guidance further articulates the FDA’s position that any assistance offered in performing clinical validation or verification, or similar specialized technical support, to clinical laboratories, is in conflict with RUO status. If we engage in any activities that the FDA deems to be in conflict with the RUO status held by any of our products so labeled, we may be subject to immediate, severe and broad FDA enforcement action that would adversely affect our ability to continue operations. Accordingly, if the FDA finds that we are distributing our RUO products in a manner that is inconsistent with its RUO Guidance, we may be forced to stop distribution of our RUO tests until we are in compliance, which would reduce our revenue, increase our costs and adversely affect our business, prospects, results of operations and financial condition.
In the event that the FDA requires or we apply for marketing authorization of our RUO products in the future, there can be no assurance that the FDA will grant any clearance or approval requested by us in a timely manner, or at all.
Even if we receive regulatory approval of our Guardant360 test, our GuardantOMNI test, or any of our other products, we will continue to be subject to extensive regulatory oversight.
Medical devices are subject to extensive regulation by the FDA in the United States and by regulatory agencies in other territories where we do business. If any of our products are approved by the FDA or other regulatory agencies, we will be required to timely file various reports. If these reports are not filed timely, regulators may impose sanctions and sales of our products may suffer, and we may be subject to product liability or regulatory enforcement actions, all of which could harm our business. In addition, as a condition of approving a PMA application, the FDA may also require some form of post-approval study or post-market surveillance, whereby the applicant conducts a follow-up study or follows certain patient groups for a number of years and makes periodic reports to the FDA on the clinical status of those patients when necessary to protect the public health or to provide additional safety and effectiveness data for the device. The product labeling must be updated and submitted in a PMA supplement as results, including any adverse event data from the post-approval study, become available. Failure to conduct or timely complete post-approval studies in compliance with applicable regulations , update the product labeling, or comply with other post-approval requirements could result in withdrawal of approval of the PMA, which would harm our business and revenue.
50
The FDA and the Federal Trade Commission, or FTC, also regulate the advertising and promotion of medical devices to ensure that their promotional claims made are consistent with the applicable marketing authorizations, that there are adequate and reasonable data to substantiate the claims, and that the promotional labeling and advertising is neither false nor misleading in any respect. If the FDA or FTC determines that any of our promotional claims are false, misleading, not substantiated or not permissible, we may be subject to enforcement actions and we may be required to revise our promotional claims and make other corrections or restitutions.
The FDA, state and foreign authorities have broad enforcement powers. Our failure to comply with applicable regulatory requirements could result in enforcement action by the FDA, state or foreign regulatory agencies, which may include any of the following sanctions:
|
•
|
adverse publicity, warning letters, untitled letters, fines, injunctions, consent decrees and civil penalties;
|
|
•
|
repair, replacement, refunds, recalls, termination of distribution, administrative detention or seizures of our products;
|
|
•
|
operating restrictions, partial suspension or total shutdown of production;
|
|
•
|
customer notifications or repair, replacement or refunds;
|
|
•
|
refusing our requests for clearances or approvals of new products, new intended uses or modifications to existing products;
|
|
•
|
withdrawals of current clearances or approvals, resulting in prohibitions on sales of our products;
|
|
•
|
refusal to issue certificates needed to export products for sale in other countries; and
|
|
•
|
criminal prosecution.
|
Any of these sanctions could also result in higher than anticipated costs or lower than anticipated sales of our products and have a material adverse effect on our reputation, business, results of operations and financial condition.
In addition, the FDA may change its clearance and approval policies, adopt additional regulations or revise existing regulations, or take other actions which may prevent or delay approval or clearance of our future products under development. For example, in November 2018, FDA officials announced forthcoming steps that the FDA intends to take to modernize the premarket notification pathway under Section 510(k) of the FDCA. Among other things, the FDA announced that it plans to develop proposals to drive manufacturers utilizing the 510(k) pathway toward the use of newer predicates. These proposals include plans to potentially sunset certain older devices that were used as predicates under the 510(k) clearance pathway, and to potentially publish a list of devices that have been cleared on the basis of demonstrated substantial equivalence to predicate devices that are more than 10 years old. The FDA also announced that it intends to finalize guidance to establish a premarket review pathway for “manufacturers of certain well-understood device types” as an alternative to the 510(k) clearance pathway and that such premarket review pathway would allow manufacturers to rely on objective safety and performance criteria recognized by the FDA to demonstrate substantial equivalence, obviating the need for manufacturers to compare the safety and performance of their medical devices to specific predicate devices in the clearance process. These proposals have not yet been finalized or adopted, and the FDA announced that it would seek public feedback prior to publication of any such proposals, and may work with Congress to implement such proposals through legislation. Accordingly, it is unclear the extent to which any proposals, if adopted, could impose additional regulatory requirements on us that could delay our ability to obtain new 510(k) clearances, increase the costs of compliance, or restrict our ability to maintain our current clearances, or otherwise create competition that may negatively affect our business. If we are slow or unable to adapt to changes in existing regulations or the adoption of new requirements or policies, or if we are not able to maintain regulatory compliance, we may lose any marketing clearance or approval that we may have obtained, which would adversely affect our business, prospects, financial condition and results of operations.
We also cannot predict the likelihood, nature or extent of government regulation that may arise from future legislation or administrative or executive action, either in the United States or abroad. For example, certain policies of the Trump administration may impact our business and industry. In particular, the Trump administration has taken several executive actions, including the issuance of a number of executive orders, that could impose significant burdens on, or otherwise materially delay, the FDA’s ability to engage in regulatory and oversight activities such as implementing statutes through rulemaking, issuance of guidance and review and approval of marketing applications. It is difficult to predict how these
51
executive actions, will be implemented, and the extent to which they will affect the FDA’s ability to exercise its regulatory authority. If these executive actions impose constraints on the FDA’s ability to engage in regulatory and oversight activities, including approving our applications, in the normal course, our business may be negatively impacted.
Failure to comply with federal, state and foreign laboratory licensing requirements and the applicable requirements of the FDA or any other regulatory authority, could cause us to lose the ability to perform our tests, experience disruptions to our business, or become subject to administrative or judicial sanctions.
We are subject to the Clinical Laboratory Improvement Amendments, or CLIA, a federal law that regulates clinical laboratories that perform testing on specimens derived from humans for the purpose of providing information for the diagnosis, prevention or treatment of disease. CLIA regulations establish specific standards with respect to personnel qualifications, facility administration, proficiency testing, quality control, quality assurance and inspections. Any testing subject to CLIA regulation must be performed in a CLIA certified laboratory. CLIA certification is also required in order for us to be eligible to bill state and federal healthcare programs, as well as commercial payers, for our tests. We have a current CLIA certificate to perform our tests at our laboratory in Redwood City, California. To maintain this certificate, we are subject to survey and inspection every two years. Moreover, CLIA inspectors may make random inspections of our laboratory from time to time.
We are also required to maintain a California clinical laboratory license to perform testing in California. California laboratory laws establish standards for day-to-day operation of our clinical laboratory in Redwood City, California, including the training and skills required of personnel and quality control. In addition, some other states require our California laboratory to be licensed in the state in order to test specimens from those states. In addition to California, our laboratory is licensed in Florida, Maryland, Pennsylvania, Rhode Island and New York. Although we have obtained licenses from states where we believe we are required to be licensed, it is possible that other states we are not aware of currently require out-of-state laboratories to obtain licensure in order to test specimens from the state, and that other states may adopt similar requirements in the future.
We may also be subject to regulations in foreign jurisdictions as we seek to expand international utilization of our tests or as such jurisdictions adopt new licensure requirements, which may require review of our tests in order to offer them or may have other limitations such as restrictions on the transport of specimens necessary for us to perform our tests that may limit our ability to make our tests available outside of the United States. Complying with licensure requirements in new jurisdictions may be expensive, time-consuming and subject us to significant and unanticipated delays.
Failure to comply with applicable clinical laboratory licensure requirements may result in a range of enforcement actions, including suspension, limitation or revocation of our CLIA certificate and/or state licenses, imposition of a directed plan of action, on-site monitoring, civil monetary penalties, criminal sanctions, inability to receive reimbursement from Medicare, Medicaid and commercial payers, as well as significant adverse publicity. Any sanction imposed under CLIA, its implementing regulations, or state or foreign laws or regulations governing clinical laboratory licensure or our failure to renew our CLIA certificate, a state or foreign license or accreditation, could have a material adverse effect on our business, financial condition and results of operations. Even if we were able to bring our laboratory back into compliance, we could incur significant expenses and potentially lose revenue in doing so.
In order to test specimens from New York, LDTs must be approved by the New York State Department of Health, or NYSDOH, on a product-by-product basis before they are offered, and Guardant360 test has been approved by NYSDOH. We will need to seek NYSDOH approval of any future LDTs we develop and want to offer for clinical testing to New York residents, and there can be no assurance that we will be able to obtain such approval. As a result, we are subject to periodic inspection by the NYSDOH and are required to demonstrate ongoing compliance with NYSDOH regulations and standards. To the extent NYSDOH identified any non-compliance and we are unable to implement satisfactory corrective actions to remedy such non-compliance, the State of New York could withdraw approval for our tests.
The College of American Pathologists, or CAP, maintains a clinical laboratory accreditation program. While not required to operate a CLIA-certified laboratory, many private insurers require CAP accreditation as a condition to contracting with clinical laboratories to cover their tests. In addition, some countries outside the United States require CAP accreditation as a condition to permitting clinical laboratories to test samples taken from their citizens. In 2014, we obtained CAP accreditation for our Redwood City, California laboratory, and in order to maintain such accreditation, we are subject to survey for compliance with CAP standards every two years. Failure to maintain CAP accreditation could have a material adverse effect on the sales of our tests and the results of our operations.
52
We are subject to numerous federal and state healthcare statutes and regulations; complying with such laws pertaining to our business is an expensive and time-consuming process, and any failure to comply could result in substantial penalties and a material adverse effect to our business and results of operations.
Our operations are subject to other extensive federal, state, local and foreign laws and regulations, all of which are subject to change. These laws and regulations may include, among others:
|
•
|
the AKS, which prohibits knowingly and willfully offering, paying, soliciting or receiving remuneration, directly or indirectly, overtly or covertly, in cash or in kind (e.g. provision of free or discounted goods, services or items), in return for or to induce such person to refer an individual, or to purchase, lease, order, arrange for or recommend purchasing, leasing or ordering, any good, facility, item or service that is reimbursable, in whole or in part, under a federal healthcare program. The term ‘‘remuneration’’ has been broadly interpreted to include anything of value, such as phlebotomy kits. Although there are a number of statutory exceptions and regulatory safe harbors protecting certain common activities from prosecution or other regulatory sanctions, the exceptions and safe harbors are drawn narrowly, and practices that involve remuneration that are alleged to be intended to induce referrals, purchases or recommendations of covered items or services may be subject to scrutiny if they do not qualify for an exception or safe harbor. Failure to meet all of the requirements of a particular applicable statutory exception or regulatory safe harbor does not make the conduct
per se
illegal under the AKS. Instead, the legality of the arrangement will be evaluated on a case-by-case basis based on a cumulative review of all its facts and circumstances. Several courts have held that if any one purpose of an arrangement involving remuneration is to induce referrals of federal healthcare covered business, the AKS has been violated. Moreover, a person or entity does not need to have actual knowledge of the statute or specific intent to violate it in order to have committed a violation. Violations are subject to civil monetary penalties of up to $100,000 for each violation, plus up to three times the remuneration involved. Violations of the AKS may also result in criminal penalties, including fines of up to $100,000 and imprisonment of up to ten years, and exclusion from Medicare, Medicaid or other governmental healthcare programs;
|
|
•
|
the Stark Law, which prohibits a physician from making a referral for certain designated health services covered by the Medicare or Medicaid program, including laboratory and pathology services, if the physician or an immediate family member of the physician has a financial relationship with the entity providing the designated health services and prohibits that entity from billing, presenting or causing to be presented a claim for the designated health services furnished pursuant to the prohibited referral, unless an exception applies. Sanctions for violating the Stark Law include denial of payment, civil monetary penalties of up to $24,728 per claim submitted and exclusion from the federal health care programs. The statute also provides for a penalty of up to $164,992 for a circumvention scheme;
|
|
•
|
the federal Civil Monetary Penalties Law, which prohibits, among other things, the offering or transfer of remuneration to a Medicare or state healthcare program beneficiary if the person knows or should know it is likely to influence the beneficiary’s selection of a particular provider, practitioner or supplier of services reimbursable by Medicare or a state healthcare program, unless an exception applies. Violations can result in civil monetary penalties of up to $20,000 for each wrongful act;
|
|
•
|
federal and state “Anti-Markup” rules, which, among other things, typically prohibit a physician or supplier billing for clinical or diagnostic tests (with certain exceptions) from marking up the price of a purchased test performed by another physician or supplier that does not “share a practice” with the billing physician or supplier;
|
|
•
|
the federal Physician Payments Sunshine Act, which requires certain manufacturers of drugs, biologicals, and kits, medical devices or supplies that require premarket approval by or notification to the FDA, and for which payment is available under Medicare, Medicaid or the Children’s Health Insurance Program to report annually to CMS, information related to (i) payments and other transfers of value to physicians and teaching hospitals, and (ii) ownership and investment interests in such manufacturers held by physicians and their immediate family members. Failure to submit required information may result in civil monetary penalties of $11,278 per failure up to an aggregate of $169,170 per year (or up to an aggregate of $1.112 million per year for “knowing failures”), for all payments, transfers of value or ownership or investment interests that are not timely, accurately, and completely reported in an annual submission, and may result in liability under other federal laws or regulations;
|
|
•
|
the federal government may bring a lawsuit under the False Claims Act, or the FCA, against any party whom it believes has knowingly or recklessly presented, or caused to be presented, a false or fraudulent request for payment from the federal government, or who has made a false statement or used a false record to get a claim for payment approved. The federal government and a number of courts have taken the position that claims presented in violation of certain other statutes, including the AKS or the Stark Law, can also be considered a violation of the FCA based on the theory that a provider impliedly certifies compliance with all applicable laws, regulations, and other rules
|
53
when submitting claims for reimbursement. A FCA violation may provide the basis for the imposition of administrative penalties as well as exclusion from participation in governmental healthcare programs, including Medicare and Medicaid. A number of states including California have enacted laws that are similar to the federal FCA. Private individuals can bring FCA “
qui tam
” actions, on behalf of the government and such individuals, commonly known as “whistleblowers,” may share in amounts paid by the entity to the government in fines or settlement. When an entity is determined to have violated the FCA, the government may impose civil fines and penalties ranging from $11,181 to $22,363 for each false claim, plus treble damages, and exclude the entity from participation in federal healthcare programs;
|
•
|
the HIPAA fraud and abuse provisions, which created federal criminal statutes that prohibit, among other things, knowingly and willfully executing, or attempting to execute, a scheme to defraud any healthcare benefit program, including private insurers, knowingly and willfully embezzling or stealing from a healthcare benefit program, willfully obstructing a criminal investigation of a healthcare offense, and knowingly and willfully falsifying, concealing or covering up a material fact or making any materially false, fictitious or fraudulent statement in connection with the delivery of or payment for healthcare benefits, items or services. A person or entity does not need to have actual knowledge of the statute or specific intent to violate it in order to have committed a violation;
|
|
•
|
HIPAA, as amended by the Health Information Technology for Economic and Clinical Health Act, or HITECH, and their implementing regulations, also as amended, which imposes certain regulatory and contractual requirements regarding the privacy, security and transmission of protected health information, or PHI, and similar state health information privacy and data breach notification laws;
|
|
•
|
federal and state laws related to, among other things, unlawful schemes to defraud, excessive fees for services, unlawful trade practices, insurance fraud, kickbacks, patient inducement and statutory or common law fraud restrict the provision of products, services or items for free or at reduced charge to government or non-government healthcare program beneficiaries. These laws and regulations relating to the provision of items or services for free are complex and are subject to interpretation by the courts and by government agencies;
|
|
•
|
other federal and state fraud and abuse laws, such as state anti-kickback, self-referrals, false claims and anti-markup laws, any of which may extend to services reimbursable by any payer, including private insurers;
|
|
•
|
state laws that prohibit other specified practices, such as billing physicians for tests that they order; providing tests at no or discounted cost to induce adoption; waiving co-insurance, co-payments, deductibles or other amounts owed by patients; billing a state healthcare program at a price that is higher than what is charged to other payers; or employing, exercising control over or splitting fees with licensed medical professionals; and
|
|
•
|
similar foreign laws and regulations in the countries in which we operate or may operate in the future.
|
As a clinical laboratory, our business practices may face additional scrutiny from various government agencies such as the Department of Justice, the U.S. Department of Health and Human Services Office of Inspector General, or OIG, and CMS. Certain arrangements between clinical laboratories and referring physicians have been identified in fraud alerts issued by the OIG as implicating the AKS. The OIG has stated that it is particularly concerned about these types of arrangements because the choice of laboratory and the decision to order laboratory tests typically are made or strongly influenced by the physician, with little or no patient input. Moreover, the provision of payments or other items of value by a clinical laboratory to a referral source could be prohibited under the Stark Law unless the arrangement meets all criteria of an exception. The government has been active in enforcement of these laws against clinical laboratories.
Numerous states have enacted laws prohibiting business corporations, such as us, from practicing medicine and from employing or engaging physicians and other medical professionals (generally referred to as the prohibition against the corporate practice of medicine), which could include physician laboratory directors. These laws are designed to prevent interference in the medical decision-making process by anyone who is not a licensed medical professional. For example, California’s Medical Board has indicated that determining the appropriate diagnostic tests for a particular condition and taking responsibility for the ultimate overall care of a patient, including making treatment options available to the patient, would constitute the unlicensed practice of medicine if performed by an unlicensed person. Violation of these laws may result in sanctions and civil or criminal penalties. It is possible that governmental authorities may conclude that our business practices, including our consulting and advisory board arrangements with physicians and other healthcare providers, some of whom receive stock or stock options as compensation for services provided, do not comply with current or future corporate practice of medicine statutes, regulations, agency guidance or case law.
54
The growth and international expansion of our business may increase the potential of violating applicable laws and regulations. The risk is further increased by the fact that many such laws and regulations have not been fully interpreted by the regulatory authorities or the courts, and their provisions are open to a variety of interpretations. Efforts to ensure that our internal operations and business arrangements with third parties comply with applicable laws and regulations will involve substantial costs. Any action brought against us for violation of these or other laws or regulations, even if we successfully defend against it, could cause us to incur significant legal expenses and divert our management’s attention from the operation of our business. Any of the foregoing consequences could seriously harm our business and our financial results. To the extent our business operations are found to be in violation of any of these laws or regulations, we may be subject to significant civil, criminal and administrative penalties, including, without limitation, damages, monetary fines, individual imprisonment, disgorgement of profits, possible exclusion from participation in Medicare, Medicaid and other healthcare programs, contractual damages, reputational harm, diminished profits and future earnings, additional reporting or oversight obligations if we become subject to a corporate integrity agreement or other agreement to resolve allegations of non-compliance with the law and curtailment or restructuring of our operations, any of which could adversely affect our ability to operate our business and pursue our strategy. If any of the healthcare providers or other parties with whom we interact or may interact in the future, are found not to be in compliance with applicable laws and regulations, they may be subject to criminal, civil or administrative sanctions, including exclusions from participation in various healthcare programs, which could also negatively affect our business or revenue.
If the validity of an informed consent from patients regarding our test was challenged, we could be forced to stop offering our products or using our resources, our business and results of operations would be negatively affected.
We offer our tests to physicians and to biopharmaceutical companies in connection with clinical trials. We have implemented measures to ensure that data and biological samples that we receive have been collected from subjects who have provided appropriate informed consent. We also act as a sponsor of clinical trials in connection with the development of our tests , which are frequently conducted in collaboration with different parties. We seek to receive approval from an ethical review board, or institutional review board, or IRB, for projects that meet the definition of “human subjects research,” which includes review and approval of processes for subject informed consent and authorization for use of personal information or waivers thereof. We and our biopharmaceutical partners could conduct clinical trials in a number of different countries. When we are acting as a vendor in connection with a clinical trial sponsored by our biopharmaceutical partners, we rely upon them to comply with the requirements to obtain the subject’s informed consent and to comply with applicable laws and regulations. The collection of data and samples in many different countries results in complex legal questions regarding the adequacy of informed consent and the status of genetic material under a large number of different legal systems. Those informed consents could be challenged and prove invalid, unlawful, or otherwise inadequate for our purposes. Any such findings against us, or our biopharmaceutical partners, could force us to stop accessing or using data and samples or servicing or conducting clinical trials, which would hinder our product offerings or development. We could also become involved in legal actions, which could consume our management and financial resources.
We may be subject to fines, penalties, licensure requirements, or legal liability, if it is determined that through our test reports we are practicing medicine without a license.
Our test reports delivered to physicians provide information regarding FDA-approved therapies and clinical trials that oncologists may use in making treatment decisions for their patients. We make members of our organization available to discuss the information provided in the reports. Certain state laws prohibit the practice of medicine without a license. Our customer service representatives and medical affairs team provide support to our customers, including assistance in interpreting the test report results. A governmental authority or other parties could allege that the identification of available therapies and clinical trials in our reports and the related customer service we provide constitute the practice of medicine. A state may seek to have us discontinue the inclusion of certain aspects of our test reports or the related services we provide, or subject us to fines, penalties, or licensure requirements. Any determination that we are practicing medicine without a license may result in significant liability to us, and our business and reputation would be harmed.
Our billing and claim processing are complex and time-consuming, and any delay in submitting claims or failure to comply with applicable billing requirements could hinder collection and have an adverse effect on our revenue.
Billing for our tests is complex, time-consuming and expensive. Depending on the billing arrangement and applicable law, we bill various payers, such as Medicare, Medicaid, health plans, insurance companies and patients, all of which may have different billing requirements. Several factors make the billing process complex, including:
|
•
|
differences between the list prices for our tests and the reimbursement rates of payers;
|
55
|
•
|
compliance with complex federal and state regulations related to billing government healthcare programs, including Medicare and Medicaid, to the extent our tests are covered by such programs;
|
|
•
|
differences in coverage among payers and the effect of patient co-payments or co-insurance;
|
|
•
|
differences in information, pre-authorization and other billing requirements among payers;
|
|
•
|
changes to codes and coding instructions governing our tests;
|
|
•
|
incorrect or missing billing information; and
|
|
•
|
the resources required to manage the billing and claim appeals process.
|
These billing complexities and the related uncertainty in obtaining payment for our tests could negatively affect our revenue and cash flow, our ability to achieve profitability and the consistency and comparability of our results of operations. In addition, if claims for our tests are not submitted to payers on a timely basis, or if we fail to comply with applicable billing requirements, it could have an adverse effect on our revenue and our business.
In addition, the coding procedure used by third-party payers to identify various procedures, including our test, during the billing process is complex, does not adapt well to our tests and may not enable coverage and adequate reimbursement rates. Third-party payers usually require us to identify the test for which we are seeking reimbursement using a Current Procedural Terminology, or CPT, code. The CPT code set is maintained by the American Medical Association, or AMA. In cases where there is not a specific CPT code to describe a test, such as Guardant360 test, the test may be billed under an unlisted molecular pathology procedure code or through the use of a combination of single gene CPT codes, depending on the payer. The Protecting Access to Medicare Act, or PAMA authorized the adoption of new, temporary billing codes and unique test identifiers for FDA-cleared or approved tests as well as advanced diagnostic laboratory tests. The AMA has created a new section of CPT codes, Proprietary Laboratory Analyses codes, to facilitate implementation of this section of PAMA. In addition, CMS maintains the Healthcare Common Procedure Coding System, or HCPCS, and may assign unique level II HCPCS code to tests that are not already described by a unique CPT code. If we obtain FDA clearance or approval for one of our products, we must apply to the AMA or CMS to request issuance of a new code, respectively, that specifically describes our test. New CPT and HCPCS codes are issued on a quarterly basis. Payers' acceptance of the new code could be delayed, and transition to the new code could result in a decrease in reimbursement for our tests, both of which could potentially reduce revenue from commercial and government payers.
Because the current coding for billing our products does not describe a specific test, the claim must be examined to determine what test was provided, whether the test was appropriate and medically necessary, and whether payment should be rendered, which may require a letter of medical necessity from the ordering physician. This process can result in a delay in processing the claim, a lower reimbursement amount or denial of the claim. Because billing third-party payers for our tests is an unpredictable, challenging, time-consuming and costly process, we may face long collection cycles and the risk that we may never collect at all, either of which could adversely affect our business, results of operations and financial condition, and we may have to increase collection efforts and incur additional costs.
Changes in healthcare laws, regulations and policies could increase our costs, decrease our sales and revenues and negatively impact reimbursement for our tests.
In March 2010, the Patient Protection and Affordable Care Act, as amended by the Health Care and Education Affordability Reconciliation Act, or the ACA, became law. This law substantially changed the way health care is financed by both commercial payers and government payers, and significantly impacted our industry. The ACA contains a number of provisions expected to impact existing state and federal health care programs or result in the development of new programs, including those governing enrollment in state and federal health care programs, reimbursement changes and fraud and abuse. For instance, the ACA requires each medical device manufacturer to pay a sales tax equal to 2.3% of the price for which such manufacturer sells its medical devices, which began to apply to taxable sales after December 31, 2012. Through a series of legislative amendments, the tax was suspended for 2016 through 2019. Absent further legislative action, the device excise tax will be reinstated on medical device sales starting January 1, 2020. Our business and operations could be affected by the ACA, including in ways we cannot currently predict.
The device exercise tax imposed by the ACA and the expansion of the government’s role in the U.S. healthcare industry may result in decreased profits to us and lower reimbursement by payers for our tests, any of which may have a material adverse impact on our business, financial condition, results of operations or cash flows. Since 2016 there have been efforts to repeal all or part of the ACA, and the current Presidential Administration and the U.S. Congress have taken
56
action to roll back certain provisions of the ACA. For example, the Tax Cuts and Jobs Act, among other things, removes penalties for not complying with the ACA’s individual mandate to carry health insurance. The government may take further action regarding the ACA, including repeal or replacement. Additionally, all or a portion of the ACA and related subsequent legislation may be modified, repealed or otherwise invalidated through judicial challenge, which could result in lower numbers of insured individuals, reduced coverage for insured individuals and adversely affect our business. In addition, other legislative changes have been proposed and adopted since the ACA was enacted. On August 2, 2011, the Budget Control Act of 2011 was signed into law, which, among other things, reduced Medicare payments to providers by 2% per fiscal year, effective on April 1, 2013 and, due to subsequent legislative amendments to the statute, will remain in effect through 2027 unless additional Congressional action is taken.
We anticipate there will continue to be proposals by legislators at both the federal and state levels, regulators and commercial and government payers to reduce healthcare costs while expanding individual healthcare benefits. Certain of these changes could impose additional limitations on the prices we will be able to charge for our tests, the coverage of or the amounts of reimbursement available for our tests from commercial and government payers.
Our collection, use and disclosure of personally identifiable information, including patient and employee information, is subject to privacy and security regulations, and our failure to comply with those regulations or to adequately secure the information in our possession could result in significant liability or reputational harm.
The privacy and security of personally identifiable information stored, maintained, received or transmitted, including electronically, is a major issue in the United States and abroad. We collect, process, maintain, retain, evaluate, utilize and distribute large amounts of personal health and financial information and other confidential and sensitive data about our customers and others in the ordinary course of our business. While we strive to comply with all applicable privacy and security laws and regulations, as well as our own posted privacy policies, legal standards for privacy, including but not limited to ‘‘unfairness’’ and ‘‘deception,’’ as enforced by the FTC and state attorneys general, continue to evolve and any failure or perceived failure to comply may result in proceedings or actions against us by government entities or others, or could cause us to lose customers and payer coverage, which could have a material adverse effect on our business and results of operations. Recently, there has been an increase in public awareness of privacy issues in the wake of revelations about the various privacy-related government investigations and enforcement actions and civil lawsuits against healthcare companies. Concerns about and claims challenging our practices with regard to the collection, use, retention, disclosure or security of personally identifiable information or other privacy-related matters, even if unfounded and even if we are in compliance with applicable laws, could damage our reputation and harm our business.
Numerous federal, state and foreign laws and regulations govern collection, dissemination, use and confidentiality of personally identifiable information and protected health information, including HIPAA, state privacy and confidentiality laws (including state laws requiring disclosure of breaches); federal and state consumer protection and employment laws; and European and other foreign data protection laws. And new privacy legislation may create additional rights for consumers and impose additional requirements on businesses. As these laws and regulations increase in complexity and number, they may change frequently, sometimes conflict and increase our compliance efforts, costs and risks.
HIPAA, as amended by HITECH, establishes a set of national privacy and security standards for the protection of protected health information, or PHI, by health plans, certain healthcare providers and others that submit certain covered transactions electronically, or ‘‘covered entities,’’ and their ‘‘business associates,’’ which are persons or entities that perform certain services for, or on behalf of, a covered entity that involve creating, receiving, maintaining or transmitting PHI. We are a covered entity under HIPAA and therefore must comply with its requirements to protect the privacy and security of health information and must provide individuals with certain rights with respect to their health information. If we engage a business associate to help us carry out healthcare activities and functions, we must have a written business associate contract or other arrangement with the business associate that establishes specifically what the business associate has been engaged to do and requires the business associate to comply with the same requirements.
On December 12, 2018, HHS issued a request for information, or RFI, seeking input from the public on how the HIPAA regulations, and the Privacy Rule in particular, could be modified to amend existing, or impose additional, obligations relating to the processing of PHI. We will monitor this process and assess the impact of changes to the Privacy Rule or other HIPAA regulations to our business.
Penalties for violations of these laws vary. For instance, penalties for failure to comply with a requirement of HIPAA and HITECH vary significantly, and include civil monetary penalties of up to $57,051 per violation, not to exceed $1.71 million per calendar year for each provision of HIPAA that is violated and, in certain circumstances, criminal penalties with fines up to $250,000 per violation and/or imprisonment. However, a single breach incident can result in findings of violations of multiple provisions, leading to possible penalties in excess of $1.71 million for violations in
57
a single year. A person who knowingly obtains or discloses individually identifiable health information in violation of HIPAA may face a criminal penalty of up to $50,000 and up to one-year imprisonment. The criminal penalties increase if the wrongful conduct involves false pretenses or the intent to sell, transfer, or use identifiable health information for commercial advantage, personal gain, or malicious harm. In addition, responding to government investigations regarding alleged violations of these and other laws and regulations, even if ultimately concluded with no findings of violations or no penalties imposed, can consume company resources and impact our business and, if public, harm our reputation.
Further, various states, such as California and Massachusetts, have implemented similar privacy laws and regulations, such as the California Confidentiality of Medical Information Act, that impose restrictive requirements regulating the use and disclosure of health information and other personally identifiable information, and the California Consumer Privacy Act, was also recently passed and creates new data privacy rights for users, effective in 2020. These laws and regulations are not necessarily preempted by HIPAA, particularly if a state affords greater protection to individuals than HIPAA. Where state laws are more protective, we may have to comply with the stricter provisions. In addition to fines and penalties imposed upon violators, some of these state laws also afford private rights of action to individuals who believe their personal information has been misused. California’s patient privacy laws, for example, provide for penalties of up to $250,000 and permit injured parties to sue for damages. The interplay of federal and state laws may be subject to varying interpretations by courts and government agencies, creating complex compliance issues for us and our clients, and potentially exposing us to additional expense, adverse publicity and liability. Further, as regulatory focus on privacy issues continues to increase and laws and regulations concerning the protection of personal information expand and become more complex, these potential risks to our business could intensify. Changes in laws or regulations associated with the enhanced protection of certain types of sensitive data, such as PHI, or personally identifiable information along with increased demands for enhanced data security infrastructure, could greatly increase our costs of providing our services, decrease demand for our services, reduce our revenue and/or subject us to additional risks.
In addition, the interpretation and application of consumer, health-related, and data protection laws, especially with respect to genetic samples and data, in the United States, the European Union, or the EU, and elsewhere are often uncertain, contradictory, and in flux. We and our joint venture operate or may operate in a number of countries outside of the United States whose laws may in some cases be more stringent than the requirements in the United States. For example, EU member countries have specific requirements relating to cross-border transfers of personal data to certain jurisdictions, including to the United States where our laboratory resides. In addition, some countries have stricter consumer notice and/or consent requirements relating to personal data collection, use or sharing, more stringent requirements relating to organizations’ privacy programs and provide stronger individual rights. Moreover, international privacy and data security regulations may become more complex and have greater consequences. For instance, as of May 25, 2018, the General Data Protection Regulation, or GDPR, has replaced the Data Protection Directive with respect to the collection and use of personal data of data subjects in the EU. The GDPR applies extra-territorially and imposes several stringent requirements for controllers and processors of personal data, including, for example, higher standards for obtaining consent from individuals to process their personal data, more robust disclosures to individuals and a strengthened individual data rights regime, shortened timelines for data breach notifications, limitations on retention of information, increased requirements pertaining to health data, other special categories of personal data and pseudonymised (i.e., key-coded) data and additional obligations when we contract third-party processors in connection with the processing of the personal data. The GDPR provides that EU member states may make their own further laws and regulations limiting the processing of personal data, including genetic, biometric or health data, which could limit our ability to use and share personal data or could cause our costs could increase, and harm our business and financial condition. Failure to comply with the requirements of GDPR and the applicable national data protection laws of the EU Member States may result in fines of up to €20,000,000 or up to 4% of the total worldwide annual turnover of the preceding financial year, whichever is higher, and other administrative penalties. Further, as the GDPR has recently come into effect, enforcement priorities and interpretation of certain provisions are still unclear. To comply with the new data protection rules imposed by GDPR, we may be required to put in place additional mechanisms ensuring compliance and other substantial expenditures. This may be onerous and adversely affect our business, financial condition, results of operations and prospects. Failure to comply with the GDPR and other applicable privacy or data security-related laws, rules or regulations could result in material penalties imposed by regulators, affect our compliance with client contracts and have an adverse effect on our business, financial condition and results of operations.
European data protection law also imposes strict rules on the transfer of personal data out of the EU to the United States. These obligations may be interpreted and applied in a manner that is inconsistent from one jurisdiction to another and may conflict with other requirements or our practices. In addition, these rules are constantly under scrutiny. For example, following a decision of the Court of Justice of the EU in October 2015, transferring personal data to U.S. companies that had certified as members of the U.S. Safe Harbor Scheme was declared invalid. In July 2016 the European Commission adopted the U.S.-EU Privacy Shield Framework which replaces the Safe Harbor Scheme. However, this Framework is under review and there is currently litigation challenging other EU mechanisms for adequate data transfers
58
(i.e., the standard contractual clauses). It is uncertain whether the Privacy Shield Framework and/or the standard contractual clauses will be similarly invalidated by the European courts. We rely on a mixture of mechanisms to transfer personal data from our EU business to the U.S., and could be impacted by changes in law as a result of a future review of these transfer mechanisms by European regulators or current challenges to these mechanisms in the European courts.
Because of the breadth of these laws and the narrowness of their exceptions and safe harbors, it is possible that our current practices are challenged under one or more of such laws. The scope and enforcement of each of these laws is uncertain and subject to rapid change in the current environment of healthcare reform. Federal, state and foreign enforcement bodies have increased their scrutiny of interactions between healthcare companies and healthcare providers, which has led to a number of investigations, prosecutions, convictions and settlements in the healthcare industry.
Cyber-based attacks, security breaches, loss of data and other disruptions in relation to our information systems and computer networks could compromise sensitive information related to our business, prevent us from accessing it and expose us to liability, which could adversely affect our business and reputation.
Cyber-attacks, security breaches, computer viruses, malware and other incidents could cause misappropriation, loss or other unauthorized disclosure of confidential data, materials or information, including those concerning our customers and employees. We can provide no assurance that we or our vendors will be able to detect, prevent or contain the effects of such attacks or other information security risks or threats in the future. The costs of attempting to protect against the foregoing risks and the costs of responding to a cyber attack are significant. Large scale data breaches at other entities increase the challenge we and our vendors face in maintaining the security of our information technology systems and of our customers' sensitive information. Following a cyber attack, our and/or our vendors' remediation efforts may not be successful, and a cyber attack could result in interruptions, delays or cessation of service, and loss of existing or potential customers. In addition, breaches of our and/or our vendors' security measures and the unauthorized dissemination of sensitive personal information or proprietary information or confidential information about us, our customers or other third-parties, could expose our customers' private information and our customers to the risk of financial or medical identity theft, or expose us or other third parties to a risk of loss or misuse of this information, and result in investigations, regulatory enforcement actions, material fines and penalties, loss of customers, litigation or other actions which could have a material adverse effect on our business, prospects, reputation, results of operations and financial condition. In addition, if we fail to adhere to our privacy policy and other published statements or applicable laws concerning our processing, use, transmission and disclosure of protected information, or if our statements or practices are found to be deceptive or misrepresentative, we could face regulatory actions, fines and other liability.
In the ordinary course of our business, we collect and store sensitive data, including PHI, personally identifiable information, credit card and other financial information, intellectual property and proprietary business information owned or controlled by us or other parties such as customers and payers. We manage and maintain our applications and data utilizing a combination of on-site systems and cloud-based data centers. We utilize external security and infrastructure vendors to manage parts of our data centers. We also communicate sensitive data, including patient data, through phone, Internet, facsimile, multiple third-party vendors and their subcontractors or integrations with third-party electronic medical records. These applications and data encompass a wide variety of information critical to our business, including research and development information, patient data, commercial information and business and financial information. We face a number of risks related to protecting this critical information, including loss of access, inappropriate use or disclosure, unauthorized access, inappropriate modification and our being unable to adequately monitor, audit or modify our controls over such critical information. This risk extends to the third-party vendors and subcontractors we use to manage this sensitive data or otherwise process it on our behalf.
The secure processing, storage, maintenance and transmission of this critical information are vital to our operations and business strategy, and we devote significant resources to protecting such information. Although we take reasonable measures to protect sensitive data from unauthorized access, use, modification or disclosure, no security measures can be perfect and our information technology infrastructure may be vulnerable to hackers, phishing scams, malware, viruses, security flaws, employee errors, and other malfeasance or inadvertent disruptions. Any breach or interruption of our security measures or information technology infrastructure could compromise our networks, and the information stored there could be accessed by unauthorized parties, publicly disclosed, lost or stolen. Any such access, breach, or other loss of information could result in legal claims or proceedings, and liability under federal, state or foreign laws that protect the privacy of personal information, such as HIPAA or HITECH, and regulatory penalties. Notice of breaches may be required to affected individuals, the Secretary of the Department of Health and Human Services or other state, federal or foreign regulators, and for extensive breaches, notice may need to be made to the media or State Attorneys General. Such a notice could harm our reputation and our ability to compete. Although we have implemented security measures and an enterprise security program to prevent unauthorized access to patient data, such data is currently accessible through multiple channels, and there is no guarantee we can protect all data from breach. Unauthorized
59
access, loss or dissemination could disrupt our operations (including our ability to perform our analysis, provide test results, bill payers or patients, process claims and appeals, provide customer assistance, conduct research and development, develop intellectual property, collect, process and prepare financial information, provide information about our tests and continue other patient and physician education and outreach efforts, and manage our business) and damage our reputation, any of which could adversely affect our business and financial condition. We continue to prioritize security and the development of practices and controls to protect our systems. As cyber threats evolve, we may be required to expend significant additional resources to continue to modify or enhance our protective measures or to investigate and remediate any information security vulnerabilities, and these efforts may not be successful.
For example, in July 2018, we experienced security incidents involving an unauthorized actor obtaining access to our email system and sending phishing messages. We promptly engaged an independent cybersecurity firm to support our investigation, assess our systems and bolster security thereof. These incidents resulted in the unauthorized access of certain information relating to an aggregate of approximately 1,700 individuals. For approximately 1,100 of these individuals, the information accessed included PHI and primarily consisted of patients’ names, contact information, birth dates, medical diagnosis codes and, in a very limited number of cases, Social Security numbers. For the remaining individuals, information accessed did not include PHI and primarily consisted of Social Security numbers and certain other personal financial information, and credit card information in one of the incidents. We have provided timely notices to the U.S. Department of Health and Human Services, or the HHS, certain state regulators and certain credit agencies, as applicable, as well as to the individuals affected. We have offered credit monitoring and identity protection services to those who have been affected by this cyber attack. While the cyber attack did not have a material impact on our business, cash flows, financial condition and results of operations for the year ended December 31, 2018, we have incurred and may continue to incur internal and external costs, including those relating to mitigation of the incidents, and may be subject to penalties, such as those described above. We have implemented and continue to implement additional security measures to help prevent future unauthorized access to our systems and the data we maintain, but we cannot guarantee that future incidents can be avoided. In addition, because the cybersecurity firm’s investigation only analyzed our email accounts dating back to February 2018 (the time period for which security logs were available in our email software), we cannot assure you that no similar incidents took place before that time.
Following the July 2018 security incidents, we received a request for information in January 2019 regarding the incidents from the HHS Office for Civil Rights, or OCR. We have responded to that request in a timely manner but do not know whether OCR will request additional information or pursue any further action. We have contingency plans and insurance coverage for related potential liabilities, however, the coverage may not be sufficient to cover all claims and liabilities. We currently cannot predict the ultimate resolution of the security incidents or the OCR inquiry or estimate the amounts of, or ranges of, potential loss, if any, that could result therefrom. An adverse outcome in any of these matters could materially impact our ability to operate our business as well as our results of operations and financial position.
Risks related to our intellectual property
If we are unable to obtain and maintain sufficient intellectual property protection for our technology, or if the scope of the intellectual property protection obtained is not sufficiently broad, our competitors could develop and commercialize products similar or identical to ours, and our ability to successfully commercialize our products may be impaired.
We rely on patent protection as well as trademark, copyright, trade secret and other intellectual property rights protection and contractual restrictions to protect our proprietary technologies, all of which provide limited protection and may not adequately protect our rights or permit us to gain or keep any competitive advantage. If we fail to protect our intellectual property, third parties may be able to compete more effectively against us. In addition, we may incur substantial litigation costs in our attempts to recover or restrict use of our intellectual property.
To the extent our intellectual property offers inadequate protection, or is found to be invalid or unenforceable, we would be exposed to a greater risk of direct competition. If our intellectual property does not provide adequate coverage of our competitors’ products, our competitive position could be adversely affected, as could our business. Both the patent application process and the process of managing patent disputes can be time-consuming and expensive.
As is the case with other biotechnology companies, our success depends in large part on our ability to obtain and maintain protection of the intellectual property we may own solely and jointly with others or we may license from others, particularly patents, in the United States and other countries with respect to our products and technologies. We apply for patents covering our products and technologies and uses thereof, as we deem appropriate. However, obtaining and enforcing biotechnology patents is costly, time-consuming and complex, and we may fail to apply for patents on important products, services and technologies in a timely fashion or at all, or we may fail to apply for patents in
60
potentially relevant jurisdictions. We may not be able to file and prosecute all necessary or desirable patent applications, or maintain, enforce and license any patents that may issue from such patent applications, at a reasonable cost or in a timely manner. It is also possible that we will fail to identify patentable aspects of our research and development output before it is too late to obtain patent protection. We may not have the right to control the preparation, filing and prosecution of patent applications, or to maintain the rights to patents licensed to third parties. Therefore, these patents and applications may not be prosecuted and enforced in a manner consistent with the best interests of our business.
We own or license numerous U.S. patents and pending U.S. patent applications, with international counterparts in certain countries. It is possible that our or our licensors' pending patent applications will not result in issued patents in a timely fashion or at all, and even if patents are granted, they may not provide a basis for intellectual property protection of commercially viable products or services, may not provide us with any competitive advantages, or may be challenged and invalidated by third parties. It is possible that others will design around our current or future patented technologies. Some of such patent rights are being challenged, including at the United States Patent and Trademark Office, or USPTO, in post-grant proceedings, and some of such patent rights may be challenged in the future. We may not be successful in defending any such challenges made against our owned or licensed patents or patent applications. Any successful third-party challenge to such patent rights could result in their unenforceability or invalidity and increased competition to our business. We have challenged and may choose to challenge the patents or patent applications of third parties. The outcome of patent litigation or other proceeding can be uncertain, and any attempt by us to enforce our patent rights against others or to challenge the patent rights of others may not be successful, or, if successful, may take substantial time and result in substantial cost, and may divert our efforts and attention from other aspects of our business.
The patent positions of life sciences companies can be highly uncertain and involve complex legal and factual questions for which important legal principles remain unresolved. No consistent policy regarding the breadth of claims allowed in such companies’ patents has emerged to date in the United States or elsewhere. Courts frequently render opinions in the biotechnology field that may affect the patentability of certain inventions or discoveries, including opinions that may affect the patentability of methods for analyzing or comparing DNA sequences.
In particular, the patent positions of companies engaged in the development and commercialization of genomic diagnostic tests, like our Guardant360 and GuardantOMNI tests and future products, are particularly uncertain. Various courts, including the U.S. Supreme Court, have rendered decisions that affect the scope of patentability of certain inventions or discoveries relating to certain diagnostic tests and related methods. These decisions state, among other things, that a patent claim that recites an abstract idea, natural phenomenon or law of nature (for example, the relationship between particular genetic variants and cancer) are not themselves patentable. Precisely what constitutes a law of nature is uncertain, and it is possible that certain aspects of genetic diagnostics tests would be considered natural laws. Accordingly, the evolving case law in the United States may adversely affect our ability to obtain patents and may facilitate third-party challenges to any owned or licensed patents. The laws of some foreign jurisdictions do not protect intellectual property rights to the same extent as the laws of the United States, and we may encounter difficulties in protecting and defending such rights in foreign jurisdictions. The legal systems of many foreign jurisdictions do not favor the enforcement of patent rights and other intellectual property protection, particularly those relating to biotechnology, which could make it difficult for us to stop the infringement of our patent rights and other intellectual property rights thereunder. Proceedings to enforce our patent rights and other intellectual property protection in foreign jurisdictions could result in substantial cost and divert our efforts and attention from other aspects of our business.
Changes in patent law in the United States and other jurisdictions could diminish the value of patents in general, thereby impairing our ability to protect our products.
Changes in either the patent laws or in interpretations of patent laws in the United States or other countries or regions may diminish the value of our intellectual property. We cannot predict the breadth of claims that may be allowed or enforced in our patents or in third-party patents. We may not develop additional proprietary products, methods and technologies that are patentable.
Assuming that other requirements for patentability are met, prior to March 16, 2013, in the United States, the first to invent the claimed invention was entitled to the patent, while outside the United States, the first to file a patent application was entitled to the patent. On or after March 16, 2013, under the Leahy-Smith America Invents Act, or the America Invents Act, enacted in September 16, 2011, the United States transitioned to a first inventor to file system in which, assuming that other requirements for patentability are met, the first inventor to file a patent application will be entitled to the patent on an invention regardless of whether a third party was the first to invent the claimed invention. A third party that files a patent application in the USPTO on or after March 16, 2013, but before us could therefore be awarded a patent covering an invention of ours even if we had made the invention before it was made by such third party. This will require us to be cognizant of the time from invention to filing of a patent application. Since patent applications in
61
the United States and most other countries are confidential for a period of time after filing or until issuance, we cannot be certain that we or our licensors were the first to either (i) file any patent application related to our product candidates or (ii) invent any of the inventions claimed in our or our licensor’s patents or patent applications.
The America Invents Act also includes a number of significant changes that affect the way patent applications will be prosecuted and also may affect patent litigation. These include allowing third-party submission of prior art to the USPTO during patent prosecution and additional procedures to attack the validity of a patent by USPTO administered post-grant proceedings, including post-grant review,
inter partes
review and derivation proceedings. Because of a lower evidentiary standard in USPTO proceedings compared to the evidentiary standard in United States federal courts necessary to invalidate a patent claim, a third party could potentially provide evidence in a USPTO proceeding sufficient for the USPTO to hold a claim invalid even though the same evidence would be insufficient to invalidate the claim if first presented in a district court action. Accordingly, a third party may attempt to use the USPTO procedures to invalidate our patent claims that would not have been invalidated if first challenged by the third party in a district court action. Therefore, the America Invents Act and its implementation could increase the uncertainties and costs surrounding our or our licensors' prosecution of patent applications and enforcement or defense of issued patents, all of which could have a material adverse effect on our business, financial condition, results of operations and prospects.
Issued patents covering our products could be found invalid or unenforceable if challenged.
The issuance of a patent is not conclusive as to its inventorship, scope, validity or enforceability. Some of our owned or licensed patent rights have been, are being or may be challenged at a future point in time in opposition, derivation, reexamination,
inter partes
review, post-grant review or interference. Any successful third-party challenge to our patent rights in this or any other proceeding could result in the unenforceability or invalidity of such patent rights, which may lead to increased competition to our business, which could harm our business. In addition, if the breadth or strength of protection provided by our patents and patent applications is threatened, regardless of the outcome, it could dissuade companies from collaborating with us to license, develop or commercialize current or future product candidates.
We may not be aware of all third-party intellectual property rights potentially relating to our product candidates. Publications of discoveries in the scientific literature often lag behind the actual discoveries, and patent applications in the United States and other jurisdictions are typically not published until approximately 18 months after filing or, in some cases, not until such patent applications issue as patents. We might not have been the first to make the inventions covered by each of our pending patent applications and we might not have been the first to file patent applications for these inventions. To determine the priority of these inventions, we have and may have to participate in interference proceedings, derivation proceedings or other post-grant proceedings declared by the USPTO that could result in substantial cost to us. The outcome of such proceedings is uncertain. No assurance can be given that other patent applications will not have priority over our patent applications. In addition, changes to the patent laws of the United States allow for various post-grant opposition proceedings that have not been extensively tested, and their outcome is therefore uncertain. Our licensors may also license patent rights to others, and we may not be aware of such licenses or such licenses may be subject to disputes or uncertainties that affect patent rights licensed by us. If third parties bring actions against our owned or licensed patent rights, we could experience significant costs and management distraction.
We and some of our licensors have initiated, are currently involved in, and may in the future initiate or become involved in legal proceedings against a third party to enforce a patent covering one of our products. For example, we filed separate patent infringement suits against Foundation Medicine, Inc. and Personal Genome Diagnostics, Inc., alleging that each infringed patents related to our digital sequencing technology. In such proceedings, the defendant could counterclaim that the patent covering our product is invalid or unenforceable. In patent litigation in the United States, defendant counterclaims alleging invalidity or unenforceability are commonplace. Grounds for a validity challenge could be an alleged failure to meet any of several statutory requirements, including lack of novelty, obviousness or non-enablement. Grounds for an unenforceability assertion could be an allegation that someone connected with prosecution of the patent withheld relevant information from the USPTO, or made a misleading statement, during prosecution. Third parties may also raise similar claims before administrative bodies in the United States or abroad, even outside the context of litigation. Such mechanisms include re-examination, post grant review and equivalent proceedings in foreign jurisdictions (e.g., opposition proceedings). Such proceedings could result in revocation or amendment to our patent rights in such a way that they no longer cover our product. The outcome following legal assertions of invalidity and unenforceability is unpredictable. With respect to the validity question, for example, we cannot be certain that there is no invalidating prior art, of which we and the patent examiner were unaware during prosecution. If a defendant were to prevail on a legal assertion of invalidity and/or unenforceability, we would lose at least part, and perhaps all, of the patent protection on our products. Such a loss of patent protection could have a material adverse impact on our business.
62
We rely on licenses from third parties, and if we lose these licenses then we may be subjected to future litigation.
We are, and we may acquire companies that are, party to various royalty-bearing license agreements that grant us rights to use certain intellectual property, including patents and patent applications, typically in certain specified fields of use. We may need to obtain additional licenses from others to advance our research, development and commercialization activities. Our license agreements impose, and we expect that future license agreements will impose, various development, diligence, commercialization and other obligations on us, including obligations to making payments to our licensors upon achievement of milestones.
In spite of our efforts, our licensors might conclude that we have materially breached our obligations under such license agreements and might therefore terminate the license agreements, thereby removing or limiting our ability to develop and commercialize products and technology covered by these license agreements. If these licenses are terminated, or if the underlying patent rights fail to provide the intended exclusivity, competitors or other third parties might have the freedom to develop, produce, seek regulatory approval of, or to market, products identical or similar to ours and we may be required to cease our development and commercialization activities. Our licensors might take action with respect to our licensed intellectual property that may decrease the value of such licensed intellectual property. Any of the foregoing could have a material adverse effect on our competitive position, business, financial condition, results of operations and prospects. Moreover, disputes may arise with respect to any one of our licensing agreements, including:
|
•
|
the scope of rights granted under the license agreement and other interpretation-related issues;
|
|
•
|
the extent to which our products or product candidates, technology and processes infringe on intellectual property of the licensor that is not subject to the licensing agreement;
|
|
•
|
the licensing of patent and other rights controlled by our licensors or developed under our collaborative development relationships to others;
|
|
•
|
our diligence obligations under the license agreement and what activities satisfy those diligence obligations;
|
|
•
|
the inventorship and ownership of inventions and know-how licensed to us or resulting from the joint creation or use of intellectual property by our licensors, us and/or our partners; and
|
|
•
|
the validity, enforceability or priority of licensed patent rights.
|
If we do not prevail in such disputes, we may lose any of such license agreements, the license agreements may not be meaningful for our business and operations, and we may be subject to unnecessary or additional payment obligations.
In addition, the agreements under which we currently license intellectual property or technology from third parties are complex, and certain provisions in such agreements may be susceptible to multiple interpretations. The resolution of any contract interpretation disagreement that may arise could narrow what we believe to be the scope of our rights to the relevant intellectual property or technology, or increase what we believe to be our financial or other obligations under the relevant agreement, either of which could have a material adverse effect on our business, financial condition, results of operations and prospects. Moreover, if disputes over licensed intellectual property impair our ability to enforce licensed intellectual property against third parties or use it to defend ourselves in litigation, the value of such licensed intellectual property may be diminished.
If we fail to maintain our current licensing arrangements on commercially acceptable terms, we may be unable to successfully develop and commercialize the affected product candidates, which could have a material adverse effect on our business, financial condition, results of operations and prospects. If any of these license agreements is terminated, if the licensor fails to abide by the terms of the license agreement, if the licensor fails to prevent infringement by third parties, or if the licensed patent or other rights are found to be invalid or unenforceable, our may be unable to achieve our business goals and our results of operations and financial condition could be adversely affected. Absent the license agreements, we may infringe patents subject to those agreements, and if the license agreements are terminated, we may be subject to litigation by the licensor. Litigation could result in substantial costs and be a distraction to management. If we do not prevail, we may be required to pay damages, including treble damages, attorneys’ fees, costs and expenses, royalties or, be enjoined from selling our products or services, including our Guardant360 test, which could adversely affect our ability to offer products or services, our ability to continue operations and our financial condition.
63
If we cannot license and maintain rights to use third-party technology on reasonable terms, we may not be able to successfully commercialize our products. Our licensed or acquired technology may lose value or utility or over time.
From time to time, we may identify third-party technology we may need, including to develop or commercialize new products or services. We may also need to negotiate licenses to patents or patent applications before or after introducing a commercial product, and we may not be able to obtain necessary licenses to such patents or patent applications. If we are unable to enter into the necessary licenses on acceptable terms or at all, if any necessary licenses are subsequently terminated, if the licensors fail to abide by the terms of the licenses or fail to prevent infringement by third parties, or if the licensed patents or other rights are found to be invalid or unenforceable, our business may suffer. In addition, any technology licensed or acquired by us may lose value or utility, including as a result of a change of in the industry, in our business objectives, others' technology, our dispute with the licensor, and other circumstances outside our control. In return for the use of a third party’s technology, we may agree to pay the licensor royalties based on sales of our products or services. Royalties are a component of cost of products or services and affect the margins on our products or services. If we are unable to negotiate reasonable royalties or if we have to pay royalties on technology that becomes less useful for us or ceases to provide value to us, our profit margin will be reduced and we may suffer losses.
We may not be able to protect or enforce our intellectual property rights adequately throughout the world.
Filing, prosecuting and defending patents on our products and services in all countries throughout the world would be prohibitively expensive, and our intellectual property rights in some territories outside the United States can be less extensive than those in the United States. In addition, the laws of some foreign countries and regions do not protect intellectual property rights to the same extent as the laws of the United States, and we may encounter difficulties in protecting and defending such rights in foreign jurisdictions. Consequently, we may not be able to prevent third parties from practicing our inventions in all jurisdictions, or from selling or importing products made using our inventions in and into the United States or other jurisdictions. Competitors may use our inventions in jurisdictions where we have not obtained patent protection to develop their own products and may also export infringing products to territories where we have patent protection, but enforcement is not as strong as that in the United States. These products may compete with our products. Our patents or other intellectual property rights existing outside the United States may not be effective or sufficient to prevent them from competing. Similarly, intellectual property rights may be exhausted in certain situations, and others could import our products sold abroad and compete with us domestically.
Many companies have encountered significant problems in protecting and defending intellectual property rights in foreign jurisdictions. The legal systems of many other countries and regions do not favor the enforcement of patents and other intellectual property protection, particularly those relating to biotechnology, which could make it difficult for us to stop the infringement of our patents in such jurisdictions. Proceedings to enforce our patent rights in foreign jurisdictions could result in substantial cost and divert our efforts and attention from other aspects of our business, could put our patents at risk of being invalidated or interpreted narrowly and our patent applications at risk of not issuing, and could provoke third parties to assert claims against us. We may not prevail in any lawsuits that we initiate and the damages or other remedies awarded to us, if any, may not be commercially meaningful. Accordingly, our efforts to enforce intellectual property rights around the world may be inadequate to obtain a significant commercial advantage.
If we are unable to protect the confidentiality of our trade secrets, the value of our technology could be materially adversely affected and our business could be harmed.
In addition to pursuing patents on our technology, we take steps to protect our intellectual property and proprietary technology by entering into agreements, including confidentiality agreements, non-disclosure agreements and intellectual property assignment agreements, with our employees, consultants, academic institutions, corporate partners and, when needed, our advisers. However, we cannot be certain that such agreements have been entered into with all relevant parties, and we cannot be certain that our trade secrets and other proprietary information will not be disclosed or that competitors will not otherwise gain access to our trade secrets or independently develop substantially equivalent information and techniques. For example, any of these parties may breach the agreements and disclose our proprietary information, including our trade secrets, and we may not be able to obtain adequate remedies for such breaches. Such agreements may not be enforceable or may not provide meaningful protection for our trade secrets or other proprietary information in the event of unauthorized use or disclosure or other breaches of the agreements, and we may not be able to prevent such unauthorized use or disclosure. If we are required to assert our rights against such party, it could result in significant cost and distraction.
Monitoring unauthorized use or disclosure is difficult, and we do not know whether the steps we have taken to prevent such use or disclosure are, or will be, adequate. If we were to enforce a claim that a third party had illegally obtained
64
and was using our trade secrets, it would be expensive and time-consuming, and the outcome would be unpredictable. In addition, courts outside the United States may be less willing to protect trade secrets.
We also seek to preserve the integrity and confidentiality of our proprietary information by maintaining physical security of our premises and physical and electronic security of our information technology systems, but it is possible that these security measures could be breached. If any of our confidential proprietary information were to be lawfully obtained or independently developed by a competitor, absent patent protection, we would have no right to prevent such competitor from using that technology or information to compete with us, which could harm our competitive position.
We may be subject to claims that our employees, consultants or independent contractors have wrongfully used or disclosed confidential information of third parties or that our employees have wrongfully used or disclosed trade secrets of their former employers.
We have employed or engaged and expect to employ or engage individuals who were previously employed at or associated with universities or other companies, including our competitors or potential competitors. Although we try to ensure that our employees, consultants and independent contractors do not use the proprietary information or know-how of others in their work for us, we may be subject to claims that our employees, consultants or independent contractors have inadvertently or otherwise used or disclosed trade secrets or other proprietary information of their former employers or other third parties, or to claims that we have improperly used or obtained such trade secrets. Litigation may be necessary to defend against these claims. If we lose, in addition to paying monetary damages, we may be deprived of valuable intellectual property and face increased competition. A loss of key research personnel or work product could hamper or prevent our ability to commercialize potential products, which could harm our business. Even if we are successful in defending against these claims, litigation could result in damage to our reputation and substantial costs and be a distraction to management and affected individuals.
We may not be able to protect and enforce our trademarks.
We have not yet registered trademarks in all of our potential markets, although we have registered Guardant Health, Guardant360 and GuardantOMNI in the United States. If we apply to register additional trademarks in the United States and other countries, our applications may not be allowed for registration in a timely fashion or at all, and our registered trademarks may not be maintained or enforced. In addition, opposition or cancellation proceedings may be filed against our trademark applications and registrations, and our trademarks may not survive such proceedings. If we do not timely register and enforce our trademarks, we may encounter difficulty in enforcing them against third parties.
We may be subject to claims challenging the inventorship or ownership of our owned or licensed intellectual property.
We or our licensors may be subject to claims that former employees, collaborators or other third parties have an interest in or right to our owned or licensed patents, trade secrets or other intellectual property. For example, we or our licensors may have inventorship disputes arise from conflicting obligations of employees, consultants or others who are involved in developing such intellectual property. Litigation may be necessary to defend against these and other claims challenging inventorship or ownership of our owned or licensed patents, trade secrets or other intellectual property. If we or our licensors fail in defending against any such claims, we may lose exclusive ownership of, or right to use, valuable intellectual property. Even if we are successful in defending against such claims, litigation could result in damage to our reputation and substantial costs and be a distraction to management and other employees. Any of the foregoing could have a material adverse effect on our business, financial condition, results of operations and prospects.
We may be involved in litigation and other legal proceedings related to intellectual property, which could be time-intensive and costly and may adversely affect our business, operating results or financial condition.
We have been, are currently in, and may also in the future be, involved with litigation or USPTO actions with various third parties. We expect that the number of such claims may increase as the number of our products or services, and the level of competition in our industry segments, grow. Any infringement claim, regardless of its validity, could harm our business by, among other things, resulting in time-consuming and costly litigation, diverting management’s time and attention from the development of our business, or requiring the payment of monetary damages (including treble damages, attorneys’ fees, costs and expenses if we are found to have willfully infringed) and ongoing royalties.
65
Litigation may be necessary for us to enforce our patent and proprietary rights or to determine the scope, coverage and validity of the proprietary rights of others. We are currently engaged in lawsuits against Foundation Medicine, Inc. and Personal Genome Diagnostics, Inc. for infringement over some of our patents. The outcome of such lawsuits, as well as any other litigation or proceeding, is inherently uncertain and might not be favorable to us. Further, we could encounter delays in product introductions, or interruptions in sale of products or services, as we develop alternative products or services. In addition, if we resort to legal proceedings to enforce our intellectual property rights (as we have against Foundation Medicine, Inc. and Personal Genome Diagnostics, Inc.) or to determine the validity, scope and coverage of the intellectual property or other proprietary rights of others, the proceedings could be burdensome and expensive, even if we were to prevail. If we do not prevail in such legal proceedings, we may be required to pay damages and we may lose significant intellectual property protection for our products or services, such that competitors could copy our products or services. Any litigation that may be necessary in the future could result in substantial costs and diversion of resources and could have a material adverse effect on our business, operating results or financial condition.
As we move into new markets and applications for our products or services, incumbent participants in such markets may assert their patents and other intellectual property or proprietary rights against us as a means of slowing our entry into such markets or as a means to extract substantial license and royalty payments from us. As our business matures and our public profile grows, we may also be subject to an increased number of allegations of patent infringement, whether by our competitors or other patent owners, both in the United States and throughout the world wherever we seek to commercialize our products and services. Our competitors and others may have significantly larger and more mature patent portfolios than we have. In addition, while we can assert our own patents or other rights during litigation, our own patents may provide little or no deterrence or protection against patent holding companies or other patent owners who have no relevant product or service revenue. Therefore, our commercial success may depend in part on our non-infringement of the patents or other rights of third parties and on our success in defending ourselves in litigation.
However, our research, development and commercialization activities are currently and may in the future be subject to claims that we infringe or otherwise violate patents or other intellectual property rights owned or controlled by third parties. There is a substantial amount of litigation and other patent challenges, both within and outside the United States, involving patent and other intellectual property rights in the biotechnology industry, including patent infringement lawsuits, interferences, oppositions and
inter partes
review proceedings before the USPTO, and corresponding foreign patent offices. Numerous U.S. and foreign issued patents and pending patent applications, which are owned by third parties, exist in the fields in which we are developing products. As the precision oncology industry expands and more patents are issued, the risk increases that our products or services may be subject to claims of infringement of the patent rights of third parties. Numerous significant intellectual property issues have been litigated, are being litigated and will likely continue to be litigated, between existing and new participants in our existing and targeted markets, and competitors have and may assert that our products or services infringe their intellectual property rights as part of a business strategy to impede our successful entry into or growth in those markets, and we may enforce our owned or licensed intellectual property rights against our competitors and other parties. For example, we have been or are currently involved in legal proceedings against Foundation Medicine, Inc. and Personal Genome Diagnostics, Inc. related to our patent rights both in courts and before the USPTO.
Third parties may assert that we are employing their proprietary technology without authorization. For instance, Foundation Medicine, Inc. filed a lawsuit for patent infringement against us in May 2016, which we settled in July 2018. We are also aware of issued U.S. patents and patent applications with claims related to our products and services, and there may be other related third-party patents or patent applications of which we are not aware. By interacting with us, our licensors may learn more about our business or technology and may assert additional patent rights against us, such as patent rights that are not currently licensed to us or patent rights that may be obtained by any such licensors in the future, which may occur if such patent rights are not available for licensing or if they are not offered on acceptable or commercially reasonable terms. Because patent applications can take many years to issue and are not publicly available until a certain period of time passes from filing, there may be currently pending patent applications which may later result in issued patents that our current or future products and services may infringe. In addition, similar to what other companies in our industry have experienced, we expect our competitors and others may develop or obtain patents with our products or services in mind and claim that making, having made, using, selling, offering to sell or importing our products or services infringes these patents.
We could incur substantial costs and divert the attention of our management and technical personnel in defending against any of these claims. Parties making claims against us may be able to sustain the costs of complex patent litigation more effectively than we can, for example, because they have substantially greater resources.
66
Parties making claims against us may be able to obtain injunctive or other relief, which could block our ability to develop, commercialize and sell certain products or services, and could result in the award of substantial damages against us, including treble damages, attorney’s fees, costs and expenses if we are found to have willfully infringed. In the event of a successful claim of infringement against us, we may be required to pay damages and ongoing royalties, and obtain one or more licenses from third parties, or be prohibited from selling certain products or services. We may not be able to obtain these licenses on acceptable or commercially reasonable terms, if at all, or these licenses may be non-exclusive, which could result in our competitors gaining access to the same intellectual property. In addition, we could encounter delays in product or service introductions while we attempt to develop alternative products or services to avoid infringing third-party patents or proprietary rights. Defense of any lawsuit or failure to obtain any of these licenses could prevent us from commercializing products or services, and the prohibition of sale of any of our products or services could materially affect our business and our ability to gain market acceptance for our products or services.
Furthermore, because of the substantial amount of discovery required in connection with intellectual property litigation, there is a risk that some of our confidential information could be compromised by disclosure during this type of litigation. In addition, during the course of this kind of litigation, there could be public announcements of the results of hearings, motions or other interim proceedings or developments. If securities analysts or investors perceive these results to be negative, it could have a substantial adverse effect on the price of our common stock.
In addition, our agreements with some of our customers, suppliers or other entities with whom we do business require us to defend or indemnify these parties to the extent they become involved in infringement claims, including the types of claims described above. We could also voluntarily agree to defend or indemnify third parties in instances where we are not obligated to do so if we determine it would be important to our business relationships. If we are required or agree to defend or indemnify third parties in connection with any infringement claims, we could incur significant costs and expenses that could adversely affect our business, operating results or financial condition.
Obtaining and maintaining our patent protection depends on compliance with various required procedures, document submissions, fee payments and other requirements imposed by governmental patent agencies, and our patent protection could be reduced or eliminated for non-compliance with these requirements.
Periodic maintenance fees, renewal fees, annuity fees and various other governmental fees on patents and/or applications will be due to be paid to the USPTO and various governmental patent agencies outside of the United States at several stages over the lifetime of the patents and/or applications. We have systems in place to remind us to pay these fees, and we rely on our outside counsel to pay these fees due to non-U.S. patent agencies. The USPTO and various foreign governmental patent agencies require compliance with a number of procedural, documentary, fee payment and other similar requirements during the patent application process. We employ reputable law firms and other professionals to help us comply, and in many cases, an inadvertent lapse can be cured by payment of a late fee or by other means in accordance with the applicable rules. However, there are situations in which non-compliance can result in abandonment or forfeiture of the patent or patent application and thus loss of patent rights in the relevant jurisdiction. Such an event would allow our competitors to enter the unprotected market and have a material adverse effect on our business.
Patent terms may be inadequate to protect our competitive position for an adequate amount of time.
Patents have a limited lifespan. In the United States, if all maintenance fees are timely paid, the natural
expiration of a patent is generally 20 years from its earliest U.S. non-provisional filing date. Various extensions may be available, but the life of a patent, and the protection it affords, is limited. Even if patents covering our products or services are obtained, once the patent life has expired, we may be open to competition. Given the amount of time required for the development, testing and regulatory review of our new products or services, patents protecting them might expire before or shortly after they are commercialized. As a result, our owned and licensed patent portfolio may not provide us with a sufficient exclusivity period to exclude others from commercializing products or services similar or identical to ours.
Risks related to our common stock
An active trading market for our common stock may not be maintained.
Our common stock only recently began trading on the Nasdaq Global Select Market, or Nasdaq, but we can provide no assurance that we will be able to maintain an active trading market on Nasdaq or any other exchange in the future. If an active market for our common stock is not maintained, or if we fail to satisfy the continued listing standards of Nasdaq for any reason and our common stock is delisted, it may be difficult for our stockholders to sell shares without depressing the market price for the shares or at all. An inactive trading market may also impair our ability to both raise
67
capital by selling shares of common stock and acquire other complementary products, technologies or businesses by using our shares of common stock as consideration.
We expect that the price of our common stock will fluctuate substantially and you may not be able to resell shares of our common stock at or above the price at which you purchased them.
The market price of our common stock is likely to be highly volatile and may fluctuate substantially due to many factors, including:
|
•
|
volume and customer mix for our precision oncology testing;
|
|
•
|
the introduction of new products or product enhancements by us or others in our industry;
|
|
•
|
disputes or other developments with respect to our or others’ intellectual property rights;
|
|
•
|
our ability to develop, obtain regulatory clearance or approval for, and market new and enhanced products on a timely basis;
|
|
•
|
product liability claims or other litigation;
|
|
•
|
quarterly or annual variations in our results of operations or those of others in our industry;
|
|
•
|
media exposure of our products or of those of others in our industry;
|
|
•
|
changes in governmental regulations or in the status of our regulatory approvals or applications;
|
|
•
|
changes in earnings estimates or recommendations by securities analysts; and
|
|
•
|
general market conditions and other factors, including factors unrelated to our operating performance or the operating performance of our competitors.
|
In recent years, the stock markets generally have experienced extreme price and volume fluctuations that have often been unrelated or disproportionate to the operating performance of those companies. Broad market and industry factors may significantly affect the market price of our common stock, regardless of our actual operating performance. In addition, in the past, class action litigation has often been instituted against companies whose securities have experienced periods of volatility in market price. Securities litigation brought against us following volatility in our stock price, regardless of the merit or ultimate results of such litigation, could result in substantial costs, which would hurt our financial condition and operating results and divert management’s attention and resources from our business.
Securities analysts may not publish favorable research or reports about our business or may publish no information at all, which could cause our stock price or trading volume to decline.
The trading market for our common stock is influenced to some extent by the research and reports that industry or financial analysts publish about us and our business. We do not control these analysts. As a newly public company, we may be slow to attract research coverage. The analysts who publish information about our common stock may have had relatively little experience with us or our industry, which could affect their ability to accurately forecast our results and could make it more likely that we fail to meet their estimates. In the event we obtain securities or industry analyst coverage, if any of the analysts who cover us provide inaccurate or unfavorable research or issue an adverse opinion regarding our stock price, our stock price could decline. If one or more of these analysts cease coverage of us or fail to publish reports covering us regularly, we could lose visibility in the market, which in turn could cause our stock price or trading volume to decline.
We are an “emerging growth company” and the reduced disclosure requirements applicable to “emerging growth companies” may make our common stock less attractive to investors.
We are an “emerging growth company,” as defined in the JOBS Act, and we may take advantage of certain exemptions and relief from various reporting requirements that are applicable to other public companies that are not “emerging growth companies.” In particular, while we are an “emerging growth company,” we will not be required to comply with the auditor attestation requirements of Section 404(b) of the Sarbanes-Oxley Act of 2002, or the Sarbanes-Oxley Act; we will be exempt from any rules that could be adopted by the Public Company Accounting Oversight Board
68
requiring mandatory audit firm rotations or a supplement to the auditor’s report on financial statements; we will be subject to reduced disclosure obligations regarding executive compensation in our periodic reports and proxy statements; and we will not be required to hold non-binding advisory votes on executive compensation or stockholder approval of any golden parachute payments not previously approved. In addition, while we are an “emerging growth company,” we can defer complying with any new financial accounting standard until such standard is generally applicable to private companies. As a result, our financial statements may not be comparable to public companies that are not “emerging growth companies” or elect not to avail themselves of this provision.
While we may otherwise remain an “emerging growth company” until as late as December 31, 2023, the fiscal year-end following the fifth anniversary of the IPO, we may cease to be an “emerging growth company” earlier under certain circumstances, including if (i) we have more than $1.07 billion in annual gross revenue in any fiscal year, (ii) the market value of our common stock that is held by non-affiliates exceeds $700 million as of June 30 of any fiscal year, or (iii) we issue more than $1.0 billion of non-convertible debt over a three-year period. As a result, if the market value of our common stock that is held by non-affiliates exceeds $700 million as of June 30, 2019, we expect that we will need to comply with additional legal, financial and accounting requirements as of December 31, 2019, which could result in substantial costs and additional risks for us and divert management’s attention.
The exact implications of the JOBS Act are still subject to interpretations and guidance by the SEC and other regulatory agencies, and we cannot assure you that we will be able to take advantage of all of the benefits of the JOBS Act. In addition, investors may find our common stock less attractive to the extent we rely on the exemptions and relief granted by the JOBS Act. If some investors find our common stock less attractive as a result, there may be a less active trading market for our common stock and our stock price may decline or become more volatile.
If our estimates or judgments relating to our critical accounting policies are based on assumptions that change or prove to be incorrect, our operating results could fall below our publicly announced guidance or the expectations of securities analysts and investors, resulting in a decline in the market price of our common stock.
The preparation of financial statements in conformity with accounting principles generally accepted in the United States of America, or GAAP, requires management to make estimates and assumptions that affect the amounts reported in our financial statements and accompanying notes. We base our estimates on historical experience and on various other assumptions that we believe to be reasonable under the circumstances, the results of which form the basis for making judgments about the carrying values of assets, liabilities, equity, revenue and expenses that are not readily apparent from other sources. As we work toward adopting and implementing the new revenue accounting standard in 2019, management will make judgments and assumptions based on our interpretation of the new standard. The new revenue standard is principle-based and interpretation of those principles may vary from company to company based on their unique circumstances. We are also required to adopt the new lease accounting standard in 2020, which involves significant judgment and assumptions, including the estimation of incremental borrowing rate used to discount our lease liabilities and the assessment of risks associated with the specific economic environment of our leased assets. It is possible that interpretation, industry practice and guidance may evolve as we work toward implementing these new accounting standards. If our assumptions change or if actual circumstances differ from our assumptions, our operating results may be adversely affected and could fall below our publicly announced guidance or the expectations of analysts and investors, resulting in a decline in the market price of our common stock.
A significant portion of our total outstanding shares may be sold into the market in the near future. This could cause the market price of our common stock to drop significantly, even if our business is doing well.
Sales of a substantial number of shares of our common stock in the public market could occur at any time. These sales, or the perception in the market that the holders of a large number of shares intend to sell their shares, could result in a decrease in the market price of our common stock. Moreover, holders of approximately 43 million shares of our common stock will have rights, subject to some conditions, to require us to file registration statements covering their shares or to include their shares in registration statements that we may file for ourselves or other stockholders. We also registered 12,282,992 shares of our common stock that have been issued or that we may issue under our current equity compensation plans following the IPO, which shares can be freely sold in the public market, subject to volume limitations applicable to affiliates and the lock-up agreements entered in connection with the IPO.
Our directors, officers and principal stockholders have significant voting power and may take actions that may not be in the best interests of our other stockholders.
As of
December 31, 2018
, our officers, directors and other stockholders each holding more than 5% of our common stock collectively controlled approximately 58% of our outstanding common stock. As a result, these stockholders, if
69
they act together, are able to control the management and affairs of our company and most matters requiring stockholder approval, including the election of directors and approval of significant corporate transactions. This concentration of ownership may have the effect of delaying or preventing a change of control and might adversely affect the market price of our common stock. This concentration of ownership may not be in the best interests of our other stockholders.
We may allocate the net proceeds from the IPO in ways that you and other stockholders may not approve.
Our management has broad discretion in the application of the net proceeds from the IPO. Because of the number and variability of factors that will determine our use of the net proceeds from the IPO, their ultimate use may vary substantially from the intended uses we identified in the prospectus relating to the IPO. Our management might not apply such proceeds in ways that ultimately increase the value of your investment, and the failure by our management to apply these funds effectively could harm our business. If we do not invest apply the net proceeds from the IPO in ways that enhance stockholder value, we may fail to achieve expected results, which could cause our stock price to decline.
We expect to incur significant additional costs as a result of being a public company, which may adversely affect our business, financial condition and results of operations.
We expect to incur costs associated with corporate governance requirements that are applicable to us as a public company, including rules and regulations of the SEC, under the Sarbanes-Oxley Act, the Dodd-Frank Wall Street Reform and Consumer Protection Act of 2010, and the Securities Exchange Act of 1934, as amended, or the Exchange Act, as well as the rules of Nasdaq. These rules and regulations significantly increase our accounting, legal and financial compliance costs and make some activities more time-consuming. These rules and regulations also make it more expensive for us to maintain directors’ and officers’ liability insurance. Accordingly, increases in costs incurred as a result of being a publicly traded company may adversely affect our business, financial condition and results of operations.
If we experience material weaknesses in the future or otherwise fail to maintain an effective system of internal controls in the future, we may not be able to accurately report our financial condition or results of operations which may adversely affect investor confidence in us and, as a result, the value of our common stock.
As a result of becoming a public company, we are required, under Section 404 of the Sarbanes-Oxley Act, to furnish a report by management on, among other things, the effectiveness of our internal control over financial reporting beginning with our next Annual Report on Form 10-K for the year ending December 31, 2019. This assessment will need to include disclosure of any material weaknesses identified by our management in our internal control over financial reporting. A material weakness is a deficiency or combination of deficiencies in internal control over financial reporting, such that there is a reasonable possibility that a material misstatement of a company’s annual and interim financial statements will not be detected or prevented on a timely basis.
We are further enhancing internal controls, processes and related documentation necessary to perform the evaluation needed to comply with Section 404. We may not be able to complete our evaluation, testing and any required remediation in a timely fashion. During the evaluation and testing process, if we identify one or more material weaknesses in our internal control over financial reporting, we will be unable to assert that our internal controls are effective. The effectiveness of our controls and procedures may be limited by a variety of factors, including:
|
•
|
faulty human judgment and simple errors, omissions or mistakes;
|
|
•
|
fraudulent action of an individual or collusion of two or more people;
|
|
•
|
inappropriate management override of procedures; and
|
|
•
|
the possibility that any enhancements to controls and procedures may still not be adequate to assure timely and accurate financial control.
|
When we cease to be an “emerging growth company” under the federal securities laws, our auditors will be required to express an opinion on the effectiveness of our internal controls. If we are unable to confirm that our internal control over financial reporting is effective, or if our independent registered public accounting firm is unable to express an opinion on the effectiveness of our internal controls, we could lose investor confidence in the accuracy and completeness of our financial reports, which could cause the price of our common stock to decline.
70
Our disclosure controls and procedures may not prevent or detect all errors or acts of fraud.
We are subject to the periodic reporting requirements of the Exchange Act. We designed our disclosure controls and procedures to provide reasonable assurance that information we must disclose in reports we file or submit under the Exchange Act is accumulated, communicated to management, recorded, processed, summarized and reported within the time periods specified in the rules and forms of the SEC. We believe that any disclosure controls and procedures, no matter how well-conceived and operated, can provide only reasonable, not absolute, assurance that the objectives of the control system are met.
These inherent limitations include the realities that judgments in decision-making can be faulty, and that breakdowns can occur because of simple error or mistake. Additionally, controls can be circumvented by the individual acts of some persons, by collusion of two or more people or by an unauthorized override of the controls. Accordingly, because of the inherent limitations in our control system, misstatements due to error or fraud may occur and not be detected.
Provisions in our corporate charter documents and under Delaware law could make a change in control of us more difficult and may prevent attempts by our stockholders to replace or remove our current management.
Provisions in our amended and restated certificate of incorporation and our amended and restated bylaws may discourage, delay or prevent a merger, acquisition or other change in control of us that stockholders may consider favorable, including transactions in which our stockholders might otherwise receive a premium for their shares. These provisions could also limit the price that investors might be willing to pay in the future for shares of our common stock, thereby depressing the market price of our common stock. In addition, these provisions may make it more difficult for our stockholders to replace current members of our board of directors or add new members thereto. Because our board of directors is responsible for appointing the members of our management team, these provisions could in turn affect any attempts by our stockholders to change our management team. Among others, these provisions include that:
|
•
|
our board of directors has the exclusive right to expand its size and to elect directors to fill a vacancy created by the expansion of the board or the resignation, death or removal of a director, which prevents stockholders from being able to fill vacancies on our board of directors;
|
|
•
|
our board of directors is divided into three classes, Class I, Class II and Class III, with each class serving staggered three-year terms, which may delay the ability of stockholders to change the membership of a majority of our board of directors;
|
|
•
|
our stockholders may not act by written consent, which forces stockholder action to be taken at an annual or special meeting of our stockholders;
|
|
•
|
a special meeting of stockholders may be called only by our board of directors, its chairman, our chief executive officer or our president, which may delay the ability of our stockholders to force consideration of a proposal or to take action, including the removal of directors;
|
|
•
|
our amended and restated certificate of incorporation prohibits cumulative voting in the election of directors, which limits the ability of minority stockholders to elect their director candidates;
|
|
•
|
our board of directors may alter our bylaws without obtaining stockholder approval;
|
|
•
|
approval of the holders of at least two-thirds of the shares entitled to vote at an election of directors is required to adopt, amend or repeal our bylaws or repeal the provisions of our amended and restated certificate of incorporation regarding the election and removal of directors;
|
|
•
|
stockholders must provide advance notice and additional disclosures in order to nominate candidates for election to the board of directors or to propose matters that can be acted upon at a stockholders’ meeting, which may discourage or deter a potential acquiror from conducting a solicitation of proxies to elect the acquiror’s own slate of directors or otherwise attempting to obtain control of our company; and
|
|
•
|
our board of directors is authorized to issue shares of preferred stock and to determine the terms of those shares, including preferences and voting rights, without stockholder approval, which could be used to significantly dilute the ownership of a hostile acquiror.
|
71
Moreover, because we are incorporated in Delaware, we are governed by the provisions of Section 203 of the Delaware General Corporation Law, which prohibits a person who owns in excess of 15% of our outstanding voting stock from merging or combining with us for a period of three years after the date of the transaction in which the person acquired in excess of 15% of our outstanding voting stock, unless the merger or combination is approved in a prescribed manner. Furthermore, our amended and restated certificate of incorporation specifies that, unless we consent in writing to the selection of an alternative forum, to the fullest extent permitted by law, the Court of Chancery of the State of Delaware will be the sole and exclusive forum for most legal actions involving actions brought against us by stockholders; provided that, the exclusive forum provision will not apply to suits brought to enforce any liability or duty created by the Exchange Act or any other claim for which the federal courts have exclusive jurisdiction; and provided further that, if and only if the Court of Chancery of the State of Delaware dismisses any such action for lack of subject matter jurisdiction, such action may be brought in another state or federal court sitting in the State of Delaware. We believe these provisions may benefit us by providing increased consistency in the application of Delaware law by chancellors, particularly experienced in resolving corporate disputes, efficient administration of cases on a more expedited schedule relative to other forums and protection against the burdens of multi-forum litigation. However, these provisions may have the effect of discouraging lawsuits brought against us and our directors and officers by our stockholders. The enforceability of similar choice of forum provisions in other companies’ certificates of incorporation has been challenged in legal proceedings, and it is possible that, in connection with any applicable action brought against us, a court could find the choice of forum provisions contained in our amended and restated certificate of incorporation to be inapplicable or unenforceable in such action.
Our amended and restated certificate of incorporation also provides that the federal district courts of the United States of America will be the exclusive forum for the resolution of any complaint asserting a cause of action against us or any of our directors, officers, employees or agents and arising under the Securities Act. However, a Delaware court recently held that such an exclusive forum provision relating to federal courts was unenforceable under Delaware law, and unless and until the Delaware court decision is reversed on appeal or otherwise abrogated, we do not intend to enforce such a provision in the event of a complaint asserting a cause of action arising under the Securities Act against us or any of our directors, officers, employees or agents.
Because we do not anticipate paying any cash dividends on our capital stock in the foreseeable future, capital appreciation, if any, will be your sole source of gain.
We have never declared or paid cash dividends on our capital stock. We currently intend to retain all of our future earnings, if any, to finance the growth and development of our business. In addition, future debt or other agreements we may enter into may preclude us from paying dividends. As a result, capital appreciation, if any, of our common stock will be your sole source of gain for the foreseeable future.
72
Item 1B. Unresolved Staff Comments
None.
Item 2. Properties
In May 2015, we began a lease of our current headquarters in Redwood City. The lease currently covers approximately 163,000 square feet of space and continues through December 31, 2025. Our CLIA-certified laboratory is located in these facilities, where testing for both clinical and biopharmaceutical customers is performed. While we believe our existing facilities are adequate to meet our current requirements, we expect to expand our facilities as our operations grow over time. We believe we will be able to obtain such space on acceptable and commercially reasonable terms.
Item 3. Legal Proceedings
We may from time to time be involved in various legal proceedings and other matters arising in the normal course of business. For example, we have received, and may in the future continue to, receive letters, claims or complaints from others alleging false advertising, patent infringement, violation of employment practices and trademark infringement. We have also instituted, and may in the future institute additional, legal proceedings to enforce our rights and seek remedies, such as monetary damages, injunctive relief and declaratory relief. We cannot predict the results of any such disputes, and despite the potential outcomes, the existence thereof may have an adverse material impact on us because of diversion of management time and attention as well as the financial costs related to resolving such disputes.
The information under the caption “
Commitments and Contingencies - Legal Proceedings
” in Note 8 to the consolidated financial statements included elsewhere in this Annual Report on Form 10-K, concerning certain legal proceedings in which we are involved, is hereby incorporated by reference. The resolution of any such legal proceeding is subject to inherent uncertainty and could have a material adverse effect on our financial condition, cash flows or results of operations.
Item 4. Mine Safety Disclosures.
Not applicable.
PART II
Item 5. Market for Registrant’s Common Equity, Related Stockholder Matters and Issuer Purchases of Equity Securities
Market information for common stock
Our common stock began trading on The Nasdaq Global Select Market under the symbol “GH” on October 4, 2018. Prior to that date, there was no public trading market for our common stock.
Holders of record
As of
March 4, 2019
, there were 249 holders of record of our common stock. Because many of our shares of common stock are held by brokers and other institutions on behalf of stockholders, we are unable to estimate the total number of stockholders represented by these record holders.
Dividend policy
We have never declared or paid any dividends on our common stock. We currently intend to retain all available funds and any future earnings for the operation and expansion of our business. Accordingly, we do not anticipate declaring or paying dividends in the foreseeable future. The payment of any future dividends will be at the discretion of our board of directors and will depend on our results of operations, capital requirements, financial condition, prospects, contractual arrangements, including any limitations on payment of dividends, and other factors that the board may deem relevant.
73
Unregistered sales of equity securities
The following sets forth information regarding all unregistered securities sold by us from January 1, 2018 through December 31, 2018 (after giving effect to a 0.7378-for-1 reverse stock split of our common stock effected on September 19, 2018):
|
1.
|
We issued an aggregate of
320,289
shares of our common stock upon the exercise of common stock warrants, for aggregate cash consideration of approximately
$45,000
.
|
|
2.
|
We granted stock options to purchase an aggregate of
2,088,639
shares of our common stock at a weighted-average exercise price of
$7.19
per share, to certain of our employees, consultants and directors in connection with services provided to us by such persons.
|
|
3.
|
We issued an aggregate of 880,086 shares of common stock to our employees, consultants and directors upon their exercise of stock options, for aggregate cash consideration of approximately $2.6 million.
|
The shares of common stock issued upon the exercise of the common stock warrants described above were issued pursuant to Section 4(a)(2) under the Securities Act, relative to transactions by an issuer not involving any public offering, to the extent an exemption from registration was required. The issuances of stock options and the shares of common stock issued upon the exercise of the options described above were issued pursuant to written compensatory plans or arrangements with our employees, directors and consultants, in reliance on the exemption provided by Rule 701 promulgated under the Securities Act, or pursuant to Section 4(a)(2) under the Securities Act, relative to transactions by an issuer not involving any public offering, to the extent an exemption from registration was required.
Use of proceeds from our initial public offering of common stock
In October 2018, we closed our IPO, in which we sold 14,375,000 shares of common stock to the public at a price of $19.00 per share. The aggregate offering price for shares sold in the offering was $273.1 million. The offer and sale of all of the shares in the IPO were registered under the Securities Act pursuant to a registration statement on Form S-1 (File No. 333-227206), which was declared effective by the SEC on October 3, 2018. The offering commenced on October 3, 2018, and J.P. Morgan Securities LLC and Merrill Lynch, Pierce, Fenner & Smith Incorporated acted as joint book-running managers for the IPO. Following the sale of the shares in connection with the closing of the IPO on October 9, 2018, the offering terminated.
We raised approximately
$254.0 million
in net proceeds from the offering, after deducting underwriter discounts and commissions of $19.1 million. Offering expenses incurred by us were $4.5 million. There has been no material change in the planned use of proceeds from the IPO from that described in the final prospectus, dated October 3, 2018, filed with the SEC pursuant to Rule 424(b).
Issuer purchases of equity securities
During the quarter ended
December 31, 2018
, we did not purchase any of our equity securities that are registered under Section 12 of the Exchange Act.
Securities authorized for issuance under equity compensation plans
The information required by this item with respect to our equity compensation plans is incorporated by reference to our 2019 Proxy Statement for our 2019 Annual Meeting of Stockholders to be filed with the SEC within 120 days after the end of the fiscal year to which this Annual Report on Form 10-K relates.
Stock performance graph
The graph below shows a comparison, from October 4, 2018 (the date our common stock commenced trading on the Nasdaq) through
December 31, 2018
, of the cumulative total return to stockholders of our common stock relative to the Nasdaq Composite Index (“Nasdaq Composite”) and the Nasdaq Biotechnology Index (“Nasdaq Biotechnology”).The graph assumes that $100 was invested in each of our common stock, the Nasdaq Composite and the Nasdaq Biotechnology at their respective closing prices on October 4, 2018 and assumes reinvestment of gross dividends. The stock price performance shown in the graph represents past performance and should not be considered an indication of future stock price performance.
74
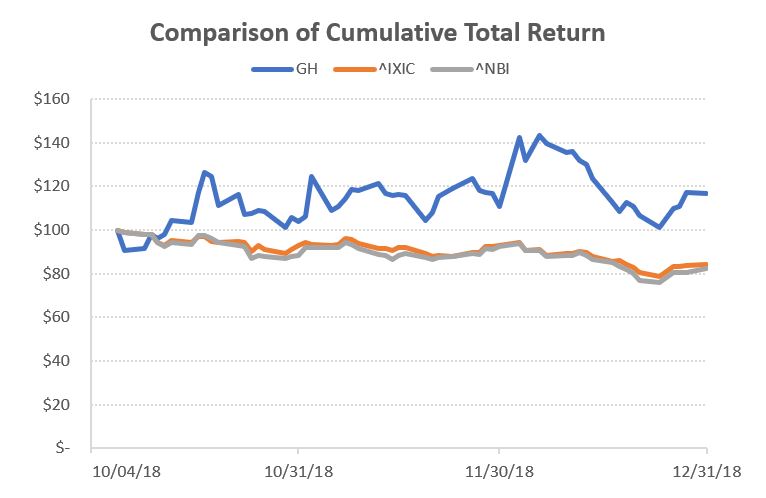
This graph is not “soliciting material,” is not deemed “filed” with the SEC and is not to be incorporated by reference into any of our filings under the Securities Act or the Exchange Act, whether made before or after the date hereof and irrespective of any general incorporation language in any such filing.
Item 6. Selected Financial Data
The following selected consolidated financial data should be read in conjunction with Part II, Item 7,
“Management’s Discussion and Analysis of Financial Condition and Results of Operations
,
”
and the audited consolidated financial statements and related notes included in Part II, Item 8,
“Financial Statements
,
”
of this Annual Report on Form 10-K, including factors that may affect the comparability of such selected information. The consolidated statements of operations data for the fiscal years ended
December 31, 2018
,
2017
and
2016
, respectively, and the consolidated balance sheet data as of
December 31, 2018
and
2017
, respectively, are derived from our audited consolidated financial statements and related notes included elsewhere in this Annual Report on Form 10-K. The consolidated balance sheet data as of
December 31, 2016
is derived from our audited consolidated financial statements that not included in this Annual Report on Form 10-K. The selected consolidated financial data in this section are not intended to replace our consolidated financial statements and the related notes, and are qualified in their entirety by the consolidated financial statements and related notes included elsewhere in this Annual Report on Form 10-K. Our historical results are not necessarily indicative of our results in any future period.
75
|
Year Ended December 31,
|
||||||||||||
|
(in thousands, except per share data)
|
2018
|
2017
|
2016
|
|||||||||
|
Statements of Operations Data:
|
||||||||||||
|
Revenue:
|
||||||||||||
|
Precision oncology testing
|
$
|
78,407
|
|
$
|
42,088
|
|
$
|
24,496
|
|
|||
|
Development services
|
12,232
|
|
7,754
|
|
753
|
|
||||||
|
Total revenue
|
90,639
|
|
49,842
|
|
25,249
|
|
||||||
|
Costs and operating expenses:
|
||||||||||||
|
Cost of precision oncology testing
|
39,846
|
|
28,883
|
|
22,065
|
|
||||||
|
Cost of development services
|
3,364
|
|
2,735
|
|
59
|
|
||||||
|
Research and development expense
|
50,714
|
|
25,562
|
|
10,859
|
|
||||||
|
Sales and marketing expense
|
53,465
|
|
32,497
|
|
26,192
|
|
||||||
|
General and administrative expense
|
36,192
|
|
36,777
|
|
9,921
|
|
||||||
|
Total costs and operating expenses
|
183,581
|
|
126,454
|
|
69,096
|
|
||||||
|
Loss from operations
|
(92,942
|
)
|
(76,612
|
)
|
(43,847
|
)
|
||||||
|
Interest income
|
5,266
|
|
2,234
|
|
733
|
|
||||||
|
Interest expense
|
(1,251
|
)
|
(2,702
|
)
|
(3,018
|
)
|
||||||
|
Loss on debt extinguishment
|
—
|
|
(5,075
|
)
|
—
|
|
||||||
|
Other income (expense), net
|
4,702
|
|
(1,059
|
)
|
(1
|
)
|
||||||
|
Loss before provision for income taxes
|
(84,225
|
)
|
(83,214
|
)
|
(46,133
|
)
|
||||||
|
Provision for income taxes
|
38
|
|
7
|
|
6
|
|
||||||
|
Net loss
|
(84,263
|
)
|
(83,221
|
)
|
(46,139
|
)
|
||||||
|
Fair value adjustment of redeemable noncontrolling interest
|
(800
|
)
|
—
|
|
—
|
|
||||||
|
Net loss attributable to Guardant Health, Inc.
|
$
|
(85,063
|
)
|
$
|
(83,221
|
)
|
$
|
(46,139
|
)
|
|||
|
Deemed dividend related to repurchase of Series A convertible preferred stock
|
—
|
|
(4,716
|
)
|
—
|
|
||||||
|
Deemed dividend related to change in conversion rate of Series D convertible preferred stock
|
—
|
|
(1,058
|
)
|
—
|
|
||||||
|
Net loss attributable to Guardant Health, Inc. common stockholders
|
$
|
(85,063
|
)
|
$
|
(88,995
|
)
|
$
|
(46,139
|
)
|
|||
|
Net loss per share attributable to Guardant Health, Inc. common stockholders, basic and diluted
|
$
|
(2.80
|
)
|
$
|
(7.07
|
)
|
$
|
(3.53
|
)
|
|||
|
Weighted-average shares used in computing net loss per share attributable to Guardant Health, Inc. common stockholders, basic and diluted
|
30,403
|
|
12,582
|
|
13,053
|
|
||||||
|
As of December 31,
|
||||||||||||
|
(in thousands)
|
2018
|
2017
|
2016
|
|||||||||
|
Balance Sheet Data:
|
||||||||||||
|
Cash, cash equivalents and marketable securities
|
$
|
496,524
|
|
$
|
294,574
|
|
$
|
95,256
|
|
|||
|
Working capital(1)
|
422,047
|
|
223,308
|
|
88,813
|
|
||||||
|
Total assets
|
587,403
|
|
342,938
|
|
116,565
|
|
||||||
|
Total liabilities
|
62,451
|
|
34,332
|
|
36,869
|
|
||||||
|
Redeemable noncontrolling interest
|
41,800
|
|
—
|
|
—
|
|
||||||
|
Total stockholders’ equity
|
483,152
|
|
308,606
|
|
79,696
|
|
||||||
(1) We define working capital as current assets less current liabilities. See our audited financial statements and related notes included elsewhere in this Annual Report on Form 10-K for further details regarding our current assets and current liabilities.
76
Item 7. Management’s Discussion and Analysis of Financial Condition and Results of Operations
You should read the following discussion and analysis of financial condition and results of operations together with the consolidated financial statements and related notes included elsewhere in this Annual Report on Form 10-K. This discussion and other parts of this report contain forward-looking statements that involve risk and uncertainties, such as statements of our plans, objectives, expectations and intentions. Our actual results could differ materially from those discussed in these forward-looking statements. Factors that could cause or contribute to such differences include, but are not limited to, those discussed in Part I, Item 1A,“Risk Factors,” of this Annual Report on Form 10-K.
Overview
We are a leading precision oncology company focused on helping conquer cancer globally through use of our proprietary blood tests, vast data sets and advanced analytics. We believe that the key to conquering cancer is unprecedented access to its molecular information throughout all stages of the disease, which we intend to enable by a routine blood draw, or liquid biopsy. Our Guardant Health Oncology Platform is designed to leverage our capabilities in technology, clinical development, regulatory and reimbursement to drive commercial adoption, improve patient clinical outcomes and lower healthcare costs. In pursuit of our goal to manage cancer across all stages of the disease, we launched our Guardant360 and GuardantOMNI liquid biopsy-based tests for advanced stage cancer. Our Guardant360 test, launched in 2014, has been used by more than 6,000 oncologists, over 50 biopharmaceutical companies and all 28 National Comprehensive Cancer Network, or NCCN, Centers. Our GuardantOMNI test, launched in 2017, is specifically built for our biopharmaceutical customers as a comprehensive genomic profiling tool to help accelerate clinical development programs in both immuno-oncology and targeted therapy. Our LUNAR-1 and LUNAR-2 programs are developing tests for minimal residual disease and recurrence monitoring and for early detection screening, respectively. In late 2018 we launched our LUNAR assay for research use by biopharmaceutical and academic researchers.
Since our inception, we have devoted substantially all of our resources to research and development activities related to our Guardant360 and GuardantOMNI tests and our LUNAR programs, including clinical and regulatory initiatives to obtain approval by the FDA, as well as sales and marketing activities. We have over 40 approved, completed or active clinical outcomes studies, more than 100 peer-reviewed publications and more than 300 scientific abstracts. We are pioneering the clinical comprehensive liquid biopsy market with our Guardant360 and GuardantOMNI tests, both of which analyze circulating tumor DNA in blood. Our Guardant360 test is a molecular diagnostic test measuring 73 cancer-related genes and has been used by clinicians to help inform which therapy may be effective for advanced stage cancer patients with solid tumors and by biopharmaceutical companies for a range of applications, including identifying target patient populations to accelerate translational science research, clinical trial enrollment, and drug development, and post-approval commercialization. Our GuardantOMNI test has a broader 500-gene panel
, including genes associated with homologous recombination repair deficiency and biomarkers for immuno-oncology applications, such as tumor mutational burden and microsatellite instability, and
has achieved comparable analytical performance in clinical studies, including for translational science applications in collaboration with several biopharmaceutical companies, including Merck MSD, Merck KGaA, Pfizer, AstraZeneca and Bristol-Myers Squibb.
The FDA granted designation as a breakthrough device for our Guardant360 test in January 2018 and for our GuardantOMNI test in December 2018. An expedited access pathway and potentially faster review are provided for breakthrough medical devices that address unmet medical needs. Our Guardant360 and GuardantOMNI tests are both being developed as companion diagnostics under collaborations with biopharmaceutical companies.
We perform our Guardant360, GuardantOMNI and other tests in our clinical laboratory located in Redwood City, California. Our laboratory is accredited by the Clinical Laboratory Improvement Amendments of 1988, or CLIA, permitted by the New York State Department of Health, or NYSDOH, and licensed in California and four other states.
The analytical and clinical data that we have generated in our efforts to establish clinical utility, combined with the support we have developed with key opinion leaders, or KOLs, in the oncology space have led to positive coverage decisions by a number of commercial payers. Our Guardant360 test is currently covered by Cigna, Priority Health and multiple Blue Cross Blue Shield plans, which have adopted reimbursement policies that specifically cover Guardant360 test for non-small cell lung cancer, or NSCLC, which we believe gives us a competitive advantage with these payers.
77
We anticipate approval by the FDA, if obtained, may support improvements in coverage and reimbursement for Guardant360 test. In July 2018, Palmetto GBA, the Medicare Administrative Contractor, or MAC, responsible for administering Medicare’s Molecular Diagnostic Services Program, or MolDx, issued a local coverage determination, or LCD, for Guardant360 test for NSCLC patients who meet certain clinical criteria. We worked with Palmetto GBA to obtain this positive coverage decision through the submission of a detailed dossier of analytical and clinical data to substantiate that the test meets Medicare’s medical necessity requirements. We estimate that approximately 75% of Medicare patients tested for NSCLC are covered by the LCD. Approximately 46% of our U.S. clinical tests in both
2018
and
2017
were for patients tested for NSCLC. Noridian Healthcare Solutions, the MAC responsible for adjudicating claims in California, where our laboratory is located, and a participant in the MolDx, recently finalized its LCD for Guardant360 test. In September 2018, we began to submit claims for reimbursement for Guardant360 clinical testing performed for Medicare beneficiaries covered under the LCDs, and in October 2018, we began to receive payments from Medicare.
In the United States, we market our tests to clinical customers through our sales organization, which is engaged in sales efforts and promotional activities primarily targeting oncologists and cancer centers. Outside the United States, we market our tests to clinical customers through distributors and direct contracts with healthcare institutions. We also market our tests to biopharmaceutical customers globally through our business development team, which promotes the broad utility of our tests throughout drug development and commercialization. Additionally, we have established a joint venture with SoftBank to accelerate commercialization of our products including in Asia, the Middle East and Africa, with our initial focus being on Japan. Our products are currently marketed in approximately 40 countries.
We generated total revenue of
$90.6 million
,
$49.8 million
and
$25.2 million
for the years ended
December 31, 2018
,
2017
and
2016
, respectively. We also incurred net losses of
$84.3 million
,
$83.2 million
and
$46.1 million
for the years ended
December 31, 2018
,
2017
and
2016
, respectively. We have funded our operations to date principally from the sale of our stock and revenue from our precision oncology testing and development services. In 2017, we raised $320.4 million through the sale of our Series E convertible preferred stock. In October 2018, we completed our initial public offering, or IPO, selling 14,375,000 shares of our common stock and raising $249.5 million net of underwriting discounts and commissions and other expenses payable by us. As of
December 31, 2018
, we had cash, cash equivalents and marketable securities of
$496.5 million
.
Factors affecting our performance
We believe there are several important factors that have impacted and that we expect will impact our operating performance and results of operations, including:
|
•
|
Testing volume, pricing and customer mix.
Our revenue and costs are affected by the volume of testing and mix of customers from period to period. We evaluate both the volume of tests that we perform for patients on behalf of clinicians and the number of tests we perform for biopharmaceutical companies. Our performance depends on our ability to retain and broaden adoption with existing customers, as well as attract new customers. We believe that the test volume we receive from clinicians and biopharmaceutical companies are indicators of growth in each of these customer verticals. Customer mix for our tests has the potential to significantly affect our results of operations, as the average selling price for biopharmaceutical sample testing is currently higher than our average selling price for clinical tests since we are not a contracted provider for, or our tests are not covered by clinical patients’ insurance for, the majority of the tests that we perform for patients on behalf of clinicians. Approximately 38% of our U.S. clinical tests in both
2018
and
2017
were for Medicare beneficiaries. Prior to the third quarter of 2018, Medicare did not cover our tests and we did not submit claims for reimbursement. In September 2018, we began to submit claims to Medicare for reimbursement for Guardant360 clinical tests for certain Medicare beneficiaries, and in October 2018, we began to receive payments from Medicare for these clinical tests.
|
|
•
|
Regulatory approval .
Our Guardant360 test was the first comprehensive liquid biopsy test approved by NYSDOH. In addition, we believe our facility was the first comprehensive liquid biopsy laboratory to be CLIA-certified, CAP-accredited and NYSDOH-permitted. The FDA granted designation as a breakthrough device for our Guardant360 test in January 2018 and for our GuardantOMNI test in December 2018. An expedited access pathway and potentially faster review are provided for breakthrough devices that address unmet medical needs. While FDA approval is currently not required to market our tests in the United States, we intend to submit an application for a pre-market approval, or PMA, for each of our Guardant360 and GuardantOMNI tests. In March 2018, the Centers for Medicare and Medicaid Services, or CMS, published a Decision Memorandum for next-generation sequencing tests for patients with advanced cancer who meet certain clinical criteria, or the NGS Decision Memorandum. The NGS Decision Memorandum states that coverage would be available for next-generation sequencing FDA-approved tests offered within the FDA-approved labeling. FDA approval therefore provides a path to reimbursement
|
78
by Medicare through the NGS Decision Memorandum. We believe that this establishes a competitive advantage for tests receiving FDA approval and that FDA approval will be increasingly necessary for diagnostic tests to gain adoption, both in the United States and abroad. We believe FDA approval, if obtained, will help increase adoption of our tests and facilitate favorable reimbursement decisions by Medicare and commercial payers. Any negative regulatory decisions or changes in regulatory requirements affecting our business could adversely impact our operations and financial results.
|
•
|
Payer coverage and reimbursement
. Our revenue depends on achieving broad coverage and reimbursement for our tests from third-party payers, including both commercial and government payers. Payment from commercial payers differs depending on whether we have entered into a contract with the payers as a “participating provider” or do not have a contract and are considered a "non-participating provider.” Payers often reimburse non-participating providers, if at all, at a lower amount than participating providers. We have received a substantial portion of our revenue from a limited number of commercial payers, most of which have not contracted with us to be a participating provider. We have received reimbursement for tests of patients with a variety of cancers, though for amounts that on average are significantly lower than for participating providers. Historically, we have experienced situations where commercial payers proactively reduced the amounts they were willing to reimburse for our tests, and in other situations, commercial payers have determined that the amounts they previously paid were too high and have sought to recover those perceived excess payments by deducting such amounts from payments otherwise being made. When we contract with a payer to serve as a participating provider, reimbursements by the payer are generally made pursuant to a negotiated fee schedule and are limited to only covered indications or where prior approval has been obtained. Becoming a participating provider generally results in higher reimbursement for covered indications and lack of reimbursement for non-covered indications. As a result, the impact of becoming a participating provider with a specific payer will vary based on historical reimbursement as a non-participating provider for that payer, and in some situations, the benefit of increased reimbursement for covered testing could be offset by the loss of reimbursement on tests for non-covered indications previously received when we served as a non-participating provider. Recently, Cigna, Priority Health and multiple regional Blue Cross Blue Shield plans adopted reimbursement policies that cover our Guardant360 test for the majority of NSCLC patients we test. If their reimbursement policies were to change in the future to cover additional cancer indications, we anticipate that our total reimbursement would increase. In September 2018, we began to submit claims for reimbursement at the rate of $3,500 per test with respect to Guardant360 clinical testing performed for NSCLC patients covered under Medicare’s Molecular Diagnostic Services Program who meet certain clinical criteria, and in October 2018, we began to receive payments from Medicare. If we fail to obtain or maintain coverage and adequate reimbursement from third-party payers, we may be unable to increase our testing volume and revenue as expected. Retrospective reimbursement adjustments can also negatively impact our revenue and cause our financial results to fluctuate.We have experienced situations where commercial payers proactively reduce the amounts they were willing to reimburse for our tests or determine that the amounts they previously paid were too high and have sought to recover those perceived excess payments by deducting such amounts from payments otherwise being made.
|
|
•
|
Biopharmaceutical customers.
Our revenue also depends on our ability to attract new, and to maintain and expand relationships with existing, biopharmaceutical customers, and we expect to increase our sales and marketing expense in furtherance of this goal. As we continue to develop these relationships, we expect to support a growing number of clinical trials both in the United States and internationally. If our relationships expand with biopharmaceutical customers, we believe we may continue to have opportunities to offer our platform to such customers for companion diagnostic development and for novel target discovery and validation, and to grow into other business opportunities. For example, we believe genomic data, in combination with clinical outcomes or claims data, has revenue-generating potential, including for novel target identification and clinical trial enrollment.
|
|
•
|
Research and development.
A significant aspect of our business is our investment in research and development, including the development of new products, such as those being developed as part of our LUNAR programs. In particular, we have invested heavily in clinical studies, including more than 40 clinical outcomes studies, the largest-ever liquid-to-tissue concordance study, and a prospective interventional clinical utility study demonstrating clinical overall response rates in line with tissue biopsy approaches. Our clinical research has resulted in over 100 peer-reviewed publications. In addition to clinical studies, we are collaborating with investigators from multiple academic cancer centers, including MD Anderson Cancer Center, the University of Colorado, Memorial Sloan Kettering Cancer Center, Massachusetts General Cancer Center, Wake Forest Cancer Center and the University of California San Francisco, as well as several international institutions. We believe these studies are critical to gaining physician adoption and driving favorable coverage decisions by payers, and expect our investments to increase. We expect to increase our research and development expense with the goal of fueling further innovation.
|
79
|
•
|
International expansion.
A component of our long-term growth strategy is to expand our commercial footprint internationally, and we expect to increase our sales and marketing expense to execute on this strategy. We currently offer our tests in countries outside the United States primarily through distributor relationships or direct contracts with hospitals. In May 2018, we formed and capitalized a joint venture, Guardant Health AMEA, Inc., which we refer to as the Joint Venture, with SoftBank, relating to the sale, marketing and distribution of our tests generally outside the Americas and Europe. We expect to rely on the Joint Venture to accelerate commercialization of our products in Asia, the Middle East and Africa, with our initial focus being on Japan.
|
While each of these areas presents significant opportunities for us, they also pose significant risks and challenges that we must address. See Part I, Item 1A,
“Risk Factors
” of this Annual Report on Form 10-K for more information.
Components of results of operations
Revenue
We derive our revenue from two sources: (i) precision oncology testing and (ii) development services.
Precision oncology testing.
Precision oncology testing revenue is generated from sales of our Guardant 360 and GuardantOMNI tests. In the United States, through 2018, we generally performed tests as an out-of-network service provider without contracts with health insurance companies. We submit claims for payment for tests performed for patients covered by U.S. private payers. Prior to the third quarter of 2018, Medicare did not cover our tests and we did not submit claims for reimbursement for these tests. In September 2018, we began to submit claims to Medicare for reimbursement for Guardant360 clinical testing performed for NSCLC patients covered under Medicare’s Molecular Diagnostic Services Program who meet certain clinical criteria. Tests for patients covered by Medicare represented approximately 38% of our U.S. clinical tests in both
2018
and
2017
. Due to the historical general lack of contracts with U.S. private payers and variability in payments received for claims submitted to them, as well as the limited claims experience to date with Medicare, revenue has not been recognized by us at the time the service has been performed as the price of the transaction was not fixed or determinable and collectability was not reasonably assured. As we provide precision oncology testing to biopharmaceutical customers under contracts for which all recognition criteria are met, we have recognized revenue on an accrual basis for those services.
Development services
. Development services revenue represents services, other than precision oncology testing, that we provide to biopharmaceutical companies and large medical institutions. It includes companion diagnostic development and regulatory approval services, clinical trial referrals and liquid biopsy testing development and support. We collaborate with biopharmaceutical companies in the development and clinical trials of new drugs. As part of these collaborations, we provide services related to regulatory filings with the FDA to support companion diagnostic device submissions for our liquid biopsy panels. Under these arrangements, we generate revenue from progression of our collaboration efforts, as well as from provision of on-going support. Development services revenue can vary over time as different projects start and complete.
Costs and operating expenses
Cost of precision oncology testing.
Cost of precision oncology testing generally consists of cost of materials, direct labor, including bonus, benefit and stock-based compensation; equipment and infrastructure expenses associated with processing liquid biopsy test samples, including sample accessioning, library preparation, sequencing, quality control analyses and shipping charges to transport blood samples; freight; curation of test results for physicians; and license fees due to third parties. Infrastructure expenses include depreciation of laboratory equipment, rent costs, amortization of leasehold improvements and information technology costs. Costs associated with performing our tests are recorded as the tests are performed regardless of whether revenue was recognized with respect to the tests. Royalties for licensed technology are calculated as a percentage of revenues generated using the associated technology and recorded as expense at the time the related revenue is recognized. One-time royalty payments related to signing of license agreements or other milestones, such as issuance of new patents, are amortized to expense over the expected useful life of the patents.
While we do not believe the technologies underlying these licenses are necessary to permit us to provide our tests, we do believe these technologies are potentially valuable and of possible strategic importance to us or our competitors. Cost of precision oncology testing revenue included royalty expense of
$1.4 million
,
$1.1 million
and
$0.7 million
for the years ended
December 31, 2018
,
2017
and
2016
, respectively.
We expect the cost of precision oncology testing to generally increase in line with the increase in the number of tests we perform, but the cost per test to decrease modestly over time due to the efficiencies we may gain as test volume increases, and from automation and other cost reductions.
80
Cost of development services.
Cost of development services includes costs incurred for the performance of development services requested by our customers. For development of new products, costs incurred before technological feasibility has been achieved are reported as research and development expenses, while costs incurred thereafter are reported as cost of revenue. Cost of development services will vary depending on the nature, timing and scope of customer projects.
Research and development expense
. Research and development expenses consist of costs incurred to develop technology and include salaries and benefits, reagents and supplies used in research and development laboratory work, infrastructure expenses, including allocated facility occupancy and information technology costs, contract services, other outside costs and costs to develop our technology capabilities. Research and development expenses also include costs related to activities performed under contracts with biopharmaceutical companies before technological feasibility has been achieved. Research and development costs are expensed as incurred. Payments made prior to the receipt of goods or services to be used in research and development are deferred and recognized as expense in the period in which the related goods are received or services are rendered. Costs to develop our technology capabilities are recorded as research and development unless they meet the criteria to be capitalized as internal-use software costs.
We expect that our research and development expenses will continue to increase in absolute dollars as we continue to innovate and develop additional products, expand our genomic and medical data management resources and conduct our ongoing and new clinical trials. This expense, though expected to increase in absolute dollars, is expected to decrease modestly as a percentage of revenue in the long term, though it may fluctuate as a percentage of revenue from period to period due to the timing and extent of these expenses.
Sales and marketing expense.
Our sales and marketing expenses are expensed as incurred and include costs associated with our sales organization, including our direct sales force and sales management, client services, marketing and reimbursement, as well as business development personnel who are focused on our biopharmaceutical customers. These expenses consist primarily of salaries, commissions, bonuses, employee benefits, travel expenses and stock-based compensation, as well as marketing and educational activities and allocated overhead expenses.
We expect our sales and marketing expenses to increase in absolute dollars as we expand our sales force, increase our presence within and outside of the United States, and increase our marketing activities to drive further awareness and adoption of our Guardant360 and GuardantOMNI tests and future products. These expenses, though expected to increase in absolute dollars, are expected to decrease modestly as a percentage of revenue in the long term, though they may fluctuate as a percentage of revenue from period to period due to the timing and extent of these expenses.
General and administrative expense
. Our general and administrative expenses include costs for our executive, accounting and finance, legal and human resources functions. These expenses consist principally of salaries, bonuses, employee benefits, travel expenses and stock-based compensation, as well as professional services fees such as consulting, audit, tax and legal fees, and general corporate costs and allocated overhead expenses.
We expect that our general and administrative expenses will continue to increase in absolute dollars, primarily due to increased headcount and costs associated with operating as a public company, including expenses related to legal, accounting, regulatory, maintaining compliance with exchange listing and requirements of the SEC, director and officer insurance premiums and investor relations. These expenses, though expected to increase in absolute dollars, are expected to decrease modestly as a percentage of revenue in the long term, though they may fluctuate as a percentage of revenue from period to period due to the timing and extent of these expenses.
Interest income
Interest income consists of interest earned on our cash, cash equivalents and marketable securities.
Interest expense
Interest expense consists primarily of interest from a loan (until it was repaid), capital leases and royalty obligations.
Loss on debt extinguishment
In June 2017, we repaid a loan prior to maturity which resulted in an extinguishment of the debt for accounting purposes. The difference between the reacquisition price and the net carrying amount of the debt and related royalty liabilities of
$5.1 million
was recognized as a one-time charge for the year ended December 31, 2017.
81
Other income (expense), net
In the first quarter of 2018, we settled a commercial legal dispute. In connection with the settlement, we received a payment of $4.25 million, which was recognized as one-time other income for the year ended
December 31, 2018
.
Other income (expense), net also consists of foreign currency exchange gains and losses. Foreign currency exchange gains and losses relate to transactions and asset and liability balances denominated in currencies other than the U.S. dollar, primarily comprised of a royalty obligation denominated in Euros. We expect our foreign currency gains and losses to continue to fluctuate in the future due to changes in foreign currency exchange rates.
Series E convertible preferred stock financing
In May 2017 we entered into a Series E convertible preferred stock purchase agreement with SoftBank and certain of our existing stockholders. Pursuant to the purchase agreement, we issued and sold an aggregate of 38,174,246 shares of Series E convertible preferred stock at a purchase price of $8.3936 per share, for an aggregate purchase price of $320.4 million. The purchase agreement also provided that we would issue additional shares of Series E convertible preferred stock to the Series E investors in such an amount as to cause SoftBank’s equity ownership to equal 35% of our outstanding fully-diluted capital stock measured 70 days after the initial closing. This gross-up was intended to maintain SoftBank’s equity ownership at 35% following various repurchases of our equity from existing stockholders. As a result, in July 2017, we repurchased an aggregate of 1,588,065 shares of common stock from certain of our directors and executive officers for a purchase price of $10.23887 per share, which represented a price equal to 90% of the original price per share for the Series E convertible preferred stock, as adjusted to reflect the 0.7378-for-one reverse stock split effected on September 19, 2018. We also engaged in a tender offer pursuant to which we repurchased 131,243 shares of common stock from certain employees at the same per share price paid for the Series E convertible preferred stock, as adjusted to reflect the 0.7378-for-one reverse stock split, and 666,920 shares of Series A convertible preferred stock from existing stockholders at a purchase price of $8.00 per share of Series A convertible preferred stock. Following these repurchases, in October 2017, we issued an additional 796,346 shares of Series E convertible preferred stock to the Series E investors for a purchase price of $0.00001 per share pursuant to the terms of the gross-up provision.
In addition, in connection with SoftBank’s purchase of Series E convertible preferred stock, we also agreed to enter into a joint venture agreement with Softbank relating to the commercialization and distribution of our products throughout the JV Territory. Upon the incorporation of the Joint Venture, Guardant Health AMEA, Inc., in May 2018, SoftBank purchased 40,000 shares of common stock of the Joint Venture in exchange for $41.0 million in cash and we purchased 40,000 shares of common stock of the Joint Venture in exchange for $9.0 million in cash. We also entered into various ancillary agreements with the Joint Venture necessary to operate its business. Under the terms of the joint venture agreement, neither we nor SoftBank is obligated to make any further capital contribution, in cash or otherwise, to the Joint Venture. In the event that the Joint Venture requires any additional funding for its operations, the Joint Venture may seek debt financing from financial institutions or additional financing in debt or equity from its major shareholders, which will be on a
pro rata
basis among such shareholders unless such shareholders agree otherwise.
Initial public offering
On October 9, 2018, we completed an initial public offering, or the IPO, in which we issued and sold
14,375,000
shares of our common stock at a price of $19.00 per share. We received net proceeds of
$249.5 million
after deducting underwriting discounts and commissions and offering expenses payable by us. All then-outstanding warrants to purchase our common stock were exercised prior to the completion of the IPO. In addition, in connection with the IPO, all shares of our then-outstanding convertible preferred stock were automatically converted into
58,264,577
shares of our common stock, and all then-outstanding warrants to purchase our convertible preferred stock were automatically converted into warrants to purchase
7,636
shares of our common stock.
82
Results of operations
The following table set forth the significant components of our results of operations for the periods presented.
|
Year Ended December 31,
|
|||||||||||
|
2018
|
2017
|
2016
|
|||||||||
|
(in thousands)
|
|||||||||||
|
Revenue:
|
|||||||||||
|
Precision oncology testing
|
$
|
78,407
|
|
$
|
42,088
|
|
$
|
24,496
|
|
||
|
Development services
|
12,232
|
|
7,754
|
|
753
|
|
|||||
|
Total revenue
|
90,639
|
|
49,842
|
|
25,249
|
|
|||||
|
Costs and operating expenses:
|
|||||||||||
|
Cost of precision oncology testing
(1)(2)
|
39,846
|
|
28,883
|
|
22,065
|
|
|||||
|
Cost of development services
|
3,364
|
|
2,735
|
|
59
|
|
|||||
|
Research and development expense
(1)(2)
|
50,714
|
|
25,562
|
|
10,859
|
|
|||||
|
Sales and marketing expense
(1)(2)
|
53,465
|
|
32,497
|
|
26,192
|
|
|||||
|
General and administrative expense
(1)(2)
|
36,192
|
|
36,777
|
|
9,921
|
|
|||||
|
Total costs and operating expenses
|
183,581
|
|
126,454
|
|
69,096
|
|
|||||
|
Loss from operations
|
(92,942
|
)
|
(76,612
|
)
|
(43,847
|
)
|
|||||
|
Interest income
|
5,266
|
|
2,234
|
|
733
|
|
|||||
|
Interest expense
|
(1,251
|
)
|
(2,702
|
)
|
(3,018
|
)
|
|||||
|
Loss on debt extinguishment
|
—
|
|
(5,075
|
)
|
—
|
|
|||||
|
Other income (expense), net
|
4,702
|
|
(1,059
|
)
|
(1
|
)
|
|||||
|
Loss before provision for income taxes
|
(84,225
|
)
|
(83,214
|
)
|
(46,133
|
)
|
|||||
|
Provision for income taxes
|
38
|
|
7
|
|
6
|
|
|||||
|
Net loss
|
$
|
(84,263
|
)
|
$
|
(83,221
|
)
|
$
|
(46,139
|
)
|
||
|
(1)
|
Amounts include stock-based compensation expense as follows:
|
|
Year Ended December 31,
|
|||||||||||
|
2018
|
2017
|
2016
|
|||||||||
|
(in thousands)
|
|||||||||||
|
Cost of precision oncology testing
|
$
|
512
|
|
$
|
162
|
|
$
|
225
|
|
||
|
Research and development expense
|
1,684
|
|
507
|
|
479
|
|
|||||
|
Sales and marketing expense
|
1,727
|
|
80
|
|
1,031
|
|
|||||
|
General and administrative expense
|
2,928
|
|
2,921
|
|
236
|
|
|||||
|
Total stock-based compensation expense
|
$
|
6,851
|
|
$
|
3,670
|
|
$
|
1,971
|
|
||
|
(2)
|
Amounts include compensation expenses associated with repurchase of common stock as follows:
|
|
Year Ended December 31,
|
|||||||||||
|
2018
|
2017
|
2016
|
|||||||||
|
(in thousands)
|
|||||||||||
|
Cost of precision oncology testing
|
$
|
—
|
|
$
|
72
|
|
$
|
2
|
|
||
|
Research and development expense
|
—
|
|
250
|
|
67
|
|
|||||
|
Sales and marketing expense
|
—
|
|
659
|
|
56
|
|
|||||
|
General and administrative expense
|
157
|
|
9,672
|
|
—
|
|
|||||
|
Total compensation expense associated with repurchase of common stock
|
$
|
157
|
|
$
|
10,653
|
|
$
|
125
|
|
||
83
Comparison of the Years Ended December 31, 2018 and 2017
Revenue
|
Year Ended December 31,
|
Change
|
|||||||||||||
|
2018
|
2017
|
$
|
%
|
|||||||||||
|
(in thousands)
|
||||||||||||||
|
Precision oncology testing
|
$
|
78,407
|
|
$
|
42,088
|
|
$
|
36,319
|
|
86
|
%
|
|||
|
Development services
|
12,232
|
|
7,754
|
|
4,478
|
|
58
|
%
|
||||||
|
Total revenue
|
$
|
90,639
|
|
$
|
49,842
|
|
$
|
40,797
|
|
82
|
%
|
|||
Total revenue was
$90.6 million
for the year ended December 31, 2018 compared to
$49.8 million
for the year ended December 31, 2017, an increase of
$40.8 million
, or
82%
.
Precision oncology testing revenue increased to
$78.4 million
for the year ended
December 31, 2018
from
$42.1 million
for the year ended
December 31, 2017
, an increase of
$36.3 million
, or
86%
. This increase in precision oncology testing revenue was primarily due to an increase in tests performed. Precision oncology tests for clinical customers increased to 29,238 for the year ended
December 31, 2018
from 23,759 for the year ended
December 31, 2017
(excluding 354 and 1,867 tests in 2018 and 2017, respectively, from a customer that in March 2018 began processing tests in-house)
mainly due to an increase in the number of physicians ordering our Guardant360 test. Precision oncology revenue from tests for clinical customers, which we have generally recognized as cash payments as received, was $43.7 million for the year ended
December 31, 2018
and $24.5 million for the year ended
December 31, 2017
, respectively. Cash receipts increased due to increases in tests for clinical customers and increases in commercial payer payments that were beneficially affected by the Protecting Access to Medicare Act of 2014. Precision oncology tests for biopharmaceutical customers increased to 10,370 for the year ended
December 31, 2018
from 6,286 for the year ended
December 31, 2017
due to an increase in the number of biopharmaceutical customers and their contracted projects. The average selling price of precision oncology tests for biopharmaceutical customers increased for the year ended
December 31, 2018
, compared to the year ended
December 31, 2017
, due to introduction at the end of 2017 of our GuardantOMNI test, which has a higher selling price than the Guardant360 test.
Development services revenue increased to
$12.2 million
for the year ended
December 31, 2018
from
$7.8 million
for the year ended
December 31, 2017
, an increase of
$4.5 million
, or
58%
. This increase in development services revenue was due to revenue received from new projects in 2018, mainly new projects related to companion diagnostic development and regulatory approval services to biopharmaceutical customers, and from completion in 2018 of a lab installation project mainly performed in 2017.
Costs and operating expenses
Cost of precision oncology testing
|
Year Ended December 31,
|
Change
|
|||||||||||||
|
2018
|
2017
|
$
|
%
|
|||||||||||
|
(in thousands)
|
||||||||||||||
|
Cost of precision oncology testing
|
$
|
39,846
|
|
$
|
28,883
|
|
$
|
10,963
|
|
38
|
%
|
|||
Cost of precision oncology testing revenue was
$39.8 million
for the year ended
December 31, 2018
compared to
$28.9 million
for the year ended
December 31, 2017
, an increase of
$11.0 million
, or
38%
. This increase in cost of precision oncology testing was primarily due to a $4.8 million increase in material costs, a $4.7 million increase in labor and manufacturing overhead costs, and a $1.2 million increase in other costs including costs related to freight, royalties and curation of test results for physicians.
84
Cost of development services
|
Year Ended December 31,
|
Change
|
|||||||||||||
|
2018
|
2017
|
$
|
%
|
|||||||||||
|
(in thousands)
|
||||||||||||||
|
Cost of development services
|
$
|
3,364
|
|
$
|
2,735
|
|
$
|
629
|
|
23
|
%
|
|||
Cost of development services was
$3.4 million
for the year ended
December 31, 2018
compared to
$2.7 million
for the year ended
December 31, 2017
, an increase of
$0.6 million
, or
23%
. Costs include material and labor costs incurred after technological feasibility was achieved on the lab installation and development programs.
Research and development expense
|
Year Ended December 31,
|
Change
|
|||||||||||||
|
2018
|
2017
|
$
|
%
|
|||||||||||
|
(in thousands)
|
||||||||||||||
|
Research and development
|
$
|
50,714
|
|
$
|
25,562
|
|
$
|
25,152
|
|
98
|
%
|
|||
Research and development expenses were
$50.7 million
for the year ended
December 31, 2018
compared to
$25.6 million
for the year ended
December 31, 2017
, an increase of
$25.2 million
, or
98%
. This increase in research and development expense was primarily due to an increase of
$9.7 million
in personnel-related costs for employees in our research and development group, and an increase of
$5.6 million
related to allocated facilities and information technology infrastructure costs as we increased our headcount to support continued investment in our technology. This increase is also attributable to an increase of
$5.3 million
in material costs relating to the development of our LUNAR programs, the preparation of our Guadant360 submission to the FDA, and the continuous improvement in our Guardant360 and GuardantOMNI liquid biopsy panels, and an increase of
$2.4 million
in development consulting fees.
Sales and marketing expense
|
Year Ended December 31,
|
Change
|
|||||||||||||
|
2018
|
2017
|
$
|
%
|
|||||||||||
|
(in thousands)
|
||||||||||||||
|
Sales and marketing
|
$
|
53,465
|
|
$
|
32,497
|
|
$
|
20,968
|
|
65
|
%
|
|||
Selling and marketing expenses were
$53.5 million
for the year ended
December 31, 2018
compared to
$32.5 million
for the year ended
December 31, 2017
, an increase of
$21.0 million
, or
65%
. This increase was primarily due to an increase of
$10.8 million
in personnel-related costs associated with the expansion of our commercial organization, an increase of
$4.2 million
related to allocated facilities and information technology infrastructure costs, an increase of
$2.5 million
in professional service expenses related to marketing activities, and an increase of
$2.0 million
in travel expenses.
General and administrative expense
|
Year Ended December 31,
|
Change
|
|||||||||||||
|
2018
|
2017
|
$
|
%
|
|||||||||||
|
(in thousands)
|
||||||||||||||
|
General and administrative
|
$
|
36,192
|
|
$
|
36,777
|
|
$
|
(585
|
)
|
(2
|
)%
|
|||
General and administrative expenses were
$36.2 million
for the year ended
December 31, 2018
compared to
$36.8 million
for the year ended
December 31, 2017
, a decrease of
$0.6 million
, or
2%
. This decrease was primarily due to
$9.7 million
in compensation expenses that we recognized in 2017 in connection with the repurchases of common stock from certain executive officers and employees, compared to compensation expenses of
$0.2 million
recognized in 2018 related to the repurchase of common stock from an employee. This decrease was largely offset by increases in 2018
85
of
$4.9 million
in personnel-related costs as we increased our headcount, and of
$3.6 million
in professional service expenses related to outside legal, accounting, consulting and IT services.
Interest income
|
Year Ended December 31,
|
Change
|
|||||||||||||
|
2018
|
2017
|
$
|
%
|
|||||||||||
|
(in thousands)
|
||||||||||||||
|
Interest income
|
$
|
5,266
|
|
$
|
2,234
|
|
$
|
3,032
|
|
136
|
%
|
|||
Interest income was
$5.3 million
for the year ended
December 31, 2018
compared to
$2.2 million
for the year ended
December 31, 2017
, an increase of
$3.0 million
, or
136%
. This increase was primarily due to a significant increase in cash, cash equivalents and marketable securities during 2018 primarily as a result of cash received from the IPO in October 2018 and Series E convertible preferred stock financing in May 2017.
Interest expense
|
Year Ended December 31,
|
Change
|
|||||||||||||
|
2018
|
2017
|
$
|
%
|
|||||||||||
|
(in thousands)
|
||||||||||||||
|
Interest expense
|
$
|
1,251
|
|
$
|
2,702
|
|
$
|
(1,451
|
)
|
(54
|
)%
|
|||
Interest expense was
$1.3 million
for the year ended
December 31, 2018
compared to
$2.7 million
for the year ended
December 31, 2017
, a decrease of
$1.5 million
, or
54%
. This decrease was primarily due to the repayment of our debt in June 2017, partially offset by interest incurred on an obligation related to a royalty in connection with a license agreement entered into in January 2017.
Loss on debt extinguishment
|
Year Ended December 31,
|
Change
|
|||||||||||||
|
2018
|
2017
|
$
|
%
|
|||||||||||
|
(in thousands)
|
||||||||||||||
|
Loss on debt extinguishment
|
$
|
—
|
|
$
|
(5,075
|
)
|
$
|
5,075
|
|
(100
|
)%
|
|||
Loss on debt extinguishment was
$5.1 million
for the year ended
December 31, 2017
. There was no similar charge for the year ended
December 31, 2018
. This loss was due to our repayment in June 2017 of the outstanding principal balance and interest on our term loan and buyout of the associated royalty obligation prior to the loan’s maturity.
Other income (expense), net
|
Year Ended December 31,
|
Change
|
||||||||||||
|
2018
|
2017
|
$
|
%
|
||||||||||
|
(in thousands)
|
|||||||||||||
|
Other income (expense), net
|
$
|
4,702
|
|
$
|
(1,059
|
)
|
$
|
5,761
|
|
*
|
|||
* Not meaningful
Other income (expense), net included a gain of $4.25 million for settlement of a commercial legal dispute for the year ended
December 31, 2018
. There was no similar charge or gain for the year ended
December 31, 2017
.
Other income (expense), net also included foreign currency exchange gains of
$0.4 million
for the year ended
December 31, 2018
and foreign currency exchange losses of
$1.1 million
for the year ended
December 31, 2017
. This increase was primarily due to an obligation denominated in Euros in connection with a license agreement entered into in January 2017.
86
Provision for income taxes
|
Year Ended December 31,
|
Change
|
|||||||||||||
|
2018
|
2017
|
$
|
%
|
|||||||||||
|
(in thousands)
|
||||||||||||||
|
Provision for income taxes
|
$
|
38
|
|
$
|
7
|
|
$
|
31
|
|
443
|
%
|
|||
Provision for income taxes was very small for the years ended
December 31, 2018
and
2017
due to the losses incurred by us. The net change was insignificant.
Comparison of the Years Ended December 31, 2017 and 2016
Revenue
|
Year Ended December 31,
|
Change
|
|||||||||||||
|
2017
|
2016
|
$
|
%
|
|||||||||||
|
(in thousands)
|
||||||||||||||
|
Precision oncology testing
|
$
|
42,088
|
|
$
|
24,496
|
|
$
|
17,592
|
|
72
|
%
|
|||
|
Development services
|
7,754
|
|
753
|
|
7,001
|
|
930
|
%
|
||||||
|
Total revenue
|
$
|
49,842
|
|
$
|
25,249
|
|
$
|
24,593
|
|
97
|
%
|
|||
Total revenue was
$49.8 million
for the year ended
December 31, 2017
compared to
$25.2 million
for the year ended
December 31, 2016
, an increase of
$24.6 million
, or
97%
.
Precision oncology testing revenue increased to
$42.1 million
for the year ended
December 31, 2017
from
$24.5 million
in the year ended
December 31, 2016
, an increase of
$17.6 million
, or
72%
. This increase in precision oncology testing revenue was primarily due to an increase in tests performed. Precision oncology tests for clinical customers increased to 25,626 for the year ended
December 31, 2017
from 18,663 for the year ended
December 31, 2016
mainly due to an increase in the number of physicians ordering our Guardant360 test. Precision oncology tests for biopharmaceutical customers increased to 6,286 for the year ended
December 31, 2017
from 1,830 for the year ended
December 31, 2016
due to an increase in the number of biopharmaceutical customers and their contracted projects.
Development service revenue increased to
$7.8 million
for the year ended
December 31, 2017
from
$0.8 million
in the year ended
December 31, 2016
, an increase of
$7.0 million
, or
930%
. This increase in development service revenue was due to revenue received from new projects in 2017, mainly new projects related to services to biopharmaceutical customers for development of our GuardantOMNI test and a lab installation project.
Costs and operating expenses
Cost of precision oncology testing
|
Year Ended December 31,
|
Change
|
|||||||||||||
|
2017
|
2016
|
$
|
%
|
|||||||||||
|
(in thousands)
|
||||||||||||||
|
Cost of precision oncology testing
|
$
|
28,883
|
|
$
|
22,065
|
|
$
|
6,818
|
|
31
|
%
|
|||
Cost of precision oncology testing revenue was
$28.9 million
for the year ended
December 31, 2017
compared to
$22.1 million
for the year ended
December 31, 2016
, an increase of
$6.8 million
, or
31%
. This increase in cost of precision oncology testing was primarily due to a $2.7 million increase in material costs, a $2.5 million increase in production labor and overhead costs, and a $1.6 million increase in other costs including costs related to freight, royalties and curation of test results for physicians.
87
Cost of development services
|
Year Ended December 31,
|
Change
|
||||||||||||
|
2017
|
2016
|
$
|
%
|
||||||||||
|
(in thousands)
|
|||||||||||||
|
Cost of development services
|
$
|
2,735
|
|
$
|
59
|
|
$
|
2,676
|
|
*
|
|||
* Not meaningful
Cost of development services was
$2.7 million
for the year ended
December 31, 2017
compared to
$0.1 million
for the year ended
December 31, 2016
, an increase of
$2.7 million
. This increase in cost of development services revenue was primarily due to the increase in development services provided to customers. Costs include material and labor costs incurred after technological feasibility was achieved on these development programs.
Research and development expense
|
Year Ended December 31,
|
Change
|
|||||||||||||
|
2017
|
2016
|
$
|
%
|
|||||||||||
|
(in thousands)
|
||||||||||||||
|
Research and development
|
$
|
25,562
|
|
$
|
10,859
|
|
$
|
14,703
|
|
135
|
%
|
|||
Research and development expenses were
$25.6 million
for the year ended
December 31, 2017
compared to
$10.9 million
for the year ended
December 31, 2016
, an increase of
$14.7 million
, or
135%
. This increase in research and development expense was primarily due to an increase of $6.5 million in personnel-related costs for employees in our research and development group as we increased our headcount to support continued investment in our technology. This increase is also attributable to $2.7 million in material costs incurred for the development of the GuardantOMNI liquid biopsy panel and development of technology in connection with a lab installation project prior to achievement of technological feasibility in each project, and an increase of $2.6 million in development consulting fees.
Sales and marketing expense
|
Year Ended December 31,
|
Change
|
|||||||||||||
|
2017
|
2016
|
$
|
%
|
|||||||||||
|
(in thousands)
|
||||||||||||||
|
Sales and marketing
|
$
|
32,497
|
|
$
|
26,192
|
|
$
|
6,305
|
|
24
|
%
|
|||
Selling and marketing expenses were
$32.5 million
for the year ended
December 31, 2017
compared to
$26.2 million
for the year ended
December 31, 2016
, an increase of
$6.3 million
, or
24%
. This increase was primarily due to an increase of $6.3 million in personnel-related costs for expansion of our sales organization and an increase of $0.9 million related to allocated facilities and information technology infrastructure costs, partially offset by a $1.0 million decrease in stock-based compensation expense.
General and administrative expense
|
Year Ended December 31,
|
Change
|
|||||||||||||
|
2017
|
2016
|
$
|
%
|
|||||||||||
|
(in thousands)
|
||||||||||||||
|
General and administrative
|
$
|
36,777
|
|
$
|
9,921
|
|
$
|
26,856
|
|
271
|
%
|
|||
General and administrative expenses were
$36.8 million
for the year ended
December 31, 2017
compared to
$9.9 million
for the year ended
December 31, 2016
, an increase of
$26.9 million
, or
271%
. This increase was primarily due to an increase of $9.7 million in compensation expenses as we repurchased common stock from certain executive officers and an increase of $6.3 million in personnel-related costs for our employees, including a $2.7 million increase in stock-based compensation as we increased our headcount. We also had an increase of $8.0 million in legal expenses primarily due to $4.3 million in costs associated with ongoing and recently settled patent lawsuits and a recently settled commercial legal dispute and an increase of $0.9 million related to allocated facilities and information technology infrastructure costs.
88
Interest income
|
Year Ended December 31,
|
Change
|
|||||||||||||
|
2017
|
2016
|
$
|
%
|
|||||||||||
|
(in thousands)
|
||||||||||||||
|
Interest income
|
$
|
2,234
|
|
$
|
733
|
|
$
|
1,501
|
|
205
|
%
|
|||
Interest income was
$2.2 million
for the year ended
December 31, 2017
compared to
$0.7 million
for the year ended
December 31, 2016
, an increase of
$1.5 million
, or
205%
. This increase was primarily due to a significant increase in cash, cash equivalents and marketable securities in 2017 primarily as a result of cash received from our Series E convertible preferred stock financing.
Interest expense
|
Year Ended December 31,
|
Change
|
|||||||||||||
|
2017
|
2016
|
$
|
%
|
|||||||||||
|
(in thousands)
|
||||||||||||||
|
Interest expense
|
$
|
2,702
|
|
$
|
3,018
|
|
$
|
(316
|
)
|
(10
|
)%
|
|||
Interest expense was
$2.7 million
for the year ended
December 31, 2017
compared to
$3.0 million
for the year ended
December 31, 2016
, a decrease of
$0.3 million
, or
10%
. This decrease was primarily due to the repayment of our debt in June 2017, partially offset by interest incurred on an obligation related to a royalty in connection with a license agreement entered into in January 2017.
Loss on debt extinguishment
|
Year Ended December 31,
|
Change
|
||||||||||||
|
2017
|
2016
|
$
|
%
|
||||||||||
|
(in thousands)
|
|||||||||||||
|
Loss on debt extinguishment
|
$
|
5,075
|
|
$
|
—
|
|
$
|
5,075
|
|
*
|
|||
* Not meaningful
Loss on debt extinguishment was
$5.1 million
for the year ended
December 31, 2017
. There was no similar charge in 2016. This loss was due to our repayment in June 2017 of the outstanding principal balance and interest on our term loan and buyout of the associated royalty obligation prior to the loan’s maturity.
Other income (expense), net
|
Year Ended December 31,
|
Change
|
||||||||||||
|
2017
|
2016
|
$
|
%
|
||||||||||
|
(in thousands)
|
|||||||||||||
|
Other income (expense), net
|
$
|
(1,059
|
)
|
$
|
(1
|
)
|
$
|
(1,058
|
)
|
*
|
|||
* Not meaningful
Other income (expense), net included foreign currency exchange losses of $1.0 million for the year ended
December 31, 2017
. This increase was primarily due to an obligation denominated in Euros in connection with a license agreement entered into in January 2017.
89
Provision for income taxes
|
Year Ended December 31,
|
Change
|
|||||||||||||
|
2017
|
2016
|
$
|
%
|
|||||||||||
|
(in thousands)
|
||||||||||||||
|
Provision for income taxes
|
$
|
7
|
|
$
|
6
|
|
$
|
1
|
|
17
|
%
|
|||
Provision for income taxes was very small for the years ended
December 31, 2017
and
2016
due to the losses incurred by us. The net change was insignificant.
Quarterly results of operations
The following tables set forth our unaudited quarterly consolidated statements of operations data for each of the eight quarters in the 24-month period ended
December 31, 2018
. The information for each of these quarters has been prepared in accordance with generally accepted accounting principles in the United States of America and on the same basis as our audited consolidated financial statements included elsewhere in this Annual Report on Form 10-K. In the opinion of management, reflect all adjustments, which include only normal recurring adjustments, necessary for the fair presentation of our results of operations. This data should be read in conjunction with our audited financial statements and related notes included elsewhere in this Annual Report on Form 10-K. These quarterly operating results are not necessarily indicative of our operating results for the full year or any future period.
90
|
Three Months Ended
|
||||||||||||||||||||||||||||||||
|
December 31, 2018
|
September 30, 2018
|
June 30,
2018
|
March 31, 2018
|
December 31, 2017
|
September 30, 2017
|
June 30,
2017
|
March 31, 2017
|
|||||||||||||||||||||||||
|
(unaudited)
|
||||||||||||||||||||||||||||||||
|
(in thousands)
|
||||||||||||||||||||||||||||||||
|
Revenue:
|
||||||||||||||||||||||||||||||||
|
Precision oncology testing
|
$
|
28,096
|
|
$
|
18,298
|
|
$
|
17,822
|
|
$
|
14,191
|
|
$
|
14,161
|
|
$
|
10,253
|
|
$
|
9,328
|
|
$
|
8,346
|
|
||||||||
|
Development services
|
4,777
|
|
3,394
|
|
1,560
|
|
2,501
|
|
5,841
|
|
879
|
|
868
|
|
166
|
|
||||||||||||||||
|
Total revenue
|
32,873
|
|
21,692
|
|
19,382
|
|
16,692
|
|
20,002
|
|
11,132
|
|
10,196
|
|
8,512
|
|
||||||||||||||||
|
Costs and operating expenses:
|
||||||||||||||||||||||||||||||||
|
Cost of precision oncology testing
|
12,624
|
|
9,671
|
|
9,506
|
|
8,045
|
|
7,955
|
|
7,603
|
|
6,954
|
|
6,371
|
|
||||||||||||||||
|
Cost of development services
|
1,323
|
|
380
|
|
453
|
|
1,208
|
|
1,193
|
|
1,058
|
|
481
|
|
3
|
|
||||||||||||||||
|
Research and development expense
|
16,652
|
|
14,253
|
|
11,554
|
|
8,255
|
|
8,120
|
|
7,246
|
|
5,494
|
|
4,702
|
|
||||||||||||||||
|
Sales and marketing expense
|
17,114
|
|
13,464
|
|
11,575
|
|
11,312
|
|
9,556
|
|
7,808
|
|
7,929
|
|
7,204
|
|
||||||||||||||||
|
General and administrative expense
|
12,547
|
|
8,129
|
|
8,997
|
|
6,519
|
|
8,795
|
|
16,095
|
|
6,675
|
|
5,212
|
|
||||||||||||||||
|
Total costs and operating expenses
|
60,260
|
|
45,897
|
|
42,085
|
|
35,339
|
|
35,619
|
|
39,810
|
|
27,533
|
|
23,492
|
|
||||||||||||||||
|
Loss from operations
|
(27,387
|
)
|
(24,205
|
)
|
(22,703
|
)
|
(18,647
|
)
|
(15,617
|
)
|
(28,678
|
)
|
(17,337
|
)
|
(14,980
|
)
|
||||||||||||||||
|
Interest income
|
2,334
|
|
958
|
|
989
|
|
985
|
|
1,012
|
|
657
|
|
360
|
|
205
|
|
||||||||||||||||
|
Interest expense
|
(299
|
)
|
(304
|
)
|
(317
|
)
|
(331
|
)
|
(304
|
)
|
(303
|
)
|
(1,056
|
)
|
(1,039
|
)
|
||||||||||||||||
|
Loss on debt extinguishment
|
—
|
|
—
|
|
—
|
|
—
|
|
—
|
|
—
|
|
(5,075
|
)
|
—
|
|
||||||||||||||||
|
Other income (expense), net
|
115
|
|
43
|
|
395
|
|
4,149
|
|
(144
|
)
|
(266
|
)
|
(445
|
)
|
(204
|
)
|
||||||||||||||||
|
Loss before provision for income taxes
|
(25,237
|
)
|
(23,508
|
)
|
(21,636
|
)
|
(13,844
|
)
|
(15,053
|
)
|
(28,590
|
)
|
(23,553
|
)
|
(16,018
|
)
|
||||||||||||||||
|
Provision for income taxes
|
35
|
|
—
|
|
3
|
|
—
|
|
7
|
|
—
|
|
—
|
|
—
|
|
||||||||||||||||
|
Net loss
|
(25,272
|
)
|
(23,508
|
)
|
(21,639
|
)
|
(13,844
|
)
|
(15,060
|
)
|
(28,590
|
)
|
(23,553
|
)
|
(16,018
|
)
|
||||||||||||||||
|
Fair value adjustment of redeemable noncontrolling interest
|
150
|
|
(950
|
)
|
—
|
|
—
|
|
—
|
|
—
|
|
—
|
|
—
|
|
||||||||||||||||
|
Net loss attributable to Guardant Health, Inc.
|
$
|
(25,122
|
)
|
$
|
(24,458
|
)
|
$
|
(21,639
|
)
|
$
|
(13,844
|
)
|
$
|
(15,060
|
)
|
$
|
(28,590
|
)
|
$
|
(23,553
|
)
|
$
|
(16,018
|
)
|
||||||||
|
Deemed dividend related to repurchase of Series A convertible preferred stock
|
—
|
|
—
|
|
—
|
|
—
|
|
—
|
|
(4,716
|
)
|
—
|
|
—
|
|
||||||||||||||||
|
Deemed dividend related to change in conversion rate of Series D convertible preferred stock
|
—
|
|
—
|
|
—
|
|
—
|
|
—
|
|
—
|
|
(1,058
|
)
|
—
|
|
||||||||||||||||
|
Net loss attributable to Guardant Health, Inc. common stockholders
|
$
|
(25,122
|
)
|
$
|
(24,458
|
)
|
$
|
(21,639
|
)
|
$
|
(13,844
|
)
|
$
|
(15,060
|
)
|
$
|
(33,306
|
)
|
$
|
(24,611
|
)
|
$
|
(16,018
|
)
|
||||||||
|
Net loss per share attributable to Guardant Health, Inc. common stockholders, basic and diluted
|
$
|
(0.30
|
)
|
$
|
(1.94
|
)
|
$
|
(1.75
|
)
|
$
|
(1.16
|
)
|
$
|
(1.27
|
)
|
$
|
(2.76
|
)
|
$
|
(1.85
|
)
|
$
|
(1.22
|
)
|
||||||||
|
Weighted-average shares used in computing net loss per share attributable to Guardant Health, Inc. common stockholders, basic and diluted
|
84,123
|
|
12,582
|
|
12,388
|
|
11,920
|
|
11,851
|
|
12,073
|
|
13,276
|
|
13,182
|
|
||||||||||||||||
91
Liquidity and capital resources
We have incurred losses and negative cash flows from operations since our inception, and as of
December 31, 2018
, we had an accumulated deficit of
$280.8 million
. We expect to incur additional operating losses in the near future and our operating expenses will increase as we continue to expand our sales organization, increase our marketing efforts to drive market adoption of our Guardant360 and GuardantOMNI tests, invest in clinical trials and develop new product offerings from our research programs, including our LUNAR programs. As demand for our Guardant360 and GuardantOMNI tests are expected to continue to increase from physicians and biopharmaceutical companies, we anticipate that our capital expenditure requirements will also increase in order to build additional capacity.
We have funded our operations to date principally from the sale of stock and revenue from precision oncology testing and development services. As of
December 31, 2018
, we had cash and cash equivalents of
$140.5 million
and marketable securities of
$356.0 million
. Cash in excess of immediate requirements is invested in accordance with our investment policy, primarily with a view to liquidity and capital preservation. Currently, our funds are held in marketable securities consisting of United States treasury securities and corporate bonds.
Based on our current business plan, we believe our current cash, cash equivalents and marketable securities and anticipated cash flow from operations will be sufficient to meet our anticipated cash requirements over at least the next 12 months from the date of this report. We may consider raising additional capital to expand our business, to pursue strategic investments, to take advantage of financing opportunities or for other reasons. As revenue from precision oncology testing and development service is expected to grow, we expect our accounts receivable and inventory balances to increase. Any increase in accounts receivable and inventory may not be completely offset by increases in accounts payable and accrued expenses, which could result in greater working capital requirements.
If our available cash, cash equivalents and marketable securities and anticipated cash flow from operations are insufficient to satisfy our liquidity requirements including because of lower demand for our products as a result of lower than currently expected rates of reimbursement from our customers or other risks described in this report, we may seek to sell additional common or preferred equity or convertible debt securities, enter into a credit facility or another form of third-party funding or seek other debt financing. The sale of equity and convertible debt securities may result in dilution to our stockholders and, in the case of preferred equity securities or convertible debt, those securities could provide for rights, preferences or privileges senior to those of our common stock. The terms of debt securities issued or borrowings pursuant to a credit agreement could impose significant restrictions on our operations. If we raise funds through collaborations and licensing arrangements, we might be required to relinquish significant rights to our platform technologies or products or grant licenses on terms that are not favorable to us. Additional capital may not be available to us on reasonable terms, or at all.
Cash flows
The following table summarizes our cash flows for the periods presented:
|
Year Ended December 31,
|
|||||||||||
|
2018
|
2017
|
2016
|
|||||||||
|
(in thousands)
|
|||||||||||
|
Cash used in operating activities
|
$
|
(72,185
|
)
|
$
|
(72,235
|
)
|
$
|
(36,710
|
)
|
||
|
Cash provided by (used in) investing activities
|
(153,028
|
)
|
(170,416
|
)
|
26,202
|
|
|||||
|
Cash provided by financing activities
|
293,161
|
|
281,656
|
|
39,840
|
|
|||||
Operating activities
Cash used in operating activities during the year ended
December 31, 2018
was
$72.2 million
, which resulted from a net loss of
$84.3 million
and net change in our operating assets and liabilities of
$1.1 million
, partially offset by non-cash charges of
$13.2 million
. Non-cash charges primarily consisted of
$7.1 million
of depreciation and amortization and
$6.9 million
of stock-based compensation, partially offset by
$0.4 million
of amortization of discount on investment. The net change in our operating assets and liabilities was primarily the result of a
$22.9 million
increase in accounts receivable driven by higher sales to biopharmaceutical customers, a
$3.7 million
increase in prepaid expenses and other current assets and a
$1.8 million
increase in inventory due to higher testing volumes, partially offset by a
$13.0 million
increase in deferred revenue, an
$8.1 million
increase in accrued compensation due to increased personnel, a
$5.0 million
increase in accounts payable and a
$1.3 million
increase in deferred rent.
92
Cash used in operating activities during the year ended
December 31, 2017
was
$72.2 million
, which resulted from a net loss of
$83.2 million
and net change in our operating assets and liabilities of
$5.0 million
, partially offset by non-cash charges of
$16.0 million
. Non-cash charges primarily consisted of
$5.2 million
of depreciation and amortization,
$5.1 million
of loss on debt extinguishment,
$3.7 million
of stock-based compensation,
$1.0 million
of unrealized translation losses on a royalty obligation denominated in Euros,
$0.7 million
of non-cash interest expense and
$0.4 million
of amortization of premium or discount on marketable securities. The net change in our operating assets and liabilities was primarily the result of a
$9.3 million
increase in accounts receivable driven by higher sales to biopharmaceutical customers, a
$4.5 million
increase in inventory due to higher testing volumes and a
$0.9 million
increase in other assets, partially offset by a
$4.7 million
increase in accrued expenses and other current liabilities, a
$2.3 million
increase in accrued compensation due to increased personnel, a
$1.3 million
increase in accounts payable and a
$1.2 million
increase in deferred revenue.
Cash used in operating activities during the year ended
December 31, 2016
was
$36.7 million
, which resulted from a net loss of
$46.1 million
, partially offset by non-cash charges of
$7.0 million
and net change in our operating assets and liabilities of
$2.4 million
. Non-cash charges primarily consisted of
$3.7 million
of depreciation and amortization,
$2.0 million
of stock-based compensation and
$1.0 million
of non-cash interest expense. The net change in our operating assets and liabilities was primarily the result of a
$2.1 million
increase in accounts payable, a
$1.7 million
increase in deferred revenue, a
$1.4 million
increase in accrued compensation and a $1.0 million increase in accrued expense and deferred rent, partially offset by a
$2.8 million
increase in accounts receivable and a
$0.6 million
increase in prepaid and other assets.
Investing activities
Cash used in investing activities during the year ended
December 31, 2018
was
$153.0 million
, which resulted primarily from purchases of marketable securities of
$287.5 million
and purchases of property and equipment of
$20.2 million
, partially offset by maturities of marketable securities of
$154.6 million
.
Cash used in investing activities during the year ended
December 31, 2017
was
$170.4 million
, which resulted primarily from purchases of marketable securities of
$236.8 million
, purchases of property and equipment of
$6.7 million
and payment related to a license agreement of
$2.3 million
, partially offset by maturity of marketable securities of
$75.4 million
.
Cash provided by investing activities during the year ended
December 31, 2016
was
$26.2 million
, which resulted primarily from maturities of marketable securities of
$369.4 million
, partially offset by purchases of marketable securities of
$341.4 million
and purchases of property and equipment of
$1.8 million
.
Financing activities
Cash provided by financing activities during the year ended
December 31, 2018
was
$293.2 million
, which was primarily due to proceeds from the IPO, net of underwriting discounts and commissions of
$254.0 million
, and net proceeds from sale of equity interests in noncontrolling interests of
$41.0 million
.
Cash provided by financing activities during the year ended
December 31, 2017
was
$281.7 million
, which was primarily due to proceeds from our issuances of Series E convertible preferred stock, net of issuance costs, of
$319.5 million
, partially offset by payment related to settlement of debt and buyout of royalty obligations of
$25.8 million
, repurchases of common stock of
$7.2 million
and repurchases of preferred stock of
$5.3 million
.
Cash provided by financing activities during the year ended
December 31, 2016
was
$39.8 million
, which was primarily due to proceeds from issuance of Series D convertible preferred stock, net of issuance costs, of
$40.0 million
.
93
Contractual obligations and commitments
Our contractual commitments will have an impact on our future liquidity. The following table summarizes our contractually committed future obligations as of
December 31, 2018
:
|
Payments due by period
|
|||||||||||||||||||
|
Total
|
|
Less than
1 year
|
|
1-3 years
|
|
3-5 years
|
|
More than 5 years
|
|
||||||||||
|
(in thousands)
|
|||||||||||||||||||
|
Operating lease obligations(1)
|
$
|
42,178
|
|
$
|
4,099
|
|
$
|
10,631
|
|
$
|
11,662
|
|
$
|
15,786
|
|
||||
|
Capital lease obligation(2)
|
285
|
|
141
|
|
144
|
|
—
|
|
—
|
|
|||||||||
|
Royalty obligation(3)
|
13,449
|
|
1,431
|
|
2,862
|
|
3,434
|
|
5,722
|
|
|||||||||
|
Total
|
$
|
55,912
|
|
$
|
5,671
|
|
$
|
13,637
|
|
$
|
15,096
|
|
$
|
21,508
|
|
||||
|
(1)
|
We lease our office and laboratory space in Redwood City, California under an operating lease that expires in December 2025. We also have operating leases for manufacturing and office equipment through February 2023.
|
|
(2)
|
As of
December 31, 2018
, we had two capital leases for our manufacturing equipment which expire at various dates through April 2021.
|
|
(3)
|
We have patent license agreements with four parties. Under these agreements, we have made one-time and milestone license fee payments that we have capitalized and are amortizing to expense ratably over the useful life of the applicable underlying patent rights. Under some of these agreements, we are obligated to pay low single-digit percentage running royalties on net sales where the patent right(s) are used in the product or service sold, subject to minimum annual royalties or fees in certain agreements.
|
Net operating loss carryforwards
Utilization of the net operating loss, or NOL, carryforwards and credits may be subject to a substantial annual limitation due to the ownership change limitations provided by the Internal Revenue Code of 1986, as amended, or the Internal Revenue Code, and similar state provisions. The annual limitation may result in the expiration of NOL carryforwards and credits before utilization. Current laws impose substantial restrictions on the utilization of NOL carryforwards and credits in the event of an “ownership change” within a three-year period as defined by the Internal Revenue Code Section 382, or Section 382. If there should be an ownership change, our ability to utilize our NOL carryforwards and credits could be limited. We have not performed a Section 382 analysis. Based on the available objective evidence, management determined that it was more likely than not that the net deferred tax assets would not be realizable as of
December 31, 2018
and
2017
. Accordingly, management applied a full valuation allowance against net deferred tax assets as of
December 31, 2018
and
2017
.
On December 22, 2017, the Tax Cuts and Jobs Act was signed into law. The new legislation decreased the U.S. corporate federal income tax rate from 35% to 21% effective January 1, 2018. The reduction in the tax rate resulted in a $21.3 million reduction in net deferred tax assets. There was no impact on our recorded deferred tax balances as the remeasurement of net deferred tax assets was offset by a change in valuation allowance for the same amount. Under the newly enacted federal income tax law, federal NOL incurred in 2018 and in future years may be carried forward indefinitely, but the deductibility of such NOL is limited. It is uncertain if and to what extent various states will conform to the newly enacted federal income tax law.
Off-balance sheet arrangements
As of
December 31, 2018
, we have not had any off-balance sheet arrangements as defined in the rules and regulations of the SEC.
Critical accounting policies and estimates
We have prepared our financial statements in accordance with accounting principles generally accepted in the United States of America (“GAAP”). Our preparation of these financial statements requires us to make estimates, assumptions and judgments that affect the reported amounts of assets, liabilities, expenses and related disclosures at the date of the financial statements, as well as revenue and expenses recorded during the reporting periods. We evaluate our estimates and judgments on an ongoing basis. We base our estimates on historical experience and on various other factors that we believe are reasonable under the circumstances, the results of which form the basis for making judgments about the carrying value of assets and liabilities that are not readily apparent from other sources. Actual results could therefore differ materially from these estimates under different assumptions or conditions.
94
While our significant accounting policies are described in more detail in Note 2 to our consolidated financial statements included elsewhere in this report, we believe the following accounting policies to be critical to the judgments and estimates used in the preparation of our financial statements.
Revenue recognition
We recognize revenue when all of the following criteria are met: (i) persuasive evidence of an arrangement exists; (ii) delivery has occurred; (iii) the fee is fixed or determinable; and (iv) collectability is reasonably assured. Criterion (i) is satisfied when we have an arrangement or contract in place. Criterion (ii) is satisfied when we deliver a test report corresponding to each sample, without further commercial obligations. Determination of criteria (iii) and (iv) are based on management’s judgments regarding whether the fee is fixed or determinable, and whether the collectability of the fee is reasonably assured. We recognize revenue from the sale of our precision oncology tests for clinical customers, including certain hospitals, cancer centers, other institutions and patients, at the time results of the test are reported to physicians, if criteria (i) through (iv) above are met.
We recognize revenue on a cash basis when we cannot conclude that criteria (iii) and (iv) have been met. Most of precision oncology tests requested by clinical customers are sold without a contracted engagement with a third-party payer; therefore, we experience significant variability in collections and do not have sufficient history to establish a predictable pattern of payment. Because the price is not fixed or determinable and collectability is not reasonably assured, we recognize revenue on a cash basis for sales of our liquid biopsy tests to clinical customers where collection depends on a third-party payer or the individual patient. We use judgment in our assessment of whether the fee is fixed or determinable and whether collectability is reasonably assured in determining when to recognize revenue. In 2018 we began to obtain agreements with certain payers that provided coverage and reimbursement for the testing of most lung cancer patients with our Guardant360 test. We have a limited history of payments under these agreements, including reimbursement by Medicare beginning in October 2018, therefore we recognized revenue on a cash basis for these clinical customers during 2018. Our precision oncology information services are delivered electronically, and as such there are no shipping or handling fees incurred by us or billed to customers.
Revenue from sales of our tests to biopharmaceutical customers are based on a negotiated price per test or on the basis of an agreement to provide certain testing volume, data access or biopharmaceutical research and development services over a defined period. We recognize the related revenue upon delivery of the test results, or over the period in which biopharmaceutical research and development services are provided, as appropriate.
Multiple-element arrangements
Contracts with biopharmaceutical customers can include precision oncology testing as well as various development services. Such contracts are primarily analyzed as multiple-element arrangements given the nature of the service deliverables. For development services performed, we are compensated in various ways, including: (i) through non-refundable regulatory and other developmental milestone payments; and (ii) through royalty and sales milestone payments. We perform development services as part of our normal activities. We record these payments as development services revenue in the statements of operations using a proportional performance model over the period which the unit of accounting is delivered or based on the level of effort expended to date over the total expected effort, whichever is considered the most appropriate measure of performance. For development of new products or services under these arrangements, costs incurred before technological feasibility is assured are included as research and development expenses in our statements of operations, while costs incurred thereafter are recorded as cost of development services.
For revenue arrangements with multiple deliverables, we evaluate each deliverable to determine whether it qualifies as a separate unit of accounting. This determination is based on whether the deliverable has stand-alone value to the customer and whether a general right of return exists. In assessing whether an item has standalone value, we consider factors such as the research, development and commercialization capabilities of a third party and the availability of the associated expertise in the general marketplace. In addition, we consider whether the other party in the arrangement can use the other deliverables for their intended purpose without the receipt of the remaining elements, whether the value of the deliverable is dependent on the undelivered items and whether there are other vendors that can provide the undelivered elements.
The consideration that is fixed or determinable is then allocated to each separate unit of accounting based on the relative selling price of each deliverable. We allocate the arrangement consideration following a hierarchy to determine the relative selling price to be used for allocating revenue to deliverables: (i) vendor-specific objective evidence of fair value, or VSOE, (ii) third-party evidence of selling price, or TPE, and (iii) best estimate of the selling price, or BESP if neither VSOE nor TPE is available. We typically use BESP to estimate the selling price, since we generally do not
95
have VSOE or TPE of selling price for our units of accounting under multiple-element arrangements. In developing the BESP for a unit of accounting, we consider applicable market conditions and estimated costs. We validate the BESP for units of accounting by evaluating whether changes in the key assumptions used to determine the BESP will have a significant effect on the allocation of arrangement consideration between multiple units of accounting. The consideration allocated to each unit of accounting is recognized as the related goods or services are delivered, limited to the consideration that is not contingent upon future deliverables. We use judgment in identifying the deliverables in our arrangements, assessing whether each deliverable is a separate unit of accounting, and in determining the best estimate of selling price for certain deliverables. We also use judgment in determining the period over which the deliverables are recognized in certain of our arrangements. Any amounts received that do not meet the criteria for revenue recognition are recorded as deferred revenue until such criteria are met.
We performed laboratory installation and maintenance services for one of our customers as part of a multiple-element arrangement entered into in 2017. We recognized certain revenue from our construction service deliverables in a multiple-element collaboration arrangement based on the completed-contract method. This method was used as we determined that we did not have the basis for estimating performance under the contract. Other construction service deliverables under that contract were recognized under the percentage-of-completion method due to our ability to make reasonably dependable estimates of the extent of progress toward contract completion. All construction services under this arrangement were completed in March 2018.
Milestones
We recognize payments that are contingent upon achievement of a substantive milestone in their entirety in the period in which the milestone is achieved. Milestones are defined as events that can only be achieved based on our performance and there is substantive uncertainty about whether the event will be achieved at the inception of the arrangement. Events that are contingent only on the passage of time or only on counterparty performance are not considered substantive milestones. Further, the amounts received must relate solely to prior performance, be reasonable relative to all of the deliverables and payment terms within the agreement and commensurate with our performance to achieve the milestone after commencement of the agreement. Any contingent payment that becomes payable upon achievement of events that are not considered substantive milestones are allocated to the units of accounting previously identified at the inception of an arrangement when the contingent payment is received, and revenue is recognized based on the revenue recognition criteria for each unit of accounting. Revenue from commercial milestone payments are recorded as revenue upon achievement of the milestone, assuming all other revenue recognition criteria are met.
Variable interest entity
We review agreements we enter into with third party entities, pursuant to which we may have a variable interest in the entity, in order to determine if the entity is a variable interest entity, or VIE. If the entity is a VIE, we assess whether or not we are the primary beneficiary of that entity. In determining whether we are the primary beneficiary of an entity, we apply a qualitative approach that determines whether we have both (1) the power to direct the economically significant activities of the entity and (2) the obligation to absorb losses of, or the right to receive benefits from, the entity that could potentially be significant to that entity. If we determine we are the primary beneficiary of a VIE, we consolidate the statements of operations and financial condition of the VIE into our consolidated financial statements. Accounting for the consolidation is based on our determination if the VIE meets the definition of a business or and asset. Assets, liabilities and noncotnrolling interests, excluding goodwill, of VIEs that are not determined to be businesses are recorded at fair value in our financial statements upon consolidation. Assets and liabilities that we have transferred to a VIE, after, or shortly before the date we became the primary beneficiary are recorded at the same amount at which the assets and liabilities would have been measured if they had not been transferred. Our determination about whether we should consolidate such VIEs is made continuously as changes to existing relationships or future transactions may result in a consolidation or deconsolidation event.
In connection with SoftBank’s purchase of our Series E convertible preferred stock, we entered into a joint venture agreement with an entity affiliated with SoftBank. In May 2018, we and SoftBank formed and capitalized the Joint Venture for the sale, marketing and distribution of our tests in the JV Territory. We expect to rely on the Joint Venture to accelerate commercialization of our products in Asia, the Middle East and Africa, with an initial focus on Japan. As of December 31, 2018, the Joint Venture is deemed to be a VIE and we are identified as the primary beneficiary of the VIE. Consequently, we have consolidated the financial position, results of operations and cash flows of the Joint Venture in our financial statements and all intercompany balances have been eliminated in consolidation.
The joint venture agreement also includes a put-call arrangement with respect to the shares of the Joint Venture held by SoftBank and its affiliates. Under certain specified circumstances and on terms specified in the joint venture
96
agreement, SoftBank will have a put right to cause us to purchase all shares of the Joint Venture held by SoftBank and its affiliates, and we will have a call right to purchase all such shares.
The noncontrolling interest held by SoftBank contains embedded put-call redemption features that are not solely within our control and has been classified outside of permanent equity in our consolidated balance sheets. The put-call feature embedded in the redeemable noncontrolling interest do not currently require bifurcation as it does not meet the definition of a derivative and is considered to be clearly and closely related to the redeemable noncontrolling interest. The noncontrolling interest is considered probable of becoming redeemable as SoftBank has the option to exercise its put right to sell its equity ownership in the Joint Venture to us on or after the seventh anniversary of the formation of the Joint Venture, on each subsequent anniversary of the IPO and under certain other circumstances. We elected to recognize the change in redemption value immediately as they occur as if the put-call redemption feature were exercisable at the end of the reporting period. The carrying value of the redeemable noncontrolling interest is first adjusted for the earnings or losses attributable to the redeemable noncontrolling interest based on the percentage of the economic or ownership interest retained in the consolidated VIE by the noncontrolling parties, and then adjusted to equal to its redemption amount, or the fair value of the noncontrolling interest held by SoftBank, as if the redemption were to occur at the end of the reporting date.
Stock-based compensation
We measure stock-based compensation expense for stock options granted to our employees and directors on the date of grant and recognize the corresponding compensation expense of those awards over the requisite service period, which is generally the vesting period of the respective award. We account for stock-based compensation arrangements with non-employee consultants using a fair value approach. The estimated fair value of unvested options granted to non-employee consultants is remeasured at each reporting date through the date of final vesting. As a result, the noncash charge to operations for non-employee options with vesting conditions is affected in each reporting period by changes in the estimated fair value of our common stock.
We estimate the fair value of stock options granted to our employees and directors on the grant date, and the resulting stock-based compensation expense, using the Black-Scholes option-pricing model. The Black-Scholes option-pricing model requires the use of assumptions regarding a number of variables that are complex, subjective and generally require significant judgment to determine. The assumptions used to calculate the fair value of our stock options were:
Fair value of common stock
Prior to the IPO, the fair value of the common stock underlying the stock options was determined by our board of directors, with input from management and independent third-party valuations. The grant date fair value of our common stock was determined using valuation methodologies which utilizes certain assumptions including probability weighting of events, volatility, time to liquidation, a risk-free interest rate and an assumption for a discount for lack of marketability. In determining the fair value of our common stock, the methodologies used to estimate our enterprise value were performed using methodologies, approaches, and assumptions consistent with the American Institute of Certified Public Accountants Accounting and Valuation Guide,
Valuation of Privately-Held-Company Equity Securities Issued as Compensation
. Subsequent to the IPO, the fair value of our common stock is determined by the closing price, on the date of grant, of our common stock, which is traded on the Nasdaq Global Select Market.
Expected term
Our expected term represents the period that our stock options are expected to be outstanding and is determined using a simplified method (based on the midpoint between the vesting date and the end of the contractual term), as we do not have sufficient historical data to use any other method to estimate expected term.
Expected volatility
Prior to the commencement of trading of our common stock on the Nasdaq Global Select Market on October 4, 2018 in connection with the IPO, there was no active trading market for our common stock. Due to limited historical data for the trading of our common stock, expected volatility is estimated based on the average volatility for comparable publicly traded peer group companies in the same industry over a period equal to the expected term of the stock option grants. The comparable companies are chosen based on their similar size, stage in the life cycle or area of specialty.
97
Risk-free interest rate
The risk-free interest rate is based on the U.S. treasury zero coupon issues in effect at the time of grant for periods corresponding with the expected term of the stock option grants.
Expected dividend yield
We have never paid dividends on our common stock and have no plans to pay dividends on our common stock. Therefore, we use an expected dividend yield of zero.
Black-Scholes assumptions
The weighted-average assumptions used in our Black-Scholes option-pricing model were as follows for stock option granted to our employees for the periods presented:
|
Year Ended December 31,
|
||||||
|
2018
|
2017
|
2016
|
||||
|
Expected term (in years)
|
5.01 – 6.51
|
6.02 – 6.08
|
6.02 – 6.43
|
|||
|
Expected volatility
|
68.7% – 78.8%
|
74.1% – 75.1%
|
65.2% – 67.7%
|
|||
|
Risk-free interest rate
|
2.5% – 3.0%
|
1.9% – 2.2%
|
1.2% – 2.3%
|
|||
|
Expected dividend yield
|
—%
|
—%
|
—%
|
|||
We recognize stock-based compensation expense net of forfeitures as they occur in accordance with Accounting Standards Update 2016-09,
Compensation - Stock Compensation (Topic 718)
.
We will continue to use judgment in evaluating the assumptions related to our stock-based compensation on a prospective basis. As we continue to accumulate additional data related to our common stock, we may have refinements to our estimates, which could materially impact our future stock-based compensation expense.
As of
December 31, 2018
, we had unrecognized stock-based compensation of
17.5 million
related to unvested stock options which is expected to be recognized over a weighted-average period of
2.7
years.
JOBS Act accounting election
We are an “emerging growth company,” or EGC, within the meaning of the Jumpstart Our Business Act of 2012, or JOBS Act. Section 107(b) of the JOBS Act provides that an EGC can leverage the extended transition period, provided in Section 102(b) of the JOBS Act, for complying with new or revised accounting standards. Thus, an EGC can delay the adoption of new or revised accounting standards that have different effective dates for public and private companies until those standards apply to private companies. We have elected to use this extended transition period and, as a result, our financial statements may not be comparable to companies that comply with public company effective dates. We also intend to rely on other exemptions provided by the JOBS Act, including without limitation, not being required to comply with the auditor attestation requirements of Section 404(b) of the Sarbanes-Oxley Act of 2002.
We will remain an EGC until the earliest of (1) the last day of the fiscal year following the fifth anniversary of the consummation of the IPO, (2) the last day of the fiscal year in which we have total annual gross revenue of at least $1.07 billion, (3) the last day of the fiscal year in which we are deemed to be a “large accelerated filer” as defined in Rule 12b-2 under the Exchange Act, which would occur if the market value of our common stock held by non-affiliates exceeded $700.0 million as of the last business day of the second fiscal quarter of such year or (4) the date on which we have issued more than $1.0 billion in non-convertible debt securities during the prior three-year period. While we may otherwise remain an EGC until as late as December 31, 2023, if the market value of our common stock that is held by non-affiliates exceeds $700 million as of June 30, 2019, we expect that we will cease to be an EGC and will need to comply with additional legal, financial and accounting requirements as of December 31, 2019, which could result in substantial costs and additional risks for us and divert management’s attention.
Recent accounting pronouncements
See Note 2 to our consolidated financial statements included elsewhere in this report for more information.
98
Item 7A. Quantitative and Qualitative Disclosures About Market Risk
We are exposed to market risk in the ordinary course of our business. Market risk represents the risk of loss that may impact our financial position due to adverse changes in financial market prices and rates.
Interest rate risk
We are exposed to market risk for changes in interest rates related primarily to our cash and cash equivalents, marketable securities and our indebtedness. As of
December 31, 2018
, we had cash and cash equivalents of
$140.5 million
held primarily in cash deposits and money market funds. Our marketable securities are held in U.S. government debt securities, U.S. government agency bonds and corporate bonds. As of
December 31, 2018
, we invested in short-term marketable securities of
$278.4 million
and long-term marketable securities of
$77.6 million
. Our primary exposure to market risk is interest income sensitivity, which is affected by changes in the general level of the interest rates in the United States. As of
December 31, 2018
, a hypothetical 100 basis point increase in interest rates would have resulted in an approximate $2.4 million decline of the fair value of our available-for-sale securities. This estimate is based on a sensitivity model that measures market value changes when changes in interest rates occur.
We are also exposed to market risk for changes in interest rates related primarily to our royalty obligations and capital lease obligations. During the year ended December 31, 2017, we paid off our term loan and exercised a buy-out option of our royalty obligation. Our capital lease obligation bears a fixed interest rate. Therefore, we are not exposed to material risks from changes in interest rates on our outstanding indebtedness.
Foreign currency risk
The majority of our revenue is generated in the United States. Through
December 31, 2018
, we have generated an insignificant amount of revenues denominated in foreign currencies. As we expand our presence in the international market, our results of operations and cash flows are expected to increasingly be subject to fluctuations due to changes in foreign currency exchange rates and may be adversely affected in the future due to changes in foreign exchange rates. Our obligation related to a royalty denominated in Euros is subject to foreign currency risk. As of
December 31, 2018
, the effect of a hypothetical 10% change in foreign currency exchange rates would result in a foreign exchange gains or losses of $0.7 million, on total cumulative balance of obligations. To date, we have not entered into any hedging arrangements with respect to foreign currency risk. As our international operations grow, we will continue to reassess our approach to manage our risk relating to fluctuations in currency rates.
99
Item 8. Financial Statements and Supplementary Data
Guardant Health, Inc.
Index to Consolidated Financial Statements
As of December 31, 2018 and 2017, and
For the Years Ended December 31, 2018, 2017 and 2016
|
Page
|
|
The supplementary financial information required by this Item 8 is included in Part II, Item 7 under the caption “
Quarterly Results of Operations
”, which is incorporated herein by reference.
100
Report of Independent Registered Public Accounting Firm
To the Stockholders and the Board of Directors of
Guardant Health, Inc.
Opinion on the Financial Statements
We have audited the accompanying consolidated balance sheets of Guardant Health, Inc. (the Company) as of December 31, 2018 and 2017, the related consolidated statements of operations, comprehensive loss, redeemable noncontrolling interest and stockholders’ equity and cash flows for each of the three years in the period ended December 31, 2018, and the related notes (collectively referred to as the “consolidated financial statements”). In our opinion, the consolidated financial statements present fairly, in all material respects, the financial position of the Company at December 31, 2018 and 2017, and the results of its operations and its cash flows for each of the three years in the period ended December 31, 2018, in conformity with U.S. generally accepted accounting principles.
Basis for Opinion
These financial statements are the responsibility of the Company’s management. Our responsibility is to express an opinion on the Company’s financial statements based on our audits. We are a public accounting firm registered with the Public Company Accounting Oversight Board (United States) (PCAOB) and are required to be independent with respect to the Company in accordance with the U.S. federal securities laws and the applicable rules and regulations of the Securities and Exchange Commission and the PCAOB.
We conducted our audits in accordance with the standards of the PCAOB. Those standards require that we plan and perform the audit to obtain reasonable assurance about whether the financial statements are free of material misstatement, whether due to error or fraud. The Company is not required to have, nor were we engaged to perform, an audit of its internal control over financial reporting. As part of our audits we are required to obtain an understanding of internal control over financial reporting but not for the purpose of expressing an opinion on the effectiveness of the Company’s internal control over financial reporting. Accordingly, we express no such opinion.
Our audits included performing procedures to assess the risks of material misstatement of the financial statements, whether due to error or fraud, and performing procedures that respond to those risks. Such procedures included examining, on a test basis, evidence regarding the amounts and disclosures in the financial statements. Our audits also included evaluating the accounting principles used and significant estimates made by management, as well as evaluating the overall presentation of the financial statements. We believe that our audits provide a reasonable basis for our opinion.
/s/ Ernst & Young LLP
We have served as the Company’s auditor since 2015.
Redwood City, California
March 19, 2019
101
Guardant Health, Inc.
Consolidated Balance Sheets
(in thousands, except share and per share data)
|
As of December 31,
|
|||||||
|
2018
|
2017
|
||||||
|
ASSETS
|
|||||||
|
Current assets:
|
|||||||
|
Cash and cash equivalents
|
$
|
140,544
|
|
$
|
72,280
|
|
|
|
Short-term marketable securities
|
278,417
|
|
149,040
|
|
|||
|
Accounts receivable
|
35,690
|
|
12,787
|
|
|||
|
Inventory
|
9,136
|
|
7,287
|
|
|||
|
Prepaid expenses and other current assets
|
5,204
|
|
1,541
|
|
|||
|
Total current assets
|
468,991
|
|
242,935
|
|
|||
|
Long-term marketable securities
|
77,563
|
|
73,254
|
|
|||
|
Property and equipment, net
|
31,003
|
|
16,036
|
|
|||
|
Capitalized license fees
|
7,800
|
|
8,739
|
|
|||
|
Other assets
|
2,046
|
|
1,974
|
|
|||
|
Total Assets
(1)
|
$
|
587,403
|
|
$
|
342,938
|
|
|
|
LIABILITIES, REDEEMABLE NONCONTROLLING INTEREST AND STOCKHOLDERS’ EQUITY
|
|||||||
|
Current liabilities:
|
|||||||
|
Accounts payable
|
$
|
10,642
|
|
$
|
4,998
|
|
|
|
Accrued compensation
|
12,986
|
|
4,911
|
|
|||
|
Accrued expenses
|
7,081
|
|
6,406
|
|
|||
|
Capital lease, current
|
97
|
|
199
|
|
|||
|
Deferred revenue
|
16,138
|
|
3,113
|
|
|||
|
Total current liabilities
|
46,944
|
|
19,627
|
|
|||
|
Capital lease, net of current portion
|
119
|
|
460
|
|
|||
|
Deferred rent, net of current portion
|
7,844
|
|
6,537
|
|
|||
|
Obligation related to royalty
|
7,338
|
|
7,708
|
|
|||
|
Other long-term liabilities
|
206
|
|
—
|
|
|||
|
Total Liabilities
(1)
|
62,451
|
|
34,332
|
|
|||
|
Commitments and contingencies (Note 8)
|
|
|
|
|
|||
|
Redeemable noncontrolling interest
|
41,800
|
|
—
|
|
|||
102
|
Stockholders’ equity:
|
|||||||
|
Convertible preferred stock, par value of $0.00001 per share; no shares authorized, issued or outstanding as of December 31, 2018; 80,104,464 shares authorized, 78,627,369 shares issued and outstanding as of December 31, 2017
|
—
|
|
499,974
|
|
|||
|
Preferred stock, par value of $0.00001 per share; 10,000,000 shares authorized, no shares issued or outstanding as of December 31, 2018; no shares authorized, issued or outstanding as of December 31, 2017
|
—
|
|
—
|
|
|||
|
Common stock, par value of $0.00001 per share; 350,000,000 and 111,853,396 shares authorized as of December 31, 2018 and 2017, respectively; 85,832,454 and 11,896,882 shares issued and outstanding as of December 31, 2018 and 2017, respectively
|
1
|
|
—
|
|
|||
|
Additional paid-in capital
|
764,033
|
|
4,900
|
|
|||
|
Accumulated other comprehensive loss
|
(83
|
)
|
(532
|
)
|
|||
|
Accumulated deficit
|
(280,799
|
)
|
(195,736
|
)
|
|||
|
Total Stockholders’ Equity
|
483,152
|
|
308,606
|
|
|||
|
Total Liabilities, Redeemable Noncontrolling Interest and Stockholders’ Equity
|
$
|
587,403
|
|
$
|
342,938
|
|
|
(1) As of
December 31, 2018
, includes $48.3 million of assets that can be used only to settle obligations of the consolidated variable interest entity ("VIE") and VIE’s subsidiaries, and $1.2 million of liabilities of consolidated VIE and VIE's subsidiaries for which their creditors do not have recourse to the general credit of the Company. See Note 3.
The accompanying notes are an integral part of these consolidated financial statements.
103
Guardant Health, Inc.
Consolidated Statements of Operations
(in thousands, except per share data)
|
Year Ended December 31,
|
||||||||||||
|
2018
|
2017
|
2016
|
||||||||||
|
Revenue:
|
||||||||||||
|
Precision oncology testing
|
$
|
78,407
|
|
$
|
42,088
|
|
$
|
24,496
|
|
|||
|
Development services
|
12,232
|
|
7,754
|
|
753
|
|
||||||
|
Total revenue
|
90,639
|
|
49,842
|
|
25,249
|
|
||||||
|
Costs and operating expenses:
|
||||||||||||
|
Cost of precision oncology testing
|
39,846
|
|
28,883
|
|
22,065
|
|
||||||
|
Cost of development services
|
3,364
|
|
2,735
|
|
59
|
|
||||||
|
Research and development expense
|
50,714
|
|
25,562
|
|
10,859
|
|
||||||
|
Sales and marketing expense
|
53,465
|
|
32,497
|
|
26,192
|
|
||||||
|
General and administrative expense
|
36,192
|
|
36,777
|
|
9,921
|
|
||||||
|
Total costs and operating expenses
|
183,581
|
|
126,454
|
|
69,096
|
|
||||||
|
Loss from operations
|
(92,942
|
)
|
(76,612
|
)
|
(43,847
|
)
|
||||||
|
Interest income
|
5,266
|
|
2,234
|
|
733
|
|
||||||
|
Interest expense
|
(1,251
|
)
|
(2,702
|
)
|
(3,018
|
)
|
||||||
|
Loss on debt extinguishment
|
—
|
|
(5,075
|
)
|
—
|
|
||||||
|
Other income (expense), net
|
4,702
|
|
(1,059
|
)
|
(1
|
)
|
||||||
|
Loss before provision for income taxes
|
(84,225
|
)
|
(83,214
|
)
|
(46,133
|
)
|
||||||
|
Provision for income taxes
|
38
|
|
7
|
|
6
|
|
||||||
|
Net loss
|
(84,263
|
)
|
(83,221
|
)
|
(46,139
|
)
|
||||||
|
Fair value adjustment of redeemable noncontrolling interest
|
(800
|
)
|
—
|
|
—
|
|
||||||
|
Net loss attributable to Guardant Health, Inc.
|
$
|
(85,063
|
)
|
$
|
(83,221
|
)
|
$
|
(46,139
|
)
|
|||
|
Deemed dividend related to repurchase of Series A convertible preferred stock
|
—
|
|
(4,716
|
)
|
—
|
|
||||||
|
Deemed dividend related to change in conversion rate of Series D convertible preferred stock
|
—
|
|
(1,058
|
)
|
—
|
|
||||||
|
Net loss attributable to Guardant Health, Inc. common stockholders
|
$
|
(85,063
|
)
|
$
|
(88,995
|
)
|
$
|
(46,139
|
)
|
|||
|
Net loss per share attributable to Guardant Health, Inc. common stockholders, basic and diluted
|
$
|
(2.80
|
)
|
$
|
(7.07
|
)
|
$
|
(3.53
|
)
|
|||
|
Weighted-average shares used in computing net loss per share attributable to Guardant Health, Inc. common stockholders, basic and diluted
|
30,403
|
|
12,582
|
|
13,053
|
|
||||||
The accompanying notes are an integral part of these consolidated financial statements.
104
Guardant Health, Inc.
Consolidated Statements of Comprehensive Loss
(in thousands)
|
Year Ended December 31,
|
||||||||||||
|
2018
|
2017
|
2016
|
||||||||||
|
Net loss
|
$
|
(84,263
|
)
|
$
|
(83,221
|
)
|
$
|
(46,139
|
)
|
|||
|
Other comprehensive income (loss), net of tax impact:
|
||||||||||||
|
Unrealized gain (loss) on available-for-sale securities
|
449
|
(446
|
)
|
(76
|
)
|
|||||||
|
Other comprehensive income (loss)
|
449
|
(446)
|
(76)
|
|||||||||
|
Comprehensive loss
|
$
|
(83,814
|
)
|
$
|
(83,667
|
)
|
$
|
(46,215
|
)
|
|||
|
Comprehensive loss attributable to redeemable noncontrolling interest
|
(800
|
)
|
—
|
|
—
|
|
||||||
|
Comprehensive loss attributable to Guardant Health, Inc.
|
$
|
(84,614
|
)
|
$
|
(83,667
|
)
|
$
|
(46,215
|
)
|
|||
The accompanying notes are an integral part of these consolidated financial statements.
105
Guardant Health, Inc.
Consolidated Statements of Redeemable Noncontrolling Interest and Stockholders’ Equity
(in thousands, except share data)
|
Redeemable Noncontrolling Interest
|
|
Convertible
Preferred Stock |
Common Stock
|
Additional
Paid-in Capital |
|
Accumulated
Other
Comprehensive Loss
|
|
Accumulated
Deficit |
|
Total Stockholders’ Equity
|
|
||||||||||||||||||||||
|
Shares
|
|
Amount
|
|
Shares
|
|
Amount
|
|
||||||||||||||||||||||||||
|
Balance as of December 31, 2015
|
$
|
—
|
|
34,821,414
|
|
$
|
139,948
|
|
13,109,829
|
|
$
|
—
|
|
$
|
4,990
|
|
$
|
(10
|
)
|
$
|
(61,486
|
)
|
$
|
83,442
|
|
||||||||
|
Issuance of Series D convertible preferred stock, net of issuance cost of $30
|
—
|
|
5,360,509
|
|
40,049
|
|
—
|
|
—
|
|
—
|
|
—
|
|
—
|
|
40,049
|
|
|||||||||||||||
|
Issuance of common stock upon exercise of stock options
|
—
|
|
—
|
|
—
|
|
132,681
|
|
—
|
|
266
|
|
—
|
|
—
|
|
266
|
|
|||||||||||||||
|
Issuance of common stock upon early exercise of stock options
|
—
|
|
—
|
|
—
|
|
1,844
|
|
—
|
|
—
|
|
—
|
|
—
|
|
—
|
|
|||||||||||||||
|
Issuance of common stock upon exercise of warrants
|
—
|
|
—
|
|
—
|
|
1,589
|
|
—
|
|
—
|
|
—
|
|
—
|
|
—
|
|
|||||||||||||||
|
Vesting of common stock exercised early
|
—
|
|
—
|
|
—
|
|
—
|
|
—
|
|
283
|
|
—
|
|
—
|
|
283
|
|
|||||||||||||||
|
Repurchase of common stock
|
—
|
|
—
|
|
—
|
|
(61,729
|
)
|
—
|
|
(100
|
)
|
—
|
|
—
|
|
(100
|
)
|
|||||||||||||||
|
Stock-based compensation
|
—
|
|
—
|
|
—
|
|
|
—
|
|
1,971
|
|
—
|
|
—
|
|
1,971
|
|
||||||||||||||||
|
Other comprehensive loss, net of tax impact
|
—
|
|
—
|
|
—
|
|
|
—
|
|
—
|
|
(76
|
)
|
—
|
|
(76
|
)
|
||||||||||||||||
|
Net loss
|
—
|
|
—
|
|
—
|
|
|
—
|
|
—
|
|
—
|
|
(46,139
|
)
|
(46,139
|
)
|
||||||||||||||||
|
Balance as of December 31, 2016
|
—
|
|
40,181,923
|
|
179,997
|
|
13,184,214
|
|
—
|
|
7,410
|
|
(86
|
)
|
(107,625
|
)
|
79,696
|
|
|||||||||||||||
|
Cumulative effect adjustment for ASU 2016-09 adoption
|
—
|
|
—
|
|
—
|
|
|
—
|
|
174
|
|
—
|
|
(174
|
)
|
—
|
|
||||||||||||||||
|
Issuance of Series D convertible preferred stock in exchange for a technology license agreement
|
—
|
|
141,774
|
|
1,060
|
|
|
—
|
|
—
|
|
—
|
|
—
|
|
1,060
|
|
||||||||||||||||
|
Issuance of Series E convertible preferred stock, net of issuance cost of $883
|
—
|
|
38,970,592
|
|
319,536
|
|
|
—
|
|
—
|
|
—
|
|
—
|
|
319,536
|
|
||||||||||||||||
|
Repurchase of Series A convertible preferred stock
|
—
|
|
(666,920
|
)
|
(619
|
)
|
|
—
|
|
—
|
|
—
|
|
(4,716
|
)
|
(5,335
|
)
|
||||||||||||||||
|
Issuance of common stock upon exercise of stock options
|
—
|
|
—
|
|
—
|
|
342,946
|
|
—
|
|
753
|
|
—
|
|
—
|
|
753
|
|
|||||||||||||||
|
Issuance of common stock upon exercise of warrants
|
—
|
|
—
|
|
—
|
|
89,030
|
|
—
|
|
12
|
|
—
|
|
—
|
|
12
|
|
|||||||||||||||
|
Vesting of common stock exercised early
|
—
|
|
—
|
|
—
|
|
|
—
|
|
103
|
|
—
|
|
—
|
|
103
|
|
||||||||||||||||
|
Repurchase of common stock
|
—
|
|
—
|
|
—
|
|
(1,719,308
|
)
|
—
|
|
(7,222
|
)
|
—
|
|
—
|
|
(7,222
|
)
|
|||||||||||||||
|
Stock-based compensation
|
—
|
|
—
|
|
—
|
|
|
—
|
|
3,670
|
|
—
|
|
—
|
|
3,670
|
|
||||||||||||||||
|
Other comprehensive loss, net of tax impact
|
—
|
|
—
|
|
—
|
|
|
—
|
|
—
|
|
(446
|
)
|
—
|
|
(446
|
)
|
||||||||||||||||
|
Net loss
|
—
|
|
—
|
|
—
|
|
|
—
|
|
—
|
|
—
|
|
(83,221
|
)
|
(83,221
|
)
|
||||||||||||||||
|
Balance as of December 31, 2017
|
—
|
|
78,627,369
|
|
499,974
|
|
11,896,882
|
|
—
|
|
4,900
|
|
(532
|
)
|
(195,736
|
)
|
308,606
|
|
|||||||||||||||
|
Conversion of convertible preferred stock to common stock upon initial public offering
|
—
|
|
(78,627,369
|
)
|
(499,974
|
)
|
58,264,577
|
|
1
|
|
499,973
|
|
—
|
|
—
|
|
—
|
|
|||||||||||||||
|
Issuance of common stock upon initial public offering, net of offering costs of $4,475
|
—
|
|
—
|
|
—
|
|
14,375,000
|
|
—
|
|
249,531
|
|
—
|
|
—
|
|
249,531
|
|
|||||||||||||||
|
Issuance of common stock upon exercise of stock options
|
—
|
|
—
|
|
—
|
|
963,119
|
|
—
|
|
2,905
|
|
—
|
|
—
|
|
2,905
|
|
|||||||||||||||
|
Issuance of common stock upon early exercise of stock options
|
—
|
|
—
|
|
—
|
|
44,268
|
|
—
|
|
—
|
|
—
|
|
—
|
|
—
|
|
|||||||||||||||
|
Issuance of common stock upon exercise of warrants
|
—
|
|
—
|
|
—
|
|
320,289
|
|
—
|
|
45
|
|
—
|
|
—
|
|
45
|
|
|||||||||||||||
|
Repurchase of common stock
|
—
|
|
—
|
|
—
|
|
(31,681
|
)
|
—
|
|
(172
|
)
|
—
|
|
—
|
|
(172
|
)
|
|||||||||||||||
|
Stock-based compensation
|
—
|
|
—
|
|
—
|
|
—
|
|
—
|
|
6,851
|
|
—
|
|
—
|
|
6,851
|
|
|||||||||||||||
|
Issuance of equity interests in redeemable noncontrolling interest
|
41,000
|
|
—
|
|
—
|
|
—
|
|
—
|
|
—
|
|
—
|
|
—
|
|
—
|
|
|||||||||||||||
|
Fair value adjustment of redeemable noncontrolling interest
|
800
|
|
—
|
|
—
|
|
—
|
|
—
|
|
—
|
|
—
|
|
(800
|
)
|
(800
|
)
|
|||||||||||||||
|
Other comprehensive loss, net of tax impact
|
—
|
|
—
|
|
—
|
|
—
|
|
—
|
|
—
|
|
449
|
|
—
|
|
449
|
|
|||||||||||||||
|
Net loss
|
—
|
|
—
|
|
—
|
|
—
|
|
—
|
|
—
|
|
—
|
|
(84,263
|
)
|
(84,263
|
)
|
|||||||||||||||
|
Balance as of December 31, 2018
|
$
|
41,800
|
|
—
|
|
$
|
—
|
|
85,832,454
|
|
$
|
1
|
|
$
|
764,033
|
|
$
|
(83
|
)
|
$
|
(280,799
|
)
|
$
|
483,152
|
|
||||||||
The accompanying notes are an integral part of these consolidated financial statements.
106
Guardant Health, Inc.
Consolidated Statements of Cash Flows
(in thousands)
|
Year Ended December 31,
|
|||||||||||
|
2018
|
2017
|
2016
|
|||||||||
|
OPERATING ACTIVITIES:
|
|||||||||||
|
Net loss
|
$
|
(84,263
|
)
|
$
|
(83,221
|
)
|
$
|
(46,139
|
)
|
||
|
Adjustments to reconcile net loss to net cash used in operating activities:
|
|||||||||||
|
Depreciation and amortization
|
7,136
|
|
5,206
|
|
3,693
|
|
|||||
|
Unrealized translation (gains) losses on obligation related to royalty
|
(357
|
)
|
980
|
|
—
|
|
|||||
|
Non-cash stock-based compensation
|
6,851
|
|
3,670
|
|
1,971
|
|
|||||
|
Non-cash interest expense
|
(13
|
)
|
685
|
|
1,024
|
|
|||||
|
Loss on debt extinguishment
|
—
|
|
5,075
|
|
—
|
|
|||||
|
Amortization of premium (discount) on marketable securities
|
(412
|
)
|
359
|
|
287
|
|
|||||
|
Changes in operating assets and liabilities:
|
|||||||||||
|
Accounts receivable
|
(22,903
|
)
|
(9,292
|
)
|
(2,786
|
)
|
|||||
|
Inventory
|
(1,849
|
)
|
(4,518
|
)
|
(351
|
)
|
|||||
|
Prepaid expenses and other current assets
|
(3,663
|
)
|
30
|
|
(610
|
)
|
|||||
|
Other assets
|
(451
|
)
|
(883
|
)
|
12
|
|
|||||
|
Accounts payable
|
5,046
|
|
1,250
|
|
2,145
|
|
|||||
|
Accrued compensation
|
8,075
|
|
2,348
|
|
1,374
|
|
|||||
|
Accrued expenses and other current liabilities
|
286
|
|
4,657
|
|
508
|
|
|||||
|
Deferred rent
|
1,307
|
|
204
|
|
467
|
|
|||||
|
Deferred revenue
|
13,025
|
|
1,215
|
|
1,695
|
|
|||||
|
Net cash used in operating activities
|
(72,185
|
)
|
(72,235
|
)
|
(36,710
|
)
|
|||||
|
INVESTING ACTIVITIES:
|
|||||||||||
|
Purchase of marketable securities
|
(287,450
|
)
|
(236,835
|
)
|
(341,415
|
)
|
|||||
|
Maturity of marketable securities
|
154,625
|
|
75,402
|
|
369,383
|
|
|||||
|
Purchase of property and equipment
|
(20,203
|
)
|
(6,681
|
)
|
(1,766
|
)
|
|||||
|
Payment in connection with a license agreement
|
—
|
|
(2,302
|
)
|
—
|
|
|||||
|
Net cash provided by (used in) investing activities
|
(153,028
|
)
|
(170,416
|
)
|
26,202
|
|
|||||
|
FINANCING ACTIVITIES:
|
|||||||||||
|
Payment related to settlement of debt and buyout of royalty obligations
|
—
|
|
(25,844
|
)
|
(379
|
)
|
|||||
|
Payments made on capital lease obligations
|
(443
|
)
|
(244
|
)
|
4
|
|
|||||
|
Proceeds from issuance of convertible preferred stock, net of issuance costs
|
—
|
|
319,536
|
|
40,049
|
|
|||||
|
Proceeds from issuance of common stock upon exercise of stock options
|
3,111
|
|
753
|
|
266
|
|
|||||
|
Proceeds from issuance of common stock upon the exercise of warrants
|
45
|
|
12
|
|
—
|
|
|||||
|
Repurchase of convertible preferred stock
|
—
|
|
(5,335
|
)
|
—
|
|
|||||
|
Repurchase of common stock
|
(172
|
)
|
(7,222
|
)
|
(100
|
)
|
|||||
|
Proceeds from initial public offering, net of underwriting discounts and commissions
|
254,006
|
|
—
|
|
—
|
|
|||||
|
Payment of offering costs related to initial public offering
|
(4,386
|
)
|
—
|
|
—
|
|
|||||
107
|
Net proceeds from issuance of equity interests in redeemable noncontrolling interest
|
41,000
|
|
—
|
|
—
|
|
|||||
|
Net cash provided by financing activities
|
293,161
|
|
281,656
|
|
39,840
|
|
|||||
|
Net increase in cash, cash equivalents and restricted cash
|
67,948
|
|
39,005
|
|
29,332
|
|
|||||
|
Cash, cash equivalents and restricted cash - Beginning of period
|
72,596
|
|
33,591
|
|
4,259
|
|
|||||
|
Cash, cash equivalents and restricted cash - End of period
|
$
|
140,544
|
|
$
|
72,596
|
|
$
|
33,591
|
|
||
|
Supplemental Disclosures of Cash Flow Information:
|
|||||||||||
|
Cash paid for interest
|
$
|
1,251
|
|
$
|
1,339
|
|
$
|
2,243
|
|
||
|
Cash paid for income taxes
|
$
|
102
|
|
$
|
26
|
|
$
|
14
|
|
||
|
Supplemental Disclosures of Noncash Investing and Financing Activities:
|
|||||||||||
|
Capitalized license fees financed through future royalty payment
|
$
|
—
|
|
$
|
6,302
|
|
$
|
—
|
|
||
|
Issuance of Series D convertible preferred stock in exchange for a technology license agreement
|
$
|
—
|
|
$
|
1,060
|
|
$
|
—
|
|
||
|
Increase in purchases of property and equipment included in accounts payable and accrued expenses
|
$
|
897
|
|
$
|
591
|
|
$
|
34
|
|
||
|
Vesting of common stock exercised early
|
$
|
—
|
|
$
|
103
|
|
$
|
283
|
|
||
|
Property and equipment acquired under capital leases
|
$
|
—
|
|
$
|
346
|
|
$
|
468
|
|
||
|
Conversion of convertible preferred stock to common stock upon initial public offering
|
$
|
499,974
|
|
$
|
—
|
|
$
|
—
|
|
||
|
Deferred offering costs included in accounts payable and accrued expenses
|
$
|
89
|
|
$
|
—
|
|
$
|
—
|
|
||
The accompanying notes are an integral part of these consolidated financial statements.
108
Guardant Health, Inc.
Notes to Consolidated Financial Statements
|
1.
|
Description of Business
|
Guardant Health, Inc. (the “Company”) is a leading precision oncology company focused on helping conquer cancer globally through use of its proprietary blood tests, vast data sets and advanced analytics. The key to conquering cancer is unprecedented access to its molecular information throughout all stages of the disease, which it enables by a routine blood draw, or liquid biopsy. The Guardant Health Oncology Platform is designed to leverage the Company’s capabilities in technology, clinical development, regulatory, reimbursement and commercial adoption to improve patient clinical outcomes, lower healthcare costs and accelerate biopharmaceutical drug development. In pursuit of its goal to manage cancer across all stages of the disease, it has launched its Guardant360 and GuardantOMNI liquid biopsy-based tests for advanced stage cancer patients, and is developing tests from its LUNAR programs for minimal residual disease and recurrence monitoring and early detection screening.
The Company was incorporated in Delaware in December 2011 and is headquartered in Redwood City, California. In April 2018, the Company established Guardant Health AMEA, Inc. (the “Joint Venture”) in the United States with an entity affiliated with SoftBank. Under the terms of the joint venture agreement, the Company held a
50%
ownership interest in the Joint Venture. As of
December 31, 2018
, the Joint Venture has subsidiaries in Singapore and Japan (see Note 3).
Reverse Stock Split
In September 2018, the Company’s Board of Directors and its stockholders approved a
0.7378
-for-one reverse stock split of the Company’s common stock. The reverse stock split became effective on September 19, 2018. The par value of the common stock was not adjusted as a result of the reverse stock split. Adjustments corresponding to the reverse stock split were made to the ratio at which the convertible preferred stock was convertible into common stock immediately prior to the closing of the Company's initial public offering (the “IPO”). All share and per share amounts in the accompanying consolidated financial statements and notes thereto have been retroactively adjusted for all periods presented to give effect to this reverse stock split.
Initial Public Offering
On October 9, 2018, the Company completed the IPO, in which it issued and sold
14,375,000
shares of its common stock at a public offering price of
$19.00
per share. The Company received net proceeds of
$249.5
million after deducting underwriting discounts and commissions and offering expenses payable by the Company. All then-outstanding warrants to purchase the Company’s common stock were exercised prior to the completion of the IPO.
In addition, in connection with the IPO,
all shares of the Company’s then-outstanding convertible preferred stock were automatically converted into
58,264,577
shares of its common stock, and all then-outstanding warrants to purchase the Company’s convertible preferred stock were automatically converted into warrants to purchase
7,636
shares of the Company’s common stock.
Approval of Amended and Restated Certificate of Incorporation
In September 2018, the Company’s Board of Directors and stockholders approved an amended and restated certificate of incorporation, which authorized
350,000,000
shares of common stock and
10,000,000
shares of preferred stock. The amended and restated certificate of incorporation became effective on October 9, 2018.
|
2.
|
Summary of Significant Accounting Policies
|
Basis of Presentation
The Company’s consolidated financial statements have been prepared in conformity with accounting principles generally accepted in the United States of America (“GAAP”). The accompanying consolidated financial statements include the accounts of Guardant Health, Inc. and its consolidated Joint Venture. Other stockholders’ interests in the Joint Venture are shown in the consolidated financial statements as redeemable noncontrolling interest. All significant intercompany balances and transactions have been eliminated in consolidation.
The Company believes that its existing cash and cash equivalents and marketable securities as of
December 31, 2018
will be sufficient to allow the Company to fund its current operating plan through at least a period of one year after the date the accompanying consolidated financial statements are issued. As the Company continues to incur losses, its transition to profitability is dependent upon a level of revenues adequate to support the Company’s cost structure. If
109
the Company’s transition to profitability is not consistent with its current operating plan, the Company may have to seek additional capital.
Use of Estimates
The preparation of consolidated financial statements in conformity with GAAP requires management to make certain estimates, judgments and assumptions that affect the reported amounts of assets and liabilities and the related disclosures at the date of the consolidated financial statements, as well as the reported amounts of revenues and expenses during the periods presented. The Company bases its estimates on historical experience and other market-specific or other relevant assumptions that it believes to be reasonable under the circumstances. Estimates are used in several areas including, but not limited to, best estimate of selling price used in the accounting for multiple-element revenue arrangements, estimation of potential credit losses on accounts receivable, the valuation of inventory, stock-based compensation, fair value of common stock and warrants prior to the IPO, contingencies, certain inputs into the provision for income taxes, including related reserves, valuation of redeemable noncontrolling interest, among others. These estimates generally involve complex issues and require judgments, involve the analysis of historical results and prediction of future trends, can require extended periods of time to resolve and are subject to change from period to period. Actual results may differ materially from management’s estimates.
JOBS Act Accounting Election
The Company is an “emerging growth company” within the meaning of the Jumpstart Our Business Act of 2012, or JOBS Act. Section 107(b) of the JOBS Act provides that an emerging growth company can leverage the extended transition period, provided in Section 102(b) of the JOBS Act, for complying with new or revised accounting standards. Thus, an emerging growth company can delay the adoption of new or revised accounting standards that have different effective dates for public and private companies until those standards apply to private companies. The Company has elected to use this extended transition period and, as a result, the consolidated financial statements may not be comparable to companies that comply with public company effective dates. The Company also intends to rely on other exemptions provided by the JOBS Act, including without limitation, not being required to comply with the auditor attestation requirements of Section 404(b) of the Sarbanes-Oxley Act of 2002.
Foreign Currency Translation
The functional currency of the subsidiaries of the consolidated Joint Venture is the local currency. The assets and liabilities of the subsidiaries are translated into U.S. dollars at exchange rates in effect at each balance sheet date, with the resulting translation adjustments recorded to a separate component of accumulated other comprehensive loss within stockholders’ equity. Income and expense accounts are translated at average exchange rates during the period. Foreign currency transaction gains and losses resulting from transactions denominated in a currency other than the functional currency are recognized in the consolidated statements of operations. For the year ended
December 31, 2018
, foreign currency translation adjustment was immaterial. For the years ended
December 31, 2017
and
2016
, the Company did not have foreign currency translation adjustment as the foreign subsidiaries were established in 2018.
Segment Information
The Company has one reportable segment: delivering precision oncology testing and development services. The Company’s chief operating decision makers (the “CODM”), the Chief Executive Officer, and the President and Chief Operating Officer, manage the Company’s operations on an aggregate basis for purposes of allocating resources.
Cash and Cash Equivalents and Restricted Cash
Cash equivalents consist of highly liquid investments with original maturities at the time of purchase of three months or less. Cash equivalents include bank demand deposits and money market accounts that invest primarily in U.S. government-backed securities and treasuries. Cash equivalents are carried at cost, which approximates their fair value.
Restricted cash consists of deposits related to the Company’s corporate credit card. The Company did not have any restricted cash as of
December 31, 2018
. Restricted cash balance as of
December 31, 2017
was
$316,000
, which was included in other assets in the accompanying consolidated balance sheets.
110
The following table provides a reconciliation of cash and cash equivalents and restricted cash reported within the consolidated balance sheets that sum to the total of the same amounts shown in the consolidated statements of cash flows:
|
As of December 31,
|
|||||||
|
2018
|
2017
|
||||||
|
(in thousands)
|
|||||||
|
Cash and cash equivalents
|
$
|
140,544
|
|
$
|
72,280
|
|
|
|
Restricted cash
|
—
|
|
316
|
|
|||
|
Total cash and cash equivalents and restricted cash
|
$
|
140,544
|
|
$
|
72,596
|
|
|
Marketable Securities
Marketable securities consist primarily of high-grade corporate bonds, commercial papers and certificates of deposit with third parties. Marketable securities with original maturities at the time of purchase between three and twelve months from balance sheet dates are classified as short-term marketable securities and those with maturities over twelve months from balance sheet dates are classified as long-term marketable securities. The Company classifies all marketable securities as available-for-sale, which are recorded at fair value. Unrealized gains and losses are included in accumulated other comprehensive loss in stockholders’ equity. Any premium or discount arising at purchase is amortized or accreted to interest income or expense. Realized gains and losses and declines in value, if any, judged to be other than temporary on available‑for‑sale securities are reported in other income (expense), net. When securities are sold, any associated unrealized gain or loss initially recorded as a separate component of stockholders’ equity is reclassified out of stockholders’ equity on a specific‑identification basis and recorded in earnings for the period.
The Company periodically evaluates whether declines in fair values of its marketable securities below their book value are other-than-temporary. This evaluation consists of several qualitative and quantitative factors regarding the severity and duration of the unrealized loss as well as the Company’s ability and intent to hold the marketable security until a forecasted recovery occurs. Additionally, the Company assesses whether it has plans to sell the security or it is more likely than not that it will be required to sell any marketable securities before recovery of its amortized cost basis. Factors considered include quoted market prices, recent financial results and operating trends, implied values from any recent transactions or offers of investee securities, credit quality of debt instrument issuers, other publicly available information that may affect the value of the marketable security, duration and severity of the decline in value, and management’s strategy and intentions for holding the marketable security. To date, the Company has not recorded any impairment charges on its marketable securities related to other-than-temporary declines in market value.
Concentration of Risk
The Company is subject to credit risk from its portfolio of cash equivalents held at one commercial bank and investments in marketable securities. The Company limits its exposure to credit losses by investing in money market funds through a U.S. bank with high credit ratings. The Company’s cash may consist of deposits held with banks that may at times exceed federally insured limits, however, its exposure to credit risk in the event of default by the financial institution is limited to the extent of amounts recorded on the consolidated balance sheets. The Company performs evaluations of the relative credit standing of these financial institutions to limit the amount of credit exposure.
The Company also invests in investment‑grade debt instruments and has policy limits for the amount it can invest in any one type of security, except for securities issued or guaranteed by the U.S. government. The goals of the Company’s investment policy, in order of priority, are as follows: safety and preservation of principal and diversification of risk; liquidity of investments sufficient to meet cash flow requirements; and a competitive after‑tax rate of return. Under its investment policy, the Company limits amounts invested in such securities by credit rating, maturity, investment type and issuer, as a result, the Company is not exposed to any significant concentrations of credit risk from these financial instruments.
The Company is also subject to credit risk from its accounts receivable. The majority of the Company’s accounts receivable arises from the provision of precision oncology services in the United States and are primarily with biopharmaceutical companies with high credit ratings. The Company has not experienced any material losses related to receivables from individual customers, or groups of customers. The Company does not require collateral. Accounts receivable are recorded at the invoiced amount and do not bear interest.
111
Significant customers are those which represent more than 10% of the Company’s total revenue or accounts receivable balance at each respective consolidated balance sheet date. For each significant customer, revenue as a percentage of revenue and accounts receivable as a percentage of accounts receivable are as follows:
|
Revenue
|
Accounts Receivable
|
|||||||||||||
|
Year Ended December 31,
|
As of December 31,
|
|||||||||||||
|
2018
|
2017
|
2016
|
2018
|
2017
|
||||||||||
|
Customer A
|
*
|
|
13
|
%
|
19
|
%
|
*
|
|
*
|
|
||||
|
Customer B
|
18
|
%
|
13
|
%
|
*
|
|
65
|
%
|
24
|
%
|
||||
|
Customer C
|
*
|
|
*
|
|
*
|
|
*
|
|
23
|
%
|
||||
|
Customer D
|
*
|
|
*
|
|
*
|
|
*
|
|
13
|
%
|
||||
|
*
|
less than 10%
|
Accounts Receivable
Accounts receivable represent valid claims against biopharmaceutical companies, research institutes and international distributors. The Company evaluates the collectability of its accounts receivable and provides for an allowance for potential credit losses based on management’s best estimate of the amount of probable credit losses. As of
December 31, 2018
and
2017
, the Company had
no
allowance for doubtful accounts.
Inventory
Inventories are stated at the lower of cost or net realizable value on a first-in, first-out basis. Inventory consisted entirely of supplies, which are consumed when providing liquid biopsy tests, and therefore the Company does not maintain any finished goods inventory.
In order to assess the ultimate realization of inventories, the Company is required to make judgments as to future demand requirements compared to current or committed inventory levels. The Company periodically reviews its inventories for excess or obsolescence and writes-down obsolete or otherwise unmarketable inventory to its estimated net realizable value. If the actual net realizable value is less than that estimated by the Company, or if it is determined that inventory utilization will further diminish based on estimates of demand, additional inventory write-downs may be required. Amounts written-down due to unmarketable inventory are recorded in cost of precision oncology testing.
Property and Equipment, Net
Property and equipment are recorded at cost. Depreciation is computed over estimated useful lives of the related assets using the straight-line method. Leasehold improvements are amortized using the straight-line method over the estimated useful lives of the assets or the remaining term of the lease, whichever is shorter. The Company periodically reviews the depreciable lives assigned to property and equipment placed in service and changes the estimates of useful lives, if necessary. Maintenance and repairs are expensed as incurred.
Estimated useful lives for property and equipment are as follows:
|
Property and Equipment
|
Estimated Useful Life
|
|
|
Machinery and equipment
|
3 – 5 years
|
|
|
Furniture and fixtures
|
7 years
|
|
|
Computer hardware and computer software
|
3 years
|
|
|
Leasehold improvements
|
Lesser of estimated useful life or remaining lease term
|
|
Obligation Related to Royalty
Certain of the Company’s asset acquisitions involve the potential for future payment of consideration that is contingent upon the royalty payments due on future product net sales, subject to annual minimums. The fair value of such liabilities is determined at the acquisition date using unobservable inputs. These inputs include the estimated amount and timing of projected cash flows and the risk-adjusted discount rate used to present value the cash flows.
112
Impairment for Long-Lived Assets
The Company evaluates long-lived assets, including property and equipment, for impairment whenever events or changes in business circumstances indicate that the carrying amount of the asset may not be fully recoverable. An impairment loss would be recognized when estimated undiscounted future cash flows expected to result from the use of the asset and its eventual disposition are less than its carrying amount. Impairment, if any, is measured as the amount by which the carrying amount of a long-lived asset exceeds its fair value.
Revenue Recognition
The Company derives revenue from the provision of precision oncology testing services provided to its ordering physicians and biopharmaceutical customers, as well as from biopharmaceutical research and development services provided to its biopharmaceutical customers. Precision oncology services include genomic profiling and the delivery of other genomic information derived from the Company’s platform. Development services include the development of new platforms and information solutions, including companion diagnostic development and laboratory services. The Company currently receives payments from commercial third-party payers, certain hospitals and oncology centers and individual patients, as well as biopharmaceutical companies and research institutes.
The Company recognizes revenue when all of the following criteria are met: (i) persuasive evidence of an arrangement exists; (ii) delivery has occurred; (iii) the fee is fixed or determinable; and (iv) collectability is reasonably assured. Criterion (i) is satisfied when the Company has an arrangement or contract in place. Criterion (ii) is satisfied when the Company delivers a test report corresponding to each sample, without further commercial obligations. Determination of criteria (iii) and (iv) are based on management’s judgments regarding whether the fee is fixed or determinable, and whether the collectability of the fee is reasonably assured. The Company recognizes revenue from the sale of its precision oncology tests for clinical customers, including certain hospitals, cancer centers, other institutions and patients, at the time results of the test are reported to physicians, if criteria (i) through (iv) above are met. The Company recognizes revenue on a cash basis when it cannot conclude that criteria (iii) and (iv) have been met. Most of precision oncology tests requested by clinical customers are sold without a contracted engagement with a third-party payer; therefore, the Company experiences significant variability in collections and does not have sufficient history to establish a predictable pattern of payment. Because the price is not fixed or determinable and collectability is not reasonably assured, the Company recognizes revenue on a cash basis for sales of its liquid biopsy tests to clinical customers where collection depends on a third-party payer or the individual patient. The Company uses judgment in its assessment of whether the fee is fixed or determinable and whether collectability is reasonably assured in determining when to recognize revenue. Accordingly, the Company expects to recognize revenue on a cash basis for these clinical customers until it has sufficient history to reliably estimate payment patterns. The Company’s precision oncology information services are delivered electronically, and as such there are no shipping or handling fees incurred by the Company or billed to customers.
Revenue from sales of the Company’s tests to biopharmaceutical customers are based on a negotiated price per test or on the basis of an agreement to provide certain testing volume, data access or biopharmaceutical research and development services over a defined period. The Company recognizes revenue upon delivery of the test results, or over the period in which biopharmaceutical research and development services are provided, as appropriate.
Multiple-element arrangements
The Company performs development services for its biopharmaceutical customers utilizing its precision oncology information platform. Contracts with biopharmaceutical customers are primarily analyzed as multiple-element arrangements given the nature of the service deliverables. For development services performed, the Company is compensated in various ways, including (i) through non-refundable regulatory and other developmental milestone payments; and (ii) through royalty and sales milestone payments. The Company performs development services as part of its normal activities. The Company records these payments as development services revenue in the consolidated statements of operations using a proportional performance model over the period which the unit of accounting is delivered or based on the level of effort expended to date over the total expected effort, whichever is considered the most appropriate measure of performance. For development of new products or services under these arrangements, costs incurred before technological feasibility is assured are included as research and development expenses in the Company’s consolidated statements of operations, while costs incurred thereafter are recorded as cost of development services.
The Company collaborates with pharmaceutical companies in the development and clinical trials of new drugs. As part of these collaborations, the Company provides services related to regulatory filings with the FDA to support companion diagnostic device submissions for the Company’s liquid biopsy panels. Under these collaborations the Company generates revenue from achievement of milestones, as well as provision of on-going support. These collaboration arrangements include no royalty obligations.
113
For revenue arrangements with multiple deliverables, the Company evaluates each deliverable to determine whether it qualifies as a separate unit of accounting. This determination is based on whether the deliverable has stand-alone value to the customer and whether a general right of return exists. In assessing whether an item has standalone value, the Company considers factors such as the research, development and commercialization capabilities of a third party and the availability of the associated expertise in the general marketplace. In addition, the Company considers whether the other party in the arrangement can use the other deliverables for their intended purpose without the receipt of the remaining elements, whether the value of the deliverable is dependent on the undelivered items and whether there are other vendors that can provide the undelivered elements.
The consideration that is fixed or determinable is then allocated to each separate unit of accounting based on the relative selling price of each deliverable. The Company allocates the arrangement consideration following a hierarchy to determine the relative selling price to be used for allocating revenue to deliverables: (i) vendor-specific objective evidence of fair value (“VSOE”), (ii) third-party evidence of selling price (“TPE”), and (iii) best estimate of the selling price (“BESP”) if neither VSOE nor TPE is available. The Company typically uses BESP to estimate the selling price, since it generally does not have VSOE or TPE of selling price for its units of accounting under multiple-element arrangements. In developing the BESP for a unit of accounting, the Company considers applicable market conditions and estimated costs. The Company validates the BESP for units of accounting by evaluating whether changes in the key assumptions used to determine the BESP will have a significant effect on the allocation of arrangement consideration between multiple units of accounting. The consideration allocated to each unit of accounting is recognized as the related goods or services are delivered, limited to the consideration that is not contingent upon future deliverables. The Company uses judgment in identifying the deliverables in its arrangements, assessing whether each deliverable is a separate unit of accounting and in determining the best estimate of selling price for certain deliverables. The Company also uses judgment in determining the period over which the deliverables are recognized in certain of its arrangements. Any amounts received that do not meet the criteria for revenue recognition are recorded as deferred revenue until such criteria are met.
The Company performed laboratory installation and maintenance services for one of its customers as part of a multiple-element arrangement entered into in 2017. The Company recognized certain revenue from its construction service deliverables in a multiple-element collaboration arrangement based on the completed-contract method. This method was used as the Company determined that it did not have the basis for estimating performance under the contract. Other construction service deliverables under that contract were recognized under the percentage-of-completion method due to the Company’s ability to make reasonably dependable estimates of the extent of progress toward contract completion. All construction services under this arrangement were completed in March 2018.
Milestones
The Company recognizes payments that are contingent upon achievement of a substantive milestone in their entirety in the period in which the milestone is achieved. Milestones are defined as events that can only be achieved based on the Company’s performance and there is substantive uncertainty about whether the event will be achieved at the inception of the arrangement. Events that are contingent only on the passage of time or only on counterparty performance are not considered substantive milestones. Further, the amounts received must relate solely to prior performance, be reasonable relative to all of the deliverables and payment terms within the agreement and commensurate with the Company’s performance to achieve the milestone after commencement of the agreement. Any contingent payment that becomes payable upon achievement of events that are not considered substantive milestones are allocated to the units of accounting previously identified at the inception of an arrangement when the contingent payment is received and revenue is recognized based on the revenue recognition criteria for each unit of accounting. Revenue from commercial milestone payments are recorded as revenue upon achievement of the milestone, assuming all other revenue recognition criteria are met.
In November 2018, the Company entered into a collaboration agreement, as well as multiple project schedules and statements of work, with AstraZeneca (collectively refer to as the “AstraZeneca Agreements”) related to the development of Guardant360 as a companion diagnostic for Tagrisso and GuardantOMNI as a companion diagnostic for Imfinzi. Both parties have the right to terminate the agreement in its entirety or in part for convenience or under certain conditions, such as material breach or lack of feasibility. The deliverables under the AstraZeneca Agreements include precision oncology testing utilizing the Company’s liquid biopsy panels, assistance with FDA pre-submission documents, clinical validation and analytical validation, submission of FDA premarket approval and other regulatory approvals, among other things. The Company estimated that substantive portion of development services performed under the Astra Zeneca Agreements will be completed by December 2019.
The AstraZeneca Agreements are first evaluated for contract combination or separation depending on the timing of negotiation, interrelationship of projects, payment terms, refund or concession of arrangement consideration, if applicable. The AstraZeneca Agreements are then analyzed under the multiple-element arrangements to determine
114
whether the arrangement should be divided into separate units of accounting. The Company determined there are two units of accounting relating to the deliverables under each of the two AstraZeneca Agreements: i) precision oncology testing; and ii) companion diagnostics development. The total arrangement consideration is allocated to each separate unit of accounting based on their respective relative selling price. The BESP of precision oncology testing is determined based on its standalone selling price, and revenue is recognized as testing are performed if all other revenue recognition criteria are met. The BESP of companion diagnostics development is estimated under the cost-plus method by considering estimated cost of development services, gross margin on the projects, and future market conditions, among others. Revenue related to the companion diagnostics development are recorded as development services revenue in the accompanying consolidated statements of operations using a proportional performance model.
As of
December 31, 2018
and
2017
, the deferred revenue balance was
$16.1 million
and
$3.1 million
, respectively, which included
$10.5 million
and
$1.5 million
, respectively, related to collaboration development efforts with two pharmaceutical companies to be recognized as the Company performs research and development services in the future periods.
Costs of Precision Oncology Testing
Cost of precision oncology testing generally consists of cost of materials, direct labor including bonus, benefit and stock-based compensation, equipment and infrastructure expenses associated with processing liquid biopsy test samples (including sample accessioning, library preparation, sequencing, quality control analyses and shipping charges to transport blood samples), freight, curation of test results for physicians and license fees due to third parties. Infrastructure expenses include depreciation of laboratory equipment, rent costs, amortization of leasehold improvements and information technology costs. Costs associated with performing the Company’s tests are recorded as the tests are performed regardless of whether revenue was recognized with respect to that test. Royalties for licensed technology calculated as a percentage of revenues generated using the associated technology are recorded as expense at the time the related revenues are recognized. One-time royalty payments related to signing of license agreements or other milestones, such as issuance of new patents, are amortized to expense over the expected useful life of the applicable patent rights.
Cost of Development Services
Cost of development service includes costs incurred for the performance of development services requested by the Company’s customers. For development of new products, costs incurred before technological feasibility has been achieved are reported as research and development expenses, while costs incurred thereafter are reported as cost of development services.
Research and Development Expenses
Research and development expenses are comprised of costs incurred to develop technology and include salaries and benefits, reagents and supplies used in research and development laboratory work, infrastructure expenses, including allocated facility occupancy and information technology costs, contract services and other outside costs. Research and development expenses also include costs related to activities performed under contracts with biopharmaceutical companies. Research and development costs are expensed as incurred. Payments made prior to the receipt of goods or services to be used in research and development are deferred and recognized as expense in the period in which the related goods are received or services are rendered. Costs to develop the Company’s technology capabilities are recorded as research and development unless they meet the criteria to be capitalized as internal-use software costs.
License Agreements
The Company has entered and may continue to enter into license agreements to access and utilize certain technology. In each case, the Company evaluates if the license agreement results in the acquisition of an asset or a business. To date none of the Company’s license agreements have been considered to be the acquisition of a business.
For asset acquisitions, the upfront payments to acquire such licenses, as well as any future milestone payments made before product approval, are evaluated for capitalization considering if the asset is related to research and development and/or has alternative future use. These license agreements may also include contingent consideration in the form of future cash milestone or royalty payments. The Company assesses whether such contingent consideration meets the definition of a derivative. To date, the Company has determined that such contingent consideration are not derivatives. The Company continuously reassesses this determination until such time that the contingency is met or expires.
Advertising
The Company expenses advertising costs as incurred. The Company incurred advertising costs of
$223,000
,
$290,000
and
$597,000
for the years ended
December 31, 2018
,
2017
and
2016
, respectively.
115
Deferred Offering Costs
Deferred offering costs consist of fees and expenses incurred in connection with the anticipated sale of the Company’s common stock in the IPO, including the legal, accounting, printing and other IPO-related costs. In October 2018, upon completion of the IPO, the Company reclassified deferred offering costs of
$4.5 million
into additional paid-in capital as a reduction of the net proceeds received from the IPO. During the year ended
December 31, 2018
,
$4.4 million
of the deferred offering costs were paid.
Stock‑Based Compensation
Stock‑based compensation related to stock options granted to the Company’s employees and directors is measured at the grant date based on the fair value of the award. The fair value is recognized as expense over the requisite service period, which is generally the vesting period of the respective awards. The Company uses the Black‑Scholes option‑pricing model to estimate the fair value of its stock options. The Black-Scholes option-pricing model requires assumptions to be made related to the estimated fair value of the Company’s common stock at the applicable measurement date, expected term of an award, expected volatility, risk-free rate and expected dividend yield.
The Company accounts for stock options issued to non-employee consultants based on the estimated fair value at the grant date and re-measured at each reporting period using the Black-Scholes option-pricing model. The measurement of stock-based compensation is subject to periodic adjustments as the underlying equity instruments vest, and the resulting change in value, if any, is recognized in the Company’s consolidated statements of operations during the period that the related services are rendered.
In 2016, the Company recognized stock-based compensation expense net of estimated forfeiture activity, which is based on historical forfeiture rates. Starting January 1, 2017, upon adoption of Accounting Standards Update (“ASU”) 2016 -09,
Compensation – Stock Compensation (Topic 718)
, forfeitures are accounted for as they occur.
Income Taxes
Income taxes are recorded using an asset and liability approach. Deferred tax assets and liabilities are recognized for the future tax consequences attributable to differences between the financial statement carrying amounts of existing assets and liabilities and their respective tax bases using enacted tax rates in effect for the year in which the differences are expected to affect taxable income. Tax benefits are recognized when it is more likely than not that a tax position will be sustained during an audit. Deferred tax assets are reduced by a valuation allowance if current evidence indicates that it is considered more likely than not that these benefits will not be realized.
The Company’s tax positions are subject to income tax audits. The Company recognizes the tax benefit of an uncertain tax position only if it is more likely than not that the position is sustainable upon examination by the taxing authority, based on the technical merits. The tax benefit recognized is measured as the largest amount of benefit which is more likely than not to be realized upon settlement with the taxing authority. The Company recognizes interest accrued and penalties related to unrecognized tax benefits in its tax provision. The Company evaluates uncertain tax positions on a regular basis. The evaluations are based on a number of factors, including changes in facts and circumstances, changes in tax law, correspondence with tax authorities during the course of the audit, and effective settlement of audit issues. The provision for income taxes includes the effects of any accruals that the Company believes are appropriate, as well as the related net interest and penalties.
Net Loss Per Share Attributable to Common Stockholders
The Company calculates its basic and diluted net loss per share attributable to common stockholders in conformity with the two-class method required for companies with participating securities. Prior to the conversion of its convertible preferred stock into common stock in connection with the IPO, the Company considered its convertible preferred stock to be participating securities. In the event a dividend is declared or paid on the Company’s common stock, holders of convertible preferred stock were entitled to a share of such dividend in proportion to the holders of common stock on an as-if converted basis. Under the two-class method, basic net loss per share attributable to common stockholders is calculated by dividing the net loss attributable to common stockholders by the weighted-average number of shares of common stock outstanding for the period. Net loss attributable to common stockholders is determined by allocating undistributed earnings between common and preferred stockholders. The net loss attributable to common stockholders was not allocated to the convertible preferred stock under the two-class method as the convertible preferred stock did not have a contractual obligation to share in the Company’s losses. The diluted net loss per share attributable to common stockholders is computed by giving effect to all potential dilutive common stock equivalents outstanding for the period determined using the treasury stock method. For purposes of this calculation, convertible preferred stock, common stock warrants and stock options are considered common stock equivalents but have been excluded from the calculation of diluted net loss per share attributable to common stockholders as their effect is anti-dilutive.
116
Recent Accounting Pronouncements Not Yet Adopted
In May 2014, the FASB issued ASU 2014-09,
Revenue from Contracts with Customers (Topic 606)
(“ASC606”)
.
The new standard is based on the principle that revenue should be recognized to depict the transfer of promised goods or services to customers in an amount that reflects the consideration to which the entity expects to be entitled in exchange for those goods or services. Since its initial release, the FASB has issued several amendments to the standard, which include clarification of accounting guidance related to identification of performance obligations, intellectual property licenses and principal vs. agent considerations. The new guidance and all subsequent amendments will be effective for the Company beginning in 2019 and may be applied using either the full retrospective method, in which case the standard would be applied to each prior reporting period presented, or the modified retrospective method, in which case the cumulative effect of applying the standard would be recognized at the date of initial application. The Company will adopt the standard using the modified retrospective method.
The Company identified certain differences in accounting for revenue recognition as a result of developing an adoption plan for ASC 606. For precision oncology testing revenue, the Company identified a difference in accounting for certain revenue arrangements from the application of the new revenue accounting standard as compared to the previous revenue accounting standards. Historically, for certain clinical customers, the Company deferred revenue recognition until cash receipt when the price pursuant to the underlying customer arrangement became fixed and determinable and collectability became reasonably assured. Under the new standard, this is considered variable consideration. For these arrangements, the Company will record an estimate of the transaction price, subject to the constraint in the new standard for variable consideration, as revenue at the time of delivery. This estimate will be monitored in subsequent periods and adjusted as necessary based on actual collection experience. This will result in earlier revenue recognition as compared to previous revenue recognition. The Company is still in the process of quantifying the impact of the new guidance on its consolidated financial statements.
In February 2016, the FASB issued ASU 2016-02,
Leases (Topic 842)
. The new standard requires lessees to recognize most leases on their balance sheets as lease liabilities with corresponding right-of-use assets and eliminates certain real estate-specific provisions. The new guidance will be effective for the Company beginning in 2020, at which time, the new guidance will be adopted on a modified retrospective transition basis for leases existing at, or entered into after, the beginning of the earliest comparative period presented in the consolidated financial statements. The Company is currently evaluating the impact of the new guidance on its consolidated financial statements and anticipates the recognition of additional assets and corresponding liabilities on its consolidated balance sheet related to leases. The adoption of the new standard is also expected to materially impact the Company’s consolidated financial statement disclosures related to leases.
In June 2016, the FASB issued ASU 2016-13,
Financial Instruments - Credit Losses: Measurement of Credit Losses on Financial Instruments
, which amends the impairment model by requiring entities to use a forward-looking approach based on expected losses to estimate credit losses on certain types of financial instruments, including trade receivables and available for sale debt securities. The new guidance is effective for the Company beginning in 2021, with early adoption permitted. The Company is currently evaluating the impact of the new guidance on its consolidated financial statements.
In June 2018, the FASB issued ASU 2018-07,
Compensation—Stock Compensation (Topic 718): Improvements to Nonemployee Share-Based Payment Accounting
, which expands the scope of Topic 718 to include share-based payment transactions for acquiring goods and services from nonemployees. The new guidance is effective for the Company beginning in 2019, with early adoption permitted. The Company adopted the new guidance effective January 1, 2019 and the adoption is not expected to have a material impact on its consolidated financial statements or disclosures.
On December 22, 2017, the U.S. federal government enacted the Tax Cuts and Jobs Act (“the Tax Act”), which contains, among other things, significant changes to corporate taxation, including reduction of the corporate tax rate from a top marginal rate of 35% to a flat rate of 21% for tax years beginning after December 31, 2017, limitation of the deduction for net operating losses to 80% of current year taxable income and elimination of net operating loss carrybacks, implementing a territorial tax system, and requiring a mandatory one-time tax on U.S. owned undistributed foreign earnings and profits known as the transition tax. In December 2017, SEC staff issued Staff Accounting Bulletin No. 118,
Income Tax Accounting Implications of the Tax Cuts and Jobs Act
(“SAB 118”) to address the accounting implications of recently enacted U.S. federal tax reform. SAB 118 allows companies to record provisional amounts during a measurement period not to extend beyond one year of the enactment date to address ongoing guidance and tax interpretations that are expected over the next 12 months. The Company has adopted SAB 118 and no measurement period adjustments were recognized due to the full valuation allowance on the Company’s deferred tax assets.
117
|
3.
|
Investment in Joint Venture
|
Variable Interest Entity (“VIE”)
In connection with SoftBank’s purchase of its Series E convertible preferred stock, the Company entered into a joint venture agreement with an entity affiliated with SoftBank, a related party. In May 2018, the Company and SoftBank formed and capitalized Guardant Health AMEA, Inc. (the “Joint Venture”) for the sale, marketing and distribution of the Company’s tests in all areas worldwide, outside of North America, Central America, South America, the United Kingdom, all other member states of the European Union as of May 2017, Iceland, Norway, Switzerland and Turkey. The Company expects to rely on the Joint Venture to accelerate commercialization of its products in Asia, the Middle East and Africa, with an initial focus on Japan.
Under the terms of the joint venture agreement, the Company paid
$9.0 million
for
40,000
shares of common stock, or
50%
ownership interest, of the Joint Venture, and the affiliate of SoftBank contributed
$41.0 million
for
40,000
shares of common stock, or the other
50%
ownership interest, of the Joint Venture. Neither party has the obligation to provide additional financial support to the Joint Venture. Each party holds two seats on the board of the Joint Venture and has to cast through its representatives on the board at least one vote for any board resolution of the Joint Venture to pass. The representatives of the Company on the Joint Venture’s board of directors have the right to appoint and remove a chief executive officer and a legal representative for the Joint Venture, in each case, subject to the approval of the full Joint Venture board of directors. The Joint Venture’s board of directors has the right to appoint and remove all other members of the Joint Venture’s senior management reporting to its chief executive officer and to approve the compensation of all foregoing individuals, including the compensation of the chief executive officer and legal representative.
At the inception of the arrangement and at the end of each reporting period, the Company assesses whether the Joint Venture is a variable interest entity (“VIE”), and if so, who is the primary beneficiary of the VIE. As of
December 31, 2018
, the Company and SoftBank had equal ownership interests and equal voting rights in the Joint Venture, and the Joint Venture’s board consisted of an equal number of directors representing the interest of the Company and SoftBank, respectively. As of
December 31, 2018
, the Joint Venture’s board had the right to vote on all critical matters that most significantly impact the Joint Venture’s economic performance, except that the Company had the unilateral right to make pricing decisions. As of
December 31, 2018
, the Company had responsibility for the Joint Venture’s daily operations, while SoftBank served as a financing partner. The Company also entered into various ancillary agreements with the Joint Venture necessary to operate its business. The Joint Venture is deemed to be a VIE, and considering the power and benefits criterion, the Company and SoftBank, collectively as a related party group, has the characteristics of the primary beneficiary of the Joint Venture, as the related party group has the power to direct the activities of the VIE that most significantly impact the VIE’s economic performance and has the obligation to absorb losses or the right to receive benefits from the VIE that could potentially be significant to the VIE. Because the Company is most closely associated with the Joint Venture within the related party group, it has been identified as the VIE’s primary beneficiary. As the primary beneficiary, the Company has consolidated the financial position, results of operations and cash flows of the Joint Venture in its financial statements and all intercompany balances have been eliminated in consolidation. The Company concluded the Joint Venture did not meet the definition of a business upon consolidation as it lacked the processes required to generate outputs. Upon consolidation no liabilities were assumed and other than cash, and any identifiable assets were related to intellectual property rights that the Company transferred to the Joint Venture shortly before it became its primary beneficiary and therefore such transfer was treated as a common control transaction. Upon initial consolidation, the non-controlling interest of the affiliate of SoftBank was recorded at its estimated fair value of
$41.0 million
, which is equal to the original investment made by the affiliate of SoftBank.
As of
December 31, 2018
, the Joint Venture had total assets of approximately
$48.3 million
, which was primarily comprised of cash and security deposits. Although the Company consolidates the Joint Venture, the legal structure of the Joint Venture limits the recourse that its creditors will have over the Company’s general credit or assets. Similarly, the assets held in the Joint Venture can be used only to settle obligations of the Joint Venture. As of
December 31, 2018
, the Company has not provided financial or other support to the Joint Venture that was not previously contracted or required.
Put-call arrangements
The joint venture agreement includes a put-call arrangement with respect to the shares of the Joint Venture held by SoftBank and its affiliates. Under certain specified circumstances and on terms specified in the joint venture agreement, including timely written notice, SoftBank has the right to cause the Company to purchase all shares of the Joint Venture held by SoftBank and its affiliates (the “put right”), and the Company has a right to purchase all such shares (the “call right”).
118
If the Company’s business model were to change such that the sale, marketing and distribution of its tests in the territory covered by the joint venture agreement was no longer economical, SoftBank would have the right to cause the Company to purchase, or the Company would have the right to purchase, all of the shares of the Joint Venture held by SoftBank and its affiliates. In this instance, the Company would be required to repurchase the shares at an aggregate purchase price of
$41.0 million
, the original purchase price paid by SoftBank to the Joint Venture for the shares.
Additionally, each of the Company and SoftBank may exercise its respective put-call rights for the Company to purchase all shares of the Joint Venture held by SoftBank in the event of (i) certain material disagreement relating to the Joint Venture or its business that may seriously affect the ability of the Joint Venture to perform its obligations under the joint venture agreement or may otherwise seriously impair the ability of the Joint Venture to conduct its business in an effective matter, other than one relating to the Joint Venture’s business plan or to factual matters that may be capable of expert determination; (ii) the effectiveness of the Company’s initial public offering, a change in control of the Company, the seventh anniversary of the formation of the Joint Venture, or each subsequent anniversary of each of the foregoing events; or (iii) a material breach of the joint venture agreement by the other party that goes unremedied within
20
business days. The purchase price per share of the Joint Venture in these situations will be equal to the average closing price of the shares for the
20
trading days ending on the business day immediately preceding the date of the put or call notice, if the shares of the Joint Venture are publicly traded and listed on a national exchange; or determined by a third-party valuation firm on the assumption that the sale is on an arm’s-length basis on the date of the put or call notice. As a result of the IPO, the put-call rights for the Company to purchase all shares of the Joint Venture held by SoftBank are exercisable on each subsequent anniversary of the IPO by the Company or SoftBank.
In the event the Company exercises its call right, the fair value of the Joint Venture will be deemed to be no less than an amount that yields a
20%
internal rate of return on each tranche of capital invested by SoftBank and its affiliates in the Joint Venture, taking into account all proceeds received by SoftBank and its affiliates arising from their shares through such date.
In the event SoftBank exercises its put right and the fair value of the Joint Venture is determined to be greater than
40%
of the fair value of the Company, the Company will only be required to purchase the number of shares of the Joint Venture held by SoftBank and its affiliates having an aggregate value equal to the product of
40%
of the Company's fair value and the pro rata portion of the outstanding shares of the Joint Venture held by SoftBank and its affiliates.
The Company may pay the purchase price for the shares of the Joint Venture in cash, in shares of its capital stock (which may be a non-voting security with senior preferences to all other classes of its equity or, if its common stock is publicly traded on a national exchange, its common stock), or in a combination thereof. In the event the Company exercises the call right, SoftBank will choose the form of consideration. In the event SoftBank exercises the put right, the Company will choose the form of consideration.
The noncontrolling interest held by SoftBank contains embedded put-call redemption features that are not solely within the Company’s control and has been classified outside of permanent equity in the consolidated balance sheets. The put-call feature embedded in the redeemable noncontrolling interest do not currently require bifurcation as it does not meet the definition of a derivative and is considered to be clearly and closely related to the redeemable noncontrolling interest. The noncontrolling interest is considered probable of becoming redeemable as SoftBank has the option to exercise its put right to sell its equity ownership in the Joint Venture to the Company on or after the seventh anniversary of the formation of the Joint Venture, on each subsequent anniversary of the IPO and under certain other circumstances. The Company elected to recognize the change in redemption value immediately as they occur as if the put-call redemption feature were exercisable at the end of the reporting period. The carrying value of the redeemable noncontrolling interest is first adjusted for the earnings or losses attributable to the redeemable noncontrolling interest based on the percentage of the economic or ownership interest retained in the consolidated VIE by the noncontrolling parties, and then adjusted to equal to its redemption amount, or the fair value of the noncontrolling interest held by SoftBank, as if the redemption were to occur at the end of the reporting date. As of
December 31, 2018
, the fair value of the redeemable noncontrolling interest held by SoftBank approximated
$41.8 million
, and a fair value adjustment of
$800,000
was recorded in the Company’s consolidated statements of operations during the year ended
December 31, 2018
.
As of
December 31, 2018
, the fair value of the redeemable noncontrolling interest held by SoftBank was determined using the combination of the income approach and the market approach. Determining the fair value of the redeemable noncontrolling interest requires judgment and the use of significant estimates and assumptions. Such estimates and assumptions include future revenue growth rates, gross profit margins, EBITDA margins, future capital expenditures, weighted average costs of capital and future market conditions, among others. The fair value measurement of the redeemable noncontrolling interest is classified within Level 3 of the fair value hierarchy.
119
|
4.
|
Consolidated Balance Sheet Components
|
Property and Equipment, Net
Property and equipment, net consist of the following:
|
As of December 31,
|
|||||||
|
2018
|
2017
|
||||||
|
(in thousands)
|
|||||||
|
Machinery and equipment
|
$
|
23,440
|
|
$
|
15,676
|
|
|
|
Computer hardware
|
4,949
|
|
1,939
|
|
|||
|
Leasehold improvements
|
13,965
|
|
6,766
|
|
|||
|
Furniture and fixtures
|
1,522
|
|
1,347
|
|
|||
|
Computer software
|
643
|
|
655
|
|
|||
|
Construction in progress
|
3,118
|
|
349
|
|
|||
|
Property and equipment, gross
|
47,637
|
|
26,732
|
|
|||
|
Less: accumulated depreciation and amortization
|
(16,634
|
)
|
(10,696
|
)
|
|||
|
Property and equipment, net
|
$
|
31,003
|
|
$
|
16,036
|
|
|
Depreciation and amortization expense related to property and equipment was
$6.1 million
,
$4.2 million
and
$3.6 million
for the years ended
December 31, 2018
,
2017
and
2016
, respectively.
As of
December 31, 2018
and
2017
, total property and equipment financed under capital leases was
$504,000
and
$1.1 million
, net of accumulated amortization of
$294,000
and
$349,000
, respectively. Amortization expense related to total property and equipment financed under capital leases was
$164,000
,
$228,000
and
$66,000
, for the years ended
December 31, 2018
,
2017
and
2016
, respectively.
Accrued Expenses
Accrued expenses consist of the following:
|
As of December 31,
|
|||||||
|
2018
|
2017
|
||||||
|
(in thousands)
|
|||||||
|
Accrued royalty obligations
|
$
|
707
|
|
$
|
766
|
|
|
|
Accrued litigation settlement expense
|
—
|
|
3,000
|
|
|||
|
Accrued legal expenses
|
814
|
|
561
|
|
|||
|
Accrued tax liabilities
|
1,470
|
|
905
|
|
|||
|
Accrued professional services
|
1,791
|
|
336
|
|
|||
|
Purchases of property and equipment included in accrued expenses
|
343
|
|
—
|
|
|||
|
Other
|
1,956
|
|
838
|
|
|||
|
Total accrued expenses
|
$
|
7,081
|
|
$
|
6,406
|
|
|
|
5.
|
Fair Value Measurements, Cash Equivalents and Marketable Securities
|
Financial instruments consist of cash equivalents, marketable securities, prepaid expenses and other current assets, accounts payable, accrued expenses and debt. Cash equivalents and marketable securities are stated at fair value. Prepaid expenses and other current assets, accounts payable and accrued expenses are stated at their carrying value, which approximates fair value due to the short time to the expected receipt or payment date.
Fair value is defined as the exchange price that would be received from sale of an asset or paid to transfer a liability in the principal or most advantageous market for the asset or liability in an orderly transaction between market participants on the measurement date. The identification of market participant assumptions provides a basis for determining what inputs are to be used for pricing each asset or liability. A financial instrument’s classification within the fair value hierarchy is based upon the lowest level of input that is significant to the fair value measurement.
120
A fair value hierarchy has been established which gives precedence to fair value measurements calculated using observable inputs over those using unobservable inputs. This hierarchy prioritized the inputs into three broad levels as follows:
Level 1 - Quoted prices in active markets for identical assets or liabilities.
Level 2 - Inputs other than Level 1 that are observable, either directly or indirectly, such as quoted prices for similar assets or liabilities; quoted prices in markets that are not active; or other inputs that are observable or can be corroborated by observable market data for substantially the full term of the assets or liabilities.
Level 3 - Unobservable inputs that are supported by little or no market activity and that are significant to the fair value of the assets or liabilities.
The Company’s financial assets and liabilities subject to fair value measurements on a recurring basis and the level of inputs used in such measurements were as follows:
|
December 31, 2018
|
|||||||||||||||
|
Fair Value
|
Level 1
|
Level 2
|
Level 3
|
||||||||||||
|
(in thousands)
|
|||||||||||||||
|
Financial Assets:
|
|||||||||||||||
|
Money market funds
|
$
|
25,796
|
|
$
|
25,796
|
|
$
|
—
|
|
$
|
—
|
|
|||
|
Total cash equivalents
|
25,796
|
|
25,796
|
|
—
|
|
—
|
|
|||||||
|
Corporate bonds
|
38,397
|
|
—
|
|
38,397
|
|
—
|
|
|||||||
|
U.S. government debt securities
|
235,016
|
|
—
|
|
235,016
|
|
—
|
|
|||||||
|
U.S. government agency bonds
|
5,004
|
|
—
|
|
5,004
|
|
—
|
|
|||||||
|
Total short-term marketable securities
|
278,417
|
|
—
|
|
278,417
|
|
—
|
|
|||||||
|
Corporate bonds
|
3,805
|
|
—
|
|
3,805
|
|
—
|
|
|||||||
|
U.S. government debt securities
|
73,758
|
|
—
|
|
73,758
|
|
—
|
|
|||||||
|
Total long-term marketable securities
|
77,563
|
|
—
|
|
77,563
|
|
—
|
|
|||||||
|
Total
|
$
|
381,776
|
|
$
|
25,796
|
|
$
|
355,980
|
|
$
|
—
|
|
|||
|
December 31, 2017
|
|||||||||||||||
|
Fair Value
|
Level 1
|
Level 2
|
Level 3
|
||||||||||||
|
(in thousands)
|
|||||||||||||||
|
Financial Assets:
|
|||||||||||||||
|
Money market funds
|
$
|
33,485
|
|
$
|
33,485
|
|
$
|
—
|
|
$
|
—
|
|
|||
|
Total cash equivalents
|
33,485
|
|
33,485
|
|
—
|
|
—
|
|
|||||||
|
Corporate bonds
|
48,075
|
|
—
|
|
48,075
|
|
—
|
|
|||||||
|
U.S. government debt securities
|
100,965
|
|
—
|
|
100,965
|
|
—
|
|
|||||||
|
Total short-term marketable securities
|
149,040
|
|
—
|
|
149,040
|
|
—
|
|
|||||||
|
Corporate bonds
|
6,698
|
|
—
|
|
6,698
|
|
—
|
|
|||||||
|
U.S. government debt securities
|
66,556
|
|
—
|
|
66,556
|
|
—
|
|
|||||||
|
Total long-term marketable securities
|
73,254
|
|
—
|
|
73,254
|
|
—
|
|
|||||||
|
Total
|
$
|
255,779
|
|
$
|
33,485
|
|
$
|
222,294
|
|
$
|
—
|
|
|||
The Company measures the fair value of money market funds based on quoted prices in active markets for identical securities. Corporate bonds, U.S. government debt securities and U.S. government agency bonds are valued taking into consideration valuations obtained from third-party pricing services. The pricing services utilize industry standard valuation models, including both income and market-based approaches, for which all significant inputs are observable,
121
either directly or indirectly, to estimate fair value. These inputs include reported trades of and broker/dealer quotes on the same or similar securities, issuer credit spreads; benchmark securities; prepayment/default projections based on historical data; and other observable inputs.
The significant unobservable inputs used in the fair value measurement of the Company’s contingent consideration liability include the estimated amount and timing of projected cash flows, and the risk-adjusted discount rate used to present value the cash flows. The use of different inputs in the valuation of the contingent consideration liability could result in materially different fair value estimates.
There were no transfers between Level 1, Level 2 and Level 3 during the periods presented.
Cash Equivalents and Marketable Securities
The following tables summarizes the Company’s cash equivalents and marketable securities’ amortized costs, gross unrealized gains, gross unrealized losses and estimated fair values by significant investment category:
|
December 31, 2018
|
|||||||||||||||
|
Amortized Cost
|
Gross Unrealized Gain
|
Gross Unrealized Loss
|
Estimated Fair Value
|
||||||||||||
|
(in thousands)
|
|||||||||||||||
|
Money market fund
|
$
|
25,796
|
|
$
|
—
|
|
$
|
—
|
|
$
|
25,796
|
|
|||
|
Corporate bond
|
42,273
|
|
—
|
|
(71
|
)
|
42,202
|
|
|||||||
|
U.S. government debt securities
|
308,775
|
|
235
|
|
(236
|
)
|
308,774
|
|
|||||||
|
U.S. government agency bonds
|
$
|
5,014
|
|
$
|
—
|
|
$
|
(10
|
)
|
$
|
5,004
|
|
|||
|
Total
|
$
|
381,858
|
|
$
|
235
|
|
$
|
(317
|
)
|
$
|
381,776
|
|
|||
|
December 31, 2017
|
|||||||||||||||
|
Amortized Cost
|
Gross Unrealized Gain
|
Gross Unrealized Loss
|
Estimated Fair Value
|
||||||||||||
|
(in thousands)
|
|||||||||||||||
|
Money market fund
|
$
|
33,485
|
|
$
|
—
|
|
$
|
—
|
|
$
|
33,485
|
|
|||
|
Corporate bond
|
54,878
|
|
—
|
|
(105
|
)
|
54,773
|
|
|||||||
|
U.S. government debt securities
|
167,947
|
|
—
|
|
(426
|
)
|
167,521
|
|
|||||||
|
Total
|
$
|
256,310
|
|
$
|
—
|
|
$
|
(531
|
)
|
$
|
255,779
|
|
|||
There have been no material realized gains or losses on marketable securities for the periods presented. None of the Company’s investments in marketable securities has been in an unrealized loss position for more than one year. The Company determined that it did have the ability and intent to hold all marketable securities that have been in a continuous loss position until maturity or recovery, thus there has been no recognition of any other-than-temporary impairment in the year ended
December 31, 2018
,
2017
and
2016
. The maturities of the Company’s long-term marketable securities range from
1.0
to
1.4
years from
December 31, 2018
.
|
6.
|
Patent License Agreement
|
In January 2017, the Company entered into a license agreement with a biotechnology company for an exclusive, non-transferable right to use proprietary technology related to high-throughput screening and identification of mutations in targeted gene sequences. The payment terms of the license agreement included (i) a one-time upfront payment of
€1.0 million
; (ii) issuance of
141,774
shares of the Company's Series D convertible preferred stock; (iii) a milestone payment of
€1.0 million
associated with the achievement of a specified milestone event; and (iv) future royalty payments at the minimum of
€13.4 million
in the aggregate based on annual net sales in which the licensed technology are used. The Company made a one-time upfront payment of
$1.1 million
in January 2017 and a milestone payment of
$1.2 million
in August 2017 upon achievement of the specified milestone event. The Series D convertible preferred stock issued under the license agreement had a fair value of
$1.1 million
on the date of issuance. The transaction was treated as an acquisition of an asset and the Company capitalized the upfront payment, milestone payments and fair value of Series D convertible preferred stock in addition to license fees of
$6.3 million
related to the future minimum royalty payments discounted to the present value. The Company recorded the obligation at the estimated present value of the future
122
payments using a discount rate of
15%
(Level 3 input), the Company’s estimate of its effective borrowing rate for similar obligations.
As of
December 31, 2018
and
2017
, unamortized capitalized license fees plus one-time upfront and milestone payments totaled
$7.8 million
and
$8.7 million
, respectively, which will be amortized over the remaining useful life of
8.0
and
9.0
years, respectively. Amortization of capitalized license fees plus one-time upfront and milestone payments totaled
$939,000
and
$925,000
for the years ended
December 31, 2018
and
2017
, respectively.
|
7.
|
Senior Term Loan and Royalty Purchase Agreement
|
In 2015, the Company entered into a credit agreement with a financial institution for a senior term loan (the “Credit Agreement”). The Credit Agreement provided for up to
$40.0 million
in borrowing capacity. The Company borrowed
$20.0 million
on the effective date of the Credit Agreement. The Credit Agreement provided for an interest rate equal to the greater of (i) three-month LIBOR or (ii)
1%
per annum plus
8.75%
on the outstanding balance of the term loan not exceeding
$20.0 million
.
Concurrent with the Credit Agreement, the Company also entered into a Royalty Purchase Agreement (the “Royalty Agreement”) with the same financial institution, which obligated the Company to make quarterly royalty payments of (i)
1.5%
applied to total Company fiscal year revenues of up to
$50 million
and (ii)
2.45%
applied to fiscal year revenues in excess of
$50 million
. The Royalty Agreement included a buyout option, by which the Company had the right, exercisable in its sole discretion, to buy out the obligation to make future royalty payments. The price of this buyout option was calculated based on a table with axes of principal balance outstanding and time, less the cumulative sum of royalty payments at the time the buy-out option is exercised.
In June 2017, the Company exercised its prepayment right under the Credit Agreement and repaid the outstanding principal balance of
$19.8 million
and accrued interest of
$0.7 million
. The prepayment option also required the Company to pay a prepayment penalty of
$1.5 million
. Concurrent with the prepayment of the senior term loan, the Company also excised its royalty buyout option for
$4.5 million
. The transaction was accounted for as a debt extinguishment. The net carrying amount of the debt and royalty liabilities immediately before the extinguishment was
$20.7 million
. As a result, the difference between the reacquisition price and the net carrying amount of
$5.1 million
was recorded as loss on debt extinguishment in the accompanying consolidated statements of operations. As of
December 31, 2017
, the Company had
no
outstanding balance under the senior term loan and its related royalty obligations.
|
8
.
|
Commitments and Contingencies
|
Operating Leases
As of
December 31, 2018
, future minimum payments under the non-cancelable operating lease are as follows:
|
Year Ending December 31,
|
|||
|
(in thousands)
|
|||
|
2019
|
$
|
4,099
|
|
|
2020
|
5,273
|
|
|
|
2021
|
5,358
|
|
|
|
2022
|
5,557
|
|
|
|
2023
|
6,105
|
|
|
|
2024 and thereafter
|
15,786
|
|
|
|
Total
|
$
|
42,178
|
|
Rent expense for the facility leases was
$4.6 million
,
$1.8 million
and
$765,000
for the years ended
December 31, 2018
,
2017
and
2016
, respectively.
Capital Leases
In April 2017 and September 2016, the Company entered into capital lease arrangements to finance the purchase of manufacturing equipment of
$346,000
and
$554,000
, respectively. Both lease agreements have a contractual term of
four
years and do not include any bargain purchase option at the end of the lease term. In May 2018, the Company exercised its buyout option for one item of manufacturing equipment financed under a capital lease of
$554,000
, net of accumulated amortization of
$219,000
. The buyout resulted in a reduction of the Company’s capital lease obligations by
$323,000
.
123
As of
December 31, 2018
, future minimum capital lease payments are as follows:
|
Year Ending December 31,
|
|||
|
(in thousands)
|
|||
|
2019
|
$
|
141
|
|
|
2020
|
108
|
|
|
|
2021
|
36
|
|
|
|
Total minimum capital lease payments
|
285
|
|
|
|
Less: amount representing interest
|
(69
|
)
|
|
|
Present value of net minimum capital lease payments
|
216
|
|
|
|
Less: current installments of obligations under capital lease
|
(97
|
)
|
|
|
Obligations under capital lease, excluding current installments
|
$
|
119
|
|
License Agreements
The Company has patent license agreements with
four
different parties. Under these agreements, the Company has made one-time upfront and milestone payments, which it has capitalized and is amortizing to expense ratably over the useful life of the underlying patent right(s). Under some of these agreements, the Company is obligated to pay low single-digit percentage running royalties on net sales where the licensed patent right(s) are used in the product or service sold, subject to minimum annual royalties or fees in certain agreements.
Royalty expenses were included in cost of precision oncology testing on the accompanying consolidated statements of operations. The Company recognized royalty expenses of
$1.4 million
,
$1.1 million
and
$684,000
, or
2%
,
2%
and
3%
of precision oncology testing revenue in each period, for the years ended
December 31, 2018
,
2017
and
2016
, respectively. As of
December 31, 2018
, future minimum royalty payments are due as follows regardless of sales amounts:
|
Year Ending December 31,
|
|||
|
(in thousands)
|
|||
|
2019
|
$
|
1,431
|
|
|
2020
|
1,431
|
|
|
|
2021
|
1,431
|
|
|
|
2022
|
1,717
|
|
|
|
2023
|
1,717
|
|
|
|
2024 and thereafter
|
5,722
|
|
|
|
Total future minimum royalty payments
|
13,449
|
|
|
|
Less: amount representing interest
|
(6,111
|
)
|
|
|
Present value of future minimum royalty payments
|
$
|
7,338
|
|
Indemnification Agreements
The Company has entered into indemnification agreements with certain directors and officers that require the Company, among other things, to indemnify them against certain liabilities that may arise by reason of their status or service as directors or officers. To date, no such matters have arisen and the Company does not believe that the outcome of any claims under indemnification arrangements will have a material adverse effect on its financial positions, results of operations or cash flows. Accordingly, the Company has not recorded a liability related to such indemnifications as of
December 31, 2018
.
Security Incidents
In July 2018, the Company experienced security incidents involving an unauthorized actor obtaining access to its email system and sending phishing messages. The Company has implemented and continues to implement additional security measures to help prevent future unauthorized access to its systems and the data it maintains, including promptly engaging an independent cybersecurity firm to support its investigation, assess its systems and bolster security thereof. The Company provided timely notices to the U.S. Department of Health and Human Services, or the HHS, certain state regulators and certain credit agencies, as applicable, as well as to the individuals affected. Following such security incidents, the Company received a request for information in January 2019 regarding the incidents from the HHS Office
124
for Civil Rights, or OCR. The Company has responded to that request in a timely manner but does not know whether OCR will request additional information or pursue any further action. The Company currently cannot predict the ultimate resolution of the security incidents or the OCR inquiry and cannot estimate the amounts or ranges of potential loss that could result therefrom. The Company has insurance coverage in place for certain potential claims, liabilities and costs relating to the security incidents, but this coverage is limited in amount and may not be adequate to protect against all claims, liabilities and costs arising from such incidents, including fines and penalties.
Legal Proceedings
The Company is subject to claims and assessments from time to time in the ordinary course of business. The Company will accrue a liability for such matters when it is probable that a liability has been incurred and the amount can be reasonably estimated. When only a range of possible loss can be established, the most probable amount in the range is accrued. If no amount within this range is a better estimate than any other amount within the range, the minimum amount in the range is accrued. The accrual for a litigation loss contingency might include, for example, estimates of potential damages, outside legal fees and other directly related costs expected to be incurred.
Patent Disputes
In May 2016, Foundation Medicine, Inc. (“Foundation Medicine”) filed a lawsuit for patent infringement against the Company in the United States District Court for the Eastern District of Texas, alleging that the Company infringed Foundation Medicine’s patent relating to its tissue biopsy assay technology and seeking compensatory damages and attorneys’ fees. The Company filed
three
petitions for inter partes review (“IPR”) with the Patent Trial and Appeal Board (“PTAB”) at the U.S. Patent and Trademark Office, challenging the patentability of Foundation Medicine’s patent. In July 2018, the Company reached an agreement with Foundation Medicine to settle the lawsuit and resolve the IPRs. As part of the settlement agreement, which was accepted by the PTAB and the United States District Court, the Company made a one-time payment of
$3.0 million
to Foundation Medicine. The Company recorded
$3.0 million
as litigation settlement expense, a component of general and administrative expenses, at December 31, 2017.
In November 2017, the Company filed separate lawsuits against Foundation Medicine and Personal Genome Diagnostics, Inc. (“Personal Genome Diagnostics”) in the United States District Court for the District of Delaware, alleging that each of the
two
companies has infringed a patent relating to the Company's digital sequencing technology. The Company subsequently amended its original complaints in each case to assert infringement of three additional patents relating to its digital sequencing technology. In each lawsuit, the Company is seeking compensatory damages, injunctive relief and attorneys’ fees. Personal Genome Diagnostics and Foundation Medicine have each asserted counterclaims of patent invalidity and non-infringement. In March 2018, Personal Genome Diagnostics filed
two
petitions for post-grant review with the PTAB, challenging the patentability of
two
of the patents asserted by the Company. Prior to reaching a decision on the merits, the
two
post-grant review petitions were dismissed with prejudice in July 2018. Subsequently, Foundation Medicine filed
six
petitions for inter partes review with the PTAB, challenging the patentability of all four of the patents asserted by the Company, which actions are currently pending at the PTAB. The Company plans to vigorously defend its patent rights during such PTAB actions. At this time, the Company cannot reasonably ascertain the likelihood that any of the challenged patents will be found to be invalid or unenforceable.
License Dispute
In November 2018, the Company filed a request for arbitration to the International Chamber of Commerce claiming that one of its licensors, KeyGene N.V. (“Licensor”), has breached its patent license agreement with the Company. In January 2019, Licensor responded with its answer and counterclaims and alleged that the Company has breached the patent license agreement. The Company subsequently followed up with supplemental claims, for which Licensor responded with its supplemental answer. The Company is seeking damages, declaratory relief and alternative forms of relief including recession and reformation to address Licensor’s alleged breaches of the patent license agreement. Licensor is seeking damages, recovery of costs and fees and declaratory relief in addition to the dismissal of the Company’s claims. The arbitration is in preliminary stages, and no date has been set for rendering a final decision. At this time, the Company cannot reasonably ascertain the likelihood that any of its claims or Licensor’s counterclaims will be heard by the arbitration panel or succeed on the merits.
Other Disputes
In the first quarter of 2018, the Company settled a commercial dispute. In connection with the settlement, the Company received a payment of
$4.25 million
, which was reported as other income in the consolidated statements of operations for the year ended
December 31, 2018
.
125
|
9.
|
Common Stock
|
Common stockholders are entitled to dividends if and when declared by the Company’s Board of Directors (the “Board of Directors”). As of
December 31, 2018
and
2017
, no dividends on common stock had been declared by the Board of Directors.
Common stock has been reserved for the following potential future issuances:
|
As of December 31,
|
||||
|
2018
|
2017
|
|||
|
Conversion of outstanding convertible preferred stock
|
—
|
|
58,264,577
|
|
|
Shares underlying outstanding stock options
|
7,588,405
|
7,391,052
|
||
|
Shares available for future stock option grants
|
3,556,507
|
1,698,790
|
||
|
Exercise and conversion of preferred stock warrants
|
—
|
|
7,636
|
|
|
Exercise of common stock warrants
|
—
|
|
313,741
|
|
|
Total
|
11,144,912
|
67,675,796
|
||
Repurchase of Common Stock
In April 2018, the Company repurchased
30,451
shares of outstanding common stock from certain employees at a price of
$10.80
per share for a total consideration of
$329,000
. These shares were repurchased at a price that exceeded the fair value of the shares. The difference between the repurchase amount and the fair value of these shares of
$157,000
were recorded as cash-based compensation expense in the accompanying statement of operations.
In July 2017, the Company repurchased
1,588,065
shares of outstanding common stock from certain executive officers considered to be related parties for
$16.3 million
. In August 2017, the Company repurchased
131,243
shares of outstanding common stock from certain executive and non-executive employees for
$1.6 million
. These shares were repurchased at a price in excess of the then-current fair value of the shares. The difference between the repurchase amount and the fair value of repurchased shares of
$10.7 million
were recorded as cash-based compensation expense in the accompanying statement of operations.
During year ended December 31, 2016, the Company repurchased
19,139
shares of outstanding common stock from certain employees at a price of
$10.13
per share for a total of
$194,000
. These shares were repurchased at a price that exceeded the fair value of the shares. The difference between the repurchase amount and the fair value of these shares of
$124,000
were recorded as cash-based compensation expense in the accompanying statement of operations.
The common stock repurchased by the Company was retired immediately thereafter.
|
10.
|
Warrants
|
In connection with a bank loan agreement with a financial institution in September 2013, the Company issued warrants to purchase
5,386
shares of Series A convertible preferred stock at an exercise price of
$0.93
per share. In October 2014, the Company issued additional warrants to the same financial institution to purchase
4,965
shares of Series B convertible preferred stock at an exercise price of
$3.16
per share. Both preferred stock warrants expire in
ten
years from issuance and were outstanding as of
December 31, 2017
. These preferred stock warrants were converted to warrants to purchase common stock upon the consummation of the IPO and were net exercised into
6,548
shares of common stock in October 2018.
No
warrants remained outstanding as of
December 31, 2018
.
In 2012, the Company issued to certain investors warrants to purchase
495,775
shares of common stock. The exercise price of the warrants is
$0.14
per share and the warrants have a contractual term through September 2023. For the years ended
December 31, 2018
and
2017
,
313,741
and
89,030
shares, respectively, were issued upon the exercise of these warrants. As of
December 31, 2017
, warrants to purchase
313,741
shares of common stock were outstanding, and these warrants were fully exercised prior to the consummation of the IPO in October 2018.
|
11.
|
Convertible Preferred Stock
|
The Company previously issued convertible preferred stock in one or more series, each with such designations, rights, qualifications, limitations, and restrictions as set forth in the Company’s certificate of incorporation, as in effect prior to the IPO. Immediately prior to the completion of the IPO, as described in Note 1,
Description of Business
, all shares of convertible preferred stock then outstanding were automatically converted to
58,264,577
shares of common stock at the respective conversion ratios in October 2018.
126
The Company’s convertible preferred stock as of
December 31, 2017
consisted of the following:
|
December 31, 2017
|
|||||||||||
|
Shares Authorized
|
Shares Issued and Outstanding
|
Aggregate Liquidation Preference
|
Net Carrying Value
|
||||||||
|
(in thousands)
|
|||||||||||
|
Series A
|
9,935,864
|
9,263,558
|
$
|
8,598
|
|
$
|
8,531
|
|
|||
|
Series B
|
10,320,952
|
10,297,182
|
32,490
|
|
32,428
|
|
|||||
|
Series C
|
8,873,996
|
8,873,996
|
55,999
|
|
55,921
|
|
|||||
|
Series D
|
11,222,041
|
11,222,041
|
83,904
|
|
83,559
|
|
|||||
|
Series E
|
39,751,611
|
38,970,592
|
320,419
|
|
319,535
|
|
|||||
|
Total convertible preferred stock
|
80,104,464
|
78,627,369
|
$
|
501,410
|
|
$
|
499,974
|
|
|||
In May 2017, the Company entered into the Series E convertible preferred stock purchase agreement with SoftBank and certain of the Company's existing stockholders. Pursuant to the purchase agreement, the Company issued and sold an aggregate of
38,174,246
shares of Series E convertible preferred stock at a purchase price of
$8.3936
per share, for an aggregate purchase price of
$320.4 million
. The purchase agreement also provided that the Company would issue additional shares of Series E convertible preferred stock to the Series E investors in such an amount as to cause SoftBank’s equity ownership in the Company to equal
35%
of the Company’s outstanding fully-diluted capital stock measured
70
days after the initial closing. This gross-up was intended to enable the Company to engage in various repurchases of its equity from existing stockholders and still maintain SoftBank’s equity ownership at
35%
. As a result, in July 2017, the Company repurchased an aggregate of
1,588,065
shares of common stock from certain of its directors and executive officers for a purchase price of
$10.23887
per share, which represented a price equal to
90%
of the original price per shares for the Series E convertible preferred stock, as adjusted to reflect the
0.7378
-for-one reverse stock split of the Company’s common stock effected on September 19, 2018. The Company also engaged in a tender offer pursuant to which it repurchased
131,243
shares of common stock from certain employees at the same per share price paid for the Series E convertible preferred stock as adjusted to reflect the
0.7378
-for-one reverse stock split of the Company’s common stock effected on September 19, 2018, and
666,920
shares of Series A convertible preferred stock from existing stockholders at a purchase price of
$8.00
per share of Series A convertible preferred stock. Following these repurchases, in October 2017, the Company issued an additional
796,346
shares of Series E convertible preferred stock to the Series E investors for a purchase price of
$0.00001
per share pursuant to the terms of the gross up provision. The conversion price of Series E convertible preferred stock was adjusted as a result of the dilutive issuance of Series E convertible preferred stock under the gross up provision.
In May 2017, in accordance with its certificate of incorporation then in effect, the Company adjusted the conversion price of Series D convertible preferred stock from
$10.1338
per share to
$9.8329
per share. The Company accounted for the transaction as a modification. A deemed dividend of
$1.1 million
, calculated as the additional
253,361
shares of common stock to be received upon the conversion of the Series D convertible preferred stock after the conversion ratio adjustment, multiplied by the then current fair value of the Company’s common stock, was reported as an increase to net loss attributable to common stockholders for the year ended
December 31, 2017
.
In February and March 2016, the Company raised a total of
$40.1 million
through the sale and issuance of an aggregate of
5,360,509
shares of Series D convertible preferred stock at a price of
$7.4767
per share.
Repurchase of Series A Convertible Preferred Stock
During the year ended December 31, 2017, the Company repurchased
666,920
shares of outstanding Series A convertible preferred stock at a price of
$8.00
per share for a total consideration of
$5.3 million
. The difference between the repurchase amount and the carrying value of these shares of
$4.7 million
was recorded as a deemed dividend in accumulated deficit on the accompanying consolidated statements of stockholders’ equity.
|
12.
|
Stock-Based Compensation
|
2012 Stock Plan and 2018 Incentive Award Plan
In June 2012 and September 2018, the Company’s Board of Directors adopted and its stockholders approved the Company’s 2012 Stock Plan (as amended and restated, the “2012 Plan”) and the Company’s 2018 Incentive Award Plan (the “2018 Plan”), respectively, under which the Company may grant cash and equity incentive awards such as stock options, restricted shares, stock units and stock appreciation rights to its employees and non-employees. Stock
127
options granted may be either incentive stock options or nonstatutory stock options. Shares issued under the 2018 Plan may be authorized but unissued shares, or shares purchased in the open market or treasury shares. Upon effectiveness of the 2018 Plan in connection with the IPO in October 2018, the 2012 Plan was terminated and
508,847
shares reserved under the 2012 Plan were forfeited. Any outstanding awards granted under the 2012 Plan remain outstanding, subject to the terms of the 2012 Plan and applicable award agreement, and further cancellation of awards granted under the 2012 Plan are not available for grant in the future. No further grants will be made under the 2012 Plan. As of
December 31, 2018
,
3,658,602
shares were approved and reserved for issuance under the 2018 Plan.
Stock Option Activity
A summary of the Company’s stock option activity under the 2012 Plan and the 2018 Plan and related information is as follows:
|
Options Outstanding
|
|||||||||||||||
|
Shares
Available for Grant
|
Shares Subject to Options Outstanding
|
Weighted-Average Exercise Price
|
Weighted-Average Remaining Contractual Life (Years)
|
Aggregate Intrinsic Value
|
|||||||||||
|
(in thousands)
|
|||||||||||||||
|
Balance as of December 31, 2016
|
699,462
|
|
3,592,185
|
|
$
|
2.77
|
|
8.6
|
$
|
3,325
|
|
||||
|
Shares authorized
|
5,141,141
|
|
—
|
|
|||||||||||
|
Granted
|
(4,685,577
|
)
|
4,685,577
|
|
4.17
|
|
|||||||||
|
Exercised
|
—
|
|
(342,946
|
)
|
2.25
|
|
|||||||||
|
Canceled
|
543,764
|
|
(543,764
|
)
|
3.48
|
|
|||||||||
|
Balance as of December 31, 2017
|
1,698,790
|
|
7,391,052
|
|
3.63
|
|
8.8
|
7,595
|
|
||||||
|
Shares authorized
|
3,658,602
|
|
—
|
|
|||||||||||
|
Shares forfeited
|
(508,847
|
)
|
—
|
|
|||||||||||
|
Granted
|
(2,088,639
|
)
|
2,088,639
|
|
7.19
|
|
|||||||||
|
Exercised
|
—
|
|
(1,007,387
|
)
|
3.09
|
|
|||||||||
|
Canceled
|
795,371
|
|
(883,899
|
)
|
4.57
|
|
|||||||||
|
Repurchase of early exercised shares
|
1,230
|
|
—
|
|
|||||||||||
|
Balance as of December 31, 2018
|
3,556,507
|
|
7,588,405
|
|
$
|
4.58
|
|
8.3
|
$
|
250,495
|
|
||||
|
Vested and Exercisable as of December 31, 2018
|
3,066,648
|
|
$
|
3.49
|
|
7.5
|
$
|
104,560
|
|
||||||
Aggregate intrinsic value represents the difference between the estimated fair value of the underlying common stock and the exercise price of outstanding, in-the-money options. The total intrinsic value of the options exercised was
$8.4 million
,
$606,000
and
$221,000
for the years ended
December 31, 2018
,
2017
and
2016
, respectively.
The weighted-average grant date fair value of options granted was
$5.17
,
$2.90
and
$2.32
per share for the years ended
December 31, 2018
,
2017
and
2016
, respectively.
Future stock-based compensation for unvested options as of
December 31, 2018
was
$17.5 million
, which is expected to be recognized over a weighted-average period of
2.7
years.
128
Stock‑Based Compensation Expense
The following table presents the effect of employee and non‑employee related stock‑based compensation expense:
|
Year Ended December 31,
|
|||||||||||
|
2018
|
2017
|
2016
|
|||||||||
|
(in thousands)
|
|||||||||||
|
Cost of precision oncology testing
|
$
|
512
|
|
$
|
162
|
|
$
|
225
|
|
||
|
Research and development expense
|
1,684
|
|
507
|
|
479
|
|
|||||
|
Sales and marketing expense
|
1,727
|
|
80
|
|
1,031
|
|
|||||
|
General and administrative expense
|
2,928
|
|
2,921
|
|
236
|
|
|||||
|
Total stock-based compensation expense
|
$
|
6,851
|
|
$
|
3,670
|
|
$
|
1,971
|
|
||
Valuation of Stock Options
The grant date fair value of employee stock options was estimated using a Black-Scholes option-pricing model with the following weighted-average assumptions:
|
Year Ended December 31,
|
||||||
|
2018
|
2017
|
2016
|
||||
|
Expected term (in years)
|
5.01 – 6.51
|
6.02 – 6.08
|
6.02 – 6.43
|
|||
|
Expected volatility
|
68.7% – 78.8%
|
74.1% – 75.1%
|
65.2% – 67.7%
|
|||
|
Risk-free interest rate
|
2.5% – 3.0%
|
1.9% – 2.2%
|
1.2% – 2.3%
|
|||
|
Expected dividend yield
|
—%
|
—%
|
—%
|
|||
The determination of the fair value of stock options on the date of grant using a Black-Scholes option-pricing model is affected by the estimated fair value of the Company’s common stock, as well as assumptions regarding a number of variables that are complex, subjective and generally require significant judgment to determine. The valuation assumptions were determined as follows:
Fair Value of Common Stock
Prior to the IPO, the grant date fair value of the Company’s common stock was determined by the Company’s Board of Directors with the assistance of management and an independent third-party valuation specialist. The grant date fair value of the Company’s common stock was determined using valuation methodologies which utilizes certain assumptions including probability weighting of events, volatility, time to liquidation, a risk-free interest rate and an assumption for a discount for lack of marketability (Level 3 inputs). In determining the fair value of the Company’s common stock, the methodologies used to estimate the enterprise value of the Company were performed using methodologies, approaches, and assumptions consistent with the American Institute of Certified Public Accountants Accounting and Valuation Guide,
Valuation of Privately-Held-Company Equity Securities Issued as Compensation
. Subsequent to the IPO, the fair value of the Company's common stock is determined by the closing price, on the date of grant, of its common stock, which is traded on the Nasdaq Global Select Market.
Expected Term
The expected term represents the period that the options granted are expected to be outstanding and is determined using the simplified method (based on the mid-point between the vesting date and the end of the contractual term) as the Company has concluded that its stock option exercise history does not provide a reasonable basis upon which to estimate expected term.
129
Expected Volatility
Prior to the commencement of trading of the Company's common stock on the Nasdaq Global Select Market on October 4, 2018 in connection with the IPO, there was no active trading market for the Company's common stock. The Company derived the expected volatility from the average historical volatilities over a period approximately equal to the expected term of comparable publicly traded companies within its peer group that were deemed to be representative of future stock price trends as the Company has limited trading history for its common stock. The Company will continue to apply this process until a sufficient amount of historical information regarding the volatility of its own stock price becomes available.
Risk-Free Interest Rate
The risk-free interest rate is based on the U.S. Treasury rate, with maturities similar to the expected term of the stock options.
Expected Dividend Yield
The Company does not anticipate paying any dividends in the foreseeable future and, therefore, uses an expected dividend yield of
zero
.
Valuation of Stock Option Grants to Non-Employees
Total options outstanding as of
December 31, 2018
and
2017
included
481,861
and
651,801
shares of options, respectively, that were granted to non-employees, of which
16,830
and
184,451
shares were granted during the years ended
December 31, 2018
and
2017
, respectively. Stock-based compensation expense related to stock options granted to non-employees is recognized as the stock option is earned and the services are rendered. The fair value of stock options granted to non-employees was estimated on the date of grant using the Black-Scholes option pricing model. The valuation assumptions used were substantially consistent with the assumption used to value the employee options with the exception of the expected term which was based on the contractual term of the award. The fair value of the stock options granted to non-employees is calculated at each reporting date using the Black-Scholes options-pricing model with the following assumptions:
|
Year Ended December 31,
|
||||||
|
2018
|
2017
|
2016
|
||||
|
Expected term (in years)
|
5.1 – 10.0
|
6.0 – 10.0
|
6.0 – 10.0
|
|||
|
Expected volatility
|
64.9% – 79.4%
|
66.1% – 73.4%
|
66.2% – 69.5%
|
|||
|
Risk-free interest rate
|
2.3% – 3.2%
|
1.2% – 2.3%
|
1.2% – 2.3%
|
|||
|
Expected dividend yield
|
—%
|
—%
|
—%
|
|||
Stock-based compensation related to grant of options to non-employees was
$1.4 million
,
$380,000
and
$237,000
for the years ended
December 31, 2018
,
2017
and
2016
, respectively.
2018 Employee Stock Purchase Plan
In September 2018, the Company’s Board of Directors adopted and its stockholders approved the 2018 Employee Stock Purchase Plan (the “ESPP”). A total of
922,250
shares of common stock are initially reserved for issuance under the ESPP. The number of shares may be increased in accordance with the terms of the ESPP.
Subject to any plan limitations, the ESPP allows eligible employees to contribute, normally through payroll deductions, up to 10% of their earnings for the purchase of the Company’s common stock at a discounted price per share. The price at which common stock is purchased under the ESPP is equal to 85% of the fair market value of the Company's common stock on the first or last day of the offering period, whichever is lower. Except for the initial offering period, the ESPP provides for separate six-month offering periods beginning on February 1 and August 1 of each year. The initial offering period ran from October 2, 2018 through January 31, 2019.
During the year ended December 31, 2018,
no
shares of common stock were purchased under the ESPP. The total compensation expense related to the ESPP for year ended
December 31, 2018
was
$321,000
. The following assumptions were used to calculate the stock-based compensation for each stock purchase right granted under the ESPP: a weighted-average expected life of
0.33
years; expected volatility of
43.6%
; a risk-free interest rate of
2.4%
; and a
zero
dividend yield.
130
Liabilities for Early Exercise of Employee Options
The Company allowed certain stock option holders to exercise unvested options to purchase shares of common stock. Shares received from such early exercises are subject to repurchase in the event of the optionee’s employment termination, at the original issuance price, until the options are fully vested. As of
December 31, 2018
and
2017
,
44,268
and
18,600
shares of common stock were subject to repurchase at weighted-average prices of
$4.66
and
$2.82
per share, respectively. As of
December 31, 2018
, the cash proceeds received for unvested shares of common stock of
$206,000
was recorded within other long-term liabilities on the consolidated balance sheet. As of
December 31, 2017
, the cash proceeds received for unvested shares of common stock recorded within other current and long-term liabilities on the consolidated balance sheet were insignificant. The shares issued pursuant to unvested options have been included in shares issued and outstanding on the consolidated balance sheet and consolidated statement of redeemable noncontrolling interest and stockholders’ equity as such shares are considered legally outstanding.
|
13.
|
Net Loss Per Share Attributable to Guardant Health, Inc. Common Stockholders
|
The following table sets forth the computation of the basic and diluted net loss per share attributable to Guardant Health, Inc. common stockholders:
|
Year Ended December 31,
|
|||||||||||
|
2018
|
2017
|
2016
|
|||||||||
|
(in thousands, except per share data)
|
|||||||||||
|
Net loss
|
$
|
(84,263
|
)
|
$
|
(83,221
|
)
|
$
|
(46,139
|
)
|
||
|
Fair value adjustment of redeemable noncontrolling interest
|
(800
|
)
|
—
|
|
—
|
|
|||||
|
Net loss attributable to Guardant Health, Inc.
|
(85,063
|
)
|
(83,221
|
)
|
(46,139
|
)
|
|||||
|
Deemed dividend related to repurchase of Series A convertible preferred stock
|
—
|
|
(4,716
|
)
|
—
|
|
|||||
|
Deemed dividend related to change in conversion rate of Series D convertible preferred stock
|
—
|
|
(1,058
|
)
|
—
|
|
|||||
|
Net loss attributable to Guardant Health, Inc. common stockholders, basic and diluted
|
$
|
(85,063
|
)
|
$
|
(88,995
|
)
|
$
|
(46,139
|
)
|
||
|
Net loss per share attributable to Guardant Health, Inc. common stockholders, basic and diluted
|
$
|
(2.80
|
)
|
$
|
(7.07
|
)
|
$
|
(3.53
|
)
|
||
|
Weighted-average shares used in computing net loss per share attributable to Guardant Health, Inc. common stockholders, basic and diluted
|
30,403
|
|
12,582
|
|
13,053
|
|
|||||
Since the Company was in a loss position for all periods presented, basic net loss per share attributable to Guardant Health, Inc. common stockholders is the same as diluted net loss per share attributable to Guardant Health, Inc. common stockholders, as the inclusion of all potential shares of common stock outstanding would have been anti-dilutive. The following weighted-average common stock equivalents were excluded from the calculation of diluted net loss per share attributable to Guardant Health, Inc. common stockholders for the periods presented as they had an anti-dilutive effect:
|
Year Ended December 31,
|
||||||||
|
2018
|
2017
|
2016
|
||||||
|
(in thousands)
|
||||||||
|
Convertible preferred stock (on an as if converted basis)
|
43,898
|
|
44,818
|
|
29,009
|
|
||
|
Stock options issued and outstanding
|
7,527
|
|
5,179
|
|
3,043
|
|
||
|
ESPP obligation
|
22
|
|
—
|
|
—
|
|
||
|
Preferred stock warrants (on an as if converted basis)
|
6
|
|
8
|
|
8
|
|
||
|
Common stock warrants
|
208
|
|
382
|
|
404
|
|
||
|
Common stock subject to repurchase
|
46
|
|
28
|
|
101
|
|
||
|
Total
|
51,707
|
|
50,415
|
|
32,565
|
|
||
131
|
14.
|
Income Taxes
|
The components of loss before provision for income taxes were as follows (in thousands):
|
Year Ended December 31,
|
|||||||||||
|
2018
|
2017
|
2016
|
|||||||||
|
(in thousands)
|
|||||||||||
|
United States
|
$
|
(84,313
|
)
|
$
|
(83,214
|
)
|
$
|
(46,133
|
)
|
||
|
Foreign
|
88
|
|
—
|
|
—
|
|
|||||
|
Total
|
$
|
(84,225
|
)
|
$
|
(83,214
|
)
|
$
|
(46,133
|
)
|
||
The components of the provision for income taxes are as follows:
|
Year Ended December 31,
|
|||||||||||
|
2018
|
2017
|
2016
|
|||||||||
|
(in thousands)
|
|||||||||||
|
Current:
|
|||||||||||
|
State
|
$
|
4
|
|
$
|
—
|
|
$
|
—
|
|
||
|
Foreign
|
34
|
|
7
|
|
6
|
|
|||||
|
Total current tax expense
|
38
|
|
7
|
|
6
|
|
|||||
|
Total provision for income taxes
|
$
|
38
|
|
$
|
7
|
|
$
|
6
|
|
||
Deferred income taxes reflect the tax effects of temporary differences between the carrying amounts of assets and liabilities for financial reporting purposes and the amounts used for income tax purposes. Significant components of the Company’s deferred tax assets are as follows:
|
Year Ended December 31,
|
|||||||
|
2018
|
2017
|
||||||
|
(in thousands)
|
|||||||
|
Deferred tax assets:
|
|||||||
|
Net operating losses carryforwards
|
$
|
36,783
|
|
$
|
25,657
|
|
|
|
Intangible assets
|
17,107
|
|
10,436
|
|
|||
|
Accruals and reserves
|
5,127
|
|
3,553
|
|
|||
|
Research and development credits
|
5,753
|
|
2,823
|
|
|||
|
Stock-based compensation
|
1,289
|
|
727
|
|
|||
|
Other
|
210
|
|
484
|
|
|||
|
Total deferred tax asset
|
$
|
66,269
|
|
$
|
43,680
|
|
|
|
Deferred tax liabilities:
|
|||||||
|
Property and equipment
|
$
|
(73
|
)
|
$
|
—
|
|
|
|
Less: valuation allowance
|
(66,196
|
)
|
(43,680
|
)
|
|||
|
Net deferred tax assets
|
$
|
—
|
|
$
|
—
|
|
|
132
The following table presents a reconciliation of the income tax expense computed at the statutory federal rate and the Company's income tax expense for the periods presented:
|
Year Ended December 31,
|
|||||||||||
|
2018
|
2017
|
2016
|
|||||||||
|
(in thousands)
|
|||||||||||
|
Tax at the statutory federal rate
|
$
|
(17,690
|
)
|
$
|
(28,293
|
)
|
$
|
(15,687
|
)
|
||
|
Other nondeductible items
|
329
|
|
371
|
|
360
|
|
|||||
|
Stock-based compensation
|
497
|
|
3,819
|
|
413
|
|
|||||
|
Research and development credits
|
(1,726
|
)
|
(714
|
)
|
(304
|
)
|
|||||
|
Change in valuation allowance
|
22,516
|
|
5,415
|
|
16,640
|
|
|||||
|
State taxes, net of federal benefits
|
(4,231
|
)
|
(1,868
|
)
|
(1,224
|
)
|
|||||
|
Change in tax rate due to Tax Act
|
—
|
|
21,346
|
|
—
|
|
|||||
|
Other
|
343
|
|
(69
|
)
|
(192
|
)
|
|||||
|
Total provision for income taxes
|
$
|
38
|
|
$
|
7
|
|
$
|
6
|
|
||
The Company’s actual tax expense differed from the statutory federal income tax expense using a tax rate of 21%, 34% and 34% for the years ended
December 31, 2018
,
2017
and
2016
, respectively, primarily due to state income taxes, nondeductible expenses, research and development tax credits and the change in valuation allowance.
As of
December 31, 2018
and
2017
, the Company had a net operating loss carryforwards of
$152.3 million
and
$107.3 million
for federal purposes, and
$73.2 million
and
$46.9 million
for state and local purposes, respectively, which may be subject to limitations as described below. If not utilized, these carryforwards will begin to expire in 2031 for federal, and 2020 for state and local purposes. Under the newly enacted federal income tax law, federal net operating losses incurred in 2018 and in future years may be carried forward indefinitely, but the deductibility of such federal net operating losses is limited. It is uncertain if and to what extent various states will conform to the newly enacted federal income tax law.
As of
December 31, 2018
and
2017
, the Company had research and development tax credit carryforwards for federal tax purposes of
$3.5 million
and
$1.5 million
, and state research and development tax credit carryforwards of
$2.9 million
and
$1.7 million
, respectively. The federal research and development tax credit carryforwards will expire at various dates beginning in the year 2032. The Company’s state research and development tax credit carryforwards do not expire.
Utilization of the net operating loss (“NOL”) carryforwards and credits may be subject to a substantial annual limitation due to the ownership change limitations provided by the Internal Revenue Code of 1986, as amended, and similar state provisions. The annual limitation may result in the expiration of NOL carryforwards and credits before utilization. Current laws impose substantial restrictions on the utilization of NOL carryforwards and credits in the event of an “ownership change” within a three-year period as defined by the Internal Revenue Code Section 382 (“Section 382”). If there should be an ownership change, the Company’s ability to utilize its NOL carryforwards and credits could be limited. The Company has not performed a Section 382 analysis.
Realization of the future tax benefits is dependent on the Company’s ability to generate sufficient taxable income within the carryforward period. Due to the Company’s history of U.S. operating losses, the Company believes that the recognition of the deferred tax assets arising from the above-mentioned future tax benefits is currently not more likely than not to be realized and, accordingly, have provided a full valuation allowance against net U.S. deferred tax assets. The net change in total valuation allowance was an increase of
$22.5 million
and an increase of
$5.4 million
for the years ended
December 31, 2018
and
2017
, respectively.
The SEC staff issued SAB 118 on December 23, 2017 regarding application of the Tax Act. It provides a “measurement period,” lasting through December 22, 2018, to allow registrants time to obtain, prepare and analyze information to complete the accounting required under ASC 740,
Income Taxes
. The Company completed its analysis during the measurement period and there were no measurement period adjustments recognized during
2018
.
The Company has not recorded a provision for deferred U.S. tax expense that could result from the remittance of foreign undistributed earnings since the Company intends to reinvest the earnings in its foreign subsidiaries indefinitely.
133
Uncertain Tax Positions
The Company records unrecognized tax benefits, where appropriate, for all uncertain income tax positions. The Company recorded unrecognized tax benefits for uncertain tax positions of
$3.4 million
and
$1.7 million
as of
December 31, 2018
and
2017
, respectively, none of which would impact the Company's effective tax rate if recognized, because the benefit would be offset by an increase in the valuation allowance.
A reconciliation of the beginning and ending balance of total unrecognized tax benefits is as follows:
|
Year Ended December 31,
|
|||||||||||
|
2018
|
2017
|
2016
|
|||||||||
|
(in thousands)
|
|||||||||||
|
Unrecognized tax benefits - Beginning of period
|
$
|
1,712
|
|
$
|
884
|
|
$
|
1,691
|
|
||
|
Increases related to current year’s tax positions
|
1,635
|
|
828
|
|
353
|
|
|||||
|
Increases related to prior years' tax positions
|
80
|
|
—
|
|
—
|
|
|||||
|
Decreases related to prior years’ tax positions
|
—
|
|
—
|
|
(1,160
|
)
|
|||||
|
Unrecognized tax benefits - End of period
|
$
|
3,427
|
|
$
|
1,712
|
|
$
|
884
|
|
||
The Company’s policy is to recognize interest and penalties accrued on any unrecognized tax benefits as a component of income tax expense. During the years ended
December 31, 2018
and
2017
, the Company recognized no interest and penalties associated with unrecognized tax benefits. There are no tax positions for which it is reasonably possible that the total amounts of unrecognized tax benefits will significantly increase or decrease within twelve months of the reporting date.
Due to the net operating loss carryforwards, all years remain open for income tax examination by tax authorities in the United States, various states and foreign tax jurisdictions in which the Company files tax returns.
|
15.
|
Employee Benefit Plan
|
The Company sponsors a 401(k) plan, and pursuant to its terms, eligible employees can elect to contribute to the 401(k) plan, subject to certain limitations, up to the lesser of the statutory maximum or
100%
of eligible compensation on a pre-tax basis. For the three year period ended
December 31, 2018
, the Company has not elected to match employee contributions as permitted by the plan. The Company pays the administrative costs for the plan.
|
16.
|
Segment and Geographic Information
|
The following table sets forth the Company’s revenue by geographic areas based on the customers’ locations:
|
Year Ended December 31,
|
|||||||||||
|
2018
|
2017
|
2016
|
|||||||||
|
(in thousands)
|
|||||||||||
|
United States
|
$
|
77,916
|
|
$
|
43,715
|
|
$
|
21,641
|
|
||
|
International(1)
|
12,723
|
|
6,127
|
|
3,608
|
|
|||||
|
Total revenue
|
$
|
90,639
|
|
$
|
49,842
|
|
$
|
25,249
|
|
||
|
(1)
|
No single country outside of the United States accounted for more than 10% of total revenue during the year ended
December 31, 2018
,
2017
and
2016
.
|
As of
December 31, 2018
and
2017
, all of the Company’s long-lived assets are located in the United States.
|
17.
|
Related Party Transactions
|
As discussed in Note 3, in connection with Softbank's purchase of its Series E convertible preferred stock in 2017, the Company entered into a joint venture agreement with an entity affiliated with SoftBank. In May 2018, the Company and SoftBank formed and capitalized the Joint Venture to accelerate commercialization of its products in Asia, the Middle East and Africa, with an initial focus on Japan. The Company has consolidated the financial position, results of operations and cash flows of the Joint Venture in its financial statements and all intercompany balances have been eliminated in consolidation.
134
As discussed in Note 9, in July and August 2017, the Company repurchased an aggregate of
1,640,901
shares of outstanding common stock from certain executive officers for
$16.9 million
. The difference between the repurchase amount and the fair value of repurchased shares of
$10.0 million
were recorded as cash-based compensation expense in the accompanying consolidated statements of operations.
For the year ended
December 31, 2017
, the Company recognized revenue of
$461,000
from an entity affiliated with a member of the Company’s Board of Directors, who serves on the board of both the aforementioned entity and the Company. This individual was appointed to the Company’s board in January 2017.
Item 9. Changes in and Disagreements with Accountants on Accounting and Financial Disclosure
None.
Item 9A. Controls and Procedures
Evaluation of disclosure controls and procedures
Our management, with the participation of our chief executive officer, or CEO, and chief financial officer, or CFO, has evaluated the effectiveness of our disclosure controls and procedures (as defined in Rules 13a-15(e) and 15d-15(e) under the Securities Exchange Act of 1934, as amended, or Exchange Act), as of the end of the period covered by this Annual Report on Form 10-K. Based on that evaluation, our CEO and CFO have concluded that as of
December 31, 2018
, our disclosure controls and procedures are designed at a reasonable assurance level and are effective to provide reasonable assurance that information we are required to disclose in reports that we file or submit under the Exchange Act is recorded, processed, summarized, and reported within the time periods specified in the rules and forms of the SEC, and that such required information is accumulated and communicated to our management, including our CEO and CFO, as appropriate, to allow timely decisions regarding required disclosures.
Changes in internal control
There was no change in our internal control over financial reporting identified in connection with the evaluation required by Rule 13a-15(d) and 15d-15(d) of the Exchange Act that occurred during the period covered by this Annual Report on Form 10-K that has materially affected, or is reasonably likely to materially affect, our internal control over financial reporting.
Management report on internal control over financial reporting
This Annual Report on Form 10-K does not include a report of management's assessment regarding internal control over financial reporting due to a transition period established by rules of the SEC for newly public companies.
In addition, for so long as we qualify as an "emerging growth company" as defined under the JOBS Act, our independent registered accounting firm is not required to issue an attestation report on our internal control over financial reporting.
Item 9B. Other Information.
In March 2019, the compensation committee of our board of directors approved entering into a letter agreement with each of Helmy Eltoukhy, our CEO, and AmirAli Talasaz, our President and Chief Operating Officer and the chairman of our board of directors, respectively.
The letter agreements provide that if either executive experiences a “qualifying termination” of employment (as defined in our Executive Severance Plan), other than in connection with a change in control, then each time-based vesting equity award held by the executive will vest and become exercisable as to the portion of the award that would have vested over the one-year period following the termination date (had the executive remained in continuous service during such period). This acceleration right is subject to the executive’s timely executive and non-revocation of a general release of claims against us.
The foregoing summary is qualified in its entirety by reference to the full text of the form of the letter agreements, which is filed as Exhibit 10.19 to this Annual Report on Form 10-K, and is incorporated herein by reference.
135
PART III
Item 10. Directors, Executive Officers and Corporate Governance
The information required by this Item 10 of Form 10-K will be included in our 2019 Proxy Statement to be filed with the SEC in connection with the solicitation of proxies for our 2019 Annual Meeting of Stockholders and is incorporated herein by reference. The 2019 Proxy Statement will be filed with the SEC within 120 days after the end of the fiscal year to which this Annual Report on Form 10-K relates.
Item 11. Executive Compensation
The information required by this Item 11 of Form 10-K will be included in our 2019 Proxy Statement and is incorporated herein by reference.
Item 12. Security Ownership of Certain Beneficial Owners and Management and Related Stockholder Matters
The information required by this Item 12 of Form 10-K will be included in our 2019 Proxy Statement and is incorporated herein by reference.
Item 13. Certain Relationships and Related Transactions, and Director Independence
The information required by this Item 13 of Form 10-K will be included in our 2019 Proxy Statement and is incorporated herein by reference.
Item 14. Principal Accounting Fees and Services
The information required by this Item 14 of Form 10-K will be included in our 2019 Proxy Statement and is incorporated herein by reference.
PART IV
Item 15. Exhibits, Financial Statement Schedules
(a)
Documents filed as part of this report
(1)
All financial statements
See Index to Consolidated Financial Statements in Part II, Item 8 of this Annual Report on Form 10-K.
(2)
Financial Statement Schedules
All financial statement schedules have been omitted since the required information was not applicable or was not present in amounts sufficient to require submission of the schedules, or because the information required is included in the consolidated financial statements or the accompanying notes.
(3)
Exhibits required by Item 601 of Regulation S-K
The exhibits listed in the following Index to Exhibits are filed, furnished or incorporated by reference as part of this Annual Report on Form 10-K.
136
INDEX TO EXHIBITS
|
Incorporated by Reference
|
||||||||||||
|
Exhibit Number
|
Exhibit Description
|
Form
|
File No.
|
Exhibit
|
Filing Date
|
Filed/Furnished Herewith
|
||||||
|
3.1
|
8-K
|
001-38683
|
3.1
|
10/9/2018
|
||||||||
|
3.2
|
8-K
|
001-38683
|
3.2
|
10/9/2018
|
||||||||
|
10.1
|
S-1
|
333-227206
|
10.1
|
9/6/2018
|
||||||||
|
10.2#
|
S-1
|
333-227206
|
10.3
|
9/6/2018
|
||||||||
|
10.2(a)#
|
S-1
|
333-227206
|
10.4
|
9/6/2018
|
||||||||
|
10.3#
|
S-8
|
333-227762
|
99.2(a)
|
10/10/2018
|
||||||||
|
10.3(a)#
|
S-1/A
|
333-227206
|
10.9(a)
|
9/21/2018
|
||||||||
|
10.3(b)#
|
S-1/A
|
333-227206
|
10.9(b)
|
9/21/2018
|
||||||||
|
10.3(c)#
|
S-1/A
|
333-227206
|
10.9(c)
|
9/21/2018
|
||||||||
|
10.4#
|
S-8
|
333-227762
|
99.3
|
10/10/2018
|
||||||||
|
10.4(a)#
|
*
|
|||||||||||
|
10.5#
|
Executive Severance Plan
|
S-1/A
|
333-227206
|
10.13
|
9/21/2018
|
|||||||
|
10.5(a)#
|
*
|
|||||||||||
|
10.6#
|
S-1/A
|
333-227206
|
10.14
|
9/21/2018
|
||||||||
|
10.7#
|
10-Q
|
001-38683
|
10.9
|
11/19/2018
|
||||||||
|
10.8#
|
10-Q
|
001-38683
|
10.10
|
11/19/2018
|
||||||||
|
10.9
|
S-1/A
|
333-227206
|
10.8
|
9/18/2018
|
||||||||
|
10.10
|
S-1
|
333-227206
|
10.2
|
9/6/2018
|
||||||||
|
10.11
|
S-1
|
333-227206
|
10.2(a)
|
9/6/2018
|
||||||||
|
10.12§
|
S-1
|
333-227206
|
10.5
|
9/6/2018
|
||||||||
|
10.13§
|
S-1
|
333-227206
|
10.6
|
9/6/2018
|
||||||||
|
10.14§
|
S-1
|
333-227206
|
10.7
|
9/6/2018
|
||||||||
|
10.15§
|
S-1
|
333-227206
|
10.7(a)
|
9/6/2018
|
||||||||
|
10.16§
|
S-1
|
333-227206
|
10.7(b)
|
9/6/2018
|
||||||||
137
|
10.17§
|
S-1
|
333-227206
|
10.7(c)
|
9/6/2018
|
||||||||
|
10.18§
|
S-1
|
333-227206
|
10.7(d)
|
9/6/2018
|
||||||||
|
10.19#
|
*
|
|||||||||||
|
21.1
|
*
|
|||||||||||
|
23.1
|
*
|
|||||||||||
|
31.1
|
*
|
|||||||||||
|
31.2
|
*
|
|||||||||||
|
32.1
|
**
|
|||||||||||
|
32.2
|
**
|
|||||||||||
|
101.INS
|
XBRL Instance Document
|
*
|
||||||||||
|
101.SCH
|
XBRL Taxonomy Extension Schema Document
|
*
|
||||||||||
|
101.CAL
|
XBRL Taxonomy Extension Calculation Linkbase Document
|
*
|
||||||||||
|
101.DEF
|
XBRL Taxonomy Extension Definition Linkbase Document
|
*
|
||||||||||
|
101.LAB
|
XBRL Taxonomy Extension Label Linkbase Document
|
*
|
||||||||||
|
101.PRE
|
XBRL Taxonomy Extension Presentation Linkbase Document
|
*
|
||||||||||
___________________________
|
*
|
Filed herewith.
|
|
**
|
Furnished herewith.
|
|
#
|
Indicates management contract or compensatory plan.
|
|
§
|
Portions of this exhibit (indicated by asterisks) have been omitted pursuant to a request for confidential treatment pursuant to Rule 24b-2 under the Securities Exchange Act of 1934, as amended.
|
Item 16. Form 10-K Summary
None.
138
SIGNATURES
Pursuant to the requirements of Section 13 or 15(d) the Securities Exchange Act of 1934, the registrant has duly caused this report to be signed on its behalf by the undersigned, thereunto duly authorized.
|
GUARDANT HEALTH, INC.
|
|||
|
Dated:
|
March 19, 2019
|
By:
|
/s/ Helmy Eltoukhy
|
|
Name:
|
Helmy Eltoukhy
|
||
|
Title:
|
Chief Executive Officer
|
||
Power of Attorney
KNOW ALL PERSONS BY THESE PRESENTS, that each person whose signature appears below constitutes and appoints Helmy Eltoukhy, his attorneys-in-fact, each with the power of substitution, for him in any and all capacities, to sign any amendments to this Annual Report on Form 10-K, and to file the same, with exhibits thereto and other documents in connection therewith, with the Securities and Exchange Commission, hereby ratifying and confirming all that each of said attorneys-in-fact, or his substitute or substitutes, may do or cause to be done by virtue hereof.
Pursuant to the requirements of the Securities Exchange Act of 1934, this report has been signed below by the following persons on behalf of the Registrant and in the capacities and on the dates indicated:
|
Signature
|
Title
|
Date
|
||
|
/s/ Helmy Eltoukhy
|
Chief Executive Officer and Director
(Principal Executive Officer)
|
March 19, 2019
|
||
|
Helmy Eltoukhy
|
||||
|
/s/ Derek Bertocci
|
Chief Financial Officer
(Principal Accounting Officer and Principal Financial Officer)
|
March 19, 2019
|
||
|
Derek Bertocci
|
||||
|
/s/ AmirAli Talasaz
|
President, Chief Operating Officer and Chairman of the Board of Directors
|
March 19, 2019
|
||
|
AmirAli Talasaz
|
||||
|
/s/ Ian Clark
|
Director
|
March 19, 2019
|
||
|
Ian Clark
|
||||
|
/s/ Aaref Hilaly
|
Director
|
March 19, 2019
|
||
|
Aaref Hilaly
|
||||
|
/s/ Samir Kaul
|
Director
|
March 19, 2019
|
||
|
Samir Kaul
|
||||
|
/s/ Stanley Meresman
|
Director
|
March 19, 2019
|
||
|
Stanley Meresman
|
||||
|
/s/ Dipchand Nishar
|
Director
|
March 19, 2019
|
||
|
Dipchand Nishar
|
||||
139
TABLE OF CONTENTS
Part IItem 1. BusinessItem 1A. Risk FactorsItem 1B. Unresolved Staff CommentsItem 2. PropertiesItem 3. Legal ProceedingsItem 4. Mine Safety DisclosuresPart IIItem 5. Market For Registrant S Common Equity, Related Stockholder Matters and Issuer Purchases Of Equity SecuritiesItem 6. Selected Financial DataItem 7. Management S Discussion and Analysis Of Financial Condition and Results Of OperationsItem 7A. Quantitative and Qualitative Disclosures About Market RiskItem 8. Financial Statements and Supplementary DataItem 9. Changes in and Disagreements with Accountants on Accounting and Financial DisclosureItem 9A. Controls and ProceduresItem 9B. Other InformationPart IIIItem 10. Directors, Executive Officers and Corporate GovernanceItem 11. Executive CompensationItem 12. Security Ownership Of Certain Beneficial Owners and Management and Related Stockholder MattersItem 13. Certain Relationships and Related Transactions, and Director IndependenceItem 14. Principal Accounting Fees and ServicesPart IVItem 15. Exhibits, Financial Statement SchedulesItem 16. Form 10-k Summary