GRAHAM HOLDINGS CO
10-Ks and 10-Qs
|
|
|
|
|
|
|
|
|
|
|
|
|
|
|
|
|
|
|
|
|
|
|
|
|
|
|
|
|
|
|
|
|
|
|
|
|
|
|
|
|
|
|
|
|
|
|
|
|
|
|
|
|
UNITED STATES SECURITIES AND EXCHANGE COMMISSION
Washington, D.C. 20549
FORM 10-K
ANNUAL REPORT PURSUANT TO SECTION 13 OR 15(d) OF THE SECURITIES EXCHANGE ACT OF 1934
FOR THE FISCAL YEAR ENDED
December 31, 2018
Commission file number 1-6714
Graham Holdings Company
(Exact name of registrant as specified in its charter)
|
Delaware
|
|
53-0182885
|
|
(State or other jurisdiction of incorporation or organization)
|
|
(I.R.S. Employer Identification No.)
|
|
1300 North 17th Street, Arlington, Virginia
|
|
22209
|
|
(Address of principal executive offices)
|
|
(Zip Code)
|
Registrant’s Telephone Number, Including Area Code: (703) 345-6300
Securities Registered Pursuant to Section 12(b) of the Act:
|
Title of each class
|
|
Name of each exchange on which registered
|
|
Class B Common Stock, par value
$1.00 per share
|
|
New York Stock Exchange
|
Indicate by check mark if the registrant is a well-known seasoned issuer, as defined in Rule 405 of the Securities Act. Yes
ý
No
¨
Indicate by check mark if the registrant is not required to file reports pursuant to Section 13 or Section 15(d) of the Act. Yes
¨
No
ý
Indicate by check mark whether the registrant (1) has filed all reports required to be filed by Section 13 or 15(d) of the Securities Exchange Act of 1934 during the preceding 12 months (or for such shorter period that the registrant was required to file such reports), and (2) has been subject to such filing requirements for the past 90 days. Yes
ý
No
¨
Indicate by check mark whether the registrant has submitted electronically every Interactive Data File required to be submitted pursuant to Rule 405 of Regulation S-T (§232.405 of this chapter) during the preceding 12 months (or for such shorter period that the registrant was required to submit such files). Yes
ý
No
¨
Indicate by check mark if disclosure of delinquent filers pursuant to Item 405 of Regulation S-K (§229.405 of this chapter) is not contained herein, and will not be contained, to the best of registrant’s knowledge, in definitive proxy or information statements incorporated by reference in Part III of this Form 10-K or any amendment to this Form 10-K.
¨
Indicate by check mark whether the registrant is a large accelerated filer, an accelerated filer, a non-accelerated filer, a smaller reporting company, or an emerging growth company. See the definitions of “large accelerated filer,” “accelerated filer,” “smaller reporting company” and “emerging growth company” in Rule 12b-2 of the Exchange Act.
|
Large accelerated
filer
|
ý
|
Accelerated
filer
|
¨
|
Non-accelerated
filer
|
¨
|
Smaller reporting
company
|
¨
|
Emerging growth
company
|
¨
|
If an emerging growth company, indicate by check mark if the registrant has elected not to use the extended transition period for complying with any new or revised financial accounting standards provided pursuant to Section 13(a) of the Exchange Act.
¨
Indicate by check mark whether the registrant is a shell company (as defined in Rule 12b-2 of the Act). Yes
¨
No
ý
Aggregate market value of the registrant’s common equity held by non-affiliates on
June 29, 2018
, based on the closing price for the Company’s Class B Common Stock on the New York Stock Exchange on such date: approximately
$2,500,000,000
.
Shares of common stock outstanding at
February 20, 2019
:
Class A Common Stock –
964,001
shares
Class B Common Stock –
4,353,623
shares
Documents partially incorporated by reference:
Definitive Proxy Statement for the registrant’s
2019
Annual Meeting of Stockholders
(incorporated in Part III to the extent provided in Items 10, 11, 12, 13 and 14 hereof).
GRAHAM HOLDINGS COMPANY
2018
FORM 10-K
|
Item 1.
|
Business
|
||
|
|
Education
|
||
|
|
Television Broadcasting
|
||
|
|
Other Activities
|
||
|
|
Competition
|
||
|
|
Executive Officers
|
||
|
|
Employees
|
||
|
|
Forward-Looking Statements
|
||
|
|
Available Information
|
||
|
Item 1A.
|
Risk Factors
|
||
|
Item 1B.
|
Unresolved Staff Comments
|
||
|
Item 2.
|
Properties
|
||
|
Item 3.
|
Legal Proceedings
|
||
|
Item 4.
|
Mine Safety Disclosures
|
||
|
Item 5.
|
Market for the Registrant’s Common Equity, Related Stockholder Matters and Issuer Purchases of Equity Securities
|
||
|
Item 6.
|
Selected Financial Data
|
||
|
Item 7.
|
Management’s Discussion and Analysis of Financial Condition and Results of Operations
|
||
|
Item 7A.
|
Quantitative and Qualitative Disclosures About Market Risk
|
||
|
Item 8.
|
Financial Statements and Supplementary Data
|
||
|
Item 9.
|
Changes in and Disagreements With Accountants on Accounting and Financial Disclosure
|
||
|
Item 9A.
|
Controls and Procedures
|
||
|
Item 9B.
|
Other Information
|
||
|
Item 10.
|
Directors, Executive Officers and Corporate Governance
|
||
|
Item 11.
|
Executive Compensation
|
||
|
Item 12.
|
Security Ownership of Certain Beneficial Owners and Management and Related Stockholder Matters
|
||
|
Item 13.
|
Certain Relationships and Related Transactions, and Director Independence
|
||
|
Item 14.
|
Principal Accounting Fees and Services
|
||
|
Item 15.
|
Exhibits, Financial Statement Schedules
|
||
|
Item 16.
|
Form 10-K Summary
|
||
|
INDEX TO EXHIBITS
|
|||
|
SIGNATURES
|
|||
|
INDEX TO FINANCIAL INFORMATION
|
|||
|
Management’s Discussion and Analysis of Results of Operations and Financial Condition (Unaudited)
|
|||
|
Financial Statements:
|
|
||
|
Report of Independent Registered Public Accounting Firm
|
|||
|
Consolidated Statements of Operations for the Three Years Ended December 31, 2018
|
|||
|
Consolidated Statements of Comprehensive Income (Loss) for the Three Years Ended December 31, 2018
|
|||
|
Consolidated Balance Sheets at December 31, 2018 and 2017
|
|||
|
Consolidated Statements of Cash Flows for the Three Years Ended December 31, 2018
|
|||
|
Consolidated Statements of Changes in Common Stockholders’ Equity for the Three Years Ended December 31, 2018
|
|||
|
Notes to Consolidated Financial Statements
|
|||
|
Five-Year Summary of Selected Historical Financial Data (Unaudited)
|
|||
PART I
Item 1. Business.
Graham Holdings Company (the Company) is a diversified education and media company whose operations include educational services; television broadcasting; online, print and local TV news; home health and hospice care; and manufacturing. The Company’s Kaplan, Inc. (Kaplan) subsidiary provides a wide variety of educational services, both domestically and outside the United States. The Company’s media operations comprise the ownership and operation of television broadcasting (through the ownership and operation of seven television broadcast stations), plus Slate and Foreign Policy magazines; Panoply, a podcast technology and advertising company; and Pinna, an ad-free audio streaming service for children. The Company also owns home health and hospice providers, four industrial companies, two automotive dealerships and Social Code LLC, a marketing solutions provider.
Financial information concerning the principal segments of the Company’s business for the past three fiscal years is contained in Note 19 to the Company’s Consolidated Financial Statements appearing elsewhere in this Annual Report on Form 10-K. Revenues for each segment are shown in Note 19 gross of intersegment sales. Consolidated revenues are reported net of intersegment sales, which did not exceed 0.1% of consolidated operating revenues.
The Company’s operations in geographic areas outside the U.S. consist primarily of Kaplan’s non-U.S. operations. During each of the fiscal years
2018
,
2017
and
2016
, these operations accounted for approximately
24%
,
25%
and
25%
, respectively, of the Company’s consolidated revenues, and the identifiable assets attributable to non-U.S. operations represented approximately
23%
and
21%
of the Company’s consolidated assets at
December 31, 2018
and
2017
, respectively.
Education
Kaplan, a subsidiary of the Company, provides an extensive range of education and related services worldwide for students and professionals. Kaplan conducts its operations through four segments: Kaplan International, Kaplan Higher Education, Kaplan Test Preparation and Kaplan Professional (U.S.). In addition, the results of the Kaplan Corporate segment include results of Kaplan’s investment activities in education technology companies.
The following table presents revenues for each of Kaplan’s segments:
|
Year Ended December 31
|
|||||||||||
|
(in thousands)
|
2018
|
2017
|
2016
|
||||||||
|
Kaplan International
|
$
|
719,982
|
|
$
|
697,999
|
|
$
|
696,362
|
|
||
|
Kaplan Higher Education
|
342,085
|
|
431,425
|
|
501,784
|
|
|||||
|
Kaplan Test Preparation
|
256,102
|
|
273,298
|
|
286,556
|
|
|||||
|
Kaplan Professional (U.S.)
|
134,187
|
|
115,839
|
|
115,263
|
|
|||||
|
Kaplan Corporate and Intersegment Eliminations
|
(1,341
|
)
|
(1,785
|
)
|
(1,504
|
)
|
|||||
|
Total Kaplan Revenue
|
$
|
1,451,015
|
|
$
|
1,516,776
|
|
$
|
1,598,461
|
|
||
Kaplan International
Kaplan International (KI) operates businesses in Europe, the U.S. and the Asia Pacific region. Each of these businesses is discussed below.
Europe.
In Europe, KI operates the following businesses, all of which are based in the U.K. and Ireland: Kaplan UK, KI Pathways, KI English, Mander Portman Woodward, Dublin Business School and Kaplan Open Learning.
The Kaplan UK business in Europe, through Kaplan Financial Limited, is a provider of training, test preparation services and degrees for accounting and financial services professionals, including those studying for ACCA, CIMA and ICAEW qualifications. In addition, Kaplan UK provides professional training. In
2018
, Kaplan UK provided courses to over 50,000 students in accountancy and financial services. Kaplan UK is headquartered in London, England, and has 21 training centers located throughout the U.K.
The KI Pathways business offers academic preparation programs especially designed for international students who wish to study in English-speaking countries. In 2018, university preparation programs were delivered in Australia, China, Japan, Myanmar, Singapore, the U.K. and the U.S., serving approximately 12,000 students in partnership with more than 40 universities.
The KI English business provides English-language training, academic preparation programs and test preparation for English–proficiency exams, principally for students wishing to study and travel in English-speaking countries. KI English operates a total of 37 English-language schools, with 19 located in the U.K., Ireland, Australia, New
1
Zealand and Canada and 18 located in the U.S. In
2018
, KI English served approximately 36,000 students for in-class English-language instruction.
Mander Portman Woodward (MPW) is a U.K. independent sixth-form college that prepares domestic and international students for A-level examinations that control admission to U.K. universities. MPW operates three colleges in London, Cambridge and Birmingham.
KI also operates Dublin Business School in Ireland, a higher education institution, and Kaplan Open Learning in the U.K., an online learning institution. At the end of
2018
, these institutions enrolled an aggregate of approximately 6,000 students.
U.K. Immigration Regulations.
Certain KI businesses serve a significant number of international students; therefore, the ability to sponsor students from outside the European Economic Area (EEA) and Switzerland to come to the U.K. is critical to these businesses. Pursuant to regulations administered by the United Kingdom Visas and Immigration Department (UKVI), the KI Pathways business is required to hold or operate Tier 4 sponsorship licenses for international students to be permitted to enter the U.K. to study the courses KI Pathways delivers. Two of the KI English schools also have Tier 4 licenses to enable them to teach international students, although students studying the English language may generally choose to enter the U.K. on a short-term study visa as opposed to a Tier 4 visa.
Each Tier 4 license holder is required to have passed the Basic Compliance Assessment (BCA) and hold Educational Oversight accreditation. Without these criteria being met, KI’s U.K. schools would not be permitted to issue a Confirmation of Acceptance for Studies to potential incoming international students, which is a prerequisite to a student obtaining a Tier 4 student visa. The UKVI rules also require all private institutions to obtain Educational Oversight accreditation, which requires a current and satisfactory full inspection, audit or review by the appropriate academic standards body. For the seventh consecutive year, KI has retained 100% in Tier 4 Educational Oversight with high grades across all colleges, and all Tier 4 license renewals have been approved again with high scores in the core measurable requirements. KI English has two U.K. English-language schools listed on the Kaplan Tier 4 master license. The MPW schools each hold current Tier 4 licenses and have performed consistently well with good records in their Office for Standards in Education, Children’s Services and Skills (OFSTED) and Independent Schools Inspectorate (ISI) Educational Oversight inspections.
The Higher Education and Research Act 2017 (HERA) received Royal Assent on April 27, 2017. HERA undertook a significant reform of regulation of the higher education sector in the U.K., including the formation of a new regulator, the Office for Students (OfS). The 2018–2019 academic year is a transition year under the new regulatory framework. The OfS has published regulatory guidance, including the new Regulatory Framework for Higher Education in England. All of KI’s higher education businesses in the U.K. will need to successfully complete registration with the OfS in 2019 to ensure that they continue operating and retain their Tier 4 sponsor licenses or continue to receive government student loan funding. Pathways institutions registered with the OfS will be, for the first time, recognized as Higher Education Providers, with students of approved providers having many of the same Tier 4 privileges as students of universities in the U.K. effective August 1, 2019. No assurance can be given that each KI business required to register with the OfS will be successful in doing so. Failure to register with the OfS would result in the loss of a Tier 4 license and, where relevant, inability to accept students funded by U.K. domestic student loans. Failure of one or more institutions to successfully register with the OfS would have a material adverse effect on Kaplan Europe’s operating results.
Changes continue to be made to U.K. immigration rules. The introduction of revised immigration rules has historically increased, and may continue to increase, KI’s operating costs in the U.K.
No assurance can be given that each KI business in the U.K. will be able to maintain its Tier 4 BCA status and Educational Oversight/OfS accreditation or registration. Maintenance of each of these approvals requires compliance with several core metrics that may be difficult to attain. Loss of either Tier 4 BCA status or Educational Oversight/OfS accreditation or registration would have a material adverse effect on KI Europe’s operating results.
Impact of Brexit.
On June 23, 2016, the U.K. held a referendum in which voters approved a proposal that the U.K. leave the European Union (EU), commonly referred to as “Brexit.” The impact of Brexit on KI will depend, in part, on the outcome of future negotiations regarding the terms of the U.K.’s withdrawal from the EU, possibly including any transition period or the outcome of any “no deal” exit. A “no deal” exit would occur if the U.K. government is not able to reach agreement with the EU on either transition arrangements or its future relationship with the EU upon exit. This risk increased following the rejection of the proposed transition arrangements by the U.K. Parliament on January 15, 2019. A U.K. exit on a “no deal” basis could adversely impact the value of the British pound as compared to other currencies or potentially have other adverse consequences and may have a materially adverse impact on KI’s results of operations. Uncertainty over the outcome of the negotiations and the possibility of a “no deal” exit may materially or significantly diminish interest in traveling to the U.K. for study. If the U.K. is no longer viewed as a favorable study destination, KI’s ability to recruit international students will be adversely impacted,
2
which would result in material adverse impacts to KI’s results of operations and cash flows. The U.K. government’s Immigration White Paper, issued in December 2018, clarified that EU nationals’ ability to enter the U.K. for long- or short-term study will change. EU national students seeking to study higher education courses will be broadly subject to similar rules as those that presently apply to non-EU international students (KI Pathways). EU national students seeking to study English-language courses will either require an Electronic Travel Authorization or a short-term student visa (KI English). EU nationals do not currently require visas or face other administrative barriers to study in the U.K. It is also expected that recruitment of staff from outside the U.K will become more difficult and that Kaplan may experience difficulties in attracting and retaining international staff in the U.K. It is unclear how international student recruitment agents and prospective international students will view the U.K. as a study destination after the introduction of these new requirements, the EU exit negotiations and the U.K.’s eventual exit from the EU. The introduction of new visa and other administrative requirements, Brexit and the perception of the U.K. as a less favorable study destination may have a materially adverse impact on KI’s ability to recruit international students, KI’s results of operations and cash flows. Additionally, if the U.K. does not receive a determination of adequacy under the EU General Data Protection Regulation, then flows of personal data within KI or between KI and its clients, suppliers, business partners and affiliates may be substantially disrupted. The risks associated with Brexit may be mitigated, in part, by the possibility that a reduction in the value of the British pound against other international currencies may attract greater numbers of students to the U.K.
Asia Pacific.
In the Asia Pacific region, Kaplan operates businesses primarily in Singapore, Australia, New Zealand, Hong Kong and China.
In Singapore, Kaplan operates three business units: Kaplan Higher Education, Kaplan Financial and Kaplan Professional. During 2018, the Higher Education and Financial divisions served more than 14,000 students from Singapore and 2,700 students from other countries throughout Asia and Western Europe. Kaplan Professional provided short courses to approximately 55,000 professionals, managers, executives and businesspeople in 2018.
Kaplan Singapore’s Higher Education business provides students with the opportunity to earn Bachelor’s and postgraduate degrees in various fields on either a part-time or full-time basis. Kaplan Singapore’s students receive degrees from affiliated educational institutions in Australia and the U.K. In addition, this division offers pre-university and diploma programs.
Kaplan Singapore’s Financial business provides preparatory courses for professional qualifications in accountancy and finance, such as the Association of Chartered Certified Accountants (ACCA) and the Chartered Financial Analyst (CFA). Kaplan Singapore’s Professional business, which is an authorized SkillsFuture Singapore Approved Training Organization, provides professionals with various skills training through workforce skills qualifications courses to help them rejoin the workforce, shift to new careers or catch up with changes that occur in the workplace.
In November 2018, Kaplan Singapore Professional received a notice from SkillsFuture Singapore (SSG), a statutory board under the Singapore Ministry of Education, that SSG would terminate Kaplan Singapore Professional’s right to deliver workforce skills qualifications (WSQ) courses under the Leadership & People Management framework for six months from December 1, 2018, due to issues relating to a small number of contractors, and restrict Kaplan Singapore from applying to teach any new WSQ programs for six months from the date of the notice. Kaplan Singapore Professional has accepted the decision from SSG and enhanced its compliance controls for all other frameworks of WSQ courses.
In Australia, Kaplan delivers a broad range of financial services programs from certificate level through Master’s level, together with professional development offerings through Kaplan Professional, as well as higher education programs in business, accounting, hospitality and tourism and management through Kaplan Business School. In
2018
, these businesses provided courses to approximately 2,300 students through face-to-face classroom programs (within Kaplan Business School) and approximately 43,000 students through online or distance-learning programs offered by Kaplan Professional.
Kaplan Australia’s English-language business is part of KI English, which operates across five locations in Australia and one location in New Zealand, teaching more than 6,000 students in 2018. In 2018, the KI English School in Manly was sold to allow Kaplan to refocus its English-language training businesses on metropolitan areas in Australia. The Kaplan Australia Pathways business is also part of KI Pathways. It consists of Murdoch Institute of Technology and the University of Adelaide College (formerly Bradford College) and offered face-to-face pathways and foundational education to more than 1,300 students wishing to enter Murdoch University in Perth and the University of Adelaide, respectively, in 2018. The contract with Murdoch University to run the Murdoch Institute of Technology will expire in 2020, and Kaplan has decided not to exercise its right to negotiate an extension of its contract.
Kaplan Australia also owns Red Marker Pty Ltd., a machine learning and artificial intelligence-based provider of regulatory software. Its Artemis product detects potentially non-compliant content as it is being created, helping
3
advisers and licensees to identify and remediate compliance risks associated with the promotion of financial products or services.
In Hong Kong, Kaplan operates three main business units: Kaplan Financial, Kaplan Language Training and Kaplan Higher Education, serving approximately 13,000 students annually.
Kaplan Hong Kong’s Financial division delivers preparatory courses to approximately 11,000 students and business executives wishing to earn professional qualifications in accountancy, financial markets designations and other professional courses.
Hong Kong’s Language Training division offers both test preparation for overseas study and college applications, including TOEFL, IELTS, SAT and GMAT, to approximately 1,000 students.
Kaplan Hong Kong’s Higher Education division offers both full-time and part-time programs to approximately 1,000 students studying for degrees from leading Western universities. Students earn Doctorate, Master’s and Bachelor’s degrees in Hong Kong. Kaplan also offers a proprietary pre-college diploma program through Kaplan Business and Accountancy School.
In 2014, Kaplan Holdings Limited (Hong Kong) signed a joint venture agreement with CITIC Press Corporation. Under the terms of the agreement, the parties have incorporated a joint venture company, Kaplan CITIC Education Co. Limited, which is 49% owned by Kaplan Holdings Limited. The joint venture company is carrying out publishing and distribution of Kaplan Financial training products in China (including CFA, FRM and ACCA) and is expanding its business with other Kaplan divisions under an intellectual property license from Kaplan.
Each of Kaplan’s international businesses is subject to unique and often complex regulatory environments in the countries in which they operate. The degree of consistency in the application and interpretation of such regulations can vary significantly in certain jurisdictions, which can make compliance challenging. No assurance can be given that Kaplan will successfully comply with all applicable foreign regulations, and failure to do so could materially and adversely affect Kaplan
’
s operating results.
Kaplan Higher Education
Until March 22, 2018, Kaplan Higher Education (KHE) provided postsecondary education services to students through Kaplan University’s (KU) online and fixed-facility colleges. KU provided a wide array of certificate, diploma and degree programs designed to meet the needs of students seeking to advance their education and career goals.
On March 22, 2018, certain subsidiaries of Kaplan contributed the institutional assets and operations of KU to a new university: an Indiana non-profit, public-benefit corporation affiliated with Purdue University, known as Purdue University Global (Purdue Global). As part of the transfer to Purdue Global, KU transferred students, academic personnel, faculty and operations, property leases for KU’s campuses and learning centers and KHE-owned academic curricula and content related to KU courses. At the same time, KU and Purdue Global entered into a Transition and Operations Support Agreement (TOSA) pursuant to which KHE provides key non-academic operations support to Purdue Global. Kaplan received nominal cash consideration upon the transfer of the institutional assets and operations of KU.
The transfer of KU did not include any of the assets of the KU School of Professional and Continuing Education, which provides professional training and exam preparation for professional certifications and licensures, nor did it include the transfer of other Kaplan businesses.
KHE’s Third-Party Service Operations
KHE’s primary business operations are providing non-academic operations support services to Purdue Global pursuant to the TOSA and similar services to Purdue University and other institutions of higher education. Purdue Global operates largely online as an Indiana public university affiliated with Purdue University. The operations support activities that KHE provides to Purdue Global include technology support, help-desk functions, human resources support for transferred faculty and employees, admissions support, financial aid processing, marketing and advertising, back-office business functions, certain test preparation and domestic and international student recruiting services.
Pursuant to the TOSA, KHE is not entitled to receive any reimbursement of costs incurred in providing support functions, or any fee, unless and until Purdue Global has first covered all of its operating costs (subject to a cap). If Purdue Global achieves cost efficiencies in its operations, it may be entitled to an additional payment equal to 20% of such cost efficiencies (Purdue Efficiency Payment). In addition, during each of Purdue Global’s first five years, prior to any payment to KHE, Purdue Global is entitled to a priority payment of $10 million per year beyond costs. To the extent Purdue Global’s revenue is insufficient to pay the priority payment, KHE is required to advance an amount to Purdue Global to cover such insufficiency. Upon closing of the transaction, Kaplan paid to Purdue
4
Global an advance in the amount of $20 million, representing, and in lieu of, priority payments for Purdue Global’s fiscal years ending June 30, 2019 and June 30, 2020.
To the extent that there is sufficient revenue to pay the Purdue Efficiency Payment, Purdue Global will be reimbursed for its operating costs (subject to a cap), and the priority payment to Purdue Global is paid. To the extent that there is remaining revenue, KHE will then receive reimbursement for its operating costs (subject to a limit) of providing the support activities. If KHE achieves cost efficiencies in its operations, then KHE may be entitled to an additional payment equal to 20% of such cost efficiencies (KHE Efficiency Payment). If there are sufficient revenues, KHE may also receive a fee equal to 12.5% of Purdue Global’s revenue. The fee will increase to 13% beginning with Purdue Global’s fiscal year ending June 30, 2023, through Purdue Global’s fiscal year ending June 30, 2027. Thereafter, the fee will return to 12.5%. Subject to certain limitations, a portion of the fee that is earned by KHE in one year may be carried over and instead paid to KHE in subsequent years. After the first five years of the TOSA, KHE and Purdue Global will be entitled to payments in a manner consistent with the structure described above, except that (i) Purdue Global will no longer be entitled to a priority payment and (ii) to the extent that there are sufficient revenues after payment of the KHE Efficiency Payment (if any), Purdue Global will be entitled to an annual payment equal to 10% of the remaining revenue after the KHE Efficiency Payment (if any) is paid, subject to certain other adjustments.
The TOSA has a 30-year initial term, which will automatically renew for five-year periods unless terminated. After the sixth year, Purdue Global has the right to terminate the agreement upon payment of a termination fee equal to 1.25 times Purdue Global’s revenue for the preceding 12-month period, which payment would be made pursuant to a 10-year note, and at the election of Purdue Global, it may receive for no additional consideration certain assets used by KHE to provide the support activities pursuant to the TOSA. At the end of the 30-year term, if Purdue Global does not renew the TOSA, Purdue Global will be obligated to make a final payment of 75% of its total revenue earned during the preceding 12-month period, which payment will be made pursuant to a 10-year note, and at the election of Purdue Global, it may receive for no additional consideration certain assets used by KHE to provide the support activities pursuant to the TOSA. Either party may terminate the TOSA at any time if Purdue Global generates (i) $25 million in cash operating losses for three consecutive years or (ii) aggregate cash operating losses greater than $75 million at any point during the initial term. Operating loss is defined as the amount of revenue Purdue Global generates minus the sum of (1) Purdue Global’s and KHE’s respective costs in performing academic and support functions and (2) the $10 million priority payment to Purdue Global in each of the first five years. Upon termination for any reason, Purdue Global will retain the assets that Kaplan contributed pursuant to the Transfer Agreement. Each party also has certain termination rights in connection with a material default or material breach of the TOSA by the other party.
Regulatory Environment
KHE no longer owns or operates KU or any other institution participating in student financial aid programs that have been created under Title IV of the U.S. Federal Higher Education Act of 1965 (Higher Education Act), as amended (Title IV). KHE is a service provider to Purdue Global and other Title IV participating institutions. As a service provider under the U.S. Department of Education (ED) regulations, KHE is required to comply with certain laws and regulations, including applicable statutory provisions of Title IV. KHE also provides financial aid services to Purdue Global, and as such, meets the definition of a “third-party servicer” contained in the Title IV regulations. By virtue of being a third-party servicer, KHE is also subject to applicable statutory provisions of Title IV and ED regulations that, among other things, require KHE to be jointly and severally liable with Purdue Global to the ED for any violation by Purdue Global of any Title IV statute or ED regulation or requirement. Pursuant to ED requirements, Purdue is responsible for any liability arising from the operation of the institution; however, pursuant to the agreement to transfer KU, KHE agreed to indemnify Purdue for certain pre-closing liabilities. KHE also is subject to other federal and state laws, including, but not limited to, information security requirements established by the Federal Trade Commission, as well as the applicable provisions of the Family Educational Rights and Privacy Act regarding the privacy of student records.
KHE’s failure to comply with these and other federal and state laws and regulations could result in adverse consequences to KHE’s business, including, for example:
|
•
|
The imposition on KHE of fines or repayment obligations for Title IV funds to the ED or the termination or limitation on KHE’s eligibility to provide services as a third-party servicer to Purdue Global or any other Title IV participating institution;
|
|
•
|
Adverse effects on KHE’s business and results of operations from a reduction or loss in KHE’s revenues under the TOSA or any other agreement with any Title IV participating institution if a client institution loses or has limits placed on its Title IV eligibility, accreditation, operations or state licensure, or is subject to fines, repayment obligations or other adverse actions due to non-compliance by KHE (or the institution) with Title IV, accreditor, federal or state agency requirements;
|
5
|
•
|
Liability under the TOSA or any other agreement with any Title IV participating institution for non-compliance with federal, state or accreditation requirements arising from KHE’s conduct; and
|
|
•
|
Liability for non-compliance with Title IV or other federal or state laws and regulations occurring prior to the transfer of KU to Purdue.
|
Incentive compensation
.
Under the ED’s incentive compensation rule, an institution participating in Title IV programs may not provide any commission, bonus or other incentive payment to any person or entity engaged in any student recruiting or admission activities or in making decisions regarding the awarding of Title IV funds if such payment is based directly or indirectly on success in securing enrollments or financial aid. KHE is a third party providing bundled services to Title IV participating institutions that include recruiting and, in the case of Purdue Global, financial aid services. As such, KHE is also subject to the incentive compensation rules and cannot provide any commission, bonus or other incentive payment to any covered employees, subcontractors or other parties engaged in certain student recruiting, admission or financial aid activities based on success in securing enrollments or financial aid. In addition, tuition revenue sharing payments to KHE under the TOSA (as well as any other agreement with any Title IV participating institution) must comply with revenue sharing guidance provided by the ED related to bundled services agreements. See Item 1A. Risk Factors, Failure to Comply With the ED’s Title IV Incentive Compensation Rule Could Subject Kaplan to Liabilities, Sanctions and Fines for more information.
Misrepresentations.
A Title IV participating institution is required to comply with the ED regulations related to misrepresentations and with related federal and state laws. These laws and regulations are broad in scope and may extend to statements by servicers, such as KHE, that provide marketing or certain other services to such institutions. The laws and regulations may also apply to KHE’s employees and agents, with respect to statements addressing the nature of an institution’s programs, financial charges or the employability of its graduates. KHE provides certain marketing and other services to Title IV participating institutions. A violation of misrepresentation regulations or other federal or state laws and regulations applicable to the services KHE provides to its client institutions arising out of statements by KHE, its employees or agents could require KHE or its clients to pay the costs associated with indemnifying its client institutions from applicable losses. Additionally, failure to comply with these and other federal and state laws and regulations could result in the imposition on KHE of fines or federal student aid repayment obligations to the ED or the termination or limitation on KHE’s eligibility to provide services as a third-party servicer to Purdue Global or any other Title IV participating institution.
Compliance reviews and litigation.
As a third-party servicer providing financial aid services to a Title IV participating institution, KHE is subject to reviews, audits, investigations and other compliance reviews conducted by various regulatory agencies and auditors, including, among others, the ED, the ED’s Office of the Inspector General, accrediting bodies and state and various other federal agencies. These compliance reviews can result in findings of non-compliance with statutory and regulatory requirements that can, in turn, result in the imposition of fines, liabilities, civil or criminal penalties or other sanctions against KHE. KHE will be required, if it enters into contracts to provide financial aid services to more than one Title IV participating institution, to arrange for an independent auditor to conduct an annual Title IV compliance audit of KHE’s compliance with applicable ED requirements.
On February 23, 2015, the ED began a program review assessing KU’s administration of its Title IV and Higher Education Act programs during the 2013-2014 and 2014-2015 award years. In 2018, Kaplan contributed the institutional assets and operations of KU to Purdue Global, and the university became Purdue Global, under the ownership and control of Purdue University. However, Kaplan retains liability for any financial obligations the ED might impose under this program review and that are the result of actions taken during the time that Kaplan owned the institution. On September 28, 2018, the ED issued a Preliminary Program Report (Preliminary Report). This Preliminary Report is not final, and the ED may change the findings in the final report. None of the initial findings in the Preliminary Report carries material financial liability. Although the program review technically covers only the 2013–2015 award years, the ED included a review of the treatment of student financial aid refunds for students who withdrew from a program prior to completion in 2017–2018. KHE cannot predict the outcome of this review, when it will be completed, whether any final findings of non-compliance with financial aid program or other requirements will impact KHE’s operations, or what liability or other limitations the ED might place on KHE or Purdue Global as a result of this review.
There are also two open program reviews at campuses that were part of the KHE Campuses business prior to its sale in 2015 to Education Corporation of America. The ED’s final reports on the program reviews at former KHE Broomall, PA, and Pittsburgh, PA, locations are pending. KHE retains responsibility for any financial obligations resulting from these program reviews.
Prior to the transfer to Purdue Global of the institutional assets and operations of KU, on September 3, 2015, Kaplan sold to Education Corporation of America (ECA) substantially all of the assets of KHE’s nationally accredited on-ground Title IV eligible schools (KHE Campuses). As part of the transaction, similar to the transfer of KU, Kaplan retained liability for the pre-sale conduct of the KHE schools. Although Kaplan no longer owns KU or the KHE Campuses, Kaplan may be liable to the current owners of KU and the KHE Campuses, respectively, for the pre-sale
6
conduct of the schools. Kaplan may also have liabilities in connection with certain real estate leases that were guaranteed by Kaplan.
Compliance by client institutions with Title IV program requirements and other federal, state and accreditation requirements.
KHE currently provides services to education institutions that are heavily regulated by federal and state laws and regulations and subject to extensive accrediting body requirements. Presently, a substantial portion of KHE’s revenues are attributable to service fees it receives under the TOSA, which are dependent upon revenues generated by Purdue Global and dependent upon Purdue Global’s eligibility to participate in the Title IV federal student aid program. To maintain Title IV eligibility, Purdue Global and KHE’s other client institutions must be certified by the ED as eligible institutions, maintain authorizations by applicable state education agencies and be accredited by an accrediting commission recognized by the ED. Purdue Global and KHE’s other client institutions must also comply with the extensive statutory and regulatory requirements of the Higher Education Act and other state and federal laws and accrediting standards relating to their financial aid management, educational programs, financial strength, disbursement and return of Title IV funds, facilities, recruiting practices, representations made by the school and various other matters. Additionally, Purdue Global and other client institutions are subject to laws and regulations that, among other things, limit student default rates on the repayment of Title IV loans; permit borrower defenses to repayment of Title IV loans based on certain conduct of the institution; establish gainful employment requirements, including certain debt-to-earnings metrics; establish specific measures of financial responsibility and administrative capability; and require state authorization and institutional and programmatic accreditation. If Purdue Global or other client institutions lose or have limits placed on their Title IV eligibility, accreditation or state licensure, or if they are subject to fines, repayment obligations or other adverse actions due to their or KHE’s non-compliance with Title IV regulations, accreditor or state agency requirements or other state or federal laws, KHE’s financial results of operations could be adversely affected. In addition, any legislative, regulatory or other development that has the effect of materially reducing the amount of Title IV financial assistance or other federal, state or private financial assistance available to the students of KHE’s client institutions could have a material adverse effect on KHE’s business and results of operations.
Kaplan Test Preparation
In 2018, Kaplan Test Preparation (KTP) included test preparation, data science education and training and healthcare simulation businesses. Each of these businesses is discussed below.
On February 28, 2018, Kaplan acquired the assets of i-Human Patients, Inc., a company that provides online, simulated patient interactions for use in training and assessing medical health professionals.
On September 14, 2018, Kaplan acquired the
test prep, study aid and foreign language assets of Barron’s Educational Series
. T
he acquisition included the “Barron’s” name and approximately 650 titles covering all test prep and study aid assets, as well as foreign language, reference, business and law titles.
Test Preparation.
KTP’s admissions businesses prepare students under the Kaplan Test Prep, Manhattan Prep and Barron’s Educational Series brands for a broad range of standardized, high-stakes tests, including the SAT, ACT, LSAT, GMAT, MCAT and GRE. KTP’s accredited businesses, operating under the Kaplan Prep & Achieve brand, prepare students for licensing exams required to enter certain professions, including nursing schools, medical schools and law schools. KTP also sells admissions consulting, tutoring and other advising services.
KTP delivers programs at numerous venues throughout the U.S., including Puerto Rico, as well as in Canada, Mexico and the U.K. Programs are taught at more than 70 Kaplan-branded locations and at numerous other locations, such as hotels, high schools and universities. KTP also offers courses and other programs online, typically in a live online classroom or a self-study format. Private tutoring services are provided in person in select markets and online. In addition, KTP licenses material for certain of its courses to third parties and to a Kaplan affiliate, which, during 2018, delivered courses at 68 locations in 30 countries outside the U.S. In 2018, KTP enrolled over 340,000 students in its courses and other programs, including more than 171,000 enrolled in online programs. Test Preparation includes Kaplan Publishing, which focuses on print test preparation resources sold through retail channels under the Kaplan Test Prep, Manhattan Prep and Barron’s Educational Series brands. At the end of 2018, Kaplan Publishing had approximately 1,100 titles in print and digital formats.
In total, KTP prepares students for more than 200 standardized tests, the large majority of which are U.S. focused.
Data science.
KTP operates Metis, an accredited and licensed data science school and training company with locations in New York, California, Illinois and Washington. Metis operates 12-week data science boot camps in each of its locations and conducts trainings for corporations around the world.
Simulation
.
i-Human Patients
provides online, simulated patient interactions for use in training and assessing medical health professionals and is typically purchased by medical and nursing schools.
7
Kaplan Professional (U.S.)
Kaplan Professional (U.S.) (KP) helps professionals obtain certifications, licensures, and designations that enable them to advance their careers. KP partners with organizations to solve their talent management challenges through customized corporate learning and development solutions. Through live and online instruction, KP provides test preparation, licensing and continuing education, as well as leadership and professional development programs to businesses and individuals in the accounting, insurance, securities, real estate, financial services, wealth management, engineering and architecture industries.
KP serves approximately 3,500 business-to-business clients, including 166 Fortune 500 companies. In 2018, more than 480,000 students used KP’s exam preparation offerings.
On May 4, 2018, KP acquired Professional Publications, Inc. (PPI), an independent publisher of professional licensing exam review materials and recognized leader in engineering, surveying, architecture and interior design licensure exam review products. PPI delivers courses and produces print and online materials for the Fundamentals of Engineering and various Professional Engineering exams in fields such as chemical, civil, electrical, mechanical and structural engineering.
On July 12, 2018, KP acquired the College for Financial Planning (CFFP). CFFP offers financial education and training to individuals seeking professional credentials, including the CERTIFIED FINANCIAL PLANNER™ (CFP
®
) mark, through comprehensive programs that lead to licensing, certification or graduate-level study. The acquisition complements KP’s existing CFP
®
certification education offerings and will add new professional designations and degrees to the KP portfolio. CFFP is accredited by the Higher Learning Commission (HLC).
Television Broadcasting
Graham Media Group, Inc. (GMG), a subsidiary of the Company, owns seven television stations located in Houston, TX; Detroit, MI; Orlando, FL; San Antonio, TX; Jacksonville, FL; and Roanoke, VA, as well as SocialNewsDesk, a provider of social-media management tools designed to connect newsrooms with their users. The following table sets forth certain information with respect to each of the Company’s television stations:
|
Station, Location and
Year Commercial
Operation Commenced
|
National
Market
Ranking (a)
|
Primary
Network
Affiliation
|
Expiration
Date of FCC
License
|
Expiration Date
of Network
Agreement
|
Total Commercial
Stations
in DMA (b)
|
|||||
|
KPRC, Houston, TX, 1949
|
7th
|
NBC
|
Aug. 1, 2022
|
Dec. 31, 2019
|
14
|
|||||
|
WDIV, Detroit, MI, 1947
|
14th
|
NBC
|
Oct. 1, 2021
|
Dec. 31, 2019
|
8
|
|||||
|
WKMG, Orlando, FL, 1954
|
18th
|
CBS
|
Feb. 1, 2021
|
April 6, 2019
|
11
|
|||||
|
KSAT, San Antonio, TX, 1957
|
31st
|
ABC
|
Aug. 1, 2022
|
Dec. 31, 2021
|
10
|
|||||
|
WJXT, Jacksonville, FL, 1947
|
42nd
|
None
|
Feb. 1, 2021
|
—
|
7
|
|||||
|
WCWJ, Jacksonville, FL, 1966
|
42nd
|
CW
|
Feb. 1, 2021
|
Aug. 31, 2021
|
7
|
|||||
|
WSLS, Roanoke, VA, 1952
|
68th
|
NBC
|
Oct. 1 2020
|
Dec. 31, 2019
|
7
|
|||||
_________________________________________________________________________________
(a) Source: 2018/2019 Local Television Market Universe Estimates, The Nielson Company, September 2018, based on television homes in DMA (see note
(b) below).
(b) Full-power commercial TV stations, Designated Market Area (DMA) is a market designation of The Nielsen Company that defines each television market exclusive of another, based on measured viewing patterns.
In January 2017, GMG acquired WCWJ, a CW affiliate television station in Jacksonville, FL, and WSLS, an NBC affiliate television station in Roanoke, VA. GMG operates both stations under the network affiliations in effect prior to their acquisition.
Revenue from broadcasting operations is derived primarily from the sale of advertising time to local, regional and national advertisers. In
2018
, advertising revenue accounted for 68.5% of the total for GMG’s operations. Advertising revenue is sensitive to a number of factors, some specific to a particular station or market and others more general in nature. These factors include a station’s audience share and market ranking; seasonal fluctuations in demand for air time; annual or biannual events, such as sporting events and political elections; and broader economic trends, among others.
Regulation of Broadcasting and Related Matters
GMG’s television broadcasting operations are subject to the jurisdiction of the U.S. Federal Communications Commission (FCC) under the U.S. Federal Communications Act of 1934, as amended (the Communications Act). Each GMG television station holds an FCC license that is renewable upon application for an eight-year period.
Digital Television (DTV) and Spectrum Issues.
Each GMG station (and each full-power television station nationwide) now broadcasts only in digital format, which allows transmission of HDTV programming and multiple channels of standard-definition television programming (multicasting).
8
Television stations may receive interference from a variety of sources, including interference from other broadcast stations, that is below a threshold established by the FCC. That interference could limit viewers’ ability to receive television stations’ signals. The amount of interference to stations could increase in the future because of the FCC’s decision to allow electronic devices, known as “white space” devices, to operate in the television frequency band on an unlicensed basis on channels not used by nearby television stations.
In November 2017, the FCC voted to adopt rules authorizing broadcast television stations to voluntarily transition to a new technical standard, called Next Generation TV or ATSC 3.0. The new standard is designed to allow broadcasters to provide consumers with better sound and picture quality; hyper-localized programming, including news and weather; enhanced emergency alerts and improved mobile reception. The standard also allows for the use of targeted advertising and more efficient use of spectrum, potentially allowing for more multicast streams to be aired on the same six-megahertz channel. ATSC 3.0 is not backwards compatible with existing television equipment, and the FCC’s recently adopted rules require full-power television stations that transition to the new standard to continue broadcasting a signal in the existing DTV standard until the FCC phases out the requirement in a future order. A transitioning station’s DTV-formatted content must be substantially similar to the programming aired on its ATSC 3.0 channel for at least five years.
In April 2017, the FCC announced the completion of an incentive auction in which certain broadcast television stations bid to relinquish spectrum or move to a different spectrum band in exchange for a share of the revenues obtained by auctioning the reallocated broadcast spectrum for use by wireless
broadband providers
.
None of GMG’s stations won the incentive auction. However, certain GMG stations—specifically, WDIV, WSLS, WCWJ and WJXT—will be required to move to new channel allotments so as to free up a nationwide block of spectrum for wireless broadband use. The FCC has adopted rules requiring this “repacking” of broadcast television stations to new channels to be completed within 39 months after the incentive auction closed, with earlier deadlines set for particular stations in order to stagger the transition to new channels. The scheduled transition deadlines for GMG’s repacked stations are as follows:
|
•
|
WSLS: September 6, 2019
|
|
•
|
WCWJ and WJXT: January 17, 2020
|
|
•
|
WDIV: March 13, 2020
|
The repacking
and incentive auction proc
es
ses could have
an
adverse effect on GMG
.
For
e
x
ample,
the repacking of GMG’s stations and/or neighboring stations may result in increased interference to the GMG stations’ signals or otherwise affect the stations’ over-the-air coverage. Although GMG’s repacked stations are eligible to seek reimbursement
for repacking-related costs, the
initial legislation
authorizing the incentive auction provided only $1.75 billion in total for all such reimbursements. In March 2018, Congress allocated an additional $1 billion for the repack, including funds that could be used toward reimbursing expenses for “repacked” low-power television (LPTV) stations and TV translators.
From late 2017 through April 2018, the FCC issued a series of Public Notices announcing the reimbursement estimates for all entities eligible for reimbursement, after such estimates were reviewed and adjusted by the FCC’s reimbursement fund administrator and then further adjusted to reflect the additional congressional appropriation. To date, each repacked commercial television station, including each of the repacked GMG stations, has been allocated a reimbursement amount equal to approximately 92.5% of the station’s estimated repacking costs, as verified by the FCC’s fund administrator. Receipt of the allocation funds is subject to FCC approval of particular requests for reimbursement of actual costs fully
incurred.
The FCC adopted rulemaking in August 2018 addressing a number of issues, including the amount of funds that should be made available for reimbursements for LPTV and TV translator stations. This proceeding is still ongoing, so the Company cannot predict the extent to which
the
GMG stations will
be
compensated
for any non-full-power television
expenses
that they incur
in connection with the
repacking.
Carriage of Local Broadcast Signals.
Congress has established, and periodically has extended or otherwise modified, various statutory copyright licensing regimes governing the local and distant carriage of broadcast television signals on cable and satellite systems. The Company cannot predict whether or how Congress may maintain or modify these regimes in the future, nor what net effect such decisions would have on the Company’s broadcast operations or on the Company overall.
The Communications Act and the FCC rules allow a commercial television broadcast station, under certain circumstances, to insist on mandatory carriage of its signal on cable systems serving the station’s market area (must carry). Alternatively, stations may elect, at three-year intervals, to forego must-carry rights and allow their signals to be carried by cable systems only pursuant to a “retransmission consent” agreement. Commercial television stations also may elect either mandatory carriage or retransmission consent with respect to the carriage of their signals on direct broadcast satellite (DBS) systems that provide “local-into-local” service (i.e., to distribute the signals of local television stations to viewers in the local market area). Stations that elect retransmission
9
consent may negotiate for compensation from cable or DBS systems in exchange for the right to carry their signals. Each of GMG’s television stations has elected retransmission consent for both cable and DBS operators, and each is carried on all of the major cable and DBS systems serving each station’s respective local market pursuant to retransmission consent agreements.
The FCC has considered proposals to alter its rules governing retransmission consent negotiations, network non-duplication and syndicated exclusivity. For example, pursuant to
the STELA Reauthorization Act (STELAR), enacted in December 2014, the FCC adopted rules prohibiting same-market television broadcast stations from coordinating or jointly negotiating for retransmission consent unless such stations are under common control, and it considered, though ultimately did not adopt, changes to its “good faith” standards for retransmission consent negotiations. In addition, the FCC in March 2014 solicited comments on a proposal to eliminate its network non-duplication and syndicated exclusivity rules, which restrict the ability of cable operators, direct broadcast satellite systems and other distributors classified by the FCC as multichannel video programming distributors (MVPDs) to import the signals of out-of-market television stations with duplicating programming during retransmission consent disputes or otherwise. The FCC has not acted on that proposal to date. If Congress or the FCC were to enact further changes to the retransmission consent and/or exclusivity rules, such changes could materially affect the GMG stations’ bargaining position in future retransmission consent negotiations.
Ownership Limits.
The
Communications Act and
the FCC
’
s rules limit the number
and
types of
media outlets
in which
a single
person
or entity
may have
an attributable
interest.
In November 2017, the FCC voted to eliminate certain of these restrictions and modify others. For instance, the FCC voted to eliminate a standard known as the “Eight Voices Test,” which generally prohibited two commercial television stations in the same market from combining ownership if the transaction would result in fewer than eight independently owned stations remaining in the market. This change to the local television
ownership (or “duopoly”)
rule
means that the ownership rules generally
will permit a party to own up to two commercial television stations in a market so long as one of the stations is not among the top-four ranked television stations in that market.
The FCC voted to retain the existing prohibition on transactions that would result in common ownership among the top-four ranked stations in the same market, subject to potential exceptions to the prohibition based on public interest showings made on a case-by-case basis. In addition, the FCC voted to eliminate the newspaper/broadcast cross-ownership rule, which had prohibited a single entity from owning a full-power broadcast station and a daily print newspaper in the same local market, and the television/radio cross-ownership rule, which imposed specific limits on the ability to own television and radio stations in the same market (in addition to the separate limits on the number of television or radio stations a party could own in the market). The FCC also voted to eliminate a rule making certain television joint sales agreements (JSAs) attributable in calculating compliance with the ownership limits. The FCC will continue to require public disclosure of certain shared services agreements (SSAs) though these agreements are not considered attributable. The changes adopted in the FCC’s November 2017 order have been challenged in court. In addition, in December 2018, the FCC initiated a statutorily mandated Quadrennial Review of its broadcast ownership rules to determine whether they continue to serve the public interest. GMG’s ability to enter into certain transactions in the future may be affected by the outcome of the court challenges as well as the FCC’s Quadrennial Review proceeding.
I
n addition, by statute, a single person or entity may have an attributable interest in an unlimited number of television stations nationwide, as long as the aggregate audience reach of such stations does not exceed 39% of nationwide television households and as long as such interest complies with the FCC’s other ownership restrictions. The FCC in 2016 eliminated the 50% “Ultra High Frequency (UHF) discount,” under which stations broadcasting on UHF channels are credited with only half the number of households in their market for purposes of calculating compliance with the 39% cap. However, the FCC reversed that decision in early 2017, concluding that the UHF discount should not be altered except in connection with a broader review of the national ownership cap. The reinstatement of the UHF discount was upheld by the D.C. Circuit in the summer of 2018.
In a December 2017 rulemaking, the FCC initiated a new proceeding to seek comments regarding its authority to modify or eliminate the national ownership cap, as well as the potential elimination of the UHF discount. The FCC has received comments on its rulemaking but has not yet implemented final rules.
Programming.
Six of GMG’s seven stations are affiliated with one or more of the national television networks that provide a substantial amount of programming to their television station affiliates. The expiration dates of GMG’s affiliation agreements are set forth at the beginning of this Television Broadcasting section. WJXT, one of GMG’s Jacksonville stations, has operated as an independent station since 2002. In addition, each of the GMG stations receives programming from syndicators and other third-party programming providers. GMG’s performance depends, in part, on the quality and availability of third-party programming, and any substantial decline in the quality or availability of this programming could materially affect the ability of GMG and its competitors to enter into certain transactions in the future.
Public Interest Obligations.
To satisfy FCC requirements, stations generally are expected to air a specified number of hours of programming intended to serve the educational and informational needs of children and to complete reports on a quarterly basis concerning children’s programming. The FCC has initiated a rulemaking to
10
determine whether certain of these requirements should be modified to provide broadcasters more flexibility in meeting the public interest obligations. In addition, the FCC requires stations to limit the amount of advertising that appears during certain children’s programs.
The FCC has other regulations and policies to ensure that broadcast licensees operate in the public interest, including rules requiring the disclosure of certain information and documents in an online public inspection file; rules requiring the closed-captioning of programming to assist television viewing by the hearing impaired; video description rules to assist television viewing by the visually impaired; rules concerning the captioning of video programming distributed via the Internet; and rules concerning the volume of commercials. Compliance with these rules imposes additional costs on the GMG stations that could affect GMG’s operations. However, the FCC has taken some measures to reduce burdens related to keeping physical copies of licenses posted and submitting paper copies of contracts, for example. The FCC also has an open proceeding to determine whether to remove other filing requirements.
Political Advertising.
The FCC regulates the sale of advertising by GMG’s stations to candidates for public office and imposes other obligations regarding the broadcast of political announcements more generally. The application of these regulations may limit the advertising revenues of GMG’s television stations during the periods preceding elections.
Broadcast Indecency.
The FCC’s policies prohibit the broadcast of indecent and profane material during certain hours of the day, and the FCC may impose monetary forfeitures when it determines that a television station has violated that policy. Broadcasters have repeatedly challenged these rules in court, arguing, among other things, that the FCC has failed to justify its indecency decisions adequately, that the FCC’s policy is too subjective to guide broadcasters’ programming decisions and that its enforcement approach otherwise violates the First Amendment. In June 2012, the U.S. Supreme Court held that certain fines against broadcasters for “fleeting expletives” were unconstitutional because the FCC failed to provide advance notice to broadcasters of what the FCC deemed to be indecent, but it also upheld the FCC’s authority to regulate broadcast decency. The Company cannot predict how GMG’s stations may be affected by the FCC’s current or future interpretation and enforcement of its indecency policies.
Other Matters.
The FCC is conducting proceedings concerning various matters in addition to those described in this section. The outcome of these proceedings and other matters described in this section could adversely affect the profitability of GMG’s television broadcasting operations.
Other Activities
Hoover Treated Wood Products, Inc.
Hoover Treated Wood Products, Inc. (Hoover) is a supplier of pressure impregnated kiln-dried lumber and plywood products for fire-retardant and preservative applications. Hoover, founded in 1955 and acquired by the Company in 2017, is headquartered in Thomson, GA. It operates nine facilities across the country and services a stocking distributor network of more than 100 locations spanning the U.S. and Canada. Hoover is constructing a 10th facility that is expected to commence operations in the second quarter of 2019.
Group Dekko Inc.
Group Dekko Inc. (Dekko) is an electrical solutions company that focuses on innovative power charging and data systems; industrial and commercial indoor lighting solutions; and the manufacture of electrical components and assemblies for medical equipment, transportation, industrial and appliance products. Dekko, founded in 1952, is headquartered in Garrett, IN, and operates 13 facilities in five states and Mexico. Dekko acquired Furnlite in July 2018.
Joyce/Dayton Corp.
Joyce/Dayton Corp. (Joyce/Dayton) is a leading manufacturer of screw jacks, linear actuators and related linear motion products and lifting systems in North America. Joyce/Dayton provides its lifting and positioning products to customers across a diverse range of industrial end markets, including renewable energy, metals and metalworking, oil and gas, satellite antennae and material handling sectors.
Forney Corporation
Forney Corporation (Forney) is a global supplier of burners, igniters, dampers and controls for combustion processes in electric utility and industrial applications. Forney is headquartered in Addison, TX, and its manufacturing plant is in Monterrey, Mexico. Forney’s customers include power plants and industrial systems around the world.
11
Graham Healthcare Group
Graham Healthcare Group (GHG) provides home health, hospice and palliative services to more than 50,000 patients annually. GHG operates 10 home care, seven hospice and two palliative care operating units in Michigan, Illinois and Pennsylvania. Six of GHG’s 19 operating units are operated through joint ventures with health systems and physician groups. The remainder are wholly owned and operated under the “Residential” brand name. Home health services include a wide range of health and social services delivered at home to recovering, disabled and chronically or terminally ill persons in need of medical, nursing, social or therapeutic treatment and/or assistance with the essential activities of daily living. Hospice care focuses on relieving symptoms and supporting patients with a life expectancy of six months or less. Hospice care involves an interdisciplinary approach to the provision of medical care, pain management and emotional and spiritual support, with an emphasis on comfort, not curing. Hospice services can be provided in the patient’s home, as well as in freestanding hospice facilities, hospitals, nursing homes and other long-term-care facilities. Palliative care is a specialized form of medicine provided by nurse practitioners that aims to enhance the quality of life of patients and their families who are faced with serious illness. It focuses on increasing comfort through prevention and treatment of distressing symptoms. In addition to expert symptom management, palliative care focuses on clear communication, advance planning and coordination of care. Each GHG operating unit offers care coordination, healthcare solutions and clinical expertise. All home health and hospice operations are Medicare certified and accredited by the Accreditation Commission for Health Care (ACHC), or are in the process of being ACHC accredited. GHG derives 90% of its revenues for home health and hospice services from Medicare. The remaining sources of revenue are from Medicaid, commercial insurance and private payers.
SocialCode LLC
Social Code LLC (SocialCode) is a marketing and insights company that manages digital advertising for global brands and early stage companies. It delivers software and service to transform consumer and performance data into planning, content, media activation and measurement to maximize ROI. SocialCode works across platforms such as Facebook, Instagram, Amazon, Google, Twitter, Pinterest, Snapchat and YouTube.
The Slate Group LLC
The Slate Group LLC (Slate) publishes
Slate
, an online magazine.
Slate
features articles and podcasts analyzing news, politics and contemporary culture and adds new material on a daily basis. Content is supplied by the magazine’s own editorial staff, as well as by independent contributors. As measured by The Slate Group,
Slate
had an average of more than 18 million unique visitors per month and averaged more than 73 million page views per month across desktop and mobile platforms in 2018. The Slate Group owns an interest in E2J2 SAS, a company incorporated in France that produces two French-language news magazine websites at
slate.fr
and
slateafrique.com
. The Slate Group provides content, technology and branding support.
Panoply Media
Panoply Media (Panoply) provides podcast technology for publishers and advertisers through the Megaphone platform and Megaphone Targeted Marketplace (MTM). Megaphone is a proprietary software as a service (SaaS) platform that provides hosting and dynamic advertising insertion designed to connect publishers with tools to publish, monetize and measure their audio content. MTM is an advertising marketplace that provides advertisers with the ability to target more than 60,000 audience segments across diverse audiences based on a listener’s location, interests, demographic profile and purchase behaviors.
Pinna
Pinna is an audio-first children’s media company offering an on-demand subscription service that delivers curated audio programming for children, all in one place, including podcasts, audio shows, audiobooks and music. The service offers children an ad-free, screen-free way to play and listen. Pinna creates and produces award-winning, original shows and partners with best-in-class brands and top creative talent to deliver age-appropriate, high-quality, highly entertaining audio experiences for 3- to 8-year-olds.
The FP Group
The FP Group produces
Foreign Policy
magazine and the
ForeignPolicy.com
website, which cover developments in national security, international politics, global economics and related issues. The site features blogs, unique news content and specialized channels and newsletters focusing on regions and topics of interest. The FP Group provides insight and analysis into global affairs for government, military, business, media and academic leaders. FP Events also produces a growing range of live programs, bringing together government, military, business and investment leaders to discuss important regional and topical developments and their implications.
12
CyberVista LLC
CyberVista LLC (CyberVista) is a cybersecurity training company headquartered in Arlington, VA. Its training solutions span cyber protection, operations, cloud and hardware/software. Its Resolve executive training suite helps large company boards and executives prepare for and mitigate cyber threats. Customers include Fortune 500 firms, leading cybersecurity providers and federal agencies.
Competition
Kaplan
Kaplan’s businesses operate in fragmented and competitive markets. Each of Kaplan International’s (KI) businesses competes in disaggregated markets with other for-profit institutions and companies (ranging in size from large for-profit universities to small competitors offering English-language courses) and, in certain instances, with government-supported schools and institutions that provide similar training and educational programs. Competitive factors vary by business and include program offerings, ranking of university partners, convenience, quality of instruction, reputation, placement rates, student services and cost. KI derives its competitive advantage from, among other things, delivering high-quality education and training experiences to students, having name brand recognition across multiple markets, developing strong relationships with corporate clients and recruitment partners and offering competitive pricing. Kaplan Higher Education (KHE) competes with companies that provide technology solutions, administrative support, curriculum development, overall online program development and analytics for colleges and universities, as well as support for corporate, employer and employee education programs.The market for KHE products and services is dynamic and rapidly evolving, and several competitors offer a mix of some of the same products and services or seek to move into KHE’s markets. Competitive factors in KHE’s markets include the ability to deliver a wide range of educational services and programs to clients across all levels of programs and administrative functions; cost effectiveness; expertise in marketing, recruitment and program delivery; student outcomes and satisfaction; the ability to invest in start-up and scaling initiatives; reputation; and compliance with laws and ability to navigate complex regulatory requirements. KHE’s ability to effectively compete will depend in large part on its successful delivery and navigation of these factors
.
While the competitive landscape is expanding, KHE’s resources, capabilities and experience are key differentiators in the market. Kaplan Test Preparation (
KTP) competes with a wide range of national, regional, local, online and location-based competitors. Competitors vary by test, with many competitors focused on preparing students for a single high-stakes test. For its curricular and assessment services, KTP has a number of national competitors, including, for example, ATI/Ascend Learning and HESI/Elsevier. Competitive factors vary by product line, and include price, features, modality, schedule and reputation. Although KTP faces intense competition and shifting consumer preferences, particularly with respect to online test prep, KTP remains a leading name in test prep due, in part, to its technical expertise and capabilities, quality of instructors, content and curricula and longevity in the industry.
Kaplan Professional (U.S.) (KP) offers a broad portfolio of products, many within highly regulated and mature industries, including securities, insurance, real estate and wealth management, where competition includes a wide variety of national, regional and local companies seeking the same market share and resulting in deep price discounting and commoditization of offerings.
Graham Media Group
GMG competes for audiences and advertising revenues with television and radio stations, cable systems and video services offered by telephone companies serving the same or nearby areas; with DBS services; and, to a lesser degree, with other media, such as newspapers and magazines. Cable systems operate in substantially all of the areas served by the Company’s television stations, where they compete for television viewers by importing out-of-market television signals; by distributing pay-cable, advertiser-supported and other programming that is originated for cable systems; and by offering movies and other programming on a pay-per-view basis. In addition, DBS services provide nationwide distribution of television programming, including pay-per-view programming and programming packages unique to DBS, using digital transmission technologies. Moreover, to the extent that competing television stations in the
Company’s television markets transition to ATSC 3.0, such stations may pose an increased competitive challenge to the Company’s stations, such as by offering an increased number of multicast channels and/or by offering advanced features.
Competition also continues to increase from established and emerging online distribution platforms. Movies and television programming increasingly are available on an on-demand basis through a variety of online platforms, which include free access on the websites of the major TV networks, ad-supported viewing on platforms such as Hulu and subscription-based access through services such as Netflix. In addition, online-only subscription services offering live television services have been launched both by traditional pay-TV competitors (such as DISH and DirecTV) and new entrants (such as Sony). The Company has entered into agreements for some of its stations to be distributed via certain of these services, typically through opt-in agreements negotiated by the stations’ affiliated networks. Participation in these services has given the Company’s stations access to new distribution platforms. At the same time, competition
from these various platforms could adversely affect the viewership of the Company’s
13
television stations via traditional platforms and/or the Company’s strategic position in negotiations with pay-TV services. In addition, the networks’ increased role in negotiating online distribution arrangements for their affiliated stations may have broader effects on the overall network-affiliate relationship, which the Company cannot predict.
Hoover
Hoover’s predominant product line is fire-retardant treated wood products for building interior applications that are specified by architects in accordance with building code requirements for multi-family residential, commercial and institutional nonresidential buildings. Hoover’s fire-retardant product lines are sold through a stocking distributor network of more than 100 locations spanning the U.S. and Canada. Hoover’s competitors are licensees of other chemical suppliers to the wood treating industry who compete with Hoover’s stocking distributors on a local basis. The primary areas of competition are product availability and price, although brand loyalty due to product quality is significant. Wood products are commodities with volatile market pricing; however, Hoover’s reputation for quality products and its unique distribution model, which provides superior product availability, enable Hoover to maintain a leading position across the continent.
Dekko
Dekko has three distinct product families that compete in fragmented, competitive global markets: power and data distribution for office and furniture products; lighting solutions; and electrical harness manufacturing. These products are sold through dealer and distribution channels and OEM customers—focused primarily on the North American market. While all markets and products are price sensitive, technology, engineering solutions, quality and delivery performance are critical in purchase decisions. Dekko’s multiple long-term relationships, high-quality manufacturing facilities, engineering support and reputation as a solutions provider, in addition to being a product supplier, all contribute to sustaining its competitive advantages.
Graham Healthcare Group
The home health and hospice industries are extremely competitive and fragmented, consisting of both for-profit and non-profit companies. According to the Medicare Payment Advisory Commission’s March 2018 report, there are approximately 12,000 Medicare-certified home health providers and approximately 4,500 hospice providers in the United States. GHG markets its services to physicians, discharge planners and social workers at hospitals, nursing homes, senior living communities and physician offices through a direct sales model. GHG differentiates its offering based on response time, clinical programming, clinical outcomes and patient satisfaction. Throughout the three states in which it operates, GHG competes primarily with both privately owned and hospital-operated home health and hospice service providers.
SocialCode
The business of managed digital advertising is highly competitive. Public multinational advertising agencies may exacerbate price competition in an attempt to protect existing relationships with advertising clients in traditional media formats such as television. Public and private advertising technology companies, digital media agencies and newer market entrants such as consulting firms also compete on price, service and technology offerings. SocialCode seeks to maintain a competitive advantage and maximize its clients’ return on advertising budgets by utilizing a combination of the deep expertise of its employees, who manage media spending on the largest digital platforms; a proprietary software (SaaS) as a service platform, allowing clients to make better use of first-party and third-party data to increase advertising effectiveness; and a full
-
service creative team with a nuanced understanding of digital media.
Panoply
Panoply provides podcast technology for publishers and advertisers through the Megaphone platform and Megaphone Targeted Marketplace (MTM). Megaphone, a proprietary SaaS platform, provides hosting and dynamic advertising insertion for publishers. Megaphone operates in a small but competitive market and competes primarily on the basis of product performance, price and service. Megaphone’s differentiators include an intuitive user experience, dynamic advertising insertion, advertising operations tools, customer service and proprietary audience-targeting technology. MTM operates in the nascent market for targeted advertising in podcasting and is the pioneer of this technology. MTM’s proprietary dynamic advertising insertion technology combined with data from the Nielsen Marketing Cloud platform allows brand advertisers to target more than 60,000 segments based on demographics, interests, behavioral traits and purchase intent.
14
Pinna
Pinna is currently the only ad-free, audio on-demand streaming service designed just for children that offers multiple audio formats in one space that complies with the Children’s Online Privacy Protection Act (COPPA). The market for children’s subscription digital media entertainment is large. It includes media subscription services for families, subscription services for children, online learning/gaming destinations, audiobooks and podcasts for children, gaming subscriptions and free digital content. Key differentiators for Pinna include its access to multiple formats and its offering of curated best-in-class brands and original shows all in one ad-free COPPA compliant-place.
Executive Officers
The executive officers of the Company, each of whom is elected annually by the Board of Directors, are as follows:
Donald E. Graham, age 73, has been Chairman of the Board of the Company since September 1993 and served as Chief Executive Officer of the Company from May 1991 until November 2015. Mr. Graham served as President of the Company from May 1991 until September 1993 and prior to that had been a Vice President of the Company for more than five years. Mr. Graham also served as Publisher of The Washington Post (the
Post)
from 1979 until September 2000 and as Chairman of the
Post
from September 2000 to February 2008.
Timothy J. O’Shaughnessy, age 37, became Chief Executive Officer in November 2015. From November 2014 until November 2015, he served as President of the Company. He was elected to the Board of Directors in November 2014. From 2007 to August 2014, Mr. O’Shaughnessy served as chief executive officer of LivingSocial, an e-commerce and marketing company that he co-founded in 2007. Mr. O’Shaughnessy is the son-in-law of Donald E. Graham, Chairman of the Company.
Andrew S. Rosen, age 58, became Executive Vice President of the Company in April 2014. He became Chairman of Kaplan, Inc. in November 2008 and served as Chief Executive Officer of Kaplan, Inc. from November 2008 to April 2014 and from August 2015 to the present. Mr. Rosen has spent nearly 33 years at the Company and its affiliates. He joined the Company in 1986 as a staff attorney with the
Post
and later served as assistant counsel at Newsweek. He moved to Kaplan in 1992 and held numerous leadership positions there before being named Chairman and Chief Executive Officer of Kaplan, Inc.
Wallace R. Cooney, age 56, became Senior Vice President–Finance and Chief Financial Officer of the Company in April 2017. Mr. Cooney served as the Company’s Vice President–Finance and Chief Accounting Officer since 2008. He joined the Company in 2001 as Controller.
Marcel A. Snyman, age 44, became Vice President and Chief Accounting Officer of the Company on January 18, 2018. Mr. Snyman served as Controller of the Company since January 2016, prior to which he served as Assistant Controller beginning in April 2014 and Director of Accounting Policy beginning in July 2008.
Denise Demeter, age 58, became Vice President–Chief Human Resources Officer of the Company in September 2014. Ms. Demeter joined the Company in 1986 and has served in a variety of roles, including Vice President–Human Resources and Senior Director–Pension & Savings Plans.
Jacob M. Maas, age 42, became Senior Vice President–Planning and Development of the Company in October 2015. Prior to joining the Company, he served as executive vice president of operations and head of corporate development at LivingSocial, an e-commerce and marketing company that he joined as chief financial officer in 2008.
Nicole M. Maddrey, age 54, became Senior Vice President, General Counsel and Secretary of the Company in April 2015. Ms. Maddrey joined the Company in 2007 as Associate General Counsel.
Employees
The Company and its subsidiaries employ approximately 11,100 people on a full-time basis.
Worldwide, Kaplan employs approximately 6,200 people on a full-time basis. Kaplan also employs substantial numbers of part-time employees who serve in instructional and administrative capacities. Kaplan’s part-time workforce comprises approximately 6,500 individuals. Collectively, in the U.S., U.K. and Canada, 71 Kaplan employees are represented by a union. Kaplan believes there are represented employees in the United Kingdom and Australia, where union membership is not disclosed to the employer.
GMG has approximately 967 full-time employees, of whom about 92 are represented by a union. Of the six collective-bargaining agreements covering union-represented employees, all are currently under contract. One collective-bargaining agreement will expire in 2019.
15
Slate has approximately 123 full-time employees. In January 2018, employees of Slate voted to elect the Writers Guild of America East (WGAE) to serve as their representative. As a result, 52 eligible Slate editorial employees are represented by the WGAE for purposes of collective bargaining.
Panoply has approximately 57 full-time employees. None of Panoply’s employees is represented by a union.
Pinna currently employs 12 full-time employees, none of whom is represented by a union.
GHG has approximately 1,142 full-time employees. None of these employees is represented by a union.
Forney has approximately 140 full-time employees, of whom 55 are represented by a union.
Joyce/Dayton has approximately 147 full-time employees, none of whom is represented by a union.
SocialCode has approximately 300 full-time employees, none of whom is represented by a union.
Dekko has approximately 1,457 full-time employees, none of whom is represented by a union.
Hoover has approximately 379 full-time employees, of whom 27 are represented by a union.
The FP Group and CyberVista each employs fewer than 50 people. Approximately 10 FP Group employees are represented by a union.
The parent Company has approximately 73 full-time employees, none of whom is represented by a union.
Forward-Looking Statements
All public statements made by the Company and its representatives that are not statements of historical fact, including certain statements in this Annual Report on Form 10-K and elsewhere in the Company’s
2018
Annual Report to Stockholders, are “forward-looking statements” within the meaning of the Private Securities Litigation Reform Act of 1995. Forward-looking statements include comments about expectations related to acquisitions or dispositions or related business activities, including the TOSA, the Company’s business strategies and objectives, the prospects for growth in the Company’s various business operations and the Company’s future financial performance. As with any projection or forecast, forward-looking statements are subject to various risks and uncertainties, including the risks and uncertainties described in Item 1A of this Annual Report on Form 10-K, that could cause actual results or events to differ materially from those anticipated in such statements. Accordingly, undue reliance should not be placed on any forward-looking statement made by or on behalf of the Company. The Company assumes no obligation to update any forward-looking statement after the date on which such statement is made, even if new information subsequently becomes available.
Available Information
The Company’s Internet address is
www.ghco.com.
The Company makes available free of charge through its website its Annual Report on Form 10-K, quarterly reports on Form 10-Q, current reports on Form 8-K, definitive proxy statements on Schedule 14A and amendments to those reports filed or furnished pursuant to Section 13(a) or 15(d) of the Securities Exchange Act of 1934 (Exchange Act) as soon as reasonably practicable after such documents are electronically filed with the Securities and Exchange Commission (SEC). In addition, the Company’s Certificate of Incorporation, its Corporate Governance Guidelines, the Charters of the Audit and Compensation Committees of the Company’s Board of Directors and the codes of conduct adopted by the Company and referred to in Item 10 of this Annual Report on Form 10-K are all available on the Company’s website; printed copies of such documents may be obtained by any stockholder upon written request to the Secretary, Graham Holdings Company at 1300 North 17th Street, Arlington, VA 22209. The contents of the Company’s website are not incorporated by reference into this Form 10-K and shall not be deemed “filed” under the Exchange Act.
The SEC website, www.sec.gov, contains the reports, proxy statements and information statements and other information regarding issuers that file electronically with the SEC.
Item 1A. Risk Factors.
The Company faces a number of significant risks and uncertainties in connection with its operations. The most significant of these are described below. These risks and uncertainties may not be the only ones facing the Company. Additional risks and uncertainties not presently known, or currently deemed immaterial, may adversely affect the Company in the future. In addition to the other information included in this Annual Report on Form 10-K, investors should carefully consider the following risk factors. If any of the events or developments described below occurs, it could have a material adverse effect on the Company’s business, financial condition or results of operations.
16
|
•
|
Failure to Comply With Statutory and Regulatory Requirements as a Service Provider to Title IV Participating Institutions Could Result in Monetary Liabilities or Subject Kaplan to Other Material Adverse Consequences.
|
KHE is a third-party service provider to Title IV participating institutions, including Purdue Global. As a result, KHE is required to comply with certain laws and regulations in connection with the provision of these services. KHE also provides financial aid services to Purdue Global, and as such, meets the definition of a “third-party servicer” contained in Title IV regulations. By virtue of being a third-party servicer, KHE is also subject to applicable statutory provisions of Title IV and ED regulations that, among other things, require KHE to be jointly and severally liable with Purdue Global to the ED for any violation by Purdue Global of any Title IV statute or ED regulation or requirement. Separately, if KHE provides financial aid services to more than one Title IV participating institution, it will be required to arrange for an independent auditor to conduct an annual Title IV compliance audit of Kaplan’s compliance with applicable ED requirements. KHE also is subject to other federal and state laws, including, but not limited to, information security requirements established by the Federal Trade Commission, as well as the applicable provisions of the Family Educational Rights and Privacy Act regarding the privacy of student records.
Failure to comply with these and other federal and state laws and regulations could result in adverse consequences, including, for example:
|
•
|
The imposition on KHE of fines or repayment obligations for Title IV funds to the ED, or the termination or limitation of Kaplan’s eligibility to provide services as a third-party servicer to Purdue Global or any other Title IV participating institution if KHE fails to comply with statutory or regulatory requirements applicable to such service providers;
|
|
•
|
Adverse effects on Kaplan’s business and operations from a reduction or loss in KHE’s revenues under the TOSA or any other agreement with any Title IV participating institution if a client institution loses or has limits placed on its Title IV eligibility, accreditation, operations or state licensure, or is subject to fines, repayment obligations or other adverse actions due to non-compliance by KHE (or the institution) with Title IV, accreditor, federal or state agency requirements;
|
|
•
|
Liability under the TOSA or any other agreement with any Title IV participating institution for non-compliance with federal, state or accreditation requirements arising from conduct by Kaplan; and
|
|
•
|
Liability for non-compliance with Title IV or other federal or state requirements occurring prior to the transfer of KU to Purdue.
|
|
•
|
Failure to Comply With the ED’s Title IV Incentive Compensation Rule Could Subject Kaplan to Liabilities, Sanctions and Fines.
|
Under the ED’s incentive compensation rule, an institution participating in Title IV programs may not provide any commission, bonus or other incentive payment to any person or entity engaged in any student recruiting or admission activities or in making decisions regarding the awarding of Title IV funds if such payment is based directly or indirectly on success in securing enrollments or financial aid. KHE is a third party providing bundled services to Title IV participating institutions, including recruiting and, in the case of Purdue Global, financial aid services. As such, KHE is also subject to the incentive compensation rules and cannot provide any commission, bonus or other incentive payment to any covered employees, subcontractors or other parties engaged in certain student recruiting, admission or financial aid activities based on success in securing enrollments or financial aid. In addition, Purdue Global’s tuition revenue sharing payments to KHE under the TOSA (as well as any other agreement with any Title IV participating institution) must comply with revenue sharing guidance provided by the ED related to bundled services agreements. KHE cannot predict how the ED or a federal court will interpret, revise or enforce all aspects of the incentive compensation rule or the revenue sharing guidance in the future or how it would be applied to KHE’s agreements. Any revisions or changes in interpretation or enforcement could require KHE and its client institutions to change their practices or the tuition revenue sharing payment terms of KHE’s agreements with such client institutions and could have a material adverse effect on Kaplan’s business and results of operations. Additionally, failure to comply with the incentive compensation rule could result in litigation or enforcement actions against KHE or its clients and could result in liabilities, fines or other sanctions against KHE or its clients, which could have a material adverse effect on Kaplan’s business and results of operations.
•
Failure to Comply With the ED’s Title IV Misrepresentation Regulations Could Subject Kaplan to Liabilities, Sanctions and Fines.
A Title IV participating institution is required to comply with the ED regulations related to misrepresentations and with related federal and state laws. These laws and regulations are broad in scope and may extend to statements by servicers, such as KHE, that provide marketing or certain other services to such institutions. These laws and regulations may also apply to KHE’s employees and agents, with respect to statements addressing the nature of an institution’s programs, financial charges or the employability of its graduates. KHE provides certain marketing and
17
other services to Title IV participating institutions. A violation of misrepresentation regulations or other federal or state laws and regulations applicable to the services KHE provides to its client institutions arising out of statements by KHE, its employees or agents could require KHE or its clients to pay fines or other monetary penalties, result in the termination of KHE’s agreements with client institutions or require KHE to pay the costs associated with indemnifying its client institutions from applicable losses. Additionally, failure to comply with these or other federal and state laws and regulations could result in the imposition on KHE of fines or federal student aid repayment obligations to the ED or the termination or limitation of KHE’s eligibility to provide services as a third-party servicer to Purdue Global or any other Title IV participating institution.
|
•
|
Compliance Reviews, Program Review, Audits and Investigations Could Result in Findings of Non- Compliance With Statutory and Regulatory Requirements and Result in Liabilities, Sanctions and Fines.
|
As a third-party servicer providing financial aid services to a Title IV participating institution, KHE is subject to reviews, audits, investigations and other compliance reviews conducted by various regulatory agencies and auditors, including, among others, the ED, the ED’s Office of the Inspector General, accrediting bodies and state and various other federal agencies. These compliance reviews can result in findings of non-compliance with statutory and regulatory requirements that can, in turn, result in proceedings to impose fines, liabilities, civil or criminal penalties or other sanctions against KHE. KHE will be required, if it enters into contracts to provide financial aid services to more than one Title IV participating institution, to arrange for an independent auditor to conduct an annual Title IV compliance audit of KHE’s compliance with applicable ED requirements.
On February 23, 2015, the ED began a program review assessing KU’s administration of its Title IV and Higher Education Act programs during the 2013–2014 and 2014–2015 award years. In 2018, Kaplan contributed the institutional assets and operations of KU to Purdue Global, and the university became Purdue Global, under the ownership and control of Purdue University. However, Kaplan retains liability for any financial obligations the ED might impose under this program review and that are the result of actions taken during the time that Kaplan owned the institution. On September 28, 2018, the ED issued a Preliminary Program Report (Preliminary Report). This Preliminary Report is not final, and the ED may change the findings in the final report. None of the initial findings in the Preliminary Report carries material financial liability. Although the program review technically covers only the 2013–2015 award years, the ED included a review of the treatment of student financial aid refunds for students who withdrew from a program prior to completion in 2017–2018. KHE cannot predict the outcome of this review, when it will be completed, whether any final findings of non-compliance with financial aid program or other requirements will impact KHE’s operations, or what liability or other limitations the ED might place on KHE or Purdue Global as a result of this review.
There are also two open program reviews at campuses that were part of the KHE Campuses business prior to its sale in 2015 to ECA. The ED’s final reports on the program reviews at former KHE Broomall, PA, and Pittsburgh, PA, locations are pending. KHE retains responsibility for any financial obligations resulting from these program reviews.
Prior to the transfer of the institutional assets and operations of KU to Purdue Global, on September 3, 2015, Kaplan sold substantially all of the assets of the KHE Campuses. As part of the transaction, similar to the transfer of KU, Kaplan retained liability for the pre-sale conduct of the KHE schools. Kaplan may also have liabilities under certain lease obligations. Although Kaplan no longer owns KU or the KHE Campuses, Kaplan may be liable to the current owners of KU and the KHE Campuses, respectively, for the pre-sale conduct of the schools.
|
•
|
Non-Compliance With Regulations by KHE’s Client Institutions May Adversely Impact Kaplan’s Results of Operations.
|
KHE currently provides services to higher education institutions that are heavily regulated by federal and state laws and regulations and by accrediting body requirements. Presently, a substantial portion of KHE’s revenues are attributable to service fees it receives under its agreement with Purdue Global, which are dependent upon revenues generated by Purdue Global and upon Purdue Global’s eligibility to participate in the Title IV federal student aid program. To maintain Title IV eligibility, Purdue Global and KHE’s other client institutions must be certified by the ED as eligible institutions, maintain authorizations by applicable state education agencies and be accredited by an accrediting commission recognized by the ED. Purdue Global and KHE’s other client institutions must also comply with the extensive statutory and regulatory requirements of the Higher Education Act and other state and federal laws and accrediting standards relating to their financial aid management, educational programs, financial strength, disbursement and return of Title IV funds, facilities, recruiting practices, representations made by the school and various other matters. If the ED finds that Purdue Global or any other KHE client institution has failed to comply with Title IV requirements or improperly disbursed or retained Title IV program funds, it may take one or more of a number of actions, including fining the school, requiring the school to repay Title IV program funds, limiting or terminating the school’s eligibility to participate in Title IV programs, initiating an emergency action to suspend the school’s participation in the Title IV programs without prior notice or opportunity for a hearing, transferring the school to a method of Title IV payment that would adversely affect the timing of the institution’s receipt of Title IV funds,
18
requiring the submission of a letter of credit, denying or refusing to consider the school’s application for renewal of its certification to participate in the Title IV programs or for approval to add a new campus or educational program and referring the matter for possible civil or criminal investigation. There can be no assurance that the ED will not take any of these or other actions in the future, whether as a result of lawsuits, program reviews or otherwise.
In turn, any of the aforementioned consequences could have a material adverse effect on Kaplan’s operating results even though such institution’s compliance is affected by circumstances beyond Kaplan’s control, including, for example:
|
•
|
a reduction or loss in KHE’s revenues under the TOSA or other client agreements if Purdue Global or any other KHE client institution loses or has limits placed on its Title IV eligibility, accreditation or state licensure;
|
|
•
|
a reduction or loss in KHE’s revenues under the TOSA or other client agreements if Purdue Global or any other client institution is subject to fines, repayment obligations or other adverse actions due to non-compliance by Purdue Global (or Kaplan) with Title IV, accreditor or state agency requirements;
|
|
•
|
the imposition on KHE of fines or repayment obligations to the ED or the termination or limitation on KHE’s eligibility to provide services to Purdue Global or other Title IV participating institutions if findings of non-compliance by Purdue Global or such other institution result in a determination that Kaplan failed to comply with statutory or regulatory requirements applicable to service providers; and
|
|
•
|
liability under the TOSA or other client agreements for non-compliance with federal, state or accreditation requirements arising from KHE’s conduct.
|
•
Kaplan May Fail to Realize the Anticipated Benefits of the Purdue Global Transaction.
Kaplan’s ability to realize the anticipated benefits of the Purdue Global transaction will depend in part on its ability to successfully and efficiently provide services to Purdue Global. Achieving the anticipated benefits is subject to a number of uncertainties, including whether the services can be provided in the manner and at the cost Kaplan anticipated and whether Purdue Global is able to realize anticipated student enrollment levels. If Kaplan is unable to effectively execute its post-transaction strategy, it may take longer than anticipated to achieve the benefits of the transaction or it may not realize those benefits at all.
•
Regulatory Changes and Developments Could Negatively Impact Kaplan’s Results of Operations.
Any legislative, regulatory or other development that has the effect of materially reducing the amount of Title IV financial assistance or other federal, state or private financial assistance available to the students of Purdue Global or any other client institution could have a material adverse effect on Kaplan’s business and results of operations. In addition, any development that has the effect of making the terms on which Title IV financial assistance or other financial assistance funds are available to Purdue Global’s or other client institutions’ students materially less attractive could have a material adverse effect on Kaplan’s business and results of operations.
The laws, regulations and other requirements applicable to KHE or any KHE client institutions are subject to change and to interpretation. In addition, there are other factors related to Purdue Global’s and other client institutions’ compliance with federal, state and accrediting agency requirements—many of which are largely outside of Kaplan’s control—that could have a material adverse effect on Purdue Global’s and other client institutions’ revenues and, in turn, on Kaplan’s operating results including, for example:
Reduction in Title IV or other federal, state or private financial assistance:
KHE receives revenue based on its agreements with client institutions and, particularly, from Purdue Global revenue under the TOSA. Purdue Global is expected to derive a significant percentage of its tuition revenues from its participation in Title IV programs. Any legislative, regulatory or other development that materially reduces the amount of Title IV, federal, state or private financial assistance available to the students of Purdue Global and other client institutions could have a material adverse effect on Kaplan’s business and results of operations. In addition, any development that makes the terms of such financial assistance less attractive could have a material adverse effect on Kaplan’s business and results of operations.
Compliance reviews and litigation:
Institutions participating in the Title IV programs, including Purdue Global and other client institutions, are subject to program reviews, audits, investigations and other compliance reviews conducted by various regulatory agencies and auditors, including, among others, the ED, the ED’s Office of the Inspector General, accrediting bodies and state and various other federal agencies, as well as annual audits by an independent certified public accountant of compliance with Title IV statutory and regulatory requirements. Purdue Global and other client institutions also may be subject to various lawsuits and claims related to a variety of matters, including, but not limited to, alleged violations of federal and state laws and accrediting agency requirements. These compliance reviews and litigation matters could extend to activities conducted by KHE on behalf of Purdue Global or other client institutions and to KHE itself as a third-party servicer subject to Title IV regulations.
19
Legislative and regulatory change:
Congress periodically revises the Higher Education Act and other laws and enacts new laws governing the Title IV programs and annually determines the funding level for each Title IV program and may make changes in the laws at any time. The ED also may issue new regulations and guidance or change its interpretation of new regulations at any time. Any action by Congress or the ED that significantly reduces funding for Title IV programs or the ability of Purdue Global or other client institutions to receive funding through these programs could reduce Purdue Global’s or other client institutions’ enrollments and tuition revenues and, in turn, the revenues KHE receives under the TOSA or other agreements. Any action by Congress or the ED that impacts the ability of Purdue Global or other client institutions to contract with KHE to provide bundled services in exchange for a share of tuition revenue could require KHE to modify the TOSA, other agreements and its practices and could impact the revenues KHE may receive under such agreements. Congress, the ED and other federal and state regulators may create new laws or take actions that may require Purdue Global, other client institutions or KHE to modify practices in ways that could have a material adverse effect on Kaplan’s business and results of operations.
Increased regulatory scrutiny of postsecondary education and service providers:
The increased scrutiny of online schools that offer programs similar to those offered by Purdue Global or other client institutions has resulted, and may continue to result, in additional enforcement actions, investigations and lawsuits by the ED, other federal agencies, state Attorneys General and state licensing agencies. Recent enforcement actions have resulted in substantial liabilities, restrictions and sanctions and, in some cases, have led to the loss of Title IV eligibility and closure of institutions. This increased activity and other current and future activity may result in further legislation, rulemaking and other governmental actions affecting the amount of student financial assistance for which Purdue Global’s or other client institutions’ students are eligible, or Kaplan’s participation in Title IV programs as a third-party servicer to Purdue Global or such other client institutions’.
|
•
|
Changes in the Extent to Which Standardized Tests Are Used in the Admissions Process by Colleges or Graduate Schools Could Reduce Demand for KTP Offerings.
|
A substantial portion of Kaplan’s revenue is generated by KTP. The source of this income is fees charged for courses that prepare students for a broad range of admissions examinations that are required for admission to colleges and graduate schools. Historically, colleges and graduate schools have required standardized tests as part of the admissions process. There has been some movement away from this historical reliance on standardized admissions tests among a small number of colleges that have adopted “test-optional” admissions policies. Any significant reduction in the use of standardized tests in the college or graduate school admissions process could have an adverse effect on Kaplan’s operating results.
|
•
|
Changes in the Extent to Which Licensing and Proficiency Examinations Are Used to Qualify Individuals to Pursue Certain Careers Could Reduce Demand for Kaplan’s Offerings.
|
A substantial portion of KP and KI’s revenue comes from preparing individuals for licensing or technical proficiency examinations in various fields. Any significant relaxation or elimination of licensing or technical proficiency requirements in those fields served by KP and KI’s businesses could negatively impact Kaplan’s operating results.
|
•
|
Difficulties of Managing Foreign Operations Could Negatively Affect Kaplan’s Business.
|
Kaplan has operations and investments in a growing number of foreign countries, including Australia, Canada, China, Colombia, France, Hong Kong, India, Ireland, Japan, Myanmar, New Zealand, Nigeria, Saudi Arabia, Singapore, the U.K. and the United Arab Emirates. Operating in foreign countries presents a number of inherent risks, including the difficulties of complying with unfamiliar laws and regulations, effectively managing and staffing foreign operations, successfully navigating local customs and practices, preparing for potential political and economic instability and adapting to currency exchange rate fluctuations. Failure to effectively manage these risks could have a material adverse effect on Kaplan’s operating results.
|
•
|
Changes in International Regulatory and Physical Environments and Failure to Comply With Regulations Applicable to International Operations Could Negatively Affect International Student Enrollments and Kaplan’s Business.
|
Any significant changes to the regulatory environment or other factors, including geopolitical instability, imposition of international sanctions or a natural disaster or pandemic in either the students’ countries of origin or countries in which they desire to study, could negatively affect Kaplan’s ability to attract and retain students and negatively affect Kaplan’s operating results. In addition, any significant changes to visa policies or the tax environment in a country in which KI operates could negatively affect its operating results.
Kaplan is subject to a wide range of regulations relating to its international operations. These include domestic laws with extra-territorial reach, such as the U.S. Foreign Corrupt Practices Act; international laws, such as the U.K. Bribery Act; as well as the local regulatory regimes of the countries in which Kaplan operates. These regulations
20
change frequently. Compliance with these regulations requires utmost vigilance. Failure to comply can result in the imposition of significant penalties or revocation of Kaplan’s authority to operate in the applicable jurisdiction, each of which could have a material adverse effect on Kaplan’s operating results.
KI’s operations, institutions and programs in the United States may be subject to state-level regulation and oversight by state regulatory agencies, whose approval or exemption from approval is necessary to allow an institution to operate in the state. These agencies may establish standards for instruction, qualifications of faculty, location and nature of facilities, financial policies and responsibility and other operational matters. Institutions that seek to admit international students are required to be federally certified and legally authorized to operate in the state in which the institution is physically located in order to be allowed to issue the relevant documentation to permit international students to obtain a visa.
A substantial portion of KI’s revenue comes from programs that prepare international students to study and travel in English-speaking countries, principally the U.S., the U.K., Australia and Singapore. KI’s ability to enroll students in these programs is directly dependent on its ability to comply with complex regulatory environments. For example, on June 23, 2016, the U.K. held a referendum in which voters approved a proposal that the U.K. leave the European Union (EU), commonly referred to as “Brexit.” The impact of Brexit on KI will depend, in part, on the outcome of future negotiations regarding the terms of the U.K.’s withdrawal from the EU, possibly including any transition period or the outcome of any “no deal” exit. A “no deal” exit would occur if the U.K. government is not able to reach agreement with the EU on either transition arrangements or its future relationship with the EU upon exit. This risk increased following the rejection of the proposed transition arrangements by the U.K. Parliament on January 15, 2019. A U.K. exit on a “no deal” basis could adversely impact the value of the British pound as compared to other currencies or potentially have other adverse consequences and may have a materially adverse impact on KI’s results of operations. Uncertainty over the outcome of the negotiations and the possibility of a “no deal” exit may materially or significantly diminish interest in traveling to the U.K. for study. If the U.K. is no longer viewed as a favorable study destination, KI’s ability to recruit international students will be adversely impacted, which would result in material adverse impacts to KI’s results of operations and cash flows. The U.K. government’s Immigration White Paper, issued in December 2018, clarified that EU nationals’ ability to enter the U.K. for long- or short-term study will change. EU national students seeking to study higher education courses will be broadly subject to similar rules as those that presently apply to non-EU international students (KI Pathways). EU national students seeking to study English-language courses will either require an Electronic Travel Authorization or a short-term student visa (KI English). EU nationals do not currently require visas or face other administrative barriers to study in the U.K. It is also expected that recruitment of staff from outside the U.K will become more difficult and that Kaplan may experience difficulties in attracting and retaining international staff in the U.K. It is unclear how international student recruitment agents and prospective international students will view the U.K. as a study destination after the introduction of these new requirements, the EU exit negotiations and the U.K.’s eventual exit from the EU. The introduction of new visa and other administrative requirements, Brexit and the perception of the U.K. as a less favorable study destination may have a materially adverse impact on KI’s ability to recruit international students, KI’s results of operations and cash flows. Additionally, if the U.K does not receive a determination of adequacy under the EU General Data Protection Regulation, then flows of personal data within KI or between KI and its clients, suppliers, business partners and affiliates may be substantially disrupted.
Changes to levels of direct and indirect government funding for international education programs would also materially impact the success of KI’s operations. For example, if government funding for vocational education in Singapore were to be reduced or the training requirements materially changed, this could produce a material adverse effect on Kaplan’s operating results. Similarly, if access to student loan or other funding were to be lost for KI operations that admit students who are entitled to receive the benefit of this funding, this could also produce a material adverse effect on Kaplan’s operating results.
In January 2017, President Trump signed an executive order barring citizens from Syria, Iraq, Iran, Yemen, Libya, Somalia and Sudan from entering the U.S. for a certain period of time. Although the countries that were the subject of the order were subsequently modified, the order has been the subject of significant international press interest. Negative perceptions regarding travel to the U.S. could have a significant negative impact on KI’s ability to recruit international students, and Kaplan’s business could be adversely and materially impacted.
In December 2017, the Australian government established a Royal Commission into Misconduct in the Banking Superannuation and Financial Services Industry. The Commission’s investigations have uncovered, among other things, widespread issues around fee misuse, adviser misconduct, conflicted remuneration and errant breach reporting. These findings are expected to result in new legislation that would further increase the compliance burden on affected firms, that may in the short term adversely impact spending on training and Kl’s business in Australia.
21
|
•
|
Liability Under Real Estate Lease Guaranties for Certain Real Estate Leases That Were Assigned to Education Corporation of America Could Have a Material Adverse Effect on the Company’s Results.
|
On September 3, 2015, Kaplan sold to ECA substantially all of the assets of KHE Campuses. The transaction included the transfer of certain real estate leases that were guaranteed by Kaplan. As part of the transaction, Kaplan retained liability for, among other things, obligations arising under certain lease guarantees.
ECA is currently in receivership and has terminated all of its higher education operations other than the New England College of Business (NECB). The receiver has repudiated all of ECA’s real estate leases not connected to NECB. Although ECA is required to indemnify Kaplan for any amounts Kaplan must pay due to ECA’s failure to fulfill its obligations under real estate leases guaranteed by Kaplan, ECA’s financial situation and the existence of secured and unsecured creditors make it unlikely that Kaplan will recover from ECA. If Kaplan is not successful in mitigating these liabilities, the Company’s results could be materially adversely impacted. In the second half of 2018, the Company recorded an estimated $17.5 million in losses on guarantor lease obligations in connection with this transaction in other non-operating expense.
|
•
|
Changes in U.K. Tax Laws Could Have a Material Adverse Effect on KI.
|
Her Majesty’s Revenue and Customs (HMRC), a department of the U.K. government responsible for the collection of taxes, has raised assessments against the Kaplan UK Pathways business for Value Added Tax (VAT) relating to 2017 and earlier years, which have been paid by Kaplan. In September 2017, in a case captioned
Kaplan International Colleges UK Limited
v
. The Commissioners for Her Majesty’s Revenue and Custom
, Kaplan challenged these assessments. The Company believes it has met all requirements under U.K. VAT law and expects to recover the £15.4 million receivable related to the assessments and subsequent payments that have been paid. Following a hearing held in January 2019, before the First Tier Tax Tribunal, all issues related to EU law in the case were referred to the Court of Justice of the European Union.
In March 2018, HMRC issued new VAT guidance indicating a change of policy in relation to certain aspects of a cost sharing exemption that could impact the U.K. Pathways business adversely if this guidance were to become law. As of December 31, 2018, this guidance had not yet been incorporated into U.K. law. If Kaplan is not successful in preserving a valid exemption under U.K. VAT law, the U.K. Pathways business would incur additional VAT expense in the future, which may materially adversely impact its financial results. In a separate matter,
there is presently a legal case awaiting judgment at the Supreme Court in the U.K. that may impact U.K. Pathways’ ability to receive the benefit of an exemption from charging its students VAT on tuition fees. The case may reverse or amend existing law and guidance that permits private providers to qualify as a “college of a university” and, therefore, receive the benefit of an exemption from charging its students VAT on tuition fees. If the case restricts which businesses are capable of constituting “colleges of a university” and entitled to exemption, KI Pathways Colleges’ financial results may be materially adversely impacted if they are not able to meet any new requirements.
|
•
|
Changing Perceptions About the Effectiveness of Television Broadcasting in Delivering Advertising May Adversely Affect the Profitability of Television Broadcasting.
|
Historically, television broadcasting has been viewed as a cost-effective method of delivering various forms of advertising. There can be no guarantee that this historical perception will guide future decisions by advertisers. To the extent that advertisers shift advertising expenditures away from television to other media outlets, the profitability of the Company’s television broadcasting business could be adversely affected.
|
•
|
Increased Competition Resulting From Technological Innovations in News, Information and Video Programming Distribution Systems and Changing Consumer Behavior Could Adversely Affect the Company’s Operating Results.
|
The continuing growth and technological expansion of Internet-based services has increased competitive pressure on the Company’s media businesses. Examples of such developments include online delivery of programming, technologies that enable users to fast-forward or skip advertisements and devices that allow users to consume content on demand and in remote locations, while avoiding traditional commercial advertisements or subscription payments. Changing consumer behavior may also put pressure on the Company’s media businesses to change traditional distribution methods. Anticipating and adapting to changes in technology and consumer behavior on a timely basis will affect the Company’s media businesses’ ability to continue to increase their revenue. The development and deployment of new technologies and changing consumer behavior have the potential to negatively and significantly affect the Company’s media businesses in ways that cannot now be reliably predicted and that may have a material adverse effect on the Company’s operating results.
22
|
•
|
Changes in the Nature and Extent of Government Regulations Could Adversely Affect the Company’s Television Broadcasting Business and Other Businesses.
|
The Company’s television broadcasting business operates in a highly regulated environment. Complying with applicable regulations has significantly increased, and may continue to increase, the costs and has reduced the revenues of the business. Changes in regulations have the potential to negatively impact the television broadcasting business, not only by increasing compliance costs and reducing revenues through restrictions on certain types of advertising, limitations on pricing flexibility or other means, but also by possibly creating more favorable regulatory environments for the providers of competing services. In addition, changes to the FCC’s rules governing broadcast ownership may affect the Company’s ability to expand its television broadcasting business and/or may enable the Company’s competitors to improve their market positions through consolidation. More generally, all of the Company’s businesses could have their profitability or their competitive positions adversely affected by significant changes in applicable regulations.
|
•
|
Transition
to the New Technical Standard for Broadcast Television Stations May Alter the Competitive Environment in the Company’s Stations’ Markets or Cause the Company to Incur Increased Costs.
|
The Company cannot predict how the market will react to the new broadcast television station technical standard, ATSC 3.0, as voluntary transition to the new standard has only recently been approved. ATSC 3.0-capable consumer devices are not yet widely available in the United States. Many station groups are beginning to test ATSC 3.0 under experimental authority. Notably, there is a large consortium led by the Pearl Media Group (of which GMG is a member) that is leading test trials in the Phoenix market. Competing stations that transition to ATSC 3.0 may increase competition for the Company’s stations and/or create competitive pressure for the Company’s stations to launch ATSC 3.0 streams. Any transition to ATSC 3.0 may cause the Company to incur substantial costs. In the event the Company transitions any or all of its stations to ATSC 3.0, there can be no guarantee that the Company would successfully earn sufficient additional revenues to offset such costs. More generally, the deployment of ATSC 3.0 may have other material effects on the Company’s media businesses that cannot now be reliably predicted and that may have a material adverse effect on the Company’s operating results.
|
•
|
Potential Liability for Intellectual Property Infringement Could Adversely Affect the Company’s Businesses.
|
The Company periodically receives claims from third parties alleging that the Company’s businesses infringe on the intellectual property rights of others. It is likely that the Company will continue to be subject to similar claims, particularly as they relate to its media businesses. Other parts of the Company’s business could also be subject to such claims. Addressing intellectual product claims is a time-consuming and expensive endeavor, regardless of the merits of the claims. In order to resolve such claims, the Company may have to change its method of doing business, enter into licensing agreements or incur substantial monetary liability. It is also possible that one of the Company’s businesses could be enjoined from using the intellectual property at issue, causing it to significantly alter its operations. Although the Company cannot predict the impact at this time, if any such claim is successful, the outcome would likely affect the business utilizing the intellectual property at issue and could have a material adverse effect on that business’s operating results or prospects.
|
•
|
System Disruptions and Security Threats to the Company’s Information Technology Infrastructure Could Have a Material Adverse Effect on Its Businesses and Results of Operations.
|
The Company relies extensively on information technology systems, networks and services, including Internet sites, data hosting and processing facilities and tools and other hardware, software and technical platforms, some of which are managed, hosted, provided and/or used by third parties or their vendors, to assist in conducting the Company’s business.
The Company’s systems and the third-party systems on which it relies are subject to damage or interruption from a number of causes, including power outages; computer and telecommunications failures; computer viruses; security breaches; cyberattacks, including the use of ransomware; catastrophic events such as fires, floods, earthquakes, tornadoes or hurricanes; acts of war or terrorism; and design or usage errors by our employees, contractors or third-party service providers. Although the Company and the third-party service providers seek to maintain their respective systems effectively and to successfully address the risk of compromise of the integrity, security and consistent operations of these systems, such efforts may not be successful. As a result, the Company or its service providers could experience errors, interruptions, delays or cessations of service in key portions of the Company’s information technology infrastructure, which could significantly disrupt its operations and be costly, time consuming and resource intensive to remedy. To the extent such vulnerabilities require remediation, such remedial measures could require significant resources and may not be implemented before such vulnerabilities are exploited. As the cybersecurity landscape evolves, the Company may also find it necessary to make significant further investments to protect data and infrastructure. Any of these events could have a material adverse effect on the Company’s businesses and results of operations.
23
|
•
|
Failure to Comply With Privacy Laws or Regulations Could Have an Adverse Effect on the Company’s Businesses.
|
Various federal, state and international laws and regulations govern the collection, use, retention, sharing and security of consumer data. This area of the law is evolving, and interpretations of applicable laws and regulations differ. Legislative activity in the privacy area may result in new laws that are relevant to the Company’s operations, including the use of consumer data for marketing or advertising, that could result in exposure to material liability. For example, new general data privacy regulations adopted by the European Union known as the General Data Protection Regulation (GDPR), became effective in May 2018. These regulations require companies to meet requirements regarding the handling of personal data, including its use, protection and transfer and the ability of persons whose data is stored to correct or delete such data about themselves. Failure to meet the GDPR could result in fines of up to 4% of the Company’s annual global revenues. In addition, in 2018, California adopted a new privacy law, scheduled to go into effect on January 1, 2020, that borrows heavily from the GDPR. Compliance with the GDPR and other applicable international and U.S. privacy laws can be costly and time consuming. Claims of failure to comply with the Company’s privacy policies or applicable laws or regulations could form the basis of governmental or private-party actions against the Company and could result in significant penalties. Such claims and actions could cause damage to the Company’s reputation and could have an adverse effect on the Company’s businesses.
|
•
|
Extensive Regulation of the Healthcare Industry Could Adversely Affect the Company’s Healthcare Businesses and Results of Operations.
|
The home health and hospice industries are subject to extensive federal, state and local laws, with regulations affecting a wide range of matters, including licensure and certification, quality of services, qualifications of personnel, confidentiality and security of medical records, relationships with physicians and other referral sources, operating policies and procedures, and billing and coding practices. These laws and regulations change frequently, and the manner in which they will be interpreted is subject to change in ways that may not be predicted.
Effective January 1, 2020, the Center for Medicare and Medicaid Services (CMS) is proposing to overhaul the home health prospective payment system. Specifically, CMS is moving forward with a new payment model that will decrease reimbursement for cases with high therapy utilization and increase billing costs by significantly increasing billing requirements. In addition, CMS has implemented a rigorous system of claim reviews to identify improper home health billing and limit fraudulent claims. Pre-claim review disrupts the current healthcare delivery model and results in additional home health operational costs for chart reviews, preparation and response to CMS.
Reimbursement for services by third-party payers, including Medicare, Medicaid and private health insurance providers, continues to decline, while authorization, audit and compliance requirements continue to add to the cost of providing those services. In 2018, an anticipated extensive overhaul of Medicare reimbursement for the home health benefit was delayed, but is likely to be revisited in the future.
Managed-care organizations, hospitals, physician practices and other third-party payers continue to consolidate in response to the evolving regulatory environment, thereby enhancing their ability to influence the delivery of healthcare services and decreasing the number of organizations serving patients. This consolidation could adversely impact Graham Healthcare Group’s businesses if they are unable to maintain their ability to participate in established networks.
GHG also is subject to periodic and routine reviews, audits and investigations by federal and state government agencies and private payers, and these audits could result in negative findings that adversely impact the business. CMS increasingly uses third-party, for-profit contractors to conduct these reviews, many of whom share in the amounts that CMS denies. These reviews, audits and investigations consume significant staff and financial resources and may take years to resolve.
|
•
|
Failure to Comply With Environmental, Health, Safety and Other Laws Applicable to The Company’s Manufacturing Operations Could Negatively Impact the Company
’
s Business.
|
The Company’s manufacturing operations are subject to extensive federal, state and local laws and regulations relating to the environment, as well as health and workplace safety, including those set forth by the Occupational Safety and Health Administration (OSHA) and the Environmental Protection Agency (EPA) and state and local regulatory authorities in the U.S. Such laws and regulations affect manufacturing operations and require compliance with various environmental registrations, licenses, permits, inspections and other approvals. The Company incurs substantial costs to comply with these regulations, and any failure to comply may expose the Company to civil, criminal and administrative fees, fines, penalties and interruptions in operations that could have a material adverse impact on the Company’s results of operations, financial position or cash flows.
24
|
•
|
The Company May Be Subject to Liability Claims That Could Have a Material Adverse Effect on Its Business.
|
The Company’s manufacturing operations are subject to hazards inherent in manufacturing and production-related facilities. An accident involving these operations or equipment may result in losses due to personal injury; loss of life; damage or destruction of property, equipment or the environment; or a suspension of operations. Insurance may not protect the Company against liability for certain kinds of events, including events involving pollution or against losses resulting from business interruption. Any damages caused by the Company’s operations that are not covered by insurance, or are in excess of policy limits, could materially adversely affect the Company’s result of operations, financial position or cash flows
|
•
|
Failure to Successfully Integrate Acquired Businesses Could Negatively Affect the Company’s Business.
|
Acquisitions involve various inherent risks and uncertainties, including difficulties in efficiently integrating the service offerings, accounting and other administrative systems of an acquired business; the challenges of assimilating and retaining key personnel; the consequences of diverting the attention of senior management from existing operations; the possibility that an acquired business does not meet or exceed the financial projections that supported the purchase price; and the possible failure of the due diligence process to identify significant business risks or liabilities associated with the acquired business. A failure to effectively manage growth and integrate acquired businesses could have a material adverse effect on the Company
’
s operating results.
•
Changes in Business Conditions May Cause Goodwill and Other Intangible Assets to Become Impaired.
Goodwill generally represents the purchase price paid in excess of the fair value of net tangible and intangible assets acquired in a business combination. Goodwill is not amortized and remains on the Company’s balance sheet indefinitely unless there is an impairment or a sale of a portion of the business. Goodwill is subject to an impairment test on an annual basis and when circumstances indicate that an impairment is more likely than not. Such circumstances include an adverse change in the business climate for one of the Company’s businesses or a decision to dispose of a business or a significant portion of a business. The Company’s businesses each face uncertainty in their business environment due to a variety of factors. The Company may experience unforeseen circumstances that adversely affect the value of the Company’s goodwill or intangible assets and trigger an evaluation of the amount of the recorded goodwill and intangible assets. There also exists a reasonable possibility that changes to the discounted cash flow model used to perform the quantitative goodwill impairment review, including a decrease in the assumed projected cash flows or long-term growth rate, or an increase in the discount rate assumption, could result in an impairment charge. Future write-offs of goodwill or other intangible assets as a result of an impairment in the business could materially adversely affect the Company’s results of operations and financial condition.
|
•
|
The Spin-Off of Cable ONE Could Result in Significant Tax Liability to the Company and Its Stockholders.
|
In connection with the Company’s spin-off of Cable ONE, it received a written opinion of counsel to the effect that the distribution of Cable ONE common stock in the spin-off (Distribution) should qualify for non-recognition of gain and loss under Section 355 of the Internal Revenue Code.
The opinion assumed that the spin-off was completed according to the terms of the transaction documents for the spin-off and relied on the facts as stated in those documents and a number of other documents. The opinion cannot be relied on if any of these assumptions or statements is incorrect, incomplete or inaccurate in any material respect. The opinion of counsel is not binding on the Internal Revenue Service or the courts, and there can be no assurance that the Internal Revenue Service or a court will not take a contrary position.
If the Distribution were determined not to qualify for non-recognition of gain and loss, the Company, its stockholders who received shares of Cable ONE common stock in the Distribution, or both, could be subject to tax. Any such tax liability could be material.
Item 1B. Unresolved Staff Comments.
Not applicable.
Item 2. Properties.
The Company leases space for its corporate offices in Arlington, VA. The space consists of 33,815 square feet of office space, and the lease expires in 2024, subject to an option of the Company to extend.
Directly or through its subsidiaries, Kaplan owns a total of four properties: a 26,000-square-foot, six-story building located at 131 West 56th Street in New York City, used by the Kaplan Test Preparation division as an education center primarily for medical students; a redeveloped 47,410-square-foot, four-story brick building in Lincoln, NE,
25
used by Purdue Global; a 4,000-square-foot office condominium in Chapel Hill, NC, utilized by KTP; and a 15,000-square-foot, three-story building in Berkeley, CA, used by KTP and KIC North America. KI has also entered into a 135-year lease of land in Liverpool, U.K., and is in the process of constructing college and dormitory space totaling 138,000 square feet that is scheduled to open in August 2019.
In the U.S., Kaplan, Inc. and KHE lease corporate offices, together with a data center, call center and employee-training facilities, in two 97,000-square-foot buildings located on adjacent lots in Fort Lauderdale, FL. Both of those leases will expire in 2024. Kaplan, Inc. and KHE share corporate office space in a 23,364-square-foot office building in Alpharetta, GA, under a lease that expires in 2021. KHE leases 62,500 square feet of corporate office space in Chicago, IL, under a lease that will expire in 2022 (of which approximately 21,000 square feet have been subleased through the remainder of the term). KHE also separately leases 76,500 square feet of office space in Chicago, IL; however, the location has been entirely subleased through the remainder of the lease term. KHE also separately leases a two-story, 124,500-square-foot building in Orlando, FL, that is used as an additional support center (of which approximately 94,000 square feet have been subleased to third parties), pursuant to a lease that will expire in 2021; and 85,600 square feet of corporate office space in Plantation, FL (which has been entirely subleased to a third party), for a term that expires in 2021. Kaplan, Inc. and KTP have signed a sublease for 85,600 square feet in New York (expiring in February 2021). Kaplan, Inc. and KTP also separately lease 159,540 square feet in New York; however, the location has been entirely subleased to a third party through the remainder of the lease term. KTP has an additional 63 leases comprising approximately 190,119 square feet of office and instructional space. KTP also delivers classes at schools, colleges, hotels and other premises for which Kaplan is not a leaseholder. KP leases two corporate offices, totaling 64,128 square feet, in La Crosse, WI, under leases that will expire in 2022.
In addition, the KI English business maintains more than 19 leases in the U.S., comprising an aggregate of more than 250,000 square feet of office and instructional space.
Overseas, Dublin Business School’s facilities in Dublin, Ireland, are located in five buildings, aggregating approximately 74,000 square feet of space, that are rented under leases expiring between 2024 and 2029. Kaplan Publishing has an office and distribution warehouse in Wokingham, Berkshire, U.K., of 27,000 square feet, under a lease expiring in 2027. Kaplan Financial’s largest leaseholds are office and instructional spaces in London, U.K., of 33,000 square feet (expiring in 2033) and 50,200 square feet (comprising two leases) obtained in January 2015 and expiring in 2030; office and instructional space in Birmingham, U.K., of 19,220 square feet (expiring in 2027); office and instructional space in Manchester, U.K., of 15,900 square feet (comprising four separate leases, expiring in 2022); office and instructional space in Singapore, of 162,000 square feet (comprising five separate leases, expiring between 2019 and 2021); and office and instructional space in Hong Kong, of 30,850 square feet.
Palace House in London, U.K., is primarily occupied by the KI Pathways business with 20,200 square feet of space (comprising several separate leases, expiring in 2032). The KI Pathways business has also entered into a separate lease agreement under which it will agree to take further additional leases in Palace House (also expiring in 2032) totaling approximately 22,281 square feet, now that certain work has been completed in the building. Once the additional leases are complete, the Palace House leases will total approximately 44,078 square feet.
Kaplan has a lease expiring in 2026 for education space in Nottingham, U.K., totaling 16,455 square feet. In addition, Kaplan has entered into two separate leases in Glasgow, Scotland, for 58,000 square feet and 22,400 square feet, respectively, of dormitory space that was constructed and opened to students in 2012. These leases expire in 2032. In addition, Kaplan leases approximately 143,000 square feet of dormitory space as the main tenant of a student residential building in Nottingham, U.K. Kaplan has further entered into a lease for a residential college in Bournemouth, England, which comprises approximately 175,000 square feet. Kaplan has entered into an agreement for a lease in Brighton, U.K., for dormitory space totaling 128,779 square feet. This lease, once granted, is anticipated to expire in 2040, subject to possible permitted delays, which could extend the expiry date to 2041 or 2042. Kaplan has further entered into a conditional agreement for a lease in Bath, U.K., of newly constructed dormitory and education space totaling 151,353 square feet once conditions are met and construction has been completed. Kaplan believes that it is unlikely that the conditions precedent for the lease to be granted will be met. If granted, the term of the lease will be 21 years and seven days. In Australia, Kaplan leases one location in Melbourne, with an aggregate of approximately 76,000 square feet; three locations in Sydney, of approximately 48,000 square feet; one location in Brisbane, of approximately 22,000 square feet; and three locations in Adelaide, of approximately 44,750 square feet. These leases expire at various times, from 2019 through 2022. The University of Adelaide College (formerly Bradford College), in Adelaide, Australia, leases one location, with an aggregate of approximately 22,184 square feet; and Murdoch Institute of Technology is housed in one location on the Murdoch University campus, under a license agreement for 3,750 square feet. In New Zealand, Kaplan leases two locations (within the same campus) of approximately 10,300 square feet, one of which expires in 2021. All other Kaplan facilities in the U.S. and overseas (including administrative offices and instructional locations) occupy leased premises that are for less space than those listed above.
26
The offices of the Company’s broadcasting operations are located in leased space in Chicago, IL. The operations of each of the Company’s television stations are owned by subsidiaries of the Company, as are the related tower sites (except in Houston, Orlando and Jacksonville, where the tower sites are 50% owned).
The corporate office of GHG is located in leased office space in Troy, MI. GHG also leases a small office in Nashville, TN. GHG leases small office spaces in Mechanicsburg, PA; Williamsport, PA; Harrisburg, PA; Kingston, PA; Milford, PA; Stroudsburg, PA; New Castle, PA; Warrendale, PA; Shiloh, IL; Marion, IL; Glen Carbon, IL; Troy, MI; Grand Rapids, MI; Lansing, MI; Lapeer, MI; and Downer’s Grove, IL. In addition, GHG leases space for a hospice inpatient unit in Wilkes-Barre, PA, and nursing offices at Edward and Elmhurst hospitals in northern Illinois. GHG also has leased office space in Mars, PA, which expires in 2022. GMG also owns property in Benton, IL.
Forney has 20,000 square feet of corporate office space in Addison, TX, under a lease that expires in 2024. Forney’s manufacturing facility is located in Monterrey, Mexico, in a building that contains 85,169 square feet of office and manufacturing space under a lease that expires in 2020. Forney leases a 3,000-square-foot distribution center in Laredo, TX, under a lease that expires in May 2019. Forney also leases sales offices in Shanghai, China.
Joyce/Dayton owns three properties: its corporate headquarters in Kettering, OH, and manufacturing facilities in Portland, IN, and Clayton, OH. It also leases a manufacturing facility in Newington, CT.
Dekko owns five U.S. properties: a 200,600-square-foot headquarters office and manufacturing building in Garrett, IN; a 77,200-square-foot manufacturing building in Avilla, IN; 64,500 square feet of manufacturing and warehouse space in Ardmore, AL; 61,750 square feet of warehouse space in El Paso, TX; and a 22,500-square-foot new product development center in LaOtto, IN. In addition, Dekko owns two buildings in Juarez, Mexico, one of which is 132,150 square feet of manufacturing and office space and the other is 65,111 square feet of manufacturing and office space. In the U.S., Dekko leases 46,370 square feet of manufacturing and warehouse space in North Webster, IN, under a lease that expires in 2019; a 30,000-square-foot warehouse building in Kendallville, IN, under a lease expiring in 2098; and a data/training facility in Kendallville, IN, under a lease expiring in 2020. Electri-Cable Assemblies leases 33,208 square feet of manufacturing and warehouse space in Shelton, CT, under a lease that expires in 2021 and 24,324 square feet of manufacturing and warehouse space in Shelton, CT, under a lease that expires in 2020. Furnlite leases 80,400 square feet of manufacturing and warehouse space in Fallston, NC, under a lease that expires in 2023.
Hoover owns nine U.S. properties: a 29-acre site in Thomson, GA; a 35-acre site in Pine Bluff, AR; a 60-acre site in Milford, VA; a 15-acre site in Detroit, MI; a 14-acre site in Bakersfield, CA; a 17-acre site in Oxford, PA; a 15-acre site in Halifax, NC; an 11-acre site in Belington, WV; and a 65-acre site in Havana, Fl. In addition, Hoover leases a 10-acre site in Winston, OR, on a long-term lease with renewal terms available through December 31, 2044. Hoover’s corporate, sales and accounting office, and research, engineering and development offices are also located on the Thomson, GA, campus.
The Slate Group leases office space in Brooklyn, NY, and Washington, DC.
SocialCode leases office space in Washington, DC; New York, NY; San Francisco, CA; Los Angeles, CA; Cleveland, OH; and Austin, TX.
Item 3. Legal Proceedings.
On February 6, 2008, a purported class-action lawsuit was filed in the U.S. District Court for the Central District of California by purchasers of BAR/BRI bar review courses, from July 2006 onward, alleging antitrust claims against Kaplan and West Publishing Corporation, BAR/BRI’s former owner. On April 10, 2008, the court granted defendants’ motion to dismiss, a decision that was reversed by the Ninth Circuit Court of Appeals on November 7, 2011. The Ninth Circuit also referred the matter to a mediator for the purpose of exploring a settlement. In the fourth quarter of 2012, the parties reached a comprehensive agreement to settle the matter. The settlement was approved by the District Court in September 2013. In the fourth quarter of 2017, the Ninth Circuit remanded to the District Court, which, once again, set attorneys’ fees on January 11, 2018. Distribution of settlement funds was made in December 2018, and the claims administration process has been completed.
During 2014, certain Kaplan subsidiaries were subject to unsealed cases filed by former employees that include, among other allegations, claims under the False Claims Act relating to eligibility for Title IV funding. The U.S. government declined to intervene in all cases, and, as previously reported, court decisions either dismissed the cases in their entirety or narrowed the scope of their allegations. The remaining case is captioned
United States of America
ex rel.
Carlos Urquilla-Diaz
et al. v.
Kaplan University
et al. (unsealed March 25, 2008). On August 17, 2011, the U.S. District Court for the Southern District of Florida issued a series of rulings in the Diaz case, which included three separate complaints: Diaz, Wilcox and Gillespie. The court dismissed the Wilcox complaint in its entirety; dismissed all False Claims Act allegations in the Diaz complaint, leaving only an individual employment claim; and dismissed in part the Gillespie complaint, thereby limiting the scope and time frame of its False Claims Act allegations regarding compliance with the U.S. Federal Rehabilitation Act. On October 31, 2012, the court
27
entered summary judgment in favor of the Company as to the sole remaining employment claim in the Diaz complaint. On July 16, 2013, the court likewise entered summary judgment in favor of the Company on all remaining claims in the Gillespie complaint. Diaz and Gillespie each appealed to the U.S. Court of Appeals for the Eleventh Judicial Circuit. Arguments on both appeals were heard on February 3, 2015. On March 11, 2015, the appellate court issued a decision affirming the lower court’s dismissal of all of Gillespie’s claims. The appellate court also dismissed three of the four Diaz claims, but reversed and remanded on Diaz’s claim that incentive compensation for admissions representatives was improperly based solely on enrollment counts. Kaplan filed an answer to Diaz’s amended complaint on September 11, 2015. Kaplan filed a motion to dismiss Diaz’s claims, and a hearing was held on December 17, 2015. On March 24, 2016, the Court denied the motion to dismiss. Discovery in the case closed in January 2017. Kaplan filed a motion for summary judgment on February 21, 2017. Summary judgment was granted in full and entered on July 13, 2017. Diaz filed a notice of appeal in September 2017 and filed his initial brief. Kaplan filed a response brief in the third quarter 2018. The matter is not likely to be decided until mid-2019.
On October 19, 2018, a lawsuit was filed against KHE and other unrelated parties in El Paso, TX, County District Court alleging liability for default on a real property lease by Education Corporation of America (ECA). On November 19, 2018, this matter was removed to the U.S. District Court for the Western District of Texas. KHE’s
responsive pleading was filed in January 2019
.
On September 3, 2015, Kaplan sold to ECA substantially all of the assets of KHE nationally accredited on-ground Title IV eligible schools (KHE Campuses). The transaction included the transfer of certain real estate leases that were guaranteed by Kaplan. As part of the transaction, Kaplan retained liability for, among other things, obligations arising under certain lease guarantees.
ECA is currently in receivership and has terminated all of its higher education operations other than the New England College of Business (NECB). The receiver has repudiated all of ECA’s real estate leases not connected to NECB. Although ECA is required to indemnify Kaplan for any amounts Kaplan must pay due to ECA’s failure to fulfill its obligations under real estate leases guaranteed by Kaplan, ECA’s financial situation and the existence of secured and unsecured creditors make it unlikely that Kaplan will recover from ECA.
On March 28, 2016, a class-action lawsuit was filed in the U.S. District Court for the Northern District of Illinois by Erin Fries, a physical therapist formerly employed by Residential, against Residential Home Health, LLC, Residential Home Health Illinois, LLC, and David Curtis. The complaint alleges violations of the Fair Labor Standards Act and the Illinois minimum wage law. The complaint seeks damages, attorney’s fees and costs. At this time, the Company cannot predict the outcome of this matter.
In August 2017, the Pennsylvania Department of Health cited Celtic Healthcare of Westmoreland, LLC for being out of compliance with four conditions of the Medicare Conditions of Participation between August 7, 2017, and September 6, 2017. Celtic Healthcare of Westmoreland, LLC d/b/a Allegheny Health Network Healthcare@Home Home Health (“AHN H@H Home Health”) is a wholly owned subsidiary of a joint venture between West Penn Allegheny Health System, Inc. and Celtic Healthcare, Inc. In light of this 31-day period of non-compliance, the Department of Health issued a provisional license for AHN H@H Home Health. Following a re-survey investigation by the Pennsylvania Department of Health, on January 12, 2018, the Department of Health removed the provisional license assigned to AHN H@H Home Health and restored its unrestricted license. The Pennsylvania Department of Health will alert the Centers for Medicare and Medicaid Services (CMS) about this matter. CMS has the authority to impose civil monetary penalties of up to $10,000 per day or per instance for non-compliance. At this time, the Company cannot predict the outcome of this matter.
Her Majesty’s Revenue and Customs (HMRC), a department of the U.K. government responsible for the collection of taxes, has raised assessments against the Kaplan U.K. Pathways business for Value Added Tax (VAT) relating to 2017 and earlier years, which have been paid by Kaplan. In September 2017, in a case captioned
Kaplan International Colleges UK Limited
v.
The Commissioners for Her Majesty’s Revenue and Customs
, Kaplan challenged these assessments. The Company believes it has met all requirements under U.K. VAT law and expects to recover the £15.4 million receivable related to the assessments and subsequent payments that have been paid. Following a hearing held in January 2019, before the First Tier Tax Tribunal, all issues related to EU law in the case were referred to the Court of Justice of the European Union.
The Company and its subsidiaries are also subject to complaints and administrative proceedings and are defendants in various other civil lawsuits that have arisen in the ordinary course of their businesses, including contract disputes; actions alleging negligence, libel, defamation, invasion of privacy; trademark, copyright and patent infringement; False Claims Act violations; violations of employment laws and applicable wage and hour laws; and statutory or common law claims involving current and former students and employees. While it is not possible to predict the outcomes of these lawsuits, in the opinion of management, their ultimate dispositions should not have a material adverse effect on the Company’s business, financial condition, results of operations or cash flows.
Item 4. Mine Safety Disclosures.
Not applicable.
28
PART II
Item 5. Market for the Registrant’s Common Equity, Related Stockholder Matters and Issuer Purchases of Equity Securities.
Market Information and Holders
The Company’s Class B Common Stock is traded on the New York Stock Exchange under the symbol “GHC.” The Company’s Class A Common Stock is not publicly traded.
At January 31,
2019
, there were
27
holders of record of the Company’s Class A Common Stock and
392
holders of record of the Company’s Class B Common Stock.
Securities Authorized for Issuance Under Equity Compensation Plans
The following table and the footnote thereto set forth certain information as of
December 31, 2018
, concerning compensation plans of the Company under which equity securities of the Company are authorized to be issued.
____________
|
|
Number of Securities
to Be Issued Upon
Exercise of
Outstanding Options,
Warrants and Rights
|
Weighted Average
Exercise Price of
Outstanding Options,
Warrants and Rights
|
Number of Securities Remaining Available for Future Issuance Under Equity Compensation Plans (Excluding Securities Reflected in Column (a))
|
||
|
Plan Category
|
(a)
|
(b)
|
(c)
|
||
|
Equity compensation plans approved by security holders
|
184,932
|
$566.55
|
—
|
||
|
Equity compensation plans not approved by security holders
|
—
|
—
|
—
|
||
|
Total
|
184,932
|
$566.55
|
—
|
||
This table does not include information relating to restricted stock grants awarded under the Graham Holdings Company’s Incentive Compensation Plan, which plan has been approved by the stockholders of the Company. At
December 31, 2018
, there were
15,850
shares of restricted stock outstanding under the 2015–2018 Award Cycle and
13,250
shares of restricted stock outstanding under the 2017–2020 Award Cycle that had been awarded to employees of the Company and its subsidiaries under that Plan. In addition, the Company has from time to time awarded special discretionary grants of restricted stock to employees of the Company and its subsidiaries. At
December 31, 2018
, there were a total of
3,100
shares of restricted stock outstanding under special discretionary grants approved by the Compensation Committee of the Board of Directors. At
December 31, 2018
, a total of
437,077
shares of restricted stock and stock options were available for future awards.
Purchases of Equity Securities by the Issuer and Affiliated Purchasers
During the quarter ended
December 31, 2018
, the Company purchased shares of its Class B Common Stock as set forth in the following table:
|
Period
|
Total Number
of Shares
Purchased
|
Average
Price Paid
per Share
|
Total Number of Shares
Purchased as Part of
Publicly Announced Plan*
|
Maximum Number of Shares That May Yet Be Purchased Under the Plan*
|
||||||||
|
2018
|
||||||||||||
|
October
|
11,570
|
|
$
|
579.44
|
|
11,570
|
|
274,455
|
|
|||
|
November
|
800
|
|
596.31
|
|
800
|
|
273,655
|
|
||||
|
December
|
—
|
|
—
|
|
—
|
|
273,655
|
|
||||
|
Total
|
12,370
|
|
$
|
580.53
|
|
12,370
|
|
|||||
____________
*On November 9, 2017, the Company’s Board of Directors authorized the Company to purchase, on the open market or otherwise, up to
500,000
shares of its Class B Common Stock. This authorization included the
163,237
shares that remained under the previous authorization. There is no expiration date for that authorization. All purchases made during the quarter ended
December 31, 2018
, were open market transactions.
Performance Graph
The following graph is a comparison of the yearly percentage change in the Company’s cumulative total shareholder return with the cumulative total return of the Standard & Poor’s 500 Stock Index and a custom peer group index comprised of a composite group of education and television broadcasting companies. Given changes in our mix of operating divisions as a result of acquisitions and dispositions, the Company is changing its custom peer group index this year to include companies that operate in its two largest businesses. The Standard & Poor’s 500 Stock Index is comprised of 500 U.S. companies in the industrial, transportation, utilities and financial industries and is weighted by market capitalization. The custom peer group of composite companies includes Adtalem Global Education Inc., Chegg, Inc., E.W. Scripps Company, Grand Canyon Education Inc., Meredith Corporation, New Oriental Education & Technology Group Inc., Pearson plc, Tegna Inc. and Tribune Media Company. In prior years, the Company used a custom peer group of education companies, including Adtalem Global Education Inc., American Public Education, Inc., Bridgepoint Education, Inc., Capella Education Co., Grand Canyon Education Inc., National American University Holdings, Inc. and Strayer Education, Inc. The graph reflects the investment of $100
29
on December 31,
2013
, in the Company’s Class B Common Stock, the Standard & Poor’s 500 Stock Index, the custom peer group of composite companies and the custom peer group index of education companies. For purposes of this graph, it has been assumed that dividends were reinvested on the date paid in the case of the Company, and on a quarterly basis in the case of the Standard & Poor’s 500 Index, the custom peer group index of composite companies, and the custom peer group index of education companies.
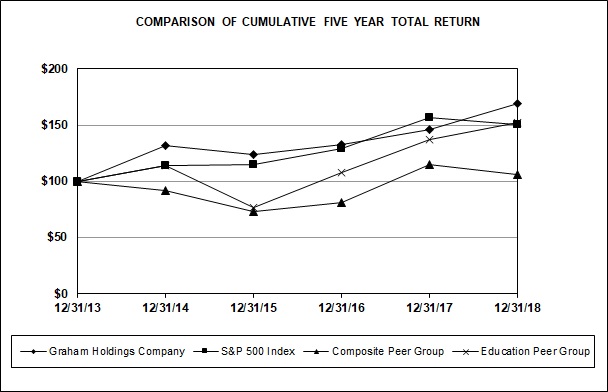
|
December 31
|
2013
|
2014
|
2015
|
2016
|
2017
|
2018
|
|||||||||||
|
Graham Holdings Company
|
100.00
|
|
132.20
|
|
124.23
|
|
132.48
|
|
145.79
|
|
168.80
|
|
|||||
|
S&P 500 Index
|
100.00
|
|
113.69
|
|
115.26
|
|
129.05
|
|
157.22
|
|
150.33
|
|
|||||
|
Composite Peer Group
|
100.00
|
|
91.93
|
|
73.21
|
|
80.79
|
|
114.50
|
|
106.19
|
|
|||||
|
Education Peer Group
|
100.00
|
|
114.14
|
|
76.33
|
|
107.82
|
|
137.50
|
|
152.09
|
|
|||||
Item 6. Selected Financial Data.
See the information for the years
2014
through
2018
contained in the table titled “Five-Year Summary of Selected Historical Financial Data,” which is included in this Annual Report on Form 10-K and listed in the index to financial information on page 37 hereof (with only the information for such years to be deemed filed as part of this Annual Report on Form 10-K).
Item 7. Management’s Discussion and Analysis of Financial Condition and Results of Operations.
See the information contained under the heading “Management’s Discussion and Analysis of Results of Operations and Financial Condition,” which is included in this Annual Report on Form 10-K and listed in the index to financial information on page 37 hereof.
Item 7A. Quantitative and Qualitative Disclosures About Market Risk.
The Company is exposed to market risk in the normal course of its business due primarily to its ownership of marketable equity securities, which are subject to equity price risk; to its borrowing and cash-management activities, which are subject to interest rate risk; and to its non-U.S. business operations, which are subject to foreign exchange rate risk.
Equity Price Risk.
The Company has common stock investments in several publicly traded companies (as discussed in Note 4 to the Company’s Consolidated Financial Statements) that are subject to market price volatility. The fair value of these common stock investments totaled
$496.4 million
at
December 31, 2018
.
30
Interest Rate Risk.
The Company’s long-term debt primarily consists of
$400 million
principal amount of
5.75%
unsecured notes due June 1, 2026 (the Notes). At
December 31, 2018
, the aggregate fair value of the Notes, based upon quoted market prices, was
$406.7 million
. An increase in the market rate of interest applicable to the Notes would not increase the Company’s interest expense with respect to the Notes since the rate of interest the Company is required to pay on the Notes is fixed, but such an increase in rates would affect the fair value of the Notes. Assuming, hypothetically, that the market interest rate applicable to the Notes was
100
basis points higher than the Notes’ stated interest rate of
5.75%
, the fair value of the Notes at
December 31, 2018
, would have been approximately
$382.1 million
. Conversely, if the market interest rate applicable to the Notes was
100
basis points lower than the Notes’ stated interest rate, the fair value of the Notes at such date would have been approximately
$418.9 million
.
On July 25, 2016, Kaplan borrowed
£75 million
under the Kaplan Credit Agreement. On the same date, Kaplan entered into an interest rate swap agreement with a total notional value of
£75 million
and a maturity date of July 1, 2020. The interest rate swap agreement will pay Kaplan variable interest on the
£75 million
notional amount at the three-month LIBOR, and Kaplan will pay the counterparties a fixed rate of
0.51%
, effectively resulting in a total fixed interest rate of
2.01%
on the outstanding borrowings at the current applicable margin of
1.50%
. The interest rate swap agreement was entered into to convert the variable rate British pound borrowing under the Kaplan Credit Agreement into a fixed rate borrowing. The Company provided a guarantee on any borrowings under the Kaplan Credit Agreement. Based on the terms of the interest rate swap agreement and the underlying borrowing, the interest rate swap agreement was determined to be effective, and thus qualifies as a cash flow hedge. As such, changes in the fair value of the interest rate swap are recorded in other comprehensive income on the accompanying Consolidated Balance Sheets until earnings are affected by the variability of cash flows.
Foreign Exchange Rate Risk.
The Company is exposed to foreign exchange rate risk primarily at its Kaplan international operations, and the primary exposure relates to the exchange rate between the U.S. dollar and the British pound, the Australian dollar, and the Singapore dollar. In
2018
, the Company reported foreign currency losses of
$3.8 million
. In
2017
, the Company reported foreign currency gains of
$3.3 million
. In
2016
, the Company reported unrealized foreign currency losses of
$39.9 million
, largely as a result of the decline in the British pound currency in 2016; this includes a realized $16.5 million loss related to a British pound intercompany advance made in the first quarter of 2016 related to Kaplan’s U.K. acquisitions that has been repaid. In the third quarter of 2016, certain intercompany loans were capitalized and other intercompany loans were designated as long-term investments.
If the values of the British pound, the Australian dollar, and Singapore dollar relative to the U.S. dollar had been
10%
lower than the values that prevailed during
2018
, the Company’s pre-tax income for
2018
would have been approximately
$9 million
lower. Conversely, if such values had been
10%
higher, the Company’s reported pre-tax income for
2018
would have been approximately
$9 million
higher.
Item 8. Financial Statements and Supplementary Data.
See the Company’s Consolidated Financial Statements at
December 31, 2018
, and for the periods then ended, together with the report of PricewaterhouseCoopers LLP thereon and the information contained in Note 20 to said Consolidated Financial Statements titled “Summary of Quarterly Operating Results and Comprehensive Income (Unaudited),” which are included in this Annual Report on Form 10-K and listed in the index to financial information on page 37 hereof.
Item 9. Changes in and Disagreements With Accountants on Accounting and Financial Disclosure.
Not applicable.
Item 9A. Controls and Procedures.
Evaluation of Disclosure Controls and Procedures
An evaluation was performed by the Company’s management, with the participation of the Company’s Chief Executive Officer (the Company’s principal executive officer) and the Company’s Senior Vice President–Finance (the Company’s principal financial officer), of the effectiveness of the Company’s disclosure controls and procedures (as defined in Exchange Act Rules 13a-15(e) and 15d-15(e)), as of December 31, 2018. Based on that evaluation, the Company’s Chief Executive Officer and Senior Vice President–Finance have concluded that the Company’s disclosure controls and procedures, as designed and implemented, are effective in ensuring that information required to be disclosed by the Company in the reports that it files or submits under the Exchange Act is recorded, processed, summarized and reported within the time periods specified in the Securities and Exchange Commission’s rules and forms and is accumulated and communicated to management, including the Chief Executive Officer and Senior Vice President–Finance, in a manner that allows timely decisions regarding required disclosure.
31
Management’s Report on Internal Control Over Financial Reporting
Management of Graham Holdings Company is responsible for establishing and maintaining adequate internal control over financial reporting (as defined in Exchange Act Rules 13a-15(f) and 15d-15(f)). The Company’s internal control over financial reporting is designed to provide reasonable assurance regarding the reliability of financial reporting and the preparation of financial statements for external purposes in accordance with generally accepted accounting principles.
The Company’s management assessed the effectiveness of internal control over financial reporting as of December 31, 2018. In making this assessment, management used the criteria set forth in
Internal Control-Integrated Framework
issued by the Committee of Sponsoring Organizations of the Treadway Commission (COSO) in 2013. Management has concluded that as of December 31, 2018, the Company’s internal control over financial reporting was effective based on these criteria.
The effectiveness of the Company’s internal control over financial reporting as of December 31, 2018, has been audited by PricewaterhouseCoopers LLP, an independent registered public accounting firm, as stated in their report included herein.
Changes in Internal Control Over Financial Reporting
There has been no change in the Company’s internal control over financial reporting during the quarter ended December 31, 2018, that has materially affected, or is reasonably likely to materially affect, the Company’s internal control over financial reporting.
Item 9B. Other Information.
Not applicable.
PART III
Item 10. Directors, Executive Officers and Corporate Governance.
The information contained under the heading “Executive Officers” in Item 1 hereof and the information contained under the headings “Nominees for Election by Class A Shareholders,” “Nominees for Election by Class B Shareholders,” “Audit Committee” and “Section 16(a) Beneficial Ownership Reporting Compliance” in the definitive Proxy Statement for the Company’s
2019
Annual Meeting of Stockholders is incorporated herein by reference thereto.
The Company has adopted codes of conduct that constitute “codes of ethics” as that term is defined in paragraph (b) of Item 406 of Regulation S-K and that apply to the Company’s principal executive officer, principal financial officer, principal accounting officer or controller and to any persons performing similar functions. Such codes of conduct are posted on the Company’s website, the address of which is ghco.com
,
and the Company intends to satisfy the disclosure requirements under Item 5.05 of Form 8-K with respect to certain amendments to, and waivers of the requirements of, the provisions of such codes of conduct applicable to the officers and persons referred to above by posting the required information on its website.
In addition to the certifications of the Company’s Chief Executive Officer and Chief Financial Officer filed as exhibits to this Annual Report on Form 10-K, on May 9, 2018, the Company’s Chief Executive Officer submitted to the New York Stock Exchange the annual certification regarding compliance with the NYSE’s corporate governance listing standards required by Section 303A.12(a) of the NYSE Listed Company Manual.
Item 11. Executive Compensation.
The information contained under the headings “Director Compensation,” “Compensation Committee Interlocks and Insider Participation,” “Executive Compensation” and “Compensation Committee Report” in the definitive Proxy Statement for the Company’s
2019
Annual Meeting of Stockholders is incorporated herein by reference thereto.
Item 12. Security Ownership of Certain Beneficial Owners and Management and Related Stockholder Matters.
The information contained under the heading “Stock Holdings of Certain Beneficial Owners and Management” in the definitive Proxy Statement for the Company’s
2019
Annual Meeting of Stockholders is incorporated herein by reference thereto.
32
Item 13. Certain Relationships and Related Transactions and Director Independence.
The information contained under the headings “Transactions With Related Persons, Promoters and Certain Control Persons” and “Controlled Company” in the definitive Proxy Statement for the Company’s
2019
Annual Meeting of Stockholders is incorporated herein by reference thereto.
Item 14. Principal Accounting Fees and Services.
The information contained under the heading “Audit Committee Report” in the definitive Proxy Statement for the Company’s
2019
Annual Meeting of Stockholders is incorporated herein by reference thereto.
PART IV
Item 15. Exhibits, Financial Statement Schedules.
The following documents are filed as part of this report:
1.
Financial Statements.
As listed in the index to financial information on page 37 hereof.
2.
Exhibits.
As listed in the index to exhibits on page 34 hereof.
Item 16. Form 10-K Summary.
Not applicable.
33
INDEX TO EXHIBITS
|
Exhibit Number
|
|
Description
|
|
|
||
|
2.1
|
||
|
3.1
|
|
|
|
3.2
|
||
|
3.3
|
|
|
|
4.1
|
||
|
10.1
|
||
|
10.2
|
||
|
10.3
|
|
|
|
10.4
|
|
|
|
10.5
|
|
|
|
10.6
|
||
|
10.7
|
|
|
|
10.8
|
||
|
10.9
|
||
|
10.10
|
||
|
10.11
|
||
|
21
|
||
|
23
|
||
|
24
|
||
|
31.1
|
||
|
31.2
|
||
|
32
|
||
34
|
Exhibit Number
|
|
Description
|
|
|
||
|
101
|
The following financial information from Graham Holdings Company Annual Report on Form 10-K for the year ended December 31, 2018, formatted in Extensible Business Reporting Language (XBRL): (i) Consolidated Statements of Operations for the years ended December 31, 2018, 2017 and 2016; (ii) Consolidated Statements of Comprehensive Income for the years ended December 31, 2018, 2017 and 2016; (iii) Consolidated Balance Sheets as of December 31, 2018 and 2017; (iv) Consolidated Statements of Cash Flows for the years ended December 31, 2018, 2017 and 2016; (v) Consolidated Statements of Changes in Common Shareholders’ Equity for the years ended December 31, 2018, 2017 and 2016; and (vi) Notes to Consolidated Financial Statements. Pursuant to Rule 406T of Regulation S-T, these interactive data files are deemed “furnished” and not “filed” or part of a registration statement or prospectus for purposes of Sections 11 or 12 of the Securities Act of 1933, are deemed “furnished” and not “filed” for purposes of Section 18 of the Securities Exchange Act of 1934 and otherwise are not subject to liability under these sections.
|
|
___________________________________________
*A management contract or compensatory plan or arrangement required to be included as an exhibit hereto pursuant to Item 15(b) of Form 10-K.
**Graham Holdings Company hereby undertakes to furnish supplementally a copy of any omitted exhibit or schedule to such agreement to the SEC upon request.
+ Select portions of this exhibit have been omitted pursuant to a request for confidential treatment and have been filed separately with the SEC.
35
SIGNATURES
Pursuant to the requirements of Section 13 or 15(d) of the Securities Exchange Act of 1934, the Registrant has duly caused this report to be signed on its behalf by the undersigned, thereunto duly authorized, on
February 25, 2019
.
|
|
|
GRAHAM HOLDINGS COMPANY
|
|
|
|
(Registrant)
|
|
|
|
|
|
|
By
|
/s/ Wallace R. Cooney
|
|
|
|
Wallace R. Cooney
|
|
|
|
Senior Vice President–Finance
|
Pursuant to the requirements of the Securities Exchange Act of 1934, this report has been signed below by the following persons on behalf of the Registrant and in the capacities indicated on
February 25, 2019
:
|
Timothy J. O’Shaughnessy
|
President, Chief Executive Officer
(Principal Executive Officer) and
Director
|
|
|
Wallace R. Cooney
|
Senior Vice President–Finance
(Principal Financial Officer)
|
|
|
Marcel A. Snyman
|
Principal Accounting Officer
|
|
|
Donald E. Graham
|
Chairman of the Board
|
|
|
Lee C. Bollinger
|
Director
|
|
|
Christopher C. Davis
|
Director
|
|
|
Thomas S. Gayner
|
Director
|
|
|
Jack A. Markell
|
Director
|
|
|
Anne M. Mulcahy
|
Director
|
|
|
Larry D. Thompson
|
Director
|
|
|
G. Richard Wagoner, Jr.
|
Director
|
|
|
Katharine Weymouth
|
Director
|
|
|
|
By
|
/s/ Wallace R. Cooney
|
|
|
|
Wallace R. Cooney
|
|
|
|
Attorney-in-Fact
|
An original power of attorney authorizing Timothy J. O’Shaughnessy, Wallace R. Cooney and Nicole M. Maddrey, and each of them, to sign all reports required to be filed by the Registrant pursuant to the Securities Exchange Act of 1934 on behalf of the above-named directors and officers has been filed with the Securities and Exchange Commission.
36
INDEX TO FINANCIAL INFORMATION
________________________________________________
GRAHAM HOLDINGS COMPANY
|
Management’s Discussion and Analysis of Results of Operations and Financial Condition (Unaudited)
|
|
|
Financial Statements:
|
|
|
Report of Independent Registered Public Accounting Firm
|
|
|
Consolidated Statements of Operations for the Three Years Ended December 31, 2018
|
|
|
Consolidated Statements of Comprehensive Income (Loss) for the Three Years Ended December 31, 2018
|
|
|
Consolidated Balance Sheets at December 31, 2018 and 2017
|
|
|
Consolidated Statements of Cash Flows for the Three Years Ended December 31, 2018
|
|
|
Consolidated Statements of Changes in Common Stockholders’ Equity for the Three Years Ended December 31, 2018
|
|
|
Notes to Consolidated Financial Statements
|
|
|
Five-Year Summary of Selected Historical Financial Data (Unaudited)
|
|
________________________________________________
All schedules have been omitted either because they are not applicable or because the required information is included in the Consolidated Financial Statements or the notes thereto referred to above.
37
MANAGEMENT’S DISCUSSION AND ANALYSIS OF RESULTS OF OPERATIONS AND FINANCIAL CONDITION
This analysis should be read in conjunction with the Consolidated Financial Statements and the notes thereto.
OVERVIEW
Graham Holdings Company (the Company) is a diversified education and media company whose operations include educational services; television broadcasting; online, print and local TV news; social-media advertising services; home health and hospice care; and manufacturing. Education is the largest business, and through its subsidiary Kaplan, Inc., the Company provides extensive worldwide education services for individuals, schools and businesses. The Company’s second largest business is television broadcasting. Since November 2012, the Company has completed several acquisitions in home health services and manufacturing. The Company’s business units are diverse and subject to different trends and risks.
The Company’s education division is the largest operating division of the Company, accounting for
54%
of the Company’s consolidated revenues in
2018
. The Company has devoted significant resources and attention to this division for many years, given its geographic and product diversity; the investment opportunities and growth prospects during this time; and challenges related to government regulation. Kaplan is organized into the following
four
operating segments: Kaplan International, Kaplan Higher Education (KHE), Kaplan Test Preparation (KTP) and Professional (U.S.).
Kaplan International reported revenue increases for
2018
due to growth in Pathways enrollments. Kaplan International operating results improved in
2018
due largely to improved results at English-language, Pathways and UK Professional.
Prior to the Kaplan University (KU) Transaction closing on March 22, 2018, Higher Education included Kaplan’s domestic postsecondary education business, made up of fixed-facility colleges and online postsecondary and career programs. Following the KU Transaction closing, the Higher Education division includes the results as a service provider to higher education institutions.
KHE’s revenue declined in
2018
, largely due to the sale of Kaplan University and fewer average enrollments prior to the sale. KHE recorded $16.8 million of service fee with Purdue Global in its Higher Education operating results in 2018, based on an assessment of its collectability under the Transition and Operations Support Agreement (TOSA)
. Each quarter, the Company assesses the collectability of the service fee with Purdue Global to make a determination as to whether to record all or part of the service fee and whether to make adjustments to service fee amounts recognized in earlier periods.
KTP revenues declined in
2018
due to reduced demand for classroom-based offerings and the disposition of Dev Bootcamp. Operating results improved due primarily to decreased losses from the new economy skills training programs.
Professional (U.S.) revenues and operating results were up in
2018
, due primarily to two acquisitions that closed in May and July of 2018.
Kaplan made
five
acquisitions in
2018
;
two
acquisitions in
2017
; and
three
acquisition in
2016
, including Mander Portman Woodward, a leading provider of high-quality bespoke education to the United Kingdom (U.K.) and international students in London, Cambridge and Birmingham.
The Company’s television broadcasting division reported higher revenues and operating income in
2018
, due to increases in political advertising revenue, retransmission revenue, and winter Olympics-related advertising revenue at the Company’s NBC stations. In recent years, the television broadcasting division has consistently generated significantly higher operating income amounts and operating income margins than the education division and other businesses.
With the recent healthcare and manufacturing acquisitions and the recent acquisition at SocialCode, the Company has invested in new lines of business from late 2012 through 2018. The Company also has three investment stage businesses - Panoply, Pinna and CyberVista.
The Company generates a significant amount of cash from its businesses that is used to support its operations, pay down debt and fund capital expenditures, share repurchases, dividends, acquisitions and other investments.
38
RESULTS OF OPERATIONS —
2018
COMPARED TO
2017
Net i
ncome attributable to common shares
was
$271.2 million
(
$50.20
per share) for the year ended
December 31, 2018
, compared to
$302.0 million
(
$53.89
per share) for the year ended
December 31, 2017
.
The Company’s results for 2017
include a significant net deferred income tax benefit related to the Tax Cuts and Jobs Act legislation enacted in December 2017.
Items included in the Company’s net income for
2018
are listed below
:
|
•
|
a
$7.9 million
intangible asset impairment charge at the healthcare business (after-tax impact of
$5.8 million
, or
$1.08
per share);
|
|
•
|
a
$3.9 million
reduction to operating expenses from property, plant and equipment gains in connection with the spectrum repacking mandate of the
Federal Communications Commission (FCC)
(after-tax impact of
$3.0 million
, or
$0.55
per share);
|
|
•
|
$6.2 million
in interest expense related to the settlement of a mandatorily redeemable noncontrolling interest (
$1.14
per share);
|
|
•
|
$11.4 million
in debt extinguishment costs (after-tax impact of
$8.6 million
, or
$1.60
per share);
|
|
•
|
a
$30.3 million
settlement gain related to a bulk lump sum pension offering and curtailment gain related to changes in the Company’s postretirement healthcare benefit plan (after-tax amount of
$22.2 million
, or
$4.11
per share);
|
|
•
|
$15.8 million
in net losses on marketable equity securities (after-tax impact of
$12.6 million
, or
$2.33
per share);
|
|
•
|
non-operating gain, net, of
$6.7 million
from sales, write-ups and impairments of cost method and equity method investments, and related to sales of land and businesses, including guarantor lease obligations (after-tax impact of
$5.7 million
, or
$1.03
per share);
|
|
•
|
a
$4.3 million
gain on the Kaplan University Transaction (after-tax impact of
$1.8 million
or
$0.33
per share);
|
|
•
|
$3.8 million
in non-operating foreign currency losses (after-tax impact of
$2.9 million
, or
$0.54
per share);
|
|
•
|
a nonrecurring discrete
$17.8 million
deferred state tax benefit related to the release of valuation allowances (
$3.31
per share); and
|
|
•
|
$1.8 million
in income tax benefits related to stock compensation (
$0.33
per share).
|
Items included in the Company’s net income for
2017
are listed below:
|
•
|
$10.0 million
in restructuring and non-operating Separation Incentive Program charges at the education division (after-tax impact of
$6.3 million
, or
$1.12
per share
);
|
|
•
|
a
$9.2 million
goodwill and other long-lived asset impairment charge at one of the manufacturing businesses (after-tax impact of
$5.8 million
,
or $1.03
per share);
|
|
•
|
$3.3 million
in non-operating foreign currency gains (after-tax impact of
$2.1 million
or
$0.37
per share);
|
|
•
|
$177.5 million
in
net deferred tax benefits related to the enactment of the Tax Cuts and Jobs Act in December 2017 (
$31.68
per share); and
|
|
•
|
$5.9 million
in income tax benefits related to stock compensation (
$1.06
per share).
|
Revenue for
2018
was
$2,696.0 million
, up
4%
from
$2,591.8 million
in
2017
.
Revenues increased at the television broadcasting and manufacturing divisions, offset by a decline at the education division.
Operating costs and expenses for the year decreased slightly to
$2,449.8 million
in
2018
, from
$2,455.4 million
in
2017
. Expenses in
2018
decreased at the education division, offset by increases at the manufacturing and television broadcasting divisions.
The Company reported operating income for
2018
of
$246.2 million
, an increase of
80%
, from
$136.4 million
in
2017
.
Operating results improved at most of the Company’s divisions in 2018.
On April 27, 2017, certain subsidiaries of Kaplan, Inc. (Kaplan), a subsidiary of Graham Holdings Company entered into a Contribution and Transfer Agreement (Transfer Agreement) to contribute the institutional assets and operations of Kaplan University (KU) to an Indiana non-profit, public-benefit corporation that is a subsidiary affiliated with Purdue University (Purdue). The closing of the transactions contemplated by the Transfer Agreement occurred on March 22, 2018. At the same time, the parties entered into a
TOSA
pursuant to which Kaplan provides key non-academic operations support to the new university. The new university operates largely online as an Indiana public university affiliated with Purdue under the name Purdue University Global (Purdue Global).
39
Division Results
Education Division.
Education division revenue in
2018
totaled
$1,451.0 million
, down
4%
from
$1,516.8 million
in
2017
.
Kaplan reported operating income of
$97.1 million
for
2018
, a
25%
increase from
$77.7 million
in
2017
. In
2018
, operating results increased at Kaplan International, Kaplan Test Preparation and Kaplan Professional (U.S.), partially offset by decreased results at Higher Education.
In recent years, Kaplan has formulated and implemented restructuring plans at its various businesses that have resulted in restructuring costs,
with the objective of establishing lower cost levels in future periods.
There were no significant restructuring charges during
2018
. Across all businesses, restructuring costs totaled
$9.1 million
in
2017
.
As a result of the KU Transaction that closed on March 22, 2018, the Company has revised the financial reporting for its education division to provide operating results for Higher Education and Professional (U.S.).
A summary of Kaplan’s operating results
is as follows:
|
Year Ended December 31
|
||||||||||
|
(in thousands)
|
2018
|
2017
|
% Change
|
|||||||
|
Revenue
|
|
|
|
|||||||
|
Kaplan international
|
$
|
719,982
|
|
$
|
697,999
|
|
3
|
|
||
|
Higher education
|
342,085
|
|
431,425
|
|
(21
|
)
|
||||
|
Test preparation
|
256,102
|
|
273,298
|
|
(6
|
)
|
||||
|
Professional (U.S.)
|
134,187
|
|
115,839
|
|
16
|
|
||||
|
Kaplan corporate and other
|
1,142
|
|
294
|
|
—
|
|
||||
|
Intersegment elimination
|
(2,483
|
)
|
(2,079
|
)
|
—
|
|
||||
|
|
$
|
1,451,015
|
|
$
|
1,516,776
|
|
(4
|
)
|
||
|
Operating Income (Loss)
|
|
|
|
|
|
|
||||
|
Kaplan international
|
$
|
70,315
|
|
$
|
51,623
|
|
36
|
|
||
|
Higher education
|
15,217
|
|
16,719
|
|
(9
|
)
|
||||
|
Test preparation
|
19,096
|
|
11,507
|
|
66
|
|
||||
|
Professional (U.S.)
|
28,608
|
|
27,558
|
|
4
|
|
||||
|
Kaplan corporate and other
|
(26,702
|
)
|
(24,701
|
)
|
(8
|
)
|
||||
|
Amortization of intangible assets
|
(9,362
|
)
|
(5,162
|
)
|
(81
|
)
|
||||
|
Intersegment elimination
|
(36
|
)
|
143
|
|
—
|
|
||||
|
|
$
|
97,136
|
|
$
|
77,687
|
|
25
|
|
||
Kaplan International includes English-language programs and postsecondary education and professional training businesses largely outside the United States.
Kaplan International revenue increased
3%
in
2018
, and on a constant currency basis, revenue increased 1%, primarily due to growth in Pathways enrollments.
Kaplan International operating income increased
36%
in
2018
, due largely to improved results at English-language, Pathways and UK Professional.
Restructuring costs at Kaplan International totaled
$2.9 million
in
2017
.
Prior to the KU Transaction closing on March 22, 2018, Higher Education included Kaplan’s domestic postsecondary education business, made up of fixed-facility colleges and online postsecondary and career programs. Following the KU Transaction closing, the Higher Education division includes the results as a service provider to higher education institutions.
In
2018
, Higher Education revenue declined
21%
due largely to the sale of KU on March 22, 2018 and fewer average enrollments at KU prior to the sale.
The Company recorded $16.8 million of service fee with Purdue Global in its Higher Education operating results in 2018, based on an assessment of its collectability under the TOSA
.
Each quarter, the Company assesses the collectability of the service fee with Purdue Global to make a determination as to whether to record all or part of the service fee and whether to make adjustments to service fee amounts recognized in earlier periods.
Restructuring costs at Higher Education were
$1.4 million
for
2017
.
KTP
includes Kaplan’s standardized test preparation programs.
In September 2018, KTP acquired the test preparation and study guide assets of Barron’s Educational Series, a New York-based education publishing company.
KTP revenue declined
6%
in
2018
due to reduced demand for classroom-based offerings, and the disposition of Dev Bootcamp, which made up the majority of KTP’s new economy skills training programs, offset in part by growth in online-based programs.
KTP operating results improved in 2018 due primarily to decreased losses from the new economy skills training programs.
Operating losses for the new economy skills training programs were $3.6 million and $16.7 million for 2018 and 2017, respectively, including restructuring costs incurred in connection with the closing of Dev Bootcamp that was completed in the second half of 2017.
Excluding losses from the new economy skills training programs, KTP operating results were down in 2018, due primarily to revenue declines for classroom-based offerings.
40
Kaplan Professional (U.S.) includes the domestic professional and other continuing education businesses.
In
2018
, Kaplan Professional (U.S.) revenue was up
16%
due primarily to the May 2018 acquisition of Professional Publications, Inc. (PPI), an independent publisher of professional licensing exam review materials that provides engineering, surveying, architecture, and interior design licensure exam review products, and the July 2018 acquisition of College for Financial Planning (CFFP), a provider of financial education and training to individuals through programs of study for professionals pursuing a career in Financial Planning.
Kaplan Professional (U.S.) operating results improved
4%
in
2018
, due mostly to income from PPI and CFFP, offset by increased spending on sales, marketing and technology.
Kaplan corporate and other represents unallocated expenses of Kaplan, Inc.’s corporate office, other minor businesses and certain shared activities.
Television Broadcasting Division.
Revenue at the television broadcasting division increased
23%
to
$505.5 million
in
2018
, from
$409.9 million
in
2017
. The revenue increase is
due to a
$64.9 million
increase in political advertising revenue,
$38.0 million
in higher retransmission revenues, $8.6 million in 2018 incremental winter Olympics-related advertising revenue at the Company’s NBC stations, and the adverse impact from hurricanes Harvey and Irma in the third quarter of 2017.
Operating income for
2018
was up
51%
to
$210.5 million
, from
$139.3 million
in
2017
, due to higher revenues.
In 2018
,
the television broadcasting division recorded $3.9 million
in reductions to operating expenses related to non-cash property, plant and equipment gains due to new equipment received at no cost in connection with the spectrum repacking mandate of the FCC.
Operating margin at the television broadcasting division was
42%
in
2018
and
34%
in
2017
.
The Company’s television stations continue to deliver competitive audience ratings and are well-positioned in their markets. On average for the year, KPRC in Houston, KSAT in San Antonio and WJXT in Jacksonville ranked number one in the key 6am, 6pm and late newscasts among the critical 25 to 54 demographic. WDIV in Detroit ended the year as a solid number one at 6pm and 11pm and number two in the mornings. WKMG in Orlando and WSLS in Roanoke ranked third in their respective markets, while WCWJ in Jacksonville successfully found a niche with their strong syndicated programming lineup in daytime and early fringe.
Healthcare.
Graham Healthcare Group (GHG) provides home health and hospice services in three states.
At the end of June 2017, GHG acquired Hometown Home Health and Hospice, a Lapeer, MI-based healthcare services provider. Healthcare revenues declined
3%
in 2018, primarily due to a new management services agreement (MSA) with one of GHG’s joint ventures that was effective in the third quarter of 2018.
In the third quarter of 2018, GHG recorded a $7.9 million intangible asset impairment charge related to the Celtic trademark, which was phased out in the second half of 2018.
The decline in GHG operating results in 2018 is due to the intangible asset impairment charge and a decline in results from the MSA with one of GHG’s joint ventures, offset by lower bad debt expense and overall cost reductions.
41
Other Businesses.
A summary of Other Businesses’ operating results for
2018
compared to
2017
is as follows:
|
|
Year Ended December 31
|
%
|
|||||||||
|
(in thousands)
|
2018
|
2017
|
Change
|
||||||||
|
Operating Revenues
|
|
|
|
||||||||
|
Manufacturing
|
$
|
487,619
|
|
$
|
414,193
|
|
18
|
|
|||
|
SocialCode
|
58,728
|
|
62,077
|
|
(5
|
)
|
|||||
|
Other
|
43,880
|
|
34,733
|
|
26
|
|
|||||
|
|
$
|
590,227
|
|
$
|
511,003
|
|
16
|
|
|||
|
Operating Expenses
|
|
|
|
|
|
|
|||||
|
Manufacturing
|
$
|
458,768
|
|
$
|
399,246
|
|
15
|
|
|||
|
SocialCode
|
59,809
|
|
65,751
|
|
(9
|
)
|
|||||
|
Other
|
71,896
|
|
65,269
|
|
10
|
|
|||||
|
|
$
|
590,473
|
|
$
|
530,266
|
|
11
|
|
|||
|
Operating Income (Loss)
|
|
|
|
|
|
|
|||||
|
Manufacturing
|
$
|
28,851
|
|
$
|
14,947
|
|
93
|
|
|||
|
SocialCode
|
(1,081
|
)
|
(3,674
|
)
|
71
|
|
|||||
|
Other
|
(28,016
|
)
|
(30,536
|
)
|
8
|
|
|||||
|
|
$
|
(246
|
)
|
$
|
(19,263
|
)
|
99
|
|
|||
|
Depreciation
|
|||||||||||
|
Manufacturing
|
$
|
9,515
|
|
$
|
9,173
|
|
4
|
|
|||
|
SocialCode
|
797
|
|
1,004
|
|
(21
|
)
|
|||||
|
Other
|
1,523
|
|
1,546
|
|
(1
|
)
|
|||||
|
|
$
|
11,835
|
|
$
|
11,723
|
|
1
|
|
|||
|
Amortization of Intangible Assets and Impairment of Goodwill and Other Long-Lived Assets
|
|||||||||||
|
Manufacturing
|
$
|
24,746
|
|
$
|
31,052
|
|
(20
|
)
|
|||
|
SocialCode
|
928
|
|
333
|
|
—
|
|
|||||
|
Other
|
—
|
|
—
|
|
—
|
|
|||||
|
|
$
|
25,674
|
|
$
|
31,385
|
|
(18
|
)
|
|||
|
Pension Expense
|
|
|
|
|
|
|
|||||
|
Manufacturing
|
$
|
72
|
|
$
|
79
|
|
(9
|
)
|
|||
|
SocialCode
|
723
|
|
593
|
|
22
|
|
|||||
|
Other
|
578
|
|
453
|
|
28
|
|
|||||
|
|
$
|
1,373
|
|
$
|
1,125
|
|
22
|
|
|||
Manufacturing includes four businesses: Dekko, a manufacturer of electrical workspace solutions, architectural lighting and electrical components and assemblies; Joyce/Dayton Corp., a manufacturer of screw jacks and other linear motion systems; Forney, a global supplier of products and systems that control and monitor combustion processes in electric utility and industrial applications; and Hoover Treated Wood Products, Inc., a supplier of pressure impregnated kiln-dried lumber and plywood products for fire retardant and preservative applications that the Company acquired in April 2017. In July 2018, Dekko acquired Furnlite, Inc., a Fallston, NC-based manufacturer of power and data solutions for the hospitality and residential furniture industries.
Manufacturing revenues and operating income increased in 2018 due largely to the Hoover acquisition.
Also, in the second quarter of 2017, the Company recorded a $9.2 million goodwill and other long-lived asset impairment charge at Forney, due to lower than expected revenues resulting from sluggish overall demand for its energy products.
While Hoover holds inventory for relatively short periods, wood prices declined on a consistent basis in the second half of 2018, resulting in losses on inventory sales.
SocialCode is a provider of marketing solutions on social, mobile and video platforms. In the third quarter of 2018, SocialCode acquired Marketplace Strategy, a Cleveland-based Amazon sales acceleration agency. SocialCode revenue decreased
5%
in
2018
, resulting from declines in digital advertising service revenues, partly due to a transition from agency-based clients to direct-relationship clients.
SocialCode reported an operating loss of
$1.1 million
in
2018
compared to
$3.7 million
in
2017
.
SocialCode’s operating results included a credit of
$7.1 million
related to phantom equity plans in
2018
; whereas
2017
results included expense of
$1.4 million
related to phantom equity plans
in 2017
. Excluding the amounts related to phantom equity plans for the relevant periods, SocialCode results are down in 2018, largely due to revenue declines.
As of December 31, 2018, the accrual balance related to these plans was $0.4 million.
Other businesses include Slate and Foreign Policy, which publish online and print magazines and websites; and three investment stage businesses, Panoply, Pinna and CyberVista.
Revenues increased
26%
in 2018
largely due to growth at Panoply. Losses from each of these businesses in 2018 adversely affected operating results.
42
Corporate Office.
Corporate office includes the expenses of the Company’s corporate office and certain continuing obligations related to prior business dispositions.
Equity in Earnings (Losses) of Affiliates.
At
December 31, 2018
, the Company held interests in a number of home health and hospice joint ventures, and interests in several other affiliates.
During 2017,
the Company acquired an approximate
11%
interest in Intersection Holdings, LLC, a company that provides digital marketing and advertising services and products for cities, transit systems, airports, and other public and private spaces.
In the third quarter of 2018, the Company recorded $7.9 million in gains in earnings of affiliates related to two of its investments. In total, the Company recorded equity in earnings of affiliates of
$14.5 million
for
2018
, compared to losses of
$3.2 million
in
2017
.
Net Interest Expense, Debt Extinguishment Costs and Related Balances.
On May 30, 2018, the Company issued $400 million of 5.75% unsecured eight-year fixed-rate notes due June 1, 2026. Interest is payable semi-annually on June 1 and December 1. On June 29, 2018, the Company used the net proceeds from the sale of the notes and other cash to repay $400 million of 7.25% notes that were due February 1, 2019. The Company incurred $11.4 million in debt extinguishment costs related to the early termination of the 7.25% notes.
The Company incurred net interest expense of
$32.5 million
in
2018
, compared to
$27.3 million
in
2017
. The Company incurred $6.2 million in interest expense related to the mandatorily redeemable noncontrolling interest at GHG settled in the second quarter of 2018.
At
December 31, 2018
, the Company had
$477.1 million
in borrowings outstanding at an average interest rate of
5.1%
, and cash, marketable securities and other investments of
$778.7 million
.
At
December 31, 2017
, the Company had
$493.3 million
in borrowings outstanding at an average interest rate of
6.3%
, and cash, marketable securities and other investments of
$964.7 million
.
Non-Operating Pension and Postretirement Benefit Income, Net.
In the first quarter of 2018, the Company adopted new accounting guidance that changes the income statement classification of net periodic pension and postretirement pension cost. Under the new guidance, service cost is included in operating income, while the other components (including expected return on assets) are included in non-operating income.
The new guidance was required to be applied retroactively, with prior period financial information revised to reflect the reclassification. From a segment reporting perspective, this change had a significant impact on Corporate office reporting, with minimal impact on the television broadcasting and Kaplan corporate reporting.
In the fourth quarter of 2018, the Company recorded a $26.9 million gain related to a bulk lump sum pension program offering.
Also in the fourth quarter of 2018, the Company made changes to its postretirement healthcare benefit plan, resulting in a $3.4 million curtailment gain
. In total, the Company recorded net non-operating pension and postretirement benefit income of
$120.5 million
in
2018
, compared to
$72.7 million
in
2017
.
Loss on Marketable Equity Securities, Net
.
In the first quarter of 2018, the Company adopted new guidance that requires changes in the fair value of marketable equity securities to be included in non-operating income (expense) on a prospective basis.
Overall, the Company recognized
$15.8 million
in net losses on marketable equity securities in
2018
.
Other Non-Operating Income (Expense).
The Company recorded total other non-operating income, net, of
$2.1 million
in
2018
, compared to
$4.2 million
in
2017
.
The
2018
non-operating income, net, included
$11.7 million
in fair value increases on cost method investments;
$8.2 million
in net gains related to sales of businesses and contingent consideration
;
a
$2.8 million
gain on sale of a cost method investment; a
$2.5 million
gain on sale of land and other items, partially offset by
$17.5 million
in losses on guarantor lease obligations in connection with the 2015 sale of the KHE Campuses businesses;
$3.8 million
in foreign currency losses; and
$2.7 million
in impairments on cost method investments.
The
2017
non-operating income, net, included
$3.3 million
in foreign currency gains
and other items.
Provision for (Benefit From) Income Taxes.
The Company’s effective tax rate for
2018
was
16.1%
. In the third quarter of 2018, the Company recorded a
$17.8 million
deferred state tax benefit related to the release of valuation allowances.
Excluding this
$17.8 million
benefit and a
$1.8 million
income tax benefit related to stock compensation, the overall income tax rate for 2018 was
22.2%
.
The Tax Cuts and Jobs Act was enacted in December 2017, which included lowering the federal corporate income tax rate from 35% to 21%.
The Company reported an income tax benefit of
$119.7 million
for 2017, which was significantly impacted by the enactment of the Tax Cuts and Jobs Act in December 2017.
Overall, the Company recorded a
$177.5 million
net deferred tax benefit in the fourth quarter of 2017 as a result of enactment of this legislation, due largely to the revaluation of the Company’s U.S. deferred tax assets and liabilities to the lower federal tax rate and a significant reduction in the amount of deferred taxes previously provided on undistributed earnings of investments in non-U.S. subsidiaries.
In the first quarter of 2017, the Company recorded a
$5.9 million
income tax benefit related to the vesting of restricted stock awards in connection with the adoption of a new accounting standard that requires all
43
excess income tax benefits and deficiencies from stock compensation to be recorded as discrete items in the provision for income taxes.
Excluding the effect of these items, the effective tax rate for 2017 was
34.9%
.
Adoption of Revenue Recognition Standard.
On January 1, 2018, the Company adopted the new revenue recognition guidance using the modified retrospective approach. In connection with the KU Transaction, Kaplan recognized $4.5 million in service fee revenue and operating income in the third quarter of 2018. Under the previous guidance, this would not have been recognized, as a determination would not have been made until the end of Purdue Global’s fiscal year (June 30, 2019).
If the company applied the accounting policies under the previous guidance for all other revenue streams, revenue and operating expenses would have been
$1.7 million
and
$0.6 million
lower, respectively, for 2018.
RESULTS OF OPERATIONS —
2017
COMPARED TO
2016
Net income attributable to common shares was
$302.0 million
(
$53.89
per share) for the year ended
December 31, 2017
, compared to
$168.6 million
(
$29.80
per share) for the year ended
December 31, 2016
. The Company’s results for
2017
include a significant net deferred income tax benefit related to the Tax Cuts and Jobs Act legislation enacted in December 2017.
Items included in the Company’s net income for
2017
are listed below:
|
•
|
$10.0 million
in restructuring and non-operating Separation Incentive Program charges at the education division (after-tax impact of
$6.3 million
, or
$1.12
per share);
|
|
•
|
a
$9.2 million
goodwill and other long-lived asset impairment charge at one of the manufacturing businesses (after-tax impact of
$5.8 million
, or
$1.03
per share);
|
|
•
|
$3.3 million
in non-operating foreign currency gains (after-tax impact of
$2.1 million
, or
$0.37
per share);
|
|
•
|
$177.5 million
in net deferred tax benefits related to the enactment of the Tax Cuts and Jobs Act in December 2017 (
$31.68
per share); and
|
|
•
|
$5.9 million
in income tax benefits related to stock compensation (
$1.06
per share).
|
Items included in the Company’s net income for
2016
are listed below:
|
•
|
$11.9 million
in restructuring charges at the education division (after-tax impact of
$7.7 million
, or
$1.36
per share);
|
|
•
|
an
$18.0 million
non-operating gain related to a bulk lump sum pension program offering (after-tax impact of
$10.8 million
, or
$1.92
per share);
|
|
•
|
$16.8 million in net non-operating gains from the sales of assets and write-downs of cost and equity method investments (after-tax impact of $9.5 million, or $1.62 per share);
|
|
•
|
$39.9 million
in non-operating foreign currency losses (after-tax impact of
$25.5 million
, or
$4.51
per share); and
|
|
•
|
a net nonrecurring
$13.9 million
deferred tax benefit related to Kaplan (
$2.47
per share).
|
Revenue for
2017
was
$2,591.8 million
, up
4%
from
$2,481.9 million
in
2016
. Revenues increased in other businesses, offset by a decline at the education division. Operating costs and expenses for the year increased
9%
to
$2,455.4 million
in
2017
, from
$2,259.0 million
in
2016
. Expenses were higher due to increased network fees at the television broadcasting division in 2017, and increased expenses at other businesses as a result of the Hoover acquisition, partially offset by lower expenses at the education division due to overall declines in business activity. The Company reported operating income for
2017
of
$136.4 million
, a decrease of
39%
, from
$222.9 million
in
2016
. Operating results declined at the television broadcasting, education and healthcare divisions.
Division Results
Education Division.
Education division revenue in
2017
totaled
$1,516.8 million
, down
5%
from
$1,598.5 million
in
2016
. Kaplan reported operating income of
$77.7 million
for
2017
, an 18% decrease from
$95.3 million
in
2016
. In 2017, operating results declined at KHE, partially offset by improved results at KTP, Kaplan International and Professional (U.S.).
In recent years, Kaplan has formulated and implemented restructuring plans at its various businesses that have resulted in restructuring costs in
2017
and
2016
, with the objective of establishing lower cost levels in future periods. Across all businesses, restructuring costs totaled
$9.1 million
in
2017
and
$11.9 million
in
2016
.
44
A summary of Kaplan’s operating results is as follows:
|
Year Ended December 31
|
||||||||||
|
(in thousands)
|
2017
|
2016
|
% Change
|
|||||||
|
Revenue
|
|
|
|
|||||||
|
Kaplan international
|
$
|
697,999
|
|
$
|
696,362
|
|
—
|
|
||
|
Higher education
|
431,425
|
|
501,784
|
|
(14
|
)
|
||||
|
Test preparation
|
273,298
|
|
286,556
|
|
(5
|
)
|
||||
|
Professional (U.S.)
|
115,839
|
|
115,263
|
|
—
|
|
||||
|
Kaplan corporate and other
|
294
|
|
214
|
|
37
|
|
||||
|
Intersegment elimination
|
(2,079
|
)
|
(1,718
|
)
|
—
|
|
||||
|
|
$
|
1,516,776
|
|
$
|
1,598,461
|
|
(5
|
)
|
||
|
Operating Income (Loss)
|
|
|
|
|
|
|
||||
|
Kaplan international
|
$
|
51,623
|
|
$
|
48,398
|
|
7
|
|
||
|
Higher education
|
16,719
|
|
39,196
|
|
(57
|
)
|
||||
|
Test preparation
|
11,507
|
|
9,599
|
|
20
|
|
||||
|
Professional (U.S.)
|
27,558
|
|
27,436
|
|
—
|
|
||||
|
Kaplan corporate and other
|
(24,701
|
)
|
(21,763
|
)
|
(13
|
)
|
||||
|
Amortization of intangible assets
|
(5,162
|
)
|
(7,516
|
)
|
31
|
|
||||
|
Intersegment elimination
|
143
|
|
(29
|
)
|
—
|
|
||||
|
|
$
|
77,687
|
|
$
|
95,321
|
|
(18
|
)
|
||
Kaplan International includes English-language programs and postsecondary education and professional training businesses largely outside the United States. Kaplan International revenue increased slightly in 2017, and on a constant currency basis, revenue increased 2%, primarily due to growth in Pathways enrollments. Kaplan International operating income increased
7%
in
2017
, due largely to improved Pathways program results, partially offset by a decline in Singapore. Restructuring costs at Kaplan International totaled
$2.9 million
and
$4.7 million
in
2017
and
2016
, respectively.
KHE includes Kaplan’s domestic postsecondary education businesses, made up of fixed-facility colleges and online postsecondary and career programs.
In 2017, KHE revenue declined
14%
due to declines in average enrollments at Kaplan University. KHE operating income declined in 2017 due primarily to lower enrollment at Kaplan University, partially offset by lower restructuring costs. Restructuring costs at KHE were
$1.4 million
for 2017, compared to
$7.1 million
for
2016
.
New higher education student enrollments at Kaplan University declined 4% in
2017
due to lower demand across Kaplan University programs. Total students at Kaplan University were
28,718
at
December 31, 2017
, down
11%
from
December 31, 2016
.
Kaplan University higher education student enrollments by certificate and degree programs are as follows:
|
|
As of December 31
|
||||
|
|
2017
|
2016
|
|||
|
Certificate
|
9.5
|
%
|
7.7
|
%
|
|
|
Associate’s
|
16.5
|
%
|
18.1
|
%
|
|
|
Bachelor’s
|
50.9
|
%
|
50.9
|
%
|
|
|
Master’s
|
23.1
|
%
|
23.3
|
%
|
|
|
|
100.0
|
%
|
100.0
|
%
|
|
KTP includes Kaplan’s standardized test preparation and new economy skills training programs. KTP revenue declined
5%
in
2017
. Enrollments, excluding the new economy skills training offerings, were up
4%
in
2017
; however, unit prices were generally lower. In comparison to
2016
, KTP operating results improved in
2017
due primarily to operating cost efficiencies. Operating losses for the new economy skills training programs were $16.7 million and
$13.0 million
for
2017
and
2016
, respectively, including restructuring costs incurred in connection with the closing of Dev Bootcamp that was completed in the second half of 2017. Dev Bootcamp made up the majority of KTP’s new economy skills training programs.
Professional (U.S.) includes the domestic professional training and other continuing education businesses. Professional (U.S.) revenues and operating income in 2017 were flat compared to 2016.
Kaplan corporate and other represents unallocated expenses of Kaplan, Inc.’s corporate office, other minor businesses and certain shared activities.
45
Television Broadcasting Division.
On January 17, 2017, the Company closed on its agreement with Nexstar Broadcasting Group, Inc. and Media General, Inc. to acquire WCWJ, a CW affiliate television station in Jacksonville, FL, and WSLS, an NBC affiliate television station in Roanoke, VA, for $60 million in cash and the assumption of certain pension obligations. The Company continues to operate both stations under their current network affiliations.
Revenue at the television broadcasting division increased slightly to
$409.9 million
in 2017, from
$409.7 million
in
2016
. Excluding revenue from the two newly acquired stations, revenue declined 6% due to a $28.7 million decrease in political advertising revenue, $13.1 million in 2016 incremental summer Olympics-related advertising revenue at the Company’s NBC affiliates, lower network revenue and the adverse impact from hurricanes Harvey and Irma in the third quarter of 2017, partially offset by $20.7 million in increased retransmission revenues. As previously disclosed, the Company’s NBC affiliates in Houston and Detroit are operating under a new contract with NBC effective January 1, 2017 that has resulted in a significant increase in network fees in 2017, compared to 2016. Operating income for
2017
was down
31%
to
$139.3 million
, from
$202.9 million
in
2016
due to lower revenues, the significantly higher network fees and increased amortization of intangibles expense.
Operating margin at the television broadcasting division was
34%
in
2017
and
50%
in
2016
.
The Company’s television station ratings remained strong across our markets. On average in the November 2017 ratings period, KPRC in Houston, WDIV in Detroit, KSAT in San Antonio and WJXT in Jacksonville ranked number one in the key 6am, 6pm and late newscasts among target demographic viewers age 25 to 54; WKMG in Orlando ranked number two and WSLS in Roanoke ranked third in key newscasts. WCWJ in Jacksonville demonstrated success with its syndicated programming in daytime and early fringe, ranking number two.
Healthcare.
Graham Healthcare Group (GHG) provides home health and hospice services in three states. In June 2016, the Company acquired the outstanding 20% redeemable noncontrolling interest in Residential Healthcare (Residential). Also in June 2016, Celtic Healthcare (Celtic) and Residential combined their business operations and the Company now owns 90% of the combined entity. The Company incurred approximately $2.0 million in expenses in conjunction with these transactions in the second quarter of 2016. At the end of June 2017, GHG acquired Hometown Home Health and Hospice, a Lapeer, MI-based healthcare services provider. Healthcare revenues increased
5%
in 2017, while operating results were down, due largely to increased bad debt expenses and higher information systems and other integration costs.
In June 2016, Residential and a Michigan hospital formed a joint venture to provide home health services to West Michigan patients. GHG manages the operations of the joint venture and holds a 40% interest. The pro rata operating results of the joint venture are included in the Company’s equity in earnings of affiliates. In connection with this transaction, the Company recorded a pre-tax gain of $3.2 million in the second quarter of 2016 that is included in other income (expense), net.
46
Other Businesses.
A summary of Other Businesses’ operating results for
2017
compared to
2016
is as follows:
|
|
Year Ended December 31
|
%
|
|||||||||
|
(in thousands)
|
2017
|
2016
|
Change
|
||||||||
|
Operating Revenues
|
|
|
|
||||||||
|
Manufacturing
|
$
|
414,193
|
|
$
|
241,604
|
|
71
|
|
|||
|
SocialCode
|
62,077
|
|
58,851
|
|
5
|
|
|||||
|
Other
|
34,733
|
|
26,433
|
|
31
|
|
|||||
|
|
$
|
511,003
|
|
$
|
326,888
|
|
56
|
|
|||
|
Operating Expenses
|
|
|
|
|
|
|
|||||
|
Manufacturing
|
$
|
399,246
|
|
$
|
228,887
|
|
74
|
|
|||
|
SocialCode
|
65,751
|
|
71,258
|
|
(8
|
)
|
|||||
|
Other
|
65,269
|
|
51,644
|
|
26
|
|
|||||
|
|
$
|
530,266
|
|
$
|
351,789
|
|
51
|
|
|||
|
Operating Income (Loss)
|
|
|
|
|
|
|
|||||
|
Manufacturing
|
$
|
14,947
|
|
$
|
12,717
|
|
18
|
|
|||
|
SocialCode
|
(3,674
|
)
|
(12,407
|
)
|
70
|
|
|||||
|
Other
|
(30,536
|
)
|
(25,211
|
)
|
(21
|
)
|
|||||
|
|
$
|
(19,263
|
)
|
$
|
(24,901
|
)
|
23
|
|
|||
|
Depreciation
|
|||||||||||
|
Manufacturing
|
$
|
9,173
|
|
$
|
7,251
|
|
27
|
|
|||
|
SocialCode
|
1,004
|
|
929
|
|
8
|
|
|||||
|
Other
|
1,546
|
|
1,390
|
|
11
|
|
|||||
|
|
$
|
11,723
|
|
$
|
9,570
|
|
22
|
|
|||
|
Amortization of Intangible Assets and Impairment of Goodwill and Other Long-Lived Assets
|
|||||||||||
|
Manufacturing
|
$
|
31,052
|
|
$
|
12,119
|
|
—
|
|
|||
|
SocialCode
|
333
|
|
—
|
|
—
|
|
|||||
|
Other
|
—
|
|
1,687
|
|
—
|
|
|||||
|
|
$
|
31,385
|
|
$
|
13,806
|
|
—
|
|
|||
|
Pension Service Cost
|
|
|
|
|
|
|
|||||
|
Manufacturing
|
$
|
79
|
|
$
|
86
|
|
(8
|
)
|
|||
|
SocialCode
|
593
|
|
541
|
|
10
|
|
|||||
|
Other
|
453
|
|
491
|
|
(8
|
)
|
|||||
|
|
$
|
1,125
|
|
$
|
1,118
|
|
1
|
|
|||
Manufacturing includes four businesses: Dekko, a manufacturer of electrical workspace solutions, architectural lighting and electrical components and assemblies; Joyce/Dayton Corp., a manufacturer of screw jacks and other linear motion systems; Forney, a supplier of products and systems that control and monitor combustion processes in electric utility and industrial applications; and Hoover Treated Wood Products, Inc., a supplier of pressure impregnated kiln-dried lumber and plywood products for fire retardant and preservative applications that the Company acquired in April 2017. In September 2016, Dekko acquired Electri-Cable Assemblies, a manufacturer of power, data and electrical solutions for the office furniture industry.
In the second quarter of 2017, the Company recorded a $9.2 million goodwill and other long-lived asset impairment charge at Forney, due to lower than expected revenues resulting from sluggish overall demand for its energy products. Excluding this impairment charge, manufacturing revenues and operating income increased in 2017 due to the Hoover acquisition and growth and improved results at Dekko, including the Electri-Cable Assemblies acquisition, offset by a decline in results at Forney.
SocialCode is a provider of marketing solutions on social, mobile and video platforms. SocialCode revenue increased
5%
in
2017
, due to continued growth in digital advertising service revenues. SocialCode reported an operating loss of
$3.7 million
in
2017
compared to $12.4 million in 2016. SocialCode’s operating results included incentive accruals of $1.4 million related to phantom equity plans in 2017; whereas 2016 results included incentive accruals of
$12.8 million
related to phantom equity plans. As of December 31,
2017
, the accrual balance related to these plans was
$15.1 million
.
Other businesses also include Slate and Foreign Policy, which publish online and print magazines and websites; and two investment stage businesses, Panoply and CyberVista. Losses from each of these businesses in
2017
adversely affected operating results.
Corporate Office.
Corporate office includes the expenses of the Company’s corporate office and certain continuing obligations related to prior business dispositions. Corporate office expenses increased in
2017
due primarily to higher professional services costs.
47
Equity in Losses of Affiliates.
At
December 31, 2017
the Company held interests in a number of home health and hospice joint ventures, and interests in several other affiliates. During 2017, the Company acquired approximately 11% of Intersection Holdings, LLC, a company that provides digital marketing and advertising services and products for cities, transit systems, airports, and other public and private spaces. The Company recorded equity in losses of affiliates of
$3.2 million
for
2017
, compared to
$7.9 million
in
2016
. In the fourth quarter of 2016, the Company recorded an
$8.4 million
write-down on its investment in HomeHero, a company that managed an online senior home care marketplace.
Net Interest Expense.
The Company incurred net interest expense of
$27.3 million
in
2017
, compared to
$32.3 million
in
2016
. At
December 31, 2017
, the Company had
$493.3 million
in borrowings outstanding at an average interest rate of
6.3%
; at
December 31, 2016
, the Company had
$491.8 million
in borrowings outstanding at an average interest rate of
6.3%
.
Non-Operating Pension and Postretirement Benefit Income, Net.
In the first quarter of 2018, the Company adopted new accounting guidance that changes the income statement classification of net periodic pension and postretirement pension cost. Under the new guidance, service cost is included in operating income, while the other components (including expected return on assets) are included in non-operating income. The new guidance was required to be applied retrospectively, with prior period financial information revised to reflect the reclassification. From a segment reporting perspective, this change had a significant impact on Corporate office reporting, with minimal impact on the television broadcasting, Kaplan corporate and other businesses reporting.
The Company recorded net non-operating pension and postretirement benefit income of
$72.7 million
and
$80.7 million
for
2017
and
2016
, respectively. In the fourth quarter of 2016, the Company recorded an $18.0 million gain related to a bulk lump sum pension program offering.
Other Non-Operating Income (Expense).
The Company recorded total other non-operating income, net, of
$4.2 million
in
2017
, compared to non-operating expense, net, of
$12.6 million
in
2016
.
The
2017
non-operating income, net, included
$3.3 million
in foreign currency gains and other items. The
2016
non-operating expense, net, included
$39.9 million
in foreign currency losses; $29.4 million in cost method investment write-downs; and $1.8 million in net losses on the sales of marketable securities, partially offset by a
$34.1 million
gain on the sale of land; an
$18.9 million
gain on the sale of a business; a
$3.2 million
gain on the Residential joint venture transaction and other items.
(Benefit from) Provision for Income Taxes.
The Company reported an income tax benefit of
$119.7 million
for
2017
, which was significantly impacted by the enactment of the Tax Cuts and Jobs Act in December 2017. Overall, the Company recorded a
$177.5 million
net deferred tax benefit in the fourth quarter of
2017
as a result of enactment of this legislation, due largely to the revaluation of the Company’s U.S. deferred tax assets and liabilities to the lower federal tax rate and a significant reduction in the amount of deferred taxes previously provided on undistributed earnings of investments in non-U.S. subsidiaries. In the first quarter of
2017
, the Company recorded a
$5.9 million
income tax benefit related to the vesting of restricted stock awards in connection with the adoption of a new accounting standard that requires all excess income tax benefits and deficiencies from stock compensation to be recorded as discrete items in the provision for income taxes. Excluding the effect of these items, the effective tax rate for
2017
was
34.9%
.
The Company’s effective tax rate for 2016 was
32.4%
. In the third quarter of 2016, a net nonrecurring
$8.3 million
deferred tax benefit related to Kaplan’s international operations was recorded. In the second quarter of 2016, the Company benefited from a favorable
$5.6 million
out of period deferred tax adjustment related to the KHE goodwill impairment recorded in the third quarter of 2015. Excluding the effect of these items, the effective tax rate in 2016 was
37.9%
.
FINANCIAL CONDITION: CAPITAL RESOURCES AND LIQUIDITY
Acquisitions and Dispositions of Businesses and Other Transactions
Acquisitions.
On January 31, 2019, the Company acquired a 90% interest in two auto dealerships. In addition to a cash payment, a subsidiary of the Company borrowed $30 million to finance the acquisition and entered into an interest rate swap to fix the interest rate on the debt at 4.7% per annum. The Company is required to repay the loan over a 10-year period by making monthly installment payments. The Company also entered into a management services agreement with
Christopher J. Ourisman, a member of the Ourisman Automotive Group family of dealerships,
to operate and manage the acquired dealerships.
During
2018
, the Company acquired
eight
businesses,
five
in its education division,
one
in its healthcare division and
two
in other businesses for
$121.1 million
in cash and contingent consideration. The assets and liabilities of the companies acquired were recorded at their estimated fair values at the date of acquisition.
48
In January and February 2018, Kaplan acquired the assets of i-Human Patients, Inc., a provider of cloud-based, interactive patient encounter simulations for medical and nursing professionals and educators, and another small business in test preparation and international, respectively. These acquisitions are expected to provide strategic benefits in the future.
In May 2018, Kaplan acquired a 100% interest in
PPI
, an independent publisher of professional licensing exam review materials and engineering, surveying, architecture, and interior design licensure exam review, by purchasing all of its issued and outstanding shares. This acquisition is expected to provide certain strategic benefits in the future. This acquisition is included in Professional (U.S.).
On July 12, 2018, Kaplan acquired 100% of the issued and outstanding shares of
CFFP
, a provider of financial education and training to individuals pursuing the Certified Financial Planner certification, a Master of Science in Personal Financial Planning, or a Master of Science in Finance. The acquisition is expected to expand Kaplan’s financial education product offerings and is included in Professional (U.S.).
On July 31, 2018, Dekko acquired 100% of the issued and outstanding shares of Furnlite, Inc., a Fallston, NC-based manufacturer of power and data solutions for the hospitality and residential furniture industries. Dekko’s primary reasons for the acquisition are to complement existing product offerings and to provide potential synergies across the businesses. The acquisition is included in other businesses.
In August 2018, SocialCode acquired 100% of the membership interests of Marketplace Strategy (MPS), a Cleveland-based digital marketing agency that provides strategy consulting, optimization services, advertising management and creative solutions on online marketplaces including Amazon. SocialCode’s primary reason for the acquisition is to expand its platform offerings. The acquisition is included in other businesses.
In September 2018, GHG acquired the assets of a small business and Kaplan acquired the test preparation and study guide assets of Barron’s Educational Series, a New York-based education publishing company. The acquisitions are expected to complement the healthcare and test preparation services currently offered by GHG and Kaplan, respectively. GHG is included in the healthcare division. The Barron’s Educational Series acquisition is included in test preparation.
During
2017
, the Company acquired
six
businesses,
two
in its education division,
two
in its television broadcasting division,
one
in its healthcare division and
one
in other businesses for
$318.9 million
in cash and contingent consideration, and the assumption of
$59.1 million
in certain pension and postretirement obligations. The assets and liabilities of the companies acquired were recorded at their estimated fair values at the date of acquisition.
On January 17, 2017, the Company closed on its agreement with Nexstar Broadcasting Group, Inc. and Media General, Inc. to acquire the assets of WCWJ, a CW affiliate television station in Jacksonville, FL, and WSLS, an NBC affiliate television station in Roanoke, VA, for cash and the assumption of certain pension obligations. The acquisition of WCWJ and WSLS will complement the other stations that GMG operates. Both of these acquisitions are included in television broadcasting.
In February 2017, Kaplan acquired a 100% interest in Genesis Training Institute, a Dubai-based provider of professional development training in the United Arab Emirates, by purchasing all of its issued and outstanding shares. Additionally, Kaplan acquired a 100% interest in Red Marker Pty Ltd., an Australia-based regulatory technology company by purchasing all of its outstanding shares. These acquisitions are expected to provide certain strategic benefits in the future. Both of these acquisitions are included in Kaplan International.
In April 2017, the Company acquired 97.72% of the issued and outstanding shares of Hoover Treated Wood Products, Inc., a Thomson, GA-based supplier of pressure impregnated kiln-dried lumber and plywood products for fire retardant and preservative applications for
$206.8 million
, net of cash acquired. The fair value of the redeemable noncontrolling interest in Hoover was $3.7 million at the acquisition date, determined using a market approach. The minority shareholders have an option to put some of their shares to the Company starting in 2019 and the remaining shares starting in 2021. The Company has an option to buy the shares of minority shareholders starting in 2027. This acquisition is consistent with the Company’s ongoing strategy of investing in companies with a history of profitability and strong management. Hoover is included in other businesses.
At the end of June 2017, GHG acquired a 100% interest in Hometown Home Health and Hospice, a Lapeer, MI-based healthcare services provider by purchasing all of its issued and outstanding shares. This acquisition expands GHG’s service area in Michigan. GHG is included in healthcare.
During 2016, the Company acquired
five
businesses,
three
businesses included in its education division and
two
businesses in other businesses for
$258.0 million
. The assets and liabilities of the companies acquired were recorded at their estimated fair values at the date of acquisition. In January 2016, Kaplan acquired a
100%
interest in Mander Portman Woodward, a provider of high-quality, bespoke education to
United Kingdom (
U.K.
)
and international students in London, Cambridge and Birmingham, by purchasing all of its issued and outstanding
49
shares.
In February 2016, Kaplan acquired a
100%
interest in Osborne Books, an educational publisher of learning resources for accounting qualifications in the U.K., by purchasing all of its issued and outstanding shares.
The primary reason for these acquisitions was based on several strategic benefits expected to be realized in the future.
Both of these acquisitions are included in Kaplan International.
In September 2016, Dekko acquired a
100%
interest in Electri-Cable Assemblies, a Shelton, CT-based manufacturer of power, data and electrical solutions for the office furniture industry, by purchasing all of its issued and outstanding shares.
Dekko’s primary reasons for the acquisition were to complement existing product offerings and provide opportunities for synergies across the businesses.
This acquisition is included in other businesses.
Kaplan University Transaction.
On April 27, 2017, certain subsidiaries of Kaplan entered into a Contribution and Transfer Agreement to contribute the institutional assets and operations of Kaplan University to an Indiana non-profit, public-benefit corporation that is a subsidiary affiliated with Purdue University. The closing of the transactions contemplated by the Transfer Agreement occurred on March 22, 2018. At the same time, the parties entered into the TOSA pursuant to which Kaplan provides key non-academic operations support to the new university.
See information contained under the heading “Education”, which is included in Item 1 of this Annual Report on Form 10-K for more information about this transaction.
As a result of the KU Transaction, the Company recorded a pre-tax gain of $4.3 million in the first quarter of 2018. For financial reporting purposes, Kaplan may receive payment of additional consideration for the sale of the institutional assets as part of the fee to the extent there are sufficient revenues available after paying all amounts required by the TOSA. The Company recorded a $1.9 million contingent consideration gain related to the disposition in the year ended December 31, 2018, and did not adjust the contingent consideration in the fourth quarter of 2018.
Sale of Businesses.
In February 2018, Kaplan completed the sale of a small business which was included in Test Preparation. In September 2018, Kaplan Australia completed the sale of a small business which was included in Kaplan International.
In February 2017, GHG completed the sale of Celtic Healthcare of Maryland. In the fourth quarter of 2017, Kaplan Australia completed the sale of a small business, which was included in Kaplan International.
In January 2016, Kaplan completed the sale of Colloquy, which was included in Kaplan Corporate and Other. As a result of these sales, the Company reported gains (losses) in other non-operating income
.
Other Transactions.
In February 2019, the Company sold its interest in Gimlet Media; the Company will report a gain in the first quarter of 2019.
In June 2018, the Company incurred $6.2 million of interest expense related to the mandatorily redeemable noncontrolling interest redemption settlement at GHG. The mandatorily redeemable noncontrolling interest was redeemed and paid in July 2018.
In June 2016, Residential Healthcare (Residential) and a Michigan hospital formed a joint venture to provide home health services to patients in western Michigan. In connection with this transaction, Residential contributed its western Michigan home health operations to the joint venture and then sold
60%
of the newly formed venture to its Michigan hospital partner. Although Residential manages the operations of the joint venture, Residential holds a
40%
interest in the joint venture, so the operating results of the joint venture are not consolidated, and the pro rata operating results are included in the Company’s equity in earnings of affiliates.
In June 2016, the Company purchased the outstanding
20%
redeemable noncontrolling interest in Residential. At that time, the Company recorded an increase to redeemable noncontrolling interest of
$3.0 million
, with a corresponding decrease to capital in excess of par value, to reflect the redemption value of the redeemable noncontrolling interest at
$24.0 million
. Following this transaction, Celtic Healthcare (Celtic) and Residential combined their business operations to form GHG. The redeemable noncontrolling interest shareholders in Celtic exchanged their
20%
interest in Celtic for a
10%
mandatorily redeemable noncontrolling interest in the combined entity, and the Company recorded a
$4.1 million
net increase to the mandatorily redeemable noncontrolling interest to reflect the estimated fair value of the mandatorily redeemable noncontrolling interest.
Capital Expenditures.
During
2018
, the Company’s capital expenditures totaled
$98.1 million
. The Company’s capital expenditures for
2018
,
2017
and
2016
are disclosed in Note 19 to the Consolidated Financial Statements. These amounts include assets acquired during the year, whereas the amounts reflected in the Company’s Statements of Cash Flows are based on cash payments made during the relevant periods. The Company estimates that its capital expenditures will be in the range of
$95
million to
$105
million in
2019
. This includes amounts for constructing an academic and student residential facility in connection with Kaplan’s Pathways program in Liverpool, U.K. This also includes capital expenditures in connection with spectrum repacking at the Company’s television stations in Detroit, MI, Jacksonville, FL, and Roanoke, VA, as mandated by the FCC; these expenditures are expected to be largely reimbursed to the Company by the FCC.
50
Investments in Marketable Equity Securities.
At
December 31, 2018
, the fair value of the Company’s investments in marketable equity securities was
$496.4 million
, which includes investments in the common stock of
six
publicly traded companies. At
December 31, 2018
, the net unrealized gain related to the Company’s investments totaled
$213.8 million
.
Common Stock Repurchases and Dividend Rate.
During
2018
,
2017
, and
2016
, the Company purchased a total of
199,023
,
88,361
, and
229,498
shares, respectively, of its Class B common stock at a cost of approximately
$118.0 million
,
$50.8 million
, and
$108.9 million
, respectively. On November 9, 2017, the Board of Directors authorized the Company to acquire up to
500,000
shares of its Class B common stock. The Company did not announce a ceiling price or time limit for the purchases. The authorization included
163,237
shares that remained under the previous authorization. At December 31,
2018
, the Company had remaining authorization from the Board of Directors to purchase up to
273,655
shares of Class B common stock.
The annual dividend rate for
2019
is
$5.56
per share, compared to
$5.32
and
$5.08
in
2018
and
2017
, respectively.
Liquidity.
During
2018
, the Company’s cash and cash equivalents decreased by
$136.8 million
due largely to significant acquisitions, investments, and repurchases of common shares. During
2018
, the Company’s borrowings decreased by
$16.2 million
due to repayments, additional unamortized debt issuance costs, and foreign currency fluctuations.
At
December 31, 2018
, the Company has
$253.3 million
in cash and cash equivalents, compared to
$390.0 million
at
December 31, 2017
. Restricted cash at
December 31, 2018
, totaled
$10.9 million
, compared to
$17.6 million
at
December 31, 2017
. As of
December 31, 2018
and
2017
, the Company had money market investments of
$75.5 million
and
$217.6 million
, respectively, that are classified as cash, cash equivalents and restricted cash in the Company’s Consolidated Financial Statements. At
December 31, 2018
, the Company held approximately $152 million in cash and cash equivalents in businesses domiciled outside the U.S., of which approximately
$6 million
is not available for immediate use in operations or for distribution. Additionally, Kaplan’s business operations outside the U.S. retain cash balances to support ongoing working capital requirements, capital expenditures, and regulatory requirements. As a result, the Company considers a significant portion of the cash and cash equivalents balance held outside the U.S. as not readily available for use in U.S. operations.
At
December 31, 2018
and
2017
, the Company had borrowings outstanding of
$477.1 million
and
$493.3 million
, respectively. The Company’s borrowings at
December 31, 2018
were mostly from
$400.0 million
of
5.75%
unsecured notes due June 1, 2026, and £65 million in outstanding borrowings under the Kaplan Credit Agreement; the interest on
$400.0 million
of
5.75%
unsecured notes is payable semiannually on June 1 and December 1. The Company’s borrowings at
December 31, 2017
were mostly from
$400.0 million
of
7.25%
unsecured notes due February 1, 2019, and £70 million in outstanding borrowings under the Kaplan Credit Agreement. The Company did not have any outstanding commercial paper borrowing or revolving credit borrowing as of
December 31, 2018
and
2017
.
On May 30, 2018, the Company issued
$400 million
senior unsecured fixed-rate notes due June 1, 2026 (the Notes). The Notes are guaranteed, jointly and severally, on a senior unsecured basis, by certain of the Company’s existing and future domestic subsidiaries, as described in the terms of the indenture, dated as of May 30, 2018 (the Indenture). The Notes have a coupon rate of
5.75%
per annum, payable semi-annually on June 1 and December 1. The Company may redeem the Notes in whole or in part at any time at the respective redemption prices described in the Indenture.
On June 29, 2018, the Company used the net proceeds from the sale of the Notes, together with cash on hand, to redeem the
$400 million
of
7.25%
notes due February 1, 2019. The Company incurred
$11.4 million
in debt extinguishment costs in relation to the early termination of the 7.25% notes.
In combination with the issuance of the Notes, the Company and certain of the Company’s domestic subsidiaries named therein as guarantors entered into an amended and restated credit agreement providing for a U.S.
$300 million
five
-year revolving credit facility (the Revolving Credit Facility) with each of the lenders party thereto, certain of the Company’s foreign subsidiaries from time to time party thereto as foreign borrowers, Wells Fargo Bank, N.A., as Administrative Agent (Wells Fargo), JPMorgan Chase Bank, N.A., as Syndication Agent, and HSBC Bank USA, N.A. and Bank of America, N.A. as Documentation Agents (the Amended and Restated Credit Agreement), which amends and restates the Company’s existing Five Year Credit Agreement, dated as of June 29, 2015, among the Company, certain of its domestic subsidiaries as guarantors, the several lenders from time to time party thereto, Wells Fargo Bank, N.A., as Administrative Agent and JPMorgan Chase Bank, N.A., as Syndication Agent (the Existing Credit Agreement). The Amended and Restated Credit Agreement amends the Existing Credit Agreement to (i) extend the maturity of the Revolving Credit Facility to May 30, 2023, unless the Company and the lenders agree to further extend the term, (ii) increase the aggregate principal amount of the Revolving Credit Facility to U.S.
$300 million
, consisting of a U.S. Dollar tranche of U.S.
$200 million
for borrowings in U.S. Dollars and a multicurrency tranche equivalent to U.S.
$100 million
for borrowings in U.S. Dollars and certain foreign currencies,
51
(iii) provide for borrowings under the Revolving Credit Facility in U.S. Dollars and certain other foreign currencies specified in the Amended and Restated Credit Agreement, (iv) permit certain foreign subsidiaries of the Company to be added to the Amended and Restated Credit Agreement as foreign borrowers thereunder and (v) effect certain other modifications to the Existing Credit Agreement.
Under the Amended and Restated Credit Agreement, the Company is required to pay a commitment fee on a quarterly basis, based on the Company’s leverage ratio, of between
0.15%
and
0.25%
of the amount of the average daily unused portion of the Revolving Credit Facility. Any borrowings under the Amended and Restated Credit Agreement are made on an unsecured basis and bear interest at the Company’s option, either at (a) a fluctuating interest rate equal to the highest of Wells Fargo’s prime rate,
0.5
percent above the Federal funds rate or the one-month Eurodollar rate plus
1%
, or (b) the Eurodollar rate for the applicable currency and interest period as defined in the Amended and Restated Credit Agreement, which is generally a periodic rate equal to LIBOR, CDOR, BBSY or SOR, as applicable, in the case of each of clauses (a) and (b) plus an applicable margin that depends on the Company’s consolidated debt to consolidated adjusted EBITDA (as determined pursuant to the Amended and Restated Credit Agreement, Total Net Leverage Ratio). The Company and its foreign subsidiaries may draw on the Revolving Credit Facility for general corporate purposes. Any outstanding borrowings must be repaid on or prior to the final termination date. The Amended and Restated Credit Agreement contains terms and conditions, including remedies in the event of a default by the Company, typical of facilities of this type and requires the Company to maintain a Total Net Leverage Ratio of not greater than
3.5
to 1.0 and a consolidated interest coverage ratio of at least
3.5
to 1.0 based upon the ratio of consolidated adjusted EBITDA to consolidated interest expense as determined pursuant to the Amended and Restated Credit Agreement.
On July 14, 2016, Kaplan entered into a credit agreement (the Kaplan Credit Agreement) among Kaplan International Holdings Limited, as borrower, the lenders party thereto, HSBC BANK PLC as Facility Agent, and other agents party thereto. The Kaplan Credit Agreement provides for a four-year credit facility in an aggregate principal amount of
£75 million
. Borrowings bear interest at a rate per annum of LIBOR plus an applicable interest rate margin between
1.25%
and
1.75%
, in each case determined on a quarterly basis by reference to a pricing grid based upon the Company’s total leverage ratio. The Kaplan Credit Agreement requires that
6.66%
of the amount of the loan be repaid on the first three anniversaries of funding, with the remaining balance due on July 1, 2020. The Kaplan Credit Agreement contains terms and conditions, including remedies in the event of a default by the Company, typical of facilities of this type and requires the Company to maintain a leverage ratio of not greater than
3.5
to 1.0 and a consolidated interest coverage ratio of at least
3.5
to 1.0 based upon the ratio of consolidated adjusted EBITDA to consolidated interest expense as determined pursuant to the Kaplan Credit Agreement.
On July 25, 2016, Kaplan borrowed
£75 million
under the Kaplan Credit Agreement. On the same date, Kaplan entered into an interest rate swap agreement with a total notional value of
£75 million
and a maturity date of July 1, 2020. The interest rate swap agreement will pay Kaplan variable interest on the
£75 million
notional amount at the three-month LIBOR, and Kaplan will pay the counterparties a fixed rate of
0.51%
,
effectively resulting in a total fixed interest rate of
2.01%
on the outstanding borrowings at the current applicable margin of
1.50%
. The interest rate swap agreement was entered into to convert the variable rate British pound borrowing under the Kaplan Credit Agreement into a fixed rate borrowing. The Company provided a guarantee on any borrowings under the Kaplan Credit Agreement. Based on the terms of the interest rate swap agreement and the underlying borrowing, the interest rate swap agreement was determined to be effective and thus qualifies as a cash flow hedge. As such, changes in the fair value of the interest rate swap are recorded in other comprehensive income on the accompanying Consolidated Balance Sheets until earnings are affected by the variability of cash flows.
On May 21, 2018, Moody’s affirmed the Company’s credit ratings, but revised the outlook from Negative to Stable.
The Company’s current credit ratings are as follows:
|
Moody’s
|
Standard & Poor’s
|
||
|
Long-term
|
Ba1
|
BB+
|
|
During
2018
and
2017
, the Company had average borrowings outstanding of approximately
$517.2 million
and
$493.2 million
, respectively, at average annual interest rates of approximately
5.6%
and
6.3%
, respectively. The Company incurred net interest expense of
$32.5 million
and
$27.3 million
, respectively, during
2018
and
2017
.
At
December 31, 2018
and
2017
, the Company had working capital of
$720.2 million
and
$857.2 million
, respectively. The Company maintains working capital levels consistent with its underlying business requirements and consistently generates cash from operations in excess of required interest or principal payments.
The Company’s net cash provided by operating activities, as reported in the Company’s Consolidated Statements of Cash Flows, was
$287.0 million
in
2018
, compared to
$268.1 million
in
2017
.
In July 2016, Kaplan International Holdings Limited (KIHL) entered into an agreement with University of York International Pathway College LLP (York International College) to loan York International College
£25 million
over
52
the next 18 months, to construct an academic building in the U.K. to be used by York International College. York International College is a limited liability partnership joint venture between Kaplan York Limited (a subsidiary of Kaplan International Colleges U.K. Limited) and a subsidiary of the University of York, that operates a pathways college; KIHL holds a 45% interest in the joint venture. The loan will be repayable over 25 years at an interest rate of 7%, and the loan is guaranteed by the University of York. While there is no strict requirement to make annual principal and interest payments, interest will be rolled up and accrue interest at 7% if no such payments are made. The loan becomes due and payable if the partnership agreement with KIHL is terminated. As of December 31, 2017, KIHL advanced approximately
£16 million
to York International College. In the second quarter of 2018, KIHL advanced a final amount of
£6 million
in additional funding to the joint venture under this agreement, bringing the total amount advanced to
£22 million
.
The Company expects to fund its estimated capital needs primarily through existing cash balances and internally generated funds and, to a lesser extent, borrowings under its revolving credit facility. In management’s opinion, the Company will have ample liquidity to meet its various cash needs in
2019
.
The following reflects a summary of the Company’s contractual obligations as of
December 31, 2018
:
|
(in thousands)
|
2019
|
2020
|
2021
|
2022
|
2023
|
Thereafter
|
Total
|
||||||||||||||||||||
|
Debt and interest
|
$
|
30,957
|
|
$
|
100,028
|
|
$
|
23,014
|
|
$
|
23,015
|
|
$
|
23,015
|
|
$
|
457,531
|
|
$
|
657,560
|
|
||||||
|
Operating leases
|
101,009
|
|
84,945
|
|
72,031
|
|
53,709
|
|
47,091
|
|
115,948
|
|
474,733
|
|
|||||||||||||
|
Programming purchase commitments
(1)
|
9,116
|
|
6,041
|
|
452
|
|
297
|
|
157
|
|
—
|
|
16,063
|
|
|||||||||||||
|
Other purchase obligations
(2)
|
72,245
|
|
28,154
|
|
13,347
|
|
4,844
|
|
2,034
|
|
1,424
|
|
122,048
|
|
|||||||||||||
|
Long-term liabilities
(3)
|
3,692
|
|
3,497
|
|
3,297
|
|
3,211
|
|
3,013
|
|
16,986
|
|
33,696
|
|
|||||||||||||
|
Total
|
$
|
217,019
|
|
$
|
222,665
|
|
$
|
112,141
|
|
$
|
85,076
|
|
$
|
75,310
|
|
$
|
591,889
|
|
$
|
1,304,100
|
|
||||||
___________________
|
(1)
|
Includes commitments for the Company’s television broadcasting business that are reflected in the Company’s Consolidated Financial Statements and commitments to purchase programming to be produced in future years.
|
|
(2)
|
Includes purchase obligations related to employment agreements, capital projects and other legally binding commitments. Other purchase orders made in the ordinary course of business are excluded from the table above. Any amounts for which the Company is liable under purchase orders are reflected in the Company’s Consolidated Balance Sheets as accounts payable and accrued liabilities.
|
|
(3)
|
Primarily made up of multiemployer pension plan withdrawal obligations and postretirement benefit obligations other than pensions. The Company has other long-term liabilities excluded from the table above, including obligations for deferred compensation, long-term incentive plans and long-term deferred revenue.
|
Other.
The Company does not have any off-balance-sheet arrangements or financing activities with special-purpose entities (SPEs).
CRITICAL ACCOUNTING POLICIES AND ESTIMATES
The preparation of financial statements in conformity with generally accepted accounting principles requires management to make estimates and judgments that affect the amounts reported in the financial statements. On an ongoing basis, the Company evaluates its estimates and assumptions. The Company bases its estimates on historical experience and other assumptions believed to be reasonable under the circumstances, the results of which form the basis for making judgments about the carrying value of assets and liabilities that are not readily apparent from other sources. Actual results could differ from these estimates.
An accounting policy is considered to be critical if it is important to the Company’s financial condition and results and if it requires management’s most difficult, subjective and complex judgments in its application. For a summary of all of the Company’s significant accounting policies, see Note 2 to the Company’s Consolidated Financial Statements.
Revenue Recognition, Trade Accounts Receivable and Allowance for Doubtful Accounts.
Education revenue is primarily derived from postsecondary education services, professional education and test preparation services. Revenue, net of any refunds, corporate discounts, scholarships and employee tuition discounts is recognized ratably over the instruction period or access period for higher education, professional education and test preparation services.
At Kaplan International and KTP, estimates of average student course length are developed for each course, along with estimates for the anticipated level of student drops and refunds from test performance guarantees, and these estimates are evaluated on an ongoing basis and adjusted as necessary. As Kaplan’s businesses and related course offerings have changed, including more online programs, the complexity and significance of management’s estimates have increased.
KHE provides non-academic operations support services to Purdue University Global pursuant to a Transition and Operations Support Agreement (TOSA), which includes technology support, help-desk functions, human resources support for faculty and employees, admissions support, financial aid administration, marketing and advertising, back-office business functions, and certain student recruitment services. KHE is not entitled to receive any reimbursement of costs incurred in providing support services, or any service fee, unless and until Purdue University Global has first covered all of its operating costs (subject to a cap), received payment for cost
53
efficiencies, if any, and during the first five years of the TOSA receive a priority payment of $10 million per year in addition to the operating cost reimbursements and cost efficiency payments. KHE will receive reimbursement for its operating costs of providing the support services after payment of Purdue University Global’s operating costs, cost efficiency payments, and priority payment. If there are sufficient revenues, KHE may be entitled to a cost efficiency payment, if any, and an additional service fee equal to 12.5% of Purdue University Global’s revenue. Subject to certain limitations, a portion of the service fee that is earned by KHE in one year may be carried over to subsequent years for payment to Kaplan.
The support services fee and reimbursement for KHE support costs are entirely dependent on the availability of cash at the end of Purdue University Global’s fiscal year (June 30), and therefore, all consideration in the contract is variable. The Company uses significant judgment to forecast the operating results of Purdue University Global, the availability of cash at the end of each fiscal year, and the consideration it expects to receive from Purdue University Global annually. Key assumptions used in the forecast model include student census and degree enrollment data, Purdue University Global and KHE expenses, changes to working capital, contractually stipulated minimum payments, and lead conversion rates. The forecast is updated as uncertainties are resolved. The Company reviews and updates the assumptions regularly, as a significant change in one or more of these estimates could affect revenue recognized. Changes to the estimated variable consideration were not material for the year ended December 31, 2018.
The determination of whether revenue should be reported on a gross or net basis is based on an assessment of whether the Company acts as a principal or an agent in the transaction. In certain cases, the Company is considered the agent, and the Company records revenue equal to the net amount retained when the fee is earned. In these cases, costs incurred with third-party suppliers is excluded from the Company’s revenue. The Company assesses whether it obtained control of the specified goods or services before they are transferred to the customer as part of this assessment. In addition, the Company considers other indicators such as the party primarily responsible for fulfillment, inventory risk and discretion in establishing price.
Accounts receivable have been reduced by an allowance for amounts that may be uncollectible in the future. This estimated allowance is based primarily on the aging category, historical collection experience and management’s evaluation of the financial condition of the customer. The Company generally considers an account past due or delinquent when a student or customer misses a scheduled payment. The Company writes off accounts receivable balances deemed uncollectible against the allowance for doubtful accounts following the passage of a certain period of time, or generally when the account is turned over for collection to an outside collection agency.
Goodwill and Other Intangible Assets.
The Company has a significant amount of goodwill and indefinite-lived intangible assets that are reviewed at least annually for possible impairment.
|
|
As of December 31
|
||||||
|
(in millions)
|
2018
|
2017
|
|||||
|
Goodwill and indefinite-lived intangible assets
|
$
|
1,396.8
|
|
$
|
1,401.9
|
|
|
|
Total assets
|
$
|
4,764.0
|
|
$
|
4,937.8
|
|
|
|
Percentage of goodwill and indefinite-lived intangible assets to total assets
|
29
|
%
|
28
|
%
|
|||
The Company performs its annual goodwill and intangible assets impairment test as of November 30. Goodwill and other intangible assets are reviewed for possible impairment between annual tests if an event occurred or circumstances changed that would more likely than not reduce the fair value of the reporting unit or other intangible assets below its carrying value.
Goodwill
The Company tests its goodwill at the reporting unit level, which is an operating segment or one level below an operating segment. The Company initially performs an assessment of qualitative factors to determine if it is necessary to perform a quantitative goodwill impairment test. The Company quantitatively tests goodwill for impairment if, based on its assessment of the qualitative factors, it determines that it is more likely than not that the fair value of a reporting unit is less than its carrying amount, or if it decides to bypass the qualitative assessment. The quantitative goodwill impairment test compares the estimated fair value of a reporting unit with its carrying amount, including goodwill. An impairment charge is recognized for the amount by which the carrying amount exceeds the reporting unit’s fair value.
54
The Company had 15 reporting units as of
December 31, 2018
. The reporting units with significant goodwill balances as of
December 31, 2018
, were as follows, representing
89%
of the total goodwill of the Company:
|
(in millions)
|
Goodwill
|
||
|
Education
|
|
||
|
Kaplan international
|
$
|
583.4
|
|
|
Higher education
|
63.2
|
|
|
|
Test preparation
|
64.7
|
|
|
|
Professional (U.S.)
|
86.2
|
|
|
|
Television broadcasting
|
190.8
|
|
|
|
Healthcare
|
69.6
|
|
|
|
Hoover
|
91.3
|
|
|
|
Total
|
$
|
1,149.2
|
|
As of November 30,
2018
, in connection with the Company’s annual impairment testing, the Company decided to perform the quantitative goodwill impairment process at all of the reporting units. The Company’s policy requires the performance of a quantitative impairment review of the goodwill at least once every three years. The Company used a discounted cash flow model, and, where appropriate, a market value approach was also utilized to supplement the discounted cash flow model to determine the estimated fair value of its reporting units. The Company made estimates and assumptions regarding future cash flows, discount rates, long-term growth rates and market values to determine each reporting unit’s estimated fair value. The methodology used to estimate the fair value of the Company’s reporting units on November 30,
2018
, was consistent with the one used during the
2017
annual goodwill impairment test.
The Company made changes to certain of its assumptions utilized in the discounted cash flow models for
2018
compared with the prior year to take into account changes in the economic environment, regulations and their impact on the Company’s businesses. The key assumptions used by the Company were as follows:
|
•
|
Expected cash flows underlying the Company’s business plans for the periods
2019
through
2023
were used. The expected cash flows took into account historical growth rates, the effect of the changed economic outlook at the Company’s businesses, industry challenges and an estimate for the possible impact of any applicable regulations.
|
|
•
|
Cash flows beyond
2023
were projected to grow at a long-term growth rate, which the Company estimated between 1.5% and 3% for each reporting unit.
|
|
•
|
The Company used a discount rate of 9.5% to 21.5% to risk adjust the cash flow projections in determining the estimated fair value.
|
The fair value of each of the reporting units exceeded its respective carrying value as of November 30,
2018
.
The estimated fair value of three reporting units at the manufacturing businesses exceeded their respective carrying values by a margin less than 25% following a decrease in their estimated fair values compared with the prior year. The total goodwill at these three reporting units was $223.9 million as of December 31, 2018, or 17% of the total goodwill of the Company. There exists a reasonable possibility that a decrease in the assumed projected cash flows or long-term growth rate, or an increase in the discount rate assumption used in the discounted cash flow model of these reporting units, could result in an impairment charge.
The estimated fair value of the Company’s other reporting units with significant goodwill balances exceeded their respective carrying values by a margin in excess of
25%
. It is possible that impairment charges could occur in the future, given changes in market conditions and the inherent variability in projecting future operating performance.
Indefinite-Lived Intangible Assets
The Company initially assesses qualitative factors to determine if it is more likely than not that the fair value of its indefinite-lived intangible assets is less than its carrying value. The Company compares the fair value of the indefinite-lived intangible asset with its carrying value if the qualitative factors indicate it is more likely than not that the fair value of the asset is less than its carrying value or if it decides to bypass the qualitative assessment. The Company records an impairment loss if the carrying value of the indefinite-lived intangible assets exceeds the fair value of the assets for the difference in the values. The Company uses a discounted cash flow model, and, in certain cases, a market value approach is also utilized to supplement the discounted cash flow model to determine the estimated fair value of the indefinite-lived intangible assets. The Company makes estimates and assumptions regarding future cash flows, discount rates, long-term growth rates and other market values to determine the estimated fair value of the indefinite-lived intangible assets. The Company’s policy requires the performance of a quantitative impairment review of the indefinite-lived intangible assets at least once every three years.
55
The Company’s intangible assets with an indefinite life are principally from trade names and FCC licenses. The fair value of each indefinite-lived intangible asset exceeded its respective carrying value as of November 30,
2018
. There is always a possibility that impairment charges could occur in the future, given the inherent variability in projecting future operating performance.
Pension Costs.
The Company sponsors a defined benefit pension plan for eligible employees in the U.S. Excluding curtailment gains, settlement gains and special termination benefits, the Company’s net pension credit was
$74.0 million
,
$59.0 million
and
$49.1 million
for
2018
,
2017
and
2016
, respectively. The Company’s pension benefit obligation and related credits are actuarially determined and are impacted significantly by the Company’s assumptions related to future events, including the discount rate, expected return on plan assets and rate of compensation increases. The Company evaluates these critical assumptions at least annually and, periodically, evaluates other assumptions involving demographic factors, such as retirement age, mortality and turnover, and updates them to reflect its experience and expectations for the future. Actual results in any given year will often differ from actuarial assumptions because of economic and other factors.
The Company assumed a
6.25%
expected return on plan assets for
2018
and
2017
, which was a change from the 6.5% expected return assumption for
2016
. The Company’s actual (loss) return on plan assets was (2.5)% in
2018
, 19.2% in
2017
and
(2.0)%
in
2016
. The 10-year and 20-year actual returns on plan assets on an annual basis were 11.6% and 7.2%, respectively.
Accumulated and projected benefit obligations are measured as the present value of future cash payments. The Company discounts those cash payments using the weighted average of market-observed yields for high-quality fixed-income securities with maturities that correspond to the payment of benefits. Lower discount rates increase present values and generally increase subsequent-year pension costs; higher discount rates decrease present values and decrease subsequent-year pension costs. The Company’s discount rate at
December 31, 2018
,
2017
and
2016
, was
4.3%
,
3.6%
and
4.1%
, respectively, reflecting market interest rates.
Changes in key assumptions for the Company’s pension plan would have had the following effects on the
2018
pension credit, excluding curtailment gains, settlement gains and special termination benefits:
|
•
|
Expected return on assets – A
1%
increase or decrease to the Company’s assumed expected return on plan assets would have increased or decreased the pension credit by approximately $20.8 million.
|
|
•
|
Discount rate – A
1%
decrease to the Company’s assumed discount rate would have decreased the pension credit by approximately $2.4 million. A
1%
increase to the Company’s assumed discount rate would have decreased the pension credit by approximately $24.6 million.
|
The Company’s net pension credit includes an expected return on plan assets component, calculated using the expected return on plan assets assumption applied to a market-related value of plan assets. The market-related value of plan assets is determined using a five-year average market value method, which recognizes realized and unrealized appreciation and depreciation in market values over a five-year period. The value resulting from applying this method is adjusted, if necessary, such that it cannot be less than
80%
or more than
120%
of the market value of plan assets as of the relevant measurement date. As a result, year-to-year increases or decreases in the market-related value of plan assets impact the return on plan assets component of pension credit for the year.
At the end of each year, differences between the actual return on plan assets and the expected return on plan assets are combined with other differences in actual versus expected experience to form a net unamortized actuarial gain or loss in accumulated other comprehensive income. Only those net actuarial gains or losses in excess of the deferred realized and unrealized appreciation and depreciation are potentially subject to amortization.
The types of items that generate actuarial gains and losses that may be subject to amortization in net periodic pension (credit) cost include the following:
|
•
|
Asset returns that are more or less than the expected return on plan assets for the year;
|
|
•
|
Actual participant demographic experience different from assumed (retirements, terminations and deaths during the year);
|
|
•
|
Actual salary increases different from assumed; and
|
|
•
|
Any changes in assumptions that are made to better reflect anticipated experience of the plan or to reflect current market conditions on the measurement date (discount rate, longevity increases, changes in expected participant behavior and expected return on plan assets).
|
Amortization of the unrecognized actuarial gain or loss is included as a component of pension credit for a year if the magnitude of the net unamortized gain or loss in accumulated other comprehensive income exceeds 10% of the
56
greater of the benefit obligation or the market-related value of assets (
10%
corridor). The amortization component is equal to that excess divided by the average remaining service period of active employees expected to receive benefits under the plan. At the end of 2015, the Company had no net unamortized actuarial gains or losses in accumulated other comprehensive income subject to amortization outside the 10% corridor, and therefore, no amortized gain or loss amounts were included in the pension credit for 2016.
During 2016, there was a decrease in the discount rate and pension asset losses that resulted in unamortized gains in accumulated other comprehensive income subject to amortization outside the corridor, and therefore, an amortized gain of $4.4 million was included in the pension credit for 2017.
During 2017, there were pension asset gains offset by a further decrease in the discount rate that resulted in unamortized gains in accumulated other comprehensive income subject to amortization outside the corridor, and therefore, an amortized gain of $1.0 million was included in the pension credit for the first three months of 2018.
As a result of the Kaplan University transaction, the Company remeasured the accumulated and projected benefit obligations as of March 22, 2018, and recorded a curtailment gain. During the first three months there was an increase in the discount rate offset by pension assets losses that resulted in net unamortized actuarial gains in accumulated other comprehensive income subject to amortization outside the corridor, and therefore, an amortized gain of $9.0 million was included in the pension credit for the last nine months of 2018. During the last nine months of 2018, there were significant pension asset losses offset by a further increase in the discount rate; however, the Company currently estimates that there will be net unamortized gains in accumulated other comprehensive income subject to amortization outside the corridor, and therefore, an amortized gain amount of $0.2 million is included in the estimated pension credit for 2019.
Overall, the Company estimates that it will record a net pension credit of approximately $54 million in
2019
.
Note 14 to the Company’s Consolidated Financial Statements provides additional details surrounding pension costs and related assumptions.
Accounting for Income Taxes.
Valuation Allowances
Deferred income taxes arise from temporary differences between the tax and financial statement recognition of assets and liabilities. In evaluating its ability to recover deferred tax assets within the jurisdiction from which they arise, the Company considers all available positive and negative evidence, including scheduled reversals of deferred tax liabilities, projected future taxable income, tax planning strategies and recent financial operations. These assumptions require significant judgment about forecasts of future taxable income.
As of
December 31, 2018
, the Company had state income tax net operating loss carryforwards of
$698.9 million
, which will expire at various future dates. Also at
December 31, 2018
, the Company had
$58.1 million
of non-U.S. income tax loss carryforwards, of which
$46.8 million
may be carried forward indefinitely;
$8.4 million
of losses that, if unutilized, will expire in varying amounts through
2023
; and
$2.9 million
of losses that, if unutilized, will start to expire after
2023
. At
December 31, 2018
, the Company has established approximately
$33.1 million
in valuation allowances against deferred state tax assets, net of U.S. Federal income taxes, and non-U.S. deferred tax assets, as the Company believes that it is more likely than not that the benefit from certain state and non-U.S. net operating loss carryforwards and other deferred tax assets will not be realized. The Company has established valuation allowances against state income tax benefits recognized, without considering potentially offsetting deferred tax liabilities established with respect to prepaid pension cost and goodwill. Prepaid pension cost and goodwill have not been considered a source of future taxable income for realizing deferred tax benefits recognized since these temporary differences are not likely to reverse in the foreseeable future. The valuation allowances established against state and non-U.S. income tax benefits recorded may increase or decrease within the next 12 months, based on operating results, the market value of investment holdings or business and tax planning strategies; as a result, the Company is unable to estimate the potential tax impact, given the uncertain operating and market environment. The Company will be monitoring future operating results and projected future operating results on a quarterly basis to determine whether the valuation allowances provided against state and non-U.S. deferred tax assets should be increased or decreased, as future circumstances warrant. The Company’s education division released valuation allowances against state deferred tax assets of
$20.0 million
during 2018, as the education division recently generated positive operating results that support the realization of these deferred tax assets.
Uncertain Tax Positions
The Company recognizes a tax benefit from an uncertain tax position when it is more likely than not that the position will be sustained upon examination, including resolutions of any related to appeals or litigation processes based on the technical merits. The Company records a liability for the difference between the benefit recognized and measured for financial statement purposes and the tax position taken or expected to be taken on the
57
Company’s tax return. Changes in the estimate are recorded in the period in which such termination is made. The Company expects that a
$2.5 million
state tax benefit, net of
$0.5 million
federal tax expense, will reduce the effective tax rate in the future if recognized.
The Company classifies interest and penalties related to uncertain tax positions as a component of interest and other expenses, respectively. As of December 31, 2018, the Company has accrued
$0.6 million
of interest related to the unrecognized tax benefits. The Company has not accrued any penalties related to the unrecognized tax benefits.
Tax Cuts and Jobs Act
The Tax Cuts and Jobs Act (the Tax Act) was enacted on December 22, 2017, making significant changes to the Internal Revenue Code. In accordance with SEC Staff Accounting Bulletin No. 118 (SAB 118), the Company finalized its analysis of the Tax Act and no material adjustments were made to previously recorded provision amounts in the Consolidated Financial Statements for the year ended
December 31, 2018
.
Recent Accounting Pronouncements.
See Note 2 to the Company’s Consolidated Financial Statements for a discussion of recent accounting pronouncements.
58
REPORT OF INDEPENDENT REGISTERED PUBLIC ACCOUNTING FIRM
To the Board of Directors and
Stockholders of Graham Holdings Company
Opinions on the Financial Statements and Internal Control over Financial Reporting
We have audited the accompanying consolidated balance sheets of Graham Holdings Company and its subsidiaries (the “Company”) as of December 31, 2018 and 2017, and the related consolidated statements of operations, comprehensive income (loss), changes in common stockholders’ equity and cash flows for each of the three years in the period ended December 31, 2018, including the related notes (collectively referred to as the “consolidated financial statements”). We also have audited the Company's internal control over financial reporting as of December 31, 2018, based on criteria established in
Internal Control - Integrated Framework
(2013) issued by the Committee of Sponsoring Organizations of the Treadway Commission (COSO).
In our opinion, the consolidated financial statements referred to above present fairly, in all material respects, the financial position of the Company as of December 31, 2018 and 2017, and the results of its operations and its cash flows for each of the three years in the period ended December 31, 2018 in conformity with accounting principles generally accepted in the United States of America. Also in our opinion, the Company maintained, in all material respects, effective internal control over financial reporting as of December 31, 2018, based on criteria established in
Internal Control - Integrated Framework
(2013) issued by the COSO.
Change in Accounting Principles
As discussed in Note 2 to the consolidated financial statements, the Company changed the manner in which it accounts for revenue from contracts with customers and the manner in which it accounts for pension and postretirement benefit costs in 2018.
Basis for Opinions
The Company's management is responsible for these consolidated financial statements, for maintaining effective internal control over financial reporting, and for its assessment of the effectiveness of internal control over financial reporting, included in Management’s Report on Internal Control Over Financial Reporting appearing under Item 9A. Our responsibility is to express opinions on the Company’s consolidated financial statements and on the Company's internal control over financial reporting based on our audits. We are a public accounting firm registered with the Public Company Accounting Oversight Board (United States) (PCAOB) and are required to be independent with respect to the Company in accordance with the U.S. federal securities laws and the applicable rules and regulations of the Securities and Exchange Commission and the PCAOB.
We conducted our audits in accordance with the standards of the PCAOB. Those standards require that we plan and perform the audits to obtain reasonable assurance about whether the consolidated financial statements are free of material misstatement, whether due to error or fraud, and whether effective internal control over financial reporting was maintained in all material respects.
Our audits of the consolidated financial statements included performing procedures to assess the risks of material misstatement of the consolidated financial statements, whether due to error or fraud, and performing procedures that respond to those risks. Such procedures included examining, on a test basis, evidence regarding the amounts and disclosures in the consolidated financial statements. Our audits also included evaluating the accounting principles used and significant estimates made by management, as well as evaluating the overall presentation of the consolidated financial statements. Our audit of internal control over financial reporting included obtaining an understanding of internal control over financial reporting, assessing the risk that a material weakness exists, and testing and evaluating the design and operating effectiveness of internal control based on the assessed risk. Our audits also included performing such other procedures as we considered necessary in the circumstances. We believe that our audits provide a reasonable basis for our opinions.
Definition and Limitations of Internal Control over Financial Reporting
A company’s internal control over financial reporting is a process designed to provide reasonable assurance regarding the reliability of financial reporting and the preparation of financial statements for external purposes in accordance with generally accepted accounting principles. A company’s internal control over financial reporting includes those policies and procedures that (i) pertain to the maintenance of records that, in reasonable detail, accurately and fairly reflect the transactions and dispositions of the assets of the company; (ii) provide reasonable assurance that transactions are recorded as necessary to permit preparation of financial statements in accordance with generally accepted accounting principles, and that receipts and expenditures of the company are being made only in accordance with authorizations of management and directors of the company; and (iii) provide reasonable
59
assurance regarding prevention or timely detection of unauthorized acquisition, use, or disposition of the company’s assets that could have a material effect on the financial statements.
Because of its inherent limitations, internal control over financial reporting may not prevent or detect misstatements. Also, projections of any evaluation of effectiveness to future periods are subject to the risk that controls may become inadequate because of changes in conditions, or that the degree of compliance with the policies or procedures may deteriorate.
/s/ PricewaterhouseCoopers LLP
McLean, Virginia
February 25, 2019
We have served as the Company’s auditor since 1946.
60
GRAHAM HOLDINGS COMPANY
CONSOLIDATED STATEMENTS OF OPERATIONS
|
|
Year Ended December 31
|
||||||||||
|
(in thousands, except per share amounts)
|
2018
|
2017
|
2016
|
||||||||
|
Operating Revenues
|
$
|
2,695,966
|
|
$
|
2,591,846
|
|
$
|
2,481,890
|
|
||
|
Operating Costs and Expenses
|
|
||||||||||
|
Operating
|
1,687,432
|
|
1,454,343
|
|
1,270,030
|
|
|||||
|
Selling, general and administrative
|
650,128
|
|
887,790
|
|
896,097
|
|
|||||
|
Depreciation of property, plant and equipment
|
56,722
|
|
62,509
|
|
64,620
|
|
|||||
|
Amortization of intangible assets
|
47,414
|
|
41,187
|
|
26,671
|
|
|||||
|
Impairment of goodwill and other long-lived assets
|
8,109
|
|
9,614
|
|
1,603
|
|
|||||
|
|
2,449,805
|
|
2,455,443
|
|
2,259,021
|
|
|||||
|
Income from Operations
|
246,161
|
|
136,403
|
|
222,869
|
|
|||||
|
Equity in earnings (losses) of affiliates, net
|
14,473
|
|
(3,249
|
)
|
(7,937
|
)
|
|||||
|
Interest income
|
5,353
|
|
6,581
|
|
3,093
|
|
|||||
|
Interest expense
|
(37,902
|
)
|
(33,886
|
)
|
(35,390
|
)
|
|||||
|
Debt extinguishment costs
|
(11,378
|
)
|
—
|
|
—
|
|
|||||
|
Non-operating pension and postretirement benefit income, net
|
120,541
|
|
72,699
|
|
80,665
|
|
|||||
|
Loss on marketable equity securities, net
|
(15,843
|
)
|
—
|
|
—
|
|
|||||
|
Other income (expense), net
|
2,103
|
|
4,241
|
|
(12,642
|
)
|
|||||
|
Income Before Income Taxes
|
323,508
|
|
182,789
|
|
250,658
|
|
|||||
|
Provision for (Benefit from) Income Taxes
|
52,100
|
|
(119,700
|
)
|
81,200
|
|
|||||
|
Net Income
|
271,408
|
|
302,489
|
|
169,458
|
|
|||||
|
Net Income Attributable to Noncontrolling Interests
|
(202
|
)
|
(445
|
)
|
(868
|
)
|
|||||
|
Net Income Attributable to Graham Holdings Company Common Stockholders
|
$
|
271,206
|
|
$
|
302,044
|
|
$
|
168,590
|
|
||
|
Per Share Information Attributable to Graham Holdings Company Common Stockholders
|
|
||||||||||
|
Basic net income per common share
|
$
|
50.55
|
|
$
|
54.24
|
|
$
|
29.95
|
|
||
|
Basic average number of common shares outstanding
|
5,333
|
|
5,516
|
|
5,559
|
|
|||||
|
Diluted net income per common share
|
$
|
50.20
|
|
$
|
53.89
|
|
$
|
29.80
|
|
||
|
Diluted average number of common shares outstanding
|
5,370
|
|
5,552
|
|
5,589
|
|
|||||
See accompanying Notes to Consolidated Financial Statements.
61
GRAHAM HOLDINGS COMPANY
CONSOLIDATED STATEMENTS OF COMPREHENSIVE INCOME (LOSS)
|
|
Year Ended December 31
|
||||||||||
|
(in thousands)
|
2018
|
2017
|
2016
|
||||||||
|
Net Income
|
$
|
271,408
|
|
$
|
302,489
|
|
$
|
169,458
|
|
||
|
Other Comprehensive (Loss) Income, Before Tax
|
|||||||||||
|
Foreign currency translation adjustments:
|
|||||||||||
|
Translation adjustments arising during the year
|
(35,584
|
)
|
33,175
|
|
(22,149
|
)
|
|||||
|
Adjustment for sales of businesses with foreign operations
|
—
|
|
137
|
|
—
|
|
|||||
|
|
(35,584
|
)
|
33,312
|
|
(22,149
|
)
|
|||||
|
Unrealized gains on available-for-sale securities:
|
|
||||||||||
|
Unrealized gains for the year
|
—
|
|
112,086
|
|
55,507
|
|
|||||
|
Reclassification adjustment for realization of loss on sale of available-for-sale securities included in net income
|
—
|
|
—
|
|
1,879
|
|
|||||
|
|
—
|
|
112,086
|
|
57,386
|
|
|||||
|
Pension and other postretirement plans:
|
|
|
|
||||||||
|
Actuarial (loss) gain
|
(101,013
|
)
|
179,674
|
|
(133,915
|
)
|
|||||
|
Prior service credit (cost)
|
4,262
|
|
(75
|
)
|
—
|
|
|||||
|
Amortization of net actuarial (gain) loss included in net income
|
(11,349
|
)
|
(6,527
|
)
|
1,157
|
|
|||||
|
Amortization of net prior service (credit) cost included in net income
|
(947
|
)
|
477
|
|
419
|
|
|||||
|
Curtailments and settlements included in net income
|
(30,267
|
)
|
—
|
|
(17,993
|
)
|
|||||
|
|
(139,314
|
)
|
173,549
|
|
(150,332
|
)
|
|||||
|
Cash flow hedge gain (loss)
|
551
|
|
112
|
|
(334
|
)
|
|||||
|
Other Comprehensive (Loss) Income, Before Tax
|
(174,347
|
)
|
319,059
|
|
(115,429
|
)
|
|||||
|
Income tax benefit (expense) related to items of other comprehensive (loss) income
|
37,510
|
|
(90,923
|
)
|
37,235
|
|
|||||
|
Other Comprehensive (Loss) Income, Net of Tax
|
(136,837
|
)
|
228,136
|
|
(78,194
|
)
|
|||||
|
Comprehensive Income
|
134,571
|
|
530,625
|
|
91,264
|
|
|||||
|
Comprehensive income attributable to noncontrolling interests
|
(202
|
)
|
(445
|
)
|
(868
|
)
|
|||||
|
Total Comprehensive Income Attributable to Graham Holdings Company
|
$
|
134,369
|
|
$
|
530,180
|
|
$
|
90,396
|
|
||
See accompanying Notes to Consolidated Financial Statements.
62
GRAHAM HOLDINGS COMPANY
CONSOLIDATED BALANCE SHEETS
|
|
As of December 31
|
||||||
|
(In thousands, except share amounts)
|
2018
|
2017
|
|||||
|
Assets
|
|
|
|||||
|
Current Assets
|
|
|
|||||
|
Cash and cash equivalents
|
$
|
253,256
|
|
$
|
390,014
|
|
|
|
Restricted cash
|
10,859
|
|
17,552
|
|
|||
|
Investments in marketable equity securities and other investments
|
514,581
|
|
557,153
|
|
|||
|
Accounts receivable, net
|
582,280
|
|
620,319
|
|
|||
|
Income taxes receivable
|
19,166
|
|
23,901
|
|
|||
|
Inventories and contracts in progress
|
69,477
|
|
60,612
|
|
|||
|
Other current assets
|
82,723
|
|
66,253
|
|
|||
|
Total Current Assets
|
1,532,342
|
|
1,735,804
|
|
|||
|
Property, Plant and Equipment, Net
|
293,085
|
|
259,358
|
|
|||
|
Investments in Affiliates
|
143,813
|
|
128,590
|
|
|||
|
Goodwill, Net
|
1,297,712
|
|
1,299,710
|
|
|||
|
Indefinite-Lived Intangible Assets
|
99,052
|
|
102,195
|
|
|||
|
Amortized Intangible Assets, Net
|
263,261
|
|
237,976
|
|
|||
|
Prepaid Pension Cost
|
1,003,558
|
|
1,056,777
|
|
|||
|
Deferred Income Taxes
|
13,388
|
|
15,367
|
|
|||
|
Deferred Charges and Other Assets
|
117,830
|
|
102,046
|
|
|||
|
Total Assets
|
$
|
4,764,041
|
|
$
|
4,937,823
|
|
|
|
Liabilities and Equity
|
|
|
|
|
|||
|
Current Liabilities
|
|
|
|
|
|||
|
Accounts payable and accrued liabilities
|
$
|
486,578
|
|
$
|
526,323
|
|
|
|
Deferred revenue
|
308,728
|
|
339,454
|
|
|||
|
Income taxes payable
|
10,496
|
|
6,109
|
|
|||
|
Current portion of long-term debt
|
6,360
|
|
6,726
|
|
|||
|
Total Current Liabilities
|
812,162
|
|
878,612
|
|
|||
|
Accrued Compensation and Related Benefits
|
179,652
|
|
213,889
|
|
|||
|
Other Liabilities
|
57,901
|
|
65,977
|
|
|||
|
Deferred Income Taxes
|
322,421
|
|
362,701
|
|
|||
|
Mandatorily Redeemable Noncontrolling Interest
|
—
|
|
10,331
|
|
|||
|
Long-Term Debt
|
470,777
|
|
486,561
|
|
|||
|
Total Liabilities
|
1,842,913
|
|
2,018,071
|
|
|||
|
Commitments and Contingencies
(Notes 17 and 18)
|
|
|
|
|
|||
|
Redeemable Noncontrolling Interests
|
4,346
|
|
4,607
|
|
|||
|
Preferred Stock,
$1 par value; 977,000 shares authorized, none issued
|
—
|
|
—
|
|
|||
|
Common Stockholders’ Equity
|
|
|
|
|
|||
|
Common stock
|
|
|
|
|
|||
|
Class A Common stock, $1 par value;
7,000,000
shares authorized; 964,001 shares issued and outstanding
|
964
|
|
964
|
|
|||
|
Class B Common stock, $1 par value; 40,000,000 shares authorized; 19,035,999 shares issued; 4,336,958 and 4,540,493 shares outstanding
|
19,036
|
|
19,036
|
|
|||
|
Capital in excess of par value
|
378,837
|
|
370,700
|
|
|||
|
Retained earnings
|
6,236,125
|
|
5,791,724
|
|
|||
|
Accumulated other comprehensive income, net of taxes
|
|
|
|
|
|||
|
Cumulative foreign currency translation adjustment
|
(29,270
|
)
|
6,314
|
|
|||
|
Unrealized gain on available-for-sale securities
|
—
|
|
194,889
|
|
|||
|
Unrealized gain on pensions and other postretirement plans
|
232,836
|
|
334,536
|
|
|||
|
Cash flow hedge
|
263
|
|
(184
|
)
|
|||
|
Cost of 14,699,041 and 14,495,506 shares of Class B common stock held in treasury
|
(3,922,009
|
)
|
(3,802,834
|
)
|
|||
|
Total Equity
|
2,916,782
|
|
2,915,145
|
|
|||
|
Total Liabilities and Equity
|
$
|
4,764,041
|
|
$
|
4,937,823
|
|
|
See accompanying Notes to Consolidated Financial Statements.
63
GRAHAM HOLDINGS COMPANY
CONSOLIDATED STATEMENTS OF CASH FLOWS
|
|
Year Ended December 31
|
||||||||||
|
(In thousands)
|
2018
|
2017
|
2016
|
||||||||
|
Cash Flows from Operating Activities
|
|
|
|
||||||||
|
Net Income
|
$
|
271,408
|
|
$
|
302,489
|
|
$
|
169,458
|
|
||
|
Adjustments to reconcile net income to net cash provided by operating activities:
|
|
|
|
||||||||
|
Depreciation, amortization and goodwill and other long-lived asset impairment
|
112,245
|
|
113,310
|
|
92,894
|
|
|||||
|
Net pension benefit
|
(100,948
|
)
|
(59,039
|
)
|
(67,097
|
)
|
|||||
|
Early retirement and special separation benefit program expense
|
—
|
|
1,825
|
|
—
|
|
|||||
|
Loss on marketable equity securities and cost method investments, net
|
4,180
|
|
—
|
|
—
|
|
|||||
|
Stock-based compensation expense, net
|
6,412
|
|
10,169
|
|
13,418
|
|
|||||
|
Debt extinguishment costs
|
10,563
|
|
—
|
|
—
|
|
|||||
|
Foreign exchange loss (gain)
|
3,844
|
|
(3,310
|
)
|
39,890
|
|
|||||
|
Net (gain) loss on sales and disposition of businesses
|
(8,157
|
)
|
569
|
|
(22,163
|
)
|
|||||
|
Net (gain) loss on dispositions, sales or write-downs of marketable equity securities and cost method investments
|
(148
|
)
|
200
|
|
30,449
|
|
|||||
|
Equity in (earnings) losses of affiliates, net of distributions
|
(10,606
|
)
|
3,646
|
|
8,859
|
|
|||||
|
(Benefit from) provision for deferred income taxes
|
(7,123
|
)
|
(146,452
|
)
|
10,070
|
|
|||||
|
Net (gain) loss on sales or write-downs of property, plant and equipment
|
(1,642
|
)
|
413
|
|
(32,362
|
)
|
|||||
|
Change in operating assets and liabilities:
|
|
|
|
|
|||||||
|
Accounts receivable, net
|
59,847
|
|
11,086
|
|
(47,892
|
)
|
|||||
|
Inventories
|
(7,351
|
)
|
(541
|
)
|
(2,422
|
)
|
|||||
|
Accounts payable and accrued liabilities
|
(44,892
|
)
|
19,380
|
|
58,147
|
|
|||||
|
Deferred revenue
|
14,801
|
|
13,903
|
|
16,552
|
|
|||||
|
Income taxes receivable/payable
|
9,405
|
|
24,739
|
|
5,115
|
|
|||||
|
Other assets and other liabilities, net
|
(26,973
|
)
|
(25,469
|
)
|
(12,265
|
)
|
|||||
|
Other
|
2,154
|
|
1,137
|
|
605
|
|
|||||
|
Net Cash Provided by Operating Activities
|
287,019
|
|
268,055
|
|
261,256
|
|
|||||
|
Cash Flows from Investing Activities
|
|
|
|
||||||||
|
Investments in certain businesses, net of cash acquired
|
(111,546
|
)
|
(299,938
|
)
|
(245,084
|
)
|
|||||
|
Purchases of property, plant and equipment
|
(98,192
|
)
|
(60,358
|
)
|
(66,612
|
)
|
|||||
|
Proceeds from sales of marketable equity securities
|
66,741
|
|
—
|
|
29,702
|
|
|||||
|
Purchases of marketable equity securities
|
(42,659
|
)
|
—
|
|
(48,265
|
)
|
|||||
|
Advance related to Kaplan University transaction and loan to affiliate
|
(28,061
|
)
|
(6,771
|
)
|
(14,244
|
)
|
|||||
|
Investments in equity affiliates, cost method and other investments
|
(11,702
|
)
|
(82,944
|
)
|
(6,273
|
)
|
|||||
|
Net (payments) proceeds from sales of businesses, property, plant and equipment and other assets
|
(10,344
|
)
|
3,265
|
|
39,490
|
|
|||||
|
Return of investment in equity affiliates
|
4,799
|
|
4,727
|
|
—
|
|
|||||
|
Net Cash Used in Investing Activities
|
(230,964
|
)
|
(442,019
|
)
|
(311,286
|
)
|
|||||
|
Cash Flows from Financing Activities
|
|
|
|
||||||||
|
Repayments of borrowings and early redemption premium
|
(417,159
|
)
|
(7,715
|
)
|
—
|
|
|||||
|
Issuance of borrowings
|
400,000
|
|
—
|
|
98,610
|
|
|||||
|
Common shares repurchased
|
(118,030
|
)
|
(50,770
|
)
|
(108,948
|
)
|
|||||
|
Dividends paid
|
(28,617
|
)
|
(28,329
|
)
|
(27,325
|
)
|
|||||
|
Purchase of noncontrolling interest and deferred payment of acquisition
|
(16,500
|
)
|
(5,187
|
)
|
(21,000
|
)
|
|||||
|
Payments of financing costs
|
(6,501
|
)
|
—
|
|
(648
|
)
|
|||||
|
(Repayments of) proceeds from bank overdrafts
|
(5,717
|
)
|
(9,505
|
)
|
14,429
|
|
|||||
|
Other
|
165
|
|
1,400
|
|
1,805
|
|
|||||
|
Net Cash Used in Financing Activities
|
(192,359
|
)
|
(100,106
|
)
|
(43,077
|
)
|
|||||
|
Effect of Currency Exchange Rate Change
|
(7,147
|
)
|
10,820
|
|
(11,029
|
)
|
|||||
|
Net Decrease in Cash and Cash Equivalents and Restricted Cash
|
(143,451
|
)
|
(263,250
|
)
|
(104,136
|
)
|
|||||
|
Cash and Cash Equivalents and Restricted Cash at Beginning of Year
|
407,566
|
|
670,816
|
|
774,952
|
|
|||||
|
Cash and Cash Equivalents and Restricted Cash at End of Year
|
$
|
264,115
|
|
$
|
407,566
|
|
$
|
670,816
|
|
||
|
Supplemental Cash Flow Information
|
|
|
|
||||||||
|
Cash paid during the year for:
|
|
|
|
||||||||
|
Income taxes
|
$
|
54,000
|
|
$
|
4,000
|
|
$
|
65,000
|
|
||
|
Interest
|
$
|
42,000
|
|
$
|
33,000
|
|
$
|
30,000
|
|
||
See accompanying Notes to Consolidated Financial Statements.
64
GRAHAM HOLDINGS COMPANY
CONSOLIDATED STATEMENTS OF CHANGES IN COMMON STOCKHOLDERS’ EQUITY
|
(in thousands)
|
Class A
Common
Stock
|
Class B
Common Stock |
Capital in
Excess of
Par Value
|
Retained
Earnings
|
Accumulated Other Comprehensive Income
|
Treasury
Stock
|
Total Equity
|
Redeemable Noncontrolling Interest
|
|||||||||||||||||
|
As of December 31, 2015
|
$
|
964
|
|
$
|
19,036
|
|
$
|
356,887
|
|
$
|
5,447,677
|
|
$
|
314,680
|
|
$
|
(3,648,546
|
)
|
$
|
2,490,698
|
|
$
|
25,957
|
|
|
|
Net income for the year
|
|
|
169,458
|
|
|
169,458
|
|
||||||||||||||||||
|
Net income attributable to redeemable noncontrolling interests
|
(868
|
)
|
(868
|
)
|
868
|
|
|||||||||||||||||||
|
Change in redemption value of redeemable noncontrolling interests
|
(3,026
|
)
|
(3,026
|
)
|
3,026
|
|
|||||||||||||||||||
|
Dividends paid on common stock
|
|
|
|
(27,325
|
)
|
|
(27,325
|
)
|
|||||||||||||||||
|
Repurchase of Class B common stock
|
|
|
(108,948
|
)
|
(108,948
|
)
|
|||||||||||||||||||
|
Issuance of Class B common stock, net of restricted stock award forfeitures
|
|
|
(697
|
)
|
|
644
|
|
(53
|
)
|
||||||||||||||||
|
Amortization of unearned stock compensation and stock option expense
|
|
|
14,717
|
|
|
|
14,717
|
|
|||||||||||||||||
|
Other comprehensive loss, net of income taxes
|
(78,194
|
)
|
(78,194
|
)
|
|||||||||||||||||||||
|
Taxes arising from employee stock plans
|
558
|
|
|
|
558
|
|
|||||||||||||||||||
|
Purchase of redeemable noncontrolling interest
|
—
|
|
(24,031
|
)
|
|||||||||||||||||||||
|
Exchange of redeemable noncontrolling interest
|
(4,076
|
)
|
(4,076
|
)
|
(5,770
|
)
|
|||||||||||||||||||
|
As of December 31, 2016
|
964
|
|
19,036
|
|
364,363
|
|
5,588,942
|
|
236,486
|
|
(3,756,850
|
)
|
2,452,941
|
|
50
|
|
|||||||||
|
Net income for the year
|
|
|
302,489
|
|
|
302,489
|
|
||||||||||||||||||
|
Acquisition of redeemable noncontrolling interest
|
|
|
|
—
|
|
3,666
|
|
||||||||||||||||||
|
Net income attributable to redeemable noncontrolling interests
|
(445
|
)
|
(445
|
)
|
445
|
|
|||||||||||||||||||
|
Change in redemption value of redeemable noncontrolling interests
|
(446
|
)
|
(446
|
)
|
446
|
|
|||||||||||||||||||
|
Dividends paid on common stock
|
|
|
|
(28,329
|
)
|
|
(28,329
|
)
|
|||||||||||||||||
|
Repurchase of Class B common stock
|
|
|
|
|
(50,770
|
)
|
(50,770
|
)
|
|||||||||||||||||
|
Issuance of Class B common stock, net of restricted stock award forfeitures
|
|
|
(4,401
|
)
|
|
4,786
|
|
385
|
|
||||||||||||||||
|
Amortization of unearned stock compensation and stock option expense
|
|
|
11,184
|
|
|
|
11,184
|
|
|||||||||||||||||
|
Other comprehensive income, net of income taxes
|
228,136
|
|
228,136
|
|
|||||||||||||||||||||
|
Reclassification of stranded tax effects as a result of tax reform
|
(70,933
|
)
|
70,933
|
|
—
|
|
|||||||||||||||||||
|
As of December 31, 2017
|
964
|
|
19,036
|
|
370,700
|
|
5,791,724
|
|
535,555
|
|
(3,802,834
|
)
|
2,915,145
|
|
4,607
|
|
|||||||||
|
Net income for the year
|
|
|
|
271,408
|
|
|
271,408
|
|
|||||||||||||||||
|
Net income attributable to redeemable noncontrolling interests
|
|
|
|
(202
|
)
|
|
(202
|
)
|
202
|
|
|||||||||||||||
|
Change in redemption value of redeemable noncontrolling interests
|
413
|
|
413
|
|
(413
|
)
|
|||||||||||||||||||
|
Dividends paid on common stock
|
|
|
|
(28,617
|
)
|
|
(28,617
|
)
|
|||||||||||||||||
|
Repurchase of Class B common stock
|
|
|
|
|
(118,030
|
)
|
(118,030
|
)
|
|||||||||||||||||
|
Issuance of Class B common stock, net of restricted stock award forfeitures
|
|
|
(340
|
)
|
|
(1,145
|
)
|
(1,485
|
)
|
||||||||||||||||
|
Amortization of unearned stock compensation and stock option expense
|
|
|
8,064
|
|
|
|
8,064
|
|
|||||||||||||||||
|
Other comprehensive loss, net of income taxes
|
(136,837
|
)
|
(136,837
|
)
|
|||||||||||||||||||||
|
Cumulative effect of accounting change
|
|
|
|
|
|
|
201,812
|
|
(194,889
|
)
|
|
6,923
|
|
||||||||||||
|
Other
|
|
|
—
|
|
(50
|
)
|
|||||||||||||||||||
|
As of December 31, 2018
|
$
|
964
|
|
$
|
19,036
|
|
$
|
378,837
|
|
$
|
6,236,125
|
|
$
|
203,829
|
|
$
|
(3,922,009
|
)
|
$
|
2,916,782
|
|
$
|
4,346
|
|
|
See accompanying Notes to Consolidated Financial Statements.
65
GRAHAM HOLDINGS COMPANY
NOTES TO CONSOLIDATED FINANCIAL STATEMENTS
|
1.
|
ORGANIZATION AND NATURE OF OPERATIONS
|
Graham Holdings Company (the Company), is a diversified education and media company. The Company’s Kaplan subsidiary provides a wide variety of educational services, both domestically and outside the United States. The Company’s media operations comprise the ownership and operation of seven television broadcasting stations.
On March 22, 2018, Kaplan completed the sale of the institutional assets and operations of Kaplan University (KU) to an Indiana non-profit, public benefit corporation that is a subsidiary affiliated with Purdue University (Purdue) (see Note 3). The gain on the KU transaction is included in other income (expense), net, in the Consolidated Statement of Operations.
Education
—Kaplan, Inc. provides an extensive range of educational services for students and professionals. Kaplan’s various businesses comprise
four
categories: Kaplan International, Higher Education (KHE), Test Preparation (KTP) and Professional (U.S.).
Media
—The Company’s diversified media operations comprise television broadcasting, several websites and print publications, and a marketing solutions provider.
Television broadcasting.
As of
December 31, 2018
, the Company owned
seven
television stations located in Houston, TX; Detroit, MI; Orlando, FL; San Antonio, TX; Roanoke, VA; and
two
stations in Jacksonville, FL. All stations are network-affiliated except for WJXT in Jacksonville, FL.
Other
—The Company’s other business operations include home health and hospice services and manufacturing.
|
2.
|
SUMMARY OF SIGNIFICANT ACCOUNTING POLICIES
|
Basis of Presentation and Principles of Consolidation.
The accompanying Consolidated Financial Statements have been prepared in accordance with generally accepted accounting principles (GAAP) in the United States and include the assets, liabilities, results of operations and cash flows of the Company and its majority-owned and controlled subsidiaries. All significant intercompany accounts and transactions have been eliminated in consolidation.
Use of Estimates.
The preparation of financial statements in conformity with GAAP requires management to make estimates and judgments that affect the amounts reported in the financial statements. Management bases its estimates and assumptions on historical experience and on various other factors that are believed to be reasonable under the circumstances. Due to the inherent uncertainty involved in making estimates, actual results reported in future periods may be affected by changes in those estimates. On an ongoing basis, the Company evaluates its estimates and assumptions.
Business Combinations.
The purchase price of an acquisition is allocated to the assets acquired, including intangible assets, and liabilities assumed, based on their respective fair values at the acquisition date. Acquisition-related costs are expensed as incurred. The excess of the cost of an acquired entity over the net of the amounts assigned to the assets acquired and liabilities assumed is recognized as goodwill. The net assets and results of operations of an acquired entity are included in the Company’s Consolidated Financial Statements from the acquisition date.
Cash and Cash Equivalents.
Cash and cash equivalents consist of cash on hand, short-term investments with original maturities of
three
months or less and investments in money market funds with weighted average maturities of
three
months or less.
Restricted Cash.
Restricted cash represents amounts required to be held by non-U.S. higher education institutions for prepaid tuition pursuant to foreign government regulations. These regulations stipulate that the Company has a fiduciary responsibility to segregate certain funds to ensure these funds are only used for the benefit of eligible students.
Concentration of Credit Risk.
Cash and cash equivalents are maintained with several financial institutions domestically and internationally. Deposits held with banks may exceed the amount of insurance provided on such deposits. Generally, these deposits may be redeemed upon demand and are maintained with financial institutions with investment-grade credit ratings. The Company routinely assesses the financial strength of significant customers, and this assessment, combined with the large number and geographical diversity of its customers, limits the Company’s concentration of risk with respect to trade accounts receivable.
66
Allowance for Doubtful Accounts.
Accounts receivable have been reduced by an allowance for amounts that may be uncollectible in the future. This estimated allowance is based primarily on the aging category, historical collection experience and management’s evaluation of the financial condition of the customer. The Company generally considers an account past due or delinquent when a student or customer misses a scheduled payment. The Company writes off accounts receivable balances deemed uncollectible against the allowance for doubtful accounts following the passage of a certain period of time, or generally when the account is turned over for collection to an outside collection agency.
Investments in Equity Securities.
The Company measures its investments in equity securities at fair value with changes in fair value recognized in earnings. The Company elected the measurement alternative to measure cost method investments that do not have readily determinable fair value at cost less impairment, adjusted by observable price changes with any fair value changes recognized in earnings. If the fair value of an equity security declines below its cost basis and the decline is considered other than temporary, the Company will record a write-down, which is included in earnings. The Company uses the average cost method to determine the basis of the securities sold.
Prior to 2018, the Company’s investments in marketable equity securities were classified as available-for-sale and, therefore, were recorded at fair value in the Consolidated Financial Statements, with the change in fair value during the period excluded from earnings and recorded net of income taxes as a separate component of other comprehensive income. Additionally, the Company used the cost method of accounting for its minority investments in nonpublic companies where it did not have significant influence over the operations and management of the investee. Investments were recorded at the lower of cost or fair value as estimated by management. Charges recorded to write down cost method investments to their estimated fair value and gross realized gains or losses upon the sale of cost method investments were included in other income (expense), net, in the Company’s Consolidated Statements of Operations. Fair value estimates were based on a review of the investees’ product development activities, historical financial results and projected discounted cash flows. The Company includes cost method investments in deferred charges and other assets in the Company’s Consolidated Balance Sheets.
Fair Value Measurements.
Fair value measurements are determined based on the assumptions that a market participant would use in pricing an asset or liability based on a three-tiered hierarchy that draws a distinction between market participant assumptions based on (i) observable inputs, such as quoted prices in active markets (Level 1); (ii) inputs other than quoted prices in active markets that are observable either directly or indirectly (Level 2); and (iii) unobservable inputs that require the Company to use present value and other valuation techniques in the determination of fair value (Level 3). Financial assets and liabilities are classified in their entirety based on the lowest level of input that is significant to the fair value measure. The Company’s assessment of the significance of a particular input to the fair value measurements requires judgment and may affect the valuation of the assets and liabilities being measured and their placement within the fair value hierarchy.
For assets that are measured using quoted prices in active markets, the total fair value is the published market price per unit multiplied by the number of units held, without consideration of transaction costs. Assets and liabilities that are measured using significant other observable inputs are primarily valued by reference to quoted prices of similar assets or liabilities in active markets, adjusted for any terms specific to that asset or liability.
The Company measures certain assets—including goodwill; intangible assets; property, plant and equipment; cost and equity-method investments—at fair value on a nonrecurring basis when they are deemed to be impaired. The fair value of these assets is determined with valuation techniques using the best information available and may include quoted market prices, market comparables and discounted cash flow models.
Fair Value of Financial Instruments.
The carrying amounts reported in the Company’s Consolidated Financial Statements for cash and cash equivalents, restricted cash, accounts receivable, accounts payable and accrued liabilities, the current portion of deferred revenue and the current portion of debt approximate fair value because of the short-term nature of these financial instruments. The fair value of long-term debt is determined based on a number of observable inputs, including the current market activity of the Company’s publicly traded notes, trends in investor demands and market values of comparable publicly traded debt. The fair value of the interest rate hedge is determined based on a number of observable inputs, including time to maturity and market interest rates.
Inventories and Contracts in Progress.
Inventories and contracts in progress are stated at the lower of cost or net realizable values and are based on the first-in, first-out (FIFO) method. Inventory costs include direct material, direct and indirect labor, and applicable manufacturing overhead. The Company allocates manufacturing overhead based on normal production capacity and recognizes unabsorbed manufacturing costs in earnings. The provision for excess and obsolete inventory is based on management’s evaluation of inventories on hand relative to historical usage, estimated future usage and technological developments.
Property, Plant and Equipment.
Property, plant and equipment is recorded at cost and includes interest capitalized in connection with major long-term construction projects. Replacements and major improvements are
67
capitalized; maintenance and repairs are expensed as incurred. Depreciation is calculated using the straight-line method over the estimated useful lives of the property, plant and equipment:
3
to
20
years for machinery and equipment;
20
to
50
years for buildings. The costs of leasehold improvements are amortized over the lesser of their useful lives or the terms of the respective leases.
Evaluation of Long-Lived Assets.
The recoverability of long-lived assets and finite-lived intangible assets is assessed whenever adverse events or changes in circumstances indicate that recorded values may not be recoverable. A long-lived asset is considered to not be recoverable when the undiscounted estimated future cash flows are less than the asset’s recorded value. An impairment charge is measured based on estimated fair market value, determined primarily using estimated future cash flows on a discounted basis. Losses on long-lived assets to be disposed of are determined in a similar manner, but the fair market value would be reduced for estimated costs to dispose.
Goodwill and Other Intangible Assets.
Goodwill is the excess of purchase price over the fair value of identified net assets of businesses acquired. The Company’s intangible assets with an indefinite life are principally from trade names and trademarks, and FCC licenses. Amortized intangible assets are primarily student and customer relationships and trade names and trademarks, with amortization periods up to
10
years. Costs associated with renewing or extending intangible assets are insignificant and expensed as incurred.
The Company reviews goodwill and indefinite-lived intangible assets at least annually, as of November 30, for possible impairment. Goodwill and indefinite-lived intangible assets are reviewed for possible impairment between annual tests if an event occurs or circumstances change that would more likely than not reduce the fair value of the reporting unit or indefinite-lived intangible asset below its carrying value. The Company tests its goodwill at the reporting unit level, which is an operating segment or one level below an operating segment. The Company initially assesses qualitative factors to determine if it is necessary to perform the goodwill or indefinite-lived intangible asset quantitative impairment review. The Company reviews the goodwill and indefinite-lived assets for impairment using the quantitative process if, based on its assessment of the qualitative factors, it determines that it is more likely than not that the fair value of a reporting unit or indefinite-lived intangible asset is less than its carrying value, or if it decides to bypass the qualitative assessment. The Company reviews the carrying value of goodwill and indefinite-lived intangible assets utilizing a discounted cash flow model, and, where appropriate, a market value approach is also utilized to supplement the discounted cash flow model. The Company makes assumptions regarding estimated future cash flows, discount rates, long-term growth rates and market values to determine the estimated fair value of each reporting unit and indefinite-lived intangible asset. If these estimates or related assumptions change in the future, the Company may be required to record impairment charges.
Investments in Affiliates.
The Company uses the equity method of accounting for its investments in and earnings or losses of affiliates that it does not control, but over which it exerts significant influence. The Company considers whether the fair values of any of its equity method investments have declined below their carrying values whenever adverse events or changes in circumstances indicate that recorded values may not be recoverable. If the Company considered any such decline to be other than temporary (based on various factors, including historical financial results, product development activities and the overall health of the affiliate’s industry), a write-down would be recorded to estimated fair value.
Revenue Recognition.
Prior to the adoption of the new revenue guidance on January 1, 2018, the Company recognized revenue when persuasive evidence of an arrangement existed, the fees were fixed or determinable, the product or service had been delivered and collectability was assured. The Company considered the terms of each arrangement to determine the appropriate accounting treatment.
Subsequent to the adoption of the new guidance, the Company identifies a contract for revenue recognition when there is approval and commitment from both parties, the rights of the parties and payment terms are identified, the contract has commercial substance and the collectability of consideration is probable. The Company evaluates each contract to determine the number of distinct performance obligations in the contract, which requires the use of judgment.
Education Revenue
.
Education revenue is primarily derived from postsecondary education, professional education and test preparation services provided both domestically and abroad. Generally, tuition and other fees are paid upfront and recorded in deferred revenue in advance of the date when education services are provided to the student. In some instances, installment billing is available to students, which reduces the amount of cash consideration received in advance of performing the service. The contractual terms and conditions associated with installment billing indicate that the student is liable for the total contract price; therefore, mitigating the Company’s exposure to losses associated with nonpayment. The Company determined the installment billing does not represent a significant financing component.
Kaplan International
. Kaplan International provides higher education, professional education, and test preparation services and materials to students primarily in the United Kingdom, Singapore, and Australia. Some Kaplan
68
International contracts consist of
one
performance obligation that is a combination of indistinct promises to the student, while other Kaplan International contracts include multiple performance obligations as the promises in the contract are capable of being both distinct and distinct within the context of the contract.
One
Kaplan International business offers an option whereby students receive future services at a discount that is accounted for as a material right.
The transaction price is stated in the contract and known at the time of contract inception; therefore, no variable consideration exists. Revenue is allocated to each performance obligation based on its standalone selling price. Any discounts within the contract are allocated across all performance obligations unless observable evidence exists that the discount relates to a specific performance obligation or obligations in the contract. Kaplan International generally determines standalone selling prices based on prices charged to students.
Revenue is recognized ratably over the instruction period or access period for higher education, professional education and test preparation services. Kaplan International generally uses the time elapsed method, an input measure, as it best depicts the simultaneous consumption and delivery of these services. Course materials determined to be a separate performance obligation are recognized at the point in time when control transfers to the student, generally when the products are delivered to the student.
Higher Education (KHE)
. In the first quarter of 2018, KHE provided postsecondary education services to students through KU’s online programs and fixed-facility colleges.
These contracts consisted either of
one
performance obligation that is a combination of distinct promises to a student, or
two
performance obligations if the student also enrolled in the Kaplan Tuition Cap, which established a maximum amount of tuition that KHE may charge students for higher education services. The Kaplan Tuition Cap was accounted for as a material right. The transaction price of a higher education contract was stated in the contract and known at the time of contract inception; therefore, no variable consideration existed. A portion of the transaction price was allocated to the material right, if applicable, based on the expected value method.
Higher education services revenue was recognized ratably over the instruction period. The Company used the time elapsed method, an input measure, as it best depicts the simultaneous consumption and delivery of higher education services.
On March 22, 2018, Kaplan contributed the institutional assets and operations of KU to Purdue University Global (see Note 3). Subsequent to the transaction, KHE provides non-academic operations support services to Purdue University Global pursuant to a Transition and Operations Support Agreement (TOSA). This contract has a
30
-year term and consists of
one
performance obligation, which represents a series of daily promises to provide support services to Purdue University Global. The transaction price is entirely made up of variable consideration related to the reimbursement of KHE support costs and the KHE fee. The TOSA outlines a payment structure, which dictates how cash will be distributed at the end of Purdue University Global’s fiscal year, which is the 30th of June. The collectability of the KHE support costs and KHE fee is entirely dependent on the availability of cash at the end of the fiscal year. This variable consideration is constrained based on fiscal year forecasts prepared for Purdue University Global. The forecasts are updated throughout the fiscal year until the uncertainty is ultimately resolved, which is at the end of each Purdue University Global fiscal year. As KHE’s performance obligation is made up of a series, the variable consideration is allocated to the distinct service period to which it relates, which is the Purdue University Global fiscal year.
Support services revenue is recognized over time based on the expenses incurred to date and the percentage of expected reimbursement. KHE fee revenue is also recognized over time based on the amount of Purdue University Global revenue recognized to date and the percentage of fee expected to be collected for the fiscal year. The Company used these input measures as Purdue University Global simultaneously receives and consumes the benefits of the services provided by KHE.
Kaplan Test Preparation (KTP)
. KTP offers test preparation services and materials to students related to pre-college, graduate, health and bar review products. Generally KTP contracts include promises for test preparation services and course materials. As each promise is both capable of being distinct and distinct in the context of the contract, each promise is accounted for as a separate performance obligation. As the transaction price is stated in the contract and known at the time of contract inception, no variable consideration exists. Revenue is allocated to each performance obligation based on its standalone selling price. KTP generally determines standalone selling prices based on prices charged to students. Any discounts within the contract are allocated across all performance obligations unless observable evidence exists that the discount relates to a specific performance obligation or obligations in the contract.
Test preparation services revenue is recognized ratably over the period of access. At KTP, an estimate of average access period is developed for each course, and this estimate is evaluated on an ongoing basis and adjusted as necessary. KTP generally uses the time elapsed method, an input measure, as it best depicts the simultaneous
69
consumption and availability of access to test preparation services. Revenue associated with distinct course materials is recognized at the point in time when control transfers to the student, generally when the products are delivered to the student.
KTP offers a guarantee on certain courses that gives students the ability to repeat a course if they are not satisfied with their exam score. The Company accounts for this guarantee as a separate performance obligation.
Professional (U.S.):
Professional (U.S.) provides professional training and exam preparation for professional certifications and licensures to students. Professional (U.S.) contracts include promises for professional education services and course materials. Generally, Professional (U.S.) revenue contracts consist of multiple performance obligations as each distinct promise is both capable of being distinct and distinct in the context of the contract. The transaction price is stated in the contract and known at the time of contract inception, therefore no variable consideration exists. Revenue is allocated to each performance obligation based on its standalone selling price. Professional (U.S.) generally determines standalone selling prices based on the prices charged to students. Any discounts within the contract are allocated across all performance obligations unless observable evidence exists that the discount relates to a specific performance obligation or obligations in the contract.
Professional education services revenue is recognized ratably over the period of access. Professional (U.S.) generally uses the time elapsed method, an input measure, as it best depicts the simultaneous consumption and availability of access to professional education services. Revenue associated with distinct course materials is recognized at the point in time when control transfers to the student, generally when the products are delivered to the student.
Television Broadcasting Revenue
.
Television broadcasting revenue at Graham Media Group (GMG) is primarily comprised of television and internet advertising revenue, and retransmission revenue.
Television Advertising Revenue
. GMG accounts for the series of advertisements included in television advertising contracts as
one
performance obligation and recognizes advertising revenue over time. The Company elected the right to invoice practical expedient, an output method, as GMG has the right to consideration that equals the value provided to the customer for advertisements delivered to date. As a result of the election to use the right to invoice practical expedient, GMG does not determine the transaction price or allocate any variable consideration at contract inception. Rather, GMG recognizes revenue commensurate with the amount to which GMG has the right to invoice the customer. Payment is typically received in arrears within
60
days of revenue recognition.
Retransmission Revenue
. Retransmission revenue represents compensation paid by cable, satellite and other multichannel video programming distributors (MVPDs) to retransmit GMG’s stations’ broadcasts in their designated market areas. The retransmission rights granted to MVPDs are accounted for as a license of functional intellectual property as the retransmitted broadcast provides significant standalone functionality. As such, each retransmission contract with an MVPD includes
one
performance obligation for each station’s retransmission license. GMG recognizes revenue using the usage-based royalty method, in which revenue is recognized in the month the broadcast is retransmitted based on the number of MVPD subscribers and the applicable per user rate identified in the retransmission contract. Payment is typically received in arrears within
60
days of revenue recognition.
Manufacturing Revenue
.
Manufacturing revenue consists primarily of product sales generated by
four
businesses: Hoover, Dekko, Joyce and Forney. The Company has determined that each item ordered by the customer is a distinct performance obligation as it has standalone value and is distinct within the context of the contract. For arrangements with multiple performance obligations, the Company initially allocates the transaction price to each obligation based on its standalone selling price, which is the retail price charged to customers. Any discounts within the contract are allocated across all performance obligations unless observable evidence exists that the discount relates to a specific performance obligation or obligations in the contract.
The Company sells some products and services with a right of return. This right of return constitutes variable consideration and is constrained from revenue recognition on a portfolio basis, using the expected value method until the refund period expires.
The Company recognizes revenue when or as control transfers to the customer. Some manufacturing revenue is recognized ratably over the manufacturing period, if the product created for the customer does not have an alternative use to the Company and the Company has an enforceable right to payment for performance completed to date. The determination of the method by which the Company measures its progress toward the satisfaction of its performance obligations requires judgment. The Company measures its progress for these products using the units delivered method, an output measure. These arrangements represented
27%
of the manufacturing revenue recognized for the year ended
December 31, 2018
.
Other manufacturing revenue is recognized at the point in time when control transfers to the customer, generally when the products are shipped. Some customers have a bill and hold arrangement with the Company. Revenue for bill and hold arrangements is recognized when control transfers to the customer, even though the customer does
70
not have physical possession of the goods. Control transfers when the bill-and-hold arrangement has been requested from the customer, the product is identified as belonging to the customer and is ready for physical transfer, and the product cannot be directed for use by anyone but the customer.
Payment terms and conditions vary by contract, although terms generally include a requirement of payment within
90
days of delivery.
The Company evaluated the terms of the warranties and guarantees offered by its manufacturing businesses and determined that these should not be accounted for as a separate performance obligation as a distinct service is not identified.
Healthcare Revenue
.
The Company contracts with patients to provide home health or hospice services. Payment is typically received from third-party payors such as Medicare, Medicaid, and private insurers. The payor is a third party to the contract that stipulates the transaction price of the contract. The Company identifies the patient as the party who benefits from its healthcare services and as such, the patient is its customer.
The Company determined that healthcare services contracts generally have
one
performance obligation to provide healthcare services to patients. The transaction price reflects the amount of revenue the Company expects to receive in exchange for providing these services. As the transaction price for healthcare services is known at the time of contract inception, no variable consideration exists. Healthcare revenue is recognized ratably over the period of care. The Company generally uses the time-elapsed method, an input measure as it best depicts the simultaneous delivery and consumption of healthcare services.
Payment is received from third-party payors within
60
days after a claim is filed, or in some cases in two installments, one during the contract and one after the services have been provided. Medicare is the most common third-party payor.
Home health revenue contracts may be modified to account for changes in the patient’s plan of care. The Company identifies contract modifications when the modification changes the existing enforceable rights and obligations. As modifications to the plan of care modify the original performance obligation, the Company accounts for the contract modification as an adjustment to revenue (either as an increase in or a reduction of revenue) on a cumulative catch-up basis.
Other Revenue
. The Company recognizes revenue associated with management services it provides to its affiliates. The Company accounts for the management services provided as
one
performance obligation and recognizes revenue over time as the services are delivered. The Company uses the right to invoice practical expedient, an output method, as the Company’s right to revenue corresponds directly with the value delivered to the affiliate. As a result of the election to use the right to invoice practical expedient, the Company does not determine the transaction price or allocate any variable consideration at contract inception. Rather, the Company recognizes revenue commensurate with the amount to which it has the right to invoice the affiliate, which is based on contractually identified percentages. Payment is received monthly in arrears.
SocialCode Revenue
.
SocialCode generates media management revenue in exchange for providing social media marketing solutions to its clients. The Company determined that SocialCode contracts generally have
one
performance obligation made up of a series of promises to manage the client’s media spend on advertising platforms for the duration of the contract period.
SocialCode recognizes revenue, net of media acquisition costs, over time as media management services are delivered to the customer. Generally, SocialCode recognizes revenue using the right to invoice practical expedient, an output method, as SocialCode’s right to revenue corresponds directly with the value delivered to its customer. As a result of the election to use the right to invoice practical expedient, SocialCode does not determine the transaction price or allocate any variable consideration at contract inception. Rather, SocialCode recognizes revenue commensurate with the amount to which it has the right to invoice the customer which is a function of the cost of social media placement plus a management fee, less any applicable discounts. Payment is typically received within
100
days of revenue recognition.
SocialCode evaluates whether it is the principal (i.e. presents revenue on a gross basis) or agent (i.e. presents revenue on a net basis) in its contracts. SocialCode presents revenue for media management services, net of media acquisition costs, as an agent, as SocialCode does not control the media before placement on social media platforms.
Other Revenue
.
Other revenue primarily includes advertising and circulation revenue from Slate, Panoply and Foreign Policy. The Company accounts for other advertising revenues consistently with the advertising revenue streams addressed above. Circulation revenue consists of fees that provide customers access to online and print publications. The Company recognizes circulation revenue ratably over the subscription period beginning on the
71
date that the publication is made available to the customer. Circulation revenue contracts are generally annual or monthly subscription contracts that are paid in advance of delivery of performance obligations.
Revenue Policy Elections
.
The Company has elected to account for shipping and handling activities that occur after the customer has obtained control of the good as a fulfillment cost rather than as an additional promised service. Therefore, revenue for these performance obligations is recognized when control of the good transfers to the customer, which is when the good is ready for shipment. The Company accrues the related shipping and handling costs over the period when revenue is recognized.
The Company has elected to exclude from the measurement of the transaction price all taxes assessed by a governmental authority that are both imposed on and concurrent with a specific revenue-producing transaction and collected by the entity from a customer.
Revenue Practical Expedients
.
The Company does not disclose the value of unsatisfied performance obligations for (i) contracts with an original expected length of
one
year or less, (ii) contracts for which the amount of revenue recognized is based on the amount to which the Company has the right to invoice the customer for services performed, (iii) contracts for which the consideration received is a usage-based royalty promised in exchange for a license of intellectual property and (iv) contracts for which variable consideration is allocated entirely to a wholly unsatisfied promise to transfer a distinct good or service that forms part of a single performance obligation.
Costs to Obtain a Contract
.
The Company incurs costs to obtain a contract that are both incremental and expected to be recovered as the costs would not have been incurred if the contract was not obtained and the revenue from the contract exceeds the associated cost. The revenue guidance provides a practical expedient to expense sales commissions as incurred in instances where the amortization period is one year or less. The amortization period is defined in the guidance as the contract term, inclusive of any expected contract renewal periods. The Company has elected to apply this practical expedient to all contracts except for contracts in its education division. In the education division, costs to obtain a contract are amortized over the applicable amortization period except for cases in which commissions paid on initial contracts and renewals are commensurate. The Company amortizes these costs to obtain a contract on a straight line basis over the amortization period. These expenses are included as operating expenses in the Company’s Consolidated Statements of Operations.
Leases.
The Company leases substantially all of its educational facilities and enters into various other lease agreements in conducting its business. At the inception of each lease, the Company evaluates the lease agreement to determine whether the lease is an operating or capital lease. Additionally, many of the Company’s lease agreements contain renewal options, tenant improvement allowances, rent holidays and/or rent escalation clauses. When such items are included in a lease agreement, the Company records a deferred rent asset or liability in the Consolidated Financial Statements and records these items in rent expense evenly over the terms of the lease.
The Company is also required to make additional payments under operating lease terms for taxes, insurance and other operating expenses incurred during the operating lease period; such items are expensed as incurred. Rental deposits are included as other assets in the Company’s Consolidated Balance Sheets for lease agreements that require payments in advance or deposits held for security that are refundable, less any damages, at the end of the respective lease.
Pensions and Other Postretirement Benefits.
The Company maintains various pension and incentive savings plans. Most of the Company’s employees are covered by these plans. The Company also provides healthcare and life insurance benefits to certain retired employees. These employees become eligible for benefits after meeting age and service requirements.
The Company recognizes the overfunded or underfunded status of a defined benefit postretirement plan as an asset or liability in its Consolidated Balance Sheets and recognizes changes in that funded status in the year in which the changes occur through comprehensive income. The Company measures changes in the funded status of its plans using the projected unit credit method and several actuarial assumptions, the most significant of which are the discount rate, the expected return on plan assets and the rate of compensation increase. The Company uses a measurement date of December 31 for its pension and other postretirement benefit plans.
Self-Insurance.
The Company uses a combination of insurance and self-insurance for a number of risks, including claims related to employee healthcare and dental care, disability benefits, workers’ compensation, general liability, property damage and business interruption. Liabilities associated with these plans are estimated based on, among other things, the Company’s historical claims experience, severity factors and other actuarial assumptions. The expected loss accruals are based on estimates, and, while the Company believes that the amounts accrued are adequate, the ultimate loss may differ from the amounts provided.
Income Taxes.
The Company accounts for income taxes under the asset and liability method, which requires the recognition of deferred tax assets and liabilities for the expected future tax consequences of events that have been
72
included in the financial statements. Under this method, deferred tax assets and liabilities are determined based on the differences between the financial statements and tax basis of assets and liabilities using enacted tax rates in effect for the year in which the differences are expected to reverse. The effect of a change in tax rates on deferred tax assets and liabilities is recognized in income in the period that includes the enactment date.
The Company records net deferred tax assets to the extent that it believes these assets will more likely than not be realized. In making such determination, the Company considers all available positive and negative evidence, including future reversals of existing taxable temporary differences, projected future taxable income, tax planning strategies and recent financial operations; this evaluation is made on an ongoing basis. In the event the Company were to determine that it was able to realize net deferred income tax assets in the future in excess of their net recorded amount, the Company would record an adjustment to the valuation allowance, which would reduce the provision for income taxes.
The Company recognizes a tax benefit from an uncertain tax position when it is more likely than not that the position will be sustained upon examination, including resolutions of any related appeals or litigation processes, based on the technical merits. The Company records a liability for the difference between the benefit recognized and measured for financial statement purposes and the tax position taken or expected to be taken on the Company’s tax return. Changes in the estimate are recorded in the period in which such determination is made.
Foreign Currency Translation.
Income and expense accounts of the Company’s non-United States operations where the local currency is the functional currency are translated into United States (U.S.) dollars using the current rate method, whereby operating results are converted at the average rate of exchange for the period, and assets and liabilities are converted at the closing rates on the period end date. Gains and losses on translation of these accounts are accumulated and reported as a separate component of equity and other comprehensive income. Gains and losses on foreign currency transactions, including foreign currency denominated intercompany loans on entities with a functional currency in U.S. dollars, are recognized in the Consolidated Statements of Operations.
Equity-Based Compensation.
The Company measures compensation expense for awards settled in shares based on the grant date fair value of the award. The Company measures compensation expense for awards settled in cash, or that may be settled in cash, based on the fair value at each reporting date. The Company recognizes the expense over the requisite service period, which is generally the vesting period of the award.
Earnings Per Share.
Basic earnings per share is calculated under the two-class method. The Company treats restricted stock as a participating security due to its nonforfeitable right to dividends. Under the two-class method, the Company allocates to the participating securities their portion of dividends declared and undistributed earnings to the extent the participating securities may share in the earnings as if all earnings for the period had been distributed. Basic earnings per share is calculated by dividing the income available to common stockholders by the weighted average number of common shares outstanding during the period. Diluted earnings per share is calculated similarly except that the weighted average number of common shares outstanding during the period includes the dilutive effect of the assumed exercise of options and restricted stock issuable under the Company’s stock plans. The dilutive effect of potentially dilutive securities is reflected in diluted earnings per share by application of the treasury stock method.
Mandatorily Redeemable Noncontrolling Interest.
The Company’s mandatorily redeemable noncontrolling interest represented the noncontrolling interest in Graham Healthcare Group (GHG), which was
90%
owned. The minority shareholders had an option to put their shares to the Company starting in 2020 and were required to put a percentage of their shares in 2022 and 2024, with the remaining shares required to be put by the minority shareholders in 2026. Since the noncontrolling interest was mandatorily redeemable by 2026, it was reported as a noncurrent liability at December 31, 2017 in the Consolidated Balance Sheets. The Company presented this liability at fair value, which was computed annually as the current redemption value. Changes in the redemption value were recorded as interest expense or income in the Company’s Consolidated Statements of Operations. The mandatorily redeemable noncontrolling interest was redeemed and paid in July 2018 (see Note 3).
Redeemable Noncontrolling Interest.
The Company’s redeemable noncontrolling interest represents the noncontrolling interest in Hoover, which is
97.72%
owned. The minority shareholders have an option to put some of their shares to the Company starting in 2019 and the remaining shares starting in 2021. The Company has an option to buy the shares of minority shareholders starting in 2027. The Company presents the redeemable noncontrolling interest at the greater of its carrying amount or redemption value at the end of each reporting period in the Consolidated Balance Sheets. Changes in the redemption value are recorded to capital in excess of par value in the Company’s Consolidated Balance Sheets.
Comprehensive Income.
Comprehensive income consists of net income, foreign currency translation adjustments, net changes in cash flow hedge, and pension and other postretirement plan adjustments.
73
Recently Adopted and Issued Accounting Pronouncements.
In May 2014, the Financial Accounting Standards Board (FASB) issued comprehensive new guidance that supersedes all existing revenue recognition guidance. In August 2015, the FASB issued an amendment to the guidance that defers the effective date by one year. The new guidance requires revenue to be recognized when the Company transfers promised goods or services to customers in an amount that reflects the consideration to which the Company expects to be entitled in exchange for those goods or services. The new guidance also significantly expands the disclosure requirements for revenue recognition. The guidance is effective for interim and fiscal years beginning after December 15, 2017. The standard permits two implementation approaches, full retrospective, requiring retrospective application of the new guidance with a restatement of prior years, or modified retrospective, requiring prospective application of the new guidance with disclosure of results under the old guidance in the first year of adoption. The Company adopted the new guidance on January 1, 2018, using the modified retrospective approach for contracts not completed as of the adoption date.
Upon adoption of the new guidance, the Company recorded a net increase to the opening balance of retained earnings of
$6.9 million
. This adjustment was driven by changes in the timing of recognition of both revenues and expenses. A change in revenue recognition at a manufacturing business resulted in the acceleration of revenue and associated expenses as revenue is now recognized over time versus at a point in time. A change in the contract term at an education business resulted in a different revenue recognition pattern from previous recognition. Finally, the Company’s treatment of certain commissions paid to employees and agents at its education division changed. The Company previously expensed such commissions as incurred. Upon adoption of the new guidance, the Company capitalizes certain commission costs as an incremental cost of obtaining a contract and, subsequently, amortizes the cost as the tuition services are delivered to students.
The cumulative effect of the changes to the Company’s Consolidated Balance Sheets as a result of adopting the new guidance was as follows:
|
(in thousands)
|
Balance as of December 31, 2017
|
Adjustments
|
Balance as of January 1, 2018
|
||||||
|
Assets
|
|||||||||
|
Accounts receivable, net
|
$
|
620,319
|
|
$
|
2,142
|
|
$
|
622,461
|
|
|
Inventories and contracts in progress
|
60,612
|
|
246
|
|
60,858
|
|
|||
|
Other current assets
|
66,253
|
|
6,343
|
|
72,596
|
|
|||
|
Liabilities
|
|||||||||
|
Accounts payable and accrued liabilities
|
$
|
526,323
|
|
$
|
88
|
|
$
|
526,411
|
|
|
Deferred revenue
|
339,454
|
|
(346
|
)
|
339,108
|
|
|||
|
Deferred income taxes
|
362,701
|
|
2,066
|
|
364,767
|
|
|||
|
Equity
|
|||||||||
|
Retained earnings
|
$
|
5,791,724
|
|
$
|
6,923
|
|
$
|
5,798,647
|
|
Under the modified retrospective method of adoption, the Company is required to disclose the impact the adoption of the revenue guidance had on its Consolidated Statements of Operations. Under the previous guidance, KU’s fee revenue with Purdue University Global is not fixed and determinable until the end of Purdue University Global’s fiscal year (see Note 3). As a result, the Company would report
$4.5 million
less revenue and operating income. If the Company continued to follow its accounting policies under the previous guidance for all other revenue streams, revenue and expenses would be
$1.7 million
and
$0.6 million
lower, respectively, for the year ended December 31, 2018. This is primarily due to the net impact of the change in the timing of the recognition of revenue and costs to obtain a contract.
In January 2016, the FASB issued new guidance that substantially revises the recognition, measurement and presentation of financial assets and financial liabilities. The new guidance, among other things, requires (i) equity investments (except those accounted for under the equity method of accounting or those that result in consolidation of the investee) to be measured at fair value with changes in fair value recognized in net income, with some exceptions; (ii) simplifies the impairment assessment of equity investments without readily determinable fair values by requiring a qualitative assessment to identify impairment; (iii) requires public business entities to use the exit price notion when measuring the fair value of financial instruments for disclosure purposes; (iv) requires separate presentation of financial assets and financial liabilities by measurement category and form of financial asset on the balance sheet or the accompanying notes to the financial statements; and (v) clarifies that an entity should evaluate the need for a valuation allowance on a deferred tax asset related to available-for-sale securities in combination with the entity’s other deferred tax assets. The guidance is effective for interim and fiscal years beginning after December 15, 2017.
The Company adopted this guidance in the first quarter of 2018 and recorded a cumulative adjustment of
$194.9 million
to retained earnings on its Consolidated Balance Sheet related to unrealized gains of available-for-sale
74
securities, net of tax, previously classified within accumulated other comprehensive income. Results for reporting periods beginning after January 1, 2018 are presented under this new guidance with any changes in fair value recognized in net income. In addition, the Company elected the measurement alternative to measure cost method investments that do not have a readily determinable fair value at cost less impairment, adjusted by observable price changes with any fair value changes recognized in net income.
In February 2016, the FASB issued new guidance that requires, among other things, a lessee to recognize a right-of-use asset representing an entity’s right to use the underlying asset for the lease term and a liability for lease payments on its balance sheet, regardless of classification of a lease as operating or financing. For leases with a term of twelve months or less, a lessee is permitted to make an accounting policy election by class of underlying asset not to recognize lease assets and liabilities and account for the lease similar to existing guidance for operating leases today. This new guidance supersedes all prior guidance. The guidance is effective for interim and fiscal years beginning after December 15, 2018. Early adoption is permitted. The standard provides two methods of adoption under the modified retrospective approach. Under the comparative date method, lessees and lessors are required to recognize and measure leases as of the beginning of the earliest period presented. Under the effective date method, lessees and lessors are required to recognize and measure leases as of the period of adoption. The Company will adopt the new guidance using the effective date method on January 1, 2019.
The Company expects to elect the available package of transition practical expedients, and the use of hindsight to determine the lease term. Additionally, the Company expects to elect the short-term lease recognition exemption, and the practical expedient not to separate non-lease components from the lease components to which they relate. The guidance will have a material impact on the Company’s Consolidated Balance Sheet, but will not impact the Company’s results of operations. The most significant impact will be the recognition of right-of-use assets and lease liabilities for operating leases.
The Company has substantially completed its evaluation of the impact of adopting the new guidance, as well as its assessment of the need for any changes to the Company’s accounting policies and internal control structure. As a result, the Company will implement new processes and internal controls to enable the preparation of financial information on adoption. The Company is finalizing its evaluation of new disclosures required by the guidance to determine additional information that will need to be disclosed, including weighted average remaining lease term, and weighted average remaining discount rate.
In March 2017, the FASB issued new guidance that changes the presentation of net periodic pension cost and net periodic postretirement benefit cost for defined benefit plans. The guidance requires an issuer to disaggregate the service cost component of net periodic pension and postretirement benefit cost from other components. Under the new guidance, service cost will be included in the same line item(s) as other compensation costs arising from services rendered by employees during the period, while the other components will be recognized after income from operations. The guidance is effective for interim and fiscal years beginning after December 15, 2017. The guidance must be applied retrospectively; however, a practical expedient is available which permits an employer to use amounts previously disclosed in its pension and postretirement plans footnote for the prior comparative periods.
The Company adopted the new standard in the first quarter of 2018. In combination with the presentation change to net periodic pension cost and net periodic postretirement benefit cost, the Company allocated its costs associated with fringe benefits between operating expenses and selling, general and administrative expenses. Previously, costs related to fringe benefits were generally classified as selling, general and administrative expenses. The amounts in the previously issued financial statements have been reclassified to conform to the reclassified presentation. The effect of these changes to the Consolidated Statements of Operations for 2017 and 2016 is as follows:
|
(in thousands)
|
As Previously Reported
|
Adjustment
|
Upon Adoption
|
||||||||
|
Year Ended December 31, 2017
|
|||||||||||
|
Operating expenses
|
$
|
1,359,842
|
|
$
|
94,501
|
|
$
|
1,454,343
|
|
||
|
Selling, general and administrative expenses
|
909,592
|
|
(21,802
|
)
|
887,790
|
|
|||||
|
Income from Operations
|
209,102
|
|
(72,699
|
)
|
136,403
|
|
|||||
|
Non-operating pension and postretirement benefit income, net
|
—
|
|
72,699
|
|
72,699
|
|
|||||
|
Income Before Income Taxes
|
182,789
|
|
—
|
|
182,789
|
|
|||||
|
Year Ended December 31, 2016
|
|||||||||||
|
Operating expenses
|
$
|
1,180,945
|
|
$
|
89,085
|
|
$
|
1,270,030
|
|
||
|
Selling, general and administrative expenses
|
904,517
|
|
(8,420
|
)
|
896,097
|
|
|||||
|
Income from Operations
|
303,534
|
|
(80,665
|
)
|
222,869
|
|
|||||
|
Non-operating pension and postretirement benefit income, net
|
—
|
|
80,665
|
|
80,665
|
|
|||||
|
Income Before Income Taxes
|
250,658
|
|
—
|
|
250,658
|
|
|||||
75
In August 2018, the FASB issued new guidance that modified the disclosure requirements for employers that sponsor defined benefit pension or other postretirement plans. The new guidance, among other things, removed the following disclosure requirements: (i) the amounts in accumulated other comprehensive income expected to be recognized as components of net periodic benefit cost over the next fiscal year, and (ii) the effects of a one-percentage-point change in assumed health care cost trend rates on the (a) aggregate of the service and interest cost components of net periodic benefit costs, and (b) benefit obligation for postretirement health care benefits. The guidance also added the following disclosure requirements: (i) the weighted-average interest crediting rates for cash balance plans with promised interest crediting rates, and (ii) an explanation of the reasons for significant gains and losses related to changes in the benefit obligation for the period. This guidance is effective for fiscal years ending after December 15, 2020, with early adoption permitted. The Company adopted this guidance in the fourth quarter of 2018.
Other new pronouncements issued but not effective until after December 31, 2018, are not expected to have a material impact on the Company’s Consolidated Financial Statements.
|
3.
|
ACQUISITIONS AND DISPOSITIONS OF BUSINESSES
|
Acquisitions.
On January 31, 2019, the Company acquired a 90% interest in two auto dealerships. In addition to a cash payment, a subsidiary of the Company borrowed $30 million to finance the acquisition and entered into an interest rate swap to fix the interest rate on the debt at 4.7% per annum. The Company is required to repay the loan over a 10-year period by making monthly installment payments. The Company also entered into a management services agreement with
an entity
to operate and manage the acquired dealerships.
The acquisition is expected to provide benefits in the future by diversifying the Company’s business operations and will be included in other businesses.
During
2018
, the Company acquired
eight
businesses,
five
in its education division,
one
in its healthcare division and
two
in other businesses for
$121.1 million
in cash and contingent consideration. The assets and liabilities of the companies acquired were recorded at their estimated fair values at the date of acquisition.
In January and February 2018, Kaplan acquired the assets of i-Human Patients, Inc., a provider of cloud-based, interactive patient encounter simulations for medical and nursing professionals and educators, and another small business in test preparation and international, respectively. These acquisitions are expected to provide strategic benefits in the future.
In May 2018, Kaplan acquired a 100% interest in
Professional Publications, Inc. (
PPI
)
, an independent publisher of professional licensing exam review materials and engineering, surveying, architecture, and interior design licensure exam review, by purchasing all of its issued and outstanding shares. This acquisition is expected to provide certain strategic benefits in the future. This acquisition is included in Professional (U.S.).
On July 12, 2018, Kaplan acquired 100% of the issued and outstanding shares of
the College for Financial Planning (
CFFP
)
, a provider of financial education and training to individuals pursuing the Certified Financial Planner certification, a Master of Science in Personal Financial Planning, or a Master of Science in Finance. The acquisition is expected to expand Kaplan’s financial education product offerings and is included in Professional (U.S.).
On July 31, 2018, Dekko acquired 100% of the issued and outstanding shares of Furnlite, Inc., a Fallston, NC-based manufacturer of power and data solutions for the hospitality and residential furniture industries. Dekko’s primary reasons for the acquisition are to complement existing product offerings and to provide potential synergies across the businesses. The acquisition is included in other businesses.
In August 2018, SocialCode acquired 100% of the membership interests of Marketplace Strategy (MPS), a Cleveland-based digital marketing agency that provides strategy consulting, optimization services, advertising management and creative solutions on online marketplaces including Amazon. SocialCode’s primary reason for the acquisition is to expand its platform offerings. The acquisition is included in other businesses.
In September 2018, GHG acquired the assets of a small business and Kaplan acquired the test preparation and study guide assets of Barron’s Educational Series, a New York-based education publishing company. The acquisitions are expected to complement the healthcare and test preparation services currently offered by GHG and Kaplan, respectively. GHG is included in the healthcare division. The Barron’s Educational Series acquisition is included in test preparation.
During
2017
, the Company acquired
six
businesses,
two
in its education division,
two
in its television broadcasting division,
one
in its healthcare division and
one
in other businesses for
$318.9 million
in cash and contingent consideration, and the assumption of
$59.1 million
in certain pension and postretirement obligations. The assets and liabilities of the companies acquired were recorded at their estimated fair values at the date of acquisition.
76
On January 17, 2017, the Company closed on its agreement with Nexstar Broadcasting Group, Inc. and Media General, Inc. to acquire the assets of WCWJ, a CW affiliate television station in Jacksonville, FL, and WSLS, an NBC affiliate television station in Roanoke, VA, for cash and the assumption of certain pension obligations. The acquisition of WCWJ and WSLS will complement the other stations that GMG operates. Both of these acquisitions are included in television broadcasting.
In February 2017, Kaplan acquired a 100% interest in Genesis Training Institute, a Dubai-based provider of professional development training in the United Arab Emirates, by purchasing all of its issued and outstanding shares. Additionally, Kaplan acquired a 100% interest in Red Marker Pty Ltd., an Australia-based regulatory technology company by purchasing all of its outstanding shares. These acquisitions are expected to provide certain strategic benefits in the future. Both of these acquisitions are included in Kaplan International.
In April 2017, the Company acquired 97.72% of the issued and outstanding shares of Hoover Treated Wood Products, Inc., a Thomson, GA-based supplier of pressure impregnated kiln-dried lumber and plywood products for fire retardant and preservative applications for
$206.8 million
, net of cash acquired. The fair value of the redeemable noncontrolling interest in Hoover was $3.7 million at the acquisition date, determined using a market approach. The minority shareholders have an option to put some of their shares to the Company starting in 2019 and the remaining shares starting in 2021. The Company has an option to buy the shares of minority shareholders starting in 2027. This acquisition is consistent with the Company’s ongoing strategy of investing in companies with a history of profitability and strong management. Hoover is included in other businesses.
At the end of June 2017, GHG acquired a 100% interest in Hometown Home Health and Hospice, a Lapeer, MI-based healthcare services provider by purchasing all of its issued and outstanding shares. This acquisition expands GHG’s service area in Michigan. GHG is included in healthcare.
During 2016, the Company acquired
five
businesses,
three
businesses included in its education division and
two
businesses in other businesses for
$258.0 million
. The assets and liabilities of the companies acquired were recorded at their estimated fair values at the date of acquisition. In January 2016, Kaplan acquired a
100%
interest in Mander Portman Woodward, a provider of high-quality, bespoke education to
United Kingdom (
U.K.
)
and international students in London, Cambridge and Birmingham, by purchasing all of its issued and outstanding shares.
In February 2016, Kaplan acquired a
100%
interest in Osborne Books, an educational publisher of learning resources for accounting qualifications in the U.K., by purchasing all of its issued and outstanding shares.
The primary reason for these acquisitions was based on several strategic benefits expected to be realized in the future.
Both of these acquisitions are included in Kaplan International.
In September 2016, Dekko acquired a
100%
interest in Electri-Cable Assemblies, a Shelton, CT-based manufacturer of power, data and electrical solutions for the office furniture industry, by purchasing all of its issued and outstanding shares.
Dekko’s primary reasons for the acquisition were to complement existing product offerings and provide opportunities for synergies across the businesses.
This acquisition is included in other businesses.
Acquisition-related costs for acquisitions that closed during
2018
,
2017
and
2016
were
$1.5 million
,
$4.1 million
and
$1.5 million
, respectively, and expensed as incurred. The aggregate purchase price of these acquisitions was allocated as follows, based on acquisition date fair values to the following assets and liabilities (excluding measurement period adjustments recorded in subsequent years):
|
Purchase Price Allocation
|
||||||||||||
|
Year Ended December 31
|
||||||||||||
|
(in thousands)
|
2018
|
2017
|
2016
|
|||||||||
|
Accounts receivable
|
$
|
2,344
|
|
$
|
12,502
|
|
$
|
8,538
|
|
|||
|
Inventory
|
1,268
|
|
25,253
|
|
878
|
|
||||||
|
Property, plant and equipment
|
1,518
|
|
29,921
|
|
3,940
|
|
||||||
|
Goodwill
|
41,840
|
|
143,149
|
|
184,118
|
|
||||||
|
Indefinite-lived intangible assets
|
—
|
|
33,800
|
|
53,110
|
|
||||||
|
Amortized intangible assets
|
78,427
|
|
170,658
|
|
28,267
|
|
||||||
|
Other assets
|
5,198
|
|
1,880
|
|
1,420
|
|
||||||
|
Pension and other postretirement benefits liabilities
|
—
|
|
(59,116
|
)
|
—
|
|
||||||
|
Other liabilities
|
(7,678
|
)
|
(12,177
|
)
|
(21,892
|
)
|
||||||
|
Deferred income taxes
|
(4,900
|
)
|
(37,289
|
)
|
(11,009
|
)
|
||||||
|
Redeemable noncontrolling interest
|
—
|
|
(3,666
|
)
|
—
|
|
||||||
|
Aggregate purchase price, net of cash acquired
|
$
|
118,017
|
|
$
|
304,915
|
|
$
|
247,370
|
|
|||
The fair values recorded were based upon valuations. Goodwill is calculated as the excess of the consideration transferred over the net assets recognized and represents the estimated future economic benefits arising from other assets acquired that could not be individually identified and separately recognized. The goodwill recorded due to these acquisitions is attributable to the assembled workforces of the acquired companies and expected synergies.
77
The Company expects to deduct
$32.3 million
,
$11.0 million
and
$22.2 million
of goodwill for income tax purposes for the acquisitions completed in
2018
,
2017
and
2016
, respectively.
The acquired companies were consolidated into the Company’s financial statements starting on their respective acquisition dates. The Company’s Consolidated Statements of Operations include aggregate revenue and operating loss of
$28.8 million
and
$2.9 million
for the year ended December 31, 2018, respectively. The following unaudited pro forma financial information presents the Company’s results as if the current year acquisitions had occurred at the beginning of
2017
. The unaudited pro forma information also includes the
2017
acquisitions as if they occurred at the beginning of
2016
and the
2016
acquisitions as if they had occurred at the beginning of 2015:
|
Year Ended December 31
|
|||||||||||
|
(in thousands)
|
2018
|
2017
|
2016
|
||||||||
|
Operating revenues
|
$
|
2,735,879
|
|
$
|
2,725,046
|
|
$
|
2,570,416
|
|
||
|
Net income
|
273,688
|
|
311,397
|
|
175,021
|
|
|||||
These pro forma results were based on estimates and assumptions, which the Company believes are reasonable, and include the historical results of operations of the acquired companies and adjustments for depreciation and amortization of identified assets and the effect of pre-acquisition transaction related expenses incurred by the Company and the acquired entities. The pro forma information does not include efficiencies, cost reductions and synergies expected to result from the acquisitions. They are not the results that would have been realized had these entities been part of the Company during the periods presented and are not necessarily indicative of the Company’s consolidated results of operations in future periods.
Kaplan University Transaction.
On April 27, 2017, certain subsidiaries of Kaplan entered into a Contribution and Transfer Agreement to contribute the institutional assets and operations of Kaplan University to an Indiana non-profit, public-benefit corporation that is a subsidiary affiliated with Purdue University. The closing of the transactions contemplated by the Transfer Agreement occurred on March 22, 2018. At the same time, the parties entered into the TOSA pursuant to which Kaplan provides key non-academic operations support to the new university.
The new university operates largely online as a new Indiana public university affiliated with Purdue under the name Purdue University Global. As part of the transfer to Purdue University Global, KU transferred students, academic personnel, faculty and operations, property leases for KU’s campuses and learning centers, Kaplan-owned academic curricula and content related to KU courses. The operations support activities that Kaplan provides to Purdue University Global includes technology support, help-desk functions, human resources support for transferred faculty and employees, admissions support, financial aid administration, marketing and advertising, back-office business functions, certain test preparation and domestic and international student recruiting services.
The transfer of KU does not include any of the assets of the KU School of Professional and Continuing Education, which provides professional training and exam preparation for professional certifications and licensures, nor does it include the transfer of other Kaplan businesses such as Kaplan Test Preparation and Kaplan International. Those entities, programs and business lines remain part of Kaplan. Kaplan received nominal cash consideration upon transfer of the institutional assets.
Pursuant to the TOSA, Kaplan is not entitled to receive any reimbursement of costs incurred in providing support functions, or any fee, unless and until Purdue University Global has first covered all of its operating costs (subject to a cap). If Purdue University Global achieves cost efficiencies in its operations, then Purdue University Global may be entitled to an additional payment equal to 20% of such cost efficiencies (Purdue Efficiency Payment). In addition, during each of Purdue University Global’s first five years, prior to any payment to Kaplan, Purdue University Global is entitled to a priority payment of $10 million per year beyond costs. To the extent Purdue University Global’s revenue is insufficient to pay the $10 million per year priority payment, Kaplan is required to advance an amount to Purdue University Global to cover such insufficiency. At closing, Kaplan paid to Purdue University Global an advance in the amount of $20 million, representing, and in lieu of, priority payments for Purdue University Global’s fiscal years ending June 30, 2019 and June 30, 2020.
To the extent that there are sufficient revenues to pay the Purdue Efficiency Payment, Purdue University Global is reimbursed for its operating costs (subject to a cap) and the priority payment to Purdue University Global is paid. To the extent there is remaining revenue, Kaplan will then receive reimbursement for its operating costs (subject to a cap) of providing the support activities. If Kaplan achieves cost efficiencies in its operations, then Kaplan may be entitled to an additional payment equal to 20% of such cost efficiencies (Kaplan Efficiency Payment). If there are sufficient revenues, Kaplan may also receive a fee equal to 12.5% of Purdue University Global’s revenue. The fee will increase to 13% beginning with Purdue University Global’s fiscal year ending June 30, 2023 and continuing through Purdue University Global’s fiscal year ending June 30, 2027, and then the fee will return to 12.5% thereafter. Subject to certain limitations, a portion of the fee that is earned by Kaplan in one year may be carried over and instead paid to Kaplan in subsequent years.
78
After the first five years of the TOSA, Kaplan and Purdue University Global will be entitled to payments in a manner consistent with the structure described above, except that (i) Purdue University Global will no longer be entitled to a priority payment and (ii) to the extent that there are sufficient revenues after payment of the Kaplan Efficiency Payment (if any), Purdue University Global will be entitled to an annual payment equal to 10% of the remaining revenue after the Kaplan Efficiency Payment (if any) is paid and subject to certain other adjustments. The TOSA has a 30-year initial term, which will automatically renew for five-year periods unless terminated. After the sixth year, Purdue University Global has the right to terminate the agreement upon payment of a termination fee equal to 1.25 times Purdue University Global’s revenue for the preceding 12-month period, which payment would be made pursuant to a 10-year note, and at the election of Purdue University Global, it may receive for no additional consideration certain assets used by Kaplan to provide the support activities pursuant to the TOSA. At the end of the 30-year term, if Purdue University Global does not renew the TOSA, Purdue University Global will be obligated to make a final payment of 75% of its total revenue earned during the preceding 12-month period, which payment will be made pursuant to a 10-year note, and at the election of Purdue University Global, it may receive for no additional consideration certain assets used by Kaplan to provide the support activities pursuant to the TOSA.
Either party may terminate the TOSA at any time if Purdue University Global generates (i) $25 million in cash operating losses for three consecutive years or (ii) aggregate cash operating losses greater than $75 million at any point during the initial term. Operating loss is defined as the amount of revenue Purdue University Global generates minus the sum of (1) Purdue University Global’s and Kaplan’s respective costs in performing academic and support functions and (2) the $10 million priority payment to Purdue University Global in each of the first five years. Upon termination for any reason, Purdue University Global will retain the assets that Kaplan contributed pursuant to the Transfer Agreement. Each party also has certain termination rights in connection with a material default or material breach of the TOSA by the other party.
Pursuant to the U.S. Department of Education (ED) requirements, Purdue assumes responsibility for any liability arising from the operation of the institution. This assumption will not limit Kaplan’s obligation to indemnify Purdue for pre-closing liabilities under the Transfer Agreement. As a result of the transfer of KU, Kaplan will no longer own or operate KU or any other institution participating in student financial aid programs that have been created under Title IV of the U.S. Federal Higher Education Act of 1965, as amended. Consequently, Kaplan is no longer responsible for operating KU. However, pursuant to the TOSA, Kaplan will be performing functions that fall within the ED’s definition of a third-party servicer and will, therefore, assume certain regulatory responsibilities that require approval by the ED. The third-party servicer arrangement between Kaplan and Purdue University Global is also subject to information security requirements established by the Federal Trade Commission as well as all aspects of the Family Educational Rights and Privacy Act. As a third-party servicer, Kaplan may be required to undergo an annual compliance audit of its administration of the Title IV functions or services that it performs.
As a result of the KU Transaction, the Company recorded a pre-tax gain of $4.3 million in the first quarter of 2018. For financial reporting purposes, Kaplan may receive payment of additional consideration for the sale of the institutional assets as part of the fee to the extent there are sufficient revenues available after paying all amounts required by the TOSA. The Company recorded a $1.9 million contingent consideration gain related to the disposition in the year ended December 31, 2018, and did not adjust the contingent consideration in the fourth quarter of 2018.
The revenue and operating income related to the KU business disposed of is as follows:
|
Year Ended December 31
|
||||||||||||
|
(in thousands)
|
2018
|
2017
|
2016
|
|||||||||
|
Revenue
|
$
|
91,526
|
|
$
|
430,645
|
|
$
|
500,914
|
|
|||
|
Operating income
|
213
|
|
17,869
|
|
39,498
|
|
||||||
Sale of Businesses.
In February 2018, Kaplan completed the sale of a small business which was included in Test Preparation. In September 2018, Kaplan Australia completed the sale of a small business which was included in Kaplan International.
In February 2017, GHG completed the sale of Celtic Healthcare of Maryland. In the fourth quarter of 2017, Kaplan Australia completed the sale of a small business, which was included in Kaplan International.
In January 2016, Kaplan completed the sale of Colloquy, which was included in Kaplan Corporate and Other. As a result of these sales, the Company reported gains (losses) in other non-operating income
(see Note 15)
.
Other Transactions.
In June 2018, the Company incurred $6.2 million of interest expense related to the mandatorily redeemable noncontrolling interest redemption settlement at GHG. The mandatorily redeemable noncontrolling interest was redeemed and paid in July 2018.
In June 2016, Residential Healthcare (Residential) and a Michigan hospital formed a joint venture to provide home health services to patients in western Michigan. In connection with this transaction, Residential contributed its western Michigan home health operations to the joint venture and then sold
60%
of the newly formed venture to its
79
Michigan hospital partner. Although Residential manages the operations of the joint venture, Residential holds a
40%
interest in the joint venture, so the operating results of the joint venture are not consolidated, and the pro rata operating results are included in the Company’s equity in earnings of affiliates.
In June 2016, the Company purchased the outstanding
20%
redeemable noncontrolling interest in Residential. At that time, the Company recorded an increase to redeemable noncontrolling interest of
$3.0 million
, with a corresponding decrease to capital in excess of par value, to reflect the redemption value of the redeemable noncontrolling interest at
$24.0 million
. Following this transaction, Celtic Healthcare (Celtic) and Residential combined their business operations to form GHG. The redeemable noncontrolling interest shareholders in Celtic exchanged their
20%
interest in Celtic for a
10%
mandatorily redeemable noncontrolling interest in the combined entity, and the Company recorded a
$4.1 million
net increase to the mandatorily redeemable noncontrolling interest to reflect the estimated fair value of the mandatorily redeemable noncontrolling interest.
|
4.
|
INVESTMENTS
|
Money Market Investments.
As of
December 31, 2018
and
2017
, the Company had money market investments of
$75.5 million
and
$217.6 million
, respectively, that are classified as cash, cash equivalents and restricted cash in the Company’s Consolidated Balance Sheets.
Investments in Marketable Equity Securities.
Investments in marketable equity securities consist of the following:
|
As of December 31
|
|||||||
|
(in thousands)
|
2018
|
2017
|
|||||
|
Total cost
|
$
|
282,563
|
|
$
|
269,343
|
|
|
|
Gross unrealized gains
|
216,111
|
|
266,972
|
|
|||
|
Gross unrealized losses
|
(2,284
|
)
|
—
|
|
|||
|
Total Fair Value
|
$
|
496,390
|
|
$
|
536,315
|
|
|
At
December 31, 2018
and
2017
, the Company owned
28,000
shares in Markel Corporation (Markel) valued at
$29.1 million
and
$31.9 million
, respectively. The Co-Chief Executive Officer of Markel, Mr. Thomas S. Gayner, is a member of the Company’s Board of Directors.
The Company purchased
$42.7 million
of marketable equity securities during
2018
. There were
no
purchases during
2017
. The Company settled on
$48.3 million
of marketable equity securities during 2016, of which
$47.9 million
was purchased during the year.
During
2018
, the gross cumulative realized gains from the sales of marketable equity securities were
$37.3 million
. The total proceeds from such sales were
$66.7 million
. There were
no
sales of marketable equity securities during
2017
. During 2016, proceeds from sales of marketable equity securities were
$29.7 million
, resulting in gross realized losses of
$8.1 million
and gross realized gains of
$6.2 million
.
The net loss on marketable equity securities comprised the following:
|
Year ended
|
|||
|
(in thousands)
|
December 31, 2018
|
||
|
Loss on marketable equity securities, net
|
$
|
(15,843
|
)
|
|
Plus: Net losses in earnings from marketable equity securities sold
|
4,271
|
|
|
|
Net unrealized losses in earnings from marketable equity securities still held at the end of the year
|
$
|
(11,572
|
)
|
Investments in Affiliates.
As of
December 31, 2018
, the Company held an approximate
11%
interest in Intersection Holdings, LLC, and in several other affiliates; GHG held a
40%
interest in Residential Home Health Illinois, a
42.5%
interest in Residential Hospice Illinois, a
40%
interest in the joint venture formed between GHG and a Michigan hospital, and a
40%
interest in the joint venture formed between GHG and Allegheny Health Network (AHN). For the year ended
December 31, 2018
and
2017
, the Company recorded
$12.1 million
and
$18.3 million
, respectively, in revenue for services provided to the affiliates of GHG.
Additionally, Kaplan International Holdings Limited (KIHL) held a
45%
interest in a joint venture formed with York University. KIHL agreed to loan the joint venture
£25 million
, of which
£16 million
was advanced as of December 31, 2017. In the second quarter of 2018, KIHL advanced a final amount of
£6 million
in additional funding to the joint venture under this agreement, bringing the total amount advanced to
£22 million
. The loan is repayable over
25
years at an interest rate of
7%
and the loan is guaranteed by the University of York.
As a result of operating losses, in the fourth quarter of
2017
, the Company recorded a
$2.8 million
write-down on its investment in an affiliate. As a result of the challenging industry operating environment and operating losses, in the
80
fourth quarter of 2016, the Company recorded an
$8.4 million
write-down on its investment in HomeHero, a company that managed an online senior home care marketplace. In the third quarter of 2018, the Company recorded a
$2.1 million
gain in equity in earnings of affiliates following the receipt of a final distribution from HomeHero upon its liquidation. Also in the third quarter of 2018, the Company recorded a
$5.8 million
gain in equity in earnings of affiliates due to a funding event that increased the estimated liquidation value of the Company’s investment in one of its affiliates.
In February 2019, the Company sold its interest in Gimlet Media; the Company will report a gain in the first quarter of 2019.
Cost Method Investments.
The Company held investments without readily determinable fair values in a number of equity securities that are accounted for as cost method investments, which are recorded at cost, less impairment, and adjusted for observable price changes for identical or similar investments of the same issuer. The carrying value of these investments was
$30.6 million
and
$19.9 million
as of
December 31, 2018
and
2017
, respectively. During 2018, the Company recorded gains of
$11.7 million
to those equity securities based on observable transactions and impairment losses of
$2.7 million
.
5. ACCOUNTS RECEIVABLE, ACCOUNTS PAYABLE AND ACCRUED LIABILITIES
Accounts receivable consist of the following:
|
As of December 31
|
|||||||
|
(in thousands)
|
2018
|
2017
|
|||||
|
Receivables from contracts with customers, less doubtful accounts of $14,775 and $22,975
|
$
|
538,021
|
|
$
|
600,215
|
|
|
|
Other receivables
|
44,259
|
|
20,104
|
|
|||
|
|
$
|
582,280
|
|
$
|
620,319
|
|
|
The changes in allowance for doubtful accounts was as follows:
|
(in thousands)
|
Balance at
Beginning of Period
|
Additions –
Charged to
Costs and
Expenses
|
Deductions
|
Balance
at
End of
Period
|
|||||||||||
|
2018
|
$
|
22,975
|
|
$
|
10,209
|
|
$
|
(18,409
|
)
|
$
|
14,775
|
|
|||
|
2017
|
$
|
26,723
|
|
$
|
33,830
|
|
$
|
(37,578
|
)
|
$
|
22,975
|
|
|||
|
2016
|
$
|
27,854
|
|
$
|
29,718
|
|
$
|
(30,849
|
)
|
$
|
26,723
|
|
|||
Accounts payable and accrued liabilities consist of the following:
|
As of December 31
|
|||||||
|
(in thousands)
|
2018
|
2017
|
|||||
|
Accounts payable and accrued liabilities
|
$
|
337,123
|
|
$
|
385,927
|
|
|
|
Accrued compensation and related benefits
|
149,455
|
|
140,396
|
|
|||
|
|
$
|
486,578
|
|
$
|
526,323
|
|
|
Cash overdrafts of
$0.3 million
and
$6.0 million
are included in accounts payable and accrued liabilities at
December 31, 2018
and
2017
, respectively.
|
6.
|
INVENTORIES AND CONTRACTS IN PROGRESS
|
Inventories and contracts in progress consist of the following:
|
As of December 31
|
|||||||
|
(in thousands)
|
2018
|
2017
|
|||||
|
Raw materials
|
$
|
37,248
|
|
$
|
30,429
|
|
|
|
Work-in-process
|
11,633
|
|
10,258
|
|
|||
|
Finished goods
|
17,861
|
|
18,851
|
|
|||
|
Contracts in progress
|
2,735
|
|
1,074
|
|
|||
|
|
$
|
69,477
|
|
$
|
60,612
|
|
|
81
|
7.
|
PROPERTY, PLANT AND EQUIPMENT
|
Property, plant and equipment consist of the following:
|
As of December 31
|
|||||||
|
(in thousands)
|
2018
|
2017
|
|||||
|
Land
|
$
|
15,965
|
|
$
|
16,190
|
|
|
|
Buildings
|
108,683
|
|
107,932
|
|
|||
|
Machinery, equipment and fixtures
|
382,064
|
|
387,914
|
|
|||
|
Leasehold improvements
|
206,170
|
|
215,445
|
|
|||
|
Construction in progress
|
68,064
|
|
16,649
|
|
|||
|
780,946
|
|
744,130
|
|
||||
|
Less accumulated depreciation
|
(487,861
|
)
|
(484,772
|
)
|
|||
|
$
|
293,085
|
|
$
|
259,358
|
|
||
Depreciation expense was
$56.7 million
,
$62.5 million
and
$64.6 million
in
2018
,
2017
and
2016
, respectively.
The Company capitalized
$0.8 million
,
$0.3 million
,
and
$0.4 million
of interest related to the construction of buildings in
2018
,
2017
and
2016
, respectively.
In the third quarter of 2018, GHG recorded an impairment charge of
$0.2 million
. In the second quarter of 2017, as a result of a challenging operating environment, Forney recorded a
$0.6 million
impairment charge. In the third quarter of 2017, GHG recorded an impairment charge of
$0.4 million
. The Company estimated the fair value of the property, plant and equipment using a market approach. Forney is included in other businesses.
|
8.
|
GOODWILL AND OTHER INTANGIBLE ASSETS
|
In the third quarter of 2018, Healthcare recorded an intangible asset impairment charge of
$7.9 million
following the decision to discontinue the use of the Celtic trade name. The fair value of the intangible asset was estimated using an income approach.
In the second quarter of 2017, as a result of a challenging operating environment, the Forney reporting unit recorded a goodwill and intangible asset impairment charge of
$8.6 million
. The Company performed an interim review of the goodwill and other long-lived assets of the reporting unit by utilizing a discounted cash flow model to estimate the fair value. The carrying value of the reporting unit exceeded the estimated fair value, resulting in a goodwill impairment charge for the amount by which the carrying value exceeded the reporting unit’s estimated fair value. Forney is included in other businesses.
In the fourth quarter of 2016, as a result of the challenging industry operating environment and operating losses,
one
of the businesses in the other businesses segment recorded a goodwill impairment charge of
$1.6 million
.
Amortization of intangible assets for the years ended
December 31, 2018
,
2017
and
2016
, was
$47.4 million
,
$41.2 million
and
$26.7 million
, respectively. Amortization of intangible assets is estimated to be approximately
$52 million
in
2019
,
$49 million
in
2020
,
$43 million
in
2021
,
$37 million
in
2022
,
$29 million
in
2023
and
$53 million
thereafter.
82
The changes in the carrying amount of goodwill, by segment, were as follows:
|
(in thousands)
|
Education
|
Television
Broadcasting
|
Healthcare
|
Other
Businesses
|
Total
|
||||||||||||||
|
As of December 31, 2016
|
|
|
|
|
|||||||||||||||
|
Goodwill
|
$
|
1,111,003
|
|
$
|
168,345
|
|
$
|
59,640
|
|
$
|
142,501
|
|
$
|
1,481,489
|
|
||||
|
Accumulated impairment losses
|
(350,850
|
)
|
—
|
|
—
|
|
(7,685
|
)
|
(358,535
|
)
|
|||||||||
|
|
760,153
|
|
168,345
|
|
59,640
|
|
134,816
|
|
1,122,954
|
|
|||||||||
|
Acquisitions
|
19,174
|
|
22,470
|
|
10,181
|
|
91,324
|
|
143,149
|
|
|||||||||
|
Impairment
|
—
|
|
—
|
|
—
|
|
(7,616
|
)
|
(7,616
|
)
|
|||||||||
|
Dispositions
|
—
|
|
—
|
|
(412
|
)
|
—
|
|
(412
|
)
|
|||||||||
|
Foreign currency exchange rate changes
|
41,635
|
|
—
|
|
—
|
|
—
|
|
41,635
|
|
|||||||||
|
As of December 31, 2017
|
|
|
|
|
|
|
|
|
|||||||||||
|
Goodwill
|
1,171,812
|
|
190,815
|
|
69,409
|
|
233,825
|
|
1,665,861
|
|
|||||||||
|
Accumulated impairment losses
|
(350,850
|
)
|
—
|
|
—
|
|
(15,301
|
)
|
(366,151
|
)
|
|||||||||
|
|
820,962
|
|
190,815
|
|
69,409
|
|
218,524
|
|
1,299,710
|
|
|||||||||
|
Acquisitions
|
20,424
|
|
—
|
|
217
|
|
21,199
|
|
41,840
|
|
|||||||||
|
Dispositions
|
(11,191
|
)
|
—
|
|
—
|
|
—
|
|
(11,191
|
)
|
|||||||||
|
Foreign currency exchange rate changes
|
(32,647
|
)
|
—
|
|
—
|
|
—
|
|
(32,647
|
)
|
|||||||||
|
As of December 31, 2018
|
|||||||||||||||||||
|
Goodwill
|
1,128,699
|
|
190,815
|
|
69,626
|
|
255,024
|
|
1,644,164
|
|
|||||||||
|
Accumulated impairment losses
|
(331,151
|
)
|
—
|
|
—
|
|
(15,301
|
)
|
(346,452
|
)
|
|||||||||
|
|
$
|
797,548
|
|
$
|
190,815
|
|
$
|
69,626
|
|
$
|
239,723
|
|
$
|
1,297,712
|
|
||||
The changes in carrying amount of goodwill at the Company’s education division were as follows:
|
(in thousands)
|
Kaplan
International
|
Higher
Education
|
Test
Preparation
|
Professional (U.S.)
|
Total
|
||||||||||||||
|
As of December 31, 2016
|
|
|
|
|
|||||||||||||||
|
Goodwill
|
$
|
555,185
|
|
$
|
205,494
|
|
$
|
166,098
|
|
$
|
184,226
|
|
$
|
1,111,003
|
|
||||
|
Accumulated impairment losses
|
—
|
|
(131,023
|
)
|
(102,259
|
)
|
(117,568
|
)
|
(350,850
|
)
|
|||||||||
|
|
555,185
|
|
74,471
|
|
63,839
|
|
66,658
|
|
760,153
|
|
|||||||||
|
Acquisitions
|
19,174
|
|
—
|
|
—
|
|
—
|
|
19,174
|
|
|||||||||
|
Foreign currency exchange rate changes
|
41,502
|
|
—
|
|
—
|
|
133
|
|
41,635
|
|
|||||||||
|
As of December 31, 2017
|
|||||||||||||||||||
|
Goodwill
|
615,861
|
|
205,494
|
|
166,098
|
|
184,359
|
|
1,171,812
|
|
|||||||||
|
Accumulated impairment losses
|
—
|
|
(131,023
|
)
|
(102,259
|
)
|
(117,568
|
)
|
(350,850
|
)
|
|||||||||
|
|
615,861
|
|
74,471
|
|
63,839
|
|
66,791
|
|
820,962
|
|
|||||||||
|
Acquisitions
|
62
|
|
—
|
|
822
|
|
19,540
|
|
20,424
|
|
|||||||||
|
Dispositions
|
—
|
|
(11,191
|
)
|
—
|
|
—
|
|
(11,191
|
)
|
|||||||||
|
Foreign currency exchange rate changes
|
(32,499
|
)
|
(40
|
)
|
—
|
|
(108
|
)
|
(32,647
|
)
|
|||||||||
|
As of December 31, 2018
|
|
|
|
|
|
|
|||||||||||||
|
Goodwill
|
583,424
|
|
174,564
|
|
166,920
|
|
203,791
|
|
1,128,699
|
|
|||||||||
|
Accumulated impairment losses
|
—
|
|
(111,324
|
)
|
(102,259
|
)
|
(117,568
|
)
|
(331,151
|
)
|
|||||||||
|
|
$
|
583,424
|
|
$
|
63,240
|
|
$
|
64,661
|
|
$
|
86,223
|
|
$
|
797,548
|
|
||||
83
Other intangible assets consist of the following:
|
|
|
As of December 31, 2018
|
As of December 31, 2017
|
||||||||||||||||||||||
|
(in thousands)
|
Useful
Life
Range
|
Gross
Carrying
Amount
|
Accumulated
Amortization
|
Net
Carrying
Amount
|
Gross
Carrying Amount |
Accumulated
Amortization |
Net
Carrying Amount |
||||||||||||||||||
|
Amortized Intangible Assets
|
|
|
|
|
|
|
|||||||||||||||||||
|
Student and customer relationships
|
2–10 years (1)
|
$
|
282,761
|
|
$
|
114,429
|
|
$
|
168,332
|
|
$
|
260,464
|
|
$
|
83,690
|
|
$
|
176,774
|
|
||||||
|
Trade names and trademarks
|
2–10 years
|
87,285
|
|
39,825
|
|
47,460
|
|
50,286
|
|
25,596
|
|
24,690
|
|
||||||||||||
|
Network affiliation agreements
|
10 years
|
17,400
|
|
3,408
|
|
13,992
|
|
17,400
|
|
1,668
|
|
15,732
|
|
||||||||||||
|
Databases and technology
|
3–6 years
|
27,041
|
|
8,471
|
|
18,570
|
|
19,563
|
|
5,008
|
|
14,555
|
|
||||||||||||
|
Noncompete agreements
|
2–5 years
|
1,088
|
|
838
|
|
250
|
|
930
|
|
467
|
|
463
|
|
||||||||||||
|
Other
|
1–8 years
|
24,530
|
|
9,873
|
|
14,657
|
|
13,430
|
|
7,668
|
|
5,762
|
|
||||||||||||
|
|
|
$
|
440,105
|
|
$
|
176,844
|
|
$
|
263,261
|
|
$
|
362,073
|
|
$
|
124,097
|
|
$
|
237,976
|
|
||||||
|
Indefinite-Lived Intangible Assets
|
|
|
|
|
|
|
|
|
|
|
|||||||||||||||
|
Trade names and trademarks
|
|
$
|
80,102
|
|
|
|
|
|
$
|
82,745
|
|
||||||||||||||
|
FCC licenses
|
18,800
|
|
18,800
|
|
|||||||||||||||||||||
|
Licensure and accreditation
|
|
150
|
|
|
|
|
|
650
|
|
|
|
|
|
||||||||||||
|
|
|
$
|
99,052
|
|
|
|
|
|
$
|
102,195
|
|
|
|
|
|
||||||||||
____________
|
(1)
|
As of December 31, 2017, the student and customer relationships’ minimum useful life was 1 year.
|
|
9.
|
INCOME TAXES
|
Income before income taxes consists of the following:
|
Year Ended December 31
|
|||||||||||
|
(in thousands)
|
2018
|
2017
|
2016
|
||||||||
|
U.S.
|
$
|
257,312
|
|
$
|
134,276
|
|
$
|
227,457
|
|
||
|
Non-U.S.
|
66,196
|
|
48,513
|
|
23,201
|
|
|||||
|
$
|
323,508
|
|
$
|
182,789
|
|
$
|
250,658
|
|
|||
The provision for (benefit from) income taxes consists of the following:
|
(in thousands)
|
Current
|
Deferred
|
Total
|
||||||||
|
Year Ended December 31, 2018
|
|
|
|
||||||||
|
U.S. Federal
|
$
|
46,059
|
|
$
|
16,718
|
|
$
|
62,777
|
|
||
|
State and Local
|
2,240
|
|
(23,809
|
)
|
(21,569
|
)
|
|||||
|
Non-U.S.
|
10,924
|
|
(32
|
)
|
10,892
|
|
|||||
|
$
|
59,223
|
|
$
|
(7,123
|
)
|
$
|
52,100
|
|
|||
|
Year Ended December 31, 2017
|
|
|
|||||||||
|
U.S. Federal
|
$
|
10,743
|
|
$
|
(153,217
|
)
|
$
|
(142,474
|
)
|
||
|
State and Local
|
5,930
|
|
3,306
|
|
9,236
|
|
|||||
|
Non-U.S.
|
10,079
|
|
3,459
|
|
13,538
|
|
|||||
|
$
|
26,752
|
|
$
|
(146,452
|
)
|
$
|
(119,700
|
)
|
|||
|
Year Ended December 31, 2016
|
|
|
|||||||||
|
U.S. Federal
|
$
|
56,342
|
|
$
|
33,959
|
|
$
|
90,301
|
|
||
|
State and Local
|
6,325
|
|
(5,164
|
)
|
1,161
|
|
|||||
|
Non-U.S.
|
8,463
|
|
(18,725
|
)
|
(10,262
|
)
|
|||||
|
$
|
71,130
|
|
$
|
10,070
|
|
$
|
81,200
|
|
|||
84
The provision for income taxes differs from the amount of income tax determined by applying the U.S. Federal statutory rate of
21%
in 2018, and 35% in 2017 and 2016, to the income before taxes, as a result of the following:
|
Year Ended December 31
|
|||||||||||
|
(in thousands)
|
2018
|
2017
|
2016
|
||||||||
|
U.S. Federal taxes at statutory rate (see above)
|
$
|
67,937
|
|
$
|
63,976
|
|
$
|
87,731
|
|
||
|
State and local taxes, net of U.S. Federal tax
|
(1,279
|
)
|
6,949
|
|
(2,965
|
)
|
|||||
|
Valuation allowances against state tax benefits, net of U.S. Federal tax
|
(15,767
|
)
|
(946
|
)
|
3,196
|
|
|||||
|
Stock-based compensation
|
(1,731
|
)
|
(6,023
|
)
|
—
|
|
|||||
|
Valuation allowances against other non-U.S. income tax benefits
|
1,322
|
|
(1,935
|
)
|
(12,688
|
)
|
|||||
|
Goodwill impairments and dispositions
|
—
|
|
—
|
|
(5,631
|
)
|
|||||
|
U.S. Federal Manufacturing Deduction tax benefits
|
—
|
|
(1,329
|
)
|
(6,012
|
)
|
|||||
|
Write-off of deferred taxes related to intercompany loans
|
—
|
|
—
|
|
10,965
|
|
|||||
|
Deferred tax impact of U.S. Federal tax rate reduction to 21%, net of state tax impact
|
—
|
|
(153,336
|
)
|
—
|
|
|||||
|
Deferred tax benefit on unremitted non-U.S. subsidiary earnings related to the Tax Act
|
—
|
|
(28,324
|
)
|
—
|
|
|||||
|
Other, net
|
1,618
|
|
1,268
|
|
6,604
|
|
|||||
|
Provision for (Benefit from) Income Taxes
|
$
|
52,100
|
|
$
|
(119,700
|
)
|
$
|
81,200
|
|
||
The Tax Cuts and Jobs Act (the Tax Act) was enacted on December 22, 2017, making significant changes to the Internal Revenue Code. In accordance with SEC Staff Accounting Bulletin No. 118 (SAB 118) the Company finalized its analysis of the Tax Act and no material adjustments were made in the Consolidated Financial Statements for the year ended
December 31, 2018
with respect to provisional amounts previously recorded.
Changes as a result of the Tax Act include, but are not limited to, a reduction in the federal corporate income tax rate from 35% to
21%
effective January 1, 2018; the imposition of a one-time transition tax on historic earnings of certain non-U.S. subsidiaries that were previously tax deferred; and the imposition of new U.S. taxes on certain non-U.S. earnings. The U.S. Federal corporate income tax rate change resulted in a one-time, non-cash benefit and corresponding reduction of the Company’s U.S. Federal deferred tax liabilities, net of the state tax impact, of
$153.3 million
, which was recorded in the fourth quarter of 2017, the period in which the legislation was enacted. The Company did not incur, and did not record, any liability with respect to the one-time U.S. transition tax imposed by the Tax Act on unremitted non-U.S. subsidiary earnings. The Company estimates that unremitted non-U.S. subsidiary earnings, when distributed, will not be subject to tax except to the extent non-U.S. withholding taxes are imposed. Accordingly, the Company recorded net deferred tax benefits and a corresponding reduction in deferred tax liabilities of
$28.3 million
in the fourth quarter of 2017, with respect to unremitted non-U.S. subsidiary earnings. Approximately
$1.7 million
of deferred tax liabilities remained recorded on the books at
December 31, 2018
, with respect to future non-U.S. withholding taxes the Company estimated may be imposed on future cash distributions.
During 2016, certain intercompany loans were capitalized and other intercompany loans were designated as long-term investments, resulting in the write-off of
$11.0 million
i
n U.S. deferred tax assets. Also, the Company benefited from a favorable
$5.6 million
out of period deferred tax adjustment related to the KHE goodwill impairment recorded in the third quarter of 2015.
85
Deferred income taxes consist of the following:
|
As of December 31
|
|||||||
|
(in thousands)
|
2018
|
2017
|
|||||
|
Employee benefit obligations
|
$
|
68,392
|
|
$
|
84,148
|
|
|
|
Accounts receivable
|
4,449
|
|
5,481
|
|
|||
|
State income tax loss carryforwards
|
34,107
|
|
35,434
|
|
|||
|
State capital loss carryforwards
|
1,093
|
|
—
|
|
|||
|
U.S. Federal income tax loss carryforwards
|
2,100
|
|
2,857
|
|
|||
|
U.S. Federal foreign income tax credit carryforwards
|
987
|
|
2,522
|
|
|||
|
Non-U.S. income tax loss carryforwards
|
15,868
|
|
18,797
|
|
|||
|
Non-U.S. capital loss carryforwards
|
3,609
|
|
2,336
|
|
|||
|
Other
|
14,657
|
|
26,546
|
|
|||
|
Deferred Tax Assets
|
145,262
|
|
178,121
|
|
|||
|
Valuation allowances
|
(33,120
|
)
|
(48,742
|
)
|
|||
|
Deferred Tax Assets, Net
|
$
|
112,142
|
|
$
|
129,379
|
|
|
|
Prepaid pension cost
|
269,412
|
|
283,604
|
|
|||
|
Unrealized gain on available-for-sale securities
|
51,242
|
|
70,827
|
|
|||
|
Goodwill and other intangible assets
|
88,798
|
|
109,428
|
|
|||
|
Property, plant and equipment
|
9,997
|
|
11,248
|
|
|||
|
Non-U.S. withholding tax
|
1,726
|
|
1,606
|
|
|||
|
Deferred Tax Liabilities
|
$
|
421,175
|
|
$
|
476,713
|
|
|
|
Deferred Income Tax Liabilities, Net
|
$
|
309,033
|
|
$
|
347,334
|
|
|
The Company has
$698.9 million
of state income tax net operating loss carryforwards available to offset future state taxable income. State income tax loss carryforwards, if unutilized, will start to expire approximately as follows:
|
(in millions)
|
|
||
|
2019
|
$
|
1.8
|
|
|
2020
|
15.5
|
|
|
|
2021
|
17.1
|
|
|
|
2022
|
0.3
|
|
|
|
2023
|
5.0
|
|
|
|
2024 and after
|
659.2
|
|
|
|
Total
|
$
|
698.9
|
|
The Company has recorded at
December 31, 2018
,
$34.1 million
in deferred state income tax assets, net of U.S. Federal income tax, with respect to these state income tax loss carryforwards. The Company has established
$17.9 million
in valuation allowances against these deferred state income tax assets, since the Company has determined that it is more likely than not that some of these state tax losses may not be fully utilized in the future to reduce state taxable income. During 2018, the Company’s education division released valuation allowances recorded against state deferred tax assets, net of U.S. Federal tax, of approximately
$20.0 million
because the education division recently generated positive operating results that support the realization of these deferred tax assets.
The Company has
$9.9 million
of U.S. Federal income tax loss carryforwards obtained as a result of prior stock acquisitions. U.S. Federal income tax loss carryforwards are expected to be fully utilized as follows:
|
(in millions)
|
|
||
|
2019
|
$
|
3.3
|
|
|
2020
|
3.3
|
|
|
|
2021
|
1.1
|
|
|
|
2022
|
0.9
|
|
|
|
2023
|
0.4
|
|
|
|
2024 and after
|
0.9
|
|
|
|
Total
|
$
|
9.9
|
|
The Company has established at
December 31, 2018
,
$2.1 million
in U.S. Federal deferred tax assets with respect to these U.S. Federal income tax loss carryforwards.
For U.S. Federal income tax purposes, the Company has
$1.0 million
of foreign tax credits available to be credited against future U.S. Federal income tax liabilities. If unutilized, these foreign tax credits will start to expire in 2023. The Company has established at
December 31, 2018
,
$1.0 million
of U.S. Federal deferred tax assets with respect
86
to these U.S. Federal foreign tax credit carryforwards, and the Company has recorded a full valuation allowance against these deferred tax assets since the Company determined that it is more likely than not these foreign tax credit carryforwards may not be utilized in the future to reduce U.S. Federal income taxes.
The Company has
$58.1 million
of non-U.S. income tax loss carryforwards, as a result of operating losses and carryforwards obtained through prior stock acquisitions that are available to offset future non-U.S. taxable income and has recorded, with respect to these losses,
$15.9 million
in non-U.S. deferred income tax assets. The Company has established
$6.1 million
in valuation allowances against the deferred tax assets for the portion of non-U.S. tax losses that may not be utilized to reduce future non-U.S. taxable income. The
$58.1 million
of non-U.S. income tax loss carryforwards consist of
$46.8 million
in losses that may be carried forward indefinitely;
$8.4 million
of losses that, if unutilized, will expire in varying amounts through
2023
; and
$2.9 million
of losses that, if unutilized, will start to expire after
2023
.
The Company has
$12.0 million
of non-U.S. capital loss carryforwards that may be carried forward indefinitely and are available to offset future non-U.S. capital gains. The Company recorded a
$3.6 million
non-U.S. deferred income tax asset for these non-U.S. capital loss carryforwards and has established a full valuation allowance against this non-U.S. deferred tax asset since the Company has determined that it is more likely than not that the capital loss carryforwards may not be utilized to reduce taxable income in the future.
Deferred tax valuation allowances and changes in deferred tax valuation allowances were as follows:
|
(in thousands)
|
Balance at Beginning of Period
|
Tax Expense and Revaluation
|
Deductions
|
Balance at End of
Period
|
|||||||||||
|
Year ended
|
|
|
|
|
|||||||||||
|
December 31, 2018
|
$
|
48,742
|
|
$
|
4,413
|
|
$
|
(20,035
|
)
|
$
|
33,120
|
|
|||
|
December 31, 2017
|
$
|
41,319
|
|
$
|
7,423
|
|
$
|
—
|
|
$
|
48,742
|
|
|||
|
December 31, 2016
|
$
|
69,545
|
|
$
|
4,709
|
|
$
|
(32,935
|
)
|
$
|
41,319
|
|
|||
The Company has established
$22.2 million
in valuation allowances against deferred state tax assets recognized, net of U.S. Federal tax. As stated above, approximately
$17.9 million
of the valuation allowances, net of U.S. Federal income tax, relate to state income tax loss carryforwards. The Company has established valuation allowances against deferred state income tax assets, without considering potentially offsetting deferred tax liabilities established with respect to prepaid pension cost and goodwill. Prepaid pension cost and goodwill have not been considered a source of future taxable income for realizing those state deferred tax assets recognized since these temporary differences are not likely to reverse in the foreseeable future, and at this time no material deferred tax assets recorded are impacted by the new indefinite net operating loss carryforward rules. The valuation allowances established against deferred state income tax assets may increase or decrease within the next 12 months, based on operating results or the market value of investment holdings. The Company will be monitoring future results on a quarterly basis to determine whether the valuation allowances provided against deferred state tax assets should be increased or decreased, as future circumstances warrant. The Company’s education division released valuation allowances against state deferred tax assets of
$20.0 million
during 2018, as the education division recently generated positive operating results that support the realization of these deferred tax assets.
The Company has established
$9.9 million
in valuation allowances against non-U.S. deferred tax assets, and, as stated above,
$6.1 million
of the non-U.S. valuation allowances relate to non-U.S. income tax loss carryforwards and
$3.6 million
relate to non-U.S. capital loss carryforwards. Valuation allowances established against non-U.S. deferred tax assets are recorded at the education division and other businesses. These non-U.S. valuation allowances may increase or decrease within the next 12 months, based on operating results. As a result, the Company is unable to estimate the potential tax impact, given the uncertain operating environment. The Company will be monitoring future education division and other businesses’ operating results and projected future operating results on a quarterly basis to determine whether the valuation allowances provided against non-U.S. deferred tax assets should be increased or decreased, as future circumstances warrant. In the third quarter of 2016, the Company released
$19.3 million
of valuation allowance previously recorded on its operations in Australia.
The Tax Act generally provides a 100% dividends received deduction for distributions from non-U.S. subsidiaries after December 31, 2017. The Tax Act establishes a new regime, the Global Intangible Low Taxed Income (GILTI) tax, that may currently subject to U.S. tax the operations of non-U.S. subsidiaries. The GILTI tax is imposed annually based on all current year non-U.S. operations starting January 1, 2018. The Company has elected to record the GILTI tax regime as a periodic tax expense for book purposes. Annually, the Company may elect to credit or deduct foreign taxes for U.S. Federal tax purposes. For the year ended
December 31, 2018
, the Company plans to elect to credit foreign taxes. The GILTI tax recorded, net of foreign taxes credited, for the year ended
December 31, 2018
is not material.
87
The book value of investments in the stocks of non-U.S. subsidiaries exceeded the tax basis by approximately
$226.1 million
and
$113.2 million
at
December 31, 2018
and
2017
. If the investment in non-U.S. subsidiaries were held for sale instead of being held indefinitely, it is possible additional U.S. Federal and state tax liabilities may be recorded, but calculation of the tax due is not practicable.
The Company does not currently anticipate that within the next 12 months there will be any events requiring the establishment of any valuation allowances against U.S. Federal net deferred tax assets.
During 2017, the Internal Revenue Service (IRS) completed its examination of the Company’s 2013 tax return and the Company received a
$9.7 million
refund primarily related to capital loss carryforwards. The 2015 U.S. Federal tax return and subsequent years remain open to IRS examination. The Company files income tax returns with the U.S. Federal government and in various state, local and non-U.S. governmental jurisdictions, with the consolidated U.S. Federal tax return filing considered the only major tax jurisdiction.
The Company endeavors to comply with tax laws and regulations where it does business, but cannot guarantee that, if challenged, the Company’s interpretation of all relevant tax laws and regulations will prevail and that all tax benefits recorded in the financial statements will ultimately be recognized in full.
The following summarizes the Company’s unrecognized tax benefits, excluding interest and penalties, for the respective periods:
|
Year Ended December 31
|
|||||||||||
|
(in thousands)
|
2018
|
2017
|
2016
|
||||||||
|
Beginning unrecognized tax benefits
|
$
|
17,331
|
|
$
|
17,331
|
|
$
|
17,331
|
|
||
|
Increases related to current year tax positions
|
—
|
|
—
|
|
—
|
|
|||||
|
Increases related to prior year tax positions
|
500
|
|
—
|
|
—
|
|
|||||
|
Decreases related to prior year tax positions
|
(12,187
|
)
|
—
|
|
—
|
|
|||||
|
Decreases related to settlement with tax authorities
|
—
|
|
—
|
|
—
|
|
|||||
|
Decreases due to lapse of applicable statutes of limitations
|
(3,161
|
)
|
—
|
|
—
|
|
|||||
|
Ending unrecognized tax benefits
|
$
|
2,483
|
|
$
|
17,331
|
|
$
|
17,331
|
|
||
The unrecognized tax benefits mainly relate to state income tax filing positions applicable to the 2014 tax period. In making these determinations, the Company presumes that taxing authorities pursuing examinations of the Company’s compliance with tax law filing requirements will have full knowledge of all relevant information, and, if necessary, the Company will pursue resolution of disputed tax positions by appeals or litigation. Although the Company cannot predict the timing of resolution with tax authorities, the Company estimates that some of the unrecognized tax benefits may change in the next 12 months due to settlement with the tax authorities. The Company expects that a
$2.5 million
state tax benefit, net of
$0.5 million
federal tax expense, will reduce the effective tax rate in the future if the unrecognized tax benefits are recognized.
The Company classifies interest and penalties related to uncertain tax positions as a component of interest and other expenses, respectively. As of
December 31, 2018
, the Company has accrued
$0.6 million
of interest related to the unrecognized tax benefits. The Company has not accrued any penalties related to the unrecognized tax benefits.
|
10.
|
DEBT
|
The Company’s borrowings consist of the following:
____________
|
As of December 31
|
|||||||
|
(in thousands)
|
2018
|
2017
|
|||||
|
5.75% unsecured notes due June 1, 2026
(1)
|
$
|
394,675
|
|
$
|
—
|
|
|
|
7.25% unsecured notes due February 1, 2019
|
—
|
|
399,507
|
|
|||
|
U.K. Credit facility
(2)
|
82,366
|
|
93,671
|
|
|||
|
Other indebtedness
|
96
|
|
109
|
|
|||
|
Total Debt
|
477,137
|
|
493,287
|
|
|||
|
Less: current portion
|
(6,360
|
)
|
(6,726
|
)
|
|||
|
Total Long-Term Debt
|
$
|
470,777
|
|
$
|
486,561
|
|
|
|
(1)
|
The carrying value is net of
$5.3 million
of unamortized debt issuance costs as of December 31,
2018
.
|
|
(2)
|
The carrying value is net of
$0.2 million
and
$0.4 million
of unamortized debt issuance costs as of December 31,
2018
and
2017
, respectively.
|
The Company did not borrow funds under its revolving credit facility in
2018
or
2017
. The Company’s other indebtedness at
December 31, 2018
and
December 31, 2017
, is at an interest rate of
2%
and matures in
2026
.
88
On May 30, 2018, the Company issued
$400 million
senior unsecured fixed-rate notes due June 1, 2026 (the Notes). The Notes are guaranteed, jointly and severally, on a senior unsecured basis, by certain of the Company’s existing and future domestic subsidiaries, as described in the terms of the indenture, dated as of May 30, 2018 (the Indenture). The Notes have a coupon rate of
5.75%
per annum, payable semi-annually on June 1 and December 1. The Company may redeem the Notes in whole or in part at any time at the respective redemption prices described in the Indenture.
On June 29, 2018, the Company used the net proceeds from the sale of the Notes, together with cash on hand, to redeem the
$400 million
of
7.25%
notes due February 1, 2019. The Company incurred
$11.4 million
in debt extinguishment costs in relation to the early termination of the 7.25% notes.
In combination with the issuance of the Notes, the Company and certain of the Company’s domestic subsidiaries named therein as guarantors entered into an amended and restated credit agreement providing for a U.S.
$300 million
five
-year revolving credit facility (the Revolving Credit Facility) with each of the lenders party thereto, certain of the Company’s foreign subsidiaries from time to time party thereto as foreign borrowers, Wells Fargo Bank, N.A., as Administrative Agent (Wells Fargo), JPMorgan Chase Bank, N.A., as Syndication Agent, and HSBC Bank USA, N.A. and Bank of America, N.A. as Documentation Agents (the Amended and Restated Credit Agreement), which amends and restates the Company’s existing Five Year Credit Agreement, dated as of June 29, 2015, among the Company, certain of its domestic subsidiaries as guarantors, the several lenders from time to time party thereto, Wells Fargo Bank, N.A., as Administrative Agent and JPMorgan Chase Bank, N.A., as Syndication Agent (the Existing Credit Agreement). The Amended and Restated Credit Agreement amends the Existing Credit Agreement to (i) extend the maturity of the Revolving Credit Facility to May 30, 2023, unless the Company and the lenders agree to further extend the term, (ii) increase the aggregate principal amount of the Revolving Credit Facility to U.S.
$300 million
, consisting of a U.S. Dollar tranche of U.S.
$200 million
for borrowings in U.S. Dollars and a multicurrency tranche equivalent to U.S.
$100 million
for borrowings in U.S. Dollars and certain foreign currencies, (iii) provide for borrowings under the Revolving Credit Facility in U.S. Dollars and certain other foreign currencies specified in the Amended and Restated Credit Agreement, (iv) permit certain foreign subsidiaries of the Company to be added to the Amended and Restated Credit Agreement as foreign borrowers thereunder and (v) effect certain other modifications to the Existing Credit Agreement.
Under the Amended and Restated Credit Agreement, the Company is required to pay a commitment fee on a quarterly basis, based on the Company’s leverage ratio, of between
0.15%
and
0.25%
of the amount of the average daily unused portion of the Revolving Credit Facility. Any borrowings under the Amended and Restated Credit Agreement are made on an unsecured basis and bear interest at the Company’s option, either at (a) a fluctuating interest rate equal to the highest of Wells Fargo’s prime rate,
0.5
percent above the Federal funds rate or the one-month Eurodollar rate plus
1%
, or (b) the Eurodollar rate for the applicable currency and interest period as defined in the Amended and Restated Credit Agreement, which is generally a periodic rate equal to LIBOR, CDOR, BBSY or SOR, as applicable, in the case of each of clauses (a) and (b) plus an applicable margin that depends on the Company’s consolidated debt to consolidated adjusted EBITDA (as determined pursuant to the Amended and Restated Credit Agreement, Total Net Leverage Ratio). The Company and its foreign subsidiaries may draw on the Revolving Credit Facility for general corporate purposes. Any outstanding borrowings must be repaid on or prior to the final termination date. The Amended and Restated Credit Agreement contains terms and conditions, including remedies in the event of a default by the Company, typical of facilities of this type and requires the Company to maintain a Total Net Leverage Ratio of not greater than
3.5
to 1.0 and a consolidated interest coverage ratio of at least
3.5
to 1.0 based upon the ratio of consolidated adjusted EBITDA to consolidated interest expense as determined pursuant to the Amended and Restated Credit Agreement. As of
December 31, 2018
, the Company is in compliance with all financial covenants.
On July 14, 2016, Kaplan entered into a credit agreement (the Kaplan Credit Agreement) among Kaplan International Holdings Limited, as borrower, the lenders party thereto, HSBC BANK PLC as Facility Agent, and other agents party thereto. The Kaplan Credit Agreement provides for a four-year credit facility in an aggregate principal amount of
£75 million
. Borrowings bear interest at a rate per annum of LIBOR plus an applicable interest rate margin between
1.25%
and
1.75%
, in each case determined on a quarterly basis by reference to a pricing grid based upon the Company’s total leverage ratio. The Kaplan Credit Agreement requires that
6.66%
of the amount of the loan be repaid on the first three anniversaries of funding, with the remaining balance due on July 1, 2020. The Kaplan Credit Agreement contains terms and conditions, including remedies in the event of a default by the Company, typical of facilities of this type and requires the Company to maintain a leverage ratio of not greater than
3.5
to 1.0 and a consolidated interest coverage ratio of at least
3.5
to 1.0 based upon the ratio of consolidated adjusted EBITDA to consolidated interest expense as determined pursuant to the Kaplan Credit Agreement. As of
December 31, 2018
, the Company is in compliance with all financial covenants.
On July 25, 2016, Kaplan borrowed
£75 million
under the Kaplan Credit Agreement. On the same date, Kaplan entered into an interest rate swap agreement with a total notional value of
£75 million
and a maturity date of July 1, 2020. The interest rate swap agreement will pay Kaplan variable interest on the
£75 million
notional amount at the three-month LIBOR, and Kaplan will pay the counterparties a fixed rate of
0.51%
,
effectively resulting in a total fixed
89
interest rate of
2.01%
on the outstanding borrowings at the current applicable margin of
1.50%
. The interest rate swap agreement was entered into to convert the variable rate British pound borrowing under the Kaplan Credit Agreement into a fixed rate borrowing. The Company provided a guarantee on any borrowings under the Kaplan Credit Agreement. Based on the terms of the interest rate swap agreement and the underlying borrowing, the interest rate swap agreement was determined to be effective and thus qualifies as a cash flow hedge. As such, changes in the fair value of the interest rate swap are recorded in other comprehensive income on the accompanying Consolidated Balance Sheets until earnings are affected by the variability of cash flows.
During
2018
and
2017
, the Company had average borrowings outstanding of approximately
$517.2 million
and
$493.2 million
, respectively, at average annual interest rates of approximately
5.6%
and
6.3%
, respectively. The Company incurred net interest expense of
$32.5 million
,
$27.3 million
and
$32.3 million
during
2018
,
2017
and
2016
, respectively.
In June 2018, the Company incurred
$6.2 million
of interest expense related to the mandatorily redeemable noncontrolling interest redemption settlement at GHG (see Note 3). The fair value of the mandatorily redeemable noncontrolling interest is based on the redemption value resulting from a negotiated settlement. The Company recorded interest income of
$2.3 million
and interest expense of
$2.7 million
for the years ended
December 31, 2017
and
2016
, respectively, to adjust the fair value of the mandatorily redeemable noncontrolling interest (see Note 3). The fair value of the mandatorily redeemable noncontrolling interest was based on an EBITDA multiple, adjusted for working capital and other items, which approximates fair value (Level 3 fair value assessment).
At
December 31, 2018
, the fair value of the Company’s
5.75%
unsecured notes, based on quoted market prices (Level 2 fair value assessment), totaled
$406.7 million
, compared with the carrying amount of
$394.7 million
. At December 31, 2017, the fair value of the Company’s
7.25%
unsecured notes, based on quoted market prices (Level 2 fair value assessment), totaled
$414.7 million
, compared with the carrying amount of
$399.5 million
. The carrying value of the Company’s other unsecured debt at
December 31, 2018
, approximates fair value.
90
|
11.
|
FAIR VALUE MEASUREMENTS
|
The Company’s financial assets and liabilities measured at fair value on a recurring basis were as follows:
____________
|
As of December 31, 2018
|
|||||||||||
|
(in thousands)
|
Level 1
|
Level 2
|
Total
|
||||||||
|
Assets
|
|
|
|
||||||||
|
Money market investments
(1)
|
$
|
—
|
|
$
|
75,500
|
|
$
|
75,500
|
|
||
|
Marketable equity securities
(2)
|
496,390
|
|
—
|
|
496,390
|
|
|||||
|
Other current investments
(3)
|
11,203
|
|
6,988
|
|
18,191
|
|
|||||
|
Interest rate swap
(4)
|
—
|
|
369
|
|
369
|
|
|||||
|
Total Financial Assets
|
$
|
507,593
|
|
$
|
82,857
|
|
$
|
590,450
|
|
||
|
Liabilities
|
|
|
|
||||||||
|
Deferred compensation plan liabilities
(5)
|
$
|
—
|
|
$
|
36,080
|
|
$
|
36,080
|
|
||
|
As of December 31, 2017
|
|||||||||||||||
|
(in thousands)
|
Level 1
|
Level 2
|
Level 3
|
Total
|
|||||||||||
|
Assets
|
|
|
|
||||||||||||
|
Money market investments
(1)
|
$
|
—
|
|
$
|
217,628
|
|
$
|
—
|
|
$
|
217,628
|
|
|||
|
Marketable equity securities
(2)
|
536,315
|
|
—
|
|
—
|
|
536,315
|
|
|||||||
|
Other current investments
(3)
|
9,831
|
|
11,007
|
|
—
|
|
20,838
|
|
|||||||
|
Total Financial Assets
|
$
|
546,146
|
|
$
|
228,635
|
|
$
|
—
|
|
$
|
774,781
|
|
|||
|
Liabilities
|
|
|
|
||||||||||||
|
Deferred compensation plan liabilities
(5)
|
$
|
—
|
|
$
|
43,414
|
|
$
|
—
|
|
$
|
43,414
|
|
|||
|
Interest rate swap
(6)
|
—
|
|
244
|
|
—
|
|
244
|
|
|||||||
|
Mandatorily redeemable noncontrolling interest
(7)
|
—
|
|
—
|
|
10,331
|
|
10,331
|
|
|||||||
|
Total Financial Liabilities
|
$
|
—
|
|
$
|
43,658
|
|
$
|
10,331
|
|
$
|
53,989
|
|
|||
|
(1)
|
The Company’s money market investments are included in cash, cash equivalents and restricted cash and the value considers the liquidity of the counterparty.
|
|
(2)
|
The Company’s investments in marketable equity securities are held in common shares of U.S. corporations that are actively traded on U.S. stock exchanges. Price quotes for these shares are readily available. Investments in marketable securities were classified as available-for-sale in 2017 prior to the adoption of the new accounting guidance (see Note 2).
|
|
(3)
|
Includes U.S. Government Securities, corporate bonds, mutual funds and time deposits. These investments are valued using a market approach based on the quoted market prices of the security or inputs that include quoted market prices for similar instruments and are classified as either Level 1 or Level 2 in the fair value hierarchy.
|
|
(4)
|
Included in Deferred Charges and Other Assets. The Company utilized a market approach model using the notional amount of the interest rate swap multiplied by the observable inputs of time to maturity and market interest rates.
|
|
(5)
|
Includes Graham Holdings Company’s Deferred Compensation Plan and supplemental savings plan benefits under the Graham Holdings Company’s Supplemental Executive Retirement Plan, which are included in accrued compensation and related benefits. These plans measure the market value of a participant’s balance in a notional investment account that is comprised primarily of mutual funds, which are based on observable market prices. However, since the deferred compensation obligations are not exchanged in an active market, they are classified as Level 2 in the fair value hierarchy. Realized and unrealized gains (losses) on deferred compensation are included in operating income.
|
|
(6)
|
Included in Other liabilities. The Company utilized a market approach model using the notional amount of the interest rate swap multiplied by the observable inputs of time to maturity and market interest rates.
|
|
(7)
|
The fair value of the mandatorily redeemable noncontrolling interest is based on an EBITDA multiple, adjusted for working capital and other items, which approximates fair value.
|
During the year ended
December 31, 2018
, the Company recorded gains of
$11.7 million
to equity securities that are accounted for as cost method investments based on observable transactions for identical or similar investments of the same issuer.
For the years ended December 31,
2018
,
2017
and
2016
, the Company recorded goodwill and other long-lived asset impairment charges of
$8.1 million
,
$9.6 million
and
$1.6 million
, respectively. The remeasurement of the goodwill and other long-lived assets is classified as a Level 3 fair value assessment due to the significance of unobservable inputs developed in the determination of the fair value. The Company used a discounted cash flow model to determine the estimated fair value of the reporting unit. A market value approach was also utilized to supplement the discounted cash flow model. The Company made estimates and assumptions regarding future cash flows, discount rates, long-term growth rates and market values to determine the reporting unit’s estimated fair value.
For the year ended December 31, 2016, the Company recorded impairment charges totaling
$27.0 million
to its cost method investment relating to a preferred equity interest in a vocational school company due to a decline in business conditions. The measurement of the preferred equity interest is classified as a Level 3 fair value assessment due to the significance of unobservable inputs developed in the determination of the fair value. The Company used a discounted cash flow model to determine the estimated fair value of the preferred equity interest and made estimates and assumptions regarding future cash flows, discount rates, long-term growth rates and market values to determine the estimated fair value.
91
|
12.
|
REVENUE FROM CONTRACTS WITH CUSTOMERS
|
Revenue Recognition.
The following table presents the Company’s revenue disaggregated by revenue source for the years ended
December 31, 2018
, 2017 and 2016:
|
Year Ended December 31
|
|||||||||||
|
(in thousands)
|
2018
|
2017
|
2016
|
||||||||
|
Education Revenue
|
|||||||||||
|
Kaplan international
|
$
|
719,982
|
|
$
|
697,999
|
|
$
|
696,362
|
|
||
|
Higher education
|
342,085
|
|
431,425
|
|
501,784
|
|
|||||
|
Test preparation
|
256,102
|
|
273,298
|
|
286,556
|
|
|||||
|
Professional (U.S.)
|
134,187
|
|
115,839
|
|
115,263
|
|
|||||
|
Kaplan corporate and other
|
1,142
|
|
294
|
|
214
|
|
|||||
|
Intersegment elimination
|
(2,483
|
)
|
(2,079
|
)
|
(1,718
|
)
|
|||||
|
1,451,015
|
|
1,516,776
|
|
1,598,461
|
|
||||||
|
Television broadcasting
|
505,549
|
|
409,916
|
|
409,718
|
|
|||||
|
Manufacturing
|
487,619
|
|
414,193
|
|
241,604
|
|
|||||
|
Healthcare
|
149,275
|
|
154,202
|
|
146,962
|
|
|||||
|
SocialCode
|
58,728
|
|
62,077
|
|
58,851
|
|
|||||
|
Other
|
43,880
|
|
34,733
|
|
26,433
|
|
|||||
|
Intersegment elimination
|
(100
|
)
|
(51
|
)
|
(139
|
)
|
|||||
|
Total Revenue
|
$
|
2,695,966
|
|
$
|
2,591,846
|
|
$
|
2,481,890
|
|
||
The Company generated
76%
of its revenue from U.S. domestic sales for the year ended
December 31, 2018
. The remaining
24%
of revenue was generated from non-U.S. sales.
For the year ended
December 31, 2018
, the Company recognized
80%
of its revenue over time as control of the services and goods transferred to the customer. The remaining
20%
of revenue was recognized at a point in time, when the customer obtained control of the promised goods.
The determination of the method by which the Company measures its progress towards the satisfaction of its performance obligations requires judgment and is described in the Summary of Significant Accounting Policies (Note 2).
Deferred Revenue.
The Company records deferred revenue when cash payments are received or due in advance of the Company’s performance, including amounts which are refundable. The following table presents the change in the Company’s deferred revenue balance during the year ended
December 31, 2018
:
|
As of
|
||||||||
|
December 31,
2018 |
January 1,
2018 |
%
|
||||||
|
(in thousands)
|
Change
|
|||||||
|
Deferred revenue
|
$
|
311,214
|
|
$
|
342,640
|
|
(9)
|
|
The majority of the change in the deferred revenue balance is related to the KU Transaction. During the year ended
December 31, 2018
, the Company recognized
$259.2 million
related to the Company’s deferred revenue balance as of January 1, 2018.
Revenue allocated to remaining performance obligations represents deferred revenue amounts that will be recognized as revenue in future periods. As of
December 31, 2018
, KTP’s deferred revenue balance related to certain medical and nursing qualifications with an original contract length greater than twelve months was
$5.6 million
. KTP expects to recognize
81%
of this revenue over the next twelve months and the remainder thereafter.
Costs to Obtain a Contract.
The following table presents changes in the Company’s costs to obtain a contract asset during the year ended
December 31, 2018
:
|
(in thousands)
|
Balance at
Beginning
of Year
|
Costs Associated with New Contracts
|
Less: Costs Amortized during the Year
|
Other
|
Balance
at
End of
Year
|
||||||||||||||
|
2018
|
$
|
16,043
|
|
$
|
55,664
|
|
$
|
(49,284
|
)
|
$
|
(1,112
|
)
|
$
|
21,311
|
|
||||
The majority of other activity is related to currency translation adjustments during the year ended
December 31, 2018
.
92
|
13.
|
CAPITAL STOCK, STOCK AWARDS AND STOCK OPTIONS
|
Capital Stock.
Each share of Class A common stock and Class B common stock participates equally in dividends. The Class B stock has limited voting rights and as a class has the right to elect
30%
of the Board of Directors; the Class A stock has unlimited voting rights, including the right to elect a majority of the Board of Directors.
During
2018
,
2017
, and
2016
the Company purchased a total of
199,023
,
88,361
, and
229,498
shares, respectively, of its Class B common stock at a cost of approximately
$118.0 million
,
$50.8 million
, and
$108.9 million
, respectively. On November 9, 2017, the Board of Directors authorized the Company to acquire up to
500,000
shares of its Class B common stock. The Company did not announce a ceiling price or time limit for the purchases. The authorization included
163,237
shares that remained under the previous authorization. At December 31,
2018
, the Company had remaining authorization from the Board of Directors to purchase up to
273,655
shares of Class B common stock.
Stock Awards.
In 2012, the Company adopted an incentive compensation plan (the 2012 Plan), which, among other provisions, authorizes the awarding of Class B common stock to key employees in the form of stock awards, stock options and other awards involving the actual transfer of shares. All stock awards, stock options and other awards involving the actual transfer of shares issued subsequent to the adoption of this plan are covered under this incentive compensation plan. Stock awards made under the 2012 Plan are primarily subject to the general restriction that stock awarded to a participant will be forfeited and revert to Company ownership if the participant’s employment terminates before the end of a specified period of service to the Company. Some of the awards are also subject to performance conditions and will be forfeited and revert to Company ownership if the conditions are not met. The number of Class B common shares authorized for issuance under the 2012 Plan is
772,588
shares. At
December 31, 2018
, there were
575,208
shares reserved for issuance under the 2012 incentive compensation plan. Of this number,
138,131
shares were subject to stock awards and stock options outstanding, and
437,077
shares were available for future awards.
Activity related to stock awards under the 2012 incentive compensation plan for the year ended
December 31, 2018
was as follows:
|
|
Number of Shares
|
Average Grant-Date Fair Value
|
||||
|
Beginning of year, unvested
|
51,575
|
|
$
|
744.07
|
|
|
|
Awarded
|
375
|
|
875.40
|
|
||
|
Vested
|
(14,275
|
)
|
694.81
|
|
||
|
Forfeited
|
(5,475
|
)
|
863.21
|
|
||
|
End of Year, unvested
|
32,200
|
|
747.18
|
|
||
For the share awards outstanding at
December 31, 2018
, the aforementioned restriction will lapse in
2019
for
18,500
shares, in
2020
for
250
shares and in
2021
for
13,450
shares. Also, in early
2019
, the Company issued stock awards of
16,665
shares. Stock-based compensation costs resulting from Company stock awards were
$4.4 million
,
$8.1 million
and
$11.0 million
in
2018
,
2017
and
2016
, respectively.
As of
December 31, 2018
, there was
$3.6 million
of total unrecognized compensation expense related to these awards. That cost is expected to be recognized on a straight-line basis over a weighted average period of
0.9
years.
Stock Options.
The Company’s 2003 employee stock option plan reserves
1,900,000
shares of the Company’s Class B common stock for options to be granted under the plan. The purchase price of the shares covered by an option cannot be less than the fair value on the grant date. Options generally vest over
six
years and have a maximum term of
ten
years. At
December 31, 2018
, there were
79,001
shares reserved for issuance under this stock option plan, which were all subject to options outstanding.
Stock options granted under the 2012 Plan cannot be less than the fair value on the grant date, generally vest over
six
years and have a maximum term of
ten
years. In 2017, a grant was issued that vests over
six
years.
93
Activity related to options outstanding for the year ended
December 31, 2018
was as follows:
|
|
Number of Shares
|
Average Option Price
|
||||
|
Beginning of year
|
185,520
|
|
$
|
565.65
|
|
|
|
Granted
|
—
|
|
—
|
|
||
|
Exercised
|
(588
|
)
|
281.18
|
|
||
|
Expired or forfeited
|
—
|
|
—
|
|
||
|
End of Year
|
184,932
|
|
566.55
|
|
||
Of the shares covered by options outstanding at the end of
2018
,
145,138
are now exercisable;
17,333
will become exercisable in
2019
;
17,334
will become exercisable in
2020
;
4,459
will become exercisable in
2021
;
333
will become exercisable in
2022
; and
335
will become exercisable in
2023
. For
2018
,
2017
and
2016
, the Company recorded expense of
$2.0 million
,
$2.0 million
and
$2.4 million
related to stock options, respectively. Information related to stock options outstanding and exercisable at
December 31, 2018
, is as follows:
|
|
Options Outstanding
|
Options Exercisable
|
||||||||||||||||
|
Range of Exercise Prices
|
Shares Outstanding at 12/31/2018
|
Weighted
Average
Remaining
Contractual
Life (years)
|
Weighted
Average Exercise Price |
Shares Exercisable at 12/31/2018
|
Weighted
Average Remaining Contractual Life (years) |
Weighted
Average Exercise Price |
||||||||||||
|
$244–276
|
3,674
|
|
2.5
|
$
|
259.19
|
|
3,674
|
|
2.5
|
$
|
259.19
|
|
||||||
|
325
|
77,258
|
|
2.1
|
325.26
|
|
77,258
|
|
2.1
|
325.26
|
|
||||||||
|
719
|
77,258
|
|
5.8
|
719.15
|
|
51,504
|
|
5.8
|
719.15
|
|
||||||||
|
805–872
|
26,742
|
|
7.0
|
865.02
|
|
12,702
|
|
6.9
|
866.03
|
|
||||||||
|
|
184,932
|
|
4.4
|
566.55
|
|
145,138
|
|
3.9
|
510.69
|
|
||||||||
At
December 31, 2018
, the intrinsic value for all options outstanding, exercisable and unvested was
$25.8 million
,
$25.8 million
and
$0.0 million
, respectively. The intrinsic value of a stock option is the amount by which the market value of the underlying stock exceeds the exercise price of the option. The market value of the Company’s stock was
$640.58
at
December 31, 2018
. At
December 31, 2018
, there were
39,794
unvested options related to this plan with an average exercise price of
$770.29
and a weighted average remaining contractual term of
6.3
years. At
December 31, 2017
, there were
57,126
unvested options with an average exercise price of
$770.67
and a weighted average remaining contractual term of
7.2
years.
As of
December 31, 2018
, total unrecognized stock-based compensation expense related to stock options was
$4.4 million
, which is expected to be recognized on a straight-line basis over a weighted average period of approximately
2.3
years. There were
588
options exercised during
2018
. The total intrinsic value of options exercised during
2018
was
$0.2 million
; a tax benefit from these stock option exercises of
$0.1 million
was realized. There were
3,476
options exercised during
2017
. The total intrinsic value of options exercised during
2017
was
$0.7 million
; a tax benefit from these stock option exercises of
$0.3 million
was realized. There were
4,726
options exercised during
2016
. The total intrinsic value of options exercised during
2016
was
$1.2 million
; a tax benefit from these option exercises of
$0.5 million
was realized.
During 2017, the Company granted
2,000
options at an exercise price above the fair market value of its common stock at the date of grant. The weighted average grant-date fair value of options granted during 2017 was
$120.47
.
No
options were granted during 2018 or 2016.
The fair value of options at date of grant was estimated using the Black-Scholes method utilizing the following assumptions:
|
|
2017
|
|
Expected life (years)
|
8
|
|
Interest rate
|
2.28%
|
|
Volatility
|
26.93%
|
|
Dividend yield
|
0.85%
|
The Company also maintains a stock option plan at Kaplan. Under the provisions of this plan, options are issued with an exercise price equal to the estimated fair value of Kaplan’s common stock, and options vest ratably over the number of years specified (generally
four
to
five
years) at the time of the grant. Upon exercise, an option holder may receive Kaplan shares or cash equal to the difference between the exercise price and the then fair value.
At
December 31, 2018
, a Kaplan senior manager holds
7,206
Kaplan restricted shares. The fair value of Kaplan’s common stock is determined by the Company’s compensation committee of the Board of Directors, and in January
94
2019
, the committee set the fair value price at
$1,575
per share. No options were awarded during
2018
,
2017
, or
2016
;
no
options were exercised during
2018
,
2017
or
2016
; and
no
options were outstanding at
December 31, 2018
.
Kaplan recorded stock compensation expense of
$0.5 million
,
$1.2 million
, and
$0.6 million
in
2018
,
2017
and
2016
, respectively. At
December 31, 2018
, the Company’s accrual balance related to the Kaplan restricted shares totaled
$11.3 million
. There were
no
payouts in
2018
,
2017
or
2016
.
Earnings Per Share.
The Company’s unvested restricted stock awards contain nonforfeitable rights to dividends and, therefore, are considered participating securities for purposes of computing earnings per share pursuant to the two-class method. The diluted earnings per share computed under the two-class method is lower than the diluted earnings per share computed under the treasury stock method, resulting in the presentation of the lower amount in diluted earnings per share. The computation of earnings per share under the two-class method excludes the income attributable to the unvested restricted stock awards from the numerator and excludes the dilutive impact of those underlying shares from the denominator.
The following reflects the Company’s net income and share data used in the basic and diluted earnings per share computations using the two-class method:
|
Year Ended December 31
|
|||||||||||
|
(in thousands, except per share amounts)
|
2018
|
2017
|
2016
|
||||||||
|
Numerator:
|
|||||||||||
|
Numerator for basic earnings per share:
|
|||||||||||
|
Net income attributable to Graham Holdings Company common stockholders
|
$
|
271,206
|
|
$
|
302,044
|
|
$
|
168,590
|
|
||
|
Less: Dividends paid–common stock outstanding and unvested restricted shares
|
(28,617
|
)
|
(28,329
|
)
|
(27,325
|
)
|
|||||
|
Undistributed earnings
|
242,589
|
|
273,715
|
|
141,265
|
|
|||||
|
Percent allocated to common stockholders
|
99.39
|
%
|
99.06
|
%
|
98.79
|
%
|
|||||
|
241,115
|
|
271,150
|
|
139,562
|
|
||||||
|
Add: Dividends paid–common stock outstanding
|
28,423
|
|
28,060
|
|
26,962
|
|
|||||
|
Numerator for basic earnings per share
|
269,538
|
|
299,210
|
|
166,524
|
|
|||||
|
Add: Additional undistributed earnings due to dilutive stock options
|
10
|
|
17
|
|
9
|
|
|||||
|
Numerator for diluted earnings per share
|
$
|
269,548
|
|
$
|
299,227
|
|
$
|
166,533
|
|
||
|
Denominator:
|
|||||||||||
|
Denominator for basic earnings per share:
|
|||||||||||
|
Weighted average shares outstanding
|
5,333
|
|
5,516
|
|
5,559
|
|
|||||
|
Add: Effect of dilutive stock options
|
37
|
|
36
|
|
30
|
|
|||||
|
Denominator for diluted earnings per share
|
5,370
|
|
5,552
|
|
5,589
|
|
|||||
|
Graham Holdings Company Common Stockholders:
|
|
|
|
|
|
|
|||||
|
Basic earnings per share
|
$
|
50.55
|
|
$
|
54.24
|
|
$
|
29.95
|
|
||
|
Diluted earnings per share
|
$
|
50.20
|
|
$
|
53.89
|
|
$
|
29.80
|
|
||
Diluted earnings per share excludes the following weighted average potential common shares, as the effect would be antidilutive, as computed under the treasury stock method:
|
Year Ended December 31
|
||||||||
|
(in thousands)
|
2018
|
2017
|
2016
|
|||||
|
Weighted average restricted stock
|
23
|
|
30
|
|
40
|
|
||
The
2018
,
2017
and
2016
diluted earnings per share amounts exclude the effects of
104,000
,
104,000
and
102,000
stock options outstanding, respectively, as their inclusion would have been antidilutive due to a market condition. The
2018
,
2017
and
2016
diluted earnings per share amounts also exclude the effects of
2,650
,
5,250
and
5,450
restricted stock awards, respectively, as their inclusion would have been antidilutive due to a performance condition.
In
2018
,
2017
and
2016
, the Company declared regular dividends totaling
$5.32
,
$5.08
and
$4.84
per share, respectively.
95
|
14.
|
PENSIONS AND OTHER POSTRETIREMENT PLANS
|
The Company maintains various pension and incentive savings plans and contributed to multiemployer plans on behalf of certain union-represented employee groups. Most of the Company’s employees are covered by these plans. The Company also provides healthcare and life insurance benefits to certain retired employees. These employees become eligible for benefits after meeting age and service requirements.
The Company uses a measurement date of December 31 for its pension and other postretirement benefit plans.
In the first quarter of 2018, the Company adopted new guidance which requires the presentation of service cost in the same line item as other compensation costs arising from services by employees during the period, while the other components of the net periodic benefit are recognized in non-operating pension and postretirement benefit income in the Company’s Consolidated Statements of Operations.
On March 22, 2018, the Company eliminated the accrual of pension benefits for certain Kaplan University employees related to their future service. As a result, the Company remeasured the accumulated and projected benefit obligation of the pension plan as of March 22, 2018, and the Company recorded a curtailment gain in the first quarter of 2018. The new measurement basis was used for the recognition of the Company’s pension benefit following the remeasurement. The curtailment gain on the Kaplan University transaction is included in the gain on the Kaplan University transaction and reported in Other income (expense), net on the Consolidated Statements of Operations.
On October 31, 2018, t
he Company made certain changes to the other postretirement plans, including changes in eligibility, cost sharing and surviving spouse coverage. As a result, the Company remeasured the accumulated and projected benefit obligation of the other postretirement plans as of October 31, 2018, and the Company recorded a curtailment gain in the fourth quarter of 2018. The new measurement basis was used for the recognition of the Company’s other postretirement plans cost following the remeasurement.
Defined Benefit Plans.
The Company’s defined benefit pension plans consist of various pension plans and a Supplemental Executive Retirement Plan (SERP) offered to certain executives of the Company.
In the fourth quarter of 2018, the Company offered certain terminated participants with a vested pension benefit an opportunity to take their benefits in the form of a lump sum or an annuity. Most of the participants that elected a lump sum benefit under the program were paid in December 2018. Additional lump sum payments were paid in early 2019. The Company recorded a
$26.9 million
settlement gain related to the bulk lump sum pension program offering.
In the fourth quarter of 2017, the Company recorded
$0.9 million
related to a Separation Incentive Program for certain Kaplan employees, which was funded from the assets of the Company’s pension plan. In the third quarter of 2017, the Company recorded
$0.9 million
related to a Separation Incentive Program for certain Forney employees, which was funded from the assets of the Company’s pension plan.
In the fourth quarter of 2016, the Company offered certain terminated participants with a vested pension benefit an opportunity to take their benefits in the form of a lump sum or an annuity. Most of the participants that elected a lump sum benefit under the program were paid in December 2016. Additional lump sum payments were paid in early 2017. The Company recorded an
$18.0 million
settlement gain related to the bulk lump sum pension program offering.
96
The following table sets forth obligation, asset and funding information for the Company’s defined benefit pension plans:
|
Pension Plans
|
|||||||
|
As of December 31
|
|||||||
|
(in thousands)
|
2018
|
2017
|
|||||
|
Change in Benefit Obligation
|
|||||||
|
Benefit obligation at beginning of year
|
$
|
1,286,694
|
|
$
|
1,160,897
|
|
|
|
Service cost
|
18,221
|
|
18,687
|
|
|||
|
Interest cost
|
46,787
|
|
47,925
|
|
|||
|
Amendments
|
7,183
|
|
75
|
|
|||
|
Actuarial (gain) loss
|
(81,851
|
)
|
73,191
|
|
|||
|
Acquisitions
|
—
|
|
58,600
|
|
|||
|
Benefits paid
|
(63,852
|
)
|
(74,506
|
)
|
|||
|
Special termination benefits
|
—
|
|
1,825
|
|
|||
|
Curtailment
|
(836
|
)
|
—
|
|
|||
|
Settlement
|
(95,777
|
)
|
—
|
|
|||
|
Benefit Obligation at End of Year
|
$
|
1,116,569
|
|
$
|
1,286,694
|
|
|
|
Change in Plan Assets
|
|
|
|||||
|
Fair value of assets at beginning of year
|
$
|
2,343,471
|
|
$
|
2,042,490
|
|
|
|
Actual return on plan assets
|
(63,715
|
)
|
375,487
|
|
|||
|
Benefits paid
|
(63,852
|
)
|
(74,506
|
)
|
|||
|
Settlement
|
(95,777
|
)
|
—
|
|
|||
|
Fair Value of Assets at End of Year
|
$
|
2,120,127
|
|
$
|
2,343,471
|
|
|
|
Funded Status
|
$
|
1,003,558
|
|
$
|
1,056,777
|
|
|
|
SERP
|
|||||||
|
As of December 31
|
|||||||
|
(in thousands)
|
2018
|
2017
|
|||||
|
Change in Benefit Obligation
|
|
|
|||||
|
Benefit obligation at beginning of year
|
$
|
110,082
|
|
$
|
106,526
|
|
|
|
Service cost
|
819
|
|
858
|
|
|||
|
Interest cost
|
3,865
|
|
4,233
|
|
|||
|
Amendments
|
1,028
|
|
—
|
|
|||
|
Actuarial (gain) loss
|
(7,552
|
)
|
4,041
|
|
|||
|
Benefits paid
|
(5,694
|
)
|
(5,576
|
)
|
|||
|
Benefit Obligation at End of Year
|
$
|
102,548
|
|
$
|
110,082
|
|
|
|
Change in Plan Assets
|
|
||||||
|
Fair value of assets at beginning of year
|
$
|
—
|
|
$
|
—
|
|
|
|
Employer contributions
|
5,694
|
|
5,576
|
|
|||
|
Benefits paid
|
(5,694
|
)
|
(5,576
|
)
|
|||
|
Fair Value of Assets at End of Year
|
$
|
—
|
|
$
|
—
|
|
|
|
Funded Status
|
$
|
(102,548
|
)
|
$
|
(110,082
|
)
|
|
The change in the Company’s benefit obligation for the pension plans was primarily due to the settlement gain recognized related to the bulk lump sum pension program offering and an actuarial gain recognized as a result of an increase to the discount rate used to measure the benefit obligation. The change in the benefit obligation for the Company’s SERP was due to the recognition of an actuarial gain resulting from an increase to the discount rate used to measure the benefit obligation.
The accumulated benefit obligation for the Company’s pension plans at
December 31, 2018
and
2017
, was
$1,097.3 million
and
$1,261.8 million
, respectively. The accumulated benefit obligation for the Company’s SERP at
December 31, 2018
and
2017
, was
$102.2 million
and
$108.0 million
, respectively. The amounts recognized in the Company’s Consolidated Balance Sheets for its defined benefit pension plans are as follows:
|
Pension Plans
|
SERP
|
||||||||||||||
|
As of December 31
|
As of December 31
|
||||||||||||||
|
(in thousands)
|
2018
|
2017
|
2018
|
2017
|
|||||||||||
|
Noncurrent asset
|
$
|
1,003,558
|
|
$
|
1,056,777
|
|
$
|
—
|
|
$
|
—
|
|
|||
|
Current liability
|
—
|
|
—
|
|
(6,321
|
)
|
(5,838
|
)
|
|||||||
|
Noncurrent liability
|
—
|
|
—
|
|
(96,227
|
)
|
(104,244
|
)
|
|||||||
|
Recognized Asset (Liability)
|
$
|
1,003,558
|
|
$
|
1,056,777
|
|
$
|
(102,548
|
)
|
$
|
(110,082
|
)
|
|||
97
Key assumptions utilized for determining the benefit obligation are as follows:
|
Pension Plans
|
SERP
|
||||||
|
As of December 31
|
As of December 31
|
||||||
|
|
2018
|
2017
|
2018
|
2017
|
|||
|
Discount rate
|
4.3%
|
3.6%
|
4.3%
|
3.6%
|
|||
|
Rate of compensation increase – age graded
|
5.0%–1.0%
|
5.0%–1.0%
|
5.0%–1.0%
|
5.0%–1.0%
|
|||
|
Cash balance interest crediting rate
|
3.50% with phase in to 4.30% in 2021
|
2.23% with phase in to 3.00% in 2020
|
—
|
—
|
|||
The Company made
no
contributions to its pension plans in
2018
and
2017
, and the Company does
no
t expect to make any contributions in
2019
. The Company made contributions to its SERP of
$5.7 million
and
$5.6 million
for the years ended
December 31, 2018
and
2017
, respectively. As the plan is unfunded, the Company makes contributions to the SERP based on actual benefit payments.
At
December 31, 2018
, future estimated benefit payments, excluding charges for early retirement programs, are as follows:
|
(in thousands)
|
Pension Plans
|
SERP
|
|||||
|
2019
|
$
|
76,245
|
|
$
|
6,456
|
|
|
|
2020
|
$
|
76,715
|
|
$
|
6,743
|
|
|
|
2021
|
$
|
75,956
|
|
$
|
6,946
|
|
|
|
2022
|
$
|
75,909
|
|
$
|
7,078
|
|
|
|
2023
|
$
|
75,389
|
|
$
|
7,149
|
|
|
|
2024–2028
|
$
|
367,130
|
|
$
|
35,656
|
|
|
The total (benefit) cost arising from the Company’s defined benefit pension plans consists of the following components:
|
Pension Plans
|
|||||||||||
|
Year Ended December 31
|
|||||||||||
|
(in thousands)
|
2018
|
2017
|
2016
|
||||||||
|
Service cost
|
$
|
18,221
|
|
$
|
18,687
|
|
$
|
20,461
|
|
||
|
Interest cost
|
46,787
|
|
47,925
|
|
51,608
|
|
|||||
|
Expected return on assets
|
(129,220
|
)
|
(121,411
|
)
|
(121,470
|
)
|
|||||
|
Amortization of prior service cost
|
150
|
|
170
|
|
297
|
|
|||||
|
Recognized actuarial gain
|
(9,969
|
)
|
(4,410
|
)
|
—
|
|
|||||
|
Net Periodic Benefit for the Year
|
(74,031
|
)
|
(59,039
|
)
|
(49,104
|
)
|
|||||
|
Curtailment
|
(806
|
)
|
—
|
|
—
|
|
|||||
|
Settlement
|
(26,917
|
)
|
—
|
|
(17,993
|
)
|
|||||
|
Early retirement programs and special separation benefit expense
|
—
|
|
1,825
|
|
—
|
|
|||||
|
Total Benefit for the Year
|
$
|
(101,754
|
)
|
$
|
(57,214
|
)
|
$
|
(67,097
|
)
|
||
|
Other Changes in Plan Assets and Benefit Obligations Recognized in Other Comprehensive Income
|
|
|
|
||||||||
|
Current year actuarial loss (gain)
|
$
|
111,084
|
|
$
|
(180,885
|
)
|
$
|
147,779
|
|
||
|
Current year prior service cost
|
7,183
|
|
75
|
|
—
|
|
|||||
|
Amortization of prior service cost
|
(150
|
)
|
(170
|
)
|
(297
|
)
|
|||||
|
Recognized net actuarial gain
|
9,969
|
|
4,410
|
|
—
|
|
|||||
|
Curtailment and settlement
|
26,887
|
|
—
|
|
17,993
|
|
|||||
|
Total Recognized in Other Comprehensive Income (Before Tax Effects)
|
$
|
154,973
|
|
$
|
(176,570
|
)
|
$
|
165,475
|
|
||
|
Total Recognized in Total Benefit and Other Comprehensive Income (Before Tax Effects)
|
$
|
53,219
|
|
$
|
(233,784
|
)
|
$
|
98,378
|
|
||
98
|
SERP
|
|||||||||||
|
Year Ended December 31
|
|||||||||||
|
(in thousands)
|
2018
|
2017
|
2016
|
||||||||
|
Service cost
|
$
|
819
|
|
$
|
858
|
|
$
|
985
|
|
||
|
Interest cost
|
3,865
|
|
4,233
|
|
4,384
|
|
|||||
|
Amortization of prior service cost
|
311
|
|
455
|
|
457
|
|
|||||
|
Recognized actuarial loss
|
2,403
|
|
1,774
|
|
2,659
|
|
|||||
|
Total Cost for the Year
|
$
|
7,398
|
|
$
|
7,320
|
|
$
|
8,485
|
|
||
|
Other Changes in Benefit Obligations Recognized in Other Comprehensive Income
|
|||||||||||
|
Current year actuarial (gain) loss
|
$
|
(7,552
|
)
|
$
|
4,041
|
|
$
|
1,120
|
|
||
|
Current year prior service cost
|
1,028
|
|
—
|
|
—
|
|
|||||
|
Amortization of prior service cost
|
(311
|
)
|
(455
|
)
|
(457
|
)
|
|||||
|
Recognized net actuarial loss
|
(2,403
|
)
|
(1,774
|
)
|
(2,659
|
)
|
|||||
|
Total Recognized in Other Comprehensive Income (Before Tax Effects)
|
$
|
(9,238
|
)
|
$
|
1,812
|
|
$
|
(1,996
|
)
|
||
|
Total Recognized in Total Cost and Other Comprehensive Income (Before Tax Effects)
|
$
|
(1,840
|
)
|
$
|
9,132
|
|
$
|
6,489
|
|
||
The costs for the Company’s defined benefit pension plans are actuarially determined. Below are the key assumptions utilized to determine periodic cost:
|
Pension Plans
|
SERP
|
||||||||||
|
Year Ended December 31
|
Year Ended December 31
|
||||||||||
|
2018
|
2017
|
2016
|
2018
|
2017
|
2016
|
||||||
|
Discount rate
(1)
|
4.0%/3.6%
|
4.1%
|
4.3%
|
3.6%
|
4.1%
|
4.3%
|
|||||
|
Expected return on plan assets
|
6.25%
|
6.25%
|
6.5%
|
—
|
—
|
—
|
|||||
|
Rate of compensation increase
|
Age graded
(5.0%–1.0%) |
Age graded
(5.0%–1.0%) |
4.0%
|
Age graded
(5.0%–1.0%) |
Age graded
(5.0%–1.0%) |
4.0%
|
|||||
|
Cash balance interest crediting rate
|
2.23% with phase in to 3.00% in 2020
|
1.57% with phase in to 3.00% in 2020
|
1.41% with phase in to 3.00% in 2019
|
—
|
—
|
—
|
|||||
___________
_
|
(1)
|
As a result of the Kaplan University transaction, the Company remeasured the accumulated and projected benefit obligation of the pension plan as of March 22, 2018. The remeasurement changed the discount rate from 3.6% for the period January 1 to March 23, 2018 to 4.0% for the period after March 23, 2018.
|
Accumulated other comprehensive income (AOCI) includes the following components of unrecognized net periodic cost for the defined benefit plans:
|
Pension Plans
|
SERP
|
||||||||||||||
|
As of December 31
|
As of December 31
|
||||||||||||||
|
(in thousands)
|
2018
|
2017
|
2018
|
2017
|
|||||||||||
|
Unrecognized actuarial (gain) loss
|
$
|
(313,809
|
)
|
$
|
(461,779
|
)
|
$
|
17,270
|
|
$
|
27,225
|
|
|||
|
Unrecognized prior service cost
|
7,273
|
|
270
|
|
1,037
|
|
320
|
|
|||||||
|
Gross Amount
|
(306,536
|
)
|
(461,509
|
)
|
18,307
|
|
27,545
|
|
|||||||
|
Deferred tax liability (asset)
|
82,765
|
|
124,607
|
|
(4,943
|
)
|
(7,437
|
)
|
|||||||
|
Net Amount
|
$
|
(223,771
|
)
|
$
|
(336,902
|
)
|
$
|
13,364
|
|
$
|
20,108
|
|
|||
Defined Benefit Plan Assets.
The Company’s defined benefit pension obligations are funded by a portfolio made up of a U.S. stock index fund, a relatively small number of stocks and high-quality fixed-income securities that are held by a third-party trustee. The assets of the Company’s pension plans were allocated as follows:
|
As of December 31
|
|||||
|
2018
|
2017
|
||||
|
U.S. equities
|
53
|
%
|
53
|
%
|
|
|
U.S. stock index fund
|
28
|
%
|
30
|
%
|
|
|
U.S. fixed income
|
13
|
%
|
11
|
%
|
|
|
International equities
|
6
|
%
|
6
|
%
|
|
|
|
100
|
%
|
100
|
%
|
|
The Company manages approximately
46%
of the pension assets internally, of which the majority is invested in a U.S. stock index fund with the remaining investments in Berkshire Hathaway stock and short-term fixed-income securities. The remaining
54%
of plan assets are managed by
two
investment companies. The goal of the investment managers is to produce moderate long-term growth in the value of these assets, while protecting them against large decreases in value. Both investment managers may invest in a combination of equity and fixed-income securities and cash. The managers are not permitted to invest in securities of the Company or in alternative
99
investments. The investment managers cannot invest more than
20%
of the assets at the time of purchase in the stock of Berkshire Hathaway or more than
10%
of the assets in the securities of any other single issuer, except for obligations of the U.S. Government, without receiving prior approval from the Plan administrator. As of
December 31, 2018
, the investment managers can invest no more than
23%
of the assets they manage in specified international exchanges, at the time the investment is made, and no less than
10%
of the assets could be invested in fixed-income securities.
In determining the expected rate of return on plan assets, the Company considers the relative weighting of plan assets, the historical performance of total plan assets and individual asset classes and economic and other indicators of future performance. In addition, the Company may consult with and consider the input of financial and other professionals in developing appropriate return benchmarks.
The Company evaluated its defined benefit pension plan asset portfolio for the existence of significant concentrations (defined as greater than
10%
of plan assets) of credit risk as of
December 31, 2018
. Types of concentrations that were evaluated include, but are not limited to, investment concentrations in a single entity, type of industry, foreign country and individual fund. At
December 31, 2018
and
2017
, the pension plan held investments in
one
common stock and one U.S. stock index fund that exceeded
10%
of total plan assets. These investments were valued at
$945.6 million
and
$1,079.3 million
at
December 31, 2018
and
2017
, respectively, or approximately
45%
and
46%
, respectively, of total plan assets.
The Company’s pension plan assets measured at fair value on a recurring basis were as follows:
|
As of December 31, 2018
|
|||||||||||||||
|
(in thousands)
|
Level 1
|
Level 2
|
Level 3
|
Total
|
|||||||||||
|
Cash equivalents and other short-term investments
|
$
|
2,068
|
|
$
|
269,544
|
|
$
|
—
|
|
$
|
271,612
|
|
|||
|
Equity securities
|
|||||||||||||||
|
U.S. equities
|
1,115,323
|
|
—
|
|
—
|
|
1,115,323
|
|
|||||||
|
International equities
|
131,912
|
|
—
|
|
—
|
|
131,912
|
|
|||||||
|
U.S. stock index fund
|
—
|
|
—
|
|
601,395
|
|
601,395
|
|
|||||||
|
Total Investments
|
$
|
1,249,303
|
|
$
|
269,544
|
|
$
|
601,395
|
|
$
|
2,120,242
|
|
|||
|
Payable for settlement of investments purchased, net
|
|
(115
|
)
|
||||||||||||
|
Total
|
|
$
|
2,120,127
|
|
|||||||||||
|
As of December 31, 2017
|
|||||||||||||||
|
(in thousands)
|
Level 1
|
Level 2
|
Level 3
|
Total
|
|||||||||||
|
Cash equivalents and other short-term investments
|
$
|
73,877
|
|
$
|
181,638
|
|
$
|
—
|
|
$
|
255,515
|
|
|||
|
Equity securities
|
|||||||||||||||
|
U.S. equities
|
1,242,139
|
|
—
|
|
—
|
|
1,242,139
|
|
|||||||
|
International equities
|
138,640
|
|
—
|
|
—
|
|
138,640
|
|
|||||||
|
U.S. stock index fund
|
—
|
|
—
|
|
706,202
|
|
706,202
|
|
|||||||
|
Total Investments
|
$
|
1,454,656
|
|
$
|
181,638
|
|
$
|
706,202
|
|
$
|
2,342,496
|
|
|||
|
Receivables
|
|
975
|
|
||||||||||||
|
Total
|
|
$
|
2,343,471
|
|
|||||||||||
Cash equivalents and other short-term investments.
These investments are primarily held in U.S. Treasury securities and registered money market funds. These investments are valued using a market approach based on the quoted market prices of the security or inputs that include quoted market prices for similar instruments and are classified as either Level 1 or Level 2 in the valuation hierarchy.
U.S. equities.
These investments are held in common and preferred stock of U.S. corporations and American Depositary Receipts (ADRs) traded on U.S. exchanges. Common and preferred shares and ADRs are traded actively on exchanges, and price quotes for these shares are readily available. These investments are classified as Level 1 in the valuation hierarchy.
International equities.
These investments are held in common and preferred stock issued by non-U.S. corporations. Common and preferred shares are traded actively on exchanges, and price quotes for these shares are readily available. These investments are classified as Level 1 in the valuation hierarchy.
U.S. stock index fund.
This fund consists of investments held in a diversified mix of securities (U.S. and international stocks, and fixed-income securities) and a combination of other collective funds that together are designed to track the performance of the S&P 500 Index. The fund is valued using the net asset value (NAV) provided by the administrator of the fund and reviewed by the Company. The NAV is based on the value of the underlying assets owned by the fund, minus liabilities and divided by the number of units outstanding. The
100
investment in this fund may be redeemed daily, subject to the restrictions of the fund. This investment is classified as Level 3 in the valuation hierarchy.
The following table provides a reconciliation of changes in pension assets measured at fair value on a recurring basis, using Level 3 inputs:
|
U.S. Stock Index Fund
|
|||||||
|
Year Ended December 31
|
|||||||
|
(in thousands)
|
2018
|
2017
|
|||||
|
Balance at Beginning of Year
|
$
|
706,202
|
|
$
|
622,865
|
|
|
|
Purchases, sales, and settlements, net
|
(80,000
|
)
|
(50,000
|
)
|
|||
|
Actual return on plan assets:
|
|||||||
|
Gains relating to assets sold
|
2,819
|
|
6,796
|
|
|||
|
(Losses) gains relating to assets still held at year-end
|
(27,626
|
)
|
126,541
|
|
|||
|
Balance at End of Year
|
$
|
601,395
|
|
$
|
706,202
|
|
|
Other Postretirement Plans.
The following table sets forth obligation, asset and funding information for the Company’s other postretirement plans:
|
Postretirement Plans
|
|||||||
|
As of December 31
|
|||||||
|
(in thousands)
|
2018
|
2017
|
|||||
|
Change in Benefit Obligation
|
|
|
|||||
|
Benefit obligation at beginning of year
|
$
|
22,785
|
|
$
|
24,171
|
|
|
|
Service cost
|
892
|
|
1,028
|
|
|||
|
Interest cost
|
620
|
|
779
|
|
|||
|
Amendments
|
(12,473
|
)
|
—
|
|
|||
|
Actuarial gain
|
(2,519
|
)
|
(2,830
|
)
|
|||
|
Acquisitions
|
—
|
|
516
|
|
|||
|
Benefits paid, net of Medicare subsidy
|
(782
|
)
|
(879
|
)
|
|||
|
Benefit Obligation at End of Year
|
$
|
8,523
|
|
$
|
22,785
|
|
|
|
Change in Plan Assets
|
|
|
|||||
|
Fair value of assets at beginning of year
|
$
|
—
|
|
$
|
—
|
|
|
|
Employer contributions
|
782
|
|
879
|
|
|||
|
Benefits paid, net of Medicare subsidy
|
(782
|
)
|
(879
|
)
|
|||
|
Fair Value of Assets at End of Year
|
$
|
—
|
|
$
|
—
|
|
|
|
Funded Status
|
$
|
(8,523
|
)
|
$
|
(22,785
|
)
|
|
The change in the benefit obligation for the Company’s other postretirement plans was primarily due to the impact of amendments to the plans, including changes to eligibility, cost sharing and surviving spouse coverage, as well as the recognition of an actuarial gain resulting from an increase to the discount rate used to measure the benefit obligation.
The amounts recognized in the Company’s Consolidated Balance Sheets for its other postretirement plans are as follows:
|
Postretirement Plans
|
|||||||
|
As of December 31
|
|||||||
|
(in thousands)
|
2018
|
2017
|
|||||
|
Current liability
|
$
|
(1,399
|
)
|
$
|
(1,920
|
)
|
|
|
Noncurrent liability
|
(7,124
|
)
|
(20,865
|
)
|
|||
|
Recognized Liability
|
$
|
(8,523
|
)
|
$
|
(22,785
|
)
|
|
The discount rates utilized for determining the benefit obligation at
December 31, 2018
and
2017
, for the postretirement plans were
3.69%
and
3.11%
, respectively. The assumed healthcare cost trend rate used in measuring the postretirement benefit obligation at
December 31, 2018
, was
7.41%
for pre-age 65,
decreasing
to
4.5%
in the year
2026
and thereafter. The assumed healthcare cost trend rate used in measuring the postretirement benefit obligation at
December 31, 2018
, was
7.96%
for post-age 65,
decreasing
to
4.5%
in the year
2026
and thereafter. The assumed healthcare cost trend rate used in measuring the postretirement benefit obligation at
December 31, 2018
, was
12.74%
for Medicare Advantage,
decreasing
to
4.5%
in the year
2028
and thereafter.
The Company made contributions to its postretirement benefit plans of
$0.8 million
and
$0.9 million
for the years ended
December 31, 2018
and
2017
, respectively. As the plans are unfunded, the Company makes contributions to its postretirement plans based on actual benefit payments.
101
At
December 31, 2018
, future estimated benefit payments are as follows:
|
(in thousands)
|
Postretirement
Plans
|
||
|
2019
|
$
|
1,399
|
|
|
2020
|
$
|
1,273
|
|
|
2021
|
$
|
1,083
|
|
|
2022
|
$
|
1,015
|
|
|
2023
|
$
|
856
|
|
|
2024–2028
|
$
|
2,308
|
|
The total (benefit) cost arising from the Company’s other postretirement plans consists of the following components:
|
Postretirement Plans
|
|||||||||||
|
Year Ended December 31
|
|||||||||||
|
(in thousands)
|
2018
|
2017
|
2016
|
||||||||
|
Service cost
|
$
|
892
|
|
$
|
1,028
|
|
$
|
1,386
|
|
||
|
Interest cost
|
620
|
|
779
|
|
1,230
|
|
|||||
|
Amortization of prior service credit
|
(1,408
|
)
|
(148
|
)
|
(335
|
)
|
|||||
|
Recognized actuarial gain
|
(3,783
|
)
|
(3,891
|
)
|
(1,502
|
)
|
|||||
|
Net Periodic (Benefit) Cost for the Year
|
(3,679
|
)
|
(2,232
|
)
|
779
|
|
|||||
|
Curtailment
|
(3,380
|
)
|
—
|
|
—
|
|
|||||
|
Total (Benefit) Cost for the Year
|
$
|
(7,059
|
)
|
$
|
(2,232
|
)
|
$
|
779
|
|
||
|
Other Changes in Benefit Obligations Recognized in Other Comprehensive Income
|
|||||||||||
|
Current year actuarial gain
|
$
|
(2,519
|
)
|
$
|
(2,830
|
)
|
$
|
(14,984
|
)
|
||
|
Current year prior service credit
|
(12,473
|
)
|
—
|
|
—
|
|
|||||
|
Amortization of prior service credit
|
1,408
|
|
148
|
|
335
|
|
|||||
|
Recognized actuarial gain
|
3,783
|
|
3,891
|
|
1,502
|
|
|||||
|
Curtailment and settlement
|
3,380
|
|
—
|
|
—
|
|
|||||
|
Total Recognized in Other Comprehensive Income (Before Tax Effects)
|
$
|
(6,421
|
)
|
$
|
1,209
|
|
$
|
(13,147
|
)
|
||
|
Total Recognized in (Benefit) Cost and Other Comprehensive Income (Before Tax Effects)
|
$
|
(13,480
|
)
|
$
|
(1,023
|
)
|
$
|
(12,368
|
)
|
||
The costs for the Company’s postretirement plans are actuarially determined. As a result of the changes to the postretirement plans, the Company remeasured the accumulated and projected benefit obligation of the postretirement plan as of October 31, 2018. The remeasurement changed the discount rate from
3.11%
for the period January 1 through October 31, 2018 to
4.04%
for the period November 1 to December 31, 2018. The discount rates utilized to determine periodic cost for the years ended
December 31, 2017
and
2016
, were
3.31%
and
3.45%
, respectively. AOCI included the following components of unrecognized net periodic benefit for the postretirement plans:
|
As of December 31
|
|||||||
|
(in thousands)
|
2018
|
2017
|
|||||
|
Unrecognized actuarial gain
|
$
|
(22,861
|
)
|
$
|
(24,125
|
)
|
|
|
Unrecognized prior service credit
|
(7,863
|
)
|
(178
|
)
|
|||
|
Gross Amount
|
(30,724
|
)
|
(24,303
|
)
|
|||
|
Deferred tax liability
|
8,295
|
|
6,561
|
|
|||
|
Net Amount
|
$
|
(22,429
|
)
|
$
|
(17,742
|
)
|
|
Multiemployer Pension Plans
. In
2018
,
2017
and
2016
, the Company contributed to
one
multiemployer defined benefit pension plan under the terms of a collective-bargaining agreement that covered certain union-represented employees. The Company’s total contributions to the multiemployer pension plan amounted to
$0.1 million
in each year for
2018
,
2017
and
2016
.
Savings Plans.
The Company recorded expense associated with retirement benefits provided under incentive savings plans (primarily 401(k) plans) of approximately
$8.6 million
in
2018
and
$7.5 million
in
2017
and
2016
.
102
|
15.
|
OTHER NON-OPERATING INCOME (EXPENSE)
|
A summary of non-operating income (expense) is as follows:
|
Year Ended December 31
|
|||||||||||
|
(in thousands)
|
2018
|
2017
|
2016
|
||||||||
|
Loss on guarantor obligations
|
$
|
(17,518
|
)
|
$
|
—
|
|
$
|
—
|
|
||
|
Net gain on cost method investments
|
11,663
|
|
—
|
|
—
|
|
|||||
|
Net gain (loss) on sales of businesses
|
8,157
|
|
(569
|
)
|
18,931
|
|
|||||
|
Foreign currency (loss) gain, net
|
(3,844
|
)
|
3,310
|
|
(39,890
|
)
|
|||||
|
Gain on sale of cost method investments
|
2,845
|
|
16
|
|
794
|
|
|||||
|
Impairment of cost method investments
|
(2,697
|
)
|
(200
|
)
|
(29,365
|
)
|
|||||
|
Net gain on sale of property, plant and equipment
|
2,539
|
|
—
|
|
34,072
|
|
|||||
|
Gain on formation of a joint venture
|
—
|
|
—
|
|
3,232
|
|
|||||
|
Net losses on sales or write-down of marketable equity securities
|
—
|
|
—
|
|
(1,791
|
)
|
|||||
|
Other, net
|
958
|
|
1,684
|
|
1,375
|
|
|||||
|
Total Other Non-Operating Income (Expense)
|
$
|
2,103
|
|
$
|
4,241
|
|
$
|
(12,642
|
)
|
||
In
2018
, the Company recorded a
$17.5 million
loss in guarantor lease obligations in connection with the sale of the KHE Campuses business.
In the
third
quarter of
2018
, the Company recorded an
$8.5 million
gain resulting from observable price changes in the fair value of equity securities accounted for under the cost method. In the fourth quarter of 2018, an additional
$3.2 million
gain was recorded.
In
2018
, the Company recorded an
$8.2 million
gain on the sale of
three
businesses in the education division, including a gain of
$4.3 million
on the Kaplan University transaction and
$1.9 million
in contingent consideration gains related to the sale of a business (see Note 3).
In the third quarter of 2016, the Company recorded an impairment of
$15.0 million
to the preferred equity interest in a vocational school company. In the fourth quarter of 2016, an additional
$12.0 million
impairment was recorded.
In the second quarter of 2016, the Company sold the remaining portion of the Robinson Terminal real estate retained from the sale of the Publishing Subsidiaries, for a gain of
$34.1 million
.
In June 2016, GHG contributed assets to a joint venture entered into with a Michigan hospital in exchange for a
40%
equity interest and other assets, resulting in a
$3.2 million
gain (see Note 3). The Company used an income and market approach to value the equity interest. The measurement of the equity interest in the joint venture is classified as a Level 3 fair value assessment due to the significance of unobservable inputs developed in the determination of the fair value.
In the first quarter of 2016, Kaplan sold Colloquy, which was part of Kaplan corporate and other, for a gain of
$18.9 million
.
|
16.
|
ACCUMULATED OTHER COMPREHENSIVE INCOME (LOSS)
|
The other comprehensive (loss) income consists of the following components:
|
Year Ended December 31, 2018
|
|||||||||||
|
Before-Tax
|
Income
|
After-Tax
|
|||||||||
|
(in thousands)
|
Amount
|
Tax
|
Amount
|
||||||||
|
Foreign currency translation adjustments:
|
|||||||||||
|
Translation adjustments arising during the year
|
$
|
(35,584
|
)
|
$
|
—
|
|
$
|
(35,584
|
)
|
||
|
Pension and other postretirement plans:
|
|||||||||||
|
Actuarial loss
|
(101,013
|
)
|
27,273
|
|
(73,740
|
)
|
|||||
|
Prior service credit
|
4,262
|
|
(1,151
|
)
|
3,111
|
|
|||||
|
Amortization of net actuarial gain included in net income
|
(11,349
|
)
|
3,064
|
|
(8,285
|
)
|
|||||
|
Amortization of net prior service credit included in net income
|
(947
|
)
|
256
|
|
(691
|
)
|
|||||
|
Curtailments and settlements included in net income
|
(30,267
|
)
|
8,172
|
|
(22,095
|
)
|
|||||
|
(139,314
|
)
|
37,614
|
|
(101,700
|
)
|
||||||
|
Cash flow hedge:
|
|||||||||||
|
Gain for the year
|
551
|
|
(104
|
)
|
447
|
|
|||||
|
Other Comprehensive Loss
|
$
|
(174,347
|
)
|
$
|
37,510
|
|
$
|
(136,837
|
)
|
||
103
|
Year Ended December 31, 2017
|
|||||||||||
|
Before-Tax
|
Income
|
After-Tax
|
|||||||||
|
(in thousands)
|
Amount
|
Tax
|
Amount
|
||||||||
|
Foreign currency translation adjustments:
|
|||||||||||
|
Translation adjustments arising during the year
|
$
|
33,175
|
|
$
|
—
|
|
$
|
33,175
|
|
||
|
Adjustment for sale of a business with foreign operations
|
137
|
|
—
|
|
137
|
|
|||||
|
33,312
|
|
—
|
|
33,312
|
|
||||||
|
Unrealized gains on available-for-sale securities:
|
|||||||||||
|
Unrealized gains for the year
|
112,086
|
|
(44,834
|
)
|
67,252
|
|
|||||
|
Pension and other postretirement plans:
|
|||||||||||
|
Actuarial gain
|
179,674
|
|
(48,511
|
)
|
131,163
|
|
|||||
|
Prior service cost
|
(75
|
)
|
20
|
|
(55
|
)
|
|||||
|
Amortization of net actuarial gain included in net income
|
(6,527
|
)
|
2,612
|
|
(3,915
|
)
|
|||||
|
Amortization of net prior service cost included in net income
|
477
|
|
(191
|
)
|
286
|
|
|||||
|
173,549
|
|
(46,070
|
)
|
127,479
|
|
||||||
|
Cash flow hedge:
|
|||||||||||
|
Gain for the year
|
112
|
|
(19
|
)
|
93
|
|
|||||
|
Other Comprehensive Income
|
$
|
319,059
|
|
$
|
(90,923
|
)
|
$
|
228,136
|
|
||
|
Year Ended December 31, 2016
|
|||||||||||
|
Before-Tax
|
Income
|
After-Tax
|
|||||||||
|
(in thousands)
|
Amount
|
Tax
|
Amount
|
||||||||
|
Foreign currency translation adjustments:
|
|||||||||||
|
Translation adjustments arising during the year
|
$
|
(22,149
|
)
|
$
|
—
|
|
$
|
(22,149
|
)
|
||
|
Unrealized gains on available-for-sale securities:
|
|||||||||||
|
Unrealized gains for the year
|
55,507
|
|
(22,203
|
)
|
33,304
|
|
|||||
|
Reclassification adjustment for realization of loss on sale of available-for-sale securities included in net income
|
1,879
|
|
(752
|
)
|
1,127
|
|
|||||
|
57,386
|
|
(22,955
|
)
|
34,431
|
|
||||||
|
Pension and other postretirement plans:
|
|||||||||||
|
Actuarial loss
|
(133,915
|
)
|
53,566
|
|
(80,349
|
)
|
|||||
|
Amortization of net actuarial loss included in net income
|
1,157
|
|
(463
|
)
|
694
|
|
|||||
|
Amortization of net prior service cost included in net income
|
419
|
|
(167
|
)
|
252
|
|
|||||
|
Curtailments and settlements included in net income
|
(17,993
|
)
|
7,197
|
|
(10,796
|
)
|
|||||
|
(150,332
|
)
|
60,133
|
|
(90,199
|
)
|
||||||
|
Cash flow hedge:
|
|||||||||||
|
Loss for the year
|
(334
|
)
|
57
|
|
(277
|
)
|
|||||
|
Other Comprehensive Loss
|
$
|
(115,429
|
)
|
$
|
37,235
|
|
$
|
(78,194
|
)
|
||
104
The accumulated balances related to each component of other comprehensive income (loss) are as follows:
|
(in thousands, net of taxes)
|
Cumulative
Foreign
Currency
Translation
Adjustment
|
Unrealized Gain on Available-for-Sale Securities
|
Unrealized Gain
on Pensions
and Other
Postretirement
Plans
|
Cash Flow
Hedge
|
Accumulated
Other
Comprehensive
Income
|
||||||||||||||
|
As of December 31, 2016
|
$
|
(26,998
|
)
|
$
|
92,931
|
|
$
|
170,830
|
|
$
|
(277
|
)
|
$
|
236,486
|
|
||||
|
Other comprehensive income (loss) before reclassifications
|
33,175
|
|
67,252
|
|
131,108
|
|
(29
|
)
|
231,506
|
|
|||||||||
|
Net amount reclassified from accumulated other comprehensive income
|
137
|
|
—
|
|
(3,629
|
)
|
122
|
|
(3,370
|
)
|
|||||||||
|
Net other comprehensive income
|
33,312
|
|
67,252
|
|
127,479
|
|
93
|
|
228,136
|
|
|||||||||
|
Reclassification of stranded tax effects to retained earnings as a result of tax reform
|
—
|
|
34,706
|
|
36,227
|
|
—
|
|
70,933
|
|
|||||||||
|
As of December 31, 2017
|
6,314
|
|
194,889
|
|
334,536
|
|
(184
|
)
|
535,555
|
|
|||||||||
|
Reclassification of unrealized gains on available-for-sale securities to retained earnings as a result of adoption of new guidance
|
—
|
|
(194,889
|
)
|
—
|
|
—
|
|
(194,889
|
)
|
|||||||||
|
Other comprehensive (loss) income before reclassifications
|
(35,584
|
)
|
—
|
|
(70,629
|
)
|
579
|
|
(105,634
|
)
|
|||||||||
|
Net amount reclassified from accumulated other comprehensive income
|
—
|
|
—
|
|
(31,071
|
)
|
(132
|
)
|
(31,203
|
)
|
|||||||||
|
Net other comprehensive (loss) income
|
(35,584
|
)
|
—
|
|
(101,700
|
)
|
447
|
|
(136,837
|
)
|
|||||||||
|
As of December 31, 2018
|
$
|
(29,270
|
)
|
$
|
—
|
|
$
|
232,836
|
|
$
|
263
|
|
$
|
203,829
|
|
||||
The amounts and line items of reclassifications out of Accumulated Other Comprehensive Income are as follows:
___________
_
|
Year Ended December 31
|
Affected Line Item in the Consolidated Statements of Operations
|
||||||||||||
|
(in thousands)
|
2018
|
2017
|
2016
|
||||||||||
|
Foreign Currency Translation Adjustments:
|
|||||||||||||
|
Adjustment for sales of businesses with foreign operations
|
$
|
—
|
|
$
|
137
|
|
$
|
—
|
|
Other income (expense), net
|
|||
|
Unrealized Gains on Available-for-Sale Securities:
|
|||||||||||||
|
Realized loss for the year
|
—
|
|
—
|
|
1,879
|
|
Other income (expense), net
|
||||||
|
—
|
|
—
|
|
(752
|
)
|
Provision for (benefit from) income taxes
|
|||||||
|
—
|
|
—
|
|
1,127
|
|
Net of tax
|
|||||||
|
Pension and Other Postretirement Plans:
|
|||||||||||||
|
Amortization of net actuarial (gain) loss
|
(11,349
|
)
|
(6,527
|
)
|
1,157
|
|
(1)
|
||||||
|
Amortization of net prior service (credit) cost
|
(947
|
)
|
477
|
|
419
|
|
(1)
|
||||||
|
Curtailment and settlement gains
|
(30,267
|
)
|
—
|
|
(17,993
|
)
|
(1)
|
||||||
|
(42,563
|
)
|
(6,050
|
)
|
(16,417
|
)
|
Before tax
|
|||||||
|
11,492
|
|
2,421
|
|
6,567
|
|
Provision for (benefit from) income taxes
|
|||||||
|
(31,071
|
)
|
(3,629
|
)
|
(9,850
|
)
|
Net of tax
|
|||||||
|
Cash Flow Hedge
|
|||||||||||||
|
(163
|
)
|
152
|
|
16
|
|
Interest expense
|
|||||||
|
31
|
|
(30
|
)
|
(3
|
)
|
Provision for (benefit from) income taxes
|
|||||||
|
(132
|
)
|
122
|
|
13
|
|
Net of tax
|
|||||||
|
Total reclassification for the year
|
$
|
(31,203
|
)
|
$
|
(3,370
|
)
|
$
|
(8,710
|
)
|
Net of tax
|
|||
|
(1)
|
These accumulated other comprehensive income components are included in the computation of net periodic pension and postretirement plan cost (see Note 14) and are included in non-operating pension and postretirement benefit income in the Company’s Consolidated Statements of Operations.
|
105
|
17.
|
LEASES AND OTHER COMMITMENTS
|
The Company leases real property under operating agreements. Many of the leases contain renewal options and escalation clauses that require payments of additional rent to the extent of increases in the related operating costs.
At
December 31, 2018
, future minimum rental payments under noncancelable operating leases approximate the following:
|
(in thousands)
|
|
||
|
2019
|
$
|
101,009
|
|
|
2020
|
84,945
|
|
|
|
2021
|
72,031
|
|
|
|
2022
|
53,709
|
|
|
|
2023
|
47,091
|
|
|
|
Thereafter
|
115,948
|
|
|
|
|
$
|
474,733
|
|
Minimum payments have not been reduced by minimum sublease rentals of
$66.0 million
due in the future under noncancelable subleases.
Rent expense under operating leases was approximately
$83.4 million
,
$81.1 million
and
$86.9 million
in
2018
,
2017
and
2016
, respectively. Sublease income was approximately
$15.6 million
,
$14.8 million
and
$14.3 million
in
2018
,
2017
and
2016
, respectively.
The Company’s broadcast subsidiaries are parties to certain agreements that commit them to purchase programming to be produced in future years. At
December 31, 2018
, such commitments amounted to approximately
$16.1 million
. If such programs are not produced, the Company’s commitment would expire without obligation.
|
18.
|
CONTINGENCIES
|
Litigation, Legal and Other Matters
. The Company and its subsidiaries are subject to complaints and administrative proceedings and are defendants in various civil lawsuits that have arisen in the ordinary course of their businesses, including contract disputes; actions alleging negligence, libel, defamation, invasion of privacy; trademark, copyright and patent infringement; U.S. False Claims Act (False Claims Act) violations; violations of employment laws and applicable wage and hour laws; and statutory or common law claims involving current and former students and employees. Although the outcomes of the legal claims and proceedings against the Company cannot be predicted with certainty, based on currently available information, management believes that there are no existing claims or proceedings that are likely to have a material effect on the Company’s business, financial condition, results of operations or cash flows. However, based on currently available information, management believes it is reasonably possible that future losses from existing and threatened legal, regulatory and other proceedings in excess of the amounts recorded could reach approximately
$45 million
.
On February 6, 2008, a purported class-action lawsuit was filed in the U.S. District Court for the Central District of California by purchasers of BAR/BRI bar review courses, from July 2006 onward, alleging antitrust claims against Kaplan and West Publishing Corporation, BAR/BRI’s former owner. On April 10, 2008, the court granted defendants’ motion to dismiss, a decision that was reversed by the Ninth Circuit Court of Appeals on November 7, 2011. The Ninth Circuit also referred the matter to a mediator for the purpose of exploring a settlement. In the fourth quarter of 2012, the parties reached a comprehensive agreement to settle the matter. The settlement was approved by the District Court in September 2013. In the fourth quarter of 2017, the Ninth Circuit remanded to the District Court, which, once again, set attorneys’ fees on January 11, 2018. Distribution of settlement funds was made in December 2018 and the claims administration process has been completed.
During 2014, certain Kaplan subsidiaries were subject to unsealed cases filed by former employees that include, among other allegations, claims under the False Claims Act relating to eligibility for Title IV funding. The U.S. government declined to intervene in all cases, and, as previously reported, court decisions either dismissed the cases in their entirety or narrowed the scope of their allegations. The remaining case is captioned
United States of America
ex rel.
Carlos Urquilla-Diaz
et al. v.
Kaplan University
et al. (unsealed March 25, 2008). On August 17, 2011, the U.S. District Court for the Southern District of Florida issued a series of rulings in the Diaz case, which included
three
separate complaints: Diaz, Wilcox and Gillespie. The court dismissed the Wilcox complaint in its entirety; dismissed all False Claims Act allegations in the Diaz complaint, leaving only an individual employment claim; and dismissed in part the Gillespie complaint, thereby limiting the scope and time frame of its False Claims Act allegations regarding compliance with the U.S. Federal Rehabilitation Act. On October 31, 2012, the court entered summary judgment in favor of the Company as to the sole remaining employment claim in the Diaz complaint. On July 16, 2013, the court likewise entered summary judgment in favor of the Company on all remaining claims in the Gillespie complaint. Diaz and Gillespie each appealed to the U.S. Court of Appeals for the
106
Eleventh Judicial Circuit. Arguments on both appeals were heard on February 3, 2015. On March 11, 2015, the appellate court issued a decision affirming the lower court’s dismissal of all of Gillespie’s claims. The appellate court also dismissed
three
of the
four
Diaz claims, but reversed and remanded on Diaz’s claim that incentive compensation for admissions representatives was improperly based solely on enrollment counts. Kaplan filed an answer to Diaz’s amended complaint on September 11, 2015. Kaplan filed a motion to dismiss Diaz’s claims, and a hearing was held on December 17, 2015. On March 24, 2016, the Court denied the motion to dismiss. Discovery in the case closed in January 2017. Kaplan filed a motion for summary judgment on February 21, 2017. Summary judgment was granted in full and entered on July 13, 2017. Diaz filed a notice of appeal in September 2017 and filed his initial brief. Kaplan filed a response brief in the third quarter of 2018. The matter is not likely to be decided until mid-2019.
On October 19, 2018, a lawsuit was filed against KHE and other unrelated parties in El Paso, TX, County District Court alleging liability for default on a real property lease by Education Corporation of America. On November 19, 2018, this matter was removed to the U.S. District Court for the Western District of Texas. KHE’s
responsive pleading was filed in January 2019
.
On September 3, 2015, Kaplan sold to ECA substantially all of the assets of KHE nationally accredited on-ground Title IV eligible schools (KHE Campuses). The transaction included the transfer of certain real estate leases that were guaranteed by Kaplan. As part of the transaction, Kaplan retained liability for, among other things, obligations arising under certain lease guarantees.
ECA is currently in receivership and has terminated all of its higher education operations other than the New England College of Business (NECB). The receiver has repudiated all of ECA’s real estate leases not connected to NECB. Although ECA is required to indemnify Kaplan for any amounts Kaplan must pay due to ECA’s failure to fulfill its obligations under real estate leases guaranteed by Kaplan, ECA’s financial situation and the existence of secured and unsecured creditors make it unlikely that Kaplan will recover from ECA. In the second half of 2018, the Company recorded an estimated
$17.5 million
in losses on guarantor lease obligations in connection with this transaction in other non-operating expense.
On March 28, 2016, a class-action lawsuit was filed in the U.S. District Court for the Northern District of Illinois by Erin Fries, a physical therapist formerly employed by Residential, against Residential Home Health, LLC, Residential Home Health Illinois, LLC, and David Curtis. The complaint alleges violations of the Fair Labor Standards Act and the Illinois minimum wage law. The complaint seeks damages, attorney’s fees and costs. At this time, the Company cannot predict the outcome of this matter. In August 2017, the Pennsylvania Department of Health cited Celtic Healthcare of Westmoreland, LLC for being out of compliance with four conditions of the Medicare Conditions of Participation between August 7, 2017, and September 6, 2017. Celtic Healthcare of Westmoreland, LLC d/b/a Allegheny Health Network Healthcare@Home Home Health (AHN H@H Home Health) is a wholly owned subsidiary of a joint venture between West Penn Allegheny Health System, Inc. and Celtic Healthcare, Inc. In light of this 31-day period of non-compliance, the Department of Health issued a provisional license for AHN H@H Home Health. Following a re-survey investigation by the Pennsylvania Department of Health, on January 12, 2018, the Department of Health removed the provisional license assigned to AHN H@H Home Health and restored its unrestricted license. The Pennsylvania Department of Health will alert the Centers for Medicare and Medicaid Services (CMS) about this matter. CMS has the authority to impose civil monetary penalties of up to
$10,000
per day or per instance for non-compliance. At this time, the Company cannot predict the outcome of this matter.
Her Majesty’s Revenue and Customs (HMRC), a department of the U.K. government responsible for the collection of taxes, has raised assessments against the Kaplan U.K. Pathways business for Value Added Tax (VAT) relating to 2017 and earlier years, which have been paid by Kaplan. In September 2017, in a case captioned
Kaplan International Colleges UK Limited
v.
The Commissioners for Her Majesty’s Revenue and Customs
, Kaplan challenged these assessments. The Company believes it has met all requirements under U.K. VAT law and expects to recover the
£15.4 million
receivable related to the assessments and subsequent payments that have been paid. Following a hearing held in January 2019, before the First Tier Tax Tribunal, all issues related to EU law in the case were referred to the Court of Justice of the European Union. If the Company does not prevail in this case, a pre-tax charge of
£15.4 million
will be recorded to operating expense in the Company’s statement of operations.
In March 2018, HMRC issued new VAT guidance indicating a change of policy in relation to certain aspects of a cost sharing exemption that could impact the U.K. Pathways business adversely if this guidance were to become law. As of December 31, 2018, this guidance had not yet been incorporated into U.K. law. If Kaplan is not successful in preserving a valid exemption under U.K. VAT law, the U.K. Pathways business would incur additional VAT expense in the future. In a separate matter,
there is presently a legal case awaiting judgment at the Supreme Court in the U.K. that may impact U.K. Pathways’ ability to receive the benefit of an exemption from charging its students VAT on tuition fees. The case may reverse or amend existing law and guidance that permits private providers to qualify as a “college of a university” and therefore, receive the benefit of an exemption from charging its students VAT on tuition fees. If the case restricts which businesses are capable of constituting “colleges of a university” and entitled to exemption, KI Pathways Colleges’ financial results may be adversely impacted if they are not able to meet any new requirements.
107
KHE Regulatory Environment.
KHE no longer owns or operates KU or any other institution participating in student financial aid programs that have been created under Title IV of the U.S. Federal Higher Education Act of 1965 (Higher Education Act), as amended (Title IV). KHE is a service provider to Purdue Global and other Title IV participating institutions. As a service provider under the U.S. Department of Education (ED) regulations, KHE is required to comply with certain laws and regulations, including applicable statutory provisions of Title IV. KHE also provides financial aid services to Purdue Global, and as such, meets the definition of a “third-party servicer” contained in the Title IV regulations. By virtue of being a third-party servicer, KHE is also subject to applicable statutory provisions of Title IV and ED regulations that, among other things, require KHE to be jointly and severally liable with Purdue Global to the ED for any violation by Purdue Global of any Title IV statute or ED regulation or requirement. Pursuant to ED requirements, Purdue is responsible for any liability arising from the operation of the institution; however, pursuant to the agreement to transfer KU, KHE agreed to indemnify Purdue for certain pre-closing liabilities.
ED Program Reviews.
The ED has undertaken program reviews at various KHE locations.
On February 23, 2015, the ED began a program review assessing KU’s administration of its Title IV and Higher Education Act programs during the 2013-2014 and 2014-2015 award years. In 2018, Kaplan contributed the institutional assets and operations of KU to Purdue Global, and the university became Purdue Global, under the ownership and control of Purdue University. However, Kaplan retains liability for any financial obligations the ED might impose under this program review and that are the result of actions taken during the time that Kaplan owned the institution. On September 28, 2018, the ED issued a Preliminary Program Report (Preliminary Report). This Preliminary Report is not final, and the ED may change the findings in the final report. None of the initial findings in the Preliminary Report carries material financial liability. Although the program review technically covers only the 2013–2015 award years, the ED included a review of the treatment of student financial aid refunds for students who withdrew from a program prior to completion in 2017–2018. KHE cannot predict the outcome of this review, when it will be completed, whether any final findings of non-compliance with financial aid program or other requirements will impact KHE’s operations, or what liability or other limitations the ED might place on KHE or Purdue Global as a result of this review.
There are also
two
open program reviews at campuses that were part of the KHE Campuses business prior to its sale in 2015 to ECA. The ED’s final reports on the program reviews at former KHE Broomall, PA, and Pittsburgh, PA, locations are pending. KHE retains responsibility for any financial obligations resulting from these program reviews.
The Company does not expect the open program reviews to have a material impact on KHE; however, the results of open program reviews and their impact on Kaplan’s operations are uncertain.
|
19.
|
BUSINESS SEGMENTS
|
Basis of Presentation.
The Company’s organizational structure is based on a number of factors that management uses to evaluate, view and run its business operations, which include, but are not limited to, customers, the nature of products and services and use of resources. The business segments disclosed in the Consolidated Financial Statements are based on this organizational structure and information reviewed by the Company’s management to evaluate the business segment results.
The Company has
six
reportable segments: Kaplan International, KHE, KTP, Professional (U.S.), television broadcasting and healthcare.
The Company evaluates segment performance based on operating income before amortization of intangible assets and impairment of goodwill and other long-lived assets. The accounting policies at the segments are the same as described in Note 2. In computing income from operations by segment, the effects of equity in earnings (losses) of affiliates, interest income, interest expense, non-operating pension and postretirement benefit income, other non-operating income and expense items and income taxes are not included. Intersegment sales are not material.
Identifiable assets by segment are those assets used in the Company’s operations in each business segment.
The Prepaid Pension cost is not included in identifiable assets by segment.
Investments in marketable equity securities are discussed in Note 4.
Education.
Education products and services are provided by Kaplan, Inc. Kaplan International includes professional training and postsecondary education businesses largely outside the United States, as well as English-language programs. Prior to the KU Transaction closing on March 22, 2018, KHE included Kaplan’s domestic postsecondary education business, made up of fixed-facility colleges and online postsecondary and career programs. Following the KU Transaction closing, KHE includes the results as a service provider to higher education institutions. KTP includes Kaplan’s standardized test preparation and new economy skills training programs. Professional (U.S.) includes the domestic professional training and other continuing education businesses.
108
In recent years, Kaplan has formulated and implemented restructuring plans at its various businesses. There were no significant restructuring costs in 2018. Across all Kaplan businesses, restructuring costs of
$9.1 million
and
$11.9 million
were recorded in
2017
and
2016
, respectively, as follows:
|
Year Ended December 31
|
|||||||
|
(in thousands)
|
2017
|
2016
|
|||||
|
Accelerated depreciation
|
$
|
339
|
|
$
|
1,815
|
|
|
|
Lease obligation losses
|
—
|
|
2,694
|
|
|||
|
Severance
|
6,099
|
|
5,902
|
|
|||
|
Other
|
2,627
|
|
1,441
|
|
|||
|
|
$
|
9,065
|
|
$
|
11,852
|
|
|
Kaplan International incurred restructuring costs of
$2.9 million
and
$4.7 million
in
2017
and
2016
, respectively. These restructuring costs were largely in the U.K. and Australia and included severance charges, lease obligations, and accelerated depreciation.
KHE incurred restructuring costs of
$1.4 million
and
$7.1 million
in
2017
and
2016
, respectively, primarily from severance, lease obligation losses and accelerated depreciation.
KTP incurred restructuring costs of
$4.3 million
in 2017 primarily from severance.
Total accrued restructuring costs at Kaplan were
$4.6 million
and
$8.5 million
at the end of
2018
and
2017
, respectively.
Television Broadcasting.
Television broadcasting operations are conducted through
seven
television stations serving the Detroit, Houston, San Antonio, Orlando, Jacksonville and Roanoke television markets. All stations are network-affiliated (except for WJXT in Jacksonville), with revenues derived primarily from sales of advertising time. In addition, the stations generate revenue from retransmission consent agreements for the right to carry their signals.
Healthcare.
Graham Healthcare Group provides home health and hospice services.
Other Businesses.
Other businesses includes the following:
|
•
|
Hoover, a Thomson, GA-based supplier of pressure impregnated kiln-dried lumber and plywood products for fire retardant and preservative applications (acquired in April 2017); Dekko, a Garrett, IN-based manufacturer of electrical workspace solutions, architectural lighting, and electrical components and assemblies; Joyce/Dayton Corp., a Dayton, OH-based manufacturer of screw jacks and other linear motion systems; and Forney, a global supplier of products and systems that control and monitor combustion processes in electric utility and industrial applications;
|
|
•
|
SocialCode, a marketing and insights company that manages digital advertising for leading brands; The Slate Group and Foreign Policy Group, which publish online and print magazines and websites; and three investment stage businesses, Panoply, Pinna and CyberVista.
|
Corporate Office.
Corporate office includes the expenses of the Company’s corporate office, a net pension credit and certain continuing obligations related to prior business dispositions.
Geographical Information.
The Company’s non-U.S. revenues in
2018
,
2017
and
2016
totaled approximately
$657 million
,
$637 million
and
$624 million
, respectively, primarily from Kaplan’s operations outside the U.S. Additionally, revenues in
2018
,
2017
and
2016
totaled approximately
$345 million
,
$320 million
, and
$312 million
, respectively, from Kaplan’s operations in the U.K. The Company’s long-lived assets in non-U.S. countries (excluding goodwill and other intangible assets), totaled approximately
$124 million
and
$89 million
at
December 31, 2018
and
2017
, respectively.
109
Company information broken down by operating segment and education division:
|
Year Ended December 31
|
|||||||||||
|
(in thousands)
|
2018
|
2017
|
2016
|
||||||||
|
Operating Revenues
|
|
|
|
||||||||
|
Education
|
$
|
1,451,015
|
|
$
|
1,516,776
|
|
$
|
1,598,461
|
|
||
|
Television broadcasting
|
505,549
|
|
409,916
|
|
409,718
|
|
|||||
|
Healthcare
|
149,275
|
|
154,202
|
|
146,962
|
|
|||||
|
Other businesses
|
590,227
|
|
511,003
|
|
326,888
|
|
|||||
|
Corporate office
|
—
|
|
—
|
|
—
|
|
|||||
|
Intersegment elimination
|
(100
|
)
|
(51
|
)
|
(139
|
)
|
|||||
|
|
$
|
2,695,966
|
|
$
|
2,591,846
|
|
$
|
2,481,890
|
|
||
|
Income (Loss) from Operations
|
|||||||||||
|
Education
|
$
|
97,136
|
|
$
|
77,687
|
|
$
|
95,321
|
|
||
|
Television broadcasting
|
210,533
|
|
139,258
|
|
202,863
|
|
|||||
|
Healthcare
|
(8,401
|
)
|
(2,569
|
)
|
2,799
|
|
|||||
|
Other businesses
|
(246
|
)
|
(19,263
|
)
|
(24,901
|
)
|
|||||
|
Corporate office
|
(52,861
|
)
|
(58,710
|
)
|
(53,213
|
)
|
|||||
|
|
$
|
246,161
|
|
$
|
136,403
|
|
$
|
222,869
|
|
||
|
Equity in Earnings (Losses) of Affiliates, Net
|
14,473
|
|
(3,249
|
)
|
(7,937
|
)
|
|||||
|
Interest Expense, Net
|
(32,549
|
)
|
(27,305
|
)
|
(32,297
|
)
|
|||||
|
Debt Extinguishment Costs
|
(11,378
|
)
|
—
|
|
—
|
|
|||||
|
Non-Operating Pension and Postretirement Benefit Income, Net
|
120,541
|
|
72,699
|
|
80,665
|
|
|||||
|
Loss on Marketable Equity Securities, net
|
(15,843
|
)
|
—
|
|
—
|
|
|||||
|
Other Income (Expense), Net
|
2,103
|
|
4,241
|
|
(12,642
|
)
|
|||||
|
Income Before Income Taxes
|
$
|
323,508
|
|
$
|
182,789
|
|
$
|
250,658
|
|
||
|
Depreciation of Property, Plant and Equipment
|
|
|
|
||||||||
|
Education
|
$
|
28,099
|
|
$
|
32,906
|
|
$
|
41,187
|
|
||
|
Television broadcasting
|
13,204
|
|
12,179
|
|
9,942
|
|
|||||
|
Healthcare
|
2,577
|
|
4,583
|
|
2,805
|
|
|||||
|
Other businesses
|
11,835
|
|
11,723
|
|
9,570
|
|
|||||
|
Corporate office
|
1,007
|
|
1,118
|
|
1,116
|
|
|||||
|
|
$
|
56,722
|
|
$
|
62,509
|
|
$
|
64,620
|
|
||
|
Amortization of Intangible Assets and Impairment of Goodwill and
|
|||||||||||
|
Other Long-Lived Assets
|
|||||||||||
|
Education
|
$
|
9,362
|
|
$
|
5,162
|
|
$
|
7,516
|
|
||
|
Television broadcasting
|
5,632
|
|
6,349
|
|
251
|
|
|||||
|
Healthcare
|
14,855
|
|
7,905
|
|
6,701
|
|
|||||
|
Other businesses
|
25,674
|
|
31,385
|
|
13,806
|
|
|||||
|
Corporate office
|
—
|
|
—
|
|
—
|
|
|||||
|
|
$
|
55,523
|
|
$
|
50,801
|
|
$
|
28,274
|
|
||
|
Pension Service Cost
|
|
|
|
||||||||
|
Education
|
$
|
8,753
|
|
$
|
9,720
|
|
$
|
11,803
|
|
||
|
Television broadcasting
|
2,188
|
|
1,942
|
|
1,714
|
|
|||||
|
Healthcare
|
573
|
|
665
|
|
—
|
|
|||||
|
Other businesses
|
1,373
|
|
1,125
|
|
1,118
|
|
|||||
|
Corporate office
|
5,334
|
|
5,235
|
|
5,826
|
|
|||||
|
|
$
|
18,221
|
|
$
|
18,687
|
|
$
|
20,461
|
|
||
|
Capital Expenditures
|
|
|
|
||||||||
|
Education
|
$
|
54,159
|
|
$
|
27,520
|
|
$
|
26,497
|
|
||
|
Television broadcasting
|
27,013
|
|
16,802
|
|
27,453
|
|
|||||
|
Healthcare
|
1,741
|
|
2,987
|
|
2,954
|
|
|||||
|
Other businesses
|
15,154
|
|
9,771
|
|
13,093
|
|
|||||
|
Corporate office
|
—
|
|
—
|
|
715
|
|
|||||
|
|
$
|
98,067
|
|
$
|
57,080
|
|
$
|
70,712
|
|
||
110
Asset information for the Company’s business segments is as follows:
|
|
As of December 31
|
||||||
|
(in thousands)
|
2018
|
2017
|
|||||
|
Identifiable Assets
|
|
|
|||||
|
Education
|
$
|
1,568,747
|
|
$
|
1,592,097
|
|
|
|
Television broadcasting
|
452,853
|
|
455,884
|
|
|||
|
Healthcare
|
108,596
|
|
129,856
|
|
|||
|
Other businesses
|
827,113
|
|
855,399
|
|
|||
|
Corporate office
|
162,971
|
|
182,905
|
|
|||
|
|
$
|
3,120,280
|
|
$
|
3,216,141
|
|
|
|
Investments in Marketable Equity Securities
|
496,390
|
|
536,315
|
|
|||
|
Investments in Affiliates
|
143,813
|
|
128,590
|
|
|||
|
Prepaid Pension Cost
|
1,003,558
|
|
1,056,777
|
|
|||
|
Total Assets
|
$
|
4,764,041
|
|
$
|
4,937,823
|
|
|
The Company’s education division comprises the following operating segments:
|
Year Ended December 31
|
|||||||||||
|
(in thousands)
|
2018
|
2017
|
2016
|
||||||||
|
Operating Revenues
|
|
|
|
||||||||
|
Kaplan international
|
$
|
719,982
|
|
$
|
697,999
|
|
$
|
696,362
|
|
||
|
Higher education
|
342,085
|
|
431,425
|
|
501,784
|
|
|||||
|
Test preparation
|
256,102
|
|
273,298
|
|
286,556
|
|
|||||
|
Professional (U.S.)
|
134,187
|
|
115,839
|
|
115,263
|
|
|||||
|
Kaplan corporate and other
|
1,142
|
|
294
|
|
214
|
|
|||||
|
Intersegment elimination
|
(2,483
|
)
|
(2,079
|
)
|
(1,718
|
)
|
|||||
|
|
$
|
1,451,015
|
|
$
|
1,516,776
|
|
$
|
1,598,461
|
|
||
|
Income (Loss) from Operations
|
|
|
|
|
|
|
|||||
|
Kaplan international
|
$
|
70,315
|
|
$
|
51,623
|
|
$
|
48,398
|
|
||
|
Higher education
|
15,217
|
|
16,719
|
|
39,196
|
|
|||||
|
Test preparation
|
19,096
|
|
11,507
|
|
9,599
|
|
|||||
|
Professional (U.S.)
|
28,608
|
|
27,558
|
|
27,436
|
|
|||||
|
Kaplan corporate and other
|
(36,064
|
)
|
(29,863
|
)
|
(29,279
|
)
|
|||||
|
Intersegment elimination
|
(36
|
)
|
143
|
|
(29
|
)
|
|||||
|
|
$
|
97,136
|
|
$
|
77,687
|
|
$
|
95,321
|
|
||
|
Depreciation of Property, Plant and Equipment
|
|
|
|
||||||||
|
Kaplan international
|
$
|
15,755
|
|
$
|
14,892
|
|
$
|
17,523
|
|
||
|
Higher education
|
4,826
|
|
9,117
|
|
13,816
|
|
|||||
|
Test preparation
|
3,941
|
|
5,286
|
|
6,287
|
|
|||||
|
Professional (U.S.)
|
3,096
|
|
3,041
|
|
3,006
|
|
|||||
|
Kaplan corporate and other
|
481
|
|
570
|
|
555
|
|
|||||
|
|
$
|
28,099
|
|
$
|
32,906
|
|
$
|
41,187
|
|
||
|
Amortization of Intangible Assets
|
$
|
9,362
|
|
$
|
5,162
|
|
$
|
7,516
|
|
||
|
Pension Service Cost
|
|
|
|
||||||||
|
Kaplan international
|
$
|
298
|
|
$
|
264
|
|
$
|
268
|
|
||
|
Higher education
|
4,310
|
|
5,269
|
|
6,544
|
|
|||||
|
Test preparation
|
2,611
|
|
2,755
|
|
3,072
|
|
|||||
|
Professional (U.S.)
|
1,162
|
|
913
|
|
1,076
|
|
|||||
|
Kaplan corporate and other
|
372
|
|
519
|
|
843
|
|
|||||
|
|
$
|
8,753
|
|
$
|
9,720
|
|
$
|
11,803
|
|
||
|
Capital Expenditures
|
|
|
|
|
|
|
|||||
|
Kaplan international
|
$
|
44,469
|
|
$
|
21,667
|
|
$
|
16,252
|
|
||
|
Higher education
|
4,045
|
|
2,158
|
|
3,140
|
|
|||||
|
Test preparation
|
681
|
|
1,038
|
|
4,672
|
|
|||||
|
Professional (U.S.)
|
4,845
|
|
2,475
|
|
2,224
|
|
|||||
|
Kaplan corporate and other
|
119
|
|
182
|
|
209
|
|
|||||
|
|
$
|
54,159
|
|
$
|
27,520
|
|
$
|
26,497
|
|
||
111
Asset information for the Company’s education division is as follows:
|
|
As of December 31
|
||||||
|
(in thousands)
|
2018
|
2017
|
|||||
|
Identifiable Assets
|
|||||||
|
Kaplan international
|
$
|
1,101,040
|
|
$
|
1,115,919
|
|
|
|
Higher education
|
126,752
|
|
231,986
|
|
|||
|
Test preparation
|
145,308
|
|
130,938
|
|
|||
|
Professional (U.S.)
|
166,916
|
|
91,630
|
|
|||
|
Kaplan corporate and other
|
28,731
|
|
21,624
|
|
|||
|
|
$
|
1,568,747
|
|
$
|
1,592,097
|
|
|
|
20.
|
SUMMARY OF QUARTERLY OPERATING RESULTS AND COMPREHENSIVE INCOME (LOSS) (UNAUDITED)
|
Quarterly results of operations and comprehensive income (loss) for the year ended
December 31, 2018
, is as follows:
|
(in thousands, except per share amounts)
|
First
Quarter
|
Second Quarter
|
Third
Quarter
|
Fourth
Quarter
|
|||||||||||
|
Operating Revenues
|
$
|
659,436
|
|
$
|
672,677
|
|
$
|
674,766
|
|
$
|
689,087
|
|
|||
|
Operating Costs and Expenses
|
|||||||||||||||
|
Operating
|
365,151
|
|
440,655
|
|
448,920
|
|
432,706
|
|
|||||||
|
Selling, general and administrative
|
225,045
|
|
141,378
|
|
131,081
|
|
152,624
|
|
|||||||
|
Depreciation of property, plant and equipment
|
14,642
|
|
13,619
|
|
13,648
|
|
14,813
|
|
|||||||
|
Amortization of intangible assets
|
10,384
|
|
11,399
|
|
12,269
|
|
13,362
|
|
|||||||
|
Impairment of goodwill and other long-lived assets
|
—
|
|
—
|
|
8,109
|
|
—
|
|
|||||||
|
|
615,222
|
|
607,051
|
|
614,027
|
|
613,505
|
|
|||||||
|
Income from Operations
|
44,214
|
|
65,626
|
|
60,739
|
|
75,582
|
|
|||||||
|
Equity in earnings of affiliates, net
|
2,579
|
|
931
|
|
9,537
|
|
1,426
|
|
|||||||
|
Interest income
|
1,372
|
|
1,901
|
|
611
|
|
1,469
|
|
|||||||
|
Interest expense
|
(8,071
|
)
|
(17,165
|
)
|
(6,135
|
)
|
(6,531
|
)
|
|||||||
|
Debt extinguishment costs
|
—
|
|
(11,378
|
)
|
—
|
|
—
|
|
|||||||
|
Non-operating pension and postretirement benefit income, net
|
21,386
|
|
23,041
|
|
22,214
|
|
53,900
|
|
|||||||
|
(Loss) gain on marketable equity securities, net
|
(14,102
|
)
|
(2,554
|
)
|
44,962
|
|
(44,149
|
)
|
|||||||
|
Other income (expense), net
|
9,187
|
|
2,333
|
|
3,142
|
|
(12,559
|
)
|
|||||||
|
Income Before Income Taxes
|
56,565
|
|
62,735
|
|
135,070
|
|
69,138
|
|
|||||||
|
Provision for Income Taxes
|
13,600
|
|
16,100
|
|
10,000
|
|
12,400
|
|
|||||||
|
Net Income
|
42,965
|
|
46,635
|
|
125,070
|
|
56,738
|
|
|||||||
|
Net Income Attributable to Noncontrolling Interests
|
(74
|
)
|
(69
|
)
|
(6
|
)
|
(53
|
)
|
|||||||
|
Net Income Attributable to Graham Holdings Company Common Stockholders
|
$
|
42,891
|
|
$
|
46,566
|
|
$
|
125,064
|
|
$
|
56,685
|
|
|||
|
Quarterly Comprehensive Income (Loss)
|
$
|
53,703
|
|
$
|
13,345
|
|
$
|
119,862
|
|
$
|
(52,541
|
)
|
|||
|
Per Share Information Attributable to Graham Holdings Company Common Stockholders
|
|||||||||||||||
|
Basic net income per common share
|
$
|
7.84
|
|
$
|
8.69
|
|
$
|
23.43
|
|
$
|
10.69
|
|
|||
|
Basic average number of common shares outstanding
|
5,436
|
|
5,325
|
|
5,302
|
|
5,270
|
|
|||||||
|
Diluted net income per common share
|
$
|
7.78
|
|
$
|
8.63
|
|
$
|
23.28
|
|
$
|
10.61
|
|
|||
|
Diluted average number of common shares outstanding
|
5,473
|
|
5,362
|
|
5,337
|
|
5,309
|
|
|||||||
The sum of the four quarters may not necessarily be equal to the annual amounts reported in the Consolidated Statements of Operations due to rounding.
112
Quarterly results of operations and comprehensive income for the year ended
December 31, 2017
, is as follows:
|
(in thousands, except per share amounts)
|
First
Quarter
|
Second
Quarter
|
Third
Quarter
|
Fourth
Quarter
|
|||||||||||
|
Operating Revenues
|
$
|
582,717
|
|
$
|
676,087
|
|
$
|
657,225
|
|
$
|
675,817
|
|
|||
|
Operating Costs and Expenses
|
|||||||||||||||
|
Operating
|
325,687
|
|
381,747
|
|
374,987
|
|
371,922
|
|
|||||||
|
Selling, general and administrative
|
225,289
|
|
208,973
|
|
228,051
|
|
225,477
|
|
|||||||
|
Depreciation of property, plant and equipment
|
14,652
|
|
15,871
|
|
16,002
|
|
15,984
|
|
|||||||
|
Amortization of intangible assets
|
6,836
|
|
10,531
|
|
10,923
|
|
12,897
|
|
|||||||
|
Impairment of goodwill and other long-lived assets
|
—
|
|
9,224
|
|
312
|
|
78
|
|
|||||||
|
572,464
|
|
626,346
|
|
630,275
|
|
626,358
|
|
||||||||
|
Income from Operations
|
10,253
|
|
49,741
|
|
26,950
|
|
49,459
|
|
|||||||
|
Equity in earnings (losses) of affiliates, net
|
649
|
|
1,331
|
|
(532
|
)
|
(4,697
|
)
|
|||||||
|
Interest income
|
1,363
|
|
1,173
|
|
861
|
|
3,184
|
|
|||||||
|
Interest expense
|
(8,129
|
)
|
(9,035
|
)
|
(8,619
|
)
|
(8,103
|
)
|
|||||||
|
Non-operating pension and postretirement benefit income, net
|
18,801
|
|
18,620
|
|
17,621
|
|
17,657
|
|
|||||||
|
Other income (expense), net
|
849
|
|
4,069
|
|
1,963
|
|
(2,640
|
)
|
|||||||
|
Income Before Income Taxes
|
23,786
|
|
65,899
|
|
38,244
|
|
54,860
|
|
|||||||
|
Provision for (Benefit From) Income Taxes
|
2,700
|
|
23,900
|
|
13,400
|
|
(159,700
|
)
|
|||||||
|
Net Income
|
21,086
|
|
41,999
|
|
24,844
|
|
214,560
|
|
|||||||
|
Net Income Attributable to Noncontrolling Interests
|
—
|
|
(3
|
)
|
(60
|
)
|
(382
|
)
|
|||||||
|
Net Income Attributable to Graham Holdings Company Common Stockholders
|
$
|
21,086
|
|
$
|
41,996
|
|
$
|
24,784
|
|
$
|
214,178
|
|
|||
|
Quarterly Comprehensive Income
|
$
|
39,368
|
|
$
|
59,135
|
|
$
|
64,029
|
|
$
|
367,648
|
|
|||
|
Per Share Information Attributable to Graham Holdings Company Common Stockholders
|
|||||||||||||||
|
Basic net income per common share
|
$
|
3.77
|
|
$
|
7.51
|
|
$
|
4.45
|
|
$
|
38.76
|
|
|||
|
Basic average number of common shares outstanding
|
5,535
|
|
5,539
|
|
5,518
|
|
5,473
|
|
|||||||
|
Diluted net income per common share
|
$
|
3.75
|
|
$
|
7.46
|
|
$
|
4.42
|
|
$
|
38.52
|
|
|||
|
Diluted average number of common shares outstanding
|
5,569
|
|
5,577
|
|
5,554
|
|
5,509
|
|
|||||||
The sum of the four quarters may not necessarily be equal to the annual amounts reported in the Consolidated Statements of Operations due to rounding.
In the fourth quarter of 2017, an unfavorable
$2.8 million
net out of period expense adjustment was included that related to prior periods from the third quarter of 2016 through the third quarter of 2017. With respect to this error, the Company has concluded that it was not material to the Company’s financial position or results of operations for 2017 and 2016 and related interim periods, based on its consideration of quantitative and qualitative factors.
113
Quarterly impact from certain items in
2018
and
2017
(after-tax and diluted EPS amounts):
|
|
First
Quarter
|
Second
Quarter
|
Third
Quarter
|
Fourth
Quarter
|
||||||||||||
|
2018
|
||||||||||||||||
|
Ÿ
|
Intangible asset impairment charge of $5.8 million at the healthcare business
|
$
|
(1.08
|
)
|
||||||||||||
|
Ÿ
|
A $3.0 million reduction to operating expenses from property, plant, and equipment gains in connection with the spectrum repacking mandate of the FCC ($0.2 million, $0.6 million, $0.8 million and $1.4 million in the first, second, third and fourth quarters, respectively)
|
$
|
0.04
|
|
$
|
0.11
|
|
$
|
0.14
|
|
$
|
0.26
|
|
|||
|
Ÿ
|
Interest expense of $6.2 million related to the settlement of a mandatorily redeemable noncontrolling interest
|
$
|
(1.14
|
)
|
||||||||||||
|
Ÿ
|
Debt extinguishment costs of $8.6 million
|
$
|
(1.60
|
)
|
||||||||||||
|
Ÿ
|
A $22.2 million settlement gain related to a bulk lump sum pension offering and curtailment gain related to changes in the Company’s postretirement healthcare benefit plan
|
$
|
4.11
|
|
||||||||||||
|
Ÿ
|
Losses, net, of $12.6 million on marketable equity securities ($10.7 million loss, $1.9 million loss, $33.6 million gain, and $33.6 million loss in the first, second, third and fourth quarters, respectively)
|
$
|
(1.94
|
)
|
$
|
(0.36
|
)
|
$
|
6.26
|
|
$
|
(6.28
|
)
|
|||
|
Ÿ
|
Non-operating gain, net, of $5.7 million from sales, write-ups and impairments of cost method and equity method investments, and related to sales of land and businesses, including losses on guarantor lease obligations ($3.6 million gain, $1.8 million gain, $8.0 million gain, and $7.7 million loss in the first, second, third and fourth quarters, respectively)
|
$
|
0.65
|
|
$
|
0.34
|
|
$
|
1.48
|
|
$
|
(1.43
|
)
|
|||
|
Ÿ
|
Gain of $1.8 million on the Kaplan University Transaction
|
$
|
0.33
|
|
||||||||||||
|
Ÿ
|
Losses, net, of $2.9 million for non-operating foreign currency (losses) gains ($0.1 million gain, $1.7 million loss, $0.1 million loss, and $1.2 million loss in the first, second, third and fourth quarters, respectively)
|
$
|
0.02
|
|
$
|
(0.32
|
)
|
$
|
(0.02
|
)
|
$
|
(0.23
|
)
|
|||
|
Ÿ
|
A nonrecurring discrete $17.8 million deferred state tax benefit related to the release of valuation allowances
|
$
|
3.31
|
|
||||||||||||
|
Ÿ
|
Income tax benefit of $1.8 million related to stock compensation
|
$
|
0.33
|
|
||||||||||||
|
2017
|
||||||||||||||||
|
Ÿ
|
Charges of $6.3 million related to restructuring and non-operating Separation Incentive Program charges at the education division ($0.3 million, $0.4 million, $1.1 million and $4.5 million in the first, second, third and fourth quarters, respectively)
|
$
|
(0.05
|
)
|
$
|
(0.06
|
)
|
$
|
(0.20
|
)
|
$
|
(0.81
|
)
|
|||
|
Ÿ
|
Goodwill and long-lived assets impairment charges of $5.8 million at other businesses
|
$
|
(1.03
|
)
|
||||||||||||
|
Ÿ
|
Gains, net, of $2.1 million for non-operating foreign currency gains (losses) ($1.1 million gain, $2.2 million gain, $0.9 million gain and $2.1 million loss in the first, second, third and fourth quarters, respectively)
|
$
|
0.19
|
|
$
|
0.39
|
|
$
|
0.16
|
|
$
|
(0.37
|
)
|
|||
|
Ÿ
|
Net deferred tax benefits of $177.5 million related to the Tax Act
|
$
|
31.68
|
|
||||||||||||
|
Ÿ
|
Income tax benefit of $5.9 million related to stock compensation
|
$
|
1.06
|
|
||||||||||||
114
GRAHAM HOLDINGS COMPANY
FIVE-YEAR SUMMARY OF SELECTED HISTORICAL FINANCIAL DATA
See Notes to Consolidated Financial Statements for the summary of significant accounting policies and additional information relative to the years
2016
–
2018
.
|
(in thousands, except per share amounts)
|
2018
|
2017
|
2016
|
2015
|
2014
|
||||||||||||||
|
Results of Operations
|
|
|
|
|
|
||||||||||||||
|
Operating revenues
|
$
|
2,695,966
|
|
$
|
2,591,846
|
|
$
|
2,481,890
|
|
$
|
2,586,114
|
|
$
|
2,737,032
|
|
||||
|
Income (loss) from operations
|
246,161
|
|
136,403
|
|
222,869
|
|
(158,140
|
)
|
149,402
|
|
|||||||||
|
Income (loss) from continuing operations
|
271,408
|
|
302,489
|
|
169,458
|
|
(141,390
|
)
|
765,403
|
|
|||||||||
|
Net income (loss) attributable to Graham Holdings Company
common stockholders
|
271,206
|
|
302,044
|
|
168,590
|
|
(101,286
|
)
|
1,292,996
|
|
|||||||||
|
Per Share Amounts
|
|
|
|
|
|
||||||||||||||
|
Basic earnings (loss) per common share attributable to Graham Holdings Company common stockholders
|
|
|
|
|
|
||||||||||||||
|
Income (loss) from continuing operations
|
$
|
50.55
|
|
$
|
54.24
|
|
$
|
29.95
|
|
$
|
(25.23
|
)
|
$
|
115.88
|
|
||||
|
Net income (loss)
|
50.55
|
|
54.24
|
|
29.95
|
|
(17.87
|
)
|
195.81
|
|
|||||||||
|
Diluted earnings (loss) per common share attributable to Graham Holdings Company common stockholders
|
|
|
|
|
|
||||||||||||||
|
Income (loss) from continuing operations
|
$
|
50.20
|
|
$
|
53.89
|
|
$
|
29.80
|
|
$
|
(25.23
|
)
|
$
|
115.40
|
|
||||
|
Net income (loss)
|
50.20
|
|
53.89
|
|
29.80
|
|
(17.87
|
)
|
195.03
|
|
|||||||||
|
Weighted average shares outstanding:
|
|
|
|
|
|
||||||||||||||
|
Basic
|
5,333
|
|
5,516
|
|
5,559
|
|
5,727
|
|
6,470
|
|
|||||||||
|
Diluted
|
5,370
|
|
5,552
|
|
5,589
|
|
5,727
|
|
6,559
|
|
|||||||||
|
Cash dividends per common share
|
$
|
5.32
|
|
$
|
5.08
|
|
$
|
4.84
|
|
$
|
9.10
|
|
$
|
10.20
|
|
||||
|
Graham Holdings Company common stockholders’ equity per common share
|
$
|
550.24
|
|
$
|
529.59
|
|
$
|
439.88
|
|
$
|
429.15
|
|
$
|
541.54
|
|
||||
|
Financial Position
|
|
|
|
|
|
||||||||||||||
|
Working capital
|
$
|
720,180
|
|
$
|
857,192
|
|
$
|
1,052,385
|
|
$
|
1,135,573
|
|
$
|
639,911
|
|
||||
|
Total assets
|
4,764,041
|
|
4,937,823
|
|
4,432,670
|
|
4,352,825
|
|
5,752,319
|
|
|||||||||
|
Long-term debt
|
470,777
|
|
486,561
|
|
485,719
|
|
399,800
|
|
399,545
|
|
|||||||||
|
Graham Holdings Company common stockholders’ equity
|
2,916,782
|
|
2,915,145
|
|
2,452,941
|
|
2,490,698
|
|
3,140,299
|
|
|||||||||
Impact from certain items included in income from continuing operations (after-tax and diluted EPS amounts):
2018
|
•
|
Intangible asset impairment charge of
$5.8 million
(
$1.08
per share) at the healthcare business
|
• Reduction to operating expenses of
$3.0 million
(
$0.55
per share) from property, plant, and equipment gains in connection with the spectrum repacking mandate of the FCC
• Interest expense of
$6.2 million
(
$1.14
per share) related to the settlement of a mandatorily redeemable noncontrolling interest
• Debt extinguishment costs of
$8.6 million
(
$1.60
per share)
• Non-operating settlement and curtailment gain of
$22.2 million
(
$4.11
per share) related to a bulk lump sum pension offering and changes in the Company’s postretirement healthcare benefit plan
• Losses, net, of
$12.6 million
(
$2.33
per share) on marketable equity securities
• Non-operating gain, net, of
$5.7 million
(
$1.03
per share) from sales, write-ups and impairments of cost method and equity method investments, and related to sales of land and businesses, including losses on guarantor lease obligations
• Gain of
$1.8 million
(
$0.33
per share) on the Kaplan University Transaction
• Losses, net, of
$2.9 million
(
$0.54
per share) from non-operating foreign currency losses
• Nonrecurring discrete deferred state tax benefit of
$17.8 million
(
$3.31
per share) related to the release of valuation allowances
• Income tax benefit of
$1.8 million
(
$0.33
per share) related to stock compensation
2017
|
•
|
Charges of
$6.3 million
(
$1.12
per share) related to restructuring and non-operating Separation Incentive Program charges at the education division
|
|
•
|
Goodwill and other long-lived assets impairment charges of
$5.8 million
(
$1.03
per share) in other businesses
|
|
•
|
Gains, net, of
$2.1 million
(
$0.37
per share) from non-operating foreign currency gains
|
|
•
|
Net deferred tax benefits of
$177.5 million
(
$31.68
per share) related to the Tax Act
|
|
•
|
Income tax benefit of
$5.9 million
(
$1.06
per share) related to stock compensation
|
2016
|
•
|
Charges of
$7.7 million
(
$1.36
per share) related to restructuring at the education division
|
|
•
|
Non-operating settlement gain of
$10.8 million
(
$1.92
per share) related to a bulk lump sum pension offering
|
|
•
|
$20.0 million
(
$3.52
per share) net non-operating gain from the sales of land and marketable equity securities
|
|
•
|
$13.6 million
(
$2.37
per share) non-operating gain arising from the sale of a business and the formation of a joint venture
|
|
•
|
$24.1 million
(
$4.27
per share) non-operating expense from the write-down of cost method investments and investments in affiliates
|
|
•
|
Losses, net, of
$25.5 million
(
$4.51
per share) from non-operating foreign currency losses
|
|
•
|
Net nonrecurring
$8.3 million
(
$1.47
per share) deferred tax benefit related to Kaplan’s international operations
|
|
•
|
Favorable
$5.6 million
(
$1.00
per share) out of period deferred tax adjustment related to the KHE goodwill impairment from 2015
|
115
2015
|
•
|
Goodwill and other long-lived assets impairment charges of
$225.2 million
(
$38.96
per share) at the education division and other business
|
|
•
|
Charges of
$28.9 million
(
$4.97
per share) related to restructuring and non-operating Special Incentive Program charges at the education division, corporate office and other businesses
|
|
•
|
$15.3 million
(
$2.64
per share) in expense related to the modification of stock option awards and restricted stock awards
|
|
•
|
Net non-operating losses of
$15.7 million
(
$2.82
per share) arising from the sales of five businesses and an investment, and on the formation of a joint venture
|
|
•
|
$13.2 million
(
$2.27
per share) gain on the sale of land
|
|
•
|
Losses, net, of
$9.7 million
(
$1.67
per share) from non-operating unrealized foreign currency losses
|
2014
|
•
|
Charges of
$20.2 million
(
$3.05
per share) related to restructuring and non-operating early retirement program expense and related charges at the education division and corporate office
|
|
•
|
Intangible and other long-lived assets impairment charge of
$11.2 million
(
$1.69
per share) at the education division and other business
|
|
•
|
Gain from the sale of Classified Ventures of
$249.8 million
(
$37.68
per share)
|
|
•
|
$58.2 million
(
$8.78
per share) gain from the Classified Ventures’ sale of apartments.com
|
|
•
|
Gain from the Berkshire exchange transaction of
$266.7 million
(
$40.23
per share)
|
|
•
|
$81.8 million
(
$12.34
per share) gain on the sale of the corporate headquarters building
|
|
•
|
Losses, net, of
$7.1 million
(
$1.08
per share) from non-operating unrealized foreign currency losses
|
116
TABLE OF CONTENTS
Part IItem 1. BusinessItem 1A. Risk FactorsItem 1B. Unresolved Staff CommentsItem 2. PropertiesItem 3. Legal ProceedingsItem 4. Mine Safety DisclosuresPart IIItem 5. Market For The Registrant S Common Equity, Related Stockholder Matters and Issuer Purchases Of Equity SecuritiesItem 6. Selected Financial DataItem 7. Management S Discussion and Analysis Of Financial Condition and Results Of OperationsItem 7A. Quantitative and Qualitative Disclosures About Market RiskItem 8. Financial Statements and Supplementary DataItem 9. Changes in and Disagreements with Accountants on Accounting and Financial DisclosureItem 9A. Controls and ProceduresItem 9B. Other InformationPart IIIItem 10. Directors, Executive Officers and Corporate GovernanceItem 11. Executive CompensationItem 12. Security Ownership Of Certain Beneficial Owners and Management and Related Stockholder MattersItem 13. Certain Relationships and Related Transactions and Director IndependenceItem 14. Principal Accounting Fees and ServicesPart IVItem 15. Exhibits, Financial Statement SchedulesItem 16. Form 10-k Summary