GULF ISLAND FABRICATION INC
10-Ks and 10-Qs
|
|
|
|
|
|
|
|
|
|
|
|
|
|
|
|
|
|
|
|
|
|
|
|
|
|
|
|
|
|
|
|
|
|
|
|
|
|
|
|
|
|
|
|
|
|
|
|
|
|
|
|
|
|
|
|
|
|
|
UNITED STATES
SECURITIES AND EXCHANGE COMMISSION
Washington, D.C. 20549
FORM 10-K
(Mark One)
|
x
|
Annual Report Pursuant to Section 13 or 15(d) of the Securities Exchange Act of 1934
|
For the fiscal year ended December 31, 2015
or
|
¨
|
Transition Report Pursuant to Section 13 or 15(d) of the Securities Exchange Act of 1934
|
For the transition period from to Commission File Number 001-34279

GULF ISLAND FABRICATION, INC.
(Exact name of registrant as specified in its charter)
|
Louisiana
|
|
72-1147390
|
|
(State or other jurisdiction
of incorporation or organization)
|
|
(I.R.S. Employer
Identification Number)
|
|
16225 Park Ten Place,
Suite 280 Houston, Texas
|
|
77084
|
|
(Address of principal executive offices)
|
|
(Zip code)
|
(713) 714-6100
(Registrant’s telephone number, including area code)
Securities registered pursuant to Section 12(b) of the Act:
|
Title of each class
|
|
Name of each exchange on which registered
|
|
Common Stock, no par value
|
|
The Nasdaq Stock Market LLC
(Nasdaq Global Select Market)
|
Securities registered pursuant to Section 12(g) of the Act:
None
Indicate by check mark if the registrant is a well-known seasoned issuer, as defined in Rule 405 of the Securities Act. Yes
¨
No
x
Indicate by check mark if the registrant is not required to file reports pursuant to Section 13 or Section 15(d) of the Act. Yes
¨
No
x
Indicate by check mark whether the registrant (1) has filed all reports required to be filed by Section 13 or 15(d) of the Securities Exchange Act of 1934 during the preceding 12 months (or for such shorter period that the registrant was required to file such reports), and (2) has been subject to such filing requirements for the past 90 days. Yes
x
No
¨
Indicate by check mark whether the registrant has submitted electronically and posted on its corporate web site, if any, every Interactive Data File required to be submitted and posted pursuant to Rule 405 of Regulation S-T during the preceding twelve months (or for such shorter period that the registrant was required to submit and post such files). Yes
x
No
¨
Indicate by check mark if disclosure of delinquent filers pursuant to Item 405 of Regulation S-K is not contained herein, and will not be contained, to the best of registrant’s knowledge, in definitive proxy or information statements incorporated by reference in Part III of this Form 10-K or any amendment to this Form 10-K.
x
Indicate by check mark whether the registrant is a large accelerated filer, an accelerated filer, a non-accelerated filer, or a smaller reporting company. See definitions of “large accelerated filer,” “accelerated filer” and “smaller reporting company” in Rule 12b-2 of the Exchange Act.
|
Large accelerated filer
¨
|
|
Accelerated filer
x
|
|
Non-accelerated filer
¨
(Do not check if a smaller reporting company)
|
|
Smaller reporting company
¨
|
Indicate by check mark whether the registrant is a shell company (as defined in Rule 12b-2 of the Act). Yes
¨
No
x
The aggregate market value of the voting and non-voting common equity held by non-affiliates of the registrant at June 30,
2015
was approximately $160,619,350.
The number of shares of the registrant’s common stock, no par value per share, outstanding as of March 9, 2016 was 14,630,686.
DOCUMENTS INCORPORATED BY REFERENCE
Portions of the registrant’s definitive Proxy Statement prepared for use in connection with the registrant’s 2016 Annual Meeting of Shareholders have been incorporated by reference into Part III of this Form 10-K.
GULF ISLAND FABRICATION, INC.
ANNUAL REPORT ON FORM 10-K FOR
THE FISCAL YEAR ENDED DECEMBER 31,
2015
TABLE OF CONTENTS
|
|
Page
|
|
|
PART I
|
2
|
|
|
Items 1 and 2. Business and Properties
|
2
|
|
|
Item 1A. Risk Factors
|
12
|
|
|
Item 1B. Unresolved Staff Comments
|
17
|
|
|
Item 3. Legal Proceedings
|
17
|
|
|
Item 4. Mine Safety Disclosures
|
17
|
|
|
Item 4A. Executive Officers of the Registrant
|
17
|
|
|
PART II
|
19
|
|
|
Item 5. Market for Registrant’s Common Equity, Related Stockholder Matters and Issuer Purchases of Equity Securities
|
19
|
|
|
Item 6. Selected Financial Data
|
21
|
|
|
Item 7. Management’s Discussion and Analysis of Financial Condition and Results of Operations
|
23
|
|
|
Item 7A. Quantitative and Qualitative Disclosures About Market Risk
|
33
|
|
|
Item 8. Financial Statements and Supplementary Data
|
33
|
|
|
Item 9. Changes in and Disagreements with Accountants on Accounting and Financial Disclosure
|
33
|
|
|
Item 9A. Controls and Procedures
|
33
|
|
|
Item 9B. Other Information
|
35
|
|
|
PART III
|
36
|
|
|
Item 10. Directors, Executive Officers and Corporate Governance
|
36
|
|
|
Item 11. Executive Compensation
|
36
|
|
|
Item 12. Security Ownership of Certain Beneficial Owners and Management and Related Stockholder Matters
|
36
|
|
|
Item 13. Certain Relationships and Related Transactions, and Director Independence
|
36
|
|
|
Item 14. Principal Accounting Fees and Services
|
37
|
|
|
PART IV
|
38
|
|
|
Item 15. Exhibits, Financial Statement Schedules
|
38
|
|
|
GLOSSARY OF CERTAIN TECHNICAL TERMS
|
G-1
|
|
|
FINANCIAL STATEMENTS
|
F-1
|
|
|
SIGNATURES
|
S-1
|
|
|
EXHIBIT INDEX
|
E-1
|
|
i
Forward-Looking Information
Certain statements included in this report and in oral statements made from time to time by management of the Company that are not statements of historical fact are forward-looking statements. In this report, forward-looking statements are included primarily in the sections entitled “Business and Properties,” “Legal Proceedings,” and “Management’s Discussion and Analysis of Financial Condition and Results of Operations.” The words “expect,” “believe,” “anticipate,” “project,” “plan,” “estimate,” “predict” and similar expressions often identify forward-looking statements. All such statements are subject to certain risks and uncertainties that could cause actual results and outcomes to differ materially from the results and outcomes predicted in the statements and investors are cautioned not to place undue reliance upon them. Important factors that may cause our actual results to differ materially from expectations or projections include those described in the section titled “Risk Factors.” Forward-looking statements speak only as to the date of this report, and we undertake no obligation to update or revise such statements to reflect new circumstances or unanticipated events or circumstances.
1
Items 1 and 2. Business and Properties
Certain technical terms are defined in the “Glossary of Certain Technical Terms” beginning on page G-1.
General
Gulf Island Fabrication, Inc. ("Gulf Island"), and together with its subsidiaries, (the “Company”, “we” or “our”), is a leading fabricator of steel platforms and other specialized structures for customers in the offshore oil and gas industry. In addition, we also perform onshore and offshore construction and fabrication services for customers in the marine industry. Our principal markets are concentrated in the offshore regions and along the coast of the Gulf of Mexico. We currently provide our customers with what we believe to be the largest group of fabrication facilities serving the Gulf of Mexico market. The Company was incorporated in 1985 and began operations at our fabrication yard on the Houma Navigation Canal in southern Louisiana, approximately 30 miles from the Gulf of Mexico. Since our formation, we have expanded and grown our operations through acquisitions of additional facilities on the Houma Navigation Canal in southern Louisiana as well as 212 acres in Ingleside, Texas between the Gulf Intracoastal Waterway and Corpus Christi Ship Channel and 160 acres in Aransas Pass, Texas located along the U.S. Intracoastal Waterway. In October 2013, we moved our corporate headquarters to Houston, Texas. We continue to grow our operations and to diversify our business. On January 1, 2016, we acquired substantially all of the assets and assumed certain specified liabilities of LEEVAC Shipyards, L.L.C. and its affiliates (collectively, “LEEVAC”), through our newly formed wholly-owned subsidiary, Gulf Island Shipyards, L.L.C. in an all cash transaction. See further discussion of the LEEVAC acquisition below.
Gulf Island serves as a holding company and conducts all of its operations through its subsidiaries, which include: Gulf Island, L.L.C.; Gulf Marine Fabricators, L.P.; Gulf Island Marine Fabricators, L.L.C.; Gulf Island Shipyards, L.L.C.; Dolphin Services, L.L.C.; and Dolphin Steel Sales, L.L.C.
LEEVAC Acquisition
On January 1, 2016, we acquired substantially all of the assets and assumed certain specified liabilities of LEEVAC Shipyards, L.L.C. and its affiliates ("LEEVAC"). The purchase price for the acquisition was $20.0 million, subject to a working capital adjustment whereby we received at closing a dollar for dollar reduction for the assumption of certain net liabilities of LEEVAC and settlement payments from sureties on certain ongoing fabrication projects that were assigned to us in the acquisition. After taking into account these adjustments, we received approximately $1.6 million in cash at closing and added approximately $112.0 million of incremental contract backlog primarily for four new build construction projects to be delivered in 2016 and 2017. Strategically, the acquisition expands our marine fabrication and repair and maintenance presence in the Gulf South market and further diversifies our fabrication capabilities. A description of the primary fabrication facilities and equipment acquired is as follows:
|
•
|
Jennings
- Leased facilities from a third party for a 180 acre complex five miles east of Jennings, LA on the west bank of the Mermentau River approximately 25 miles north of the Intracoastal waterway. The Jennings Complex includes over 100,000 square feet of covered fabrication area including a panel line and pipe shop and 3,000 feet of water frontage with two launch ways and four covered construction bays. The lease, including exercisable renewal options, extends through January 2045.
|
|
•
|
Lake Charles
- Subleased facilities from a third party for a 10 acre complex 17 miles from the Gulf of Mexico on the Calcasieu River near Lake Charles, LA. The Lake Charles complex includes 1,100 feet of bulkhead water frontage with a water depth of 40 feet located one mile from the main ship channel and the Gulf Intracoastal Waterway and is located multiple petrochemical plants. The sublease, including exercisable renewal options (subject to sublessor renewals), extends through July 2038.
|
|
•
|
Houma
- Leased facilities from the owner of LEEVAC Shipyards for a 35 acre complex 26 miles from the Gulf of Mexico near Houma, LA. The Houma complex includes 2,700 feet of bulkhead water frontage and 110,000 square feet of covered construction area. The lease expires on the later of December 31, 2016 or 90 days following the completion of the two vessels currently under construction at the facility, but no later than August 31, 2017. Upon expiration, we will have the option to extend the lease at market rates.
|
Machinery and equipment at the above leased facilities includes a new plasma cutter installed in 2013, eight crawler cranes ranging from 65-230 tons, 8 track cranes, 10 overhead cranes, six drydocks ranging from 1,500 to 3,500 tons, and a 200 ton module transporter.
2
At the date of acquisition, we acquired approximately $112.0 million of new build construction backlog which primarily includes 4 new build construction projects to be delivered in 2016 and 2017 with two third party customers. The ultimate dollar amount of acquired backlog is subject to a change in value in connection with our purchase price allocation. Additionally, we hired 380 employees upon acquisition of the facilities representing all of the LEEVAC former employees.
Web site and Electronic Posting Disclosures
Our web site address is www.gulfisland.com. We make available on or through our web site, without charge, as soon as reasonably practicable after such material are electronically filed with or furnished to the Securities and Exchange Commission (“SEC”), our annual reports on Form 10-K, quarterly reports on Form 10-Q, current reports on Form 8-K and amendments to those reports. The SEC also maintains an Internet site that contains reports, proxy and information statements, and other information regarding issuers that file electronically with the SEC. The SEC’s web site address is www.sec.gov. Our web site and the information contained therein or connected thereto are not intended to be incorporated into this annual report on Form 10-K.
Description of Operations
The following description of our operations are as they exist as of and for the year ended December 31, 2015.
Our primary activity is the fabrication of offshore drilling and production platforms and other steel structures for customers in the oil and gas and marine industries, including jackets and deck sections of fixed production platforms, hull, tendon, and/or deck sections of floating production platforms (such as TLPs, Spars, FPSOs and MinDOCs), piles, wellhead protectors, subsea templates, and various production, compressor, and utility modules. We use modern welding and fabrication technology, and all of our projects are manufactured in accordance with industry standards, specifications and regulations, including those published by the American Petroleum Institute, the American Welding Society, the American Society of Mechanical Engineers, the American Bureau of Shipping and the United States Coast Guard. The quality management systems of our operating subsidiaries are certified as ISO 9001-2008 quality assurance programs. For additional information, see “Safety and Quality Assurance” below.
Most of the steel used in our operations arrives at our fabrication yards as steel plate. The plate is cut and rolled into tubular sections at rolling mills in our fabrication yards. The tubular sections (which vary in diameter up to 23 feet) are welded together in long straight tubes to become legs or into shorter tubes to become part of the network of bracing that support the legs. Various cuts and welds in the fabrication process are performed by computer-controlled equipment that operates from data developed during the design of the structure. A majority of our offshore drilling and production platforms are fixed platforms. A fixed platform is the traditional type of platform used for the offshore development and production of oil and gas reserves, although recently there has been an increase in the use of floating production platforms as a result of increased drilling and production activities in deeper waters.
Jackets
-The most common type of fixed platform consists of a jacket (a tubular steel, braced structure extending from the mud line on the seabed to a point above the water surface) which supports the deck structure located above the level of storm waves and is secured with tubular pilings driven deep into the seabed. The deck structure is designed to accommodate multiple functions, including drilling, production, separating, gathering, piping, compression, well support, and crew quartering. Platforms can be joined by bridges to form complexes of platforms for very large developments or to improve safety by dividing functions among specialized platforms. Jacket-type platforms are generally the most viable solution for water depths of 1,000 feet or less. Although there is no height limit to the jackets that can be fabricated at our Houma facilities, the dimensions of the Houma Navigation Canal prevent the transportation to the Gulf of Mexico of most jackets and hulls designed for water depths exceeding 800 feet. Our south yard in Texas, which is located along the Gulf Intracoastal Waterway and the 45-foot-deep Corpus Christi Ship Channel, provides direct and unrestricted access to the Gulf of Mexico, which allows for fabrication or assembly of any size jacket or other structure currently in use for the development and production of oil and gas for deepwater drilling. In some instances, we may fabricate jackets, deck sections, living quarters and/or piles for a platform at our Houma facility, with the hulls and/or jackets for the platform designed for water depths in excess of 800 feet fabricated at our Texas facility.
Jackets are built on skidways (which are long parallel rails along which the jacket will slide when it is transferred to a barge for towing out to sea) and are generally built in sections. As each section of legs and bracing is complete, large crawler cranes pick up an entire side and “roll up” the section, joining it to another uprighted section. When a jacket is complete, it is pulled along the skidway onto a launch barge. Using ocean-going tugs, the barge is transported to the offshore installation site. Our ability to fabricate and assemble large tubular sections needed for jackets for use in water depths over 300 feet distinguish us from all but one of our domestic competitors.
3
Decks
- Decks are built either as single structures or in sections and are installed on location on fixed and floating platforms by construction contractors. The composition and quantity of petroleum in the well stream generally determine the size and configuration of the production deck on a processing platform. Typical deck equipment includes crude oil pumps, oil and gas separators and gas compressors. Unlike large jackets, which are transported in a horizontal position, decks are transported upright and, as a result, are not subject to the width restrictions of the Houma Navigation Canal.
TLPs
-TLPs consist of a deck that sits atop one or more column-shaped hulls, which are positioned on site with vertical tendons running from the hulls to the seabed. The tendons hold the hulls partially submerged and are highly tensioned using the buoyancy of the hulls. This system develops a restoring force against wave, wind and current actions in proportion to the lateral displacement of the vessel. Wells for a TLP are often pre-drilled through a subsea template. Long, flexible production risers, which carry the petroleum to the deck of the TLP, are supported in tension by mechanical tensioner machines on the platform’s deck and are directly subject to wave, wind and current forces. TLPs can be used in any water depth and are generally better suited than fixed platforms for water depths greater than 1,000 feet. The size of a TLP depends on a number of factors, including the intended scope of production of the platform, the length of the production risers connected to the platform, the size of the deck to be installed on the platform and the water depth for which the platform is designed. We fabricate deck sections and hulls for use with TLPs of any size. In November 2009, we completed fabrication and delivered a MinDOC hull, the first deepwater dry tree drilling and production platform built in the United States. We completed the fabrication of the first Spar hull to be built in the United States, and delivered it in the first quarter of 2014.
Subsea templates
-
We fabricate subsea templates used in connection with TLPs. Subsea templates are structures installed on the seabed before development drilling begins.
Other fabrication and repair work
-
We also produce and repair pressure vessels used in the oil and gas industry, refurbish existing platforms, fabricate various other types of steel structures, including processing modules used in petro-chemical plants, fabricate living quarters for installation on such platforms ranging in size from 4 to 250 beds, provide onshore and offshore scaffolding and piping insulation services, perform heavy lifts such as ship integration and TLP module integration and load and offload jack-up drilling rigs, semi-submersible drilling rigs, TLPs, Spars or other similar cargo. In addition, we fabricate towboats, barges, lift boats, dry docks, offshore support vessels, other marine vessels, and mid-body sections for offshore supply vessels. Our Houma dry dock has recently been upgraded, extending the lift capacity from 9,000 tons to 12,000 tons and is used to maintain and repair third party marine vessels, as well as to launch vessels fabricated at our facilities.
In addition, we fabricate piles and other rolled goods, bridges for connecting offshore platforms, wellhead protectors, various production, compressor and utility modules and other structures used in offshore oil and gas production and development activities. All of our products are installed by construction contractors.
Onshore and offshore construction services
-
We provide interconnect piping services on offshore platforms and inshore steel structures. Interconnect piping services involve sending employee crews to offshore platforms in the Gulf of Mexico to perform welding and other activities required to connect production equipment, service modules and other equipment to a platform. We also contract with oil and gas companies that have platforms and other structures located in the inland lakes and bays throughout the southeast for various on-site construction and maintenance activities. In addition, we fabricate pressure vessels and large and small packaged skid units and provide various municipal and drainage projects, such as pump stations, levee reinforcement, bulkheads and other levee and drainage projects, to state and local governments.
Marine vessels
-
We manufacture and repair various steel marine vessels in the United States including offshore supply vessels; anchor handling vessels; and lift boats to support the construction and ongoing operation of offshore oil and gas production platforms; tug boats and towboats for towing and pushing barges that support transportation of various types of products and materials; mooring and positioning, dredging assistance, tanker escort, port management, shipping, piloting, coastal flood protection barge gates, inland and offshore barges, and fire-fighting and salvage vessels. We also construct dry docks to lift marine vessels out of the water. Our marine repair activities include steel repair, blasting and painting services, electrical systems repair, machinery and piping system repairs, and propeller, shaft, and rudder reconditioning. In addition, we perform conversion projects that consist of lengthening vessels, modifying vessels to permit their use for a different type of activity, and other modifications to enhance the capacity or functionality of a vessel. In the first quarter 2012, we delivered a 335-Class lift boat to Montco Offshore, Inc., and in the fourth quarter, 2014, we completed and delivered to the customer a second 335-Class lift boat. These two vessels are the largest lift boats to be used in the Gulf of Mexico.
Facilities and Equipment
We perform all projects at our Louisiana and Texas facilities based on availability of space and equipment. The description below is as of December 31, 2015, as they pertain to operations for the year ended December 31, 2015 (the period presented in this annual report). See the LEEVAC acquisition discussion above for a description of the additional leased
4
facilities and equipment that we acquired on January 1, 2016. As of December 31, 2015, we owned all of the facilities and equipment described below.
Facilities
Louisiana Operations
In Louisiana, our main fabrication yard is located on the east bank of the Houma Navigation Canal in Houma, Louisiana, approximately 30 miles from the Gulf of Mexico. This facility is situated on approximately 140 acres, of which 100 acres are developed for fabrication, and includes several buildings totaling 49,000 square feet of administrative offices, 267,000 square feet of covered fabrication area, over 47,000 square feet of warehouse storage area and 8,000 square feet of training and medical facilities. The main yard also has approximately 2,800 linear feet of water frontage, which includes 1,500 feet of steel bulkheads that permit load out of heavy structures.
Our west yard is located across the Houma Navigation Canal from the main yard on 437 acres, 130 acres of which are developed for fabrication and over 300 acres of which are unimproved land that could be used for expansion. The west yard spans 6,750 linear feet of the Houma Navigation Canal, including 2,350 feet of steel bulkhead, and has approximately 151,600 square feet of covered fabrication area, 21,000 square feet of warehouse storage area, and two buildings providing an additional 8,000 square feet for administrative offices.
Our Houma north yard operates on the east bank of the Houma Navigation Canal adjacent to our Houma main fabrication yard. The facility covers 23 acres and includes a two-story, 5,000 square foot administration building with an attached 5,300 square foot warehouse. The property has approximately 1,850 linear feet of water frontage, including a 380 linear foot steel bulkhead that permits docking of vessels and the load out of structures.
Located approximately a quarter of a mile from our main yard on a channel adjacent to the Houma Navigation Canal, we operate a 63-acre facility that includes buildings totaling 14,500 square feet of administrative offices, 40,800 square feet of covered fabrication area, 29,600 square feet of warehouse storage area, a 10,000 square foot blasting and coating facility and approximately 1,320 linear feet of water frontage, including 660 feet of steel bulkhead.
We own a 12,000 ton dry dock, supplementing our marine construction operations in Houma. The dry dock is 320 feet long by 160 feet wide and 140 feet wide between the wing walls. The bottom is 10 feet deep with 30 foot walls. The dry dock is used for maintenance and repairs of marine vessels, as well as launch vessels fabricated at our Houma facility.
Texas Operations
Our south yard in Ingleside, Texas is located on the northwest corner of the intersection between the Gulf Intracoastal Waterway and the Corpus Christi Ship Channel. The 45-foot deep Corpus Christi Ship Channel provides direct and unrestricted access to the Gulf of Mexico, which allows for fabrication or assembly of any size jacket or other structure currently in use for the development and production of oil and gas in the Gulf of Mexico. This facility is situated on approximately 212 acres developed for fabrication and assembly, and includes a fabrication shop with 5,000 square feet of covered fabrication area, 10,000 square feet of warehouse storage area and 2,700 square feet of training facilities. The yard includes approximately 2,650 linear feet of water frontage, all of which is reinforced by steel bulkhead. In addition, there is a dredge area 86 feet deep within 500 feet of the bulkhead used in conjunction with heavy lift vessels. This area measures 800 feet by 200 feet at the base and can accommodate the largest existing semi-submersible transport vessels.
In addition, the south yard contains a graving dock which measures 700 feet long by 250 feet wide and 40 feet deep. The graving dock has a reinforced concrete slab floor, sheet-pile walls and pile supported relieving platforms around the perimeter to take the surcharge load applied by cranes. The south end of the graving dock, which opens to the Corpus Christi Ship Channel, can use either a removable sheet piled wall supported by steel struts or a portable gate that can be removed and attached to seal the dock from the water in the channel, depending upon the nature of the project. The graving dock gate is a steel barge-like structure consisting of a steel reinforced wall and a buoyancy tank. The floating structure is 240 feet long x 35 feet wide x 40 feet deep and weighs approximately 950 tons. The gate structure has rubber seals that engage the walls and the graving dock floor. Although the de-ballasting of the dock requires pumps, the gate is equipped with piping to allow the gate to be flooded without the use of pumps. When flooded, the graving dock has a minimum of 30 feet of water over the concrete floor.
Our Texas north yard in Aransas Pass, Texas is located along the U.S. Intracoastal Waterway and is approximately three miles north of the Corpus Christi Ship Channel. This facility is situated on approximately 160 acres, of which 85 acres are dedicated to fabrication activities and 55 acres are used for the storage of steel, prefabricated elements, equipment, and spare parts. Several buildings are located on our Texas north yard with 328,000 square feet of covered fabrication area, 22,000 square
5
feet of administrative office space, 61,750 square feet of warehouse storage area and 16,000 square feet of training and medical facilities. The yard also has approximately 3,000 linear feet of water frontage, including approximately 1,000 feet of steel bulkhead.
Equipment
Our Houma main yard houses our Bertsch Model 34 and Model 20 plate bending rolls, a computerized Vernon brace coping machine used for cutting steel in complex geometric sections, two grit blast systems, a hydraulic plate shear, a hydraulic press brake, and various other equipment needed to build offshore structures and fabricate steel components. Our Houma west yard has a Bertsch Model 38 plate bending roll, a computerized Vernon brace coping machine, and various other equipment used in our fabrication business. The brace coping machines can handle pipe up to 1,500 pounds per foot and 54-inch outer diameter, and 1,000 pounds per foot and 48-inch outer diameter, respectively. The brace coping machine in the Houma west yard provides additional efficiencies as it can cut 360 degrees without repositioning itself. We have a computerized numeric controlled plasma-arc cutting system that cuts and bevels steel up to one inch thick at a rate of two hundred inches per minute. The system can also etch into steel for piece markings and layout markings at a rate of 300 inches per minute. We own 16 crawler cranes, located in our Louisiana facilities, which range in tonnage capacity from 230 to 500 tons each. We may rent additional cranes on a monthly basis in times of very high activity levels. We have 12 rubber-tired, hydraulic modular transporters (KAMAG – Type 2406) located at our Houma, Louisiana facilities that allow fabricated deck sections that weigh as much as 2,400 tons to be transported around our facilities. The transporters allow easier load-out of smaller decks and provide more agility for the movement of deck sections. Each of these transporters have a 200 ton weight capacity, are easily relocated, and can be used in tandem. We own a deck barge which gives us the ability to move material and equipment to and from our facilities more conveniently and efficiently. We perform routine repairs and maintenance on all of this equipment.
Our plate bending rolls have the capability to roll and weld steel into approximately 50,000 tons of tubular pipe sections per year. We have a state of the art, fully enclosed, and environmentally friendly blast and coating facility that can operate twenty-four hours a day. The facility is automated and provides blasting and coating activities in support of our Houma fabrication projects. The design output of the facility also allows us to provide blast and paint services to the Gulf south shipbuilding industry. The use of this equipment provides Gulf Island a competitive advantage by reducing labor costs.
Gulf Island’s panel line system, located in the Houma west yard, consists of six individual in-line fully automated systems utilized to cut, weld, and assemble panels to be used in marine vessel construction. The first station consists of an ESAB Avenger 3 Plasma cutting table for high speed cutting and beveling of steel plates and shapes. The second station incorporates an Ogden Model OSWS-5600 single sided welder complete with an electromagnetic plate holding system whereby two steel plates are automatically welded together in a single pass utilizing a multiple sub arc welding process. This process can be repeated up to four times with a result of a single panel having an overall dimension of 40 by 50 feet. An ESAB Avenger 3-13 plate marking and cutting machine is positioned at the third station which lays out the welded panels, marks the applicable locations for stiffeners installation, and cuts the plate to required configurations. The fourth station utilizes an Ogden Model SF-5600 stiffener fitting system to properly align and tack in place the plate stiffeners. The fifth station consists of an Ogden Model SW-5600-3 multiple stiffener welding system whereby three longitudinal plate stiffeners can be automatically welded (both sides) in a single operation performing continuous or intermittent welding of the stiffeners. There is also an automated conveyor system that operates along the panel line which transfers the panels from station to station. The sixth station is a vertical lifting system that elevates the fabricated panels to the required height for transportation to the field.
We own three spud barges for use in connection with our inshore construction activities. Each barge is equipped with a crane with a lifting capacity of 60 to 100 tons. In addition, we own a 26 foot long by 16 foot wide tug boat with two 300 horsepower engines, used in connection with our three spud barges, reducing costs on tug boat rentals. We also own 10 cranes, which range in tonnage capacity from 60 to 230 tons each.
We own 13 crawler cranes, which range in tonnage capacity from 230 to 1055 tons each and are located at our Texas facility. The pipe mill at our Texas facility is equipped with a Haeusler Quad Roll, and Bertsch Model 30, Model 34 and Model 36 plate bending roll machines for diameters ranging from 1 foot 6 inches to 10 feet, and one large diameter plate bending roll machine, the Haeusler Quad Roll, for diameters ranging from 3 feet to 23 feet. The two Romar CNC-controlled flame planers, each with four torch stations (two torches per station), are used to cut steel plate up to 12 feet wide and 65 feet long. Our Texas facility is equipped with a panel line system, a Pangborn shot blast machine, 20,000 square feet of climate controlled staging area and a 16 feet by 14 feet by 125 feet paint booth that can operate 24 hours a day. We own an additional six rubber-tired, hydraulic modular transporters (KMAG – Type 2406), located at our Texas facility that allow fabricated deck sections that weigh as much as 1,200 tons to be transported throughout the facility. These transporters allow easier load-out of small decks and provide more agility for the movement of deck sections than cranes. All of our transporters can easily be relocated to or from our Louisiana and Texas facilities and, when used in tandem, have a capacity of 3,600 tons.
6
Materials and Supplies
The principal materials and supplies we use in the fabrication business are standard steel shapes, steel plate, steel pipe, welding gases, fuel, oil, gasoline and paint, all of which are currently available from many sources. We do not depend upon any single supplier or source. Standard delivery from domestic steel mills is running about 5 to 6 weeks on as-rolled steels versus anywhere from 8 to 12 weeks for heat treated steels. Due to the inability of domestic mills to produce our customers’ required steel grades, we are often forced to procure material from foreign steel mills. The delivery from these foreign mills, including transit time, is currently running approximately 16 to 20 weeks. To mitigate our risk of increasing cost of materials, we often negotiate escalation clauses in our contract terms to increase the contract price with a corresponding increase in cost of materials purchased during the life of the contract.
Safety and Quality Assurance
Management is committed to the safety and health of our employees. We believe that a strong safety culture is a critical element of our success. We continue to improve and maintain a stringent safety assurance program designed to mitigate the risk, and ultimately to eliminate accidents within our operations. Our Health, Safety, and Environment department develops guidelines to ensure the safety of our employees and to allow us to remain in compliance with all applicable federal and state mandated safety regulations. We are committed to maintaining a well trained workforce and providing timely instruction to our workforce to ensure our workers have the knowledge and skills to perform their work safely while maintaining the highest standards of quality possible. We provide continuous quality safety education and training to both employees and subcontractors to ensure our people are ready for the challenges inherent in all fabrication projects. Our employees and subcontractors begin their training on their first day of employment with a comprehensive orientation class that addresses Company policies and procedures and provides clear expectations for working safely. The Company maintains a zero tolerance approach to drugs and alcohol in the workplace. We support this policy through the use of a comprehensive drug and alcohol screening program that includes initial screenings for all employees and periodic random screenings throughout employment. Our employees are given opportunities to be a part of a dedicated safety committee which is comprised of peer-elected craft employees and members of management to assist in supporting their efforts to continuously improve our safety performance. This committee meets once a month to discuss safety issues and initiatives to prevent accidents within our organization.
We believe it is important to recognize and promote a positive and safe work culture. To this end, we hold a quarterly Safety Recognition Award Program. Our management team emphasizes open lines of communication and conducts quarterly employee meetings throughout our various facilities in order to keep our workforce updated on safety concerns. We also use this time to conduct demonstrations in safety education and quality improvement. Since 2012, a safety component has been included in our annual incentive program guidelines for our executive officers and other key employees to recognize the importance that we and our customers place on safety.
We fabricate to the standards and regulations of the American Petroleum Institute, the American Welding Society, the American Society of Mechanical Engineers, the American Bureau of Shipping, the United States Coast Guard, the United States Navy, and customer specifications. We use welding and fabrication procedures in accordance with the latest technology and industry requirements. We have in place training programs for technical fitting and welding instruction in order to upgrade our skilled labor workforce and maintain high standards of quality. In addition, we maintain on-site facilities for the non-destructive testing of all welds, a process performed by an independent contractor.
Our quality management systems are certified as ISO 9001-2008 programs. ISO 9001-2008 is an internationally recognized verification system for quality management overseen by the International Standard Organization based in Geneva, Switzerland. The certification is based on a review of our programs and procedures designed to maintain and enhance quality production and is subject to semi-annual review and full recertification every three years.
Customers and Contracting
Our principal customers include large independent oil and gas companies and their contractors, and marine service companies, offshore support companies, offshore and inland barge and support vessel operators, offshore construction contractors, diving companies, the U.S. Army, the U.S. Army Corps of Engineers, the U.S. Coast Guard, the U.S. Navy and the state and local governmental agencies and their contractors. Our international sales fluctuate from year to year depending on whether and to what extent our customers require installation of fabricated structures outside of the United States. Sales of fabricated structures installed outside the United States comprised between 3% and 16% of revenue during each of the last five years, and accounted for 6%, 10%, and 6% of revenue for the years ended December 31,
2015
,
2014
and
2013
, respectively.
A large portion of our revenue has historically been generated by only a few customers, although not necessarily the same customers from year to year. Our largest customers (those which individually accounted for 10% or more of revenue in a given year) accounted for
30%
of revenue in
2015
(
18%
for Customer A and
12%
for Customer B), 51% of revenue in
2014
(32% for
7
Customer A and 19% for Customer C), and 60% of revenue in
2013
(36% for Customer D, and 24% for Customer E). Substantially all of the revenue represented by our largest customers (those which individually accounted for 10% or more of revenue in a given year) in the last three years relates to work performed on large deepwater projects.
At December 31,
2015
,
76.1%
of our backlog, consisted of work for
five
customers as follows:
|
(i)
|
tendon support buoys for a deepwater Gulf of Mexico project;
|
|
(ii)
|
two large multi-purpose service vessels;
|
|
(iii)
|
two large petroleum vessels;
|
|
(iv)
|
one jacket and piles related to an overseas project; and
|
|
(v)
|
offshore support and construction services related to a deepwater Gulf of Mexico project.
|
While customers may consider other factors, including the availability, capability, reputation and safety record of a contractor, we believe price and the ability to meet a customer’s delivery schedule are the principal factors weighed by customers in awarding contracts. Our contracts generally vary in length from one month to 24 months depending on the size and complexity of the project. Generally, our contracts and projects are subject to termination or reduction in scope at any time prior to completion, at the option of the customer. Upon termination or reduction in scope, however, the customer is generally required to pay us for work performed and materials purchased through the date of termination.
Generally our projects are subject to the same bid procedures and are accounted for using the percentage-of-completion accounting method. Projects are generally awarded on a fixed-price, unit rate, alliance/partnering or cost-plus basis. Under fixed-price contracts, we receive the price fixed in the contract, subject to adjustment only for change-orders approved by the customer. As a result, we retain all cost savings but are also responsible for all cost overruns. Under a unit rate contract, material items or labor tasks are assigned unit rates of measure. The unit rates of measure will generally be an amount of dollars per ton, per foot, per square foot or per item installed. A typical unit rate contract may contain hundreds to thousands of unit rates of measure. Profit margins are built in to the unit rates and, similar to a fixed price contract, we retain all cost savings but are also responsible for all cost overruns. Under typical alliance/partnering arrangements, the parties agree in advance to a target price that includes specified levels of labor and material costs and profit margins. If the project is completed at less cost than that targeted in the contract, the contract price is reduced by a portion of the savings. If the cost of completion is greater than that targeted in the contract, the contract price is increased, but generally to the target price plus the actual incremental cost of materials and direct labor costs. Accordingly, under alliance/partnering arrangements, we have some protection from cost overruns but also share a portion of any cost savings with the customer. Under cost-plus arrangements, pursuant to which we receive a specified fee in excess of our direct labor and material costs, we are protected against cost overruns but do not benefit directly from cost savings. Because we generally price materials as pass-through items on our contracts, the cost of our labor force is the primary factor affecting our operating costs. Consequently, it is essential that we control the cost and productivity of the direct labor hours worked on our projects.
Seasonality
Our operations have historically been subject to seasonal variations in weather conditions and daylight hours. Since most of our construction activities take place outdoors, the number of direct labor hours worked generally declines during the winter months due to an increase in rain, cold temperatures, and a decrease in daylight hours. In addition, our oil and gas customers often schedule the completion of their projects during the summer months in order to take advantage of the milder weather during such months for the installation of their platforms. In recent years, seasonality has had less of an impact on productivity, mainly due to our ongoing investment in machinery and equipment and covered fabrication areas.
Competition
The offshore platform fabrication industry is highly competitive and influenced by events largely outside of the control of offshore platform fabrication companies. Platform fabrication companies compete intensely for available projects, which are generally awarded on a competitive bid basis with customers usually requesting bids on projects one to three months prior to commencement. Although we believe price and the contractor’s ability to meet a customer’s delivery schedule are the principal factors in determining which fabricator is awarded a project, customers also consider, among other things, the availability of technically capable personnel and facility space, a fabricator’s efficiency, condition of equipment, reputation, safety record and customer relations.
We currently have one domestic competitor, Kiewit Offshore Services, for the fabrication of deepwater projects such as large topsides and tendons. However, an increasing number of foreign shipyards, many of which have lower fixed costs than their United States competitors, also compete for larger deepwater projects destined for both the Gulf of Mexico and international waters. We compete with numerous domestic fabricators, including State Services Co., Inc. and Kiewit Offshore
8
Services, for platform jackets for intermediate water depths from 150 feet to 300 feet. Numerous domestic and foreign shipyards compete for marine projects.
We believe that our competitive pricing, expertise in fabricating offshore structures and the certification of our facilities as ISO 9001-2008 fabricators will enable us to continue to compete effectively for projects destined for Gulf of Mexico and international waters. We recognize, however, that foreign governments often use subsidies and incentives to create local jobs where oil and gas production is being developed. In addition, as a result of recent technological innovations, decreased transportation costs incurred by our customers when exporting structures from foreign locations to the Gulf of Mexico may hinder our ability to successfully bid for projects in the Gulf of Mexico against foreign competitors. Because of subsidies, import duties and fees, taxes on foreign operators, lower wage rates in foreign countries, fluctuations in the value of the U.S. dollar, the possible imposition of tariffs on raw materials imported into the United States, and other factors, we may not be able to remain competitive with foreign contractors for large deepwater projects.
Government and Environmental Regulation
Many aspects of our operations and properties are materially affected by federal, state and local regulations, as well as certain international conventions and private industry organizations. The exploration and development of oil and gas properties located on the outer continental shelf of the United States is regulated primarily by the Bureau of Ocean Energy, Management and Enforcement (“BOEM”) of the Department of Interior (“DOI”). The Secretary of the Interior, through the BOEM, is responsible for the administration of federal regulations under the Outer Continental Shelf Lands Act requiring the construction of offshore platforms located on the outer continental shelf to meet stringent engineering and construction specifications. Violations of these regulations and related laws can result in substantial civil and criminal penalties as well as injunctions curtailing operations. We believe that our operations are in compliance with these and all other regulations affecting the fabrication of platforms for delivery to the outer continental shelf of the United States. In addition, we depend on the demand for our services from the oil and gas industry and, therefore, can be affected by changes in taxes, price controls and other laws and regulations relating to the oil and gas industry. Offshore construction and drilling in certain areas has also been opposed by environmental groups and, in certain areas, has been restricted. To the extent laws are enacted or other governmental actions are taken that prohibit or restrict offshore construction and drilling or impose environmental protection requirements that result in increased costs to the oil and gas industry in general and the offshore construction industry in particular, our business and prospects could be adversely affected. We cannot determine to what extent future operations and earnings may be affected by new legislation, new regulations or changes in existing regulations.
The Houma Navigation Canal provides the only means of access from our Houma facilities to open waters. With respect to our Texas facilities, the U.S. Intracoastal Waterway provides access between our North and South Texas yards. From our South yard, the Corpus Christi Ship Channel provides access to the Gulf of Mexico. These waterways are considered to be navigable waterways of the United States and, as such, are protected by federal law from unauthorized obstructions that would hinder water-borne traffic. Federal law also authorizes maintenance of these waterways by the U.S. Army Corps of Engineers. These waterways are dredged from time to time to maintain water depth and, while federal funding for dredging has historically been provided, there is no assurance that Congressional appropriations sufficient for adequate dredging and other maintenance of these waterways will be continued indefinitely. If sufficient funding were not appropriated for that purpose, some or all of these waterways could become impassable by barges or other vessels required to transport many of our projects and could have a material adverse effect on our operations and financial position.
Our operations and properties are subject to a wide variety of increasingly complex and stringent foreign, federal, state and local environmental laws and regulations, including those governing discharges into the air and water, the handling and disposal of solid and hazardous wastes, the remediation of soil and groundwater contaminated by hazardous substances and the health and safety of employees. These laws may provide for “strict liability” for damages to natural resources and threats to public health and safety, rendering a party liable for the environmental damage without regard to negligence or fault on the part of such party. Sanctions for noncompliance may include revocation of permits, corrective action orders, administrative or civil penalties and criminal prosecution. Certain environmental laws provide for strict, joint and several liability for remediation of spills and other releases of hazardous substances, as well as damage to natural resources. In addition, we may be subject to claims alleging personal injury or property damage as a result of alleged exposure to hazardous substances. Such laws and regulations may also expose us to liability for the conduct of or conditions caused by others, or for acts that were in compliance with all applicable laws at the time we performed them.
The Comprehensive Environmental Response, Compensation, and Liability Act of 1980, as amended and similar laws provide for responses to and liability for releases of hazardous substances into the environment. Additionally, the Clean Air Act, the Clean Water Act, the Resource Conservation and Recovery Act, the Safe Drinking Water Act, the Emergency Planning and Community Right to Know Act, each as amended, and similar foreign, state or local counterparts to these federal laws, regulate air emissions, water discharges, hazardous substances and wastes, and require public disclosure related to the use of various
9
hazardous substances. Compliance with such environmental laws and regulations may require the acquisition of permits or other authorizations for certain activities and compliance with various standards or procedural requirements. We believe that our facilities are in substantial compliance with current regulatory standards.
Our operations are also governed by laws and regulations relating to workplace safety and worker health, primarily the Occupational Safety and Health Act and regulations promulgated thereunder. In addition, various other governmental and quasi-governmental agencies require us to obtain certain permits, licenses and certificates with respect to our operations. The kinds of permits, licenses and certificates required by our operations depend upon a number of factors. We believe that we have all material permits, licenses and certificates necessary for the conduct of our existing business.
Our compliance with these laws and regulations has entailed certain additional expenses and changes in operating procedures; however, we believe that compliance efforts will not have a material adverse effect on our business or financial condition. Future events, such as changes in existing laws and regulations or their interpretation, more vigorous enforcement policies of regulatory agencies, or stricter or different interpretations of existing laws and regulations, may require additional expenditures by us, which expenditures may be material.
Our employees may engage in certain activities, including interconnect piping and other service activities conducted on offshore platforms, activities performed on the spud barges owned or chartered by us, marine vessel fabrication and repair activities performed at our facilities, and operating vessels owned by us, that are covered in either the provisions of the Jones Act or U.S. Longshoreman and Harbor Workers Act (“USL&H”). These laws operate to make the liability limits established under state workers’ compensation laws inapplicable to these employees and, instead, permit them or their representatives to pursue actions against us for damages or job related injuries, with generally no limitations on our potential liability. Our ownership and operation of vessels and our fabrication and repair of customer vessels can give rise to large and varied liability risks, such as risks of collisions with other vessels or structures, sinkings, fires and other marine casualties, which can result in significant claims for damages against us for, among other things, personal injury, death, property damage, pollution and loss of business.
In addition, our operations are subject to extensive government regulation by the United States Coast Guard, as well as various private industry organizations such as the American Petroleum Institute, American Society of Mechanical Engineers, American Welding Society and the American Bureau of Shipping.
Insurance
We maintain insurance against property damage caused by fire, flood, explosion and similar catastrophic events that may result in physical damage or destruction to our facilities. All policies are subject to deductibles and other coverage limitations. We also maintain a builder’s risk policy for construction projects, general liability insurance and maritime employer’s liability insurance, which are also subject to deductibles and coverage limitations. The Company is self-insured for workers’ compensation and USL&H claims except for losses in excess of a per occurrence threshold amount. Although management believes that our insurance is adequate, there can be no assurance that we will be able to maintain adequate insurance at rates which management considers commercially reasonable, nor can there be any assurance that such coverage will be adequate to cover all claims that may arise.
Employees
Our workforce varies based on the level of ongoing fabrication activity at any particular time. As of December 31, 2015 and 2014, we had approximately
1,255
and
1,700
employees, respectively. Additionally, we will use contract labor when required to meet customer demand. The number of contract laborers we used decreased to
71
in 2015 as compared to
247
in 2014. In connection with our acquisition of LEEVAC, on January 1, 2016, we increased our employee count by 380 employees. None of our employees are employed pursuant to a collective bargaining agreement, and we believe our relationship with our employees is good.
Our ability to remain productive and profitable depends substantially on our ability to attract and retain skilled construction workers, primarily welders, fitters and equipment operators. In addition, our ability to expand our operations depends not only upon customer demand but also on our ability to increase our labor force. The demand for such workers is high and the supply can be limited, especially during periods of high activity in the oil and gas industry. While we believe our relationship with our skilled labor force is good, a significant increase in the wages paid by a wide range of other employers seeking similar skill sets could result in a reduction in our skilled labor force, increases in the wage rates we pay, increase in our use of contract labor, or all of these. Additionally, reductions made, from time to time, in our labor force may make it more difficult for us to increase our labor force to desirable levels during periods of increased customer demand for our services. If any of these occurred in the near-term, the profits expected from work in progress could be reduced or eliminated and to the extent such wage increases could not be passed on to our customers, our production capacity and growth potential could be
10
diminished. In an effort to maintain our current workforce and attract new employees in periods of high activity, we have enhanced several incentive programs and expanded our training facility.
11
Cautionary Statement
Our business is subject to significant risks. We caution readers that the following important factors could affect our actual consolidated results and could cause our actual consolidated results in the future to differ materially from the goals and expectations expressed in the forward-looking statements contained in this report and in any other forward-looking statements made by us or on our behalf.
We are subject to the cyclical nature of the oil and gas industry.
Our business depends significantly on the level of capital expenditures by oil and gas and marine companies in the Gulf of Mexico and along the Gulf Coast. This level of activity has traditionally been volatile, primarily as a result of fluctuations in oil and gas prices. Projects for which we are engaged may be deferred or delayed by our customers based, in part, on the price of oil and gas. The levels of our customers’ capital expenditures are influenced by, among other things:
|
•
|
oil and gas prices and industry perceptions of future prices;
|
|
•
|
the cost of exploring for, producing and delivering oil and gas;
|
|
•
|
the ability of oil and gas companies to generate capital;
|
|
•
|
the sale and expiration dates of offshore leases in the United States and overseas;
|
|
•
|
the discovery rate of new oil and gas reserves in offshore areas;
|
|
•
|
local, federal and international political and economic conditions;
|
|
•
|
technological advances; and
|
|
•
|
uncertainty regarding the United States energy policy, particularly any revision, reinterpretation or creation of environmental and tax laws and regulations that would negatively impact the industry.
|
The decline in global oil and gas prices during 2014 and 2015 has adversely impacted the demand for our products and services, our financial condition and our results of operations. In particular, we have experienced an adverse impact on the level of activity for deepwater projects. While we are unable to predict future oil and gas prices or the level of oil and gas industry activity in the Gulf of Mexico region and internationally, we do not expect an increase in the level of activity in the oil and gas industry absent an increase in global oil and gas prices. Continued or further declines in global oil and gas prices and/or a low level of activity in the oil and gas industry by our customers generally will continue to adversely affect the demand for our products and services, our financial condition and results of operations.
Our backlog is subject to change as a result of changes to management’s estimates, suspension or termination of projects currently in our backlog or our failure to secure additional projects. Our revenue, net income and cash flow could be adversely affected as a result of changes to our backlog.
Our backlog is based on management’s estimate of the direct labor hours required to complete, and the remaining revenue to be recognized with respect to, those projects as to which a customer has authorized us to begin work or purchase materials or services pursuant to written contracts, letters of intent or other forms of authorization. However, management’s estimates are often based on preliminary engineering and design specifications by the customer. As engineering and design plans are finalized or changes to existing plans are made, management’s estimate of the direct labor hours required to complete and price at completion is likely to change.
All projects currently included in our backlog generally are subject to suspension, termination, or a reduction in scope at the option of the customer, although the customer is generally required to pay us for work performed and materials purchased through the date of termination. In addition, customers have the ability to delay the execution of projects. Depending on the size of the project, the termination, postponement, or change in scope of any project could significantly reduce backlog, and could have a material adverse effect on revenue, net income and cash flow. Accordingly, our backlog as of any particular date is an uncertain indicator of future earnings.
Deepwater projects have historically represented a significant part of our backlog. As of December 31, 2015, we had a revenue backlog of
$232.4 million
and a labor backlog of approximately
1.9 million
man-hours. With respect to backlog at December 31, 2015,
$47.1 million
, or approximately
20.3%
, represents projects destined for deepwater locations. Since the scope of work and contract prices on most deepwater projects typically represent a substantial portion of overall backlog, a suspension, termination, or change in scope of any of these projects is likely to have a more significant adverse impact on revenue, net income and cash flow as compared to other projects. For example, in 2013, we recognized estimated contract
12
losses of $29.6 million on a large deepwater project as a result of our inability to recover certain costs and the de-scoping of the project, whereby remaining completion and integration work was performed by a different integration contractor.
Our acquisition of LEEVAC may not fully integrate with our operations as quickly as we anticipated, and therefore, not yield the anticipated benefits of this acquisition.
On January 1, 2016, LEEVAC Shipyards, L.L.C. and its related affiliates sold substantially all of their assets, including leasehold interests in marine fabrication facilities in Jennings, Louisiana and Lake Charles, Louisiana, and substantially all of their machinery and equipment, to one of our subsidiaries. See further discussion of our acquisition of the LEEVAC assets in Item 1. - “Business and Properties - LEEVAC Acquisition.”
Our acquisition of the LEEVAC assets may expose us to the following risks, any of which, could adversely affect our financial condition, results of operation, cash flows and the trading price of our common stock:
|
•
|
We may not be able to secure additional projects or work for the new assets acquired due to downturns in our markets.
|
|
•
|
We may be unsuccessful in managing current projects acquired, which could result in future potential losses.
|
|
•
|
Cash flows and profits derived from the acquired assets may not be accretive to our consolidated operations.
|
|
•
|
We may be unable to efficiently integrate personnel and systems within our operations resulting in increased costs.
|
|
•
|
Acquired assets and leases could subject us to liabilities with limited or no recourse that could potentially include, but are not limited to, environmental contamination and claims by customers and/or vendors.
|
Competitive pricing common in the fabrication industry may not provide sufficient protection from cost overruns.
As is common in the offshore platform fabrication industry, a substantial number of our projects are performed on a fixed-price or unit-rate basis, although some projects are performed on an alliance/partnering or cost-plus basis. Under fixed-price or unit-rate contracts, we receive the price fixed in the contract, subject to adjustment only for change-orders placed by the customer. Under a unit rate contract, material items or labor tasks are assigned unit rates of measure. The unit rates of measure will generally be an amount of dollars per ton, per foot, per square foot or per item installed. A typical unit rate contract can contain hundreds to thousands of unit rates of measure. Profit margins are built into the unit rates and, similar to a fixed price contract, we retain all cost savings but are also responsible for all cost overruns. Under typical alliance/partnering arrangements, the parties agree in advance to a target price that includes specified levels of labor, material costs and profit margins. If the project is completed at less cost than that targeted in the contract, the contract price is reduced by a portion of the savings. If the cost of completion is greater than target costs, the contract price is increased, but generally to the target price plus the actual incremental cost of materials and direct labor. Accordingly, under alliance/partnering arrangements, we have some protection against cost overruns but must share a portion of any cost savings with the customer. Under cost-plus arrangements, we receive a specified fee in excess of our direct labor and material cost and thus are protected against cost overruns, but do not benefit directly from cost savings.
The revenue, costs and gross profit realized on a contract will often vary from the estimated amounts on which such contracts were originally based due to, among other things:
|
•
|
changes in the availability and cost of labor and material;
|
|
•
|
variations in productivity from the original estimates;
|
|
•
|
our inability to recover compensation for additional work we perform or expenses we incur from our customers;
|
|
•
|
changes in estimates or bidding;
|
|
•
|
our payment of liquidated damages upon a failure to meet scheduled delivery requirements; and
|
|
•
|
termination or de-scoping of projects by our customers.
|
These variations and the risks inherent in our industry may result in revenue and gross profits different from those originally estimated and reduce profitability or create losses on projects. Depending on the size of a project, variations from estimated contract performance can have a significant impact on our operating results for any particular fiscal quarter or year. In addition, substantially all of our customer contracts require us to continue work in accordance with the contractually agreed schedule (and thus, continue to incur expenses for labor and materials) notwithstanding the occurrence of a disagreement with customers over increased pricing and/or unresolved change orders.
For example, during the third and fourth quarters of 2015, we recorded contract losses of
$24.5 million
related to a decrease in the contract price due to final weight re-measurements and our inability to recover certain costs on disputed change orders related to a large deepwater project which was recently delivered. We are currently in negotiations with this customer
13
concerning disputed change orders and no amounts with respect to these disputed change orders are included in contract revenues at December 31, 2015. Our intention is to resolve the disputed cost amounts and finalize the change orders with the customer as quickly as possible; however, we can give no assurance that these negotiations will conclude in the near term or that we will recover any of the contract losses from our customer. Additionally, in 2015, we accrued contract losses of approximately
$9.4 million
resulting from increases in our projected unit labor rates of our fabrication facilities. Our increases in unit labor rates were driven by our inability to absorb fixed costs due to decreases in expected oil and gas fabrication activity. In 2014, we recognized contract losses of $6.6 million that were primarily related to two tank barge projects for a marine transportation company, platform supply vessels for an offshore marine company and a production platform jacket for a deepwater customer. We recognized contract losses of $29.6 million as of December 31, 2013 on one of our large deepwater projects, mainly due to our inability to recover certain costs and the de-scoping of one of our major deepwater contracts.
We might be unable to employ a sufficient number of skilled workers.
Our ability to remain productive and profitable depends substantially on our ability to attract and retain skilled construction workers, primarily welders, fitters and equipment operators. In addition, our ability to expand our operations depends not only upon customer demand but also on our ability to integrate the former employees of LEEVAC into our operations and, when necessary, increase our labor force. The demand for workers is high and the supply is extremely limited, especially during periods of high activity in the oil and gas industry. While we believe our relationship with our skilled labor force is good, a significant increase in the wages paid by a wide range of other employers seeking similar skill sets could result in a reduction in our skilled labor force, increases in the wage rates we pay, increase in our use of contract labor, or all of these. Additionally, reductions made, from time to time, in our labor force may make it more difficult for us to increase our labor force to desirable levels during periods of increased customer demand for our services. If any of these occurred in the near-term, the profits expected from work in progress could be reduced or eliminated and to the extent such wage increases could not be passed on to our customers, our production capacity could be diminished and growth potential could be impaired.
The dangers inherent in our operations and the limits on our insurance coverage could expose us to potentially significant liability costs and materially interfere with the performance of our operations.
The fabrication of large steel structures involves operating hazards that can cause personal injury or loss of life, severe damage to and destruction of property and equipment and suspension of operations. The failure of such structures during and after installation can result in similar injuries and damages. In addition, our employees may engage in certain activities, including interconnect piping and other service activities conducted on offshore platforms, activities performed on the spud barges owned or chartered by us, marine vessel fabrication and repair activities performed at our facilities and operating vessels owned by us, that are covered in either the provisions of the Jones Act or USL&H. These laws operate to make the liability limits established under state workers’ compensation laws inapplicable to these employees and, instead, permit them or their representatives to pursue actions against us for damages or job related injuries, with generally no limitations on our potential liability.
Our ownership and operation of vessels can give rise to large and varied liability risks, such as risks of collisions with other vessels or structures, sinkings, fires and other marine casualties, which can result in significant claims for damages against both us and third parties. Litigation arising from any such occurrences may result in our being named as a defendant in lawsuits asserting large claims. In addition, due to the proximity to the Gulf of Mexico, our facilities are subject to the possibility of physical damage caused by hurricanes or flooding.
Although we believe that our insurance coverage is adequate, there can be no assurance that we will be able to maintain adequate insurance in the future at rates we consider reasonable or that our insurance coverage will be adequate to cover future claims that may arise. Claims for which we are not fully insured may adversely affect our working capital and profitability. In addition, changes in the insurance industry have generally led to higher insurance costs and decreased availability of coverage. The availability of insurance that covers risks we and our competitors typically insure against may decrease, and the insurance that we are able to obtain may have higher deductibles, higher premiums and more restrictive policy terms.
Our industry is highly competitive.
The offshore and marine fabrication industries are highly competitive and influenced by events largely outside of our control. Contracts for our services are generally awarded on a competitive bid basis, and our customers consider many factors when awarding a job. These factors include price, the contractor’s ability to meet the customer’s delivery schedule, the availability and capability of equipment, and the reputation, experience, and safety record of the contractor. Although we believe that our reputation for safety and quality service is good, we cannot guarantee that we will be able to maintain our
14
competitive position. We compete with both large and small companies for available jobs, and certain of our competitors, particularly our domestic competitor for major deepwater projects, have greater financial and other resources than we do.
Foreign governments often use subsidies and incentives to create local jobs where oil and gas production is being developed. In addition, decreased transportation costs incurred by our customers when exporting structures from foreign locations to the Gulf of Mexico may hinder our ability to successfully bid for projects in the Gulf of Mexico against foreign competitors. Because of subsidies, import duties and fees, taxes on foreign operators, lower wage rates in foreign countries, fluctuations in the value of the U.S. dollar, the possible imposition of tariffs on raw materials imported into the United States, and other factors, we may not be able to remain competitive with foreign contractors for large deepwater projects. For additional information, see Item 1. “Business and Properties - Competition” for more information regarding the competitive nature of our industry.
Our failure to successfully defend against claims made against us by customers or subcontractors, or our failure to successfully recover on claims made by us against customers or subcontractors, could adversely affect our business, financial condition, results of operations and cash flows.
Our projects are generally highly complex and we may encounter difficulties in design or engineering, schedule changes and other factors, some of which may be beyond our control, that affect our ability to complete projects in accordance with original delivery schedules or to otherwise meet contractual performance obligations. We may bring claims against customers for additional costs exceeding contract prices or for amounts not included in original contract prices as a result of customer-caused delays or changes from initial project scope. In addition, claims may be brought against us by customers relating to, among other things, alleged defective or incomplete work, breaches of warranty and/or late completion of work. Claims among us and our subcontractors may include claims similar to those described above. These claims may be subject to lengthy and/or expensive litigation or arbitration proceedings, and we may invest significant working capital in projects to cover cost overruns pending resolution of these claims. These claims could materially adversely affect our business, financial condition, results of operations and cash flows.
Our method of accounting for revenue could result in an earnings charge.
Most of our revenue is recognized on a percentage-of-completion basis based on the ratio of direct labor hours worked to the total estimated direct labor hours required for completion. Accordingly, contract price and cost estimates are reviewed monthly as the work progresses, and adjustments proportionate to the percentage of completion are reflected in revenue for the period when such estimates are revised. To the extent that these adjustments result in a reduction or elimination of previously reported profits, we are required to recognize a charge against current earnings, which may be significant depending on the size of the project or the adjustment.
For example, during the third and fourth quarters of 2015, we recorded contract losses of
$24.5 million
related to a decrease in the contract price due to final weight re-measurements and our inability to recover certain costs on disputed change orders related to a large deepwater project which was recently delivered. In addition, we recognized increased contract losses of
$9.4 million
due to increases in our projected unit labor rates for our fabrication facilities. Our increases in unit labor rates were driven by our inability to absorb fixed costs due to decreases in expected oil and gas fabrication activity. We recognized contract losses of $6.6 million for the year ended December 31, 2014 that were primarily related to two tank barges projects for a marine transportation company, platform supply vessels for an offshore marine company and a production platform jacket for a deepwater customer. For the year ended December 31, 2013, we recognized contract losses of $29.6 million on one of our large deepwater projects, mainly due to our inability to recover certain costs and the de-scoping of one of our major deepwater contracts.
We are susceptible to adverse weather conditions in our market areas.
Our operations are directly affected by the seasonal differences in weather patterns in the Gulf of Mexico, as well as daylight hours. Since most of our construction activities take place outdoors, the number of direct labor hours worked generally declines in the winter months due to an increase in rain, colder temperatures, and a decrease in daylight hours. The seasonality of oil and gas industry activity as a whole in the Gulf Coast region also affects our operations. Our oil and gas customers often schedule the completion of their projects during the summer months in order to take advantage of milder weather for the installation of their platforms. The rainy weather, tropical storms, hurricanes and other storms prevalent in the Gulf of Mexico and along the Gulf Coast throughout the year may also affect our operations. Accordingly, our operating results may vary from quarter to quarter, depending on factors outside of our control. As a result, full year results are not likely to be a direct multiple of any particular quarter or combination of quarters.
15
We depend on key personnel.
Our success depends to a great degree on the abilities of our key management personnel, particularly our executives and other key employees. The loss of the services of one or more of these individuals could adversely affect us.
We depend on significant customers.
We derive a significant amount of our revenue from a small number of major and independent oil and gas and marine companies. Because the level of fabrication that we may provide to any particular customer depends, among other things, on the size of that customer’s capital expenditure budget and our ability to meet the customer’s delivery schedule, customers that account for a significant portion of our revenue in one fiscal year may represent an immaterial portion of revenue in subsequent years. For example, our largest customers (those which individually accounted for 10% or more of revenue in a given year) accounted for
30%
of revenue in 2015 (
18%
for Customer A and
12%
for Customer B), 51% of revenue in 2014 (32% for Customer A and 19% for Customer C), and 60% of revenue in 2013 (36% for Customer D and 24% for Customer E). The loss of a significant customer in any given year for any reason, including a sustained decline in that customer’s capital expenditure budget or competitive factors, can result in a substantial loss of revenue and could have a material adverse effect on our operating performance.
The nature of our industry subjects us to compliance with regulatory and environmental laws.
Our operations and properties are materially affected by state and federal laws and other regulations relating to the oil and gas industry in general, as well as a wide variety of federal, state and local environmental laws and regulations, including those governing discharges into the air and water, the handling and disposal of solid and hazardous wastes, the remediation of soil and groundwater contaminated by hazardous substances and the health and safety of employees. Compliance with many of these laws is becoming increasingly complex, stringent and expensive. Many of these laws impose “strict liability” for damages to natural resources or threats to public health and safety, rendering a party liable for the environmental damage without regard to its negligence or fault. Certain environmental laws provide for strict, joint and several liability for remediation of spills and other releases of hazardous substances, as well as damage to natural resources. In addition, we could be subject to claims alleging personal injury or property damage as a result of alleged exposure to hazardous substances. Such laws and regulations may also expose us to liability for the conduct of or conditions caused by others, or for acts that were in compliance with all applicable laws at the time such acts were performed. We believe that our present operations substantially comply with applicable federal and state pollution control and environmental protection laws and regulations. We also believe that compliance with such laws has had no material adverse effect on our operations. However, such environmental laws are changed frequently. Sanctions for noncompliance may include revocation of permits, corrective action orders, administrative or civil penalties and criminal prosecution. We are unable to predict whether environmental laws will materially adversely affect our future operations and financial results. See “Business and Properties - Government and Environmental Regulation.”
The demand for our services is also affected by changing taxes, price controls and other laws and regulations relating to the oil and gas and, marine industries generally. Offshore construction and drilling in certain areas has also been opposed by environmental groups and, in certain areas, has been restricted. To the extent laws are enacted or other governmental actions are taken that prohibit or restrict offshore construction and drilling or impose environmental protection requirements that result in increased costs to the oil and gas industry in general and the offshore construction industry in particular, our business and prospects could be adversely affected. We cannot determine to what extent future operations and earnings may be affected by new legislation, new regulations or changes in existing regulations.
Our business is highly dependent on our ability to utilize the navigation canals adjacent to our facilities
The Houma Navigation Canal provides the only means of access from our Louisiana facilities to open waters. With respect to our Texas facilities, the U.S. Intracoastal Waterway provides access between our North and South Texas yards. From our South Texas yard, the Corpus Christi Ship Channel provides access to the Gulf of Mexico. Our leased Jennings, Louisiana facility is located on the west bank of the Mermentau River approximately 25 miles north of the Intracoastal Waterway where the Lake Charles, Louisiana facility is 17 miles from the Gulf of Mexico on the Calcasieu River near Lake Charles, LA. These waterways are considered to be navigable waterways of the United States and, as such, are protected by federal law from unauthorized obstructions that would hinder water-borne traffic. Federal law also authorizes maintenance of these waterways by the U.S. Army Corps of Engineers. These waterways are dredged from time to time to maintain water depth and, while federal funding for dredging has historically been provided, there is no assurance that Congressional appropriations sufficient for adequate dredging and other maintenance of these waterways will be continued indefinitely. If sufficient funding were not appropriated for that purpose, some or all of these waterways could become impassable by barges or other vessels required to transport many of our products and could have a material adverse effect on our operations and financial position.
16
We depend on subcontractor services to perform our contractual obligations.
Our ability to perform under our contracts depends to some degree on the performance of third parties we subcontract. We depend upon subcontractors for a variety of reasons, including:
|
•
|
to perform work as a result of scheduling demands we would otherwise perform with our employees;
|
|
•
|
to supervise and/or perform certain aspects of the contract more efficiently considering the conditions of the contract; and
|
|
•
|
to perform certain types of skilled work.
|
We work closely with these subcontractors to monitor progress and address our customer requirements. We generally have the ability to pursue back charges for costs we incur or liabilities we assume as a result of a subcontractor’s lack of performance. However, the inability of our subcontractors to perform under the terms of their contracts could cause us to incur additional costs that reduce profitability or create losses on projects.
Our business is subject to a potential security breach or other system failures.
We rely on information technology networks and systems to process, transmit and store electronic information, to manage or support a variety of our business operations, transactions and processes and to maintain various records. While we make significant efforts to maintain security and integrity of these types of information and systems, we cannot assure you that our security efforts and measures will prevent unauthorized access to our systems, loss or destruction of data or other forms of cyber-attacks or similar events, whether caused by mechanical failure, human error, fraud, malice, sabotage or otherwise. Any such failure of our information technology networks and systems could interrupt our operations, damage our reputation, or subject us to claims, any of which could materially and adversely affect us.
We are exposed to risks arising out of recent legislation affecting U.S. public companies.
Changing laws, regulations and standards relating to corporate governance and public disclosures, including the Sarbanes-Oxley Act and the Dodd-Frank Wall Street Reform and Consumer Protection Act, and related regulations implemented thereunder, are increasing legal and financial compliance costs and making some activities more time consuming. Any failure to successfully or timely complete annual assessments of our internal controls required by Section 404 of the Sarbanes-Oxley Act could subject us to sanctions or investigations by regulatory authorities. Any such action could adversely affect our financial results or our reputation with investors, lenders and others.
None.
We are subject to various routine legal proceedings in the normal conduct of our business primarily involving commercial claims, workers’ compensation claims, and claims for personal injury under the general maritime laws of the United States and the Jones Act. While the outcome of these lawsuits, legal proceedings and claims cannot be predicted with certainty, management believes that the outcome of any such proceedings, even if determined adversely, would not have a material adverse effect on our financial position, results of operations or cash flows.
None.
Listed below are the names, ages and offices held by each of our executive officers as of March 9, 2016. All officers serve at the pleasure of our Board of Directors.
17
|
Name
|
Age
|
Position
|
|||
|
Kirk J. Meche
|
53
|
|
President, Chief Executive Officer and Director
|
||
|
Jeffrey M. Favret
|
54
|
|
Executive Vice President, Chief Financial Officer, Treasurer and Secretary
|
||
|
Todd F. Ladd
|
49
|
|
Executive Vice President and Chief Operating Officer
|
||
Kirk J. Meche
became Chief Executive Officer in January 2013. Mr. Meche has served as President since January 2009. He served as Chief Operating Officer from January 2009 to December 2012. Mr. Meche served as the Executive Vice President – Operations from 2001 to 2009. Mr. Meche was President and Chief Executive Officer of Gulf Marine from February 2006 to October 2006. Mr. Meche served as President and Chief Executive Officer of Gulf Island, L.L.C. from February 2001 until January 2006. Prior to that, Mr. Meche served as President and Chief Executive Officer of Southport, Inc., a wholly-owned fabrication subsidiary of the Company, from 1999 to 2001. Mr. Meche was a project manager of the Company from 1996 to 1999. Mr. Meche held various engineering positions for J. Ray McDermott, Inc. from 1985 to 1996.
Jeffrey M. Favret
became Vice President of Finance, Chief Financial Officer and Treasurer in May 2013. Mr. Favret became Secretary in May 2014 and was appointed Executive Vice President in February 2015. Mr. Favret has worked with companies in oil and gas exploration and production, vessel construction, offshore drilling construction and offshore vessel/marine transportation industries, among others. Mr. Favret previously served as Director of Finance, Energy Infrastructure Segment, of FMC Technologies, Inc., a leading global provider of technology solutions for the energy industry, from May 2012 to May 2013. Mr. Favret also served as the Chief Accounting Officer for Trico Marine Services, Inc., a provider of marine support vessel and subsea services to the offshore oil and gas industry, from April 2010 to May 2012. Prior to that, Mr. Favret served as Director (Partner) of the accounting firm Postlethwaite & Netterville, and in various roles at Ernst & Young in its Assurance and Advisory practice.
Todd F. Ladd
became Chief Operating Officer in February 2014 and was appointed Executive Vice President in February 2015. Mr. Ladd previously served as Vice President and General Manager of the Company since July 2013. Mr. Ladd has over 25 years industry experience in the offshore fabrication sector. From 2001 to 2013, Mr. Ladd served as a partner and Senior Project Manager with Paloma Energy Consultants, an offshore construction project management firm. From April 1996 to August 2001, Mr. Ladd served as a Project Manager for Gulf Island, L.L.C. Mr. Ladd also served as Production Engineer and Facility Engineer at McDermott Marine Construction from January 1988 through March 1996.
18
Our common stock is traded on the Nasdaq Global Select Market, under the symbol “GIFI.” As of March 9, 2016, we had approximately 2,685 holders of record of our common stock.
The following table sets forth the high and low sale prices per share of the common stock, as reported by The Nasdaq Stock Market LLC, and the amount of cash dividends declared per share of our common stock, for each fiscal quarter of the two most recent fiscal years.
|
High
|
Low
|
Dividend
|
|||||||||
|
Fiscal Year 2015
|
|||||||||||
|
First Quarter
|
$
|
20.05
|
|
$
|
12.85
|
|
$
|
0.10
|
|
||
|
Second Quarter
|
16.11
|
|
10.03
|
|
0.10
|
|
|||||
|
Third Quarter
|
13.26
|
|
9.05
|
|
0.10
|
|
|||||
|
Fourth Quarter
|
13.00
|
|
8.95
|
|
0.10
|
|
|||||
|
Fiscal Year 2014
|
|||||||||||
|
First Quarter
|
$
|
23.89
|
|
$
|
18.06
|
|
$
|
0.10
|
|
||
|
Second Quarter
|
24.01
|
|
18.10
|
|
0.10
|
|
|||||
|
Third Quarter
|
21.99
|
|
17.11
|
|
0.10
|
|
|||||
|
Fourth Quarter
|
23.57
|
|
16.43
|
|
0.10
|
|
|||||
In each quarter of
2015
, our Board of Directors declared a dividend of $0.10 per share on the shares of our common stock outstanding, totaling $5.9 million. On February 25, 2016, our Board of Directors declared a dividend of $
0.01
per share on the shares of our common stock outstanding, payable March 24, 2016 to shareholders of record on March 10, 2016. Future declaration and payment of dividends, if any, is at the discretion of our Board of Directors and will depend on our retained earnings, working capital requirements and the future operation and growth of our business and other factors deemed relevant by the Board of Directors.
Issuer Purchases of Equity Securities
The following table sets forth shares of our common stock we repurchased during the three-month period ended December 31,
2015
.
|
|
|
|
|
Current Program
|
||||||||||
|
Period
|
Total
Number of
Shares
Purchased
|
|
Average
Price
Paid per
Share
|
Total Number of
Shares Purchased
as Part of Publicly
Announced Plans
or Programs
|
Maximum
Number of Shares
that May Yet Be
Purchased Under the
Plans or Programs
|
|||||||||
|
October 1 to 31, 2015
|
—
|
|
|
—
|
|
—
|
|
—
|
|
|||||
|
November 1 to 30, 2015
|
1,542
|
|
|
$
|
9.90
|
|
—
|
|
—
|
|
||||
|
December 1 to 31, 2015
|
5,383
|
|
|
$
|
9.47
|
|
—
|
|
—
|
|
||||
|
Total
|
6,925
|
|
(a)
|
$
|
9.57
|
|
—
|
|
—
|
|
||||
|
(a)
|
Represents shares repurchased under our applicable stock incentive plan to satisfy tax obligations for stock options and restricted stock awards.
|
On July 30, 2015, our Board of Directors authorized the Company to repurchase up to $10.0 million in shares of our common stock under a share repurchase program that remains in effect through July 30, 2017. Repurchases may be effected through open market purchases or in privately negotiated transactions at such times and in such amounts as management deems appropriate, depending on market conditions and other factors. The repurchase program does not obligate the Company to acquire any particular amount of common stock and may be modified, suspended or discontinued at any time. To date, we have made no repurchases of our common stock. Due to the severity of the industry downturn, management has recommended and our board of directors has approved a temporary suspension of our stock repurchase program in an effort to conserve cash.
19
Information as to the securities authorized for issuance under our equity compensation plans is incorporated herein by reference to Item 12 of this report on Form 10-K.
Stock Performance Graph
The following graph compares the cumulative total shareholder return on our common stock from December 31, 2010 to December 31,
2015
, with the cumulative total return of the Standard & Poor’s 500 Index and the Standard & Poor’s 500 Oil & Gas Equipment & Services Index for the same period. The returns are based on an assumed investment of $100 on January 1, 2011 at closing prices on December 31, 2010 in our common stock and in each of the indexes and on the assumption that dividends were reinvested.
Total Return To Shareholders
(Includes reinvestment of dividends)
|
|
ANNUAL RETURN PERCENTAGE
Years Ending
|
||||||||||||||||
|
Company / Index
|
|
Dec 11
|
Dec 12
|
Dec 13
|
Dec 14
|
Dec 15
|
|||||||||||
|
Gulf Island Fabrication, Inc.
|
4.51
|
|
(16.45
|
)
|
(1.66
|
)
|
(14.85
|
)
|
(44.22
|
)
|
|||||||
|
S&P 500 Index
|
2.11
|
|
16.00
|
|
32.39
|
|
13.69
|
|
1.38
|
|
|||||||
|
S&P 500 Oil & Gas Equipment & Services
|
(11.68
|
)
|
—
|
|
30.65
|
|
(7.80
|
)
|
(18.75
|
)
|
|||||||
|
|
Base
Period
Dec 10
|
INDEXED RETURNS
Years Ending
|
|||||||||||||||
|
Company / Index
|
Dec 11
|
Dec 12
|
Dec 13
|
Dec 14
|
Dec 15
|
||||||||||||
|
Gulf Island Fabrication, Inc.
|
100
|
|
104.51
|
|
87.32
|
|
85.87
|
|
73.12
|
|
40.79
|
|
|||||
|
S&P 500 Index
|
100
|
|
102.11
|
|
118.45
|
|
156.82
|
|
178.29
|
|
180.75
|
|
|||||
|
S&P 500 Oil & Gas Equipment & Services
|
100
|
|
88.32
|
|
88.32
|
|
115.39
|
|
106.39
|
|
86.44
|
|
|||||
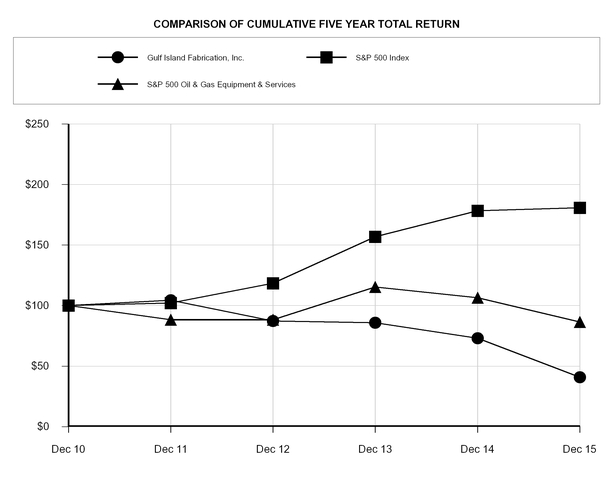
20
The following table sets forth selected historical financial data as of the dates and for the periods indicated. The historical financial data for each year in the five-year period ended December 31,
2015
is derived from our audited financial statements. The following information should be read in conjunction with “Management’s Discussion and Analysis of Financial Condition and Results of Operations” and our financial statements and notes thereto included elsewhere in this report on Form 10-K.
|
|
Years Ended December 31,
|
||||||||||||||||||
|
|
2015
|
2014
|
2013
|
2012
|
2011
|
||||||||||||||
|
|
(in thousands, except per share data)
|
||||||||||||||||||
|
Income Statement Data:
|
|||||||||||||||||||
|
Revenue
|
$
|
306,120
|
|
$
|
506,639
|
|
$
|
608,326
|
|
$
|
521,340
|
|
$
|
307,832
|
|
||||
|
Cost of revenue:
|
|||||||||||||||||||
|
Contract costs
|
321,276
|
|
462,083
|
|
584,665
|
|
502,999
|
|
295,614
|
|
|||||||||
|
Provision for losses on contract receivables
|
—
|
|
—
|
|
—
|
|
14,501
|
|
—
|
|
|||||||||
|
Asset impairments
|
—
|
|
—
|
|
—
|
|
—
|
|
7,690
|
|
|||||||||
|
Total cost of revenue
|
321,276
|
|
462,083
|
|
584,665
|
|
517,500
|
|
303,304
|
|
|||||||||
|
Gross profit
|
(15,156
|
)
|
44,556
|
|
23,661
|
|
3,840
|
|
4,528
|
|
|||||||||
|
General and administrative expenses
|
16,256
|
|
17,409
|
|
11,555
|
|
9,806
|
|
8,187
|
|
|||||||||
|
Asset impairment
|
7,202
|
|
3,200
|
|
—
|
|
—
|
|
—
|
|
|||||||||
|
Operating income (loss)
|
(38,614
|
)
|
23,947
|
|
12,106
|
|
(5,966
|
)
|
(3,659
|
)
|
|||||||||
|
Net interest income (expense)
|
(139
|
)
|
(24
|
)
|
(234
|
)
|
433
|
|
902
|
|
|||||||||
|
Other, income (expense)
|
20
|
|
(99
|
)
|
(337
|
)
|
128
|
|
309
|
|
|||||||||
|
Income (loss) before income taxes
|
(38,733
|
)
|
23,824
|
|
11,535
|
|
(5,405
|
)
|
(2,448
|
)
|
|||||||||
|
Income taxes
|
(13,369
|
)
|
8,504
|
|
4,303
|
|
(1,314
|
)
|
(644
|
)
|
|||||||||
|
Net income (loss)
|
$
|
(25,364
|
)
|
$
|
15,320
|
|
$
|
7,232
|
|
$
|
(4,091
|
)
|
$
|
(1,804
|
)
|
||||
|
Income Summary Data:
|
|||||||||||||||||||
|
Basic earnings (loss) per share—common shareholders
|
$
|
(1.75
|
)
|
$
|
1.05
|
|
$
|
0.50
|
|
$
|
(0.29
|
)
|
$
|
(0.13
|
)
|
||||
|
Diluted earnings (loss) per share—common shareholders
|
$
|
(1.75
|
)
|
$
|
1.05
|
|
$
|
0.50
|
|
$
|
(0.29
|
)
|
$
|
(0.13
|
)
|
||||
|
Basic weighted-average common shares
|
14,546
|
|
14,505
|
|
14,463
|
|
14,400
|
|
14,351
|
|
|||||||||
|
Diluted weighted-average common shares
|
14,546
|
|
14,505
|
|
14,469
|
|
14,400
|
|
14,351
|
|
|||||||||
|
Cash dividend declared per common share
|
$
|
0.40
|
|
$
|
0.40
|
|
$
|
0.40
|
|
$
|
0.40
|
|
$
|
0.24
|
|
||||
21
|
|
As of December 31,
|
||||||||||||||||||
|
|
2015
|
2014
|
2013
|
2012
|
2011
|
||||||||||||||
|
|
(in thousands)
|
||||||||||||||||||
|
Balance Sheet Data:
|
|||||||||||||||||||
|
Working capital
|
$
|
77,968
|
|
$
|
97,084
|
|
$
|
89,721
|
|
$
|
81,330
|
|
$
|
101,926
|
|
||||
|
Property, plant and equipment, net
|
200,384
|
|
224,777
|
|
223,555
|
|
229,216
|
|
216,722
|
|
|||||||||
|
Total assets
|
316,923
|
|
395,297
|
|
426,234
|
|
403,495
|
|
395,935
|
|
|||||||||
|
Debt
|
—
|
|
—
|
|
—
|
|
—
|
|
—
|
|
|||||||||
|
Cash Flow Data:
|
|||||||||||||||||||
|
Net cash provided by operating activities
|
10,615
|
|
32,110
|
|
38,003
|
|
11,037
|
|
11,932
|
|
|||||||||
|
Net cash used in investing activities
|
(6,007
|
)
|
(26,729
|
)
|
(20,802
|
)
|
(35,890
|
)
|
(41,545
|
)
|
|||||||||
|
Net cash used in financing activities
|
(5,865
|
)
|
(5,865
|
)
|
(5,520
|
)
|
(5,546
|
)
|
(3,172
|
)
|
|||||||||
|
Operating Data:
|
|||||||||||||||||||
|
Direct labor hours worked for the year ended December 31 ¹
|
2,655
|
|
3,646
|
|
4,060
|
|
4,768
|
|
2,715
|
|
|||||||||
|
Backlog as of December 31 ²
|
|||||||||||||||||||
|
Direct labor hours
|
1,914
|
|
1,654
|
|
3,256
|
|
4,372
|
|
4,609
|
|
|||||||||
|
Dollars
|
$
|
232,411
|
|
$
|
184,667
|
|
$
|
358,732
|
|
$
|
536,950
|
|
$
|
614,481
|
|
||||
|
(1)
|
Direct labor hours are hours worked by employees directly involved in the production of our products.
|
|
(2)
|
Our backlog is based on management’s estimate of the number of direct labor hours required to complete, and the remaining revenues to be recognized, with respect to those projects for which a customer has authorized us to begin work or purchase materials or services pursuant to written contracts, letters of intent or other forms of authorization. The backlog as of each year end also includes commitments received subsequent to December 31 of each year as described in Item 1. of this report on Form 10-K.
|
22
Executive Overview and Summary
Our Business
We are a leading fabricator of offshore drilling and production platforms and other steel structures for customers in the oil and gas and marine industries, including jackets and deck sections of fixed production platforms, hull, tendon, and/or deck sections of floating production platforms (such as TLPs, Spars, FPSOs and MinDOCs), piles, wellhead protectors, subsea templates, and various production, compressor, and utility modules. In addition. we also perform onshore and offshore construction services as well the repair, fabrication and construction of marine vessels. We use modern welding and fabrication technology, and all of our projects are manufactured in accordance with industry standards, specifications and regulations, including those published by the American Petroleum Institute, the American Welding Society, the American Society of Mechanical Engineers, the American Bureau of Shipping and the United States Coast Guard. The quality management systems of our operating subsidiaries are certified as ISO 9001-2008 quality assurance programs.
Operational achievements during the year include:
|
•
|
We fabricated a 1,200 foot jacket, piles, and an approximate 4,500 short ton topside for a deepwater Gulf of Mexico project, which commenced in the second quarter of 2013 and was successfully completed and delivered on time to our customer during the fourth quarter of 2015.
|
|
•
|
We completed five jackets and piles for a shallow water wind turbine project located off the coast of Rhode Island, that commenced in the fourth quarter of 2014 and were completed and delivered on time to our customer during the second and third quarters of 2015.
|
|
•
|
We completed one of three tow boats for an inland towing customer that commenced in the third quarter of 2014. The first tow boat was completed during the fourth quarter of 2015. The second tow boat is expected to be completed during the first quarter of 2016, and the third tow boat is expected to be completed during the third quarter of 2016.
|
Known Trends and Uncertainties
Our results of operations are affected primarily by (i) the level of exploration and development activity maintained by oil and gas exploration and production companies in the Gulf of Mexico, and to a lesser extent, overseas locations, (ii) our ability to win contracts through competitive bidding or alliance/partnering arrangements, and (iii) our ability to effectively manage contracts to successful completion. The level of exploration and development activity throughout the energy industry is related to several factors, including trends in oil and gas prices, expectations of future oil and gas prices, changes in technology and changes in the regulatory environment.
The slowdown in our industry as a result of crude oil price volatility has created significant uncertainty in global equity prices and overall market fundamentals within the energy industry in general. This uncertainty is the result of several factors including a global supply/demand imbalance for oil and an oversupply of natural gas in the United States; robust non-OPEC supply growth led by expanding unconventional production in the United States; weakening growth in emerging markets; and the decision by OPEC to maintain its current production ceiling. The downturn in oil and gas prices presents challenges in the near term, particularly as it relates to shallow water activity. The further reductions in capital spending by our customers in the global oil and gas industry, relative to the already reduced spending levels in the prior year for exploration and production, introduces additional uncertainty to short- and long-term demand in offshore oil and gas project activity. The result of these actions have had an adverse effect on our overall backlog levels and has created challenges with respect to our ability to operate our fabrication facilities at desired utilization levels. We anticipate that crude oil prices will increase in the future, as continued growth in demand and a slowing in supply growth should bring global markets into balance; however, the timing of any such increase is unknown.
We continue to respond to expected near-term decreases in capital spending by our customers by reducing our own discretionary and capital spending. We have adjusted the level of our workforce, based on expected near-term work in our facilities. As we work through existing backlog, depending on the duration of the downturn, we may need to make additional reductions in labor commensurate with the level of fabrication activity. We have recently undertaken additional efforts to reduce our overall cost structure and will continue to pursue opportunities to eliminate unnecessary spending. We continually evaluate opportunities to dispose of assets that are not expected to provide sufficient long-term value. In addition, our recent acquisition of LEEVAC, as further discussed below, has provided assets and operations that are complementary to our existing marine fabrication business, at an attractive value. The transaction provides us with more diversified product offerings and adds approximately $112.0 million in additional backlog.
23
From a marketing perspective, we are increasing our focus on obtaining marine fabrication and repair work, certain petrochemical plant work, alternative energy fabrication projects, and other projects that are less susceptible to fluctuations in oil prices.
We believe that our strong balance sheet, levels of cash, and access to capital provides us with the strength to persevere throughout this cycle.
LEEVAC Acquisition
On January 1, 2016, we acquired substantially all of the assets and assumed certain specified liabilities of LEEVAC Shipyards, L.L.C. and its affiliates ("LEEVAC"). The purchase price for the acquisition was $20.0 million, subject to a working capital adjustment whereby we received at closing a dollar for dollar reduction for the assumption of certain net liabilities of LEEVAC and settlement payments from sureties on certain ongoing fabrication projects that were assigned to us in the acquisition. After taking into account these adjustments, we received approximately $1.6 million in cash at closing and added approximately $112.0 million of incremental contract backlog primarily for four new build construction projects to be delivered in 2016 and 2017. Strategically, the acquisition expands our marine fabrication and repair and maintenance presence in the Gulf South market and further diversifies our fabrication capabilities.
Backlog
Our backlog is based on management’s estimate of the direct labor hours required to complete, and the remaining revenue to be recognized with respect to those projects a customer has authorized us to begin work or purchase materials or services pursuant to written contracts, letters of intent or other forms of authorization. As engineering and design plans are finalized or changes to existing plans are made, management’s estimate of the direct labor hours required to complete a project and the price of a project at completion is likely to change.
All projects currently included in our backlog generally are subject to suspension, termination, or a reduction in scope at the option of the customer, although the customer is generally required to pay us for work performed and materials purchased through the date of termination, suspension, or reduction in scope. In addition, customers have the ability to delay the execution of projects.
A comparison of our backlog as of December 31, 2015, September 30, 2015 and as of December 31, 2014 is as follows (amounts in thousands, except for percentages):
|
As of December 31, 2015
|
(1)
|
As of September, 2015
|
As of December 31, 2014
|
||||||
|
$'s
|
Labor hours
|
$'s
|
Labor hours
|
$'s
|
Labor hours
|
||||
|
Backlog
|
$232,411
|
1,914
|
$135,149
|
1,287
|
$184,667
|
1,654
|
|||
|
Number
|
Percentage
|
Number
|
Percentage
|
Number
|
Percentage
|
||||
|
Major customers
|
five
|
76.1%
|
(2)
|
five
|
66.5%
|
three
|
64.2%
|
||
|
$'s
|
Percentage
|
$'s
|
Percentage
|
$'s
|
Percentage
|
||||
|
Deepwater locations
|
$47,077
|
20.3%
|
$63,854
|
47.2%
|
$70,088
|
38.0%
|
|||
|
Foreign locations
|
$26,184
|
11.3%
|
$33,287
|
24.6%
|
$5,324
|
2.9%
|
|||
|
Backlog that is expected to be recognized in revenue during:
|
|||||||||
|
$'s
|
Percentage
|
||||||||
|
2016
|
$207,852
|
89.4%
|
(3)
|
||||||
|
2017
|
$24,559
|
10.6%
|
(3)
|
||||||
|
$232,411
|
|||||||||
24
1) Backlog as of December 31, 2015 includes commitments received through February 19, 2016. We exclude suspended projects from contract backlog that are expected to be suspended more than twelve months because resumption of work and timing of revenue recognition for these projects are difficult to predict. Our backlog also includes approximately $112.0 million of new build construction that was acquired in the LEEVAC acquisition on January 1, 2016. Our amount of backlog that was acquired in the LEEVAC acquisition does not include any adjustments that could arise from purchase price accounting which has not been finalized. Because purchase price accounting could result in different market values of the backlog acquired, the value assigned to the LEEVAC backlog acquired in the LEEVAC acquisition could potentially impact future margin, however, it is not expected to impact future cash flow.
2) Projects for our
five
largest customers consist of the following:
(i) tendon support buoys for a deepwater Gulf of Mexico project for one customer, which commenced in the fourth quarter of 2015 and will be completed during the fourth quarter of 2016;
(ii) two large multi-purpose service vessels for one customer, which commenced in the first quarter of 2014 and will be completed during the first quarter of 2017;
(iii) two large petroleum supply vessels for one customer, which commenced in the second quarter of 2013 and will be completed during the first quarter of 2017;
(iv) one jacket and piles for a foreign customer, which commenced in the third quarter of 2015 and will be completed during the fourth quarter of 2016; and
(v) offshore support and construction services related to a deepwater Gulf of Mexico project which commenced in the fourth quarter of 2015 and will be completed in the fourth quarter of 2016.
3) The timing of our recognition of the revenue backlog as presented above is based on management estimates of the application of the direct labor hours during the current projected timelines to complete the projects in our backlog. Certain factors and circumstances, as mentioned above, could cause changes in the period when the backlog is recognized as revenue.
Depending on the size of the project, the termination, postponement, or reduction in scope of any one project could significantly reduce our backlog, and could have a material adverse effect on revenue, net income and cash flow. For additional information, see Note 1 in the Notes to Consolidated Financial Statements “Assets held for sale” and Item 1A. Risk Factors – “
Our backlog is subject to change as a result of changes to management’s estimates, suspension or termination of projects currently in our backlog or our failure to secure additional projects. Our revenue, net income and cash flow could be adversely affected as a result of changes to our backlog.”
Workforce
Our workforce varies based on the level of ongoing fabrication activity at any particular time. During 2015 we made reductions in our workforce at our Houma, LA and Ingleside, TX facilities in response to decreases in the amount of fabrication work. As of December 31, 2015 and 2014, we had approximately
1,255
and 1,700 employees, respectively. On January 1, 2016, we hired 380 employees with the LEEVAC acquisition representing substantially all of the former LEEVAC employees.
We use contract labor when required to meet customer demand. The number of contract laborers we used decreased to
71
in 2015 as compared to 247 in 2014. None of our employees are employed pursuant to a collective bargaining agreement, and we believe our relationship with our employees is good. In an effort to maintain our current workforce and attract new employees in period of high activity, we have enhanced several incentive programs and expanded our training facility.
Labor hours worked were
2.7 million
, 3.6 million and 4.1 million for the years ending December 31, 2015, 2014 and 2013 respectively. The decrease in labor hours worked in 2015 relative to 2014 was primarily attributable to overall decreased levels of activity as a result of a decline in our oil and gas fabrication activity due to the steep decline in oil and gas prices as well as the completion of a jacket, piles, and topsides for a deepwater Gulf of Mexico project, and the completion of five jackets and piles for a shallow water wind turbine project located off the coast of Rhode Island, that commenced in the fourth quarter of 2014.
Critical Accounting Policies
Our consolidated financial statements are prepared in accordance with accounting principles generally accepted in the United States, which require us to make estimates and assumptions. We believe that of our significant accounting policies (see Note 1 in the Notes to Consolidated Financial Statements), the following involves a higher degree of judgment and complexity:
Revenue Recognition
The majority of our revenue is recognized on a percentage-of-completion basis based on the ratio of direct labor hours actually performed to date compared to the total estimated direct labor hours required for completion. Accordingly, contract price and cost estimates are reviewed monthly as the work progresses, and adjustments proportionate to the percentage of
25
completion are reflected in revenue for the period when such estimates are revised. If these adjustments were to result in a reduction of previously reported profits, we would recognize a charge against current earnings, which may be significant depending on the size of the project or the adjustment.
Profit incentives are included in revenue when their realization is probable. Claims for extra work or changes in scope of work are included in revenue when the amount can be reliably estimated and collection is probable. Changes in job performance, job conditions, and estimated profitability, including those arising from contract penalty provisions, and final contract settlements may result in revisions to costs and income and are recognized in the period in which the revisions are determined. For the years ended December 31, 2015, 2014 and 2013, there was no significant revenue related to unapproved change orders or claims.
Contract costs include all direct material, labor and subcontract costs and those indirect costs related to contract performance, such as indirect labor, supplies and tools. Also included in contract costs are a portion of those indirect contract costs related to plant capacity, such as depreciation, insurance and repairs and maintenance. These indirect costs are allocated to jobs based on actual direct labor hours worked.
Some contracts include a total or partial reimbursement to us of any costs associated with specific capital projects required by the fabrication process. If a particular capital project provides future benefits to us, the cost to build the capital project will be capitalized, and the revenue for the capital project will increase the estimated profit in the contract.
Provisions for estimated losses on uncompleted contracts are made in the period in which such losses are determined. We recognized contract losses of
$33.9 million
, $6.6 million, and $30.8 million for the years ended December 31, 2015, 2014, and 2013, respectively. Contract losses for the year ended December 31, 2015 were primarily related to
$24.5 million
related to a decrease in the contract price due to final weight re-measurements and our inability to recover certain costs on disputed change orders related to a large deepwater project which was recently delivered. In addition we accrued contract losses of approximately
$9.4 million
resulting from increases in our projected unit labor rates of our fabrication facilities. Our increases in unit labor rates were driven by our inability to absorb fixed costs due to decreases in expected oil and gas fabrication activity.
Contract losses for the year ended December 31, 2014 of $6.6 million were primarily related to two tank barge projects for a marine transportation company, platform supply vessels for an offshore marine company and a production platform jacket for a deepwater customer. Contract losses in 2013 of $30.8 million were primarily due to our inability to recover certain costs and the de-scoping of one of our major deepwater project, whereby remaining completion and integration work was performed at the integration site by a different integration contractor.
Allowance for Doubtful Accounts
We routinely review individual contracts receivable balances and make provisions for probable doubtful accounts as we deem appropriate. Among the factors considered during the review are the financial condition of our customers and their access to financing, underlying disputes on the account, age and amount of the account and overall economic conditions. Accounts are written off only when all reasonable collection efforts are exhausted.
Our principal customers include major and large independent oil and gas companies and their contractors and marine vessel operators and their contractors. This concentration of customers may impact our overall exposure to credit risk, either positively or negatively, in that customers may be similarly affected by changes in economic or other conditions. Receivables are generally not collateralized; however, in certain instances we obtain collateral to reduce our credit exposure. In the normal course of business, we extend credit to our customers on a short-term basis.
During 2015 allowances for bad debts were approximately $44,000. During the fourth quarter of 2014, the Company included an allowance for bad debt in the amount of $3.6 million in connection with negotiations of an outstanding contract receivable balance with a deepwater offshore customer related to a deepwater hull project that was completed during the first quarter of 2014.
Fair Value Measurements: Impairments of Long-Lived Assets and Assets Held for Sale
The determination of fair value can require the use of significant judgment and can vary based on the facts and circumstances.
We evaluate impairment losses on long-lived assets or asset groups used in operations when events and circumstances indicate that the assets or asset groups might not be recoverable. If events and circumstance indicate that the assets or asset groups might not be recoverable, the expected future undiscounted cash flows from the assets or asset groups are estimated and compared with the carrying amount of the assets or asset groups. If the sum of the estimated undiscounted cash flows is less than the carrying amount of the assets or asset groups, an impairment loss is recorded.
26
An impairment loss is measured by comparing the fair value of the asset or asset group to its carrying amount and recording the excess of the carrying amount of the asset or asset group over its fair value as an impairment charge. An asset group constitutes the minimum level for which identifiable cash flows are principally independent of the cash flows of other asset or liability groups. Fair value is determined based on discounted cash flows or appraised values, as appropriate. Due to the slow down in our industry as a result of the downturn in oil prices, we identified indicators of impairment at our Texas facility. Management performed an undiscounted cash flow analysis for the Texas facility which did not result in impairment.
We measure and record assets held for sale at the lower of their carrying amount or fair value less cost to sell. Assets held for sale at December 31, 2015 consist of equipment that was subsequently sold during the first quarter of 2016. We estimated the fair value as the actual cash proceeds received less costs incurred to sell. We recorded an impairment of $0.6 million related to this equipment during the fourth quarter of 2015.
Assets held for sale at December 31, 2014 consist of a partially constructed topside, related valves, piping and equipment that we acquired from a customer following its default under a contract for a deepwater project in 2012. We previously determined a fair value $10.3 million for these assets with the assistance of third party valuation specialists, relying primarily on the cost approach and applied the market approach where comparable sales transaction information was readily available. The cost approach is based on current replacement or reproduction costs of the subject assets less depreciation attributable to physical, functional, and economic factors. The market approach involves gathering data on sales and offerings of similar assets in order to value the subject assets. This approach also includes an assumption for the measurement of the loss in value from physical, functional, and economic factors.
To date, we have not sold, licensed, or leased any of this equipment. While we have not discontinued our programs to identify buyers for our assets held for sale, our ability to effectively market these assets held for sale has been significantly limited due to the sustained downturn in the energy sector. In addition, during the third quarter, we learned that a potential buyer is no longer expressing interest in the assets. As a result, we reassessed our estimate of fair value and recorded an impairment of $6.6 million, and reclassified the asset’s net realizable value of $3.7 million to inventory based on the estimated scrap value of these materials during the third quarter of 2015. We intend to use this inventory on future construction projects at our various fabrication facilities. Inventory consists of materials and production supplies and is stated at the lower of cost or market.
Results of Operations
Loss provision -
During the year ended December 31, 2015, we incurred contract losses of
$24.5 million
related to a decrease in the contract price due to final weight re-measurements and our inability to recover certain costs on disputed change orders related to a large deepwater project which was recently delivered. We are currently in negotiations with this customer concerning change orders with respect to the adjusted amounts due under this contract which are not included in contract revenues at December 31, 2015. Our intention is to resolve the disputed cost amounts and finalize the change orders with our customer as quickly as possible; however, we can give no assurance that these negotiations will conclude or that the change orders will be finalized in the near term.
In addition, we accrued contract losses of approximately
$9.4 million
resulting from increases in our projected unit labor rates of our fabrication facilities. Our increases in unit labor rates were driven by our inability to absorb fixed costs due to decreases in expected oil and gas fabrication activity.
27
Comparison of the years ended December 31, 2015 and 2014
(in thousands, except for percentages):
|
Twelve Months Ended December 31,
|
Increase or (Decrease)
|
||||||||||||
|
|
2015
|
2014
|
Amount
|
Percent
|
|||||||||
|
Revenue
|
$
|
306,120
|
|
$
|
506,639
|
|
$
|
(200,519
|
)
|
(39.6
|
)%
|
||
|
Cost of revenue
|
321,276
|
|
462,083
|
|
$
|
(140,807
|
)
|
(30.5
|
)%
|
||||
|
Gross (loss) profit
|
(15,156
|
)
|
44,556
|
|
(59,712
|
)
|
(134.0
|
)%
|
|||||
|
Gross profit percentage
|
(5.0
|
)%
|
8.8
|
%
|
|||||||||
|
General and administrative expenses
|
16,256
|
|
17,409
|
|
(1,153
|
)
|
(6.6
|
)%
|
|||||
|
Asset impairment
|
7,202
|
|
3,200
|
|
4,002
|
|
125.1
|
%
|
|||||
|
Operating (loss) income
|
(38,614
|
)
|
23,947
|
|
(62,561
|
)
|
(261.2
|
)%
|
|||||
|
Other income (expense):
|
|||||||||||||
|
Interest expense
|
(165
|
)
|
(37
|
)
|
(128
|
)
|
|||||||
|
Interest income
|
26
|
|
13
|
|
13
|
|
|||||||
|
Other income (expense)
|
20
|
|
(99
|
)
|
119
|
|
|||||||
|
(119
|
)
|
(123
|
)
|
4
|
|
3.3
|
%
|
||||||
|
(Loss) income before income taxes
|
(38,733
|
)
|
23,824
|
|
(62,557
|
)
|
(262.6
|
)%
|
|||||
|
Income taxes
|
(13,369
|
)
|
8,504
|
|
(21,873
|
)
|
(257.2
|
)%
|
|||||
|
Net (loss) income
|
$
|
(25,364
|
)
|
$
|
15,320
|
|
$
|
(40,684
|
)
|
(265.6
|
)%
|
||
Revenues -
Our revenues for years ended December 31,
2015
and
2014
were
$306.1 million
and
$506.6 million
, respectively, representing a decrease of
39.6%
. The decrease is primarily attributable to an overall decrease in work experienced in our fabrication yards as a result of depressed oil and gas prices and the corresponding reduction in activity in the Gulf of Mexico. In addition, we also:
|
•
|
incurred contract losses of
$24.5 million
during 2015 related to a deck and jacket for one of our large deepwater projects as further described above;
|
|
•
|
accrued contract losses of
$9.4 million
during 2015 due to projected increases in our unit labor rates as referred to above;
|
|
•
|
recognized higher revenue primarily as a result of work performed for a large deepwater project during 2014 and, to a lesser extent, experienced a decrease of pass through costs due to lesser amounts of subcontractor services and direct materials in
2015
as compared to
2014
.
|
Pass-through costs, as described in Note 2 in the Notes to Consolidated Financial Statements, are included in revenue but have no impact on the gross profit recognized on a project for a particular period. Pass-through costs as a percentage of revenue were
44.4%
and
48.2%
for the years ended December 31,
2015
and
2014
, respectively.
Gross (loss) profit -
Our gross (loss) profit for the years ended December 31,
2015
and
2014
was
$(15.2) million
(
(5.0)%
of revenue) and
$44.6 million
(
8.8%
of revenue), respectively. The decrease in gross profit was primarily due to:
|
•
|
contract losses of
$24.5 million
recorded during the third and fourth quarters of
2015
, as referred to above;
|
|
•
|
$9.4 million
of contract losses due to projected increases in our unit labor rates as referred to above;
|
|
•
|
lower project activity during the period as compared to the same period in
2014
; and
|
|
•
|
less offshore commissioning and hook-up activity performed on a time and material basis during
2015
as compared to
2014
.
|
General and administrative expenses
- Our general and administrative expenses were
$16.3 million
for the year ended December 31,
2015
, compared to
$17.4 million
for the year ended December 31,
2014
. The decrease in general and administrative expenses was primarily attributable to bad debt expense of $3.6 million recorded during the fourth quarter of 2014 related to a contract receivable balance with a customer for a deepwater hull project as well as reductions in discretionary spending in response to reductions in our oil and gas fabrication activity. These decreases were partially offset by $721,000 in acquisition and due diligence expenditures related to the LEEVAC acquisition and an increase in stock-based compensation expense of $1.6 million during 2015 as compared to 2014.
28
Asset impairment
- We recorded an asset impairment charges of
$7.2 million
during the year ended December 31,
2015
related to our assets held for sale as further discussed above and in Note 5 of the Notes to Consolidated Financial Statements as compared to asset impairment charges of
$3.2 million
for the year ended December 31,
2014
.
Interest expense
- The Company had net interest expense of
$139,000
for the year ended December 31,
2015
compared to net interest expense of
$24,000
for
2014
. The increase in net interest expense was primarily driven by interest expense associated with increases to letters of credit during
2015
.
Other income (expense)
- Other income for the year ended December 31,
2015
was
$20,000
of other income compared to other expense
$99,000
for 2014. Other income for the year ended December 31,
2015
primarily represents gains on sales of property, plant, and equipment as compared to other expense in
2014
, which primarily related to losses on sales of property, plant, and equipment during
2014
.
Income taxes -
Our effective income tax rate for
2015
was
34.5%
compared to an effective tax rate of 35.7% for
2014
. The decrease in the effective tax rate is primarily due to the impact of state income taxes for our operations in Louisiana.
Comparison of the years ended December 31, 2014 and 2013
(in thousands, except for percentages):
|
|
2014
|
2013
|
Amount
|
Percent
|
|||||||||
|
Revenue
|
$
|
506,639
|
|
$
|
608,326
|
|
$
|
(101,687
|
)
|
(16.7
|
)%
|
||
|
Cost of revenue
|
462,083
|
|
584,665
|
|
(122,582
|
)
|
(21.0
|
)%
|
|||||
|
Gross profit
|
44,556
|
|
23,661
|
|
20,895
|
|
88.3
|
%
|
|||||
|
Gross profit percentage
|
8.8
|
%
|
3.9
|
%
|
|||||||||
|
General and administrative expenses
|
17,409
|
|
11,555
|
|
5,854
|
|
50.7
|
%
|
|||||
|
Asset impairment
|
3,200
|
|
—
|
|
3,200
|
|
100.0
|
%
|
|||||
|
Operating (loss) income
|
23,947
|
|
12,106
|
|
11,841
|
|
97.8
|
%
|
|||||
|
Other income (expense):
|
|||||||||||||
|
Interest expense
|
(37
|
)
|
(237
|
)
|
200
|
|
|||||||
|
Interest income
|
13
|
|
3
|
|
10
|
|
|||||||
|
Other income (expense)
|
(99
|
)
|
(337
|
)
|
238
|
|
|||||||
|
(123
|
)
|
(571
|
)
|
448
|
|
78.5
|
%
|
||||||
|
(Loss) income before income taxes
|
23,824
|
|
11,535
|
|
12,289
|
|
106.5
|
%
|
|||||
|
Income taxes
|
8,504
|
|
4,303
|
|
4,201
|
|
97.6
|
%
|
|||||
|
Net (loss) income
|
$
|
15,320
|
|
$
|
7,232
|
|
$
|
8,088
|
|
111.8
|
%
|
||
Revenues
- For the twelve-month period ended December 31, 2014, our revenue was $506.6 million compared to $608.3 million for the twelve-month period ended December 31, 2013, a decrease of 16.7%. The following factors contributed to the decrease in revenues for the year ended December 31, 2014 compared to the year ended December 31, 2013:
|
•
|
pass-through costs, as a percentage of revenue, for the twelve-month period ended December 31, 2014 were 48.2% compared to 58.5% for the twelve-month period ended December 31, 2013; and
|
|
•
|
overall decreased levels of activity as a result of the completion of topsides for two large deepwater customers in 2013, and a Spar Hull for a large deepwater customer in the first quarter of 2014.
|
|
•
|
a decrease in pass-through costs for the twelve months ended December 31, 2014 primarily relates to higher levels of sub-contracted service costs on our major deepwater projects in 2013. Pass-through costs, as described in Note 2 in the Notes to Consolidated Financial Statements, are included in revenue, but have no impact on the gross profit recognized for that particular period.
|
|
•
|
The decrease in revenue was offset by lower estimated contract losses of $6.6 million for December 31, 2014 compared to $30.8 million for December 31, 2013.
|
Gross Profit
- For the twelve-month periods ended December 31, 2014 and 2013, gross profit was $44.6 million (8.8% of revenue) and $23.7 million (3.9% of revenue), respectively. Factors contributing to the overall increase in gross profit for the twelve-month period ended December 31, 2014 compared to the twelve-month period ended December 31, 2013 include:
29
|
•
|
lower contract losses of $6.6 million during the twelve month period ended December 31, 2014 compared to $30.8 million during the twelve-month period ended December 31, 2013;
|
|
•
|
a return to traditional jacket and smaller topside shallow water projects during 2014 as compared to 2013; and
|
|
•
|
a higher level of offshore commissioning and hook-up activity performed on a time and material basis.
|
Both the offshore connection and hook-up work and execution of the 2014 shallow water projects garnered higher profit margins as compared to our mix of projects performed during 2013, primarily due to (i) certain project improvement initiatives undertaken in 2014, and (ii) the fact that we historically have been able to more effectively control costs associated with these projects as compared to larger, more complex deepwater projects.
General and administrative expenses
- Our general and administrative expenses were $17.4 million for the twelve-month period ended December 31, 2014 compared to $11.6 million for the twelve-month period ended December 31, 2013. Factors that contributed to the increase in general and administrative expenses for the twelve months ended December 31, 2014 include:
|
•
|
a net increase of $2.7 million in bad debt expense; Bad debt expense for 2014 included a $3.6 million increase in the fourth quarter related to negotiations of an outstanding contract receivable balance with a customer for a deepwater hull project completed during the first quarter of 2014. At December 31, 2013, the Company included an allowance for bad debt in the amount of $0.9 million in connection with a vessel upgrade and outfitting project.
|
|
•
|
increases in expenses related to the relocation of our corporate headquarters to Houston, Texas and hiring of additional corporate staff members to support operations;
|
|
•
|
the addition of three consultants to assist with the marketing efforts for assets held for sale and potential FLNG opportunities; and
|
|
•
|
increases in expenses associated with an increase in the numbers of directors serving on our board.
|
Asset impairment
- As further discussed in “
Assets held for sale,”
under Critical Accounting Policies above, as of December 31, 2014, management determined that its previous estimate of $13.5 million for the fair value of assets held for sale had declined to $10.3 million. As a result, we included in general and administrative expenses in our income statement for the year ended December 31, 2014 an impairment charge of $3.2 million.
Interest expenses
- We had net interest expense of $24,000 for the twelve-month period ended December 31, 2014 compared to net interest expense of $234,000 for the twelve-month period ended December 31, 2013. Net interest expense for the period ended December 31, 2014 was lower as a result of decreased borrowings on the line of credit.
Other expenses
- We had other expenses of $99,000 for the twelve-month period ended December 31, 2014, compared to other expenses of $337,000 for the twelve-month period ended December 31, 2013. Other expenses for both periods primarily represent losses on sales of miscellaneous equipment.
Income taxes
- Our effective income tax rate was 35.7% for the twelve-month period ended December 31, 2014, compared to 37.3% for the twelve-month period ended December 31, 2013. The decrease in the effective rate for the period ended December 31, 2014 is a result of (a) lower effective state income tax rate; and (b) the fact that we were able to fully utilized net operating losses in 2014, allowing the Company to take the Qualified Production Activities Income Deduction (Section 199) for taxable earnings in excess of net operating losses for the year ended December 31, 2014.
Liquidity and Capital Resources
Historically, we have funded our business activities through cash generated from operations. At December 31, 2015 cash and cash equivalents totaled $
34.8 million
, compared to $36.1 million at December 31, 2014 with no borrowings outstanding under our credit facility. Working capital was $
78.0 million
and our ratio of current assets to current liabilities was
3.1
to 1 at December 31, 2015. Our primary source of cash for the year ended December 31, 2015, was the collection of accounts receivable along with a reduction in costs associated with lower activity levels. At December 31, 2015, our contracts receivable balance was $
47.0 million
. We have subsequently collected $28.4 million through February 19, 2016.
During 2015, we recorded contract losses of
$24.5 million
related to a decrease in the contract price due to final weight re-measurements and our inability to recover certain costs on disputed change orders related to a large deepwater project which was recently delivered. We are currently in negotiations with this customer concerning disputed change orders and no amounts with respect to these disputed change orders are included in contract revenues at December 31, 2015. Our intention is to resolve the disputed cost amounts and finalize the change orders with our customer as quickly as possible; however, we can give no assurance that these negotiations will conclude in the near term or at all or that we will recover any of these contract
30
losses from our customer. In addition, we accrued contract losses of approximately
$9.4 million
resulting from increases in our projected unit labor rates of our fabrication facilities. Our increases in unit labor rates were driven by our inability to absorb fixed costs due to decreases in expected oil and gas fabrication activity.
On January 1, 2016, we acquired substantially all of the assets and assumed certain specified liabilities of LEEVAC Shipyards, L.L.C. and its affiliates ("LEEVAC"). The purchase price for the acquisition was $20.0 million, subject to a working capital adjustment whereby we received at closing a dollar for dollar reduction for the assumption of certain net liabilities of LEEVAC and settlement payments from sureties on certain ongoing fabrication projects that were assigned to us in the acquisition. After taking into account these adjustments, we received approximately $1.6 million in cash at closing and added approximately $112.0 million of incremental contract backlog primarily for four new build construction projects to be delivered in 2016 and 2017. Strategically, the acquisition expands our marine fabrication and repair and maintenance presence in the Gulf South market and further diversifies our fabrication capabilities.
We have a credit agreement with Whitney Bank and JPMorgan Chase Bank N.A. that provides for an $80.0 million revolving credit facility. Our obligations under the credit agreement are secured by substantially all of our assets, other than real property located in the state of Louisiana. On February 29, 2016, we entered into an amendment to our credit agreement. The amendment restates our financial covenants beginning with the quarter ending March 31, 2016 as follows:
|
(i)
|
minimum net worth not less than
$250.0 million
plus
|
(a) 50% of net income earned in each quarter beginning March 31, 2016 and
(b) 100% of proceeds from any issuance of common stock;
|
(ii)
|
debt to EBITDA ratio not greater than 3.0 to 1.0; and
|
|
(iii)
|
interest coverage ratio of not less than 2.0 to 1.0.
|
The amendment also (i) extends the term of the Credit Facility from February 29, 2016 to January 2, 2017; (ii) increases the commitment fee on undrawn amounts from 0.25% to 0.50% per annum; (iii) increases the letter of credit fee, subject to certain limited exceptions, to 2.0% per annum on undrawn stated amounts under letters of credit issued by the lenders; and (iv) limits the maximum amount of loans outstanding at any time for general corporate purposes to $20.0 million.
At December 31, 2015 we had no outstanding borrowings under the credit agreement, and we had outstanding letters of credit totaling $
20.5 million
. After consideration of outstanding letters of credit, the availability of the unused portion of the revolving credit agreement (as amended) for additional letters of credit and for general corporate purposes was
$59.5 million
and $
20.0 million
, respectively. Amounts borrowed under our the credit agreement bear interest, at our option, at either the prime lending rate established by JPMorgan Chase Bank, N.A. or LIBOR plus 2.0 percent.
Our primary liquidity requirements are for the costs associated with fabrication projects, capital expenditures and payment of dividends to our shareholders. We experienced a significant decline in our fabrication work from our oil and gas customers during 2015 resulting from a steep decline in oil and gas prices.
We anticipate capital expenditures for 2016 to be approximately $4.0 million primarily for the following:
|
•
|
computer system upgrades,
|
|
•
|
improvement of bulkhead at our Houma facility, and
|
|
•
|
improvements to our newly acquired facilities
|
On February 25, 2016, our Board of Directors declared a dividend of
$0.01
per share on our shares of common stock outstanding, payable March 24, 2016 to shareholders of record on March 10, 2016. A decrease in our historical quarterly dividend from $0.10 per share to $0.01 was recommended by management and approved by our board of directors in an effort to conserve cash due to the severity of the industry downturn.
On July 30, 2015, our Board of Directors authorized the Company to repurchase up to $10.0 million in shares of our common stock under a share repurchase program that remains in effect through July 30, 2017. Repurchases may be effected through open market purchases or in privately negotiated transactions at such times and in such amounts as management deems appropriate, depending on market conditions and other factors. The repurchase program does not obligate the Company to acquire any particular amount of common stock and may be modified, suspended or discontinued at any time. To date, we have made no repurchases of our common stock. Due to the severity of the industry downturn, management has recommended and our board of directors has approved a temporary suspension of our stock repurchase program in an effort to conserve cash.
31
We believe our cash and cash equivalents generated by operating activities and funds available under our credit facility will be sufficient to fund our capital expenditures, issue future letters of credit and meet our working capital needs for the next twelve months to continue our operations, satisfy our contractual operations and pay dividends to our shareholders.
Cash Flows for the Years Ended December 31,
2015
,
2014
and
2013
(in thousands)
:
|
2015
|
2014
|
2013
|
||||||||
|
Operating activities
|
$
|
10,615
|
|
$
|
32,110
|
|
$
|
38,003
|
|
|
|
Investing activities
|
$
|
(6,007
|
)
|
$
|
(26,729
|
)
|
$
|
(20,802
|
)
|
|
|
Financing activities
|
$
|
(5,865
|
)
|
$
|
(5,865
|
)
|
$
|
(5,520
|
)
|
|
Operating activities:
|
•
|
The decrease in cash flows provided by operating activities for 2015 as compared to 2014 is primarily due to net losses incurred during 2015 as compared to net income during 2014.
|
|
•
|
The decrease in cash flows provided by operating activities for 2014 as compared to 2013 is primarily due to the increase in project costs in 2014, primarily in connection with the start-up of our large traditional jacket deepwater project, partially offset by stronger operating performance in 2014, specifically related to increased gross profit and lower contract losses.
|
Investing activities:
|
•
|
The decrease in cash flows used in investing activities for 2015 as compared to 2014 is primarily due to reduced capital expenditures as a result of management’s concerted effort to reduce our discretionary and capital spending to match the decrease in oil and gas fabrication work as a result of decreases in oil and gas prices.
|
|
•
|
The increase in cash flows used in investing activities for 2014 as compared to 2013 is primarily due to increased capital expenditures for equipment and improvements to our production facilities, including $15.4 million for two cranes at our Texas facility.
|
Financing activities:
|
•
|
Cash flows used in financing activities for each of the years ended December 31, 2015, 2014 and 2013 primarily related to the payment of dividends.
|
Contractual Obligations and Commitments
The following table sets forth an aggregation of our contractual obligations and commitments as of
December 31, 2015
, (in thousands).
|
|
Total
|
Payments Due by Period
|
|||||||||||||||||
|
|
Less Than
1 Year
|
1 to 3
Years
|
3 to 5
Years
|
Thereafter
|
|||||||||||||||
|
Purchase commitment – material and services ¹
|
3,862
|
|
3,862
|
|
—
|
|
—
|
|
—
|
|
|||||||||
|
Operating leases ²
|
911
|
|
217
|
|
446
|
|
248
|
|
—
|
|
|||||||||
|
$
|
4,773
|
|
$
|
4,079
|
|
$
|
446
|
|
$
|
248
|
|
$
|
—
|
|
|||||
|
(1)
|
“Purchase commitment – material and services” is a commitment related to purchase order agreements.
|
|
(2)
|
Operating leases are commitments for office space.
|
Off-Balance Sheet Arrangements
We are not a party to any contract or other obligation not included on our balance sheet that has, or is reasonably likely to have, a current or future effect on our financial condition, changes in financial condition, revenues or expenses, results of operations, liquidity, capital expenditures or capital resources.
32
Other Matters
During the first quarter of 2016, our Chief Financial Officer received a notice from the SEC indicating that it had made a preliminary determination to recommend that the SEC Division of Enforcement file a civil enforcement action against him relating to his alleged responsibility for two accounting issues that occurred during his tenure as controller of FMC Technologies, Inc.’s Energy Infrastructure business segment from May 2012 to May 2013, a position he held immediately prior to joining the Company. Our Chief Financial Officer has advised the Company that he (i) has fully responded to all of the SEC’s requests for information, (ii) has cooperated and engaged in discussions with the SEC, (iii) has discussed these matters with our Audit Committee, and (iv) intends to vigorously defend any claims that may be brought.
As disclosed in its Form 10-K for the year ended December 31, 2015, FMC Technologies, Inc. also received a notice indicating that the SEC had made a preliminary determination to recommend that the SEC Division of Enforcement file a civil enforcement action against FMC for alleged violations of the reporting, books-and-records and internal control provisions of U.S. securities laws.
We do not have operations subject to material risk of foreign currency fluctuations, nor do we use derivative financial instruments in our operations or investment portfolio. We have a credit agreement with Whitney Bank and JPMorgan Chase Bank N.A. that provides for an $80.0 million revolving credit facility that allows us to use up to the full amount of the available borrowing base for letters of credit and up to $20.0 million for general corporate purposes. Amounts borrowed under our the credit agreement bear interest, at our option, at either the prime lending rate established by JPMorgan Chase Bank, N.A. or LIBOR plus 2.0 percent. We pay fees on a quarterly basis of one-half of one percent per annum on the weighted-average unused portion of our revolving line of credit and 2.0% per annum, subject to certain limited exceptions, on undrawn stated amounts under letters of credit issued by the lenders.
In this report our consolidated financial statements of and the accompanying notes appear on pages F-1 through F-17 and are incorporated herein by reference. See Index to Consolidated Financial Statements on Page 38
.
None.
The Company maintains disclosure controls and procedures that are designed to ensure that information required to be disclosed by the Company in the reports that it files or submits under the Securities Exchange Act of 1934 is recorded, processed, summarized and reported within the time periods specified in the SEC rules and forms, and that such information is communicated to the Company’s management, including its Chief Executive Officer and Chief Financial Officer, as appropriate, to allow timely decisions regarding required disclosure. The Company’s management, with the participation of the Company’s Chief Executive Officer and Chief Financial Officer, has evaluated the effectiveness of our disclosure controls and procedures (as defined in Rule 13a-15(e) under the Securities Exchange Act of 1934) as of the end of the period covered by this report. Based on this evaluation, our Chief Executive Officer and Chief Financial Officer have concluded that the design and operation of our disclosure controls and procedures were effective as of the end of the period covered by this report.
Management’s Report on Internal Control Over Financial Reporting
Our management is responsible for establishing and maintaining adequate internal control over financial reporting, as such term is defined in Exchange Act Rule 13a-15(f). Under the supervision and with the participation of our management, including our principal executive officer and principal financial officer, we conducted an evaluation of the effectiveness of our internal control over financial reporting based on the framework in
Internal Control – Integrated Framework
issued by the Committee of Sponsoring Organizations of the Treadway Commission (2013 framework). Based on our evaluation under the framework in
Internal Control – Integrated Framework,
our management concluded that our internal control over financial reporting was effective as of December 31,
2015
.
The effectiveness of our internal control over financial reporting as of December 31,
2015
has been audited by Ernst & Young LLP, an independent registered public accounting firm, as stated in their report dated March 9, 2016, which is included herein.
33
Report of Independent Registered Public Accounting Firm
The Board of Directors and Shareholders
Gulf Island Fabrication, Inc.
We have audited Gulf Island Fabrication, Inc.’s (the “Company’s”) internal control over financial reporting as of December 31,
2015
, based on criteria established in
Internal Control – Integrated Framework
issued by the Committee of Sponsoring Organizations of the Treadway Commission (2013 framework) (the COSO criteria). Gulf Island Fabrication, Inc.’s management is responsible for maintaining effective internal control over financial reporting and for its assessment of the effectiveness of internal control over financial reporting included in the accompanying Management’s Report on Internal Control Over Financial Reporting. Our responsibility is to express an opinion on the Company’s internal control over financial reporting based on our audit.
We conducted our audit in accordance with the standards of the Public Company Accounting Oversight Board (United States). Those standards require that we plan and perform the audit to obtain reasonable assurance about whether effective internal control over financial reporting was maintained in all material respects. Our audit included obtaining an understanding of internal control over financial reporting, assessing the risk that a material weakness exists, testing and evaluating the design and operating effectiveness of internal control based on the assessed risk, and performing such other procedures as we considered necessary in the circumstances. We believe that our audit provides a reasonable basis for our opinion.
A company’s internal control over financial reporting is a process designed to provide reasonable assurance regarding the reliability of financial reporting and the preparation of financial statements for external purposes in accordance with generally accepted accounting principles. A company’s internal control over financial reporting includes those policies and procedures that (1) pertain to the maintenance of records that, in reasonable detail, accurately and fairly reflect the transactions and dispositions of the assets of the Company; (2) provide reasonable assurance that transactions are recorded as necessary to permit preparation of financial statements in accordance with generally accepted accounting principles, and that receipts and expenditures of the Company are being made only in accordance with authorizations of management and directors of the Company; and (3) provide reasonable assurance regarding prevention or timely detection of unauthorized acquisition, use, or disposition of the Company’s assets that could have a material effect on the financial statements.
Because of its inherent limitations, internal control over financial reporting may not prevent or detect misstatements. Also, projections of any evaluation of effectiveness to future periods are subject to the risk that controls may become inadequate because of changes in conditions, or that the degree of compliance with the policies or procedures may deteriorate.
In our opinion, Gulf Island Fabrication, Inc. maintained, in all material respects, effective internal control over financial reporting as of December 31,
2015
, based on the COSO criteria.
We have also audited, in accordance with the standards of the Public Company Accounting Oversight Board (United States), the consolidated balance sheets of Gulf Island Fabrication, Inc. as of December 31,
2015
and
2014
, and the related consolidated statements of operations, changes in shareholders’ equity, and cash flows for each of the three years in the period ended December 31,
2015
, and our report dated March 9, 2016, expressed an unqualified opinion thereon.
/s/ Ernst & Young LLP
New Orleans, Louisiana
March 9, 2016
34
Not applicable.
35
The information regarding executive officers called for by this item may be found following Item 4 of this report on Form 10-K under the caption “Executive Officers of the Registrant” and is incorporated herein by reference.
We have adopted a Code of Ethics for the Chief Executive Officer, the Chief Financial Officer (the principal accounting officer), the Controller – Financial Reporting and persons performing similar functions (the “Code of Ethics”) and a Code of Business Conduct and Ethics, which applies to all employees and directors, including the Chief Executive Officer, the Chief Financial Officer (the principal accounting officer), the Corporate Controller and persons performing similar functions. These codes are available to the public on our web site at www.gulfisland.com. Any substantive amendments to the Code of Ethics or any waivers granted under the Code of Ethics will be disclosed within four business days of such event on our web site.
The remaining information called for by this item may be found in our definitive Proxy Statement prepared in connection with the
2016
Annual Meeting of Shareholders and is incorporated herein by reference.
Information called for by this item may be found in our definitive Proxy Statement prepared in connection with the
2016
Annual Meeting of Shareholders and is incorporated herein by reference.
Information regarding security ownership of certain beneficial owners and management called for by this item may be found in our definitive Proxy Statement prepared in connection with the
2016
Annual Meeting of Shareholders and is incorporated herein by reference.
Equity Compensation Plan Information
The following table provides information about our shares of common stock that may be issued upon the exercise of options, warrants and rights under all of our existing equity compensation plans as of December 31,
2015
.
|
Plan Category
|
Number of securities
to be issued upon
exercise of
outstanding options,
warrants and rights
(a)
|
|
Weighted-average
exercise price of
outstanding
options, warrants
and rights
(b)
|
Number of securities remaining
available for future issuance
under equity compensation
plans (excluding securities
reflected in column (a))
(c)
|
|
||||||
|
Equity compensation plans approved by security holders
|
—
|
|
|
N/A
|
1,345,887
|
|
|
||||
|
Equity compensation plans not approved by security holders
|
—
|
|
|
—
|
|
|
|||||
|
Total
|
—
|
|
(1)
|
1,345,887
|
|
(2)
|
|||||
|
(1)
|
There were no outstanding options as of December 31,
2015
.
|
|
(2)
|
As of December 31,
2015
, there were 1,000,000 shares remaining available for issuance under the 2015 Stock Incentive Plan, 240,011 shares remaining available under the 2011 Long-Term Incentive Plan, and 105,876 shares remaining available under the Long-Term Incentive Plan all of which could be issued under the terms of the plans upon the exercise of stock options or stock appreciation rights, or in the form of restricted stock or other stock awards.
|
Information called for by this item may be found in our definitive Proxy Statement prepared in connection with the
2016
Annual Meeting of Shareholders and is incorporated herein by reference.
36
Information called for by this item may be found in our definitive Proxy Statement prepared in connection with the
2016
Annual Meeting of Shareholders and is incorporated herein by reference.
37
The following financial statements, schedules and exhibits are filed as part of this Report:
(i) Financial Statements
|
|
Page
|
|
Report of Independent Registered Public Accounting Firm
|
F-1
|
|
Consolidated Balance Sheets at December 31, 2015 and December 31, 2014
|
F-2
|
|
Consolidated Statements of Operations for the Years Ended December 31, 2015, 2014, and 2013
|
F-3
|
|
Consolidated Statements of Changes in Shareholders’ Equity for the Years Ended December 31, 2015, 2014, and 2013
|
F-4
|
|
Consolidated Statements of Cash Flows for the Years Ended December 31, 2015, 2014, and 2013
|
F-5
|
|
Notes to Consolidated Financial Statements
|
F-6
|
(ii) Schedules
Other schedules have not been included because they are not required, not applicable, immaterial, or the information required has been included elsewhere herein.
(iii) Exhibits
See Exhibit Index on page E-1. The Company will furnish to any eligible shareholder, upon written request, a copy of any exhibit listed upon payment of a reasonable fee equal to the Company’s expenses in furnishing such exhibit. Such requests should be addressed to Investor Relations, Gulf Island Fabrication, Inc., 16225 Park Ten Place, Suite 280 Houston, Texas 77084.
38
GLOSSARY OF CERTAIN TECHNICAL TERMS
|
blasting and coating facility:
|
|
Building and equipment used to clean steel products and prepare them for coating with marine paints and other coatings.
|
|
coping machine:
|
|
A computerized machine that cuts ends of tubular pipe sections to allow for changes in weld bevel angles and fits onto other tubular pipe sections.
|
|
deck:
|
|
The component of a platform on which development drilling, production, separating, gathering, piping, compression, well support, crew quartering and other functions related to offshore oil and gas development are conducted.
|
|
deepwater drilling
|
|
Drilling is typically defined as drilling that occurs in depths of 1,000 feet or more..
|
|
direct labor hours:
|
|
Hours worked by employees directly involved in the production of the Company’s products. These hours do not include contractor labor hours and support personnel hours such as maintenance, warehousing and drafting.
|
|
dry tree system:
|
|
A system in which a platform’s well control valves and apparatus (“christmas trees”) and risers are installed and operated above water.
|
|
fixed platform:
|
|
A platform consisting of a rigid jacket which rests on tubular steel pilings driven into the seabed and which supports a deck structure above the water surface.
|
|
floating production platform:
|
|
Floating structure that supports offshore oil and gas production equipment (MinDOC, TLP, FPSO, SPAR).
|
|
FPSO:
|
|
Floating Production Storage and Offloading vessel.
|
|
graving dock:
|
|
A box shaped basin made of steel sheet pile walls and concrete floor into which a vessel may be floated into or out of by pumping out or in water. The end will be closed by earthen berms and a sheet pile wall that will be removed to float out vessels.
|
|
grit blast system:
|
|
System of preparing steel for coating by using steel grit rather than sand as a blasting medium.
|
|
hydraulic plate shear:
|
|
Machine that cuts steel by a mechanical system similar to scissors.
|
|
inshore:
|
|
Inside coastlines, typically in bays, lakes and marshy areas.
|
|
ISO 9001-2008:
|
|
International Standards of Operations 9001-2008 – Defines quality management system of procedures and goals for certified companies.
|
G-1
|
jacket:
|
|
A component of a fixed platform consisting of a tubular steel, braced structure extending from the mudline of the seabed to a point above the water surface. The jacket is supported on tubular steel pilings driven into the seabed and supports the deck structure located above the level of storm waves.
|
|
MinDOC:
|
|
Minimum Deepwater Operating Concept. Floating production platform designed for stability and dynamic response to waves consisting of three vertical columns arranged in a triangular shape connected to upper and lower pontoon sections.
|
|
modules:
|
|
Packaged equipment usually consisting of major production, utility or compression equipment with associated piping and control system.
|
|
offshore:
|
|
In unprotected waters outside coastlines.
|
|
piles:
|
|
Rigid tubular pipes that are driven into the seabed to support platforms.
|
|
plasma-arc cutting system:
|
|
Steel cutting system that uses an ionized gas cutting rather than oxy-fuel system.
|
|
platform:
|
|
A structure from which offshore oil and gas development drilling and production are conducted.
|
|
pressure vessel:
|
|
A metal container generally cylindrical or spheroid, capable of withstanding various internal pressure loadings.
|
|
skid unit:
|
|
Packaged equipment usually consisting of major production, utility or compression equipment with associated piping and control system.
|
|
Spar:
|
|
A vessel with a circular cross-section that sits vertically in the water and is supported by buoyancy chambers (“hard tanks”) at the top and stabilized by a structure (“midsection”) hanging from the hard tanks.
|
|
spud barge:
|
|
Construction barge rigged with vertical tubular or square lengths of steel pipes that are lowered to anchor the vessel.
|
|
subsea templates:
|
|
Tubular frames which are placed on the seabed and anchored with piles. Usually a series of oil and gas wells are drilled through these underwater structures.
|
|
tension leg platform (TLP):
|
|
A platform consisting of a floating hull and deck anchored by vertical tensioned cables or pipes connected to pilings driven into the seabed. A tension leg platform is typically used in water depths exceeding 1,000 feet.
|
G-2
REPORT OF INDEPENDENT REGISTERED PUBLIC ACCOUNTING FIRM
The Board of Directors and Shareholders
Gulf Island Fabrication, Inc.
We have audited the accompanying consolidated balance sheets of Gulf Island Fabrication, Inc. as of December 31,
2015
and
2014
, and the related consolidated statements of operations, changes in shareholders’ equity, and cash flows for each of the three years in the period ended December 31,
2015
. These financial statements are the responsibility of the Company’s management. Our responsibility is to express an opinion on these financial statements based on our audits.
We conducted our audits in accordance with the standards of the Public Company Accounting Oversight Board (United States). Those standards require that we plan and perform the audit to obtain reasonable assurance about whether the financial statements are free of material misstatement. An audit includes examining, on a test basis, evidence supporting the amounts and disclosures in the financial statements. An audit also includes assessing the accounting principles used and significant estimates made by management, as well as evaluating the overall financial statement presentation. We believe that our audits provide a reasonable basis for our opinion.
In our opinion, the financial statements referred to above present fairly, in all material respects, the consolidated financial position of Gulf Island Fabrication, Inc. at December 31,
2015
and
2014
, and the consolidated results of its operations and its cash flows for each of the three years in the period ended December 31,
2015
, in conformity with U.S. generally accepted accounting principles.
We also have audited, in accordance with the standards of the Public Company Accounting Oversight Board (United States), Gulf Island Fabrication, Inc.’s internal control over financial reporting as of December 31,
2015
, based on criteria established in Internal Control—Integrated Framework issued by the Committee of Sponsoring Organizations of the Treadway Commission (2013 framework) and our report dated March 9, 2016, expressed an unqualified opinion thereon.
/s/ Ernst & Young LLP
New Orleans, Louisiana
March 9, 2016
F-1
GULF ISLAND FABRICATION, INC.
|
December 31,
2015 |
December 31,
2014 |
||||||
|
|
(in thousands)
|
||||||
|
ASSETS
|
|||||||
|
Current assets:
|
|||||||
|
Cash and cash equivalents
|
$
|
34,828
|
|
$
|
36,085
|
|
|
|
Contract retainage
|
52
|
|
—
|
|
|||
|
Contracts receivable, net
|
47,008
|
|
80,448
|
|
|||
|
Costs and estimated earnings in excess of billings on uncompleted contracts
|
12,822
|
|
26,989
|
|
|||
|
Prepaid expenses and other
|
3,418
|
|
4,510
|
|
|||
|
Inventory
|
12,936
|
|
10,140
|
|
|||
|
Income tax receivable
|
—
|
|
1,350
|
|
|||
|
Assets held for sale
|
4,805
|
|
10,327
|
|
|||
|
Total current assets
|
115,869
|
|
169,849
|
|
|||
|
Property, plant and equipment, net
|
200,384
|
|
224,777
|
|
|||
|
Other assets
|
670
|
|
671
|
|
|||
|
Total assets
|
$
|
316,923
|
|
$
|
395,297
|
|
|
|
LIABILITIES AND SHAREHOLDERS’ EQUITY
|
|||||||
|
Current liabilities:
|
|||||||
|
Accounts payable
|
$
|
13,604
|
|
$
|
40,272
|
|
|
|
Billings in excess of costs and estimated earnings on uncompleted contracts
|
7,081
|
|
18,766
|
|
|||
|
Accrued contract losses
|
9,495
|
|
817
|
|
|||
|
Accrued employee costs
|
6,831
|
|
7,723
|
|
|||
|
Accrued expenses and other liabilities
|
777
|
|
5,187
|
|
|||
|
Income taxes payable
|
113
|
|
—
|
|
|||
|
Total current liabilities
|
37,901
|
|
72,765
|
|
|||
|
Net deferred tax liabilities
|
21,825
|
|
36,734
|
|
|||
|
Total liabilities
|
59,726
|
|
109,499
|
|
|||
|
Shareholders’ equity:
|
|||||||
|
Preferred stock, no par value, 5,000,000 shares authorized, no shares issued and outstanding
|
|
|
|
|
|||
|
Common stock, no par value, 20,000,000 shares authorized, 14,580,216 issued and outstanding at December 31, 2015 and 14,539,104 at December 31, 2014, respectively
|
10,352
|
|
10,090
|
|
|||
|
Additional paid-in capital
|
96,194
|
|
93,828
|
|
|||
|
Retained earnings
|
150,651
|
|
181,880
|
|
|||
|
Total shareholders’ equity
|
257,197
|
|
285,798
|
|
|||
|
Total liabilities and shareholders’ equity
|
$
|
316,923
|
|
$
|
395,297
|
|
|
The accompanying notes are an integral part of these financial statements.
F-2
GULF ISLAND FABRICATION, INC.
(in thousands, except per share data)
|
|
Years Ended December 31,
|
||||||||||
|
|
2015
|
2014
|
2013
|
||||||||
|
Revenue
|
$
|
306,120
|
|
$
|
506,639
|
|
$
|
608,326
|
|
||
|
Cost of revenue:
|
|||||||||||
|
Contract costs
|
321,276
|
|
462,083
|
|
584,665
|
|
|||||
|
Gross (loss) profit
|
(15,156
|
)
|
44,556
|
|
23,661
|
|
|||||
|
General and administrative expenses
|
16,256
|
|
17,409
|
|
11,555
|
|
|||||
|
Asset impairment
|
7,202
|
|
3,200
|
|
—
|
|
|||||
|
Operating (loss) income
|
(38,614
|
)
|
23,947
|
|
12,106
|
|
|||||
|
Other income (expense):
|
|||||||||||
|
Interest expense
|
(165
|
)
|
(37
|
)
|
(237
|
)
|
|||||
|
Interest income
|
26
|
|
13
|
|
3
|
|
|||||
|
Other income (expense), net
|
20
|
|
(99
|
)
|
(337
|
)
|
|||||
|
(119
|
)
|
(123
|
)
|
(571
|
)
|
||||||
|
(Loss) income before income taxes
|
(38,733
|
)
|
23,824
|
|
11,535
|
|
|||||
|
Income tax (benefit) expense
|
(13,369
|
)
|
8,504
|
|
4,303
|
|
|||||
|
Net (loss) income
|
$
|
(25,364
|
)
|
$
|
15,320
|
|
$
|
7,232
|
|
||
|
Per share data:
|
|||||||||||
|
Basic earnings (loss) per share—common shareholders
|
$
|
(1.75
|
)
|
$
|
1.05
|
|
$
|
0.50
|
|
||
|
Diluted earnings (loss) per share—common shareholders
|
$
|
(1.75
|
)
|
$
|
1.05
|
|
$
|
0.50
|
|
||
The accompanying notes are an integral part of these financial statements.
F-3
GULF ISLAND FABRICATION, INC.
CONSOLIDATED STATEMENT OF CHANGES IN SHAREHOLDERS’ EQUITY
(in thousands, except share data)
|
|
Common Stock
|
Additional
Paid-In
Capital
|
Retained
Earnings
|
Total
Shareholders’
Equity
|
||||||||||||||
|
|
Shares
|
Amount
|
||||||||||||||||
|
Balance at January 1, 2013
|
14,452,660
|
|
$
|
9,956
|
|
$
|
92,512
|
|
$
|
171,032
|
|
$
|
273,500
|
|
||||
|
Exercise of stock options
|
2,900
|
|
20
|
|
183
|
|
—
|
|
203
|
|
||||||||
|
Income tax benefit from stock compensation
|
—
|
|
—
|
|
116
|
|
—
|
|
116
|
|
||||||||
|
Net income
|
—
|
|
—
|
|
—
|
|
7,232
|
|
7,232
|
|
||||||||
|
Vesting of restricted stock
|
38,188
|
|
(32
|
)
|
(290
|
)
|
—
|
|
(322
|
)
|
||||||||
|
Compensation expense restricted stock
|
—
|
|
68
|
|
604
|
|
—
|
|
672
|
|
||||||||
|
Dividends on common stock
|
—
|
|
—
|
|
—
|
|
(5,839
|
)
|
(5,839
|
)
|
||||||||
|
Balance at December 31, 2013
|
14,493,748
|
|
$
|
10,012
|
|
$
|
93,125
|
|
$
|
172,425
|
|
$
|
275,562
|
|
||||
|
Net income
|
—
|
|
—
|
|
—
|
|
15,320
|
|
15,320
|
|
||||||||
|
Vesting of restricted stock
|
45,356
|
|
(35
|
)
|
(323
|
)
|
—
|
|
(358
|
)
|
||||||||
|
Compensation expense restricted stock
|
—
|
|
113
|
|
1,026
|
|
—
|
|
1,139
|
|
||||||||
|
Dividends on common stock
|
—
|
|
—
|
|
—
|
|
(5,865
|
)
|
(5,865
|
)
|
||||||||
|
Balance at December 31, 2014
|
14,539,104
|
|
$
|
10,090
|
|
$
|
93,828
|
|
$
|
181,880
|
|
$
|
285,798
|
|
||||
|
Net loss
|
—
|
|
—
|
|
—
|
|
(25,364
|
)
|
(25,364
|
)
|
||||||||
|
Vesting of restricted stock
|
41,112
|
|
(9
|
)
|
(70
|
)
|
—
|
|
(79
|
)
|
||||||||
|
Compensation expense restricted stock
|
—
|
|
271
|
|
2,436
|
|
—
|
|
2,707
|
|
||||||||
|
Dividends on common stock
|
—
|
|
—
|
|
—
|
|
(5,865
|
)
|
(5,865
|
)
|
||||||||
|
Balance at December 31, 2015
|
14,580,216
|
|
$
|
10,352
|
|
$
|
96,194
|
|
$
|
150,651
|
|
$
|
257,197
|
|
||||
The accompanying notes are an integral part of these financial statements.
F-4
GULF ISLAND FABRICATION, INC.
(in thousands)
|
|
Years Ended December 31,
|
||||||||||
|
|
2015
|
2014
|
2013
|
||||||||
|
Operating activities:
|
|||||||||||
|
Net (loss) income
|
$
|
(25,364
|
)
|
$
|
15,320
|
|
7,232
|
|
|||
|
Adjustments to reconcile net (loss) income to net cash provided by operating activities:
|
|||||||||||
|
Depreciation
|
26,204
|
|
26,436
|
|
25,087
|
|
|||||
|
Asset impairment
|
7,202
|
|
3,200
|
|
—
|
|
|||||
|
Allowance for doubtful accounts
|
448
|
|
3,168
|
|
887
|
|
|||||
|
(Loss) gain on the sale of assets
|
(10
|
)
|
86
|
|
353
|
|
|||||
|
Deferred income taxes
|
(14,061
|
)
|
8,264
|
|
3,788
|
|
|||||
|
Stock-based compensation expense
|
2,707
|
|
1,139
|
|
672
|
|
|||||
|
Excess tax benefits from share-based payment arrangements
|
—
|
|
—
|
|
(116
|
)
|
|||||
|
Changes in operating assets and liabilities:
|
|||||||||||
|
Contracts receivable, net
|
31,792
|
|
14,963
|
|
(55,353
|
)
|
|||||
|
Contract retainage
|
(52
|
)
|
111
|
|
1,187
|
|
|||||
|
Costs and estimated earnings in excess of billings on uncompleted contracts
|
14,167
|
|
(2,262
|
)
|
1,590
|
|
|||||
|
Billings in excess of costs and estimated earnings on uncompleted contracts
|
(11,685
|
)
|
(16,240
|
)
|
9,418
|
|
|||||
|
Accounts payable
|
(26,668
|
)
|
(25,782
|
)
|
16,569
|
|
|||||
|
Prepaid subcontractor costs
|
—
|
|
—
|
|
33,145
|
|
|||||
|
Prepaid expenses and other assets
|
1,092
|
|
352
|
|
(385
|
)
|
|||||
|
Inventory
|
931
|
|
1,189
|
|
(6,325
|
)
|
|||||
|
Accrued contract losses
|
8,678
|
|
817
|
|
(3,790
|
)
|
|||||
|
Accrued employee costs
|
(971
|
)
|
(154
|
)
|
1,854
|
|
|||||
|
Accrued expenses
|
(4,410
|
)
|
1,488
|
|
(1,462
|
)
|
|||||
|
Current income taxes
|
615
|
|
15
|
|
3,652
|
|
|||||
|
Net cash provided by operating activities
|
$
|
10,615
|
|
$
|
32,110
|
|
$
|
38,003
|
|
||
|
Cash flows from investing activities:
|
|||||||||||
|
Capital expenditures, net
|
(6,018
|
)
|
(27,658
|
)
|
(21,353
|
)
|
|||||
|
Proceeds on the sale of equipment
|
11
|
|
929
|
|
551
|
|
|||||
|
Net cash used in investing activities
|
(6,007
|
)
|
(26,729
|
)
|
(20,802
|
)
|
|||||
|
Cash flows from financing activities:
|
|||||||||||
|
Borrowings against notes payable
|
—
|
|
22,000
|
|
45,000
|
|
|||||
|
Payments on notes payable
|
—
|
|
(22,000
|
)
|
(45,000
|
)
|
|||||
|
Proceeds from exercise of stock options
|
—
|
|
—
|
|
203
|
|
|||||
|
Excess tax benefit from share-based payment arrangements
|
—
|
|
—
|
|
116
|
|
|||||
|
Payments of dividends on common stock
|
(5,865
|
)
|
(5,865
|
)
|
(5,839
|
)
|
|||||
|
Net cash used in financing activities
|
(5,865
|
)
|
(5,865
|
)
|
(5,520
|
)
|
|||||
|
Net (decrease) increase in cash and cash equivalents
|
(1,257
|
)
|
(484
|
)
|
11,681
|
|
|||||
|
Cash and cash equivalents at beginning of period
|
36,085
|
|
36,569
|
|
24,888
|
|
|||||
|
Cash and cash equivalents at end of period
|
$
|
34,828
|
|
$
|
36,085
|
|
$
|
36,569
|
|
||
|
Supplemental cash flow information:
|
|||||||||||
|
Interest paid
|
$
|
165
|
|
$
|
169
|
|
$
|
843
|
|
||
|
Income taxes (received) paid, net of payments (refunds)
|
$
|
(152
|
)
|
$
|
225
|
|
$
|
3,138
|
|
||
|
Schedule of noncash financing activities
|
|||||||||||
|
Reclassification of property, plant and equipment to assets held for sale
|
$
|
4,805
|
|
$
|
—
|
|
$
|
14,527
|
|
||
|
Reclassification of assets held for sale to inventory
|
$
|
3,727
|
|
$
|
—
|
|
$
|
—
|
|
||
The accompanying notes are an integral part of these financial statements.
F-5
GULF ISLAND FABRICATION, INC.
NOTES TO CONSOLIDATED FINANCIAL STATEMENTS
DECEMBER 31, 2015
1. ORGANIZATION AND SUMMARY OF SIGNIFICANT ACCOUNTING POLICIES
Basis of Presentation
Gulf Island Fabrication, Inc. ("Gulf Island"), and together with its subsidiaries, (the “Company”, “we” or “our”), is a leading fabricator of steel platforms and other specialized structures for customers in the offshore oil and gas industry. In addition, we also perform onshore and offshore construction and fabrication services for customers in the marine industry. Our principal markets are concentrated in the offshore regions and along the coast of the Gulf of Mexico. We currently provide our customers with what we believe to be the largest group of fabrication facilities serving the Gulf of Mexico market. The Company was incorporated in 1985 and began operations at our fabrication yard on the Houma Navigation Canal in southern Louisiana, approximately 30 miles from the Gulf of Mexico. Since our formation, we have expanded and grown our operations through acquisitions of additional facilities on the Houma Navigation Canal in southern Louisiana as well as
212
acres in Ingleside, Texas between the Gulf Intracoastal Waterway and Corpus Christi Ship Channel and
160
acres in Aransas Pass, Texas located along the U.S. Intracoastal Waterway. In October 2013, we moved our corporate headquarters to Houston, Texas. We continue to grow our operations and to diversify our business. On January 1, 2016, we acquired substantially all of the assets and assumed certain specified liabilities of LEEVAC Shipyards, L.L.C. and its affiliates (collectively, “LEEVAC”), through our newly formed wholly-owned subsidiary, Gulf Island Shipyards, L.L.C. in an all cash transaction. See further discussion of the LEEVAC acquisition as discussed in Note12 - "Subsequent Events".
Gulf Island serves as a holding company and conducts all of its operations through its subsidiaries, which include Gulf Island, L.L.C.; Gulf Marine Fabricators, L.P.; Gulf Island Marine Fabricators, L.L.C.; Gulf Island Shipyards, L.L.C.; Dolphin Services, L.L.C.; and Dolphin Steel Sales, L.L.C.
The consolidated financial statements include the accounts of Gulf Island Fabrication, Inc. and its majority owned subsidiaries. All significant intercompany balances and transactions have been eliminated in consolidation.
Operating Cycle
The lengths of our contracts vary, but are typically longer than one year in duration. Consistent with industry practice, assets and liabilities have been classified as current under the operating cycle concept whereby all contract-related items are regarded as current regardless of whether cash will be received or paid within a twelve month period. Assets and liabilities classified as current which may not be paid or received within the next twelve months include contract retainage, costs and estimated earnings in excess of billings on uncompleted contracts and billings in excess of costs and estimated earnings on uncompleted contracts. However, any variation from normal contract terms would cause classification of assets and liabilities as long-term.
Use of Estimates
The preparation of financial statements in conformity with accounting principles generally accepted in the United States (GAAP) requires management to make estimates and assumptions that affect the reported amounts of assets and liabilities and disclosure of contingent liabilities at the date of the financial statements and the reported amounts of revenue and expense during the reporting period. Areas requiring significant estimates by our management include asset impairments, value of assets held for sale, provisions for contract losses, contract revenues, costs and profits, the application of the percentage-of-completion method of accounting and the determination of the allowance of doubtful accounts. Actual results could differ from those estimates.
Reclassifications
We reclassified
$2.6 million
in deferred tax assets, current with deferred tax liabilities in our consolidated balance sheet as of December 31, 2014 to conform to current year balance sheet presentation. This reclassification had no impact to our previously reported results of operations or cash flows. See also New Accounting Standards discussion below.
Cash Equivalents
The Company considers all highly liquid investments with maturities of three months or less when purchased to be cash equivalents.
F-6
GULF ISLAND FABRICATION, INC.
NOTES TO CONSOLIDATED FINANCIAL STATEMENTS-(Continued)
Allowance for Doubtful Accounts
We routinely review individual contracts receivable balances and make provisions for probable doubtful accounts as we deem appropriate. Among the factors considered during the review are the financial condition of our customer and their access to financing, underlying disputes on the account, age and amount of the account and overall economic conditions. Accounts are written off only when all reasonable collection efforts are exhausted.
Our principal customers include major and large independent oil and gas companies and their contractors and marine vessel operators and their contractors. This concentration of customers may impact our overall exposure to credit risk, either positively or negatively, in that customers may be similarly affected by changes in economic or other conditions. Receivables are generally not collateralized. In the normal course of business, we extend credit to our customers on a short-term basis. See Note 3 - "Contracts Receivable and Retainage" for a detail of our allowance for doubtful accounts.
Stock-Based Compensation
Awards under the Company’s stock-based compensation plans are calculated using a fair value based measurement method. Share-based compensation expense for share based awards is recognized only for those awards that are expected to vest. We use the straight-line method to recognize share-based compensation expense over the requisite service period of the award.
Inventory
Inventory consists of materials and production supplies and is stated at the lower of cost or market determined on the first-in, first-out basis.
Assets Held for Sale
Assets held for sale are required to be measured at the lower of their carrying amount or fair value less cost to sell. See Note 5-“Fair Value Measurements and Assets Held for Sale” for additional information regarding our assets held for sale.
Workers Compensation Liability
The Company and its subsidiaries are self-insured for workers’ compensation liability except for losses in excess of varying threshold amounts. Our workers compensation liability balance was
$2.6 million
as of
December 31, 2015
and
$2.7 million
as of December 31,
2014
, respectively.
Property, Plant and Equipment
Property, plant and equipment is stated at cost less accumulated depreciation. Depreciation is computed on the straight-line basis over the estimated useful lives of the assets, which range from
3
to
25 years
. Ordinary maintenance and repairs, which do not extend the physical or economic lives of the plant or equipment, are charged to expense as incurred.
Long-Lived Assets
We evaluate impairment losses on long-lived assets or asset groups used in operations when events and circumstances indicate that the assets or asset groups might not be recoverable. If events and circumstance indicate that the assets or asset groups might not be recoverable, the expected future undiscounted cash flows from the assets or asset groups are estimated and compared with the carrying amount of the assets or asset groups. If the sum of the estimated undiscounted cash flows is less than the carrying amount of the assets or asset groups, an impairment loss is recorded.
An impairment loss is measured by comparing the fair value of the asset or asset group to its carrying amount and recording the excess of the carrying amount of the asset or asset group over its fair value as an impairment charge. An asset group constitutes the minimum level for which identifiable cash flows are principally independent of the cash flows of other asset or liability groups. Fair value is determined based on discounted cash flows or appraised values, as appropriate. Due to the slow down in our industry as a result of the downturn in oil prices, we identified indicators of impairment at our Texas facility. Management performed an undiscounted cash flow analysis for the Texas facility which did not result in impairment.
Fair Value Measurements
The Company bases its fair value determinations of the carrying value of other financial assets and liabilities on an evaluation of their particular facts and circumstances and valuation techniques that require judgments and estimates. We base our fair value determinations by applying the following hierarchy, which prioritizes the inputs used to measure fair value into
F-7
GULF ISLAND FABRICATION, INC.
NOTES TO CONSOLIDATED FINANCIAL STATEMENTS-(Continued)
three levels and bases the categorization within the hierarchy upon the lowest level of input that is available and significant to the fair value measurement:
|
•
|
Level 1-inputs are based upon quoted prices for identical instruments traded in active markets.
|
|
•
|
Level 2-inputs are based upon quoted prices for similar instruments in active markets and model-based valuation techniques for which all significant assumptions are observable in the market.
|
|
•
|
Level 3-inputs are generally unobservable and typically reflect management’s estimates of assumptions that market participants would use in pricing the asset or liability. These include discounted cash flow models and similar valuation techniques.
|
See Note 5-“Fair Value Measurements and Assets Held for Sale” for additional information regarding fair value measurements.
Revenue Recognition
We use the percentage-of-completion accounting method for fabrication contracts. Revenue from fixed-price or unit rate contracts is recognized on the percentage-of-completion method, computed by the efforts-expended method which measures the percentage of labor hours incurred to date as compared to estimated total labor hours for each contract. This progress percentage is applied to our estimate of total anticipated gross profit for each contract to determine gross profit earned to date. Revenue recognized in a period for a contract is the amount of gross profit earned for that period plus the costs incurred on the contract during the period. Under a unit rate contract, material items or labor tasks are assigned unit rates of measure. The unit rates of measure will generally be an amount of dollars per ton, per foot, per square foot or per item installed. A typical unit rate contract can contain hundreds to thousands of unit rates of measure. Profit margins are built into the unit rates.
Profit incentives are included in revenue when their realization is probable. Claims for extra work or changes in scope of work are included in revenue when the amount can be reliably estimated and collection is probable. Changes in job performance, job conditions, and estimated profitability, including those arising from contract penalty provisions, and final contract settlements may result in revisions to costs and income and are recognized in the period in which the revisions are determined. For the years ended
December 31, 2015
,
2014
, and
2013
, there was no significant revenue related to unapproved change orders or claims.
Some contracts include a total or partial reimbursement to us of any costs associated with specific capital projects required by the fabrication process. If a particular capital project provides future benefits to us, the cost to build the capital project will be capitalized, and the revenue for the capital project will increase the estimated profit in the contract.
See Note 2-“Contract Revenue” for additional information regarding our percentage-of-completion accounting and revenue recognition.
Income Taxes
Income taxes have been provided using the liability method. Deferred income taxes reflect the net tax effects of temporary differences between the carrying amounts of assets and liabilities for financial reporting purposes and the amounts used for income tax purposes using enacted rates expected to be in effect during the year in which the basis differences reverse. A valuation allowance is provided to reserve for deferred tax assets if, based upon the available evidence, it is more likely than not that some or all of the deferred tax assets will not be realized.
Reserves for uncertain tax positions are recognized when the positions are more likely than not to not be sustained upon audit. Interest and penalties on uncertain tax positions are recorded in income tax expense. Our federal tax returns have been examined and settled through the 2011 tax year. There were no material uncertain tax positions recorded for the years presented in these statements. See also Note 8 - "Income Taxes"
New Accounting Standards
In November 2015, the Financial Accounting Standards Board (FASB), issued Accounting Standards Update (ASU) No. 2015-17, “Balance Sheet Classification of Deferred Taxes” (Topic 740). Prior to implementation of this update, entities are required to separate deferred tax assets and liabilities into current and noncurrent amounts on their balance sheet. However, upon implementation of this update, entities will be required to present deferred tax liabilities and assets as noncurrent on their balance sheet. The provisions of this update are applicable to us on January 1, 2017; however, we have elected to early adopt the provisions of this statement as permitted during the fourth quarter of 2015. As a result of this implementation, we
F-8
GULF ISLAND FABRICATION, INC.
NOTES TO CONSOLIDATED FINANCIAL STATEMENTS-(Continued)
reclassified
$2.6 million
in current deferred tax assets as of December 31, 2014 with our deferred tax liabilities as noncurrent. Implementation of this update had no impact to our results of operations or cash flows for any of the periods presented. See also Note 8 - “Income Taxes.”
On May 28, 2014, the FASB issued ASU No. 2014-09, “Revenue from Contracts with Customers” (Topic 606), which supersedes the revenue recognition requirements in FASB Accounting Standard Codification (ASC) Topic 605, “Revenue Recognition.” ASU No. 2014-09 requires entities to recognize revenue in a way that depicts the transfer of promised goods or services to customers in an amount that reflects the consideration to which the entity expects to be entitled in exchange for those goods or services. ASU 2014-09 requires retrospective application and will be effective for financial statements issued for fiscal years beginning after December 15, 2017, and interim periods within those fiscal years. Early application is not permitted. The Company is evaluating the effect of this new standard on its financial statements.
2. CONTRACT REVENUE AND PERCENTAGE OF COMPLETION METHOD
Information with respect to uncompleted contracts as of December 31, is as follows (in thousands):
|
2015
|
2014
|
||||||
|
Costs incurred on uncompleted contracts
|
$
|
437,658
|
|
$
|
742,608
|
|
|
|
Estimated profit earned to date
|
7,777
|
|
53,551
|
|
|||
|
445,435
|
|
796,159
|
|
||||
|
Less billings to date
|
439,694
|
|
787,936
|
|
|||
|
$
|
5,741
|
|
$
|
8,223
|
|
||
The above amounts are included in the accompanying consolidated balance sheets at December 31 under the following captions (in thousands):
|
2015
|
2014
|
||||||
|
Costs and estimated earnings in excess of billings on uncompleted contracts
|
$
|
12,822
|
|
$
|
26,989
|
|
|
|
Billings in excess of costs and estimated earnings on uncompleted contracts
|
(7,081
|
)
|
(18,766
|
)
|
|||
|
$
|
5,741
|
|
$
|
8,223
|
|
||
Provision for estimated losses
Provisions for estimated losses on uncompleted contracts are made in the period in which such losses are determined. We recognized contract losses of
$33.9 million
,
$6.6 million
, and
$30.8 million
in the years ended
December 31, 2015
,
2014
, and
2013
, respectively. Contract losses for the year ended December 31, 2015 were primarily due to
$24.5 million
related to a decrease in the contract price due to final weight re-measurements and our inability to recover certain costs on disputed change orders related to a large deepwater project which was recently delivered. In addition we increased accrued contract losses associated with our remaining contracts by approximately
$9.4 million
during 2015 due to increases in our projected unit labor rates of our fabrication facilities. Our increases in unit labor rates were driven by our inability to absorb fixed costs due to decreases in expected oil and gas fabrication activity. Contract losses for the year ended December 31, 2014 were primarily related to
two
tank barge projects for a marine transportation company, platform supply vessels for an offshore marine company and a production platform jacket for a deepwater customer. Contract losses in 2013 were primarily due to our inability to recover certain costs and the de-scoping of one of our major deepwater project, whereby remaining completion and integration work was performed at the integration site by a different integration contractor. In addition, we recorded an additional loss provision of
$18.2 million
in the fourth quarter of 2013 related to this project.
F-9
GULF ISLAND FABRICATION, INC.
NOTES TO CONSOLIDATED FINANCIAL STATEMENTS-(Continued)
Revenues from Major Customers
The Company is not dependent on any one customer, and the revenue earned from each customer varies from year to year based on the contracts awarded; however, the Company is highly dependent on a few large customers in each year, particularly customers for our major deepwater projects, as shown below. Revenues from customers comprising
10%
or more of the Company’s total revenue for the years ended
December 31, 2015
,
2014
and
2013
, respectively, are summarized as follows (in thousands):
|
Customer
|
2015
|
2014
|
2013
|
|||||||
|
A
|
$
|
55,775
|
|
$
|
160,173
|
|
*
|
|
||
|
B
|
36,320
|
|
*
|
|
*
|
|
||||
|
C
|
*
|
|
98,644
|
|
*
|
|
||||
|
D
|
*
|
|
*
|
|
216,875
|
|
||||
|
E
|
*
|
|
*
|
|
148,539
|
|
||||
|
*
|
The customer revenue was less than 10% of the total revenue for the year.
|
International Revenues
The Company’s fabricated structures are used worldwide by U.S. customers operating abroad and by foreign customers. Revenues related to fabricated structures for delivery outside of the United States accounted for
6%
,
10%
, and
6%
of the Company’s revenues for the years ended
December 31, 2015
,
2014
and
2013
, respectively, as follows (in thousands):
|
|
2015
|
2014
|
2013
|
||||||||
|
Location:
|
|||||||||||
|
United States
|
$
|
287,892
|
|
$
|
456,839
|
|
$
|
570,726
|
|
||
|
International
|
18,228
|
|
49,800
|
|
37,600
|
|
|||||
|
Total
|
$
|
306,120
|
|
$
|
506,639
|
|
$
|
608,326
|
|
||
Contract Costs
Contract costs include all direct material, labor and subcontract costs and those indirect costs related to contract performance, such as indirect labor, supplies and tools. Also included in contract costs are a portion of those indirect contract costs related to plant capacity, such as depreciation, insurance and repairs and maintenance. These indirect costs are allocated to jobs based on actual direct labor hours incurred.
We define pass-through costs as material, freight, equipment rental, and sub-contractor services included in the direct costs of revenue associated with projects. Pass-through costs have no impact in the determination of gross margin recognized for the related project for a particular period. Pass-through costs as a percentage of revenue were
44.4%
,
48.2%
and
58.5%
for the years ended
December 31, 2015
,
2014
and
2013
, respectively.
Some of our contracts contain provisions that require us to pay liquidated damages if we are responsible for the failure to meet specified contractual milestone dates and the applicable customer asserts a claim under those provisions. Those contracts define the conditions under which our customers may make claims against us for liquidated damages. In 2014, we had
one
asserted liquidated damages claim in the amount of
$0.3 million
that was fully settled, related to the fabrication of an offshore supply vessel. Other than the aforementioned claim, as of March 9, 2016, we were not aware of any asserted or unasserted liquidated damage claims by any of our customers.
F-10
GULF ISLAND FABRICATION, INC.
NOTES TO CONSOLIDATED FINANCIAL STATEMENTS-(Continued)
3. CONTRACTS RECEIVABLE AND RETAINAGE
Of our contracts receivable balance at
December 31, 2015
,
$29.9 million
, or
63.7%
, is for
six
customers. Amounts due on contracts as of December 31 were as follows (in thousands):
|
2015
|
2014
|
||||||
|
Completed contracts
|
|||||||
|
Current receivables
|
$
|
15,904
|
|
$
|
24,667
|
|
|
|
Long term receivables due after one year
|
—
|
|
—
|
|
|||
|
Contracts in progress:
|
|||||||
|
Current receivables
|
31,148
|
|
59,384
|
|
|||
|
Retainage due within one year
|
52
|
|
—
|
|
|||
|
47,104
|
|
84,051
|
|
||||
|
Less allowance for doubtful accounts
|
44
|
|
3,603
|
|
|||
|
$
|
47,060
|
|
$
|
80,448
|
|
||
Our allowance for doubtful accounts as of December 31, 2015 related to a customer that had declared bankruptcy and was fully reserved in 2015. Our allowance for doubtful accounts as of December 31, 2014 was in connection with negotiations of an outstanding contract receivable balance with a customer related to a deepwater hull project, which was written off in 2013.
4. PROPERTY, PLANT AND EQUIPMENT
Property, plant and equipment consisted of the following at December 31, (in thousands):
|
Estimated
Useful Life
|
2015
|
2014
|
||||||||
|
|
(in Years)
|
|
|
|||||||
|
Land
|
-
|
|
$
|
10,463
|
|
$
|
10,463
|
|
||
|
Buildings
|
25
|
|
64,154
|
|
63,837
|
|
||||
|
Machinery and equipment
|
3 to 25
|
|
223,521
|
|
228,284
|
|
||||
|
Furniture and fixtures
|
3 to 5
|
|
5,354
|
|
5,354
|
|
||||
|
Transportation equipment
|
3 to 5
|
|
3,481
|
|
3,748
|
|
||||
|
Improvements
|
15
|
|
127,727
|
|
125,265
|
|
||||
|
Construction in progress
|
-
|
|
2,488
|
|
1,177
|
|
||||
|
437,188
|
|
438,128
|
|
|||||||
|
Less accumulated depreciation
|
236,804
|
|
213,351
|
|
||||||
|
$
|
200,384
|
|
$
|
224,777
|
|
|||||
We lease certain equipment used in the normal course under month-to-month lease agreements cancelable only by us. During
2015
,
2014
, and
2013
, we expensed
$5.9 million
,
$5.6 million
, and
$9.5 million
, respectively, related to these leases.
We lease our corporate office and parking facilities located in Houston, Texas. Leased premises consist of office space of approximately
8,000
square feet. The term of the lease matures on
January 31, 2020
. The schedule of minimum rental payments for our corporate office leases is as follows (in thousands):
|
2016
|
$
|
217
|
|
|
2017
|
221
|
|
|
|
2018
|
225
|
|
|
|
2019
|
229
|
|
|
|
2020
|
19
|
|
|
|
Total
|
$
|
911
|
|
F-11
GULF ISLAND FABRICATION, INC.
NOTES TO CONSOLIDATED FINANCIAL STATEMENTS-(Continued)
5. FAIR VALUE MEASUREMENTS AND ASSETS HELD FOR SALE
Recurring fair value measurements and financial instruments
-
The carrying amounts that we have reported for financial instruments, including cash and cash equivalents, accounts receivables and accounts payables approximate their fair values.
Assets held for sale
- We measure and record assets held for sale at the lower of their carrying amount or fair value less cost to sell. The determination of fair value can require the use of significant judgment and can vary on the facts and circumstances.
Assets held for sale at December 31, 2015 consist of equipment that was subsequently sold during the first quarter of 2016. We estimated the fair value as the actual cash proceeds received less costs incurred to sell. We recorded an impairment of
$0.6 million
related to this equipment during the fourth quarter of 2015.
Assets held for sale at December 31, 2014 consisted of a partially constructed topside, related valves, piping and equipment that we acquired from a customer following its default under a contract for a deepwater project in 2012. We previously determined a fair value
$10.3 million
for these assets with the assistance of third party valuation specialists, relying primarily on the cost approach and applied the market approach where comparable sales transaction information was readily available. The cost approach is based on current replacement or reproduction costs of the subject assets less depreciation attributable to physical, functional, and economic factors. The market approach involves gathering data on sales and offerings of similar assets in order to value the subject assets. This approach also includes an assumption for the measurement of the loss in value from physical, functional, and economic factors.
To date, we have not sold, licensed, or leased any of this equipment. While we have not discontinued our programs to identify buyers for our assets held for sale, our ability to effectively market these assets held for sale has been significantly limited due to the sustained downturn in the energy sector. In addition, during the third quarter, we learned that a potential buyer is no longer expressing interest in the assets. As a result, we reassessed our estimate of fair value and recorded an impairment of
$6.6 million
, and reclassified the asset’s net realizable value of
$3.7 million
to inventory based on the estimated scrap value of these materials during the third quarter of 2015. We intend to use this inventory on future construction projects at our various fabrication facilities. Inventory consists of materials and production supplies and is stated at the lower of cost or market.
During the fourth quarter of 2014, management determined that its previous estimate of
$13.5 million
for the fair value of assets held for sale had declined to
$10.3 million
and we recorded an impairment charge of
$3.2 million
for the year ended December 31, 2014.
We have determined that our impairments of assets held for sale and inventory are non-recurring fair value measurements that fall within Level 3 of the fair value hierarchy.
F-12
GULF ISLAND FABRICATION, INC.
NOTES TO CONSOLIDATED FINANCIAL STATEMENTS-(Continued)
6. EARNINGS PER SHARE AND STOCK REPURCHASE PLAN
The following table sets forth the computation of basic and diluted earnings per share (in thousands, except per share data):
|
2015
|
2014
|
2013
|
|||||||||
|
Numerator:
|
|||||||||||
|
Net (loss) income
|
$
|
(25,364
|
)
|
$
|
15,320
|
|
$
|
7,232
|
|
||
|
Less: distributed loss / distributed and undistributed income (unvested restricted stock)
|
84
|
|
104
|
|
75
|
|
|||||
|
Net (loss) income attributable to common shareholders
|
$
|
(25,448
|
)
|
$
|
15,216
|
|
$
|
7,157
|
|
||
|
Denominator (basic):
|
|||||||||||
|
Denominator for basic earnings per share-weighted-average shares
|
14,546
|
|
14,505
|
|
14,463
|
|
|||||
|
Basic (loss) earnings per share—common shareholders
|
$
|
(1.75
|
)
|
$
|
1.05
|
|
$
|
0.50
|
|
||
|
Denominator (diluted):
|
|||||||||||
|
Denominator for basic earnings per share-weighted-average shares
|
14,546
|
|
14,505
|
|
14,463
|
|
|||||
|
Effect of dilutive securities: employee stock options
|
—
|
|
—
|
|
6
|
|
|||||
|
Denominator for dilutive earnings per share-weighted-average shares
|
14,546
|
|
14,505
|
|
14,469
|
|
|||||
|
Diluted (loss) earnings per share—common shareholders
|
$
|
(1.75
|
)
|
$
|
1.05
|
|
$
|
0.50
|
|
||
On July 30, 2015, our Board of Directors authorized the Company to repurchase up to
$10.0 million
in shares of our common stock under a share repurchase program that remains in effect through July 30, 2017. Repurchases may be effected through open market purchases or in privately negotiated transactions at such times and in such amounts as management deems appropriate, depending on market conditions and other factors. The repurchase program does not obligate the Company to acquire any particular amount of common stock and may be modified, suspended or discontinued at any time. To date, we have made no repurchases of our common stock. Due to the severity of the industry downturn, management has recommended and our board of directors has approved a temporary suspension of our stock repurchase program in an effort to conserve cash.
7. LINE OF CREDIT
We have a credit agreement with Whitney Bank and JPMorgan Chase Bank N.A. that provides for an
$80.0 million
revolving credit facility. The credit agreement allows the Company to use up to the full amount of the available borrowing base for letters of credit and up to
$20.0 million
for general corporate purposes. Our obligations under the credit agreement are secured by substantially all of our assets, other than real property located in the state of Louisiana. On February 29, 2016, we entered into an amendment to our credit agreement. The amendment restates our financial covenants beginning with the quarter ending March 31, 2016 as follows:
|
(i)
|
minimum net worth requirement of not less than
$250.0 million
plus
|
|
a)
|
50%
of net income earned in each quarter beginning March 31, 2016 and
|
|
b)
|
100%
of proceeds from any issuance of common stock;
|
|
(ii)
|
debt to EBITDA ratio not greater than
3.0
to 1.0; and
|
|
(iii)
|
interest coverage ratio not less than
2.0
to 1.0.
|
The amendment also (i) extends the term of the Credit Facility from February 29, 2016 to January 2, 2017; (ii) increases the commitment fee on undrawn amounts from
0.25%
to
0.50%
per annum; (iii) increases the letter of credit fee, subject to certain limited exceptions, to
2.0%
per annum on undrawn stated amounts under letters of credit issued by the lenders; and (iv) limits the maximum amount of loans outstanding at any time for general corporate purposes to
$20.0 million
.
At December 31, 2015 we had
no
outstanding borrowings under the credit agreement, and we had outstanding letters of credit totaling $
20.5 million
. After consideration of outstanding letters of credit, the availability of the unused portion of the revolving credit agreement (as amended) for additional letters of credit and for general corporate purposes was
$59.5 million
F-13
GULF ISLAND FABRICATION, INC.
NOTES TO CONSOLIDATED FINANCIAL STATEMENTS-(Continued)
and $
20.0 million
, respectively. Amounts borrowed under our the credit agreement bear interest, at our option, at either the prime lending rate established by JPMorgan Chase Bank, N.A. or LIBOR plus
2.0 percent
.
We are required to maintain certain financial covenants under the credit agreement. As of December 31, 2015, our financial covenants included (i) a minimum current ratio of
1.25
to 1.0, (ii) a net worth minimum requirement of
$254.1 million
, (iii) debt to net worth ratio of not greater than
0.5
to 1.0, and (iv) interest coverage ratio of not less than
4.0
to 1.0. As of December 31, 2015, we were in compliance with all of these covenants or had obtained a waiver of noncompliance.
8. INCOME TAXES
Significant components of the Company’s deferred tax assets and liabilities as of December 31 were as follows (in thousands):
|
2015
|
2014
|
||||||
|
Deferred tax liabilities:
|
|||||||
|
Property, plant and equipment
|
$
|
31,943
|
|
$
|
38,070
|
|
|
|
Prepaid insurance
|
1,209
|
|
1,310
|
|
|||
|
Total deferred tax liabilities:
|
33,152
|
|
39,380
|
|
|||
|
Deferred tax assets:
|
|||||||
|
Employee benefits
|
924
|
|
951
|
|
|||
|
Uncompleted contracts
|
3,321
|
|
391
|
|
|||
|
Stock based compensation expense
|
825
|
|
43
|
|
|||
|
Allowance for uncollectible accounts
|
16
|
|
1,261
|
|
|||
|
Federal net operating loss
|
5,478
|
|
—
|
|
|||
|
AMT tax credits
|
763
|
|
—
|
|
|||
|
Total deferred tax assets:
|
11,327
|
|
2,646
|
|
|||
|
Net deferred tax liabilities:
|
$
|
21,825
|
|
$
|
36,734
|
|
|
Significant components of income tax expense for the years ended December 31 were as follows (in thousands):
|
2015
|
2014
|
2013
|
|||||||||
|
Current:
|
|||||||||||
|
Federal
|
$
|
219
|
|
$
|
(105
|
)
|
$
|
—
|
|
||
|
State
|
473
|
|
459
|
|
254
|
|
|||||
|
Total current
|
692
|
|
354
|
|
254
|
|
|||||
|
Deferred:
|
|||||||||||
|
Federal
|
(13,614
|
)
|
8,120
|
|
4,049
|
|
|||||
|
State
|
(447
|
)
|
30
|
|
—
|
|
|||||
|
Total deferred
|
(14,061
|
)
|
8,150
|
|
4,049
|
|
|||||
|
Income taxes
|
$
|
(13,369
|
)
|
$
|
8,504
|
|
$
|
4,303
|
|
||
A reconciliation of income taxes computed at the U.S. federal statutory tax rate to the Company’s income tax (benefit) expense for the years ended December 31 is as follows (in thousands):
|
2015
|
%
|
2014
|
%
|
2013
|
%
|
|||||||||||||||
|
U.S. statutory rate
|
$
|
(13,556
|
)
|
35.0
|
%
|
$
|
8,338
|
|
35.0
|
%
|
$
|
4,037
|
|
35.0
|
%
|
|||||
|
Increase (decrease) resulting from:
|
||||||||||||||||||||
|
State income taxes
|
275
|
|
(0.7
|
)%
|
311
|
|
1.0
|
%
|
317
|
|
2.7
|
%
|
||||||||
|
Qualified Production Activities
|
—
|
|
—
|
%
|
(21
|
)
|
(0.1
|
)%
|
—
|
|
—
|
%
|
||||||||
|
Other
|
(88
|
)
|
0.2
|
%
|
(124
|
)
|
(0.2
|
)%
|
(51
|
)
|
(0.4
|
)%
|
||||||||
|
Income tax (benefit) expense
|
$
|
(13,369
|
)
|
34.5
|
%
|
$
|
8,504
|
|
35.7
|
%
|
$
|
4,303
|
|
37.3
|
%
|
|||||
F-14
GULF ISLAND FABRICATION, INC.
NOTES TO CONSOLIDATED FINANCIAL STATEMENTS-(Continued)
9. RETIREMENT AND LONG-TERM INCENTIVE PLANS
401(k) Plan
The Company has a defined contribution plan for all employees that are qualified under Section 401(k) of the Internal Revenue Code. Gulf Island Resources employees are not eligible for the retirement plan. Contributions to the retirement plan by the Company are based on the participants’ contributions, with an additional year-end discretionary contribution determined by the Board of Directors. For the years ended
December 31, 2015
,
2014
and 2013, the Company contributed a total of
$2.3 million
,
$2.6 million
, and
$2.7 million
, respectively.
Long-Term Incentive Plans
Under our long-term incentive plans, the compensation committee of our board of directors may award shares of restricted stock and/or options to eligible participants as the compensation committee determines are warranted. A summary of our long-term incentive plans is as follows:
Long-Term Incentive Plan (approved by our shareholders on February 13, 1997)
|
•
|
authorizes the grant of options to purchase an aggregate of
1,000,000
(split adjusted) shares of the Company’s common stock to certain officers, key employees, directors and consultants of the Company chosen by the compensation committee.
|
|
•
|
No individual employee may be granted options to purchase more than an aggregate of
400,000
shares of common stock.
|
2002 Long-Term Incentive Plan (approved by our shareholders on April 24, 2002, and amended on April 26, 2006).
|
•
|
authorizes the grant of awards, including options, to purchase an aggregate of
500,000
shares of the Company’s common stock to certain officers, key employees, directors and consultants of the Company chosen by the compensation committee.
|
|
•
|
no individual employee may be granted options to purchase more than an aggregate of
200,000
shares of common stock.
|
2011 Stock Incentive Plan (approved by our shareholders on April 28, 2011)
|
•
|
authorizes the grant of awards, including options, to purchase an aggregate of
500,000
shares of the Company’s common stock to certain officers, key employees, directors and consultants of the Company chosen by the compensation committee.
|
|
•
|
no individual employee may be granted options to purchase more than an aggregate of
200,000
shares of common stock.
|
2015
Stock Incentive Plan (approved by our shareholders on April 23,2015)
|
•
|
authorizes the grant of awards, including options, to purchase an aggregate of
1,000,000
shares of the Company’s common stock to certain officers, key employees, directors and consultants of the Company chosen by the compensation committee.
|
|
•
|
no individual employee may be granted options to purchase more than an aggregate of
200,000
shares of common stock and no outside director may receive awards that relate to more than
25,000
shares in any fiscal year.
|
At
December 31, 2015
, there were approximately
1,345,887
shares in the aggregate remaining available for future issuance under the Long-Term Incentive Plan, the 2002 Long-Term Incentive Plan, the 2011 Stock Incentive Plan and the 2015 Stock Incentive Plan (together, the “Incentive Plans”). The Company issues new shares through its transfer agent upon stock option exercises or restricted share issuances.
Restricted Stock Awards
Awards of restricted stock are subject to transfer restrictions, forfeit provisions and other terms and conditions subject to the provisions of our long-term incentive plans. At the time an award of restricted stock is made, the compensation committee will establish a period of time during which the transfer of the shares of restricted stock shall be restricted and after which the shares of restricted stock shall be vested. Except for the shares of restricted stock that vest based on the attainment of performance goals, the restricted period shall be a minimum of
three years
, with incremental vesting of portions of the award over the three-year period permitted.
F-15
GULF ISLAND FABRICATION, INC.
NOTES TO CONSOLIDATED FINANCIAL STATEMENTS-(Continued)
Our long-term incentive plans do not have any limitations on the amount of shares that can be specifically awarded as restricted stock. Restricted stock granted to our non-employee directors have
six
-month vesting periods. The fair value of restricted stock is determined based on the closing price of the Company’s common stock on the date of the grant.
A summary of our restricted stock awards activity for the years ended December 31, 2015, 2014 and 2013 is presented in the table below.
|
2015
|
2014
|
2013
|
||||||||||||||||||
|
Number
of Shares
|
Weighted-
Average
Grant-Date
Fair Value
Per Share
|
Number
of Shares
|
Weighted-
Average
Grant-Date
Fair Value
Per Share
|
Number
of Shares
|
Weighted-
Average
Grant-Date
Fair Value
Per Share
|
|||||||||||||||
|
Restricted shares at the beginning of period
|
107,840
|
|
$
|
24.27
|
|
178,950
|
|
$
|
24.00
|
|
143,150
|
|
$
|
24.28
|
|
|||||
|
Granted
|
215,034
|
|
16.33
|
|
6,000
|
|
23.19
|
|
100,150
|
|
23.22
|
|
||||||||
|
Vested
|
(41,112
|
)
|
22.04
|
|
(45,356
|
)
|
23.35
|
|
(38,188
|
)
|
23.14
|
|
||||||||
|
Forfeited
|
(18,798
|
)
|
21.39
|
|
(31,754
|
)
|
23.85
|
|
(26,162
|
)
|
23.82
|
|
||||||||
|
Restricted shares at the end of period
|
262,964
|
|
$
|
18.33
|
|
107,840
|
|
$
|
24.27
|
|
178,950
|
|
$
|
24.00
|
|
|||||
As of
December 31, 2015
, there was
$3.0 million
of total unrecognized compensation cost related to restricted share-based compensation arrangements granted under the Incentive Plans. This cost is expected to be recognized over a weighted-average period of
3.6
years. The total fair value of shares vested during the year ended
December 31, 2015
was
$0.6 million
.
Share-based compensation cost that has been charged against income for the Incentive Plans was
$2.7 million
,
$1.1 million
and
$0.7 million
for
2015
,
2014
and
2013
, respectively. The total income tax benefit recognized in the income statement for share-based compensation arrangements was
$0
,
$49,000
and
$116,000
for
2015
,
2014
and
2013
, respectively.
Performance based share awards
We issue performance based share awards to our executives and certain members of management. Performance targets are communicated to employees at the beginning of a performance period and are based upon our total shareholder return compared to an industry peer group as determined by our Board of Directors. There were
no
performance based share awards for the years ended December 31, 2014 and 2013. Awards earned for 2015 will be based upon a two-year performance period ending in 2017, and awards earned for 2016 will be based upon a three-year performance period ending in 2018. The shares vest at the completion of the performance period with compensation expense recognized on a straight line basis.
For the years ended December 31, 2015, 2014 and 2013, expense recognized for performance based share compensation was
$1.1 million
,
$0
and
$0
, respectively. The fair value of the performance based shares granted for the year ended December 31, 2015 was
$2.7 million
as determined using a monte carlo simulation model.
10. CONTINGENCIES AND COMMITMENTS
The Company is subject to various routine legal proceedings in the normal conduct of its business, primarily involving commercial claims, workers’ compensation claims, and claims for personal injury under general maritime laws of the United States and the Jones Act. While the outcome of these lawsuits, legal proceedings and claims cannot be predicted with certainty, management believes that the outcome of any such proceedings, even if determined adversely
,
would not have a material adverse effect on the financial position, results of operations or cash flows of the Company.
F-16
GULF ISLAND FABRICATION, INC.
NOTES TO CONSOLIDATED FINANCIAL STATEMENTS-(Continued)
11. QUARTERLY OPERATING RESULTS (UNAUDITED)
A summary of quarterly results of operations for the years ended
December 31, 2015
and
2014
were as follows (in thousands, except per share data):
|
March 31,
2015
|
June 30,
2015
|
September 30,
2015 (a)
|
December 31,
2015 (a)
|
||||||||||||
|
Revenue
|
$
|
99,233
|
|
$
|
84,338
|
|
$
|
67,531
|
|
$
|
55,018
|
|
|||
|
Gross profit (loss)
|
4,448
|
|
5,805
|
|
(7,837
|
)
|
(17,572
|
)
|
|||||||
|
Net income (loss)
|
83
|
|
1,357
|
|
(12,137
|
)
|
(14,667
|
)
|
|||||||
|
Basic and fully diluted EPS
|
—
|
|
0.09
|
|
(0.84
|
)
|
(1.01
|
)
|
|||||||
|
March 31,
2014
|
June 30,
2014
|
September 30,
2014
|
December 31,
2014 (b)
|
||||||||||||
|
Revenue
|
$
|
134,690
|
|
$
|
129,169
|
|
$
|
118,020
|
|
$
|
124,760
|
|
|||
|
Gross profit (loss)
|
8,773
|
|
10,322
|
|
14,653
|
|
10,808
|
|
|||||||
|
Net income (loss)
|
3,535
|
|
4,310
|
|
7,586
|
|
(111
|
)
|
|||||||
|
Basic and fully diluted EPS
|
0.24
|
|
0.30
|
|
0.52
|
|
(0.01
|
)
|
|||||||
|
(a)
|
During the third quarter of 2015, we recorded contract losses of
$14.3 million
as a result of our inability to recover certain costs related to a deck and jacket for one of our large deepwater projects, and we recorded an impairment of
$6.6 million
related to assets held for sale. During the fourth quarter of 2015, we recorded additional contract losses of
$10.3 million
related to a decrease in the contract price due to final weight re-measurements and our inability to recover certain costs on disputed change orders related to a large deepwater project which was recently delivered. In addition, during the fourth quarter of 2015, we accrued contract losses of approximately
$7.6 million
resulting from increases in our projected unit labor rates of our fabrication facilities. Our increases in unit labor rates were driven by our inability to absorb fixed costs due to decreases in expected oil and gas fabrication activity.
|
|
(b)
|
We recognized an impairment charge of
$3.2 million
related to a reduction in the fair value of assets held for sale and a
$3.6 million
charge related to an increase in the allowance for doubtful accounts for negotiations of an outstanding contract receivable balance during the fourth quarter of 2014.
|
12. SUBSEQUENT EVENTS
LEEVAC Acquisition
On January 1, 2016, we acquired substantially all of the assets and assumed certain specified liabilities of LEEVAC Shipyards, L.L.C. and its affiliates ("LEEVAC"). The purchase price for the acquisition was
$20.0 million
, subject to a working capital adjustment whereby we received at closing a dollar for dollar reduction for the assumption of certain net liabilities of LEEVAC and settlement payments from sureties on certain ongoing fabrication projects that were assigned to us in the acquisition. After taking into account these adjustments, we received approximately
$1.6 million
in cash at closing.
Dividends
On
February 25, 2016
, our Board of Directors declared a dividend of
$0.01
per share on the shares of our common stock outstanding, payable
March 24, 2016
to shareholders of record on
March 10, 2016
.
F-17
SIGNATURES
Pursuant to the requirements of Section 13 or 15(d) of the Securities Exchange Act of 1934, the registrant has duly caused this report to be signed on its behalf by the undersigned, thereunto duly authorized, on March 9, 2016.
|
GULF ISLAND FABRICATION, INC.
(Registrant)
|
||
|
By:
|
/S/ KIRK J. MECHE
|
|
|
|
Kirk J. Meche
|
|
|
|
President and Chief Executive Officer
|
|
Pursuant to the requirements of the Securities Exchange Act of 1934, this report has been signed below by the following persons on behalf of the registrant and in the capacities indicated on March 9, 2016.
|
Signature
|
|
Title
|
|
/S/ KIRK J. MECHE
|
President, Chief Executive Officer and Director
(Principal Executive Officer)
|
|
|
Kirk J. Meche
|
|
|
|
/S/ JEFFREY M. FAVRET
|
Executive Vice President, Chief Financial Officer, Treasurer, and Secretary (Principal Financial and Accounting Officer)
|
|
|
Jeffrey M. Favret
|
|
|
|
/S/ MURRAY W. BURNS
|
|
Director
|
|
Murray W. Burns
|
||
|
/S/ WILLIAM E. CHILES
|
|
Director
|
|
William E. Chiles
|
||
|
/S/ GREGORY J. COTTER
|
|
Director
|
|
Gregory J. Cotter
|
||
|
/S/ JERRY D. DUMAS, Sr.
|
|
Director
|
|
Jerry D. Dumas, Sr.
|
||
|
/S/ MICHAEL A. FLICK
|
|
Director
|
|
Michael A. Flick
|
||
|
/S/ CHRISTOPHER M. HARDING
|
|
Director
|
|
Christopher M. Harding
|
||
|
/S/ MICHAEL J. KEEFFE
|
|
Director
|
|
Michael J. Keeffe
|
||
|
/S/ JOHN P. LABORDE
|
|
Chairman of the Board
|
|
John P. Laborde
|
||
S-1
GULF ISLAND FABRICATION, INC.
EXHIBIT INDEX
|
EXHIBIT
NUMBER
|
|
|
|
2.1
|
|
Asset Purchase Agreement, dated December 23, 2015, among the Company, LEEVAC and certain other parties thereto, incorporated by reference to Exhibit 2.1 of the Company’s Form 8-K filed December 23, 2015.
|
|
3.1
|
|
Composite Articles of Incorporation of the Company incorporated by reference to Exhibit 3.1 of the Company’s Form 10-Q filed April 23, 2009.
|
|
3.2
|
|
Bylaws of the Company as Amended and Restated through April 26, 2012, incorporated by reference to Exhibit 3.1 of the Company’s Form 8-K filed April 30, 2012.
|
|
4.1
|
|
Specimen Common Stock Certificate, incorporated by reference to the Company’s Form S-1/A filed March 19, 1997 (Registration No. 333-21863). *
|
|
10.1
|
|
Form of Indemnity Agreement by and between the Company and each of its directors and executive officers. * †
|
|
10.2
|
|
Registration Rights Agreement between the Company and Alden J. Laborde. *
|
|
10.3
|
|
The Company’s Long-Term Incentive Plan. * †
|
|
10.4
|
|
The Company’s 2002 Long-Term Incentive Plan, as amended and restated, incorporated by reference to Exhibit 10.2 to the Company’s Quarterly Report on Form 10-Q for the period ended June 30, 2006 . † ^
|
|
10.5
|
|
The Company’s 2011 Stock Incentive Plan, incorporated by reference to Exhibit 99 to the Company’s Form S-8 filed August 9, 2011 (Registration No. 333-176187).
|
|
10.6
|
|
The Company’s 2015 Stock Incentive Plan, incorporated by reference to Exhibit 10.1 of the Company’s Form 8-K filed April 28, 2015.
|
|
10.7
|
|
Form of Performance Share Unit Agreement, incorporated by reference to Exhibit 10.1 to the Company’s Quarterly Report on Form 10-Q for the period ended March 31, 2015.
|
|
10.8
|
|
Form of Restricted Stock Unit Agreement, incorporated by reference to Exhibit 10.2 of the Company’s Quarterly Report on Form 10-Q for the period ended March 31, 2015.
|
|
10.9
|
|
The Company’s Amended and Restated Annual Incentive Program, incorporated by reference to Exhibit 10.4 to the Company’s Form 8-K filed March 4, 2015.
|
|
10.10
|
|
Form of Restricted Stock Agreement, incorporated by reference to Exhibit 10.8 to the Company’s Annual Report or Form 10-K for the year ended December 31, 2005. † ^
|
|
10.11
|
|
Ninth Amended and Restated Credit Agreement among the Company, Bank One, N.A. and Whitney National Bank, dated as of December 31, 2003, incorporated by reference to Exhibit 10.9 to the Company’s Annual Report on Form 10-K for the year ended December 31, 2003. ^
|
|
10.12
|
|
First Amendment to Ninth Amended and Restated Credit Agreement among the Company and Bank One, N.A. and Whitney National Bank dated as of June 30, 2004 incorporated by reference to Exhibit 10.1 to the Company’s Quarterly Report on Form 10-Q for the period ended June 30, 2004. ^
|
|
10.13
|
|
Second Amendment to Ninth Amended and Restated Credit Agreement among the Company and JP Morgan Chase Bank, N.A. and Whitney National Bank dated as of December 21, 2004, incorporated by reference to Exhibit 10.12 to the Company’s Annual Report on Form 10-K for the year ended December 31, 2004. ^
|
|
10.14
|
|
Third Amendment to Ninth Amended and Restated Credit Agreement among the Company and JP Morgan Chase Bank, N.A. and Whitney National Bank dated June 30, 2005, incorporated by reference to Exhibit 10.1 to the Company’s Quarterly Report on Form 10-Q for the period ended June 30, 2005. ^
|
E-1
|
EXHIBIT
NUMBER
|
|
|
|
10.15
|
|
Fourth Amendment to Ninth Amended and Restated Credit Agreement among the Company and JP Morgan Chase Bank, N.A. and Whitney National Bank dated January 30, 2006, incorporated by reference to Exhibit 10.1 to the Company’s Form 8-K filed February 3, 2006. ^
|
|
10.16
|
|
Fifth Amendment to the Ninth Amended and Restated Credit Agreement among the Company, JP Morgan Chase Bank N.A. and Whitney National Bank dated March 31, 2006, incorporated by reference to Exhibit 10.1 to the Company’s Quarterly Report on Form 10-Q for the period ended June 30, 2006. ^
|
|
10.17
|
|
Sixth Amendment to the Ninth Amended and Restated Credit Agreement among the Company and JP Morgan Chase Bank, N.A. and Whitney National Bank dated as of February 19, 2007, incorporated by reference to Exhibit 10.19 to the Company’s Annual Report on Form 10-K for the year ended December 31, 2006. ^
|
|
10.18
|
|
Seventh Amendment to the Ninth Amended and Restated Credit Agreement among the Company and JP Morgan Chase Bank, N.A. and Whitney National Bank dated as of August 6, 2008, incorporated by reference to Exhibit 10.1 to the Company’s Form 8-K filed August 11, 2008.
|
|
10.19
|
|
Eighth Amendment to the Ninth Amended and Restated Credit Agreement among the Company and JPMorgan Chase Bank, N.A. and Whitney National Bank dated as of June 2, 2009, incorporated by reference to Exhibit 10.1 of the Company’s Form 8-K filed June 3, 2009.
|
|
10.20
|
|
Ninth Amendment to the Ninth Amended and Restated Credit Agreement dated July 15, 2010, incorporated by reference to Exhibit 10.1 of the Company’s Form 8-K filed July 16, 2010.
|
|
10.21
|
|
Tenth Amendment to the Ninth Amended and Restated Credit Agreement dated May 31, 2011, incorporated by reference to Exhibit 10.1 of the Company’s Form 8-K filed June 3, 2011.
|
|
10.22
|
|
Eleventh Amendment to the Ninth Amended and Restated Credit Agreement dated October 29, 2012, incorporated by reference to Exhibit 10.1 of the Company’s Form 10-Q filed October 30, 2012.
|
|
10.23
|
|
Twelfth Amendment to the Ninth Amended and Restated Credit Agreement dated September 12, 2013, incorporated by reference to Exhibit 10.1 of the Company’s Form 8-K filed September 13, 2013.
|
|
10.24
|
|
Thirteenth Amendment to the Ninth Amended and Restated Credit Agreement dated September 12, 2013, incorporated by reference to Exhibit 10.1 of the Company’s Form 10-Q filed October 29, 2014.
|
|
10.25
|
|
Fourteenth Amendment to the Ninth Amended and Restated Credit Facility dated December 29, 2015, incorporated by reference to Exhibit 10.1 of the Company’s Form 8-K filed January 4, 2016.
|
|
10.26
|
|
Fifteenth Amendment to the Ninth Amended and Restated Credit Facility dated February 29, 2016, incorporated by reference to Exhibit 10.1 of the Company’s Form 8-K filed February 29, 2016.
|
|
10.27
|
|
Change of Control Agreement, dated February 26, 2015, between the Company and Kirk J. Meche, incorporated by reference to Exhibit 10.1 of the Company’s Form 8-K filed March 4, 2015.
|
E-2
|
EXHIBIT
NUMBER
|
|
|
|
10.28
|
|
Change of Control Agreement, dated February 26, 2015, between the Company and Jeffrey M. Favret, incorporated by reference to Exhibit 10.2 of the Company’s Form 8-K filed March 4, 2015.
|
|
10.29
|
|
Change of Control Agreement, dated February 26, 2015, between the Company and Todd F. Ladd, incorporated by reference to Exhibit 10.3 of the Company’s Form 8-K filed March 4, 2015.
|
|
21.1
|
|
Subsidiaries of the Company - The Company’s significant subsidiaries, Gulf Island, L.L.C., Gulf Island Marine Fabricators, L.L.C., Gulf Island Shipyards, L.L.C., Dolphin Steel Sales, L.L.C., Gulf Island Resources, L.L.C. and Dolphin Services, L.L.C. (organized under Louisiana law) and Gulf Marine Fabricators, L.P. (a Texas limited partnership) are wholly owned and are included in the Company’s consolidated financial statements.
|
|
23.1
|
|
Consent of Ernst & Young LLP.
|
|
31.1
|
|
CEO Certifications pursuant to Rule 13a-14 under the Securities Exchange Act of 1934.
|
|
31.2
|
|
CFO Certifications pursuant to Rule 13a-14 under the Securities Exchange Act of 1934.
|
|
32
|
|
Section 906 Certifications furnished pursuant to 18 U.S.C. Section 1350.
|
|
101
|
|
Attached as Exhibit 101 to this report are the following items formatted in XBRL (Extensible Business Reporting Language):
|
|
|
(i) Consolidated Balance Sheets,
(ii) Consolidated Statements of Operations,
(iii) Consolidated Statement of Changes in Shareholders’ Equity,
(iv) Consolidated Statements of Cash Flows and
(v) Notes to Consolidated Financial Statements.
|
|
|
†
|
Management Contract or Compensatory Plan.
|
|
*
|
Incorporated by reference to the Company’s Registration Statement on Form S-1 filed with the Commission on February 14, 1997 (Registration Number 333-21863).
|
|
^
|
SEC File Number 000-22303.
|
E-3
TABLE OF CONTENTS
Part IItem 1A. Risk FactorsItem 1B. Unresolved Staff CommentsItem 3. Legal ProceedingsItem 4. Mine Safety DisclosuresItem 4A. Executive Officers Of The RegistrantPart IIItem 5. Market For Registrant's Common Equity, Related Stockholder Matters and Issuer Purchases Of Equity SecuritiesItem 6. Selected Financial DataItem 7. Management S Discussion and Analysis Of Financial Condition and Results Of OperationsItem 7A. Quantitative and Qualitative Disclosures About Market RiskItem 8. Financial Statements and Supplementary DataItem 9. Changes in and Disagreements with Accountants on Accounting and Financial DisclosureItem 9A. Controls and ProceduresItem 9B. Other InformationPart IIIItem 10. Directors, Executive Officers and Corporate GovernanceItem 11. Executive CompensationItem 12. Security Ownership Of Certain Beneficial Owners and Management and Related Stockholders MattersItem 13. Certain Relationships and Related Transactions, and Director IndependenceItem 14. Principal Accounting Fees and ServicesPart IVItem 15. Exhibits, Financial Statement Schedules