GILEAD SCIENCES INC
10-Ks and 10-Qs
|
|
|
|
|
|
|
|
|
|
|
|
|
|
|
|
|
|
|
|
|
|
|
|
|
|
|
|
|
|
|
|
|
|
|
|
|
|
|
|
|
|
|
|
|
|
|
|
|
|
|
|
|
|
|
|
UNITED STATES
SECURITIES AND EXCHANGE COMMISSION
Washington, D.C. 20549
FORM 10-K
(Mark One)
|
ý
|
ANNUAL REPORT PURSUANT TO SECTION 13 OR 15(d) OF THE SECURITIES EXCHANGE ACT OF 1934
|
For the fiscal year ended
December 31, 2012
or
|
o
|
TRANSITION REPORT PURSUANT TO SECTION 13 OR 15(d) OF THE SECURITIES EXCHANGE ACT OF 1934
|
For the transition period from to
Commission File No. 0-19731
GILEAD SCIENCES, INC.
(Exact name of registrant as specified in its charter)
|
Delaware
|
94-3047598
|
|
(State or Other Jurisdiction of Incorporation or Organization)
|
(I.R.S. Employer Identification No.)
|
|
333 Lakeside Drive, Foster City, California
|
94404
|
|
(Address of principal executive offices)
|
(Zip Code)
|
Registrant's telephone number, including area code: 650-574-3000
SECURITIES REGISTERED PURSUANT TO SECTION 12(b) OF THE ACT:
|
Title of each class
|
Name of each exchange on which registered
|
|
Common Stock, $0.001 par value per share
|
The Nasdaq Global Select Market
|
SECURITIES REGISTERED PURSUANT TO SECTION 12(g) OF THE ACT: NONE
Indicate by check mark if the registrant is a well-known seasoned issuer, as defined in Rule 405 of the Securities Act. Yes
x
No
¨
Indicate by check mark if the registrant is not required to file reports pursuant to Section 13 or Section 15(d) of the Act. Yes
¨
No
x
Indicate by check mark whether the registrant (1) has filed all reports required to be filed by Section 13 or 15(d) of the Securities Exchange Act of 1934 during the preceding 12 months (or for such shorter period that the registrant was required to file such reports), and (2) has been subject to such filing requirements for the past 90 days. Yes
x
No
¨
Indicate by check mark whether the registrant has submitted electronically and posted on its corporate Web site, if any, every Interactive Data File required to be
submitted and posted pursuant to Rule 405 of Regulation S-T (§ 232.405 of this chapter) during the preceding 12 months (or for such shorter period that the registrant was required to submit and post such files). Yes
x
No
¨
Indicate by check mark if disclosure of delinquent filers pursuant to Item 405 of Regulation S-K (§ 229.405) is not contained herein, and will not be contained, to the best of registrant's knowledge, in definitive proxy or information statements incorporated by reference in Part III of this Form 10-K or any amendment to this Form 10-K.
x
Indicate by check mark whether registrant is a large accelerated filer, an accelerated filer, a non-accelerated filer, or a smaller reporting company. See the definitions of “large accelerated filer,” “accelerated filer” and “smaller reporting company” in Rule 12b-2 of the Exchange Act. (Check one):
|
Large accelerated filer
x
|
Accelerated filer
¨
|
Non-Accelerated filer
¨
|
Smaller reporting company
¨
|
|
(Do not check if a smaller reporting company)
|
|||
Indicate by check mark whether the registrant is a shell company (as defined in Rule 12b-2 of the Exchange Act). Yes
¨
No
x
The aggregate market value of the voting and non-voting common equity held by non-affiliates of the registrant based upon the closing price of its Common Stock on the Nasdaq Global Select Market on June 29, 2012 was
$32,606,069,397
.*
The number of shares outstanding of the registrant's Common Stock on
February 15, 2013
was
1,522,392,518
.
DOCUMENTS INCORPORATED BY REFERENCE
Specified portions of the registrant's proxy statement, which will be filed with the Commission pursuant to Regulation 14A in connection with the registrant's 2013 Annual Meeting of Stockholders, to be held on May 8, 2013, are incorporated by reference into Part III of this Report.
* Based on a closing price of $25.64 per share on June 29, 2012. Excludes 226,596,532 shares of the registrant's Common Stock held by executive officers, directors and any stockholders whose ownership exceeds 5% of registrant's common stock outstanding at June 29, 2012. Exclusion of such shares should not be construed to indicate that any such person possesses the power, direct or indirect, to direct or cause the direction of the management or policies of the registrant or that such person is controlled by or under common control with the registrant.
GILEAD SCIENCES, INC.
2012 Form 10-K Annual Report
Table of Contents
|
PART I
|
|
|
|
Item 1
|
||
|
Item 1A
|
||
|
Item 1B
|
||
|
Item 2
|
||
|
Item 3
|
||
|
Item 4
|
||
|
PART II
|
|
|
|
Item 5
|
||
|
Item 6
|
||
|
Item 7
|
||
|
Item 7A
|
||
|
Item 8
|
||
|
Item 9
|
||
|
Item 9A
|
||
|
Item 9B
|
||
|
PART III
|
|
|
|
Item 10
|
||
|
Item 11
|
||
|
Item 12
|
||
|
Item 13
|
||
|
Item 14
|
||
|
PART IV
|
|
|
|
Item 15
|
||
We own or have rights to various trademarks, copyrights and trade names used in our business, including the following: GILEAD
®
, GILEAD SCIENCES
®
, STRIBILD
®
, COMPLERA
®
, EVIPLERA
®
, TRUVADA
®
, VIREAD
®
, HEPSERA
®
, AMBISOME
®
, EMTRIVA
®
, VISTIDE
®
, LETAIRIS
®
, VOLIBRIS
®
, RANEXA
®
, CAYSTON
®
and RAPISCAN
®
. ATRIPLA
®
is a registered trademark belonging to Bristol-Myers Squibb & Gilead Sciences, LLC. LEXISCAN
®
is a registered trademark belonging to Astellas U.S. LLC. MACUGEN
®
is a registered trademark belonging to Eyetech, Inc. SUSTIVA
®
is a registered trademark of Bristol-Myers Squibb Pharma Company. TAMIFLU
®
is a registered trademark belonging to Hoffmann-La Roche Inc. This report also includes other trademarks, service marks and trade names of other companies.
This Annual Report on Form 10-K, including the section entitled “Management's Discussion and Analysis of Financial Condition and Results of Operations,” contains forward-looking statements regarding future events and our future results that are subject to the safe harbors created under the Securities Act of 1933, as amended (the Securities Act), and the Securities Exchange Act of 1934, as amended (the Exchange Act). Words such as “expect,” “anticipate,” “target,” “goal,” “project,” “hope,” “intend,” “plan,” “believe,” “seek,” “estimate,” “continue,” “may,” “could,” “should,” “might,” variations of such words and similar expressions are intended to identify such forward-looking statements. In addition, any statements other than statements of historical fact are forward-looking statements, including statements regarding overall trends, operating cost and revenue trends, liquidity and capital needs and other statements of expectations, beliefs, future plans and strategies, anticipated events or trends and similar expressions. We have based these forward-looking statements on our current expectations about future events. These statements are not guarantees of future performance and involve risks, uncertainties and assumptions that are difficult to predict. Our actual results may differ materially from those sugg
ested by these forward-looking statements for various reasons, including those identified below under “Risk Factors,” beginning at page 31. Given these risks and uncertainties, you are cautioned not to place undue reliance on forward-looking statements. The forward-looking statements included in this report are made only as of the date hereof. Except as required under federal securities laws and the rules and regulations of the Securities and Exchange Commission (SEC), we do not undertake, and specifically decl
ine, any obligation to update any of these statements or to publicly announce the results of any revisions to any forward-looking statements after the distribution of this report, whether as a result of new information, future events, changes in assumptions or otherwise.
2
|
ITEM 1.
|
BUSINESS
|
Overview
Gilead Sciences, Inc. (Gilead, we or us), incorporated in Delaware on June 22, 1987, is a research-based biopharmaceutical company that discovers, develops and commercializes innovative medicines in areas of unmet medical need. With each new discovery and experimental drug candidate, we seek to improve the care of patients suffering from life-threatening diseases around the world. Gilead's primary areas of focus include human immunodeficiency virus (HIV), liver diseases such as hepatitis B virus (HBV) and hepatitis C virus (HCV), serious cardiovascular and respiratory conditions, and oncology/inflammation. Headquartered in Foster City, California, we have operations in North America, Europe and Asia. We continue to add to our existing portfolio of products through our internal discovery and clinical development programs and through a product acquisition and in-licensing strategy.
2012 Highlights
Over the past year, we executed on our strategy to bring best-in-class drugs to market. We completed our acquisition of Pharmasset, Inc. (Pharmasset), which accelerated our timeline to develop the first all-oral HCV regimen and entered into an agreement to acquire YM Biosciences Inc. (YM Biosciences), which closed in February 2013 and expands our growing oncology/inflammation pipeline. We also expanded our single tablet regimen product offerings for the treatment of HIV with the launch of Stribild in the United States, which combines four of our medicines in a once-daily single tablet regimen, and expanded worldwide access to Complera/Eviplera, which is now available in 21 countries. We also advanced our research and development pipeline, with over 50 active Phase 3 clinical trials at the end of 2012 and filed marketing applications for two of the components of Stribild, elvitegravir and cobicistat, as single agents.
HIV Program
A substantial portion of our revenues is derived from our six marketed HIV products. In 2012, we continued to be at the forefront of advancing HIV treatment through the development of new single tablet regimens. Our long-term goal is to ensure that all HIV patients have the option to choose a single tablet regimen that is right for them. Single tablet regimens allow patients to adhere to a fully suppressive course of therapy more easily and consistently, which is critical for the successful management of the disease. Because of this, we continue to focus on the development of new HIV medicines and co-formulations. With the launch of Stribild in the United States in 2012, Complera/Eviplera in 2011 and Atripla in 2006, we now have three single tablet regimens available.
During 2012, we submitted marketing applications in the United States and European Union for elvitegravir, an integrase inhibitor for the treatment of HIV-1 infection in treatment-experienced adults, and cobicistat, a pharmacoenhancing or "boosting" agent that increases blood levels to allow once-daily dosing of certain HIV medicines. The U.S. Food and Drug Administration (FDA) has set target review dates of April 2013 under the Prescription Drug User Fee Act.
In 2012, we also obtained FDA approval for once-daily oral Truvada, in combination with safer sex practices, for pre-exposure prophylaxis (PrEP) to reduce the risk of HIV-1 infection among uninfected adults. Truvada is the first antiretroviral has been approved for the prevention of HIV infection in adults.
We also made important progress with the clinical development of tenofovir alafenamide (TAF), formerly known as GS-7340. A Phase 2 study showed that TAF is efficacious at one-tenth the dose of Viread and provides potential safety advantages. Based on these results, a Phase 3 trial evaluating the single tablet regimen of TAF, elvitegravir, cobicistat and emtricitabine treatment of HIV infection in treatment-naïve adults commenced earlier this year. Under an agreement with Janssen R&D Ireland (Janssen), we are also conducting Phase 2 trials evaluating a single tablet regimen of TAF, cobicistat, darunavir and emtricitabine for the treatment of HIV infection.
3
HCV Program
In January 2012, we acquired Pharmasset. Through the acquisition, we acquired sofosbuvir (formerly known as GS-7977), an investigational nucleotide analog that acts to inhibit the replication of HCV. This product candidate is currently in Phase 2 and Phase 3 clinical trials. The HCV therapeutic market has been and continues to be vastly underserved. Due to the limitations of available therapies, only a small fraction of individuals who are infected with HCV are diagnosed, and an even smaller fraction of those patients are treated. Prior to May 2011, when the first protease inhibitors were approved, only about half of the patients responded to the standard of care combination of pegylated interferon (peg-IFN) and ribavirin. The addition of protease inhibitors to the standard of care has resulted in incremental response rates for patients with genotype 1 infection; however, this regimen causes substantial side effects such as fatigue, bone marrow suppression, potentially debilitating rash, anemia and neuropsychiatric effects. As such, discontinuation rates with these triple therapy combinations have significantly increased.
During 2013, we expect to receive a significant amount of data from clinical trials evaluating sofosbuvir, alone or in combination with other direct acting antivirals in HCV-infected individuals across all genotypes. Our initial new drug application (NDA) for sofosbuvir will be supported by four Phase 3 studies named Fission, Positron, Fusion and Neutrino. Fission is a study in genotype 2 and 3-treatment naïve patients comparing 12 weeks of sofosbuvir and ribavirin to the current standard of care of 24 weeks of treatment with interferon and ribavirin. Positron compares 12 weeks of treatment with sofosbuvir and ribavirin in genotype 2 and 3 interferon intolerant/ineligible patients to placebo. The Fusion study explores 12 or 16 weeks duration of treatment with sofosbuvir and ribavirin among genotype 2 and 3 treatment-experienced patients. Neutrino is a single arm study evaluating a 12-week course of sofosbuvir, interferon and ribavirin in genotype 1, 4, 5 and 6 infected-patients. We announced data from the four studies in late 2012 and during the first quarter of 2013.
We anticipate filing for regulatory approvals for sofosbuvir by the second quarter of 2013. We expect the initial indication to be for 12 to 16 weeks of treatment with sofosbuvir and ribavirin in treatment-naive, interferon-intolerant and experienced genotype 2 and 3 patients and for 12 weeks of treatment with sofosbuvir, peg-IFN and ribavirin in treatment-naive genotype 1, 4, 5 and 6 patients.
In parallel, we are also advancing a fixed-dose combination of sofosbuvir and ledipasvir (formerly GS-5885) for the treatment of genotype 1 patients. Our NDA for the fixed dose combination of sofosbuvir and ledipasvir will be supported by two clinical trials. The first study, named ION-1, evaluates the fixed-dose combination of sofosbuvir and ledipasvir with and without ribavirin for either 12 or 24 weeks in treatment-naïve genotype 1 infected patients. Pending a review of results from the two 12-week arms of an initial enrollment of 200 patients, by the second quarter of 2013, we expect to enroll additional patients in the ION-1 study to assess the fixed dose combination of sofosbuvir and ledipasvir in a total of 800 individuals. In January 2013, we also started screening patients for the second Phase 3 study, named ION-2, which evaluates the fixed-dose combination with ribavirin for 12 weeks and with and without ribavirin for 24 weeks of therapy among treatment-experienced genotype 1 HCV patients.
See the Risk Factor entitled “The public announcement of data from clinical studies evaluating sofosbuvir and the fixed dose combination of sofosbuvir and ledipasvir in HCV-infected patients is likely to cause significant volatility in our stock price” on page 31.
Oncology/Inflammation
Over the last five years we have worked to advance our oncology franchise. Idelalisib, is a PI3K delta inhibitor antibody formerly known as GS-1101, that advanced into five Phase 3 trials during 2012. The compound is being evaluated for the treatment of chronic lymphocytic leukemia and indolent non-Hodgkin's lymphoma. Simtuzumab, a monoclonal antibody formerly known as GS-6624, is being evaluated in various Phase 2 trials for the treatment of myelofibrosis, colorectal cancer and pancreatic cancer. With the acquisition of YM Biosciences, we acquired momelotinib or GS-0387, formerly known as CYT387. Momelotinib is a JAK inhibitor being evaluated in Phase 2 clinical trials for the treatment of myelofibrosis. We expect to advance the compound to Phase 3 trials later in 2013.
Our Products
HIV/AIDS
|
•
|
Stribild
(elvitegravir 150 mg/cobicistat 150 mg/emtricitabine 200 mg/tenofovir disoproxil fumarate 300 mg) is a complete once-daily single tablet regimen for HIV-1 infection for treatment-naive adults. Stribild combines four compounds in one daily tablet and was approved by the FDA in August 2012. We filed a marketing authorization application for Stribild with the European Medicines Agency (EMA) in December 2011. We expect to receive approval from the European Commission in the second quarter of 2013.
|
4
|
•
|
Complera/Eviplera
is an oral formulation dosed once a day for the treatment of HIV-1 infection in treatment-naïve adults. The product, marketed in the United States as Complera and in Europe as Eviplera, is the second complete single tablet regimen for the treatment of HIV and is a fixed-dose combination of our antiretroviral medications, Viread (tenofovir disoproxil fumarate) and Emtriva (emtricitabine), and Janssen's non-nucleoside reverse transcriptase inhibitor, Edurant (rilpivirine).
|
|
•
|
Atripla
(efavirenz 600 mg/emtricitabine 200 mg/tenofovir disoproxil fumarate 300 mg) is an oral formulation dosed once a day for the treatment of HIV infection in adults. Atripla is the first once-daily single tablet regimen for HIV intended as a stand alone therapy or in combination with other antiretrovirals. It is a fixed-dose combination of our antiretroviral medications, Viread and Emtriva and Bristol Myers-Squibb Company's non-nucleoside reverse transcriptase inhibitor, Sustiva (efavirenz).
|
|
•
|
Truvada
(emtricitabine and tenofovir disoproxil fumarate) is an oral formulation dosed once a day as part of combination therapy to treat HIV infection in adults. It is a fixed-dose combination of our antiretroviral medications, Viread and Emtriva. In 2012, the FDA also approved Truvada, in combination with safer sex practices, to reduce the risk of sexually acquired HIV-1 infection in adults at high risk, a strategy called pre-exposure prophylaxis (PrEP).
|
|
•
|
Viread
is an oral formulation of a nucleotide analog reverse transcriptase inhibitor, dosed once a day as part of combination therapy to treat HIV infection in patients 2 years of age and older. In 2012, the European Commission also approved the use of Viread in combination with other antiretroviral agents for the treatment of HIV-1 infected pediatric patients aged 2 to less than 18 years with nucleoside reverse transcriptase inhibitor resistance or toxicities precluding the use of first line pediatric agents. Viread is also approved for the treatment of chronic HBV in adults.
|
|
•
|
Emtriva
is an oral formulation of a nucleoside analog reverse transcriptase inhibitor, dosed once a day as part of combination therapy to treat HIV infection in adults. In the United States and Europe, Emtriva is also available as an oral solution approved as part of combination therapy to treat HIV infection in children.
|
Liver Disease
|
•
|
Viread
is an oral formulation of a nucleotide analog reverse transcriptase inhibitor, dosed once a day for the treatment of chronic HBV in adults with compensated and decompensated liver disease. We licensed to GlaxoSmithKline Inc. (GSK) the rights to commercialize Viread for the treatment of chronic HBV in China, Japan and Saudi Arabia. In 2012, the European Commission approved the use of Viread for the treatment of chronic HBV infection in adolescent patients aged 12 to less than 18 years with compensated liver disease and evidence of immune active disease. Viread is also approved for the treatment of HIV infection in patients 2 years of age and older in combination with other antiretroviral agents.
|
|
•
|
Hepsera
(adefovir dipivoxil) is an oral formulation of a nucleotide analog polymerase inhibitor, dosed once a day to treat chronic HBV in patients 12 years of age and older. We licensed to GSK the rights to commercialize Hepsera for the treatment of chronic HBV in Asia, Latin America and certain other territories.
|
Cardiovascular
|
•
|
Letairis
(ambrisentan) is an oral formulation of an endothelin receptor antagonist (ERA) indicated for the treatment of pulmonary arterial hypertension (PAH) (WHO Group 1) in patients with WHO Class II or III symptoms to improve exercise capacity and delay clinical worsening. We sublicensed to GSK the rights to ambrisentan, marketed by GSK as Volibris (ambrisentan), for PAH in territories outside of the United States.
|
|
•
|
Ranexa
(ranolazine) is an extended-release tablet for the treatment of chronic angina. We have licensed to Menarini International Operations Luxembourg SA the rights to Ranexa in territories outside of the United States.
|
|
•
|
Lexiscan/Rapiscan
(regadenoson) injection is indicated for use as a pharmacologic stress agent in radionuclide myocardial perfusion imaging (MPI), a test that detects and characterizes coronary artery disease, in patients unable to undergo adequate exercise stress. Astellas US LLC has exclusive rights to manufacture and sell regadenoson under the name Lexiscan in the United States, subject to its obligations to pay us royalties based on sales of Lexiscan in the U.S. Rapidscan Pharma Solutions, Inc. (RPS) holds the exclusive right to manufacture and sell regadenoson under the name Rapiscan in Europe and certain territories outside the United States. We receive royalties from Astellas and RPS for sales in these territories.
|
5
Respiratory
|
•
|
Cayston
(aztreonam for inhalation solution) is an inhaled antibiotic for the treatment of respiratory systems in cystic fibrosis (CF) patients 7 years of age and older with
Pseudomonas aeruginosa (P. aeruginosa)
.
|
|
•
|
Tamiflu
(oseltamivir phosphate) is an oral antiviral available in capsule form for the treatment and prevention of influenza A and B. Tamiflu is approved for the treatment of influenza in children and adults in more than 60 countries, including the United States, Japan and the European Union. Tamiflu is also approved for the prevention of influenza in children and adults in the United States, Japan and the European Union. We developed Tamiflu with F. Hoffmann-La Roche Ltd (together with Hoffmann-La Roche Inc., Roche). Roche has the exclusive right to manufacture and sell Tamiflu worldwide, subject to its obligation to pay us royalties based on a percentage of the net sales of Tamiflu.
|
Other
|
•
|
AmBisome
(amphotericin B liposome for injection) is a proprietary liposomal formulation of amphotericin B, an antifungal agent to treat serious invasive fungal infections caused by various fungal species in adults. Our corporate partner, Astellas Pharma US, Inc., promotes and sells AmBisome in the United States and Canada, and we promote and sell AmBisome in Europe, Australia and New Zealand.
|
|
•
|
Vistide
(cidofovir injection) is an antiviral injection for the treatment of cytomegalovirus retinitis in adult patients with AIDS.
|
|
•
|
Macugen
(pegaptanib sodium injection) is an intravitreal injection of an anti-angiogenic oligonucleotide for the treatment of neovascular age-related macular degeneration. Macugen was developed by Eyetech Inc. (Eyetech) using technology licensed from us and is now promoted in the United States by Valeant Pharmaceuticals, Inc. (Valeant), which acquired Eyetech in 2012. Valeant holds the exclusive rights to manufacture and sell Macugen in the United States, and Pfizer Inc. (Pfizer) holds the exclusive right to manufacture and sell Macugen in the rest of the world. We receive royalties from Valeant and Pfizer based on sales of Macugen worldwide.
|
Sales of our antiviral products, which include products in our HIV/AIDS and Liver Disease areas described above, were
$8.14 billion
in 2012,
$7.05 billion
in 2011 and
$6.54 billion
in 2010. This represented
84%
of our total revenues in 2012 and 2011 and
82%
in 2010. Sales of our other products, which include Letairis, Ranexa, AmBisome and Cayston, were
$1.26 billion
in 2012,
$1.05 billion
in 2011 and
$852.9 million
in 2010. This represented
13%
of our total revenues in 2012 and 2011 and
11%
in 2010. Please see Item 7, Management's Discussion and Analysis included in this Annual Report on Form 10-K for more information regarding our revenues.
Commercialization and Distribution
We have U.S. and international commercial sales operations, with marketing subsidiaries in Australia, Austria, Belgium, Canada, the Czech Republic, Denmark, Finland, France, Germany, Greece, Hong Kong, Ireland, Italy, Japan, the Netherlands, New Zealand, Norway, Poland, Portugal, Russia, South Korea, Spain, Sweden, Switzerland, Turkey, the United Kingdom and the United States.
Our products are marketed through our commercial teams and/or in conjunction with third-party distributors and corporate partners. Our commercial teams promote our products through direct field contact with physicians, hospitals, clinics and other healthcare providers. We generally grant our third-party distributors the exclusive right to promote our product in a territory for a specified period of time. Most of our agreements with these distributors provide for collaborative efforts between the distributor and Gilead in obtaining and maintaining regulatory approval for the product in the specified territory.
We sell and distribute Stribild, Complera, Atripla, Truvada, Viread, Hepsera, Emtriva, Ranexa and Vistide in the United States exclusively through the wholesale channel. Our product sales to three large wholesalers, Cardinal Health, Inc., McKesson Corp. and AmerisourceBergen Corp., each accounted for more than 10% of total revenues for each of the years ended
December 31, 2012
,
2011
and
2010
. On a combined basis, in
2012
, these wholesalers accounted for approximately
81%
of our product sales in the United States and approximately
46%
of our total worldwide revenues. Letairis and Cayston are distributed exclusively by specialty pharmacies. These specialty pharmacies dispense medications for complex or chronic conditions that require a high level of patient education and ongoing counseling. We sell and distribute Complera/Eviplera, Atripla, Truvada, Viread, Hepsera, Emtriva and AmBisome in Asia, Australia, Canada, Europe, Latin America, the Middle East and New Zealand either through our commercial teams, third-party distributors or corporate partners.
6
Access in the Developing World
Through the Gilead Access Program, established in 2003, certain of our products for the treatment of HIV, chronic HBV and visceral leishmaniasis are available at substantially reduced prices in the developing world. Gilead delivers its medicines in these countries by working with regional business partners to distribute brand-name Viread and Truvada at prices that are based on a country's ability to pay and represent little or no profit to Gilead. We also have partnerships with India-based companies to expand access to generic versions of our HIV medications in the least-developed countries of the world (see below).
We work closely with the World Health Organization and with non-governmental organizations to provide AmBisome for the treatment of leishmaniasis at a preferential price in resource limited settings. We support numerous clinical studies investigating the role of AmBisome to treat visceral and cutaneous leishmaniasis in developing countries through collaborations with organizations such as the Drugs for Neglected Diseases initiative and Médecins Sans Frontières. We also support clinical research studies aimed at identifying the best treatment course for visceral leishmaniasis and donated AmBisome to support clinical studies assessing combination therapies and the cost-effectiveness of multiple visceral leishmaniasis treatment interventions. In December 2011, we signed a partnership agreement with World Health Organization to donate 445,000 vials of AmBisome over five years. This donation will be used to treat more than 50,000 patients in resource-limited countries.
We also support many clinical studies through the donation of our products to help define the best treatment strategies in developing world countries. For example, we donated tenofovir for the Centre for the AIDS Programme of Research in South Africa (CAPRISA) 004 microbicide trial, which assessed the effectiveness and the safety of a tenofovir-based microbicide gel for the prevention of HIV infection in South African women. We also provide drugs for a number of innovative international studies investigating whether Viread or Truvada can prevent HIV transmission among at-risk, uninfected adults. This is a HIV prevention strategy called pre-exposure prophylaxis, or PrEP. With the FDA approval in 2012, Truvada became the first agent indicated for uninfected individuals to reduce the risk of acquiring HIV through sex.
We have also entered into a number of collaborations related to access to our products in the developing world, which include:
|
•
|
PharmaChem Technologies (Grand Bahama), Ltd (PharmaChem).
In 2005, PharmaChem, one of our commercial manufacturing partners, established a facility in The Bahamas to manufacture tenofovir disoproxil fumarate, the active pharmaceutical ingredient in Viread and one of the active pharmaceutical ingredients in Atripla and Truvada, for resource limited countries through a cooperative effort with PharmaChem and the Grand Bahama Port Authority.
|
|
•
|
Aspen Pharmacare Holdings Ltd (Aspen).
In 2005, we entered into a non-exclusive manufacturing and distribution agreement with Aspen, providing for the manufacture and distribution of Viread and Truvada for the treatment of HIV infection to certain developing world countries included in our Gilead Access Program. In 2007, we amended our agreement with Aspen. Under the amended agreement, Aspen retained the right to manufacture and distribute Viread and Truvada for the treatment of HIV infection in these developing world countries. Aspen has the right to purchase Viread and Truvada in unlabeled bottles from us for distribution in such countries, and also has the right to manufacture Viread and Truvada using active pharmaceutical ingredient that has been purchased by Aspen from suppliers approved by us. Aspen was also granted the right to manufacture and distribute generic versions of emtricitabine and tenofovir disoproxil fumarate, including versions of tenofovir disoproxil fumarate in combination with emtricitabine for the treatment of HIV infection. Aspen is required to pay us royalties on net sales of Viread and Truvada, as well as royalties on net sales of generic versions of tenofovir disoproxil fumarate, including versions of tenofovir disoproxil fumarate in combination with generic versions of emtricitabine that are manufactured and distributed by Aspen.
|
7
|
•
|
Licenses with Generic Manufacturers.
We have entered into non-exclusive license agreements with Indian generic manufacturers, granting them rights to produce and distribute generic versions of tenofovir disoproxil fumarate for the treatment of HIV infection to low income countries around the world, which includes India and many of the low income countries in our Gilead Access Program. The agreements require that the generic manufacturers meet certain national and international regulatory and quality standards and include technology transfers to enable expeditious production of large volumes of high quality generic versions of tenofovir disoproxil fumarate. In addition, these agreements allow for the manufacture of commercial quantities of both active pharmaceutical ingredient and finished product. In 2011, we expanded these non-exclusive license agreements to increase the number of countries included in the license, and also to include rights to Stribild and our future product candidates, elvitegravir, an investigational integrase inhibitor; and cobicistat, a pharmacoenhancing or "boosting" agent that increases blood levels to allow once-daily dosing of certain HIV medicines. To expand access to Viread for the treatment of HBV treatment in developing countries, we also included in these non-exclusive license agreements the ability to manufacture and distribute generic versions of tenofovir disoproxil fumarate for the treatment of HBV in the same countries where they are authorized to sell generic versions of tenofovir disoproxil fumarate for HIV. In August 2012, we announced new collaborations with Indian partners to produce and distribute generic emtricitabine in the developing world, including single tablet regimens containing emtricitabine and fixed-dose combinations of emtricitabine co-formulated with other Gilead HIV medicines.
|
|
•
|
Merck.
In 2006, we entered into an agreement with an affiliate of Merck pursuant to which Gilead and Merck provide Atripla at substantially reduced prices to HIV infected patients in developing countries in Africa, the Caribbean, Latin America and Southeast Asia. Under the agreement, we manufacture Atripla using efavirenz supplied by Merck, and Merck handles distribution of the product in the countries covered by the agreement.
|
|
•
|
International Partnership for Microbicides (IPM) and CONRAD.
In 2006, we entered into an agreement under which we granted rights to IPM and CONRAD, a cooperating agency of the U.S. Agency for International Development committed to improving reproductive health by expanding the contraceptive choices of women and men, to develop, manufacture, and, if proven efficacious, arrange for the distribution in resource limited countries of certain formulations of tenofovir for use as a topical microbicide to prevent HIV infection.
|
|
•
|
Medicines Patent Pool (the Pool)
. In 2011, we entered into an agreement with the Pool, an organization that was established by the United Nations to increase global access to high-quality, low-cost antiretroviral therapy through the sharing of patents. We granted the Pool a non-exclusive license to identify generic pharmaceutical manufacturers in India who specialize in high-quality production of generic medicines and granted sublicenses to those Indian manufacturers to manufacture and distribute generic versions of our antiretrovirals in the developing world. Sublicensees through the Pool will be free to develop combination products and pediatric formulations of our HIV medicines. We also granted the Pool the right to grant sublicenses to generic versions of Stribild and to our product candidates, elvitegravir and cobicistat, to those same generic pharmaceutical manufacturers in India for distribution in the developing world.
|
|
•
|
Janssen
. In 2011, we expanded our agreement with Janssen, formerly Tibotec Pharmaceuticals, to provide for distribution of Complera/Eviplera for the treatment of HIV in less developed countries and to enable the commercialization of generic versions of the product.
|
8
Competition
Our marketed products target a number of areas, including viral, cardiovascular, respiratory and fungal diseases. There are many commercially available products for the treatment of these diseases. Many companies and institutions are making substantial investments in developing additional products to treat these diseases. Our products compete with other available products based primarily on:
|
•
|
efficacy;
|
|
•
|
safety;
|
|
•
|
tolerability;
|
|
•
|
acceptance by doctors;
|
|
•
|
ease of patient compliance;
|
|
•
|
patent protection;
|
|
•
|
ease of use;
|
|
•
|
price;
|
|
•
|
insurance and other reimbursement coverage;
|
|
•
|
distribution; and
|
|
•
|
marketing.
|
Our HIV Products
The HIV landscape is becoming more competitive and complex as treatment trends continue to evolve. A growing number of HIV drugs are currently sold or are in advanced stages of clinical development. Competition from current and expected competitors may erode the revenues we receive from sales of our HIV products. Of the 35 branded HIV drugs available in the United States, our products primarily compete with the fixed-dose combination products in the nucleotide/nucleoside reverse transcriptase inhibitors (NRTI) class, including Combivir (lamivudine/zidovudine), Epzicom/Kivexa (abacavir/lamivudine) and Trizivir (abacavir/lamivudine/zidovudine), each sold by a joint venture, ViiV, that was established in November 2009 by GSK and Pfizer focused on HIV therapies. Our HIV products also compete broadly with HIV products from Abbott Laboratories, Inc., Boehringer Ingelheim GmbH, Merck, Roche and Janssen.
BMS's Videx EC (didanosine, ddI) became the first generic HIV product in the United States in 2004. GSK's Retrovir (zidovudine) faces generic competition in the United States as a result of the launch of generic zidovudine in 2005. BMS's Zerit (stavudine) faces generic competition in the United States as a result of the launch of generic stavudine in 2008. Epivir (lamivudine), marketed by ViiV, is competitive with emtricitabine, the active pharmaceutical ingredient of Emtriva and a component of Atripla, Truvada, Complera/Eviplera and Stribild. In May 2010, the compound patent covering Epivir (lamivudine) itself expired in the United States and Europe, and generic lamivudine is now available in the United States, Spain, Portugal and Italy. We expect that generic versions of lamivudine will be launched in other countries within the European Union. In May 2011, a generic version of Combivir (lamivudine and zidovudine) was approved and was recently launched in the United States. In addition, in late 2011, generic tenofovir also became available in Turkey, which resulted in an increase in the rebate for Viread in Turkey. To date, there has not been a significant impact from generic didanosine, zidovudine, stavudine, lamivudine, the generic version of Combivir or generic tenofovir in Turkey on the price of our HIV products; however, price decreases for all HIV products may result in the longer term.
We currently also expect competition from a generic version of Sustiva (efavirenz), a component of our Atripla, to be available in Europe and Canada in 2013 and the United States in 2014, which may negatively impact sales of our HIV products. We also expect the launch of dolutegravir, an integrase inhibitor, in the fourth quarter of 2013 by GSK which could impact the sales of our HIV products.
Our Liver Disease Products
Our HBV products, Viread and Hepsera, face significant competition from existing and expected therapies for treating patients with chronic HBV, which may erode the revenues we receive from sales of our HBV products. Our HBV products face competition from Baraclude (entecavir), an oral nucleoside analog developed by BMS and launched in the United States in 2005 and Europe in 2011, and Tyzeka/Sebivo (telbivudine), an oral nucleoside analog developed by Novartis Pharmaceuticals Corporation (Novartis) for sale in the United States, the European Union and China.
Our HBV products also compete with Epivir-HBV/Zeffix (lamivudine), which was developed by GSK in collaboration with Shire Pharmaceuticals Group PLC and is sold in major countries throughout North and South America, Europe and Asia.
9
Viread and Hepsera for the treatment of chronic HBV also compete with established immunomodulatory therapies, including Intron-A (interferon alfa-2b), which is sold by Schering Plough Corporation in major countries throughout North and South America, Europe and Asia, and Pegasys (pegylated interferon alfa-2a), an injectable drug similar to Intron-A sold by Roche for the treatment of chronic HBV.
Our Cardiovascular Products
Letairis competes directly with Tracleer (bosentan) sold by Actelion Pharmaceuticals US, Inc. (Actelion) and indirectly with Adcirca (tadalafil) from United Therapeutics Corporation.
Ranexa competes predominantly with generic compounds from three distinct classes of drugs for the treatment of chronic angina in the United States, including generic and/or branded beta-blockers, calcium channel blockers and long-acting nitrates. In addition, surgical treatments and interventions such as coronary artery bypass grafting and percutaneous coronary intervention can be another option for angina patients, and may be perceived by healthcare practitioners as preferred methods to treat the cardiovascular disease that underlies and causes angina.
There are numerous marketed generic and/or branded pharmacologic stress agents that compete with Lexiscan/Rapiscan.
Our Respiratory Products
Cayston competes primarily with Tobi (tobramycin inhalation solution), an inhaled medication sold by Novartis for the treatment of CF patients whose lungs contain
P. aeruginosa
,
a bacterial infection.
Tamiflu competes with Relenza (zanamivir), an anti-influenza drug that is sold by GSK. Relenza is a neuraminidase inhibitor that is delivered as an orally-inhaled dry powder. Generic competitors include amantadine and rimantadine, both oral tablets that only inhibit the replication of the influenza A virus. BioCryst Pharmaceuticals, Inc. is developing injectable formulations of peramivir, an influenza neuraminidase inhibitor, for the treatment of influenza, which are currently approved in Japan and South Korea.
Our Other Products
AmBisome faces strong competition from several current and expected competitors. AmBisome faces competition from Vfend (voriconazole) developed by Pfizer and caspofungin, a product developed by Merck that is marketed as Cancidas in the United States and as Caspofungin elsewhere. AmBisome also competes with other lipid-based amphotericin B products, including Abelcet (amphotericin B lipid complex injection), sold by Enzon Pharmaceuticals, Inc. in the United States, Canada and Japan and by Zeneus Pharma Ltd. in Europe; Amphotec (amphotericin B cholesteryl sulfate complex for injection), sold by Three Rivers Pharmaceuticals, LLC worldwide; and Anfogen (amphotericin B liposomal), sold by Genpharma, S.A. in Argentina. BMS and numerous generic manufacturers sell conventional amphotericin B, which also competes with AmBisome.
We are aware of at least three lipid formulations that claim similarity to AmBisome becoming available outside of the United States, including the possible entry of such formulations in Greece and Taiwan. These formulations may reduce market demand for AmBisome. The manufacture of lipid formulations of amphotericin B is very complex, and if any of these formulations are found to be unsafe, sales of AmBisome may be negatively impacted by association.
Vistide competes with a number of drugs that also treat cytomegalovirus retinitis, including Cytovene IV and Cytovene (ganciclovir), sold in intravenous and oral formulations, respectively, by Roche and as an ocular implant by Bausch & Lomb Incorporated; Valcyte (valganciclovir), also marketed by Roche; Foscavir (foscarnet), an intravenous drug sold by AstraZeneca PLC; and Vitravene (fomivirsen), a drug injected directly into the eye, sold by CibaVision.
Macugen competes primarily with Visudyne (verteporfin for injection), which is sold by Novartis and used in connection with photodynamic therapy, and Lucentis (ranibizumab), which is sold by Genentech, Inc. in the United States and Novartis in territories outside the United States.
A number of companies are pursuing the development of technologies which are competitive with our research programs. These competing companies include specialized pharmaceutical firms and large pharmaceutical companies acting either independently or together with other pharmaceutical companies. Furthermore, academic institutions, government agencies and other public and private organizations conducting research may seek patent protection and may establish collaborative arrangements for competitive products and programs.
10
Collaborative Relationships
As part of our business strategy, we establish collaborations with other companies, universities and medical research institutions to assist in the clinical development and/or commercialization of certain of our products and product candidates and to provide support for our research programs. We also evaluate opportunities for acquiring products or rights to products and technologies that are complementary to our business from other companies, universities and medical research institutions. More information regarding certain of these relationships, including their ongoing financial and accounting impact on our business can be found in Item 8, Note 9 to our Consolidated Financial Statements included in this Annual Report on Form
10-K.
Commercial Collaborations
Although we currently have a number of collaborations with corporate partners that govern the manufacture, sale, distribution and/or marketing of our products in various territories worldwide, the following commercial collaborations are those that are most significant to us from a financial statement perspective and where significant ongoing collaboration activity exists.
|
•
|
BMS.
In 2004, we entered into a collaboration arrangement with BMS to develop and commercialize the single tablet regimen of our Truvada and BMS's Sustiva in the United States. This combination was approved for use in the United States in 2006 and is sold under the brand name Atripla. We and BMS structured this collaboration as a joint venture and operate as a limited liability company named Bristol-Myers Squibb & Gilead Sciences, LLC, which we consolidate. We and BMS granted royalty free sublicenses to the joint venture for the use of our respective company owned technologies and, in return, were granted a license by the joint venture to use any intellectual property that results from the collaboration. In 2006, the joint venture's collaboration agreement was amended to allow the joint venture to sell Atripla into Canada. The economic interests of the joint venture held by us and BMS (including share of revenues and out-of-pocket expenses) are based on the portion of the net selling price of Atripla attributable to efavirenz and Truvada. Since the net selling price for Truvada may change over time relative to the net selling price of efavirenz, both our and BMS's respective economic interests in the joint venture may vary annually. Since the second quarter of 2011, except for a limited number of activities that will be jointly managed, the parties no longer coordinate detailing and promotional activities in the United States, and the parties have reduced their joint promotional efforts since we launched Complera in August 2011 and Stribild in August 2012. The agreement will continue until terminated by the mutual agreement of the parties. In addition, either party may terminate the other party's participation in the collaboration within 30 days after the launch of at least one generic version of such other party's single agent products (or the double agent products). The non-terminating party then has the right to continue to sell Atripla, but will be obligated to pay the terminating party certain royalties for a three-year period following the effective date of the termination.
|
In 2007, Gilead Sciences Limited, a wholly-owned subsidiary in Ireland, and BMS entered into a collaboration agreement under which we and BMS commercialize and distribute Atripla in the European Union, Iceland, Liechtenstein, Norway and Switzerland (collectively, the European Territory). The parties formed a limited liability company which we consolidate, to manufacture Atripla for distribution in the European Territory using efavirenz that it purchases from BMS at BMS's estimated net selling price of efavirenz in the European Territory. Starting in the first quarter of 2012, except for a limited number of activities that will be jointly managed, the parties no longer coordinate detailing and promotional activities in the region. As of
December 31, 2012
and
2011
, efavirenz purchased from BMS at BMS's estimated net selling price of efavirenz in the European Territory is included in inventories on our Consolidated Balance Sheets. The agreement will terminate upon the expiration of the last-to-expire patent which affords market exclusivity to Atripla or one of its components in the European countries covered by the agreement. In addition, either party may terminate the agreement for any reason and such termination will be effective on the later of December 31, 2013, or two calendar quarters after notice of termination. The non-terminating party has the right to continue to sell Atripla, but will be obligated to pay the terminating party certain royalties for a three-year period following the effective date of the termination. In the event the non-terminating party decides not to sell Atripla, the effective date of the termination will be the date Atripla is withdrawn in each country or the date on which a third party assumes distribution of Atripla, whichever is earlier.
|
•
|
GSK.
As a result of our acquisition of Myogen, Inc. (Myogen) in 2006, we assumed all rights to the March 2006 license and distribution and supply agreements between Myogen and GSK. Under the terms of the license agreement, GSK has exclusive rights to market ambrisentan (the active pharmaceutical ingredient in Letairis) under the name Volibris for pulmonary arterial hypertension in territories outside of the United States. Under the license agreement, we received an up-front payment of $20.0 million and, subject to the achievement of specific milestones, we are eligible to receive total additional milestone payments of $80.0 million. Through
December 31, 2012
, we have received $55.0 million of such potential milestone payments. In addition, we receive royalties based on net sales of Volibris in the GSK territories. GSK has an option to negotiate from us an
|
11
exclusive sublicense for additional therapeutic uses for Volibris in the GSK territories during the term of the license agreement. Under the agreement, we will continue to conduct and bear the expense of all clinical development activities that we believe are required to obtain and maintain regulatory approvals for Letairis and Volibris in the United States, Canada and the European Economic Area, and each party may conduct additional development activities in its territories at its own expense. The parties may agree to jointly develop ambrisentan for new indications in the licensed field, and each party will pay its share of external costs associated with such joint development. The agreement and GSK's obligation to pay royalties to us will terminate on a country-by-country basis on the earlier of the date on which generic equivalents sold in a country achieve a certain percentage of total prescriptions for the product plus its generic equivalents or the fifteenth anniversary of commercial launch in such country. GSK may terminate the agreement for any reason. Upon such termination, all rights to the product would revert to us. Either party may terminate the agreement in response to a material breach by the other party.
|
•
|
Janssen.
In 2009, we entered into a collaboration agreement with Janssen to develop and commercialize a fixed-dose combination of our Truvada and Janssen's rilpivirine. This combination was approved in the United States and European Union in 2011 and is sold under the brand name Complera in the United States and Eviplera in the European Union. Under the agreement, Janssen granted us an exclusive license to Complera/Eviplera worldwide excluding certain middle income and developing world countries and Japan. Neither party is restricted from combining its drugs with any other drugs.
|
Through
December 31, 2011
, we recorded €71.5 million (approximately $100.0 million) in reimbursable R&D expenses incurred by Janssen in the development of rilpivirine, which is the maximum amount reimbursable under the terms of the agreement. We are responsible for manufacturing Complera/Eviplera and have the lead role in registration, distribution and commercialization of the product in the licensed countries. Janssen has exercised a right to co-detail the combination product in some of the countries where Gilead is the selling party.
In July 2011 and February 2013, we amended the collaboration agreement to include distribution of Complera/Eviplera in the rest of the world. We will distribute the product in North America, Europe, Latin America (except Argentina and Mexico), Australia and New Zealand, while Janssen will distribute the product in the other regions, including Japan and Russia.
The price of the product is expected to be the sum of the price of Truvada and the price of rilpivirine purchased separately. The cost of rilpivirine purchased by us from Janssen for Complera/Eviplera will approximate the market price of rilpivirine, less a specified percentage of up to 30% in major markets.
Either party may terminate the collaboration agreement if Complera/Eviplera is withdrawn from the market or if a party materially breaches the agreement. We may terminate the agreement in the United States and Canada on or after the expiration of the last to expire patent for tenofovir disoproxil fumarate in the United States, and may terminate the agreement in any other country on or after the expiration of the last to expire patent for tenofovir disoproxil fumarate in a country of the European Union. Janssen may terminate the agreement in the United States and Canada on or after the expiration of the last to expire patent for rilpivirine in the United States, and may terminate the agreement in any other country on or after the expiration of the last to expire patent for rilpivirine in a country of the European Union.
12
Research Collaborations
We currently have a number of collaborations with corporate partners that govern our research and development (R&D) of certain compounds and drug candidates. Our research collaboration with Japan Tobacco Inc. (Japan Tobacco) is the only collaboration that is significant to us from a financial statement perspective and where significant ongoing collaboration activity exists.
|
•
|
Japan Tobacco.
In 2005, we entered into a licensing agreement with Japan Tobacco, under which Japan Tobacco granted us exclusive rights to develop and commercialize elvitegravir, a novel HIV integrase inhibitor, in all countries of the world, excluding Japan, where Japan Tobacco would retain such rights. Under the agreement, we are responsible for seeking regulatory approval in our territories and are required to use diligent efforts to commercialize a product for the treatment of HIV infection. We will bear all costs and expenses associated with such commercialization efforts. Under the terms of the agreement, we paid an up-front license fee of $15.0 million and are obligated to make total potential milestone payments of up to $90.0 million upon the achievement of certain clinical, regulatory and commercial objectives. Additionally, we are obligated to pay royalties based on any net sales in the territories where we market the product. Through
December 31, 2012
, we have made total milestone payments of $48.0 million. The agreement and our obligation to pay royalties to Japan Tobacco will terminate on a product-by-product basis as patents providing exclusivity for the product expire or, if later, on the tenth anniversary of commercial launch for such product. We may terminate the agreement for any reason in which case the license granted by Japan Tobacco to us would terminate. Either party may terminate the agreement in response to a material breach by the other party.
|
Research and Development
Our research and development philosophy and strategy is to develop best-in-class drugs that improve safety or efficacy for unmet medical needs. We intend to continue committing significant resources to research and development opportunities and business development activity.
Our product development efforts cover a wide range of medical conditions, including HIV/AIDS and liver diseases such as HBV and HCV, serious cardiovascular and respiratory conditions and inflammation/oncology . We have research scientists in Foster City, Fremont, Palo Alto, San Dimas and Oceanside, California; Branford, Connecticut; Seattle, Washington; and Mississauga, Ontario engaged in the discovery and development of new molecules and technologies that we hope will lead to the approval of new medicines addressing unmet needs.
The development of our product candidates is subject to various risks and uncertainties. These risks and uncertainties include our ability to enroll patients in clinical trials, the possibility of unfavorable results of our clinical trials, the need to modify or delay our clinical trials or to perform additional trials and the risk of failing to obtain regulatory approvals. As a result, our product candidates may never be successfully commercialized. Drug development is inherently risky and many product candidates fail during the drug development process.
Below is a summary of our key product candidates and their corresponding current stages of development. For additional information on our development pipeline, visit our website at www.gilead.com.
13
Product Candidates for the Treatment of HIV
|
Product Candidates
|
Description
|
|
|
Marketing Application Pending
|
|
|
|
Stribild
|
|
Our new drug application (NDA) for Stribild, a once-daily, single tablet regimen of elvitegravir, cobicistat, tenofovir disoproxil fumarate and emtricitabine for the treatment of HIV-1 infection in treatment-naïve adults, was approved by the FDA in August 2012. We filed for a marketing authorization application for Stribild with the European Medicines Agency in December 2011. We expect to receive approval from the European Commission in the second quarter of 2013.
|
|
Cobicistat
|
Cobicistat is a pharmacoenhancing or "boosting" agent that increases blood levels to allow once-daily dosing of certain HIV medicines that was approved as a component of Stribild in the United States and is under evaluation as a stand-alone boosting agent for certain other HIV medicines in treatment-naïve patients. In May 2012, we received validation from the EMA on our marketing authorization application for the product. In June 2012, we filed an NDA for approval of the product as a single agent.
|
|
|
Elvitegravir
|
Elvitegravir is an oral integrase inhibitor that was approved as a component of Stribild in the United States and is being evaluated as a standalone agent for HIV in treatment-experienced patients. In June 2012, we submitted an NDA for the product and received validation from the EMA on our marketing authorization application. Also in June 2012, we filed an NDA for the product as a single agent.
|
|
|
Product in Phase 3
|
||
|
Single tablet regimen of tenofovir alafenamide (TAF), elvitegravir, cobicistat and emtricitabine
|
A single tablet regimen of TAF, a nucleotide reverse transcriptase inhibitor formerly known as GS-7340, elvitegravir, cobicistat and emtricitabine is being evaluated for the treatment of HIV infection in treatment-naïve adults.
|
|
|
Product in Phase 2
|
|
|
|
Single tablet regimen of TAF, darunavir, cobicistat and emtricitabine
|
Under an agreement with Janssen R&D Ireland entered into in 2011, a single tablet regimen of TAF, darunavir, cobicistat and emtricitabine is being evaluated for the treatment of HIV infection.
|
|
14
Product Candidates for the Treatment of Liver Disease
|
Product Candidates
|
Description
|
|
|
Products in Phase 3
|
|
|
|
Sofosbuvir (GS-7977)
|
Sofosbuvir is a nucleotide NS5B inhibitor under evaluation in Phase 2 and Phase 3 trials for the treatment of HCV.
|
|
|
Single tablet regimen of sofosbuvir and ledipasvir (GS-5885)
|
A single tablet regimen of sofosbuvir and ledipasvir, an oral NS5A inhibitor, taken with and without ribavirin is under evaluation in Phase 3 trials for the treatment of HCV.
|
|
|
Products in Phase 2
|
||
|
GS-9451
|
GS-9451 is an oral NS3 protease inhibitor being evaluated for the treatment of hepatitis C.
|
|
|
GS-9669
|
GS-9669 is a non-nucleoside NS5B polymerase inhibitor under evaluation for the treatment of HCV.
|
|
|
Simtuzumab (GS-6624)
|
Simtuzumab is a monoclonal antibody being evaluated for the treatment of liver fibrosis, nonalcoholic steatohepatitis and primary sclerosing cholangitis.
|
|
|
Products in Phase 1
|
||
|
GS-5816
|
GS-5816 is a pan-genotypic NS5A inhibitor being evaluated for the treatment of HCV
|
|
|
GS-9620
|
GS-9620 is an oral TLR-7 agonist being evaluated for the treatment of HBV and HCV.
|
|
|
TAF
|
TAF is a nucleoside reverse transcriptase inhibitor under evaluation for the treatment of HBV.
|
|
Product Candidates for the Treatment of Cardiovascular Diseases
|
Product Candidates
|
Description
|
|
|
Product in Phase 3
|
|
|
|
Ranolazine
|
Ranolazine is a late sodium current inhibitor approved for the treatment of chronic angina, which is being evaluated for the treatment of incomplete revascularization post-percutaneous coronary intervention and the treatment of type II diabetes.
|
|
|
Product in Phase 2
|
||
|
Ranolazine
|
Ranolazine is also being evaluated for the treatment of paroxysmal atrial fibrillation.
|
|
|
Product in Phase 1
|
||
|
GS-6615
|
GS-6615 is a late sodium current inhibitor being evaluated for the treatment of ischemic heart disease and arrhythmias.
|
|
Product Candidates for the Treatment of Respiratory Diseases
|
Product Candidates
|
Description
|
|
|
Product in Phase 3
|
|
|
|
Aztreonam for inhalation solution
|
Aztreonam for inhalation solution is being evaluated for the treatment of bronchiectasis.
|
|
|
Product in Phase 2
|
|
|
|
GS-5806
|
GS-5806 is an
inhalable small molecule antiviral fusion inhibitor
being evaluated for the treatment of respiratory syncytial virus.
|
|
|
Simtuzumab
|
Simtuzumab is a monoclonal antibody being evaluated for the treatment of idiopathic pulmonary fibrosis.
|
|
15
Product Candidates for the Treatment of Oncology Diseases/Inflammation
|
Product Candidates
|
Description
|
|
|
Product in Phase 3
|
|
|
|
Idelalisib (GS-1101)
|
Idelalisib is a PI3K delta inhibitor antibody being evaluated for the treatment of chronic lymphocytic leukemia and indolent non-Hodgkin's lymphoma.
|
|
|
Products in Phase 2
|
|
|
|
Momelotinib (GS-0387/CYT387)
|
Momelotinib or GS-0387, formerly known as CYT387, is a JAK inhibitor being evaluated for the treatment of myelofibrosis.
|
|
|
Simtuzumab
|
Simtuzumab is a monoclonal antibody being evaluated for the treatment of myelofibrosis, colorectal cancer and pancreatic cancer.
|
|
|
Products in Phase 1
|
||
|
GS-9820
|
GS-9820 is a PI3K delta inhibitor being evaluated for the potential treatment of lymphoid malignancies.
|
|
|
GS-9973 in combination with idelalisib
|
GS-9973 is a SYK inhibitor being evaluated in combination with idelalisib for the potential treatment of hematological malignancies.
|
|
In total, our R&D expenses for
2012
were
$1.76 billion
compared with $1.23 billion for 2011 and $1.07 billion for 2010. In addition to our internal discovery and clinical development programs, we seek to add to our portfolio of products through product acquisitions and collaborations. The following table shows some of our recent acquisitions:
|
Year
|
Company
|
Therapeutic area
|
||
|
2009
|
CV Therapeutics, Inc.
|
Cardiovascular disorders
|
||
|
2010
|
CGI Pharmaceuticals, Inc.
|
Serious inflammatory diseases
|
||
|
2011
|
Arresto Biosciences, Inc.
|
Fibrotic diseases and cancer
|
||
|
2011
|
Calistoga Pharmaceuticals, Inc.
|
Cancer and inflammatory diseases
|
||
|
2012
|
Pharmasset
|
Chronic HCV
|
||
|
2013
|
YM Biosciences Inc.
|
Hematological and immune cell disorders and inflammatory diseases and cancers
|
||
Our largest transaction was the acquisition of Pharmasset in January 2012 for $11.05 billion. Pharmasset was a clinical-stage pharmaceutical company located in Princeton, New Jersey, committed to discovering, developing and commercializing novel drugs to treat viral infections. Pharmasset's primary focus was the development of oral therapeutics for the treatment of HCV infection. Through our acquisition of Pharmasset, we gained ownership of sofosbuvir, currently in Phase 3 trials for the treatment of HCV. See the Risk Factor entitled “The public announcement of data from clinical studies evaluating sofosbuvir and the fixed-dose combination of sofosbuvir and ledipasvir in HCV-infected patients is likely to cause significant volatility in our stock price” on page 31.
16
Patents and Proprietary Rights
U.S. and European Patent Expiration
We have a number of U.S. and foreign patents, patent applications and rights to patents related to our compounds, products and technology, but we cannot be certain that issued patents will be enforceable or provide adequate protection or that pending patent applications will result in issued patents.
The following table shows the estimated expiration dates (including Patent Term Extension, Supplementary Protection Certificates and/or Pediatric exclusivity where granted) in the United States and Europe for the primary (typically compound) patents for our Phase 3 product candidates. Patents do not cover the ranolazine compound. Instead, when it was discovered that only a sustained release formulation of ranolazine would achieve therapeutic plasma levels, patents were obtained on those formulations and the characteristic plasma levels they achieve. Dates in parentheses reflect the estimated expiration date of patents which may issue from currently pending applications. The estimated expiration dates do not include any potential additional exclusivity (e.g., patent term extension, supplementary protection certificates or pediatric exclusivity) that is not yet granted. For our product candidates that are single tablet regimens, the estimated patent expiration date provided corresponds to the latest expiring compound patent for one of the active ingredients in the single tablet regimen.
|
Phase 3 Product Candidates
|
Patent Expiration
|
||||
|
Product Candidates for the Treatment of HIV
|
U.S.
|
E.U.
|
|||
|
Cobicistat
|
2029
|
(2027)
|
|||
|
Elvitegravir
|
2023
|
2023
|
|||
|
Single tablet regimen of TAF, elvitegravir, cobicistat and emtricitabine
|
2029
|
(2027)
|
|||
|
Product Candidate for the Treatment of Liver Disease
|
|
|
|||
|
Sofosbuvir for the treatment of hepatitis C
|
2029
|
(2028)
|
|||
|
Single tablet regimen of sofosbuvir and ledipasvir for the treatment of hepatitis C
|
2030
|
(2030)
|
|||
|
Product Candidate for the Treatment of Respiratory Diseases
|
|
|
|||
|
Aztreonam for inhalation solution for the treatment of bronchiectasis
|
2021
|
2021
|
|||
|
Product Candidate for the Treatment of Cardiovascular Diseases
|
|
|
|||
|
Ranolazine for the treatment of incomplete revascularization post-percutaneous
coronary intervention and the treatment of type II diabetes
|
2019
|
2019
|
|||
|
Product Candidate for the Treatment of Oncology/Inflammation
|
|||||
|
Idelalisib for the treatment of chronic lymphocytic leukemia and indolent non-Hodgkin's lymphoma
|
2025
|
(2025)
|
|||
17
The following table shows the actual or estimated expiration dates (including Patent Term Extension, Supplementary Protection Certificates and/or Pediatric exclusivity where granted) in the United States and Europe for the primary (typically compound) patents for our marketed products. Patents do not cover the ranolazine compound. Instead, when it was discovered that only a sustained release formulation of ranolazine would achieve therapeutic plasma levels, patents were obtained on those formulations and the characteristic plasma levels they achieve. Dates in parentheses reflect the estimated expiration date of patents which may issue from currently pending applications. The expiration dates do not include any potential additional exclusivity (e.g., patent term extension, supplementary protection certificates or pediatric exclusivity) . For our product that are single tablet regimens (e.g., Truvada, Atripla, Complera and Stribild), the estimated patent expiration dates provided correspond to the latest expiring compound patent for one of the active ingredients in the single tablet regimen.
|
Products
|
Patent Expiration
|
||||
|
U.S.
|
E.U.
|
||||
|
Vistide
|
2010
|
2012
|
|||
|
Hepsera
|
2014
|
2016
|
|||
|
AmBisome
|
2016
|
2008
|
|||
|
Macugen
|
2017
|
2017
|
|||
|
Tamiflu
|
2017
|
2016
|
|||
|
Letairis
|
2018
|
2020
|
|||
|
Viread
|
2018*
|
2018
|
|||
|
Ranexa
|
2019
|
2023
|
|||
|
Atripla
|
2021
|
2018
|
|||
|
Cayston
|
2021
|
2021
|
|||
|
Emtriva
|
2021
|
2016
|
|||
|
Truvada
|
2021
|
2018
|
|||
|
Lexiscan
|
2022
|
2025
|
|||
|
Complera/Eviplera
|
2023
|
2022
|
|||
|
Stribild
|
2029
|
(2027)
|
|||
|
*
|
In February 2013, Gilead and Teva reached an agreement in principle to settle the ongoing patent litigation concerning the four patents that protect tenofovir disoproxil fumarate in our Viread, Truvada and Atripla products. Under the agreement, Teva will be allowed to launch a generic version of Viread on December 15, 2017. The settlement agreement must be filed with the Federal Trade Commission and Department of Justice for their review before it is final.
|
Patent Protection and Certain Challenges
Patents and other proprietary rights are very important to our business. If we have a properly drafted and enforceable patent, it can be more difficult for our competitors to use our technology to create competitive products and more difficult for our competitors to obtain a patent that prevents us from using technology we create. As part of our business strategy, we actively seek patent protection both in the United States and internationally and file additional patent applications, when appropriate, to cover improvements in our compounds, products and technology. We also rely on trade secrets, internal know-how, technological innovations and agreements with third parties to develop, maintain and protect our competitive position. Our ability to be competitive will depend on the success of this strategy.
Patents covering the active pharmaceutical ingredients of Stribild, Complera/Eviplera, Atripla, Truvada, Viread, Emtriva, Hepsera, Letairis, Vistide and Lexiscan are held by third parties. We acquired exclusive rights to these patents in the agreements we have with these parties. Patents do not cover the ranolazine compound, the active ingredient of Ranexa. Instead, when it was discovered that only a sustained release formulation of ranolazine would achieve therapeutic plasma levels, patents were obtained on those formulations and the characteristic plasma levels they achieve. Patents do not cover the active ingredients in AmBisome. Instead, we hold patents to the liposomal formulations of this compound and also protect formulations through trade secrets. In addition, we do not have patent filings in China or certain other Asian countries covering all forms of adefovir dipivoxil, the active ingredient in Hepsera. Asia is a major market for therapies for HBV, the indication for which Hepsera has been developed.
We may obtain patents for certain products many years before marketing approval is obtained for those products. Because patents have a limited life, which may begin to run prior to the commercial sale of the related product, the commercial value of the patent may be limited. However, we may be able to apply for patent term extensions. For example,
18
extensions for the patents or supplementary protection certificates on many of our products have been granted in the United States and in a number of European countries, compensating in part for delays in obtaining marketing approval. Similar patent term extensions may be available for other products that we are developing, but we cannot be certain we will obtain them in some countries.
It is also very important that we do not infringe the valid patents or proprietary rights of others and that we do not violate the agreements that grant proprietary rights to us. If we do infringe valid patents or violate these agreements, we may be prevented from commercializing products or from using the processes covered by those patents or agreements, or may be required to obtain a license from third parties to allow us to use their technology. We may be unable to obtain alternative technologies or any required license on reasonable terms or at all. If we fail to obtain these licenses or alternative technologies, we may be unable to develop or commercialize some or all of our products. For example, we are aware of a body of patents that may relate to our operation of Letairis Education and Access Program (LEAP), our restricted distribution program designed to support Letairis.
We own patents that claim sofosbuvir as a chemical entity and its metabolites. However, the existence of issued patents does not guarantee our right to practice the patented technology or commercialize the patented product. Third parties may have or obtain rights to patents which they may claim could be used to prevent or attempt to prevent us from commercializing the patented product candidates obtained from the Pharmasset acquisition. For example, we are aware of patents and patent applications owned by other parties that might be alleged to cover the use of sofosbuvir. If these other parties are successful in obtaining valid and enforceable patents, and establishing our infringement of those patents, we could be prevented from selling sofosbuvir unless we were able to obtain a license under such patents. If any license is needed it may not be available on commercially reasonable terms or at all.
Further, Gilead (as successor to Pharmasset) is a party to a collaboration agreement with Roche to develop PSI-6130, a cytidine analog, and its prodrugs for the treatment of chronic HCV infection. The collaborative research efforts under this agreement ended on December 31, 2006. Roche later asked Pharmasset to consider whether Roche may have contributed to the inventorship of sofosbuvir and whether Pharmasset has complied with the confidentiality provisions of the collaboration agreement. Pharmasset advised us that it carefully considered the issues raised by Roche and that it believed any such issues are without merit. We have also considered these issues and reached the same conclusion. Roche recently contacted us asserting that Roche has an exclusive license to sofosbuvir pursuant to the collaboration agreement. Roche alleges that sofosbuvir, a prodrug of a uridine monophosphate analog, is a prodrug of PSI-6130 and therefore Roche has an exclusive license. We believe Roche's claim is without merit. However, if Roche were to successfully establish inventorship or exclusive license rights to sofosbuvir, our expected revenues and earnings from the sale of sofosbuvir could be adversely affected.
Because patent applications are confidential for a period of time until a patent is issued, we may not know if our competitors have filed patent applications for technology covered by our pending applications or if we were the first to invent or first to file an application directed toward the technology that is the subject of our patent applications. Competitors may have filed patent applications or received patents and may obtain additional patents and proprietary rights that block or compete with our products. In addition, if competitors file patent applications covering our technology, we may have to participate in interference/derivation proceedings or litigation to determine the right to a patent. Litigation and interference/derivation proceedings are unpredictable and expensive, such that, even if we are ultimately successful, our results of operations may be adversely affected by such events.
Patents relating to pharmaceutical, biopharmaceutical and biotechnology products, compounds and processes such as those that cover our existing compounds, products and processes and those that we will likely file in the future, do not always provide complete or adequate protection. Future litigation or re-examination proceedings regarding the enforcement or validity of our existing patents or any future patents could invalidate our patents or substantially reduce their protection. From time to time, certain individuals or entities may challenge our patents. For example, in 2007, the Public Patent Foundation filed requests for re-examination with the U.S. Patent and Trademark Office (PTO) challenging four of our patents related to tenofovir disoproxil fumarate, which is an active ingredient in Atripla, Truvada, Complera/Eviplera, Stribild and Viread. The PTO granted these requests, and in 2008, the PTO confirmed the patentability of all four patents.
19
From time to time, we may become involved in disputes with inventors on our patents. For example, in March 2012, Jeremy Clark, a former employee of Pharmasset, which we acquired in January 2012, and inventor of U.S. Patent No. 7,429,572, filed a demand for arbitration in his lawsuit against Pharmasset and Dr. Raymond Schinazi. Mr. Clark initially filed the lawsuit against Pharmasset and Dr. Schinazi in February 2008 seeking to void the assignment provision in his employment agreement and assert ownership of U.S. Patent No. 7,429,572, which claims metabolites of sofosbuvir and RG7128. In December 2008, the court ordered a stay of the litigation pending the outcome of an arbitration proceeding required by Mr. Clark's employment agreement. Instead of proceeding with arbitration, Mr. Clark filed two additional lawsuits in September 2009 and June 2010, both of which were subsequently dismissed by the court. In September 2010, Mr. Clark filed a motion seeking reconsideration of the court's December 2008 order which was denied by the court. In December 2011, Mr. Clark filed a motion to appoint a special prosecutor. In February 2012, the court issued an order requiring Mr. Clark to enter arbitration or risk dismissal of his case. Mr. Clark filed a demand for arbitration in March 2012. The arbitration panel has set a hearing date for April 2013. We cannot predict the outcome of the arbitration. If Mr. Clark's prior assignment of this patent to Pharmasset is voided by the arbitration panel, and he is ultimately found to be the owner of the 7,429,572 patent and it is determined that we have infringed the patent, we may be required to obtain a license from and pay royalties to Mr. Clark to commercialize sofosbuvir and RG7128.
In some instances, we may be required to defend our right to a patent on an invention through an Interference proceeding before the PTO. An Interference is an administrative proceeding before the PTO designed to determine who was the first to invent the subject matter being claimed by both parties. In February 2012, we received notice that the PTO had declared an Interference between our U.S. Patent No. 7,429,572 and Idenix Pharmaceuticals, Inc.'s (Idenix) pending patent application no. 12/131868. Our patent covers metabolites of sofosbuvir and RG7128. Idenix is attempting to claim a class of compounds, including these metabolites, in their pending patent application. In the course of this proceeding, both parties will be called upon to submit evidence of the date they conceived of their respective inventions. The Interference will determine who was first to invent these compounds and therefore who is entitled to the patent claiming these compounds. If the administrative law judge determines Idenix is entitled to these patent claims and it is determined that we have infringed those claims, we may be required to obtain a license from and pay royalties to Idenix to commercialize sofosbuvir and RG7128. Any determination by the judge can be appealed by either party to U.S. Federal District Court.
In June 2012, we met with Idenix in mandatory settlement discussions. The parties were unable to settle the Interference due to our widely divergent views on the strength of our respective positions, on whether we need a license to Idenix's patents and whether Idenix needs a license to Gilead patents to develop and manufacture its pipeline products. We believe the Idenix application involved in the Interference and similar U.S. and foreign patents claiming the same compounds and metabolites are invalid. As a result, we filed an Impeachment Action in Canadian Federal Court to invalidate the Idenix CA2490191 patent, which is the Canadian patent that corresponds to the Idenix U.S. Patent No. 7608600 and the Idenix patent application that is the subject of the Interference. We filed a similar legal action in the Federal Court of Norway seeking to invalidate the corresponding Norwegian patent. We filed a similar legal action in the Federal Court of Australia seeking to invalidate the corresponding Australian patent. We may bring similar action in other countries in 2013. Idenix has not been awarded patents on these compounds and metabolites in European countries, Japan or China. In the event such patents issue, we expect to challenge them in proceedings similar to those we invoked in Canada, Norway and Australia.
Our pending patent applications and the patent applications filed by our collaborative partners may not result in the issuance of any patents or may result in patents that do not provide adequate protection. As a result, we may not be able to prevent third parties from developing compounds or products that are closely related to those which we have developed or are developing. In addition, certain countries in Africa and Asia, including China, do not provide effective enforcement of our patents, and third-party manufacturers are able to sell generic versions of our products in those countries.
Litigation with Generic Manufacturers
As part of the approval process of some of our products, the FDA granted an New Chemical Entity (NCE) exclusivity period during which other manufacturers' applications for approval of generic versions of our product will not be granted. Generic manufacturers may challenge the patents protecting products that have been granted exclusivity one year prior to the end of the exclusivity period. Generic manufacturers have sought and may continue to seek FDA approval for a similar or identical drug through an ANDA, the application form typically used by manufacturers seeking approval of a generic drug.
20
Tenofovir Disoproxil Fumarate, Emtricitabine and Fixed-dose Combination of Emtricitabine, Tenofovir Disoproxil Fumarate and Efavirenz
For example, in November 2008, we received notice that Teva Pharmaceuticals (Teva) submitted an ANDA to the FDA requesting permission to manufacture and market a generic version of Truvada. In the notice, Teva alleges that two of the patents associated with emtricitabine, owned by Emory University and licensed exclusively to us, are invalid, unenforceable and/or will not be infringed by Teva's manufacture, use or sale of a generic fixed-dose combination of emtricitabine and tenofovir disoproxil fumarate. In December 2008, we filed a lawsuit against Teva for infringement of the two emtricitabine patents. In March 2009, we received notice that Teva submitted an ANDA to the FDA requesting permission to manufacture and market a generic fixed-dose combination of emtricitabine, tenofovir disoproxil fumarate and efavirenz. In the notice, Teva challenged the same two emtricitabine patents. In May 2009, we filed another lawsuit against Teva for infringement of the two emtricitabine patents, and this lawsuit was consolidated with the lawsuit filed in December 2008. In January 2010, we received notice that Teva submitted an ANDA to the FDA requesting permission to manufacture and market a generic version of Viread. In the notice, Teva challenged four of the tenofovir disoproxil fumarate patents protecting Viread. In January 2010, we also received notices from Teva amending its ANDAs related to generic versions of our Atripla and Truvada products. In the notice related to Teva's ANDA for a generic version of Atripla, Teva challenged four patents related to tenofovir disoproxil fumarate, two additional patents related to emtricitabine and two patents related to efavirenz. In the notice related to Teva's ANDA for a generic version of Truvada, Teva challenged four patents related to tenofovir disoproxil fumarate and two additional patents related to emtricitabine. In March 2010, we filed lawsuits against Teva for infringement of the four Viread patents and two additional emtricitabine patents. In March 2010, Bristol-Myers Squibb Company and Merck & Co., Inc. filed a lawsuit against Teva for infringement of the patents related to efavirenz. Because we filed our lawsuits within the requisite 45 day period provided in the Hatch Waxman Act, there were stays preventing FDA approval of Teva's ANDAs for 30 months or until a court decision adverse to the patents. The 30-month stay for all three Teva ANDAs expired in July 2012. However, as a result of the court's scheduling orders, Teva is prohibited from launching at risk upon expiration of that 30-month stay. In February 2013, Gilead and Teva reached an agreement in principle to settle the ongoing patent litigation concerning the four patents that protect tenofovir disoproxil fumarate in our Viread, Truvada and Atripla products. The trial in this litigation, which was scheduled to begin on February 20, 2013, has been adjourned pending completion of activities necessary to finalize the settlement. Under the agreement, Teva will be allowed to launch a generic version of Viread on December 15, 2017. The settlement agreement must be filed with the Federal Trade Commission and Department of Justice for their review before it is final.
In November 2011, we received notice that Teva submitted an Abbreviated New Drug Submission (ANDS) to the Canadian Ministry of Health requesting permission to manufacture and market a generic fixed-dose combination of emtricitabine and tenofovir disoproxil fumarate. In the notice, Teva alleges that three of the patents associated with Truvada are invalid, unenforceable and/or will not be infringed by Teva's manufacture, use or sale of a generic version of Truvada. In January 2012, we filed a lawsuit against Teva seeking an order of prohibition against approval of this ANDS.
In December 2011, we received notice that Teva submitted an ANDS to the Canadian Ministry of Health requesting permission to manufacture and market a generic fixed-dose combination of emtricitabine, tenofovir disoproxil fumarate and efavirenz. In the notice, Teva alleges that three of our patents associated with Atripla and two of Merck's patents associated with Atripla are invalid, unenforceable and/or will not be infringed by Teva's manufacture, use or sale of a generic fixed-dose combination of emtricitabine, tenofovir disoproxil fumarate and efavirenz. In February 2012, we filed a lawsuit against Teva seeking an order of prohibition against approval of this ANDS.
In July 2012, we received notice that Lupin Limited (Lupin) submitted an ANDA to the FDA requesting permission to manufacture and market a generic version of Truvada. In the notice, Lupin alleges that four patents associated with emtricitabine and four patents associated with tenofovir disoproxil fumarate are invalid, unenforceable and/or will not be infringed by Lupin's manufacture, use or sale of a generic version of a fixed-dose combination of emtricitabine and tenofovir disoproxil fumarate. In August 2012, we filed a lawsuit against Lupin for infringement of our patents.
In July 2012, we received notice that Cipla Ltd. submitted an ANDA to the FDA requesting permission to manufacture and market a generic version of Emtriva and a generic version of Viread. In the notices, Cipla alleges that two patents associated with emtricitabine are invalid, unenforceable and/or will not be infringed by Cipla's manufacture, use or sale of a generic version of emtricitabine, and the four patents associated with tenofovir disoproxil fumarate are invalid, unenforceable and/or will not be infringed by Cipla's manufacture, use or sale of a generic version of tenofovir disoproxil fumarate. In August 2012, we filed lawsuits against Cipla for infringement of our patents.
21
In August 2012, we received notice that Teva submitted an ANDS to the Canadian Ministry of Health requesting permission to manufacture and market a generic version of tenofovir disoproxil fumarate. In the notice, Teva alleges that two patents associated with Viread are invalid, unenforceable and/or will not be infringed by Teva's manufacture, use or sale of a generic version of Viread. In September 2012, we filed a lawsuit against Teva seeking an order of prohibition against approval of this ANDS. Also in August 2012, Teva filed an Impeachment Action in Canadian Federal Court seeking invalidation of our two Canadian patents associated with Viread. We are currently defending that Impeachment Action.
In October 2012, we received notice that Lupin submitted an ANDA to the FDA requesting permission to manufacture and market a generic version of Viread. In the notice, Lupin alleges that four patents associated tenofovir disoproxil fumarate are invalid, unenforceable and/or will not be infringed by Lupin's manufacture, use or sale of a generic version of tenofovir disoproxil fumarate. In October 2012, we filed a lawsuit against Lupin for infringement of our patents.
Ranolazine
In June 2010, we received notice that Lupin submitted an ANDA to the FDA requesting permission to manufacture and market a generic version of sustained release ranolazine. In the notice, Lupin alleges that ten of the patents associated with Ranexa are invalid, unenforceable and/or will not be infringed by Lupin's manufacture, use or sale of a generic version of Ranexa. In July 2010, we filed a lawsuit against Lupin for infringement of our patents for Ranexa. The FDA cannot approve Lupin's ANDA until we receive a court decision or upon the expiration of the court's automatic stay in July 2013. The court has scheduled the trial to begin in April 2013. If the court finds that none of the patents that protect our Ranexa formulation are infringed and/or that all are invalid and Lupin receives final approval of their product, Lupin will be able to launch generic version of our Ranexa product “at risk” upon issuance of that decision.
Adefovir Disoproxil
In August 2010, we received notice that Sigmapharm Labs (Sigmapharm) submitted an ANDA to the FDA requesting permission to manufacture and market a generic adefovir dipivoxil. In the notice, Sigmapharm alleges that both of the patents associated with Hepsera are invalid, unenforceable and/or will not be infringed by Sigmapharm's manufacture, use or sale of a generic version of Hepsera. In September 2010, we filed a lawsuit against Sigmapharm for infringement of our patents. The FDA cannot approve Sigmapharm's ANDA until we receive a court decision or upon the expiration of the court's automatic stay in February 2013. The court has not yet set a trial date in this case but we anticipate that trial will occur in mid-2013. Upon expiry of the 30-month stay in February 2013, if Sigmapharm obtains final FDA approval of its product from the FDA, it may elect to launch its generic product “at risk” of infringing our patents prior to the decision of the court.
One of the patents challenged by Sigmapharm has also been challenged by Ranbaxy, Inc. (Ranbaxy) pursuant to a notice received in October 2010. The patent challenged by Ranbaxy expires in July 2018. We have the option of filing a lawsuit at any time if we believe that Ranbaxy is infringing our patent.
Tamiflu
In February 2011, we received notice that Natco Pharma Ltd. (Natco) submitted an ANDA to the FDA requesting permission to manufacture and market a generic oseltamivir phosphate. In the notice, Natco alleges that one of the patents associated with Tamiflu is invalid, unenforceable and/or will not be infringed by Natco's manufacture, use or sale of a generic version of Tamiflu. In March 2011, we and F. Hoffmann-La Roche Ltd. filed a lawsuit against Natco for infringement of one of the patents associated with Tamiflu. In December 2012, the court issued a ruling in favor of Gilead and Roche, that our patent is not invalid for the reasons stated in Natco's notice letter.
We cannot predict the ultimate outcome of these actions, and we may spend significant resources enforcing and defending these patents. If we are unsuccessful in these lawsuits, some or all of our original claims in the patents may be narrowed or invalidated and the patent protection for Atripla, Truvada, Viread, Hepsera, Ranexa and Tamiflu in the United States and Atripla, Truvada and Viread in Canada could be substantially shortened. Further, if all of the patents covering one or more products are invalidated, the FDA or Canadian Ministry of Health could approve the requests to manufacture a generic version of such products in the United States or Canada, respectively, prior to the expiration date of those patents. The sale of generic versions of these products, other than Hepsera, earlier than their patent expiration would have a significant negative effect on our revenues and results of operations.
Trade Secrets
We also rely on unpatented trade secrets and improvements, unpatented internal know-how and technological innovation. In particular, a great deal of our liposomal manufacturing expertise, which is a key component of our liposomal technology, is not covered by patents but is instead protected as a trade secret. We protect these rights mainly through confidentiality agreements with our corporate partners, employees, consultants and vendors. These agreements provide that all confidential information developed or made known to an individual during the course of their relationship with us will be kept confidential and will not be used or disclosed to third parties except in specified circumstances. In the case of employees,
22
the agreements provide that all inventions made by an individual while employed by us will be our exclusive property. We cannot be certain that these parties will comply with these confidentiality agreements, that we have adequate remedies for any breach or that our trade secrets will not otherwise become known or be independently discovered by our competitors. Under some of our R&D agreements, inventions become jointly owned by us and our corporate partner and in other cases become the exclusive property of one party. In certain circumstances, it can be difficult to determine who owns a particular invention and disputes could arise regarding those inventions.
Manufacturing and Raw Materials
Our manufacturing strategy is to contract with third parties to manufacture the majority of our active pharmaceutical ingredients and solid dose products. We also rely on our corporate partners to manufacture certain of our products. Additionally, we own or lease manufacturing facilities in San Dimas, California; Edmonton, Alberta, Canada; Cork, Ireland and Oceanside, California, where we manufacture certain products and active pharmaceutical ingredients for clinical and commercial uses.
Manufacturing of our Products
We contract with third parties to manufacture certain products for clinical and commercial purposes, including Stribild, Complera/Eviplera, Atripla, Truvada, Viread, Hepsera, Emtriva, Ranexa and Vistide. We use multiple third-party contract manufacturers to manufacture tenofovir disoproxil fumarate, the active pharmaceutical ingredient in Viread and one of the active pharmaceutical ingredients in Stribild, Complera/Eviplera, Atripla, Truvada; and emtricitabine, the active pharmaceutical ingredient in Emtriva and one of the active pharmaceutical ingredients in Atripla, Truvada, Complera/Eviplera and Stribild. We rely on a single third-party manufacturer to manufacture the active pharmaceutical ingredient of Cayston. We are the exclusive manufacturer of the active pharmaceutical ingredients in Hepsera, Letairis and Vistide.
We also rely on third-party contract manufacturers to tablet or capsulate products. For example, we use multiple third-party contract manufacturers to tablet Stribild, Complera/Eviplera, Atripla, Truvada, Viread, Hepsera and Ranexa. Emtriva encapsulation is also completed by third-party contract manufacturers. We rely on a single third-party supplier to manufacture Letairis tablets.
We also have manufacturing agreements with many of our corporate partners. Roche, by itself and through third parties, is responsible for manufacturing Tamiflu. Under our agreement with Roche, through a joint manufacturing committee composed of representatives from Roche and us, we have the opportunity to review Roche's existing manufacturing capacity for Tamiflu and global plans for manufacturing Tamiflu. Astellas US LLC, our corporate partner for Lexiscan in the United States, is responsible for the commercial manufacture and supply of product in the United States and is dependent on a single supplier for the active pharmaceutical ingredient of Lexiscan. PARI Pharma GmbH is responsible for the manufacturing of the device required to administer Cayston to the lungs of patients. This device is made by a single supplier at a single site.
For our future products, we continue to develop additional manufacturing capabilities and establish additional third-party suppliers to manufacture sufficient quantities of our product candidates to undertake clinical trials and to manufacture sufficient quantities of any product that is approved for commercial sale. If we are unable to develop manufacturing capabilities internally or contract for large scale manufacturing with third parties on acceptable terms for our future products, our ability to conduct large scale clinical trials and meet customer demand for commercial products will be adversely affected.
Our Manufacturing Facilities
At our San Dimas, California manufacturing facility, we manufacture, fill and package solid dosage form products. We manufacture Cayston and AmBisome at our San Dimas facility. We depend on a single supplier for the active pharmaceutical ingredient in Cayston and for the high quality cholesterol used in the manufacture of AmBisome. We also fill and package solid dosage form products, including Stribild, Complera/Eviplera, Atripla, Truvada, Viread, Emtriva and Ranexa, in their finished forms and label Hepsera at our facilities in San Dimas. Because we are the exclusive supplier of AmBisome, in the event of a disaster, including an earthquake, equipment failure or other difficulty, we may be unable to replace this manufacturing capacity in a timely manner and may be unable to manufacture AmBisome to meet market needs.
We fill and package drug product for Stribild, Atripla, Truvada, Viread and Cayston in their finished forms and label Hepsera and Emtriva at our facilities in Cork, Ireland. We also perform quality control testing, final labeling and packaging of AmBisome and final release of many of our products for the European Union and elsewhere at this facility. We utilize our Cork, Ireland facility primarily for solid dose tablet manufacturing of certain of our antiviral products, as well as product packaging activities. We distribute our products to the European Union and other international markets from our Dublin, Ireland site.
23
At our Edmonton, Alberta facility in Canada, we carry out process research and scale-up of our clinical development candidates, manufacture active pharmaceutical ingredients for both investigational and commercial products and conduct chemical development activities to improve existing commercial manufacturing processes. We also manufacture the active pharmaceutical ingredients in Hepsera, Letairis and Vistide exclusively at our Edmonton site, although another supplier is qualified to make the active pharmaceutical ingredient in Letairis.
Our Oceanside, California facility is designed and equipped to produce biologic compounds for toxicological, Phase 1 and Phase 2 clinical studies. We use the facility for the process development and manufacture of simtuzumab, an investigational monoclonal antibody candidate in development for treatment of certain cancers and for fibrotic diseases, and another antibody which is currently in Phase 2 clinical trials.
Third-party Manufacturers
Our third-party manufacturers and our corporate partners are independent entities who are subject to their own unique operational and financial risks which are out of our control. If we or any of our third-party manufacturers or our corporate partners fail to perform as required, this could impair our ability to deliver our products on a timely basis or receive royalties or cause delays in our clinical trials and applications for regulatory approval. To the extent these risks materialize and affect their performance obligations to us, our financial results may be adversely affected. For example, in 2012, due to unexpected delays both in qualifying two new external sites and with expanding Cayston manufacturing in San Dimas, we were unable to supply enough Cayston to fulfill our projected demand. During February through September 2012, we suspended access for patients with new prescriptions for Cayston, subject to certain exceptions where specific medical need exists. As a result of our inability to manufacture sufficient Cayston to meet demand, the amount of revenues we received from the sale of Cayston was reduced.
We believe the technology we use to manufacture our products is proprietary. For products manufactured by our third-party contract manufacturers, we have disclosed all necessary aspects of this technology to enable them to manufacture the products for us. We have agreements with these third-party manufacturers that are intended to restrict these manufacturers from using or revealing this technology, but we cannot be certain that these third-party manufacturers will comply with these restrictions. In addition, these third-party manufacturers could develop their own technology related to the work they perform for us that we may need to manufacture our products. We could be required to enter into additional agreements with these third-party manufacturers if we want to use that technology ourselves or allow another manufacturer to use that technology. The third-party manufacturer could refuse to allow us to use their technology or could demand terms to use their technology that are not acceptable to us.
Regulation of Manufacturing Process
The manufacturing process for pharmaceutical products is highly regulated and regulators may shut down manufacturing facilities that they believe do not comply with regulations. We, our third-party manufacturers and our corporate partners are subject to current Good Manufacturing Practices, which are extensive regulations governing manufacturing processes, stability testing, record keeping and quality standards as defined by the FDA and the EMA. Similar regulations are in effect in other countries.
Our manufacturing operations are subject to routine inspections by regulatory agencies. For example, in January and February 2010, the FDA conducted a routine inspection of our San Dimas, California, manufacturing and distribution facility, where we manufacture AmBisome and Cayston and package solid dosage form products. At the conclusion of that inspection, the FDA issued Form 483 Inspectional Observations stating concerns over: the maintenance of aseptic processing conditions in the manufacturing suite for our AmBisome product; environmental maintenance issues in the San Dimas warehousing facility; batch sampling; and the timeliness of completion of annual product quality reports. On September 24, 2010, our San Dimas manufacturing facility received a Warning Letter from the FDA further detailing the FDA's concerns over the AmBisome manufacturing environment, including control systems and monitoring, procedures to prevent microbiological contamination and preventative cleaning and equipment maintenance. Referencing certain Viread lots, the letter also stated concerns connected with quality procedures, controls and investigation procedures, and a generalized concern over the effectiveness of the San Dimas quality unit in carrying out its responsibilities. In November and December 2010, the FDA re-inspected the San Dimas facility. The re-inspection closed with no additional Form 483 observations. In August 2011, the FDA notified us that we resolved all issues raised by the FDA in its Warning Letter.
24
Access to Supplies and Materials
We need access to certain supplies and products to manufacture our products. If delivery of material from our suppliers were interrupted for any reason or if we are unable to purchase sufficient quantities of raw materials used to manufacture our products, we may be unable to ship certain of our products for commercial supply or to supply our product candidates in development for clinical trials. For example, a significant portion of the raw materials and intermediates used to manufacture our HIV products (Stribild, Complera/Eviplera, Atripla, Truvada, Viread and Emtriva) are supplied by Chinese-based companies. As a result, an international trade dispute between China and the United States or any other actions by the Chinese government that would limit or prevent Chinese companies from supplying these materials would adversely affect our ability to manufacture and supply our HIV products to meet market needs and have a material and adverse effect on our operating results.
Seasonal Operations and Backlog
Our worldwide product sales do not reflect any significant degree of seasonality. However, our royalty revenues, which represented approximately
3%
of our total revenues in 2012 and included Tamiflu royalties, are affected by seasonality. Royalty revenue that we recognize from Roche's sales of Tamiflu can be impacted by the severity of flu seasons and product delivery in response to the influenza pandemics.
For the most part, we operate in markets characterized by short lead times and the absence of significant backlogs. We do not believe that backlog information is material to our business as a whole.
Government Regulation
Our operations and activities are subject to extensive regulation by numerous government authorities in the United States and other countries. In the United States, drugs are subject to rigorous FDA regulation. The Federal Food, Drug and Cosmetic Act and other federal and state statutes and regulations govern the testing, manufacture, safety, efficacy, labeling, storage, record keeping, approval, advertising and promotion of our products. As a result of these regulations, product development and product approval processes are very expensive and time consuming.
The FDA must approve a drug before it can be sold in the United States. The general process for this approval is as follows:
Preclinical Testing
Before we can test a drug candidate in humans, we must study the drug in laboratory experiments and in animals to generate data to support the drug candidate's potential benefits and safety. We submit this data to the FDA in an investigational new drug (IND) application seeking its approval to test the compound in humans.
Clinical Trials
If the FDA accepts the investigational new drug application, the drug candidate can then be studied in human clinical trials to determine if the drug candidate is safe and effective. These clinical trials involve three separate phases that often overlap, can take many years and are very expensive. These three phases, which are subject to considerable regulation, are as follows:
|
•
|
Phase 1. The drug candidate is given to a small number of healthy human control subjects or patients suffering from the indicated disease, to test for safety, dose tolerance, pharmacokinetics, metabolism, distribution and excretion.
|
|
•
|
Phase 2. The drug candidate is given to a limited patient population to determine the effect of the drug candidate in treating the disease, the best dose of the drug candidate, and the possible side effects and safety risks of the drug candidate. It is not uncommon for a drug candidate that appears promising in Phase 1 clinical trials to fail in the more rigorous Phase 2 clinical trials.
|
|
•
|
Phase 3. If a drug candidate appears to be effective and safe in Phase 2 clinical trials, Phase 3 clinical trials are commenced to confirm those results. Phase 3 clinical trials are conducted over a longer term, involve a significantly larger population, are conducted at numerous sites in different geographic regions and are carefully designed to provide reliable and conclusive data regarding the safety and benefits of a drug candidate. It is not uncommon for a drug candidate that appears promising in Phase 2 clinical trials to fail in the more rigorous and extensive Phase 3 clinical trials.
|
25
FDA Approval Process
When we believe that the data from the Phase 3 clinical trials show an adequate level of safety and efficacy, we submit the appropriate filing, usually in the form of an NDA or supplemental NDA, with the FDA seeking approval to sell the drug candidate for a particular use. The FDA may hold a public hearing where an independent advisory committee of expert advisors asks additional questions and makes recommendations regarding the drug candidate. This committee makes a recommendation to the FDA that is not binding but is generally followed by the FDA. If the FDA agrees that the compound has met the required level of safety and efficacy for a particular use, it will allow us to sell the drug candidate in the United States for that use. It is not unusual, however, for the FDA to reject an application because it believes that the drug candidate is not safe enough or efficacious enough or because it does not believe that the data submitted is reliable or conclusive.
At any point in this process, the development of a drug candidate can be stopped for a number of reasons including safety concerns and lack of treatment benefit. We cannot be certain that any clinical trials that we are currently conducting or any that we conduct in the future will be completed successfully or within any specified time period. We may choose, or the FDA may require us, to delay or suspend our clinical trials at any time if it appears that the patients are being exposed to an unacceptable health risk or if the drug candidate does not appear to have sufficient treatment benefit.
The FDA may also require Phase 4 non-registrational studies to explore scientific questions to further characterize safety and efficacy during commercial use of our drug. The FDA may also require us to provide additional data or information, improve our manufacturing processes, procedures or facilities or may require extensive surveillance to monitor the safety or benefits of our product candidates if it determines that our filing does not contain adequate evidence of the safety and benefits of the drug. In addition, even if the FDA approves a drug, it could limit the uses of the drug. The FDA can withdraw approvals if it does not believe that we are complying with regulatory standards or if problems are uncovered or occur after approval.
In addition to obtaining FDA approval for each drug, we obtain FDA approval of the manufacturing facilities for any drug we sell, including those of companies who manufacture our drugs for us. All of these facilities are subject to periodic inspections by the FDA. The FDA must also approve foreign establishments that manufacture products to be sold in the United States and these facilities are subject to periodic regulatory inspection. Our manufacturing facilities located in California, including our Oceanside and San Dimas facilities, also must be licensed by the State of California in compliance with local regulatory requirements. Our manufacturing facilities located in Canada, including our Edmonton, Alberta facility, and our facilities located near Dublin and in Cork, Ireland, also must obtain local licenses and permits in compliance with local regulatory requirements.
Drugs that treat serious or life threatening diseases and conditions that are not adequately addressed by existing drugs, and for which the development program is designed to address the unmet medical need, may be designated as fast track candidates by the FDA and may be eligible for accelerated and priority review. Drugs for the treatment of HIV infection that are designated for use under the U.S. President's Emergency Plan for AIDS Relief may also qualify for an expedited or priority review. Atripla, Truvada, Viread and Complera received accelerated approval and priority reviews. Drugs receiving accelerated approval must be monitored in post-marketing clinical trials in order to confirm the safety and benefits of the drug.
Because Congress did not agree to a package of tax and federal spending proposals on January 1, 2013, absent further Congressional action, an automatic reduction in federal spending or “sequestration” will take effect on March 1, 2013. Under sequestration, across-the board cuts will be implemented, which is expected to effect the operations of governmental agencies, including the FDA. As a result, the FDA may be unable to review and approve new drug applications in the currently anticipated timelines. Any significant delay in the timing of our anticipated product approvals may reduce our anticipated future revenue and earnings and could negatively affect our stock price.
Drugs are also subject to extensive regulation outside of the United States. In the European Union, there is a centralized approval procedure that authorizes marketing of a product in all countries of the European Union (which includes most major countries in Europe). If this centralized approval procedure is not used, approval in one country of the European Union can be used to obtain approval in another country of the European Union under one of two simplified application processes: the mutual recognition procedure or the decentralized procedure, both of which rely on the principle of mutual recognition. After receiving regulatory approval through any of the European registration procedures, separate pricing and reimbursement approvals are also required in most countries. The European Union also has requirements for approval of manufacturing facilities for all products that are approved for sale by the EU regulatory authorities.
26
Pricing and Reimbursement
Successful commercialization of our products depends, in part, on the availability of governmental and third-party payer reimbursement for the cost of such products and related treatments. Government health administration authorities, private health insurers and other organizations generally provide reimbursement. In the United States, the European Union and other significant or potentially significant markets for our products and product candidates, government authorities and third-party payers are increasingly attempting to limit or regulate the price of medical products and services, particularly for new and innovative products and therapies, which has resulted in lower average selling prices.
A significant portion of our sales of the majority of our products are subject to significant discounts from list price and rebate obligations. In the United States, state AIDS Drug Assistant Programs (ADAPs), which purchase a significant portion of our HIV products, rely on federal, supplemental federal and state funding to help fund purchases of our products. Given the current economic downturn, we have experienced a shift in our payer mix as patients previously covered by private insurance move to public reimbursement programs that require rebates or discounts from us or as patients previously covered by one public reimbursement program move to another public reimbursement program that requires greater rebates or discounts from us. As a result of this shift, revenue growth may be lower than prescription growth. Absent further Congressional action, an automatic reduction in federal spending or “sequestration” will take effect on March 1, 2013. Under sequestration, across-the board cuts will be implemented and could potentially cut the amount of federal and state funds to support ADAP programs. If federal and state funds are not available in amounts sufficient to support the number of patients that rely on ADAPs, sales of our HIV products could be negatively impacted which would reduce our revenues. For example, during the first quarter of 2011, the state budget crisis in Florida led to a temporary movement of patients who were previously covered by Florida's ADAP into industry-supported patient assistance programs. In prior quarters, because of the insufficiency of federal and state funds and as many states reduced eligibility criteria, we saw an increase in the number of patients on state ADAP wait lists, and we may see similar increases in future periods as a result of any cut in federal and state ADAP support resulting from the sequestration. Until these patients are enrolled in ADAP, they generally receive product from industry-supported patient assistance programs or are unable to access treatment. The increased emphasis on managed healthcare in the United States and on country and regional pricing and reimbursement controls in the European Union will put additional pressure on product pricing, reimbursement and usage, which may adversely affect our product sales and profitability. These pressures can arise from rules and practices of managed care groups, judicial decisions and governmental laws and regulations related to Medicare, Medicaid and healthcare reform, pharmaceutical reimbursement policies and pricing in general.
In Europe, the success of our commercialized products, and any other product candidates we may develop, will depend largely on obtaining and maintaining government reimbursement, because in many European countries patients are unlikely to use prescription drugs that are not reimbursed by their governments. In addition, negotiating prices with governmental authorities can delay commercialization by 12 months or more. Reimbursement policies may adversely affect our ability to sell our products on a profitable basis. In many international markets, governments control the prices of prescription pharmaceuticals, including through the implementation of reference pricing, price cuts, rebates, revenue-related taxes and profit control, and they expect prices of prescription pharmaceuticals to decline over the life of the product or as volumes increase.
Recently, many countries in the European Union have increased the amount of discounts required on our products, and these efforts could continue as countries attempt to manage healthcare expenditures, especially in light of the severe fiscal and debt crises experienced by many countries in the European Union. For example, in June 2010, Spain imposed an incremental discount on all branded drugs and in August 2010, Germany increased the rebate on prescription pharmaceuticals. As generic drugs come to market, we may face price decreases for our products in some countries in the European Union. Further, cost containment pressures in the European Union could lead to delays in the treatment of patients and also delay pricing approval, which could negatively impact the commercialization of new products.
Government agencies also issue regulations and guidelines directly applicable to us and to our products. In addition, from time to time, professional societies, practice management groups, private health/science foundations and organizations publish guidelines or recommendations directed to certain health care and patient communities. Such recommendations and guidelines may relate to such matters as product usage, dosage, route of administration, and use of related or competing therapies and can consequently result in increased or decreased usage of our products. For example, recent HIV treatment guidelines in the United States and abroad have endorsed earlier diagnosis and treatment.
27
United States Healthcare Reform
Legislative and regulatory changes to government prescription drug procurement and reimbursement programs occur relatively frequently in the United States. In March 2010, healthcare reform legislation was adopted in the United States. As a result, we are required to further rebate or discount products reimbursed or paid for by various public payers, including Medicaid and other entities eligible to purchase discounted products through the 340B Drug Pricing Program under the Public Health Service Act, such as ADAPs. As a result of the 2010 legislation, the discounts, rebates and fees that impacted us include:
|
•
|
our minimum base rebate amount owed to Medicaid on products reimbursed by Medicaid increased by 8%, and the discounts or rebates we owe to ADAPs and other Public Health Service entities which reimburse or purchase our products also increased by 8%;
|
|
•
|
we are required to extend rebates to patients receiving our products through Medicaid managed care organizations;
|
|
•
|
we are required to provide a 50% discount on products sold to patients while they are in the Medicare Part D “donut hole;” and
|
|
•
|
we, along with other pharmaceutical manufacturers of branded drug products, were required to pay a portion of a new industry fee (also known as the pharmaceutical excise tax), of $2.8 billion for 2012, calculated based on select government sales during the 2010 calendar year as a percentage of total industry government sales.
|
The amount of the industry fee imposed on the pharmaceutical industry as a whole increased to $2.8 billion for 2012 and 2013, with additional increases over the next several years to a peak of $4.1 billion per year in 2018, and then decrease to $2.8 billion in 2019 and thereafter. As the amount of the industry fee increases, our product sales increase and drug patents expire on major drugs of other companies, we expect our portion of the excise tax to increase as well. We estimate our portion of the pharmaceutical excise tax to be approximately $100-$120 million in 2013, compared to approximately $85 million in 2012. The excise tax is not tax deductible.
Further, even though not addressed in the healthcare reform legislation, discussions continue at the federal level on legislation that would either allow or require the federal government to directly negotiate price concessions from pharmaceutical manufacturers or set minimum requirements for Medicare Part D pricing.
In addition, state Medicaid programs could request additional supplemental rebates on our products as a result of the increase in the federal base Medicaid rebate. Private insurers could also use the enactment of these increased rebates to exert pricing pressure on our products, and to the extent that private insurers or managed care programs follow Medicaid coverage and payment developments, the adverse effects may be magnified by private insurers adopting lower payment schedules.
Health Care Fraud and Abuse Laws and Anti-Bribery Laws
We are subject to various federal and state laws pertaining to health care “fraud and abuse,” including anti-kickback laws and false claims laws. Anti-kickback laws make it illegal for a prescription drug manufacturer to solicit, offer, receive or pay any remuneration in exchange for, or to induce, the referral of business, including the purchase or prescription of a particular drug. Due to the breadth of the statutory provisions and the increasing attention being given to them by law enforcement authorities, it is possible that certain of our practices may be challenged under anti-kickback or similar laws. False claims laws generally prohibit anyone from knowingly presenting, or causing to be presented, a false or fraudulent claim for payment by federal and certain state payers (including Medicare and Medicaid), or knowingly making, using or causing to be made or used, a false record or statement material to a false or fraudulent claim. Our sales, marketing and medical activities may be subject to scrutiny under these laws. In addition, the U.S. Foreign Corrupt Practices Act and similar worldwide anti-bribery laws generally prohibit companies and their intermediaries from making improper payments for the purpose of obtaining or retaining business. Our policies mandate compliance with these anti-bribery laws. We operate in parts of the world that have experienced governmental corruption to some degree. In certain circumstances, strict compliance with anti-bribery laws may conflict with local customs and practices or may require us to interact with doctors and hospitals, some of which may be state controlled, in a manner that is different than local custom. Despite our training and compliance program, our internal control policies and procedures may not protect us from reckless or criminal acts committed by our employees or agents. Violations of fraud and abuse laws or anti-bribery laws may be punishable by criminal and/or civil sanctions, including fines and civil monetary penalties, as well as the possibility of exclusion from federal health care programs (including Medicare and Medicaid). Violations can also lead to the imposition of a Corporate Integrity Agreement or similar government oversight program. If the government were to allege against or convict us of violating these laws, there could be a disruption on our business and material adverse effect on our results of operations.
28
Compulsory Licenses
In a number of developing countries, government officials and other interested groups have suggested that pharmaceutical companies should make drugs for HIV infection available at low cost. Alternatively, governments in those developing countries could require that we grant compulsory licenses to allow competitors to manufacture and sell their own versions of our products, thereby reducing our product sales. For example, in the past, certain offices of the government of Brazil have expressed concern over the affordability of our HIV products and declared that they were considering issuing compulsory licenses to permit the manufacture of otherwise patented products for HIV infection, including Viread. In July 2009, the Brazilian patent authority rejected our patent application for tenofovir disoproxil fumarate, the active pharmaceutical ingredient in Viread. This was the highest level of appeal available to us within the Brazilian patent authority. Because we do not currently have a patent in Brazil, the Brazilian government now purchases its supply of tenofovir disoproxil fumarate from generic manufacturers.
In addition, concerns over the cost and availability of Tamiflu related to a potential avian flu pandemic and H1N1 influenza generated international discussions over compulsory licensing of our Tamiflu patents. For example, the Canadian government considered allowing Canadian manufacturers to manufacture and export the active ingredient in Tamiflu to eligible developing and least developed countries under Canada's Access to Medicines Regime. Furthermore, Roche issued voluntary licenses to permit third-party manufacturing of Tamiflu. For example, Roche granted a sublicense to Shanghai Pharmaceutical (Group) Co., Ltd. for China and a sublicense to India's Hetero Drugs Limited for India and certain developing countries. Should one or more compulsory licenses be issued permitting generic manufacturing to override our Tamiflu patents, or should Roche issue additional voluntary licenses to permit third-party manufacturing of Tamiflu, those developments could reduce royalties we receive from Roche's sales of Tamiflu. Certain countries do not permit enforcement of our patents, and third-party manufacturers are able to sell generic versions of our products in those countries. Compulsory licenses or sales of generic versions of our products could significantly reduce our sales and adversely affect our results of operations, particularly if generic versions of our products are imported into territories where we have existing commercial sales.
Employees
As of January 31, 2013, we had approximately 5,000 full-time employees. We believe we have good relations with our employees.
Environment, Health and Safety
We are voluntarily assessing and publicly reporting our greenhouse gas emissions and water usage, and have begun to take action to reduce such emissions and usage. For example we have established employee commuter programs, evaluated the energy efficiency of our buildings and installed low-flow water fixtures. Various laws and regulations have been implemented or are under consideration to mitigate the effects of climate change caused by greenhouse gas emissions. For example, the California Air Resources Board is in the process of drafting regulations to meet state emissions targets. Based on current information and subject to the finalization of the proposed regulations, we believe that our primary risk related to climate change is the risk of increased energy costs. However, because we are not an energy intensive business, we do not anticipate being subject to a cap and trade system or any other mitigation measures that would likely be material to our capital expenditures, results of operations or competitive position.
We are also subject to other federal, state and local regulations regarding workplace safety and protection of the environment. We use hazardous materials, chemicals, viruses and various radioactive compounds in our R&D activities and cannot eliminate the risk of accidental contamination or injury from these materials. Certain misuse or accidents involving these materials could lead to significant litigation, fines and penalties. We have implemented proactive programs to reduce and minimize the risk of hazardous materials incidents.
Other Information
We are subject to the information requirements of the Exchange Act. Therefore, we file periodic reports, proxy statements and other information with the SEC. Such reports, proxy statements and other information may be obtained by visiting the Public Reference Room of the SEC at 100 F Street, NE, Washington, D.C. 20549 or by calling the SEC at 1-800-SEC-0330, by sending an electronic message to the SEC at publicinfo@sec.gov or by sending a fax to the SEC at 1-202-777-1027. In addition, the SEC maintains a website (www.sec.gov) that contains reports, proxy and information statements, and other information regarding issuers that file electronically.
29
The mailing address of our headquarters is 333 Lakeside Drive, Foster City, California 94404, and our telephone number at that location is 650-574-3000. Our website is www.gilead.com. Through a link on the “Investors” section of our website (under “SEC Filings” in the “Financial Information” section), we make available the following filings as soon as reasonably practicable after they are electronically filed with or furnished to the SEC: our Annual Reports on Form 10-K; Quarterly Reports on Form 10-Q; Current Reports on Form 8-K; and any amendments to those reports filed or furnished pursuant to Section 13(a) or 15(d) of the Exchange Act. All such filings are available free of charge upon request.
Transactions with Iran
As discussed above under “Access in the Developing World” in Item 1, Business, we are committed to providing access to certain of our HIV and other products in the developing world, and in that connection, have provided medical education related to the treatment of HIV in these countries. In accordance with this commitment, in January 2012, a non-U.S. subsidiary of Gilead based in Greece (Greek Sub) sponsored an HIV conference in Abu Dhabi, UAE, during which strategies for the treatment and prevention of HIV were discussed. Our third party distributor for Gilead in North Africa and the Middle East, including Iran, invited on our Greek Sub's behalf, doctors throughout the region, including four Iranian doctors, at least two of whom appear to have been officials for the Iranian National AIDS Program. Gilead Sciences Europe Limited reimbursed the distributor for the travel-related expenses of the four Iranian doctors to attend the HIV conference. The expenses for all four Iranian doctors totaled $3,330 and covered the cost of visa fees, airline tickets and transportation. We understand that the distributor in turn transferred the reimbursed amount to an Iranian entity which acts as a sub-distributor in Iran. Neither the distributor nor the sub-distributor is affiliated with Gilead and to our knowledge, are not agencies or instrumentalities or otherwise controlled by the Government of Iran. Sales of our products in Iran by sub-distributors are made available as part of the Gilead Access Program and sold at not-for-profit prices. The activities described above, which involved non-U.S. affiliates of Gilead and occurred prior to the enactment of the Iran Threat Reduction & Syria Human Rights Act in August 2012, were not subject to the U.S.-Iran sanctions regime. We have no current intention to engage in the activities described above in the future, directly or pursuant to any of its non-U.S. subsidiaries. If at a future time, Gilead (including any subsidiary) were to engage in such activities, it would first obtain a license from the U.S. Department of Treasury's Office of Foreign Assets Control or rely on an applicable exemption from the U.S.-Iran sanctions regime.
30
|
ITEM 1A.
|
RISK FACTORS
|
In evaluating our business, you should carefully consider the following risks in addition to the other information in this Annual Report on Form 10-K. A manifestation of any of the following risks could materially and adversely affect our business, results of operations and financial condition. We note these factors for investors as permitted by the Private Securities Litigation Reform Act of 1995. It is not possible to predict or identify all such factors and, therefore, you should not consider the following risks to be a complete statement of all the potential risks or uncertainties that we face.
The public announcement of data from clinical studies evaluating sofosbuvir and the fixed-dose combination of sofosbuvir and ledipasvir in HCV-infected patients is likely to cause significant volatility in our stock price. If the development of sofosbuvir alone or in combination with ledipasvir is delayed or discontinued, our stock price could decline significantly.
During 2013, we expect to receive a significant amount of data from clinical trials evaluating sofosbuvir, an investigational nucleotide analog we acquired through our purchase of Pharmasset Inc. (Pharmasset), alone or in combination with other direct acting antivirals in hepatitis C virus (HCV)-infected individuals across all genotypes.
Our initial new drug application (NDA) for sofosbuvir will be supported by four Phase 3 studies named Fission, Positron, Fusion and Neutrino. Fission is a study in genotype 2 and 3-treatment naïve patients comparing 12 weeks of sofosbuvir and ribavirin to the current standard of care of 24 weeks of treatment with interferon and ribavirin. In February 2013, we announced topline results from the Fission study. The study met its primary efficacy endpoint of non-inferiority of sofosbuvir plus ribavirin to pegylated interferon (peg-IFN) plus ribavirin and found that 67% of patients achieved a sustained viral response (SVR) in the sofosbuvir plus ribavirin treatment group versus 67% in the peg-IFN plus ribavirin treatment group. Positron, compares 12 weeks of treatment with sofosbuvir and ribavirin in genotype 2 and 3 interferon intolerant/ineligible patients to placebo. In November 2012, we announced topline results from the Positron study. The study found that 78% of patients achieved SVR12 weeks after completing therapy. Neutrino is a single arm study that evaluates a 12-week course of sofosbuvir, interferon and ribavirin in genotype 1, 4, 5 and 6 infected-patients. In February 2013, we announced topline results from the Neutrino study. The study met its primary efficacy endpoint of superiority compared to a predefined historic control SVR rate of 60% and showed that 90% of patients achieved SVR 12 weeks after completing therapy. The Fusion study explores 12 or 16 weeks duration of treatment with sofosbuvir and ribavirin in genotype 2 and 3 treatment-experienced patients. In February 2013, we announced topline results from the Fusion study. The study met its primary efficacy endpoint of superiority compared to a predefined historic control SVR rate of 25% and showed that 50% of patients in the 12-week arm and 73% of patients in the 16-week arm achieved SVR 12 weeks after completing therapy.
We anticipate filing for regulatory approvals for sofosbuvir by the second quarter of -2013. We expect the initial indication to be for 12 to 16 weeks of treatment with sofosbuvir and ribavirin in treatment-naive, interferon-intolerant and experienced genotype 2 and 3 patients and for 12 weeks of treatment with sofosbuvir, peg-IFN and ribavirin in treatment-naive genotype 1, 4, 5 and 6 patients.
In parallel, we are also advancing a fixed-dose combination of sofosbuvir and ledipasvir (formerly GS-5885) for the treatment of genotype 1 patients. Our NDA for the fixed dose combination of sofosbuvir and ledipasvir will be supported by two clinical trials. The first study, named ION-1, evaluates the fixed-dose combination of sofosbuvir and ledipasvir with and without ribavirin for either 12 or 24 weeks in treatment-naïve genotype 1 infected patients. Pending a review of results from the two 12-week arms of an initial enrollment of 200 patients, by the second quarter of 2013, we expect to enroll additional patients in the ION-1 study to assess the fixed dose combination of sofosbuvir and ledipasvir in a total of 800 individuals. In January 2013, we also started screening patients for a Phase 3 study, named ION-2, evaluating the fixed-dose combination with ribavirin for 12 weeks and with and without ribavirin for 24 weeks of therapy among treatment-experienced genotype 1 HCV patients.
The announcement of data from our clinical studies evaluating sofosbuvir and the fixed-dose combination of sofosbuvir and ledipasvir is likely to cause significant volatility in our stock price. The announcement of any negative or unexpected data or the discontinuation of development of sofosbuvir or the fixed-dose combination of sofosbuvir and ledipasvir or any delay in our anticipated timelines for filing for regulatory approval will likely cause our stock price to decline significantly.
31
A substantial portion of our revenues is derived from sales of our HIV products, particularly Atripla and Truvada. If we are unable to maintain or continue increasing sales of these products, our results of operations may be adversely affected.
We are currently dependent on sales of our products for the treatment of HIV infection, particularly Atripla and Truvada, to support our existing operations. Our HIV products contain tenofovir disoproxil fumarate and/or emtricitabine, which belong to the nucleoside class of antiviral therapeutics. Were the treatment paradigm for HIV to change, causing nucleoside-based therapeutics to fall out of favor, or if we were unable to maintain or continue increasing our HIV product sales, our results of operations would likely suffer and we would likely need to scale back our operations, including our spending on research and development (R&D) efforts. For the year ended
December 31, 2012
, Atripla and Truvada product sales together were
$6.76 billion
, or
70%
of our total revenues. We may not be able to sustain or increase the growth rate of sales of our HIV products, especially Stribild, Complera/Eviplera, Atripla and Truvada, for any number of reasons including, but not limited to, the following:
|
•
|
As our HIV products are used over a longer period of time in many patients and in combination with other products, and additional studies are conducted, new issues with respect to safety, resistance and interactions with other drugs may arise, which could cause us to provide additional warnings or contraindications on our labels, narrow our approved indications or halt sales of a product, each of which could reduce our revenues.
|
|
•
|
As our HIV products mature, private insurers and government payers often reduce the amount they will reimburse patients for these products, which increases pressure on us to reduce prices.
|
|
•
|
A large part of the market for our HIV products consists of patients who are already taking other HIV drugs. If we are not successful in encouraging physicians to change patients' regimens to include our HIV products, the sales of our HIV products will be limited.
|
|
•
|
As generic HIV products are introduced into major markets, our ability to maintain pricing and market share may be affected.
|
If we fail to commercialize new products or expand the indications for existing products, our prospects for future revenues may be adversely affected.
If we do not introduce new products to market or increase sales of our existing products, we will not be able to increase or maintain our total revenues and continue to expand our R&D efforts. Drug development is inherently risky and many product candidates fail during the drug development process. For example, in January 2011, we announced our decision to terminate our Phase 3 clinical trial of ambrisentan in patients with idiopathic pulmonary fibrosis (IPF). In April 2011, we announced our decision to terminate our Phase 3 clinical trial of aztreonam for inhalation solution for the treatment of cystic fibrosis (CF) in patients with Burkholderia spp. In addition, our marketing application for our single tablet regimen of elvitegravir, cobicistat, tenofovir disoproxil fumarate and emtricitabine for the treatment of HIV in treatment-naïve patient may not be approved by the European Medicines Agency (EMA) or other foreign regulatory agencies, and our new drug applications for elvitegravir for the treatment of HIV in treatment-experienced patients and cobicistat, a pharmacoenhancing or “boosting” agent, may not be approved by the U.S. Food and Drug Administration (FDA), EMA or other foreign regulatory authorities. Even if marketing approval is granted for any of these products, there may be significant limitations on their use. Further, we may be unable to file our marketing applications for new products, including sofosbuvir and the fixed-dose combination of sofosbuvir and ledipasvir in the currently anticipated timelines and marketing approval for the products may not be granted.
Because Congress did not agree to a package of tax and federal spending proposals on January 1, 2013, absent further Congressional action, an automatic reduction in federal spending or “sequestration” will take effect on March 1, 2013. Under sequestration, across-the board cuts will be implemented, which is expected to effect the operations of governmental agencies, including the FDA. As a result, the FDA may be unable to review and approve new drug applications in the currently anticipated timelines. Any significant delay in the timing of our anticipated product approvals may reduce our anticipated future revenue and earnings and could negatively affect our stock price.
32
Our results of operations will be adversely affected by current and potential future healthcare reforms.
Legislative and regulatory changes to government prescription drug procurement and reimbursement programs occur relatively frequently in the United States and foreign jurisdictions. In March 2010, healthcare reform legislation was adopted in the United States. As a result, we are required to further rebate or discount products reimbursed or paid for by various public payers, including Medicaid and other entities eligible to purchase discounted products through the 340B Drug Pricing Program under the Public Health Service Act, such as AIDS Drug Assistance Programs (ADAPs). As a result of the 2010 legislation, the discounts, rebates and fees that impacted us include:
|
•
|
our minimum base rebate amount owed to Medicaid on products reimbursed by Medicaid increased by 8%, and the discounts or rebates we owe to ADAPs and other Public Health Service entities which reimburse or purchase our products also increased by 8%;
|
|
•
|
we are required to extend rebates to patients receiving our products through Medicaid managed care organizations;
|
|
•
|
we are required to provide a 50% discount on products sold to patients while they are in the Medicare Part D “donut hole;” and
|
|
•
|
we, along with other pharmaceutical manufacturers of branded drug products, were required to pay a portion of a new industry fee (also known as the pharmaceutical excise tax) of $2.8 billion for 2012, calculated based on select government sales during the 2010 calendar year as a percentage of total industry government sales.
|
The amount of the industry fee imposed on the pharmaceutical industry as a whole increased to $2.8 billion in 2012 and 2013, with additional increases over the next several years to a peak of $4.1 billion per year in 2018, and then decrease to $2.8 billion in 2019 and thereafter. As the amount of the industry fee increases, our product sales increase and drug patents expire on major drugs of other companies, we expect our portion of the excise tax to increase as well. We estimate our portion of the pharmaceutical excise tax to be approximately $100-$120 million in 2013, compared to approximately $85 million in 2012. The excise tax is not tax deductible. Further, even though not addressed in the healthcare reform legislation, discussions continue at the federal level on legislation that would either allow or require the federal government to directly negotiate price concessions from pharmaceutical manufacturers or set minimum requirements for Medicare Part D pricing.
In addition, state Medicaid programs could request additional supplemental rebates on our products as a result of the increase in the federal base Medicaid rebate. Private insurers could also use the enactment of these increased rebates to exert pricing pressure on our products, and to the extent that private insurers or managed care programs follow Medicaid coverage and payment developments, the adverse effects may be magnified by private insurers adopting lower payment schedules.
Our existing products are subject to reimbursement from government agencies and other third parties. Pharmaceutical pricing and reimbursement pressures may reduce profitability.
Successful commercialization of our products depends, in part, on the availability of governmental and third-party payer reimbursement for the cost of such products and related treatments. Government health administration authorities, private health insurers and other organizations generally provide reimbursement. In the United States, the European Union and other significant or potentially significant markets for our products and product candidates, government authorities and third-party payers are increasingly attempting to limit or regulate the price of medical products and services, particularly for new and innovative products and therapies, which has resulted in lower average selling prices.
A significant portion of our sales of the majority of our products are subject to significant discounts from list price and rebate obligations. In the United States, state ADAPs, which purchase a significant portion of our HIV products, rely on federal, supplemental federal and state funding to help fund purchases of our products. Given the current economic downturn, we have experienced a shift in our payer mix as patients previously covered by private insurance move to public reimbursement programs that require rebates or discounts from us or as patients previously covered by one public reimbursement program move to another public reimbursement program that requires greater rebates or discounts from us. As a result of this shift, revenue growth may be lower than prescription growth. Absent further Congressional action, an automatic reduction in federal spending or “sequestration” will take effect on March 1, 2013. Under sequestration, across-the board cuts will be implemented and could reduce the amount of federal and state funds to support ADAP programs. If federal and state funds are not available in amounts sufficient to support the number of patients that rely on ADAPs, sales of our HIV products could be negatively impacted which would reduce our revenues. For example, during the first quarter of 2011, the state budget crisis in Florida led to a temporary movement of patients who were previously covered by Florida's ADAP into industry-supported patient assistance programs. In prior quarters, because of the insufficiency of federal and state funds and as many states reduced eligibility criteria, we saw an increase in the number of patients on state ADAP wait lists, and we may see similar increases in future periods as a result of any reduction in federal and state ADAP support resulting from the sequestration. Until these patients are enrolled in ADAP, they generally receive product from industry-supported patient assistance programs or are unable to access treatment. The increased emphasis on managed healthcare in the United States and
33
on country and regional pricing and reimbursement controls in the European Union will put additional pressure on product pricing, reimbursement and usage, which may adversely affect our product sales and profitability. These pressures can arise from rules and practices of managed care groups, judicial decisions and governmental laws and regulations related to Medicare, Medicaid and healthcare reform, pharmaceutical reimbursement policies and pricing in general.
In Europe, the success of our commercialized products, and any other product candidates we may develop, will depend largely on obtaining and maintaining government reimbursement, because in many European countries patients are unlikely to use prescription drugs that are not reimbursed by their governments. In addition, negotiating prices with governmental authorities can delay commercialization by 12 months or more. Reimbursement policies may adversely affect our ability to sell our products on a profitable basis. In many international markets, governments control the prices of prescription pharmaceuticals, including through the implementation of reference pricing, price cuts, rebates, revenue-related taxes and profit control, and they expect prices of prescription pharmaceuticals to decline over the life of the product or as volumes increase.
Recently, many countries in the European Union have increased the amount of discounts required on our products, and these efforts could continue as countries attempt to manage healthcare expenditures, especially in light of the severe fiscal and debt crises experienced by many countries in the European Union. For example, in June 2010, Spain imposed an incremental discount on all branded drugs and in August 2010, Germany increased the rebate on prescription pharmaceuticals. As generic drugs come to market, we may face price decreases for our products in some countries in the European Union. Further, cost containment pressures in the European Union could lead to delays in the treatment of patients and also delay pricing approval, which could negatively impact the commercialization of new products.
Approximately 40-45% of our product sales occur outside the United States, and currency fluctuations and hedging expenses may cause our earnings to fluctuate, which could adversely affect our stock price.
Because a significant percentage of our product sales are denominated in foreign currencies, primarily the Euro, we face exposure to adverse movements in foreign currency exchange rates. When the U.S. dollar strengthens against these foreign currencies, the relative value of sales made in the respective foreign currency decreases. Conversely, when the U.S. dollar weakens against these currencies, the relative value of such sales increases. Overall, we are a net receiver of foreign currencies and, therefore, benefit from a weaker U.S. dollar and are adversely affected by a stronger U.S. dollar relative to those foreign currencies in which we transact significant amounts of business.
We use foreign currency exchange forward and option contracts to hedge a percentage of our forecasted international sales, primarily those denominated in the Euro. We also hedge certain monetary assets and liabilities denominated in foreign currencies, which reduces but does not eliminate our exposure to currency fluctuations between the date a transaction is recorded and the date that cash is collected or paid. We cannot predict future fluctuations in the foreign currency exchange rate of the U.S. dollar. If the U.S. dollar appreciates significantly against certain currencies and our hedging program does not sufficiently offset the effects of such appreciation, our results of operations will be adversely affected and our stock price may decline.
Additionally, the expenses that we recognize in relation to our hedging activities can also cause our earnings to fluctuate. The level of hedging expenses that we recognize in a particular period is impacted by the changes in interest rate spreads between the foreign currencies that we hedge and the U.S. dollar.
Our inability to accurately estimate demand for our products, as well as sales fluctuations as a result of inventory levels held by wholesalers, pharmacies and non-retail customers make it difficult for us to accurately forecast sales and may cause our earnings to fluctuate, which could adversely affect our financial results and our stock price.
In
2012
, approximately
81%
of our product sales in the United States were to three wholesalers, Cardinal Health, Inc., McKesson Corp. and AmerisourceBergen Corp. The U.S. wholesalers with whom we have entered into inventory management agreements make estimates to determine end user demand and may not be completely effective in matching their inventory levels to actual end user demand. As a result, changes in inventory levels held by those wholesalers can cause our operating results to fluctuate unexpectedly if our sales to these wholesalers do not match end user demand. In addition, inventory is held at retail pharmacies and other non-wholesale locations with whom we have no inventory management agreements and no control over buying patterns. Adverse changes in economic conditions or other factors may cause retail pharmacies to reduce their inventories of our products, which would reduce their orders from wholesalers and, consequently, the wholesalers' orders from us, even if end user demand has not changed. For example, during the fourth quarter of 2010, our wholesalers increased their inventory levels for our antiviral products. In the first quarter of 2011, our wholesalers drew down on their inventory such that inventory levels for our antiviral products moved to the lower end of the contractual boundaries set by our inventory management agreements. As inventory in the distribution channel fluctuates from quarter to quarter, we may continue to see fluctuations in our earnings and a mismatch between prescription demand for our products and our revenues
34
In addition, the non-retail sector in the United States, which includes government institutions, including state ADAPs, correctional facilities and large health maintenance organizations, tends to be even less consistent in terms of buying patterns and often causes quarter over quarter fluctuations that do not necessarily mirror patient demand. Federal and state budget pressures, as well as the annual grant cycles for federal and state ADAP funds, may cause ADAP purchasing patterns to not reflect patient demand. For example, in the first and second quarters of 2012, we observed large non-retail purchases by a number of state ADAPs which exceeded patient demand. We believe such purchases were driven by the grant cycle for federal ADAP funds, the early communication of Ryan White Federal Funds and the desire by state ADAPs to reduce patient wait lists, which led to a significant reduction in ADAP purchasing in the third quarter of 2012. We also observed large non-retail purchases in the fourth quarter of 2012, driven by the same issues. As a result, we expect to continue to experience fluctuations in the purchasing patterns of our non-retail customers which may result in fluctuations in our product sales, revenues and earnings in the future. In light of the global economic downturn and budget crises faced by many European countries, we have observed variations in purchasing patterns induced by cost containment measures in Europe. We believe these measures have caused some government agencies and other purchasers to reduce inventory of our products in the distribution channels, which has decreased our revenues and caused fluctuations in our product sales and earnings. We may continue to see this trend in the future.
We face significant competition.
We face significant competition from large pharmaceutical and biotechnology companies, most of whom have substantially greater resources than we do. In addition, our competitors have more products and have operated in the fields in which we compete for longer than we have. Our HIV products compete primarily with products from the joint venture established by GlaxoSmithKline Inc. (GSK) and Pfizer Inc. (Pfizer) which markets fixed-dose combination products that compete with Stribild, Complera/Eviplera, Atripla and Truvada. For example, lamivudine, marketed by this joint venture, is competitive with emtricitabine, the active pharmaceutical ingredient of Emtriva and a component of Complera/Eviplera, Atripla and Truvada.
We also face competition from generic HIV products. In May 2010, the compound patent covering Epivir (lamivudine) itself expired in the United States, and generic lamivudine is now available in the United States, Spain, Portugal and Italy. We expect that generic versions of lamivudine will be launched in other countries within the European Union. In May 2011, a generic version of Combivir (lamivudine and zidovudine) was approved and was recently launched in the United States. In addition, in late 2011, generic tenofovir also became available in Turkey, which resulted in an increase in the rebate for Viread in Turkey. We currently also expect competition from a generic version of Sustiva (efavirenz), a component of our Atripla, to be available in Europe and Canada in 2013 and the United States in 2014, which may negatively impact sales of our HIV products. We also expect the launch of dolutegravir, an integrase inhibitor, in the fourth quarter of 2013 by GSK which could impact the sales of our HIV products.
For Viread and Hepsera for treatment of chronic HBV, we compete primarily with products produced by GSK, BMS and Novartis Pharmaceuticals Corporation (Novartis) in the United States, the European Union and China. For AmBisome, we compete primarily with products produced by Merck & Co., Inc. (Merck) and Pfizer. In addition, we are aware of at least three lipid formulations that claim similarity to AmBisome becoming available outside of the United States, including the possible entry of such formulations in Greece and Taiwan. These formulations may reduce market demand for AmBisome. Furthermore, the manufacture of lipid formulations of amphotericin B is very complex and if any of these formulations are found to be unsafe, sales of AmBisome may be negatively impacted by association. Letairis competes directly with a product produced by Actelion Pharmaceuticals US, Inc. and indirectly with pulmonary arterial hypertension products from United Therapeutics Corporation and Pfizer. Ranexa competes predominantly with generic compounds from three distinct classes of drugs, beta-blockers, calcium channel blockers and long-acting nitrates for the treatment of chronic angina in the United States. Cayston competes with a product marketed by Novartis. Tamiflu competes with products sold by GSK and generic competitors.
In addition, a number of companies are pursuing the development of technologies which are competitive with our existing products or research programs. These competing companies include specialized pharmaceutical firms and large pharmaceutical companies acting either independently or together with other pharmaceutical companies. Furthermore, academic institutions, government agencies and other public and private organizations conducting research may seek patent protection and may establish collaborative arrangements for competitive products or programs.
If significant safety issues arise for our marketed products or our product candidates, our future sales may be reduced, which would adversely affect our results of operations.
The data supporting the marketing approvals for our products and forming the basis for the safety warnings in our product labels were obtained in controlled clinical trials of limited duration and, in some cases, from post-approval use. As our products are used over longer periods of time by many patients with underlying health problems, taking numerous other
35
medicines, we expect to continue to find new issues such as safety, resistance or drug interaction issues, which may require us to provide additional warnings or contraindications on our labels or narrow our approved indications, each of which could reduce the market acceptance of these products.
Our product Letairis, which was approved by the FDA in June 2007, is a member of a class of compounds called endothelin receptor antagonists (ERAs) which pose specific risks, including serious risks of birth defects. Because of these risks, Letairis is available only through the Letairis Education and Access Program (LEAP), a restricted distribution program intended to help physicians and patients learn about the risks associated with the product and assure appropriate use of the product. As the product is used by additional patients, we may discover new risks associated with Letairis which may result in changes to the distribution program and additional restrictions on the use of Letairis which may decrease demand for the product.
Regulatory authorities have been moving towards more active and transparent pharmacovigilance and are making greater amounts of stand-alone safety information directly available to the public through websites and other means, e.g. periodic safety update report summaries, risk management plan summaries and various adverse event data. Safety information, without the appropriate context and expertise, may be misinterpreted and lead to misperception or legal action which may potentially cause our product sales or stock price to decline.
Further, if serious safety, resistance or drug interaction issues arise with our marketed products, sales of these products could be limited or halted by us or by regulatory authorities and our results of operations would be adversely affected.
Our operations depend on compliance with complex FDA and comparable international regulations. Failure to obtain broad approvals on a timely basis or to maintain compliance could delay or halt commercialization of our products.
The products we develop must be approved for marketing and sale by regulatory authorities and, once approved, are subject to extensive regulation by the FDA, the EMA and comparable regulatory agencies in other countries. We are continuing clinical trials for Stribild, Complera/Eviplera, Atripla, Truvada, Viread, Hepsera, Emtriva, Letairis, Ranexa, AmBisome and Cayston for currently approved and additional uses. We anticipate that we will file for marketing approval in additional countries and for additional indications and products over the next several years. These products may fail to receive such marketing approvals on a timely basis, or at all.
Further, our marketed products and how we manufacture and sell these products are subject to extensive regulation and review. Discovery of previously unknown problems with our marketed products or problems with our manufacturing or promotional activities may result in restrictions on our products, including withdrawal of the products from the market. If we fail to comply with applicable regulatory requirements, including those related to promotion and manufacturing, we could be subject to penalties including fines, suspensions of regulatory approvals, product recalls, seizure of products and criminal prosecution.
For example, under FDA rules, we are often required to conduct post-approval clinical studies to assess a known serious risk, signals of serious risk or to identify an unexpected serious risk and implement a Risk Evaluation and Mitigation Strategy for our products, which could include a medication guide, patient package insert, a communication plan to healthcare providers or other elements as the FDA deems are necessary to assure safe use of the drug, which could include imposing certain restrictions on the distribution or use of a product. Failure to comply with these or other requirements, if imposed on a sponsor by the FDA, could result in significant civil monetary penalties and our operating results may be adversely affected.
The results and anticipated timelines of our clinical trials are uncertain and may not support continued development of a product pipeline, which would adversely affect our prospects for future revenue growth.
We are required to demonstrate the safety and efficacy of products that we develop for each intended use through extensive preclinical studies and clinical trials. The results from preclinical and early clinical studies do not always accurately predict results in later, large-scale clinical trials. Even successfully completed large-scale clinical trials may not result in marketable products. If any of our product candidates fails to achieve its primary endpoint in clinical trials, if safety issues arise or if the results from our clinical trials are otherwise inadequate to support regulatory approval of our product candidates, commercialization of that product candidate could be delayed or halted. For example, in January 2011, we announced our decision to terminate our Phase 3 clinical trial of ambrisentan in patients with IPF and, in April 2011, we announced our decision to terminate our Phase 3 clinical trial of aztreonam for inhalation solution for the treatment of CF in patients with Burkholderia spp. In addition, we may also face challenges in clinical trial protocol design. If the clinical trials for any of the product candidates in our pipeline are delayed or terminated, our prospects for future revenue growth would be adversely impacted. For example, we face numerous risks and uncertainties with our product candidates, including sofosbuvir and the fixed-dose combination of sofosbuvir and ledipasvir for the treatment of hepatitis C; aztreonam for inhalation solution for the treatment of bronchiectasis; ranolazine for the treatment of incomplete revascularization post-percutaneous coronary intervention and type II diabetes; and idelalisib for the treatment of chronic lymphocytic leukemia, each currently in Phase 3
36
clinical trials, that could prevent completion of development of these product candidates. These risks include our ability to enroll patients in clinical trials, the possibility of unfavorable results of our clinical trials, the need to modify or delay our clinical trials or to perform additional trials and the risk of failing to obtain FDA and other regulatory body approvals. As a result, our product candidates may never be successfully commercialized. Further, we may make a strategic decision to discontinue development of our product candidates if, for example, we believe commercialization will be difficult relative to other opportunities in our pipeline. If these programs and others in our pipeline cannot be completed on a timely basis or at all, then our prospects for future revenue growth may be adversely impacted. In addition, clinical trials involving our commercial products could raise new safety issues for our existing products, which could in turn decrease our revenues and harm our business.
Due to our reliance on third-party contract research organizations to conduct our clinical trials, we are unable to directly control the timing, conduct, expense and quality of our clinical trials.
We extensively outsource our clinical trial activities and usually perform only a small portion of the start-up activities in-house. We rely on independent third-party contract research organizations (CROs) to perform most of our clinical studies, including document preparation, site identification, screening and preparation, pre-study visits, training, program management and bioanalytical analysis. Many important aspects of the services performed for us by the CROs are out of our direct control. If there is any dispute or disruption in our relationship with our CROs, our clinical trials may be delayed. Moreover, in our regulatory submissions, we rely on the quality and validity of the clinical work performed by third-party CROs. If any of our CROs' processes, methodologies or results were determined to be invalid or inadequate, our own clinical data and results and related regulatory approvals could be adversely impacted.
Expenses associated with clinical trials may cause our earnings to fluctuate, which could adversely affect our stock price.
The clinical trials required for regulatory approval of our products, as well as clinical trials we are required to conduct after approval, are very expensive. It is difficult to accurately predict or control the amount or timing of these expenses from quarter to quarter, and the FDA and/or other regulatory agencies may require more clinical testing than we originally anticipated. Uneven and unexpected spending on these programs, including on the clinical trials that will be necessary to advance sofosbuvir, the fixed-dose combination of sofosbuvir and ledipasvir and our other product candidates for the treatment of HCV and oncology, may cause our operating results to fluctuate from quarter to quarter and volatility in our stock price.
We depend on relationships with other companies for sales and marketing performance, development and commercialization of product candidates and revenues. Failure to maintain these relationships, poor performance by these companies or disputes with these companies could negatively impact our business.
We rely on a number of significant collaborative relationships with major pharmaceutical companies for our sales and marketing performance in certain territories. These include collaborations with BMS for Atripla in the United States, Europe and Canada; F. Hoffmann-La Roche Ltd. (together with Hoffmann-La Roche Inc., Roche) for Tamiflu worldwide; and GSK for ambrisentan in territories outside of the United States. In some countries, we rely on international distributors for sales of Truvada, Viread, Hepsera, Emtriva and AmBisome. Some of these relationships also involve the clinical development of these products by our partners. Reliance on collaborative relationships poses a number of risks, including the risk that:
|
•
|
we are unable to control the resources our corporate partners devote to our programs or products;
|
|
•
|
disputes may arise with respect to the ownership of rights to technology developed with our corporate partners;
|
|
•
|
disagreements with our corporate partners could cause delays in, or termination of, the research, development or commercialization of product candidates or result in litigation or arbitration;
|
|
•
|
contracts with our corporate partners may fail to provide significant protection or may fail to be effectively enforced if one of these partners fails to perform;
|
|
•
|
our corporate partners have considerable discretion in electing whether to pursue the development of any additional products and may pursue alternative technologies or products either on their own or in collaboration with our competitors;
|
|
•
|
our corporate partners with marketing rights may choose to pursue competing technologies or to devote fewer resources to the marketing of our products than they do to products of their own development; and
|
|
•
|
our distributors and our corporate partners may be unable to pay us, particularly in light of current economic conditions.
|
37
Given these risks, there is a great deal of uncertainty regarding the success of our current and future collaborative efforts. If these efforts fail, our product development or commercialization of new products could be delayed or revenues from products could decline.
We also rely on collaborative relationships with major pharmaceutical companies for development and commercialization of certain product candidates. Gilead (as successor to Pharmasset) is a party to a October 24, 2004 collaboration agreement with Roche. The agreement granted Roche rights to develop PSI-6130, a cytidine analog, and its prodrugs, for the treatment of chronic HCV infection. The collaborative research efforts under the agreement ended on December 31, 2006. Roche later asked Pharmasset to consider whether Roche may have contributed to the inventorship of sofosbuvir and whether Pharmasset has complied with the confidentiality provisions of the collaboration agreement. Pharmasset advised us that it carefully considered the issues raised by Roche and that it believed any such issues are without merit. We have also considered these issues and reached the same conclusion. Roche recently contacted Gilead asserting that Roche has an exclusive license to sofosbuvir pursuant to the collaboration agreement. Roche alleges that sofosbuvir, a prodrug of a uridine monophosphate analog, is a prodrug of PSI-6130 and therefore Roche has an exclusive license. We believe Roche's claim is without merit. However, if Roche were to successfully establish inventorship or exclusive license rights to sofosbuvir, our expected revenues and earnings from the sale of sofosbuvir could be adversely affected.
Under our April 2002 licensing agreement with GSK, we gave GSK the right to control clinical and regulatory development and commercialization of Hepsera in territories in Asia, Africa and Latin America. These include major markets for Hepsera, such as China, Japan, Taiwan and South Korea. In November 2009, we entered into an agreement with GSK that provided GSK with exclusive commercialization rights and registration responsibilities for Viread for the treatment of chronic HBV in China. In October 2010, we granted similar rights to GSK in Japan and Saudi Arabia. The success of Hepsera and Viread for the treatment of chronic HBV in these territories depends almost entirely on the efforts of GSK. In this regard, GSK promotes Epivir-HBV/Zeffix, a product that competes with Hepsera and Viread for the treatment of chronic HBV. Consequently, GSK's marketing strategy for Hepsera and Viread for the treatment of chronic hepatitis B may be influenced by its promotion of Epivir-HBV/Zeffix. We receive royalties from GSK equal to a percentage of GSK's net sales of Hepsera and Viread for the treatment of chronic HBV as well as net sales of GSK's Epivir-HBV/Zeffix. If GSK fails to devote sufficient resources to, or does not succeed in developing or commercializing Hepsera or Viread for the treatment of chronic HBV in its territories, our potential revenues in these territories may be substantially reduced.
In addition, Cayston and Letairis are distributed through third-party specialty pharmacies, which are pharmacies specializing in the dispensing of medications for complex or chronic conditions that may require a high level of patient education and ongoing counseling. The use of specialty pharmacies requires significant coordination with our sales and marketing, medical affairs, regulatory affairs, legal and finance organizations and involves risks, including but not limited to risks that these specialty pharmacies will:
|
•
|
not provide us with accurate or timely information regarding their inventories, patient data or safety complaints;
|
|
•
|
not effectively sell or support Cayston or Letairis;
|
|
•
|
not devote the resources necessary to sell Cayston or Letairis in the volumes and within the time frames that we expect;
|
|
•
|
not be able to satisfy their financial obligations to us or others; or
|
|
•
|
cease operations.
|
We also rely on a third party to administer LEAP, the restricted distribution program designed to support Letairis. This third party provides information and education to prescribers and patients on the risks of Letairis, confirms insurance coverage and investigates alternative sources of reimbursement or assistance, ensures fulfillment of the risk management requirements mandated for Letairis by the FDA and coordinates and controls dispensing to patients through the third-party specialty pharmacies. Failure of this third party or the specialty pharmacies that distribute Letairis to perform as expected may result in regulatory action from the FDA or decreased Letairis sales, either of which would harm our business.
Further, Cayston may only be taken by patients using a specific inhalation device that delivers the drug to the lungs of patients. Our ongoing distribution of Cayston is entirely reliant upon the manufacturer of that device. For example, the manufacturer could encounter other issues with regulatory agencies related to the device or be unable to supply sufficient quantities of this device. In addition, the manufacturer may not be able to provide adequate warranty support for the device after it has been distributed to patients. With respect to distribution of the drug and device to patients, we are reliant on the capabilities of specialty pharmacies. For example, the distribution channel for drug and device is complicated and requires coordination. The reimbursement approval processes associated with both drug and device are similarly complex. If the device manufacturer is unable to obtain reimbursement approval or receives approval at a lower-than-expected price, sales of Cayston may be adversely affected. Any of the previously described issues may limit the sales of Cayston, which would adversely affect our financial results.
38
Our success will depend to a significant degree on our ability to protect our patents and other intellectual property rights both domestically and internationally. We may not be able to obtain effective patents to protect our technologies from use by competitors and patents of other companies could require us to stop using or pay for the use of required technology.
Patents and other proprietary rights are very important to our business. Our success will depend to a significant degree on our ability to:
|
•
|
obtain patents and licenses to patent rights;
|
|
•
|
preserve trade secrets;
|
|
•
|
defend against infringement and efforts to invalidate our patents; and
|
|
•
|
operate without infringing on the property of others.
|
If we have a properly drafted and enforceable patent, it can be more difficult for our competitors to use our technology to create competitive products and more difficult for our competitors to obtain a patent that prevents us from using technology we create. As part of our business strategy, we actively seek patent protection both in the United States and internationally and file additional patent applications, when appropriate, to cover improvements in our compounds, products and technology.
We have a number of U.S. and foreign patents, patent applications and rights to patents related to our compounds, products and technology, but we cannot be certain that issued patents will be enforceable or provide adequate protection or that pending patent applications will result in issued patents. Patent applications are confidential for a period of time before a patent is issued. As a result, we may not know if our competitors filed patent applications for technology covered by our pending applications or if we were the first to invent or first to file an application directed toward the technology that is the subject of our patent applications. Competitors may have filed patent applications or received patents and may obtain additional patents and proprietary rights that block or compete with our products. In addition, if competitors file patent applications covering our technology, we may have to participate in interference/derivation proceedings or litigation to determine the right to a patent. Litigation and interference/derivation proceedings are unpredictable and expensive, such that, even if we are ultimately successful, our results of operations may be adversely affected by such events.
From time to time, certain individuals or entities may challenge our patents. For example, in 2007, the Public Patent Foundation filed requests for re-examination with the U.S. Patent and Trademark Office (PTO) challenging four of our patents related to tenofovir disoproxil fumarate, which is an active ingredient in Stribild, Complera/Eviplera, Atripla, Truvada and Viread. The PTO granted these requests, and in 2008, the PTO confirmed the patentability of all four patents.
From time to time, we may become involved in disputes with inventors on our patents. For example, in March 2012, Jeremy Clark, a former employee of Pharmasset, which we acquired in January 2012, and inventor of U.S. Patent No. 7,429,572, filed a demand for arbitration in his lawsuit against Pharmasset and Dr. Raymond Schinazi. Mr. Clark initially filed the lawsuit against Pharmasset and Dr. Schinazi in February 2008 seeking to void the assignment provision in his employment agreement and assert ownership of U.S. Patent No. 7,429,572, which claims metabolites of sofosbuvir and RG7128. In December 2008, the court ordered a stay of the litigation pending the outcome of an arbitration proceeding required by Mr. Clark's employment agreement. Instead of proceeding with arbitration, Mr. Clark filed two additional lawsuits in September 2009 and June 2010, both of which were subsequently dismissed by the court. In September 2010, Mr. Clark filed a motion seeking reconsideration of the court's December 2008 order which was denied by the court. In December 2011, Mr. Clark filed a motion to appoint a special prosecutor. In February 2012, the court issued an order requiring Mr. Clark to enter arbitration or risk dismissal of his case. Mr. Clark filed a demand for arbitration in March 2012. The arbitration panel has set a hearing date in April 2013. We cannot predict the outcome of the arbitration. If Mr. Clark's prior assignment of this patent to Pharmasset is voided by the arbitration panel, and he is ultimately found to be the owner of the 7,429,572 patent and it is determined that we have infringed the patent, we may be required to obtain a license from and pay royalties to Mr. Clark to commercialize sofosbuvir and RG7128.
Patents do not cover the ranolazine compound, the active ingredient of Ranexa. Instead, when it was discovered that only a sustained release formulation of ranolazine would achieve therapeutic plasma levels, patents were obtained on those formulations and the characteristic plasma levels they achieve. Patents do not cover the active ingredients in AmBisome. In addition, we do not have patent filings in China or certain other Asian countries covering all forms of adefovir dipivoxil, the active ingredient in Hepsera. Asia is a major market for therapies for HBV, the indication for which Hepsera has been developed.
We may obtain patents for certain products many years before marketing approval is obtained for those products. Because patents have a limited life, which may begin to run prior to the commercial sale of the related product, the commercial value of the patent may be limited. However, we may be able to apply for patent term extensions or supplementary protection certificates in some countries.
39
Generic manufacturers have sought and may continue to seek FDA approval to market generic versions of our products through an ANDA, the application form typical
ly used by manufacturers seeking approval of a generic drug. See a description of our ANDA litigation in "Legal Proceedings" beginning on page 46 and risk factor entitled "Litigation with generic manufacturers have reduced and may continue to reduce our earnings. If we are unsuccessful in all or some of these lawsuits, some or all of our original claims in the patents may be narrowed or invalidated" beginning on page 42.
Our success depends in large part on our ability to operate without infringing upon the patents or other proprietary rights of third parties.
If we infringe the valid patents of others, we may be prevented from commercializing products or may be required to obtain licenses from these third parties. We may not be able to obtain alternative technologies or any required license on reasonable terms or at all. If we fail to obtain these licenses or alternative technologies, we may be unable to develop or commercialize some or all of our products. For example, we are aware of a body of patents that may relate to our operation of LEAP, our restricted distribution program designed to support Letairis. We own patents that claim sofosbuvir as a chemical entity and its metabolites. However, the existence of issued patents does not guarantee our right to practice the patented technology or commercialize the patented product. Third parties may have or obtain rights to patents which they may claim could be used to prevent or attempt to prevent us from commercializing the patented product candidates obtained from the Pharmasset acquisition. For example, we are aware of patents and patent applications owned by other parties that might be alleged to cover the use of sofosbuvir. If these other parties are successful in obtaining valid and enforceable patents, and establishing our infringement of those patents, we could be prevented from selling sofosbuvir unless we were able to obtain a license under such patents. If any license is needed it may not be available on commercially reasonable terms or at all.
In some instances, we may be required to defend our right to a patent on an invention through an Interference proceeding before the PTO. An Interference is an administrative proceeding before the PTO designed to determine who was the first to invent the subject matter being claimed by both parties. In February 2012, we received notice that the PTO had declared an Interference between our U.S. Patent No. 7,429,572 and Idenix Pharmaceuticals, Inc.'s (Idenix) pending patent application no. 12/131868. Our patent covers metabolites of sofosbuvir and RG7128. Idenix is attempting to claim a class of compounds, including these metabolites, in their pending patent application. In the course of this proceeding, both parties will be called upon to submit evidence of the date they conceived of their respective inventions. The Interference will determine who was first to invent these compounds and therefore who is entitled to the patent claiming these compounds. If the administrative law judge determines Idenix is entitled to these patent claims and it is determined that we have infringed those claims, we may be required to obtain a license from and pay royalties to Idenix to commercialize sofosbuvir and RG7128. Any determination by the judge can be appealed by either party to U.S. Federal Court.
In June 2012, we met with Idenix in mandatory settlement discussions. The parties were unable to settle the Interference due to our widely divergent views on the strength of our respective positions, on whether we need a license to Idenix's patents and whether Idenix needs a license to Gilead patents to develop and manufacture its pipeline products. We believe the Idenix application involved in the Interference and similar U.S. and foreign patents claiming the same compounds and metabolites are invalid. As a result, we filed an Impeachment Action in Canadian Federal Court to invalidate the Idenix CA2490191 patent, which is the Canadian patent that corresponds to the Idenix U.S. Patent No. 7608600 and the Idenix patent application that is the subject of the Interference. We filed a similar legal action in the Federal Court of Norway seeking to invalidate the corresponding Norwegian patent. We filed a similar legal action in the Federal Court of Australia seeking to invalidate the corresponding Australian patent. We may bring similar action in other countries in 2013. Idenix has not been awarded patents on these compounds and metabolites in European countries, Japan or China. In the event such patents issue, we expect to challenge them in proceedings similar to those we invoked in Canada, Norway and Australia.
Furthermore, we use significant proprietary technology and rely on unpatented trade secrets and proprietary know-how to protect certain aspects of our production and other technologies. Our trade secrets may become known or independently discovered by our competitors.
Manufacturing problems, including at our third-party manufacturers and corporate partners, could cause inventory shortages and delay product shipments and regulatory approvals, which may adversely affect our results of operations.
In order to generate revenue from our products, we must be able to produce sufficient quantities of our products to satisfy demand. Many of our products are the result of complex manufacturing processes. The manufacturing process for pharmaceutical products is also highly regulated and regulators may shut down manufacturing facilities that they believe do not comply with regulations.
40
Our products are either manufactured at our own facilities or by third-party manufacturers or corporate partners. We depend on third parties to perform manufacturing activities effectively and on a timely basis for the majority of our solid dose products. In addition, Roche, either by itself or through third parties, is responsible for manufacturing Tamiflu. We, our third-party manufacturers and our corporate partners are subject to current Good Manufacturing Practices (GMP), which are extensive regulations governing manufacturing processes, stability testing, record keeping and quality standards as defined by the FDA and the EMA. Similar regulations are in effect in other countries.
Our third-party manufacturers and corporate partners are independent entities who are subject to their own unique operational and financial risks which are out of our control. If we or any of these third-party manufacturers or corporate partners fail to perform as required, this could impair our ability to deliver our products on a timely basis or receive royalties or cause delays in our clinical trials and applications for regulatory approval. To the extent these risks materialize and affect their performance obligations to us, our financial results may be adversely affected.
In addition, we, our third-party manufacturers and our corporate partners may only be able to produce some of our products at one or a limited number of facilities and, therefore, have limited manufacturing capacity for certain products. For example, in 2012, due to unexpected delays both in qualifying two new external sites and with expanding Cayston manufacturing in San Dimas, we were unable to supply enough Cayston to fulfill our projected demand. From February through September 2012, we suspended access for patients with new prescriptions for Cayston, subject to certain exceptions where specific medical need exists. As a result of our inability to manufacture sufficient Cayston to meet demand, the amount of revenues we received from the sale of Cayston was reduced.
Our manufacturing operations are subject to routine inspections by regulatory agencies. For example, in January and February 2010, the FDA conducted a routine inspection of our San Dimas manufacturing facility, where we exclusively manufacture Cayston and AmBisome. At the conclusion of that inspection, the FDA issued Form 483 Inspectional Observations stating concerns over: the maintenance of aseptic processing conditions in the manufacturing suite for our AmBisome product; environmental maintenance issues in the San Dimas warehousing facility; batch sampling; and the timeliness of completion of annual product quality reports. On September 24, 2010, our San Dimas manufacturing facility received a Warning Letter from the FDA further detailing the FDA's concerns over the AmBisome manufacturing environment, including control systems and monitoring, procedures to prevent microbiological contamination and preventative cleaning and equipment maintenance. Referencing certain Viread lots, the letter also stated concerns connected with quality procedures, controls and investigation procedures, and a generalized concern over the effectiveness of the San Dimas quality unit in carrying out its responsibilities. In November and December 2010, the FDA re-inspected the San Dimas facility. The re-inspection closed with no additional Form 483 observations. In August 2011, the FDA notified us that we resolved all issues raised by the FDA in its Warning Letter.
Our ability to successfully manufacture and commercialize Cayston will depend upon our ability to manufacture in a multi-product facility.
Aztreonam, the active pharmaceutical ingredient in Cayston, is a mono-bactam Gram-negative antibiotic. We manufacture Cayston by ourselves in San Dimas, California, or through third parties, in multi-product manufacturing facilities. Historically, the FDA has permitted the manufacture of mono-bactams in multi-product manufacturing facilities; however, there can be no assurance that the FDA will continue to allow this practice. We do not currently have a single-product facility that can be dedicated to the manufacture of Cayston nor have we engaged a contract manufacturer with a single-product facility for Cayston. If the FDA prohibits the manufacture of mono-bactam antibiotics, like aztreonam, in multi-product manufacturing facilities in the future, we may not be able to procure a single-product manufacturing facility in a timely manner, which would adversely affect our commercial supplies of Cayston and our anticipated financial results attributable to such product.
We may not be able to obtain materials or supplies necessary to conduct clinical trials or to manufacture and sell our products, which would limit our ability to generate revenues.
We need access to certain supplies and products to conduct our clinical trials and to manufacture our products. In light of the global economic downturn, we have had increased difficulty in purchasing certain of the raw materials used in our manufacturing process. If we are unable to purchase sufficient quantities of these materials or find suitable alternate materials in a timely manner, our development efforts for our product candidates may be delayed or our ability to manufacture our products would be limited, which would limit our ability to generate revenues.
Suppliers of key components and materials must be named in an NDA filed with the FDA, EMA or other regulatory authority for any product candidate for which we are seeking marketing approval, and significant delays can occur if the qualification of a new supplier is required. Even after a manufacturer is qualified by the regulatory authority, the manufacturer must continue to expend time, money and effort in the area of production and quality control to ensure full compliance with
41
GMP. Manufacturers are subject to regular, periodic inspections by the regulatory authorities following initial approval. If, as a result of these inspections, a regulatory authority determines that the equipment, facilities, laboratories or processes do not comply with applicable regulations and conditions of product approval, the regulatory authority may suspend the manufacturing operations. If the manufacturing operations of any of the single suppliers for our products are suspended, we may be unable to generate sufficient quantities of commercial or clinical supplies of product to meet market demand, which would in turn decrease our revenues and harm our business. In addition, if delivery of material from our suppliers were interrupted for any reason, we may be unable to ship certain of our products for commercial supply or to supply our products in development for clinical trials. In addition, some of our products and the materials that we utilize in our operations are made at only one facility. For example, we manufacture AmBisome exclusively at our facilities in San Dimas, California. In the event of a disaster, including an earthquake, equipment failure or other difficulty, we may be unable to replace this manufacturing capacity in a timely manner and may be unable to manufacture AmBisome to meet market needs.
Cayston is dependent on two different third-party single-source suppliers. First, aztreonam, the active pharmaceutical ingredient in Cayston, is manufactured by a single supplier at a single site. Second, it is administered to the lungs of patients through a device that is made by a single supplier at a single site. Disruptions or delays with any of these single suppliers could adversely affect our ability to supply Cayston, and we cannot be sure that alternative suppliers can be identified in a timely manner, or at all. See the Risk Factor entitled “Our ability to successfully manufacture and commercialize Cayston will depend upon our ability to manufacture in a multi-product facility.”
In addition, we depend on a single supplier for high-quality cholesterol, which is used in the manufacture of AmBisome. We also rely on a single source for the active pharmaceutical ingredient of Hepsera, Letairis and Vistide and for the tableting of Letairis. Astellas US LLC, which markets Lexiscan in the United States, is responsible for the commercial manufacture and supply of product in the United States and is dependent on a single supplier for the active pharmaceutical ingredient of Lexiscan. Problems with any of the single suppliers we depend on may negatively impact our development and commercialization efforts.
A significant portion of the raw materials and intermediates used to manufacture our HIV products (Stribild, Complera/Eviplera, Atripla, Truvada, Viread and Emtriva) are supplied by Chinese-based companies. As a result, an international trade dispute between China and the United States or any other actions by the Chinese government that would limit or prevent Chinese companies from supplying these materials would adversely affect our ability to manufacture and supply our HIV products to meet market needs and have a material and adverse effect on our operating results.
Litigation with generic manufacturers has reduced and may continue to reduce our earnings. If we are unsuccessful in all or some of these lawsuits, some or all of our original claims in the patents may be narrowed or invalidated and generic versions of our products could be launched prior to our patent expiry.
As part of the approval process of some of our products, the FDA granted a New Chemical Entity (NCE) exclusivity period during which other manufacturers' applications for approval of generic versions of our product will not be granted. Generic manufacturers may challenge the patents protecting products that have been granted exclusivity one year prior to the end of the exclusivity period. Generic manufacturers have sought and may continue to seek FDA approval for a similar or identical drug through an ANDA, the application form typically used by manufacturers seeking approval of a generic drug.
We received notices that generic manufacturers have submitted ANDAs to manufacture a generic version of Atripla, Truvada, Viread, Hepsera, Ranexa and Tamiflu in the United States and Atripla, Truvada and Viread in Canada. We expect to begin trial with some of the generic manufacturers in 2013. In February 2013, Gilead and Teva reached an agreement in principle to settle the ongoing patent litigation concerning the four patents that protect tenofovir disoproxil fumarate in our Viread, Truvada and Atripla products. The trial in this litigation has been adjourned pending completion of activities necessary to finalize the settlement. Under the agreement, Teva will be allowed to launch a generic version of Viread on December 15, 2017. The settlement agreement must be filed with the Federal Trade Commission and Department of Justice for their review before it is final. The trial related to ten of the patents associated with Ranexa is scheduled to begin in April 2013. We anticipate the trial related to two patents related to Hepsera will begin in mid 2013. The trial related to the two patents protecting emtricitabine patent in Atripla is scheduled to begin in October 2013.
We cannot predict the ultimate outcome of these actions, and we may spend significant resources enforcing and defending these patents. If we are unsuccessful in these lawsuits, some or all of our original claims in the patents may be narrowed or invalidated and the patent protection for Atripla, Truvada, Viread, Hepsera, Ranexa and Tamiflu in the United States and Atripla, Truvada and Viread in Canada could be substantially shortened. Further, if all of the patents covering one or more products are invalidated, the FDA or Canadian Ministry of Health could approve the requests to manufacture a generic version of such products in the United States or Canada, respectively, prior to the expiration date of those patents. The sale of generic versions of these products, other than Hepsera, earlier than their patent expiration would have a significant negative effect on our revenues and results of operations.
42
We face credit risks from our Southern European customers that may adversely affect our results of operations.
Our European product sales to government-owned or supported customers in Southern Europe, specifically Greece, Italy, Portugal and Spain have historically been and continue to be subject to significant payment delays due to government funding and reimbursement practices. This has resulted and may continue to result in days sales outstanding being significantly higher in these countries due to the average length of time that accounts receivable remain outstanding. As of
December 31, 2012
, our accounts receivable in these countries totaled approximately
$822.4 million
of which,
$331.6 million
were past due greater than 120 days and
$106.3 million
were past due greater than 365 days as follows (in thousands):
|
|
December 31, 2012
|
|||||||
|
|
Greater than
120 days past due
|
Greater than
365 days past due
|
||||||
|
Italy
|
$
|
101,623
|
|
$
|
49,697
|
|
||
|
Spain
|
122,756
|
|
7,518
|
|
||||
|
Portugal
|
82,691
|
|
44,638
|
|
||||
|
Greece
|
24,553
|
|
4,424
|
|
||||
|
Total
|
$
|
331,623
|
|
$
|
106,277
|
|
||
Historically, receivable balances with certain publicly-owned hospitals accumulate over a period of time and are then subsequently settled as large lump sum payments. This pattern is also experienced by other pharmaceutical companies that sell directly to hospitals. If significant changes were to occur in the reimbursement practices of these European governments or if government funding becomes unavailable, we may not be able to collect on amounts due to us from these customers and our results of operations would be adversely affected.
In 2012, we collected $533.4 million in past due accounts receivable from customers based in Spain and Portugal. This included $349.7 million in proceeds from a one-time factoring arrangement where we sold receivables in Spain.
In 2011, the Greek government settled substantially all of its outstanding receivables subject to the bond settlement with zero-coupon bonds that trade at a discount to face value. In March 2012, the Greek government restructured its sovereign debt which impacted all holders of Greek bonds. As a result, we recorded a $40.1 million loss.
Our revenues and gross margin could be reduced by imports from countries where our products are available at lower prices.
Prices for our products are based on local market economics and competition and sometimes differ from country to country. Our sales in countries with relatively higher prices may be reduced if products can be imported into those or other countries from lower price markets. There have been cases in which other pharmaceutical products were sold at steeply discounted prices in the developing world and then re-exported to European countries where they could be re-sold at much higher prices. If this happens with our products, particularly Truvada and Viread, which we have agreed to make available at substantially reduced prices to 134 countries participating in our Gilead Access Program, or Atripla, which Merck distributes at substantially reduced prices to HIV infected patients in developing countries under our 2006 agreement, our revenues would be adversely affected. In addition, we have established partnerships with thirteen Indian generic manufacturers to distribute high-quality, low-cost generic versions of tenofovir disoproxil fumarate to 112 developing world countries, including India. If generic versions of our medications under these licenses are then re-exported to the United States, Europe or other markets outside of these 112 countries, our revenues would be adversely affected.
In addition, purchases of our products in countries where our selling prices are relatively low for resale in countries in which our selling prices are relatively high may adversely impact our revenues and gross margin and may cause our sales to fluctuate from quarter to quarter. For example, in the European Union, we are required to permit products purchased in one country to be sold in another country. Purchases of our products in countries where our selling prices are relatively low for resale in countries in which our selling prices are relatively high affect the inventory level held by our wholesalers and can cause the relative sales levels in the various countries to fluctuate from quarter to quarter and not reflect the actual consumer demand in any given quarter. These quarterly fluctuations may impact our earnings, which could adversely affect our stock price and harm our business.
43
Expensive litigation and government investigations have reduced and may continue to reduce our earnings.
We are involved in a number of litigation, investigation and other dispute-related matters that require us to expend substantial internal and financial resources. We expect these matters will continue to require a high level of internal and financial resources for the foreseeable future. These matters
have reduced and will continue to reduce our earnings. Please see a description of our Department of Justice investigation; Interference and litigation proceedings with Idenix and contract arbitration with Jeremy Clark in "Legal Proceedings" beginning on page 46. The outcome of the lawsuits above, or any other lawsuits that may be brought against us, the investigation or any other investigations that may be initiated, are inherently uncertain, and adverse developments or outcomes can result in significant expenses, m
onetary damages, penalties or injunctive relief against us that could significantly reduce our earnings and cash flows and harm our business.
In some countries, we may be required to grant compulsory licenses for our products or face generic competition for our products.
In a number of developing countries, government officials and other interested groups have suggested that pharmaceutical companies should make drugs for HIV infection available at low cost. Alternatively, governments in those developing countries could require that we grant compulsory licenses to allow competitors to manufacture and sell their own versions of our products, thereby reducing our product sales. For example, in the past, certain offices of the government of Brazil have expressed concern over the affordability of our HIV products and declared that they were considering issuing compulsory licenses to permit the manufacture of otherwise patented products for HIV infection, including Viread. In July 2009, the Brazilian patent authority rejected our patent application for tenofovir disoproxil fumarate, the active pharmaceutical ingredient in Viread. This was the highest level of appeal available to us within the Brazilian patent authority. Because we do not currently have a patent in Brazil, the Brazilian government now purchases its supply of tenofovir disoproxil fumarate from generic manufacturers. In addition, concerns over the cost and availability of Tamiflu related to a potential avian flu pandemic and H1N1 influenza generated international discussions over compulsory licensing of our Tamiflu patents. For example, the Canadian government considered allowing Canadian manufacturers to manufacture and export the active ingredient in Tamiflu to eligible developing and least developed countries under Canada's Access to Medicines Regime. Furthermore, Roche issued voluntary licenses to permit third-party manufacturing of Tamiflu. For example, Roche granted a sublicense to Shanghai Pharmaceutical (Group) Co., Ltd. for China and a sublicense to India's Hetero Drugs Limited for India and certain developing countries. Should one or more compulsory licenses be issued permitting generic manufacturing to override our Tamiflu patents, or should Roche issue additional voluntary licenses to permit third-party manufacturing of Tamiflu, those developments could reduce royalties we receive from Roche's sales of Tamiflu. Certain countries do not permit enforcement of our patents, and third-party manufacturers are able to sell generic versions of our products in those countries. Compulsory licenses or sales of generic versions of our products could significantly reduce our sales and adversely affect our results of operations, particularly if generic versions of our products are imported into territories where we have existing commercial sales.
Changes in royalty revenue disproportionately affect our pre-tax income, earnings per share and gross margins.
A portion of our revenues is derived from royalty revenues recognized from collaboration agreements with third parties. Royalty revenues impact our pre-tax income, earnings per share and gross margins disproportionately more than their contributions to our revenues. Any increase or decrease to our royalty revenue could be material and could significantly impact our operating results. For example, Roche's Tamiflu sales have unpredictable variability due to their strong relationship with seasonal influenza and global pandemic planning efforts. Tamiflu royalties increased sharply in 2009 and the first quarter of 2010 primarily as a result of pandemic planning initiatives worldwide. Tamiflu royalties since the second quarter of 2010 have decreased due to declining pandemic planning initiatives worldwide. During periods when our royalty revenue from Tamiflu increase, we will see a disproportionate increase in our pre-tax income, earnings per share and gross margins. Similarly, during periods when our royalty from Tamiflu decrease, we will see a disproportionate decrease in our pre-tax income, earnings per share and gross margins.
We may face significant liability resulting from our products that may not be covered by insurance and successful claims could materially reduce our earnings.
The testing, manufacturing, marketing and use of our commercial products, as well as product candidates in development, involve substantial risk of product liability claims. These claims may be made directly by consumers, healthcare providers, pharmaceutical companies or others. In recent years, coverage and availability of cost-effective product liability insurance has decreased, so we may be unable to maintain sufficient coverage for product liabilities that may arise. In addition, the cost to defend lawsuits or pay damages for product liability claims may exceed our coverage. If we are unable to maintain adequate coverage or if claims exceed our coverage, our financial condition and our ability to clinically test our product candidates and market our products will be adversely impacted. In addition, negative publicity associated with any claims, regardless of their merit, may decrease the future demand for our products and impair our financial condition.
44
Business disruptions from natural or man-made disasters may harm our future revenues.
Our worldwide operations could be subject to business interruptions stemming from natural or man-made disasters for which we may be self-insured. Our corporate headquarters and Fremont locations, which together house a majority of our research and development activities, and our San Dimas and Oceanside manufacturing facilities are located in California, a seismically active region. As we do not carry earthquake insurance and significant recovery time could be required to resume operations, our financial condition and operating results could be materially adversely affected in the event of a major earthquake.
Changes in our effective income tax rate could reduce our earnings.
Various factors may have favorable or unfavorable effects on our income tax rate. These factors include, but are not limited to, interpretations of existing tax laws, changes in tax laws and rates, our portion of the non-deductible pharmaceutical excise tax, the accounting for stock options and other share-based payments, mergers and acquisitions, future levels of R&D spending, changes in accounting standards, changes in the mix of earnings in the various tax jurisdictions in which we operate, changes in overall levels of pre-tax earnings and resolution of federal, state and foreign income tax audits. The impact on our income tax provision resulting from the above mentioned factors may be significant and could have a negative impact on our net income.
Our income tax returns are audited by federal, state and foreign tax authorities. We are currently under examination by the Internal Revenue Service for the 2008 and 2009 tax years and by various state and foreign jurisdictions. There are differing interpretations of tax laws and regulations, and as a result, significant disputes may arise with these tax authorities involving issues of the timing and amount of deductions and allocations of income among various tax jurisdictions. Resolution of one or more of these exposures in any reporting period could have a material impact on the results of operations for that period.
If we fail to attract and retain highly qualified personnel, we may be unable to successfully develop new product candidates, conduct our clinical trials and commercialize our product candidates.
Our future success will depend in large part on our continued ability to attract and retain highly qualified scientific, technical and management personnel, as well as personnel with expertise in clinical testing, governmental regulation and commercialization. We face competition for personnel from other companies, universities, public and private research institutions, government entities and other organizations. Competition for qualified personnel in the biopharmaceutical field is intense, and there is a limited pool of qualified potential employees to recruit. We may not be able to attract and retain quality personnel on acceptable terms. If we are unsuccessful in our recruitment and retention efforts, our business may be harmed.
|
ITEM 1B.
|
UNRESOLVED STAFF COMMENTS
|
Not applicable.
|
ITEM 2.
|
PROPERTIES
|
We lease facilities in Foster City, Fremont, Palo Alto and San Dimas, California, to house some of our manufacturing, warehousing and R&D activities. In addition, we also lease facilities in Branford, Connecticut and Seattle, Washington to house some of our administrative and R&D activities.
In 2012, in order to expand our corporate headquarters, we completed our purchase of an office building located at 303 Velocity Way, Foster City and associated real property.
Our international headquarters, which include some of our commercial, medical and administrative facilities, are located and leased in the London area in the United Kingdom.
We own a manufacturing facility in Cork, Ireland, that we primarily use for solid dose tablet manufacturing of our antiviral products, as well as product packaging activities. We also lease a facility in Cork used for shared services. We lease and own facilities in the Dublin area of Ireland to house distribution activities.
We own a manufacturing facility in Edmonton, Alberta, Canada, that we primarily use to conduct process research and scale-up of our clinical development candidates, the manufacturing of our active pharmaceutical ingredients for both investigational and commercial products and our chemical development activities to improve existing commercial manufacturing processes.
45
We also own a manufacturing facility in Oceanside, California, that is designed and equipped to produce biologic compounds for toxicological, Phase 1 and Phase 2 clinical studies. We use the facility for the process development and manufacture of simtuzumab, an investigational monoclonal antibody candidate in development for treatment of certain cancers and for fibrotic diseases, and another antibody.
We have leased additional facilities to house our commercial, medical and administrative activities in Australia, Austria, Belgium, Canada, the Czech Republic, France, Germany, Greece, Hong Kong, Ireland, Italy, Netherlands, Poland, Portugal, Russia, Spain, South Korea, Sweden, Switzerland, Turkey and the United Kingdom. We also lease an office in Shanghai, China to provide sourcing and manufacturing support primarily related to our commercial purchases of active pharmaceutical ingredients.
We believe that our existing properties, including both owned and leased sites, are in good condition and suitable for the conduct of our business. We believe our capital resources are sufficient to purchase, lease or construct any additional facilities required to meet our expected long-term growth needs.
|
ITEM 3.
|
LEGAL PROCEEDINGS
|
Litigation with Generic Manufacturers
Tenofovir Disoproxil Fumarate, Emtricitabine and Fixed-dose Combination of Emtricitabine, Tenofovir Disoproxil Fumarate and Efavirenz
In November 2008, we received notice that Teva Pharmaceuticals (Teva) submitted an abbreviated new drug application (ANDA) to the U.S. and Drug Administration (FDA) requesting permission to manufacture and market a generic version of Truvada. In the notice, Teva alleges that two of the patents associated with emtricitabine, owned by Emory University and licensed exclusively to us, are invalid, unenforceable and/or will not be infringed by Teva's manufacture, use or sale of a generic fixed-dose combination of emtricitabine and tenofovir disoproxil fumarate. In December 2008, we filed a lawsuit in U.S. District Court in New York against Teva for infringement of the two emtricitabine patents. In March 2009, we received notice that Teva submitted an ANDA to the FDA requesting permission to manufacture and market a generic fixed-dose combination of emtricitabine, tenofovir disoproxil fumarate and efavirenz. In the notice, Teva challenged the same two emtricitabine patents. In May 2009, we filed another lawsuit in U.S. District Court in New York against Teva for infringement of the two emtricitabine patents, and this lawsuit was consolidated with the lawsuit filed in December 2008. In January 2010, we received notice that Teva submitted an ANDA to the FDA requesting permission to manufacture and market a generic version of Viread. In the notice, Teva challenged four of the tenofovir disoproxil fumarate patents protecting Viread. In January 2010, we also received notices from Teva amending its ANDAs related to generic versions of our Atripla and Truvada products. In the notice related to Teva's ANDA for a generic version of Atripla, Teva challenged four patents related to tenofovir disoproxil fumarate, two additional patents related to emtricitabine and two patents related to efavirenz. In the notice related to Teva's ANDA for a generic version of Truvada, Teva challenged four patents related to tenofovir disoproxil fumarate and two additional patents related to emtricitabine. In March 2010, we filed lawsuits against Teva for infringement of the four Viread patents and two additional emtricitabine patents. In March 2010, Bristol-Myers Squibb Company and Merck & Co., Inc. filed a lawsuit against Teva for infringement of the patents related to efavirenz. Because we filed our lawsuits within the requisite 45 day period provided in the Hatch Waxman Act, there were stays preventing FDA approval of Teva's ANDAs for 30 months or until a district court decision adverse to the patents. The 30-month stay for all three Teva ANDAs expired in July 2012. However, as a result of the court's scheduling orders, Teva is prohibited from launching at risk upon expiration of that 30-month stay. Gilead and Teva reached an agreement in principle to settle the ongoing patent litigation concerning the four patents that protect tenofovir disoproxil fumarate in our Viread, Truvada and Atripla products. The trial in this litigation, which was scheduled to begin on February 20, 2013, has been adjourned pending completion of activities necessary to finalize the settlement. Under the agreement, Teva will be allowed to launch a generic version of Viread on December 15, 2017. The settlement agreement must be filed with the Federal Trade Commission and Department of Justice for their review before it is final.
In November 2011, we received notice that Teva submitted an Abbreviated New Drug Submission (ANDS) to the Canadian Ministry of Health requesting permission to manufacture and market a generic fixed-dose combination of emtricitabine and tenofovir disoproxil fumarate. In the notice, Teva alleges that three of the patents associated with Truvada are invalid, unenforceable and/or will not be infringed by Teva's manufacture, use or sale of a generic version of Truvada. In January 2012, we filed a lawsuit against Teva in Canadian Federal Court seeking an order of prohibition against approval of this ANDS.
46
In December 2011, we received notice that Teva submitted an ANDS to the Canadian Ministry of Health requesting permission to manufacture and market a generic fixed-dose combination of emtricitabine, tenofovir disoproxil fumarate and efavirenz. In the notice, Teva alleges that three of our patents associated with Atripla and two of Merck's patents associated with Atripla are invalid, unenforceable and/or will not be infringed by Teva's manufacture, use or sale of a generic fixed-dose combination of emtricitabine, tenofovir disoproxil fumarate and efavirenz. In February 2012, we filed a lawsuit against Teva in Canadian Federal Court seeking an order of prohibition against approval of this ANDS.
In July 2012, we received notice that Lupin Limited (Lupin) submitted an ANDA to the FDA requesting permission to manufacture and market a generic version of Truvada. In the notice, Lupin alleges that four patents associated with emtricitabine and four patents associated with tenofovir disoproxil fumarate are invalid, unenforceable and/or will not be infringed by Lupin's manufacture, use or sale of a generic version of a fixed-dose combination of emtricitabine and tenofovir disoproxil fumarate. In August 2012, we filed a lawsuit against Lupin in U.S. District Court in New York for infringement of our patents.
In July 2012, we received notice that Cipla Ltd. submitted an ANDA to the FDA requesting permission to manufacture and market a generic version of Emtriva and a generic version of Viread. In the notice, Cipla alleges that two patents associated with emtricitabine are invalid, unenforceable and/or will not be infringed by Cipla's manufacture, use or sale of a generic version of emtricitabine and four patents associated with tenofovir disoproxil fumarate are invalid, unenforceable and/or will not be infringed by Cipla's manufacture, use or sale of a generic version of tenofovir disoproxil fumarate. In August 2012, we filed lawsuits against Cipla in U.S. District Court in New York for infringement of our patents.
In August 2012, we received notice that Teva submitted an ANDS to the Canadian Ministry of Health requesting permission to manufacture and market a generic version of tenofovir disoproxil fumarate. In the notice, Teva alleges that two patents associated with Viread are invalid, unenforceable and/or will not be infringed by Teva's manufacture, use or sale of a generic version of Viread. In September 2012, we filed a lawsuit against Teva in Canadian Federal Court seeking an order of prohibition against approval of this ANDS. Also in August 2012, Teva filed an Impeachment Action in Canadian Federal Court seeking invalidation of our two Canadian patents associated with Viread. We are currently defending that Impeachment Action.
In October 2012, we received notice that Lupin submitted an ANDA to the FDA requesting permission to manufacture and market a generic version of Viread. In the notice, Lupin alleges that four patents associated tenofovir disoproxil fumarate are invalid, unenforceable and/or will not be infringed by Lupin's manufacture, use or sale of a generic version of tenofovir disoproxil fumarate. In October 2012, we filed a lawsuit against Lupin in U.S. District Court in New York for infringement of our patents.
Ranolazine
In June 2010, we received notice that Lupin submitted an ANDA to the FDA requesting permission to manufacture and market a generic version of sustained release ranolazine. In the notice, Lupin alleges that ten of the patents associated with Ranexa are invalid, unenforceable and/or will not be infringed by Lupin's manufacture, use or sale of a generic version of Ranexa. In July 2010, we filed a lawsuit against Lupin in U.S. District Court in New Jersey for infringement of our patents for Ranexa. The FDA cannot approve Lupin's ANDA until we receive a district court decision or upon the expiration of the court's automatic stay in July 2013. The court has scheduled the trial to begin in April 2013. If the court finds that none of the patents that protect our Ranexa formulation are infringed and/or that all are invalid and Lupin receives final approval of their product, Lupin will be able to launch generic version of our Ranexa product “at risk” upon issuance of that decision.
Adefovir disoproxil fumarate
In August 2010, we received notice that Sigmapharm Labs (Sigmapharm) submitted an ANDA to the FDA requesting permission to manufacture and market a generic adefovir dipivoxil. In the notice, Sigmapharm alleges that both of the patents associated with Hepsera are invalid, unenforceable and/or will not be infringed by Sigmapharm's manufacture, use or sale of a generic version of Hepsera. In September 2010, we filed a lawsuit against Sigmapharm in U.S. District Court in New Jersey for infringement of our patents. The FDA cannot approve Sigmapharm's ANDA until we receive a district court decision or upon the expiration of the court's automatic stay in February 2013. The court has not yet set a trial date in this case but we anticipate that trial will occur in mid-2013. Upon expiry of the 30-month stay in February 2013, if Sigmapharm obtains final FDA approval of its product from the FDA, it may elect to launch its generic product “at risk” of infringing our patents prior to the decision of the court.
One of the patents challenged by Sigmapharm has also been challenged by Ranbaxy, Inc. (Ranbaxy) pursuant to a notice received in October 2010. The patent challenged by Ranbaxy expires in July 2018. We have the option of filing a lawsuit at any time if we believe that Ranbaxy is infringing our patent.
47
Tamiflu
In February 2011, we received notice that Natco Pharma Ltd. (Natco) submitted an ANDA to the FDA requesting permission to manufacture and market a generic oseltamivir phosphate. In the notice, Natco alleges that one of the patents associated with Tamiflu is invalid, unenforceable and/or will not be infringed by Natco's manufacture, use or sale of a generic version of Tamiflu. In March 2011, we and F. Hoffmann-La Roche Ltd. filed a lawsuit against Natco in U.S. District Court in New Jersey for infringement of one of the patents associated with Tamiflu. In December 2012, the court issued a ruling in favor of Gilead and Roche, that our patent is not invalid for the reasons stated in Natco's notice letter.
We cannot predict the ultimate outcome of these actions, and we may spend significant resources enforcing and defending these patents. If we are unsuccessful in these lawsuits, some or all of our original claims in the patents may be narrowed or invalidated and the patent protection for Atripla, Truvada, Viread, Hepsera, Ranexa and Tamiflu in the United States and Atripla, Truvada and Viread in Canada could be substantially shortened. Further, if all of the patents covering one or more products are invalidated, the FDA or Canadian Ministry of Health could approve the requests to manufacture a generic version of such products in the United States or Canada, respectively, prior to the expiration date of those patents. The sale of generic versions of these products, other than Hepsera, earlier than their patent expiration would have a significant negative effect on our revenues and results of operations.
Department of Justice Investigation
In June 2011, we received a subpoena from the U.S. Attorney's Office for the Northern District of California requesting documents related to the manufacture, and related quality and distribution practices, of Complera, Atripla, Truvada, Viread, Emtriva, Hepsera and Letairis. We have been cooperating and will continue to cooperate with this governmental inquiry.
Interference Proceedings and Litigation with Idenix Pharmaceuticals, Inc.
In February 2012, we received notice that the U.S. Patent and Trademark Office (PTO) had declared an Interference between our U.S. Patent No. 7,429,572 and Idenix Pharmaceuticals, Inc.'s (Idenix) pending patent application no. 12/131868. An Interference is an administrative proceeding before the PTO designed to determine who was the first to invent the subject matter being claimed by both parties. Our patent covers metabolites of sofosbuvir and RG7128. Idenix is attempting to claim a class of compounds, including these metabolites, in their pending patent application. In the course of this proceeding, both parties will be called upon to submit evidence of the date they conceived of their respective inventions. The Interference will determine who was first to invent these compounds and therefore who is entitled to the patent claiming these compounds. If the administrative law judge determines Idenix is entitled to these patent claims and it is determined that we have infringed those claims, we may be required to obtain a license from and pay royalties to Idenix to commercialize sofosbuvir and RG7128. Any determination by the PTO can be appealed by either party to U.S. Federal Court.
In June 2012, we met with Idenix in mandatory settlement discussions. The parties were unable to settle the Interference due to our widely divergent views on the strength of our respective positions, on whether we need a license to Idenix's patents and whether Idenix needs a license to Gilead patents to develop and manufacture its pipeline products. We believe the Idenix application involved in the Interference and similar U.S. and foreign patents claiming the same compounds and metabolites are invalid. As a result, we filed an Impeachment Action in Canadian Federal Court to invalidate the Idenix CA2490191 patent, which is the Canadian patent that corresponds to the Idenix U.S. Patent No. 7608600 and the Idenix patent application that is the subject of the Interference. We filed a similar legal action in the Federal Court of Norway seeking to invalidate the corresponding Norwegian patent. We filed a similar legal action in the Federal Court of Australia seeking to invalidate the corresponding Australian patent. We may bring similar action in other countries in 2013. Idenix has not been awarded patents on these compounds and metabolites in European countries, Japan or China. In the event such patents issue, we expect to challenge them in proceedings similar to those we invoked in Canada, Norway and Australia.
48
Contract Arbitration
In March 2012, Jeremy Clark, a former employee of Pharmasset, Inc. (Pharmasset), which we acquired in January 2012, and inventor of U.S. Patent No. 7,429,572, filed a demand for arbitration in his lawsuit against Pharmasset and Dr. Raymond Schinazi. Mr. Clark initially filed the lawsuit against Pharmasset and Dr. Schinazi in Alabama District Court in February 2008 seeking to void the assignment provision in his employment agreement and assert ownership of U.S. Patent No. 7,429,572, which claims metabolites of sofosbuvir and RG7128. In December 2008, the court ordered a stay of the litigation pending the outcome of an arbitration proceeding required by Mr. Clark's employment agreement. Instead of proceeding with arbitration, Mr. Clark filed two additional lawsuits in September 2009 and June 2010, both of which were subsequently dismissed by the court. In September 2010, Mr. Clark filed a motion seeking reconsideration of the court's December 2008 order which was denied by the court. In December 2011, Mr. Clark filed a motion to appoint a special prosecutor. In February 2012, the Alabama Court issued an order requiring Mr. Clark to enter arbitration or risk dismissal of his case. Mr. Clark filed a demand for arbitration in March 2012. The arbitration panel has set a hearing date for April 2013. We cannot predict the outcome of the arbitration. If Mr. Clark's prior assignment of this patent to Pharmasset is voided by the arbitration panel, and he is ultimately found to be the owner of the 7,429,572 patent and it is determined that we have infringed the patent, we may be required to obtain a license from and pay royalties to Mr. Clark to commercialize sofosbuvir and RG7128.
Other Matters
We are a party to various legal actions that arose in the ordinary course of our business. We do not believe that any of these legal actions will have a material adverse impact on our consolidated business, financial position or results of operations.
|
ITEM 4.
|
MINE SAFETY DISCLOSURES
|
Not applicable.
49
|
ITEM 5.
|
MARKET FOR REGISTRANT'S COMMON EQUITY, RELATED STOCKHOLDER MATTERS AND ISSUER PURCHASES OF EQUITY SECURITIES
|
Our common stock is traded on The Nasdaq Global Select Market under the symbol “GILD”. The following table sets forth the high and low intra-day sale prices per share of our common stock on The Nasdaq Global Select Market for the periods indicated. These prices represent quotations among dealers without adjustments for retail mark-ups, markdowns or commissions and may not represent prices of actual transactions.
|
|
High
|
Low
|
||
|
2012
|
|
|
||
|
First Quarter
|
$28.02
|
$20.93
|
||
|
Second Quarter
|
$26.36
|
$22.71
|
||
|
Third Quarter
|
$33.88
|
$25.33
|
||
|
Fourth Quarter
|
$38.17
|
$32.43
|
||
|
2011
|
|
|
||
|
First Quarter
|
$21.45
|
$18.22
|
||
|
Second Quarter
|
$21.47
|
$19.40
|
||
|
Third Quarter
|
$21.75
|
$17.64
|
||
|
Fourth Quarter
|
$21.49
|
$17.23
|
||
As of
February 15, 2013
, we had
1,522,392,518
shares of common stock outstanding held by approximately 410 stockholders of record, which include shares held by a broker, bank or other nominee.
We have not paid cash dividends on our common stock since our inception. We expect to retain earnings primarily for use in the operation and expansion of our business, and therefore, do not anticipate paying any cash dividends in the near future. In an effort to continue to return value to our stockholders and minimize dilution from stock issuances, in January 2011, our Board of Directors (Board) authorized a three-year $5.00 billion stock repurchase program which commenced in September 2011 upon the completion of our May 2010 stock repurchase program. As of
December 31, 2012
, we have repurchased
$1.07 billion
of our common stock under our January 2011 stock repurchase program. During 2012, we spent a total of
$666.9 million
to repurchase and retire
23.1 million
shares of our common stock at an average purchase price of
$28.93
per share. We will suspend our share repurchases during the first half of 2013 in order to focus on debt repayment.
See Item 8, Note 12 to our Consolidated Financial Statements included in this Annual Report on Form 10-K for more information regarding our stock repurchase programs.
Performance Graph
(1)
The following graph compares our total stockholder returns for the past five years to two indices: the Standard & Poor's 500 Stock Index, labeled S&P500 Index; and the Nasdaq Biotechnology Index, labeled NBI Index. The total return for each index assumes the reinvestment of all dividends, if any, paid by companies included in these indices and are calculated as of December 31 of each year.
We are a composite member of each of the S&P500 Index and the NBI Index, and we intend to use these indices as comparators for our stock performance for the purposes of the following graph going forward. As a composite member of the S&P500 Index, we are required under applicable regulations to use this index as a comparator, and we believe the NBI Index is a relevant comparator since it is composed of peer companies in lines-of-business similar to ours.
The stockholder return shown on the graph below is not necessarily indicative of future performance, and we do not make or endorse any predictions as to future stockholder returns.
50
Comparison of Cumulative Total Return on Investment for the Past Five Years
(2)
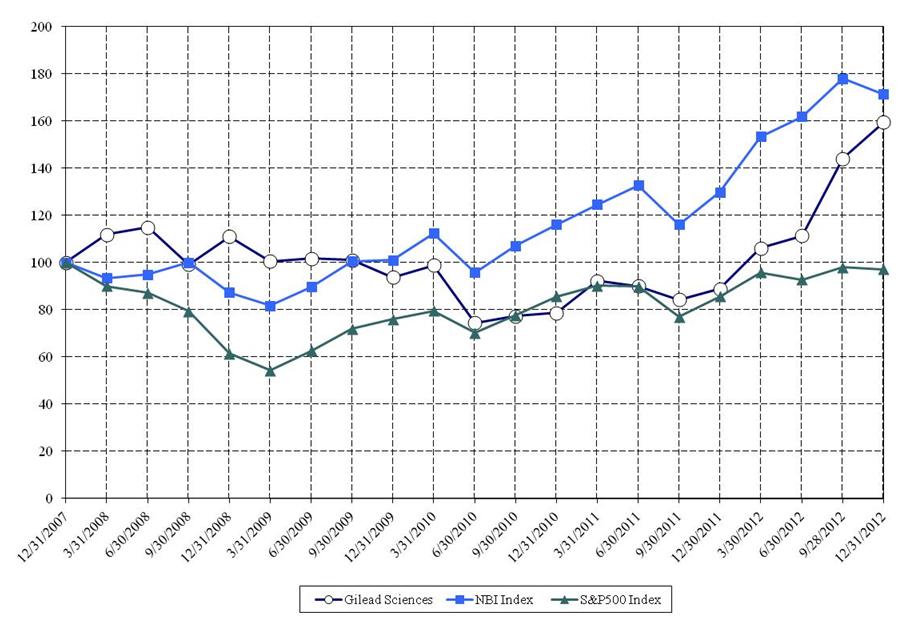
|
(1)
|
This section is not “soliciting material,” is not deemed “filed” with the SEC and is not to be incorporated by reference in any of our filings under the Securities Act or the Exchange Act whether made before or after the date hereof and irrespective of any general incorporation language in any such filing.
|
|
(2)
|
Shows the cumulative return on investment assuming an investment of $100 in our common stock, the NBI Index and the S&P500 Index on December 31, 2007.
|
Issuer Purchases of Equity Securities
As of
December 31, 2012
, we have repurchased
$1.07 billion
of our common stock under our January 2011, three-year, $5.00 billion stock repurchase program. For 2012, we spent a total of
$666.9 million
to repurchase and retire
23.1 million
shares of our common stock at an average purchase price of
$28.93
per share. We will suspend our share repurchases during the first half of 2013 in order to focus on debt repayment.
See Item 8, Note 12 to our Consolidated Financial Statements included in this Annual Report on Form 10-K for more information regarding our stock repurchase programs.
The table below summarizes our stock repurchase activity for the three months ended December 31, 2012 (in thousands, except per share amounts):
|
|
Total Number of
Shares Purchased
|
Average Price
Paid per Share
|
Total Number of
Shares Purchased
as Part of Publicly
Announced
Program
|
(1)
|
Maximum Fair
Value of Shares
that May Yet Be Purchased Under
the Program
|
(1)
|
|||||||||
|
October 1 - October 31, 2012
|
2,156
|
|
$
|
34.09
|
|
2,122
|
|
$
|
4,057,757
|
|
|||||
|
November 1 - November 30, 2012
|
2,176
|
|
$
|
35.30
|
|
2,002
|
|
$
|
3,986,617
|
|
|||||
|
December 1 - December 31, 2012
|
1,540
|
|
$
|
37.24
|
|
1,518
|
|
$
|
3,930,086
|
|
|||||
|
Total
|
5,872
|
|
(2)
|
$
|
35.37
|
|
5,642
|
|
(2)
|
|
|
||||
|
(1)
|
In January 2011, we announced that our Board authorized a three-year, $5.00 billion stock repurchase program, which expires in January 2014.
|
|
(2)
|
The difference between the total number of shares purchased and the total number of shares purchased as part of publicly announced programs is due to shares of common stock withheld by us from employee restricted stock awards in order to satisfy our applicable tax withholding obligations.
|
51
|
ITEM 6.
|
SELECTED FINANCIAL DATA
|
GILEAD SCIENCES, INC.
SELECTED CONSOLIDATED FINANCIAL DATA
(in thousands, except per share data)
|
|
Year Ended December 31,
|
||||||||||||||||||
|
|
2012
|
2011
|
2010
|
2009
|
2008
|
||||||||||||||
|
CONSOLIDATED STATEMENT OF INCOME DATA:
|
|
|
|
|
|
||||||||||||||
|
Total revenues
|
$
|
9,702,517
|
|
$
|
8,385,385
|
|
$
|
7,949,420
|
|
$
|
7,011,383
|
|
$
|
5,335,750
|
|
||||
|
Total costs and expenses
(1)
|
$
|
5,692,342
|
|
$
|
4,595,544
|
|
$
|
3,987,198
|
|
$
|
3,482,162
|
|
$
|
2,657,209
|
|
||||
|
Income from operations
|
$
|
4,010,175
|
|
$
|
3,789,841
|
|
$
|
3,962,222
|
|
$
|
3,529,221
|
|
$
|
2,678,541
|
|
||||
|
Provision for income taxes
|
$
|
1,038,381
|
|
$
|
861,945
|
|
$
|
1,023,799
|
|
$
|
876,364
|
|
$
|
702,363
|
|
||||
|
Net income attributable to Gilead
|
$
|
2,591,566
|
|
$
|
2,803,637
|
|
$
|
2,901,257
|
|
$
|
2,635,755
|
|
$
|
1,978,899
|
|
||||
|
Net income per share attributable to Gilead common stockholders-basic
(2)
|
$
|
1.71
|
|
$
|
1.81
|
|
$
|
1.69
|
|
$
|
1.46
|
|
$
|
1.07
|
|
||||
|
Shares used in per share calculation-basic
(2)
|
1,514,621
|
|
1,549,806
|
|
1,712,120
|
|
1,809,208
|
|
1,841,386
|
|
|||||||||
|
Net income per share attributable to Gilead common stockholders-diluted
(2)
|
$
|
1.64
|
|
$
|
1.77
|
|
$
|
1.66
|
|
$
|
1.41
|
|
$
|
1.03
|
|
||||
|
Shares used in per share calculation-diluted
(2)
|
1,582,549
|
|
1,580,236
|
|
1,746,792
|
|
1,868,218
|
|
1,917,650
|
|
|||||||||
|
|
As of December 31,
|
||||||||||||||||||
|
|
2012
|
2011
|
2010
|
2009
|
2008
|
||||||||||||||
|
CONSOLIDATED BALANCE SHEET DATA:
|
|
|
|
|
|
||||||||||||||
|
Cash, cash equivalents and marketable securities
|
$
|
2,582,086
|
|
$
|
9,963,972
|
|
$
|
5,318,071
|
|
$
|
3,904,846
|
|
$
|
3,239,639
|
|
||||
|
Working capital
|
$
|
1,886,327
|
|
$
|
11,403,995
|
|
$
|
3,243,132
|
|
$
|
2,940,927
|
|
$
|
3,057,416
|
|
||||
|
Total assets
(3)
|
$
|
21,239,838
|
|
$
|
17,303,134
|
|
$
|
11,592,630
|
|
$
|
9,698,559
|
|
$
|
6,936,831
|
|
||||
|
Other long-term obligations
|
$
|
228,040
|
|
$
|
147,736
|
|
$
|
27,401
|
|
$
|
35,918
|
|
$
|
21,462
|
|
||||
|
Convertible senior notes, senior unsecured notes and credit facility
(4)
|
$
|
8,223,988
|
|
$
|
7,605,734
|
|
$
|
3,477,564
|
|
$
|
1,155,443
|
|
$
|
1,098,025
|
|
||||
|
Retained earnings
|
$
|
3,704,744
|
|
$
|
1,776,760
|
|
$
|
1,183,730
|
|
$
|
1,995,272
|
|
$
|
300,314
|
|
||||
|
Total stockholders' equity
|
$
|
9,550,869
|
|
$
|
6,867,349
|
|
$
|
6,121,837
|
|
$
|
6,505,158
|
|
$
|
4,465,583
|
|
||||
|
(1)
|
During 2012, we recorded $100.1 million and $93.8 million of stock-based compensation in research and development (R&D) expenses and selling, general and administrative expenses, respectively, related to the acquisition of Pharmasset.
|
During 2011, we recorded $26.6 million of impairment charges in R&D expense related to certain in-process research and development (IPR&D) assets acquired from CGI Pharmaceuticals, Inc.
During 2010, we recorded $136.0 million of impairment charges in R&D expense related to certain IPR&D assets acquired from CV Therapeutics, Inc. (CV Therapeutics).
During 2008, we completed the acquisition of all of the assets of Navitas Assets, LLC related to its cicletanine business for an aggregate purchase price of $10.9 million which was recorded as IPR&D expense.
|
(2)
|
Net income per share and the number of shares used in the per share calculations for all periods presented reflect the two-for-one stock split in the form of a stock dividend effective on January 25, 2013.
|
|
(3)
|
During 2012, we completed the acquisition of Pharmasset and we recognized consideration transferred of $11.05 billion which was primarily recorded in intangible assets. We financed the transaction with approximately $5.20 billion in cash on hand, $2.15 billion in bank debt issued in January 2012 and $3.70 billion in senior unsecured notes issued in December 2011.
|
During 2009, we completed the acquisition of CV Therapeutics and we recognized consideration transferred of $1.39 billion which was primarily recorded in intangible assets.
|
(4)
|
During 2012, we borrowed $750.0 million under our five-year revolving credit facility credit agreement.
|
During 2011, we issued $4.70 billion principal amount of senior unsecured notes in registered offerings.
During 2010, we issued $2.50 billion principal amount of convertible senior notes in a private placement.
52
|
ITEM 7.
|
MANAGEMENT'S DISCUSSION AND ANALYSIS OF FINANCIAL CONDITION AND RESULTS OF OPERATIONS
|
The following Management's Discussion and Analysis of Financial Condition and Results of Operations (MD&A) is intended to help the reader understand our results of operations and financial condition. MD&A is provided as a supplement to, and should be read in conjunction with, our audited Consolidated Financial Statements and the accompanying notes to the Consolidated Financial Statements and other disclosures included in this Annual Report on Form 10-K (including the disclosures under “Item 1A. Risk Factors”). Our Consolidated Financial Statements have been prepared in accordance with U.S. generally accepted accounting principles and are presented in U.S. dollars.
Management Overview
Gilead Sciences, Inc. (Gilead, we or us), incorporated in Delaware on June 22, 1987, is a research-based biopharmaceutical company that discovers, develops and commercializes innovative medicines in areas of unmet medical need. With each new discovery and experimental drug candidate, we seek to improve the care of patients suffering from life-threatening diseases around the world. Gilead's primary areas of focus include human immunodeficiency virus (HIV), liver diseases such as hepatitis B virus (HBV) and hepatitis C virus (HCV), serious cardiovascular and respiratory conditions and oncology/inflammation. Headquartered in Foster City, California, we have operations in North America, Europe and Asia. We continue to add to our existing portfolio of products through our internal discovery and clinical development programs and through our product acquisition and in-licensing strategy.
Our product portfolio is comprised of Stribild
®
, Complera
®
/Eviplera
®
, Atripla
®
, Truvada
®
, Viread
®
, Hepsera
®
, Emtriva
®
, Letairis
®
, Ranexa
®
, AmBisome
®
, Cayston
®
and Vistide
®
. We have U.S. and international commercial sales operations, with marketing subsidiaries in North America, Europe and Asia. In addition, we also sell and distribute certain products through our corporate partners under royalty-paying collaborative agreements.
Business Highlights
We continue to advance our pipeline across all therapeutic areas and believe the combination of our existing internal research programs and our recent acquisitions and partnerships will allow us to continue to bring innovative therapies to individuals who are living with unmet medical needs. Below is a summary of our key accomplishments during 2012:
|
•
|
completed the $11.05 billion acquisition of Pharmasset, Inc. (Pharmasset), acquired the lead compound now known as sofosbuvir, a nucleotide analog being evaluated for the treatment of HCV infection and accelerated our timeline to develop the first all-oral HCV regimen as a result of the acquisition;
|
|
•
|
expanded worldwide access to Complera/Eviplera, now available in 21 countries;
|
|
•
|
expanded our research and development (R&D) pipeline with over 50 active Phase 3 clinical studies at the end of 2012;
|
|
•
|
submitted marketing applications in the United States and European Union for elvitegravir, an integrase inhibitor for the treatment of HIV-1 infection in treatment-experienced adults, and cobicistat, a pharmacoenhancing or "boosting" agent that increases blood levels to allow once-daily dosing of certain HIV medicines. The U.S. Food and Drug Administration (FDA) has set target review dates of April 2013 under the Prescription Drug User Fee Act;
|
|
•
|
obtained FDA approval for and launched Stribild, our third single tablet regimen for the treatment of HIV in the United States;
|
|
•
|
announced the acquisition of YM Biosciences (YM), which closed in February 2013, and will expand our growing oncology/inflammation pipeline; and
|
|
•
|
obtained FDA approval for once-daily oral Truvada, in combination with safer sex practices, for pre-exposure prophylaxis (PrEP) to reduce the risk of HIV-1 infection among uninfected adults.
|
Outlook 2013
Our operating objectives for 2013 include increasing the market share of our commercial products, continuing to strengthen our pipeline with internally developed and/or externally in-licensed or purchased opportunities and strengthening our key alliances.
From an R&D perspective, we will continue advancing our growing product pipeline. Our focus will be on progressing our efforts towards filing marketing applications for sofosbuvir for the treatment of HCV, developing additional innovative HIV single tablet regimens and advancing new product candidates for the treatment of oncology and inflammation diseases. As a result, we expect to move forward on a number of important late-stage clinical studies related to HIV, HCV, oncology and inflammation.
53
From a commercial perspective, we have a number of initiatives to promote the continued growth of our franchises. In the HIV area, the scientific support for earlier diagnosis and treatment, along with the use of single tablet regimens remains compelling both medically and practically. In anticipation of receiving regulatory approval for sofosbuvir, we will begin to build our commercial organization to support the expected launch of this product in 2014.
In 2012, we launched Stribild, a single tablet regimen for the treatment of HIV in the United States. In 2013, we expect continued strong uptake of Stribild in the United States. Our marketing application for Stribild is currently being reviewed by the European Medicines Agency, and if approved, we expect to make the product available in the second quarter of 2013. In the HBV area, we will continue to support educational and promotional activities focused on Asian communities in the United States, highlighting the need to screen, diagnose and link patients to care. In the cardiovascular area, we will continue our efforts to raise awareness of Gilead in the pulmonary arterial hypertension and cardiology communities.
We are mindful that conditions in the current macroeconomic environment could affect our ability to achieve our goals. Some of the factors that could affect our business include: changes to legislation that may delay or impact funding for ADAPs in the United States, a continuation or worsening of economic conditions in certain key markets, particularly in Europe, patent expirations of competitive products and the launch of generic competitors, continued government pricing pressures internationally and the potential volatility in foreign currency exchange rates. We will continue to monitor these conditions and will adjust our business processes, as appropriate, to attempt to mitigate these risks to our business.
We believe the successes we experienced in 2012 have enabled us to continue to build a financially sound business model that will allow us to continue to further expand our commercial and R&D activities and to maintain quality and compliance. As we continue to grow our business, we remain focused on profitable revenue growth and prudent expense management that we believe will enable solid execution of our operating objectives for 2013.
Financial Highlights
During
2012
, total revenues grew
16%
to
$9.70 billion
, driven by strong underlying demand for our products. Total product sales were
$9.40 billion
for
2012
,
an increase
of
16%
over
2011
due primarily to growth in our antiviral franchise, which
increased
15%
to
$8.14 billion
compared to the prior year. Sales of Letairis, Ranexa and AmBisome together surpassed the $1 billion mark, reaching
$1.13 billion
, an increase of
20%
compared to the prior year. Royalty revenues from our collaborations with corporate partners were
$290.5 million
, an increase of
8%
compared to the prior year.
R&D expenses increased
43%
to
$1.76 billion
for
2012
as we progressed and invested in the expansion of our product pipeline. We continued investing in our Phase 3 clinical studies, particularly in liver disease and oncology. Selling, general and administrative (SG&A) expenses were
$1.46 billion
for
2012
, an increase of
$219.1 million
or
18%
over
2011
, reflective of the ongoing growth of our business and an increase in the pharmaceutical excise tax resulting from U.S. healthcare reform.
Net income for
2012
was
$2.59 billion
or
$1.64
per diluted share, a decrease from
$2.80 billion
or
$1.77
per diluted share in
2011
, primarily due to the continued progression and investment of our product pipeline, and an increase in our effective tax rate resulting from a shift in our geographic mix of earnings, expiration of the federal research tax credit and an increase in acquisition-related expenses for which we receive no tax benefit.
At
December 31, 2012
, cash, cash equivalents and marketable securities totaled
$2.58 billion
, a decrease from
$9.96 billion
as of
December 31, 2011
. In January 2012, we completed the Pharmasset acquisition which we financed with approximately $5.20 billion in cash on hand, $3.70 billion in senior unsecured notes issued in December 2011 and $2.15 billion in bank debt issued in January 2012. We generated over
$3.19 billion
in operating cash flows during 2012, some of which we used to repay approximately
$1.84 billion
in debt financing and repurchase and retire shares of our common stock for
$666.9 million
.
54
Results of Operations
Total Revenues
Total revenues include product sales, royalty revenues, and contract and other revenues. Total revenues were
$9.70 billion
in
2012
,
$8.39 billion
in
2011
and
$7.95 billion
in
2010
. Increases in total revenues were driven by growth in product sales.
Product Sales
Total product sales were
$9.40 billion
in
2012
, an increase of
16%
over total product sales of
$8.10 billion
in
2011
, primarily driven by continued growth in sales of antiviral products, including Atripla, Truvada and Complera/Eviplera. The increase also reflected sales growth in other products, primarily Letairis, Ranexa and AmBisome, which reached
$1.13 billion
in
2012
compared to
$943.6 million
in
2011
. Total product sales increased by
10%
in
2011
compared to
$7.39 billion
in
2010
, primarily driven by the growth of Atripla and Truvada.
More than 40% of our product sales are generated outside the United States and as a result, we face exposure to adverse movements in foreign currency exchange rates, primarily in Euro. We used foreign currency exchange forward contracts to hedge a percentage of our foreign currency exposure. Foreign currency exchange, net of hedges, had an unfavorable impact of $57.1 million on our
2012
revenues compared to
2011
and a favorable impact of $21.4 million on our
2011
revenues compared to
2010
.
Product sales in the United States increased
22%
for
2012
to $5.54 billion compared to $4.55 billion in
2011
, primarily driven by higher underlying demand for our antiviral products and the launch of Stribild in August 2012. Product sales in other therapeutic areas also contributed to the growth. Letairis sales totaled
$410.1 million
in
2012
, an increase of
40%
compared to
2011
. Ranexa sales totaled
$372.9 million
in
2012
, an increase of
17%
compared to
2011
. AmBisome sales totaled
$346.6 million
in
2012
, an increase of
5%
compared to
2011
.
Product sales in Europe increased
6%
for
2012
to $3.14 billion compared to $2.97 billion in
2011
, primarily driven by higher underlying demand in our antiviral franchise. Antiviral product sales in Europe totaled
$2.87 billion
in
2012
, an increase of
6%
compared to
$2.71 billion
in
2011
, primarily driven by the sales of Atripla and Truvada. Foreign currency exchange, net of hedges, had an unfavorable impact of $68.9 million on our European product sales in
2012
compared to
2011
.
Total product sales are expected to grow in 2013, as we realize the full year impact of sales of Stribild and continued growth of Complera/Eviplera and products in our cardiovascular franchise. We believe this growth could be tempered by uncertainty around the timing of approval of the U.S. federal budget, the possibility of an automatic reduction in federal spending, or "sequestration" in March 2013, the unavailability or delay in AIDS Drug Assistance Programs (ADAP) funding and the challenging economic environment in Europe. Our results are also subject to continued potential volatility in foreign currency exchange rates.
The following table summarizes the period over period changes in our product sales (in thousands):
|
|
2012
|
Change
|
2011
|
Change
|
2010
|
|||||||||||||
|
Antiviral products:
|
|
|
|
|
|
|||||||||||||
|
Atripla
|
$
|
3,574,483
|
|
11
|
%
|
$
|
3,224,518
|
|
10
|
%
|
$
|
2,926,579
|
|
|||||
|
Truvada
|
3,181,110
|
|
11
|
%
|
2,875,141
|
|
8
|
%
|
2,649,908
|
|
||||||||
|
Viread
|
848,697
|
|
15
|
%
|
737,867
|
|
1
|
%
|
732,240
|
|
||||||||
|
Complera/Eviplera
|
342,200
|
|
783
|
%
|
38,747
|
|
—
|
%
|
—
|
|
||||||||
|
Stribild
|
57,536
|
|
—
|
%
|
—
|
|
—
|
%
|
—
|
|
||||||||
|
Hepsera
|
108,315
|
|
(25
|
)%
|
144,679
|
|
(28
|
)%
|
200,592
|
|
||||||||
|
Emtriva
|
29,449
|
|
2
|
%
|
28,764
|
|
4
|
%
|
27,679
|
|
||||||||
|
Total antiviral products
|
8,141,790
|
|
15
|
%
|
7,049,716
|
|
8
|
%
|
6,536,998
|
|
||||||||
|
Letairis
|
410,054
|
|
40
|
%
|
293,426
|
|
22
|
%
|
240,279
|
|
||||||||
|
Ranexa
|
372,949
|
|
17
|
%
|
320,004
|
|
33
|
%
|
239,832
|
|
||||||||
|
AmBisome
|
346,646
|
|
5
|
%
|
330,156
|
|
8
|
%
|
305,856
|
|
||||||||
|
Other
|
126,932
|
|
16
|
%
|
109,057
|
|
63
|
%
|
66,956
|
|
||||||||
|
Total product sales
|
$
|
9,398,371
|
|
16
|
%
|
$
|
8,102,359
|
|
10
|
%
|
$
|
7,389,921
|
|
|||||
55
Antiviral Products
Antiviral product sales increased by
15%
in
2012
compared to
2011
and
8%
in
2011
compared to
2010
.
|
•
|
Atripla
|
In
2012
, Atripla sales were driven primarily by sales volume growth in the United States. In
2011
, Atripla sales were driven primarily by sales volume growth in Europe and the United States. Atripla sales accounted for
44%
,
46%
and
45%
of our total antiviral product sales for
2012
,
2011
and
2010
, respectively. The efavirenz component of Atripla, which has a gross margin of zero, comprised $1.34 billion, $1.21 billion and $1.07 billion of our Atripla sales in
2012
,
2011
and
2010
, respectively.
|
•
|
Truvada
|
In
2012
, Truvada sales were driven primarily by sales volume growth in the United States. In
2011
, Truvada sales were driven primarily by sales volume growth in Europe and the United States. Truvada sales accounted for
39%
,
41%
and
41%
of our total antiviral product sales for
2012
,
2011
and
2010
, respectively.
|
•
|
Complera/Eviplera
|
In
2012
, sales of Complera/Eviplera increased primarily due to sales volume growth in the United States. Complera was approved in the United States in August 2011, and Eviplera was approved in the European Union in November 2011.
|
•
|
Stribild
|
Stribild was approved in the United States in August 2012.
Other Product Sales
Other products, which include Letairis, Ranexa and AmBisome increased due primarily to sales volume growth. Since the label update in March 2011, sales of Letairis have continued to grow as a result of higher enrollments, increasing by
40%
in
2012
and
22%
in
2011
. AmBisome product sales in the United States and Canada relate solely to our sales of AmBisome to Astellas Pharma US, Inc. which are recorded at our manufacturing cost.
Royalty Revenues
The following table summarizes the period over period changes in our royalty revenues (in thousands):
|
|
2012
|
Change
|
2011
|
Change
|
2010
|
|||||||||||||
|
Royalty revenues
|
$
|
290,523
|
|
8
|
%
|
$
|
268,827
|
|
(51
|
)%
|
$
|
545,970
|
|
|||||
Royalty revenues increased
8%
for
2012
compared to
2011
, driven primarily by higher royalty revenues from GlaxoSmithKline, Japan Tobacco and Astellas partially offset by lower Tamiflu royalties from Roche. Since the second quarter of 2010, Tamiflu royalties have been decreasing due to the decline in flu planning initiatives worldwide. In 2011 and 2010, our most significant source of royalty revenues was sales of Tamiflu by Roche. Royalty revenues declined
51%
for
2011
compared to
2010
, due primarily to lower Tamiflu royalties from Roche. Tamiflu royalties from Roche contributed $43.7 million, $75.5 million and $386.5 million to total royalty revenues in
2012
,
2011
and
2010
respectively. We recognize royalties on Tamiflu sales by Roche in the quarter following the quarter in which the corresponding sales occur.
Cost of Goods Sold and Product Gross Margin
The following table summarizes the period over period changes in our product sales (in thousands), cost of goods sold (in thousands) and product gross margin:
|
|
2012
|
Change
|
2011
|
Change
|
2010
|
|||||||||||||
|
Total product sales
|
$
|
9,398,371
|
|
16
|
%
|
$
|
8,102,359
|
|
10
|
%
|
$
|
7,389,921
|
|
|||||
|
Cost of goods sold
|
$
|
2,471,363
|
|
16
|
%
|
$
|
2,124,410
|
|
14
|
%
|
$
|
1,869,876
|
|
|||||
|
Product gross margin
|
74
|
%
|
|
|
74
|
%
|
|
|
75
|
%
|
||||||||
Our product gross margin for
2012
was consistent with our product gross margin for
2011
. Our product gross margin for
2011
was
74%
, a decrease of
1%
compared to 2010, due primarily to an annual selling price adjustment for the percentage share of Atripla that is paid to our partner on the efavirenz component.
56
Research and Development Expenses
|
|
2012
|
Change
|
2011
|
Change
|
2010
|
|||||||||||||
|
Research and development
|
$
|
1,759,945
|
|
43
|
%
|
$
|
1,229,151
|
|
15
|
%
|
$
|
1,072,930
|
|
|||||
We manage our R&D expenses by identifying the R&D activities we anticipate will be performed during a given period and then prioritizing efforts based on scientific data, probability of successful development, market potential, available human and capital resources and other considerations. We continually review our R&D pipeline and the status of development and, as necessary, reallocate resources among the R&D portfolio that we believe will best support the future growth of our business.
R&D expenses summarized above consist primarily of clinical studies performed by contract research organizations (CROs), materials and supplies, licenses and fees, milestone payments under collaboration arrangements, personnel costs, including salaries, benefits and stock-based compensation and overhead allocations consisting of various support and facilities-related costs. The following table provides a breakout of R&D expenses by major cost type (in thousands):
|
|
2012
|
2011
|
2010
|
|||||||||
|
Clinical studies and outside services
|
$
|
828,278
|
|
$
|
570,302
|
|
$
|
375,228
|
|
|||
|
Personnel expenses
|
686,091
|
|
412,463
|
|
384,488
|
|
||||||
|
Facilities, IT and other costs
|
245,576
|
|
219,756
|
|
177,214
|
|
||||||
|
IPR&D impairment charges
|
—
|
|
26,630
|
|
136,000
|
|
||||||
|
Total
|
$
|
1,759,945
|
|
$
|
1,229,151
|
|
$
|
1,072,930
|
|
|||
Compared to
2011
, in
2012
, clinical studies and outside services increased $258.0 million due to progression and expansion of our Phase 3 studies, particularly in liver disease and oncology, and personnel expenses increased $273.6 million due to higher headcount to support our product pipeline and study progression.
Compared to
2010
, in
2011
, clinical studies and outside services increased $195.1 million due to study progression in liver disease and HIV, new investments in oncology and inflammation and new in-license agreements, milestones and ongoing collaborations; personnel expenses increased $28.0 million due to higher headcount; and facilities, IT and other costs increased $42.5 million to support the ongoing growth of our business. This increase was partially offset by a $109.4 million decrease in IPR&D impairment charges.
During 2011, we recorded $26.6 million of impairment charges related to certain IPR&D assets acquired from CGI Pharmaceuticals, Inc. (CGI). These impairment charges were a result of changes in the anticipated market share related to the Syk compound.
During 2010, we recorded $136.0 million of impairment charges related to certain IPR&D assets acquired from CV Therapeutics, Inc. The majority of the impairment charge related to our GS-9667 program, a product candidate that was in Phase 1 clinical studies for the treatment of diabetes and hypertriglyceridemia, which was terminated in the fourth quarter of 2010 due to unfavorable results from pharmacokinetics and pharmacodynamics tests that demonstrated limited effectiveness of the compound in patients.
In 2013, we expect R&D expenses to increase over
2012
levels due to continued investment in our internal and collaborative R&D efforts and advancement of our product pipeline, driven primarily by the progression of our Phase 3 clinical studies in the liver disease and oncology areas.
Selling, General and Administrative Expenses
|
|
2012
|
Change
|
2011
|
Change
|
2010
|
|||||||||||||
|
Selling, general and administrative
|
$
|
1,461,034
|
|
18
|
%
|
$
|
1,241,983
|
|
19
|
%
|
$
|
1,044,392
|
|
|||||
SG&A expenses relate to sales and marketing, finance, human resources, legal and other administrative activities. Expenses are primarily comprised of facilities and overhead costs; outside marketing, advertising and legal expenses and other general and administrative costs.
Compared to
2011
, in
2012
, SG&A expenses increased
$219.1 million
or
18%
. The increase was due primarily to a $100.5 million increase in costs associated with the growth of our business which include personnel and headcount-related expenses, a $98.0 million increase in stock-based compensation expenses primarily resulting from the acquisition of
57
Pharmasset and an increase of $38.2 million in the pharmaceutical excise tax resulting from U.S. healthcare reform. This increase was partially offset by a reduction in bad debt provisions of $34.3 million, which included a gain of $29.9 million related to the sale of our accounts receivables balances in Spain in the second quarter of 2012.
Compared to
2010
, in
2011
, SG&A expenses increased
$197.6 million
or
19%
, due primarily to increased contract, legal and other professional services of $86.8 million, pharmaceutical excise tax of $47.3 million, increased compensation and benefits expenses of $41.6 million as a result of higher headcount to support our expanding commercial activities, promotional costs of $20.1 million driven by our expanding sales and marketing activities and bad debt provisions of $14.7 million associated with slower collections in southern European countries.
In 2013, we expect SG&A expenses to increase over 2012 to support the expansion of our business including the pre-launch activities in preparation for the anticipated NDA filing of sofosbuvir in the first half of 2013 and an increase in the pharmaceutical excise tax. We also expect bad debt provisions to return to historical levels as 2012 included significant collections of past due accounts receivable in Spain and Portugal, that we do not expect to occur in 2013.
Interest Expense
Compared to
2011
, in
2012
, interest expense increased to
$360.9 million
. The increase was due primarily to the additional debt we issued in connection with our acquisition of Pharmasset, which included $3.70 billion in senior unsecured notes issued in December 2011 and $2.15 billion in bank debt issued in January 2012. Compared to
2010
, in
2011
, interest expense increased to
$205.4 million
. The increase in interest expense was due primarily to the issuance of our convertible senior notes for $2.50 billion in July 2010, the issuance of our senior unsecured notes for $1.00 billion in March 2011, and the issuance of our senior unsecured notes for $3.70 billion in December 2011. This increase was partially offset by the maturity of our convertible senior notes due in May 2011, which had an aggregate principal balance of $650.0 million.
Other Income (Expense), Net
For
2012
, other income (expense), net was a net expense of
$(37.3) million
compared to income of
$66.6 million
and
$60.3 million
in
2011
and
2010
, respectively. The decrease in other income (expense), net, in
2012
compared to
2011
was due primarily to decreased interest income resulting from lower cash and marketable securities balances and yields and a $40.1 million loss on Greek bonds related to Greece's restructuring of its sovereign debt in the first quarter of 2012. The increase in other income (expense), net, in
2011
compared to
2010
was driven primarily by a favorable net foreign currency exchange impact and an increase in interest income, partially offset by an increase in costs related to our hedging activities.
Provision for Income Taxes
Our provision for income taxes was
$1.04 billion
,
$861.9 million
and
$1.02 billion
in
2012
,
2011
and
2010
, respectively. The
2012
effective tax rate of 28.7% differed from the U.S. federal statutory rate of 35% due primarily to tax credits and certain operating earnings from non-U.S. subsidiaries that are considered indefinitely reinvested, partially offset by state taxes, the stock-based compensation expense related to the Pharmasset acquisition and contingent consideration expense related to certain acquisitions for which we receive no tax benefit. We do not provide for U.S. income taxes on undistributed earnings of our foreign operations that are intended to be indefinitely reinvested in our foreign subsidiaries.
The
2011
effective tax rate of 23.6% differed from the U.S. federal statutory rate of 35% due primarily to tax credits and certain operating earnings from non-U.S. subsidiaries that are considered indefinitely reinvested, partially offset by state taxes and the non-deductible pharmaceutical excise tax.
The
2010
effective tax rate of 26.2% differed from the U.S. federal statutory rate of 35% due primarily to tax credits and certain operating earnings from non-U.S. subsidiaries that are considered indefinitely reinvested, partially offset by state taxes.
In January 2013, the U.S. Congress passed the American Taxpayer Relief Act of 2012 which retroactively reinstated the federal research tax credit for 2012 and 2013. As a result, our income tax provision for the first quarter of 2013 will include a discrete tax benefit related to the federal research tax credit for 2012 which will reduce our effective tax rate for the quarter and to a lesser extent, the annual effective tax rate.
58
Acquisition of Pharmasset
In January 2012, we completed the acquisition of Pharmasset, a publicly-held clinical-stage pharmaceutical company committed to discovering, developing and commercializing novel drugs to treat viral infections. Pharmasset's primary focus was the development of oral therapeutics for the treatment of HCV infection. Pharmasset's lead compound, now known as sofosbuvir (formally known as GS-7977), is a nucleotide analog which, as of January 2012, was being evaluated in Phase 2 and Phase 3 clinical studies for the treatment of HCV infection across genotypes. We believe the acquisition of Pharmasset provides us with an opportunity to complement our existing HCV portfolio and helps advance our effort to develop all-oral regimens for the treatment of HCV.
We acquired all of the outstanding shares of common stock of Pharmasset for $137 per share in cash through a tender offer and subsequent merger under the terms of an agreement and plan of merger entered into in November 2011. The aggregate cash payment to acquire all of the outstanding shares of common stock was $11.05 billion. We financed the transaction with approximately $5.20 billion in cash on hand,
$3.70 billion
in senior unsecured notes issued in December 2011 and $2.15 billion in bank debt issued in January 2012.
The Pharmasset acquisition was accounted for as a business combination. The results of operations of Pharmasset have been included in our Consolidated Statement of Income since January 13, 2012, the date on which we acquired approximately
88%
of the outstanding shares of common stock of Pharmasset, cash consideration was transferred, and as a result, we obtained effective control of Pharmasset. The acquisition was completed on
January 17, 2012
, at which time Pharmasset became a wholly-owned subsidiary of Gilead and was integrated into our operations. As we do not track earnings results by product candidate or therapeutic area, we do not maintain separate earnings results for the acquired Pharmasset business.
The following table summarizes the components of the cash paid to acquire Pharmasset (in thousands):
|
Total consideration transferred
|
$
|
10,858,372
|
|
|
Stock-based compensation expense
|
193,937
|
|
|
|
Total cash paid
|
$
|
11,052,309
|
|
The
$11.05 billion
cash payment consisted of a
$10.38 billion
cash payment to the outstanding common stockholders as well as a
$668.3 million
cash payment to option holders under the Pharmasset stock option plans. The
$10.38 billion
cash payment to the outstanding common stockholders and
$474.3 million
of the cash payment to vested option holders under the Pharmasset stock option plans were accounted for as consideration transferred. The remaining
$193.9 million
of cash payment was accounted for as stock-based compensation expense resulting from the accelerated vesting of Pharmasset employee options immediately prior to the acquisition.
The following table summarizes the acquisition date fair values of assets acquired and liabilities assumed, and the consideration transferred (in thousands):
|
Identifiable intangible assets
|
$
|
10,738,000
|
|
|
Cash and cash equivalents
|
106,737
|
|
|
|
Other assets acquired (liabilities assumed), net
|
(43,182
|
)
|
|
|
Total identifiable net assets
|
10,801,555
|
|
|
|
Goodwill
|
56,817
|
|
|
|
Total consideration transferred
|
$
|
10,858,372
|
|
59
Identifiable Intangible Assets
We acquired intangible assets, primarily comprised of the sofosbuvir in-process research and development (IPR&D) compound, which had an estimated fair value of
$10.72 billion
as of the date of acquisition. The fair value was determined using a probability-weighted income approach that discounts expected future cash flows to present value. The estimated net cash flows were discounted using a discount rate of
12%
, which is based on the estimated weighted-average cost of capital for companies with profiles similar to that of Pharmasset. This rate is comparable to the estimated internal rate of return for the acquisition and represents the rate that market participants would use to value the intangible asset. The projected cash flows were based on key assumptions such as: estimates of revenues and operating profits related to each project considering its stage of development on the acquisition date; the time and resources needed to complete the development and approval of the product candidate; the life of the potential commercialized product and associated risks, including the inherent difficulties and uncertainties in developing a product candidate such as obtaining marketing approval from the FDA and other regulatory agencies; and risks related to the viability of and potential alternative treatments in any future target markets. Intangible assets related to IPR&D projects are considered to be indefinite-lived assets and are not amortized until the completion or abandonment of the associated R&D efforts.
Goodwill
The
$56.8 million
of goodwill represents the excess of the consideration transferred over the fair values of assets acquired and liabilities assumed and is attributable to the synergies expected from combining our R&D operations with Pharmasset's. None of the goodwill is expected to be deductible for income tax purposes.
Stock-Based Compensation Expense
The stock-based compensation expense recognized for the accelerated vesting of employee options immediately prior to the acquisition was reported in our Consolidated Statement of Income as follows (in thousands):
|
Year Ended
|
||||
|
December 31, 2012
|
||||
|
Research and development expense
|
$
|
100,149
|
|
|
|
Selling, general and administrative expense
|
93,788
|
|
||
|
Total stock-based compensation expense
|
$
|
193,937
|
|
|
Other Costs
Other costs incurred in connection with the acquisition include (in thousands):
|
Year Ended December 31,
|
||||||||
|
2012
|
2011
|
|||||||
|
Transaction costs (e.g. investment advisory, legal and accounting fees)
|
$
|
10,635
|
|
$
|
28,461
|
|
||
|
Bridge financing costs
|
7,333
|
|
23,817
|
|
||||
|
Restructuring costs
|
15,125
|
|
—
|
|
||||
|
Total other costs
|
$
|
33,093
|
|
$
|
52,278
|
|
||
The following table summarizes these costs by the line item in the Consolidated Statement of Income in which these costs were recognized (in thousands):
|
Year Ended December 31,
|
||||||||
|
2012
|
2011
|
|||||||
|
Research and development expense
|
$
|
7,906
|
|
$
|
—
|
|
||
|
Selling, general and administrative expense
|
17,854
|
|
28,461
|
|
||||
|
Interest expense
|
7,333
|
|
23,817
|
|
||||
|
Total other costs
|
$
|
33,093
|
|
$
|
52,278
|
|
||
60
Liquidity and Capital Resources
We believe that our existing capital resources, supplemented by our cash flows generated from operating activities, as well as cash flow from financing activities will be adequate to satisfy our capital needs for the foreseeable future. Our cash, cash equivalents and marketable securities decreased significantly in 2012 as we completed our acquisition of Pharmasset in January 2012. The following table summarizes our cash, cash equivalents and marketable securities, our working capital and our cash flow activities as of the end of, and for each of, the periods presented (in thousands):
|
|
2012
|
2011
|
2010
|
|||||||||
|
As of December 31:
|
|
|
|
|||||||||
|
Cash, cash equivalents and marketable securities
|
$
|
2,582,086
|
|
$
|
9,963,972
|
|
$
|
5,318,071
|
|
|||
|
Working capital
|
$
|
1,886,327
|
|
$
|
11,403,995
|
|
$
|
3,243,132
|
|
|||
|
Year Ended December 31:
|
|
|
|
|
|
|
||||||
|
Cash provided by (used in):
|
|
|
|
|
|
|
||||||
|
Operating activities
|
$
|
3,194,716
|
|
$
|
3,639,010
|
|
$
|
2,833,913
|
|
|||
|
Investing activities
|
$
|
(11,846,054
|
)
|
$
|
3,589,845
|
|
$
|
(1,937,751
|
)
|
|||
|
Financing activities
|
$
|
563,346
|
|
$
|
1,763,569
|
|
$
|
(1,338,710
|
)
|
|||
Cash, Cash Equivalents and Marketable Securities
Cash, cash equivalents and marketable securities totaled
$2.58 billion
at
December 31, 2012
, a decrease of
$7.38 billion
or
74%
from
December 31, 2011
primarily due to our acquisition of Pharmasset for $11.05 billion in January 2012. During 2012, we generated $3.19 billion in cash flows from operations.
Cash, cash equivalents and marketable securities totaled
$9.96 billion
at
December 31, 2011
, an increase of
$4.65 billion
or
87%
from
December 31, 2010
. This increase was primarily attributable to the issuance of our senior unsecured notes in 2011 for total net proceeds of $4.66 billion and cash provided by operations of $3.64 billion. This increase was partially offset by $2.38 billion used to repurchase our common stock under our stock repurchase programs, $650.0 million used to repay our convertible senior notes due in May 2011 and $588.6 million used in our acquisitions of Arresto Biosciences, Inc. and Calistoga Pharmaceuticals, Inc. The $3.70 billion in net proceeds related to our senior unsecured notes issued in December 2011 and $2.15 billion in additional bank debt issued in January 2012 were used to fund our $11.05 billion acquisition of Pharmasset.
Of the total cash, cash equivalents and marketable securities at
December 31, 2012
, approximately
$1.73 billion
was generated from operations in foreign jurisdictions and is intended for use in our foreign operations. We do not rely on unrepatriated earnings as a source of funds for our domestic business as we expect to have sufficient cash flow and borrowing capacity in the United States to fund our domestic operational and strategic needs.
Working Capital
Working capital was
$1.89 billion
at
December 31, 2012
. The decrease of
$9.52 billion
from working capital as of
December 31, 2011
was primarily attributable to $11.05 billion in cash used for the Pharmasset acquisition and an increase in short-term debt of $1.17 billion related to the current portion of the bank debt issued to finance the Pharmasset acquisition and the current portion of our convertible senior notes due in May 2013.
Working capital was
$11.40 billion
at
December 31, 2011
, an increase of
$8.16 billion
from working capital as of
December 31, 2010
. This increase was primarily attributable to an increase of $7.80 billion in cash, cash equivalents and short-term marketable securities resulting from the $3.67 billion net issuance of senior unsecured notes in December 2011 and sales of long-term marketable securities in anticipation of the acquisition of Pharmasset.
Cash Provided by Operating Activities
Cash provided by operating activities of
$3.19 billion
in
2012
primarily related to net income of $2.57 billion, adjusted for non-cash items such as $278.2 million of depreciation and amortization expenses, $208.7 million of stock-based compensation expenses,
$177.1 million
of net cash inflow related to changes in operating assets and liabilities and $112.6 million of tax benefits from employee stock plans.
Cash provided by operating activities of
$3.64 billion
in
2011
primarily related to net income of $2.79 billion, adjusted for non-cash items such as $302.2 million of depreciation and amortization expenses, $220.3 million of net cash inflow related to changes in operating assets and liabilities and $192.4 million of stock-based compensation expenses.
61
Cash provided by operating activities of
$2.83 billion
in
2010
primarily related to net income of $2.89 billion, adjusted for non-cash items such as $265.5 million of depreciation and amortization expenses, $200.0 million of stock-based compensation expenses, $136.0 million of IPR&D impairment expenses and $82.1 million of tax benefits from employee stock plans, partially offset by $680.4 million of net cash outflow related to changes in operating assets and liabilities.
Cash Provided by (Used in) Investing Activities
Cash used in investing activities in
2012
was
$11.85 billion
, consisting primarily of $10.75 billion used for our acquisition of Pharmasset, net of the stock-based compensation expense and cash acquired, $672.4 million of net purchases of marketable securities and $397.0 million of capital expenditures, related primarily to the purchase of an office building for $180.0 million and a $155.7 million increase in construction in progress associated with new facilities at our headquarters to support the ongoing growth of our business.
Cash provided by investing activities in
2011
was
$3.59 billion
, consisting of $4.31 billion of net proceeds related to the sales of marketable securities in connection with our acquisition of Pharmasset, partially offset by $588.6 million used in our acquisitions of Arresto and Calistoga and $131.9 million of capital expenditures.
Cash used in investing activities in
2010
was
$1.94 billion
, driven by $1.78 billion of net purchases of marketable securities, $91.0 million used in our acquisition of CGI and $61.9 million of capital expenditures.
Cash Provided by (Used in) Financing Activities
Cash provided by financing activities in
2012
was
$563.3 million
, driven primarily by net proceeds of
$2.14 billion
from the issuance of bank debt in conjunction with the Pharmasset acquisition, proceeds of
$466.3 million
from issuances of common stock under our employee stock plans and
$213.9 million
from proceeds received related to our convertible note hedges. The cash proceeds were partially offset by the
$1.84 billion
used to repay debt financing during the year and
$667.0 million
used to repurchase common stock under our stock repurchase programs, including commissions. With the upcoming maturity of the May 2013 convertible notes, we will be suspending our share repurchase activity during the first half of 2013.
Cash provided by financing activities in
2011
was
$1.76 billion
, driven primarily by the issuance of $4.66 billion in senior unsecured notes, of which $3.67 billion was raised in December 2011 to partially fund the Pharmasset acquisition, net of issuance costs, and $211.7 million in proceeds from issuances of common stock under our employee stock plans. The cash proceeds were partially offset by $2.38 billion used to repurchase our common stock under our stock repurchase programs, including commissions and $650.0 million used to repay our convertible senior notes due in May 2011.
Cash used in financing activities in
2010
was
$1.34 billion
, driven primarily by the $4.02 billion used to repurchase our common stock under our stock repurchase programs and $362.6 million used to purchase note hedges related to our convertible senior notes due in May 2014 and May 2016. The cash outflows were partially offset by $2.46 billion in net proceeds from the issuance of such notes, $221.2 million in proceeds from issuances of common stock under our employee stock plans and $155.4 million in proceeds from the sale of warrants related to such notes.
Long-Term Obligations
Bank Debt
In January 2012, in conjunction with our acquisition of Pharmasset, we entered into a five-year $1.25 billion revolving credit facility credit agreement (the Five-Year Revolving Credit Agreement), a $750.0 million short-term revolving credit facility credit agreement (the Short-Term Revolving Credit Agreement) and a $1.00 billion term loan facility (the Term Loan Credit Agreement). We borrowed an aggregate principal amount of $2.15 billion as follows: $750.0 million under the Five-Year Revolving Credit Agreement, $400.0 million under the Short-Term Revolving Credit Agreement and $1.00 billion under the Term Loan Credit Agreement, upon the close of the acquisition. In 2012, we fully repaid the $1.40 billion outstanding debt under the Term Loan Credit Agreement and the Short-Term Revolving Credit Agreement, at which time both agreements terminated.
The Five-Year Revolving Credit Agreement contains customary representations, warranties, affirmative, negative and financial maintenance covenants and events of default. The loan bears interest at either (i) the Eurodollar Rate plus the Applicable Margin or (ii) the Base Rate plus the Applicable Margin, each as defined in the credit agreement. We may reduce the commitments and may prepay the loan in whole or in part at any time without premium or penalty.
The Five-Year Revolving Credit Agreement was inclusive of a $30.0 million swing line loan sub-facility and a $25.0 million letter of credit sub-facility. As of
December 31, 2012
, we had
$7.3 million
in letters of credit outstanding under the
62
Five-Year Revolving Credit Agreement. The Five-Year Revolving Credit Agreement will terminate and all amounts owed under the agreement shall be due and payable on January 12, 2017.
Convertible Senior Notes and Senior Unsecured Notes
In 2012, a portion of our convertible notes due in May 2013 were converted and we repaid $223.3 million of the principal balance. We also paid $213.9 million in cash related to the conversion spread on these notes, which represents the conversion value in excess of the principal amount, and received $213.9 million in cash from our convertible note hedges related to these notes.
In December 2011, we issued senior unsecured notes in a registered offering for an aggregate principal amount of $3.70 billion to partially fund our acquisition of Pharmasset. We pay interest on the notes at fixed annual rates ranging from 2.40% to 5.65%.
Also, during 2011, our convertible senior notes due in May 2011 matured and we repaid the aggregate principal balance of $650.0 million. We also paid $36.1 million in cash related to the conversion spread of our matured notes, which represent the conversion value in excess of the principal amount, and received $36.1 million in cash from the related convertible note hedges. Warrants related to our convertible senior notes due in May 2011 expired in August 2011.
In March 2011, we issued senior unsecured notes due in April 2021 in a registered offering for an aggregate principal amount of $1.00 billion. The notes pay interest at a fixed annual rate of 4.50%.
As of December 31, 2012, our debt-to-EBITDA ratio was 1.9x. During 2012, we repaid $1.84 billion in debt financing and in 2013, we plan to continue to repay our debt to further decrease our debt-to-EBITDA ratio.
The following is a summary of our borrowings under various financing arrangements (in thousands):
|
|
Interest
|
December 31,
|
||||||||||||||
|
Type of Borrowing
|
Description
|
Issue Date
|
Due Date
|
Rate
|
2012
|
2011
|
||||||||||
|
Convertible Senior
|
May 2013 Notes
|
April 2006
|
May 2013
|
0.625%
|
$
|
419,433
|
|
$
|
607,036
|
|
||||||
|
Convertible Senior
|
May 2014 Notes
|
July 2010
|
May 2014
|
1.00%
|
1,210,213
|
|
1,181,525
|
|
||||||||
|
Convertible Senior
|
May 2016 Notes
|
July 2010
|
May 2016
|
1.625%
|
1,157,692
|
|
1,132,293
|
|
||||||||
|
Senior Unsecured
|
April 2021 Notes
|
March 2011
|
April 2021
|
4.50%
|
992,923
|
|
992,066
|
|
||||||||
|
Senior Unsecured
|
December 2014 Notes
|
December 2011
|
December 2014
|
2.40%
|
749,394
|
|
749,078
|
|
||||||||
|
Senior Unsecured
|
December 2016 Notes
|
December 2011
|
December 2016
|
3.05%
|
699,095
|
|
698,864
|
|
||||||||
|
Senior Unsecured
|
December 2021 Notes
|
December 2011
|
December 2021
|
4.40%
|
1,247,428
|
|
1,247,138
|
|
||||||||
|
Senior Unsecured
|
December 2041 Notes
|
December 2011
|
December 2041
|
5.65%
|
997,810
|
|
997,734
|
|
||||||||
|
Credit Facility
|
Five-Year Revolver
|
January 2012
|
January 2017
|
Variable
|
750,000
|
|
—
|
|
||||||||
|
Total debt, net
|
$
|
8,223,988
|
|
$
|
7,605,734
|
|
||||||||||
|
Less current portion
|
1,169,433
|
|
—
|
|
||||||||||||
|
Total long-term debt, net
|
$
|
7,054,555
|
|
$
|
7,605,734
|
|
||||||||||
We believe our existing capital resources, supplemented by cash generated from our operations, will be adequate to satisfy our capital needs for the foreseeable future. Our future capital requirements will depend on many factors, including but not limited to the following:
|
•
|
the commercial performance of our current and future products;
|
|
•
|
the progress and scope of our R&D efforts, including preclinical studies and clinical trials;
|
|
•
|
the cost, timing and outcome of regulatory reviews;
|
|
•
|
the expansion of our sales and marketing capabilities;
|
|
•
|
administrative expenses;
|
|
•
|
the possibility of acquiring additional manufacturing capabilities or office facilities;
|
|
•
|
the possibility of acquiring other companies or new products;
|
|
•
|
costs associated with the settlement and conversion of our convertible senior notes and related warrants;
|
|
•
|
the establishment of additional collaborative relationships with other companies; and
|
|
•
|
costs associated with the defense, settlement and adverse results of litigation and government investigations.
|
63
We may in the future require additional funding, which could be in the form of proceeds from equity or debt financings. If such funding is required, we cannot guarantee that it will be available to us on favorable terms, if at all.
Critical Accounting Policies, Estimates and Judgments
The discussion and analysis of our financial condition and results of operations is based on our Consolidated Financial Statements, which have been prepared in accordance with U.S. generally accepted accounting principles. The preparation of these financial statements requires us to make estimates and judgments that affect the reported amounts of assets, liabilities, revenues and expenses and related disclosures. On an ongoing basis, we evaluate our estimates, including those related to revenue recognition, allowance for doubtful accounts, valuation of intangible assets and contingent consideration liabilities resulting from a business combination and our tax provision. We base our estimates on historical experience and on various other market specific and other relevant assumptions that we believe to be reasonable under the circumstances, the results of which form the basis for making judgments about the carrying values of assets and liabilities that are not readily apparent from other sources. Actual results may differ significantly from these estimates.
We believe the following critical accounting policies reflect the more significant judgments and estimates used in the preparation of our Consolidated Financial Statements.
Revenue Recognition
Product Sales
We recognize revenues from product sales when there is persuasive evidence that an arrangement exists, delivery to the customer has occurred, the price is fixed or determinable and collectability is reasonably assured. We record estimated reductions to revenues for government rebates such as Medicaid reimbursements, customer incentives such as cash discounts for prompt payment, distributor fees and expected returns of expired products. These estimates are deducted from gross product sales at the time such revenues are recognized. Of these reductions from gross product sales, government rebates significantly impact our reported net product sales and are based upon certain estimates that require complex and significant judgment by management.
Government Rebates Allowances and Accrued Government Rebates
We estimate reductions to our revenues for government-managed Medicaid programs as well as to certain other qualifying federal, state and foreign government programs for the reimbursement of portions of the retail price of prescriptions filled that are covered by these programs. These reductions are settled either by us being invoiced directly or through charge-backs from our wholesalers. Government rebates that are invoiced directly to us are recorded in accrued government rebates on our Consolidated Balance Sheets. For qualified programs that can purchase our products through wholesalers at a lower contractual government price, the wholesalers charge back to us the difference between their acquisition cost and the lower contractual government price, which we record as allowances against accounts receivable. Although we may pay rebates in countries outside of the United States, to date, payments made to foreign governments have not represented a significant portion of our total government rebates. For government programs in the United States, we estimate these sales allowances based on contractual terms, historical utilization rates, new information regarding changes in these programs' regulations and guidelines that would impact the amount of the actual rebates, our expectations regarding future utilization rates for these programs and channel inventory data obtained from our major U.S. wholesalers in accordance with our inventory management agreements. During 2012, 2011 and 2010, U.S government rebates and chargebacks of $2.59 billion, $1.86 billion and $1.38 billion, respectively, representing 21%, 17% and 15% of total gross product sales, respectively, were deducted from gross product sales. We believe that the methodology that we use to estimate our sales allowances for government price reductions is reasonable and appropriate given the current facts and circumstances. However, actual results may differ. Based on the current information available to us, actual government rebates claimed for these periods have varied by less than 3% from our estimates recorded in those periods. As of December 31, 2012 and 2011, we had accrued U.S. government rebates of $716.6 million and $525.6 million, respectively, in accrued government rebates and had an allowance for government chargebacks of $111.1 million and $72.1 million, respectively, recorded against accounts receivable.
64
The following table summarizes the aggregate activity in our U.S. government rebates allowance and accrued government rebate accounts:
|
|
Balance at
Beginning
of Year
|
Charged to
Expense
|
Deducted
from
Accruals
|
Balance at
End of
Year
|
||||||||||||
|
Year ended December 31, 2012:
|
|
|
|
|
||||||||||||
|
Government rebates allowances and accrued government rebates
|
|
|
|
|
||||||||||||
|
Activity related to 2012 sales
|
$
|
—
|
|
$
|
2,580,317
|
|
$
|
1,836,199
|
|
$
|
744,118
|
|
||||
|
Activity related to sales prior to 2012
|
597,693
|
|
10,511
|
|
524,631
|
|
83,573
|
|
||||||||
|
Total
|
$
|
597,693
|
|
$
|
2,590,828
|
|
$
|
2,360,830
|
|
$
|
827,691
|
|
||||
|
Year ended December 31, 2011:
|
|
|
|
|
|
|
|
|
||||||||
|
Government rebates allowances and accrued government rebates
|
|
|
|
|
|
|
|
|
||||||||
|
Activity related to 2011 sales
|
$
|
—
|
|
$
|
1,840,657
|
|
$
|
1,279,643
|
|
$
|
561,014
|
|
||||
|
Activity related to sales prior to 2011
|
371,783
|
|
22,935
|
|
358,039
|
|
36,679
|
|
||||||||
|
Total
|
$
|
371,783
|
|
$
|
1,863,592
|
|
$
|
1,637,682
|
|
$
|
597,693
|
|
||||
Allowance for Doubtful Accounts
We maintain an allowance for doubtful accounts for estimated losses resulting from the inability of our customers to make required payments. This allowance is based on our analysis of several factors including, but not limited to, contractual payment terms, historical payment patterns of our customers and individual customer circumstances, an analysis of days sales outstanding by geographic region and a review of the local economic environment and its potential impact on government funding and reimbursement practices. If the financial condition of our customers or the economic environment in which they operate were to deteriorate, resulting in an inability to make payments, additional allowances may be required. We believe that the allowance for doubtful accounts is adequate; however, significant deterioration in any of the above factors could materially change these expectations and may result in an increase to our allowance for doubtful accounts. As of
December 31, 2012
and
2011
, our allowance for doubtful accounts was $50.9 million and $59.8 million, respectively.
Valuation of Intangible Assets and Contingent Consideration Liabilities Resulting from a Business Combination
In conjunction with our business combinations, we have recorded intangible assets primarily related to IPR&D projects, and
we have recorded contingent consideration liabilities payable upon the achievement of specified development, regulatory approval or sales-based milestone events. Both the
identifiable intangible assets and
contingent consideration
liabilities are measured at their respective fair values as of the acquisition date. The models used in valuing these intangible assets and contingent consideration liabilities require the use of significant estimates and assumptions including but not limited to:
|
•
|
estimates of revenues and operating profits related to the products or product candidates;
|
|
•
|
the probability of success for unapproved product candidates considering their stages of development;
|
|
•
|
the time and resources needed to complete the development and approval of product candidates;
|
|
•
|
the life of the potential commercialized products and associated risks, including the inherent difficulties and uncertainties in developing a product candidate such as obtaining FDA and other regulatory approvals; and
|
|
•
|
risks related to the viability of and potential alternative treatments in any future target markets.
|
Intangible assets with indefinite useful lives are reviewed annually for impairment, or when facts or circumstances suggest that the carrying value of these assets may not be recoverable. W
e revalue contingent consideration obligations each quarter following the acquisition and record increases or decreases in their fair value in R&D expense within our Consolidated Statement of Income.
Increases or decreases in the fair value of our indefinite-lived intangible assets and contingent consideration liabilities can result from updates to assumptions such as the expected timing or probability of achieving the specified milestones, changes in projected revenues or changes in discount rates. Significant judgment is employed in determining these assumptions as of the acquisition date and for each subsequent period. Updates to assumptions could have a significant impact on our results of operations in any given period. Actual results may differ from estimates.
As of
December 31, 2012
and
2011
, we had total intangible assets of
$11.74 billion
and
$1.06 billion
, respectively, and contingent consideration liabilities of
$205.1 million
and
$135.6 million
, respectively.
65
Tax Provision
We estimate our income tax provision, including deferred tax assets and liabilities, based on significant management judgment. We evaluate the realization of all or a portion of our deferred tax assets on a quarterly basis. We record a valuation allowance to reduce our deferred tax assets to the amounts that are more likely than not to be realized. We consider future taxable income, ongoing tax planning strategies and our historical financial performance in assessing the need for a valuation allowance.
If we expect to realize deferred tax assets for which we have previously recorded a valuation allowance, we will reduce the valuation allowance in the period in which such determination is first made.
Various factors may have favorable or unfavorable effects on our income tax rate. These factors include, but are not limited to, interpretations of existing tax laws, changes in tax laws and rates, our portion of the non-deductible pharmaceutical excise tax, the accounting for stock options and other share-based payments, mergers and acquisitions, future levels of R&D spending, changes in accounting standards, changes in the mix of earnings in the various tax jurisdictions in which we operate, changes in overall levels of pre-tax earnings and resolution of federal, state and foreign income tax audits. The impact on our income tax provision resulting from the above mentioned factors may be significant and could have a negative impact on our net income.
We record liabilities related to uncertain tax positions in accordance with the guidance that clarifies the accounting for uncertainty in income taxes recognized in an enterprise's financial statements by prescribing a minimum recognition threshold and measurement attribute for the financial statement recognition and measurement of a tax position taken or expected to be taken in a tax return. We do not believe any such uncertain tax positions currently pending will have a material adverse effect on our Consolidated Financial Statements, although an adverse resolution of one or more of these uncertain tax positions in any period could have a material impact on the results of operations for that period.
At
December 31, 2012
and
2011
, we had total federal, state and foreign unrecognized tax benefits of
$157.0 million
and
$146.9 million
, respectively. Of the total unrecognized tax benefits,
$126.5 million
and
$120.6 million
at
December 31, 2012
and
2011
, respectively, if recognized, would reduce our effective tax rate in the period of recognition. As of
December 31, 2012
, we believe that it is reasonably possible that our unrecognized tax benefits will not significantly change in the next 12 months as we do not expect to have clarification from the IRS and other tax authorities regarding any of our uncertain tax positions.
We file federal, state and foreign income tax returns in many jurisdictions in the United States and abroad. For federal income tax purposes, the statute of limitations is open for 2008 and onwards. For certain acquired entities, the statute of limitations is open for all years from inception due to our utilization of their net operating losses and credits carried over from prior years. For California income tax purposes, the statute of limitations is open for 2008 and onwards.
Our income tax returns are audited by federal, state and foreign tax authorities. We are currently under examination by the IRS for the 2008 and 2009 tax years and by various state and foreign jurisdictions. There are differing interpretations of tax laws and regulations, and as a result, significant disputes may arise with these tax authorities involving issues of the timing and amount of deductions and allocations of income among various tax jurisdictions. We periodically evaluate our exposures associated with our tax filing positions.
Off Balance Sheet Arrangements
We do not have any off balance sheet arrangements as defined in Item 303(a)(4)(ii) of Regulation S-K.
66
Contractual Obligations
Our contractual obligations consist of debt obligations, operating leases, capital commitments, purchase obligations for active pharmaceutical ingredients and inventory-related items and clinical trials contracts. The following table summarizes our significant enforceable and legally binding obligations, future commitments and obligations related to all contracts that we are likely to continue regardless of the fact that certain of these obligations may be cancelable as of
December 31, 2012
(in thousands):
|
|
Payments due by Period
|
|||||||||||||||||||
|
Contractual Obligations
|
Total
|
Less than one
year
|
1-3 years
|
3-5 years
|
More than 5
years
|
|||||||||||||||
|
Long-term debt
(1)
|
$
|
10,355,158
|
|
$
|
656,576
|
|
$
|
2,420,576
|
|
$
|
2,294,506
|
|
$
|
4,983,500
|
|
|||||
|
Operating lease obligations
|
213,645
|
|
47,009
|
|
80,513
|
|
45,859
|
|
40,264
|
|
||||||||||
|
Capital commitments
(2)
|
56,221
|
|
53,184
|
|
3,037
|
|
—
|
|
—
|
|
||||||||||
|
Purchase obligations
(3)(4)
|
1,512,093
|
|
1,148,980
|
|
252,012
|
|
111,101
|
|
—
|
|
||||||||||
|
Clinical trials
(5)
|
511,243
|
|
333,562
|
|
136,921
|
|
24,902
|
|
15,858
|
|
||||||||||
|
Total
|
$
|
12,648,360
|
|
$
|
2,239,311
|
|
$
|
2,893,059
|
|
$
|
2,476,368
|
|
$
|
5,039,622
|
|
|||||
|
(1)
|
Long-term debt obligations include future interest payments based on fixed rates of 0.625%, 1.00% and 1.625% for our convertible senior notes due in May 2013, May 2014 and May 2016, respectively. Long-term debt obligations also include future interest payments based on fixed rates of 2.40%, 3.05%, 4.50%, 4.40% and 5.65% for our senior unsecured notes due in December 2014, December 2016, April 2021, December 2021 and December 2041, respectively. At
December 31, 2012
, the aggregate carrying values of our convertible notes and senior unsecured notes were
$2.79 billion
and $4.69 billion, respectively.
|
|
(2)
|
At
December 31, 2012
, we had firm capital project commitments of approximately $56.2 million primarily relating to facilities improvement projects.
|
|
(3)
|
At
December 31, 2012
, we had firm purchase commitments related to active pharmaceutical ingredients and certain inventory-related items. These amounts include minimum purchase requirements and actual purchases are expected to significantly exceed these amounts.
|
|
(4)
|
In addition to the above, we have committed to make potential future milestone payments to third parties as part of licensing, collaboration and development arrangements. Payments under these agreements generally become due and payable only upon achievement of certain developmental, regulatory and/or commercial milestones. Because the achievement of these milestones is neither probable nor reasonably estimable, such contingencies have not been recorded on our Consolidated Balance Sheets and have not been included in the table above.
|
|
(5)
|
At
December 31, 2012
, we had several clinical studies in various clinical trial phases. Our most significant clinical trial expenditures are to CROs. Although all of our material contracts with CROs are cancelable, we historically have not cancelled such contracts. These amounts reflect commitments based on existing contracts and do not reflect any future modifications to, or terminations of, existing contracts or anticipated or potential new contracts.
|
We had total gross unrecognized tax benefit liabilities of $178.1 million as of
December 31, 2012
. We believe that it is reasonably possible that our unrecognized tax benefits will not significantly change in the next 12 months as we do not expect to have clarification from the IRS and other tax authorities regarding any of our uncertain tax positions. The unrecognized tax benefits were included in long-term income taxes payable and non-current deferred tax assets on our Consolidated Balance Sheet and have not been included in the table above.
Recent Accounting Pronouncement
In July 2012, the Financial Accounting Standards Board issued new accounting guidance intended to simplify the testing of indefinite-lived intangible assets for impairment. Entities will be allowed the option to first perform a qualitative assessment on impairment for indefinite-lived intangible assets to determine whether a quantitative assessment is necessary. This guidance is effective for impairment tests performed in interim and annual periods for fiscal years beginning after September 15, 2012. Early adoption is permitted. We elected to early adopt this guidance as of December 31, 2012 which did not have a material impact on our Consolidated Financial Statements.
67
|
ITEM 7A.
|
QUANTITATIVE AND QUALITATIVE DISCLOSURES ABOUT MARKET RISK
|
We are exposed to market risks that may result from changes in foreign currency exchange rates, interest rates and credit risks. To reduce certain of these risks, we enter into various types of foreign currency or interest rate derivative hedging transactions, follow investment guidelines and monitor outstanding receivables as part of our risk management program.
Foreign Currency Exchange Risk
Our operations include manufacturing and sales activities in the United States, Canada and Ireland as well as sales activities in countries outside the United States, including Europe and Asia. As a result, our financial results could be significantly affected by factors such as changes in foreign currency exchange rates or weak economic conditions in the foreign markets in which we distribute our products. Our operating results are exposed to changes in foreign currency exchange rates between the U.S. dollar and various foreign currencies, the most significant of which is the Euro. When the U.S. dollar strengthens against these currencies, the relative value of sales made in the respective foreign currency decreases. Conversely, when the U.S. dollar weakens against these currencies, the relative amounts of such sales increase. Overall, we are a net receiver of foreign currencies and, therefore, benefit from a weaker U.S. dollar and are adversely affected by a stronger U.S. dollar relative to those foreign currencies in which we transact significant amounts of business.
More than 40% of our product sales were denominated in foreign currencies during 2012. To partially mitigate the impact of changes in currency exchange rates on net cash flows from our foreign currency denominated sales, we may enter into foreign currency exchange forward and option contracts. We also hedge certain monetary assets and liabilities denominated in foreign currencies, which reduces but does not eliminate our exposure to currency fluctuations between the date a transaction is recorded and the date that cash is collected or paid. In general, the market risks of these contracts are offset by corresponding gains and losses on the transactions being hedged.
As of
December 31, 2012
and
2011
, we had open foreign currency forward contracts with notional amounts of
$3.39 billion
and
$4.03 billion
, respectively. A hypothetical 10% adverse movement in foreign currency exchange rates compared with the U.S. dollar relative to exchange rates at
December 31, 2012
, would have resulted in a reduction in fair value of these contracts of approximately $350.0 million on this date and, if realized, would negatively affect earnings over the remaining life of the contracts. A hypothetical 10% adverse movement in foreign currency exchange rates compared with the U.S. dollar relative to exchange rates at
December 31, 2011
, would have resulted in a reduction in fair value of these contracts of approximately $325.0 million on this date and, if realized, would negatively affect earnings over the remaining life of the contracts. The analysis does not consider the impact that hypothetical changes in foreign currency exchange rates would have on anticipated transactions that these foreign currency sensitive instruments were designed to offset.
Interest Rate Risk
Our portfolio of available-for-sale marketable securities and our fixed and variable rate liabilities create an exposure to interest rate risk. With respect to our investment portfolio, we adhere to an investment policy that requires us to limit amounts invested in securities based on credit rating, maturity, industry group and investment type and issuer, except for securities issued by the U.S. government. The goals of our investment policy, in order of priority, are as follows:
|
•
|
safety and preservation of principal and diversification of risk;
|
|
•
|
liquidity of investments sufficient to meet cash flow requirements; and
|
|
•
|
competitive after-tax rate of return.
|
68
The following table summarizes the expected maturities and average interest rates of our interest-generating assets and fixed interest-bearing liabilities at
December 31, 2012
(dollars in thousands):
|
|
Expected Maturity
|
|
Total Fair Value at December 31, 2012
|
|||||||||||||||||||||||||||||
|
|
2013
|
2014
|
2015
|
2016
|
2017
|
Thereafter
|
Total
|
|||||||||||||||||||||||||
|
Assets
|
|
|
|
|
|
|
|
|
||||||||||||||||||||||||
|
Available-for-sale debt securities
|
$
|
58,556
|
|
$
|
258,220
|
|
$
|
413,150
|
|
$
|
9,250
|
|
$
|
5,330
|
|
$
|
33,886
|
|
$
|
778,392
|
|
$
|
778,392
|
|
||||||||
|
Average interest rate
|
0.3
|
%
|
0.4
|
%
|
0.6
|
%
|
0.6
|
%
|
0.6
|
%
|
2
|
%
|
|
|
|
|
||||||||||||||||
|
Liabilities
|
|
|
|
|
|
|
|
|
|
|
|
|
|
|
|
|
||||||||||||||||
|
Long-term debt
(1)
|
$
|
426,580
|
|
$
|
2,000,000
|
|
$
|
—
|
|
$
|
1,950,000
|
|
$
|
—
|
|
$
|
3,250,000
|
|
$
|
7,626,580
|
|
$
|
10,307,954
|
|
||||||||
|
Average interest rate
|
0.6
|
%
|
1.5
|
%
|
—
|
%
|
2.1
|
%
|
—
|
%
|
4.8
|
%
|
|
|
|
|
||||||||||||||||
|
(1)
|
In December 2011, we issued senior unsecured notes due in December 2014, 2016, 2021 and 2041 in a registered offering. The notes pay interest at fixed annual rates ranging from 2.40% to 5.65%. In March 2011, we issued senior unsecured notes due in April 2021 in a registered offering. The notes pay interest at a fixed annual rate of 4.50%.
|
In July 2010, we issued convertible senior notes due in May 2014 and May 2016 in a private placement pursuant to Rule 144A of the Securities Act of 1933, as amended. The notes due in May 2014 and May 2016 were issued at par and bear interest rates of 1.00% and 1.625%, respectively, and may be converted into shares of our common stock subject to certain circumstances.
In April 2006, we issued convertible senior notes due in May 2013 in a private placement pursuant to Rule 144A of the Securities Act of 1933, as amended. The notes were issued at par and bear interest rates of 0.625%, and may be converted into shares of our common stock subject to certain circumstances.
During the first quarter of 2012, in connection with our acquisition of Pharmasset, we entered into credit agreements that are subject to variable interest rates. During 2012, the portion of interest expense related to variable interest totaled $20.5 million.
Credit Risk
We are subject to credit risk from our portfolio of cash equivalents and marketable securities. Under our investment policy, we limit amounts invested in such securities by credit rating, maturity, industry group, investment type and issuer, except for securities issued by the U.S. government. We are not exposed to any significant concentrations of credit risk from these financial instruments. The goals of our investment policy, in order of priority, are as follows: safety and preservation of principal and diversification of risk; liquidity of investments sufficient to meet cash flow requirements; and a competitive after-tax rate of return.
We are also subject to credit risk from our accounts receivable related to our product sales. The majority of our trade accounts receivable arises from product sales in the United States and Europe.
During the second quarter of 2012, we received payment on
$460.6 million
in past due accounts receivable from customers based in Spain. Included in this amount were proceeds from a one-time factoring arrangement where we sold receivables with a carrying value of
$319.8 million
, net of the allowance for doubtful accounts. We received proceeds of
$349.7 million
and recorded a gain of
$29.9 million
, resulting primarily from the reversal of the related allowance for doubtful accounts. This gain was recorded as an offset to SG&A expenses in our Consolidated Statement of Income. Subsequent to this transaction, we have had no continuing involvement with the transferred receivables, which were derecognized at the time of the sale.
As of
December 31, 2012
, our accounts receivable in Southern Europe, specifically Greece, Italy, Portugal and Spain, totaled approximately
$822.4 million
, of which
$331.6 million
were past due greater than 120 days and
$106.3 million
were past due greater than 365 days . As of December 31, 2011, our accounts receivable in Southern Europe, specifically Greece, Italy, Portugal and Spain totaled approximately $1.10 billion, of which $612.4 million were past due greater than 120 days and $250.7 million were past due greater than 365 days. To date, we have not experienced significant losses with respect to the collection of our accounts receivable. We believe that our allowance for doubtful accounts was adequate at
December 31, 2012
.
69
|
ITEM 8.
|
FINANCIAL STATEMENTS AND SUPPLEMENTARY DATA
|
The financial statements required by this item are set forth beginni
ng at page 84 of this Annu
al Report on Form 10-K and are incorporated herein by reference.
|
ITEM 9.
|
CHANGES IN AND DISAGREEMENTS WITH ACCOUNTANTS ON ACCOUNTING AND FINANCIAL DISCLOSURE
|
Not applicable.
|
ITEM 9A.
|
CONTROLS AND PROCEDURES
|
(a) Evaluation of Disclosure Controls and Procedures
An evaluation as of
December 31, 2012
was carried out under the supervision and with the participation of our management, including our Chief Executive Officer and Chief Financial Officer, of the effectiveness of our “disclosure controls and procedures,” which are defined in Rule 13a-15(e) under the Securities Exchange Act of 1934, as amended (the Exchange Act), as controls and other procedures of a company that are designed to ensure that the information required to be disclosed by a company in the reports that it files or submits under the Exchange Act is recorded, processed, summarized and reported, within the time periods specified in the Securities and Exchange Commission's rules and forms, and that such information is accumulated and communicated to the company's management, including its Chief Executive Officer and Chief Financial Officer, as appropriate, to allow timely decisions regarding required disclosure. Based upon that evaluation, our Chief Executive Officer and Chief Financial Officer concluded that our disclosure controls and procedures were effective at
December 31, 2012
.
(b) Management's Report on Internal Control over Financial Reporting
Our management is responsible for establishing and maintaining adequate internal control over financial reporting, as such term is defined in Rule 13a-15(f) of the Exchange Act. Our internal control system is designed to provide reasonable assurance regarding the preparation and fair presentation of financial statements for external purposes in accordance with generally accepted accounting principles. All internal control systems, no matter how well designed, have inherent limitations and can provide only reasonable assurance that the objectives of the internal control system are met.
Under the supervision and with the participation of our management, including our Chief Executive Officer and Chief Financial Officer, we conducted an evaluation of the effectiveness of our internal control over financial reporting, based on criteria established in Internal Control-Integrated Framework issued by the Committee of Sponsoring Organizations of the Treadway Commission (COSO). Based on our evaluation, we concluded that our internal control over financial reporting was effective as of
December 31, 2012
.
Our independent registered public accounting firm, Ernst & Young LLP, has audited our Consolidated Financial Statements included in this Annual Report on Form 10-K and have issued a report on our internal control over financial reporting as of
December 31, 2012
. Their report on the audit of internal control over financial reporting appears below.
(c) Changes in Internal Control over Financial Reporting
Our management, including our Chief Executive Officer and Chief Financial Officer, has evaluated any changes in our internal control over financial reporting that occurred during the quarter ended
December 31, 2012
, and has concluded that there was no change during such quarter that has materially affected, or is reasonably likely to materially affect, our internal control over financial reporting.
70
REPORT OF INDEPENDENT REGISTERED PUBLIC ACCOUNTING FIRM
The Board of Directors and Stockholders of Gilead Sciences, Inc.
We have audited Gilead Sciences, Inc.'s internal control over financial reporting as of
December 31, 2012
, based on criteria established in Internal Control—Integrated Framework issued by the Committee of Sponsoring Organizations of the Treadway Commission (the COSO criteria). Gilead Sciences, Inc.'s management is responsible for maintaining effective internal control over financial reporting, and for its assessment of the effectiveness of internal control over financial reporting included in the accompanying Management's Report on Internal Control Over Financial Reporting. Our responsibility is to express an opinion on the company's internal control over financial reporting based on our audit.
We conducted our audit in accordance with the standards of the Public Company Accounting Oversight Board (United States). Those standards require that we plan and perform the audit to obtain reasonable assurance about whether effective internal control over financial reporting was maintained in all material respects. Our audit included obtaining an understanding of internal control over financial reporting, assessing the risk that a material weakness exists, testing and evaluating the design and operating effectiveness of internal control based on the assessed risk, and performing such other procedures as we considered necessary in the circumstances. We believe that our audit provides a reasonable basis for our opinion.
A company's internal control over financial reporting is a process designed to provide reasonable assurance regarding the reliability of financial reporting and the preparation of financial statements for external purposes in accordance with generally accepted accounting principles. A company's internal control over financial reporting includes those policies and procedures that (1) pertain to the maintenance of records that, in reasonable detail, accurately and fairly reflect the transactions and dispositions of the assets of the company; (2) provide reasonable assurance that transactions are recorded as necessary to permit preparation of financial statements in accordance with generally accepted accounting principles, and that receipts and expenditures of the company are being made only in accordance with authorizations of management and directors of the company; and (3) provide reasonable assurance regarding prevention or timely detection of unauthorized acquisition, use, or disposition of the company's assets that could have a material effect on the financial statements.
Because of its inherent limitations, internal control over financial reporting may not prevent or detect misstatements. Also, projections of any evaluation of effectiveness to future periods are subject to the risk that controls may become inadequate because of changes in conditions, or that the degree of compliance with the policies or procedures may deteriorate.
In our opinion, Gilead Sciences, Inc. maintained, in all material respects, effective internal control over financial reporting as of
December 31, 2012
, based on the COSO criteria.
We also have audited, in accordance with the standards of the Public Company Accounting Oversight Board (United States), the
2012
consolidated financial statements of Gilead Sciences, Inc. and our report dated
February 27, 2013
expressed an unqualified opinion thereon.
/s/ E
RNST
& Y
OUNG
LLP
Redwood City, California
February 27, 2013
71
|
ITEM 9B.
|
OTHER INFORMATION
|
Not applicable.
|
ITEM 10.
|
DIRECTORS, EXECUTIVE OFFICERS AND CORPORATE GOVERNANCE
|
The information required by this Item concerning our directors and executive officers is incorporated by reference to the sections of our Definitive Proxy Statement to be filed with the Securities and Exchange Commission pursuant to Regulation 14A in connection with our
2013
Annual Meeting of Stockholders (the Proxy Statement) under the headings “Nominees,” “Directors Not Standing for Re-Election,” “Board Committees and Meetings,” “Executive Officers,” and “Section 16(a) Beneficial Ownership Reporting Compliance.”
Our written Code of Ethics applies to all of our directors and employees, including our executive officers, including without limitation our principal executive officer, principal financial officer, principal accounting officer or controller or persons performing similar functions. The Code of Ethics is available on our website at http://www.gilead.com in the Investors section under “Corporate Governance.” Changes to or waivers of the Code of Ethics will be disclosed on the same website. We intend to satisfy the disclosure requirement under Item 5.05 of Form 8-K regarding any amendment to, or waiver of, any provision of the Code of Ethics by disclosing such information on the same website.
|
ITEM 11.
|
EXECUTIVE COMPENSATION
|
The information required by this Item is incorporated by reference to the sections of the Proxy Statement under the headings “Executive Compensation,” “Compensation Committee Interlocks and Insider Participation,” “Compensation Committee Report,” and “Compensation of Non-Employee Board Members.”
|
ITEM 12.
|
SECURITY OWNERSHIP OF CERTAIN BENEFICIAL OWNERS AND MANAGEMENT AND RELATED STOCKHOLDER MATTERS
|
The information required by this Item is incorporated by reference to the sections of the Proxy Statement under the headings “Security Ownership of Certain Beneficial Owners and Management” and “Securities Authorized for Issuance under Equity Compensation Plans.”
|
ITEM 13.
|
CERTAIN RELATIONSHIPS AND RELATED TRANSACTIONS, AND DIRECTOR INDEPENDENCE
|
The information required by this Item is incorporated by reference to the sections of the Proxy Statement under the headings “Nominees,” “Directors Not Standing for Re-Election” and “Certain Relationships and Related Party Transactions.”
|
ITEM 14.
|
PRINCIPAL ACCOUNTANT FEES AND SERVICES
|
The information required by this Item is incorporated by reference to the section of the Proxy Statement under the heading “Principal Accountant Fees and Services.”
72
ITEM 15.
EXHIBITS AND FINANCIAL STATEMENT SCHEDULES
(a) The following documents are filed as part of this Annual Report on Form 10-K:
(1) Index list to Consolidated Financial Statements:
|
Audited Consolidated Financial Statements
|
|
(2) Schedule II is included o
n page 130 of this report
. All other schedules are omitted because they are not required or the required information is included in the financial statements or notes thereto.
(3) Exhibits.
The following exhibits are filed herewith or incorporated by reference:
|
ITEM 15.
|
EXHIBITS
|
|
Exhibit
Footnote
|
Exhibit
Number
|
Description of Document
|
||
|
√
(1)
|
2.1
|
Agreement and Plan of Merger among Registrant, Apex Merger Sub, Inc. and CV Therapeutics, Inc., dated as of March 12, 2009
|
||
|
†(2)
|
2.5
|
Agreement and Plan of Merger among Registrant, Merger Sub and Pharmasset, Inc., dated as of November 21, 2011
|
||
|
(3)
|
3.1
|
Restated Certificate of Incorporation of Registrant, as amended through May 12, 2011
|
||
|
(3)
|
3.2
|
Amended and Restated Bylaws of Registrant, as amended and restated on May 12, 2011
|
||
|
|
4.1
|
Reference is made to Exhibit 3.1 and Exhibit 3.2
|
||
|
(4)
|
4.2
|
Indenture related to the Convertible Senior Notes due 2013 (2013 Notes), between Registrant and Wells Fargo Bank, National Association, as trustee (including form of 0.625% Convertible Senior Note due 2013), dated April 25, 2006
|
||
|
(5)
|
4.3
|
Indenture related to the Convertible Senior Notes due 2014 (2014 Notes), between Registrant and Wells Fargo Bank, National Association, as trustee (including form of 1.00% Convertible Senior Note due 2014), dated July 30, 2010
|
||
|
(5)
|
4.4
|
Indenture related to the Convertible Senior Notes due 2016 (2016 Notes), between Registrant and Wells Fargo Bank, National Association, as trustee (including form of 1.625% Convertible Senior Note due 2016), dated July 30, 2010
|
||
|
(6)
|
4.5
|
Indenture related to Senior Notes, dated as of March 30, 2011, between Registrant and Wells Fargo, National Association, as Trustee
|
||
|
(6)
|
4.6
|
First Supplemental Indenture related to Senior Notes, dated as of March 30, 2011, between Registrant and Wells Fargo, National Association, as Trustee (including form of Senior Notes)
|
||
|
(7)
|
4.7
|
Second Supplemental Indenture related to Senior Notes, dated as of December 13, 2011, between Registrant and Wells Fargo, National Association, as Trustee (including Form of 2014 Note, Form of 2016 Note, Form of 2021 Note, Form of 2041 Note)
|
||
|
(8)
|
10.1
|
Confirmation of OTC Convertible Note Hedge related to 2013 Notes, dated April 19, 2006, as amended and restated as of April 24, 2006, between Registrant and Bank of America, N.A.
|
||
73
|
(8)
|
10.2
|
Confirmation of OTC Warrant Transaction, dated April 19, 2006, as amended and restated as of April 24, 2006, between Registrant and Bank of America, N.A. for warrants expiring in 2013
|
||
|
(9)
|
10.3
|
Confirmation of OTC Convertible Note Hedge related to 2014 Notes, dated July 26, 2010, between Registrant and Goldman, Sachs & Co.
|
||
|
(9)
|
10.4
|
Confirmation of OTC Convertible Note Hedge related to 2014 Notes, dated July 26, 2010, between Registrant and JPMorgan Chase Bank, National Association
|
||
|
(9)
|
10.5
|
Confirmation of OTC Convertible Note Hedge related to 2016 Notes, dated July 26, 2010, between Registrant and Goldman, Sachs & Co.
|
||
|
(9)
|
10.6
|
Confirmation of OTC Convertible Note Hedge related to 2016 Notes, dated July 26, 2010, between Registrant and JPMorgan Chase Bank, National Association
|
||
|
(9)
|
10.7
|
Confirmation of OTC Warrant Transaction, dated July 26, 2010, between Registrant and Goldman, Sachs & Co. for warrants expiring in 2014
|
||
|
(9)
|
10.8
|
Confirmation of OTC Warrant Transaction, dated July 26, 2010, between Registrant and JPMorgan Chase Bank, National Association for warrants expiring in 2014
|
||
|
(9)
|
10.9
|
Confirmation of OTC Warrant Transaction, dated July 26, 2010, between Registrant and Goldman, Sachs & Co. for warrants expiring in 2016
|
||
|
(9)
|
10.10
|
Confirmation of OTC Warrant Transaction, dated July 26, 2010, between Registrant and JPMorgan Chase Bank, National Association for warrants expiring in 2016
|
||
|
(10)
|
10.11
|
Confirmation of OTC Additional Convertible Note Hedge related to 2014 Notes, dated August 5, 2010, between Registrant and Goldman, Sachs & Co.
|
||
|
(10)
|
10.12
|
Confirmation of OTC Additional Convertible Note Hedge related to 2014 Notes, dated August 5, 2010, between Registrant and JPMorgan Chase Bank, National Association
|
||
|
(10)
|
10.13
|
Confirmation of OTC Additional Convertible Note Hedge related to 2016 Notes, dated August 5, 2010, between Registrant and Goldman, Sachs & Co.
|
||
|
(10)
|
10.14
|
Confirmation of OTC Additional Convertible Note Hedge related to 2016 Notes, dated August 5, 2010, between Registrant and JPMorgan Chase Bank, National Association
|
||
|
(10)
|
10.15
|
Confirmation of OTC Additional Warrant Transaction, dated August 5, 2010, between Registrant and Goldman, Sachs & Co. for warrants expiring in 2014
|
||
|
(10)
|
10.16
|
Confirmation of OTC Additional Warrant Transaction, dated August 5, 2010, between Registrant and JPMorgan Chase Bank, National Association for warrants expiring in 2014
|
||
|
(10)
|
10.17
|
Confirmation of OTC Additional Warrant Transaction, dated August 5, 2010, between Registrant and Goldman, Sachs & Co. for warrants expiring in 2016
|
||
|
(10)
|
10.18
|
Confirmation of OTC Additional Warrant Transaction, dated August 5, 2010, between Registrant and JPMorgan Chase Bank, National Association for warrants expiring in 2016
|
||
|
(10)
|
10.19
|
Amendment to Confirmation of OTC Convertible Note Hedge related to 2014 Notes, dated August 30, 2010, between Registrant and Goldman, Sachs & Co.
|
||
|
(10)
|
10.20
|
Amendment to Confirmation of OTC Convertible Note Hedge related to 2014 Notes, dated August 30, 2010, between Registrant and JPMorgan Chase Bank, National Association
|
||
|
(10)
|
10.21
|
Amendment to Confirmation of OTC Convertible Note Hedge related to 2016 Notes, dated August 30, 2010, between Registrant and Goldman, Sachs & Co.
|
||
|
(10)
|
10.22
|
Amendment to Confirmation of OTC Convertible Note Hedge related to 2016 Notes, dated August 30, 2010, between Registrant and JPMorgan Chase Bank, National Association
|
||
|
(10)
|
10.23
|
Amendment to Confirmation of OTC Additional Convertible Note Hedge related to 2014 Notes, dated August 30, 2010, between Registrant and Goldman, Sachs & Co.
|
||
74
|
(10)
|
10.24
|
Amendment to Confirmation of OTC Additional Convertible Note Hedge related to 2014 Notes, dated August 30, 2010, between Registrant and JPMorgan Chase Bank, National Association
|
||
|
(10)
|
10.25
|
Amendment to Confirmation of OTC Additional Convertible Note Hedge related to 2016 Notes, dated August 30, 2010, between Registrant and Goldman, Sachs & Co.
|
||
|
(10)
|
10.26
|
Amendment to Confirmation of OTC Additional Convertible Note Hedge related to 2016 Notes, dated August 30, 2010, between Registrant and JPMorgan Chase Bank, National Association
|
||
|
(11)
|
10.27
|
5-Year Revolving Credit Facility Credit Agreement among Registrant and Gilead Biopharmaceutics Ireland Corporation, as Borrowers, Bank of America, N.A., as Administrative Agent, Swing Line Lender and L/C Issuer, certain other lenders parties thereto, Barclays Capital, as Syndication Agent, and Goldman Sachs Bank USA, JPMorgan Chase Bank, N.A., Royal Bank of Canada and Wells Fargo Bank, N.A., as Co-Documentation Agents, dated as of January 12, 2012
|
||
|
(11)
|
10.28
|
Parent Guaranty Agreement (5-Year Revolving Credit Facility), dated as of January 12, 2012, by Registrant
|
||
|
*(12)
|
10.29
|
Gilead Sciences, Inc. 1991 Stock Option Plan, as amended through January 29, 2003
|
||
|
*(13)
|
10.30
|
Form of option agreements used under the 1991 Stock Option Plan
|
||
|
*(12)
|
10.31
|
Gilead Sciences, Inc. 1995 Non-Employee Directors' Stock Option Plan, as amended through January 30, 2002
|
||
|
*(14)
|
10.32
|
Form of option agreement used under the Gilead Sciences, Inc. 1995 Non-Employee Directors' Stock Option Plan
|
||
|
*(15)
|
10.33
|
Gilead Sciences, Inc. 2004 Equity Incentive Plan, as amended through May 6, 2009
|
||
|
*(16)
|
10.34
|
Form of employee stock option agreement used under 2004 Equity Incentive Plan (for grants prior to February 2008)
|
||
|
*(17)
|
10.35
|
Form of employee stock option agreement used under 2004 Equity Incentive Plan (for grants made February 2008 through April 2009)
|
||
|
*(18)
|
10.36
|
Form of employee stock option agreement used under 2004 Equity Incentive Plan (for grants commencing in May 2009)
|
||
|
*(19)
|
10.37
|
Form of employee stock option agreement used under 2004 Equity Incentive Plan (for grants commencing in February 2010)
|
||
|
*(20)
|
10.38
|
Form of employee stock option agreement used under 2004 Equity Incentive Plan (for 2011 and subsequent year grants)
|
||
|
*(17)
|
10.39
|
Form of non-employee director stock option agreement used under 2004 Equity Incentive Plan (for grants prior to 2008)
|
||
|
*(17)
|
10.40
|
Form of non-employee director option agreement used under 2004 Equity Incentive Plan (for initial grants made in 2008)
|
||
|
*(17)
|
10.41
|
Form of non-employee director option agreement used under 2004 Equity Incentive Plan (for annual grants made in May 2008)
|
||
|
*(18)
|
10.42
|
Form of non-employee director option agreement used under 2004 Equity Incentive Plan (for annual grants commencing in May 2009)
|
||
|
*(21)
|
10.43
|
Form of restricted stock unit issuance agreement used under 2004 Equity Incentive Plan (for annual grants to non-employee directors commencing in May 2012)
|
||
|
*(18)
|
10.44
|
Form of restricted stock award agreement used under 2004 Equity Incentive Plan (for annual grants to certain non-employee directors prior to May 2012)
|
||
|
*(18)
|
10.45
|
Form of performance share award agreement used under the 2004 Equity Incentive Plan (for grants to certain executive officers made in 2009)
|
||
75
|
*(19)
|
10.46
|
Form of performance share award agreement used under the 2004 Equity Incentive Plan (for grants to certain executive officers made in 2010)
|
||
|
*(20)
|
10.47
|
Form of performance share award agreement used under the 2004 Equity Incentive Plan (for grants to certain executive officers made in 2011)
|
||
|
*(22)
|
10.48
|
Form of performance share award agreement used under the 2004 Equity Incentive Plan (for grants to certain executive officers made in 2012)
|
||
|
*(23)
|
10.49
|
Form of restricted stock unit issuance agreement used under the 2004 Equity Incentive Plan (for grants to certain executive officers made prior to May 2009)
|
||
|
*(18)
|
10.50
|
Form of restricted stock unit issuance agreement used under the 2004 Equity Incentive Plan (for grants to certain executive officers commencing in May 2009)
|
||
|
*(24)
|
10.51
|
Form of restricted stock unit issuance agreement used under the 2004 Equity Incentive Plan (service-based vesting for certain executive officers commencing in November 2009)
|
||
|
*(20)
|
10.52
|
Form of restricted stock unit issuance agreement used under the 2004 Equity Incentive Plan (service-based vesting for certain executive officers commencing in 2011)
|
||
|
*(19)
|
10.53
|
Gilead Sciences, Inc. Employee Stock Purchase Plan, amended and restated on November 3, 2009
|
||
|
*(25)
|
10.54
|
Gilead Sciences, Inc. International Employee Stock Purchase Plan, adopted November 3, 2009
|
||
|
*(26)
|
10.55
|
Gilead Sciences, Inc. Deferred Compensation Plan-Basic Plan Document
|
||
|
*(26)
|
10.56
|
Gilead Sciences, Inc. Deferred Compensation Plan-Adoption Agreement
|
||
|
*(26)
|
10.57
|
Addendum to the Gilead Sciences, Inc. Deferred Compensation Plan
|
||
|
*(27)
|
10.58
|
Gilead Sciences, Inc. 2005 Deferred Compensation Plan, as amended and restated on October 23, 2008
|
||
|
*(22)
|
10.59
|
Gilead Sciences, Inc. Severance Plan, as amended on January 26, 2012
|
||
|
*(16)
|
10.60
|
Gilead Sciences, Inc. Corporate Bonus Plan
|
||
|
*(3)
|
10.61
|
Amended and Restated Gilead Sciences, Inc. Code Section 162(m) Bonus Plan
|
||
|
*(28)
|
10.62
|
2013 Base Salaries for the Named Executive Officers
|
||
|
*(29)
|
10.63
|
Offer Letter dated April 16, 2008 between Registrant and Robin Washington
|
||
|
*(13)
|
10.64
|
Form of Indemnity Agreement entered into between Registrant and its directors and executive officers
|
||
|
*(13)
|
10.65
|
Form of Employee Proprietary Information and Invention Agreement entered into between Registrant and certain of its officers and key employees
|
||
|
*(19)
|
10.66
|
Form of Employee Proprietary Information and Invention Agreement entered into between Registrant and certain of its officers and key employees (revised in September 2006)
|
||
|
(30)
|
10.67
|
Amended and Restated Collaboration Agreement by and among Registrant, Gilead Holdings, LLC, Bristol-Myers Squibb Company, E.R. Squibb & Sons, L.L.C., and Bristol-Myers Squibb & Gilead Sciences, LLC, dated September 28, 2006
|
||
|
(17)
|
10.68
|
Commercialization Agreement by and between Gilead Sciences Limited and Bristol-Myers Squibb Company, dated December 10, 2007
|
||
76
|
(31)
|
10.69
|
Amendment Agreement, dated October 25, 1993, between Registrant, the Institute of Organic Chemistry and Biochemistry (IOCB) and Rega Stichting v.z.w. (REGA), together with the following exhibits: the License Agreement, dated December 15, 1991, between Registrant, IOCB and REGA (the 1991 License Agreement), the License Agreement, dated October 15, 1992, between Registrant, IOCB and REGA (the October 1992 License Agreement) and the License Agreement, dated December 1, 1992, between Registrant, IOCB and REGA (the December 1992 License Agreement)
|
||
|
(32)
|
10.70
|
Amendment Agreement between Registrant and IOCB/REGA, dated December 27, 2000 amending the 1991 License Agreement and the December 1992 License Agreement
|
||
|
(30)
|
10.71
|
Sixth Amendment Agreement to the License Agreement, between IOCB/REGA and Registrant, dated August 18, 2006 amending the October 1992 License Agreement and the December 1992 License Agreement
|
||
|
(30)
|
10.72
|
Development and License Agreement among Registrant and F. Hoffmann-La Roche Ltd and Hoffmann-La Roche Inc., dated September 27, 1996
|
||
|
(33)
|
10.73
|
First Amendment and Supplement dated November 15, 2005 to the Development and Licensing Agreement between Registrant, F. Hoffmann-La Roche Ltd and Hoffman-La Roche Inc. dated September 27, 1996
|
||
|
(34)
|
10.74
|
Second Amendment dated December 22, 2011 to the Development and Licensing Agreement between Registrant, F. Hoffmann-La Roche Ltd and Hoffman-La Roche Inc. dated September 27, 1996
|
||
|
+
|
10.75
|
Third Amendment dated October 5, 2012 to the Development and Licensing Agreement between Registrant, F. Hoffmann-La Roche Ltd and Hoffman-La Roche Inc. dated September 27, 1996
|
||
|
(35)
|
10.76
|
Exclusive License Agreement between Registrant (as successor to Triangle Pharmaceuticals, Inc.), Glaxo Group Limited, The Wellcome Foundation Limited, Glaxo Wellcome Inc. and Emory University, dated May 6, 1999
|
||
|
(36)
|
10.77
|
Royalty Sale Agreement by and among Registrant, Emory University and Investors Trust & Custodial Services (Ireland) Limited, solely in its capacity as Trustee of Royalty Pharma, dated July 18, 2005
|
||
|
(36)
|
10.78
|
Amended and Restated License Agreement between Registrant, Emory University and Investors Trust & Custodial Services (Ireland) Limited, solely in its capacity as Trustee of Royalty Pharma, dated July 21, 2005
|
||
|
(37)
|
10.79
|
License Agreement between Japan Tobacco Inc. and Registrant, dated March 22, 2005
|
||
|
(38)
|
10.80
|
First Amendment to License Agreement between Japan Tobacco Inc. and Registrant, dated May 19, 2005
|
||
|
(38)
|
10.81
|
Second Amendment to License Agreement between Japan Tobacco Inc. and Registrant, dated May 17, 2010
|
||
|
(38)
|
10.82
|
Third Amendment to License Agreement between Japan Tobacco Inc. and Registrant, dated July 5, 2011
|
||
|
(38)
|
10.83
|
Fourth Amendment to License Agreement between Japan Tobacco Inc. and Registrant, dated July 5, 2011
|
||
|
(39)
|
10.84
|
License Agreement between Registrant (as successor to Myogen, Inc.) and Abbott Deutschland Holding GmbH dated October 8, 2001
|
||
|
(39)
|
10.85
|
License Agreement between Registrant (as successor to CV Therapeutics, Inc.) and Roche Palo Alto LLC (successor in interest by merger to Syntex (U.S.A.) Inc.), dated March 27, 1996
|
||
|
(40)
|
10.86
|
First Amendment to License Agreement between Registrant (as successor to CV Therapeutics, Inc.) and Roche Palo Alto LLC (successor in interest by merger to Syntex (U.S.A.) Inc.), dated July 3, 1997
|
||
77
|
(40)
|
10.87
|
Amendment No. 2 to License Agreement between Registrant (as successor to CV Therapeutics, Inc.) and Roche Palo Alto LLC (successor in interest by merger to Syntex (U.S.A.) Inc.), dated November 30. 1999
|
||
|
(41)
|
10.88
|
Amendment No. 4 to License Agreement with Registrant (as successor to CV Therapeutics, Inc.) and Roche Palo Alto LLC (successor in interest by merger to Syntex (U.S.A.) Inc.), dated June 20, 2006
|
||
|
(34)
|
10.89
|
Amendment No. 5 to License Agreement with Registrant (as successor to CV Therapeutics, Inc.) and Roche Palo Alto LLC (successor in interest by merger to Syntex (U.S.A.) Inc.), dated December 22, 2011
|
||
|
(42)
|
10.90
|
License and Collaboration Agreement by and among Registrant, Gilead Sciences Limited and Janssen R&D Ireland (formerly Tibotec Pharmaceuticals), dated July 16, 2009
|
||
|
(38)
|
10.91
|
Second Amendment to License and Collaboration Agreement by and among Registrant, Gilead Sciences Limited and Janssen R&D Ireland (formerly Tibotec Pharmaceuticals), dated July 1, 2011
|
||
|
(43)
|
10.92
|
Master Clinical and Commercial Supply Agreement between Gilead World Markets, Limited, Registrant and Patheon Inc., dated January 1, 2003
|
||
|
(36)
|
10.93
|
Tenofovir Disoproxil Fumarate Manufacturing Supply Agreement by and between Gilead Sciences Limited and PharmaChem Technologies (Grand Bahama), Ltd., dated July 17, 2003
|
||
|
(44)
|
10.94
|
Addendum to Tenofovir Disoproxil Fumarate Manufacturing Supply Agreement by and between Gilead Sciences Limited and PharmaChem Technologies (Grand Bahama) Ltd., dated May 10, 2007
|
||
|
(27)
|
10.95
|
Addendum to Tenofovir Disoproxil Fumarate Manufacturing Supply Agreement by and between Gilead Sciences Limited and PharmaChem Technologies (Grand Bahama) Ltd., dated December 5, 2008
|
||
|
(20)
|
10.96
|
Addendum to Tenofovir Disoproxil Fumarate Manufacturing Supply Agreement by and between Gilead Sciences Limited and PharmaChem Technologies (Grand Bahama) Ltd., dated February 3. 2011
|
||
|
(45)
|
10.97
|
Tenofovir Disoproxil Fumarate Manufacturing Supply Agreement by and between Gilead Sciences Limited and Ampac Fine Chemicals LLC, dated November 3, 2010
|
||
|
(33)
|
10.98
|
Restated and Amended Toll Manufacturing Agreement between Gilead Sciences Limited, Registrant and Nycomed GmbH (formerly ALTANA Pharma Oranienburg GmbH), dated November 7, 2005
|
||
|
+(8)
|
10.99
|
Emtricitabine Manufacturing Supply Agreement between Gilead Sciences Limited and Evonik Degussa GmbH (formerly known as Degussa AG), dated June 6, 2006
|
||
|
+(9)
|
10.100
|
Amendment No. 1 to Emtricitabine Manufacturing Supply Agreement between Gilead Sciences Limited and Evonik Degussa GmbH (formerly known as Degussa AG), dated April 30, 2010
|
||
|
(46)
|
10.101
|
Purchase and Sale Agreement and Joint Escrow Instructions between Electronics for Imaging, Inc. and Registrant, dated July 18, 2012
|
||
|
10.102
|
Amendment No. 1, dated October 30, 2012, to the Purchase and Sale Agreement and Joint Escrow Instructions between Electronics for Imaging, Inc. and Registrant, dated July 18, 2012
|
|||
|
21.1
|
Subsidiaries of Registrant
|
|||
|
23.1
|
Consent of Independent Registered Public Accounting Firm
|
|||
|
24.1
|
Power of Attorney, reference is made to the signature page
|
|||
|
|
31.1
|
Certification of Chief Executive Officer, as required by Rule 13a-14(a) or Rule 15d-14(a) of the Securities Exchange Act of 1934, as amended
|
||
|
|
31.2
|
Certification of Chief Financial Officer, as required by Rule 13a-14(a) or Rule 15d-14(a) of the Securities Exchange Act of 1934, as amended
|
||
78
|
|
32.1**
|
Certifications of Chief Executive Officer and Chief Financial Officer, as required by Rule 13a-14(b) or Rule 15d-14(b) and Section 1350 of Chapter 63 of Title 18 of the United States Code (18 U.S.C. §1350)
|
||
|
101***
|
The following materials from Registrant's Annual Report on Form 10-K for the year ended December 31, 2012, formatted in Extensible Business Reporting Language (XBRL) includes: (i) Consolidated Balance Sheets at December 31, 2012 and 2011, (ii) Consolidated Statements of Income for the years ended December 31, 2012, 2011 and 2010, (iii) Consolidated Statements of Comprehensive Income for the years ended December 31, 2012, 2011 and 2010, (iv) Consolidated Statements of Stockholders' Equity for the years ended December 31, 2012, 2011 and 2010 (v) Consolidated Statements of Cash Flows for years ended December 31, 2012, 2011 and 2010, and (vi) Notes to Consolidated Financial Statements.
|
|||
|
(1)
|
Filed as an exhibit to Registrant's Current Report on Form 8-K filed on March 12, 2009, and incorporated herein by reference.
|
|
(2)
|
Filed as an exhibit to Registrant's Current Report on Form 8-K filed on November 25, 2011, and incorporated herein by reference.
|
|
(3)
|
Filed as an exhibit to Registrant's Current Report on Form 8-K filed on May 17, 2011, and incorporated herein by reference.
|
|
(4)
|
Filed as an exhibit to Registrant's Current Report on Form 8-K filed on April 25, 2006, and incorporated herein by reference.
|
|
(5)
|
Filed as an exhibit to Registrant's Current Report on Form 8-K filed on August 2, 2010, and incorporated herein by reference.
|
|
(6)
|
Filed as an exhibit to Registrant's Current Report on Form 8-K filed on April 1, 2011, and incorporated herein by reference.
|
|
(7)
|
Filed as an exhibit to Registrant's Current Report on Form 8-K filed on December 13, 2011, and incorporated herein by reference.
|
|
(8)
|
Filed as an exhibit to Registrant's Quarterly Report on Form 10-Q for the quarter ended June 30, 2006, and incorporated herein by reference.
|
|
(9)
|
Filed as an exhibit to Registrant's Quarterly Report on Form 10-Q for the quarter ended June 30, 2010, and incorporated herein by reference.
|
|
(10)
|
Filed as an exhibit to Registrant's Quarterly Report on Form 10-Q for the quarter ended September 30, 2010, and incorporated herein by reference.
|
|
(11)
|
Filed as an exhibit to Registrant's Current Report on Form 8-K filed on January 17, 2012, and incorporated herein by reference.
|
|
(12)
|
Filed as an exhibit to Registrant's Registration Statement on Form S-8 (No. 333-102912) filed on January 31, 2003, and incorporated herein by reference.
|
|
(13)
|
Filed as an exhibit to Registrant's Registration Statement on Form S-1 (No. 33-55680), as amended, and incorporated herein by reference.
|
|
(14)
|
Filed as an exhibit to Registrant's Annual Report on Form 10-K/A for the fiscal year ended December 31, 1998, and incorporated herein by reference.
|
|
(15)
|
Filed as an exhibit to Registrant's Current Report on Form 8-K filed on May 11, 2009, and incorporated herein by reference.
|
|
(16)
|
Filed as an exhibit to Registrant's Current Report on Form 8-K/A filed on February 22, 2006, and incorporated herein by reference.
|
|
(17)
|
Filed as an exhibit to Registrant's Annual Report on Form 10-K for the fiscal year ended December 31, 2007, and incorporated herein by reference.
|
|
(18)
|
Filed as an exhibit to Registrant's Quarterly Report on Form 10-Q for the quarter ended June 30, 2009, and incorporated herein by reference.
|
|
(19)
|
Filed as an exhibit to Registrant's Annual Report on Form 10-K for the fiscal year ended December 31, 2009, and incorporated herein by reference.
|
79
|
(20)
|
Filed as an exhibit to Registrant's Quarterly Report on Form 10-Q for the quarter ended March 31, 2011, and incorporated herein by reference.
|
|
(21)
|
Filed as an exhibit to Registrant's Quarterly Report on Form 10-Q for the quarter ended June 30, 2012, and incorporated herein by reference.
|
|
(22)
|
Filed as an exhibit to Registrant's Quarterly Report on Form 10-Q for the quarter ended March 31, 2012, and incorporated herein by reference.
|
|
(23)
|
Filed as an exhibit to Registrant's Current Report on Form 8-K first filed on December 19, 2007, and incorporated herein by reference.
|
|
(24)
|
Filed as an exhibit to Registrant's Quarterly Report on Form 10-Q for the quarter ended March 31, 2010, and incorporated herein by reference.
|
|
(25)
|
Filed as an exhibit to Registrant's Registration Statement on Form S-8 (No. 333-163871) filed on December 21, 2009, and incorporated herein by reference.
|
|
(26)
|
Filed as an exhibit to Registrant's Annual Report on Form 10-K for the fiscal year ended December 31, 2001, and incorporated herein by reference.
|
|
(27)
|
Filed as an exhibit to Registrant's Annual Report on Form 10-K for the fiscal year ended December 31, 2008, and incorporated herein by reference.
|
|
(28)
|
Information is included in Registrant's Current Report on Form 8-K filed on February 4, 2013, and incorporated herein by reference.
|
|
(29)
|
Filed as an exhibit to Registrant's Quarterly Report on Form 10-Q for the quarter ended June 30, 2008, and incorporated herein by reference.
|
|
(30)
|
Filed as an exhibit to Registrant's Quarterly Report on Form 10-Q for the quarter ended September 30, 2006, and incorporated herein by reference.
|
|
(31)
|
Filed as an exhibit to Registrant's Annual Report on Form 10-K for the fiscal year ended March 31, 1994, and incorporated herein by reference.
|
|
(32)
|
Filed as an exhibit to Registrant's Annual Report on Form 10-K for the fiscal year ended December 31, 2000, and incorporated herein by reference.
|
|
(33)
|
Filed as an exhibit to Registrant's Annual Report on Form 10-K for the fiscal year ended December 31, 2005, and incorporated herein by reference.
|
|
(34)
|
Filed as an exhibit to Registrant's Annual Report on Form 10-K for the fiscal year ended December 31, 2011, and incorporated herein by reference
|
|
(35)
|
Filed as an exhibit to Triangle Pharmaceuticals, Inc.'s Quarterly Report on Form 10-Q/A filed on November 3, 1999, and incorporated herein by reference.
|
|
(36)
|
Filed as an exhibit to Registrant's Quarterly Report on Form 10-Q for the quarter ended September 30, 2005, and incorporated herein by reference.
|
|
(37)
|
Filed as an exhibit to Registrant's Quarterly Report on Form 10-Q for the quarter ended March 31, 2005, and incorporated herein by reference.
|
|
(38)
|
Filed as an exhibit to Registrant's Quarterly Report on Form 10-Q for the quarter ended September 30, 2011, and incorporated herein by reference.
|
|
(39)
|
Filed as an exhibit to Myogen, Inc.'s Registration Statement on Form S-1 (No. 333-108301), as amended, originally filed on August 28, 2003, and incorporated herein by reference.
|
|
(40)
|
Filed as an exhibit to CV Therapeutics, Inc.'s Registration Statement on Form S-3 (No. 333-59318), as amended, originally filed on April 20, 2001, and incorporated herein by reference.
|
|
(41)
|
Filed as an exhibit to CV Therapeutics, Inc.'s Quarterly Report on Form 10-Q for the quarter ended June 30, 2006, and incorporated herein by reference.
|
|
(42)
|
Filed as an exhibit to Registrant's Quarterly Report on Form 10-Q for the quarter ended September 30, 2009, and incorporated herein by reference.
|
|
(43)
|
Filed as an exhibit to Registrant's Annual Report on Form 10-K for the fiscal year ended December 31, 2003, and incorporated herein by reference.
|
|
(44)
|
Filed as an exhibit to Registrant's Current Report on Form 8-K filed on August 7, 2007, and incorporated herein by reference.
|
80
|
(45)
|
Filed as an exhibit to Registrant's Annual Report on Form 10-K for the fiscal year ended December 31, 2010, and incorporated herein by reference.
|
|
(46)
|
Filed as an exhibit to Registrant's Quarterly Report on Form 10-Q for the quarter ended September 30, 2012, and incorporated herein by reference.
|
|
√
|
The Agreement and Plan of Merger (the Merger Agreement) contains representations and warranties of Registrant, Apex Merger Sub, Inc. and CV Therapeutics, Inc. made solely to each other as of specific dates. Those representations and warranties were made solely for purposes of the Merger Agreement and may be subject to important qualifications and limitations agreed to by Registrant, Apex Merger Sub, Inc. and CV Therapeutics, Inc. Moreover, some of those representations and warranties may not be accurate or complete as of any specified date, may be subject to a standard of materiality provided for in the Merger Agreement and have been used for the purpose of allocating risk among Registrant, Apex Merger Sub, Inc. and CV Therapeutics, Inc. rather than establishing matters as facts.
|
|
†
|
The Agreement and Plan of Merger (the Pharmasset Merger Agreement) contains representations and warranties of Registrant, Merger Sub and Pharmasset, Inc. made solely to each other as of specific dates. Those representations and warranties were made solely for purposes of the Pharmasset Merger Agreement and may be subject to important qualifications and limitations agreed to by Registrant, Merger Sub and Pharmasset, Inc. Moreover, some of those representations and warranties may not be accurate or complete as of any specified date, may be subject to a standard of materiality provided for in the Pharmasset Merger Agreement and have been used for the purpose of allocating risk among Registrant, Merger Sub and Pharmasset, Inc. rather than establishing matters as facts.
|
|
*
|
Management contract or compensatory plan or arrangement.
|
|
**
|
This certification accompanies the Form 10-K to which it relates, is not deemed filed with the Securities and Exchange Commission and is not to be incorporated by reference into any filing of Registrant under the Securities Act of 1933, as amended, or the Securities Exchange Act of 1934, as amended (whether made before or after the date of the Form 10-K), irrespective of any general incorporation language contained in such filing.
|
|
***
|
XBRL information is filed herewith.
|
|
+
|
Certain confidential portions of this Exhibit were omitted by means of marking such portions with an asterisk (the Mark). This Exhibit has been filed separately with the Secretary of the SEC without the Mark pursuant to Registrant's Application Requesting Confidential Treatment under Rule 24b-2 under the Securities Exchange Act of 1934, as amended.
|
81
GILEAD SCIENCES, INC.
CONSOLIDATED FINANCIAL STATEMENTS
Years ended December 31, 2012, 2011 and 2010
CONTENTS
|
Report of Independent Registered Public Accounting Firm
|
||
|
Audited Consolidated Financial Statements:
|
||
82
REPORT OF INDEPENDENT REGISTERED PUBLIC ACCOUNTING FIRM
The Board of Directors and Stockholders of Gilead Sciences, Inc.
We have audited the accompanying consolidated balance sheets of Gilead Sciences, Inc. as of
December 31, 2012
and
2011
, and the related consolidated statements of income, comprehensive income, stockholders' equity, and cash flows for each of the three years in the period ended
December 31, 2012
. Our audits also included the financial statement schedule listed in the Index at Item 15(a). These financial statements and schedule are the responsibility of the Company's management. Our responsibility is to express an opinion on these financial statements and schedule based on our audits.
We conducted our audits in accordance with the standards of the Public Company Accounting Oversight Board (United States). Those standards require that we plan and perform the audit to obtain reasonable assurance about whether the financial statements are free of material misstatement. An audit includes examining, on a test basis, evidence supporting the amounts and disclosures in the financial statements. An audit also includes assessing the accounting principles used and significant estimates made by management, as well as evaluating the overall financial statement presentation. We believe that our audits provide a reasonable basis for our opinion.
In our opinion, the financial statements referred to above present fairly, in all material respects, the consolidated financial position of Gilead Sciences, Inc. at
December 31, 2012
and
2011
, and the consolidated results of its operations and its cash flows for each of the three years in the period ended
December 31, 2012
, in conformity with U.S. generally accepted accounting principles. Also, in our opinion, the related financial statement schedule, when considered in relation to the basic financial statements taken as a whole, presents fairly in all material respects the information set forth therein.
We also have audited, in accordance with the standards of the Public Company Accounting Oversight Board (United States), Gilead Sciences, Inc.'s internal control over financial reporting as of
December 31, 2012
, based on criteria established in Internal Control—Integrated Framework issued by the Committee of Sponsoring Organizations of the Treadway Commission and our report dated
February 27, 2013
expressed an unqualified opinion thereon.
/s/ E
RNST
& Y
OUNG
LLP
Redwood City, California
February 27, 2013
83
GILEAD SCIENCES, INC.
(in thousands, except per share amounts)
|
|
December 31,
|
||||||
|
|
2012
|
2011
|
|||||
|
Assets
|
|
|
|||||
|
Current assets:
|
|
|
|||||
|
Cash and cash equivalents
|
$
|
1,803,694
|
|
$
|
9,883,777
|
|
|
|
Short-term marketable securities
|
58,556
|
|
16,491
|
|
|||
|
Accounts receivable, net of allowances of $261,013 and $205,990 at December 31, 2012 and 2011, respectively
|
1,751,388
|
|
1,951,167
|
|
|||
|
Inventories
|
1,744,982
|
|
1,389,983
|
|
|||
|
Deferred tax assets
|
262,641
|
|
208,155
|
|
|||
|
Prepaid taxes
|
348,420
|
|
246,444
|
|
|||
|
Prepaid expenses and other current assets
|
186,666
|
|
222,768
|
|
|||
|
Total current assets
|
6,156,347
|
|
13,918,785
|
|
|||
|
Property, plant and equipment, net
|
1,100,259
|
|
774,406
|
|
|||
|
Long-term portion of prepaid royalties
|
175,790
|
|
174,584
|
|
|||
|
Long-term deferred tax assets
|
131,107
|
|
144,015
|
|
|||
|
Long-term marketable securities
|
719,836
|
|
63,704
|
|
|||
|
Intangible assets, net
|
11,736,393
|
|
1,062,864
|
|
|||
|
Goodwill
|
1,060,919
|
|
1,004,102
|
|
|||
|
Other long-term assets
|
159,187
|
|
160,674
|
|
|||
|
Total assets
|
$
|
21,239,838
|
|
$
|
17,303,134
|
|
|
|
|
|
|
|
||||
|
Liabilities and Stockholders’ Equity
|
|
|
|
|
|||
|
Current liabilities:
|
|
|
|
|
|||
|
Accounts payable
|
$
|
1,327,339
|
|
$
|
1,206,052
|
|
|
|
Accrued government rebates
|
745,148
|
|
547,473
|
|
|||
|
Accrued compensation and employee benefits
|
236,716
|
|
173,316
|
|
|||
|
Income taxes payable
|
13,403
|
|
40,583
|
|
|||
|
Other accrued liabilities
|
674,762
|
|
471,129
|
|
|||
|
Deferred revenues
|
103,162
|
|
74,665
|
|
|||
|
Current portion of long-term debt and other obligations, net
|
1,169,490
|
|
1,572
|
|
|||
|
Total current liabilities
|
4,270,020
|
|
2,514,790
|
|
|||
|
Long-term deferred revenues
|
20,532
|
|
31,870
|
|
|||
|
Long-term debt, net
|
7,054,555
|
|
7,605,734
|
|
|||
|
Long-term income taxes payable
|
115,822
|
|
135,655
|
|
|||
|
Other long-term obligations
|
228,040
|
|
147,736
|
|
|||
|
Commitments and contingencies (Note 11)
|
|
|
|
|
|||
|
Stockholders’ equity:
|
|
|
|
|
|||
|
Preferred stock, par value $0.001 per share; 5,000 shares authorized; none outstanding
|
—
|
|
—
|
|
|||
|
Common stock, par value $0.001 per share; 2,800,000 shares authorized; 1,519,163 and 1,506,212 shares issued and outstanding at December 31, 2012 and 2011, respectively
(1)
|
760
|
|
753
|
|
|||
|
Additional paid-in capital
|
5,649,850
|
|
4,903,143
|
|
|||
|
Accumulated other comprehensive income (loss)
|
(45,615
|
)
|
58,200
|
|
|||
|
Retained earnings
|
3,704,744
|
|
1,776,760
|
|
|||
|
Total Gilead stockholders’ equity
|
9,309,739
|
|
6,738,856
|
|
|||
|
Noncontrolling interest
|
241,130
|
|
128,493
|
|
|||
|
Total stockholders’ equity
|
9,550,869
|
|
6,867,349
|
|
|||
|
Total liabilities and stockholders’ equity
|
$
|
21,239,838
|
|
$
|
17,303,134
|
|
|
|
(1)
The number of shares for all periods presented reflects the two-for-one stock split in the form of a stock dividend declared on December 10, 2012 which took effect on January 25, 2013.
|
See accompanying notes.
84
GILEAD SCIENCES, INC.
(in thousands, except per share amounts)
|
|
Year Ended December 31,
|
|||||||||||
|
|
2012
|
2011
|
2010
|
|||||||||
|
Revenues:
|
|
|
|
|||||||||
|
Product sales
|
$
|
9,398,371
|
|
$
|
8,102,359
|
|
$
|
7,389,921
|
|
|||
|
Royalty revenues
|
290,523
|
|
268,827
|
|
545,970
|
|
||||||
|
Contract and other revenues
|
13,623
|
|
14,199
|
|
13,529
|
|
||||||
|
Total revenues
|
9,702,517
|
|
8,385,385
|
|
7,949,420
|
|
||||||
|
Costs and expenses:
|
|
|||||||||||
|
Cost of goods sold
|
2,471,363
|
|
2,124,410
|
|
1,869,876
|
|
||||||
|
Research and development expenses
|
1,759,945
|
|
1,229,151
|
|
1,072,930
|
|
||||||
|
Selling, general and administrative expenses
|
1,461,034
|
|
1,241,983
|
|
1,044,392
|
|
||||||
|
Total costs and expenses
|
5,692,342
|
|
4,595,544
|
|
3,987,198
|
|
||||||
|
Income from operations
|
4,010,175
|
|
3,789,841
|
|
3,962,222
|
|
||||||
|
Interest expense
|
(360,916
|
)
|
(205,418
|
)
|
(108,961
|
)
|
||||||
|
Other income (expense), net
|
(37,279
|
)
|
66,581
|
|
60,287
|
|
||||||
|
Income before provision for income taxes
|
3,611,980
|
|
3,651,004
|
|
3,913,548
|
|
||||||
|
Provision for income taxes
|
1,038,381
|
|
861,945
|
|
1,023,799
|
|
||||||
|
Net income
|
2,573,599
|
|
2,789,059
|
|
2,889,749
|
|
||||||
|
Net loss attributable to noncontrolling interest
|
17,967
|
|
14,578
|
|
11,508
|
|
||||||
|
Net income attributable to Gilead
|
$
|
2,591,566
|
|
$
|
2,803,637
|
|
$
|
2,901,257
|
|
|||
|
Net income per share attributable to Gilead common stockholders—basic
(1)
|
$
|
1.71
|
|
$
|
1.81
|
|
$
|
1.69
|
|
|||
|
Shares used in per share calculation—basic
(1)
|
1,514,621
|
|
1,549,806
|
|
1,712,120
|
|
||||||
|
Net income per share attributable to Gilead common stockholders—diluted
(1)
|
$
|
1.64
|
|
$
|
1.77
|
|
$
|
1.66
|
|
|||
|
Shares used in per share calculation—diluted
(1)
|
1,582,549
|
|
1,580,236
|
|
1,746,792
|
|
||||||
|
(1)
Net income per share and the number of shares used in the per share calculations for all periods presented reflect the two-for-one stock split in the form of a stock dividend declared on December 10, 2012 which took effect on January 25, 2013.
|
See accompanying notes.
85
GILEAD SCIENCES, INC.
CONSOLIDATED STATEMENTS OF COMPREHENSIVE INCOME
(in thousands)
|
Year Ended December 31,
|
||||||||||||
|
2012
|
2011
|
2010
|
||||||||||
|
Net income
|
$
|
2,573,599
|
|
$
|
2,789,059
|
|
$
|
2,889,749
|
|
|||
|
Other comprehensive income (loss):
|
||||||||||||
|
Net foreign currency translation gain (loss)
|
11,076
|
|
(5,264
|
)
|
(8,416
|
)
|
||||||
|
Available-for-sale securities:
|
||||||||||||
|
Net unrealized gain (loss), net of tax impact of $(703), $(3,305) and $(6,624) for the year ended December 31, 2012, 2011 and 2010, respectively
|
1,242
|
|
(24,067
|
)
|
13,450
|
|
||||||
|
Reclassifications to net income, net of tax impact of $849, $(11,114) and $(3,167) for the year ended December 31, 2012, 2011 and 2010, respectively
|
33,008
|
|
(19,209
|
)
|
(6,430
|
)
|
||||||
|
Net change
|
34,250
|
|
(43,276
|
)
|
7,020
|
|
||||||
|
Cash flow hedges:
|
||||||||||||
|
Net unrealized gain (loss), net of tax impact of $1,566, $(93) and $(9,149) for the year ended December 31, 2012, 2011 and 2010, respectively
|
(62,505
|
)
|
1,571
|
|
105,924
|
|
||||||
|
Reclassification to net income, net of tax impact of $(2,171), $4,389 and $(5,861) for the year ended December 31, 2012, 2011 and 2010, respectively
|
(86,636
|
)
|
74,258
|
|
(67,859
|
)
|
||||||
|
Net change
|
(149,141
|
)
|
75,829
|
|
38,065
|
|
||||||
|
Other comprehensive income (loss)
|
(103,815
|
)
|
27,289
|
|
36,669
|
|
||||||
|
Comprehensive income
|
2,469,784
|
|
2,816,348
|
|
2,926,418
|
|
||||||
|
Comprehensive loss attributable to noncontrolling interest
|
17,967
|
|
14,578
|
|
11,508
|
|
||||||
|
Comprehensive income attributable to Gilead
|
$
|
2,487,751
|
|
$
|
2,830,926
|
|
$
|
2,937,926
|
|
|||
See accompanying notes.
86
GILEAD SCIENCES, INC.
Consolidated Statements of Stockholders' Equity
(in thousands)
|
|
Gilead Stockholders' Equity
|
Noncontrolling
Interest
|
Total
Stockholders'
Equity
|
||||||||||||||||||||||||
|
Common Stock
|
Additional
Paid-In
Capital
|
Accumulated
Other
Comprehensive
Income (Loss)
|
Retained
Earnings
|
||||||||||||||||||||||||
|
Shares
(1)
|
Amount
|
||||||||||||||||||||||||||
|
Balance at December 31, 2009
|
1,799,506
|
|
$
|
900
|
|
$
|
4,376,651
|
|
$
|
(5,758
|
)
|
$
|
1,995,272
|
|
$
|
138,093
|
|
$
|
6,505,158
|
|
|||||||
|
Contributions from noncontrolling interest
|
—
|
|
—
|
|
—
|
|
—
|
|
—
|
|
131,523
|
|
131,523
|
|
|||||||||||||
|
Net income (loss)
|
—
|
|
—
|
|
—
|
|
—
|
|
2,901,257
|
|
(11,508
|
)
|
2,889,749
|
|
|||||||||||||
|
Other comprehensive income, net of tax
|
—
|
|
—
|
|
—
|
|
36,669
|
|
—
|
|
—
|
|
36,669
|
|
|||||||||||||
|
Issuances under employee stock purchase plan
|
2,220
|
|
1
|
|
32,306
|
|
—
|
|
—
|
|
—
|
|
32,307
|
|
|||||||||||||
|
Stock option exercises, net
|
21,342
|
|
11
|
|
188,906
|
|
—
|
|
—
|
|
—
|
|
188,917
|
|
|||||||||||||
|
Tax benefits from employee stock plans
|
—
|
|
—
|
|
82,086
|
|
—
|
|
—
|
|
—
|
|
82,086
|
|
|||||||||||||
|
Stock-based compensation
|
922
|
|
—
|
|
200,595
|
|
—
|
|
—
|
|
—
|
|
200,595
|
|
|||||||||||||
|
Purchases of convertible note hedges
|
—
|
|
—
|
|
(362,622
|
)
|
—
|
|
—
|
|
—
|
|
(362,622
|
)
|
|||||||||||||
|
Sale of warrants
|
—
|
|
—
|
|
155,425
|
|
—
|
|
—
|
|
—
|
|
155,425
|
|
|||||||||||||
|
Deferred tax assets on convertible note hedges
|
—
|
|
—
|
|
39,093
|
|
—
|
|
—
|
|
—
|
|
39,093
|
|
|||||||||||||
|
Equity portion of convertible notes, net of issuance costs of $4,018
|
—
|
|
—
|
|
255,517
|
|
—
|
|
—
|
|
—
|
|
255,517
|
|
|||||||||||||
|
Repurchases of common stock
|
(219,994
|
)
|
(110
|
)
|
(319,671
|
)
|
—
|
|
(3,712,799
|
)
|
—
|
|
(4,032,580
|
)
|
|||||||||||||
|
Balance at December 31, 2010
|
1,603,996
|
|
802
|
|
4,648,286
|
|
30,911
|
|
1,183,730
|
|
258,108
|
|
6,121,837
|
|
|||||||||||||
|
Distributions to noncontrolling interest
|
—
|
|
—
|
|
—
|
|
—
|
|
—
|
|
(115,037
|
)
|
(115,037
|
)
|
|||||||||||||
|
Net income (loss)
|
—
|
|
—
|
|
—
|
|
—
|
|
2,803,637
|
|
(14,578
|
)
|
2,789,059
|
|
|||||||||||||
|
Other comprehensive income, net of tax
|
—
|
|
—
|
|
—
|
|
27,289
|
|
—
|
|
—
|
|
27,289
|
|
|||||||||||||
|
Issuances under employee stock purchase plan
|
2,400
|
|
1
|
|
35,012
|
|
—
|
|
—
|
|
—
|
|
35,013
|
|
|||||||||||||
|
Stock option exercises, net
|
18,350
|
|
9
|
|
176,699
|
|
—
|
|
—
|
|
—
|
|
176,708
|
|
|||||||||||||
|
Tax benefits from employee stock plans
|
—
|
|
—
|
|
37,231
|
|
—
|
|
—
|
|
—
|
|
37,231
|
|
|||||||||||||
|
Stock-based compensation
|
—
|
|
—
|
|
192,030
|
|
—
|
|
—
|
|
—
|
|
192,030
|
|
|||||||||||||
|
Repurchases of common stock
|
(118,534
|
)
|
(59
|
)
|
(186,115
|
)
|
—
|
|
(2,210,607
|
)
|
—
|
|
(2,396,781
|
)
|
|||||||||||||
|
Balance at December 31, 2011
|
1,506,212
|
|
753
|
|
4,903,143
|
|
58,200
|
|
1,776,760
|
|
128,493
|
|
6,867,349
|
|
|||||||||||||
|
Contributions from noncontrolling interest
|
—
|
|
—
|
|
—
|
|
—
|
|
—
|
|
130,604
|
|
130,604
|
|
|||||||||||||
|
Net income (loss)
|
—
|
|
—
|
|
—
|
|
—
|
|
2,591,566
|
|
(17,967
|
)
|
2,573,599
|
|
|||||||||||||
|
Other comprehensive loss, net of tax
|
—
|
|
—
|
|
—
|
|
(103,815
|
)
|
—
|
|
—
|
|
(103,815
|
)
|
|||||||||||||
|
Issuances under employee stock purchase plan
|
2,010
|
|
1
|
|
30,735
|
|
—
|
|
—
|
|
—
|
|
30,736
|
|
|||||||||||||
|
Stock option exercises, net
|
31,693
|
|
16
|
|
435,688
|
|
—
|
|
—
|
|
—
|
|
435,704
|
|
|||||||||||||
|
Tax benefits from employee stock plans
|
—
|
|
—
|
|
112,629
|
|
—
|
|
—
|
|
—
|
|
112,629
|
|
|||||||||||||
|
Stock-based compensation
|
—
|
|
—
|
|
208,230
|
|
—
|
|
—
|
|
—
|
|
208,230
|
|
|||||||||||||
|
Repurchases of common stock
|
(20,752
|
)
|
(10
|
)
|
(40,575
|
)
|
—
|
|
(663,582
|
)
|
—
|
|
(704,167
|
)
|
|||||||||||||
|
Balance at December 31, 2012
|
1,519,163
|
|
$
|
760
|
|
$
|
5,649,850
|
|
$
|
(45,615
|
)
|
$
|
3,704,744
|
|
$
|
241,130
|
|
$
|
9,550,869
|
|
|||||||
|
(1)
The common stock shares for all periods presented reflect the two-for-one stock split in the form of a stock dividend declared on December 10, 2012 which took effect on January 25, 2013.
|
See accompanying notes.
87
GILEAD SCIENCES, INC.
(in thousands)
|
|
Year Ended December 31,
|
|||||||||||
|
|
2012
|
2011
|
2010
|
|||||||||
|
Operating Activities:
|
||||||||||||
|
Net income
|
$
|
2,573,599
|
|
$
|
2,789,059
|
|
$
|
2,889,749
|
|
|||
|
Adjustments to reconcile net income to net cash provided by operating activities:
|
||||||||||||
|
Depreciation expense
|
82,847
|
|
72,187
|
|
67,240
|
|
||||||
|
Amortization expense
|
195,359
|
|
230,045
|
|
198,237
|
|
||||||
|
Stock-based compensation expense
|
208,725
|
|
192,378
|
|
200,041
|
|
||||||
|
In-process research and development impairment charges
|
—
|
|
26,630
|
|
136,000
|
|
||||||
|
Excess tax benefits from stock-based compensation
|
(114,236
|
)
|
(40,848
|
)
|
(81,620
|
)
|
||||||
|
Tax benefits from employee stock plans
|
112,629
|
|
37,231
|
|
82,086
|
|
||||||
|
Deferred income taxes
|
(39,393
|
)
|
64,061
|
|
12,152
|
|
||||||
|
Other
|
(1,878
|
)
|
47,931
|
|
10,408
|
|
||||||
|
Changes in operating assets and liabilities:
|
||||||||||||
|
Accounts receivable, net
|
197,986
|
|
(375,736
|
)
|
(348,875
|
)
|
||||||
|
Inventories
|
(349,924
|
)
|
(200,793
|
)
|
(161,190
|
)
|
||||||
|
Prepaid expenses and other assets
|
(129,318
|
)
|
(13,959
|
)
|
(70,466
|
)
|
||||||
|
Accounts payable
|
117,485
|
|
428,944
|
|
(4,453
|
)
|
||||||
|
Income taxes payable
|
(68,473
|
)
|
110,771
|
|
(185,733
|
)
|
||||||
|
Accrued liabilities
|
386,063
|
|
300,593
|
|
120,065
|
|
||||||
|
Deferred revenues
|
23,245
|
|
(29,484
|
)
|
(29,728
|
)
|
||||||
|
Net cash provided by operating activities
|
3,194,716
|
|
3,639,010
|
|
2,833,913
|
|
||||||
|
Investing Activities:
|
||||||||||||
|
Purchases of marketable securities
|
(1,244,898
|
)
|
(5,127,790
|
)
|
(5,502,687
|
)
|
||||||
|
Proceeds from sales of marketable securities
|
527,712
|
|
8,649,752
|
|
3,033,893
|
|
||||||
|
Proceeds from maturities of marketable securities
|
44,813
|
|
788,395
|
|
683,927
|
|
||||||
|
Purchases of other investments
|
(25,000
|
)
|
—
|
|
—
|
|
||||||
|
Acquisitions, net of cash acquired
|
(10,751,635
|
)
|
(588,608
|
)
|
(91,000
|
)
|
||||||
|
Capital expenditures
|
(397,046
|
)
|
(131,904
|
)
|
(61,884
|
)
|
||||||
|
Net cash provided by (used in) investing activities
|
(11,846,054
|
)
|
3,589,845
|
|
(1,937,751
|
)
|
||||||
|
Financing Activities:
|
||||||||||||
|
Proceeds from debt financing, net of issuance costs
|
2,144,733
|
|
4,660,702
|
|
2,962,500
|
|
||||||
|
Proceeds from convertible note hedges
|
213,856
|
|
36,148
|
|
—
|
|
||||||
|
Proceeds from sale of warrants
|
—
|
|
—
|
|
155,425
|
|
||||||
|
Proceeds from issuances of common stock
|
466,283
|
|
211,737
|
|
221,223
|
|
||||||
|
Purchases of convertible note hedges
|
—
|
|
—
|
|
(362,622
|
)
|
||||||
|
Repurchases of common stock
|
(667,041
|
)
|
(2,383,132
|
)
|
(4,022,593
|
)
|
||||||
|
Repayments of debt financing
|
(1,837,139
|
)
|
(686,135
|
)
|
(500,000
|
)
|
||||||
|
Repayments of other long-term obligations
|
(2,186
|
)
|
(1,562
|
)
|
(5,786
|
)
|
||||||
|
Excess tax benefits from stock-based compensation
|
114,236
|
|
40,848
|
|
81,620
|
|
||||||
|
Contributions from (distributions to) noncontrolling interest
|
130,604
|
|
(115,037
|
)
|
131,523
|
|
||||||
|
Net cash provided by (used in) financing activities
|
563,346
|
|
1,763,569
|
|
(1,338,710
|
)
|
||||||
|
Effect of exchange rate changes on cash
|
7,909
|
|
(16,526
|
)
|
77,469
|
|
||||||
|
Net change in cash and cash equivalents
|
(8,080,083
|
)
|
8,975,898
|
|
(365,079
|
)
|
||||||
|
Cash and cash equivalents at beginning of period
|
9,883,777
|
|
907,879
|
|
1,272,958
|
|
||||||
|
Cash and cash equivalents at end of period
|
$
|
1,803,694
|
|
$
|
9,883,777
|
|
$
|
907,879
|
|
|||
|
Supplemental disclosure of cash flow information:
|
||||||||||||
|
Interest paid, net of amounts capitalized
|
$
|
249,358
|
|
$
|
62,180
|
|
$
|
15,748
|
|
|||
|
Income taxes paid
|
$
|
1,101,241
|
|
$
|
621,025
|
|
$
|
1,129,577
|
|
|||
See accompanying notes.
88
GILEAD SCIENCES, INC.
NOTES TO CONSOLIDATED FINANCIAL STATEMENTS
|
1.
|
ORGANIZATION AND SUMMARY OF SIGNIFICANT ACCOUNTING POLICIES
|
Overview
Gilead Sciences, Inc. (Gilead, we or us), incorporated in Delaware on June 22, 1987, is a research-based biopharmaceutical company that discovers, develops and commercializes innovative medicines in areas of unmet medical need. With each new discovery and experimental drug candidate, we seek to improve the care of patients suffering from life-threatening diseases around the world. Gilead's primary areas of focus include human immunodeficiency virus (HIV), liver diseases such as hepatitis B virus (HBV) and hepatitis C virus (HCV), serious cardiovascular and respiratory conditions and various oncology/inflammation. We continue to add to our existing portfolio of products through our internal discovery and clinical development programs and through a product acquisition and in-licensing strategy.
Our product portfolio is comprised of Atripla
®
, Truvada
®
, Viread
®
, Complera
®
/Eviplera
®
, Stribild
®
, Hepsera
®
, Emtriva
®
, Letairis
®
, Ranexa
®
, AmBisome
®
, Cayston
®
and Vistide
®
. We have U.S. and international commercial sales operations, with marketing subsidiaries in North America, Europe and Asia. In addition, we also sell and distribute certain products through our corporate partners under royalty-paying collaborative agreements.
Basis of Presentation
The accompanying Consolidated Financial Statements include the accounts of Gilead, our wholly-owned subsidiaries and our joint ventures with Bristol-Myers Squibb Company (BMS), for which we are the primary beneficiary. We record a noncontrolling interest in our Consolidated Financial Statements to reflect BMS's interest in the joint ventures. All intercompany transactions have been eliminated. The Consolidated Financial Statements include the results of companies acquired by us from the date of each acquisition for the applicable reporting periods.
On January 25, 2013, we completed a two-for-one stock split in the form of a stock dividend to stockholders of record as of January 7, 2013, as declared on December 10, 2012. Accordingly, all share and per share amounts for all periods presented in these Consolidated Financial Statements and notes have been adjusted retroactively to reflect this stock split. Additionally, certain prior period amounts within our Consolidated Financial Statements and related notes have been reclassified to conform to the current presentation.
Significant Accounting Policies, Estimates and Judgments
The preparation of these Consolidated Financial Statements requires us to make estimates and judgments that affect the reported amounts of assets, liabilities, revenues and expenses, and related disclosures. On an ongoing basis, management evaluates its significant accounting policies or estimates. We base our estimates on historical experience and on various market specific and other relevant assumptions that we believe to be reasonable under the circumstances, the results of which form the basis for making judgments about the carrying values of assets and liabilities that are not readily apparent from other sources. Actual results may differ significantly from these estimates.
Revenue Recognition
Product Sales
We recognize revenue from product sales when there is persuasive evidence that an arrangement exists, delivery to the customer has occurred, the price is fixed or determinable and collectability is reasonably assured. Upon recognition of revenue from product sales, provisions are made for government rebates such as Medicaid reimbursements, customer incentives such as cash discounts for prompt payment, distributor fees and expected returns of expired products, as appropriate.
89
Items Deducted from Gross Product Sales
Government Rebates
We estimate reductions to our revenues for government-managed Medicaid programs as well as for certain other qualifying federal, state and foreign government programs based on contractual terms, historical utilization rates, new information regarding changes in these programs' regulations and guidelines that would impact the amount of the actual rebates, our expectations regarding future utilization rates for these programs and, for our U.S. product sales, channel inventory data obtained from our major U.S. wholesalers in accordance with our inventory management agreements. Government rebates that are invoiced directly to us are recorded in accrued government rebates on our Consolidated Balance Sheets. For qualified programs that can purchase our products through wholesalers at a lower contractual government price, the wholesalers charge back to us the difference between their acquisition cost and the lower contractual government price, which we record as allowances against accounts receivable.
Cash Discounts
We estimate cash discounts based on contractual terms, historical utilization rates and our expectations regarding future utilization rates.
Distributor Fees
Under our inventory management agreements with our significant U.S. wholesalers, we pay the wholesalers a fee primarily for the compliance of certain contractually determined covenants such as the maintenance of agreed upon inventory levels. These distributor fees are based on a contractually determined fixed percentage of sales.
Product Returns
We do not provide our customers with a general right of product return, but permit returns if the product is damaged or defective when received by the customer, or in the case of product sold in the United States and certain countries outside the United States, if the product has expired. We will accept returns for product that will expire within six months or that have expired up to one year after their expiration dates. Our estimates for expected returns of expired products are based primarily on an ongoing analysis of historical return patterns.
Royalty Revenues
Royalty revenue from sales of our other products is generally recognized when received, which is generally in the quarter following the quarter in which the corresponding sales occur. Royalty revenue from sales of Lexiscan and AmBisome by Astellas US LLC and Astellas Pharma US, Inc., respectively, is recognized in the month following the month in which the corresponding sales occur.
Contract and Other Revenues
Revenue from non-refundable up-front license fees and milestone payments such as under a development collaboration or an obligation to supply product, is recognized as performance occurs and our obligations are completed. In accordance with the specific terms of our obligations under these arrangements, revenue is recognized as the obligation is fulfilled or ratably over the development or manufacturing period. Revenue associated with substantive at-risk milestones is recognized based upon the achievement of the milestones set forth in the respective agreements. Advance payments received in excess of amounts earned are classified as deferred revenue on our Consolidated Balance Sheets.
Shipping and Handling Costs
Shipping and handling costs incurred for inventory purchases and product shipments are recorded in cost of goods sold in our Consolidated Statements of Income.
Research and Development Expenses
R&D expenses consist primarily of personnel costs, including salaries, benefits and stock-based compensation, clinical studies performed by contract research organizations (CROs), materials and supplies, licenses and fees, milestone payments under collaboration arrangements and overhead allocations consisting of various support and facilities-related costs.
We charge R&D costs, including clinical study costs, to expense when incurred
.
Clinical study costs are a significant component of R&D expenses. Most of our clinical studies are performed by third-party CROs. We monitor levels of performance under each significant contract including the extent of patient enrollment and other activities through communications with our CROs. We accrue costs for clinical studies performed by CROs over the service periods specified in
90
the contracts and adjust our estimates, if required, based upon our ongoing review of the level of effort and costs actually incurred by the CROs. All of our material CRO contracts are terminable by us upon written notice and we are generally only liable for actual services completed by the CRO and certain non-cancelable expenses incurred at any point of termination. Amounts paid in advance related to uncompleted services will be refunded to us if a contract is terminated.
Advertising Expenses
We expense the costs of advertising, including promotional expenses, as incurred. Advertising expenses were
$159.8 million
in
2012
,
$116.6 million
in
2011
and
$116.5 million
in
2010
.
Net Income Per Share Attributable to Gilead Common Stockholders
The following table is a reconciliation of the numerator and denominator used in the calculation of basic and diluted net income per share attributable to Gilead common stockholders (in thousands):
|
|
Year Ended December 31,
|
|||||||||||
|
|
2012
|
2011
|
2010
|
|||||||||
|
Numerator:
|
|
|
|
|||||||||
|
Net income attributable to Gilead
|
$
|
2,591,566
|
|
$
|
2,803,637
|
|
$
|
2,901,257
|
|
|||
|
Denominator:
|
|
|
|
|
|
|
||||||
|
Weighted-average shares of common stock outstanding used in the calculation of basic net income per share attributable to Gilead common stockholders
|
1,514,621
|
|
1,549,806
|
|
1,712,120
|
|
||||||
|
Effect of dilutive securities:
|
|
|
|
|
|
|
||||||
|
Stock options and equivalents
|
33,364
|
|
28,496
|
|
33,212
|
|
||||||
|
Conversion spread related to the May 2011 Notes
|
—
|
|
374
|
|
444
|
|
||||||
|
Conversion spread related to the May 2013 Notes
|
10,930
|
|
1,560
|
|
1,016
|
|
||||||
|
Conversion spread related to the May 2014 Notes
|
11,230
|
|
—
|
|
—
|
|
||||||
|
Conversion spread related to the May 2016 Notes
|
10,822
|
|
—
|
|
—
|
|
||||||
|
Warrants related to the Convertible Notes
|
1,582
|
|
—
|
|
—
|
|
||||||
|
Weighted-average shares of common stock outstanding used in the calculation of diluted net income per share attributable to Gilead common stockholders
|
1,582,549
|
|
1,580,236
|
|
1,746,792
|
|
||||||
Basic net income per share attributable to Gilead common stockholders is calculated based on the weighted-average number of shares of our common stock outstanding during the period. Diluted net income per share attributable to Gilead common stockholders is calculated based on the weighted-average number of shares of our common stock outstanding and other dilutive securities outstanding during the period. The potential dilutive shares of our common stock resulting from the assumed exercise of outstanding stock options, performance shares and the assumed exercise of warrants relating to the convertible senior notes due in May 2013 (May 2013 Notes), May 2014 (May 2014 Notes) and May 2016 (May 2016 Notes) (collectively, the Convertible Notes) are determined under the treasury stock method.
Because the principal amount of the Convertible Notes will be settled in cash, only the conversion spread relating to the Convertible Notes is included in our calculation of diluted net income per share attributable to Gilead common stockholders. Our common stock resulting from the assumed settlement of the conversion spread of the Convertible Notes has a dilutive effect when the average market price of our common stock during the period exceeds the conversion prices of
$19.05
,
$22.54
and
$22.71
for the May 2013 Notes, May 2014 Notes and May 2016 Notes, respectively.
In 2011, our convertible senior notes due in May 2011 (May 2011 Notes) matured and the related warrants expired. As a result, we have only considered their impact for the period they were outstanding on our net income per share calculations. Our common stock resulting from the assumed settlement of the conversion spread of the May 2011 Notes had a dilutive effect when the average market price of our common stock during the period exceeded the conversion price of
$19.38
. For 2011 and 2010, the average market price of our common stock exceeded the conversion price of the May 2011 Notes and the dilutive effect is included in the accompanying table. Warrants related to the May 2011 Notes had a dilutive effect when the average market price of our common stock during the period exceeded the warrants’ exercise price of
$25.40
. The average market price of our common stock during 2011 and 2010 did not exceed the exercise price of the warrants related to the May 2011 Notes; therefore, these warrants did not have a dilutive effect on our net income per share for those periods.
91
For 2012, 2011 and 2010, the average market price of our common stock exceeded the conversion price of the May 2013 Notes, and the dilutive effects are included in the accompanying table. During 2012, a portion of the May 2013 Notes were converted and as a result, we have only considered their impact for the period they were outstanding. For 2012, the average market price of our common stock exceeded the conversion prices of the May 2014 Notes and May 2016 Notes and the dilutive effect is included in the accompanying table. For 2011 and 2010, the average market price of our common stock did not exceed the conversion prices of the May 2014 Notes and May 2016 Notes and therefore, these notes did not have a dilutive effect on our net income per share for those periods.
Warrants relating to the May 2013 Notes, May 2014 Notes and May 2016 Notes have a dilutive effect when the average market price of our common stock during the period exceeds the warrants’ exercise prices of
$26.95
,
$28.38
and
$30.05
, respectively. For 2012, the average market price of our common stock exceeded the warrants' exercise price relating to the May 2013 Notes and the dilutive effect is included in the accompanying table. For 2012, the average market price of our common stock did not exceed the warrants' exercise prices relating to the May 2014 Notes and May 2016 Notes and therefore, these warrants did not have a dilutive effect on our net income per share for that period. The average market prices of our common stock for 2011 and 2010 did not exceed the warrants’ exercise prices relating to any of the Convertible Notes; therefore, these warrants did not have a dilutive effect on our net income per share for those periods.
Stock options to purchase approximately
5.1 million
,
42.2 million
and
45.0 million
weighted-average shares of our common stock were outstanding during
2012
,
2011
and
2010
, respectively, but were not included in the computation of diluted net income per share attributable to Gilead common stockholders because their effect was antidilutive.
Stock-Based Compensation
Share-based payments to employees and directors are recognized in the Consolidated Statements of Income based on their fair values and the benefit of tax deductions in excess of recognized compensation cost are reported in the Consolidated Statements of Cash Flows as a financing activity. The calculated pool of excess tax benefits is recorded as part of additional paid-in capital (APIC).
Cash and Cash Equivalents
We consider highly liquid investments with insignificant interest rate risk and an original maturity of three months or less on the purchase date to be cash equivalents. Eligible instruments under our investment policy that are included in cash equivalents include commercial paper, money market funds, overnight repurchase agreements (repos) with major banks and authorized dealers and other bank obligations.
Marketable and Nonmarketable Securities
We determine the appropriate classification of our marketable securities, which consist primarily of debt securities and variable rate demand obligations, at the time of purchase and reevaluate such designation at each balance sheet date. All of our marketable securities are considered as available-for-sale and carried at estimated fair values and reported in either cash equivalents, short-term marketable securities or long-term marketable securities. Unrealized gains and losses on available-for-sale securities are excluded from net income and reported in accumulated other comprehensive income (loss) as a separate component of stockholders' equity. Other income (expense), net, includes interest, dividends, amortization of purchase premiums and discounts, realized gains and losses on sales of securities and other-than-temporary declines in the fair value of securities, if any. The cost of securities sold is based on the specific identification method. We regularly review all of our investments for other-than-temporary declines in fair value. Our review includes the consideration of the cause of the impairment, including the creditworthiness of the security issuers, the number of securities in an unrealized loss position, the severity and duration of the unrealized losses, whether we have the intent to sell the securities and whether it is more likely than not that we will be required to sell the securities before the recovery of their amortized cost basis. When we determine that the decline in fair value of an investment is below our accounting basis and this decline is other-than-temporary, we reduce the carrying value of the security we hold and record a loss for the amount of such decline.
As a result of entering into collaborations, from time to time, we may hold investments in non-public companies. We record these nonmarketable securities at cost in other long-term assets, less any amounts for other-than-temporary impairment. We regularly review our securities for indicators of impairment. Investments in nonmarketable securities are not material for the periods presented.
92
Concentrations of Risk
We are subject to credit risk from our portfolio of cash equivalents and marketable securities. Under our investment policy, we limit amounts invested in such securities by credit rating, maturity, industry group, investment type and issuer, except for securities issued by the U.S. government. We are not exposed to any significant concentrations of credit risk from these financial instruments. The goals of our investment policy, in order of priority, are as follows: safety and preservation of principal and diversification of risk; liquidity of investments sufficient to meet cash flow requirements; and a competitive after-tax rate of return.
We are also subject to credit risk from our accounts receivable related to our product sales. The majority of our trade accounts receivable arises from product sales in the United States and Europe.
In 2012, we received payment on
$460.6 million
in past due accounts receivable from customers based in Spain. Included in this amount were proceeds from a one-time factoring arrangement where we sold receivables with a carrying value of
$319.8 million
, net of the allowance for doubtful accounts. We received proceeds of
$349.7 million
and recorded a gain of
$29.9 million
, resulting primarily from the reversal of the related allowance for doubtful accounts. This gain was recorded as an offset to selling, general and administrative (SG&A) expenses in our Consolidated Statement of Income. Subsequent to this transaction, we have had no continuing involvement with the transferred receivables, which were derecognized at the time of the sale.
As of
December 31, 2012
, our accounts receivable in Southern Europe, specifically Greece, Italy, Portugal and Spain, totaled approximately
$822.4 million
, of which
$331.6 million
were greater than 120 days past due and
$106.3 million
were greater than 365 days past due. To date, we have not experienced significant losses with respect to the collection of our accounts receivable. We believe that our allowance for doubtful accounts was adequate at
December 31, 2012
.
Certain of the raw materials and components that we utilize in our operations are obtained through single suppliers. Certain of the raw materials that we utilize in our operations are made at only one facility. Since the suppliers of key components and raw materials must be named in a new drug application (NDA) filed with the U.S. Food and Drug Administration (FDA) for a product, significant delays can occur if the qualification of a new supplier is required. If delivery of material from our suppliers were interrupted for any reason, we may be unable to ship our commercial products or to supply any of our product candidates for clinical trials.
Accounts Receivable
Trade accounts receivable are recorded net of allowances for wholesaler chargebacks related to government rebate programs, cash discounts for prompt payment, sales returns and doubtful accounts. Estimates for wholesaler chargebacks for government rebates, cash discounts and sales returns are based on contractual terms, historical trends and our expectations regarding the utilization rates for these programs. Estimates for our allowance for doubtful accounts are determined based on existing contractual payment terms, historical payment patterns of our customers and individual customer circumstances, an analysis of days sales outstanding by geographic region and a review of the local economic environment and its potential impact on government funding and reimbursement practices. Historically, the amounts of uncollectible accounts receivable that have been written off have been insignificant and consistent with management's expectations.
Inventories
Inventories are recorded at the lower of cost or market, with cost determined on a first-in, first-out basis. We periodically review the composition of our inventories in order to identify obsolete, slow-moving or otherwise unsaleable items. If unsaleable items are observed and there are no alternate uses for the inventory, we will record a write-down to net realizable value in the period that the impairment is first recognized.
When future commercialization is considered probable and the future economic benefit is expected to be realized, based on management's judgment, we capitalize pre-launch inventory costs prior to regulatory approval. A number of factors are taken into consideration, including the current status in the regulatory approval process, potential impediments to the approval process such as safety or efficacy, anticipated research and development initiatives that could impact the indication in which the compound will be used, viability of commercialization and marketplace trends. As of
December 31, 2012
and
2011
, the amount of pre-launch inventory on our Consolidated Balance Sheets was not significant.
93
Property, Plant and Equipment
Property, plant and equipment is stated at cost less accumulated depreciation and amortization. Depreciation and amortization are recognized using the straight-line method. Repairs and maintenance costs are expensed as incurred. Estimated useful lives in years are as follows:
|
Description
|
Estimated Useful Life
|
|
Buildings and improvements
|
20-35
|
|
Laboratory and manufacturing equipment
|
4-10
|
|
Office and computer equipment
|
3-7
|
|
Leasehold improvements
|
Shorter of useful life
or lease term |
Office and computer equipment includes capitalized software. We had unamortized capitalized software costs of
$91.0 million
and
$96.0 million
on our Consolidated Balance Sheets as of
December 31, 2012
and
2011
, respectively. Leasehold improvements and capitalized leased equipment are amortized over the shorter of the lease term or the asset's useful life. Amortization of capitalized leased equipment is included in depreciation expense. Capitalized interest on construction in-progress is included in property, plant and equipment. Interest capitalized in
2012
,
2011
and
2010
was not significant.
Goodwill and Intangible Assets
Goodwill represents the excess of the consideration transferred over the estimated fair value of assets acquired and liabilities assumed in a business combination. Intangible assets with indefinite useful lives are related to purchased in-process research and development (IPR&D) projects and are measured at their respective fair values as of the acquisition date. We do not amortize goodwill and intangible assets with indefinite useful lives. We test goodwill and other indefinite-lived intangible assets for impairment on an annual basis and in between annual tests if we become aware of any events or changes that would indicate a reduction in the fair value of the assets below their carrying amounts.
Intangible assets related to IPR&D projects are considered to be indefinite-lived until the completion or abandonment of the associated R&D efforts. During the period the assets are considered indefinite-lived, they will not be amortized but will be tested for impairment on an annual basis as well as between annual tests if we become aware of any events or changes that would indicate a reduction in the fair value of the IPR&D projects below their respective carrying amounts. If and when development is complete, which generally occurs if and when regulatory approval to market a product is obtained, the associated assets would be deemed finite-lived and would then be amortized based on their respective estimated useful lives at that point in time.
Intangible assets with finite useful lives are amortized over their estimated useful lives. Intangible assets with finite useful lives are reviewed for impairment when facts or circumstances suggest that the carrying value of these assets may not be recoverable.
Impairment of Long-Lived Assets
The carrying value of long-lived assets is reviewed on a regular basis for the existence of facts or circumstances both internally and externally that may suggest impairment. Specific potential indicators of impairment include a significant decrease in the fair value of an asset, a significant change in the extent or manner in which an asset is used or a significant physical change in an asset, a significant adverse change in legal factors or in the business climate that affects the value of an asset, an adverse action or assessment by the FDA or another regulator, an accumulation of costs significantly in excess of the amount originally expected to acquire or construct an asset and operating or cash flow losses combined with a history of operating or cash flow losses or a projection or forecast that demonstrates continuing losses associated with an income producing asset.
Should there be an indication of impairment, we will test for recoverability by comparing the estimated undiscounted future cash flows expected to result from the use of the asset or asset group and its eventual disposition to the carrying amount of the asset or asset group. Any excess of the carrying value of the asset or asset group over its estimated fair value will be recognized as an impairment loss.
Valuation of Contingent Consideration Resulting from a Business Combination
In connection with certain acquisitions, we may be required to pay future consideration that is contingent upon the achievement of specified development, regulatory approval or sales-based milestone events. We record contingent consideration resulting from a business combination at its fair value on the acquisition date. Each quarter thereafter, we revalue
94
these obligations and record increases or decreases in their fair value in R&D expense within our Consolidated Statement of Income until such time that the related product candidate receives marketing approval.
Increases or decreases in fair value of the contingent consideration liabilities can result from updates to assumptions such as the expected timing or probability of achieving the specified milestones, changes in projected revenues or changes in discount rates. Significant judgment is employed in determining these assumptions as of the acquisition date and for each subsequent period. Updates to assumptions could have a significant impact on our results of operations in any given period. Actual results may differ from estimates.
Foreign Currency Translation, Transactions and Contracts
Operations in non-U.S. entities are recorded in the functional currency of each entity. For financial reporting purposes, the functional currency of an entity is the currency of the environment in which the entity primarily generates and expends cash. The results of operations for non-U.S. dollar functional currency entities are translated from functional currencies into U.S. dollars using the average currency rate during each month, which approximates the results that would be obtained using actual currency rates on the dates of individual transactions. Assets and liabilities are translated using currency rates at the end of the period. Adjustments resulting from translating the financial statements of our foreign entities into the U.S. dollar are excluded from the determination of net income and are recorded as a component of other comprehensive income (loss) as a separate component of stockholders' equity. Transaction gains and losses are recorded in other income (expense), net on our Consolidated Statements of Income. Net transaction losses totaled
$10.7 million
,
$21.3 million
and
$3.7 million
in
2012
,
2011
and
2010
, respectively.
We hedge a portion of our foreign currency exposures related to outstanding monetary assets and liabilities as well as forecasted product sales using foreign currency exchange forward and option contracts. In general, the market risk related to these contracts is offset by corresponding gains and losses on the hedged transactions. The credit risk associated with these contracts is driven by changes in interest and currency exchange rates and, as a result, varies over time. By working only with major banks and closely monitoring current market conditions, we limit the risk that counterparties to these contracts may be unable to perform. We also limit our risk of loss by entering into contracts that permit net settlement at maturity. Therefore, our overall risk of loss in the event of a counterparty default is limited to the amount of any unrecognized gains on outstanding contracts (i.e., those contracts that have a positive fair value) at the date of default. We do not enter into derivative contracts for trading purposes, nor do we hedge our net investment in any of our foreign subsidiaries.
Fair Value of Financial Instruments
Our financial instruments consist principally of cash and cash equivalents, marketable securities, accounts receivable, foreign currency exchange forward and option contracts, accounts payable and short-term and long-term debt. Cash and cash equivalents, marketable securities and foreign currency exchange contracts that hedge accounts receivable and forecasted sales are reported at their respective fair values on our Consolidated Balance Sheets. The carrying value and fair value of the Convertible Notes were
$2.79 billion
and
$4.97 billion
, respectively, as of
December 31, 2012
. The carrying value and fair value of the Convertible Notes were
$2.92 billion
and
$3.53 billion
, respectively, as of
December 31, 2011
.
In 2011, we issued senior unsecured notes due in April 2021 (April 2021 Notes) in a registered offering for an aggregate principal amount of
$1.00 billion
. The carrying value and fair value of the April 2021 Notes were
$992.9 million
and
$1.15 billion
, respectively, as of
December 31, 2012
. The carrying value and fair value of the April 2021 Notes were
$992.1 million
and
$1.06 billion
, respectively, as of
December 31, 2011
. In 2011, we also issued senior unsecured notes due in December 2014 (December 2014 Notes), December 2016 (December 2016 Notes), December 2021 (December 2021 Notes) and December 2041 (December 2041 Notes) for an aggregate principal amount of
$3.70 billion
. The carrying value and fair value of these notes were
$3.69 billion
and
$4.19 billion
, respectively, as of
December 31, 2012
. The carrying value and fair value of these notes were
$3.69 billion
and
$3.93 billion
, respectively, as of
December 31, 2011
. The fair values of the Convertible Notes and senior unsecured notes were determined using Level 2 inputs based on their quoted market values.
The remaining financial instruments are reported on our Consolidated Balance Sheets at amounts that approximate current fair values.
95
Income Taxes
Our income tax provision is computed under the liability method. Deferred tax assets and liabilities are determined based on the difference between the financial statement and tax basis of assets and liabilities using enacted tax rates in effect for the year in which the differences are expected to reverse. Significant estimates are required in determining our provision for income taxes. Some of these estimates are based on interpretations of existing tax laws or regulations. Various factors may have favorable or unfavorable effects on our income tax rate. These factors include, but are not limited to, interpretations of existing tax laws, changes in tax laws and rates, our portion of the non-tax deductible pharmaceutical excise tax, the accounting for stock options and other share-based payments, mergers and acquisitions, future levels of R&D spending, changes in accounting standards, changes in the mix of earnings in the various tax jurisdictions in which we operate, changes in overall levels of pre-tax earnings and resolution of federal, state and foreign income tax audits. The impact on our income tax provision resulting from the above mentioned factors may be significant and could have a negative impact on our consolidated net income.
We record liabilities related to uncertain tax positions in accordance with the guidance that clarifies the accounting for uncertainty in income taxes recognized in an enterprise's financial statements by prescribing a minimum recognition threshold and measurement attribute for the financial statement recognition and measurement of a tax position taken or expected to be taken in a tax return. We do not believe any such uncertain tax positions currently pending will have a material adverse effect on our Consolidated Financial Statements, although an adverse resolution of one or more of these uncertain tax positions in any period could have a material impact on the results of operations for that period.
Recent Accounting Pronouncement
In July 2012, the Financial Accounting Standards Board issued new accounting guidance intended to simplify the testing of indefinite-lived intangible assets for impairment. Entities will be allowed the option to first perform a qualitative assessment on impairment for indefinite-lived intangible assets to determine whether a quantitative assessment is necessary. This guidance is effective for impairment tests performed in interim and annual periods for fiscal years beginning after September 15, 2012. Early adoption is permitted. We elected to early adopt this guidance as of December 31, 2012 which did not have a material impact on our Consolidated Financial Statements.
|
2.
|
FAIR VALUE MEASUREMENTS
|
We determine the fair value of financial and non-financial assets and liabilities using the fair value hierarchy, which establishes three levels of inputs that may be used to measure fair value, as follows:
|
•
|
Level 1 inputs which include quoted prices in active markets for identical assets or liabilities;
|
|
•
|
Level 2 inputs which include observable inputs other than Level 1 inputs, such as quoted prices for similar assets or liabilities; quoted prices for identical or similar assets or liabilities in markets that are not active; or other inputs that are observable or can be corroborated by observable market data for substantially the full term of the asset or liability. For our marketable securities, we review trading activity and pricing as of the measurement date. When sufficient quoted pricing for identical securities is not available, we use market pricing and other observable market inputs for similar securities obtained from various third-party data providers. These inputs either represent quoted prices for similar assets in active markets or have been derived from observable market data; and
|
|
•
|
Level 3 inputs which include unobservable inputs that are supported by little or no market activity and that are significant to the fair value of the underlying asset or liability. Level 3 assets and liabilities include those whose fair value measurements are determined using pricing models, discounted cash flow methodologies or similar valuation techniques and significant management judgment or estimation.
|
96
The following table summarizes, for assets or liabilities recorded at fair value, the respective fair value and the classification by level of input within the fair value hierarchy defined above (in thousands):
|
|
December 31, 2012
|
December 31, 2011
|
|||||||||||||||||||||||||||||
|
|
Level 1
|
Level 2
|
Level 3
|
Total
|
Level 1
|
Level 2
|
Level 3
|
Total
|
|||||||||||||||||||||||
|
Assets:
|
|
|
|
|
|
|
|
|
|||||||||||||||||||||||
|
Debt securities:
|
|
|
|
|
|
|
|
|
|||||||||||||||||||||||
|
U.S. treasury securities
|
$
|
81,903
|
|
$
|
—
|
|
$
|
—
|
|
$
|
81,903
|
|
$
|
—
|
|
$
|
—
|
|
$
|
—
|
|
$
|
—
|
|
|||||||
|
Money market funds
|
1,416,355
|
|
—
|
|
—
|
|
1,416,355
|
|
7,455,982
|
|
—
|
|
—
|
|
7,455,982
|
|
|||||||||||||||
|
Certificates of deposit
|
—
|
|
—
|
|
—
|
|
—
|
|
—
|
|
1,139,982
|
|
—
|
|
1,139,982
|
|
|||||||||||||||
|
U.S. government agencies securities
|
—
|
|
248,952
|
|
—
|
|
248,952
|
|
—
|
|
—
|
|
—
|
|
—
|
|
|||||||||||||||
|
Municipal debt securities
|
—
|
|
12,088
|
|
—
|
|
12,088
|
|
—
|
|
—
|
|
—
|
|
—
|
|
|||||||||||||||
|
Non-U.S. government securities
|
—
|
|
—
|
|
—
|
|
—
|
|
—
|
|
—
|
|
24,741
|
|
24,741
|
|
|||||||||||||||
|
Corporate debt securities
|
—
|
|
352,718
|
|
—
|
|
352,718
|
|
—
|
|
404,989
|
|
—
|
|
404,989
|
|
|||||||||||||||
|
Residential mortgage and asset-backed securities
|
—
|
|
82,732
|
|
—
|
|
82,732
|
|
—
|
|
—
|
|
—
|
|
—
|
|
|||||||||||||||
|
Student loan-backed securities
|
—
|
|
—
|
|
—
|
|
—
|
|
—
|
|
—
|
|
46,952
|
|
46,952
|
|
|||||||||||||||
|
Total debt securities
|
1,498,258
|
|
696,490
|
|
—
|
|
2,194,748
|
|
7,455,982
|
|
1,544,971
|
|
71,693
|
|
9,072,646
|
|
|||||||||||||||
|
Equity securities
|
—
|
|
—
|
|
—
|
|
—
|
|
8,503
|
|
—
|
|
—
|
|
8,503
|
|
|||||||||||||||
|
Derivatives
|
—
|
|
14,823
|
|
—
|
|
14,823
|
|
—
|
|
100,475
|
|
—
|
|
100,475
|
|
|||||||||||||||
|
|
$
|
1,498,258
|
|
$
|
711,313
|
|
$
|
—
|
|
$
|
2,209,571
|
|
$
|
7,464,485
|
|
$
|
1,645,446
|
|
$
|
71,693
|
|
$
|
9,181,624
|
|
|||||||
|
|
|
|
|
|
|
|
|
|
|
|
|
|
|
|
|
|
|||||||||||||||
|
Liabilities:
|
|
|
|
|
|
|
|
|
|
|
|
|
|
|
|
|
|||||||||||||||
|
Contingent consideration
|
$
|
—
|
|
$
|
—
|
|
$
|
205,060
|
|
$
|
205,060
|
|
$
|
—
|
|
$
|
—
|
|
$
|
135,591
|
|
$
|
135,591
|
|
|||||||
|
Derivatives
|
—
|
|
65,248
|
|
—
|
|
65,248
|
|
—
|
|
5,710
|
|
—
|
|
5,710
|
|
|||||||||||||||
|
|
$
|
—
|
|
$
|
65,248
|
|
$
|
205,060
|
|
$
|
270,308
|
|
$
|
—
|
|
$
|
5,710
|
|
$
|
135,591
|
|
$
|
141,301
|
|
|||||||
Level 2 Inputs
We estimate the fair values of our government related debt, corporate debt, residential mortgage and asset-backed securities by taking into consideration valuations obtained from third-party pricing services. The pricing services utilize industry standard valuation models, including both income- and market-based approaches, for which all significant inputs are observable, either directly or indirectly, to estimate fair value. These inputs include reported trades of and broker/dealer quotes on the same or similar securities; issuer credit spreads; benchmark securities; prepayment/default projections based on historical data; and other observable inputs.
Substantially all of our foreign currency derivatives contracts have maturities primarily over an 18 month time horizon and all are with counterparties that have a minimum credit rating of A- or equivalent by Standard & Poor's, Moody's Investors Service, Inc. or Fitch, Inc. We estimate the fair values of these contracts by taking into consideration valuations obtained from a third-party valuation service that utilizes an income-based industry standard valuation model for which all significant inputs are observable, either directly or indirectly. These inputs include foreign currency rates, London Interbank Offered Rates (LIBOR) and swap rates. These inputs, where applicable, are at commonly quoted intervals.
97
Level 3 Inputs
Assets measured at fair value using Level 3 inputs were comprised of auction rate securities and Greek bonds within our available-for-sale investment portfolio. Our policy is to recognize transfers into or out of Level 3 classification as of the actual date of the event or change in circumstances that caused the transfer. As of December 31, 2012, we held no assets measured using Level 3 inputs. The following table provides a rollforward of the changes in the fair value of our assets measured using Level 3 inputs (in thousands):
|
|
Year Ended December 31,
|
||||||
|
|
2012
|
2011
|
|||||
|
Fair value, beginning of period
|
$
|
71,693
|
|
$
|
80,365
|
|
|
|
Total realized and unrealized gains (losses) included in:
|
|
|
|
|
|||
|
Other income (expense), net
|
(40,096
|
)
|
6,251
|
|
|||
|
Other comprehensive income (loss), net
|
32,630
|
|
(30,376
|
)
|
|||
|
Sales of marketable securities
|
(64,227
|
)
|
(38,430
|
)
|
|||
|
Transfers into Level 3
|
—
|
|
53,883
|
|
|||
|
Fair value, end of period
|
$
|
—
|
|
$
|
71,693
|
|
|
Auction Rate Securities
The underlying assets of our auction rate securities consisted of student loans. Although auction rate securities would typically be measured using Level 2 inputs, the failure of auctions and the lack of market activity and liquidity experienced since the beginning of 2008 required that these securities be measured using Level 3 inputs. The fair value of our auction rate securities was determined using a discounted cash flow model that considered projected cash flows for the issuing trusts, underlying collateral and expected yields. Projected cash flows were estimated based on the underlying loan principal, bonds outstanding and payout formulas. The weighted-average life over which the cash flows were projected considered the collateral composition of the securities and related historical and projected prepayments.
During the third quarter of 2012, we sold our remaining portfolio of auction rate securities. As a result of the sale, we received total proceeds of
$37.3 million
which resulted in a
$3.8 million
loss that was recognized in other income (expense), net on our Consolidated Statement of Income.
As of
December 31, 2011
, our auction rate securities were recorded in long-term marketable securities on our Consolidated Balance Sheets.
Greek Government Bonds
In 2010, the Greek government agreed to settle the majority of its aged outstanding accounts receivable with zero-coupon bonds, which were expected to trade at a discount to face value. We estimated the fair value of the Greek zero-coupon bonds using Level 3 inputs due to the then current lack of market activity and liquidity. The discount rates used in our fair value model for these bonds were based on credit default swap rates. In March 2012, the Greek government restructured its sovereign debt which impacted all holders of Greek bonds. As a result, we recorded a
$40.1 million
loss related to the debt restructuring as part of other income (expense), net on our Consolidated Statement of Income and exchanged the Greek government-issued bonds for new securities, which we liquidated during the first quarter of 2012.
As of
December 31, 2011
, our Greek government-issued bonds were recorded in short-term and long-term marketable securities on our Consolidated Balance Sheet.
Contingent Consideration Liabilities
In connection with certain acquisitions, we may be required to pay future consideration that is contingent upon the achievement of specified development, regulatory approval or sales-based milestone events. We estimate the fair value of the contingent consideration liabilities on the acquisition date and each reporting period thereafter using a probability-weighted income approach, which reflects the probability and timing of future payments. This fair value measurement is based on significant Level 3 inputs such as the anticipated timelines and probability of achieving development, regulatory approval or sales-based milestone events and projected revenues. The resulting probability-weighted cash flows are discounted using credit-risk adjusted interest rates.
Each reporting period thereafter, we revalue these obligations by performing a review of the assumptions listed above and record increases or decreases in the fair value of these contingent consideration obligations in R&D expense within our Consolidated Statements of Income until such time that the related product candidate receives marketing approval. In the
98
absence of any significant changes in key assumptions, the quarterly determination of fair values of these contingent consideration obligations would primarily reflect the passage of time.
Significant judgment is employed in determining Level 3 inputs and fair value measurements as of the acquisition date and for each subsequent period. Updates to assumptions could have a significant impact on our results of operations in any given period and actual results may differ from estimates. For example: significant increases in the probability of achieving a milestone or projected revenues would result in a significantly higher fair value measurement while significant decreases in the estimated probability of achieving a milestone or projected revenues would result in a significantly lower fair value measurement. Significant increases in the discount rate or in the anticipated timelines would result in a significantly lower fair value measurement while significant decreases in the discount rate or anticipated timelines would result in a significantly higher fair value measurement.
The potential contingent consideration payments resulting from development or regulatory approval based milestones related to our CGI Pharmaceuticals, Inc. (CGI) and Calistoga Pharmaceuticals acquisitions range from no payment if none of the milestones are achieved to an estimated maximum of
$254.0 million
(undiscounted), of which we accrued
$159.3 million
as of
December 31, 2012
and
$127.1 million
as of
December 31, 2011
. Potential future payments resulting from the acquisition of Arresto Biosciences, Inc. (Arresto) relate to royalty obligations on future sales once specified sales-based milestones are achieved.
The following table provides a rollforward of our contingent consideration liabilities, which are recorded as part of other long-term obligations in our Consolidated Balance Sheets (in thousands):
|
Year Ended December 31,
|
||||||||
|
2012
|
2011
|
|||||||
|
Balance, beginning of period
|
$
|
135,591
|
|
$
|
11,100
|
|
||
|
Additions from new acquisitions
|
—
|
|
116,008
|
|
||||
|
Net changes in valuation
|
69,469
|
|
8,483
|
|
||||
|
Balance, end of period
|
$
|
205,060
|
|
$
|
135,591
|
|
||
99
|
3.
|
AVAILABLE-FOR-SALE SECURITIES
|
The following table is a summary of available-for-sale debt and equity securities recorded in cash and cash equivalents or marketable securities in our Consolidated Balance Sheets. During the first quarter of 2012, we liquidated a portion of our investment portfolio to partially fund the acquisition of Pharmasset, Inc. (Pharmasset) which was completed in January 2012. Estimated fair values of available-for-sale securities are generally based on prices obtained from commercial pricing services (in thousands):
|
December 31, 2012
|
December 31, 2011
|
|||||||||||||||||||||||||||||||
|
|
Amortized
Cost |
Gross
Unrealized Gains |
Gross
Unrealized Losses |
Estimated
Fair Value |
Amortized
Cost |
Gross
Unrealized Gains |
Gross
Unrealized Losses |
Estimated
Fair Value |
||||||||||||||||||||||||
|
|
|
|
|
|
|
|
|
|||||||||||||||||||||||||
|
Debt securities:
|
|
|
|
|
|
|
|
|
||||||||||||||||||||||||
|
U.S. treasury securities
|
$
|
81,752
|
|
$
|
151
|
|
$
|
—
|
|
$
|
81,903
|
|
$
|
—
|
|
$
|
—
|
|
$
|
—
|
|
$
|
—
|
|
||||||||
|
Money market funds
|
1,416,356
|
|
—
|
|
—
|
|
1,416,356
|
|
7,455,982
|
|
—
|
|
—
|
|
7,455,982
|
|
||||||||||||||||
|
Certificates of deposit
|
—
|
|
—
|
|
—
|
|
—
|
|
1,140,000
|
|
—
|
|
(18
|
)
|
1,139,982
|
|
||||||||||||||||
|
U.S. government agencies securities
|
248,595
|
|
386
|
|
(29
|
)
|
248,952
|
|
—
|
|
—
|
|
—
|
|
—
|
|
||||||||||||||||
|
Municipal debt securities
|
12,062
|
|
33
|
|
(7
|
)
|
12,088
|
|
—
|
|
—
|
|
—
|
|
—
|
|
||||||||||||||||
|
Non-U.S. government securities
|
—
|
|
—
|
|
—
|
|
—
|
|
55,246
|
|
—
|
|
(30,505
|
)
|
24,741
|
|
||||||||||||||||
|
Corporate debt securities
|
351,309
|
|
1,492
|
|
(84
|
)
|
352,717
|
|
404,994
|
|
—
|
|
(5
|
)
|
404,989
|
|
||||||||||||||||
|
Residential mortgage and asset-backed securities
|
82,717
|
|
156
|
|
(141
|
)
|
82,732
|
|
—
|
|
—
|
|
—
|
|
—
|
|
||||||||||||||||
|
Student loan-backed securities
|
—
|
|
—
|
|
—
|
|
—
|
|
51,500
|
|
—
|
|
(4,548
|
)
|
46,952
|
|
||||||||||||||||
|
Total debt securities
|
2,192,791
|
|
2,218
|
|
(261
|
)
|
2,194,748
|
|
9,107,722
|
|
—
|
|
(35,076
|
)
|
9,072,646
|
|
||||||||||||||||
|
Equity securities
|
—
|
|
—
|
|
—
|
|
—
|
|
1,451
|
|
7,052
|
|
—
|
|
8,503
|
|
||||||||||||||||
|
Total
|
$
|
2,192,791
|
|
$
|
2,218
|
|
$
|
(261
|
)
|
$
|
2,194,748
|
|
$
|
9,109,173
|
|
$
|
7,052
|
|
$
|
(35,076
|
)
|
$
|
9,081,149
|
|
||||||||
|
|
|
|
|
|
|
|
|
|
|
|
|
|
|
|
|
|
||||||||||||||||
The following table summarizes the classification of the available-for-sale debt and equity securities on our Consolidated Balance Sheets (in thousands):
|
|
December 31, 2012
|
December 31, 2011
|
|||||
|
Cash and cash equivalents
|
$
|
1,416,356
|
|
$
|
9,000,954
|
|
|
|
Short-term marketable securities
|
58,556
|
|
16,491
|
|
|||
|
Long-term marketable securities
|
719,836
|
|
63,704
|
|
|||
|
Total
|
$
|
2,194,748
|
|
$
|
9,081,149
|
|
|
Cash and cash equivalents in the table above exclude cash of
$387.3 million
and
$882.8 million
as of December 31, 2012 and 2011, respectively.
100
The following table summarizes our portfolio of available-for-sale debt securities by contractual maturity (in thousands):
|
|
December 31, 2012
|
December 31, 2011
|
||||||||||||||
|
|
Amortized Cost
|
Fair Value
|
Amortized Cost
|
Fair Value
|
||||||||||||
|
Less than one year
|
$
|
1,474,872
|
|
$
|
1,474,912
|
|
$
|
9,030,122
|
|
$
|
9,017,445
|
|
||||
|
Greater than one year but less than five years
|
684,105
|
|
685,950
|
|
26,100
|
|
8,249
|
|
||||||||
|
Greater than five years but less than ten years
|
17,148
|
|
17,213
|
|
—
|
|
—
|
|
||||||||
|
Greater than ten years
|
16,666
|
|
16,673
|
|
51,500
|
|
46,952
|
|
||||||||
|
Total
|
$
|
2,192,791
|
|
$
|
2,194,748
|
|
$
|
9,107,722
|
|
$
|
9,072,646
|
|
||||
To conform to the current presentation, we reclassified
$7.46 billion
of the amortized cost and fair value balances as of December 31, 2011 from greater than ten years to less than one year contractual maturity.
The following table summarizes the gross realized gains and losses related to sales of marketable securities (in thousands):
|
|
Year Ended December 31,
|
|||||||||||
|
|
2012
|
2011
|
2010
|
|||||||||
|
Gross realized gains on sales
|
$
|
10,451
|
|
$
|
42,849
|
|
$
|
13,254
|
|
|||
|
Gross realized losses on sales
|
$
|
(44,308
|
)
|
$
|
(12,526
|
)
|
$
|
(3,657
|
)
|
|||
The cost of securities sold was determined based on the specific identification method.
101
The following table summarizes our available-for-sale debt securities that were in a continuous unrealized loss position, but were not deemed to be other-than-temporarily impaired (in thousands):
|
|
Less Than 12 Months
|
12 Months or Greater
|
Total
|
|||||||||||||||||||||
|
|
Gross
Unrealized Losses |
Estimated
Fair Value |
Gross
Unrealized Losses |
Estimated
Fair Value |
Gross
Unrealized Losses |
Estimated
Fair Value |
||||||||||||||||||
|
December 31, 2012
|
|
|
|
|
|
|
||||||||||||||||||
|
Debt securities:
|
|
|
|
|
|
|
||||||||||||||||||
|
U.S. treasury securities
|
$
|
—
|
|
$
|
—
|
|
$
|
—
|
|
$
|
—
|
|
$
|
—
|
|
$
|
—
|
|
||||||
|
U.S. government agencies securities
|
(29
|
)
|
26,306
|
|
—
|
|
—
|
|
(29
|
)
|
26,306
|
|
||||||||||||
|
Municipal debt securities
|
(7
|
)
|
3,993
|
|
—
|
|
—
|
|
(7
|
)
|
3,993
|
|
||||||||||||
|
Non-U.S. government securities
|
—
|
|
—
|
|
—
|
|
—
|
|
—
|
|
—
|
|
||||||||||||
|
Corporate debt securities
|
(84
|
)
|
72,722
|
|
—
|
|
—
|
|
(84
|
)
|
72,722
|
|
||||||||||||
|
Certificates of deposit
|
—
|
|
—
|
|
—
|
|
—
|
|
—
|
|
—
|
|
||||||||||||
|
Residential mortgage and asset-backed securities
|
(141
|
)
|
36,415
|
|
—
|
|
—
|
|
(141
|
)
|
36,415
|
|
||||||||||||
|
Student loan-backed securities
|
—
|
|
—
|
|
—
|
|
—
|
|
—
|
|
—
|
|
||||||||||||
|
Total
|
$
|
(261
|
)
|
$
|
139,436
|
|
$
|
—
|
|
$
|
—
|
|
$
|
(261
|
)
|
$
|
139,436
|
|
||||||
|
|
|
|
|
|
|
|
|
|
|
|
|
|
||||||||||||
|
December 31, 2011
|
|
|
|
|
|
|
|
|
|
|
|
|
||||||||||||
|
Debt securities:
|
|
|
|
|
|
|
|
|
|
|
|
|
||||||||||||
|
U.S. treasury securities
|
$
|
—
|
|
$
|
—
|
|
$
|
—
|
|
$
|
—
|
|
$
|
—
|
|
$
|
—
|
|
||||||
|
U.S. government agencies securities
|
—
|
|
—
|
|
—
|
|
—
|
|
—
|
|
—
|
|
||||||||||||
|
Municipal debt securities
|
—
|
|
—
|
|
—
|
|
—
|
|
—
|
|
—
|
|
||||||||||||
|
Non-U.S. government securities
|
(30,505
|
)
|
24,741
|
|
—
|
|
—
|
|
(30,505
|
)
|
24,741
|
|
||||||||||||
|
Corporate debt securities
|
(5
|
)
|
224,989
|
|
—
|
|
—
|
|
(5
|
)
|
224,989
|
|
||||||||||||
|
Certificates of deposit
|
(18
|
)
|
1,019,982
|
|
—
|
|
—
|
|
(18
|
)
|
1,019,982
|
|
||||||||||||
|
Residential mortgage and asset-backed securities
|
—
|
|
—
|
|
—
|
|
—
|
|
—
|
|
—
|
|
||||||||||||
|
Student loan-backed securities
|
—
|
|
—
|
|
(4,548
|
)
|
46,952
|
|
(4,548
|
)
|
46,952
|
|
||||||||||||
|
Total
|
$
|
(30,528
|
)
|
$
|
1,269,712
|
|
$
|
(4,548
|
)
|
$
|
46,952
|
|
$
|
(35,076
|
)
|
$
|
1,316,664
|
|
||||||
As of
December 31, 2012
and
2011
, we held a total of
47
and
42
securities, respectively, that were in an unrealized loss position. Based on our review of these securities, we believe we had no other-than-temporary impairments on these securities as of December 31, 2012 and 2011 because we do not intend to sell these securities and it is not more likely than not that we will be required to sell these securities before the recovery of their amortized cost basis.
|
4.
|
DERIVATIVE FINANCIAL INSTRUMENTS
|
We operate in foreign countries, which exposes us to market risk associated with foreign currency exchange rate fluctuations between the U.S. dollar and various foreign currencies, the most significant of which is the Euro. In order to manage this risk, we may hedge a portion of our foreign currency exposures related to outstanding monetary assets and liabilities as well as forecasted product sales using foreign currency exchange forward or option contracts. In general, the market risk related to these contracts is offset by corresponding gains and losses on the hedged transactions. The credit risk associated with these contracts is driven by changes in interest and currency exchange rates and, as a result, varies over time. By working only with major banks and closely monitoring current market conditions, we limit the risk that counterparties to these contracts may be unable to perform. We also limit our risk of loss by entering into contracts that permit net settlement at maturity. Therefore, our overall risk of loss in the event of a counterparty default is limited to the amount of any unrecognized gains on outstanding contracts (i.e., those contracts that have a positive fair value) at the date of default. We do not enter into derivative contracts for trading purposes, nor do we hedge our net investment in any of our foreign subsidiaries.
102
We hedge our exposure to foreign currency exchange rate fluctuations for certain monetary assets and liabilities of our foreign subsidiaries that are denominated in a non-functional currency. The derivative instruments we use to hedge this exposure are not designated as hedges, and as a result, changes in their fair value are recorded in other income (expense), net on our Consolidated Statements of Income.
We hedge our exposure to foreign currency exchange rate fluctuations for forecasted product sales that are denominated in a non-functional currency. The derivative instruments we use to hedge this exposure are designated as cash flow hedges and have maturity dates of 18 months or less. Upon executing a hedging contract and quarterly thereafter, we assess prospective hedge effectiveness using a regression analysis which calculates the change in cash flow as a result of the hedge instrument. On a monthly basis, we assess retrospective hedge effectiveness using a dollar offset approach. We exclude time value from our effectiveness testing and recognize changes in the time value of the hedge in other income (expense), net. The effective component of our hedge is recorded as an unrealized gain or loss on the hedging instrument in accumulated other comprehensive income (OCI) within stockholders' equity. When the hedged forecasted transaction occurs, the hedge is de-designated and the unrealized gains or losses are reclassified into product sales. The majority of gains and losses related to the hedged forecasted transactions reported in accumulated OCI at
December 31, 2012
will be reclassified to product sales within 12 months. The cash flow effects of our derivatives contracts for the three years ended December 31, 2012 are included within net cash provided by operating activities in the Consolidated Statements of Cash Flows.
We had notional amounts on foreign currency exchange contracts outstanding of
$3.39 billion
and
$4.03 billion
at
December 31, 2012
and
2011
, respectively.
The following table summarizes information about the fair values of derivative instruments on our Consolidated Balance Sheets (in thousands):
|
|
December 31, 2012
|
|||||||||||
|
|
Asset Derivatives
|
Liability Derivatives
|
||||||||||
|
|
Classification
|
Fair Value
|
Classification
|
Fair Value
|
||||||||
|
Derivatives designated as hedges:
|
|
|
|
|
||||||||
|
Foreign currency exchange contracts
|
Other current assets
|
$
|
14,556
|
|
Other accrued liabilities
|
$
|
54,597
|
|
||||
|
Foreign currency exchange contracts
|
Other long-term assets
|
142
|
|
Other long-term obligations
|
10,630
|
|
||||||
|
Total derivatives designated as hedges
|
|
14,698
|
|
|
65,227
|
|
||||||
|
Derivatives not designated as hedges:
|
|
|
|
|
|
|
||||||
|
Foreign currency exchange contracts
|
Other current assets
|
125
|
|
Other accrued liabilities
|
21
|
|
||||||
|
Total derivatives not designated as hedges
|
|
125
|
|
|
21
|
|
||||||
|
Total derivatives
|
|
$
|
14,823
|
|
|
$
|
65,248
|
|
||||
103
|
|
December 31, 2011
|
|||||||||||
|
|
Asset Derivatives
|
Liability Derivatives
|
||||||||||
|
|
Classification
|
Fair Value
|
Classification
|
Fair Value
|
||||||||
|
Derivatives designated as hedges:
|
|
|
|
|
||||||||
|
Foreign currency exchange contracts
|
Other current assets
|
$
|
77,066
|
|
Other accrued liabilities
|
$
|
5,052
|
|
||||
|
Foreign currency exchange contracts
|
Other long-term assets
|
23,169
|
|
Other long-term obligations
|
620
|
|
||||||
|
Total derivatives designated as hedges
|
|
100,235
|
|
|
5,672
|
|
||||||
|
Derivatives not designated as hedges:
|
|
|
|
|
|
|
||||||
|
Foreign currency exchange contracts
|
Other current assets
|
240
|
|
Other accrued liabilities
|
38
|
|
||||||
|
Total derivatives not designated as hedges
|
|
240
|
|
|
38
|
|
||||||
|
Total derivatives
|
|
$
|
100,475
|
|
|
$
|
5,710
|
|
||||
The following table summarizes the effect of our foreign currency exchange contracts on our Consolidated Statements of Income (in thousands):
|
|
Year Ended December 31,
|
|||||||||||
|
|
2012
|
2011
|
2010
|
|||||||||
|
Derivatives designated as hedges:
|
|
|
||||||||||
|
Net gains (losses) recognized in OCI (effective portion)
|
$
|
(62,258
|
)
|
$
|
1,664
|
|
$
|
115,073
|
|
|||
|
Net gains (losses) reclassified from accumulated OCI into product sales (effective portion)
|
$
|
88,807
|
|
$
|
(78,647
|
)
|
$
|
73,720
|
|
|||
|
Gains (losses) recognized in other income (expense), net (ineffective portion and amounts excluded from effectiveness testing)
|
$
|
(8,444
|
)
|
$
|
(17,237
|
)
|
$
|
887
|
|
|||
|
Derivatives not designated as hedges:
|
|
|
|
|
|
|
||||||
|
Net gains (losses) recognized in other income (expense), net
|
$
|
(1,099
|
)
|
$
|
22,084
|
|
$
|
66,639
|
|
|||
There were no material amounts recorded in other income (expense), net for the years ended
December 31, 2012
and
2011
as a result of the discontinuance of cash flow hedges.
The balance of accumulated other comprehensive income (loss), net of taxes, as reported on our Consolidated Balance Sheets consists of the following components (in thousands):
|
|
December 31,
|
|||||||
|
|
2012
|
2011
|
||||||
|
Net unrealized gain (loss) on available-for-sale securities
|
$
|
7,502
|
|
$
|
(26,748
|
)
|
||
|
Net unrealized gain (loss) on cash flow hedges
|
(51,697
|
)
|
97,444
|
|
||||
|
Cumulative foreign currency translation adjustment
|
(1,420
|
)
|
(12,496
|
)
|
||||
|
Accumulated other comprehensive income (loss)
|
$
|
(45,615
|
)
|
$
|
58,200
|
|
||
|
5.
|
ACQUISITIONS
|
Pharmasset, Inc.
In January 2012, we completed the acquisition of Pharmasset, a publicly-held clinical-stage pharmaceutical company committed to discovering, developing and commercializing novel drugs to treat viral infections. Pharmasset's primary focus was the development of oral therapeutics for the treatment of HCV infection. Pharmasset's lead compound, now known as sofosbuvir (formally referred to as GS-7977), is a nucleotide analog which, as of January 2012, was being evaluated in Phase 2 and Phase 3 clinical studies for the treatment of HCV infection across genotypes. We believe the acquisition of Pharmasset provides us with an opportunity to complement our existing HCV portfolio and helps advance our effort to develop all-oral regimens for the treatment of HCV.
104
We acquired all of the outstanding shares of common stock of Pharmasset for
$137
per share in cash through a tender offer and subsequent merger under the terms of an agreement and plan of merger entered into in November 2011. The aggregate cash payment to acquire all of the outstanding shares of common stock was
$11.05 billion
. We financed the transaction with approximately
$5.20 billion
in cash on hand,
$3.70 billion
in senior unsecured notes issued in December 2011 and
$2.20 billion
in bank debt issued in January 2012.
The Pharmasset acquisition was accounted for as a business combination. The results of operations of Pharmasset have been included in our Consolidated Statement of Income since
January 13, 2012
, the date on which we acquired approximately
88%
of the outstanding shares of common stock of Pharmasset, cash consideration was transferred, and as a result, we obtained effective control of Pharmasset. The acquisition was completed on January 17, 2012, at which time Pharmasset became a wholly-owned subsidiary of Gilead and was integrated into our operations. As we do not track earnings results by product candidate or therapeutic area, we do not maintain separate earnings results for the acquired Pharmasset business.
The following table summarizes the components of the cash paid to acquire Pharmasset (in thousands):
|
Total consideration transferred
|
$
|
10,858,372
|
|
|
|
Stock-based compensation expense
|
193,937
|
|
||
|
Total cash paid
|
$
|
11,052,309
|
|
|
The
$11.05 billion
cash payment consisted of a
$10.38 billion
cash payment to the outstanding common stockholders as well as a
$668.3 million
cash payment to option holders under the Pharmasset stock option plans. The
$10.38 billion
cash payment to the outstanding common stockholders and
$474.3 million
of the cash payment to vested option holders under the Pharmasset stock option plans were accounted for as consideration transferred. The remaining
$193.9 million
of cash payment was accounted for as stock-based compensation expense resulting from the accelerated vesting of Pharmasset employee options immediately prior to the acquisition.
The following table summarizes the acquisition date fair values of assets acquired and liabilities assumed, and the consideration transferred (in thousands):
|
Identifiable intangible assets
|
$
|
10,738,000
|
|
|
|
Cash and cash equivalents
|
106,737
|
|
||
|
Other assets acquired (liabilities assumed), net
|
(43,182
|
)
|
||
|
Total identifiable net assets
|
10,801,555
|
|
||
|
Goodwill
|
56,817
|
|
||
|
Total consideration transferred
|
$
|
10,858,372
|
|
|
Identifiable Intangible Assets
We acquired intangible assets, primarily comprised of the sofosbuvir IPR&D compound, which had an estimated fair value of
$10.72 billion
as of the date of acquisition. The fair value of the asset was determined using a probability-weighted income approach that discounts expected future cash flows to present value. The estimated net cash flows were discounted using a discount rate of
12%
, which is based on the estimated weighted-average cost of capital for companies with profiles similar to that of Pharmasset. This rate is comparable to the estimated internal rate of return for the acquisition and represents the rate that market participants would use to value the intangible asset. The projected cash flow from sofosbuvir was based on key assumptions such as: estimates of revenues and operating profits related to each project considering its stage of development on the acquisition date; the time and resources needed to complete the development and approval of the product candidate; the life of the potential commercialized product and associated risks, including the inherent difficulties and uncertainties in developing a product candidate such as obtaining marketing approval from the FDA and other regulatory agencies; and risks related to the viability of and potential alternative treatments in any future target markets. Intangible assets related to IPR&D projects are considered to be indefinite-lived assets until the completion or abandonment of the associated R&D efforts.
Goodwill
The
$56.8 million
of goodwill represents the excess of the consideration transferred over the fair values of assets acquired and liabilities assumed and is attributable to the synergies expected from combining our R&D operations with Pharmasset's. None of the goodwill is expected to be deductible for income tax purposes.
105
Stock-Based Compensation Expense
The stock-based compensation expense recognized for the accelerated vesting of employee options immediately prior to the acquisition was reported in our Consolidated Statement of Income as follows (in thousands):
|
Year Ended
|
||||
|
December 31, 2012
|
||||
|
Research and development expense
|
$
|
100,149
|
|
|
|
Selling, general and administrative expense
|
93,788
|
|
||
|
Total stock-based compensation expense
|
$
|
193,937
|
|
|
Other Costs
Other costs incurred in connection with the acquisition include (in thousands):
|
Year Ended December 31,
|
||||||||
|
2012
|
2011
|
|||||||
|
Transaction costs (e.g. investment advisory, legal and accounting fees)
|
$
|
10,635
|
|
$
|
28,461
|
|
||
|
Bridge financing costs
|
7,333
|
|
23,817
|
|
||||
|
Restructuring costs
|
15,125
|
|
—
|
|
||||
|
Total other costs
|
$
|
33,093
|
|
$
|
52,278
|
|
||
The following table summarizes these costs by the line item in the Consolidated Statement of Income in which these costs were recognized (in thousands).
|
Year Ended December 31,
|
||||||||
|
2012
|
2011
|
|||||||
|
Research and development expense
|
$
|
7,906
|
|
$
|
—
|
|
||
|
Selling, general and administrative expense
|
17,854
|
|
28,461
|
|
||||
|
Interest expense
|
7,333
|
|
23,817
|
|
||||
|
Total other costs
|
$
|
33,093
|
|
$
|
52,278
|
|
||
Pro Forma Information
The following unaudited pro forma information presents the combined results of operations of Gilead and Pharmasset as if the acquisition of Pharmasset had been completed on January 1, 2011, with adjustments to give effect to pro forma events that are directly attributable to the acquisition. The unaudited pro forma results do not reflect any operating efficiencies or potential cost savings which may result from the consolidation of the operations of Gilead and Pharmasset. Accordingly, these unaudited pro forma results are presented for informational purposes only and are not necessarily indicative of what the actual results of operations of the combined company would have been if the acquisition had occurred at the beginning of the period presented, nor are they indicative of future results of operations (in thousands):
|
Year Ended December 31,
|
||||||||
|
2012
|
2011
|
|||||||
|
Total revenues
|
$
|
9,702,517
|
|
$
|
8,385,385
|
|
||
|
Net income attributable to Gilead
|
$
|
2,745,911
|
|
$
|
2,389,364
|
|
||
The unaudited pro forma consolidated results include non-recurring pro forma adjustments that assume the acquisition occurred on January 1, 2011. Stock-based compensation expenses of
$193.9 million
incurred in 2012 were included in the net income attributable to Gilead for the year ended
December 31, 2011
. Other costs of
$18.0 million
incurred during the year ended December 31, 2012 were included in the net income attributable to Gilead for the year ended
December 31, 2011
.
106
Calistoga Pharmaceuticals, Inc.
In February 2011, we entered into an agreement to acquire Calistoga for
$375.0 million
plus potential payments of up to
$225.0 million
based on the achievement of certain milestones. This transaction closed on
April 1, 2011
, at which time Calistoga became a wholly-owned subsidiary. Calistoga was a privately-held, biotechnology company based in Seattle, Washington, focused on the development of medicines to treat cancer and inflammatory diseases. This acquisition has provided us with a portfolio of proprietary compounds that selectively target isoforms of phosphoinositide-3 kinase (PI3K). The lead product candidate, idelalisib (formerly referred to as GS-1101), is a first-in-class specific inhibitor of the PI3K delta isoform. PI3K delta is preferentially expressed in leukocytes involved in a variety of inflammatory and autoimmune diseases and hematological cancers.
The acquisition was accounted for as a business combination. Calistoga's results of operations since
April 1, 2011
have been included in our Consolidated Statement of Income and were not significant.
The acquisition-date fair value of the total consideration transferred to acquire Calistoga was
$484.3 million
, and consisted of cash paid at or prior to closing of
$373.7 million
and contingent consideration of
$110.6 million
.
The following table summarizes the fair values of the assets acquired and liabilities assumed at
April 1, 2011
(in thousands):
|
IPR&D
|
$
|
149,200
|
|
|
|
Other net liabilities assumed
|
(1,853
|
)
|
||
|
Total identifiable assets
|
$
|
147,347
|
|
|
|
Goodwill
|
336,951
|
|
||
|
Total consideration transferred
|
$
|
484,298
|
|
|
IPR&D
Intangible assets associated with IPR&D projects relate to the idelalisib product candidate. Management determined that the estimated acquisition-date fair value of intangible assets related to IPR&D was
$149.2 million
. The estimated fair value was determined using the income approach, which discounts expected future cash flows to present value. We estimated the fair value using a present value discount rate of
11%
, which considers both the estimated weighted-average cost of capital for companies with profiles substantially similar to that of Calistoga, as well as the acquirer's estimated weighted-average cost of capital. We believe this is appropriate given the unique characteristics of this acquisition which included a competitive bidding process. This rate is comparable to the estimated internal rate of return for the acquisition and represents the rate that market participants would use to value the intangible assets. The projected cash flows from the IPR&D projects were based on key assumptions such as: estimates of revenues and operating profits related to each project considering its stage of development on the acquisition date; the time and resources needed to complete the development and approval of the product candidate; the life of the potential commercialized product and associated risks, including the inherent difficulties and uncertainties in developing a product candidate such as obtaining marketing approval from the FDA and other regulatory agencies; and risks related to the viability of and potential alternative treatments in any future target markets. Intangible assets related to IPR&D projects are considered to be indefinite-lived until the completion or abandonment of the associated R&D efforts.
Goodwill
The excess of the consideration transferred over the fair values assigned to the assets acquired and liabilities assumed is
$337.0 million
, which represents the goodwill amount resulting from the Calistoga acquisition. Management believes that the goodwill mainly represents the synergies expected from combining our R&D operations as well as acquiring Calistoga's assembled workforce and other intangible assets that do not qualify for separate recognition.
We do not consider the Calistoga acquisition to be a material business combination and therefore have not disclosed the pro forma results of operations as required for material business combinations.
107
Arresto Biosciences, Inc.
In December 2010, we entered into an agreement to acquire Arresto for
$225.0 million
plus potential future payments based on the achievement of certain sales targets. This transaction closed on
January 14, 2011
, at which time Arresto became a wholly-owned subsidiary. Arresto was a privately-held, development-stage biotechnology company based in Palo Alto, California, focused on developing antibodies for the potential treatment of fibrotic diseases and cancer. The lead product from the acquisition of Arresto was simtuzumab (formerly referred to as GS-6224), a humanized monoclonal antibody (mAb) targeting the human lysyl oxidase-like-2 (LOXL2) protein. In addition to an ongoing Phase 1 study of simtuzumab in patients with advanced solid tumors at the time of the acquisition, a Phase 1 study had also been initiated to evaluate simtuzumab in patients with idiopathic pulmonary fibrosis.
The acquisition was accounted for as a business combination. Arresto's results of operations since
January 14, 2011
have been included in our Consolidated Statement of Income and were not significant.
The acquisition-date fair value of the total consideration transferred to acquire Arresto was
$227.1 million
, and consisted of cash paid at or prior to closing of
$221.7 million
and contingent consideration of
$5.4 million
.
The following table summarizes the fair values of the assets acquired and liabilities assumed at
January 14, 2011
(in thousands):
|
IPR&D
|
$
|
117,000
|
|
|
|
Deferred tax assets
|
17,417
|
|
||
|
Deferred tax liabilities
|
(41,705
|
)
|
||
|
Other net liabilities assumed
|
(125
|
)
|
||
|
Total identifiable net assets
|
$
|
92,587
|
|
|
|
Goodwill
|
134,482
|
|
||
|
Total consideration transferred
|
$
|
227,069
|
|
|
IPR&D
Intangible assets associated with IPR&D projects relate to the simtuzumab product candidate. Management determined that the estimated acquisition-date fair value of intangible assets related to IPR&D was
$117.0 million
. The estimated fair value was determined using the income approach, which discounts expected future cash flows to present value. We estimated the fair value using a present value discount rate of
16%
, which is based on the estimated weighted-average cost of capital for companies with profiles substantially similar to that of Arresto. This is comparable to the estimated internal rate of return for the acquisition and represents the rate that market participants would use to value the intangible assets. The projected cash flows from the IPR&D projects were based on key assumptions such as: estimates of revenues and operating profits related to each project considering its stage of development on the acquisition date; the time and resources needed to complete the development and approval of the product candidate; the life of the potential commercialized product and associated risks, including the inherent difficulties and uncertainties in developing a product candidate such as obtaining marketing approval from the FDA and other regulatory agencies; and risks related to the viability of and potential alternative treatments in any future target markets. Intangible assets related to IPR&D projects will be considered to be indefinite-lived until the completion or abandonment of the associated R&D efforts.
Goodwill
The excess of the consideration transferred over the fair values assigned to the assets acquired and liabilities assumed is
$134.5 million
, which represents the goodwill amount resulting from the Arresto acquisition. Management believes that the goodwill mainly represents the synergies expected from combining our R&D operations as well as acquiring Arresto's assembled workforce and other intangible assets that do not qualify for separate recognition.
We do not consider the Arresto acquisition to be a material business combination and therefore have not disclosed the pro forma results of operations as required for material business combinations.
108
CGI Pharmaceuticals, Inc.
In June 2010, we entered into an agreement to acquire CGI for up to
$120.0 million
in cash, consisting of
$91.0 million
as an upfront payment and up to
$29.0 million
of contingent consideration payable based on the achievement of clinical development milestones. This transaction closed on
July 8, 2010
, at which time CGI became a wholly-owned subsidiary. CGI was a privately-held development stage pharmaceutical company based in Branford, Connecticut, primarily focused on small molecule chemistry and protein kinase biology. The lead preclinical compound from CGI's library of proprietary small molecule kinase inhibitors targets spleen tyrosine kinase (Syk) and could have unique applications for the treatment of serious inflammatory diseases, including rheumatoid arthritis.
The CGI acquisition was accounted for as a business combination. The results of operations of CGI since
July 8, 2010
have been included in our Consolidated Statements of Income and were not significant.
The acquisition-date fair value of the total consideration transferred to acquire CGI was
$102.1 million
and consisted of cash paid at or prior to closing of
$91.0 million
and contingent consideration of
$11.1 million
.
The following table summarizes the fair values of the assets acquired and liabilities assumed at
July 8, 2010
(in thousands):
|
IPR&D
|
$
|
26,630
|
|
|
|
Deferred tax assets
|
12,656
|
|
||
|
Deferred tax liabilities
|
(6,313
|
)
|
||
|
Other net liabilities assumed
|
(984
|
)
|
||
|
Total identifiable net assets
|
31,989
|
|
||
|
Goodwill
|
70,111
|
|
||
|
Total consideration transferred
|
$
|
102,100
|
|
|
IPR&D
Intangible assets associated with IPR&D projects relate to the preclinical Syk product candidate. Management estimated the acquisition-date fair value of intangible assets related to IPR&D to be
$26.6 million
. The estimated fair value was determined using the income approach, which discounts expected future cash flows to present value. We estimated the fair value using a present value discount rate of
18%
, which is based on the estimated weighted-average cost of capital for companies with profiles substantially similar to that of CGI. This is comparable to the estimated internal rate of return for CGI's operations and represents the rate that market participants would use to value the intangible assets. The projected cash flows from the IPR&D project was based on key assumptions such as: estimates of revenues and operating profits related to the project considering its stage of development; the time and resources needed to complete the development and approval of the product candidate; the life of the potential commercialized product and associated risks, including the inherent difficulties and uncertainties in developing a drug compound such as obtaining marketing approval from the FDA and other regulatory agencies; and risks related to the viability of and potential alternative treatments in any future target markets. Intangible assets related to IPR&D projects are considered to be indefinite-lived until the completion or abandonment of the associated R&D efforts.
During the fourth quarter of 2011, we recorded
$26.6 million
of impairment charges in R&D expense related to the Syk IPR&D asset acquired from CGI. These impairment charges were a result of changes in the anticipated market share related to the Syk compound.
Goodwill
The excess of the consideration transferred over the fair values assigned to the assets acquired and liabilities assumed is
$70.1 million
, which represents the goodwill amount resulting from the CGI acquisition. Management believes that the goodwill mainly represents the synergies expected from combining our R&D operations as well as acquiring CGI's assembled workforce and other intangible assets that do not qualify for separate recognition.
109
|
6.
|
INVENTORIES
|
Inventories are summarized as follows (in thousands):
|
|
December 31,
|
|||||||
|
|
2012
|
2011
|
||||||
|
Raw materials
|
$
|
826,545
|
|
$
|
697,621
|
|
||
|
Work in process
|
358,525
|
|
466,499
|
|
||||
|
Finished goods
|
559,912
|
|
225,863
|
|
||||
|
Total
|
$
|
1,744,982
|
|
$
|
1,389,983
|
|
||
As of
December 31, 2012
and
2011
, the joint ventures formed by Gilead and BMS (See Note 9), which are included in our Consolidated Financial Statements, held
$1.26 billion
and
$995.7 million
in inventory, respectively, of efavirenz active pharmaceutical ingredient which was purchased from BMS at BMS's estimated net selling price of efavirenz.
|
7.
|
PROPERTY, PLANT AND EQUIPMENT
|
Property, plant and equipment are summarized as follows (in thousands):
|
|
December 31,
|
|||||||
|
|
2012
|
2011
|
||||||
|
Property, plant and equipment, net:
|
|
|
||||||
|
Buildings and improvements (including leasehold improvements)
|
$
|
670,470
|
|
$
|
500,040
|
|
||
|
Laboratory and manufacturing equipment
|
205,097
|
|
199,693
|
|
||||
|
Office and computer equipment
|
233,987
|
|
211,936
|
|
||||
|
Capitalized leased equipment
|
1,758
|
|
10,878
|
|
||||
|
Construction in progress
|
216,434
|
|
60,746
|
|
||||
|
Subtotal
|
1,327,746
|
|
983,293
|
|
||||
|
Less accumulated depreciation and amortization (including $1,525 and $10,546 relating to capitalized leased equipment for 2012 and 2011, respectively)
|
(423,300
|
)
|
(358,263
|
)
|
||||
|
Subtotal
|
904,446
|
|
625,030
|
|
||||
|
Land
|
195,813
|
|
149,376
|
|
||||
|
Total
|
$
|
1,100,259
|
|
$
|
774,406
|
|
||
In November 2012, we acquired land and an office building totaling approximately
294,000
square feet located in Foster City, California, for an aggregate purchase price of
$192.8 million
.
Construction in progress increased by
$155.7 million
in 2012 compared to 2011 due primarily to a new lab building that is expected to be completed in 2013.
|
8.
|
INTANGIBLE ASSETS AND GOODWILL
|
The following table summarizes the carrying amount of our intangible assets and goodwill (in thousands):
|
|
December 31,
|
|||||||
|
|
2012
|
2011
|
||||||
|
Indefinite-lived intangible assets
|
$
|
10,986,200
|
|
$
|
266,200
|
|
||
|
Finite-lived intangible assets
|
750,193
|
|
796,664
|
|
||||
|
Total intangible assets
|
11,736,393
|
|
1,062,864
|
|
||||
|
Goodwill
|
1,060,919
|
|
1,004,102
|
|
||||
|
Total intangible assets and goodwill
|
$
|
12,797,312
|
|
$
|
2,066,966
|
|
||
Indefinite-Lived Intangible Assets
As of
December 31, 2012
, we had indefinite-lived intangible assets of
$10.99 billion
which consisted primarily of the purchased IPR&D from our acquisition of Pharmasset (see Note 5).
110
As of
December 31, 2011
, we had indefinite-lived intangible assets of
$266.2 million
which consisted of
$117.0 million
and
$149.2 million
of purchased IPR&D from our acquisitions of Arresto and Calistoga, respectively. During 2011, using a probability-weighted income approach to estimate the current fair value, we recorded
$26.6 million
of impairment charges related to certain IPR&D assets acquired from CGI. These impairment charges were a result of changes in the anticipated market share related to the Syk compound and were included in R&D expense in our Consolidated Statement of Income. In 2011, the
$2.9 million
purchased IPR&D project from CV Therapeutics, Inc. in 2009 was completed and reclassified as a finite-lived intangible asset, and is currently being amortized over its estimated useful life.
Finite-Lived Intangible Assets
The following table summarizes our finite-lived intangible assets (in thousands):
|
|
December 31, 2012
|
December 31, 2011
|
||||||||||||||
|
|
Gross Carrying
Amount
|
Accumulated
Amortization
|
Gross Carrying
Amount
|
Accumulated
Amortization
|
||||||||||||
|
Intangible asset - Ranexa
|
$
|
688,400
|
|
$
|
133,119
|
|
$
|
688,400
|
|
$
|
97,099
|
|
||||
|
Intangible asset - Lexiscan
|
262,800
|
|
95,466
|
|
262,800
|
|
69,723
|
|
||||||||
|
Other
|
42,995
|
|
15,417
|
|
24,995
|
|
12,709
|
|
||||||||
|
Total
|
$
|
994,195
|
|
$
|
244,002
|
|
$
|
976,195
|
|
$
|
179,531
|
|
||||
Amortization expense related to finite-lived intangible assets included in cost of goods sold in our Consolidated Statement of Income totaled
$63.3 million
,
$69.6 million
and
$59.9 million
for the years ended
December 31, 2012
,
2011
and
2010
, respectively. The weighted-average amortization period for these intangible assets is approximately
11
years. As of
December 31, 2012
, the estimated future amortization expense associated with our intangible assets for each of the five succeeding fiscal years is as follows (in thousands):
|
Fiscal Year
|
Amount
|
||
|
2013
|
$
|
86,181
|
|
|
2014
|
92,441
|
|
|
|
2015
|
97,673
|
|
|
|
2016
|
107,312
|
|
|
|
2017
|
116,137
|
|
|
|
Total
|
$
|
499,744
|
|
Goodwill
The following table summarizes the changes in the carrying amount of goodwill (in thousands):
|
Balance at December 31, 2011
|
$
|
1,004,102
|
|
|
Goodwill resulting from the acquisition of Pharmasset
|
56,817
|
|
|
|
Balance at December 31, 2012
|
$
|
1,060,919
|
|
|
9.
|
COLLABORATIVE ARRANGEMENTS
|
From time to time, as a result of entering into strategic collaborations, we may hold investments in non-public companies. We review our interests in investee companies for consolidation and/or appropriate disclosure based on applicable guidance. For variable interest entities (VIEs), we may be required to consolidate an entity if the contractual terms of the arrangement essentially provide us with control over the entity, even if we do not have a majority voting interest. We assess whether we are the primary beneficiary of a VIE based on our power to direct the activities of the VIE that most significantly impact the VIE's economic performance and our obligation to absorb losses or the right to receive benefits from the VIE that could potentially be significant to the VIE. As of
December 31, 2012
, we determined that certain of our investee companies are VIEs; however, other than with respect to our joint ventures with BMS, we are not the primary beneficiary and therefore do not consolidate these investees.
111
Bristol-Myers Squibb Company
North America
In 2004, we entered into a collaboration arrangement with BMS in the United States to develop and commercialize a single tablet regimen containing our Truvada and BMS's Sustiva (efavirenz). This combination was approved for use in the United States in 2006 and is sold under the brand name Atripla. We and BMS structured this collaboration as a joint venture that operates as a limited liability company named Bristol-Myers Squibb & Gilead Sciences, LLC, which we consolidate. Under the terms of the collaboration we and BMS granted royalty free sublicenses to the joint venture for the use of our respective company owned technologies and, in return, were granted a license by the joint venture to use any intellectual property that results from the collaboration. In 2006, we and BMS amended the joint venture's collaboration agreement to allow the joint venture to sell Atripla into Canada. The economic interests of the joint venture held by us and BMS (including share of revenues and out-of-pocket expenses) is based on the portion of the net selling price of Atripla attributable to efavirenz and Truvada. Since the net selling price for Truvada may change over time relative to the net selling price of efavirenz, both our and BMS's respective economic interests in the joint venture may vary annually.
We and BMS shared marketing and sales efforts. Since the second quarter of 2011, except for a limited number of activities that will be jointly managed, the parties no longer coordinate detailing and promotional activities in the United States, and the parties have begun to reduce their joint promotional efforts since we launched Complera in August 2011 and Stribild in August 2012. The parties will continue to collaborate on activities such as manufacturing, regulatory, compliance and pharmacovigilance. The daily operations of the joint venture are governed by four primary joint committees formed by both BMS and Gilead. We are responsible for accounting, financial reporting, tax reporting, manufacturing and product distribution for the joint venture. Both parties provide their respective bulk active pharmaceutical ingredients to the joint venture at their approximate market values. The agreement will continue until terminated by the mutual agreement of the parties. In addition, either party may terminate the other party's participation in the collaboration within 30 days after the launch of at least one generic version of such other party's single agent products (or the double agent products). The non-terminating party then has the right to continue to sell Atripla, but will be obligated to pay the terminating party certain royalties for a three-year period following the effective date of the termination.
As of
December 31, 2012
and 2011, the joint venture held efavirenz active pharmaceutical ingredient which it purchased from BMS at BMS's estimated net selling price of efavirenz in the U.S. market. These amounts are included in inventories on our Consolidated Balance Sheets. As of
December 31, 2012
, total assets held by the joint venture were
$1.95 billion
and consisted primarily of cash and cash equivalents of
$191.1 million
, accounts receivable of
$223.7 million
and inventories of
$1.54 billion
; total liabilities were
$1.32 billion
and consisted primarily of accounts payable of
$501.7 million
and other accrued expenses of
$291.5 million
. As of
December 31, 2011
, total assets held by the joint venture were
$1.62 billion
and consisted primarily of cash and cash equivalents of
$156.9 million
, accounts receivable of
$235.6 million
and inventories of
$1.19 billion
; total liabilities were
$1.27 billion
and consisted primarily of accounts payable of
$561.1 million
and other accrued expenses of
$232.9 million
. These asset and liability amounts do not reflect the impact of intercompany eliminations that are included in our Consolidated Balance Sheets. Although we consolidate the joint venture, the legal structure of the joint venture limits the recourse that its creditors will have over our general credit or assets. Similarly, the assets held in the joint venture can be used only to settle obligations of the joint venture.
Europe
In 2007, Gilead Sciences Limited, a wholly-owned subsidiary in Ireland, and BMS entered into a collaboration agreement with BMS which sets forth the terms and conditions under which we and BMS will commercialize and distribute Atripla in the European Union, Iceland, Liechtenstein, Norway and Switzerland (collectively, the European Territory). The parties formed a limited liability company which we consolidate, to manufacture Atripla for distribution in the European Territory using efavirenz that it purchases from BMS at BMS's estimated net selling price of efavirenz in the European Territory. We are responsible for product distribution, inventory management and warehousing. Through our local subsidiaries, we have primary responsibility for order fulfillment, collection of receivables, customer relations and handling of sales returns in all the territories where we and BMS promote Atripla. In general, the parties share revenues and out-of-pocket expenses in proportion to the net selling prices of the components of Atripla, Truvada and efavirenz.
Starting in the first quarter of 2012, except for a limited number of activities that will be jointly managed, the parties no longer coordinate detailing and promotional activities in the region. We are responsible for accounting, financial reporting and tax reporting for the collaboration. As of
December 31, 2012
and
2011
, efavirenz purchased from BMS at BMS's estimated net selling price of efavirenz in the European Territory is included in inventories on our Consolidated Balance Sheets.
112
The parties also formed a limited liability company to hold the marketing authorization for Atripla in Europe. We have primary responsibility for regulatory activities. In the major market countries, both parties have agreed to independently continue to use commercially reasonable efforts to promote Atripla.
Roche
Tamiflu
In 1996, we entered into a development and license agreement (the 1996 Agreement) with Roche to develop and commercialize therapies to treat and prevent viral influenza. Tamiflu, an antiviral oral formulation for the treatment and prevention of influenza, was co-developed by us and Roche. Under the 1996 Agreement, Roche has the exclusive right and obligation to manufacture and sell Tamiflu worldwide, subject to its obligation to pay us a percentage of the net revenues that Roche generates from Tamiflu sales, which, in turn, has been subject to reduction for certain defined manufacturing costs.
In 2005, we entered into a first amendment and supplement to the 1996 Agreement with Roche. The amended agreement provided for the formation of a joint manufacturing committee to review Roche's manufacturing capacity for Tamiflu and its global plans for manufacturing Tamiflu, a U.S. commercial committee to evaluate commercial plans and strategies for Tamiflu in the United States and a joint supervisory committee to evaluate Roche's overall commercial plans for Tamiflu on a global basis in each case, consisting of representatives of Roche and us. Under the amended agreement, we also have the option to provide a specialized sales force to supplement Roche's marketing efforts in the United States for Tamiflu which we have not exercised to date. The agreement and Roche's obligation to pay royalties to us will terminate on a country-by-country basis as patents providing exclusivity for Tamiflu in such countries expire. Roche may terminate the agreement for any reason in which case all rights to Tamiflu would revert to us. Either party may terminate the agreement in response to a material breach by the other party.
The royalties payable to us on net sales of Tamiflu sold by Roche remain the same under the amended agreement, which are as follows: (a)
14%
of the first
$200.0 million
in worldwide net sales in a given calendar year; (b)
18%
of the next
$200.0 million
in worldwide net sales during the same calendar year; and (c)
22%
of worldwide net sales in excess of
$400.0 million
during the same calendar year. The amended agreement revised the provision in the 1996 Agreement relating to the calculation of royalty payments such that in any given calendar quarter Roche will pay royalties based on the actual royalty rates applicable to such quarter. In addition, under the amended agreement, royalties payable by Roche to us will no longer be subject to a cost of goods sold adjustment that was provided in the 1996 Agreement. We recorded a total of
$43.7 million
,
$75.5 million
and
$386.5 million
of Tamiflu royalties in
2012
,
2011
and
2010
, respectively.
Ranexa
As a result of our acquisition of CV Therapeutics in 2009, we assumed all rights to the agreement between CV Therapeutics and Roche under which we have an exclusive worldwide license to Ranexa. Under the license agreement, we paid an initial license fee and are obligated to make certain payments to Roche upon receipt of the first and second product approvals for Ranexa in any of the following major market countries: France, Germany, Italy, the United States and the United Kingdom. In 2006, we received FDA approval for Ranexa for the treatment of chronic angina and paid
$11.0 million
to Roche in accordance with the agreement. In 2008, we received marketing authorization from the European Medicines Agency (EMA) for Ranexa for the treatment of chronic angina in all 27 European Union member states and paid
$9.0 million
to Roche related to this approval. This amount was capitalized as a long-term asset on our Consolidated Balance Sheet and is being amortized over its useful U.S. patent life, which is approximately
11
years, expiring in 2019.
In 2006, we entered into an amendment to the agreement with Roche related to Ranexa. This amendment provided us with exclusive worldwide commercial rights to Ranexa for all potential indications in humans. Under the terms of the amendment, we made an upfront payment to Roche and are obligated to make royalty payments to Roche on worldwide net product sales of any licensed products. In addition, we are obligated to make additional milestone payments upon the achievement of certain regulatory approvals.
113
Japan Tobacco Inc.
In 2005, Japan Tobacco granted us exclusive rights to develop and commercialize elvitegravir, a novel HIV integrase inhibitor, in all countries of the world, excluding Japan, where Japan Tobacco retained such rights. Under the agreement, we are responsible for seeking regulatory approval in our territories and are required to use diligent efforts to commercialize a product for the treatment of HIV infection. We bear all costs and expenses associated with such commercialization efforts. Under the terms of the agreement, we incurred an up-front license fee of
$15.0 million
which was included in R&D expenses in 2005 as there was no future alternative use for this technology. In 2006, we recorded
$5.0 million
in R&D expenses related to a milestone we incurred as a result of dosing the first patient in a Phase 2 clinical study and in 2008, we recorded
$7.0 million
in R&D expenses related to a milestone we paid related to the dosing of the first patient in a Phase 3 clinical study.
In December 2011, we announced that we had submitted a marketing authorization application to the EMA for marketing approval of Stribild, a once-daily, single tablet regimen of elvitegravir, cobicistat, tenofovir disoproxil fumarate and emtricitabine. We recorded
$16.0 million
in R&D expenses in December 2011 related to milestones we incurred in connection with these filings. We are obligated to make additional payments upon the achievement of other milestones as well as pay royalties on any future product sales arising from this collaboration. In August 2012, we capitalized
$20.0 million
related to the milestone we incurred in connection with the FDA approval of Stribild and is being amortized over its useful U.S. patent life, which is approximately
10
years, expiring in 2023.
Janssen R&D Ireland
In 2009, we entered into a license and collaboration agreement with Janssen R&D Ireland (Janssen), formerly Tibotec Pharmaceuticals, to develop and commercialize a fixed-dose combination of our Truvada and Janssen's non-nucleoside reverse transcriptase inhibitor rilpivirine. This combination was approved in the United States and European Union in 2011 and is sold under the trade name Complera in the United States and Eviplera in the European Union. Under our license and collaboration agreement with Janssen, we were granted an exclusive license to Complera/Eviplera for administration to adults in a once-daily, oral dosage form, worldwide excluding certain middle income and developing world countries and Japan. Neither party is restricted from combining its drug products with any other drugs.
In accordance with the terms of the agreement, we were obligated to reimburse up to
€71.5 million
(approximately
$100.0 million
) of development costs incurred by Janssen for rilpivirine through December 2011. For 2011 and 2010, we recorded
€17.9 million
(approximately
$24.7 million
) and
€17.9 million
(approximately
$22.1 million
), respectively, in reimbursable R&D expenses incurred by Janssen in the development of rilpivirine. There were no reimbursable R&D expenses incurred by Janssen in 2012. We are responsible for manufacturing Complera/Eviplera and have the lead role in registration, distribution and commercialization of the combination product in the licensed countries. Janssen has exercised a right to co-detail the combination product in the some of the countries where Gilead is the selling party.
In 2011 and 2013, we amended the agreement to include distribution of Complera/Eviplera to the rest of the world. We have the right to distribute the product in North America, Europe, Latin America (except Argentina and Mexico), Australia and New Zealand, while Janssen has the right to distribute the product in the other regions, including Japan and Russia.
The price of the combination product is the sum of the prices of the Truvada and rilpivirine components. The cost of rilpivirine purchased by us from Janssen for the combination product approximates the market price of rilpivirine, less a specified percentage of up to
30%
in major markets.
114
|
10.
|
LONG-TERM OBLIGATIONS
|
Financing Arrangements
The following table summarizes the carrying amount of our borrowings under various financing arrangements (in thousands):
|
|
Interest
|
December 31,
|
||||||||||||||
|
Type of Borrowing
|
Description
|
Issue Date
|
Due Date
|
Rate
|
2012
|
2011
|
||||||||||
|
Convertible Senior
|
May 2013 Notes
|
April 2006
|
May 2013
|
0.625%
|
$
|
419,433
|
|
$
|
607,036
|
|
||||||
|
Convertible Senior
|
May 2014 Notes
|
July 2010
|
May 2014
|
1.00%
|
1,210,213
|
|
1,181,525
|
|
||||||||
|
Convertible Senior
|
May 2016 Notes
|
July 2010
|
May 2016
|
1.625%
|
1,157,692
|
|
1,132,293
|
|
||||||||
|
Senior Unsecured
|
April 2021 Notes
|
March 2011
|
April 2021
|
4.50%
|
992,923
|
|
992,066
|
|
||||||||
|
Senior Unsecured
|
December 2014 Notes
|
December 2011
|
December 2014
|
2.40%
|
749,394
|
|
749,078
|
|
||||||||
|
Senior Unsecured
|
December 2016 Notes
|
December 2011
|
December 2016
|
3.05%
|
699,095
|
|
698,864
|
|
||||||||
|
Senior Unsecured
|
December 2021 Notes
|
December 2011
|
December 2021
|
4.40%
|
1,247,428
|
|
1,247,138
|
|
||||||||
|
Senior Unsecured
|
December 2041 Notes
|
December 2011
|
December 2041
|
5.65%
|
997,810
|
|
997,734
|
|
||||||||
|
Credit Facility
|
Five-Year Revolver
|
January 2012
|
January 2017
|
Variable
|
750,000
|
|
—
|
|
||||||||
|
Total debt, net
|
$
|
8,223,988
|
|
$
|
7,605,734
|
|
||||||||||
|
Less current portion
|
1,169,433
|
|
—
|
|
||||||||||||
|
Total long-term debt, net
|
$
|
7,054,555
|
|
$
|
7,605,734
|
|
||||||||||
May 2013 Convertible Senior Notes
In April 2006, we issued
$650.0 million
of the May 2013 Notes in a private placement pursuant to Rule 144A of the Securities Act of 1933, as amended. In 2012, a portion of the May 2013 Notes were converted and we repaid
$223.3 million
of the principal balance. We also paid
$213.9 million
in cash related to the conversion spread of the May 2013 Notes, which represents the conversion value in excess of the principal amount, and received
$213.9 million
in cash from our convertible note hedges related to the May 2013 Notes.
The May 2013 Notes were issued at par and bear an interest rates of
0.625%
. Debt issuance costs of
$8.4 million
were recorded in other long-term assets and are being amortized to interest expense over the contractual terms of the May 2013 Notes. The initial conversion rate for the May 2013 Notes is
52.4920
shares per
$1,000
principal amount of the May 2013 Notes (which represents an initial conversion price of approximately
$19.05
per share). The conversion rates are subject to customary anti-dilution adjustments.
The May 2013 Notes may be converted, subject to adjustment, only under the following circumstances: 1) during any calendar quarter beginning after September 30, 2006 if the closing price of our common stock for at least 20 trading days during the last 30 consecutive trading day period of the previous quarter is more than
130%
of the applicable conversion price per share, 2) if we make specified distributions to holders of our common stock or if specified corporate transactions occur, or 3) during the last month prior to maturity of the applicable notes. Upon conversion, a holder would receive an amount in cash equal to the lesser of (i) the principal amount of the note or (ii) the conversion value for such note. If the conversion value exceeds the principal amount, we may also deliver, at our option, cash or common stock or a combination of cash and common stock for the conversion value in excess of the principal amount. If the May 2013 Notes are converted in connection with a change in control, we may be required to provide a make whole premium in the form of an increase in the conversion rate, subject to a stated maximum amount. In addition, in the event of a change in control, the holders may require us to purchase all or a portion of their notes at a purchase price equal to
100%
of their principal amount, plus accrued and unpaid interest, if any. As of December 31, 2012, the if-converted value of the May 2013 Notes would exceed the principal amount of the notes by
$395.8 million
.
Concurrent with the issuance of the May 2013 Notes, we purchased convertible note hedges in private transactions at a cost of
$214.7 million
, which is tax deductible over the life of the notes. We also sold warrants in private transactions to acquire
34.1 million
shares of our common stock and received net proceeds of
$133.5 million
from the sale of the warrants. The convertible note hedges and warrants are intended to reduce the potential economic dilution upon future conversions of the notes by effectively increasing our conversion price to
$26.95
per share for the May 2013 Notes. The net cost of
$81.2 million
of the convertible note hedge and warrant transactions was recorded in stockholders' equity on our Consolidated Balance Sheets. In addition, because both of these contracts are classified in stockholders’ equity and are indexed to our common stock, they are not accounted for as derivatives.
115
The convertible note hedges cover, subject to customary anti-dilution adjustments,
34.1 million
shares of our common stock at strike prices that initially correspond to the initial conversion price of the May 2013 Notes and are subject to adjustments similar to those applicable to the conversion price of the related notes. If the market value per share of our common stock at the time of conversion of the May 2013 Notes is above the strike price of the applicable convertible note hedges, we will be entitled to receive from the counterparties in the transactions shares of our common stock or, to the extent we have made a corresponding election with respect to the related convertible notes, cash or a combination of cash and shares of our common stock, at our option, for the excess of the market value of the common stock over the strike price of the convertible note hedges. The convertible note hedges will terminate upon the maturity of the May 2013 Notes or when none of the May 2013 Notes remain outstanding due to conversion or otherwise. There are
34.1 million
shares of our common stock underlying the warrants, subject to customary anti-dilution adjustments. The warrants have a strike price of
$26.95
per share and are exercisable only on their expiration dates. If the market value of our common stock at the time of the exercise of the applicable warrants exceeds their strike prices, we will be required to net settle in cash or shares of our common stock, at our option, with the counterparties for the value of the warrants in excess of the warrant strike prices.
Contemporaneously with the closing of the sale of the May 2013 Notes, a portion of the net proceeds from the notes issuance and the proceeds of the warrant transactions were used to repurchase shares of our common stock.
Under current accounting guidance, we bifurcated the conversion option of the May 2013 Notes from the debt instrument, classified the conversion option in equity and are accreting the resulting debt discount as interest expense over the contractual terms of the May 2013 Notes. The following table summarizes information about the equity and liability components of the May 2013 Notes (in thousands):
|
|
Carrying Value of
Equity Component
|
Net Carrying Amount of
Liability Component
|
Unamortized Discount of
Liability Component
|
|||||||||||||||||||||
|
|
December 31,
|
December 31,
|
December 31,
|
|||||||||||||||||||||
|
|
2012
|
2011
|
2012
|
2011
|
2012
|
2011
|
||||||||||||||||||
|
May 2013 convertible senior notes
|
$
|
126,839
|
|
$
|
193,231
|
|
$
|
419,433
|
|
$
|
607,036
|
|
$
|
(7,147
|
)
|
$
|
(42,831
|
)
|
||||||
For the years ended
December 31, 2012
,
2011
and
2010
, we recognized
$35.8 million
,
$34.2 million
and
$32.5 million
, respectively, in interest expense related to the contractual coupon rates and amortization of the debt discount for the May 2013 Notes. The effective interest rates on the liability components of the May 2013 Notes were
5.8%
.
May 2014 and 2016 Convertible Senior Notes
In July 2010, we issued
$1.25 billion
of the May 2014 Notes and
$1.25 billion
of the May 2016 Notes in a private placement pursuant to Rule 144A of the Securities Act of 1933, as amended. The May 2014 Notes and May 2016 Notes were issued at par and bear interest rates of
1.00%
and
1.625%
, respectively. Debt issuance costs of
$34.8 million
were recorded in other long-term assets and are being amortized to interest expense over the contractual terms of the May 2014 Notes and the May 2016 Notes. The aggregate principal amount of the May 2014 Notes and the May 2016 Notes sold reflects the full exercise by the initial purchasers of their option to purchase additional notes to cover over-allotments. The initial conversion rate for the May 2014 Notes is
44.3690
shares per
$1,000
principal amount (which represents an initial conversion price of approximately
$22.54
per share), and the initial conversion rate for the May 2016 Notes is
44.0428
shares per
$1,000
principal amount (which represents an initial conversion price of approximately
$22.71
per share). The conversion rates are subject to customary anti-dilution adjustments.
The May 2014 Notes and May 2016 Notes may be converted prior to April 1, 2014 and April 1, 2016, respectively, only under the following circumstances: 1) during any calendar quarter commencing after September 30, 2010, if the closing price of the common stock for at least 20 trading days (whether or not consecutive) during the period of 30 consecutive trading days ending on the last trading day of the preceding calendar quarter is greater than
130%
of the applicable conversion price on each applicable trading day, or 2) during the five business day period after any measurement period of ten consecutive trading days in which, for each trading day of such period, the trading price per
$1,000
principal amount of notes was less than
98%
of the product of the last reported sale price of our common stock and the applicable conversion rate on such trading day, or 3) upon the occurrence of specified corporate transactions, such as the distribution of certain stock rights, cash amounts, or other assets to all of our shareholders or the occurrence of a change in control. On and after April 1, 2014, in the case of the May 2014 Notes, and April 1, 2016, in the case of the May 2016 Notes, holders may convert their notes at any time, regardless of the foregoing circumstances. Generally, upon conversion, a holder would receive an amount in cash equal to the lesser of (i) the principal amount of the note or (ii) the conversion value for such note, as measured under the indenture governing the relevant notes. If the conversion value exceeds the principal amount, we may also deliver, at our option, cash or common stock or a combination of cash and common stock for the conversion value in excess of the principal amount. If the May 2014 Notes and the May 2016 Notes are converted in connection with a change in control, we may be required to provide a make whole premium in the form of an increase in the conversion rate, subject to a stated maximum amount. In addition, in the event of a
116
change in control, the holders may require us to purchase all or a portion of their notes at a purchase price equal to
100%
of their principal amount, plus accrued and unpaid interest, if any. As of
December 31, 2012
, the if-converted value of the May 2014 Notes and May 2016 Notes would exceed the principal amounts of the notes by
$786.7 million
and
$771.9 million
, respectively.
Concurrent with the issuance of the May 2014 Notes and May 2016 Notes, we purchased convertible note hedges in private transactions at a cost of
$362.6 million
, which is tax deductible over the life of the notes. We also sold warrants in private transactions to acquire
110.5 million
shares of our common stock and received net proceeds of
$155.4 million
from the sale of the warrants. The convertible note hedges and warrants are intended to reduce the potential economic dilution upon future conversions of the May 2014 Notes and May 2016 Notes by effectively increasing our conversion price to
$28.38
per share for the May 2014 Notes and
$30.05
per share for the May 2016 Notes. The net cost of
$207.2 million
of the convertible note hedge and warrant transactions was recorded in stockholders' equity on our Consolidated Balance Sheets. In addition, because both of these contracts are classified in Stockholders’ equity and are indexed to our common stock, they are not accounted for as derivatives.
The convertible note hedges cover, subject to customary anti-dilution adjustments,
110.5 million
shares of our common stock at strike prices that initially correspond to the initial conversion prices of the May 2014 Notes and the May 2016 Notes and are subject to adjustments similar to those applicable to the conversion price of the related notes. If the market value per share of our common stock at the time of conversion of the May 2014 Notes and the May 2016 Notes is above the strike price of the applicable convertible note hedges, we will be entitled to receive from the counterparties in the transactions shares of our common stock or, to the extent we have made a corresponding election with respect to the related convertible notes, cash or a combination of cash and shares of our common stock, at our option, for the excess of the market value of the common stock over the strike price of the convertible note hedges. The convertible note hedges will terminate upon the maturity of the May 2014 Notes and the May 2016 Notes or when none of the May 2014 Notes and the May 2016 Notes remain outstanding due to conversion or otherwise. There are
110.5 million
shares of our common stock underlying the warrants, subject to customary anti-dilution adjustments. The warrants have strike prices of
$28.38
per share (for the warrants expiring in 2014) and
$30.05
per share (for the warrants expiring in 2016) and are exercisable only on their respective expiration dates. If the market value of our common stock at the time of the exercise of the applicable warrants exceeds their respective strike prices, we will be required to net settle in cash or shares of our common stock, at our option, with the respective counterparties for the value of the warrants in excess of the warrant strike prices.
We have used the net proceeds from the issuance of the convertible notes to repurchase shares of our common stock and repay existing indebtedness.
Under current accounting guidance, we bifurcated the conversion option of the May 2014 Notes and May 2016 Notes from the debt instrument, classified the conversion option in equity and are accreting the resulting debt discount as interest expense over the contractual terms of the May 2014 Notes and the May 2016 Notes. The following table summarizes information about the equity and liability components of the May 2014 Notes and May 2016 Notes (in thousands):
|
|
Carrying Value of
Equity Component
|
Net Carrying Amount of
Liability Component
|
Unamortized Discount of
Liability Component
|
|||||||||||||||||||||
|
|
December 31,
|
December 31,
|
December 31,
|
|||||||||||||||||||||
|
|
2012
|
2011
|
2012
|
2011
|
2012
|
2011
|
||||||||||||||||||
|
May 2014 convertible senior notes
|
$
|
107,496
|
|
$
|
107,496
|
|
$
|
1,210,213
|
|
$
|
1,181,525
|
|
$
|
(39,787
|
)
|
$
|
(68,475
|
)
|
||||||
|
May 2016 convertible senior notes
|
152,039
|
|
152,039
|
|
1,157,692
|
|
1,132,293
|
|
(92,308
|
)
|
(117,707
|
)
|
||||||||||||
|
Total May 2014 and 2016 convertible senior notes
|
$
|
259,535
|
|
$
|
259,535
|
|
$
|
2,367,905
|
|
$
|
2,313,818
|
|
$
|
(132,095
|
)
|
$
|
(186,182
|
)
|
||||||
For the years ended
December 31, 2012
,
2011
and
2010
we recognized
$86.9 million
,
$84.9 million
, and
$34.9 million
, respectively, in interest expense related to the contractual coupon rates and amortization of the debt discount for the May 2014 Notes and May 2016 Notes. The effective interest rate on the liability components of the May 2014 Notes and May 2016 Notes were
3.5%
and
4.0%
, respectively.
117
April 2021 Senior Unsecured Notes
In March 2011, we issued the April 2021 Notes in a registered offering for an aggregate principal amount of
$1.00 billion
. The April 2021 Notes will mature on April 1, 2021 and pay interest at a fixed annual rate of
4.50%
. Debt issuance costs incurred in connection with the issuance of this debt totaled approximately
$5.8 million
and are being amortized to interest expense over the contractual term of the April 2021 Notes. For the years ended
December 31, 2012
and
2011
, we recognized
$46.4 million
and
$35.0 million
, respectively, in interest expense related to the contractual coupon rates and amortization of the debt discount for the April 2021 Notes.
The April 2021 Notes may be redeemed at our option at any time or from time to time, at a redemption price equal to the greater of (i)
100%
of the principal amount of the notes to be redeemed and (ii) the sum, as determined by an independent investment banker, of the present values of the remaining scheduled payments of principal and interest on the notes to be redeemed (exclusive of interest accrued to the date of redemption) discounted to the redemption date on a semiannual basis at the Treasury Rate plus
20
basis points, plus, in each case, accrued and unpaid interest on the notes to be redeemed to the date of redemption. At any time on or after January 1, 2021, we may redeem the notes, in whole or in part, at
100%
of the principal amount of the notes to be redeemed, plus accrued and unpaid interest to the date of redemption. In addition, in the event of the occurrence of both a change in control and a downgrade in the rating of the April 2021 Notes below an investment grade rating by Standard & Poor's Ratings Services and Moody's Investors Service, Inc., the holders may require us to purchase all or a portion of their notes at a price equal to
101%
of their principal amount, plus accrued and unpaid interest.
We used the net proceeds for general corporate purposes, which include the repayment of existing indebtedness and repurchases of our common stock.
December 2014, 2016, 2021 and 2041 Senior Unsecured Notes
In December 2011, we issued the December 2014 Notes, December 2016 Notes, December 2021 Notes and December 2041 Notes (the December Notes) in a registered offering for
$750.0 million
,
$700.0 million
,
$1.25 billion
and
$1.00 billion
, respectively for an aggregate principal amount of
$3.70 billion
. The notes will mature in December 2014, 2016, 2021 and 2041 and pay interest at fixed annual rates of
2.40%
,
3.05%
,
4.40%
and
5.65%
, respectively. Debt issuance costs incurred in connection with the issuance of this debt totaled approximately
$20.0 million
and are being amortized to interest expense over the contractual term of each of the respective notes. For the years ended
December 31, 2012
and
2011
, we recognized
$155.0 million
and
$7.8 million
, respectively, in interest expense related to the contractual coupon rates and amortization of the debt discount for the December Notes.
These notes may be redeemed at our option at any time or from time to time, at a redemption price equal to the greater of (i)
100%
of the principal amount of the notes to be redeemed and (ii) the sum, as determined by an independent investment banker, of the present values of the remaining scheduled payments of principal and interest on the notes to be redeemed (exclusive of interest accrued to the date of redemption) discounted to the redemption date on a semiannual basis at the Treasury Rate plus
35
basis points in the case of the December 2014 Notes and December 2016 Notes and
40
basis points in the case of the December 2021 Notes and December 2041 Notes plus, in each case, accrued and unpaid interest on the notes to be redeemed to the date of redemption.
At any time on or after the date that is three months prior to the maturity date of the December 2021 Notes, we may redeem the notes, in whole or in part, at
100%
of the principal amount of the notes to be redeemed, plus accrued and unpaid interest to the date of redemption. At any time on or after the date that is six months prior to the maturity date of the December 2041 Notes, we may redeem the notes, in whole or in part, at
100%
of the principal amount of the notes to be redeemed, plus accrued and unpaid interest to the date of redemption.
In the event of the occurrence of a change in control and a downgrade in the rating of a series of notes below an investment grade rating by Standard & Poor's Ratings Services and Moody's Investors Service, Inc., the holders of such series of notes may require us to purchase all or a portion of their notes of such series at a price equal to
101%
of the aggregate principal amount of the notes repurchased, plus accrued and unpaid interest.
We used the net proceeds to fund the acquisition of Pharmasset which was completed in January 2012 (See Note 5).
Credit Facilities
We were eligible to borrow up to an aggregate of
$1.25 billion
in revolving credit loans under an amended and restated credit agreement that we entered into in 2007. The credit agreement also included a sub-facility for swing-line loans and letters of credit. As of
December 31, 2011
, we had
$4.0 million
in letters of credit outstanding under the credit agreement. In January 2012, we fully repaid the outstanding obligations under this credit agreement and terminated the credit agreement.
118
In January 2012, in conjunction with our acquisition of Pharmasset, we entered into a five-year
$1.25 billion
revolving credit facility credit agreement (the Five-Year Revolving Credit Agreement), a
$750.0 million
short-term revolving credit facility credit agreement (the Short-Term Revolving Credit Agreement) and a
$1.00 billion
term loan facility (the Term Loan Credit Agreement). We borrowed
$750.0 million
under the Five-Year Revolving Credit Agreement,
$400.0 million
under the Short-Term Revolving Credit Agreement and
$1.00 billion
under the Term Loan Credit Agreement, upon the close of the acquisition. In 2012, we fully repaid the outstanding debt under the Term Loan Credit Agreement and the Short-Term Revolving Credit Agreement, at which time both agreements terminated.
The Five-Year Revolving Credit Agreement contains customary representations, warranties, affirmative, negative and financial maintenance covenants and events of default. The loan bears interest at either (i) the Eurodollar Rate plus the Applicable Margin or (ii) the Base Rate plus the Applicable Margin, each as defined in the credit agreement. We may reduce the commitments and may prepay the loan in whole or in part at any time without premium or penalty. We are required to comply with certain covenants under the credit agreement and notes indentures and as of
December 31, 2012
, we were in compliance with all such covenants.
The Five-Year Revolving Credit Agreement was inclusive of a
$30.0 million
swing line loan sub-facility and a
$25.0 million
letter of credit sub-facility. As of
December 31, 2012
, we had
$7.3 million
in letters of credit outstanding under the Five-Year Revolving Credit Agreement. The Five-Year Revolving Credit Agreement will terminate and all amounts owed under the agreement shall be due and payable in January 2017.
|
11.
|
COMMITMENTS AND CONTINGENCIES
|
Lease Arrangements
We have entered into various long-term non-cancelable operating leases for equipment and facilities. We lease facilities in Foster City, Fremont, Palo Alto and San Dimas, California; Branford, Connecticut; Princeton, New Jersey; Durham, North Carolina; and Seattle, Washington; the Dublin and Cork areas of Ireland and the London area of the United Kingdom. We also have operating leases for sales, marketing and administrative facilities in Europe, Canada and Asia. Our leases expire on various dates between 2013 and 2030, with many of our leases containing options to renew. Certain facility leases also contain rent escalation clauses. Our most significant lease, related to a facility in Seattle, Washington, expires in 2020 and has a 10-year term. The lease provides us with three consecutive rights to extend the term of the lease through 2035 and contains an annual three percent rent escalation clause. The lease also requires us to pay additional amounts for operating expenses and maintenance. We also have leases for three corporate aircraft, with varying terms, with renewal options upon expiration of the lease terms.
Lease expense under our operating leases was approximately
$53.9 million
,
$48.1 million
and
$41.7 million
during the years ended
December 31, 2012
,
2011
and
2010
, respectively. Aggregate non-cancelable future minimum rental payments under operating leases are as follows (in thousands):
|
2013
|
$
|
47,009
|
|
|
2014
|
42,947
|
|
|
|
2015
|
37,566
|
|
|
|
2016
|
26,648
|
|
|
|
2017
|
19,211
|
|
|
|
Thereafter
|
40,264
|
|
|
|
Total
|
$
|
213,645
|
|
Legal Proceedings
Department of Justice Investigation
In June 2011, we received a subpoena from the U.S. Attorney's Office for the Northern District of California requesting documents related to the manufacture, and related quality and distribution practices, of Atripla, Emtriva, Hepsera, Letairis, Truvada, Viread and Complera. We have been cooperating and will continue to cooperate with this governmental inquiry. An estimate of a possible loss or range of losses cannot be determined.
Litigation with Generic Manufacturers
As part of the approval process of some of our products, the FDA granted an New Chemical Entity (NCE) exclusivity period during which other manufacturers' applications for approval of generic versions of our product will not be granted. Generic manufacturers may challenge the patents protecting products that have been granted exclusivity one year prior to the
119
end of the exclusivity period. Generic manufacturers have sought and may continue to seek FDA approval for a similar or identical drug through an ANDA, the application form typically used by manufacturers seeking approval of a generic drug.
We received notices that generic manufacturers have submitted ANDAs to manufacture a generic version of Atripla, Truvada, Viread, Hepsera, Ranexa and Tamiflu in the United States and Atripla, Truvada and Viread in Canada. We expect to begin trial with some of the generic manufacturers in 2013. In February 2013, Gilead and Teva reached an agreement in principle to settle the ongoing patent litigation concerning the four patents that protect tenofovir disoproxil fumarate in our Viread, Truvada and Atripla products. The trial in this litigation has been adjourned pending completion of activities necessary to finalize the settlement. Under the agreement, Teva will be allowed to launch a generic version of Viread on December 15, 2017. The settlement agreement must be filed with the Federal Trade Commission and Department of Justice for their review before it is final. The trial related to ten of the patents associated with Ranexa is scheduled to begin in April 2013. We anticipate the trial related to two patents related to Hepsera will begin in mid 2013. The trial related to the two patents protecting emtricitabine patent in our Atripla is scheduled to begin in October 2013.
We cannot predict the ultimate outcome of these actions, and we may spend significant resources enforcing and defending these patents. If we are unsuccessful in these lawsuits, some or all of our original claims in the patents may be narrowed or invalidated and the patent protection for Atripla, Truvada, Viread, Hepsera, Ranexa and Tamiflu in the United States and Atripla, Truvada and Viread in Canada could be substantially shortened. Further, if all of the patents covering one or more products are invalidated, the FDA or Canadian Ministry of Health could approve the requests to manufacture a generic version of such products in the United States or Canada, respectively, prior to the expiration date of those patents. The sale of generic versions of these products, other than Hepsera, earlier than their patent expiration would have a significant negative effect on our revenues and results of operations.
Other Matters
We are a party to various legal actions that arose in the ordinary course of our business. We do not believe that any of these legal actions will have a material adverse impact on our consolidated business, financial position or results of operations.
Other Commitments
In the normal course of business, we enter into various firm purchase commitments primarily related to active pharmaceutical ingredients and certain inventory related items. As of
December 31, 2012
, these commitments for the next five years were approximately
$1.15 billion
in 2013,
$164.2 million
in 2014,
$87.8 million
in 2015,
$84.2 million
in 2016 and
$26.9 million
in 2017. The amounts related to active pharmaceutical ingredients represent minimum purchase requirements. Actual payments for the purchases related to these active pharmaceutical ingredients were
$1.86 billion
,
$1.53 billion
and
$835.7 million
during the years ended
December 31, 2012
,
2011
and
2010
.
|
12.
|
STOCKHOLDERS' EQUITY
|
Stock Repurchase Programs
In January 2010, our Board authorized a program for the repurchase of our common stock in an amount of up to
$1.00 billion
through open market and private block transactions pursuant to Rule 10b5-1 plans, privately negotiated purchases or other means. We completed this plan in May 2010, at which time our Board authorized a three-year,
$5.00 billion
stock repurchase program. As of December 31, 2010, we had repurchased
$3.02 billion
of our common stock under our May 2010 program, and the remaining authorized amount of stock repurchases that may be made under the program was
$1.98 billion
. In 2010, we spent a total of
$4.02 billion
to repurchase and retire
219.8 million
shares of our common stock, at an average purchase price of
$18.29
per share.
In January 2011, our Board authorized a three-year,
$5.00 billion
stock repurchase program. We initiated purchases under this program in September 2011 upon completion of our May 2010 stock repurchase program. As of
December 31, 2012
, we had repurchased
$1.07 billion
of our common stock under our January 2011 stock repurchase program and the remaining authorized amount of stock repurchases that may be made under this plan was
$3.93 billion
. In
2012
, we spent a total of
$666.9 million
to repurchase and retire
23.1 million
shares of our common stock at an average purchase price of
$28.93
per share.
We use the par value method of accounting for our stock repurchases. Under the par value method, common stock is first charged with the par value of the shares involved. The excess of the cost of shares acquired over the par value is allocated to APIC based on an estimated average sales price per issued share with the excess amounts charged to retained earnings.
120
The following table summarizes the reduction of common stock and APIC and the charge to retained earnings as a result of our stock repurchases (in millions):
|
Year ended December 31,
|
||||||||||||
|
2012
|
2011
|
2010
|
||||||||||
|
Reduction of common stock and APIC
|
$
|
40.6
|
|
$
|
186.2
|
|
$
|
319.8
|
|
|||
|
Charge to retained earnings
|
$
|
663.6
|
|
$
|
2,210.6
|
|
$
|
3,712.8
|
|
|||
Preferred Stock
We have
5,000,000
shares of authorized preferred stock issuable in series. Our Board is authorized to determine the designation, powers, preferences and rights of any such series. There was no preferred stock outstanding as of
December 31, 2012
and
2011
.
Rights Plan
In September 2012, we terminated our Rights Plan.
2004 Equity Incentive Plan
In May 2004, our stockholders approved and we adopted the Gilead Sciences, Inc. 2004 Equity Incentive Plan (the 2004 Plan), which replaced all of our existing equity plans (Prior Plans). The remaining shares that were available for future grants under the Prior Plans were transferred to the 2004 Plan and additionally, if awards granted under the Prior Plans expire or otherwise terminate without being exercised, the shares of our common stock reserved for such awards are added back to the pool of available shares of common stock under the 2004 Plan. The 2004 Plan is a broad based incentive plan that provides for the grant of equity-based awards, including stock options, restricted stock units, restricted stock awards and performance awards, to employees, directors and consultants. Under the 2004 Plan, we are authorized to issue a maximum of
50,000,000
shares of full-value awards, such as restricted stock, restricted stock units, performance shares, performance units (to the extent settled in common stock) and phantom shares over the term of the Plan. The 2004 Plan authorizes the issuance of a total of
243,188,366
shares of common stock. As of
December 31, 2012
,
83,273,752
shares remain available for future grant under the 2004 Plan.
Stock Options
The 2004 Plan provides for option grants designated as either non-qualified or incentive stock options. Prior to January 1, 2006, we granted both non-qualified and incentive stock options, but all stock options granted after January 1, 2006 have been non-qualified stock options. Under the 2004 Plan, employee stock options granted prior to 2011 generally vest over five years and stock options granted starting in 2011 generally vest over four years. All options are exercisable over a period not to exceed the contractual term of ten years from the date the stock options are issued and are granted at prices not less than the fair market value of our common stock on the grant date. Stock option exercises are settled with common stock from the 2004 Plan's previously authorized and available pool of shares.
In connection with the acquisition of Arresto, we assumed the Arresto 2007 Equity Incentive Plan (the Arresto Plan). The options that were issued and outstanding under the Arresto Plan have been converted into options to purchase our common stock effective
January 14, 2011
. The number of converted options to purchase our common stock is not significant. There are no shares available for future grant under the Arresto Plan.
The following table summarizes activity under our stock option plans. All option grants presented in the table had exercise prices not less than the fair value of the underlying common stock on the grant date (shares in thousands):
|
Shares
|
Weighted-
Average
Exercise Price
|
||||||
|
Outstanding at December 31, 2011
|
101,762
|
|
$
|
15.96
|
|
||
|
Granted and assumed
|
3,692
|
|
$
|
24.63
|
|
||
|
Forfeited
|
(1,001
|
)
|
$
|
22.64
|
|
||
|
Expired
|
(513
|
)
|
$
|
25.13
|
|
||
|
Exercised
|
(31,693
|
)
|
$
|
13.74
|
|
||
|
Outstanding at December 31, 2012
|
72,247
|
|
$
|
17.21
|
|
||
|
Exercisable, end of year
|
59,617
|
|
$
|
16.05
|
|
||
121
The total intrinsic value of options exercised during the years ended
December 31, 2012
,
2011
and
2010
was
$500.0 million
,
$194.5 million
and
$262.3 million
, respectively. The total fair value of stock options that vested during the years ended
December 31, 2012
,
2011
and
2010
was
$67.9 million
,
$96.4 million
and
$124.6 million
, respectively.
The weighted-average grant date fair values of the stock options granted during the years ended
December 31, 2012
,
2011
and
2010
were
$7.60
,
$6.17
and
$7.12
per share, respectively.
As of
December 31, 2012
, the number of options outstanding that are expected to vest, net of estimated future option forfeitures was
11,744,882
with a weighted-average exercise price of
$22.68
per share, an aggregate intrinsic value of
$165.0 million
and a weighted-average remaining contractual life of
7.6
years. The aggregate intrinsic value of stock options outstanding and stock options exercisable as of
December 31, 2012
were
$1.41 billion
and
$1.23 billion
, respectively. As of
December 31, 2012
, the weighted-average remaining contractual life for options outstanding and options exercisable were
4.5
and
3.8
years, respectively.
As of
December 31, 2012
, there was
$98.5 million
of unrecognized compensation cost related to stock options, which is expected to be recognized over an estimated weighted-average period of
2.2
years.
Performance Awards
Under the 2004 Plan, we grant performance-based restricted stock units which vest upon the achievement of specified market or performance goals, which could include achieving a total shareholder return compared to a pre-determined peer group or achieving revenue targets (Performance Shares). The actual number of common shares ultimately issued is calculated by multiplying the number of performance units by a payout percentage ranging from
0%
to
200%
. Performance Shares vest only when a committee (or subcommittee) of our Board has determined that the specified market and performance goals have been achieved. In January 2012, 2011 and 2010, we granted
804,900
,
1,206,800
and
825,010
Performance Shares, respectively. These awards generally vest over a period of three years.
The fair value of each performance share is estimated at the date of grant. Depending on the terms of the award, fair value on the date of grant is determined based on either the Monte Carlo valuation methodology or the stock price on the date of grant. The following table summarizes our Performance Shares activity and related information (in thousands, except per share amounts):
|
Shares
|
Weighted-Average Grant-Date Fair Value Per Share
|
||||||
|
Outstanding at December 31, 2011
|
2,696
|
|
$
|
24.78
|
|
||
|
Granted
|
805
|
|
$
|
21.14
|
|
||
|
Vested
|
(559
|
)
|
$
|
30.91
|
|
||
|
Forfeited
|
(228
|
)
|
$
|
29.66
|
|
||
|
Outstanding at December 31, 2012
|
2,714
|
|
$
|
22.03
|
|
||
The weighted-average grant date fair values of the
2012
,
2011
and
2010
Performance Shares were
$21.14
,
$19.22
and
$27.13
per share, respectively.
We recognized
$21.1 million
,
$24.6 million
and
$21.3 million
of stock-based compensation expenses in
2012
,
2011
and
2010
, respectively, related to these Performance Shares. As of
December 31, 2012
, there was
$20.6 million
of unrecognized compensation costs related to Performance Shares, which is expected to be recognized over an estimated weighted-average period of
1.1 years
.
The total fair value of Performance Shares that vested during the years ended
December 31, 2012
,
2011
and
2010
were
$17.3 million
,
$17.2 million
and
$12.6 million
, respectively.
We have also granted other performance-based restricted stock awards to certain of our employees under the 2004 Plan. The vesting of these awards is subject to the achievement of specified individual performance goals. To date, the number of units granted and fair value of these awards have not been significant.
122
Restricted Stock Units
We grant time-based restricted stock units (RSUs) to certain employees as part of our annual employee equity compensation review program as well as to new hire employees and to non-employee members of our Board. RSUs are share awards that entitle the holder to receive freely tradable shares of our common stock upon vesting. For awards granted prior to 2011, RSUs vest ratably on an annual basis over five years from the date of grant. Starting January 1, 2011, RSUs vest over four years from the date of grant.
The fair value of an RSU is equal to the closing price of our common stock on the grant date. The following table summarizes our RSU activities and related information (in thousands, except per share amounts):
|
|
Shares
|
Weighted-Average Grant-Date Fair Value Per Share
|
|||||
|
Outstanding at December 31, 2011
|
11,646
|
|
$
|
20.04
|
|
||
|
Granted and assumed
|
9,594
|
|
$
|
27.75
|
|
||
|
Vested
|
(2,972
|
)
|
$
|
20.19
|
|
||
|
Forfeited
|
(1,093
|
)
|
$
|
22.35
|
|
||
|
Outstanding at December 31, 2012
|
17,175
|
|
$
|
24.17
|
|
||
The weighted-average grant date fair values of RSUs granted during the years ended
December 31, 2012
,
2011
and
2010
were
$27.75
,
$19.40
and
$20.45
per share, respectively.
The total fair value of RSUs that vested during the years ended
December 31, 2012
,
2011
and
2010
was
$60.0 million
,
$25.4 million
and
$13.1 million
, respectively. As of
December 31, 2012
, there was
$371.7 million
of unrecognized compensation cost related to unvested RSUs which is expected to be recognized over a weighted-average period of
2.9
years.
Employee Stock Purchase Plan
Under our Employee Stock Purchase Plan, as amended and the International Employee Stock Purchase Plan (together, the ESPP), employees can purchase shares of our common stock based on a percentage of their compensation subject to certain limits. The purchase price per share is equal to the lower of
85%
of the fair market value of our common stock on the offering date or the purchase date. The ESPP offers a two-year look-back feature as well as an automatic reset feature that provides for an offering period to be reset to a new lower-priced offering if the offering price of the new offering period is less than that of the current offering period. ESPP purchases are settled with common stock from the ESPP's previously authorized and available pool of shares. During
2012
,
2,009,692
shares were issued under the ESPP for
$30.7 million
. A total of
66,560,000
shares of common stock have been reserved for issuance under the ESPP, and there were
8,725,652
shares available for issuance under the ESPP as of
December 31, 2012
.
As of
December 31, 2012
, there was
$18.3 million
of unrecognized compensation cost related to the ESPP, which is expected to be recognized over an estimated weighted-average period of
1.3
years.
|
13.
|
STOCK-BASED COMPENSATION
|
The following table summarizes the stock-based compensation expenses included in our Consolidated Statements of Income (in thousands):
|
|
Year Ended December 31,
|
|||||||||||
|
|
2012
|
2011
|
2010
|
|||||||||
|
Cost of goods sold
|
$
|
7,061
|
|
$
|
8,433
|
|
$
|
10,180
|
|
|||
|
Research and development expenses
|
187,100
|
|
73,490
|
|
84,048
|
|
||||||
|
Selling, general and administrative expenses
|
208,501
|
|
110,455
|
|
105,813
|
|
||||||
|
Stock-based compensation expense included in total costs and expenses
|
402,662
|
|
192,378
|
|
200,041
|
|
||||||
|
Income tax effect
|
(55,957
|
)
|
(47,325
|
)
|
(52,331
|
)
|
||||||
|
Stock-based compensation expense, net of tax
|
$
|
346,705
|
|
$
|
145,053
|
|
$
|
147,710
|
|
|||
123
During the years ended
December 31, 2012
,
2011
and
2010
, we capitalized
$6.9 million
,
$8.6 million
and
$10.9 million
of stock-based compensation costs to inventory, respectively, of which
$1.9 million
,
$2.0 million
and
$1.8 million
remained in inventory at
December 31, 2012
,
2011
and
2010
, respectively. Total stock-based compensation for the year ended
December 31, 2012
included
$100.1 million
and
$93.8 million
in R&D and SG&A expenses, respectively, related to the acceleration of unvested stock options in connection with the acquisition of Pharmasset, which closed during the first quarter of 2012.
Stock-based compensation is recognized as expense over the requisite service periods in our Consolidated Statements of Income using a graded vesting expense attribution approach for unvested stock options granted prior to January 1, 2006, and using the straight-line expense attribution approach for stock options granted after our adoption of new guidance for share-based payments to employees and directors on January 1, 2006. As stock-based compensation expenses related to stock options recognized on adoption of the new guidance is based on awards ultimately expected to vest, gross expense has been reduced for estimated forfeitures. The guidance requires forfeitures to be estimated at the time of grant and revised, if necessary, in subsequent periods if actual forfeitures differ from those estimates. We estimated forfeitures based on our historical experience. Prior to the adoption of this guidance, pro forma information that was required to be disclosed included forfeitures as they occurred. As a result of the guidance adopted on January 1, 2006, we only recognize a tax benefit from stock-based compensation in APIC if an incremental tax benefit is realized after all other tax attributes currently available to us have been utilized. In addition, we have elected to account for the indirect benefits of stock-based compensation on the research tax credit and the extraterritorial income deduction through the Consolidated Statements of Income rather than through APIC.
Valuation Assumptions
Fair values of options granted under our 2004 Plan and purchases under our ESPP were estimated at grant or purchase dates using a Black-Scholes option valuation model. The Black-Scholes option valuation model was developed for use in estimating the fair value of traded options, which have no vesting restrictions and are fully transferable. In addition, option valuation models require the input of highly subjective assumptions, including expected stock price volatility and expected award life. We used the following assumptions to calculate the estimated fair value of the awards:
|
|
Year Ended December 31,
|
||||||||
|
|
2012
|
2011
|
2010
|
||||||
|
Expected volatility:
|
|
|
|
||||||
|
Stock options
|
30
|
%
|
29
|
%
|
31
|
%
|
|||
|
ESPP
|
32
|
%
|
30
|
%
|
35
|
%
|
|||
|
Expected term in years:
|
|
|
|
|
|
|
|||
|
Stock options
|
5.9
|
|
5.6
|
|
5.4
|
|
|||
|
ESPP
|
1.3
|
|
1.4
|
|
1.3
|
|
|||
|
Risk-free interest rate:
|
|
|
|
|
|
|
|||
|
Stock options
|
1.1
|
%
|
2.2
|
%
|
2.3
|
%
|
|||
|
ESPP
|
0.7
|
%
|
0.8
|
%
|
0.4
|
%
|
|||
|
Expected dividend yield
|
—
|
%
|
—
|
%
|
—
|
%
|
|||
The fair value of stock options granted was calculated using the single option approach. We use a blend of historical volatility along with implied volatility for traded options on our common stock to determine our expected volatility. The expected term of stock-based awards represents the weighted-average period the awards are expected to remain outstanding. We estimate the weighted-average expected term based on historical cancellation and historical exercise data related to our stock options as well as the contractual term and vesting terms of the awards. The risk-free interest rate is based upon observed interest rates appropriate for the term of the stock-based awards. The dividend yield is based on our history and expectation of dividend payouts.
|
14.
|
SEGMENT INFORMATION
|
Product Sales
We operate in one business segment, which primarily focuses on the development and commercialization of human therapeutics for life threatening diseases. All products are included in one segment, because the majority of our products have similar economic and other characteristics, including the nature of the products and production processes, type of customers, distribution methods and regulatory environment.
124
Product sales consist of the following (in thousands):
|
|
Year Ended December 31,
|
|||||||||||
|
|
2012
|
2011
|
2010
|
|||||||||
|
Antiviral products:
|
|
|
|
|||||||||
|
Atripla
|
$
|
3,574,483
|
|
$
|
3,224,518
|
|
$
|
2,926,579
|
|
|||
|
Truvada
|
3,181,110
|
|
2,875,141
|
|
2,649,908
|
|
||||||
|
Viread
|
848,697
|
|
737,867
|
|
732,240
|
|
||||||
|
Complera/Eviplera
|
342,200
|
|
38,747
|
|
—
|
|
||||||
|
Stribild
|
57,536
|
|
—
|
|
—
|
|
||||||
|
Hepsera
|
108,315
|
|
144,679
|
|
200,592
|
|
||||||
|
Emtriva
|
29,449
|
|
28,764
|
|
27,679
|
|
||||||
|
Total antiviral products
|
8,141,790
|
|
7,049,716
|
|
6,536,998
|
|
||||||
|
Letairis
|
410,054
|
|
293,426
|
|
240,279
|
|
||||||
|
Ranexa
|
372,949
|
|
320,004
|
|
239,832
|
|
||||||
|
AmBisome
|
346,646
|
|
330,156
|
|
305,856
|
|
||||||
|
Other products
|
126,932
|
|
109,057
|
|
66,956
|
|
||||||
|
Total product sales
|
$
|
9,398,371
|
|
$
|
8,102,359
|
|
$
|
7,389,921
|
|
|||
The following table summarizes total revenues from external customers and collaboration partners by geographic region (in thousands). Product sales and product-related contract revenue are attributed to regions based on ship-to location. Royalty and non-product related contract revenue are attributed to regions based on the location of the collaboration partner.
|
|
Year Ended December 31,
|
|||||||||||
|
|
2012
|
2011
|
2010
|
|||||||||
|
Revenues:
|
||||||||||||
|
United States
|
$
|
5,591,988
|
|
$
|
4,608,343
|
|
$
|
4,224,035
|
|
|||
|
Europe
|
3,332,824
|
|
3,124,699
|
|
3,170,738
|
|
||||||
|
Other countries
|
777,705
|
|
652,343
|
|
554,647
|
|
||||||
|
Total revenues
|
$
|
9,702,517
|
|
$
|
8,385,385
|
|
$
|
7,949,420
|
|
|||
The following table summarizes revenues from each of our customers who individually accounted for
10%
or more of our total revenues (as a percentage of total revenues):
|
|
Year Ended December 31,
|
||||||||
|
|
2012
|
2011
|
2010
|
||||||
|
Cardinal Health, Inc.
|
19
|
%
|
17
|
%
|
17
|
%
|
|||
|
McKesson Corp.
|
16
|
%
|
14
|
%
|
14
|
%
|
|||
|
AmerisourceBergen Corp.
|
11
|
%
|
12
|
%
|
12
|
%
|
|||
Property, Plant and Equipment
At
December 31, 2012
, the net book value of our property, plant and equipment in the United States, Ireland and Canada was
$914.3 million
,
$115.2 million
and
$53.6 million
, respectively, which comprised approximately
98%
of the total net book value of our property, plant and equipment. At
December 31, 2011
, the net book value of our property, plant and equipment in the United States, Ireland and Canada was
$597.9 million
,
$109.0 million
and
$51.7 million
, respectively, which comprised approximately
98%
of the total net book value of our property, plant and equipment.
125
|
15.
|
INCOME TAXES
|
The provision for income taxes consists of the following (in thousands):
|
|
Year Ended December 31,
|
|||||||||||
|
|
2012
|
2011
|
2010
|
|||||||||
|
Federal:
|
|
|
|
|||||||||
|
Current
|
$
|
1,002,946
|
|
$
|
704,412
|
|
$
|
852,822
|
|
|||
|
Deferred
|
(25,261
|
)
|
68,391
|
|
(29,854
|
)
|
||||||
|
|
977,685
|
|
772,803
|
|
822,968
|
|
||||||
|
State:
|
|
|
|
|
|
|
||||||
|
Current
|
49,503
|
|
62,631
|
|
139,819
|
|
||||||
|
Deferred
|
(15,242
|
)
|
(17,450
|
)
|
17,464
|
|
||||||
|
|
34,261
|
|
45,181
|
|
157,283
|
|
||||||
|
Foreign:
|
|
|
|
|
|
|
||||||
|
Current
|
28,621
|
|
39,921
|
|
43,094
|
|
||||||
|
Deferred
|
(2,186
|
)
|
4,040
|
|
454
|
|
||||||
|
|
26,435
|
|
43,961
|
|
43,548
|
|
||||||
|
Provision for income taxes
|
$
|
1,038,381
|
|
$
|
861,945
|
|
$
|
1,023,799
|
|
|||
Foreign pre-tax income was
$884.7 million
,
$1.48 billion
and
$1.37 billion
in
2012
,
2011
and
2010
, respectively. The cumulative unremitted foreign earnings that are considered to be indefinitely reinvested in our foreign subsidiaries and for which no U.S. taxes have been provided, were approximately
$7.25 billion
and
$5.84 billion
as of
December 31, 2012
and
2011
, respectively. The residual U.S. tax liability, if such amounts were remitted, would be approximately
$2.54 billion
and
$2.05 billion
as of
December 31, 2012
and
2011
, respectively.
The difference between the provision for income taxes and the amount computed by applying the U.S. federal statutory income tax rate to income before provision for income taxes is as follows (in thousands):
|
|
Year Ended December 31,
|
|||||||||||
|
|
2012
|
2011
|
2010
|
|||||||||
|
Income before provision for income taxes
|
$
|
3,611,980
|
|
$
|
3,651,004
|
|
$
|
3,913,548
|
|
|||
|
Tax at federal statutory rate
|
$
|
1,264,193
|
|
$
|
1,277,852
|
|
$
|
1,369,742
|
|
|||
|
State taxes, net of federal benefit
|
16,551
|
|
27,894
|
|
106,250
|
|
||||||
|
Foreign earnings at different rates
|
(307,281
|
)
|
(443,879
|
)
|
(435,767
|
)
|
||||||
|
Research and other credits
|
(16,126
|
)
|
(32,403
|
)
|
(33,072
|
)
|
||||||
|
Net unbenefitted stock compensation
|
11,292
|
|
14,860
|
|
13,188
|
|
||||||
|
Non-deductible pharmaceutical excise tax
|
25,809
|
|
13,874
|
|
—
|
|
||||||
|
Other
|
43,943
|
|
3,747
|
|
3,458
|
|
||||||
|
Provision for income taxes
|
$
|
1,038,381
|
|
$
|
861,945
|
|
$
|
1,023,799
|
|
|||
126
Deferred income taxes reflect the net tax effects of temporary differences between the carrying amounts of assets and liabilities for financial reporting purposes and the amounts used for income tax purposes. Significant components of our deferred tax assets and liabilities are as follows (in thousands):
|
|
December 31,
|
|||||||
|
|
2012
|
2011
|
||||||
|
Deferred tax assets:
|
|
|
||||||
|
Net operating loss carryforwards
|
$
|
225,652
|
|
$
|
260,907
|
|
||
|
Stock-based compensation
|
148,833
|
|
156,715
|
|
||||
|
Reserves and accruals not currently deductible
|
186,601
|
|
116,564
|
|
||||
|
Deferred revenue
|
39,904
|
|
37,314
|
|
||||
|
Depreciation related
|
50,074
|
|
45,223
|
|
||||
|
Research and other credit carryforwards
|
39,445
|
|
30,350
|
|
||||
|
Other, net
|
48,428
|
|
63,399
|
|
||||
|
Total deferred tax assets before valuation allowance
|
738,937
|
|
710,472
|
|
||||
|
Valuation allowance
|
(9,488
|
)
|
(9,209
|
)
|
||||
|
Total deferred tax assets
|
729,449
|
|
701,263
|
|
||||
|
Deferred tax liabilities:
|
|
|
|
|
||||
|
Intangibles
|
(306,354
|
)
|
(330,184
|
)
|
||||
|
Unremitted foreign earnings
|
(15,928
|
)
|
(15,928
|
)
|
||||
|
Other
|
(23,669
|
)
|
(14,562
|
)
|
||||
|
Total deferred tax liabilities
|
(345,951
|
)
|
(360,674
|
)
|
||||
|
Net deferred tax assets
|
$
|
383,498
|
|
$
|
340,589
|
|
||
The valuation allowance increased by
$0.3 million
for the year ended
December 31, 2012
. The valuation allowance decreased by
$3.8 million
for the year ended
December 31, 2011
and increased by
$11.9 million
for the year ended
December 31, 2010
. We have concluded, based on the standard set forth in the FASB Accounting Standards Codification related to Income Taxes, that it is more likely than not that we will not realize any benefit from the deferred tax assets related to certain state net operating loss and credit carryforwards.
At
December 31, 2012
, we had U.S. federal net operating loss carryforwards of approximately
$503.8 million
. The federal net operating loss carryforwards will start to expire in 2016, if not utilized. We also had federal tax credit carryforwards of approximately
$13.8 million
which will start to expire in 2016, if not utilized. In addition, we had state net operating loss and tax credit carryforwards of approximately
$1.55 billion
and
$52.9 million
, respectively. The state net operating loss and tax credit carryforwards will start to expire in 2013 if not utilized.
Utilization of net operating losses and tax credits may be subject to an annual limitation due to ownership change limitations provided in the Internal Revenue Code of 1986, as amended, and similar state provisions. This annual limitation may result in the expiration of the net operating losses and credits before utilization.
We file federal, state and foreign income tax returns in many jurisdictions in the United States and abroad. For federal income tax purposes, the statute of limitations is open for 2008 and onwards. For certain acquired entities, the statute of limitations is open for all years from inception due to our utilization of their net operating losses and credits carried over from prior years. For California income tax purposes, the statute of limitations is open for 2008 and onwards.
Our income tax returns are audited by federal, state and foreign tax authorities. We are currently under examination by the Internal Revenue Service (IRS) for the 2008 and 2009 tax years and by various state and foreign jurisdictions. There are differing interpretations of tax laws and regulations, and as a result, significant disputes may arise with these tax authorities involving issues of the timing and amount of deductions and allocations of income among various tax jurisdictions. We periodically evaluate our exposures associated with our tax filing positions.
At
December 31, 2012
and
2011
, we have total federal, state and foreign unrecognized tax benefits of
$157.0 million
and
$146.9 million
, respectively. Of the total unrecognized tax benefits,
$126.5 million
and
$120.6 million
at
December 31, 2012
and
2011
, respectively, if recognized, would reduce our effective tax rate in the period of recognition. We have continued to classify interest and penalties related to unrecognized tax benefits as part of our income tax provision in our Consolidated Statements of Income. As of
December 31, 2012
and
2011
, we had accrued interest and penalties related to unrecognized tax benefits of
$15.3 million
and
$17.7 million
, respectively.
127
As of
December 31, 2012
, we believe that it is reasonably possible that our unrecognized tax benefits will not significantly change in the next 12 months as we do not expect to have clarification from the IRS and other tax authorities regarding any of our uncertain tax positions.
The following is a rollforward of our total gross unrecognized tax benefit liabilities for the years ended
December 31, 2012
,
2011
and
2010
(in thousands):
|
|
December 31,
|
|||||||||||
|
|
2012
|
2011
|
2010
|
|||||||||
|
Balance, beginning of period
|
$
|
146,908
|
|
$
|
126,516
|
|
$
|
106,506
|
|
|||
|
Tax positions related to current year:
|
|
|
|
|
|
|
||||||
|
Additions
|
26,691
|
|
21,113
|
|
24,320
|
|
||||||
|
Reductions
|
—
|
|
—
|
|
(3,303
|
)
|
||||||
|
Tax positions related to prior years:
|
|
|
|
|
|
|
||||||
|
Additions
|
1,609
|
|
11,171
|
|
25,581
|
|
||||||
|
Reductions
|
(12,866
|
)
|
(4,896
|
)
|
(23,474
|
)
|
||||||
|
Settlements
|
—
|
|
(3,067
|
)
|
(2,160
|
)
|
||||||
|
Lapse of statute of limitations
|
(5,345
|
)
|
(3,929
|
)
|
(954
|
)
|
||||||
|
Balance, end of period
|
$
|
156,997
|
|
$
|
146,908
|
|
$
|
126,516
|
|
|||
|
16.
|
DEFERRED COMPENSATION PLANS
|
We maintain a retirement savings plan under which eligible employees may defer compensation for income tax purposes under Section 401(k) of the Internal Revenue Code (Gilead Plan). Under the Gilead Plan, employees may contribute up to
60%
of their eligible annual compensation, subject to IRS plan limits. We make matching contributions under the Gilead Plan. We contributed up to
50%
of an employee's contributions up to an annual maximum match of
$7,500
in
2012
and up to an annual maximum match of
$5,000
in
2011
and
2010
. Our total matching contribution expense under the Gilead Plan for the years ended
December 31, 2012
,
2011
and
2010
was
$26.8 million
,
$18.8 million
and
$11.2 million
, respectively.
We maintain a deferred compensation plan under which our directors and key employees may defer compensation for income tax purposes. The deferred compensation plan is a non-qualified deferred compensation plan which is not subject to the qualification requirements under Section 401(a) of the Internal Revenue Code. Compensation deferred after December 31, 2004 is subject to the requirements of Section 409A of the Internal Revenue Code. Under the plan, officers and other senior grade level employees may contribute up to
70%
of their annual salaries and up to
100%
of their annual bonus while directors may contribute up to
100%
of their annual retainer fee. Effective 2011, directors may also defer up to
100%
of their RSU awards. Amounts deferred by participants are deposited in a rabbi trust and are recorded in other long-term assets in our Consolidated Balance Sheets. Beginning in 2004, directors may also elect to receive all or a portion of their annual cash retainer in phantom shares, which gives the participant the right to receive an amount equal to the value of a specified number of shares over a specified period of time and which will be payable in shares of our common stock (with fractional shares paid out in cash) as established by the plan administrator. As of
December 31, 2012
, we had
60,180
phantom shares outstanding. Participants can elect one of several distribution dates or events available under the plan at which they will receive their deferred compensation payment.
|
17.
|
SUBSEQUENT EVENTS
|
Acquisition of YM BioSciences Inc.
In December 2012, we signed a definitive agreement to acquire YM BioSciences Inc. (YM) for USD
$2.95
per share in cash or approximately
$490.0 million
. The transaction was completed on February 8, 2013, at which time YM became a wholly-owned subsidiary.
128
|
18.
|
QUARTERLY RESULTS OF OPERATIONS (UNAUDITED)
|
The following amounts are in thousands, except per share amounts:
|
|
1st Quarter
|
2nd Quarter
|
3rd Quarter
|
4th Quarter
|
||||||||||||
|
2012
|
|
|
|
|||||||||||||
|
Total revenues
|
$
|
2,282,449
|
|
$
|
2,405,186
|
|
$
|
2,426,597
|
|
$
|
2,588,285
|
|
||||
|
Gross profit on product sales
|
$
|
1,627,411
|
|
$
|
1,703,895
|
|
$
|
1,760,709
|
|
$
|
1,834,993
|
|
||||
|
Net income
|
$
|
437,531
|
|
$
|
706,074
|
|
$
|
671,035
|
|
$
|
758,959
|
|
||||
|
Net income attributable to Gilead
|
$
|
441,956
|
|
$
|
711,564
|
|
$
|
675,505
|
|
$
|
762,541
|
|
||||
|
Net income per share attributable to Gilead common stockholders-basic
(1)
|
$
|
0.29
|
|
$
|
0.47
|
|
$
|
0.45
|
|
$
|
0.50
|
|
||||
|
Net income per share attributable to Gilead common stockholders-diluted
(1)
|
$
|
0.28
|
|
$
|
0.46
|
|
$
|
0.43
|
|
$
|
0.47
|
|
||||
|
2011
(2)
|
|
|
|
|
|
|
||||||||||
|
Total revenues
|
$
|
1,926,094
|
|
$
|
2,137,253
|
|
$
|
2,121,660
|
|
$
|
2,200,378
|
|
||||
|
Gross profit on product sales
|
$
|
1,389,467
|
|
$
|
1,505,725
|
|
$
|
1,533,870
|
|
$
|
1,548,887
|
|
||||
|
Net income
|
$
|
647,303
|
|
$
|
742,459
|
|
$
|
737,538
|
|
$
|
661,759
|
|
||||
|
Net income attributable to Gilead
|
$
|
651,141
|
|
$
|
746,227
|
|
$
|
741,124
|
|
$
|
665,145
|
|
||||
|
Net income per share attributable to Gilead common stockholders-basic
(1)
|
$
|
0.41
|
|
$
|
0.48
|
|
$
|
0.48
|
|
$
|
0.44
|
|
||||
|
Net income per share attributable to Gilead common stockholders-diluted
(1)
|
$
|
0.40
|
|
$
|
0.47
|
|
$
|
0.47
|
|
$
|
0.43
|
|
||||
|
(1)
|
Net income per share for all periods presented reflect the two-for-one stock split effective on January 25, 2013.
|
|
(2)
|
During the fourth quarter of 2011, we recorded
$26.6 million
of impairment charges in R&D expense, related to certain IPR&D assets acquired from CGI.
|
129
GILEAD SCIENCES, INC.
Schedule II: Valuation and Qualifying Accounts
(in thousands)
|
Balance at Beginning of Period
|
Additions/Charged to Expense
|
Deductions
|
Balance at End of Period
|
|||||||||
|
Year ended December 31, 2012:
|
||||||||||||
|
Accounts Receivable Allowances
(1)
|
205,990
|
|
1,409,661
|
|
1,354,638
|
|
261,013
|
|
||||
|
Valuation allowances for deferred tax assets
(2)
|
9,209
|
|
702
|
|
423
|
|
9,488
|
|
||||
|
Year ended December 31, 2011:
|
||||||||||||
|
Accounts Receivable Allowances
(1)
|
150,942
|
|
1,228,006
|
|
1,172,958
|
|
205,990
|
|
||||
|
Valuation allowances for deferred tax assets
(2)
|
13,040
|
|
436
|
|
4,267
|
|
9,209
|
|
||||
|
Year ended December 31, 2010:
|
||||||||||||
|
Accounts Receivable Allowances
(1)
|
132,810
|
|
818,132
|
|
800,000
|
|
150,942
|
|
||||
|
Valuation allowances for deferred tax assets
(2)
|
1,078
|
|
12,127
|
|
165
|
|
13,040
|
|
||||
|
(1)
|
Allowances are for doubtful accounts, sales returns, cash discounts and government chargebacks.
|
|
(2)
|
Valuation allowance for deferred tax assets includes $7.2 million and $7.5 million as of December 31, 2012 and 2011, respectively, related to our acquisitions.
|
130
SIGNATURES
Pursuant to the requirements of Section 13 or 15(d) of the Securities Exchange Act of 1934, the registrant has duly caused this report to be signed on its behalf by the undersigned, thereunto duly authorized.
|
G
ILEAD
S
CIENCES
, I
NC
.
|
|
|
By:
|
/
S
/ J
OHN
C. M
ARTIN
|
|
|
John C. Martin, Ph.D.
Chairman and Chief Executive Officer
|
POWER OF ATTORNEY
KNOW ALL PERSONS BY THESE PRESENTS, that each person whose signature appears below constitutes and appoints John C. Martin and Gregg H. Alton, and each of them, as his true and lawful attorneys-in-fact and agents, with full power of substitution and resubstitution, for him or her and in his or her name, place, and stead, in any and all capacities, to sign any and all amendments to this Report, and to file the same, with all exhibits thereto, and other documents in connection therewith, with the Securities and Exchange Commission, granting unto said attorneys-in-fact and agents, and each of them, full power and authority to do and perform each and every act and thing requisite and necessary to be done in connection therewith, as fully to all intents and purposes as he might or could do in person, hereby ratifying and confirming that all said attorneys-in-fact and agents, or any of them or their or his substitute or substitutes, may lawfully do or cause to be done by virtue hereof.
Pursuant to the requirements of the Securities Exchange Act of 1934, as amended, this Report has been signed below by the following persons on behalf of the registrant and in the capacities and on the dates indicated.
131
|
Signature
|
Title
|
Date
|
||
|
/
S
/ J
OHN
C. M
ARTIN
|
Chairman and Chief Executive Officer
|
February 27, 2013
|
||
|
John C. Martin, Ph.D.
|
(Principal Executive Officer)
|
|||
|
/
S
/ R
OBIN
L. W
ASHINGTON
|
Senior Vice President and Chief Financial Officer
|
February 27, 2013
|
||
|
Robin L. Washington
|
(Principal Financial and Accounting Officer)
|
|||
|
/
S
/ J
AMES
M. D
ENNY
|
Director
|
February 27, 2013
|
||
|
James M. Denny
|
||||
|
/
S
/ J
OHN
F. C
OGAN
|
Director
|
February 27, 2013
|
||
|
John F. Cogan
|
||||
|
/
S
/ E
TIENNE
F. D
AVIGNON
|
Director
|
February 27, 2013
|
||
|
Etienne F. Davignon
|
||||
|
/
S
/ C
ARLA
A. H
ILLS
|
Director
|
February 27, 2013
|
||
|
Carla A. Hills
|
||||
|
/
S
/ K
EVIN
E. L
OFTON
|
Director
|
February 27, 2013
|
||
|
Kevin E. Lofton
|
||||
|
/
S
/ J
OHN
W. M
ADIGAN
|
Director
|
February 27, 2013
|
||
|
John W. Madigan
|
||||
|
/
S
/ G
ORDON
E. M
OORE
|
Director
|
February 27, 2013
|
||
|
Gordon E. Moore
|
||||
|
/
S
/ N
ICHOLAS
G. M
OORE
|
Director
|
February 27, 2013
|
||
|
Nicholas G. Moore
|
||||
|
/
S
/ R
ICHARD
J. W
HITLEY
|
Director
|
February 27, 2013
|
||
|
Richard J. Whitley
|
||||
|
/
S
/ G
AYLE
E. W
ILSON
|
Director
|
February 27, 2013
|
||
|
Gayle E. Wilson
|
||||
|
/
S
/ P
ER
W
OLD
-O
LSEN
|
Director
|
February 27, 2013
|
||
|
Per Wold-Olsen
|
||||
132
TABLE OF CONTENTS
Part IItem 1. BusinessItem 1A. Risk FactorsItem 1B. Unresolved Staff CommentsItem 2. PropertiesItem 3. Legal ProceedingsItem 4. Mine Safety DisclosuresPart IIItem 5. Market For Registrant's Common Equity, Related Stockholder Matters and Issuer Purchases Of Equity SecuritiesItem 6. Selected Financial DataItem 7. Management's Discussion and Analysis Of Financial Condition and Results Of OperationsItem 7A. Quantitative and Qualitative Disclosures About Market RiskItem 8. Financial Statements and Supplementary DataItem 9. Changes in and Disagreements with Accountants on Accounting and Financial DisclosureItem 9A. Controls and ProceduresItem 9B. Other InformationPart IIIItem 10. Directors, Executive Officers and Corporate GovernanceItem 11. Executive CompensationItem 12. Security Ownership Of Certain Beneficial Owners and Management and Related Stockholder MattersItem 13. Certain Relationships and Related Transactions, and Director IndependenceItem 14. Principal Accountant Fees and ServicesPart IVItem 15. Exhibits and Financial Statement SchedulesItem 15. Exhibits