GILEAD SCIENCES INC
10-Ks and 10-Qs
|
|
|
|
|
|
|
|
|
|
|
|
|
|
|
|
|
|
|
|
|
|
|
|
|
|
|
|
|
|
|
|
|
|
|
|
|
|
|
|
|
|
|
|
|
|
|
|
|
|
|
|
|
|
|
|
UNITED STATES
SECURITIES AND EXCHANGE COMMISSION
Washington, D.C. 20549
FORM 10-K
(Mark One)
|
ý
|
ANNUAL REPORT PURSUANT TO SECTION 13 OR 15(d) OF THE SECURITIES EXCHANGE ACT OF 1934
|
For the fiscal year ended
December 31, 2017
or
|
o
|
TRANSITION REPORT PURSUANT TO SECTION 13 OR 15(d) OF THE SECURITIES EXCHANGE ACT OF 1934
|
For the transition period from to
Commission File No. 0-19731
GILEAD SCIENCES, INC.
(Exact name of registrant as specified in its charter)
|
Delaware
|
94-3047598
|
|
(State or Other Jurisdiction of Incorporation or Organization)
|
(I.R.S. Employer Identification No.)
|
|
333 Lakeside Drive, Foster City, California
|
94404
|
|
(Address of principal executive offices)
|
(Zip Code)
|
Registrant’s telephone number, including area code: 650-574-3000
SECURITIES REGISTERED PURSUANT TO SECTION 12(b) OF THE ACT:
|
Title of each class
|
Name of each exchange on which registered
|
|
Common Stock, $0.001 par value per share
|
The Nasdaq Global Select Market
|
SECURITIES REGISTERED PURSUANT TO SECTION 12(g) OF THE ACT: NONE
Indicate by check mark if the registrant is a well-known seasoned issuer, as defined in Rule 405 of the Securities Act. Yes
x
No
¨
Indicate by check mark if the registrant is not required to file reports pursuant to Section 13 or Section 15(d) of the Act. Yes
¨
No
x
Indicate by check mark whether the registrant (1) has filed all reports required to be filed by Section 13 or 15(d) of the Securities Exchange Act of 1934 during the preceding 12 months (or for such shorter period that the registrant was required to file such reports), and (2) has been subject to such filing requirements for the past 90 days. Yes
x
No
¨
Indicate by check mark whether the registrant has submitted electronically and posted on its corporate Web site, if any, every Interactive Data File required to be submitted and posted pursuant to Rule 405 of Regulation S-T (§ 232.405 of this chapter) during the preceding 12 months (or for such shorter period that the registrant was required to submit and post such files). Yes
x
No
¨
Indicate by check mark if disclosure of delinquent filers pursuant to Item 405 of Regulation S-K (§ 229.405) is not contained herein, and will not be contained, to the best of registrant’s knowledge, in definitive proxy or information statements incorporated by reference in Part III of this Form 10-K or any amendment to this Form 10-K.
¨
Indicate by check mark whether registrant is a large accelerated filer, an accelerated filer, a non-accelerated filer, or a smaller reporting company. See the definitions of “large accelerated filer,” “accelerated filer,” “smaller reporting company” and “emerging growth company” in Rule 12b-2 of the Exchange Act. (Check one):
Large accelerated filer
x
Accelerated filer
¨
Non-accelerated filer
¨
(Do not check if a smaller reporting company)
Smaller reporting company
¨
Emerging growth company
¨
If an emerging growth company, indicate by check mark if the registrant has elected not to use the extended transition period for complying with any new or revised financial accounting standards provided pursuant to Section 13(a) of the Exchange Act.
¨
Indicate by check mark whether the registrant is a shell company (as defined in Rule 12b-2 of the Exchange Act). Yes
¨
No
x
The aggregate market value of the voting and non-voting common equity held by non-affiliates of the registrant based upon the closing price of its Common Stock on the Nasdaq Global Select Market on
June 30, 2017
was
$80,416,471,495
.*
The number of shares outstanding of the registrant’s Common Stock on
February 15, 2018
was
1,309,967,781
.
DOCUMENTS INCORPORATED BY REFERENCE
Specified portions of the registrant’s proxy statement, which will be filed with the Commission pursuant to Regulation 14A in connection with the registrant’s 2018 Annual Meeting of Stockholders, to be held on May 9, 2018, are incorporated by reference into Part III of this Report.
* Based on a closing price of
$70.78
per share on
June 30, 2017
. Excludes
170,032,880
shares of the registrant’s Common Stock held by executive officers, directors and any stockholders whose ownership exceeds 5% of registrant’s common stock outstanding at
June 30, 2017
. Exclusion of such shares should not be construed to indicate that any such person possesses the power, direct or indirect, to direct or cause the direction of the management or policies of the registrant or that such person is controlled by or under common control with the registrant.
GILEAD SCIENCES, INC.
2017
Form 10-K Annual Report
Table of Contents
|
PART I
|
|
|
|
Item 1
|
||
|
Item 1A
|
||
|
Item 1B
|
||
|
Item 2
|
||
|
Item 3
|
||
|
Item 4
|
||
|
PART II
|
|
|
|
Item 5
|
||
|
Item 6
|
||
|
Item 7
|
||
|
Item 7A
|
||
|
Item 8
|
||
|
Item 9
|
||
|
Item 9A
|
||
|
Item 9B
|
||
|
PART III
|
|
|
|
Item 10
|
||
|
Item 11
|
||
|
Item 12
|
||
|
Item 13
|
||
|
Item 14
|
||
|
PART IV
|
|
|
|
Item 15
|
||
|
Item 16
|
||
We own or have rights to various trademarks, copyrights and trade names used in our business, including the following: GILEAD
®
, GILEAD SCIENCES
®
, AMBISOME
®
, AXI-CEL
TM
, BIKTARVY
®
, CAYSTON
®
, COMPLERA
®
, DESCOVY
®
, EMTRIVA
®
, EPCLUSA
®
, EVIPLERA
®
, GENVOYA
®
, GILEAD COMPASS INITIATIVE™, HARVONI
®
, HEPSERA
®
, LETAIRIS
®
, ODEFSEY
®
, RANEXA
®
, SOVALDI
®
, STRIBILD
®
, SYNNOTCH™, THROTTLE™, TRUVADA
®
, TYBOST
®
, VEMLIDY
®
, VIREAD
®
, VOLIBRIS
®
, VOSEVI
®
, YESCARTA
TM
and ZYDELIG
®
. ATRIPLA
®
is a registered trademark of Gilead Sciences, LLC. LEXISCAN
®
is a registered trademark of Astellas U.S. LLC. MACUGEN
®
is a registered trademark of Eyetech, Inc. TAMIFLU
®
is a registered trademark of Hoffmann-La Roche Inc. This report also includes other trademarks, service marks and trade names of other companies.
This Annual Report on Form 10-K, including the section entitled “Management’s Discussion and Analysis of Financial Condition and Results of Operations,” contains forward-looking statements regarding future events and our future results that are subject to the safe harbors created under the Securities Act of 1933, as amended (the Securities Act), and the Securities Exchange Act of 1934, as amended (the Exchange Act). Words such as “expect,” “anticipate,” “target,” “goal,” “project,” “hope,” “intend,” “plan,” “believe,” “seek,” “estimate,” “continue,” “may,” “could,” “should,” “might,” variations of such words and similar expressions are intended to identify such forward-looking statements. In addition, any statements other than statements of historical fact are forward-looking statements, including statements regarding overall trends, operating cost and revenue trends, liquidity and capital needs and other statements of expectations, beliefs, future plans and strategies, anticipated events or trends and similar expressions. We have based these forward-looking statements on our current expectations about future events. These statements are not guarantees of future performance and involve risks, uncertainties and assumptions that are difficult to predict. Our actual results may differ materially from those suggested by these forward-looking statements for various reasons, including those identified in Part I, Item 1A of this Form 10-K under the heading “Risk Factors.” Given these risks and uncertainties, you are cautioned not to place undue reliance on forward-looking statements. The forward-looking statements included in this report are made only as of the date hereof. Except as required under federal securities laws and the rules and regulations of the Securities and Exchange Commission (SEC), we do not undertake, and specifically decline, any obligation to update any of these statements or to publicly announce the results of any revisions to any forward-looking statements after the distribution of this report, whether as a result of new information, future events, changes in assumptions or otherwise.
2
|
ITEM 1.
|
BUSINESS
|
Overview
Gilead Sciences, Inc. (Gilead, we, our or us), incorporated in Delaware on June 22, 1987, is a research-based biopharmaceutical company that discovers, develops and commercializes innovative medicines in areas of unmet medical need. With each new discovery and investigational drug candidate, we strive to transform and simplify care for people with life-threatening illnesses around the world. We have operations in more than 35 countries worldwide, with headquarters in Foster City, California. Gilead’s primary areas of focus include HIV/AIDS, liver diseases, hematology/oncology and inflammation/respiratory diseases. We seek to add to our existing portfolio of products through our internal discovery and clinical development programs and through product acquisition and in-licensing strategies.
2017 Highlights
Over the past year, we continued to bring best-in-class drugs to market that advance the standard of care by offering enhanced modes of delivery, more convenient treatment regimens, improved resistance profiles, reduced side effects and greater efficacy. In HIV, we submitted a new drug application (NDA) with U.S. Food and Drug Administration (FDA) and a marketing authorization application (MAA) with the European Medicines Agency (EMA) for Biktarvy
®
, a once-daily single tablet regimen containing bictegravir, a novel investigational integrase strand transfer inhibitor, emtricitabine and tenofovir alafenamide (TAF) for the treatment of HIV infection in adults. In February 2018, we received approval for Biktarvy in the United States. In oncology, we acquired Kite Pharma, Inc. (Kite) in October 2017 and shortly thereafter received FDA approval for Yescarta™ (axicabtagene ciloleucel), the first chimeric antigen receptor (CAR) T cell therapy for the treatment of adult patients with relapsed or refractory large B-cell lymphoma after two or more lines of systemic therapy. The acquisition of Kite helps establish our foundation for improving the treatment of hematological malignancies and solid tumors. In liver diseases, we continued to advance the treatment of chronic hepatitis C virus (HCV) infection with the approval of Vosevi
®
(sofosbuvir/velpatasvir/voxilaprevir), a single tablet regimen for the re-treatment of adults with chronic HCV infection. In 2017, Sovaldi
®
(sofosbuvir) for the treatment of chronic HCV infection received approval in China and is the first product we launched directly in China. We also received European Commission approval of Vemlidy
®
(TAF), a once-daily treatment for adults with chronic hepatitis B virus (HBV) infection with compensated liver disease. In addition, we continued to advance our multiple ongoing clinical studies for the treatment of nonalcoholic steatohepatitis (NASH), which include the evaluation of selonsertib in two ongoing Phase 3 studies. In the area of inflammation/respiratory diseases, we continued to advance filgotinib, a JAK1 inhibitor we are developing with Galapagos NV (Galapagos), in five ongoing Phase 3 clinical trials for the potential treatment of rheumatoid arthritis, Crohn’s disease and ulcerative colitis. At the end of 2017, our research and development pipeline included 138 active clinical studies, of which 49 were Phase 3 clinical trials.
In addition to advancing treatment options across therapeutic areas, we enabled access to our medications for people who need them around the world. We continued to expand access to our medicines in low- and middle-income countries by pursuing multiple strategies, including entering into collaborations with governments, generic manufacturers, regional business partners, policy makers, healthcare providers, patient groups and public health entities. Today, more than 10 million people are receiving our HIV medicines in low- and middle-income countries. In 2017, we entered into a new licensing agreement with the Medicines Patent Pool (MPP), a United Nations-backed public health organization, to expand access to bictegravir. We also launched the Gilead COMPASS Initiative™, a 10-year, $100 million commitment to support organizations working to address the HIV/AIDS epidemic in the Southern United States.
HIV/AIDS
Our goal is to ensure that all HIV patients can choose a single tablet regimen that is right for them. Single tablet regimens allow patients to adhere to a fully suppressive course of therapy more easily and consistently, which is critical for the successful management of the disease. HIV patients are living longer, thus facing additional health challenges to those experienced by newly diagnosed patients. We are motivated to continue improving on existing treatment options. The need for efficacy together with improved long-term safety has driven our development programs and the design of the studies we have completed and those that are planned.
Our TAF single tablet regimens seek to address the diverse needs of HIV patients worldwide. TAF is a novel targeted prodrug of tenofovir that has demonstrated high antiviral efficacy similar to, and at a dose less than one-tenth that of, Viread
®
(tenofovir disoproxil fumarate, TDF), as well as improvement in surrogate laboratory markers of renal and bone safety as compared to TDF in clinical trials in combination with other antiretroviral agents. With the recent approval and launch of Biktarvy in the United States in February 2018, we now have six single tablet regimens available for the treatment of HIV, which include three TAF-
3
based single tablet regimens, Biktarvy, Genvoya
®
(elvitegravir/cobicistat/emtricitabine/TAF) and Odefsey
®
(emtricitabine/rilpivirine/TAF).
We expect approval for Biktarvy in the European Union towards the middle of 2018. Data from four Phase 3 studies evaluating Biktarvy among treatment-naïve patients and virologically suppressed patients found Biktarvy to be statistically non-inferior to regimens containing dolutegravir in combination with a dual-NRTI backbone in treatment-naïve patients and virologically suppressed patients. Biktarvy was also found to be statistically non-inferior to regimens containing a boosted protease inhibitor in virologically suppressed adult patients with HIV and demonstrated no treatment-emergent resistance at 48 weeks.
In 2017, we continued to see strong use of Truvada
®
for a pre-exposure prophylaxis (PrEP) indication for HIV prevention. We are working with the healthcare community to ensure that patients and providers have accurate information about the appropriate use of Truvada for PrEP. We have launched targeted media campaigns and provided grants to community organizations to raise awareness about PrEP among at-risk populations through education and training, and we support demonstration projects and research efforts that are seeking to identify optimal implementation strategies for PrEP as an HIV prevention tool. Descovy is currently being evaluated in Phase 3 clinical trials for potential use in PrEP.
Looking ahead, our innovation efforts in HIV continue with research directed to new treatment modalities and the pursuit of our ultimate goal - a cure.
Liver Diseases
We have advanced the treatment options and standard of care for the HCV market, including providing products to meet the needs of almost all HCV patients regardless of disease severity, genotype or prior treatment. With FDA’s approval of Sovaldi in December 2013, compared to the prior standard of care of up to 48 weeks, the duration of treatment was shortened to as few as 12 weeks and the need for peg-interferon injections in certain viral genotype populations was reduced or eliminated completely. In 2014, Harvoni
®
(ledipasvir/sofosbuvir) was approved as the first once-daily single tablet regimen for the treatment of HCV genotype 1-infected patients, the most prevalent genotype in the United States. In April 2017, FDA approved supplemental indications for Sovaldi and Harvoni for the treatment of HCV in certain pediatric patients. In 2016, Epclusa
®
(sofosbuvir/velpatasvir) was approved as our first all-oral, pan-genotypic, single tablet regimen for the treatment of adults with genotype 1-6 chronic HCV infection. Epclusa was also the first single tablet regimen approved for the treatment of patients with HCV genotype 2 and 3, without the need for ribavirin, and in August 2017, FDA approved expanded labeling for Epclusa to include use in patients co-infected with HIV. In July 2017, FDA and European Commission approved Vosevi, our once-daily, single tablet regimen for the re-treatment of adults with HCV, which offers an effective cure for patients who have failed prior therapy with other highly effective regimens.
In September 2017, we received regulatory approval of Sovaldi in China, where an estimated 10 million people are estimated to be living with HCV. We have also filed a marketing application for Vemlidy for the treatment of HBV infection in China.
In January 2017, we received European Commission approval of Vemlidy, a once-daily treatment for adults with HBV infection with compensated liver disease. Vemlidy was approved in the United States in November 2016.
We continued to advance two ongoing Phase 3 studies evaluating selonsertib, our apoptosis signal-regulating kinase 1, or ASK-1, inhibitor, for the treatment of NASH. We expect data will be available in 2019 and, if positive, will form the basis of our regulatory filing. In October 2017, we announced Phase 2 data results for GS-0976, an acetyl-CoA carboxylase (ACC) inhibitor, in patients with NASH. The data demonstrated that GS-0976 led to significant reductions in measures of liver fat and certain biomarkers of liver fibrosis compared to placebo. This is the first randomized placebo-controlled Phase 2 study of an ACC inhibitor in NASH. The study suggests that GS-0976 has a potential to play an important role in treating patients with the disease. We are also conducting Phase 2 combination studies of GS-0976 with selonsertib and the selective non-steroidal FXR agonist, GS-9674 in patients with NASH.
Hematology/Oncology
In October 2017, we completed our acquisition of Kite, which helped establish us as a leader in cellular therapy and provides a foundation from which we will drive continued innovation for people with advanced cancers. Kite’s cell therapies express either a CAR or an engineered T cell receptor, depending on the type of cancer. In October 2017, Yescarta, a CAR T cell therapy, was approved by FDA, making it the first CAR T cell therapy for the treatment of adult patients with relapsed or refractory large B-cell lymphoma after two or more lines of systemic therapy, which includes diffuse large B-cell lymphoma (DLBCL) not otherwise specified, primary mediastinal B-cell lymphoma (PMBCL), high-grade B-cell lymphoma, and DLBCL arising from follicular lymphoma (transformed follicular lymphoma or TFL). We expect European Commission approval of Yescarta during the first half of 2018. Additional studies of Yescarta for other indications are underway. Kite has additional candidates in clinical trials in both hematologic cancers and solid tumors, including KITE-585, a CAR T cell therapy candidate that targets B-cell maturation antigen in patients with relapsed/refractory multiple myeloma.
4
In December 2017, we acquired Cell Design Labs, Inc. (Cell Design Labs), a pre-clinical stage company with significant expertise in custom cell engineering. The company is developing two proprietary technology platforms: synNotch™, a synthetic gene expression system that responds to external cues which, among other applications, can be deployed to engineer CAR T cells that require dual antigen recognition for activation, and Throttle ™, an “on switch” that modulates CAR T cell activity using small molecules. The addition of these technologies to existing Kite research and development programs could lead to the treatment of a broader range of hematological malignancies and solid tumors and potentially offer improved selectivity and safety of future treatments.
In 2017, we continued to advance the ongoing Phase 3 study of andecaliximab, a MMP9 mAb inhibitor, in combination with mFOLFOX6, for the treatment of gastric cancer. We are also conducting a Phase 2 study of andecaliximab in combination with nivolumab versus nivolumab alone. This study is expected to be completed in the first quarter of 2018.
Inflammation/Respiratory Diseases
In 2017, we continued to advance five ongoing Phase 3 clinical trials of filgotinib, a JAK1 inhibitor we are developing with Galapagos, for the potential treatment of rheumatoid arthritis, Crohn’s disease and ulcerative colitis. Filgotinib is also being investigated in five Phase 2 studies for the treatment of other inflammatory diseases, including psoriatic arthritis, ankylosing spondylitis, lupus, Sjogren’s syndrome and uveitis.
Our Products
HIV/AIDS
|
•
|
Biktarvy
is an oral formulation dosed once a day for the treatment of HIV-1 infection in certain patients. Biktarvy is a fixed-dose combination of our antiretroviral medications, bictegravir, emtricitabine and TAF.
|
|
•
|
Descovy
is an oral formulation indicated in combination with other antiretroviral agents for the treatment of HIV-1 infection in adults and pediatric patients 12 years of age or older. Descovy is a fixed-dose combination of our antiretroviral medications, emtricitabine and TAF.
|
|
•
|
Odefsey
is an oral formulation dosed once a day for the treatment of HIV-1 infection in certain patients. Odefsey is a fixed-dose combination of our antiretroviral medications, emtricitabine and TAF, and rilpivirine hydrochloride marketed by Janssen Sciences Ireland UC (Janssen), one of the Janssen Pharmaceutical Companies of Johnson & Johnson.
|
|
•
|
Genvoya
is an oral formulation dosed once a day for the treatment of HIV-1 infection in adults. Genvoya is a single tablet regimen for the treatment of HIV and is a fixed-dose combination of our antiretroviral medicines, elvitegravir, cobicistat, emtricitabine and TAF.
|
|
•
|
Stribild
®
(elvitegravir/cobicistat/emtricitabine/TDF) is an oral formulation dosed once a day for the treatment of HIV-1 infection in treatment-naïve adults. Stribild is a single tablet regimen for the treatment of HIV and is a fixed-dose combination of our antiretroviral medications, elvitegravir, cobicistat, TDF and emtricitabine.
|
|
•
|
Complera
®
/Eviplera
®
(emtricitabine/rilpivirine/TDF) is an oral formulation dosed once a day for the treatment of HIV-1 infection in adults. The product, marketed in the United States as Complera and in Europe as Eviplera, is a single tablet regimen for the treatment of HIV and is a fixed-dose combination of our antiretroviral medications, TDF and emtricitabine, and Janssen’s rilpivirine.
|
|
•
|
Atripla
®
(efavirenz/emtricitabine/TDF) is an oral formulation dosed once a day for the treatment of HIV infection in adults. Atripla is a single tablet regimen for HIV intended as a stand-alone therapy or in combination with other antiretrovirals. It is a fixed-dose combination of our antiretroviral medications, TDF and emtricitabine, and Bristol-Myers Squibb Company’s (BMS’s) efavirenz.
|
|
•
|
Truvada
(emtricitabine/TDF) is an oral formulation dosed once a day as part of combination therapy to treat HIV infection in adults. It is a fixed-dose combination of our antiretroviral medications, TDF and emtricitabine. FDA also approved Truvada for a PrEP indication, in combination with safer sex practices, to reduce the risk of sexually acquired HIV-1 infection in adults at high risk.
|
|
•
|
Viread
is an oral formulation of a nucleotide analog reverse transcriptase inhibitor, dosed once a day as part of combination therapy to treat HIV infection in patients two years of age and older. The European Commission also approved the use of Viread in combination with other antiretroviral agents for the treatment of HIV-1-infected adolescent patients aged two to less than 18 years with nucleoside reverse transcriptase inhibitor resistance or toxicities precluding the use of first-line pediatric agents. Viread is also approved for the treatment of HBV.
|
5
|
•
|
Emtriva
®
is an oral formulation of a nucleoside analog reverse transcriptase inhibitor, dosed once a day as part of combination therapy to treat HIV infection in adults. In the United States and Europe, Emtriva is also available as an oral solution approved as part of combination therapy to treat HIV infection in children.
|
|
•
|
Tybost
®
is a pharmacokinetic enhancer dosed once a day that boosts blood levels of certain HIV medicines. Tybost is indicated as a boosting agent for the HIV protease inhibitors atazanavir and darunavir as part of antiretroviral combination therapy in adults with HIV-1 infection.
|
Liver Diseases
|
•
|
Vosevi
is an oral formulation of a once-daily, single tablet regimen of sofosbuvir, velpatasvir and voxilaprevir for the re-treatment of HCV infection in adults with genotype 1, 2, 3, 4, 5 or 6 previously treated with an NS5A inhibitor-containing regimen, or with genotype 1a or 3 previously treated with a sofosbuvir-containing regimen without an NS5A inhibitor.
|
|
•
|
Vemlidy
is an oral formulation of a once-daily treatment of TAF for adults with HBV infection with compensated liver disease.
|
|
•
|
Epclusa
is an oral formulation of sofosbuvir and velpatasvir and the first pan-genotypic, single tablet regimen for the treatment of adults with genotype 1-6 chronic infection. Epclusa is also the first single tablet regimen approved for the treatment of patients with HCV genotype 2 and 3, without the need for ribavirin. Epclusa for 12 weeks was approved in patients without cirrhosis or with compensated cirrhosis (Child-Pugh A), and in combination with ribavirin for patients with decompensated cirrhosis (Child-Pugh B or C). In 2017, FDA approved expanded labeling for Epclusa to include use in patients co-infected with HIV.
|
|
•
|
Harvoni
is an oral formulation of ledipasvir and sofosbuvir dosed once a day for the treatment of genotypes 1, 4, 5 and 6, HCV/HIV-1 co-infection, HCV genotype 1 and 4 liver transplant recipients, and genotype 1-infected patients with decompensated cirrhosis. In 2017, FDA approved supplemental indications for Harvoni for the treatment of genotype 1, 4, 5 or 6 chronic HCV infection in adolescents without cirrhosis or with compensated cirrhosis, 12 years of age or older, or at least 35kg. In Europe, Harvoni is also indicated for certain patients with HCV genotype 4 infection, HCV genotype 3 infection with cirrhosis and/or prior treatment failure and those with HCV/HIV-1 co-infection.
|
|
•
|
Sovaldi
is an oral formulation of sofosbuvir dosed once a day for the treatment of HCV as a component of a combination antiviral treatment regimen. Sovaldi’s efficacy has been established in patients with HCV genotypes 1, 2, 3 or 4 infection (in the United States and Europe) and genotypes 5 and 6 infection (in Europe), including those with hepatocellular carcinoma meeting Milan criteria (awaiting liver transplantation) and those with HCV/HIV-1 co-infection. In 2017, FDA approved supplemental indications for Sovaldi, in combination with ribavirin, for the treatment of genotype 2 or 3 chronic HCV infection in adolescents without cirrhosis or with compensated cirrhosis, 12 years of age or older, or at least 35kg.
|
|
•
|
Viread
is an oral formulation of a nucleotide analog reverse transcriptase inhibitor, dosed once a day for the treatment of HBV in adults with compensated and decompensated liver disease. We licensed to GlaxoSmithKline Inc. (GSK) the rights to commercialize Viread for the treatment of HBV in China, Japan and Saudi Arabia. The European Commission approved the use of Viread for the treatment of HBV infection in adolescent patients aged 12 to less than 18 years with compensated liver disease and evidence of immune active disease. Viread is also approved for the treatment of HIV infection.
|
|
•
|
Hepsera
®
(adefovir dipivoxil) is an oral formulation of a nucleotide analog polymerase inhibitor, dosed once a day to treat HBV in patients 12 years of age and older. We licensed to GSK the rights to commercialize Hepsera for the treatment of HBV in Asia Pacific, Latin America and certain other territories.
|
Hematology/Oncology
|
•
|
Yescarta
(axicabtagene ciloleucel) is the first CAR T cell therapy for the treatment of adult patients with relapsed or refractory large B-cell lymphoma after two or more lines of systemic therapy, including DLBCL not otherwise specified, PMBCL, high-grade B-cell lymphoma and DLBCL arising from TFL. Yescarta is currently under review with EMA and potential approval is expected in the first half of 2018.
|
|
•
|
Zydelig
®
(idelalisib) is a first-in-class PI3K delta inhibitor for the treatment of certain blood cancers. In the United States, Zydelig is approved in combination with rituximab for patients with relapsed chronic lymphocytic leukemia (CLL) for whom rituximab alone would be considered appropriate therapy and as monotherapy for patients with relapsed follicular B-cell non-Hodgkin lymphoma (FL) and small lymphocytic lymphoma who have received at least two prior systemic therapies. In the European Union, Zydelig is approved for the treatment of CLL and FL.
|
6
Cardiovascular
|
•
|
Letairis
®
(ambrisentan) is an oral formulation of an endothelin receptor antagonist indicated for the treatment of pulmonary arterial hypertension (PAH) (WHO Group I) in patients with WHO Class II or III symptoms to improve exercise capacity and delay clinical worsening. We sublicensed to GSK the rights to ambrisentan, marketed by GSK as Volibris
®
(ambrisentan), for PAH in territories outside of the United States.
|
|
•
|
Ranexa
®
(ranolazine) is an extended-release tablet for the treatment of chronic angina. We licensed to Menarini International Operations Luxembourg SA the rights to Ranexa in territories outside of the United States.
|
|
•
|
Lexiscan
®
(regadenoson) injection is indicated for use as a pharmacologic stress agent in radionuclide myocardial perfusion imaging, a test that detects and characterizes coronary artery disease, in patients unable to undergo adequate exercise stress. Astellas US LLC (Astellas) has exclusive rights to manufacture and sell regadenoson under the name Lexiscan in the United States. Rapidscan Pharma Solutions, Inc. (RPS) holds the exclusive right to manufacture and sell regadenoson under the name Rapiscan
®
in Europe and certain territories outside the United States. We receive royalties from Astellas and RPS for sales in these territories.
|
Inflammation/Respiratory
|
•
|
Cayston
®
(aztreonam for inhalation solution) is an inhaled antibiotic for the treatment of respiratory systems in cystic fibrosis patients seven years of age and older with
Pseudomonas aeruginosa (P. aeruginosa)
.
|
|
•
|
Tamiflu
®
(oseltamivir phosphate) is an oral antiviral available in capsule form for the treatment and prevention of influenza A and B. Tamiflu is approved for the treatment of influenza in children and adults in more than 60 countries, including the United States, Japan and the European Union. Tamiflu is also approved for the prevention of influenza in children and adults in the United States, Japan and the European Union. We developed Tamiflu with F. Hoffmann-La Roche Ltd (together with Hoffmann-La Roche Inc., Roche). Roche has the exclusive right to manufacture and sell Tamiflu worldwide, subject to its obligation to pay us royalties based on a percentage of the net sales of Tamiflu.
|
Other
|
•
|
AmBisome
®
(amphotericin B liposome for injection) is a proprietary liposomal formulation of amphotericin B, an antifungal agent to treat serious invasive fungal infections caused by various fungal species in adults. Our corporate partner, Astellas Pharma US, Inc., promotes and sells AmBisome in the United States and Canada, and we promote and sell AmBisome in Europe, Australia and New Zealand.
|
|
•
|
Macugen
®
(pegaptanib sodium injection) is an intravitreal injection of an anti-angiogenic oligonucleotide for the treatment of neovascular age-related macular degeneration. Macugen was developed by Eyetech Inc. (Eyetech) using technology licensed from us and is now promoted in the United States by Valeant Pharmaceuticals, Inc. (Valeant), which acquired Eyetech in 2012. Valeant holds the exclusive rights to manufacture and sell Macugen in the United States, and Pfizer Inc. (Pfizer) holds the exclusive rights to manufacture and sell Macugen in the rest of the world. We receive royalties from Valeant and Pfizer based on worldwide sales of Macugen.
|
Antiviral product sales, which include sales of our HIV, HBV and HCV products, were
$23.3 billion
,
$27.7 billion
and
$30.2 billion
in 2017, 2016 and 2015, respectively, and represented
89%
of our total revenues in 2017, 91% of our total revenues in 2016 and 93% of our total revenues in 2015. Sales of our other products were
$2.3 billion
,
$2.2 billion
and
$1.9 billion
in 2017, 2016 and 2015, respectively, and represented
9%
of our total revenues in 2017, 7% of our total revenues in 2016 and 6% of our total revenues in 2015. See Management’s Discussion and Analysis of Financial Condition and Results of Operations included in Part II, Item 7 and Note
16
, Segment Information of the Notes to Consolidated Financial Statements included in Part II, Item 8 of this Annual Report on Form 10-K for additional information related to sales by product.
Commercialization and Distribution
We have U.S. and international commercial sales operations, with marketing subsidiaries in over 35 countries. Our products are marketed through our commercial teams and/or in conjunction with third-party distributors and corporate partners. Our commercial teams promote our products through direct field contact with physicians, hospitals, clinics and other healthcare providers. We generally grant our third-party distributors the exclusive right to promote our product in a territory for a specified period of time. Most of our agreements with these distributors provide for collaborative efforts between the distributor and Gilead in obtaining and maintaining regulatory approval for the product in the specified territory.
We sell and distribute most of our products in the United States exclusively through the wholesale channel. Our product sales to three large wholesalers, McKesson Corporation, AmerisourceBergen Corporation and Cardinal Health, Inc. each accounted for more than 10% of total revenues for each of the years ended
December 31, 2017
,
2016
and
2015
. On a combined basis, in
7
2017
, these wholesalers accounted for approximately
89%
of our product sales in the United States and approximately
62%
of our total worldwide revenues. We sell and distribute our products in Europe and countries outside the United States where the product is approved, either through our commercial teams, third-party distributors or corporate partners.
U.S. Patient Access
We make it a priority to increase access to our medicines for people who can benefit from them, regardless of their ability to pay. In the United States, our patient support programs help patients and their families by providing information regarding insurance coverage, financial assistance and eligibility for free medication. We make our therapies accessible for uninsured individuals and those who need financial assistance. We also support programs for those unable to afford the co-payments associated with commercial health insurance programs. Half of all patients taking our HIV medicines in the United States already receive them through federal and state programs at substantially discounted prices. We also have a long history of working with state AIDS Drug Assistance Programs (ADAPs) to provide lower pricing for our HIV medicines. The price freeze we instituted for ADAPs in 2008 was extended in 2013 through the end of 2018, providing important support to these critical programs as they evolve in the changing U.S. healthcare environment.
Our corporate giving program aims to reduce disparities, provide access, advance education programs and support local communities. For example, in 2017, we launched the Gilead COMPASS Initiative, a 10-year, $100 million commitment to support organizations working to address the HIV/AIDS epidemic in the Southern United States.
Developing World Access
Under the Gilead Access Program, established in 2003, certain products for HIV/AIDS, viral hepatitis and visceral leishmaniasis are available at substantially reduced prices in the developing world. Today, more than 10 million people are receiving our HIV medicines in low- and middle-income countries. We have entered into a number of collaborations related to access to our products in the developing world, which include:
|
•
|
Licenses with Generic Manufacturers.
We have entered into voluntary license agreements with generic manufacturers in India, South Africa and China, which allows them to manufacture generic versions of HIV and HBV products incorporating our licensed compounds, TAF, cobicistat, elvitegravir and bictegravir for distribution in certain low- and middle-income countries. We have also entered into licensing agreements with generic manufacturers in India, Egypt and Pakistan to produce and distribute generic versions of our HCV products to certain low- and middle-income countries.
|
|
•
|
Medicines Patent Pool (MPP).
We have entered into a voluntary license agreement with the MPP, a United Nations-backed public health organization, to sub-license rights to generic manufacturers in India, China and South Africa to manufacture generic versions of HIV and HBV products incorporating our licensed compounds, TAF, cobicistat, elvitegravir and bictegravir for distribution in certain low- and middle-income countries.
|
|
•
|
Special Partnerships.
We work with national governments and local organizations to increase access to our HIV and HCV medicines and strengthen healthcare systems. Recent partnerships include:
|
|
◦
|
We partner with the Spouses of Carribean Leaders Action Network (SCLAN) to address the high incidence of HIV in the region and the elimination of mother-to-child transmission by raising awareness and supporting HIV prevention efforts. We also partner with the Organization of Africa First Ladies Against HIV/AIDS (OAFLA) to eliminate mother-to-child transmission of HIV and help end the AIDS epidemic across the continent. We are committed to helping the SCLAN and OAFLA leaders exchange and build collaborations maximizing the synergies across the regions.
|
|
◦
|
We supported an HCV elimination program in Arkhangai, Mongolia by donating enough Harvoni to treat the entire adult population, for which the HCV prevalence was 18%. The government of Arkhangai screened and treated these adults over the course of 12 months in 2017.
|
|
◦
|
Since 2015, we have partnered with the government of the Republic of Georgia and the U.S. Centers for Disease Control and Prevention to provide free HCV medicines to all those affected by the disease in the country and to collaborate with the government and healthcare professional across the country to expand its health systems infrastructure.
|
Competition
Our marketed products target a number of areas, including HIV/AIDS, liver diseases, hematology/oncology, inflammation/respiratory, cardiovascular and other diseases. There are many commercially available products for the treatment of these diseases. We face significant competition from large global pharmaceutical and biotechnology companies, specialized pharmaceutical firms and generic drug manufacturers. Our products compete with other available products based primarily on efficacy, safety, tolerability,
8
acceptance by doctors, ease of patient compliance, ease of use, price, insurance and other reimbursement coverage, distribution and marketing. As our products mature, private insurers and government payers often reduce the amount they will reimburse patients, which increases pressure on us to reduce prices. Further, as new branded or generic products are introduced into major markets, our ability to maintain pricing and market share may be affected.
Our HIV/AIDS Products
The HIV landscape is becoming more competitive and complex as treatment trends continue to evolve. A growing number of HIV drugs are currently in the market. Competition from current and expected competitors may erode the revenues we receive from sales of our HIV products. Our HIV products compete primarily with products from ViiV Healthcare Company (ViiV), which markets fixed-dose combination products that compete with Biktarvy, Descovy, Odefsey, Genvoya, Stribild, Complera/Eviplera, Atripla and Truvada. For example, products marketed by ViiV, including Tivicay (dolutegravir), Triumeq (abacavir/dolutegravir/lamivudine) and Juluca (dolutegravir/rilpivirine), compete with our HIV products. In addition, ViiV’s lamivudine competes with emtricitabine, the active pharmaceutical ingredient of Emtriva and a component of Biktarvy, Descovy, Odefsey, Genvoya, Stribild, Complera/Eviplera, Atripla and Truvada. For Tybost, we compete with ritonavir, marketed by AbbVie Inc. (AbbVie). Most of our HIV products contain TAF, TDF and/or emtrictabine, which belong to the nucleoside class of antiviral therapeutics. If the treatment paradigm for HIV changes, our market share would likely decline.
We also face competition from generic HIV products. Generic versions of lamivudine and Combivir (lamivudine and zidovudine) are available in the United States and certain other countries. Generic versions of efavirenz, a component of our Atripla, are now available in the United States, Canada and Europe. We have observed some pricing pressure related to the efavirenz component of our Atripla sales. In addition, TDF, one of the active pharmaceutical ingredients in Stribild, Complera/Eviplera, Atripla and Truvada, and the main active pharmaceutical ingredient in Viread, faces generic competition in the European Union, the United States and certain other countries. In addition, because emtricitabine, the other active pharmaceutical ingredient of Truvada, faces generic competition in the European Union, Truvada also faces generic competition in the European Union and certain other countries outside of the United States.
Our Liver Diseases Products
We continue to face competition in the HCV market. Our HCV products, Vosevi, Epclusa, Harvoni and Sovaldi, compete primarily with Mavyret (glecaprevir/pibrentasvir) marketed by AbbVie and Zepatier (elbasvir and grazoprevir) marketed by Merck & Co. Inc. Our HCV product revenues have declined and are expected to further decline as a result of increased competition from new HCV products, which has further eroded our net pricing and market share. We expect pricing pressure in the HCV market to continue.
Our HBV products, Vemlidy, Viread and Hepsera, face competition from existing therapies for treating patients with HBV. Our HBV products face competition from generic versions of TDF. Our HBV products also compete with Baraclude (entecavir), an oral nucleoside analog marketed by BMS, as well as generic entecavir, and Tyzeka/Sebivo (telbivudine), an oral nucleoside analog marketed by Novartis Pharmaceuticals Corporation (Novartis).
Our Hematology/Oncology Products
Yescarta is expected to compete with other companies developing advanced T cell therapies for the treatment of relapsed/refractory diffuse large B-cell lymphoma, including Novartis.
Our Other Products
Letairis competes with Tracleer (bosentan) and Opsumit (macitentan) marketed by Actelion Pharmaceuticals US, Inc. and also with Adcirca (tadalafil) marketed by United Therapeutics Corporation and Pfizer. Letairis is also expected to face generic competition in the United States starting in July 2018.
Ranexa competes predominantly with generic compounds from three distinct classes of drugs for the treatment of chronic angina in the United States, including generic and/or branded beta-blockers, calcium channel blockers and long-acting nitrates. Ranexa is also expected to face generic competition in the United States starting in 2019.
In addition, a number of companies are pursuing the development of technologies which are competitive with our existing products or research programs. These competing companies include specialized pharmaceutical firms and large pharmaceutical companies acting either independently or together with other pharmaceutical companies. Furthermore, academic institutions, government agencies and other public and private organizations conducting research may seek patent protection and may establish collaborative arrangements for competitive products and programs. If any of these competitors gain market share as a result of new technologies, commercialization strategies or otherwise, it could adversely affect our results of operations and stock price.
9
Collaborative Relationships
As part of our business strategy, we establish collaborations with other companies, universities and medical research institutions to assist in the clinical development and/or commercialization of certain of our products and product candidates and to provide support for our research programs. We also evaluate opportunities for acquiring products or rights to products and technologies that are complementary to our business from other companies, universities and medical research institutions. For more information regarding certain of these relationships, including their ongoing financial and accounting impact on our business, see Note 10, Collaborative Arrangements of the Notes to Consolidated Financial Statements included in Part II, Item 8 of this Annual Report on Form 10-K.
Commercial Collaborations
Although we currently have a number of collaborations with corporate partners for the manufacture, sale, distribution and/or marketing of our products in various territories worldwide, the following commercial collaborations are those that are most significant to us from a financial statement perspective and where significant ongoing collaboration activity exists.
|
•
|
BMS
|
North America
In 2004, we entered into a collaboration arrangement with BMS to develop and commercialize a single tablet regimen containing our Truvada and BMS’s Sustiva (efavirenz) in the United States and Canada. This combination was approved for use in the United States in 2006 and is sold under the brand name Atripla. We and BMS structured this collaboration as a joint venture that operated as a limited liability company, which we consolidated. We and BMS granted royalty-free sublicenses to the joint venture for the use of our respective company owned technologies and, in return, were granted certain licenses by the joint venture to use the intellectual property resulting from the collaboration. The economic interests of the joint venture held by us and BMS (including the sharing of revenues and out-of-pocket expenses) were based on the portion of the net selling price of Atripla attributable to Truvada and efavirenz. Since the net selling price for Truvada changed over time relative to the net selling price of efavirenz, both our and BMS’s respective economic interests in the joint venture varied annually over the course of the collaboration.
Under the agreement, either party could terminate the other party’s participation in the collaboration within 30 days after the launch of at least one generic version of such other party’s single agent products (or double agent products). The terminating party then had the right to continue to sell Atripla and become the continuing party, but was obligated to pay the terminated party certain royalties for a three-year period following the effective date of the termination.
In December 2017, a generic version of efavirenz was launched in the United States. Upon the generic version launch, we terminated BMS’s participation in the collaboration and became the continuing party and the sole owner of the joint venture. December 31, 2017 was the last day of the collaboration. As a result of the termination and the transfer to Gilead of BMS’s ownership interest in the joint venture, we consolidate the limited liability company as a wholly-owned subsidiary. BMS no longer has any ownership interest in the joint venture and is not permitted to commercialize Atripla in the United States and Canada, but is entitled to receive from us certain royalties on net sales of Atripla for the next three calendar years, on a declining annual scale. We may continue to purchase efavirenz from BMS as needed to continue manufacturing Atripla for the United States and Canada markets.
Europe
In 2007, Gilead Sciences Ireland UC, our wholly-owned subsidiary, and BMS entered into a collaboration agreement which sets forth the terms and conditions under which we and BMS commercialize and distribute Atripla in the European Union, Iceland, Liechtenstein, Norway and Switzerland (collectively, the European Territory). The parties formed a limited liability company which we consolidate, to manufacture Atripla for distribution in the European Territory using efavirenz that it purchases from BMS at BMS’s estimated net selling price of efavirenz in the European Territory. We are responsible for manufacturing, product distribution, inventory management and warehousing. Through our local subsidiaries, we have primary responsibility for order fulfillment, collection of receivables, customer relations and handling of sales returns in all the territories where we and BMS promote Atripla. In general, the parties share revenues and out-of-pocket expenses in proportion to the net selling prices of the components of Atripla, Truvada and efavirenz.
Starting in 2012, except for a limited number of activities that are jointly managed, the parties no longer coordinate detailing and promotional activities in the European Territory. We are responsible for accounting, financial reporting and tax reporting for the collaboration. As of December 31, 2017 and 2016, efavirenz purchased from BMS at BMS’s estimated net selling price of efavirenz in the European Territory is included in Inventories on our Consolidated Balance Sheets.
10
The parties also formed a limited liability company to hold the marketing authorization for Atripla in the European Territory. We have primary responsibility for regulatory activities. In the major market countries, both parties have agreed to independently continue to use commercially reasonable efforts to promote Atripla.
The agreement will terminate upon the expiration of the last-to-expire patent which affords market exclusivity to Atripla or one of its components in the European Territory. In addition, since December 31, 2013, either party may terminate the agreement for any reason and such termination will be effective two calendar quarters after notice of termination. The non-terminating party has the right to continue to sell Atripla and become the continuing party, but will be obligated to pay the terminating party certain royalties for a three-year period following the effective date of the termination. In the event the continuing party decides not to sell Atripla, the effective date of the termination will be the date Atripla is withdrawn in each country or the date on which a third party assumes distribution of Atripla, whichever is earlier.
|
•
|
Janssen
|
In 2009, we entered into a license and collaboration agreement with Janssen Sciences Ireland UC (Janssen), formerly Tibotec Pharmaceuticals, to develop and commercialize a fixed-dose combination of our Truvada and Janssen’s non-nucleoside reverse transcriptase inhibitor rilpivirine. This combination was approved in the United States and European Union in 2011 and is sold under the brand name Complera in the United States and Eviplera in the European Union. Under this original agreement, Janssen granted us an exclusive license to Complera/Eviplera worldwide excluding certain middle income and developing world countries and Japan.
We are responsible for manufacturing Complera/Eviplera and Odefsey and have the lead role in registration, distribution and commercialization of both products except in the countries where Janssen distributes. Janssen has exercised a right to co-detail the combination product in some of the countries where Gilead is the selling party.
Either party may terminate the collaboration agreement with respect to a product and a country if the product is withdrawn from the market in such country or with respect to a product in all countries if the other party materially breaches the agreement with respect to a product. The agreement and the parties’ obligation to share revenues will expire on a product-by-product and country-by-country basis as Janssen patents providing exclusivity for the product expire or, if later, on the tenth anniversary of commercial launch for such product. We may terminate the agreement without cause with respect to the countries where we sell the products in which case Janssen has the right to become the selling party for such country if the product has launched but has been on the market for fewer than 10 years.
|
•
|
Japan Tobacco
|
In 2005, Japan Tobacco Inc. (Japan Tobacco) granted us exclusive rights to develop and commercialize elvitegravir, a novel HIV integrase inhibitor, in all countries of the world, excluding Japan, where Japan Tobacco retained such rights. Under the agreement, we are responsible for seeking regulatory approval in our territories and are required to use diligent efforts to commercialize elvitegravir for the treatment of HIV infection. We bear all costs and expenses associated with such commercialization efforts.
We received approval of Stribild (an elvitegravir-containing product) from FDA in August 2012 and from the European Commission in May 2013. We received approval of Genvoya (an elvitegravir-containing product) from FDA and the European Commission in November 2015.
The agreement and our obligation to pay royalties to Japan Tobacco will terminate on a product-by-product basis as patents providing exclusivity for the product expire or, if later, on the tenth anniversary of commercial launch for such product. We may terminate the agreement for any reason in which case the license granted by Japan Tobacco to us would terminate. Either party may terminate the agreement in response to a material breach by the other party.
Research Collaborations
We have a number of collaborations with partners for the research and development (R&D) of certain compounds and drug candidates. None of our research collaborations are significant to us from a financial statement perspective.
Research and Development
Our R&D philosophy and strategy are to develop best-in-class drugs that improve safety or efficacy for unmet medical needs. We intend to continue committing significant resources to internal R&D opportunities and external business development activity.
Our product development efforts cover a wide range of medical conditions, including HIV/AIDS, liver diseases, hematology/oncology, and inflammation/respiratory diseases. We have research scientists primarily in Foster City and Santa Monica, California; Seattle, Washington; and Alberta, Canada engaged in the discovery and development of new molecules and technologies that we hope will lead to the approval of new medicines that will advance the current standard of care and address unmet medical needs.
11
The development of our product candidates is subject to various risks and uncertainties. These risks and uncertainties include our ability to enroll patients in clinical trials, the possibility of unfavorable results of our clinical trials, the need to modify or delay our clinical trials or to perform additional trials and the risk of failing to obtain regulatory approvals. As a result, our product candidates may never be successfully commercialized. Drug development is inherently risky and many product candidates fail during the drug development process.
Below is a summary of our key product candidates and their corresponding current stages of development.
Product Candidates for the Treatment of HIV/AIDS
|
Product Candidates
|
Description
|
|
|
Product in Phase 3
|
||
|
Descovy
|
Descovy is being evaluated for a PrEP indication.
|
|
|
Products in Phase 1
|
||
|
GS-9620
|
GS-9620, a TLR-7 agonist, is being evaluated for the treatment of HIV infection.
|
|
|
GS-9722
|
GS-9722, a broadly neutralizing antibody (bNab), is being evaluated for the treatment of HIV infection.
|
|
Product Candidates for the Treatment of Liver Diseases
|
Product Candidates
|
Description
|
|
|
Product in Phase 3
|
||
|
Selonsertib
|
Selonsertib, an ASK-1 inhibitor, is being evaluated for the treatment of NASH.
|
|
|
Products in Phase 2
|
||
|
Selonsertib
|
Selonsertib is being evaluated for the treatment of alcoholic hepatitis.
|
|
|
GS-0976
|
GS-0976, an ACC inhibitor, is being evaluated for the treatment of NASH.
|
|
|
GS-9674
|
GS-9674, a FXR agonist, is being evaluated for the treatment of NASH, primary biliary cirrhosis and primary sclerosing cholangitis.
|
|
|
Product in Phase 1
|
||
|
GS-9688
|
GS-9688, a TLR-8 agonist, is being evaluated for the treatment of HBV infection.
|
|
12
Product Candidates for the Treatment of Hematology/Oncology
|
Product Candidates
|
Description
|
|
|
Products in Phase 3
|
||
|
Andecaliximab
|
Andecaliximab, a MMP9 mAb inhibitor, is being evaluated for the treatment of gastric cancer.
|
|
|
Axicabtagene ciloleucel
|
Axicabtagene ciloleucel is being evaluated for the treatment of second line diffuse large B-cell lymphoma.
|
|
|
Idelalisib
|
Idelalisib, a PI3K delta inhibitor, is being evaluated for the treatment of relapsed refractory chronic lymphocytic leukemia.
|
|
|
Products in Phase 2
|
||
|
Axicabtagene ciloleucel
|
Axicabtagene ciloleucel is being evaluated for the treatment of indolent non-Hodgkin lymphoma. Axicabtagene ciloleucel is also being evaluated for the treatment of diffuse large B-cell lymphoma in combination with anti-PD-L1 mAB.
|
|
|
Entospletinib
|
Entospletinib, a Syk inhibitor, is being evaluated for the treatment of hematological malignancies.
|
|
|
Tirabrutinib
|
Tirabrutinib, a BTK inhibitor, is being evaluated for the treatment of B-cell malignancies.
|
|
|
KTE-C19
|
KTE-C19, a CAR T cell therapy, is being evaluated for the treatment of mantle cell lymphoma.
|
|
|
Products in Phase 1
|
||
|
Andecaliximab
|
Andecaliximab is being evaluated for the treatment of solid tumors.
|
|
|
GS-5829
|
GS-5829, a BET inhibitor, is being evaluated for the treatment of solid tumors.
|
|
|
KTE-C19
|
KTE-C19 is being evaluated for the treatment of adult and pediatric acute lymphoblastic leukemia.
|
|
|
KITE-585
|
KITE-585, an anti-BCMA, is being evaluated for the treatment of multiple myeloma.
|
|
|
KITE-718
|
KITE-718, a MAGE A3/A6, is being evaluated for the treatment of solid tumors.
|
|
Product Candidates for the Treatment of Inflammation/Respiratory Diseases
|
Product Candidates
|
Description
|
|
|
Product in Phase 3
|
||
|
Filgotinib
|
Filgotinib, a JAK1 inhibitor, is being evaluated for the treatment of rheumatoid arthritis, Crohn’s disease and ulcerative colitis.
|
|
|
Products in Phase 2
|
||
|
Filgotinib
|
Filgotinib is being evaluated for the treatment of various inflammatory diseases.
|
|
|
Presatovir
|
Presatovir, a fusion inhibitor, is being evaluated for the treatment of respiratory syncytial virus.
|
|
|
GS-9876
|
GS-9876, a Syk inhibitor, is being evaluated for the treatment of Sjogren’s syndrome and lupus.
|
|
Other Product Candidates
|
Product Candidate
|
Description
|
|
|
Product in Phase 2
|
||
|
GS-5734
|
GS-5734, a Nuc inhibitor, is being evaluated for the treatment of Ebola virus infection.
|
|
In total, our R&D expenses were
$3.7 billion
for
2017
,
$5.1 billion
for
2016
and
$3.0 billion
for
2015
. R&D expenses
decreased
27%
in
2017
compared to
2016
, primarily due to the 2016 impacts of business development activities resulting in up-front collaboration expense related to our license and collaboration agreement with Galapagos and acquired in-process R&D (IPR&D) expense related to our purchase of Nimbus Apollo, Inc. (Nimbus), IPR&D impairment charges and ongoing milestone payments, partially offset by acquired IPR&D expense related to our purchase of Cell Design Labs in 2017.
In addition to our internal discovery and clinical development programs, we seek to add to our portfolio of products through product acquisitions, licenses and collaborations.
13
In 2017, we acquired Kite and shortly thereafter received FDA approval for axicabtagene ciloleucel, now known commercially as Yescarta, making it the first CAR T cell therapy for the treatment of adult patients with relapsed or refractory large B-cell lymphoma after two or more lines of systemic therapy, which includes DLBCL, TFL and PMBCL. We expect European Commission approval of Yescarta in the first half of 2018. Additional studies of Yescarta for other indications are underway. Kite has additional candidates in clinical trials in both hematologic cancers and solid tumors, including KITE-585, a CAR T cell therapy candidate that targets B-cell maturation antigen in patients with relapsed/refractory multiple myeloma.
In 2017, we also acquired Cell Design Labs, a pre-clinical stage company with significant expertise in custom cell engineering. The company is developing two proprietary technology platforms: synNotch, a synthetic gene expression system that responds to external cues which, among other applications, can be deployed to engineer CAR T cells that require dual antigen recognition for activation, and Throttle, an “on switch” that modulates CAR T cell activity using small molecules. The addition of these technologies to existing Kite research and development programs could lead to the treatment of a broader range of hematological malignancies and solid tumors and potentially offer improved selectivity and safety of future treatments.
Patents and Proprietary Rights
U.S. and European Patent Expiration
We have a number of U.S. and foreign patents, patent applications and rights to patents related to our compounds, products and technology, but we cannot be certain that issued patents will be enforceable or provide adequate protection or that pending patent applications will result in issued patents.
The following table shows the estimated expiration dates (including patent term extensions, supplementary protection certificates and/or pediatric exclusivity where granted) in the United States and the European Union for the primary (typically compound) patents for our Phase 3 product candidates. For our product candidates that are single tablet regimens, the estimated patent expiration date provided corresponds to the latest expiring compound patent for one of the active ingredients in the single tablet regimen.
|
Phase 3 Product Candidates
|
Patent Expiration
|
|||||
|
Product Candidate for the Treatment of HIV
|
U.S.
|
E.U.
|
||||
|
Descovy for PrEP
|
2022
|
2021
|
||||
|
Product Candidate for the Treatment of Liver Diseases
|
||||||
|
Selonsertib for the treatment of NASH
|
2033
|
2033
|
||||
|
Product Candidates for the Treatment of Hematology/Oncology
|
||||||
|
Andecaliximab for the treatment of gastric cancer
|
2031
|
(2031)
|
||||
|
Axicabtagene ciloleucel for the treatment of second line diffuse large B-cell lymphoma
|
2027
|
*
|
||||
|
Idelalisib for the treatment of relapsed refractory CLL
|
2025
|
2025
|
||||
|
Product Candidate for the Treatment of Inflammation/Respiratory Diseases
|
||||||
|
Filgotinib for the treatment of rheumatoid arthritis, Crohn’s disease and ulcerative colitis
|
2030
|
2030
|
||||
|
_______________________
|
||||||
|
Dates in parentheses reflect the estimated expiration date of patents which may issue from currently pending applications. The estimated expiration dates do not include any potential additional exclusivity (e.g., patent term extensions, supplementary protection certificates or pediatric exclusivity) that has not yet been granted.
|
||||||
|
* The composition of matter patent has expired in the European Union. In the European Union and the United States, patent applications are pending relating to Kite’s proprietary manufacturing processes.
|
||||||
14
The following table shows the actual or estimated expiration dates (including patent term extensions, supplementary protection certificates and/or pediatric exclusivity where granted) in the United States and the European Union for the primary (typically compound) patents for our marketed products. Patents do not cover ranolazine, the active ingredient of Ranexa. Instead, when it was discovered that only a sustained-release formulation of ranolazine would achieve therapeutic plasma levels, patents were obtained on those formulations and the characteristic plasma levels they achieve. For our products that are fixed-dose combinations or single tablet regimens (e.g., Truvada, Atripla, Complera/Eviplera, Stribild, Genvoya, Odefsey, Descovy and Biktarvy), the estimated patent expiration dates provided correspond to the latest expiring compound patent for one of the active ingredients in the single tablet regimen.
|
Products
|
Patent Expiration
|
||||
|
U.S.
|
E.U.
|
||||
|
Letairis
|
2018
|
(1)
|
2020
|
||
|
Viread
|
2018
|
(2)
|
2017
|
||
|
Ranexa
|
2019
|
(3)
|
2023
|
||
|
Atripla
|
2021
|
(4)
|
2017
|
||
|
Cayston
|
2021
|
2021
|
(7)
|
||
|
Emtriva
|
2021
|
2016
|
|||
|
Truvada
|
2021
|
(4)
|
2017
|
(5)
|
|
|
Lexiscan
|
2022
|
2025
|
|||
|
Descovy
|
2022
|
(8)
|
2021
|
(8)
|
|
|
Vemlidy
|
2022
|
(8)
|
2021
|
(8)
|
|
|
Complera/Eviplera
|
2025
|
2022
|
(7)
|
||
|
Zydelig
|
2025
|
(7)
|
2025
|
(7)
|
|
|
Odefsey
|
2025
|
2022
|
(7)
|
||
|
Yescarta
|
2027
|
(7)
|
(6)
|
||
|
Sovaldi
|
2029
|
2028
|
(7)
|
||
|
Stribild
|
2029
|
2027
|
(7)
|
||
|
Genvoya
|
2029
|
2027
|
(7)
|
||
|
Tybost
|
2029
|
2027
|
(7)
|
||
|
Harvoni
|
2030
|
2030
|
(7)
|
||
|
Epclusa
|
2032
|
2032
|
|||
|
Biktarvy
|
2033
|
2033
|
|||
|
Vosevi
|
2034
|
2033
|
|||
|
_______________________
|
|||||
|
These estimated expiration dates do not include any potential additional exclusivity (e.g., patent term extensions, supplementary protection certificates or pediatric exclusivity) that has not yet been granted.
|
|||||
______________________________________________________
|
(1)
|
In 2017, Gilead and Watson Laboratories, Inc. reached an agreement to settle the patent litigation related to Letairis.
|
|
(2)
|
In 2013, Gilead and Teva Pharmaceuticals (Teva) reached an agreement in principle to settle the ongoing patent litigation concerning the four patents that protect tenofovir disoproxil fumarate in our Viread, Truvada and Atripla products. Under the agreement, Teva was allowed to launch a generic version of Viread in December 2017.
|
|
(3)
|
In 2013, Gilead and Lupin Limited (Lupin) reached an agreement to settle the patent litigation prior to issuance of the court’s decision. Under the agreement, Lupin will be allowed to launch a generic version of Ranexa in February 2019.
|
|
(4)
|
In 2014, Gilead and Teva reached an agreement to settle the patent litigation concerning patents that protect emtricitabine in our Truvada and Atripla products.
|
|
(5)
|
Supplementary protection certificates (SPCs) have been granted in several European countries. The validity of these SPCs has been challenged by several generic manufacturers, many of whom launched their conpeting product in 2017. The validity of these SPCs is being considered in national courts and by the Court of Justice for the European Union.
|
|
(6)
|
The composition of matter patent has expired in the European Union. In the European Union and the United States, patent applications are pending relating to Kite’s proprietary manufacturing processes.
|
|
(7)
|
Applications for patent term extensions are pending in the United States and/or SPCs are pending in one or more countries in the European Union for these products.
|
|
(8)
|
An application for patent term extension was filed in the United States that if granted would extend the U.S. expiration date to 2025. Applications for SPCs were filed in the European Union that if granted would extend the E.U. expiration date to 2026.
|
15
Patent Protection and Certain Challenges
Patents and other proprietary rights are very important to our business. If we have a properly drafted and enforceable patent, it can be more difficult for our competitors to use our technology to create competitive products and more difficult for our competitors to obtain a patent that prevents us from using technology we create. As part of our business strategy, we actively seek patent protection both in the United States and internationally and file additional patent applications, when appropriate, to cover improvements in our compounds, products and technology.
Patents covering certain of the active pharmaceutical ingredients (API) of most of our HIV products as well as Yescarta, Letairis and Ranexa are held by third parties. We acquired exclusive rights to these patents in the agreements we have with these parties. We do not own patents covering ranolazine, the active ingredient of Ranexa. Instead, when it was discovered that only a sustained-release formulation of ranolazine would achieve therapeutic plasma levels, we obtained patents on those formulations and the characteristic plasma levels they achieve. For Yescarta, the composition of matter patent has expired in the European Union. In the European Union and the United States, patent applications are pending related to Kite’s proprietary manufacturing processes.
We may obtain patents for certain products many years before marketing approval is obtained for those products. Because patents have a limited life, which may begin to run prior to the commercial sale of the related product, the commercial value of the patent may be limited. However, we may be able to apply for patent term extensions or supplementary protection certificates in some countries. For example, extensions for the patents or supplementary protection certificates on many of our products have been granted in the United States and in a number of European countries, compensating in part for delays in obtaining marketing approval. Similar patent term extensions may be available for other products that we are developing, but we cannot be certain we will obtain them in some countries.
It is also important that we do not infringe the valid patents of third parties. If we infringe the valid patents of third parties, we may be required to pay significant monetary damages or we may be prevented from commercializing products or may be required to obtain licenses from these third parties. We may not be able to obtain alternative technologies or any required license on reasonable terms or at all. If we fail to obtain these licenses or alternative technologies, we may be unable to develop or commercialize some or all of our products. For example, we are aware of patents and patent applications owned by other parties that such parties may claim to cover the use of sofosbuvir, axicabtagene ciloleucel and bictegravir.
Because patent applications are confidential for a period of time until a patent is issued, we may not know if our competitors have filed patent applications for technology covered by our pending applications or if we were the first to invent or first to file an application directed toward the technology that is the subject of our patent applications. Competitors may have filed patent applications or received patents and may obtain additional patents and proprietary rights that block or compete with our products. In addition, if competitors file patent applications covering our technology, we may have to participate in interference/derivation proceedings or litigation to determine the right to a patent. Litigation and interference/derivation proceedings are unpredictable and expensive, such that, even if we are ultimately successful, our results of operations may be adversely affected by such events.
Patents relating to pharmaceutical, biopharmaceutical and biotechnology products, compounds and processes such as those that cover our existing compounds, products and processes and those that we will likely file in the future, do not always provide complete or adequate protection. Future litigation or other proceedings regarding the enforcement or validity of our existing patents or any future patents could result in the invalidation of our patents or substantially reduce their protection. From time to time, certain individuals or entities may challenge our patents.
Our pending patent applications and the patent applications filed by our collaborative partners may not result in the issuance of any patents or may result in patents that do not provide adequate protection. As a result, we may not be able to prevent third parties from developing compounds or products that are closely related to those which we have developed or are developing. In addition, certain countries do not provide effective enforcement of our patents, and third-party manufacturers may be able to sell generic versions of our products in those countries.
For a description of our significant pending legal proceedings, please see Note
12
, Commitments and Contingencies - Legal Proceedings of the Notes to Consolidated Financial Statements included in Part II, Item 8 of this Annual Report on Form 10-K.
Trade Secrets
We also rely on unpatented trade secrets and improvements, unpatented internal know-how and technological innovation. For example, a great deal of our liposomal manufacturing expertise, which is a key component of our liposomal technology, is not covered by patents but is instead protected as a trade secret. We protect these rights mainly through confidentiality agreements with our corporate partners, employees, consultants and vendors. These agreements provide that all confidential information developed or made known to an individual during the course of their relationship with us will be kept confidential and will not be used or disclosed to third parties except in specified circumstances. In the case of employees, the agreements provide that all inventions made by an individual while employed by us will be our exclusive property. We cannot be certain that these parties will comply with these confidentiality agreements, that we have adequate remedies for any breach or that our trade secrets will not
16
otherwise become known or be independently discovered by our competitors. Under some of our R&D agreements, inventions become jointly owned by us and our corporate partner and in other cases become the exclusive property of one party. In certain circumstances, it can be difficult to determine who owns a particular invention and disputes could arise regarding those inventions. If our trade secrets or confidential information become known or independently discovered by competitors or if we enter into disputes over ownership of inventions, our business and results of operations could be adversely affected.
Manufacturing and Raw Materials
Our products are either manufactured at our own facilities or by third-party manufacturers or corporate partners. We depend on third parties to manufacture the majority of our API and solid dose products. We also rely on our corporate partners to manufacture certain of our products. Additionally, we own or lease manufacturing facilities in Foster City, San Dimas, La Verne, Oceanside and El Segundo, California; Edmonton, Alberta, Canada and Cork, Ireland, where we manufacture certain products and API for clinical and/or commercial uses.
Manufacturing of our Products
We contract with third parties to manufacture certain API for clinical and commercial purposes, including Vosevi, Epclusa, Harvoni, Sovaldi, Truvada, Atripla, Stribild, Complera/Eviplera, Viread, Genvoya, Odefsey, Descovy, Biktarvy, Vemlidy, Emtriva, Tybost, Ranexa, AmBisome, Zydelig and Cayston. We generally use multiple third-party contract manufacturers to manufacture the API in our products. We are the exclusive manufacturer of ambrisentan, the API of Letairis, although another supplier is qualified to make this API.
We also rely on third-party contract manufacturers to manufacture our oral liquid, tablet and capsule products. For example, we use multiple third-party contract manufacturers to manufacture Epclusa, Harvoni, Sovaldi, Truvada, Atripla, Stribild, Complera/Eviplera, Viread, Genvoya, Odefsey, Descovy, Biktarvy, Vemlidy and Ranexa. Emtriva, Vosevi, Tybost, Letairis, Zydelig and Hepsera are also completed by a third-party contract manufacturer. In addition, we rely on third-party contract manufacturers to manufacture our aseptic products such as AmBisome and Cayston.
We have established a clinical and commercial manufacturing facility for the cell processing activities of Yescarta. Yescarta, a CAR T cell therapy, involves (i) harvesting T cells from the patient’s blood, (ii) engineering T cells to express cancer-specific receptors, (iii) increasing the number of engineered T cells and (iv) infusing the functional cancer-specific T cells back into the patient.
For our future products, we continue to develop additional manufacturing capabilities and establish additional third-party suppliers to manufacture sufficient quantities of our product candidates to undertake clinical trials and to manufacture sufficient quantities of any product that is approved for commercial sale.
Our Manufacturing Facilities
At our Foster City, California facility, we conduct process chemistry research and development activities, manufacture API for our clinical trials and oversee our third-party contract manufacturers.
At our San Dimas, California and La Verne, California facilities, we manufacture AmBisome (in San Dimas), package and label the majority of our commercial products and distribute our products to the Americas and Pacific Rim.
We utilize our Oceanside, California facility for the clinical manufacture and process development of biologics candidates in preclinical, Phase 1 and Phase 2 testing.
We utilize our El Segundo, California facility for the clinical and commercial manufacture and processing of Yescarta on a patient-by-patient basis.
We utilize our Cork, Ireland facility for the commercial manufacture, packaging and labeling of our antiviral products. We also perform quality control testing, labeling, packaging and final release of many of our products for distribution to the European Union and other international markets.
At our Edmonton, Alberta facility in Canada, we carry out process research and scale-up of our clinical development candidates, manufacture API for both investigational and commercial products and conduct chemical development activities to improve existing commercial manufacturing processes.
Third-party Manufacturers
Our third-party manufacturers and corporate partners are independent entities who are subject to their own unique operational and financial risks which are out of our control. If we or any of these third-party manufacturers or corporate partners fail to perform as required, this could impair our ability to deliver our products on a timely basis or receive royalties or cause delays in our clinical trials and applications for regulatory approval. Further, we may have to write-off the costs of manufacturing any batch that fails
17
to pass quality inspection or meet regulatory approval. To the extent these risks materialize and affect their performance obligations to us, our financial results may be adversely affected. In addition, we, our third-party manufacturers and our corporate partners may only be able to produce some of our products at one or a limited number of facilities and, therefore, have limited manufacturing capacity for certain products.
We believe the technology we use to manufacture our products is proprietary. For products manufactured by our third-party contract manufacturers, we have disclosed all necessary aspects of this technology to enable them to manufacture the products for us. We have agreements with these third-party manufacturers that are intended to restrict these manufacturers from using or revealing this technology, but we cannot be certain that these third-party manufacturers will comply with these restrictions. In addition, these third-party manufacturers could develop their own technology related to the work they perform for us that we may need to manufacture our products. We could be required to enter into additional agreements with these third-party manufacturers if we want to use that technology ourselves or allow another manufacturer to use that technology. The third-party manufacturer could refuse to allow us to use their technology or could demand terms to use their technology that are not acceptable to us.
Regulation of Manufacturing Process
The manufacturing process for pharmaceutical products is highly regulated and regulators may shut down manufacturing facilities that they believe do not comply with regulations. We, our third-party manufacturers and our corporate partners are subject to current Good Manufacturing Practices, which are extensive regulations governing manufacturing processes, stability testing, record keeping and quality standards as defined by FDA and EMA. Similar regulations are in effect in other jurisdictions.
Our manufacturing operations are subject to routine inspections by regulatory agencies. If we are unable to remedy the deficiencies cited by FDA in these inspections, our currently marketed products and the timing of regulatory approval of products in development could be adversely affected. Further, there is risk that regulatory agencies in other countries where marketing applications are pending will undertake similar additional reviews or apply a heightened standard of review, which could delay the regulatory approvals for products in those countries.
For Yescarta, we are required by FDA to comply with the Risk Evaluation and Mitigation Strategy program, which includes educating and certifying medical personnel regarding the therapy procedures and the potential side effect profile of our therapy, such as the potential adverse side effects related to cytokine release syndrome and neurologic toxicities. Additionally, we are required to maintain a complex chain of identity and custody with respect to patient material as such material moves to the manufacturing facilities, through the manufacturing process, and back to the patient.
Access to Supplies and Materials
We need access to certain supplies and products to conduct our clinical trials and manufacture our products. If we are unable to purchase sufficient quantities of these materials or find suitable alternate materials in a timely manner, our development efforts for our product candidates may be delayed or our ability to manufacture our products would be limited, which would limit our ability to generate revenues. For example, a significant portion of the raw materials and intermediates used to manufacture our antiviral products are supplied by third-party manufacturers and corporate partners outside of the United States. As a result, any political or economic factors in a specific country or region, including any changes in or interpretations of trade regulations, compliance requirements or tax legislation, that would limit or prevent third parties outside of the United States from supplying these materials would adversely affect our ability to manufacture and supply our antiviral products to meet market needs and have a material and adverse effect on our operating results.
Seasonal Operations and Backlog
Our worldwide product sales do not reflect any significant degree of seasonality.
For the most part, we operate in markets characterized by short lead times and the absence of significant backlogs. We do not believe that backlog information is material to our business as a whole.
Government Regulation
Our operations and activities are subject to extensive regulation by numerous government authorities in the United States and other countries. In the United States, the European Union and other countries, drugs are subject to rigorous regulation. Federal and state statutes and regulations govern the testing, manufacture, safety, efficacy, labeling, storage, record keeping, approval, advertising and promotion of our products. As a result of these regulations, product development and product approval processes are very expensive and time consuming. The regulatory requirements applicable to drug development and approval are subject to change. Any legal and regulatory changes may impact our operations in the future.
A country’s regulatory agency, such as FDA in the United States and EMA/European Commission for the European Union, must approve a drug before it can be sold in the respective country or countries. The general process for drug approval in the
18
United States is summarized below. Many other countries, including countries in the European Union, have similar regulatory structures.
Preclinical Testing
Before we can test a drug candidate in humans, we must study the drug in laboratory experiments and in animals to generate data to support the drug candidate’s potential benefits and safety. We submit this data to FDA in an investigational new drug (IND) application seeking its approval to test the compound in humans.
Clinical Trials
If FDA accepts the IND, the drug candidate can then be studied in human clinical trials to determine if the drug candidate is safe and effective. These clinical trials involve three separate phases that often overlap, can take many years and are very expensive. These three phases, which are subject to considerable regulation, are as follows:
|
•
|
Phase 1. The drug candidate is given to a small number of healthy human control subjects or patients suffering from the indicated disease, to test for safety, dose tolerance, pharmacokinetics, metabolism, distribution and excretion.
|
|
•
|
Phase 2. The drug candidate is given to a limited patient population to determine the effect of the drug candidate in treating the disease, the best dose of the drug candidate, and the possible side effects and safety risks of the drug candidate. It is not uncommon for a drug candidate that appears promising in Phase 1 clinical trials to fail in the more rigorous Phase 2 clinical trials.
|
|
•
|
Phase 3. If a drug candidate appears to be effective and safe in Phase 2 clinical trials, Phase 3 clinical trials are commenced to confirm those results. Phase 3 clinical trials are conducted over a longer term, involve a significantly larger population, are conducted at numerous sites in different geographic regions and are carefully designed to provide reliable and conclusive data regarding the safety and benefits of a drug candidate. It is not uncommon for a drug candidate that appears promising in Phase 2 clinical trials to fail in the more rigorous and extensive Phase 3 clinical trials.
|
FDA Approval Process
When we believe that the data from our clinical trials show an acceptable benefit-risk profile, we submit the appropriate filing, usually in the form of an NDA or supplemental NDA, with FDA seeking approval to sell the drug candidate for a particular use. FDA may hold a public hearing where an independent advisory committee of expert advisors asks additional questions and makes recommendations regarding the drug candidate. This committee makes a recommendation to FDA that is not binding but is generally followed by FDA. If FDA agrees that the compound has met the required level of safety and efficacy for a particular use, it will allow us to sell the drug candidate in the United States for that use. It is not unusual, however, for FDA to reject an application because it believes that the drug candidate is not safe enough or efficacious enough or because it does not believe that the data submitted is reliable or conclusive.
At any point in this process, the development of a drug candidate can be stopped for a number of reasons including safety concerns and lack of treatment benefit. We cannot be certain that any clinical trials that we are currently conducting or any that we conduct in the future will be completed successfully or within any specified time period. We may choose, or FDA may require us, to delay or suspend our clinical trials at any time if it appears that the patients are being exposed to an unacceptable health risk or if the drug candidate does not appear to have sufficient treatment benefit.
FDA may also require Phase 4 non-registrational studies to explore scientific questions to further characterize safety and efficacy during commercial use of our drug. FDA may also require us to provide additional data or information, improve our manufacturing processes, procedures or facilities or may require extensive surveillance to monitor the safety or benefits of our product candidates if it determines that our filing does not contain adequate evidence of the safety and benefits of the drug. In addition, even if FDA approves a drug, it could limit the uses of the drug. FDA can withdraw approvals if it does not believe that we are complying with regulatory standards or if problems are uncovered or occur after approval.
In addition to obtaining FDA approval for each drug, we obtain FDA approval of the manufacturing facilities for any drug we sell, including those of companies who manufacture our drugs for us. All of these facilities are subject to periodic inspections by FDA. FDA must also approve foreign establishments that manufacture products to be sold in the United States and these facilities are subject to periodic regulatory inspection. Our manufacturing facilities located in California, including our El Segundo, La Verne, Oceanside and San Dimas facilities, also must be licensed by the State of California in compliance with local regulatory requirements. Our Edmonton, Alberta manufacturing facility in Canada, and our facilities located near Dublin and in Cork, Ireland, also must obtain local licenses and permits in compliance with local regulatory requirements.
Drugs that treat serious or life-threatening diseases and conditions that are not adequately addressed by existing drugs, and for which the development program is designed to address the unmet medical need, may be designated as fast track candidates by
19
FDA and may be eligible for priority review. Drugs for the treatment of HIV infection that are designated for use under the U.S. President’s Emergency Plan for AIDS Relief may also qualify for an expedited or priority review.
Rest of World
Drugs are also subject to extensive regulation outside of the United States. In the European Union, there is a centralized approval procedure that authorizes marketing of a product in all countries of the European Union (which includes most major countries in Europe). If this centralized approval procedure is not used, approval in one country of the European Union can be used to obtain approval in another country of the European Union under one of two simplified application processes: the mutual recognition procedure or the decentralized procedure, both of which rely on the principle of mutual recognition. After receiving regulatory approval through any of the European registration procedures, separate pricing and reimbursement approvals are also required in most countries. The European Union also has requirements for approval of manufacturing facilities for all products that are approved for sale by the European regulatory authorities.
Pricing and Reimbursement
Successful commercialization of our products depends, in part, on the availability of governmental and third-party payer reimbursement for the cost of such products and related treatments in the markets where we sell our products. Government health authorities, private health insurers and other organizations generally provide reimbursement. In the United States, the European Union and other significant or potentially significant markets for our products and product candidates, government authorities and third-party payers are increasingly attempting to limit or regulate the price of medical products and services. A significant portion of our sales of the majority of our products are subject to substantial discounts from list price.
In addition, the non-retail sector in the United States, which includes government institutions, including state ADAPs, the U.S. Department of Veterans Affairs, correctional facilities and large health maintenance organizations, tends to be even less consistent in terms of buying patterns and often causes quarter-over-quarter fluctuations that do not necessarily mirror patient demand for our products. Federal and state budget pressures, including sequestration, as well as the annual grant cycles for federal and state funds, may cause purchasing patterns to not reflect patient demand of our products. For example, in the first quarters of certain prior years, we observed large non-retail purchases of our HIV products by a number of state ADAPs that exceeded patient demand. We believe such purchases were driven by the grant cycle for federal ADAP funds. We expect to continue to experience fluctuations in the purchasing patterns of our non-retail customers which may result in fluctuations in our product sales, revenues and earnings in the future. In light of the budget crises faced by many European countries, we have observed variations in purchasing patterns induced by cost containment measures in Europe. We believe these measures have caused some government agencies and other purchasers to reduce inventory of our products in the distribution channels, which has decreased our revenues and caused fluctuations in our product sales and earnings. We may continue to see this trend in the future.
As our products mature, private insurers and government payers often reduce the amount they will reimburse patients, which increases pressure on us to reduce prices. Further, as new branded or generic products are introduced into major markets, our ability to maintain pricing and market share may be affected. For example, TDF, one of the active pharmaceutical ingredients in Stribild, Complera/Eviplera, Atripla and Truvada, and the main active pharmaceutical ingredient in Viread, faces generic competition in the European Union, the United States and certain other countries. In addition, because emtricitabine, the other active pharmaceutical ingredient of Truvada, faces generic competition in the European Union, Truvada also faces generic competition in the European Union and certain other countries outside of the United States. This has had a negative impact on our business and results of operations.
See also our Item 1A - risk factor “A substantial portion of our revenues is derived from sales of products to treat HIV and HCV. If we are unable to increase HIV sales or if HCV sales decrease more than anticipated, then our results of operations may be adversely affected.”
Patient Assistance Programs
Recently, there has been enhanced scrutiny of company-sponsored patient assistance programs, including insurance premium and co-pay assistance programs and donations to third-party charities that provide such assistance. There has also been enhanced scrutiny by governments on reimbursement support offerings, clinical education programs and promotional speaker programs. If we, or our agents, vendors or donation recipients, are deemed to have failed to comply with laws, regulations or government guidance in any of these areas, we could be subject to criminal and civil sanctions. Any similar violations by our competitors could also negatively impact our industry reputation and increase scrutiny over our business and our products.
See also our Item 1A - risk factor “Laws and regulations applicable to the health care industry could impose new obligations on us, require us to change our business practices and restrict our operations in the future.”
20
United States Healthcare Reform
Legislative and regulatory changes to government prescription drug procurement and reimbursement programs occur relatively frequently in the United States and foreign jurisdictions. In the United States, we, along with other pharmaceutical manufacturers of branded drug products, are required to pay a portion of an industry fee (also known as the branded prescription drug (BPD) fee), calculated based on select government sales during the year as a percentage of total industry government sales. The amount of the annual BPD fee imposed on the pharmaceutical industry as a whole is $4.1 billion in 2018, and $2.8 billion in 2019 and thereafter. Our BPD fee expenses were $385 million in 2017, $270 million in 2016 and $414 million in 2015. The BPD fee is not tax deductible.
Since the November 2016 U.S. election, President Trump and the U.S. Congress have made numerous efforts to repeal or amend the Affordable Care Act in whole or in part. In May 2017, the U.S. House of Representatives voted to pass the American Health Care Act (the AHCA), which would repeal many provisions of the Affordable Care Act. Although the U.S. Senate considered but failed to pass the AHCA and other comparable measures, the U.S. Congress may consider further legislation to repeal or replace elements of the Affordable Care Act. In addition, the Tax Cuts and Jobs Act, which President Trump signed into law in December 2017, repeals the Affordable Care Act’s individual health insurance mandate, which is considered a key component of the Affordable Care Act. The future stability of the Affordable Care Act and the resulting impact on our business is thus uncertain and could be material.
In addition, many states have proposed legislation that seeks to indirectly or directly regulate pharmaceutical drug pricing by requiring biopharmaceutical manufacturers to publicly report proprietary pricing information or to place a maximum price ceiling on pharmaceutical products purchased by state agencies. If such proposed legislation is passed, we may experience additional pricing pressures on our products. For example, in October 2017, California’s governor signed a prescription drug price transparency state bill into law, requiring prescription drug manufacturers to provide advance notice and explanation for price increases of certain drugs that exceed a specified threshold. Similar bills have been previously introduced at the federal level and we expect that additional legislation may be introduced this year. The potential effect of health insurance market destabilization during ongoing repeal and replace discussions, as well as the impact of potential changes to the way the Medicaid program is financed, will likely affect patients’ sources of insurance and resultant drug coverage. Discussions continue at the federal level regarding policies that would either allow or require the U.S. government to directly negotiate drug prices with pharmaceutical manufacturers for Medicare patients, require manufacturers to pay higher rebates in Medicare Part D, give states more flexibility on drugs that are covered under the Medicaid program, and other policy proposals that could impact reimbursement for our products. Other discussions have centered on legislation that would permit the re-importation of prescription medications from Canada or other countries. It is difficult to predict the impact, if any, of any such legislation, executive actions or Medicaid flexibility on the use and reimbursement of our products in the United States, including the potential for the importation of generic versions of our products.
Further, Yescarta is administered on an in-patient basis. It is possible that federal government reimbursement through programs like Medicare and Medicaid will be insufficient to cover the complete cost associated with the therapy. This could impact the willingness of some hospitals to offer the therapy and doctors to recommend the therapy and could lessen the attractiveness of our therapy to patients, which could have an adverse effect on sales of Yescarta and our results of operations.
In addition, state Medicaid programs could request additional supplemental rebates on our products as a result of the increase in the federal base Medicaid rebate. Private insurers could also use the enactment of these increased rebates to exert pricing pressure on our products, and to the extent that private insurers or managed care programs follow Medicaid coverage and payment developments, the adverse effects may be magnified by private insurers adopting lower payment schedules.
Health Care Fraud and Abuse Laws and Anti-Bribery Laws
We are subject to various federal and state laws pertaining to health care “fraud and abuse,” including anti-kickback laws and false claims laws. Anti-kickback laws make it illegal for a prescription drug manufacturer to solicit, offer, receive or pay any remuneration in exchange for, or to induce, the referral of business, including the purchase or prescription of a particular drug. Due to the breadth of the statutory provisions and the increasing attention being given to them by law enforcement authorities, it is possible that certain of our practices may be challenged under anti-kickback or similar laws. False claims laws generally prohibit anyone from knowingly presenting, or causing to be presented, a false or fraudulent claim for payment by federal and certain state payers (including Medicare and Medicaid), or knowingly making, using or causing to be made or used, a false record or statement material to a false or fraudulent claim. Our sales, marketing, patient support and medical activities may be subject to scrutiny under these laws. In addition, the U.S. Foreign Corrupt Practices Act and similar worldwide anti-bribery laws generally prohibit companies and their intermediaries from making improper payments for the purpose of obtaining or retaining business. Our policies mandate compliance with these anti-bribery laws. We operate in parts of the world that have experienced governmental corruption to some degree. In certain circumstances, strict compliance with anti-bribery laws may conflict with local customs and practices or may require us to interact with doctors and hospitals, some of which may be state controlled, in a manner that is different than local custom. Despite our training and compliance program, our internal control policies and procedures may not protect us from reckless or criminal acts committed by our employees or agents. Violations of fraud and abuse laws or anti-bribery laws may be punishable
21
by criminal and/or civil sanctions, including fines and civil monetary penalties, as well as the possibility of exclusion from federal health care programs (including Medicare and Medicaid). Violations can also lead to the imposition of a Corporate Integrity Agreement or similar government oversight program. If the government were to allege against or convict us of violating these laws, there could be a disruption on our business and material adverse effect on our results of operations.
Compulsory Licenses
In a number of developing countries, government officials and other interested groups have suggested that pharmaceutical companies should make drugs for HIV or HCV infection available at low cost. Alternatively, governments in those developing countries could require that we grant compulsory licenses to allow competitors to manufacture and sell their own versions of our products, thereby reducing our product sales. For example, there is growing attention on the availability of HCV therapies and some activists are advocating for the increased availability of HCV therapies through other means including compulsory licenses. The government of Malaysia has exercised Government Rights under Section 84 of the Malaysian Patents Act to practice the patented invention of sofosbuvir for a period of three years for use only in government hospitals and clinics. We are challenging the Malaysian government’s actions. In the past, certain offices of the government of Brazil have expressed concern over the affordability of our HIV products and declared that they were considering issuing compulsory licenses to permit the manufacture of otherwise patented products for HIV infection, including Viread. If compulsory licenses permit generic manufacturing to override our product patents for our HIV, HCV or other products, or if we are required to grant compulsory licenses for these products, it could reduce our earnings and cash flows and harm our business.
In addition, certain countries do not permit enforcement of our patents, or permit our patents to issue, and third-party manufacturers are able to sell generic versions of our products in those countries. For example, in 2017, the Brazilian Health Regulatory Agency rejected our patent applications related to sofosbuvir and our HCV products. We successfully appealed those decisions, and those applications are now under examination at the Brazilian Patent and Trademark Office. Sales of generic versions of our products could significantly reduce our sales and adversely affect our results of operations, particularly if generic versions of our products are imported into territories where we have existing commercial sales.
Employees
As of January 31, 2018, we had approximately 10,000 employees. We believe we have good relations with our employees.
Environment, Health and Safety
We strive to reduce our environmental footprint and implement sustainable business process and practices. We incorporate sustainability throughout the development and distribution of our medicines. From the safety and regulatory compliance of our products to the regular efficiency improvements we make to our manufacturing processes, the operations surrounding our product portfolio are routinely evaluated for new and innovative ways to further incorporate social and environmental responsibility. Our practices include ethical sourcing of materials, green chemistry practices, solvent recycling and continued improvements to the sustainability and efficiency of the API and product development process. Gilead sites around the world identify opportunities to reduce natural resource usage through water conservation, sustainable building practices, energy conservation, recycling and diversion from landfill and alternative transportation. We continue to look for ways to minimize our impact on the environment. Some factors that contribute to our environmental impact include greenhouse gas emissions produced by employee commutes, the energy and water consumed by our facilities, and the use of hazardous materials such as chemicals, viruses and radioactive compounds in our R&D facilities. Please refer to our 2016 Year In Review found on our website at www.gilead.com under “Responsibility” for some of the measures we have taken to mitigate the environmental impact from our business.
We are subject to a number of laws and regulations that require compliance with federal, state, and local regulations regarding workplace safety and protection of the environment. We anticipate additional regulations in the near future. Laws and regulations are implemented and under consideration to mitigate the effects of climate change mainly caused by greenhouse gas emissions. Our business is not energy intensive. Therefore, we do not anticipate being subject to a cap and trade system or other mitigation measure that would materially impact our capital expenditures, operations, or competitive position. Based on current information, and subject to the finalization of proposed regulations, we believe that our primary risk related to climate change is increased energy costs.
Other Information
We are subject to the information requirements of the Exchange Act. Therefore, we file periodic reports, proxy statements and other information with the SEC. Such reports, proxy statements and other information may be obtained by visiting the Public Reference Room of the SEC at 100 F Street, NE, Washington, D.C. 20549 or by calling the SEC at 1-800-SEC-0330, by sending an electronic message to the SEC at publicinfo@sec.gov or by sending a fax to the SEC at 1-202-777-1027. In addition, the SEC maintains a website (www.sec.gov) that contains reports, proxy and information statements, and other information regarding issuers that file electronically.
22
The mailing address of our headquarters is 333 Lakeside Drive, Foster City, California 94404, and our telephone number at that location is 650-574-3000. Our website is www.gilead.com. Through a link on the “Investors” section of our website (under “SEC Filings” section), we make available the following filings as soon as reasonably practicable after they are electronically filed with or furnished to the SEC: our Annual Reports on Form 10-K; Quarterly Reports on Form 10-Q; Current Reports on Form 8-K; and any amendments to those reports filed or furnished pursuant to Section 13(a) or 15(d) of the Exchange Act. All such filings are available free of charge upon request.
Transactions with Iran
We did not have any transactions with Iran during 2017 that would require disclosure in this Annual Report on Form 10-K.
|
Item 1A.
|
RISK FACTORS
|
In evaluating our business, you should carefully consider the following risks in addition to the other information in this Annual Report on Form 10-K. A manifestation of any of the following risks could materially and adversely affect our business, results of operations and financial condition. We note these factors for investors as permitted by the Private Securities Litigation Reform Act of 1995. It is not possible to predict or identify all such factors and, therefore, you should not consider the following risks to be a complete statement of all the potential risks or uncertainties that we face.
A substantial portion of our revenues is derived from sales of products to treat HIV and HCV. If we are unable to increase HIV sales or if HCV sales decrease more than anticipated, then our results of operations may be adversely affected.
We receive a substantial portion of our revenue from sales of our products for the treatment of HIV infection, which include Genvoya, Truvada, Atripla, Descovy, Stribild, Odefsey and Complera/Eviplera. During the
year ended December 31, 2017
, sales of our HIV products accounted for approximately
55%
of our total product sales, and we expect our HIV products to account for a higher percentage of our total product sales in 2018. Most of our HIV products contain tenofovir alafenamide (TAF), tenofovir disoproxil fumarate (TDF) and/or emtricitabine, which belong to the nucleoside class of antiviral therapeutics. If the treatment paradigm for HIV changes, causing nucleoside-based therapeutics to fall out of favor, or if we are unable to maintain or increase our HIV product sales, our results of operations would likely suffer and we would likely need to scale back our operations, including our spending on research and development efforts.
During the
year ended December 31, 2017
, sales of Harvoni, Epclusa, Sovaldi and Vosevi for the treatment of HCV accounted for approximately
36%
of our total product sales. The primary drivers of our HCV product revenues are patient starts, net pricing and market share. Since the second quarter of 2015, the number of new patient starts has diminished, and we expect patient starts to continue to decline relative to 2017 in all major markets, resulting in a decrease in our HCV product sales. Our HCV revenues have declined and are expected to further decline as a result of increased competition from new HCV products, which has further eroded net pricing and market share. We anticipate that this impact on pricing and market share will be more fully reflected in mid-2018. Our HCV product sales could also be further impacted by a larger than anticipated shift in our payer mix to more highly discounted payer segments and geographic regions.
In addition, future sales of our HCV products may be difficult to estimate because demand depends, in part, on the extent of reimbursement of our HCV products by private and government payers. We may continue to experience global pricing pressure which could result in larger discounts or rebates on our products or delayed reimbursement, which negatively impacts our product sales and results of operations. Also, private and public payers can choose to exclude our HCV products from their formulary coverage lists or limit the types of patients for whom coverage will be provided, which would negatively impact the demand for, and revenues of, our HCV products. Any change in the formulary coverage, reimbursement levels or discounts or rebates offered on our HCV products to payers may impact our anticipated revenues. We expect pricing pressure in the HCV market to continue. If we are unable to achieve our forecasted HCV sales, our stock price could experience significant volatility.
We may be unable to sustain or increase sales of our HIV or HCV products for any number of reasons including, but not limited to, the reasons discussed above and the following:
|
•
|
As our HIV and HCV products are used over a longer period of time in many patients and in combination with other products, and additional studies are conducted, new issues with respect to safety, resistance and interactions with other drugs may arise, which could cause us to provide additional warnings or contraindications on our labels, narrow our approved indications or halt sales of a product, each of which could reduce our revenues.
|
|
•
|
As our products mature, private insurers and government payers often reduce the amount they will reimburse patients for these products, which increases pressure on us to reduce prices.
|
|
•
|
If physicians do not see the benefit of our HIV or HCV products, the sales of our HIV or HCV products will be limited.
|
|
•
|
As new branded or generic products are introduced into major markets, our ability to maintain pricing and market share may be affected. For example, TDF, one of the active pharmaceutical ingredients in Stribild, Complera/Eviplera,
|
23
Atripla and Truvada, and the main active pharmaceutical ingredient in Viread, faces generic competition in the European Union, the United States and certain other countries. In addition, because emtricitabine, the other active pharmaceutical ingredient of Truvada, faces generic competition in the European Union, Truvada faces generic competition in the European Union and certain other countries outside of the United States. This has had, and is expected to continue to have, a negative impact on our business and results of operations.
If we fail to commercialize new products or expand the indications for existing products, our prospects for future revenues may be adversely affected.
If we do not introduce new products or increase sales of our existing products, we will not be able to increase or maintain our total revenues nor continue to expand our R&D efforts. Drug development is inherently risky and many product candidates fail during the drug development process. For example, during 2017, we terminated our Phase 2 studies of GS-5745 for the treatment of rheumatoid arthritis and cystic fibrosis and our Phase 2 study of GS-9620 for the treatment of hepatitis B virus. In addition, we may decide to terminate product development after expending significant resources and effort. In addition, if we are unable to obtain regulatory approval for product candidates from our recent acquisition of Kite Pharma, Inc. (Kite) and effectively commercialize Kite’s product candidates, we may not be able to realize the anticipated benefits from our acquisition of Kite, including any expected future revenues from Kite’s product candidates.
We have filed our marketing authorization application (MAA) in the European Union for the approval of a once-daily, single tablet regimen containing bictegravir (50 mg) and emtricitabine/tenofovir alafenamide (200/25 mg) for the treatment of HIV-1 infection in adults. We have also filed a MAA in the European Union for the approval of axicabtagene ciloleucel for the treatment of relapsed/refractory diffuse large B-cell lymphoma, transformed follicular lymphoma and primary mediastinal B-cell lymphoma. These and any future marketing applications we file may not be approved by the regulatory authorities on a timely basis, or at all. Even if marketing approval is granted for these products, there may be significant limitations on their use. Further, we may be unable to file our marketing applications for new products.
Our inability to accurately predict demand for our products, uptake of new products or fluctuations in customer inventories makes it difficult for us to accurately forecast sales and may cause our forecasted revenues and earnings to fluctuate, which could adversely affect our financial results and our stock price.
We may be unable to accurately predict demand for our products, including the uptake of new products, as demand is dependent on a number of factors. For example, the non-retail sector in the United States, which includes government institutions, including state AIDS Drug Assistance Programs (ADAPs), the U.S. Department of Veterans Affairs, correctional facilities and large health maintenance organizations, tends to be even less consistent in terms of buying patterns and often causes quarter-over-quarter fluctuations that do not necessarily mirror patient demand for our products. Federal and state budget pressures as well as the annual grant cycles for federal and state funds, may cause purchasing patterns to not reflect patient demand of our products. For example, in the first quarters of certain prior years, we observed large non-retail purchases of our HIV products by a number of state ADAPs that exceeded patient demand. We believe such purchases were driven by the grant cycle for federal ADAP funds. We expect to continue to experience fluctuations in the purchasing patterns of our non-retail customers which may result in fluctuations in our product sales, revenues and earnings in the future. In light of the budget crises faced by many European countries, we have observed variations in purchasing patterns induced by cost containment measures in Europe. We believe these measures have caused some government agencies and other purchasers to reduce inventory of our products in the distribution channels, which has decreased our revenues and caused fluctuations in our product sales and earnings. We may continue to see this trend in the future.
During the
year ended December 31, 2017
, approximately
89%
of our product sales in the United States were to three wholesalers, McKesson Corp., AmerisourceBergen Corp. and Cardinal Health, Inc. The U.S. wholesalers with whom we have entered into inventory management agreements make estimates to determine end user demand and may not be completely effective in matching their inventory levels to actual end user demand. As a result, changes in inventory levels held by those wholesalers can cause our operating results to fluctuate unexpectedly if our sales to these wholesalers do not match end user demand. In addition, inventory is held at retail pharmacies and other non-wholesaler locations with whom we have no inventory management agreements and no control over buying patterns. Adverse changes in economic conditions, increased competition or other factors may cause retail pharmacies to reduce their inventories of our products, which would reduce their orders from wholesalers and, consequently, the wholesalers’ orders from us, even if end user demand has not changed. For example, during the fourth quarter of 2016, strong wholesaler and sub-wholesaler purchases of our products resulted in inventory draw-down by wholesalers and sub-wholesalers in the first quarter of 2017. As inventory in the distribution channel fluctuates from quarter to quarter, we may continue to see fluctuations in our earnings and a mismatch between prescription demand for our products and our revenues.
Further, because our HCV products represent a cure and competitors’ HCV products have entered the market, revenues from our HCV products are difficult for us and investors to estimate. The primary drivers of our HCV product revenues are patient starts, net pricing and market share. In our experience, the number of patient starts is very difficult to accurately predict. In addition, demand for our HCV products will depend on the extent of reimbursement of our HCV products by private and public payers in
24
the United States and other countries. Private and public payers can choose to exclude our HCV products from their formulary coverage lists or limit the types of patients for whom coverage will be provided, which would negatively impact the demand for and revenues of our HCV products. We continue to experience pricing pressure in the United States, the European Union and other countries. Any change in the formulary coverage, reimbursement levels or discounts or rebates offered on our HCV products to payers may negatively impact our anticipated revenues. In addition, because rebate claims for product discounts are made by payers one or two quarters in arrears, we estimate the rebates we will be required to pay in connection with sales during a particular quarter based on claims data from prior quarters. Because HCV-related revenues are difficult to predict, investors may have widely varying expectations that may be materially higher or lower than our actual or anticipated revenues. To the extent our actual or anticipated HCV product revenues exceed or fall short of these expectations, our stock price may experience significant volatility.
Yescarta, a chimeric antigen receptor (CAR) T cell therapy, represents a novel approach to cancer treatment that creates significant challenges for us.
Yescarta, a CAR T cell therapy, involves (i) harvesting T cells from the patient’s blood, (ii) engineering T cells to express cancer-specific receptors, (iii) increasing the number of engineered T cells and (iv) infusing the functional cancer-specific T cells back into the patient. Advancing this novel and personalized therapy creates significant challenges, including:
|
•
|
educating and certifying medical personnel regarding the procedures and the potential side effect profile of our therapy, such as the potential adverse side effects related to cytokine release syndrome and neurologic toxicities, in compliance with the Risk Evaluation and Mitigation Strategy (REMS) program required by FDA for Yescarta;
|
|
•
|
using medicines to manage adverse side effects of our therapy, such as tocilizumab and corticosteroids, which may not be available in sufficient quantities, may not adequately control the side effects and/or may have a detrimental impact on the efficacy of the treatment;
|
|
•
|
sourcing clinical and commercial supplies for the materials used to manufacture and process Yescarta;
|
|
•
|
developing a robust and reliable process, while limiting contamination risks, for engineering a patient’s T cells ex vivo and infusing the engineered T cells back into the patient; and
|
|
•
|
conditioning patients with chemotherapy in advance of administering our therapy, which may increase the risk of adverse side effects.
|
The use of engineered T cells as a potential cancer treatment is a recent development and may not be broadly accepted by physicians, patients, hospitals, cancer treatment centers, payers and others in the medical community. We may not be able to establish or demonstrate in the medical community the safety and efficacy of Yescarta and the potential advantages and side effects compared to existing and future therapeutics. If we fail to overcome these significant challenges, our sales of Yescarta, results of operations and stock price could be adversely affected.
We may be required to pay significant damages to Merck & Co., Inc. (Merck) as a result of a jury’s finding that we willfully infringed a patent owned by Merck’s Idenix subsidiary.
In December 2013, Idenix, Universita Degli Studi di Cagliari (UDSG), Centre National de la Recherche Scientifique and L’Université Montpellier II sued us in U.S. District Court for the District of Delaware alleging that the commercialization of sofosbuvir will infringe Idenix’s U.S. Patent No. 7,608,600 (the ‘600 patent) and that an interference exists between the ‘600 patent and our U.S. Patent No. 8,415,322. Also in December 2013, Idenix and UDSG sued us in the U.S. District Court for the District of Massachusetts alleging that the commercialization of sofosbuvir will infringe U.S. Patent Nos. 6,914,054 (the ‘054 patent) and 7,608,597 (the ‘597 patent). In June 2014, the court transferred the Massachusetts litigation to the U.S. District Court for the District of Delaware. Idenix was acquired by Merck in August 2014.
Prior to trial in December 2016, Idenix committed to give us a covenant not to sue with respect to any claims arising out of the ‘054 patent related to sofosbuvir and withdrew that patent from the trial. In addition, Idenix declined to litigate the ‘600 patent infringement action at trial in light of the appeal then pending at the U.S. Court of Appeals for the Federal Circuit (CAFC) regarding who was the first to invent the subject matter claimed in the ‘600 patent. In January 2017, the District Court stayed Idenix’s infringement claim on the ‘600 patent pending the outcome of the appeal of the interference decision on that patent (the Second Idenix Interference), described above. Unless Idenix is successful in persuading the United States Supreme Court to consider a further appeal to challenge the Federal Circuit’s June 2017 decision in our favor in the Second Idenix Interference, we will ask for dismissal of, or for judgment to be entered against Idenix on, the ‘600 infringement and interference claims. A jury trial was held in December 2016 on the ‘597 patent. In December 2016, the jury found that we willfully infringed the asserted claims of the ‘597 patent and awarded Idenix $2.54 billion in past damages. The parties filed post-trial motions and briefings, and the district judge heard oral argument in September 2017. In September 2017, the judge denied Idenix’s motions for enhanced damages and attorney’s fees. In February 2018, the judge granted our motion arguing that the ‘597 patent is invalid for lacking enablement. The grant of our motion invalidating Idenix’s ‘597 patent vacates the jury’s award of $2.54 billion in past damages. Idenix has indicated
25
it plans to appeal this decision to the CAFC. We believe the court’s decision correctly found that, as a matter of law, the ‘597 patent is invalid, and we remain confident in the merits of our case on appeal.
If the court’s decision invalidating Idenix’s patent is overturned on appeal, the amount we could be required to pay could be material. The timing and magnitude of the amount of any such payment could have a material adverse impact on our results of operations and stock price.
Our results of operations may be adversely affected by current and potential future healthcare reforms.
Legislative and regulatory changes to government prescription drug procurement and reimbursement programs occur relatively frequently in the United States and foreign jurisdictions. In the United States, we, along with other pharmaceutical manufacturers of branded drug products, are required to pay a portion of an industry fee (also known as the branded prescription drug (BPD) fee), calculated based on select government sales during the year as a percentage of total industry government sales. The amount of the annual BPD fee imposed on the pharmaceutical industry as a whole is $4.1 billion in 2018 and $2.8 billion in 2019 and thereafter. Our BPD fee expenses were $385 million in 2017, $270 million in 2016 and $414 million in 2015. The BPD fee is not tax deductible.
Since the November 2016 U.S. election, President Trump and the U.S. Congress have made numerous efforts to repeal or amend the Affordable Care Act in whole or in part. In May 2017, the U.S. House of Representatives voted to pass the American Health Care Act (the AHCA), which would repeal many provisions of the Affordable Care Act. Although the U.S. Senate considered but failed to pass the AHCA and other comparable measures, the U.S. Congress may consider further legislation to repeal or replace elements of the Affordable Care Act. In addition, the Tax Cuts and Jobs Act, which President Trump signed into law in December 2017, repeals the Affordable Care Act’s individual health insurance mandate, which is considered a key component of the Affordable Care Act. The future stability of the Affordable Care Act and the resulting impact on our business is thus uncertain and could be material.
In addition, many states have proposed legislation that seeks to indirectly or directly regulate pharmaceutical drug pricing by requiring biopharmaceutical manufacturers to publicly report proprietary pricing information or to place a maximum price ceiling on pharmaceutical products purchased by state agencies. If such proposed legislation is passed, we may experience additional pricing pressures on our products. For example, in October 2017, California’s governor signed a prescription drug price transparency state bill into law, requiring prescription drug manufacturers to provide advance notice and explanation for price increases of certain drugs that exceed a specified threshold. Similar bills have been previously introduced at the federal level and we expect that additional legislation may be introduced this year. The potential effect of health insurance market destabilization during ongoing repeal and replace discussions, as well as the impact of potential changes to the way the Medicaid program is financed, will likely affect patients’ sources of insurance and resultant drug coverage. Discussions continue at the federal level regarding policies that would either allow or require the U.S. government to directly negotiate drug prices with pharmaceutical manufacturers for Medicare patients, require manufacturers to pay higher rebates in Medicare Part D, give states more flexibility on drugs that are covered under the Medicaid program, and other policy proposals that could impact reimbursement for our products. Other discussions have centered on legislation that would permit the re-importation of prescription medications from Canada or other countries. It is difficult to predict the impact, if any, of any such legislation, executive actions or Medicaid flexibility on the use and reimbursement of our products in the United States, including the potential for the importation of generic versions of our products.
Further, Yescarta is administered on an in-patient basis. It is possible that federal government reimbursement through programs like Medicare and Medicaid will be insufficient to cover the complete cost associated with the therapy. This could impact the willingness of some hospitals to offer the therapy and doctors to recommend the therapy and could lessen the attractiveness of our therapy to patients, which could have an adverse effect on sales of Yescarta and our results of operations.
In addition, state Medicaid programs could request additional supplemental rebates on our products as a result of the increase in the federal base Medicaid rebate. Private insurers could also use the enactment of these increased rebates to exert pricing pressure on our products, and to the extent that private insurers or managed care programs follow Medicaid coverage and payment developments, the adverse effects may be magnified by private insurers adopting lower payment schedules.
Our existing products are subject to reimbursement from government agencies and other third parties. Pharmaceutical pricing and reimbursement pressures may reduce profitability.
Successful commercialization of our products depends, in part, on the availability of governmental and third-party payer reimbursement for the cost of such products and related treatments in the markets where we sell our products. Government health authorities, private health insurers and other organizations generally provide reimbursement. In the United States, the European Union and other significant or potentially significant markets for our products and product candidates, government authorities and third-party payers are increasingly attempting to limit or regulate the price of medical products and services. A significant portion of our sales of the majority of our products are subject to significant discounts from list price.
26
We face significant competition.
We face significant competition from global pharmaceutical and biotechnology companies, specialized pharmaceutical firms and generic drug manufacturers. Our products compete with other available products based primarily on efficacy, safety, tolerability, acceptance by doctors, ease of patient compliance, ease of use, price, insurance and other reimbursement coverage, distribution and marketing.
Our HIV products compete primarily with products from ViiV Healthcare Company (ViiV), which markets fixed-dose combination products that compete with Biktarvy, Descovy, Odefsey, Genvoya, Stribild, Complera/Eviplera, Atripla and Truvada. For example, products marketed by ViiV, including Tivicay (dolutegravir), Triumeq (abacavir/dolutegravir/lamivudine) and Juluca (dolutegravir/rilpivirine), compete with our HIV products. In addition, lamivudine, marketed by ViiV, competes with emtricitabine, the active pharmaceutical ingredient of Emtriva and a component of Biktarvy, Descovy, Odefsey, Genvoya, Stribild, Complera/Eviplera, Atripla and Truvada. For Tybost, we compete with ritonavir marketed by AbbVie Inc. (AbbVie).
We also face competition from generic HIV products. Generic versions of lamivudine and Combivir (lamivudine and zidovudine) are available in the United States and certain other countries. Generic versions of efavirenz, a component of Atripla, are available in the United States, Canada and Europe. We have observed some pricing pressure related to the efavirenz component of our Atripla sales. TDF, one of the active pharmaceutical ingredients in Stribild, Complera/Eviplera, Atripla and Truvada, and the main active pharmaceutical ingredient in Viread, faces generic competition in the European Union, the United States and certain other countries. In addition, because emtricitabine, the other active pharmaceutical ingredient of Truvada, faces generic competition in the European Union, Truvada also faces generic competition in the European Union and certain other countries outside of the United States.
Our HCV products, Sovaldi, Harvoni, Epclusa and Vosevi, compete primarily with Mavyret (glecaprevir/pibrentasvir) marketed by AbbVie and Zepatier (elbasvir and grazoprevir) marketed by Merck.
Our HBV products, Vemlidy, Viread and Hepsera, face competition from existing therapies for treating patients with HBV. Our HBV products face competition from generic versions of TDF. Our HBV products also compete with Baraclude (entecavir), an oral nucleoside analog marketed by Bristol-Myers Squibb Company (BMS), as well as generic entecavir, and Tyzeka/Sebivo (telbivudine), an oral nucleoside analog marketed by Novartis Pharmaceuticals Corporation (Novartis).
Yescarta is expected to compete with other companies developing advanced T cell therapies for the treatment of relapsed/refractory diffuse large B-cell lymphoma, including Novartis.
Letairis competes with Tracleer (bosentan) and Opsumit (macitentan) marketed by Actelion Pharmaceuticals US, Inc. and also with Adcirca (tadalafil) marketed by United Therapeutics Corporation and Pfizer Inc. Letairis is also expected to face generic competition in the United States starting in July 2018.
Ranexa competes predominantly with generic compounds from three distinct classes of drugs for the treatment of chronic angina in the United States, including generic and/or branded beta-blockers, calcium channel blockers and long-acting nitrates. Ranexa is also expected to face generic competition in the United States starting in 2019.
In addition, a number of companies are pursuing the development of technologies which are competitive with our existing products or research programs. These competing companies include specialized pharmaceutical firms and large pharmaceutical companies acting either independently or together with other pharmaceutical companies. Furthermore, academic institutions, government agencies and other public and private organizations conducting research may seek patent protection and may establish collaborative arrangements for competitive products or programs. If any of these competitors gain market share as a result of new technologies, commercialization strategies or otherwise, it could adversely affect our results of operations and stock price.
Laws and regulations applicable to the health care industry could impose new obligations on us, require us to change our business practices and restrict our operations in the future.
The health care industry is subject to various federal, state and international laws and regulations pertaining to drug reimbursement, rebates, price reporting, health care fraud and abuse, and data privacy and security. In the United States, these laws include anti-kickback and false claims laws, laws and regulations relating to the Medicare and Medicaid programs and other federal and state programs, the Medicaid Rebate Statute, individual state laws relating to pricing and sales and marketing practices, the Health Insurance Portability and Accountability Act (HIPAA) and other federal and state laws relating to the privacy and security of health information.
Violations of these laws or any related regulations may be punishable by criminal and/or civil sanctions, including, in some instances, substantial fines, civil monetary penalties, exclusion from participation in federal and state health care programs, including Medicare, Medicaid, Veterans Administration health programs, and federal employee health benefit programs, actions against executives overseeing our business and burdensome remediation measures. In addition, these laws and regulations are broad in scope and they are subject to change and evolving interpretations, which could require us to incur substantial costs associated with compliance or to alter one or more of its sales or marketing practices. Violations of these laws, or allegations of
27
such violations, could also result in negative publicity or other consequences that could harm our reputation, disrupt our business or adversely affect our results of operations. If any or all of these events occur, our business and stock price could be materially and adversely affected.
Recently, there has been enhanced scrutiny of company-sponsored patient assistance programs, including insurance premium and co-pay assistance programs and donations to third-party charities that provide such assistance. There has also been enhanced scrutiny by governments on reimbursement support offerings, clinical education programs and promotional speaker programs. If we, or our agents, vendors or donation recipients, are deemed to have failed to comply with laws, regulations or government guidance in any of these areas, we could be subject to criminal or civil sanctions. Any similar violations by our competitors could also negatively impact our industry reputation and increase scrutiny over our business and our products.
See a description of our government investigations and related litigation in Note 12, Commitments and Contingencies - Legal Proceedings of the Notes to Consolidated Financial Statements included in Part II, Item 8 of this Annual Report on Form 10-K.
Approximately
29%
of our product sales occur outside the United States, and currency fluctuations and hedging expenses may cause our earnings to fluctuate, which could adversely affect our stock price.
Because a significant percentage of our product sales are denominated in foreign currencies, primarily the Euro, we face exposure to adverse movements in foreign currency exchange rates. When the U.S. dollar strengthens against these foreign currencies, the relative value of sales made in the respective foreign currency decreases. Conversely, when the U.S. dollar weakens against these currencies, the relative value of such sales increases. Overall, we are a net receiver of foreign currencies and, therefore, benefit from a weaker U.S. dollar and are adversely affected by a stronger U.S. dollar.
We use foreign currency exchange forward and option contracts to hedge a percentage of our forecasted international sales, primarily those denominated in the Euro. We also hedge certain monetary assets and liabilities denominated in foreign currencies, which reduces but does not eliminate our exposure to currency fluctuations between the date a transaction is recorded and the date cash is collected or paid. Foreign currency exchange, net of hedges, had
an unfavorable
impact on our product sales of
$117 million
for the
year ended December 31, 2017
, compared to the same period in 2016.
We cannot predict future fluctuations in the foreign currency exchange rates of the U.S. dollar. If the U.S. dollar appreciates significantly against certain currencies and our hedging program does not sufficiently offset the effects of such appreciation, our results of operations will be adversely affected and our stock price may decline.
Additionally, the expenses that we recognize in relation to our hedging activities can also cause our earnings to fluctuate. The level of hedging expenses that we recognize in a particular period is impacted by the changes in interest rate spreads between the foreign currencies that we hedge and the U.S. dollar.
If significant safety issues arise for our marketed products or our product candidates, our future sales may be reduced, which would adversely affect our results of operations.
The data supporting the marketing approvals for our products and forming the basis for the safety warnings in our product labels were obtained in controlled clinical trials of limited duration and, in some cases, from post-approval use. As our products are used over longer periods of time by many patients with underlying health problems, taking numerous other medicines, we expect to continue to find new issues such as safety, resistance or drug interaction issues, which may require us to provide additional warnings or contraindications on our labels or narrow our approved indications, each of which could reduce the market acceptance of these products.
Regulatory authorities have been moving towards more active and transparent pharmacovigilance and are making greater amounts of stand-alone safety information and clinical trial data directly available to the public through websites and other means, such as periodic safety update report summaries, risk management plan summaries and various adverse event data. Safety information, without the appropriate context and expertise, may be misinterpreted and lead to misperception or legal action which may potentially cause our product sales or stock price to decline.
For Yescarta, a novel CAR T cell therapy, treatment-related adverse effects may not be appropriately recognized and managed by the treating medical staff, as toxicities resulting from personalized T cell therapy are not typically encountered in the general patient population and by medical personnel. Common medicines that may be used at academic medical centers and hospitals to help manage adverse side effects of Yescarta, such as tocilizumab and corticosteroids, may not be available in sufficient quantities, may not adequately control such adverse side effects and/or may have a detrimental impact on the efficacy of the treatment. We have trained and expect to continue to train medical personnel to understand the side effect profile of Yescarta in compliance with the REMS program required by FDA for Yescarta, although we can give no assurances on the efficacy of our training efforts. Inadequate training in recognizing or managing the potential adverse effects of Yescarta, or the disregard or modification of our training by medical staff, could result in more severe or prolonged toxicities or even patient deaths.
28
Further, if serious safety, resistance or drug interaction issues arise with our marketed products, sales of these products could be limited or halted by us or by regulatory authorities and our results of operations would be adversely affected.
Our operations depend on compliance with complex FDA and comparable international regulations. Failure to obtain broad approvals on a timely basis or to maintain compliance could delay or halt commercialization of our products.
The products we develop must be approved for marketing and sale by regulatory authorities and, once approved, are subject to extensive regulation by FDA, the European Medicines Agency (EMA) and comparable regulatory agencies in other countries. We are continuing clinical trials for many of our products for currently approved and additional uses. We anticipate that we will file for marketing approval in additional countries and for additional indications and products over the next several years. These products may fail to receive such marketing approvals on a timely basis, or at all.
Further, how we manufacture and sell our products is subject to extensive regulation and review. Discovery of previously unknown problems with our marketed products or problems with our manufacturing, safety reporting or promotional activities may result in restrictions on our products, including withdrawal of the products from the market. If we fail to comply with applicable regulatory requirements, including those related to promotion and manufacturing, we could be subject to penalties including fines, suspensions of regulatory approvals, product recalls, seizure of products and criminal prosecution.
For example, under FDA rules, we are often required to conduct post-approval clinical studies to assess a known serious risk, signals of serious risk or to identify an unexpected serious risk and implement a REMS for our products, which could include a medication guide, patient package insert, a communication plan to healthcare providers or other elements as FDA deems are necessary to assure safe use of the drug, which could include imposing certain restrictions on the distribution or use of a product. Failure to comply with these or other requirements imposed by FDA could result in significant civil monetary penalties and our operating results may be adversely affected.
The results and anticipated timelines of our clinical trials are uncertain and may not support continued development of a product candidate, which would adversely affect our prospects for future revenue growth.
We are required to demonstrate the safety and efficacy of products that we develop for each intended use through extensive preclinical studies and clinical trials. The results from preclinical and early clinical studies do not always accurately predict results in later, large-scale clinical trials. Even successfully completed large-scale clinical trials may not result in marketable products. For example, during 2017, we terminated our Phase 2 studies of GS-5745 for the treatment of rheumatoid arthritis and cystic fibrosis and our Phase 2 study of GS-9620 for the treatment of hepatitis B virus, after determining that study data showed insufficient evidence of treatment benefit. If any of our product candidates fails to achieve its primary endpoint in clinical trials, if safety issues arise or if the results from our clinical trials are otherwise inadequate to support regulatory approval of our product candidates, commercialization of that product candidate could be delayed or halted. In addition, we may also face challenges in clinical trial protocol design.
If the clinical trials for any of the product candidates in our pipeline are delayed or terminated, our prospects for future revenue growth would be adversely impacted. For example, we face numerous risks and uncertainties with our product candidates, including Descovy for pre-exposure prophylaxis (PrEP); selonsertib for the treatment of nonalcoholic steatohepatitis (NASH); andecaliximab for the treatment of gastric cancer; axicabtagene ciloleucel for the treatment of second line diffuse large B-cell lymphoma; and filgotinib for the treatment of rheumatoid arthritis, Crohn’s disease and ulcerative colitis, each currently in Phase 3 clinical trials, that could prevent completion of development of these product candidates. These risks include our ability to enroll patients in clinical trials, the possibility of unfavorable results of our clinical trials, the need to modify or delay our clinical trials or to perform additional trials and the risk of failing to obtain FDA and other regulatory body approvals. As a result, our product candidates may never be successfully commercialized. Further, we may make a strategic decision to discontinue development of our product candidates if, for example, we believe commercialization will be difficult relative to other opportunities in our pipeline. If these programs and others in our pipeline cannot be completed on a timely basis or at all, then our prospects for future revenue growth may be adversely impacted. In addition, clinical trials involving our commercial products could raise new safety issues for our existing products, which could in turn decrease our revenues and harm our business.
Due to our reliance on third-party contract research organizations to conduct our clinical trials, we are unable to directly control the timing, conduct, expense and quality of our clinical trials.
We extensively outsource our clinical trial activities and usually perform only a small portion of the start-up activities in-house. We rely on independent third-party contract research organizations (CROs) to perform most of our clinical studies, including document preparation, site identification, screening and preparation, pre-study visits, training, program management and bioanalytical analysis. Many important aspects of the services performed for us by the CROs are out of our direct control. If there is any dispute or disruption in our relationship with our CROs, our clinical trials may be delayed. Moreover, in our regulatory submissions, we rely on the quality and validity of the clinical work performed by third-party CROs. If any of our CROs’ processes,
29
methodologies or results were determined to be invalid or inadequate, our own clinical data and results and related regulatory approvals could be adversely affected.
We depend on relationships with other companies for sales and marketing performance, technology, development, logistics and commercialization of product candidates and revenues. Failure to maintain these relationships, poor performance by these companies or disputes with these companies could negatively impact our business.
We rely on a number of significant collaborative relationships with major pharmaceutical companies for our sales and marketing performance in certain territories. These include collaborations with Janssen Sciences Ireland UC for Odefsey, Complera/Eviplera and Symtuza in Europe; and BMS for Atripla in Europe. In some countries, we rely on international distributors for sales of certain of our products. Some of these relationships also involve the clinical development of these products by our partners. Reliance on collaborative relationships poses a number of risks, including the risk that:
|
•
|
we are unable to control the resources our corporate partners devote to our programs or products;
|
|
•
|
disputes may arise with respect to the ownership of rights to technology developed with our corporate partners;
|
|
•
|
disagreements with our corporate partners could cause delays in, or termination of, the research, development or commercialization of product candidates or result in litigation or arbitration;
|
|
•
|
contracts with our corporate partners may fail to provide significant protection or may fail to be effectively enforced if one of these partners fails to perform;
|
|
•
|
our corporate partners have considerable discretion in electing whether to pursue the development of any additional products and may pursue alternative technologies or products either on their own or in collaboration with our competitors;
|
|
•
|
our corporate partners with marketing rights may choose to pursue competing technologies or to devote fewer resources to the marketing of our products than they do to products of their own development; and
|
|
•
|
our distributors and our corporate partners may be unable to pay us.
|
Given these risks, there is a great deal of uncertainty regarding the success of our current and future collaborative efforts. If these efforts fail, our product development or commercialization of new products could be delayed or revenues from products could decline.
Yescarta is available only through a REMS program, which is required by FDA to mitigate the potential risks of the product. Only hospitals and their associated clinics certified in the REMS program are permitted to dispense Yescarta. All relevant staff involved in the prescribing, dispensing or administering of Yescarta must be trained on the REMS program requirements and must successfully complete a REMS program knowledge assessment. Failure of hospitals and clinics to enroll in the Yescarta REMS program or to successfully complete and comply with the program requirements may result in regulatory action from FDA or decreased sales of Yescarta, which could harm our business and our reputation.
For Yescarta, we rely on technology partners to assist in the development and maintenance of the Kite Konnect platform. This platform is critical to ensure positive prescriber and patient experience, as well as chain of identity and chain of custody of Yescarta. If the technology platform is incomplete, insufficiently maintained or develops technological issues, we may experience a disruption to the sales and logistics of our Yescarta business, which could extend for a significant period of time, and we may need to expend considerable resources and time to repair or improve the platform in cooperation with our partners. In addition, we rely on sites to collect patient white blood cells, known as apheresis centers, shippers, couriers, and hospitals for the logistical collection of patient’s white blood cells and ultimate delivery of Yescarta to patients. Any disruption or difficulties incurred by any of these vendors could result in product loss and regulatory action and harm our Yescarta business and our reputation.
In addition, to ensure that any apheresis center is prepared to ship cells to our manufacturing facilities, we plan to conduct quality certifications of each apheresis center. However, apheresis centers may choose not to participate in the certification process or we may be unable to complete certification in a timely manner or at all, which could delay or restrain our manufacturing and commercialization efforts. As a result, our sales of Yescarta may be limited which could harm our results of operations.
Our success depends to a significant degree on our ability to defend our patents and other intellectual property rights both domestically and internationally. We may not be able to obtain effective patents to protect our technologies from use by competitors and patents of other companies could require us to stop using or pay for the use of required technology.
Patents and other proprietary rights are very important to our business. Our success depends to a significant degree on our ability to:
|
•
|
obtain patents and licenses to patent rights;
|
|
•
|
preserve trade secrets and internal know-how;
|
30
|
•
|
defend against infringement and efforts to invalidate our patents; and
|
|
•
|
operate without infringing on the intellectual property of others.
|
If we have a properly drafted and enforceable patent, it can be more difficult for our competitors to use our technology to create competitive products and more difficult for our competitors to obtain a patent that prevents us from using technology we create. As part of our business strategy, we actively seek patent protection both in the United States and internationally and file additional patent applications, when appropriate, to cover improvements in our compounds, products and technology.
We have a number of U.S. and foreign patents, patent applications and rights to patents related to our compounds, products and technology, but we cannot be certain that issued patents will be enforceable or provide adequate protection or that pending patent applications will result in issued patents. Patent applications are confidential for a period of time before a patent is issued. As a result, we may not know if our competitors filed patent applications for technology covered by our pending applications or if we were the first to invent or first to file an application directed toward the technology that is the subject of our patent applications. Competitors may have filed patent applications or received patents and may obtain additional patents and proprietary rights that block or compete with our products. In addition, if competitors file patent applications covering our technology, we may have to participate in litigation, interference or other proceedings to determine the right to a patent or validity of any patent granted. Litigation, interference or other proceedings are unpredictable and expensive, and could divert management attention from other operations, such that, even if we are ultimately successful, our results of operations may be adversely affected by such events.
For example, TDF, one of the active pharmaceutical ingredients in Stribild, Complera/Eviplera, Atripla and Truvada, and the main active pharmaceutical ingredient in Viread, faces generic competition in the European Union, the United States and certain other countries. In addition, because emtricitabine, the other active pharmaceutical ingredient of Truvada, faces generic competition in the European Union, Truvada also faces generic competition in the European Union and certain other countries outside of the United States. Letairis is also expected to face generic competition in the United States starting in July 2018. The entry of these generic products may lead to market share and price erosion and have a negative impact on our business and results of operations. In addition, we do not own any patents covering ranolazine, the active ingredient of Ranexa. Instead, when it was discovered that only a sustained-release formulation of ranolazine would achieve therapeutic plasma levels, we obtained patents on those formulations and the characteristic plasma levels they achieve. For Yescarta, the composition of matter patent has expired in the European Union. In the European Union and the United States, patent applications are pending related to Kite’s proprietary manufacturing processes.
We may obtain patents for certain products many years before marketing approval is obtained for those products. Because patents have a limited life, which may begin to run prior to the commercial sale of the related product, the commercial value of the patent may be limited. However, we may be able to apply for patent term extensions or supplementary protection certificates in some countries.
Generic manufacturers have sought, and may continue to seek, FDA approval to market generic versions of our products through an abbreviated new drug application (ANDA), the application form typically used by manufacturers seeking approval of a generic drug. See a description of our ANDA litigation in Note
12
, Commitments and Contingencies - Legal Proceedings of the Notes to Consolidated Financial Statements included in Part II, Item 8 of this Annual Report on Form 10-K and risk factor entitled “Litigation with generic manufacturers has increased our expenses which may continue to reduce our earnings. If we are unsuccessful in all or some of these lawsuits, some or all of our claims in the patents may be narrowed or invalidated and generic versions of our products could be launched prior to our patent expiry.” beginning on
page 35.
Our success depends in large part on our ability to operate without infringing upon the patents or other proprietary rights of third parties.
If we infringe the valid patents of third parties, we may be required to pay significant monetary damages or we may be prevented from commercializing products or may be required to obtain licenses from these third parties. We may not be able to obtain alternative technologies or any required license on commercially reasonable terms or at all. If we fail to obtain these licenses or alternative technologies, we may be unable to develop or commercialize some or all of our products. For example, we are aware of patents and patent applications owned by third parties that such parties may claim to cover the use of sofosbuvir, axicabtagene ciloleucel and bictegravir. See also a description of our litigation regarding sofosbuvir, axicabtagene ciloleucel and bictegravir in Note
12
, Commitments and Contingencies - Legal Proceedings of the Notes to Consolidated Financial Statements included in Part II, Item 8 of this Annual Report on Form 10-K and the risk factors entitled “If any of our HCV products is proven to infringe the patents of any third party, we may be required to pay significant monetary damages, which could adversely affect our financial results.
”
beginning on page 32 and “If any party is successful in establishing exclusive rights to axicabtagene ciloleucel, our anticipated revenues and earnings from the sale of that product could be adversely affected.” beginning on page 33. We are also aware of U.S. Patent Nos. 9,044,509 and 9,579,333 assigned to the U.S. Department of Health and Human Services that purports to claim a process of protecting a primate host from infection by an immunodeficiency retrovirus by administering a combination of emtricitabine and tenofovir or TDF prior to exposure of the host to the immunodeficiency retrovirus. We have been in contact with the U.S. Department of Health and Human Services about the scope and relevance of the patents and have explained that we
31
do not believe that these patents are valid because the patent office was not given the most relevant prior art and because physicians and patients were using the claimed methods years before the Centers for Disease Control and Prevention filed the applications for the patents.
Furthermore, we also rely on unpatented trade secrets and improvements, unpatented internal know-how and technological innovation. For example, a great deal of our liposomal manufacturing expertise, which is a key component of our liposomal technology, is not covered by patents but is instead protected as a trade secret. We protect these rights mainly through confidentiality agreements with our corporate partners, employees, consultants and vendors. These agreements provide that all confidential information developed or made known to an individual during the course of their relationship with us will be kept confidential and will not be used or disclosed to third parties except in specified circumstances. In the case of employees, the agreements provide that all inventions made by an individual while employed by us will be our exclusive property. We cannot be certain that these parties will comply with these confidentiality agreements, that we have adequate remedies for any breach or that our trade secrets, internal know-how or technological innovation will not otherwise become known or be independently discovered by our competitors. Under some of our R&D agreements, inventions become jointly owned by us and our corporate partner and in other cases become the exclusive property of one party. In certain circumstances, it can be difficult to determine who owns a particular invention and disputes could arise regarding those inventions. If our trade secrets, internal know-how, technological innovation or confidential information become known or independently discovered by competitors or if we enter into disputes over ownership of inventions, our business and results of operations could be adversely affected.
If any of our HCV products is proven to infringe the patents of any third party, we may be required to pay significant monetary damages, which could adversely affect our financial results.
We own patents and patent applications that claim sofosbuvir (Sovaldi) as a chemical entity and its metabolites and the fixed-dose combinations of ledipasvir and sofosbuvir (Harvoni), sofosbuvir and velpatasvir (Epclusa) and sofosbuvir, velpatasvir and voxilaprevir (Vosevi). We are aware of patents and patent applications owned by third parties that have been or may in the future be alleged by such parties to cover the use of our HCV products. If third parties obtain valid and enforceable patents, and successfully prove infringement of those patents by our HCV products, we could be required to pay significant monetary damages.
Current legal proceedings of significance related to sofosbuvir include:
Litigation with Idenix Pharmaceuticals, Inc. (Idenix)
In March 2014, the European Patent Office (EPO) granted Idenix European Patent No. 1 523 489 (the ‘489 patent), which corresponds to the ‘600 patent. The same day that the ‘489 patent was granted, we filed an opposition with the EPO seeking to revoke the ‘489 patent. An opposition hearing was held in February 2016, and the EPO ruled in our favor and revoked the ‘489 patent. Idenix has appealed.
See also a description of our Idenix litigation in Note
12
, Commitments and Contingencies - Legal Proceedings of the Notes to Consolidated Financial Statements included in Part II, Item 8 of this Annual Report on Form 10-K.
Litigation with Merck
In August 2013, Merck contacted us requesting that we pay royalties on the sales of sofosbuvir and obtain a license to U.S. Patent No. 7,105,499 (the ‘499 patent) and U.S. Patent No. 8,481,712 (the ‘712 patent), which it co-owns with Ionis Pharmaceuticals, Inc. The ‘499 and ‘712 patents cover compounds which do not include, but may relate to, sofosbuvir. We filed a lawsuit in August 2013 in the U.S. District Court for the Northern District of California seeking a declaratory judgment that the Merck patents are invalid and not infringed. During patent prosecution, Merck amended its patent application in an attempt to cover compounds related to sofosbuvir. Initially, in March 2016, a jury determined that we had not established that Merck’s patents are invalid for lack of written description or lack of enablement and awarded Merck $200 million in damages. However, in June 2016, the court ruled in our favor on our defense of unclean hands and determined that Merck may not recover any damages from us for the ‘499 and ‘712 patents. The judge has determined that Merck is required to pay our attorney’s fees due to the exceptional nature of this case. In July 2017, the court issued a decision setting the amount of attorney fees awarded to Gilead.
Merck has filed notices of appeal to the CAFC regarding the court’s decision on our defense of unclean hands and its award of attorney’s fees. We appealed the issue relating to the invalidity of Merck’s patent. The CAFC heard oral arguments in February 2018. If the decision on our defense of unclean hands is reversed on appeal and Merck’s patent is upheld, we may be required to pay damages and a royalty on sales of sofosbuvir-containing products following the appeal. In that event, the judge has indicated that she will determine the amount of the royalty, if necessary, at the conclusion of any appeal in this case.
Litigation with the University of Minnesota
The University of Minnesota (the University) has obtained Patent No. 8,815,830 (‘830 patent), which purports to broadly cover nucleosides with antiviral and anticancer activity. In August 2016, the University filed a lawsuit against us in the U.S.
32
District Court for the District of Minnesota, alleging that the commercialization of sofosbuvir-containing products infringes the ‘830 patent. We believe that the ‘830 patent is invalid and will not be infringed by the continued commercialization of sofosbuvir. In October 2017, the court granted our motion to transfer the case to California. We have also filed four petitions for inter partes review in the USPTO alleging that all asserted claims are invalid for anticipation and obviousness.
Petitions for Inter Partes Review filed by Initiative for Medicines, Access & Knowledge
In October 2017, we received notice that Initiative for Medicines, Access & Knowledge (I-MAK) submitted multiple petitions requesting inter partes review to the USPTO Patent Trial and Appeal Board (PTAB) alleging that certain patents associated with sofosbuvir are invalid as either not novel or obvious. We strongly believe I-MAK’s petitions are without merit and that sofosbuvir, the only approved HCV drug of its kind, is both novel and not obvious. Accordingly, we will defend against these allegations. If the PTAB decides to initiate one or more inter partes reviews, a decision would be expected about a year later. Either party can appeal the PTAB’s decision to the CAFC.
European Patent Claims
In February 2015, several parties filed oppositions in the EPO requesting revocation of one of our granted European patents covering sofosbuvir that expires in 2028. In October 2016, the EPO upheld the validity of certain claims of our sofosbuvir patent. We anticipate that the challengers will appeal this decision in favor of our patent. We have appealed this decision, seeking to restore all of the original claims, and several of the original opposing parties have also appealed, requesting full revocation. The appeal process may take several years.
In April 2017, several parties filed oppositions in the EPO requesting revocation of our granted European patent relating to sofosbuvir that expires in 2024.
We cannot predict the ultimate outcome of intellectual property claims related to our HCV products, and we have spent, and will continue to spend, significant resources defending against these claims. If we are unsuccessful in all or some of these lawsuits, we could be required to pay significant monetary damages, which could have a significant negative effect on our financial results.
If any party is successful in establishing exclusive rights to axicabtagene ciloleucel, our anticipated revenues and earnings from the sale of that product could be adversely affected.
In October 2017, we acquired Kite, which is now our wholly-owned subsidiary. Through the acquisition, we acquired axicabtagene ciloleucel, a CAR T cell therapy. In October 2017, we received approval from FDA for axicabtagene ciloleucel, now known commercially as Yescarta.
We own patents and patent applications that claim axicabtagene ciloleucel chimeric DNA segments. Third parties may have, or may obtain rights to, patents that allegedly could be used to prevent or attempt to prevent us from commercializing axicabtagene ciloleucel or to require us to obtain a license in order to commercialize axicabtagene ciloleucel. For example, we are aware that Juno Therapeutics, Inc. (Juno) has exclusively licensed Patent No. 7,446,190 (the ‘190 patent) which was issued to Sloan Kettering Cancer Center. In September 2017, Juno and Sloan Kettering Cancer Center filed a lawsuit against Kite in the U.S. District Court for the Central District of California, alleging that the commercialization of axicabtagene ciloleucel infringes the ‘190 patent. In October 2017, following FDA approval for Yescarta, Juno filed a second complaint alleging that axicabtagene ciloleucel infringes the ‘190 patent. Juno subsequently moved to dismiss the September 2017 complaint and has maintained the October 2017 complaint.
In August 2015, Kite filed a petition for inter partes review in the USPTO alleging that the asserted claims of the ‘190 patent are invalid as obvious. In December 2016, the PTAB determined that the claims of the ‘190 patent are not invalid due to obviousness. In February 2017, Kite filed a Notice of Appeal to the CAFC. That appeal is currently pending.
We cannot predict the ultimate outcome of intellectual property claims related to axicabtagene ciloleucel. If Juno’s patent is upheld as valid and Juno successfully proves infringement of that patent by axicabtagene ciloleucel, we could be prevented from selling Yescarta unless we were able to obtain a license to this patent. Such a license may not be available on commercially reasonable terms or at all, which could adversely impact our business and results of operations.
Manufacturing problems, including at our third-party manufacturers and corporate partners, could cause inventory shortages and delay product shipments and regulatory approvals, which may adversely affect our results of operations.
In order to generate revenue from our products, we must be able to produce sufficient quantities of our products to satisfy demand. Many of our products are the result of complex manufacturing processes. The manufacturing process for pharmaceutical products is also highly regulated and regulators may shut down manufacturing facilities that they believe do not comply with regulations.
Our products are either manufactured at our own facilities or by third-party manufacturers or corporate partners. We depend on third parties to perform manufacturing activities effectively and on a timely basis for the majority of our solid dose products.
33
We, our third-party manufacturers and our corporate partners are subject to Good Manufacturing Practices (GMP), which are extensive regulations governing manufacturing processes, stability testing, record keeping and quality standards as defined by FDA and EMA. Similar regulations are in effect in other jurisdictions.
Our third-party manufacturers and corporate partners are independent entities who are subject to their own unique operational and financial risks which are out of our control. If we or any of these third-party manufacturers or corporate partners fail to perform as required, this could impair our ability to deliver our products on a timely basis or receive royalties or cause delays in our clinical trials and applications for regulatory approval. Further, we may have to write-off the costs of manufacturing any batch that fails to pass quality inspection or meet regulatory approval. In addition, we, our third-party manufacturers and our corporate partners may only be able to produce some of our products at one or a limited number of facilities and, therefore, have limited manufacturing capacity for certain products, and we may not be able to locate additional or replacement facilities on a reasonable basis or at all. Our sales of such products could also be adversely impacted by our reliance on such limited number of facilities. To the extent these risks materialize and affect their performance obligations to us, our financial results may be adversely affected.
Our manufacturing operations are subject to routine inspections by regulatory agencies. If we are unable to remedy any deficiencies cited by FDA in these inspections, our currently marketed products and the timing of regulatory approval of products in development could be adversely affected. Further, there is risk that regulatory agencies in other countries where marketing applications are pending will undertake similar additional reviews or apply a heightened standard of review, which could delay the regulatory approvals for products in those countries. If approval of any of our product candidates were delayed or if production of our marketed products was interrupted, our anticipated revenues and our stock price would be adversely affected.
We have limited experience managing the T cell engineering process, and our processes may be more difficult or more expensive than the approaches taken by our current and future competitors. We cannot be sure that the manufacturing processes employed by us will result in engineered T cells that will be safe and effective. In addition, we may encounter difficulties in production, particularly in scaling up and validating initial production to meet patient demand and ensuring the absence of contamination. These problems could include difficulties with production costs and yields, quality control, including stability of the product, quality assurance testing, operator error, shortages of qualified personnel, as well as compliance with strictly enforced federal, state and foreign regulations. Further, if contaminants are discovered in our supply of Yescarta or in the manufacturing facilities, such manufacturing facilities may need to be closed for an extended period of time to investigate and remedy the contamination, which could require substantial resources and management attention. We cannot assure you that any stability or other issues relating to the manufacture of Yescarta will not occur in the future or that any such issues may be remedied on a timely basis or at all. In addition, we may fail to manage the logistics of collecting and shipping patient material to the manufacturing site and shipping Yescarta back to the patient. Logistical and shipment delays and problems caused by us, our vendors or other factors not in our control, such as weather and natural disasters, could prevent or delay the delivery of our products and product candidates to patients. Additionally, we are required to maintain a complex chain of identity and custody with respect to patient material as such material moves to the manufacturing facilities, through the manufacturing process, and back to the patient. Failure to maintain chain of identity and custody could result in patient death, loss of product or regulatory action, which could have an adverse effect on us, our reputation and our stock price.
We may not be able to obtain materials or supplies necessary to conduct clinical trials or to manufacture and sell our products, which would limit our ability to generate revenues.
We need access to certain supplies and products to conduct our clinical trials and to manufacture our products. If we are unable to purchase sufficient quantities of these materials or find suitable alternate materials in a timely manner, our development efforts for our product candidates may be delayed or our ability to manufacture our products would be limited, which would limit our ability to generate revenues.
Suppliers of key components and materials must be named in the new drug application or MAA filed with FDA, EMA or other regulatory authority for any product candidate for which we are seeking marketing approval, and significant delays can occur if the qualification of a new supplier is required. Even after a manufacturer is qualified by the regulatory authority, the manufacturer must continue to expend time, money and effort in the area of production and quality control to ensure full compliance with GMP. Manufacturers are subject to regular, periodic inspections by the regulatory authorities following initial approval. If, as a result of these inspections, a regulatory authority determines that the equipment, facilities, laboratories or processes do not comply with applicable regulations and conditions of product approval, the regulatory authority may suspend the manufacturing operations. If the manufacturing operations of any of the single suppliers for our products are suspended, we may be unable to generate sufficient quantities of commercial or clinical supplies of product to meet market demand, which would in turn decrease our revenues and harm our business. In addition, if delivery of material from our suppliers were interrupted for any reason, we may be unable to ship certain of our products for commercial supply or to supply our products in development for clinical trials. In addition, some of our products and the materials that we utilize in our operations are made at only one facility, which we may not able to replace in a timely manner and on commercially reasonable terms, or at all. Problems with any of the single suppliers we depend on,
34
including in the event of a disaster, including an earthquake, equipment failure or other difficulty, may negatively impact our development and commercialization efforts.
A significant portion of the raw materials and intermediates used to manufacture our antiviral products are supplied by third-party manufacturers and corporate partners outside of the United States. As a result, any political or economic factors in a specific country or region, including any changes in or interpretations of trade regulations, compliance requirements or tax legislation, that would limit or prevent third parties outside of the United States from supplying these materials would adversely affect our ability to manufacture and supply our antiviral products to meet market needs and have a material and adverse effect on our operating results.
If we were to encounter any of these difficulties, our ability to provide our products and product candidates to patients would be jeopardized.
Litigation with generic manufacturers has increased our expenses which may continue to reduce our earnings. If we are unsuccessful in all or some of these lawsuits, some or all of our claims in the patents may be narrowed or invalidated and generic versions of our products could be launched prior to our patent expiry.
As part of the approval process for some of our products, FDA granted us a New Chemical Entity (NCE) exclusivity period during which other manufacturers’ applications for approval of generic versions of our product will not be approved. Generic manufacturers may challenge the patents protecting products that have been granted NCE exclusivity one year prior to the end of the NCE exclusivity period. Generic manufacturers have sought and may continue to seek FDA approval for a similar or identical drug through an ANDA, the application form typically used by manufacturers seeking approval of a generic drug. To seek approval for a generic version of a product having NCE status, a generic manufacturer may submit its ANDA to FDA four years after the branded product’s approval. For sofosbuvir, this date falls in December 2017. Consequently, it is possible that one or more generic manufacturers can file an ANDA for sofosbuvir as of December 2017.
Current legal proceedings of significance with some of our generic manufacturers include:
Mylan
In February 2016, we received notice that Mylan Pharmaceuticals, Inc. (Mylan) submitted an ANDA to FDA requesting permission to manufacture and market a generic version of Tybost (cobicistat). In the notice, Mylan alleges that the patent covering cobicistat is invalid as obvious and that Mylan’s generic product cannot infringe an invalid claim. In March 2016, we filed lawsuits against Mylan in the U.S. District Court for the District of Delaware and U.S. District Court for the Northern District of West Virginia. The parties have agreed to dismiss the action in West Virginia, and the trial in Delaware was stayed. The patent in suit that covers Tybost is also listed in the Orange Book for Stribild and Genvoya. In November 2017, we received notice that Mylan submitted an ANDA to FDA requesting permission to manufacture and market a generic version of Evotaz (atazanavir/cobicistat) and challenging the validity of our cobicistat compound patent, citing the arguments it has made in the ongoing litigation involving Tybost. In December 2017, we filed a lawsuit against Mylan in the U.S. District Court for the Northern District of West Virginia.
Amneal
In May 2017, we received notice that Amneal Pharmaceuticals LLC (Amneal) submitted an ANDA to FDA requesting permission to manufacture and market a generic version of Truvada at low dosage strengths. In the notice, Amneal alleges that two patents associated with emtricitabine are invalid, unenforceable and/or will not be infringed by Amneal’s manufacture, use or sale of generic versions of Truvada at low dosage strengths. In July 2017, we filed a lawsuit against Amneal in the U.S. District Court for the District of Delaware for infringement of our patents.
Natco and Teva
In February 2018, we received notices from Natco Pharma Limited (Natco) and Teva Pharmaceuticals (Teva) that they have each submitted an ANDA to FDA requesting permission to manufacture and market a generic version of Sovaldi. In Teva’s notice, it alleges that nine patents associated with sofosbuvir are invalid, unenforceable and/or will not be infringed by Teva’s manufacture, use or sale of generic versions of Sovaldi. In Natco’s notice, it alleges that two patents associated with sofosbuvir are invalid, unenforceable and/or will not be infringed by Natco’s manufacture, use or sale of generic versions of Sovaldi. Natco did not challenge all patents listed on the Orange Book for Sovaldi. We are evaluating the notice letters and determining next steps.
We cannot predict the ultimate outcome of the foregoing actions and other litigation with generic manufacturers, and we may spend significant resources enforcing and defending these patents. If we are unsuccessful in these lawsuits, some or all of our original claims in the patents may be narrowed or invalidated and the patent protection for these products could be substantially shortened. Further, if all of the patents covering one or more products are invalidated, FDA could approve the requests to manufacture a generic version of such products in the United States prior to the expiration date of those patents. The sale of generic versions
35
of these products earlier than their patent expiration would have a significant negative effect on our revenues and results of operations.
Imports from countries where our products are available at lower prices and unapproved generic or counterfeit versions of our products could have a negative impact on our reputation and business.
Prices for our products are based on local market economics and competition and sometimes differ from country to country. Our sales in countries with relatively higher prices may be reduced if products can be imported into those or other countries from lower price markets. If our HIV, HBV and HCV products, which we have agreed to make available at substantially reduced prices to certain low- and middle-income countries participating in our Gilead Access Program, are re-exported from these low- and middle-income countries into the United States, Europe or other higher price markets, our revenues would be adversely affected. In addition, we have entered into voluntary licensing agreements with generic drug companies in India, South Africa and China, as well as a licensing agreement with the Medicines Patent Pool, a United Nations-backed public health organization, which allows generic drug companies to manufacture generic versions of HIV and HBV products incorporating our licensed compounds, TAF, cobicistat, elvitegravir and bictegravir, for distribution in certain low- and middle-income countries. We have also entered into licensing agreements with generic manufacturers in India, Egypt and Pakistan to produce and distribute generic versions of our HCV products in certain low- and middle-income countries. If generic versions of our HIV, HBV and HCV products under these licenses are then re-exported to the United States, Europe or other markets outside of these low- and middle-income countries, our revenues would be adversely affected.
In addition, purchases of our products in countries where our selling prices are relatively low for resale in countries in which our selling prices are relatively high may adversely impact our revenues and gross margin and may cause our sales to fluctuate from quarter to quarter. For example, in the European Union, we are required to permit products purchased in one country to be sold in another country. Purchases of our products in countries where our selling prices are relatively low for resale in countries in which our selling prices are relatively high can affect the inventory level held by our wholesalers and can cause the relative sales levels in the various countries to fluctuate from quarter to quarter and not reflect the actual consumer demand in any given quarter. These quarterly fluctuations may impact our earnings, which could adversely affect our stock price and harm our business.
We are also aware of the existence of various “Buyers Clubs” around the world that promote the personal importation of generic versions of our HCV products that have not been approved for use in the countries into which they are imported. As a result, patients may be at risk of taking unapproved medications which may not be what they purport to be, may not have the potency they claim to have or may contain harmful substances. To the extent patients take unapproved generic versions of one or more of our medications and are injured or not cured by these products, our brand or the commercial or scientific reputation of our HCV products could be harmed.
Further, third parties may illegally distribute and sell counterfeit versions of our products, which do not meet the rigorous quality standards of our manufacturing and supply chain. For example, in the first quarter of 2017, bottles of counterfeit drugs labeled under the Harvoni brand name were discovered at a retail pharmacy chain and pharmaceutical wholesalers in Japan. We investigated this matter and accelerated planned changes to our product packaging to make counterfeiting more difficult. We cooperated and continue to cooperate with the Japanese health ministry. Also, in the third quarter of 2017, bottles of counterfeit drugs labeled under the Sovaldi brand name were discovered at a retail pharmacy chain and pharmaceutical wholesalers in Germany. We investigated this matter and determined that a number of wholesalers had obtained Sovaldi from an unapproved source. We cooperated and continue to cooperate with the German regulatory authorities. Also in 2017, there were reports that a product labeled as Epclusa was available in multiple countries, which we determined was not authentic product based on sample analysis and the lot number. We are working with regulatory authorities to investigate this matter. We actively take actions to discourage counterfeits of our products around the world, including working with local regulatory and legal authorities to enforce laws against counterfeit drugs. Counterfeit drugs pose a serious risk to patient health and safety. Our reputation and business could suffer as a result of counterfeit drugs sold under our brand name.
Expensive litigation and government investigations have increased our expenses which may continue to reduce our earnings.
We are involved in a number of litigation, investigation and other dispute-related matters that require us to expend substantial internal and financial resources. We expect these matters will continue to require a high level of internal and financial resources for the foreseeable future. These matters have reduced and will continue to reduce our earnings and require significant management attention. Please see a description of our litigation, investigation and other dispute-related matters in Note
12
, Commitments and Contingencies - Legal Proceedings of the Notes to Consolidated Financial Statements included in Part II, Item 8 of this Annual Report on Form 10-K. The outcome of such legal proceedings or any other legal proceedings that may be brought against us, the investigations or any other investigations that may be initiated and any other dispute-related matters, are inherently uncertain, and adverse developments or outcomes can result in significant expenses, monetary damages, penalties or injunctive relief against us that could significantly reduce our earnings and cash flows and harm our business.
36
In some countries, we may be required to grant compulsory licenses for our products or our patents may not be enforced.
In a number of developing countries, government officials and other interested groups have suggested that pharmaceutical companies should make drugs for HIV or HCV infection available at low cost. Alternatively, governments in those developing countries could require that we grant compulsory licenses to allow competitors to manufacture and sell their own versions of our products, thereby reducing our product sales. For example, there is growing attention on the availability of HCV therapies and some activists are advocating for the increased availability of HCV therapies through other means including compulsory licenses. The government of Malaysia has exercised Government Rights under Section 84 of the Malaysian Patents Act to practice the patented invention of sofosbuvir for a period of three years for use only in government hospitals and clinics. We are challenging the Malaysian government’s actions. In the past, certain offices of the government of Brazil have expressed concern over the affordability of our HIV products and declared that they were considering issuing compulsory licenses to permit the manufacture of otherwise patented products for HIV infection, including Viread. If compulsory licenses permit generic manufacturing to override our product patents for our HIV, HCV or other products, or if we are required to grant compulsory licenses for these products, it could reduce our earnings and cash flows and harm our business.
In addition, certain countries do not permit enforcement of our patents, or permit our patents to issue, and third-party manufacturers are able to sell generic versions of our products in those countries. For example, in 2017, the Brazilian Health Regulatory Agency rejected our patent applications related to sofosbuvir and our HCV products. We successfully appealed those decisions, and those applications are now under examination at the Brazilian Patent and Trademark Office. Sales of generic versions of our products could significantly reduce our sales and adversely affect our results of operations, particularly if generic versions of our products are imported into territories where we have existing commercial sales.
We may face significant liability resulting from our products that may not be covered by insurance and such liability could materially reduce our earnings.
The testing, manufacturing, marketing and use of our commercial products, as well as product candidates in development, involve substantial risk of product liability claims. These claims may be made directly by consumers, healthcare providers, pharmaceutical companies or others. We may not have sufficient insurance coverage for product liabilities that may arise. In addition, the cost to defend lawsuits or pay damages for product liability claims may exceed our insurance coverage. If we do not maintain adequate coverage or if claims exceed our coverage, our financial condition will be adversely affected. In addition, negative publicity associated with any claims, regardless of their merit, may decrease the future demand for our products and impair our financial condition.
Business disruptions from natural or man-made disasters may harm our future revenues.
Our worldwide operations could be subject to business interruptions stemming from natural or man-made disasters for which we may be uninsured or inadequately insured. Our corporate headquarters in Foster City and our Santa Monica location, which together house a majority of our R&D activities, and our San Dimas, La Verne, Oceanside and El Segundo manufacturing facilities are located in California, a seismically active region. As we may not carry adequate earthquake insurance and significant recovery time could be required to resume operations, our financial condition and operating results could be materially adversely affected in the event of a major earthquake. In addition, our Yescarta business is also reliant on our ability to manage the logistics of collecting and shipping patient material to our manufacturing facilities and shipping Yescarta back to the patient. Any logistical and shipment delays caused by such natural or man-made disasters could prevent or delay the delivery of our products to patients and could harm our Yescarta business.
We are dependent on information technology systems, infrastructure and data.
We are dependent upon information technology systems, infrastructure and data, including our new Kite Konnect platform. The multitude and complexity of our computer systems make them inherently vulnerable to service interruption or destruction, malicious intrusion and random attack. Likewise, data privacy or security breaches by employees or others may pose a risk that sensitive data, including our intellectual property, trade secrets or personal information of our employees, patients, customers or other business partners may be exposed to unauthorized persons or to the public. Cyberattacks
are increasing in their frequency, sophistication and intensity. Cyberattacks could include the deployment of harmful malware, denial-of-service, social engineering and other means to affect service reliability and threaten data confidentiality, integrity and availability. Our business and technology partners face similar risks and any security breach of their systems could adversely affect our security posture. While we have invested, and continue to invest, in the protection of our data and information technology infrastructure, there can be no assurance that our efforts, or the efforts of our partners and vendors, will prevent service interruptions, or identify breaches in our systems, that could adversely affect our business and operations and/or result in the loss of critical or sensitive information, which could result in financial, legal, business or reputational harm to us. In addition, our liability insurance may not be sufficient in type or amount to cover us against claims related to security breaches, cyberattacks and other related breaches.
37
Regulators globally are also imposing greater monetary fines for privacy violations. For example, in 2016, the European Union adopted a new law governing data practices and privacy called the General Data Protection Regulation (GDPR), which becomes effective in May 2018. The law establishes new requirements regarding the handling of personal data, and non-compliance with the GDPR may result in monetary penalties of up to 4% of worldwide revenue. The GDPR and other changes in laws or regulations associated with the enhanced protection of certain types of sensitive data, such as healthcare data or other personal information, could greatly increase our cost of providing our products and services or even prevent us from offering certain services in jurisdictions that we operate.
Changes in our effective income tax rate could reduce our earnings.
We are subject to income taxes in the United States and various foreign jurisdictions including Ireland. Due to economic and political conditions, various countries are actively considering and have made changes to existing tax laws. We cannot predict the form or timing of potential legislative changes that could have a material adverse impact on our results of operations. For example, the United States recently enacted significant tax reform, and certain provisions of the new law will significantly affect us. The accounting for these changes is currently considered provisional and may change materially during the measurement period due to the issuance of anticipated guidance and finalization of certain accounting method elections. See Note 17, Income Taxes of the Notes to Consolidated Financial Statements included in Part II, Item 8 of this Annual Report on Form 10-K for additional details.
In addition, significant judgment is required in determining our worldwide provision for income taxes. Various factors may have favorable or unfavorable effects on our income tax rate including, but not limited to, changes in forecasted demand for our HCV products, our portion of the non-tax deductible annual BPD fee, the accounting for stock options and other share-based awards, mergers and acquisitions, the ability to manufacture product in our Cork, Ireland facility, the amortization of certain acquisition related intangibles for which we receive no tax benefit, future levels of R&D spending, changes in the mix of earnings in the various tax jurisdictions in which we operate, changes in overall levels of pre-tax earnings and resolution of federal, state and foreign income tax audits. The impact on our income tax provision resulting from the above mentioned factors may be significant and could have a negative impact on our consolidated results of operations.
Our income tax returns are subject to audit by federal, state and foreign tax authorities. We are currently under examination by the Internal Revenue Service for the tax years from 2010 to 2014 and by various state and foreign jurisdictions. There are differing interpretations of tax laws and regulations and, as a result, significant disputes may arise with these tax authorities involving issues of the timing and amount of deductions and allocations of income among various tax jurisdictions. Resolution of one or more of these exposures in any reporting period could have a material impact on the results of operations for that period.
If we fail to attract and retain highly qualified personnel, we may be unable to successfully develop new product candidates, conduct our clinical trials and commercialize our product candidates.
Our future success will depend in large part on our continued ability to attract and retain highly qualified scientific, technical and management personnel, as well as personnel with expertise in clinical testing, governmental regulation and commercialization. We face competition for personnel from other companies, universities, public and private research institutions, government entities and other organizations. Competition for qualified personnel in the biopharmaceutical field is intense, and there is a limited pool of qualified potential employees to recruit. We may not be able to attract and retain quality personnel on acceptable terms. Additionally, changes to U.S. immigration and work authorization laws and regulations could make it more difficult for employees to work in or transfer to jurisdictions in which we have operations and could impair our ability to attract and retain qualified personnel. If we are unsuccessful in our recruitment and retention efforts, our business may be harmed.
There can be no assurance that we will pay dividends or continue to repurchase stock.
Our Board of Directors authorized a dividend program under which we intend to pay quarterly dividends of $0.57 per share, subject to quarterly declarations by our Board of Directors. Our Board of Directors also approved the repurchase of up to $12.0 billion of our common stock, of which
$8.0 billion
is available for repurchase as of
December 31, 2017
. Any future declarations, amount and timing of any dividends and/or the amount and timing of such stock repurchases are subject to capital availability and determinations by our Board of Directors that cash dividends and/or stock repurchases are in the best interest of our stockholders and are in compliance with all respective laws and our agreements applicable to the declaration and payment of cash dividends and the repurchase of stock. Our ability to pay dividends and/or repurchase stock will depend upon, among other factors, our cash balances and potential future capital requirements for strategic transactions, including acquisitions, debt service requirements, results of operations, financial condition and other factors beyond our control that our Board of Directors may deem relevant. A reduction in or elimination of our dividend payments, our dividend program and/or stock repurchases could have a negative effect on our stock price.
|
ITEM 1B.
|
UNRESOLVED STAFF COMMENTS
|
Not applicable.
38
|
ITEM 2.
|
PROPERTIES
|
Our corporate headquarters is located in Foster City, California, where we house our administrative, manufacturing and R&D activities. We also have R&D facilities in Oceanside and Santa Monica, California; Seattle, Washington; and Alberta, Canada and manufacturing facilities in El Segundo, La Verne, Oceanside, San Dimas, California; Alberta, Canada; and Cork, Ireland. Our global operations include offices in Europe, North America, Asia, South America, Africa, Australia and the Middle East.
We believe that our existing properties, including both owned and leased sites, are in good condition and suitable for the conduct of our business. We believe our capital resources are sufficient to purchase, lease or construct any additional facilities required to meet our expected long-term growth needs.
|
ITEM 3.
|
LEGAL PROCEEDINGS
|
For a description of our significant pending legal proceedings, please see Note
12
, Commitments and Contingencies - Legal Proceedings of the Notes to Consolidated Financial Statements included in Part II, Item 8 of this Annual Report on Form 10-K, which is incorporated herein by reference.
|
ITEM 4.
|
MINE SAFETY DISCLOSURES
|
Not applicable.
|
ITEM 5.
|
MARKET FOR REGISTRANT’S COMMON EQUITY, RELATED STOCKHOLDER MATTERS AND ISSUER PURCHASES OF EQUITY SECURITIES
|
Our common stock is traded on the Nasdaq Global Select Market under the symbol “GILD.” The following table sets forth the high and low intra-day sale prices per share of our common stock on the Nasdaq Global Select Market for the periods indicated. These prices represent quotations among dealers without adjustments for retail mark-ups, markdowns or commissions and may not represent prices of actual transactions.
|
2017
|
2016
|
|||||||||||||||
|
High
|
Low
|
High
|
Low
|
|||||||||||||
|
First Quarter
|
$
|
76.98
|
|
$
|
65.38
|
|
$
|
100.68
|
|
$
|
81.89
|
|
||||
|
Second Quarter
|
$
|
72.17
|
|
$
|
63.76
|
|
$
|
103.10
|
|
$
|
77.92
|
|
||||
|
Third Quarter
|
$
|
86.27
|
|
$
|
68.54
|
|
$
|
88.85
|
|
$
|
76.67
|
|
||||
|
Fourth Quarter
|
$
|
84.23
|
|
$
|
70.05
|
|
$
|
80.00
|
|
$
|
70.83
|
|
||||
As of
February 15, 2018
, we had
1,309,967,781
shares of common stock outstanding held by approximately
345
stockholders of record, which include shares held by a broker, bank or other nominee.
Dividends
During
2017
, we declared and paid quarterly cash dividends for an aggregate amount of
$2.7 billion
or
$2.08
per common share. During
2016
, we declared and paid quarterly cash dividends for an aggregate amount of $2.5 billion or $1.84 per common share. See Note
13
, Stockholders’ Equity of the Notes to Consolidated Financial Statements included in Item 8 of this Annual Report on Form 10-K for additional information.
39
Performance Graph
(1)
The following graph compares our cumulative total stockholder return for the past five years to two indices: the Standard & Poor’s 500 Stock Index, labeled S&P 500 Index; and the Nasdaq Biotechnology Index, labeled NBI Index. The stockholder return shown on the graph below is not necessarily indicative of future performance, and we do not make or endorse any predictions as to future stockholder returns.
Comparison of Cumulative Total Return on Investment for the Past Five Years
(2)
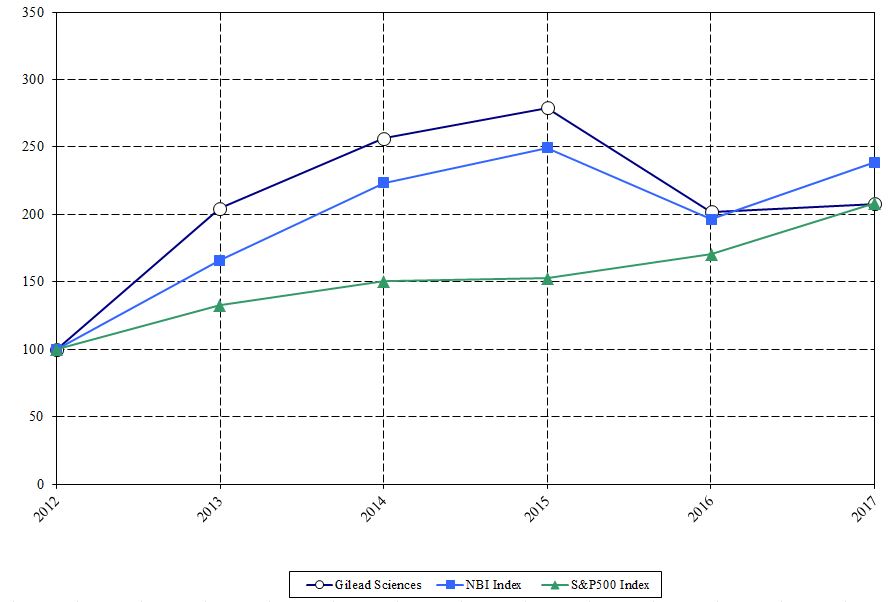
______________________________________________________
Notes:
|
(1)
|
This section is not “soliciting material,” is not deemed “filed” with the SEC and is not to be incorporated by reference in any of our filings under the Securities Act or the Exchange Act whether made before or after the date hereof and irrespective of any general incorporation language in any such filing.
|
|
(2)
|
Shows the cumulative return on investment assuming an investment of $100 in our common stock, the NBI Index and the S&P 500 Index on December 31, 2012, and that all dividends were reinvested.
|
Issuer Purchases of Equity Securities
In the first quarter of 2016, our Board of Directors authorized a $12.0 billion share repurchase program (2016 Program) under which repurchases may be made in the open market or in privately negotiated transactions. We started repurchases under the 2016 Program in April 2016.
During
2017
, we repurchased and retired 13 million shares of our common stock for
$954 million
through open market transactions under the 2016 Program.
The table below summarizes our stock repurchase activity for the three months ended
December 31, 2017
:
|
Total Number
of Shares
Purchased
(in thousands)
|
Average
Price Paid
per Share
(in dollars)
|
Total Number of
Shares Purchased
as Part of a Publicly
Announced Program
(in thousands)
|
Maximum Fair
Value of Shares
that May Yet Be
Purchased Under
the Program
(in millions)
|
|||||||||||
|
October 1 - October 31, 2017
|
522
|
|
$
|
80.47
|
|
500
|
|
$
|
8,112
|
|
||||
|
November 1 - November 30, 2017
|
681
|
|
$
|
73.06
|
|
502
|
|
$
|
8,075
|
|
||||
|
December 1 - December 31, 2017
|
495
|
|
$
|
74.36
|
|
393
|
|
$
|
8,046
|
|
||||
|
Total
|
1,698
|
|
(1)
|
$
|
75.72
|
|
1,395
|
|
(1)
|
|||||
|
_________________________________________
|
||||||||||||||
Note:
|
(1)
|
The difference between the total number of shares purchased and the total number of shares purchased as part of a publicly announced program is due to shares of common stock withheld by us from employee restricted stock awards in order to satisfy applicable tax withholding obligations.
|
40
|
ITEM 6.
|
SELECTED FINANCIAL DATA
|
GILEAD SCIENCES, INC.
SELECTED CONSOLIDATED FINANCIAL DATA
(in millions, except per share data)
|
Year Ended December 31,
|
|||||||||||||||||||
|
2017
|
2016
|
2015
|
2014
|
2013
|
|||||||||||||||
|
CONSOLIDATED STATEMENT OF INCOME DATA:
|
|||||||||||||||||||
|
Total revenues
(1)
|
$
|
26,107
|
|
$
|
30,390
|
|
$
|
32,639
|
|
$
|
24,890
|
|
$
|
11,202
|
|
||||
|
Total costs and expenses
(1)
|
$
|
11,983
|
|
$
|
12,757
|
|
$
|
10,446
|
|
$
|
9,625
|
|
$
|
6,678
|
|
||||
|
Income from operations
|
$
|
14,124
|
|
$
|
17,633
|
|
$
|
22,193
|
|
$
|
15,265
|
|
$
|
4,524
|
|
||||
|
Provision for income taxes
(2)
|
$
|
8,885
|
|
$
|
3,609
|
|
$
|
3,553
|
|
$
|
2,797
|
|
$
|
1,151
|
|
||||
|
Net income
(2)
|
$
|
4,644
|
|
$
|
13,488
|
|
$
|
18,106
|
|
$
|
12,059
|
|
$
|
3,057
|
|
||||
|
Net income attributable to Gilead
(2)
|
$
|
4,628
|
|
$
|
13,501
|
|
$
|
18,108
|
|
$
|
12,101
|
|
$
|
3,075
|
|
||||
|
Net income per share attributable to Gilead
common stockholders - basic
(2)
|
$
|
3.54
|
|
$
|
10.08
|
|
$
|
12.37
|
|
$
|
7.95
|
|
$
|
2.01
|
|
||||
|
Shares used in per share calculation - basic
|
1,307
|
|
1,339
|
|
1,464
|
|
1,522
|
|
1,529
|
|
|||||||||
|
Net income per share attributable to Gilead
common stockholders - diluted
(2)
|
$
|
3.51
|
|
$
|
9.94
|
|
$
|
11.91
|
|
$
|
7.35
|
|
$
|
1.81
|
|
||||
|
Shares used in per share calculation - diluted
|
1,319
|
|
1,358
|
|
1,521
|
|
1,647
|
|
1,695
|
|
|||||||||
|
Cash dividends declared per share
|
$
|
2.08
|
|
$
|
1.84
|
|
$
|
1.29
|
|
$
|
—
|
|
$
|
—
|
|
||||
|
December 31,
|
|||||||||||||||||||
|
2017
|
2016
|
2015
|
2014
|
2013
|
|||||||||||||||
|
CONSOLIDATED BALANCE SHEET DATA:
|
|||||||||||||||||||
|
Cash, cash equivalents and marketable securities
(3)
|
$
|
36,694
|
|
$
|
32,380
|
|
$
|
26,208
|
|
$
|
11,726
|
|
$
|
2,571
|
|
||||
|
Working capital
(3)(4)
|
$
|
20,188
|
|
$
|
10,370
|
|
$
|
14,044
|
|
$
|
11,453
|
|
$
|
259
|
|
||||
|
Total assets
(3)(5)
|
$
|
70,283
|
|
$
|
56,977
|
|
$
|
51,716
|
|
$
|
34,601
|
|
$
|
22,555
|
|
||||
|
Other long-term obligations
(4)
|
$
|
558
|
|
$
|
297
|
|
$
|
395
|
|
$
|
594
|
|
$
|
262
|
|
||||
|
Long-term debt, including current portion
(3)(5)
|
$
|
33,542
|
|
$
|
26,346
|
|
$
|
22,055
|
|
$
|
12,341
|
|
$
|
6,612
|
|
||||
|
Retained earnings
|
$
|
19,012
|
|
$
|
18,154
|
|
$
|
18,001
|
|
$
|
12,732
|
|
$
|
6,106
|
|
||||
|
Total stockholders’ equity
|
$
|
20,501
|
|
$
|
19,363
|
|
$
|
19,113
|
|
$
|
15,819
|
|
$
|
11,745
|
|
||||
|
_______________________
|
|||||||||||||||||||
|
Notes:
|
||
|
(1)
|
See Management’s Discussion and Analysis of Financial Condition and Results of Operations included in Item 7 of this Annual Report on Form 10-K for a description of our results of operations for 2017.
|
|
|
(2)
|
In December 2017, we recorded an estimated $5.5 billion net charge related to the enactment of the Tax Cuts and Jobs Act. See Note 17, Income Taxes of the Notes to Consolidated Financial Statements included in Item 8 of this Annual Report on Form 10-K for additional details.
|
|
|
(3)
|
During 2017, in connection with the acquisition of Kite Pharma, Inc., we issued $3.0 billion aggregate principal amount of senior unsecured notes in a registered offering and drew on a $6.0 billion aggregate principal amount term loan facility credit agreement, of which $1.5 billion was repaid in December 2017.
|
|
|
During 2016, we issued $5.0 billion principal amount of senior unsecured notes in a registered offering. We also repaid $285 million of principal balance of convertible senior notes due in May 2016 and $700 million of principal balance of senior unsecured notes due in December 2016.
|
||
|
During 2015, we issued $10.0 billion principal amount of senior unsecured notes in a registered offering. We also repaid $213 million of principal balance of convertible senior notes due in May 2016.
|
||
|
During 2014, we issued $8.0 billion principal amount of senior unsecured notes in registered offerings. We also repaid $912 million of principal balance of convertible senior notes due in May 2014, $750 million of principal balance of senior unsecured notes due in December 2014 and $600 million under our five-year revolving credit facility agreement.
|
||
|
During 2013, we repaid $1.5 billion of principal balance of convertible senior notes and repaid $150 million under our five-year revolving credit facility agreement.
|
||
|
(4)
|
In 2017, we retrospectively adopted Accounting Standards Update No. 2015-17 “Balance Sheet Classification of Deferred Taxes,” which requires deferred tax assets and liabilities be classified as noncurrent on the balance sheet. As a result, we reclassified deferred tax assets from Total current assets to Other long-term assets and our deferred tax liabilities from Other accrued liabilities to Other long-term obligations for each of the years presented.
|
|
|
(5)
|
In 2016, we retrospectively adopted Accounting Standards Update No. 2015-03 “Simplifying the Presentation of Debt Issuance Costs,” which requires presentation of debt issuance costs as a direct deduction from the carrying amount of a recognized debt liability on the balance sheet. As a result, we reclassified unamortized debt issuance costs from assets to Long-term debt, including current portion for each of the years presented.
|
|
41
|
ITEM 7.
|
MANAGEMENT’S DISCUSSION AND ANALYSIS OF FINANCIAL CONDITION AND RESULTS OF OPERATIONS
|
The following Management’s Discussion and Analysis of Financial Condition and Results of Operations (MD&A) is intended to help the reader understand our results of operations and financial condition. MD&A is provided as a supplement to, and should be read in conjunction with, our audited Consolidated Financial Statements and the accompanying Notes to Consolidated Financial Statements and other disclosures included in this Annual Report on Form 10-K (including the disclosures under Part I, Item 1A,
“
Risk Factors
”
). Our Consolidated Financial Statements have been prepared in accordance with U.S. generally accepted accounting principles and are presented in U.S. dollars.
Management Overview
Gilead Sciences, Inc. (Gilead, we, our or us), incorporated in Delaware on June 22, 1987, is a research-based biopharmaceutical company that discovers, develops and commercializes innovative medicines in areas of unmet medical need. With each new discovery and investigational drug candidate, we strive to transform and simplify care for people with life-threatening illnesses around the world. We have operations in more than 35 countries worldwide, with headquarters in Foster City, California. Gilead’s primary areas of focus include HIV/AIDS, liver diseases, hematology/oncology and inflammation/respiratory diseases. We seek to add to our existing portfolio of products through our internal discovery and clinical development programs and through product acquisition and in-licensing strategies.
Our portfolio of marketed products includes AmBisome
®
, Atripla
®
, Biktarvy
®
, Cayston
®
, Complera
®
/Eviplera
®
, Descovy
®
, Emtriva
®
, Epclusa
®
, Genvoya
®
, Harvoni
®
, Hepsera
®
, Letairis
®
, Odefsey
®
, Ranexa
®
, Sovaldi
®
, Stribild
®
, Truvada
®
, Tybost
®
, Vemlidy
®
, Viread
®
, Vosevi
®
, Yescarta
TM
and Zydelig
®
. We have U.S. and international commercial sales operations, with marketing subsidiaries in over 35 countries. We also sell and distribute certain products through our corporate partners under royalty-paying collaborative agreements.
2017
Business Highlights
2017 was marked by operational excellence across our business, as we accomplished many key goals that position us for future growth. During 2017, we observed strong performance in our HIV and cardiovascular products. We continued to execute on and maximize the opportunity in HCV in a changing competitive landscape. In addition, we continued to advance our product pipeline across our therapeutic areas with the goal of delivering best-in-class drugs that advance the current standard of care and/or address unmet medical need. Recent key developments include:
Key Announcements
|
•
|
FDA granted priority review for our new drug application (NDA) for Biktarvy, our fixed-dose combination of bictegravir (BIC), a novel investigational integrase strand transfer inhibitor, and emtricitabine/tenofovir alafenamide (TAF), for the treatment of HIV-1 infection. In addition, our marketing authorization application for Biktarvy has been fully validated and is now under evaluation by the European Medicines Agency (EMA). We received U.S. Food and Drug Administration (FDA) approval for Biktarvy on February 7, 2018.
|
|
•
|
European Commission granted marketing authorization for Vemlidy, a once-daily tablet for the treatment of chronic hepatitis B virus (HBV) infection in adults and adolescents (aged 12 years and older with body weight at least 35 kg).
|
|
•
|
European Commission and FDA approved Vosevi, a once-daily single tablet regimen for the treatment of HCV infection in adults with genotype 1-6. Vosevi is the first and only single tablet regimen for patients who have previously failed therapy with direct-acting antiviral (DAA) treatments and is the latest regimen in our portfolio of sofosbuvir-based HCV DAA treatments.
|
|
•
|
We announced a new licensing agreement with the Medicines Patent Pool (MPP), a United Nations-backed public health organization, to expand access to BIC. Through this agreement, MPP can sub-license rights to BIC to generic drug companies in India, China and South Africa to manufacture therapies containing BIC for distribution in certain low- and middle-income countries.
|
|
•
|
China Food and Drug Administration approved Sovaldi for the treatment of HCV infection. Sovaldi was approved for the treatment of adults and adolescents (aged 12 to 18 years) infected with HCV genotypes 1, 2, 3, 4, 5 or 6 as a component of a combination antiviral treatment regimen. Sovaldi is our first HCV medicine approved in China.
|
|
•
|
FDA approved expanded labeling for Epclusa, the first all-oral, pan-genotypic, once-daily single tablet regimen for the treatment of adults with HCV infection, to include use in patients co-infected with HIV.
|
|
•
|
European Commission extended marketing authorization for Harvoni to include the treatment of HCV infection in adolescents infected with genotype 1, 3, 4, 5 or 6. Harvoni is the first DAA regimen to receive marketing authorization in the European Union extended for use in the adolescent population.
|
42
|
•
|
FDA approved supplemental indications for Harvoni and Sovaldi for the treatment of HCV infection in adolescents without cirrhosis or with compensated cirrhosis, 12 years of age and older, or weighing at least 35 kilograms. Harvoni was approved for pediatric patients with genotype 1, 4, 5 or 6 HCV infection. Sovaldi was approved for pediatric patients with genotype 2 or 3 HCV infection, in combination with ribavirin.
|
Acquisitions
|
•
|
In October 2017, we completed a tender offer for all of the outstanding common stock of Kite Pharma, Inc. (Kite) for $180 per share in cash, or approximately $11.2 billion, excluding approximately $0.7 billion relating to the portion of the replaced stock-based awards attributable to the post combination period. We financed the transaction with $3.0 billion aggregate principal amount in senior unsecured notes issued in September 2017, a
$6.0 billion
aggregate principal amount term loan facility credit agreement entered into in September 2017 and drawn in October 2017, of which $1.5 billion was repaid in December 2017, as well as cash on hand. Kite’s cell therapies express either a chimeric antigen receptor (CAR) or an engineered T cell receptor, depending on the type of cancer. The acquisition resulted in Kite becoming our wholly-owned subsidiary and established us as a leader in cellular therapy.
|
Through the Kite acquisition, we acquired axicabtagene ciloleucel, a CAR T cell therapy. In October 2017, we received approval from FDA for axicabtagene ciloleucel, now known commercially as Yescarta, making it the first CAR T cell therapy for the treatment of adult patients with relapsed or refractory large B-cell lymphoma after two or more lines of systemic therapy, which includes diffuse large B-cell lymphoma, transformed follicular lymphoma and primary mediastinal B-cell lymphoma. We have also filed a marketing authorization application for axicabtagene ciloleucel for the treatment of the same indications with EMA, representing the first known submission in Europe for a CAR T cell therapy. Approval in Europe is expected in the first half of 2018, although there can be no assurance that we will receive such approval on a timely basis or at all. In addition to axicabtagene ciloleucel, we also acquired therapy candidates in clinical trials in both hematologic cancers and solid tumors, including KITE-585, a CAR T cell therapy candidate that targets B-cell maturation antigen expressed in multiple myeloma.
|
•
|
In December 2017, we acquired all of the issued and outstanding stock of Cell Design Labs, Inc. (Cell Design Labs), a privately held company, which was in addition to the approximately
12.2%
of shares in Cell Design Labs we obtained in the acquisition of Kite. With this acquisition, we gained new technology platforms that will enhance research and development efforts in cellular therapy.
|
See Note
5
, Acquisitions of the Notes to Consolidated Financial Statements included in Item 8 of this Annual Report on Form 10-K for additional information regarding the acquisition of Kite and Cell Design Labs.
2017
Financial Highlights
During
2017
, total revenues
decreased
to
$26.1 billion
and total product sales
decreased
to
$25.7 billion
, compared to
$30.4 billion
and
$30.0 billion
in
2016
, respectively, primarily due to the competitive dynamics of the HCV market, which lowered sales of our HCV products, partially offset by higher sales of our HIV products. In the United States, product sales were
$18.1 billion
in
2017
, compared to
$19.3 billion
in
2016
. In Europe, product sales were
$5.0 billion
in
2017
, compared to
$6.1 billion
in
2016
. Sales in other international locations were $2.6 billion in
2017
, compared to
$4.6 billion
in
2016
.
Research and development (R&D) expenses
decreased
27%
to
$3.7 billion
for
2017
compared to
2016
, primarily due to the 2016 impacts of business development activities resulting in up-front collaboration expense related to our license and collaboration agreement with Galapagos NV (Galapagos) and acquired in-process R&D (IPR&D) expense related to our purchase of Nimbus Apollo, Inc. (Nimbus), IPR&D impairment charges and ongoing milestone payments, partially offset by acquired IPR&D expense related to our purchase of Cell Design Labs in 2017.
Selling, general and administrative (SG&A) expenses increased
14%
to
$3.9 billion
for
2017
compared to
2016
, primarily due to costs associated with our acquisition of Kite and higher branded drug prescription (BPD) fee expense.
Provision for income taxes increased to
$8.9 billion
for
2017
compared to
$3.6 billion
in
2016
, primarily due to an estimated $5.5 billion net charge related to the enactment of the Tax Cuts and Jobs Act (Tax Reform) in the fourth quarter of 2017.
Net income attributable to Gilead for
2017
was
$4.6 billion
or
$3.51
per diluted share, compared to
$13.5 billion
or
$9.94
per diluted share in
2016
, primarily due to lower product sales and the impact from Tax Reform.
As of
December 31, 2017
, we had
$36.7 billion
of cash, cash equivalents and marketable securities compared to
$32.4 billion
as of
December 31, 2016
. During 2017, we generated
$11.9
billion in operating cash flow, paid cash dividends of $2.7 billion and repurchased a total of 13 million shares for $954 million through open market transactions.
43
Outlook
2018
In 2018, we will continue to maintain our strong focus on operational excellence and financial discipline. From a R&D perspective, we will continue to invest in new and ongoing clinical studies, which support both our existing products and our product candidates. We expect to move forward on a number of clinical studies for new product candidates, including advancing our cell therapy pipeline and continuing the progression of our Phase 3 studies of selonsertib for nonalcoholic steatohepatitis (NASH) and filgotinib for rheumatoid arthritis and inflammatory bowel disease. In order to further develop our product pipeline, we will focus on leveraging our balance sheet to pursue partnering and acquisition opportunities which fit into our long-term strategic plan.
From a commercial perspective, we will support the launch of Biktarvy and continue to promote the use of our existing TAF-containing regimens. In addition, we believe Truvada for pre-exposure prophylaxis (PrEP) will continue to be an integral part of our growth in HIV in the United States as communities embrace the public health benefits of prevention. In HCV, we expect a decline in product sales in all major markets as a result of increased competition. HCV revenues are driven by four variables: patient starts, net pricing, market share and treatment duration. Treatment duration has stabilized as a variable and pricing of all regimens has gravitated towards the 8-week regimen price. We anticipate both pricing and market share to stabilize by mid-2018 with more predictable, but slightly declining, patient starts moving forward. In cell therapy, we will continue to promote the use of Yescarta in the United States and prepare for anticipated approval in Europe.
We will continue to help ensure patient access to our products around the world, including through our Gilead Access Program, under which more than 10 million people receive our HIV medicines in low- and middle-income countries.
Our progress on all of these initiatives is subject to a number of uncertainties, including, but not limited to, the continuation of an uncertain global macroeconomic environment; additional pricing pressures from payers and competitors; slower than anticipated growth in our HIV products; an increase in discounts, chargebacks and rebates due to ongoing contracts and future negotiations with commercial and government payers; market share and price erosion caused by the introduction of generic versions of Truvada outside the United States and Viread and Letairis in the United States; inaccuracies in our HCV patient start estimates; potential amendments to the Affordable Care Act or other government action that could have the effect of lowering prices; a larger than anticipated shift in payer mix to more highly discounted payer segment; and volatility in foreign currency exchange rates.
2017
Results of Operations
Total Revenues
The following table summarizes the period over period changes in our product sales and royalty, contract and other revenues:
|
(In millions, except percentages)
|
2017
|
Change
|
2016
|
Change
|
2015
|
|||||||||||||
|
Revenues:
|
||||||||||||||||||
|
Product sales
|
$
|
25,662
|
|
(14
|
)%
|
$
|
29,953
|
|
(7
|
)%
|
$
|
32,151
|
|
|||||
|
Royalty, contract and other revenues
|
445
|
|
2
|
%
|
437
|
|
(10
|
)%
|
488
|
|
||||||||
|
Total revenues
|
$
|
26,107
|
|
(14
|
)%
|
$
|
30,390
|
|
(7
|
)%
|
$
|
32,639
|
|
|||||
Product Sales
2017
Compared to
2016
Total product sales were
$25.7 billion
in
2017
, compared to
$30.0 billion
in
2016
, primarily due to a decrease in antiviral product sales.
Antiviral product sales, which include sales of our HIV, HBV and HCV products, were
$23.3 billion
in
2017
, compared to
$27.7 billion
in
2016
. HIV and HBV product sales were
$14.2 billion
in
2017
, compared to
$12.9 billion
in
2016
. The increase was primarily driven by the continued uptake of our TAF-based products, partially offset by decreases in sales of tenofovir disoproxil (TDF)-based products. HCV product sales, which consist of Harvoni, Epclusa, Sovaldi and Vosevi, were
$9.1 billion
in
2017
, compared to
$14.8 billion
in
2016
. The declines of our HCV product sales across all major markets were a result of increased competition and lower total market patient starts.
Other product sales, which include sales of Letairis, Ranexa and AmBisome, were
$2.3 billion
in
2017
, an increase of
5%
compared to
$2.2 billion
in
2016
. Letairis is expected to face generic competition in the United States starting in July 2018.
Of our product sales in
2017
,
29%
were generated outside the United States. We faced exposure to movements in foreign currency exchange rates, primarily in the Euro. We used foreign currency exchange contracts to hedge a percentage of our foreign currency exposure. Foreign currency exchange, net of hedges, had
an unfavorable
impact of
$117 million
on our
2017
product sales compared to
2016
.
44
We record product sales net of estimated mandatory and supplemental discounts to government payers, in addition to discounts to private payers, including rebates, chargebacks, cash discounts for prompt payment, distributor fees and other related costs. These deductions are generally referred to as gross-to-net deductions and totaled
$17.2 billion
or
40%
of gross product sales in
2017
, compared to
$20.3 billion
or
40%
in
2016
. Of the
$17.2 billion
in
2017
,
$15.5 billion
or
36%
of gross product sales was related to government and other rebates and chargebacks, and
$1.7 billion
was related to cash discounts for prompt payment, distributor fees and other related costs.
Product sales in the United States decreased by
6%
to
$18.1 billion
in
2017
, compared to
$19.3 billion
in
2016
. Declines in sales of our HCV products were partially offset by increases in sales of our HIV and HBV products. The declines in sales of our HCV products were primarily due to lower Harvoni and Sovaldi sales volume as a result of increased competition and lower total market patient starts. Additionally, increases in Epclusa and Vosevi sales volume were partially offset by lower average net selling price for Epclusa as pricing of all regimens has gravitated towards the 8-week regimen price. The increases in the sales of our HIV and HBV products were primarily driven by higher sales volume of our TAF-based products and higher average net selling prices, partially offset by decreases in our TDF-based products and the prior year impact of a favorable revision to our rebate reserves of $332 million, primarily related to our TDF-based products.
Product sales in Europe decreased by
18%
to
$5.0 billion
in
2017
, compared to
$6.1 billion
in
2016
, primarily due to lower Harvoni and Sovaldi sales volume, partially offset by higher Epclusa sales volume. Foreign currency exchange, net of hedges, had
an unfavorable
impact of
$89 million
on our product sales in
2017
compared to
2016
.
Product sales in other international locations decreased by
45%
to $2.6 billion in
2017
, compared to
$4.6 billion
in
2016
, primarily due to lower sales in Japan. Sales of our HCV products in Japan were $692 million for
2017
, compared to $2.5 billion for the same period in 2016, primarily due to lower sales volume as a result of lower total market patient starts and increased competition.
2016
Compared to
2015
Total product sales were $30.0 billion in 2016, compared to $32.2 billion in 2015, primarily due to a decrease in antiviral product sales.
Antiviral product sales were $27.7 billion in 2016, compared to $30.2 billion in 2015. HIV and HBV product sales were $12.9 billion in 2016, compared to $11.1 billion in 2015. The increase was primarily driven by the continued uptake of our TAF-based products, partially offset by decreases in sales of TDF-based products. HCV product sales were $14.8 billion in 2016, compared to $19.1 billion in 2015. The declines were due to lower sales of Harvoni and Sovaldi, partially offset by sales of Epclusa, which was launched in 2016 across various locations.
Other product sales, which include sales of Letairis, Ranexa and AmBisome, were $2.2 billion in 2016, an increase of 14% compared to $1.9 billion in 2015.
Of our product sales in 2016, 36% were generated outside the United States. Foreign currency exchange, net of hedges, had an unfavorable impact of $498 million on our 2016 product sales compared to 2015.
Our gross-to-net deductions totaled $20.3 billion or 40% of gross product sales in 2016, compared to $18.1 billion or 36% in 2015. Of the $20.3 billion in 2016, $19.1 billion or 38% of gross product sales was related to government and other rebates and chargebacks, and $1.2 billion was related to cash discounts for prompt payment, distributor fees and other related costs. The increase in our 2016 gross-to-net deductions was primarily due to an increase in discounts and a higher percentage of sales to more deeply discounted segments for our HCV products in the United States.
Product sales in the United States decreased by 9% to $19.3 billion in 2016, compared to $21.2 billion in 2015. Declines in sales of our HCV products were partially offset by increases in sales of our HIV and HBV products. The increases in the sales of our HIV and HBV products were primarily driven by sales of our newly launched TAF-based products and a favorable revision to our rebate reserves of $332 million, primarily related to our TDF-based products.
Product sales in Europe decreased by 15% to $6.1 billion in 2016, compared to $7.2 billion in 2015, primarily due to lower Harvoni and Sovaldi sales volume. Foreign currency exchange, net of hedges, had an unfavorable impact of $503 million on our product sales in 2016 compared to 2015.
Product sales in other international locations increased by 20% to $4.6 billion in 2016, compared to $3.8 billion in 2015, primarily due to sales in Japan. Sales of our HCV products in Japan were $2.5 billion for 2016, compared to $1.9 billion in 2015. The increase was primarily driven by higher sales volume of Harvoni, which was launched in September 2015, partially offset by a mandatory price reduction of 32% for Sovaldi and Harvoni that was effective April 1, 2016.
45
The following table summarizes the period over period changes in our product sales:
|
(In millions, except percentages)
|
2017
|
Change
|
2016
|
Change
|
2015
|
|||||||||||||
|
Antiviral products:
|
|
|
|
|
|
|||||||||||||
|
HCV products
|
||||||||||||||||||
|
Harvoni
|
$
|
4,370
|
|
(52
|
)%
|
$
|
9,081
|
|
(34
|
)%
|
$
|
13,864
|
|
|||||
|
Epclusa
|
3,510
|
|
100
|
%
|
1,752
|
|
*
|
|
—
|
|
||||||||
|
Sovaldi
|
964
|
|
(76
|
)%
|
4,001
|
|
(24
|
)%
|
5,276
|
|
||||||||
|
Vosevi
|
293
|
|
*
|
|
—
|
|
*
|
|
—
|
|
||||||||
|
HIV and HBV products
|
|
|
||||||||||||||||
|
Genvoya
|
3,674
|
|
148
|
%
|
1,484
|
|
*
|
|
45
|
|
||||||||
|
Truvada
|
3,134
|
|
(12
|
)%
|
3,566
|
|
3
|
%
|
3,459
|
|
||||||||
|
Atripla
|
1,806
|
|
(31
|
)%
|
2,605
|
|
(17
|
)%
|
3,134
|
|
||||||||
|
Descovy
|
1,218
|
|
*
|
|
298
|
|
*
|
|
—
|
|
||||||||
|
Odefsey
|
1,106
|
|
*
|
|
329
|
|
*
|
|
—
|
|
||||||||
|
Stribild
|
1,053
|
|
(45
|
)%
|
1,914
|
|
5
|
%
|
1,825
|
|
||||||||
|
Viread
|
1,046
|
|
(12
|
)%
|
1,186
|
|
7
|
%
|
1,108
|
|
||||||||
|
Complera/Eviplera
|
966
|
|
(34
|
)%
|
1,457
|
|
2
|
%
|
1,427
|
|
||||||||
|
Other
|
196
|
|
*
|
|
72
|
|
4
|
%
|
69
|
|
||||||||
|
Total antiviral products
|
23,336
|
|
(16
|
)%
|
27,745
|
|
(8
|
)%
|
30,207
|
|
||||||||
|
Other products:
|
|
|
||||||||||||||||
|
Letairis
|
887
|
|
8
|
%
|
819
|
|
17
|
%
|
700
|
|
||||||||
|
Ranexa
|
717
|
|
6
|
%
|
677
|
|
15
|
%
|
588
|
|
||||||||
|
AmBisome
|
366
|
|
3
|
%
|
356
|
|
2
|
%
|
350
|
|
||||||||
|
Zydelig
|
149
|
|
(11
|
)%
|
168
|
|
27
|
%
|
132
|
|
||||||||
|
Other
|
207
|
|
10
|
%
|
188
|
|
8
|
%
|
174
|
|
||||||||
|
Total product sales
|
$
|
25,662
|
|
(14
|
)%
|
$
|
29,953
|
|
(7
|
)%
|
$
|
32,151
|
|
|||||
* Percentage not meaningful
The following is additional discussion of our results by product:
|
•
|
Harvoni
|
Harvoni sales accounted for
19%
,
33%
and
46%
of our total antiviral product sales for
2017
,
2016
and
2015
, respectively. In
2017
, product sales were
$3.1 billion
in the United States,
$704 million
in Europe and
$613 million
in other international locations. In
2016
, product sales were
$4.9 billion
in the United States,
$1.8 billion
in Europe and
$2.3 billion
in other international locations. In
2015
, product sales were $10.1 billion in the United States, $2.2 billion in Europe and $1.6 billion in other international locations.
The decreases in 2017 compared to 2016 in all major markets were primarily due to lower sales volume.
In the United States, the decrease in 2016 compared to 2015 was primarily due to lower sales volume and a lower average net selling price, which was partially offset by a favorable revision to our sales return reserve of $181 million recorded during the second quarter of 2016. The number of patients that started treatment with Harvoni in the United States peaked in the first half of 2015, as many warehoused patients initiated treatment after the product launch. In Europe, the decrease in 2016 compared to 2015 was primarily due to lower sales volume and unfavorable foreign currency exchange, net of hedges. In other international locations, the increase in 2016 compared to 2015 was primarily due to higher sales in Japan. Sales in Japan were $1.8 billion in 2016 compared to $1.0 billion in 2015, driven by higher sales volume, partially offset by a mandatory price reduction of 32% that was effective April 1, 2016.
|
•
|
Epclusa
|
Epclusa was approved by FDA and the European Commission in June and July 2016, respectively.
Epclusa sales accounted for
15%
and
6%
of our total antiviral product sales for
2017
and
2016
, respectively. In
2017
, product sales were
$2.4 billion
in the United States,
$869 million
in Europe and $237 million in other international
46
locations. In 2016, product sales were
$1.6 billion
in the United States,
$141 million
in Europe and $20 million in other international locations.
The increases in
2017
compared to
2016
in all major markets were primarily due to higher sales volume, partially offset by a decrease in average net selling price.
|
•
|
Sovaldi
|
Sovaldi sales accounted for
4%
,
14%
and
17%
of our total antiviral product sales for
2017
,
2016
and
2015
, respectively. In
2017
, product sales were
$130 million
in the United States,
$258 million
in Europe and
$576 million
in other international locations. In
2016
, product sales were
$1.9 billion
in the United States,
$891 million
in Europe and
$1.2 billion
in other international locations. In
2015
, product sales were $2.4 billion in the United States, $1.6 billion in Europe and $1.3 billion in other international locations.
The decreases in
2017
compared to
2016
in all major markets were primarily due to lower sales volume driven by a shift in the market from Sovaldi to Epclusa.
In the United States, the decrease in 2016 compared to 2015 was primarily due to lower sales volume, partially offset by a favorable revision to our sales return reserve of $98 million recorded during the second quarter of 2016. In Europe, the decrease in 2016 compared to 2015 was primarily due to lower sales volume. In other international locations, the slight decrease was primarily due to lower sales in Japan. Sales in Japan were $635 million in 2016 compared to $878 million in 2015 due to a mandatory price reduction of 32% that was effective April 1, 2016 and lower sales volume.
|
•
|
TAF-based regimens - Genvoya, Descovy and Odefsey
|
Genvoya was approved by FDA and the European Commission in November 2015. Descovy was approved by FDA and the European Commission in April 2016. Odefsey was approved by FDA and the European Commission in March and June 2016, respectively.
Product sales of these TAF-based regimens were
$6.0 billion
,
$2.1 billion
and
$45 million
in 2017, 2016 and 2015, respectively, and accounted for
26%
and
8%
of our total antiviral product sales for
2017
and
2016
, respectively. In
2017
, product sales were
$5.0 billion
in the United States,
$892 million
in Europe and
$151 million
in other international locations. In
2016
, product sales were
$1.8 billion
in the United States,
$256 million
in Europe and
$26 million
in other international locations.
The increases in
2017
compared to
2016
in all major markets were primarily driven by higher sales volume as patients shifted away from TDF-based regimens. In Europe, product sales of our TAF-based regimens continue to grow despite the availability of generic Viread and Truvada in several countries.
|
•
|
TDF-based regimens - Stribild, Complera/Eviplera, Atripla, Truvada and Viread
|
Product sales of these TDF-based regimens were
$8.0 billion
,
$10.7 billion
and
$11.0 billion
in 2017, 2016 and 2015, respectively, and accounted for
34%
,
39%
and
36%
of our total antiviral product sales for
2017
,
2016
and
2015
, respectively. In
2017
, product sales were
$5.3 billion
in the United States,
$1.9 billion
in Europe and
$805 million
in other international locations. In
2016
, product sales were
$7.2 billion
in the United States,
$2.6 billion
in Europe and
$882 million
in other international locations. In
2015
, product sales were $7.1 billion in the United States, $3.0 billion in Europe and $881 million in other international locations.
In the United States, the decreases in
2017
compared to
2016
were primarily due to lower sales volume as a result of the continued uptake of our TAF-based regimens, partially offset by the increased usage of Truvada for PrEP. In Europe, the decreases in
2017
compared to
2016
were primarily due to lower sales volume
as a result of the availability of generic Viread and Truvada in several countries and the continued uptake of our TAF-based regimens.
In the United States, the increases in
2016
compared to
2015
were primarily due to a favorable revision to our rebate reserves of $312 million relating to Stribild and Complera in the third quarter of 2016. In Europe, the decreases in
2016
compared to
2015
were primarily due to lower sales volume as a result of the continued uptake of our TAF-based regimens.
Royalty, Contract and Other Revenues
The following table summarizes the period over period changes in our royalty, contract and other revenues:
|
(In millions, except percentages)
|
2017
|
Change
|
2016
|
Change
|
2015
|
|||||||||||||
|
Royalty, contract and other revenues
|
$
|
445
|
|
2
|
%
|
$
|
437
|
|
(10
|
)%
|
$
|
488
|
|
|||||
47
Royalty, contract and other revenues in 2017 were up slightly compared to the same period in
2016
, and decreased by
10%
in
2016
, compared to
$488 million
in
2015
. The decrease in 2016 compared to 2015 was primarily due to royalty revenues from F. Hoffman-La Roche Ltd for sales of Tamiflu.
Cost of Goods Sold and Product Gross Margin
The following table summarizes the period over period changes in our product sales, cost of goods sold and product gross margin:
|
(In millions, except percentages)
|
2017
|
Change
|
2016
|
Change
|
2015
|
|||||||||||||
|
Total product sales
|
$
|
25,662
|
|
(14
|
)%
|
$
|
29,953
|
|
(7
|
)%
|
$
|
32,151
|
|
|||||
|
Cost of goods sold
|
$
|
4,371
|
|
3
|
%
|
$
|
4,261
|
|
6
|
%
|
$
|
4,006
|
|
|||||
|
Product gross margin
|
83
|
%
|
86
|
%
|
88
|
%
|
||||||||||||
The decreases in our product gross margin in
2017
compared to 2016 and in
2016
compared to 2015 were primarily due to changes in product mix, as our HCV product sales decreased as a percentage of total product sales.
Research and Development Expenses
The following table summarizes the period over period changes in R&D expenses:
|
(In millions, except percentages)
|
2017
|
Change
|
2016
|
Change
|
2015
|
|||||||||||||
|
R&D expenses
|
$
|
3,734
|
|
(27
|
)%
|
$
|
5,098
|
|
69
|
%
|
$
|
3,014
|
|
|||||
R&D expenses summarized above consisted primarily of clinical studies performed by contract research organizations, materials and supplies, licenses and fees, up-front payments under collaboration agreements, milestone payments, personnel costs, including salaries, benefits and stock-based compensation and overhead allocations consisting of various support and facilities-related costs.
We do not track total R&D expenses by product candidate, therapeutic area or development phase. However, we manage our R&D expenses by identifying the R&D activities we anticipate will be performed during a given period and then prioritizing efforts based on scientific data, probability of successful development, market potential, available human and capital resources and other considerations. We continually review our R&D pipeline and the status of development and, as necessary, reallocate resources among the R&D portfolio that we believe will best support the future growth of our business.
The following table provides a breakout of R&D expenses by major cost type:
|
(In millions, except percentages)
|
2017
|
2016
|
2015
|
|||||||||
|
Clinical studies and outside services
|
$
|
1,881
|
|
$
|
2,446
|
|
$
|
1,568
|
|
|||
|
Personnel and infrastructure expenses
|
1,271
|
|
1,122
|
|
1,041
|
|
||||||
|
Facilities, IT and other costs
|
360
|
|
325
|
|
339
|
|
||||||
|
IPR&D impairment charges
|
—
|
|
432
|
|
—
|
|
||||||
|
Acquired IPR&D
|
222
|
|
400
|
|
66
|
|
||||||
|
Up-front collaboration expenses
|
—
|
|
373
|
|
—
|
|
||||||
|
Total
|
$
|
3,734
|
|
$
|
5,098
|
|
$
|
3,014
|
|
|||
In
2017
, R&D expenses
decreased
$1.4 billion
or
27%
, compared to
2016
, primarily due to the 2016 impacts of business development activities resulting in up-front collaboration expense related to our license and collaboration agreement with Galapagos and acquired IPR&D expense related to our purchase of Nimbus, IPR&D impairment charges and ongoing milestone payments, partially offset by acquired IPR&D expense related to our purchase of Cell Design Labs in 2017.
In 2016, R&D expenses increased $2.1 billion or 69%, compared to 2015, primarily due to the overall progression of clinical studies, including ongoing milestone payments, our purchase of an FDA priority review voucher, up-front collaboration expenses related to our license and collaboration agreement with Galapagos and acquired IPR&D expense related to our purchase of Nimbus. IPR&D impairment charges were a result of termination of clinical development for momelotinib and simtuzumab.
48
Selling, General and Administrative Expenses
The following table summarizes the period over period changes in SG&A expenses:
|
(In millions, except percentages)
|
2017
|
Change
|
2016
|
Change
|
2015
|
|||||||||||||
|
SG&A expenses
|
$
|
3,878
|
|
14
|
%
|
$
|
3,398
|
|
(1
|
)%
|
$
|
3,426
|
|
|||||
SG&A expenses relate to sales and marketing, finance, human resources, legal and other administrative activities. Expenses consist primarily of personnel costs, facilities and overhead costs, outside marketing, advertising and legal expenses, and other general and administrative costs. SG&A expenses also include the BPD fee. In the United States, we, along with other pharmaceutical manufacturers of branded drug products, are required to pay a portion of the BPD fee, which is estimated based on select government sales during each calendar year as a percentage of total industry government sales and is trued-up upon receipt of invoices from the Internal Revenue Service (IRS).
In
2017
, SG&A expenses
increased
$480 million
or
14%
compared to
2016
, primarily
due to costs associated with our acquisition of Kite, which primarily consist of stock-based compensation and transaction costs, as well as higher BPD fee expenses resulting from a favorable adjustment of $191 million in the first quarter of 2016.
In
2016
, SG&A expenses were flat compared to
2015
. Declines in our BPD fee expenses were offset by higher costs to support new product launches and our geographic expansion. The
2016
BPD fee expenses were favorably impacted by a credit of $191 million based on our receipt of the IRS invoice.
Our BPD fee expenses were $385 million in
2017
, $270 million in
2016
and $414 million in
2015
. The BPD fee expenses are not tax deductible.
Interest Expense
In
2017
, interest expense
increased
to
$1.1 billion
, compared to
$964 million
in
2016
, primarily due to the issuance of
$5.0 billion
aggregate principal amount of senior unsecured notes in September 2016 (the 2016 Notes). In
2016
, interest expense
increased
to
$964 million
, compared to
$688 million
in
2015
, primarily due to the issuance of the 2016 Notes and $10.0 billion aggregate principal amount of senior unsecured notes issued in September 2015.
Other Income (Expense), Net
Other income (expense), net, was
$523 million
,
$428 million
and
$154 million
in
2017
,
2016
and
2015
, respectively. The increases were primarily due to our cash, cash equivalents and marketable securities earning a higher yield and higher cash balances.
Provision for Income Taxes
Our provision for income taxes was $8.9 billion in 2017 compared to $3.6 billion in 2016. The 2017 effective tax rate increased to 65.7% from the 2016 effective tax rate of 21.1%, primarily due to the enactment of Tax Reform in December 2017. Changes to the geographic mix of earnings also contributed to the increase in the 2017 effective tax rate.
On December 22, 2017, Tax Reform was signed into law in the United States making significant changes to the Internal Revenue Code of 1986, as amended. Changes include, but are not limited to, a corporate tax rate decrease from 35% to 21% effective for tax years beginning after December 31, 2017, implementation of a modified territorial tax system and a repatriation tax on deemed repatriated earnings of foreign subsidiaries. We calculated a provisional estimate of the impact from Tax Reform in our 2017 income tax provision in accordance with our interpretation of Tax Reform and guidance available as of the date of this filing. As a result, we recorded an estimated $5.5 billion net charge to income tax expense in the fourth quarter of 2017, the period in which Tax Reform was enacted. This amount includes: i) a provisional $308 million deferred tax benefit related to the re-measurement of certain deferred tax assets and liabilities, based on the revised rates at which they are expected to reverse in the future, and ii) a provisional $5.8 billion charge related to the transition tax on the mandatory deemed repatriation of accumulated foreign earnings determined as of December 31, 2017. The provisional transition tax charge includes federal (net of certain offsetting adjustments related to unrecognized tax benefits), state and local, and foreign withholding tax on the accumulated foreign earnings, which are no longer considered indefinitely reinvested as of December 31, 2017.
The accrued federal liability for the transition tax of $6.1 billion will be payable over an eight year period. As of December 31, 2017, $487 million of the transition tax was recorded within Other accrued liabilities and $5.6 billion was recorded in Long-term income taxes payable on our Consolidated Balance Sheets.
In accordance with the U.S. Securities and Exchange Commission (SEC) Staff Accounting Bulletin No. 118 (SAB 118), we have determined that the $308 million of the deferred tax benefit recorded in connection with the re-measurement of certain deferred tax assets and liabilities and the $5.8 billion of current tax expense recorded in connection with the transition tax on the mandatory deemed repatriation of foreign earnings are provisional and subject to further adjustment during the measurement period (not to exceed one year from the enactment of Tax Reform). Given the complexity of Tax Reform, we may be refining our
49
estimates of these provisional amounts as further guidance is issued from the U.S. Treasury, the SEC and the Financial Accounting Standards Board (FASB).
Additionally, we are continuing to evaluate the accounting policy election required with regard to the tax on Global Intangible Low-Taxed Income (the Global Minimum Tax). The FASB allows companies to adopt a policy election to account for the Global Minimum Tax under one of two methods: (i) account for the Global Minimum Tax as a component of tax expense in the period in which a company is subject to the rules (the period cost method), or (ii) account for the Global Minimum Tax in a company’s measurement of deferred taxes (the deferred method). We have not elected a method and will only do so after our completion of the analysis of the Global Minimum Tax provisions. Our election method will depend, in part, on analyzing expected future U.S. taxable income inclusions related to Global Minimum Tax under both methodologies in order to determine the most appropriate method. Should we decide to elect the deferred method of accounting for the Global Minimum Tax, it is possible that our provisional estimate for re-measuring our deferred taxes may materially change. We will finalize the analysis for the accounting policy election during the measurement period.
Our provision for income taxes was $3.6 billion in both 2016 and 2015. The effective tax rate increased to 21.1% in 2016 from 16.4% in 2015 primarily due to changes in the geographic mix of earnings.
Liquidity and Capital Resources
We believe that our existing capital resources, supplemented by our cash flows generated from operating activities will be adequate to satisfy our capital needs for the foreseeable future. The following table summarizes our cash, cash equivalents, and marketable securities and working capital (in millions):
|
December 31,
|
|||||||||||||
|
2017
|
2016
|
2015
|
|||||||||||
|
Cash, cash equivalents and marketable securities
|
$
|
36,694
|
|
$
|
32,380
|
|
$
|
26,208
|
|
||||
|
Working capital
|
$
|
20,188
|
|
$
|
10,370
|
|
$
|
14,044
|
|
||||
Cash, Cash Equivalents and Marketable Securities
Cash, cash equivalents and marketable securities totaled
$36.7 billion
at
December 31, 2017
, an increase of
$4.3 billion
or
13%
when compared to
$32.4 billion
at
December 31, 2016
. During 2017, we generated
$11.9 billion
in operating cash flow and in connection with our acquisition of Kite, we issued $3.0 billion aggregate principal amount of senior unsecured notes and entered into and drew on a $6.0 billion aggregate principal amount term loan facility credit agreement, of which $1.5 billion was repaid in December 2017. Additionally, we paid cash dividends of
$2.7 billion
and utilized
$954 million
on stock repurchases. See Note 5, Acquisitions of the Notes to Consolidated Financial Statements included in Item 8 of this Annual Report on Form 10-K for additional details on our acquisition of Kite.
Cash, cash equivalents and marketable securities totaled $32.4 billion at December 31, 2016, an increase of $6.2 billion or 24% when compared to $26.2 billion at December 31, 2015. During 2016, we generated
$17.0 billion
in operating cash flow, received $4.9 billion in net proceeds from the 2016 Notes, utilized $11.0 billion to repurchase stock, repaid $985 million principal balance of our senior notes and convertible senior notes and paid cash dividends of $2.5 billion.
Of the total cash, cash equivalents and marketable securities at
December 31, 2017
, approximately
$31.5 billion
was generated from operations in foreign jurisdictions. In February 2018, we repatriated $28.0 billion of cash, cash equivalents and marketable securities
to our parent company headquartered in the United States.
Prior to the enactment of Tax Reform, these earnings were considered indefinitely reinvested and no U.S. taxes had been provided. In 2017, U.S. taxes have been provided on these earnings through the accrual of the Tax Reform transition tax. See Note 17, Income Taxes of the Notes to Consolidated Financial Statements included in Item 8 of this Annual Report on Form 10-K for additional details on Tax Reform.
Working Capital
Working capital was
$20.2 billion
at
December 31, 2017
. The
increase
of
$9.8 billion
from working capital at
December 31, 2016
was primarily driven by an increase in cash, cash equivalents and short-term marketable securities resulting from a shift in the duration of our marketable securities portfolio to reduce interest rate risk, partially offset by $2.7 billion increase in current portion of long-term debt based on contractual maturity.
Working capital was
$10.4 billion
at
December 31, 2016
. The
decrease
of
$3.7 billion
from working capital at
December 31, 2015
was primarily due to a decline in cash and cash equivalents, as a result of an increase in our long-term marketable securities.
50
Cash Flows
The following table summarizes our cash flow activities (in millions):
|
2017
|
2016
|
2015
|
|||||||||||
|
Cash provided by (used in):
|
|
|
|
|
|
|
|||||||
|
Operating activities
|
$
|
11,898
|
|
$
|
17,047
|
|
$
|
21,250
|
|
||||
|
Investing activities
|
$
|
(16,069
|
)
|
$
|
(11,985
|
)
|
$
|
(12,475
|
)
|
||||
|
Financing activities
|
$
|
3,393
|
|
$
|
(9,725
|
)
|
$
|
(5,884
|
)
|
||||
Cash Provided by Operating Activities
Cash provided by operating activities represents the cash receipts and disbursements related to all of our activities other than investing and financing activities. Operating cash flow is derived by adjusting our net income for non-cash items and changes in operating assets and liabilities. Cash
provided by
operating activities
decreased
by
$5.1 billion
to
$11.9 billion
in
2017
when compared to
2016
, primarily due to lower cash receipts as a result of lower product sales and higher tax payments.
Cash provided by operating activities decreased by $4.2 billion to
$17.0 billion
in 2016 when compared to 2015, primarily due to lower cash receipts as a result of lower product sales and higher cash payments related to accrued government and other rebates and chargebacks.
Cash Used in Investing Activities
Cash used in investing activities primarily consists of acquisitions (net of cash acquired), net purchases of marketable securities and other investments and our capital expenditures. Cash
used in
investing activities increased by
$4.1 billion
to
$16.1 billion
in
2017
when compared to
2016
, primarily due to our acquisition of Kite, partially offset by lower net purchases of marketable securities.
Cash used in investing activities decreased by $490 million to $12.0 billion in 2016 when compared to 2015, primarily due to lower net purchases of marketable securities, partially offset by other investments related to our license and collaboration agreement with Galapagos.
Cash Provided by (Used in) Financing Activities
Cash
provided by
financing activities was
$3.4 billion
in
2017
, compared to cash used in financing activities of
$9.7 billion
in
2016
, primarily due to lower repurchases of our common stock and higher proceeds from the issuances of debt to partially fund our acquisition of Kite.
Cash used in financing activities increased by $3.8 billion to
$9.7 billion
in 2016 when compared to 2015, primarily due to higher repurchases of our common stock, higher net payments on debt, higher payments of cash dividends and lower proceeds from the issuances of debt. These increases were partially offset by lower payments to settle warrants related to our convertible senior notes that were due in May 2016.
Debt and Credit Facilities
Long-Term Obligations
The summary of our borrowings under various financing arrangements is included in Note
11
, Debt and Credit Facilities of the Notes to Consolidated Financial Statements included in Item 8 of this Annual Report on Form 10-K.
Senior Unsecured Notes
In 2017, in connection with our acquisition of Kite, we issued $3.0 billion aggregate principal amount of senior unsecured notes consisting of $750 million principal amount of floating rate notes due September 2018, $750 million principal amount of floating rate notes due March 2019, and $500 million principal amount of floating rate notes due September 2019 (collectively, the Floating Rate Notes) and $1.0 billion principal amount of 1.85% senior notes due September 2019 (the Fixed Rate Notes and, collectively with the Floating Rate Notes, the 2017 Notes). The Floating Rate Notes bear interest rates equal to three month London Interbank Offered Rates (LIBOR), plus 0.17% with respect to the Floating Rate Notes due September 2018, 0.22% with respect to the Floating Rate Notes due March 2019 and 0.25% with respect to the Floating Rate Notes due September 2019. The Fixed Rate Notes will pay interest semiannually and the Floating Rate Notes will pay interest quarterly.
In September 2016, we issued the 2016 Notes in the aggregate principal amount of $5.0 billion and in December 2016, repaid $700 million of principal balance related to our senior unsecured notes.
51
We are required to comply with certain covenants under our notes indentures and as of
December 31, 2017
, we were not in violation of any covenants.
Term Loan Facilities
In September 2017, we entered into a
$6.0 billion
aggregate principal amount term loan facility credit agreement consisting of a
$1.0 billion
principal amount 364-day senior unsecured term loan facility, a
$2.5 billion
principal amount three-year senior unsecured term loan facility and a
$2.5 billion
principal amount five-year senior unsecured term loan facility (collectively, the Term Loan Facilities). In October 2017, we drew
$6.0 billion
aggregate principal amount on the Term Loan Facilities and used the proceeds to finance our acquisition of Kite.
The Term Loan Facilities bear interest at floating rates based on LIBOR plus an applicable margin which will vary based on our debt ratings from Fitch Ratings, Inc., Moody’s Investors Service, Inc. and S&P Global Ratings. The 364-day senior unsecured term loan facility and three-year senior unsecured term loan facility will be due and payable at maturity. The five-year senior unsecured term loan facility will be payable in quarterly amounts equal to 2.5% of the initial principal amount of the five-year senior unsecured term loan facility on each fiscal quarter end date after the second anniversary of the closing date, with any remaining balance due and payable at maturity. We may prepay loans under the Term Loan Facilities in whole or in part at any time without premium or penalty. Amounts repaid under the Term Loan Facilities cannot be reborrowed. The Term Loan Facilities contain customary representations, warranties, affirmative, negative and financial maintenance covenants and events of default. As of
December 31, 2017
, we were not in violation of any covenants.
In 2017, we repaid
$1.5 billion
of principal balance related to the three-year senior unsecured term loan facility and
$311 million
of our term loan facility issued in May 2016.
Credit Facilities
In 2016, we terminated our five-year $1.3 billion revolving credit facility and entered into a $2.5 billion five-year revolving credit facility maturing in May 2021 (the Five-Year Revolving Credit Agreement). The revolving credit facility can be used for working capital requirements and for general corporate purposes, including, without limitation, acquisitions. We are required to comply with certain covenants under the Five-Year Revolving Credit Agreement and as of
December 31, 2017
, we were not in violation of any covenants, and no amounts were outstanding under the Five-Year Revolving Credit Agreement.
Capital Return Program
Stock Repurchase Programs
In the first quarter of 2016, our Board of Directors authorized a
$12.0 billion
stock repurchase program (2016 Program), under which repurchases may be made in the open market or in privately negotiated transactions. The 2016 Program commenced after the
$15.0 billion
stock repurchase program authorized by our Board of Directors in January 2015 was completed in the second quarter of 2016. The
$5.0 billion
stock repurchase program authorized by our Board of Directors in May 2014 was completed in the first quarter of 2015. As of
December 31, 2017
, the remaining authorized repurchase amount under the 2016 Program was
$8.0 billion
.
The following table summarizes our stock repurchases under the above-described programs (in millions):
|
Year ended December 31,
|
|||||||||||||
|
2017
(1)
|
2016
(2)
|
2015
(3)
|
|||||||||||
|
Shares repurchased and retired
|
13
|
|
123
|
|
95
|
|
|||||||
|
Amount
|
$
|
954
|
|
$
|
11,001
|
|
$
|
10,002
|
|
||||
|
_______________________
|
|||||||||||||
|
Notes:
|
|||||||||||||
|
(1)
|
All repurchases were under the 2016 Program.
|
||||||||||||
|
(2)
|
Includes 36 million shares repurchased for $3.0 billion under the 2016 Program and 87 million shares repurchased for $8.0 billion under the 2015 Program.
|
||||||||||||
|
(3)
|
Includes 65 million shares repurchased for $7.0 billion under the 2015 Program and 30 million shares repurchased for $3.0 billion under the 2014 Program.
|
||||||||||||
Dividends
On February 6, 2018, we announced that our Board of Directors declared a quarterly cash dividend of $0.57 per share of our common stock, with a payment date of March 29, 2018 to all stockholders of record as of the close of business on March 16, 2018. Future dividends are subject to declaration by the Board of Directors.
During
2017
, we declared and paid quarterly cash dividends for an aggregate amount of
$2.7 billion
or
$2.08
per common share. During
2016
, we declared and paid quarterly cash dividends for an aggregate amount of $2.5 billion or $1.84 per common
52
share. See Note
13
, Stockholders’ Equity of the Notes to Consolidated Financial Statements included in Item 8 of this Annual Report on Form 10-K for additional information.
Capital Resources
We believe our existing capital resources, supplemented by cash flows generated from our operations, will be adequate to satisfy our capital needs for the foreseeable future. Our future capital requirements will depend on many factors, including but not limited to the following:
|
•
|
the commercial performance of our current and future products;
|
|
•
|
the progress and scope of our R&D efforts, including preclinical studies and clinical trials;
|
|
•
|
the cost, timing and outcome of regulatory reviews;
|
|
•
|
the expansion of our sales and marketing capabilities;
|
|
•
|
the possibility of acquiring additional manufacturing capabilities or office facilities;
|
|
•
|
the possibility of acquiring other companies or new products;
|
|
•
|
debt service requirements;
|
|
•
|
the establishment of additional collaborative relationships with other companies; and
|
|
•
|
costs associated with the defense, settlement and adverse results of government investigations and litigation, including matters related to sofosbuvir.
|
We may in the future require additional funding, which could be in the form of proceeds from equity or debt financings. If such funding is required, we cannot guarantee that it will be available to us on favorable terms, if at all.
Other
In 2004, we entered into a collaboration arrangement with Bristol-Myers Squibb Company (BMS) to develop and commercialize a single tablet regimen containing our Truvada and BMS’s Sustiva (efavirenz) in the United States and Canada. This combination was approved for use in the United States in 2006 and is sold under the brand name Atripla. We and BMS structured this collaboration as a joint venture that operated as a limited liability company, which we consolidated. We and BMS granted royalty-free sublicenses to the joint venture for the use of our respective company owned technologies and, in return, were granted certain licenses by the joint venture to use the intellectual property resulting from the collaboration. The economic interests of the joint venture held by us and BMS (including the sharing of revenues and out-of-pocket expenses) were based on the portion of the net selling price of Atripla attributable to Truvada and efavirenz. Since the net selling price for Truvada changed over time relative to the net selling price of efavirenz, both our and BMS’s respective economic interests in the joint venture varied annually over the course of the collaboration.
Under the agreement, either party could terminate the other party’s participation in the collaboration within 30 days after the launch of at least one generic version of such other party’s single agent products (or double agent products). The terminating party then had the right to continue to sell Atripla and become the continuing party, but was obligated to pay the terminated party certain royalties for a three-year period following the effective date of the termination.
In December 2017, a generic version of efavirenz was launched in the United States. Upon the generic version launch, we terminated BMS’s participation in the collaboration and became the continuing party and the sole owner of the joint venture. December 31, 2017 was the last day of the collaboration. As a result of the termination and the transfer to Gilead of BMS’s ownership interest in the joint venture, we consolidate the limited liability company as a wholly-owned subsidiary. BMS no longer has any ownership interest in the joint venture and is not permitted to commercialize Atripla in the United States and Canada, but is entitled to receive from us certain royalties on net sales of Atripla for the next three calendar years, on a declining annual scale. We may continue to purchase efavirenz from BMS as needed to continue manufacturing Atripla for the United States and Canada markets.
See Note 10, Collaborative Arrangements of the Notes to Consolidated Financial Statements included in Item 8 of this Annual Report on Form 10-K for additional information.
Critical Accounting Policies, Estimates and Judgments
The discussion and analysis of our financial condition and results of operations is based on our Consolidated Financial Statements included in Item 8 of this Annual Report on Form 10-K, which have been prepared in accordance with U.S. generally accepted accounting principles. The preparation of these financial statements requires us to make estimates and judgments that affect the reported amounts of assets, liabilities, revenues and expenses and related disclosures. On an ongoing basis, we evaluate and base our estimates on historical experience and on various other market specific and other relevant assumptions that we believe
53
to be reasonable under the circumstances, the results of which form the basis for making judgments about the carrying values of assets and liabilities that are not readily apparent from other sources. Actual results may differ significantly from these estimates.
We believe the following critical accounting policies reflect the more significant judgments and estimates used in the preparation of our Consolidated Financial Statements.
Revenue Recognition
Product Sales
We recognize revenues from product sales when there is persuasive evidence that an arrangement exists, delivery has occurred, the price is fixed or determinable and collectability is reasonably assured. We record product sales net of estimated mandatory and supplemental discounts to government payers, in addition to discounts to private payers, and other related charges. These are generally referred to as gross-to-net deductions and are recorded in the same period the related sales occur. Government and other rebates and chargebacks represent the majority of our gross-to-net deductions and require complex and significant judgment by management. Estimates are assessed each period and updated to reflect current information.
Government and Other Rebates and Chargebacks
Government and other rebates and chargebacks include amounts paid to payers and healthcare providers in the United States, including Medicaid rebates, AIDS Drug Assistance Programs, Veterans Administration and Public Health Service discounts, and other rebates, as well as foreign government rebates. Rebates and chargebacks are based on contractual arrangements or statutory requirements which may vary by product, by payer and individual payer plans.
For qualified programs that can purchase our products through wholesalers or other distributors at a lower contractual price, the wholesalers or distributors charge back to us the difference between their acquisition cost and the lower contractual price. Our consolidated allowances for government and other chargebacks that are payable to our direct customers are classified as reductions of accounts receivable, and totaled
$340 million
as of
December 31, 2017
and
$636 million
as of
December 31, 2016
.
Our consolidated allowance for government and other rebates that will be paid to parties other than our direct customers are recorded in Accrued government and other rebates on our Consolidated Balance Sheets, and totaled
$4.7 billion
as of
December 31, 2017
and
$5.0 billion
as of
December 31, 2016
.
Our allowances for government and other rebates and chargebacks are estimated based on products sold, historical utilization rates, pertinent third-party industry information, estimated patient population, known market events or trends, channel inventory data and/or other market data. We also consider new information regarding changes in programs’ regulations and guidelines that would impact the amount of the actual rebates and/or our expectations regarding future utilization rates for these programs. We believe that the methodology that we use to estimate our government and other rebates and chargebacks is reasonable and appropriate given the current facts and circumstances. However, actual results may differ significantly from our estimates. During the last three years, our actual government rebates and chargebacks claimed for prior periods have varied by less than 5% from our estimates.
The following table summarizes the consolidated activities and ending balances in our government and other rebates and chargebacks accounts (in millions):
|
Accrued government and other rebates and chargebacks:
|
Balance at Beginning of Year
|
Decrease/(Increase) to Product Sales
|
Payments
|
Balance at End of Year
|
||||||||||||
|
Year ended December 31, 2017:
|
|
|
|
|
||||||||||||
|
Activity related to 2017 sales
|
$
|
—
|
|
$
|
15,809
|
|
$
|
(11,170
|
)
|
$
|
4,639
|
|
||||
|
Activity related to sales prior to 2017
|
5,657
|
|
(264
|
)
|
(4,988
|
)
|
405
|
|
||||||||
|
Total
|
$
|
5,657
|
|
$
|
15,545
|
|
$
|
(16,158
|
)
|
$
|
5,044
|
|
||||
|
Year ended December 31, 2016:
|
|
|
|
|
|
|
|
|
||||||||
|
Activity related to 2016 sales
|
$
|
—
|
|
$
|
19,219
|
|
$
|
(13,920
|
)
|
$
|
5,299
|
|
||||
|
Activity related to sales prior to 2016
|
5,025
|
|
(148
|
)
|
(4,519
|
)
|
358
|
|
||||||||
|
Total
|
$
|
5,025
|
|
$
|
19,071
|
|
$
|
(18,439
|
)
|
$
|
5,657
|
|
||||
The decrease in our government and other rebates and chargebacks in
2017
compared to
2016
was primarily driven by lower HCV sales.
54
Legal Contingencies
We are a party to various legal actions. The most significant of these are described in Note
12
, Commitments and Contingencies - Legal Proceedings of the Notes to Consolidated Financial Statements included in Item 8 of this Annual Report on Form 10-K. It is not possible to determine the outcome of these matters. We recognize accruals for such actions to the extent that we conclude that a loss is both probable and reasonably estimable. We accrue for the best estimate of a loss within a range; however, if no estimate in the range is better than any other, then we accrue the minimum amount in the range. If we determine that a loss is reasonably possible and the loss or range of loss can be estimated, we disclose the possible loss.
Significant judgment is required in both the determination of probability and the determination as to whether an exposure is reasonably estimable. Because of the inherent uncertainty and unpredictability related to these matters, accruals are based on what we believe to be the best information available at the time of our assessment, including the legal facts and circumstances of the case, status of the proceedings, applicable law and the views of legal counsel. Upon the final resolution of such matters, it is possible that there may be a loss in excess of the amount recorded, and such amounts could have a material adverse effect on our results of operations, cash flows or financial position. We periodically reassess these matters when additional information becomes available and adjust our estimates and assumptions when facts and circumstances indicate the need for any changes.
We did not recognize any accruals for such matters as of
December 31, 2017
and
2016
as we did not believe losses were probable.
Valuation of Intangible Assets
In conjunction with our business combinations, we have recorded intangible assets primarily related to IPR&D projects. We had total intangible assets of
$17.1 billion
as of
December 31, 2017
, compared to
$9.0 billion
as of
December 31, 2016
.
The identifiable intangible assets are measured at their respective fair values as of the acquisition date and may be subject to revision within the measurement period, which may be up to one year from the acquisition date. The models used in valuing these intangible assets require the use of significant estimates and assumptions including but not limited to:
|
•
|
estimates of revenues and operating profits related to the products or product candidates;
|
|
•
|
the probability of success for unapproved product candidates considering their stages of development;
|
|
•
|
the time and resources needed to complete the development and approval of product candidates;
|
|
•
|
the life of the potential commercialized products and associated risks, including the inherent difficulties and uncertainties in developing a product candidate such as obtaining FDA and other regulatory approvals; and
|
|
•
|
risks related to the viability of and potential alternative treatments in any future target markets.
|
We believe the fair values used to record intangible assets acquired in connection with a business combination using information known and knowable and are based upon reasonable estimates and assumptions given the facts and circumstances as of the related valuation dates.
Intangible assets related to IPR&D projects are considered to be indefinite-lived until the completion or abandonment of the associated R&D efforts. If and when development is complete, which generally occurs if and when regulatory approval to market a product is obtained, the associated assets would be deemed finite-lived and would then be amortized based on their respective estimated useful lives at that point in time. During the period the assets are considered indefinite-lived, they are not amortized but are tested for impairment on an annual basis as well as between annual tests if we become aware of any events or changes that would indicate that it is more likely than not that the fair values of the IPR&D projects are below their respective carrying amounts. The fair value of our indefinite-lived intangible assets is dependent on assumptions such as the expected timing or probability of achieving the specified milestones, changes in projected revenues or changes in discount rates. Significant judgment is employed in determining these assumptions and changes to our assumptions could have a significant impact on our results of operations in any given period.
Intangible assets with finite useful lives are amortized over their estimated useful lives primarily on a straight-line basis. Intangible assets with finite useful lives are reviewed for impairment when facts or circumstances suggest that the carrying value of these assets may not be recoverable.
On October 3, 2017, in connection with our Kite acquisition, we acquired intangible assets primarily related to IPR&D for axicabtagene ciloleucel, KITE-585 and KTE-C19, which had an estimated aggregate fair value of $9.0 billion. On October 18, 2017, FDA approved axicabtagene ciloleucel, now known commercially as Yescarta, making it the first CAR T cell therapy for the treatment of adult patients with relapsed or refractory large B-cell lymphoma after two or more lines of systemic therapy, which includes diffuse large B-cell lymphoma, transformed follicular lymphoma and primary mediastinal B-cell lymphoma. Upon approval, we reclassified $6.2 billion of the purchased IPR&D as a finite-lived intangible asset. We are amortizing this asset over an estimated useful life of 18 years using the straight-line method. See Note
5
, Acquisitions of the Notes to Consolidated Financial Statements included in Item 8 of this Annual Report on Form 10-K.
55
As of
December 31, 2017
, we had indefinite-lived intangible assets of
$2.8 billion
which consisted of purchased IPR&D from our acquisition of Kite. See Note
5
, Acquisitions of the Notes to Consolidated Financial Statements included in Item 8 of this Annual Report on Form 10-K.
In 2016, the estimated fair value of our IPR&D related to momelotinib and simtuzumab was written down to zero due to termination of clinical developments of such programs, and as a result, we recorded impairment charges of
$432 million
within Research and development expenses on our Consolidated Statements of Income included in Item 8 of this Annual Report on Form 10-K.
Provision for Income Taxes
We estimate our income tax provision, including deferred tax assets and liabilities, based on significant management judgment. We evaluate the realization of all or a portion of our deferred tax assets on a quarterly basis. We record a valuation allowance to reduce our deferred tax assets to the amounts that are more likely than not to be realized. We consider future taxable income, ongoing tax planning strategies and our historical financial performance in assessing the need for a valuation allowance. If we expect to realize deferred tax assets for which we have previously recorded a valuation allowance, we will reduce the valuation allowance in the period in which such determination is first made. The valuation allowance was
$162 million
as of
December 31, 2017
and
$126 million
as of
December 31, 2016
. The increase of our valuation allowance from
December 31, 2016
to
December 31, 2017
was primarily related to Kite.
We are subject to income taxes in the United States and various foreign jurisdictions including Ireland. Due to economic and political conditions, various countries are actively considering and have made changes to existing tax laws (for example, the United States recently enacted significant tax reform, and certain provisions of the new law will significantly affect us). We cannot predict the form or timing of potential legislative changes that could have a material adverse impact on our results of operations. In addition, significant judgment is required in determining our worldwide provision for income taxes.
On December 22, 2017, Tax Reform was signed into law in the United States making significant changes to the Internal Revenue Code of 1986, as amended. Changes include, but are not limited to, a corporate tax rate decrease from 35% to 21% effective for tax years beginning after December 31, 2017, implementation of a modified territorial tax system and a repatriation tax on deemed repatriated earnings of foreign subsidiaries. We calculated a provisional estimate of the impact from Tax Reform in our 2017 income tax provision in accordance with our interpretation of Tax Reform and guidance available as of the date of this filing. As a result, we recorded an estimated $5.5 billion net charge to income tax expense in the fourth quarter of 2017, the period in which Tax Reform was enacted. This amount includes: i) a provisional $308 million deferred tax benefit related to the re-measurement of certain deferred tax assets and liabilities, based on the revised rates at which they are expected to reverse in the future, and ii) a provisional $5.8 billion charge related to the transition tax on the mandatory deemed repatriation of accumulated foreign earnings determined as of December 31, 2017. The provisional transition tax charge includes federal (net of certain offsetting adjustments related to unrecognized tax benefits), state and local, and foreign withholding tax on the accumulated foreign earnings, which are no longer considered indefinitely reinvested as of December 31, 2017.
In accordance with the SEC SAB 118, we have determined that the $308 million of the deferred tax benefit recorded in connection with the re-measurement of certain deferred tax assets and liabilities and the $5.8 billion of current tax expense recorded in connection with the transition tax on the mandatory deemed repatriation of foreign earnings are provisional and subject to further adjustment during the measurement period (not to exceed one year from the enactment of Tax Reform). Given the complexity of Tax Reform, we may be refining our estimates of these provisional amounts as further guidance is issued from the U.S. Treasury, the SEC and the FASB.
Additionally, we are continuing to evaluate the accounting policy election required with regard to the tax on Global Intangible Low-Taxed Income (the Global Minimum Tax). The FASB allows companies to adopt a policy election to account for the Global Minimum Tax under one of two methods: (i) account for the Global Minimum Tax as a component of tax expense in the period in which a company is subject to the rules (the period cost method), or (ii) account for the Global Minimum Tax in a company’s measurement of deferred taxes (the deferred method). We have not elected a method and will only do so after our completion of the analysis of the Global Minimum Tax provisions. Our election method will depend, in part, on analyzing expected future U.S. taxable income inclusions related to Global Minimum Tax under both methodologies in order to determine the most appropriate method. Should we decide to elect the deferred method of accounting for the Global Minimum Tax, it is possible that our provisional estimate for re-measuring our deferred taxes may materially change. We will finalize the analysis for the accounting policy election during the measurement period.
We record liabilities related to unrecognized tax benefits in accordance with the guidance that clarifies the accounting for uncertainty in income taxes recognized in an enterprise’s financial statements by prescribing a minimum recognition threshold and measurement attribute for the financial statement recognition and measurement of a tax position taken or expected to be taken in a tax return. An adverse resolution of one or more of these uncertain tax positions in any period could have a material impact on the results of operations for that period.
56
Of the total unrecognized tax benefits, $1.8 billion at both December 31, 2017 and 2016, if recognized, would reduce our effective tax rate in the period of recognition. As of December 31, 2017, we believe that it is reasonably possible that our unrecognized tax benefits will decrease by approximately $800 million in the next 12 months due to potential settlement of tax examinations and lapse of statute of limitations.
We file federal, state and foreign income tax returns in the United States and in many foreign jurisdictions. For federal and California income tax purposes, the statute of limitations is open for 2010 and onwards. For certain acquired entities, the statute of limitations is open for all years from inception due to our utilization of their net operating losses and credits carried over from prior years.
Our income tax returns are subject to audit by federal, state and foreign tax authorities. We are currently under examination by the IRS for the tax years from 2010 to 2014 and by various state and foreign jurisdictions. There are differing interpretations of tax laws and regulations and, as a result, significant disputes may arise with these tax authorities involving issues of the timing and amount of deductions and allocations of income among various tax jurisdictions. We periodically evaluate our exposures associated with our tax filing positions.
See Note 17, Income Taxes of the Notes to Consolidated Financial Statements included in Item 8 of this Annual Report on Form 10-K for additional information.
Off Balance Sheet Arrangements
We do not have any off balance sheet arrangements as defined in Item 303(a)(4)(ii) of Regulation S-K.
Contractual Obligations
Our contractual obligations consist of debt obligations, operating leases, capital commitments, purchase obligations for active pharmaceutical ingredients and inventory-related items and clinical trials contracts. The following table summarizes our significant enforceable and legally binding obligations, future commitments and obligations related to all contracts that we are likely to continue regardless of the fact that certain of these obligations may be cancelable as of
December 31, 2017
(in millions):
|
Payments due by Period
|
||||||||||||||||||||
|
Contractual Obligations
|
Total
|
Less than one
year
|
1-3 years
|
3-5 years
|
More than 5
years
|
|||||||||||||||
|
Debt
(1)
|
$
|
49,524
|
|
$
|
3,900
|
|
$
|
8,676
|
|
$
|
7,701
|
|
$
|
29,247
|
|
|||||
|
Operating lease obligations
|
519
|
|
77
|
|
132
|
|
95
|
|
215
|
|
||||||||||
|
Capital commitments
(2)
|
535
|
|
450
|
|
85
|
|
—
|
|
—
|
|
||||||||||
|
Purchase obligations
(3)(4)
|
1,746
|
|
1,256
|
|
286
|
|
104
|
|
100
|
|
||||||||||
|
Clinical trials
(5)
|
2,356
|
|
1,079
|
|
802
|
|
293
|
|
182
|
|
||||||||||
|
Transition Tax Payable
(6)
|
6,084
|
|
487
|
|
1,460
|
|
1,460
|
|
2,677
|
|
||||||||||
|
Total
(7)
|
$
|
60,764
|
|
$
|
7,249
|
|
$
|
11,441
|
|
$
|
9,653
|
|
$
|
32,421
|
|
|||||
|
_______________________
|
||||||||||||||||||||
Notes:
|
(1)
|
Debt primarily consisted of senior unsecured notes and term loan facilities, including principal and interest payments. Interest payments for our fixed rate senior unsecured notes are incurred and calculated based on terms of the related notes. Interest payments for our variable rate debt are calculated based on the interest rates on the last reset date in 2017 for each debt instrument. See Note
11
, Debt and Credit Facilities of the Notes to Consolidated Financial Statements included in Item 8 of this Annual Report on Form 10-K for additional information.
|
|
(2)
|
Amounts include firm capital project commitments primarily relating to construction of new buildings.
|
|
(3)
|
Amounts include firm purchase commitments primarily relating to active pharmaceutical ingredients and certain inventory-related items. These amounts include minimum purchase requirements.
|
|
(4)
|
In addition to the above, we have committed to make potential future milestone payments to third parties as part of licensing, collaboration and development arrangements. Payments under these agreements generally become due and payable only upon achievement of certain developmental, regulatory and/or commercial milestones. Because the achievement of these milestones is neither probable nor reasonably estimable, such contingencies have not been recorded on our Consolidated Balance Sheets and have not been included in the table above.
|
|
(5)
|
At
December 31, 2017
, we had several clinical studies in various clinical trial phases. Our most significant clinical trial expenditures are to contract research organizations (CROs). Although all of our material contracts with CROs are cancelable, we historically have not canceled such contracts. These amounts reflect commitments based on existing contracts and do not reflect any future modifications to, or terminations of, existing contracts or anticipated or potential new contracts.
|
|
(6)
|
In connection with Tax Reform, as of December 31, 2017, we recorded a federal income tax payable of $6.1 billion of transition tax on the mandatory deemed repatriation of foreign earnings. The amounts included in the table above represent the federal income tax payable of $6.1 billion of the transition tax that will be payable over an eight year period. Amounts associated with Tax Reform are considered provisional and may be subject to further adjustment during the measurement period. See Note 17, Income Taxes of the Notes to Consolidated Financial Statements included in Item 8 of this Annual Report on Form 10-K for additional details on Tax Reform.
|
57
|
(7)
|
As of December 31, 2017, our long-term income taxes payable include unrecognized tax benefits, interest and penalties totaling $1.2 billion. Due to the high degree of uncertainty on the timing of future cash settlement and other events that could extinguish these unrecognized tax benefits, we are unable to estimate the period of cash settlement and therefore we have excluded these unrecognized tax benefits from the table above.
|
Recent Accounting Pronouncements
The information required by this item is included in Note
1
, Organization and Summary of Significant Accounting Policies of the Notes to Consolidated Financial Statements included in Item 8 of this Annual Report on Form 10-K.
|
ITEM 7A.
|
QUANTITATIVE AND QUALITATIVE DISCLOSURES ABOUT MARKET RISK
|
We are exposed to market risks that may result from changes in foreign currency exchange rates, interest rates, credit risks and market price. To reduce certain of these risks, we enter into various types of foreign currency or interest rate derivative hedging transactions, follow investment guidelines and monitor outstanding receivables as part of our risk management program.
Foreign Currency Exchange Risk
Our operations include manufacturing and sales activities in the United States, Canada and Ireland as well as sales activities in countries outside the United States, including Europe and Asia Pacific. As a result, our financial results could be significantly affected by factors such as changes in foreign currency exchange rates or weak economic conditions in the foreign markets in which we distribute our products. Our operating results are exposed to changes in foreign currency exchange rates between the U.S. dollar and various foreign currencies, the most significant of which is the Euro. When the U.S. dollar strengthens against these currencies, the relative value of sales made in the respective foreign currency decreases. Conversely, when the U.S. dollar weakens against these currencies, the relative amounts of such sales increase. Overall, we are a net receiver of foreign currencies and, therefore, benefit from a weaker U.S. dollar and are adversely affected by a stronger U.S. dollar relative to those foreign currencies in which we transact significant amounts of business.
Approximately
29%
of our product sales were denominated in foreign currencies during
2017
. To partially mitigate the impact of changes in currency exchange rates on net cash flows from our foreign currency denominated sales, we may enter into foreign currency exchange forward and option contracts. We also hedge certain monetary assets and liabilities denominated in foreign currencies, which reduces but does not eliminate our exposure to currency fluctuations between the date a transaction is recorded and the date that cash is collected or paid. In general, the market risks of these contracts are offset by corresponding gains and losses on the transactions being hedged.
As of
December 31, 2017
and
2016
, we had open foreign currency forward contracts with notional amounts of
$2.8 billion
and
$6.2 billion
, respectively. A hypothetical 10% adverse movement in foreign currency exchange rates compared with the U.S. dollar relative to exchange rates at
December 31, 2017
would have resulted in a reduction in fair value of these contracts of approximately $285 million on this date and, if realized, would negatively affect earnings over the remaining life of the contracts. The same hypothetical movement in foreign currency exchange rates compared with the U.S. dollar relative to exchange rates at
December 31, 2016
, would have resulted in a reduction in fair value of these contracts of approximately $583 million on this date and, if realized, would negatively affect earnings over the remaining life of the contracts. The analysis does not consider the impact that hypothetical changes in foreign currency exchange rates would have on anticipated transactions that these foreign currency sensitive instruments were designed to offset.
Interest Rate Risk
Our portfolio of available-for-sale marketable securities and our fixed and variable rate liabilities create an exposure to interest rate risk. With respect to our investment portfolio, we adhere to an investment policy that requires us to limit amounts invested in securities based on credit rating, maturity, industry group and investment type and issuer, except for securities issued by the U.S. government. The goals of our investment policy, in order of priority, are as follows:
|
•
|
safety and preservation of principal and diversification of risk;
|
|
•
|
liquidity of investments sufficient to meet cash flow requirements; and
|
|
•
|
competitive after-tax rate of return.
|
58
The following table summarizes the expected maturities and average interest rates of our interest-generating assets and interest-bearing liabilities at
December 31, 2017
(in millions, except percentages):
|
|
Expected Maturity
|
|
Total Fair Value
|
||||||||||||||||||||||||||||
|
|
2018
|
2019
|
2020
|
2021
|
2022
|
Thereafter
|
Total
|
||||||||||||||||||||||||
|
Assets
|
|
|
|
|
|
|
|
|
|||||||||||||||||||||||
|
Available-for-sale debt securities
|
$
|
18,403
|
|
$
|
8,577
|
|
$
|
1,957
|
|
$
|
488
|
|
$
|
29
|
|
$
|
133
|
|
$
|
29,587
|
|
$
|
29,587
|
|
|||||||
|
Average interest rate
|
1.73
|
%
|
2.07
|
%
|
1.94
|
%
|
2.17
|
%
|
2.10
|
%
|
2.33
|
%
|
|
|
|
|
|||||||||||||||
|
Liabilities
|
|
|
|
|
|
|
|
|
|
|
|
|
|
|
|
|
|||||||||||||||
|
Long-term debt, including current portion
(1)
:
|
|||||||||||||||||||||||||||||||
|
Fixed rate
|
$
|
1,000
|
|
$
|
1,500
|
|
$
|
2,500
|
|
$
|
2,250
|
|
$
|
1,500
|
|
$
|
18,500
|
|
$
|
27,250
|
|
$
|
29,021
|
|
|||||||
|
Average interest rate
|
1.85
|
%
|
1.92
|
%
|
2.51
|
%
|
4.44
|
%
|
2.82
|
%
|
4.09
|
%
|
|
|
|||||||||||||||||
|
Variable rate
(2)
|
$
|
1,750
|
|
$
|
1,312
|
|
$
|
1,250
|
|
$
|
250
|
|
$
|
1,938
|
|
$
|
—
|
|
$
|
6,500
|
|
$
|
6,500
|
|
|||||||
|
Average interest rate
(3)
|
2.04
|
%
|
1.88
|
%
|
2.46
|
%
|
2.34
|
%
|
2.34
|
%
|
|
|
|
|
|||||||||||||||||
|
_______________________
|
|||||||||||||||||||||||||||||||
Notes:
|
(1)
|
Amounts represent principal balances. In addition to these fixed and variable rate long-term debt, we have a $2.5 billion five-year revolving credit facility. There were no amounts outstanding under the five-year revolving credit facility as of December 31, 2017. See Note
11
, Debt and Credit Facilities of the Notes to Consolidated Financial Statements included in Item 8 of this Annual Report on Form 10-K for additional information.
|
|
(2)
|
Our
$2.5 billion
principal amount five-year senior unsecured term loan facility issued in October 2017 will be payable in quarterly amounts equal to 2.5% of the initial principal amount on each fiscal quarter end date starting in the fourth quarter of 2019, with any remaining balance due and payable at maturity.
|
|
(3)
|
Average interest rates for our variable rate debt were based on the interest rates on the last reset date in 2017 for each debt instrument and are dependent upon several factors subject to change, including but not limited to LIBOR, the principal amount of debt outstanding and credit ratings on each reset date.
|
Credit Risk
We are subject to credit risk from our portfolio of cash equivalents and marketable securities. Under our investment policy, we limit amounts invested in such securities by credit rating, maturity, industry group, investment type and issuer, except for securities issued by the U.S. government. We are not exposed to any significant concentrations of credit risk from these financial instruments. The goals of our investment policy, in order of priority, are as follows: safety and preservation of principal and diversification of risk; liquidity of investments sufficient to meet cash flow requirements; and a competitive after-tax rate of return.
We are also subject to credit risk from our accounts receivable related to our product sales. The majority of our trade accounts receivable arises from product sales in the United States and Europe.
As of
December 31, 2017
, our accounts receivable, net, in Southern Europe, specifically Greece, Italy, Portugal and Spain, totaled approximately
$326 million
, of which
$131 million
were greater than 120 days past due, including
$52 million
greater than 365 days past due. As of
December 31, 2016
, our accounts receivable, net, in Southern Europe, specifically Greece, Italy, Portugal and Spain, totaled approximately
$317 million
, of which
$110 million
were greater than 120 days past due, including
$45 million
greater than 365 days past due. To date, we have not experienced significant losses with respect to the collection of our accounts receivable.
Market Price Risk
We hold
6.8 million
shares of common stock of Galapagos, a clinical-stage biotechnology company based in Belgium, in connection with a license and collaboration agreement entered into with Galapagos. This equity security was classified as an available-for-sale security, the fair value of which was approximately $635 million and $428 million as of December 31, 2017 and 2016, respectively. The year-over-year increase was due to an increase in the common stock price of Galapagos. This available-for-sale equity security is subject to potential changes in fair value due to the volatility of the stock market and changes in general economic conditions, among other factors. A hypothetical 20% decrease in the stock price of this investment would decrease its fair value at December 31, 2017 by approximately $127 million. We monitor this investment for an other than temporary decline in fair value and would record an impairment loss to income when an other than temporary decline in fair value occurs.
59
|
ITEM 8.
|
FINANCIAL STATEMENTS AND SUPPLEMENTARY DATA
|
GILEAD SCIENCES, INC.
INDEX TO CONSOLIDATED FINANCIAL STATEMENTS AND SUPPLEMENTARY DATA
Years ended
December 31, 2017
,
2016
and
2015
CONTENTS
60
REPORT OF INDEPENDENT REGISTERED PUBLIC ACCOUNTING FIRM
To the Stockholders and the Board of Directors of Gilead Sciences, Inc.
Opinion on the Financial Statements
We have audited the accompanying consolidated balance sheets of Gilead Sciences, Inc. (the Company) as of
December 31, 2017
and
2016
, the related
consolidated statements of income, comprehensive income, stockholders’ equity and cash flows for each of the three years in the period ended
December 31, 2017
, and the related notes and financial statement schedule listed in the Index at Item 15(a) (collectively referred to as the “consolidated financial statements”). In our opinion, the consolidated financial statements present fairly, in all material respects, the financial position of the Company at
December 31, 2017
and
2016
, and the results of its operations and its cash flows for each of the three years in the period ended
December 31, 2017
, in conformity with U.S. generally accepted accounting principles.
We also have audited, in accordance with the standards of the Public Company Accounting Oversight Board (United States) (PCAOB), the Company’s internal control over financial reporting as of
December 31, 2017
, based on criteria established in Internal Control-Integrated Framework issued by the Committee of Sponsoring Organizations of the Treadway Commission (2013 framework) and our report dated
February 26, 2018
expressed an unqualified opinion thereon.
Basis for Opinion
These financial statements are the responsibility of the Company’s management. Our responsibility is to express an opinion on the Company’s financial statements based on our audits. We are a public accounting firm registered with the PCAOB and are required to be independent with respect to the Company in accordance with the U.S. federal securities laws and the applicable rules and regulations of the Securities and Exchange Commission and the PCAOB.
We conducted our audits in accordance with the standards of the PCAOB. Those standards require that we plan and perform the audit to obtain reasonable assurance about whether the financial statements are free of material misstatement, whether due to error or fraud. Our audits included performing procedures to assess the risks of material misstatement of the financial statements, whether due to error or fraud, and performing procedures that respond to those risks. Such procedures included examining, on a test basis, evidence regarding the amounts and disclosures in the financial statements. Our audits also included evaluating the accounting principles used and significant estimates made by management, as well as evaluating the overall presentation of the financial statements. We believe that our audits provide a reasonable basis for our opinion.
/s/ Ernst & Young LLP
We have served as the Company’s auditor since 1988.
Redwood City, California
February 26, 2018
61
GILEAD SCIENCES, INC.
(in millions, except per share amounts)
|
December 31,
|
|||||||
|
2017
|
2016
|
||||||
|
Assets
|
|||||||
|
Current assets:
|
|||||||
|
Cash and cash equivalents
|
$
|
7,588
|
|
$
|
8,229
|
|
|
|
Short-term marketable securities
|
17,922
|
|
3,666
|
|
|||
|
Accounts receivable, net of allowances of $455 at December 31, 2017 and $763 at December 31, 2016
|
3,851
|
|
4,514
|
|
|||
|
Inventories
|
801
|
|
1,587
|
|
|||
|
Prepaid and other current assets
|
1,661
|
|
1,592
|
|
|||
|
Total current assets
|
31,823
|
|
19,588
|
|
|||
|
Property, plant and equipment, net
|
3,295
|
|
2,865
|
|
|||
|
Long-term marketable securities
|
11,184
|
|
20,485
|
|
|||
|
Intangible assets, net
|
17,100
|
|
8,971
|
|
|||
|
Goodwill
|
4,159
|
|
1,172
|
|
|||
|
Other long-term assets
|
2,722
|
|
3,896
|
|
|||
|
Total assets
|
$
|
70,283
|
|
$
|
56,977
|
|
|
|
Liabilities and Stockholders’ Equity
|
|
|
|
|
|||
|
Current liabilities:
|
|
|
|
|
|||
|
Accounts payable
|
$
|
814
|
|
$
|
1,206
|
|
|
|
Accrued government and other rebates
|
4,704
|
|
5,021
|
|
|||
|
Other accrued liabilities
|
3,370
|
|
2,991
|
|
|||
|
Current portion of long-term debt and other obligations, net
|
2,747
|
|
—
|
|
|||
|
Total current liabilities
|
11,635
|
|
9,218
|
|
|||
|
Long-term debt, net
|
30,795
|
|
26,346
|
|
|||
|
Long-term income taxes payable
|
6,794
|
|
1,753
|
|
|||
|
Other long-term obligations
|
558
|
|
297
|
|
|||
|
Commitments and contingencies (Note 12)
|
|
|
|
|
|||
|
Stockholders’ equity:
|
|
|
|
|
|||
|
Preferred stock, par value $0.001 per share; 5 shares authorized; none outstanding
|
—
|
|
—
|
|
|||
|
Common stock, par value $0.001 per share; shares authorized of 5,600 at December 31, 2017 and December 31, 2016; shares issued and outstanding of 1,308 at December 31, 2017 and 1,310 at December 31, 2016
|
1
|
|
1
|
|
|||
|
Additional paid-in capital
|
1,264
|
|
454
|
|
|||
|
Accumulated other comprehensive income
|
165
|
|
278
|
|
|||
|
Retained earnings
|
19,012
|
|
18,154
|
|
|||
|
Total Gilead stockholders’ equity
|
20,442
|
|
18,887
|
|
|||
|
Noncontrolling interest
|
59
|
|
476
|
|
|||
|
Total stockholders’ equity
|
20,501
|
|
19,363
|
|
|||
|
Total liabilities and stockholders’ equity
|
$
|
70,283
|
|
$
|
56,977
|
|
|
See accompanying notes.
62
GILEAD SCIENCES, INC.
(in millions, except per share amounts)
|
Year Ended December 31,
|
||||||||||||
|
2017
|
2016
|
2015
|
||||||||||
|
Revenues:
|
||||||||||||
|
Product sales
|
$
|
25,662
|
|
$
|
29,953
|
|
$
|
32,151
|
|
|||
|
Royalty, contract and other revenues
|
445
|
|
437
|
|
488
|
|
||||||
|
Total revenues
|
26,107
|
|
30,390
|
|
32,639
|
|
||||||
|
Costs and expenses:
|
||||||||||||
|
Cost of goods sold
|
4,371
|
|
4,261
|
|
4,006
|
|
||||||
|
Research and development expenses
|
3,734
|
|
5,098
|
|
3,014
|
|
||||||
|
Selling, general and administrative expenses
|
3,878
|
|
3,398
|
|
3,426
|
|
||||||
|
Total costs and expenses
|
11,983
|
|
12,757
|
|
10,446
|
|
||||||
|
Income from operations
|
14,124
|
|
17,633
|
|
22,193
|
|
||||||
|
Interest expense
|
(1,118
|
)
|
(964
|
)
|
(688
|
)
|
||||||
|
Other income (expense), net
|
523
|
|
428
|
|
154
|
|
||||||
|
Income before provision for income taxes
|
13,529
|
|
17,097
|
|
21,659
|
|
||||||
|
Provision for income taxes
|
8,885
|
|
3,609
|
|
3,553
|
|
||||||
|
Net income
|
4,644
|
|
13,488
|
|
18,106
|
|
||||||
|
Net income (loss) attributable to noncontrolling interest
|
16
|
|
(13
|
)
|
(2
|
)
|
||||||
|
Net income attributable to Gilead
|
$
|
4,628
|
|
$
|
13,501
|
|
$
|
18,108
|
|
|||
|
Net income per share attributable to Gilead common stockholders - basic
|
$
|
3.54
|
|
$
|
10.08
|
|
$
|
12.37
|
|
|||
|
Shares used in per share calculation - basic
|
1,307
|
|
1,339
|
|
1,464
|
|
||||||
|
Net income per share attributable to Gilead common stockholders - diluted
|
$
|
3.51
|
|
$
|
9.94
|
|
$
|
11.91
|
|
|||
|
Shares used in per share calculation - diluted
|
1,319
|
|
1,358
|
|
1,521
|
|
||||||
|
Cash dividends declared per share
|
$
|
2.08
|
|
$
|
1.84
|
|
$
|
1.29
|
|
|||
See accompanying notes.
63
GILEAD SCIENCES, INC.
Consolidated Statements of Comprehensive Income
(in millions)
|
Year Ended December 31,
|
||||||||||||
|
2017
|
2016
|
2015
|
||||||||||
|
Net income
|
$
|
4,644
|
|
$
|
13,488
|
|
$
|
18,106
|
|
|||
|
Other comprehensive income (loss):
|
||||||||||||
|
Net foreign currency translation gain (loss), net of tax
|
(47
|
)
|
177
|
|
9
|
|
||||||
|
Available-for-sale securities:
|
||||||||||||
|
Net unrealized gain (loss), net of tax impact of $6, $19 and $(17), respectively
|
218
|
|
7
|
|
(29
|
)
|
||||||
|
Reclassifications to net income, net of tax impact of $(9), $0 and $1, respectively
|
(8
|
)
|
(7
|
)
|
1
|
|
||||||
|
Net change
|
210
|
|
—
|
|
(28
|
)
|
||||||
|
Cash flow hedges:
|
||||||||||||
|
Net unrealized gain (loss), net of tax impact of $(11), $0 and $21, respectively
|
(304
|
)
|
5
|
|
389
|
|
||||||
|
Reclassification to net income, net of tax impact of $0, $(8) and $(19), respectively
|
28
|
|
8
|
|
(583
|
)
|
||||||
|
Net change
|
(276
|
)
|
13
|
|
(194
|
)
|
||||||
|
Other comprehensive income (loss)
|
(113
|
)
|
190
|
|
(213
|
)
|
||||||
|
Comprehensive income
|
4,531
|
|
13,678
|
|
17,893
|
|
||||||
|
Comprehensive income (loss) attributable to noncontrolling interest
|
16
|
|
(13
|
)
|
(2
|
)
|
||||||
|
Comprehensive income attributable to Gilead
|
$
|
4,515
|
|
$
|
13,691
|
|
$
|
17,895
|
|
|||
See accompanying notes.
64
GILEAD SCIENCES, INC.
Consolidated Statements of Stockholders’ Equity
(in millions)
|
Gilead Stockholders’ Equity
|
Noncontrolling
Interest
|
Total
Stockholders’ Equity |
|||||||||||||||||||||||||
|
Common Stock
|
Additional
Paid-In
Capital
|
Accumulated
Other
Comprehensive
Income (Loss)
|
Retained
Earnings
|
||||||||||||||||||||||||
|
Shares
|
Amount
|
||||||||||||||||||||||||||
|
Balance at December 31, 2014
|
1,499
|
|
$
|
2
|
|
$
|
2,391
|
|
$
|
301
|
|
$
|
12,732
|
|
$
|
393
|
|
$
|
15,819
|
|
|||||||
|
Change in noncontrolling interest
|
—
|
|
—
|
|
—
|
|
—
|
|
—
|
|
188
|
|
188
|
|
|||||||||||||
|
Net income (loss)
|
—
|
|
—
|
|
—
|
|
—
|
|
18,108
|
|
(2
|
)
|
18,106
|
|
|||||||||||||
|
Other comprehensive loss, net of tax
|
—
|
|
—
|
|
—
|
|
(213
|
)
|
—
|
|
—
|
|
(213
|
)
|
|||||||||||||
|
Issuances under employee stock purchase plan
|
1
|
|
—
|
|
86
|
|
—
|
|
—
|
|
—
|
|
86
|
|
|||||||||||||
|
Issuances under equity incentive plans
|
21
|
|
—
|
|
235
|
|
—
|
|
—
|
|
—
|
|
235
|
|
|||||||||||||
|
Tax benefits from employee stock plans
|
—
|
|
—
|
|
586
|
|
—
|
|
—
|
|
—
|
|
586
|
|
|||||||||||||
|
Stock-based compensation
|
—
|
|
—
|
|
384
|
|
—
|
|
—
|
|
—
|
|
384
|
|
|||||||||||||
|
Repurchases of common stock
|
(99
|
)
|
(1
|
)
|
(222
|
)
|
—
|
|
(10,115
|
)
|
—
|
|
(10,338
|
)
|
|||||||||||||
|
Warrants settlement
|
—
|
|
—
|
|
(3,031
|
)
|
—
|
|
(834
|
)
|
—
|
|
(3,865
|
)
|
|||||||||||||
|
Convertible notes settlement
|
—
|
|
—
|
|
(782
|
)
|
—
|
|
—
|
|
—
|
|
(782
|
)
|
|||||||||||||
|
Convertible note hedges settlement
|
—
|
|
—
|
|
784
|
|
—
|
|
—
|
|
—
|
|
784
|
|
|||||||||||||
|
Dividends declared
|
—
|
|
—
|
|
—
|
|
—
|
|
(1,890
|
)
|
—
|
|
(1,890
|
)
|
|||||||||||||
|
Reclassification to equity component of currently redeemable convertible notes
|
—
|
|
—
|
|
13
|
|
—
|
|
—
|
|
—
|
|
13
|
|
|||||||||||||
|
Balance at December 31, 2015
|
1,422
|
|
1
|
|
444
|
|
88
|
|
18,001
|
|
579
|
|
19,113
|
|
|||||||||||||
|
Change in noncontrolling interest
|
—
|
|
—
|
|
—
|
|
—
|
|
—
|
|
(90
|
)
|
(90
|
)
|
|||||||||||||
|
Net income (loss)
|
—
|
|
—
|
|
—
|
|
—
|
|
13,501
|
|
(13
|
)
|
13,488
|
|
|||||||||||||
|
Other comprehensive income, net of tax
|
—
|
|
—
|
|
—
|
|
190
|
|
—
|
|
—
|
|
190
|
|
|||||||||||||
|
Issuances under employee stock purchase plan
|
1
|
|
—
|
|
84
|
|
—
|
|
—
|
|
—
|
|
84
|
|
|||||||||||||
|
Issuances under equity incentive plans
|
13
|
|
—
|
|
128
|
|
—
|
|
—
|
|
—
|
|
128
|
|
|||||||||||||
|
Tax benefits from employee stock plans
|
—
|
|
—
|
|
186
|
|
—
|
|
—
|
|
—
|
|
186
|
|
|||||||||||||
|
Stock-based compensation
|
—
|
|
—
|
|
381
|
|
—
|
|
—
|
|
—
|
|
381
|
|
|||||||||||||
|
Repurchases of common stock
|
(126
|
)
|
—
|
|
(302
|
)
|
—
|
|
(10,883
|
)
|
—
|
|
(11,185
|
)
|
|||||||||||||
|
Warrants settlement
|
—
|
|
—
|
|
(469
|
)
|
—
|
|
—
|
|
—
|
|
(469
|
)
|
|||||||||||||
|
Convertible notes settlement
|
—
|
|
—
|
|
(95
|
)
|
—
|
|
—
|
|
—
|
|
(95
|
)
|
|||||||||||||
|
Convertible note hedges settlement
|
—
|
|
—
|
|
95
|
|
—
|
|
—
|
|
—
|
|
95
|
|
|||||||||||||
|
Dividends declared
|
—
|
|
—
|
|
—
|
|
—
|
|
(2,465
|
)
|
—
|
|
(2,465
|
)
|
|||||||||||||
|
Reclassification of conversion spread of convertible notes
|
—
|
|
—
|
|
(733
|
)
|
—
|
|
—
|
|
—
|
|
(733
|
)
|
|||||||||||||
|
Reclassification of convertible note hedges
|
—
|
|
—
|
|
733
|
|
—
|
|
—
|
|
—
|
|
733
|
|
|||||||||||||
|
Reclassification to equity component of currently redeemable convertible notes
|
—
|
|
—
|
|
2
|
|
—
|
|
—
|
|
—
|
|
2
|
|
|||||||||||||
|
Balance at December 31, 2016
|
1,310
|
|
1
|
|
454
|
|
278
|
|
18,154
|
|
476
|
|
19,363
|
|
|||||||||||||
|
Change in noncontrolling interest
|
—
|
|
—
|
|
(3
|
)
|
—
|
|
—
|
|
(433
|
)
|
(436
|
)
|
|||||||||||||
|
Net income
|
—
|
|
—
|
|
—
|
|
—
|
|
4,628
|
|
16
|
|
4,644
|
|
|||||||||||||
|
Other comprehensive loss, net of tax
|
—
|
|
—
|
|
—
|
|
(113
|
)
|
—
|
|
—
|
|
(113
|
)
|
|||||||||||||
|
Issuances under employee stock purchase plan
|
1
|
|
—
|
|
83
|
|
—
|
|
—
|
|
—
|
|
83
|
|
|||||||||||||
|
Issuances under equity incentive plans
|
11
|
|
—
|
|
146
|
|
—
|
|
—
|
|
—
|
|
146
|
|
|||||||||||||
|
Stock-based compensation
|
—
|
|
—
|
|
618
|
|
—
|
|
—
|
|
—
|
|
618
|
|
|||||||||||||
|
Repurchases of common stock
|
(14
|
)
|
—
|
|
(34
|
)
|
—
|
|
(1,028
|
)
|
—
|
|
(1,062
|
)
|
|||||||||||||
|
Dividends declared
|
—
|
|
—
|
|
—
|
|
—
|
|
(2,742
|
)
|
—
|
|
(2,742
|
)
|
|||||||||||||
|
Balance at December 31, 2017
|
1,308
|
|
$
|
1
|
|
$
|
1,264
|
|
$
|
165
|
|
$
|
19,012
|
|
$
|
59
|
|
$
|
20,501
|
|
|||||||
See accompanying notes.
65
GILEAD SCIENCES, INC.
(in millions)
|
Year Ended December 31,
|
||||||||||||
|
2017
|
2016
|
2015
|
||||||||||
|
Operating Activities:
|
||||||||||||
|
Net income
|
$
|
4,644
|
|
$
|
13,488
|
|
$
|
18,106
|
|
|||
|
Adjustments to reconcile net income to net cash provided by operating activities:
|
||||||||||||
|
Depreciation expense
|
233
|
|
177
|
|
161
|
|
||||||
|
Amortization expense
|
1,053
|
|
981
|
|
937
|
|
||||||
|
Stock-based compensation expense
|
638
|
|
380
|
|
382
|
|
||||||
|
Deferred income taxes
|
(82
|
)
|
(119
|
)
|
(393
|
)
|
||||||
|
In-process research and development impairment
|
—
|
|
432
|
|
—
|
|
||||||
|
Other
|
304
|
|
162
|
|
562
|
|
||||||
|
Changes in operating assets and liabilities:
|
||||||||||||
|
Accounts receivable, net
|
754
|
|
1,192
|
|
(1,397
|
)
|
||||||
|
Inventories
|
(253
|
)
|
(488
|
)
|
(855
|
)
|
||||||
|
Prepaid expenses and other
|
358
|
|
(520
|
)
|
(90
|
)
|
||||||
|
Accounts payable
|
(430
|
)
|
47
|
|
226
|
|
||||||
|
Income taxes payable
|
5,497
|
|
1,010
|
|
269
|
|
||||||
|
Accrued liabilities
|
(818
|
)
|
305
|
|
3,342
|
|
||||||
|
Net cash provided by operating activities
|
11,898
|
|
17,047
|
|
21,250
|
|
||||||
|
Investing Activities:
|
||||||||||||
|
Purchases of marketable securities
|
(23,314
|
)
|
(25,619
|
)
|
(17,239
|
)
|
||||||
|
Proceeds from sales of marketable securities
|
10,440
|
|
13,039
|
|
4,792
|
|
||||||
|
Proceeds from maturities of marketable securities
|
7,821
|
|
1,700
|
|
719
|
|
||||||
|
Other investments
|
—
|
|
(357
|
)
|
—
|
|
||||||
|
Acquisitions, net of cash acquired
|
(10,426
|
)
|
—
|
|
—
|
|
||||||
|
Capital expenditures
|
(590
|
)
|
(748
|
)
|
(747
|
)
|
||||||
|
Net cash used in investing activities
|
(16,069
|
)
|
(11,985
|
)
|
(12,475
|
)
|
||||||
|
Financing Activities:
|
||||||||||||
|
Proceeds from debt financing, net of issuance costs
|
8,985
|
|
5,293
|
|
9,902
|
|
||||||
|
Proceeds from convertible note hedges
|
—
|
|
956
|
|
784
|
|
||||||
|
Proceeds from issuances of common stock
|
234
|
|
208
|
|
319
|
|
||||||
|
Repurchases of common stock
|
(954
|
)
|
(11,001
|
)
|
(10,002
|
)
|
||||||
|
Repayments of debt and other obligations
|
(1,811
|
)
|
(1,981
|
)
|
(997
|
)
|
||||||
|
Payments to settle warrants
|
—
|
|
(469
|
)
|
(3,865
|
)
|
||||||
|
Payment of dividends
|
(2,731
|
)
|
(2,455
|
)
|
(1,874
|
)
|
||||||
|
Other
|
(330
|
)
|
(276
|
)
|
(151
|
)
|
||||||
|
Net cash provided by (used in) financing activities
|
3,393
|
|
(9,725
|
)
|
(5,884
|
)
|
||||||
|
Effect of exchange rate changes on cash and cash equivalents
|
137
|
|
41
|
|
(67
|
)
|
||||||
|
Net change in cash and cash equivalents
|
(641
|
)
|
(4,622
|
)
|
2,824
|
|
||||||
|
Cash and cash equivalents at beginning of period
|
8,229
|
|
12,851
|
|
10,027
|
|
||||||
|
Cash and cash equivalents at end of period
|
$
|
7,588
|
|
$
|
8,229
|
|
$
|
12,851
|
|
|||
|
Supplemental disclosure of cash flow information:
|
||||||||||||
|
Interest paid, net of amounts capitalized
|
$
|
1,038
|
|
$
|
885
|
|
$
|
529
|
|
|||
|
Income taxes paid
|
$
|
3,342
|
|
$
|
2,436
|
|
$
|
3,137
|
|
|||
See accompanying notes.
66
GILEAD SCIENCES, INC.
NOTES TO CONSOLIDATED FINANCIAL STATEMENTS
|
1
.
|
ORGANIZATION AND SUMMARY OF SIGNIFICANT ACCOUNTING POLICIES
|
Overview
Gilead Sciences, Inc. (Gilead, we, our or us), incorporated in Delaware on June 22, 1987, is a research-based biopharmaceutical company that discovers, develops and commercializes innovative medicines in areas of unmet medical need. With each new discovery and investigational drug candidate, we strive to transform and simplify care for people with life-threatening illnesses around the world. We have operations in more than 35 countries worldwide, with headquarters in Foster City, California. Gilead’s primary areas of focus include HIV/AIDS, liver diseases, hematology/oncology and inflammation/respiratory diseases. We seek to add to our existing portfolio of products through our internal discovery and clinical development programs and through product acquisition and in-licensing strategies.
Our portfolio of marketed products includes AmBisome
®
, Atripla
®
, Biktarvy
®
, Cayston
®
, Complera
®
/Eviplera
®
, Descovy
®
, Emtriva
®
, Epclusa
®
, Genvoya
®
, Harvoni
®
, Hepsera
®
, Letairis
®
, Odefsey
®
, Ranexa
®
, Sovaldi
®
, Stribild
®
, Truvada
®
, Tybost
®
, Vemlidy
®
, Viread
®
, Vosevi
®
, Yescarta
TM
and Zydelig
®
. We have U.S. and international commercial sales operations, with marketing subsidiaries in over 35 countries. We also sell and distribute certain products through our corporate partners under royalty-paying collaborative agreements.
Basis of Presentation
The accompanying Consolidated Financial Statements include the accounts of Gilead, our wholly-owned subsidiaries and certain variable interest entities for which we are the primary beneficiary. All intercompany transactions have been eliminated. For consolidated entities where we own or are exposed to less than 100% of the economics, we record net income (loss) attributable to noncontrolling interests on our Consolidated Statements of Income equal to the percentage of the economic or ownership interest retained in such entities by the respective noncontrolling parties.
We assess whether we are the primary beneficiary of a variable interest entity (VIE) at the inception of the arrangement and at each reporting date. This assessment is based on our power to direct the activities of the VIE that most significantly impact the VIE’s economic performance and our obligation to absorb losses or the right to receive benefits from the VIE that could potentially be significant to the VIE. As of December 31, 2016, the only material VIE was our joint venture with Bristol-Myers Squibb Company (BMS). As described in Note
10
, Collaborative Arrangements, December 31, 2017 was the last day of our joint venture with BMS in the United States and Canada.
Significant Accounting Policies, Estimates and Judgments
The preparation of these Consolidated Financial Statements requires us to make estimates and judgments that affect the reported amounts of assets, liabilities, revenues and expenses, and related disclosures. On an ongoing basis, we evaluate our significant accounting policies and estimates. We base our estimates on historical experience and on various market specific and other relevant assumptions that we believe to be reasonable under the circumstances, the results of which form the basis for making judgments about the carrying values of assets and liabilities that are not readily apparent from other sources. Actual results may differ significantly from these estimates.
Revenue Recognition
Product Sales
We recognize revenue from product sales when there is persuasive evidence that an arrangement exists, delivery has occurred, the price is fixed or determinable and collectability is reasonably assured. Upon recognition of revenue from product sales, provisions are made for government and other rebates such as Medicaid reimbursements, customer incentives such as cash discounts for prompt payment, distributor fees and expected returns of expired products, as appropriate.
Items Deducted from Gross Product Sales
Rebates and Chargebacks
We estimate reductions to our revenues for amounts paid to payers and healthcare providers in the United States, including Medicaid rebates, AIDS Drug Assistance Programs, Veterans Administration and Public Health Service discounts, and other rebates, as well as foreign government rebates. Rebates and chargebacks are based on contractual arrangements or statutory requirements which may vary by product, by payer and individual payer plans. Our estimates are based on products sold, historical utilization rates, and as available, pertinent third-party industry information, estimated patient population, known market events
67
or trends, and for our U.S. product sales, channel inventory data obtained from our major U.S. wholesalers in accordance with our inventory management agreements. We also take into consideration, as available, new information regarding changes in programs’ regulations and guidelines that would impact the amount of the actual rebates and/or our expectations regarding future utilization rates for these programs. Government and other chargebacks that are payable to our direct customers are classified as reductions of accounts receivable on our Consolidated Balance Sheets. Government and other rebates that are invoiced directly to us are recorded in Accrued government and other rebates on our Consolidated Balance Sheets.
Cash Discounts
We estimate cash discounts based on contractual terms, historical utilization rates and our expectations regarding future utilization rates.
Distributor Fees
Under our inventory management agreements with our significant U.S. wholesalers, we pay the wholesalers a fee primarily for compliance with certain contractually determined covenants such as the maintenance of agreed upon inventory levels. These distributor fees are based on a contractually determined fixed percentage of sales.
Product Returns
We do not provide our customers with a general right of product return, but typically permit returns if the product is damaged or defective when received by the customer, or in the case of product sold in the United States and certain countries outside the United States, if the product has expired. We will accept returns for product that will expire within six months or that have expired up to one year after their expiration dates. Our estimates for expected returns of expired products are based primarily on an ongoing analysis of our historical return patterns, historical industry information reporting the return rates for similar products and contractual agreements intended to limit the amount of inventory maintained by our wholesalers.
Royalty Revenues
Royalty revenue from sales of our other products is generally recognized when received, which is generally in the quarter following the quarter in which the corresponding sales occur or in the month following the month in which the corresponding sales occur.
Research and Development Expenses
Research and development (R&D) expenses consist primarily of personnel costs, including salaries, benefits and stock-based compensation, clinical studies performed by contract research organizations (CROs), materials and supplies, licenses and fees, up-front and milestone payments under collaboration arrangements and overhead allocations consisting of various support and facility-related costs.
We charge R&D costs, including clinical study costs, to expense when incurred
.
Clinical study costs are a significant component of R&D expenses. Most of our clinical studies are performed by third-party CROs. We monitor levels of performance under each significant contract including the extent of patient enrollment and other activities through communications with our CROs. We accrue costs for clinical studies performed by CROs over the service periods specified in the contracts and adjust our estimates, if required, based upon our ongoing review of the level of effort and costs actually incurred by the CROs. All of our material CRO contracts are terminable by us upon written notice and we are generally only liable for actual services completed by the CRO and certain non-cancelable expenses incurred at any point of termination.
Selling, General and Administrative Expenses
Selling, general and administrative (SG&A) expenses relate to sales and marketing, finance, human resources, legal and other administrative activities. SG&A expenses consist primarily of personnel costs, facilities and overhead costs, outside marketing, advertising and legal expenses, and other general and administrative costs. SG&A expenses also include the branded prescription drug (BPD) fee.
We expense the costs of advertising, including promotional expenses, as incurred. Advertising expenses were
$600 million
in
2017
,
$618 million
in
2016
and
$601 million
in
2015
.
Cash and Cash Equivalents
We consider highly liquid investments with insignificant interest rate risk and an original maturity of three months or less on the purchase date to be cash equivalents. Eligible instruments under our investment policy that are included in cash equivalents primarily include commercial paper, money market funds, overnight repurchase agreements with major banks and authorized dealers and other bank obligations.
68
Marketable and Nonmarketable Securities
Marketable Debt Securities
We determine the appropriate classification of our marketable securities at the time of purchase and reevaluate such designation at each balance sheet date. All of our marketable securities are considered available-for-sale and carried at estimated fair values and reported in cash equivalents, short-term marketable securities or long-term marketable securities. Unrealized gains and losses on available-for-sale securities are excluded from net income and reported in accumulated other comprehensive income (loss) (AOCI) as a separate component of stockholders’ equity. Other income (expense), net, includes interest, dividends, amortization of purchase premiums and discounts, realized gains and losses on sales of securities and other-than-temporary declines in the fair value of securities, if any. The cost of securities sold is based on the specific identification method. We regularly review all of our investments for other-than-temporary declines in fair value. Our review includes the consideration of the cause of the impairment, including the creditworthiness of the security issuers, the number of securities in an unrealized loss position, the severity and duration of the unrealized losses, whether we have the intent to sell the securities and whether it is more likely than not that we will be required to sell the securities before the recovery of their amortized cost basis. When we determine that the decline in fair value of an investment is below our accounting basis and the decline is other-than-temporary, we reduce the carrying value of the security we hold and record a loss for the amount of such decline.
Marketable and Non-Marketable Equity Securities
We record investments in public companies as available-for-sale securities at fair market value. We also invest in equity securities of companies whose securities are not publicly traded and where fair value is not readily available. These investments are recorded using either the cost method or the equity method of accounting, depending on our ownership percentage and other factors that indicate we have significant influence. These investments are recorded in other assets. Unrealized gains and losses on the available-for-sale securities are excluded from net income and reported in AOCI. We regularly review our securities for indicators of impairment. Investments in non-public companies are not material for the periods presented.
Concentrations of Risk
We are subject to credit risk from our portfolio of cash equivalents and marketable securities. Under our investment policy, we limit amounts invested in such securities by credit rating, maturity, industry group, investment type and issuer, except for securities issued by the U.S. government. We are not exposed to any significant concentrations of credit risk from these financial instruments. The goals of our investment policy, in order of priority, are as follows: safety and preservation of principal and diversification of risk; liquidity of investments sufficient to meet cash flow requirements; and a competitive after-tax rate of return.
We are also subject to credit risk from our accounts receivable related to our product sales. The majority of our trade accounts receivable arises from product sales in the United States, Europe and Japan. To date, we have not experienced significant losses with respect to the collection of our accounts receivable. We believe that our allowance for doubtful accounts was adequate at
December 31, 2017
.
Certain of the raw materials and components that we utilize in our operations are obtained through single suppliers. Certain of the raw materials that we utilize in our operations are made at only one facility. Since the suppliers of key components and raw materials must be named in a new drug application filed with U.S. Food and Drug Administration (FDA) for a product, significant delays can occur if the qualification of a new supplier is required. If delivery of material from our suppliers was interrupted for any reason, we may be unable to ship our commercial products or to supply our product candidates for clinical trials.
Accounts Receivable
Trade accounts receivable are recorded net of allowances for wholesaler chargebacks related to government and other programs, cash discounts for prompt payment and doubtful accounts. Estimates for wholesaler chargebacks for government and other programs and cash discounts are based on contractual terms, historical trends and our expectations regarding the utilization rates for these programs. Estimates of our allowance for doubtful accounts are determined based on existing contractual payment terms, historical payment patterns of our customers and individual customer circumstances, an analysis of days sales outstanding by geographic region and a review of the local economic environment and its potential impact on government funding and reimbursement practices. Historically, the amounts of uncollectible accounts receivable that have been written off have been insignificant.
Inventories
Inventories are recorded at the lower of cost and net realizable value, with cost determined on a first-in, first-out basis. We periodically review the composition of our inventories in order to identify obsolete, slow-moving or otherwise unsaleable items.
69
If unsaleable items are observed and there are no alternate uses for the inventory, we record a write-down to net realizable value in the period that the impairment is first recognized.
When future commercialization is considered probable and the future economic benefit is expected to be realized, based on management’s judgment, we capitalize pre-launch inventory costs prior to regulatory approval. A number of factors are taken into consideration, including the current status in the regulatory approval process, potential impediments to the approval process such as safety or efficacy, anticipated R&D initiatives that could impact the indication in which the compound will be used, viability of commercialization and marketplace trends. As of
December 31, 2017
and
2016
, the amount of pre-launch inventory on our Consolidated Balance Sheets was not significant.
Property, Plant and Equipment
Property, plant and equipment is stated at cost less accumulated depreciation and amortization. Depreciation and amortization are recognized using the straight-line method. Repairs and maintenance costs are expensed as incurred. Estimated useful lives in years are generally as follows:
|
Description
|
Estimated Useful Life
|
|
Buildings and improvements
|
20-35
|
|
Laboratory and manufacturing equipment
|
4-10
|
|
Office and computer equipment
|
3-7
|
|
Leasehold improvements
|
Shorter of useful life or lease term
|
Office and computer equipment includes capitalized software. We had unamortized capitalized software costs on our Consolidated Balance Sheets of
$129 million
as of
December 31, 2017
and
$141 million
as of
December 31, 2016
. Capitalized interest on construction in-progress is included in property, plant and equipment. Interest capitalized in
2017
,
2016
and
2015
was not significant.
Acquisitions
We account for business combinations using the acquisition method of accounting, which requires that assets acquired, including in-process research and development (IPR&D) projects, and liabilities assumed be recorded at their fair values as of the acquisition date on our Consolidated Balance Sheets. Any excess of purchase price over the fair value of net assets acquired is recorded as goodwill. The determination of estimated fair value requires us to make significant estimates and assumptions. As a result, we may record adjustments to the fair values of assets acquired and liabilities assumed within the measurement period (up to one year from the acquisition date) with the corresponding offset to goodwill. Transaction costs associated with business combinations are expensed as they are incurred. When we determine net assets acquired do not meet the definition of a business combination under the acquisition method of accounting, acquired IPR&D is expensed and no goodwill is recorded.
Goodwill and Intangible Assets
Goodwill represents the excess of the consideration transferred over the estimated fair value of assets acquired and liabilities assumed in a business combination. Intangible assets with indefinite useful lives are related to purchased IPR&D projects and are measured at their respective fair values as of the acquisition date. We do not amortize goodwill and intangible assets with indefinite useful lives. Intangible assets related to IPR&D projects are considered to be indefinite-lived until the completion or abandonment of the associated R&D efforts. If and when development is complete, which generally occurs if and when regulatory approval to market a product is obtained, the associated assets are deemed finite-lived and are amortized based on their respective estimated useful lives at that point in time. We test goodwill and other indefinite-lived intangible assets for impairment on an annual basis and in between annual tests if we become aware of any events or changes that would indicate the fair values of the assets are below their carrying amounts.
Intangible assets with finite useful lives are amortized over their estimated useful lives, primarily on a straight-line basis, and are reviewed for impairment when facts or circumstances suggest that the carrying value of these assets may not be recoverable.
Impairment of Long-Lived Assets
Long-lived assets, including property, plant and equipment and finite-lived intangible assets, are reviewed for impairment whenever facts or circumstances either internally or externally may suggest that the carrying value of an asset or asset group may not be recoverable. Should there be an indication of impairment, we test for recoverability by comparing the estimated undiscounted future cash flows expected to result from the use of the asset or asset group and its eventual disposition to the carrying amount of the asset or asset group. Any excess of the carrying value of the asset or asset group over its estimated fair value is recognized as an impairment loss.
70
Foreign Currency Translation, Transaction Gains and Losses, and Hedging Contracts
Non-U.S. entity operations are recorded in the functional currency of each entity. Results of operations for non-U.S. dollar functional currency entities are translated into U.S. dollars using average currency rates. Assets and liabilities are translated using currency rates at period end. Foreign currency translation adjustments are recorded as a component of AOCI within stockholders’ equity. Foreign currency transaction gains and losses are recorded in Other income (expense), net, on our Consolidated Statements of Income. Net foreign currency transaction gains and losses were immaterial for the years ended
December 31, 2017
,
2016
and
2015
.
We hedge a portion of our foreign currency exposures related to outstanding monetary assets and liabilities as well as forecasted product sales using foreign currency exchange forward and option contracts. In general, the market risk related to these contracts is offset by corresponding gains and losses on the hedged transactions. The credit risk associated with these contracts is driven by changes in interest and currency exchange rates and, as a result, varies over time. By working only with major banks and closely monitoring current market conditions, we seek to limit the risk that counterparties to these contracts may be unable to perform. We also seek to limit our risk of loss by entering into contracts that permit net settlement at maturity. Therefore, our overall risk of loss in the event of a counterparty default is limited to the amount of any unrecognized gains on outstanding contracts (i.e., those contracts that have a positive fair value) at the date of default. We do not enter into derivative contracts for trading purposes.
Fair Value of Financial Instruments
We apply fair value accounting for all financial assets and liabilities and non-financial assets and liabilities that are recognized or disclosed at fair value in the financial statements on a recurring basis. We define fair value as the price that would be received from selling an asset or paid to transfer a liability in an orderly transaction between market participants at the measurement date. When determining the fair value measurements for assets and liabilities which are required to be recorded at fair value, we consider the principal or most advantageous market in which we would transact and the market-based risk measurements or assumptions that market participants would use in pricing the asset or liability, such as risks inherent in valuation techniques, transfer restrictions and credit risks.
Derivative Financial Instruments
We recognize all derivative instruments as either assets or liabilities at fair value on our Consolidated Balance Sheets. Changes in the fair value of derivatives are recorded each period in current earnings or AOCI, depending on whether a derivative is designated as part of a hedge transaction and, if it is, the type of hedge transaction. We classify the cash flows from these instruments in the same category as the cash flows from the hedged items. We do not hold or issue derivative instruments for trading or speculative purposes.
We assess, both at inception and on an ongoing basis, whether the derivatives that are used in hedging transactions are highly effective in offsetting the changes in cash flows or fair values of the hedged items. We also assess hedge ineffectiveness on a quarterly basis and record the gain or loss related to the ineffective portion to current earnings to the extent significant. If we determine that a forecasted transaction is probable of not occurring, we discontinue hedge accounting for the affected portion of the hedge instrument, and any related unrealized gain or loss on the contract is recognized in Other income (expense), net, on our Consolidated Statements of Income.
Income Taxes
Our income tax provision is computed under the liability method. Deferred tax assets and liabilities are determined based on the difference between the financial statement and tax basis of assets and liabilities using enacted tax rates in effect for the year in which the differences are expected to reverse. Significant estimates are required in determining our provision for income taxes. Some of these estimates are based on interpretations of applicable tax laws or regulations.
We record liabilities related to unrecognized tax benefits in accordance with the guidance that clarifies the accounting for uncertainty in income taxes recognized in an enterprise’s financial statements by prescribing a minimum recognition threshold and measurement attribute for the financial statement recognition and measurement of a tax position taken or expected to be taken in a tax return. An adverse resolution of one or more of these uncertain tax positions in any period could have a material impact on the results of operations for that period.
Recently Adopted Accounting Pronouncements
In November 2015, the Financial Accounting Standards Board (FASB) issued Accounting Standards Update No. 2015-17 (ASU 2015-17) “Balance Sheet Classification of Deferred Taxes.” We adopted this standard on a retrospective basis in the first quarter of 2017. ASU 2015-17 requires that deferred tax assets and liabilities be classified as noncurrent on the balance sheet. As a result, our Consolidated Balance Sheets as of December 31, 2016 was retrospectively adjusted, resulting in a reduction in Total
71
current assets of
$857 million
and an increase in Other long-term assets of
$857 million
. The resulting reclassification of our deferred tax liabilities was not material.
In March 2016, the FASB issued Accounting Standards Update No. 2016-09 (ASU 2016-09) “Improvements to Employee Share-Based Payment Accounting.” We adopted this standard in January 2017. One aspect of the standard requires that excess tax benefits and deficiencies that arise upon vesting or exercise of share-based awards be recognized in the income statement on a prospective basis. Under previous guidance, the tax effects were recorded in additional paid-in capital. As a result, we recognized
$91 million
of excess tax benefits in Provision for income taxes on our Consolidated Statements of Income for 2017. The resulting impact to the shares used in the calculation of diluted earnings per share for 2017 was not material. Additionally, as allowed by the standard, we elected to continue to estimate potential forfeitures.
Another aspect of ASU 2016-09 amended the presentation of certain share-based payment items on the statement of cash flows, which we adopted on a retrospective basis. As a result, our Consolidated Statements of Cash Flows for
2016
and
2015
were adjusted to (a) reclassify
$194 million
and
$585 million
, respectively, of excess tax benefits from stock-based compensation from Net cash used in financing activities to Net cash provided by operating activities and (b) reclassify
$184 million
and
$336 million
, respectively, of employee taxes paid to tax authorities when we withheld shares to meet the minimum statutory withholding requirement from changes in Accrued liabilities within Net cash provided by operating activities to Other within Net cash used in financing activities.
In January 2017, the FASB issued Accounting Standards Update No. 2017-01 (ASU 2017-01) “Clarifying the Definition of a Business.” ASU 2017-01 clarifies the definition of a business when evaluating whether transactions should be accounted for as acquisitions or disposals of assets or businesses. We anticipate more transactions will be accounted for as asset acquisitions rather than business acquisitions under the provisions of this new standard. We adopted this standard on a prospective basis in the fourth quarter of 2017 and the impact from adoption did not have a material effect on our Consolidated Financial Statements.
Recently Issued Accounting Pronouncements Not Yet Adopted
In May 2014, the FASB issued Accounting Standards Update No. 2014-09 (ASU 2014-09) “Revenue from Contracts with Customers.” The standard’s core principle is that a reporting entity will recognize revenue when it transfers promised goods or services to customers in an amount that reflects the consideration to which the entity expects to be entitled in exchange for those goods or services. The standard will become effective for us beginning in the first quarter of 2018. Early adoption is permitted in 2017. Entities have the option of using either a full retrospective or a modified retrospective approach to adopt this new guidance. The FASB issued supplemental adoption guidance and clarification to ASU 2014-09 in March 2016, April 2016, May 2016 and December 2016 within ASU 2016-08 “Revenue from Contracts with Customers: Principal versus Agent Considerations,” ASU 2016-10 “Revenue from Contracts with Customers: Identifying Performance Obligations and Licensing,” ASU 2016-12 “Revenue from Contracts with Customers: Narrow-Scope Improvements and Practical Expedients” and ASU 2016-20 “Technical Corrections and Improvements to Topic 606, Revenue from Contracts with Customers,” respectively. We are adopting these standards using the modified retrospective approach. The cumulative effect of adopting these standards will be recorded to retained earnings on January 1, 2018. We have completed our assessment of the effect of adoption. Based on our assessment, we will accelerate recognition of royalty revenues and certain other revenues that have been recognized on a cash basis or sell through method to the periods in which the sales occur, subject to the constraint on variable consideration. We do not expect the adoption of these standards to have a material impact on our Consolidated Financial Statements.
In January 2016, the FASB issued Accounting Standards Update No. 2016-01 (ASU 2016-01) “Financial Instruments - Overall: Recognition and Measurement of Financial Assets and Financial Liabilities.” ASU 2016-01 changes accounting for equity investments, financial liabilities under the fair value option and the presentation and disclosure requirements for financial instruments. In addition, it clarified guidance related to the valuation allowance assessment when recognizing deferred tax assets resulting from unrealized losses on available-for-sale debt securities. The guidance will become effective for us beginning in the first quarter of 2018 and must be adopted using a modified retrospective approach, with certain exceptions. Early adoption is permitted for certain provisions. We plan to adopt this guidance in the first quarter of 2018. We expect an impact primarily related to the recognition and measurement of our equity investment in Galapagos NV (Galapagos). We will reclassify the unrealized net gain from AOCI to retained earnings as of the date of the adoption, which primarily comprises of
$278 million
of unrealized gain based on the fair value of our equity investment in Galapagos as of December 31, 2017.
In February 2016, the FASB issued Accounting Standards Update No. 2016-02 (ASU 2016-02) “Leases.” ASU 2016-02 amends a number of aspects of lease accounting, including requiring lessees to recognize almost all leases with a term greater than one year as a right-of-use asset and corresponding liability, measured at the present value of the lease payments. The guidance will become effective for us beginning in the first quarter of 2019 and is required to be adopted using a modified retrospective approach. Early adoption is permitted. We are evaluating the impact of the adoption of this standard and we anticipate recognition of additional assets and corresponding liabilities related to leases on our Consolidated Balance Sheets.
In June 2016, the FASB issued Accounting Standards Update No. 2016-13 (ASU 2016-13) “Financial Instruments - Credit Losses: Measurement of Credit Losses on Financial Instruments.” ASU 2016-13 requires measurement and recognition of expected
72
credit losses for financial assets. This guidance will become effective for us beginning in the first quarter of 2020 and must be adopted using a modified retrospective approach, with certain exceptions. Early adoption is permitted beginning in the first quarter of 2019. We are evaluating the impact of the adoption of this standard on our Consolidated Financial Statements.
|
2
.
|
FAIR VALUE MEASUREMENTS
|
We determine the fair value of financial and non-financial assets and liabilities using the fair value hierarchy, which establishes three levels of inputs that may be used to measure fair value, as follows:
|
•
|
Level 1 inputs include quoted prices in active markets for identical assets or liabilities;
|
|
•
|
Level 2 inputs include observable inputs other than Level 1 inputs, such as quoted prices for similar assets or liabilities; quoted prices for identical or similar assets or liabilities in markets that are not active; or other inputs that are observable or can be corroborated by observable market data for substantially the full term of the asset or liability. For our marketable securities, we review trading activity and pricing as of the measurement date. When sufficient quoted pricing for identical securities is not available, we use market pricing and other observable market inputs for similar securities obtained from various third-party data providers. These inputs either represent quoted prices for similar assets in active markets or have been derived from observable market data; and
|
|
•
|
Level 3 inputs include unobservable inputs that are supported by little or no market activity and that are significant to the fair value of the underlying asset or liability. Our Level 3 assets and liabilities include those whose fair value measurements are determined using pricing models, discounted cash flow methodologies or similar valuation techniques and significant management judgment or estimation.
|
Our financial instruments consist primarily of cash and cash equivalents, marketable securities, accounts receivable, foreign currency exchange contracts, equity securities, accounts payable and short-term and long-term debt. Cash and cash equivalents, marketable securities, foreign currency exchange contracts and equity securities are reported at their respective fair values on our Consolidated Balance Sheets. Short-term and long-term debt are reported at their amortized costs on our Consolidated Balance Sheets. The remaining financial instruments are reported on our Consolidated Balance Sheets at amounts that approximate current fair values. There were no transfers between Level 1, Level 2 and Level 3 in the periods presented.
The following table summarizes the types of assets and liabilities measured at fair value on a recurring basis by level within the fair value hierarchy (in millions):
|
|
December 31, 2017
|
December 31, 2016
|
|||||||||||||||||||||||||||||
|
|
Level 1
|
Level 2
|
Level 3
|
Total
|
Level 1
|
Level 2
|
Level 3
|
Total
|
|||||||||||||||||||||||
|
Assets:
|
|
|
|
|
|
|
|
|
|||||||||||||||||||||||
|
Corporate debt securities
|
$
|
—
|
|
$
|
14,747
|
|
$
|
—
|
|
$
|
14,747
|
|
$
|
—
|
|
$
|
12,603
|
|
$
|
—
|
|
$
|
12,603
|
|
|||||||
|
Certificates of deposit
|
—
|
|
5,131
|
|
—
|
|
5,131
|
|
—
|
|
943
|
|
—
|
|
943
|
|
|||||||||||||||
|
Money market funds
|
4,714
|
|
—
|
|
—
|
|
4,714
|
|
5,464
|
|
—
|
|
—
|
|
5,464
|
|
|||||||||||||||
|
U.S. treasury securities
|
4,061
|
|
—
|
|
—
|
|
4,061
|
|
5,529
|
|
—
|
|
—
|
|
5,529
|
|
|||||||||||||||
|
Residential mortgage and asset-backed securities
|
—
|
|
4,058
|
|
—
|
|
4,058
|
|
—
|
|
3,602
|
|
—
|
|
3,602
|
|
|||||||||||||||
|
U.S. government agencies securities
|
—
|
|
926
|
|
—
|
|
926
|
|
—
|
|
975
|
|
—
|
|
975
|
|
|||||||||||||||
|
Non-U.S. government securities
|
—
|
|
664
|
|
—
|
|
664
|
|
—
|
|
720
|
|
—
|
|
720
|
|
|||||||||||||||
|
Municipal debt securities
|
—
|
|
—
|
|
—
|
|
—
|
|
—
|
|
27
|
|
—
|
|
27
|
|
|||||||||||||||
|
Equity securities
|
635
|
|
|
|
—
|
|
635
|
|
428
|
|
—
|
|
—
|
|
428
|
|
|||||||||||||||
|
Deferred compensation plan
|
116
|
|
—
|
|
—
|
|
116
|
|
84
|
|
—
|
|
—
|
|
84
|
|
|||||||||||||||
|
Foreign currency derivative contracts
|
—
|
|
13
|
|
—
|
|
13
|
|
—
|
|
336
|
|
—
|
|
336
|
|
|||||||||||||||
|
Total
|
$
|
9,526
|
|
$
|
25,539
|
|
$
|
—
|
|
$
|
35,065
|
|
$
|
11,505
|
|
$
|
19,206
|
|
$
|
—
|
|
$
|
30,711
|
|
|||||||
|
|
|
|
|
|
|
|
|
|
|
|
|
|
|
|
|
||||||||||||||||
|
Liabilities:
|
|
|
|
|
|
|
|
|
|
|
|
|
|
|
|
|
|||||||||||||||
|
Deferred compensation plan
|
$
|
116
|
|
$
|
—
|
|
$
|
—
|
|
$
|
116
|
|
$
|
84
|
|
$
|
—
|
|
$
|
—
|
|
$
|
84
|
|
|||||||
|
Foreign currency derivative contracts
|
—
|
|
93
|
|
—
|
|
93
|
|
—
|
|
37
|
|
—
|
|
37
|
|
|||||||||||||||
|
Contingent consideration
|
—
|
|
—
|
|
15
|
|
15
|
|
—
|
|
—
|
|
25
|
|
25
|
|
|||||||||||||||
|
Total
|
$
|
116
|
|
$
|
93
|
|
$
|
15
|
|
$
|
224
|
|
$
|
84
|
|
$
|
37
|
|
$
|
25
|
|
$
|
146
|
|
|||||||
73
Level 2 Inputs
We estimate the fair values of Level 2 instruments by taking into consideration valuations obtained from third-party pricing services. The pricing services utilize industry standard valuation models, including both income- and market-based approaches, for which all significant inputs are observable, either directly or indirectly, to estimate fair value. These inputs include reported trades of and broker/dealer quotes on the same or similar securities; issuer credit spreads; benchmark securities; prepayment/default projections based on historical data; and other observable inputs.
Substantially all of our foreign currency derivative contracts have maturities within an 18 month time horizon and all are with counterparties that have a minimum credit rating of A- or equivalent by S&P Global Ratings, Moody’s Investors Service, Inc. or Fitch Ratings, Inc. We estimate the fair values of these contracts by taking into consideration valuations obtained from a third-party valuation service that utilizes an income-based industry standard valuation model for which all significant inputs are observable, either directly or indirectly. These inputs include foreign currency exchange rates, London Interbank Offered Rates (LIBOR) and swap rates. These inputs, where applicable, are observable at commonly quoted intervals.
The total estimated fair values of our short-term and long-term debt, determined using Level 2 inputs based on their quoted market values, were approximately
$35.5 billion
and
$27.0 billion
at
December 31, 2017
and
2016
, respectively, and the carrying values were
$33.5 billion
and
$26.3 billion
at
December 31, 2017
and
2016
, respectively.
Level 3 Inputs
As of
December 31, 2017
and
2016
, the only assets or liabilities that were measured using Level 3 inputs on a recurring basis were our contingent consideration liabilities, which were immaterial. On a nonrecurring basis, we measure certain assets including intangible assets at fair value when the carrying value of the asset exceeds its fair value. During
2016
, the estimated fair value of our IPR&D related to momelotinib and simtuzumab was written down to
zero
due to termination of clinical developments of such programs, and as a result, we recorded impairment charges of
$432 million
.
Our policy is to recognize transfers into or out of Level 3 classification as of the actual date of the event or change in circumstances that caused the transfer.
3
. AVAILABLE-FOR-SALE SECURITIES
Estimated fair values of available-for-sale securities are generally based on prices obtained from commercial pricing services. The following summarizes our available-for-sale securities (in millions):
|
December 31, 2017
|
December 31, 2016
|
|||||||||||||||||||||||||||||||
|
Amortized
Cost |
Gross
Unrealized Gains |
Gross
Unrealized Losses |
Estimated
Fair Value |
Amortized
Cost |
Gross
Unrealized Gains |
Gross
Unrealized Losses |
Estimated
Fair Value |
|||||||||||||||||||||||||
|
Corporate debt securities
|
$
|
14,790
|
|
$
|
3
|
|
$
|
(46
|
)
|
$
|
14,747
|
|
$
|
12,657
|
|
$
|
7
|
|
$
|
(61
|
)
|
$
|
12,603
|
|
||||||||
|
Certificates of deposit
|
5,131
|
|
—
|
|
—
|
|
5,131
|
|
943
|
|
—
|
|
—
|
|
943
|
|
||||||||||||||||
|
Money market funds
|
4,714
|
|
—
|
|
—
|
|
4,714
|
|
5,464
|
|
—
|
|
—
|
|
5,464
|
|
||||||||||||||||
|
U.S. treasury securities
|
4,090
|
|
—
|
|
(29
|
)
|
4,061
|
|
5,558
|
|
1
|
|
(30
|
)
|
5,529
|
|
||||||||||||||||
|
Residential mortgage and asset-backed securities
|
4,072
|
|
1
|
|
(15
|
)
|
4,058
|
|
3,613
|
|
2
|
|
(13
|
)
|
3,602
|
|
||||||||||||||||
|
U.S. government agencies securities
|
934
|
|
—
|
|
(8
|
)
|
926
|
|
981
|
|
—
|
|
(6
|
)
|
975
|
|
||||||||||||||||
|
Non-U.S. government securities
|
668
|
|
—
|
|
(4
|
)
|
664
|
|
725
|
|
—
|
|
(5
|
)
|
720
|
|
||||||||||||||||
|
Municipal debt securities
|
—
|
|
—
|
|
—
|
|
—
|
|
27
|
|
—
|
|
—
|
|
27
|
|
||||||||||||||||
|
Equity securities
|
357
|
|
278
|
|
—
|
|
635
|
|
357
|
|
71
|
|
—
|
|
428
|
|
||||||||||||||||
|
Total
|
$
|
34,756
|
|
$
|
282
|
|
$
|
(102
|
)
|
$
|
34,936
|
|
$
|
30,325
|
|
$
|
81
|
|
$
|
(115
|
)
|
$
|
30,291
|
|
||||||||
74
The following table summarizes the classification of our available-for-sale securities on our Consolidated Balance Sheets (in millions):
|
December 31, 2017
|
December 31, 2016
|
||||||
|
Cash and cash equivalents
|
$
|
5,195
|
|
$
|
5,712
|
|
|
|
Short-term marketable securities
|
17,922
|
|
3,666
|
|
|||
|
Prepaid and other current assets
|
635
|
|
—
|
|
|||
|
Long-term marketable securities
|
11,184
|
|
20,485
|
|
|||
|
Other long-term assets
|
—
|
|
428
|
|
|||
|
Total
|
$
|
34,936
|
|
$
|
30,291
|
|
|
Cash and cash equivalents in the table above excludes cash of
$2.4 billion
and
$2.5 billion
as of
December 31, 2017
and
2016
, respectively.
The following table summarizes our available-for-sale securities by contractual maturity (in millions):
|
December 31, 2017
|
|||||||
|
Amortized Cost
|
Fair Value
|
||||||
|
Within one year
|
$
|
23,139
|
|
$
|
23,117
|
|
|
|
After one year through five years
|
11,125
|
|
11,051
|
|
|||
|
After five years through ten years
|
98
|
|
96
|
|
|||
|
After ten years
|
37
|
|
37
|
|
|||
|
Total
|
$
|
34,399
|
|
$
|
34,301
|
|
|
The following table summarizes our available-for-sale securities that were in a continuous unrealized loss position, but were not deemed to be other-than-temporarily impaired (in millions):
|
|
Less Than 12 Months
|
12 Months or Greater
|
Total
|
|||||||||||||||||||||
|
|
Gross
Unrealized Losses |
Estimated
Fair Value |
Gross
Unrealized Losses |
Estimated
Fair Value |
Gross
Unrealized Losses |
Estimated
Fair Value |
||||||||||||||||||
|
December 31, 2017
|
|
|
|
|
|
|
||||||||||||||||||
|
Corporate debt securities
|
$
|
(14
|
)
|
$
|
7,674
|
|
$
|
(32
|
)
|
$
|
3,561
|
|
$
|
(46
|
)
|
$
|
11,235
|
|
||||||
|
U.S. treasury securities
|
(2
|
)
|
821
|
|
(27
|
)
|
3,240
|
|
(29
|
)
|
4,061
|
|
||||||||||||
|
Residential mortgage and asset-backed securities
|
(4
|
)
|
2,245
|
|
(11
|
)
|
1,206
|
|
(15
|
)
|
3,451
|
|
||||||||||||
|
U.S. government agencies securities
|
(1
|
)
|
206
|
|
(7
|
)
|
700
|
|
(8
|
)
|
906
|
|
||||||||||||
|
Non-U.S. government securities
|
(1
|
)
|
203
|
|
(3
|
)
|
461
|
|
(4
|
)
|
664
|
|
||||||||||||
|
Total
|
$
|
(22
|
)
|
$
|
11,149
|
|
$
|
(80
|
)
|
$
|
9,168
|
|
$
|
(102
|
)
|
$
|
20,317
|
|
||||||
|
|
|
|
|
|
|
|
|
|
|
|
|
|||||||||||||
|
December 31, 2016
|
|
|
|
|
|
|
|
|
|
|
|
|
||||||||||||
|
Corporate debt securities
|
$
|
(60
|
)
|
$
|
8,685
|
|
$
|
(1
|
)
|
$
|
155
|
|
$
|
(61
|
)
|
$
|
8,840
|
|
||||||
|
U.S. treasury securities
|
(30
|
)
|
5,081
|
|
—
|
|
—
|
|
(30
|
)
|
5,081
|
|
||||||||||||
|
Residential mortgage and asset-backed securities
|
(13
|
)
|
2,180
|
|
—
|
|
42
|
|
(13
|
)
|
2,222
|
|
||||||||||||
|
U.S. government agencies securities
|
(6
|
)
|
897
|
|
—
|
|
—
|
|
(6
|
)
|
897
|
|
||||||||||||
|
Non-U.S. government securities
|
(5
|
)
|
714
|
|
—
|
|
5
|
|
(5
|
)
|
719
|
|
||||||||||||
|
Certificates of deposit
|
—
|
|
15
|
|
—
|
|
—
|
|
—
|
|
15
|
|
||||||||||||
|
Municipal debt securities
|
—
|
|
11
|
|
—
|
|
—
|
|
—
|
|
11
|
|
||||||||||||
|
Total
|
$
|
(114
|
)
|
$
|
17,583
|
|
$
|
(1
|
)
|
$
|
202
|
|
$
|
(115
|
)
|
$
|
17,785
|
|
||||||
We held a total of
2,957
and
2,709
positions as of
December 31, 2017
and
2016
, respectively, related to our debt securities that were in an unrealized loss position.
Based on our review of our available-for-sale securities, we believe we had
no
other-than-temporary impairments on these securities as of
December 31, 2017
and
2016
, because we do not intend to sell these securities nor do we believe that we will be required to sell these securities before the recovery of their amortized cost basis. Gross realized gains and gross realized losses were immaterial for the years ended
December 31, 2017
,
2016
and
2015
.
75
|
4
.
|
DERIVATIVE FINANCIAL INSTRUMENTS
|
Our operations in foreign countries expose us to market risk associated with foreign currency exchange rate fluctuations between the U.S. dollar and various foreign currencies, primarily the Euro. In order to manage this risk, we may hedge a portion of our foreign currency exposures related to outstanding monetary assets and liabilities as well as forecasted product sales using foreign currency exchange forward or option contracts. In general, the market risk related to these contracts is offset by corresponding gains and losses on the hedged transactions. The credit risk associated with these contracts is driven by changes in interest and currency exchange rates and, as a result, varies over time. By working only with major banks and closely monitoring current market conditions, we seek to limit the risk that counterparties to these contracts may be unable to perform. We also seek to limit our risk of loss by entering into contracts that permit net settlement at maturity. Therefore, our overall risk of loss in the event of a counterparty default is limited to the amount of any unrecognized gains on outstanding contracts (i.e., those contracts that have a positive fair value) at the date of default. We do not enter into derivative contracts for trading purposes.
We hedge our exposure to foreign currency exchange rate fluctuations for certain monetary assets and liabilities of our entities that are denominated in a non-functional currency. The derivative instruments we use to hedge this exposure are not designated as hedges, and as a result, changes in their fair value are recorded in Other income (expense), net, on our Consolidated Statements of Income.
We hedge our exposure to foreign currency exchange rate fluctuations for forecasted product sales that are denominated in a non-functional currency. The derivative instruments we use to hedge this exposure are designated as cash flow hedges and have maturities of
18 months
or less. Upon executing a hedging contract and quarterly thereafter, we assess prospective hedge effectiveness using a regression analysis which calculates the change in cash flow as a result of the hedge instrument. On a quarterly basis, we assess retrospective hedge effectiveness using a dollar offset approach. We exclude time value from our effectiveness testing and recognize changes in the time value of the hedge in Other income (expense), net, on our Consolidated Statements of Income. The effective component of our hedge is recorded as an unrealized gain or loss on the hedging instrument in AOCI within Stockholders’ equity on our Consolidated Balance Sheets and the gains or losses are reclassified into product sales when the hedged transactions affect earnings. The majority of gains and losses related to the hedged forecasted transactions reported in AOCI at
December 31, 2017
are expected to be reclassified to product sales within 12 months.
The cash flow effects of our derivative contracts for the three years ended
December 31, 2017
,
2016
and
2015
are included within Net cash provided by operating activities on our Consolidated Statements of Cash Flows.
We had notional amounts on foreign currency exchange contracts outstanding of
$2.8 billion
and
$6.2 billion
at
December 31, 2017
and
2016
, respectively.
While all of our derivative contracts allow us the right to offset assets or liabilities, we have presented amounts on a gross basis. Under the International Swap Dealers Association, Inc. master agreements with the respective counterparties of the foreign currency exchange contracts, subject to applicable requirements, we are allowed to net settle transactions of the same currency with a single net amount payable by one party to the other. The following table summarizes the classification and fair values of derivative instruments on our Consolidated Balance Sheets (in millions):
|
December 31, 2017
|
||||||||||||
|
Asset Derivatives
|
Liability Derivatives
|
|||||||||||
|
Classification
|
Fair Value
|
Classification
|
Fair
Value
|
|||||||||
|
Derivatives designated as hedges:
|
||||||||||||
|
Foreign currency exchange contracts
|
Other current assets
|
$
|
2
|
|
Other accrued liabilities
|
$
|
(89
|
)
|
||||
|
Foreign currency exchange contracts
|
Other long-term assets
|
1
|
|
Other long-term obligations
|
(3
|
)
|
||||||
|
Total derivatives designated as hedges
|
3
|
|
(92
|
)
|
||||||||
|
Derivatives not designated as hedges:
|
|
|
|
|
||||||||
|
Foreign currency exchange contracts
|
Other current assets
|
10
|
|
Other accrued liabilities
|
(1
|
)
|
||||||
|
Total derivatives not designated as hedges
|
10
|
|
(1
|
)
|
||||||||
|
Total derivatives
|
$
|
13
|
|
$
|
(93
|
)
|
||||||
76
|
December 31, 2016
|
||||||||||||
|
Asset Derivatives
|
Liability Derivatives
|
|||||||||||
|
Classification
|
Fair Value
|
Classification
|
Fair
Value
|
|||||||||
|
Derivatives designated as hedges:
|
||||||||||||
|
Foreign currency exchange contracts
|
Other current assets
|
$
|
225
|
|
Other accrued liabilities
|
$
|
(1
|
)
|
||||
|
Foreign currency exchange contracts
|
Other long-term assets
|
20
|
|
Other long-term obligations
|
—
|
|
||||||
|
Total derivatives designated as hedges
|
245
|
|
(1
|
)
|
||||||||
|
Derivatives not designated as hedges:
|
||||||||||||
|
Foreign currency exchange contracts
|
Other current assets
|
81
|
|
Other accrued liabilities
|
(34
|
)
|
||||||
|
Foreign currency exchange contracts
|
Other long-term assets
|
10
|
|
Other long-term obligations
|
(2
|
)
|
||||||
|
Total derivatives not designated as hedges
|
91
|
|
(36
|
)
|
||||||||
|
Total derivatives
|
$
|
336
|
|
$
|
(37
|
)
|
||||||
The following table summarizes the effect of our foreign currency exchange contracts on our Consolidated Financial Statements (in millions):
|
Year Ended December 31,
|
||||||||||||
|
2017
|
2016
|
2015
|
||||||||||
|
Derivatives designated as hedges:
|
|
|
||||||||||
|
Gains (losses) recognized in AOCI (effective portion)
|
$
|
(315
|
)
|
$
|
5
|
|
$
|
410
|
|
|||
|
Gains (losses) reclassified from AOCI into product sales (effective portion)
|
$
|
(28
|
)
|
$
|
73
|
|
$
|
602
|
|
|||
|
Gains (losses) recognized in Other income (expense), net (ineffective portion and amounts excluded from effectiveness testing)
|
$
|
41
|
|
$
|
(32
|
)
|
$
|
13
|
|
|||
|
Derivatives not designated as hedges:
|
|
|
|
|
|
|
||||||
|
Gains (losses) recognized in Other income (expense), net
|
$
|
(113
|
)
|
$
|
206
|
|
$
|
117
|
|
|||
From time to time, we may discontinue cash flow hedges, and as a result, record related amounts in Other income (expense), net, on our Consolidated Statements of Income. There were
no
material amounts recorded in Other income (expense), net, for the years ended
December 31, 2017
,
2016
and
2015
as a result of the discontinuance of cash flow hedges.
As of
December 31, 2017
and
2016
, we held one type of financial instrument, which was derivative contracts related to foreign currency exchange contracts. The following table summarizes the potential effect of offsetting derivatives by type of financial instrument on our Consolidated Balance Sheets (in millions):
|
As of December 31, 2017
|
||||||||||||||||||||||||
|
Offsetting of Derivative Assets/Liabilities
|
||||||||||||||||||||||||
|
Gross Amounts Not Offset on the Consolidated Balance Sheets
|
||||||||||||||||||||||||
|
Description
|
Gross Amounts of Recognized Assets/Liabilities
|
Gross Amounts Offset on the Consolidated Balance Sheets
|
Amounts of Assets/Liabilities Presented on the Consolidated Balance Sheets
|
Derivative Financial Instruments
|
Cash Collateral Received/Pledged
|
Net Amount (Legal Offset)
|
||||||||||||||||||
|
Derivative assets
|
$
|
13
|
|
$
|
—
|
|
$
|
13
|
|
$
|
(8
|
)
|
$
|
—
|
|
$
|
5
|
|
||||||
|
Derivative liabilities
|
(93
|
)
|
—
|
|
(93
|
)
|
8
|
|
—
|
|
(85
|
)
|
||||||||||||
|
As of December 31, 2016
|
||||||||||||||||||||||||
|
Offsetting of Derivative Assets/Liabilities
|
||||||||||||||||||||||||
|
Gross Amounts Not Offset on the Consolidated Balance Sheets
|
||||||||||||||||||||||||
|
Description
|
Gross Amounts of Recognized Assets/Liabilities
|
Gross Amounts Offset on the Consolidated Balance Sheets
|
Amounts of Assets/Liabilities Presented on the Consolidated Balance Sheets
|
Derivative Financial Instruments
|
Cash Collateral Received/Pledged
|
Net Amount (Legal Offset)
|
||||||||||||||||||
|
Derivative assets
|
$
|
336
|
|
$
|
—
|
|
$
|
336
|
|
$
|
(37
|
)
|
$
|
—
|
|
$
|
299
|
|
||||||
|
Derivative liabilities
|
(37
|
)
|
—
|
|
(37
|
)
|
37
|
|
—
|
|
—
|
|
||||||||||||
77
May 2016 Convertible Senior Notes and Convertible Note Hedges
In March 2016, we exercised our option to elect cash for the settlement of the conversion value in excess of the principal amount (the conversion spread) of our remaining convertible senior notes due in May 2016 (the Convertible Notes) and for the related convertible note hedges. Until our cash settlement election, the conversion spread of the Convertible Notes and the convertible note hedges met the applicable criteria for equity classification and were therefore recorded in Stockholders’ equity on our Consolidated Balance Sheets. Upon our cash settlement election, we reclassified
$733 million
of the fair value of the conversion spread from Stockholders’ equity to Current portion of long-term debt and other obligations, net, and reclassified
$733 million
of the fair value of the convertible note hedges from Stockholders’ equity to Prepaid and other current assets on our Consolidated Balance Sheets. Upon maturity of the Convertible Notes in 2016, we settled the conversion spread and the convertible note hedges in cash at
$861 million
, respectively, and recorded a loss of
$128 million
on the conversion spread and a gain of
$128 million
on the convertible note hedges on our Consolidated Statements of Income.
5
. ACQUISITIONS
Kite Pharma, Inc.
On October 3, 2017 (the Acquisition Date), we completed a tender offer for all of the outstanding common stock of Kite Pharma, Inc. (Kite) for
$180
per share in cash. As a result, Kite became our wholly-owned subsidiary. The acquisition of Kite helps establish our foundation for improving the treatment of hematological malignancies and solid tumors. Kite’s cell therapies express either a chimeric antigen receptor (CAR) or an engineered T cell receptor, depending on the type of cancer. Kite’s most advanced therapy candidate, axicabtagene ciloleucel, is a CAR T cell therapy. On October 18, 2017, axicabtagene ciloleucel, now known commercially as Yescarta, was approved by FDA, making it the first CAR T cell therapy for the treatment of adult patients with relapsed or refractory large B-cell lymphoma after two or more lines of systemic therapy, which includes diffuse large B-cell lymphoma (DLBCL), transformed follicular lymphoma (TFL) and primary mediastinal B-cell lymphoma (PMBCL). A marketing authorization application has also been filed for axicabtagene ciloleucel for the treatment of relapsed/refractory DLBCL, TFL and PMBCL with the European Medicines Agency. Kite has additional candidates in clinical trials in both hematologic cancers and solid tumors, including KITE-585, a CAR T cell therapy candidate that targets B-cell maturation antigen expressed in multiple myeloma.
The consideration transferred for the acquisition was
$11,155 million
, consisting of
$10,420 million
in cash to the outstanding Kite common stockholders,
$645 million
cash payment to vested equity award holders,
$15 million
to warrant holders, and approximately
$75 million
representing the portion of the replaced stock-based awards attributable to the pre-combination period. In addition, approximately
$733 million
was excluded from the consideration transferred, representing the portion of the replaced stock-based awards attributable to the post combination period, of which
$238 million
was recognized as compensation expense during the three months ended December 31, 2017. The remaining stock-based compensation expense from the replacement awards is expected to be recognized through 2021. We financed the transaction with
$3.0 billion
aggregate principal amount in senior unsecured notes issued in September 2017, a
$6.0 billion
aggregate principal amount term loan facility credit agreement entered into in September 2017 and drawn in October 2017, as well as cash on hand. See Note
11
, Debt and Credit Facilities for additional information.
The acquisition of Kite was accounted for as a business combination using the acquisition method of accounting. This method requires, among other things, that assets acquired and liabilities assumed be recognized at fair value as of the acquisition date. The fair value estimates for the assets acquired and liabilities assumed were based upon preliminary valuations using information known and knowable as of the date of this filing. We will be able to complete our valuation when we obtain additional information, primarily related to certain forecast assumptions used to perform our preliminary valuation of intangibles and estimates to record the benefit of certain tax attributes. Changes to these assumptions and estimates could cause an impact to the valuation of assets acquired, including intangible assets, goodwill and the related tax impacts of the acquisition.
78
The following table summarizes the preliminary acquisition date fair values of assets acquired and liabilities assumed, and the consideration transferred (in millions):
|
Cash and cash equivalents
|
$
|
652
|
|
|
|
Identifiable intangible assets
|
||||
|
Indefinite-lived intangible assets - IPR&D
|
8,950
|
|
||
|
Outlicense acquired
|
91
|
|
||
|
Deferred income taxes
|
(1,606
|
)
|
||
|
Other assets acquired (liabilities assumed), net
|
81
|
|
||
|
Total identifiable net assets
|
8,168
|
|
||
|
Goodwill
|
2,987
|
|
||
|
Total consideration transferred
|
$
|
11,155
|
|
|
Identifiable Intangible Assets
We acquired intangible assets primarily related to IPR&D for axicabtagene ciloleucel, KITE-585 and KTE-C19, which had an estimated aggregate fair value of
$8,950 million
as of the Acquisition Date. The fair values of the assets were determined using a probability-weighted income approach that discounts expected future cash flows to present value. The estimated net cash flows were discounted using a discount rate of
9.5%
, which is based on the estimated weighted-average cost of capital for companies with profiles similar to that of Kite. This rate is comparable to the estimated internal rate of return for the acquisition and represents the rate that market participants would use to value the intangible assets. The projected cash flows from the IPR&D assets were based on key assumptions such as:
|
•
|
estimates of revenues and operating profits related to each project considering its stage of development as of the Acquisition Date;
|
|
•
|
the time and resources needed to complete the development and approval of the product candidates;
|
|
•
|
the life of the potential commercialized product and associated risks, including the inherent difficulties and uncertainties in developing a product candidate such as obtaining marketing approval from the FDA and other regulatory agencies;
|
|
•
|
risks related to the viability of and potential alternative treatments in any future target markets.
|
Intangible assets related to IPR&D projects are considered to be indefinite-lived assets until the completion or abandonment of the associated R&D efforts. In October 2017, upon FDA approval of Yescarta for the treatment of adult patients with relapsed or refractory DLBCL after two or more lines of systemic therapy,
$6,200 million
of the purchased IPR&D was reclassified as a finite-lived intangible asset and is being amortized over an estimated useful life of
18 years
using the straight-line method.
Additionally, we acquired an outlicense to Daiichi Sankyo, which had an estimated fair value of
$91 million
as of the Acquisition Date. This definite-lived intangible asset is being amortized over an estimated useful life of
14 years
on a straight-line basis. The fair value was determined by estimating the probability-weighted net cash flows attributable to the outlicense discounted to present value using a discount rate that represents the estimated rate that market participants would use to value this intangible asset.
Goodwill
The
$2,987 million
goodwill represents the excess of the consideration transferred over the fair values of assets acquired and liabilities assumed and represents the future economic benefits arising from other assets acquired that could not be individually identified and separately recognized. None of the goodwill is deductible for income tax purposes.
Actual and Supplemental Pro Forma Information
The financial results of Kite since the date of acquisition have been included in our Consolidated Statements of Income for the year ended December 31, 2017. Kite’s pre-tax operating loss was approximately
$675 million
, which included expenses of
$431 million
associated with the acquisition of Kite. Kite’s pre-tax operating loss included
$290 million
share-based and other compensation expenses, of which
$209 million
was due to accelerated vesting and other compensation charges associated with the acquisition,
$222 million
acquired IPR&D expenses, primarily related to the acquisition of Cell Design Labs, Inc. (Cell Design Labs), and
$73 million
amortization of intangible assets. Share-based compensation expenses were recorded primarily within Research and development expenses and Selling, general and administrative expenses, acquired IPR&D expenses were recorded within Research and development expenses and amortization expense was recorded within Cost of goods sold on our Consolidated Statements of Income for the year ended December 31, 2017.
79
In connection with the acquisition of Kite, we incurred
$48 million
of transaction costs which were recorded within Selling, general, and administrative expenses on our Consolidated Statements of Income for the year ended December 31, 2017.
The following pro forma information presents the combined results of operations of Gilead and Kite as if the acquisition of Kite had been completed on January 1, 2016, with adjustments to give effect to pro forma events that are directly attributable to the acquisition (in millions, unaudited):
|
Year Ended December 31,
|
||||||||
|
2017
|
2016
|
|||||||
|
Total revenues
|
$
|
26,127
|
|
$
|
30,390
|
|
||
|
Net income attributable to Gilead
|
$
|
4,508
|
|
$
|
12,928
|
|
||
The unaudited pro forma consolidated results include pro forma adjustments directly attributable to the acquisition, assuming that the acquisition occurred on January 1, 2016. The primary adjustments include: (i) compensation expenses of
$223 million
and acquisition-related transaction expenses of
$139 million
, inclusive of Kite’s transaction expenses, incurred in 2017, which were included in the net income attributable to Gilead for the year ended December 31, 2016, and (ii) the impact of additional interest expense on debt issued in connection with the acquisition of Kite assuming the debt was incurred on January 1, 2016. The unaudited pro forma results do not reflect any operating efficiencies or potential cost savings which may result from the consolidation of the operations of Gilead and Kite. Accordingly, these unaudited pro forma results are presented for informational purposes only and are not necessarily indicative of what the actual results of operations of the combined company would have been if the acquisition had occurred at the beginning of 2016, nor are they indicative of future results of operations.
Cell Design Labs, Inc.
In December 2017, we acquired all of the issued and outstanding stock of Cell Design Labs, a privately held company, which was in addition to the approximately
12.2%
of shares in Cell Design Labs we obtained in the acquisition of Kite. With this acquisition, we gained new technology platforms that will enhance research and development efforts in cellular therapy.
The cash consideration totaled
$150 million
, net of acquired cash. Additionally, the shareholders of Cell Design Labs, other than us, are eligible to receive contingent development and regulatory milestone-based payments of up to
$322 million
. Our
12.2%
equity interest in Cell Design Labs had a carrying value of
$30 million
. The transaction was accounted for as an asset acquisition. As a result,
$172 million
was expensed as acquired IPR&D within Research and development expenses on our Consolidated Statements of Income.
Nimbus Apollo, Inc.
In May 2016, we acquired Nimbus Apollo, Inc., a privately held company, and its Acetyl-CoA Carboxylase inhibitor program, which is being evaluated for the potential treatment of non-alcoholic steatohepatitis, hepatocellular carcinoma and other diseases. The consideration included a payment of
$400 million
and contingent development and regulatory milestone-based payments of up to
$800 million
. The transaction was accounted for as an asset acquisition. As a result, the payment of
$400 million
was expensed
as acquired IPR&D within Research and development expenses on our Consolidated Statements of Income. During 2016, based on the achievement of certain clinical development milestones, we recorded a
$200 million
expense within Research and development expenses on our Consolidated Statements of Income.
|
6
.
|
INVENTORIES
|
Inventories are summarized as follows (in millions):
|
December 31,
|
||||||||
|
2017
|
2016
|
|||||||
|
Raw materials
|
$
|
1,880
|
|
$
|
1,610
|
|
||
|
Work in process
|
352
|
|
626
|
|
||||
|
Finished goods
|
670
|
|
928
|
|
||||
|
Total
|
$
|
2,902
|
|
$
|
3,164
|
|
||
|
Reported as:
|
||||||||
|
Inventories
|
$
|
801
|
|
$
|
1,587
|
|
||
|
Other long-term assets
|
2,101
|
|
1,577
|
|
||||
|
Total
|
$
|
2,902
|
|
$
|
3,164
|
|
||
80
Amounts reported as other long-term assets primarily consisted of raw materials as of
December 31, 2017
and
2016
.
The joint ventures with BMS, which we consolidate, held efavirenz active pharmaceutical ingredient in inventory. This efavirenz inventory was purchased from BMS at BMS’s estimated net selling price of efavirenz. In December 2017, a generic version of efavirenz was launched in the United States. Upon the generic version launch, we terminated BMS’s participation in the collaboration for the United States and Canada, and became the sole owner of the joint venture for these countries. December 31, 2017 was the last day of the collaboration for the United States and Canada. As a result of the termination and pursuant to the terms of the existing agreements governing the collaboration for the United States and Canada, we recorded a
$438 million
reduction to inventory and a receivable from BMS to adjust the purchase price of inventory on hand as of the termination date. The remaining collaborative arrangements with BMS continue to purchase efavirenz from BMS at BMS’s estimated net selling price of efavirenz. See Note
10
, Collaborative Arrangements for additional information. As of
December 31, 2017
and
2016
, efavirenz inventory valued at BMS’s estimated net selling price totaled
$137 million
and
$1.1 billion
, respectively.
|
7
.
|
PROPERTY, PLANT AND EQUIPMENT
|
Property, plant and equipment is summarized as follows (in millions):
|
December 31,
|
||||||||
|
2017
|
2016
|
|||||||
|
Land
|
$
|
396
|
|
$
|
394
|
|
||
|
Buildings and improvements (including leasehold improvements)
|
2,176
|
|
1,713
|
|
||||
|
Laboratory and manufacturing equipment
|
533
|
|
469
|
|
||||
|
Office and computer equipment
|
494
|
|
466
|
|
||||
|
Construction in progress
|
690
|
|
641
|
|
||||
|
Subtotal
|
4,289
|
|
3,683
|
|
||||
|
Less accumulated depreciation and amortization
|
(994
|
)
|
(818
|
)
|
||||
|
Total
|
$
|
3,295
|
|
$
|
2,865
|
|
||
|
8
.
|
INTANGIBLE ASSETS AND GOODWILL
|
The following table summarizes the carrying amount of our Intangible assets, net (in millions):
|
December 31,
|
||||||||
|
2017
|
2016
|
|||||||
|
Finite-lived intangible assets
|
$
|
14,350
|
|
$
|
8,971
|
|
||
|
Indefinite-lived intangible assets
|
2,750
|
|
—
|
|
||||
|
Total
|
$
|
17,100
|
|
$
|
8,971
|
|
||
Finite-Lived Intangible Assets
The following table summarizes our finite-lived intangible assets (in millions):
|
December 31, 2017
|
December 31, 2016
|
|||||||||||||||||||||||
|
Gross Carrying
Amount
|
Accumulated
Amortization
|
Net Carrying
Amount
|
Gross Carrying
Amount
|
Accumulated
Amortization
|
Net Carrying
Amount
|
|||||||||||||||||||
|
Intangible asset - sofosbuvir
|
$
|
10,720
|
|
$
|
2,855
|
|
$
|
7,865
|
|
$
|
10,720
|
|
$
|
2,156
|
|
$
|
8,564
|
|
||||||
|
Intangible asset - axicabtagene ciloleucel (DLBCL)
|
6,200
|
|
72
|
|
6,128
|
|
—
|
|
—
|
|
—
|
|
||||||||||||
|
Intangible asset - Ranexa
|
688
|
|
566
|
|
122
|
|
688
|
|
467
|
|
221
|
|
||||||||||||
|
Other
|
546
|
|
311
|
|
235
|
|
455
|
|
269
|
|
186
|
|
||||||||||||
|
Total
|
$
|
18,154
|
|
$
|
3,804
|
|
$
|
14,350
|
|
$
|
11,863
|
|
$
|
2,892
|
|
$
|
8,971
|
|
||||||
Amortization expense related to finite-lived intangible assets, included primarily in Cost of goods sold on our Consolidated Statements of Income, totaled
$912 million
,
$844 million
and
$826 million
in
2017
,
2016
and
2015
.
81
As of
December 31, 2017
, estimated future amortization expense associated with our finite-lived intangible assets is as follows (in millions):
|
Fiscal Year
|
Amount
|
||
|
2018
|
$
|
1,203
|
|
|
2019
|
1,088
|
|
|
|
2020
|
1,064
|
|
|
|
2021
|
1,064
|
|
|
|
2022
|
1,064
|
|
|
|
Thereafter
|
8,867
|
|
|
|
Total
|
$
|
14,350
|
|
Indefinite-Lived Intangible Assets
As of
December 31, 2017
, we had indefinite-lived intangible assets of
$2,750 million
, which consisted of the purchased IPR&D from our acquisition of Kite. See Note
5
, Acquisitions for additional information. In 2016, the estimated fair value of our IPR&D related to momelotinib and simtuzumab was written down to
zero
due to termination of clinical development of such programs, and as a result, we recorded impairment charges of
$432 million
within Research and development expenses on our Consolidated Statements of Income.
Goodwill
Upon completing the acquisition of Kite in October 2017, we preliminarily attributed
$2,987 million
to goodwill on our Consolidated Balance Sheets. The following table summarizes the changes in the carrying amount of goodwill (in millions):
|
Balance at December 31, 2016
|
$
|
1,172
|
|
|
Goodwill resulting from the acquisition of Kite
|
2,987
|
|
|
|
Balance at December 31, 2017
|
$
|
4,159
|
|
|
9
.
|
OTHER FINANCIAL INFORMATION
|
Other accrued liabilities
The components of Other accrued liabilities are summarized as follows (in millions):
|
December 31,
|
||||||||
|
2017
|
2016
|
|||||||
|
Income taxes payable
|
$
|
713
|
|
$
|
186
|
|
||
|
Compensation and employee benefits
|
455
|
|
398
|
|
||||
|
BPD fee
|
284
|
|
481
|
|
||||
|
Other accrued expenses
|
1,918
|
|
1,926
|
|
||||
|
Total
|
$
|
3,370
|
|
$
|
2,991
|
|
||
|
10
.
|
COLLABORATIVE ARRANGEMENTS
|
We enter into collaborative arrangements with third parties for the development and commercialization of certain products. Both parties are active participants in the operating activities of the collaboration and are exposed to significant risks and rewards depending on the commercial success of the activities. The following are our significant collaborative arrangements.
Bristol-Myers Squibb Company
North America
In 2004, we entered into a collaboration arrangement with BMS to develop and commercialize a single tablet regimen containing our Truvada and BMS’s Sustiva (efavirenz) in the United States and Canada. This combination was approved for use in the United States in 2006 and is sold under the brand name Atripla. We and BMS structured this collaboration as a joint venture that operated as a limited liability company, which we consolidated. We and BMS granted royalty-free sublicenses to the joint
82
venture for the use of our respective company owned technologies and, in return, were granted certain licenses by the joint venture to use the intellectual property resulting from the collaboration. The economic interests of the joint venture held by us and BMS (including the sharing of revenues and out-of-pocket expenses) were based on the portion of the net selling price of Atripla attributable to Truvada and efavirenz. Since the net selling price for Truvada changed over time relative to the net selling price of efavirenz, both our and BMS’s respective economic interests in the joint venture varied annually over the course of the collaboration.
Under the agreement, either party could terminate the other party’s participation in the collaboration within 30 days after the launch of at least one generic version of such other party’s single agent products (or double agent products). The terminating party then had the right to continue to sell Atripla and become the continuing party, but was obligated to pay the terminated party certain royalties for a three-year period following the effective date of the termination.
In December 2017, a generic version of efavirenz was launched in the United States. Upon the generic version launch, we terminated BMS’s participation in the collaboration and became the continuing party and the sole owner of the joint venture. December 31, 2017 was the last day of the collaboration. As a result of the termination and the transfer to Gilead of BMS’s ownership interest in the joint venture, we consolidate the limited liability company as a wholly-owned subsidiary. BMS no longer has any ownership interest in the joint venture and is not permitted to commercialize Atripla in the United States and Canada, but is entitled to receive from us certain royalties on net sales of Atripla for the next three calendar years, on a declining annual scale. We may continue to purchase efavirenz from BMS as needed to continue manufacturing Atripla for the United States and Canada markets.
The transfer of BMS’s ownership interest in the joint venture to us was accounted for as an equity transaction and we reduced the associated noncontrolling interest to zero to reflect the derecognition of BMS’s ownership interest. The difference between the consideration payable to BMS and the amount of noncontrolling interest was insignificant and recorded as a reduction to additional paid-in-capital (APIC). The associated cash flow effect of the transfer of BMS’s ownership interest has not been reflected as cash used in financing activities on our Consolidated Statements of Cash Flows for the year ended December 31, 2017 as the amount has not been settled.
As of
December 31, 2016
, the joint venture held efavirenz active pharmaceutical ingredient which it purchased from BMS at BMS’s estimated net selling price of efavirenz in the U.S. market. These amounts were primarily included in Inventories
on our Consolidated Balance Sheets at
December 31, 2016
.
Selected financial information for the joint venture was as follows (in millions):
|
December 31, 2016
|
|||
|
Total assets
|
$
|
1,918
|
|
|
Cash and cash equivalents
|
$
|
92
|
|
|
Accounts receivable, net
|
$
|
229
|
|
|
Inventories
|
$
|
1,579
|
|
|
Total liabilities
|
$
|
772
|
|
|
Accounts payable
|
$
|
434
|
|
|
Other accrued liabilities
|
$
|
338
|
|
These asset and liability amounts do not reflect the impact of intercompany eliminations that are included on our Consolidated Balance Sheets. Although we consolidated the joint venture, the legal structure of the joint venture limited the recourse that its creditors could have over our general credit or assets. Similarly, the assets held in the joint venture could be used only to settle obligations of the joint venture.
Europe
In 2007, Gilead Sciences Ireland UC, our wholly-owned subsidiary, and BMS entered into a collaboration agreement which sets forth the terms and conditions under which we and BMS commercialize and distribute Atripla in the European Union, Iceland, Liechtenstein, Norway and Switzerland (collectively, the European Territory). The parties formed a limited liability company which we consolidate, to manufacture Atripla for distribution in the European Territory using efavirenz that it purchases from BMS at BMS’s estimated net selling price of efavirenz in the European Territory. We are responsible for manufacturing, product distribution, inventory management and warehousing. Through our local subsidiaries, we have primary responsibility for order fulfillment, collection of receivables, customer relations and handling of sales returns in all the territories where we and BMS promote Atripla. In general, the parties share revenues and out-of-pocket expenses in proportion to the net selling prices of the components of Atripla, Truvada and efavirenz.
Starting in 2012, except for a limited number of activities that are jointly managed, the parties no longer coordinate detailing and promotional activities in the European Territory. We are responsible for accounting, financial reporting and tax reporting for
83
the collaboration. As of
December 31, 2017
and
2016
, efavirenz purchased from BMS at BMS’s estimated net selling price of efavirenz in the European Territory is included in Inventories on our Consolidated Balance Sheets.
The parties also formed a limited liability company to hold the marketing authorization for Atripla in the European Territory. We have primary responsibility for regulatory activities. In the major market countries, both parties have agreed to independently continue to use commercially reasonable efforts to promote Atripla.
The agreement will terminate upon the expiration of the last-to-expire patent which affords market exclusivity to Atripla or one of its components in the European Territory. In addition, since December 31, 2013, either party may terminate the agreement for any reason and such termination will be effective two calendar quarters after notice of termination. The non-terminating party has the right to continue to sell Atripla and become the continuing party, but will be obligated to pay the terminating party certain royalties for a three-year period following the effective date of the termination. In the event the continuing party decides not to sell Atripla, the effective date of the termination will be the date Atripla is withdrawn in each country or the date on which a third party assumes distribution of Atripla, whichever is earlier.
Japan Tobacco Inc.
In 2005, Japan Tobacco Inc. (Japan Tobacco) granted us exclusive rights to develop and commercialize elvitegravir, a novel HIV integrase inhibitor, in all countries of the world, excluding Japan, where Japan Tobacco retained such rights. Under the agreement, we are responsible for seeking regulatory approval in our territories and are required to use diligent efforts to commercialize elvitegravir for the treatment of HIV infection. We bear all costs and expenses associated with such commercialization efforts.
We received approval of Stribild (an elvitegravir-containing product) from FDA in August 2012 and from the European Commission in May 2013. We received approval of Genvoya (an elvitegravir-containing product) from FDA and the European Commission in November 2015.
The agreement and our obligation to pay royalties to Japan Tobacco will terminate on a product-by-product basis as patents providing exclusivity for the product expire or, if later, on the tenth anniversary of commercial launch for such product. We may terminate the agreement for any reason in which case the license granted by Japan Tobacco to us would terminate. Either party may terminate the agreement in response to a material breach by the other party.
Janssen
In 2009, we entered into a license and collaboration agreement with Janssen Sciences Ireland UC (Janssen), formerly Tibotec Pharmaceuticals, to develop and commercialize a fixed-dose combination of our Truvada and Janssen’s non-nucleoside reverse transcriptase inhibitor, rilpivirine. This combination was approved in the United States and European Union in 2011 and is sold under the brand name Complera in the United States and Eviplera in the European Union. Under this original agreement, Janssen granted us an exclusive license to Complera/Eviplera worldwide excluding certain middle income and developing world countries and Japan.
In 2011 and 2013, we amended the agreement to include distribution of Complera/Eviplera to the rest of the world. In 2014, we amended the agreement to expand the collaboration to include another product containing Janssen’s rilpivirine and our emtricitabine and tenofovir alafenamide (Odefsey). Under the amended agreement, Janssen granted us an exclusive license to Complera/Eviplera and Odefsey worldwide, but retained rights to distribute both combination products in 18 countries including Mexico, Russia and Japan. Neither party is restricted from combining its drugs with any other drug products except those which are similar to the components of Complera/Eviplera and Odefsey.
We are responsible for manufacturing Complera/Eviplera and Odefsey and have the lead role in registration, distribution and commercialization of both products except in the countries where Janssen distributes. Janssen has exercised a right to co-detail the combination product in some of the countries where Gilead is the selling party.
Under the initial agreement, the price of Complera/Eviplera was expected to be the sum of the price of Truvada and the price of rilpivirine purchased separately. The cost of rilpivirine purchased by us from Janssen for Complera/Eviplera was approximately the market price of rilpivirine, less a specified percentage of up to
30%
in major markets. The financial provisions of the 2014 amendment, effective in 2015, enable the selling party to set the price of the combined products and the parties share revenues based on the ratio of the net selling prices of the party’s component(s), subject to certain restrictions and adjustments. We will continue to retain a specified percentage of Janssen’s share of revenues, up to
30%
in major markets.
Either party may terminate the collaboration agreement with respect to a product and a country if the product is withdrawn from the market in such country or with respect to a product in all countries if the other party materially breaches the agreement with respect to a product. The agreement and the parties’ obligation to share revenues will expire on a product-by-product and country-by-country basis as Janssen patents providing exclusivity for the product expire or, if later, on the tenth anniversary of
84
commercial launch for such product. We may terminate the agreement without cause with respect to the countries where we sell the products in which case Janssen has the right to become the selling party for such country if the product has launched but has been on the market for fewer than 10 years.
Galapagos
In 2016, we closed on a license and collaboration agreement with Galapagos, a clinical-stage biotechnology company based in Belgium, for the development and commercialization of filgotinib, a JAK1-selective inhibitor being evaluated for inflammatory disease indications.
Upon closing of the license and collaboration agreement, we made an up-front license fee payment of
$300 million
and a
$425 million
equity investment in Galapagos by subscribing for new shares at a price of
€58
per share, including issuance premium. As a result, we received
6.8 million
new shares of Galapagos, representing
14.75%
of their outstanding share capital at the closing of the license and collaboration agreement. The license fee payment of
$300 million
and the issuance premium on the equity investment of
$68 million
were recorded within Research and development expenses on our Consolidated Statements of Income. The equity investment, net of issuance premium, was recorded as an available-for-sale security in Other long-term assets on our Consolidated Balance Sheets at the closing of the license and collaboration agreement and at December 31, 2016. As of December 31, 2017, this investment was recorded in Prepaid and other current assets on our Consolidated Balance Sheets.
Galapagos is eligible to receive from us development and regulatory milestone-based payments of up to
$755 million
, sales-based milestone payments of up to
$600 million
, plus tiered royalties on global net sales ranging from
20%
to
30%
, with the exception of certain co-promotion territories where profits would be shared equally. During 2016, based on the achievement of certain clinical development milestones, we recorded a
$60 million
expense within Research and development expenses on our Consolidated Statements of Income.
Under the terms of the agreement, we have an exclusive, worldwide, royalty-bearing, sublicensable license for filgotinib and products containing filgotinib. We are primarily responsible for development and seeking regulatory approval related to filgotinib. We are responsible for
80%
and Galapagos is responsible for
20%
of the development costs incurred. We are also responsible for the manufacturing and commercialization activities. In 2017, Galapagos exercised its option to co-promote filgotinib in certain territories, and in these territories we and Galapagos will share profits equally.
85
|
11
.
|
|
The following table summarizes the carrying amount of our borrowings under various financing arrangements (in millions):
|
December 31,
|
||||||||||||||
|
Type of Borrowing
|
Issue Date
|
Due Date
|
Interest Rate
|
2017
|
2016
|
|||||||||
|
Senior Unsecured
|
September 2015
|
September 2018
|
1.85%
|
$
|
999
|
|
$
|
998
|
|
|||||
|
Senior Unsecured
|
September 2017
|
September 2018
|
3-month LIBOR + 0.17%
|
749
|
|
—
|
|
|||||||
|
Term Loan
|
October 2017
|
October 2018
|
Variable
|
999
|
|
—
|
|
|||||||
|
Senior Unsecured
|
September 2017
|
March 2019
|
3-month LIBOR + 0.22%
|
748
|
|
—
|
|
|||||||
|
Senior Unsecured
|
March 2014
|
April 2019
|
2.05%
|
499
|
|
499
|
|
|||||||
|
Term Loan
|
May 2016
|
May 2019
|
Variable
|
—
|
|
311
|
|
|||||||
|
Senior Unsecured
|
September 2017
|
September 2019
|
1.85%
|
997
|
|
—
|
|
|||||||
|
Senior Unsecured
|
September 2017
|
September 2019
|
3-month LIBOR + 0.25%
|
499
|
|
—
|
|
|||||||
|
Senior Unsecured
|
November 2014
|
February 2020
|
2.35%
|
499
|
|
498
|
|
|||||||
|
Senior Unsecured
|
September 2015
|
September 2020
|
2.55%
|
1,994
|
|
1,991
|
|
|||||||
|
Term Loan
|
October 2017
|
October 2020
|
Variable
|
998
|
|
—
|
|
|||||||
|
Senior Unsecured
|
March 2011
|
April 2021
|
4.50%
|
995
|
|
994
|
|
|||||||
|
Senior Unsecured
|
December 2011
|
December 2021
|
4.40%
|
1,246
|
|
1,245
|
|
|||||||
|
Senior Unsecured
|
September 2016
|
March 2022
|
1.95%
|
497
|
|
497
|
|
|||||||
|
Senior Unsecured
|
September 2015
|
September 2022
|
3.25%
|
996
|
|
995
|
|
|||||||
|
Term Loan
|
October 2017
|
October 2022
|
Variable
|
2,497
|
|
—
|
|
|||||||
|
Senior Unsecured
|
September 2016
|
September 2023
|
2.50%
|
745
|
|
744
|
|
|||||||
|
Senior Unsecured
|
March 2014
|
April 2024
|
3.70%
|
1,742
|
|
1,741
|
|
|||||||
|
Senior Unsecured
|
November 2014
|
February 2025
|
3.50%
|
1,744
|
|
1,743
|
|
|||||||
|
Senior Unsecured
|
September 2015
|
March 2026
|
3.65%
|
2,729
|
|
2,726
|
|
|||||||
|
Senior Unsecured
|
September 2016
|
March 2027
|
2.95%
|
1,244
|
|
1,243
|
|
|||||||
|
Senior Unsecured
|
September 2015
|
September 2035
|
4.60%
|
990
|
|
989
|
|
|||||||
|
Senior Unsecured
|
September 2016
|
September 2036
|
4.00%
|
740
|
|
739
|
|
|||||||
|
Senior Unsecured
|
December 2011
|
December 2041
|
5.65%
|
995
|
|
995
|
|
|||||||
|
Senior Unsecured
|
March 2014
|
April 2044
|
4.80%
|
1,733
|
|
1,732
|
|
|||||||
|
Senior Unsecured
|
November 2014
|
February 2045
|
4.50%
|
1,730
|
|
1,729
|
|
|||||||
|
Senior Unsecured
|
September 2015
|
March 2046
|
4.75%
|
2,215
|
|
2,214
|
|
|||||||
|
Senior Unsecured
|
September 2016
|
March 2047
|
4.15%
|
1,723
|
|
1,723
|
|
|||||||
|
Total debt, net
|
33,542
|
|
26,346
|
|
||||||||||
|
Less current portion
|
2,747
|
|
—
|
|
||||||||||
|
Total long-term debt, net
|
$
|
30,795
|
|
$
|
26,346
|
|
||||||||
Senior Unsecured Notes
In 2017, in connection with our acquisition of Kite, we issued
$3.0 billion
aggregate principal amount of senior unsecured notes in a registered offering consisting of
$750 million
principal amount of floating rate notes due September 2018,
$750 million
principal amount of floating rate notes due March 2019, and
$500 million
principal amount of floating rate notes due September 2019 (collectively, the Floating Rate Notes) and
$1.0 billion
principal amount of
1.85%
senior notes due September 2019 (the Fixed Rate Notes and, collectively with the Floating Rate Notes, the 2017 Notes), the terms of which are summarized in the table above.
In 2016, we issued
$5.0 billion
aggregate principal amount of senior unsecured notes (the 2016 Notes) in a registered offering.
We collectively refer to the 2017 Notes, 2016 Notes, and our senior unsecured notes issued in September 2015 (the 2015 Notes), in March and November 2014 (the 2014 Notes) and in March and December 2011 (the 2011 Notes) as our Senior Notes.
86
Our Senior Notes, except for the Floating Rate Notes, may be redeemed at our option at a redemption price equal to the greater of (i)
100%
of the principal amount of the notes to be redeemed and (ii) the sum, as determined by an independent investment banker, of the present values of the remaining scheduled payments of principal and interest on the notes to be redeemed (exclusive of interest accrued to the date of redemption) discounted to the redemption date on a semiannual basis at the Treasury Rate, plus a make-whole premium as defined in the indenture. Our Senior Notes maturing after 2020 also have a call feature, exercisable at our option, to redeem the notes at par in whole or in part one to six months immediately preceding maturity. In each case, accrued and unpaid interest is also required to be redeemed to the date of redemption. We do not have the option to redeem any series of the Floating Rate Notes, in whole or in part, prior to the maturity date. In 2016, we repaid at maturity
$700 million
of principal balance related to the 2011 Notes.
In the event of the occurrence of a change in control and a downgrade in the rating of our Senior Notes below investment grade by Moody’s Investors Service, Inc. and S&P Global Ratings, the holders may require us to purchase all or a portion of their notes at a price equal to
101%
of the aggregate principal amount of the notes repurchased, plus accrued and unpaid interest to the date of repurchase. We are required to comply with certain covenants under our Senior Notes and as of
December 31, 2017
and
2016
, we were not in violation of any covenants.
We recognized
$1.0 billion
in
2017
,
$907 million
in
2016
, and
$605 million
in
2015
of interest expense on our Senior Notes related to the contractual coupon rates and amortization of the debt discount and issuance costs.
Term Loan Facilities
In September 2017, we entered into a
$6.0 billion
aggregate principal amount term loan facility credit agreement consisting of a
$1.0 billion
principal amount 364-day senior unsecured term loan facility, a
$2.5 billion
principal amount three-year senior unsecured term loan facility and a
$2.5 billion
principal amount five-year senior unsecured term loan facility (collectively, the Term Loan Facilities). In October 2017, we drew
$6.0 billion
principal amount on the Term Loan Facilities and used the proceeds to finance our acquisition of Kite.
The Term Loan Facilities bear interest at floating rates based on LIBOR plus an applicable margin which will vary based on our debt ratings from Fitch Ratings, Inc., Moody’s Investors Service, Inc. and S&P Global Ratings. The 364-day senior unsecured term loan facility and three-year senior unsecured term loan facility will be due and payable at maturity. The five-year senior unsecured term loan facility will be payable in quarterly amounts equal to
2.5%
of the initial principal amount of the five-year senior unsecured term loan facility on each fiscal quarter end date after the second anniversary of the closing date, with any remaining balance due and payable at maturity. We may prepay loans under the Term Loan Facilities in whole or in part at any time without premium or penalty. The Term Loan Facilities contain customary representations, warranties, affirmative, negative and financial maintenance covenants and events of default. As of
December 31, 2017
, we were not in violation of any covenants.
In 2017, we repaid
$1.5 billion
of principal balance related to the three-year senior unsecured term loan facility and
$311 million
of our term loan facility issued in May 2016.
Cash Bridge Facility
In August 2017, we entered into a
$9 billion
principal amount 90-day senior unsecured term loan facility (the Cash Bridge Facility). The Cash Bridge Facility was terminated as a result of our issuance of the 2017 Notes and entering into the Term Loan Facilities in September 2017.
No
amounts were drawn under the Cash Bridge Facility.
Convertible Senior Notes
In July 2010, we issued
$1.3 billion
of Convertible Notes at par in a private placement. Concurrent with the issuance of the Convertible Notes, we purchased convertible note hedges and sold warrants in private transactions. In 2015 and 2016, portions of the Convertible Notes were converted and on May 1, 2016, the remainder matured. In 2016, we repaid an aggregate principal balance of
$285 million
, paid
$956 million
in cash related to the conversion spread of the Convertible Notes, which represented the conversion value in excess of the principal amount, received
$956 million
in cash from our convertible note hedges related to the Convertible Notes, and paid
$469 million
to settle the warrants as the average market price of our common stock exceeded the warrants’ exercise price.
Credit Facilities
In 2016, we terminated our
five
-year
$1.3 billion
revolving credit facility and entered into a
$2.5 billion
five
-year revolving credit facility agreement maturing in May 2021 (the Five-Year Revolving Credit Agreement). The revolving credit facility can be used for working capital requirements and for general corporate purposes, including, without limitation, acquisitions. As of
December 31, 2017
and
2016
, there were
no
amounts outstanding under the Five-Year Revolving Credit Agreement.
The Five-Year Revolving Credit Agreement contains customary representations, warranties, affirmative and negative covenants and events of default. At
December 31, 2017
, we were not in violation of any covenants. Loans under the Five-Year
87
Revolving Credit Agreement bear interest at either (i) the Eurodollar Rate plus the Applicable Percentage, or (ii) the Base Rate plus the Applicable Percentage, each as defined in the Five-Year Revolving Credit Agreement. We may terminate or reduce the commitments, and may prepay any loans under the Five-Year Revolving Credit Agreement in whole or in part at any time without premium or penalty.
Contractual Maturities of Financing Obligations
As of
December 31, 2017
, the aggregate future principal maturities of financing obligations for each of the next five years, based on contractual due dates, are as follows (in millions):
|
2018
|
2019
|
2020
|
2021
|
2022
|
||||||||||||||||
|
Contractual Maturities
|
$
|
2,750
|
|
$
|
2,812
|
|
$
|
3,750
|
|
$
|
2,500
|
|
$
|
3,438
|
|
|||||
|
12
.
|
COMMITMENTS AND CONTINGENCIES
|
Lease Arrangements
We lease facilities and equipment related primarily to administrative, R&D, sales and marketing activities under various long-term non-cancelable operating leases in the United States and international markets. Our leases expire on various dates between 2018 and 2068, with many of our leases containing options to renew. Lease expense under our operating leases was
$84 million
in
2017
,
$81 million
in
2016
and
$78 million
in
2015
.
Aggregate non-cancelable future minimum rental payments under operating leases are as follows (in millions):
|
2018
|
$
|
77
|
|
|
2019
|
71
|
|
|
|
2020
|
61
|
|
|
|
2021
|
49
|
|
|
|
2022
|
46
|
|
|
|
Thereafter
|
215
|
|
|
|
Total
|
$
|
519
|
|
Legal Proceedings
We are a party to various legal actions. The most significant of these are described below. We recognize accruals for such actions to the extent that we conclude that a loss is both probable and reasonably estimable. We accrue for the best estimate of a loss within a range; however, if no estimate in the range is better than any other, then we accrue the minimum amount in the range. If we determine that a loss is reasonably possible and the loss or range of loss can be estimated, we disclose the possible loss. Unless otherwise noted, it is not possible to determine the outcome of these matters, and we cannot reasonably estimate the maximum potential exposure or the range of possible loss.
We did not recognize any accruals for litigation on our Consolidated Balance Sheets as of
December 31, 2017
and December 31, 2016, as we did not believe losses were probable.
Litigation Related to Sofosbuvir
In January 2012, we acquired Pharmasset, Inc. (Pharmasset). Through the acquisition, we acquired sofosbuvir, a nucleotide analog that acts to inhibit the replication of the hepatitis C virus (HCV). In December 2013, we received approval from FDA for sofosbuvir, now known commercially as Sovaldi. Sofosbuvir is also included in all of our marketed HCV products. We have received a number of contractual and intellectual property claims regarding sofosbuvir. While we have carefully considered these claims both prior to and following the acquisition and believe they are without merit, we cannot predict the ultimate outcome of such claims or range of loss, except where stated otherwise herein.
We are aware of patents and patent applications owned by third parties that have been or may in the future be alleged by such parties to cover the use of our HCV products. If third parties obtain valid and enforceable patents, and successfully prove infringement of those patents by our HCV products, we could be required to pay significant monetary damages. We cannot predict the ultimate outcome of intellectual property claims related to our HCV products. We have spent, and will continue to spend, significant resources defending against these claims.
88
Interference Proceedings and Litigation with Idenix Pharmaceuticals, Inc. (Idenix), Universita Degli Studi di Cagliari (UDSG), Centre National de la Recherche Scientifique and L‘Universite Montpellier II
In February 2012, we received notice that the U.S. Patent and Trademark Office (USPTO) had declared Interference No. 105,871 (First Idenix Interference) between our U.S. Patent No. 7,429,572 (the ‘572 patent) and Idenix’s pending U.S. Patent Application No. 12/131,868 to determine who was the first to invent certain nucleoside compounds. In January 2014, the USPTO Patent Trial and Appeal Board (PTAB) determined that Pharmasset and not Idenix was the first to invent the compounds. Idenix was acquired by Merck & Co. Inc. (Merck) in August 2014. Idenix has appealed the PTAB’s decisions to the U.S. District Court for the District of Delaware, which has stayed that appeal pending the outcome of the appeal of the interference involving Idenix’s U.S. Patent No. 7,608,600 (the ‘600 patent) as described below. In light of the decision in the Second Idenix Interference in our favor (as described below), we believe that the District Court will dismiss the First Idenix Interference with prejudice or enter judgment against Idenix and in our favor.
In December 2013, after receiving our request to do so, the USPTO declared Interference No. 105,981 (Second Idenix Interference) between our pending U.S. Patent Application No. 11/854,218 and Idenix’s ‘600 patent. The ‘600 patent includes claims directed to methods of treating HCV with nucleoside compounds. In March 2015, the PTAB determined that Pharmasset and not Idenix was the first to invent the claimed methods of treating HCV. Idenix appealed this decision in both the U.S. District Court for the District of Delaware and the U.S. Court of Appeals for the Federal Circuit (CAFC). The CAFC heard oral arguments in September 2016 and affirmed the PTAB decision in June 2017. In November 2017, the CAFC denied Idenix’s petition for a rehearing. Idenix may file further petitions in the United States Supreme Court. We filed a motion to dismiss the appeal in Delaware, which was granted. Idenix appealed the dismissal to the CAFC, and that court has stayed this other appeal pending a decision in the Second Idenix Interference. We believe that the appeal from the Delaware dismissal should be dismissed in light of the recent decision of the CAFC affirming the PTAB’s prior decision in the Second Idenix Interference that Idenix is not entitled to its patent.
We believe that the Idenix claims involved in the First and Second Idenix Interferences, and similar U.S. and foreign patents claiming the same compounds, metabolites and uses thereof, are invalid. As a result, we filed an Impeachment Action in the Federal Court of Canada to invalidate Idenix Canadian Patent No. 2,490,191 (the ‘191 patent), which is the Canadian patent that corresponds to the ‘600 patent. Idenix asserted that the commercialization of Sovaldi in Canada will infringe its ‘191 patent and that our Canadian Patent No. 2,527,657, corresponding to our ‘572 patent, is invalid. In November 2015, the Canadian court held that Idenix’s patent is invalid and that our patent is valid. Idenix appealed the decision to the Canadian Federal Court of Appeal in November 2015. In July 2017, the Canadian Federal Appeal Court affirmed the lower court’s decision in our favor. In September 2017, Idenix appealed the decision to the Supreme Court of Canada.
In January 2013, we filed a legal action in the Federal Court of Australia seeking to invalidate Idenix’s Australian patent corresponding to the ‘600 patent. In April 2013, Idenix asserted that the commercialization of Sovaldi in Australia infringes its Australian patent corresponding to the ‘600 patent. In March 2016, the Australian court revoked Idenix’s Australian patent. Idenix appealed this decision, and in December 2017, the Federal Court of Australia dismissed Idenix’s appeal. In January 2018, Idenix applied for Special Leave to Appeal to the High Court of Australia.
In March 2014, the European Patent Office (EPO) granted Idenix European Patent No. 1 523 489 (the ‘489 patent), which corresponds to the ‘600 patent. The same day that the ‘489 patent was granted, we filed an opposition with the EPO seeking to revoke the ‘489 patent. An opposition hearing was held in February 2016, and the EPO ruled in our favor and revoked the ‘489 patent. Idenix has appealed. In March 2014, Idenix also initiated infringement proceedings against us in the United Kingdom (UK), Germany and France alleging that the commercialization of Sovaldi would infringe the UK, German and French counterparts of the ‘489 patent. A trial was held in the UK in October 2014. In December 2014, the High Court of Justice of England and Wales (UK Court) invalidated all challenged claims of the ‘489 patent on multiple grounds. Idenix appealed. In November 2016, the appeals court affirmed the UK Court’s decision invalidating Idenix’s patent, and in April 2017, the UK Supreme Court refused Idenix’s application for permission to appeal. In March 2015, the German court in Düsseldorf determined that the Idenix patent was highly likely to be invalid and stayed the infringement proceedings pending the outcome of the opposition hearing held by the EPO in February 2016. Idenix has not appealed this decision of the German court staying the proceedings. Upon Idenix’s request, the French proceedings have been stayed.
In December 2013, Idenix, UDSG, Centre National de la Recherche Scientifique and L’Université Montpellier II sued us in U.S. District Court for the District of Delaware alleging that the commercialization of sofosbuvir will infringe the ‘600 patent and that an interference exists between the ‘600 patent and our U.S. Patent No. 8,415,322. Also in December 2013, Idenix and UDSG sued us in the U.S. District Court for the District of Massachusetts alleging that the commercialization of sofosbuvir will infringe U.S. Patent Nos. 6,914,054 (the ‘054 patent) and 7,608,597 (the ‘597 patent). In June 2014, the court transferred the Massachusetts litigation to the U.S. District Court for the District of Delaware.
Prior to trial in December 2016, Idenix committed to give us a covenant not to sue with respect to any claims arising out of the ‘054 patent related to sofosbuvir and withdrew that patent from the trial. In addition, Idenix declined to litigate the ‘600 patent infringement action at trial in light of the appeal then pending at the CAFC regarding who was the first to invent the subject matter claimed in the ‘600 patent. In January 2017, the District Court stayed Idenix’s infringement claim on the ‘600 patent pending the
89
outcome of the appeal of the Second Idenix Interference. Unless Idenix is successful in persuading the United States Supreme Court to consider a further appeal to challenge the Federal Circuit’s June 2017 decision in our favor in the Second Idenix Interference, we will ask for dismissal of, or for judgment to be entered against Idenix on, the ‘600 infringement and interference claims. A jury trial was held in December 2016 on the remaining ‘597 patent. In December 2016, the jury found that we willfully infringed the asserted claims of the ‘597 patent and awarded Idenix
$2.54 billion
in past damages. The parties filed post-trial motions and briefings, and the district judge heard oral arguments in September 2017. In September 2017, the judge denied Idenix’s motion for enhanced damages and attorney’s fees. In February 2018, the judge granted our motion arguing that the ‘597 patent is invalid for lacking enablement. The grant of our motion invalidating Idenix’s ‘597 patent vacates the jury’s award of
$2.54 billion
in past damages. Idenix has indicated it plans to appeal this decision to the CAFC. We believe the court’s decision correctly found that, as a matter of law, the ‘597 patent is invalid, and we remain confident in the merits of our case on appeal. We believe that the possibility of a material adverse outcome on this matter is remote.
Litigation with Merck
In August 2013, Merck contacted us requesting that we pay royalties on the sales of sofosbuvir and obtain a license to U.S. Patent No. 7,105,499 (the ‘499 patent) and U.S. Patent No. 8,481,712 (the ‘712 patent), which it co-owns with Ionis Pharmaceuticals, Inc. The ‘499 and ‘712 patents cover compounds which do not include, but may relate to, sofosbuvir. We filed a lawsuit in August 2013 in the U.S. District Court for the Northern District of California seeking a declaratory judgment that the Merck patents are invalid and not infringed. During patent prosecution, Merck amended its patent application in an attempt to cover compounds related to sofosbuvir. Initially, in March 2016, a jury determined that we had not established that Merck’s patents are invalid for lack of written description or lack of enablement and awarded Merck
$200 million
in damages. However, in June 2016, the court ruled in our favor on our defense of unclean hands and determined that Merck may not recover any damages from us for the ‘499 and ‘712 patents. The judge has determined that Merck is required to pay our attorney’s fees due to the exceptional nature of this case. In July 2017, the court issued a decision setting the amount of attorney fees awarded to us.
Merck has filed notices of appeal to the CAFC regarding the court’s decision on our defense of unclean hands and its award of attorney’s fees. We appealed the issue relating to the invalidity of Merck’s patent. The CAFC heard oral arguments in February 2018. If the decision on our defense of unclean hands is reversed on appeal and Merck’s patent is upheld, we may be required to pay damages and a royalty on sales of sofosbuvir-containing products following the appeal. In that event, the judge has indicated that she will determine the amount of the royalty, if necessary, at the conclusion of any appeal in this case.
Litigation with the University of Minnesota
The University of Minnesota (the University) has obtained Patent No. 8,815,830 (the ‘830 patent), which purports to broadly cover nucleosides with antiviral and anticancer activity. In August 2016, the University filed a lawsuit against us in the U.S. District Court for the District of Minnesota, alleging that the commercialization of sofosbuvir-containing products infringes the ‘830 patent. We believe that the ‘830 patent is invalid and will not be infringed by the continued commercialization of sofosbuvir. In October 2017, the court granted our motion to transfer the case to California. We have also filed four petitions for inter partes review in the USPTO alleging that all asserted claims are invalid for anticipation and obviousness.
Petitions for Inter Partes Review filed by Initiative for Medicines, Access & Knowledge
In October 2017, we received notice that Initiative for Medicines, Access & Knowledge (I-MAK) submitted multiple petitions requesting inter partes review to the PTAB alleging that certain patents associated with sofosbuvir are invalid as either not novel or obvious. We strongly believe I-MAK’s petitions are without merit and that sofosbuvir, the only approved HCV drug of its kind, is both novel and not obvious. Accordingly, we will defend against these allegations. If the PTAB decides to initiate one or more inter partes reviews, a decision would be expected about a year later. Either party can appeal the PTAB’s decision to the CAFC.
European Patent Claims
In February 2015, several parties filed oppositions in the EPO requesting revocation of one of our granted European patents covering sofosbuvir that expires in 2028. In October 2016, the EPO upheld the validity of certain claims of our sofosbuvir patent. We have appealed this decision, seeking to restore all of the original claims, and several of the original opposing parties have also appealed, requesting full revocation. The appeal process may take several years.
In April 2017, several parties filed oppositions in the EPO requesting revocation of our granted European patent relating to sofosbuvir that expires in 2024.
In January 2016, several parties filed oppositions in the EPO requesting revocation of our granted European patent covering tenofovir alafenamide (TAF) that expires in 2021. In July 2017, the EPO upheld the validity of the claims of our TAF patent. We are awaiting a written decision from the EPO. The parties that filed the oppositions may appeal this decision. The appeal process may take several years.
90
In July 2017, several parties filed oppositions in the EPO requesting revocation of our granted European patent relating to TAF hemifumarate that expires in 2032.
In March 2016, three parties filed oppositions in the EPO requesting revocation of our granted European patent covering cobicistat that expires in 2027. In December 2017, the EPO upheld the validity of the claims of our cobicistat patent. The parties that filed the oppositions may appeal this decision. The appeal process may take several years.
While we are confident in the strength of our patents, we cannot predict the ultimate outcome of these oppositions. If we are unsuccessful in defending these oppositions, some or all of our patent claims may be narrowed or revoked and the patent protection for sofosbuvir, TAF and cobicistat in the European Union could be substantially shortened or eliminated entirely. If our patents are revoked, and no other European patents are granted covering these compounds, our exclusivity may be based entirely on regulatory exclusivity granted by the European Medicines Agency. Sovaldi has been granted regulatory exclusivity that will prevent generic sofosbuvir from entering the European Union for 10 years following approval of Sovaldi, or January 2024. If we lose patent protection for sofosbuvir prior to 2028, our revenues and results of operations could be negatively impacted for the years including and succeeding the year in which such exclusivity is lost, which may cause our stock price to decline.
Litigation Related to Axicabtagene Ciloleucel
In October 2017, we acquired Kite, which is now our wholly-owned subsidiary. Through the acquisition, we acquired axicabtagene ciloleucel, a CAR T cell therapy. In October 2017, we received approval from FDA for axicabtagene ciloleucel, now known commercially as Yescarta.
We own patents and patent applications that claim axicabtagene ciloleucel chimeric DNA segments. Third parties may have, or may obtain rights to, patents that allegedly could be used to prevent or attempt to prevent us from commercializing axicabtagene ciloleucel or to require us to obtain a license in order to commercialize axicabtagene ciloleucel. For example, we are aware that Juno Therapeutics, Inc. (Juno) has exclusively licensed Patent No. 7,446,190 (the ‘190 patent), which was issued to Sloan Kettering Cancer Center. In September 2017, Juno and Sloan Kettering Cancer Center filed a lawsuit against Kite in the U.S. District Court for the Central District of California, alleging that the commercialization of axicabtagene ciloleucel infringes the ‘190 patent. In October 2017, following FDA approval for Yescarta, Juno filed a second complaint alleging that axicabtagene ciloleucel infringes the ‘190 patent. Juno subsequently moved to dismiss the September 2017 complaint and has maintained the October 2017 complaint.
In August 2015, Kite filed a petition for inter partes review in the USPTO alleging that the asserted claims of the ‘190 patent are invalid as obvious. In December 2016, the PTAB determined that the claims of the ‘190 patent are not invalid due to obviousness. In February 2017, Kite filed a Notice of Appeal to the CAFC. That appeal is currently pending.
We cannot predict the ultimate outcome of intellectual property claims related to axicabtagene ciloleucel. If Juno’s patent is upheld as valid and Juno successfully proves infringement of that patent by axicabtagene ciloleucel, we could be prevented from selling Yescarta unless we were able to obtain a license to this patent. Such a license may not be available on commercially reasonable terms or at all.
Litigation Related to Bictegravir
In February 2018, ViiV Healthcare Company (ViiV) filed a lawsuit against us in the U.S. District Court of Delaware, alleging that the commercialization of bictegravir, now known commercially as Biktarvy, infringes ViiV’s U.S. Patent No. 8,129,385 (the ‘385 patent), which was issued to Shinogi & Co. Ltd. & GlaxoSmithKline LLC. The ‘385 patent is the compound patent covering ViiV’s dolutegravir. Bictegravir is structurally different from dolutegravir, and we believe that bictegravir does not infringe the claims of the ‘385 patent. To the extent that ViiV’s patent claims are interpreted to cover bictegravir, we believe those claims are invalid. The USPTO has granted us patents covering bictegravir.
In February 2018, ViiV also filed a lawsuit against us in the Federal Court of Canada, alleging that our activities relating to our bictegravir product have infringed ViiV’s Canadian Patent No. 2,606,282 (the ‘282 patent), which was issued to Shinogi & Co. Ltd. and ViiV. The ‘282 patent is the compound patent covering ViiV’s dolutegravir. We believe that bictegravir does not infringe the claims of the ‘282 patent. To the extent that ViiV’s patent claims are interpreted to cover bictegravir, we believe those claims are invalid.
We cannot predict the ultimate outcome of intellectual property claims related to bictegravir. If ViiV’s patents are upheld as valid and ViiV successfully proves infringement of those patents by bictegravir, we could be required by pay significant monetary damages.
Litigation with Generic Manufacturers
As part of the approval process for some of our products, FDA granted us a New Chemical Entity (NCE) exclusivity period during which other manufacturers’ applications for approval of generic versions of our product will not be approved. Generic manufacturers may challenge the patents protecting products that have been granted NCE exclusivity one year prior to the end of
91
the NCE exclusivity period. Generic manufacturers have sought and may continue to seek FDA approval for a similar or identical drug through an abbreviated new drug application (ANDA), the application form typically used by manufacturers seeking approval of a generic drug. The sale of generic versions of our products earlier than their patent expiration would have a significant negative effect on our revenues and results of operations. To seek approval for a generic version of a product having NCE status, a generic company may submit its ANDA to FDA four years after the branded product’s approval.
Current legal proceedings of significance with generic manufacturers include:
HIV Products
In February 2016, we received notice that Mylan Pharmaceuticals, Inc. (Mylan) submitted an ANDA to FDA requesting permission to manufacture and market a generic version of Tybost (cobicistat). In the notice, Mylan alleges that the patent covering cobicistat is invalid as obvious and that Mylan’s generic product cannot infringe an invalid claim. In March 2016, we filed lawsuits against Mylan in the U.S. District Court for the District of Delaware and U.S. District Court for the Northern District of West Virginia. The parties have agreed to dismiss the action in West Virginia, and the trial in Delaware was stayed. The patent in suit that covers Tybost is also listed in the Orange Book for Stribild and Genvoya. In November 2017, we received notice that Mylan submitted an ANDA to FDA requesting permission to manufacture and market a generic version of Evotaz (atazanavir/cobicistat) and challenging the validity of our cobicistat compound patent, citing the arguments it has made in the ongoing litigation involving Tybost. In December 2017, we filed a lawsuit against Mylan in the U.S. District Court for the Northern District of West Virginia.
In May 2017, we received notice that Amneal Pharmaceuticals LLC (Amneal) submitted an ANDA to FDA requesting permission to manufacture and market a generic version of Truvada at low dosage strengths. In the notice, Amneal alleges that two patents associated with emtricitabine are invalid, unenforceable and/or will not be infringed by Amneal’s manufacture, use or sale of generic versions of Truvada at low dosage strengths. In July 2017, we filed a lawsuit against Amneal in the U.S. District Court for the District of Delaware for infringement of our patents.
In June 2017, we received notice that Macleods Pharmaceuticals Ltd. (Macleods) submitted ANDAs to FDA requesting permission to manufacture and market generic versions of Truvada and Atripla. In the notices, Macleods alleges that two patents associated with emtricitabine, three patents associated with the emtricitabine and tenofovir disoproxil fumarate (TDF) fixed-dose combination and three patents associated with the emtricitabine, TDF and efavirenz fixed-dose combination are invalid, unenforceable and/or will not be infringed by Macleods’ manufacture, use or sale of generic versions of Truvada or Atripla. In July 2017, we filed a lawsuit against Macleods in the U.S. District Court for the District of Delaware for infringement of these patents. In December 2017, we reached an agreement with Macleods to resolve the lawsuit. The settlement agreement has been filed with the Federal Trade Commission and Department of Justice as required by law.
HCV Products
In February 2018, we received notices from Natco Pharma Limited (Natco) and Teva Pharmaceuticals (Teva) that they have each submitted an ANDA to FDA requesting permission to manufacture and market a generic version of Sovaldi. In Teva’s notice, it alleges that nine patents associated with sofosbuvir are invalid, unenforceable and/or will not be infringed by Teva’s manufacture, use or sale of generic versions of Sovaldi. In Natco’s notice, it alleges that two patents associated with sofosbuvir are invalid, unenforceable and/or will not be infringed by Natco’s manufacture, use or sale of generic versions of Sovaldi. Natco did not challenge all patents listed on the Orange Book for Sovaldi. We are evaluating the notice letters and determining next steps.
TAF Litigation
In January 2016, AIDS Healthcare Foundation, Inc. (AHF) filed a complaint with the U.S. District Court for the Northern District of California against Gilead, Japan Tobacco, Inc. and Japan Tobacco International, U.S.A. (together, JT), and Emory University (Emory). In April 2016, AHF amended its complaint to add Janssen and Johnson & Johnson Inc. (J&J) as defendants. AHF claims that U.S. Patent Nos. 7,390,791; 7,800,788; 8,754,065; 8,148,374; and 8,633,219 are invalid. In addition, AHF claims that Gilead, independently and together with JT, Akros, Janssen and J&J, is violating federal and state antitrust and unfair competition laws in the market for sales of TAF by offering TAF as part of a fixed-dose combination product with elvitegravir, cobicistat and emtricitabine (Genvoya), a fixed-dose combination product with elvitegravir and rilpivirine (Odefsey) and in a fixed-dosed combination product with elvitegravir (Descovy). AHF sought a declaratory judgment of invalidity against each of the patents as well as monetary damages. In May 2016, we, JT, Janssen and J&J filed motions to dismiss all of AHF’s claims, which AHF opposed. In June 2016, a hearing was held on the motions to dismiss. In July 2016, the judge granted our and the other defendants’ motions and dismissed all of AHF’s claims. AHF subsequently appealed the court’s decision dismissing the challenge to the validity of our TAF patents. The appeal hearing was held in June 2017, and we are awaiting a decision.
92
Government Investigations and Related Litigation
In June 2011, we received a subpoena from the U.S. Attorney’s Office for the Northern District of California requesting documents related to the manufacture, and related quality and distribution practices, of Complera, Atripla, Truvada, Viread, Emtriva, Hepsera and Letairis. We cooperated with the government’s inquiry. In April 2014, the U.S. Department of Justice informed us that, following an investigation, it declined to intervene in a False Claims Act lawsuit filed by two former employees. In April 2014, the former employees served a First Amended Complaint. In January 2015, the federal district court issued an order granting in its entirety, without prejudice, our motion to dismiss the First Amended Complaint. In February 2015, the plaintiffs filed a Second Amended Complaint and in June 2015, the federal district court issued an order granting our motion to dismiss the Second Amended Complaint. In July 2015, the plaintiffs filed a notice of appeal in the U.S. Court of Appeals for the Ninth Circuit. In July 2017, a three-judge panel of the Ninth Circuit reversed and remanded the case back to the U.S. District Court for the Northern District of California. In October 2017, the Ninth Circuit granted our motion to stay the case pending an appeal to the Supreme Court of the United States. In December 2017, we filed a Petition for a Writ of Certiorari to the Supreme Court. We expect the Supreme Court to decide whether it will hear the case later this year.
In February 2016, we received a subpoena from the U.S. Attorney’s Office for the District of Massachusetts requesting documents related to our support of 501(c)(3) organizations that provide financial assistance to patients and documents concerning our provision of financial assistance to patients for our HCV products. We are cooperating with this inquiry. In October 2017, we received a subpoena from the U.S. Attorney’s Office for the District of Massachusetts requesting documents related to our copay coupon program and Medicaid price reporting methodology. We are cooperating with this inquiry.
In September 2017, we received a voluntary request for information from the U.S. Attorney’s Office for the Eastern District of Pennsylvania requesting information related to our reimbursement support offerings, clinical education programs and interactions with specialty pharmacies for Sovaldi and Harvoni. We are cooperating with this voluntary request.
In October 2017, we received a subpoena from the California Department of Insurance and the Alameda County District Attorney’s Office requesting documents related to our marketing activities, reimbursement support offerings, clinical education programs and interactions with specialty pharmacies. We are cooperating with this inquiry.
In November 2017, Health Choice Advocates LLC served us with a complaint in the United States District Court for the Eastern District of Texas alleging violations of the False Claims Act and similar state statutes through our marketing activities, reimbursement support offerings and clinical education programs for Sovaldi and Harvoni. The lawsuit was unsealed after the United States and 31 plaintiff-states declined to intervene in the action. We are evaluating our next steps.
In November 2017, we received a subpoena from the U.S. Department of Health and Human Services requesting documents related to our Frontlines of Communities in the United States (FOCUS) program. We are cooperating with this inquiry.
In November 2017, we also received a subpoena from the U.S. Attorney’s Office for the Southern District of New York requesting documents related to our promotional speaker programs for HIV. We are cooperating with this inquiry.
Other Matters
We are a party to various legal actions that arose in the ordinary course of our business. We do not believe that these other legal actions will have a material adverse impact on our consolidated business, financial position or results of operations.
Other Commitments
In the normal course of business, we enter into various firm purchase commitments primarily related to active pharmaceutical ingredients and certain inventory related items. As of
December 31, 2017
, these commitments for the next five years were approximately
$902 million
in
2018
,
$179 million
in
2019
,
$50 million
in
2020
,
$48 million
in
2021
and
$45 million
in
2022
. The amounts related to active pharmaceutical ingredients represent minimum purchase commitments.
Actual payments for the purchases related to active pharmaceutical ingredients were
$1.7 billion
in
2017
,
$2.0 billion
in
2016
and
$2.2 billion
in
2015
.
|
13
.
|
STOCKHOLDERS’ EQUITY
|
Stock Repurchase Programs
In the first quarter of 2016, our Board of Directors authorized a
$12.0 billion
stock repurchase program (2016 Program) under which repurchases may be made in the open market or in privately negotiated transactions. The 2016 Program commenced after the
$15.0 billion
stock repurchase program authorized by our Board of Directors in January 2015 (2015 Program) was completed in the second quarter of 2016. The
$5.0 billion
stock repurchase program authorized by our Board of Directors in May 2014 (2014 Program) was completed in the first quarter of 2015.
93
During 2017, we repurchased and retired
13 million
shares of our common stock for
$954 million
through open market transactions under the 2016 Program. As of
December 31, 2017
, the remaining authorized repurchase amount under the 2016 Program was
$8.0 billion
.
In February 2016, we entered into an accelerated stock repurchase program (ASR) to repurchase
$5.0 billion
of our common stock under the 2015 Program. We made an upfront payment of
$5.0 billion
and received
46 million
shares of our common stock. The
46 million
shares represented approximately
80%
of the total shares calculated based on our common stock closing price of
$86.68
per share on the date we entered into the ASR. In April 2016, the ASR settled, and we received an additional
8 million
shares of our common stock based on the average price of our common stock during the ASR purchase period less a predetermined discount. As a result, the average purchase price of our common stock from the ASR was
$92.09
per share.
We accounted for the ASR as two separate transactions: (a) as shares of common stock acquired in a treasury stock transaction recorded on the transaction date and (b) as a forward contract indexed to our own common stock. As such, the up-front payment of
$5.0 billion
was accounted for as a reduction to Stockholders’ equity on our Consolidated Balance Sheets in the period the payment was made. The ASR met all of the applicable criteria for equity classification and therefore was not accounted for as a derivative instrument. The shares received under the ASR were retired in the periods they were received.
The following table summarizes our stock repurchases under the above-described programs (in millions, except per share data):
|
Year ended December 31,
|
||||||||||||
|
2017
(1)
|
2016
(2)
|
2015
(3)
|
||||||||||
|
Shares repurchased and retired
|
13
|
|
123
|
|
95
|
|
||||||
|
Amount
|
$
|
954
|
|
$
|
11,001
|
|
$
|
10,002
|
|
|||
|
Average price per share
|
$
|
71.79
|
|
$
|
89.15
|
|
$
|
104.91
|
|
|||
|
_______________________
|
||||||||||||
|
Notes:
|
|
|
(1)
|
All repurchases were under the 2016 Program.
|
|
(2)
|
Includes 36 million shares repurchased for $3.0 billion under the 2016 Program and 87 million shares repurchased for $8.0 billion under the 2015 Program.
|
|
(3)
|
Includes 65 million shares repurchased for $7.0 billion under the 2015 Program and 30 million shares repurchased for $3.0 billion under the 2014 Program.
|
In addition to repurchases from our stock repurchase programs, we repurchased shares of common stock withheld by us from employee restricted stock awards to satisfy our applicable tax withholding obligations, which are immaterial and excluded from the table above.
We use the par value method of accounting for our stock repurchases. Under the par value method, common stock is first charged with the par value of the shares involved. The excess of the cost of shares acquired over the par value is allocated to APIC based on an estimated average sales price per issued share with the excess amounts charged to retained earnings.
The following table summarizes the reduction of common stock and APIC and the charge to retained earnings as a result of our stock repurchases (in millions):
|
Year ended December 31,
|
||||||||||||
|
2017
|
2016
|
2015
|
||||||||||
|
Reduction of common stock and APIC
|
$
|
34
|
|
$
|
302
|
|
$
|
223
|
|
|||
|
Charge to retained earnings
|
$
|
1,028
|
|
$
|
10,883
|
|
$
|
10,115
|
|
|||
Dividends
The following table summarizes cash dividends declared on our common stock (in millions, except per share data):
|
2017
|
2016
|
|||||||||||||||
|
Dividend Per Share
|
Amount
|
Dividend Per Share
|
Amount
|
|||||||||||||
|
First quarter
|
$
|
0.52
|
|
$
|
685
|
|
$
|
0.43
|
|
$
|
587
|
|
||||
|
Second quarter
|
0.52
|
|
685
|
|
0.47
|
|
631
|
|
||||||||
|
Third quarter
|
0.52
|
|
685
|
|
0.47
|
|
625
|
|
||||||||
|
Fourth quarter
|
0.52
|
|
687
|
|
0.47
|
|
622
|
|
||||||||
|
Total
|
$
|
2.08
|
|
$
|
2,742
|
|
$
|
1.84
|
|
$
|
2,465
|
|
||||
94
Our restricted stock and performance-based stock units have dividend equivalent rights entitling holders to dividend equivalents to be paid upon vesting for each share of the underlying units.
On February 6, 2018, we announced that our Board of Directors declared a quarterly cash dividend of
$0.57
per share of our common stock, with a payment date of
March 29, 2018
to all stockholders of record as of the close of business on
March 16, 2018
. Future dividends are subject to declaration by the Board of Directors.
Preferred Stock
We have
5 million
shares of authorized preferred stock issuable in series. Our Board is authorized to determine the designation, powers, preferences and rights of any such series. There was
no
preferred stock outstanding as of
December 31, 2017
and
2016
.
Accumulated Other Comprehensive Income
The following table summarizes the changes in AOCI by component, net of tax (in millions):
|
Foreign Currency Translation
|
Unrealized Gains and Losses on Available-for-Sale Securities
|
Unrealized Gains and Losses on Cash Flow Hedges
|
Total
|
|||||||||||||
|
Balance at December 31, 2015
|
$
|
(45
|
)
|
$
|
(16
|
)
|
$
|
149
|
|
$
|
88
|
|
||||
|
Other comprehensive income before reclassifications
|
177
|
|
7
|
|
5
|
|
189
|
|
||||||||
|
Amounts reclassified from accumulated other comprehensive income
|
—
|
|
(7
|
)
|
8
|
|
1
|
|
||||||||
|
Net current period other comprehensive income
|
177
|
|
—
|
|
13
|
|
190
|
|
||||||||
|
Balance at December 31, 2016
|
132
|
|
(16
|
)
|
162
|
|
278
|
|
||||||||
|
Other comprehensive income (loss) before reclassifications
|
(47
|
)
|
218
|
|
(304
|
)
|
(133
|
)
|
||||||||
|
Amounts reclassified from accumulated other comprehensive income
|
—
|
|
(8
|
)
|
28
|
|
20
|
|
||||||||
|
Net current period other comprehensive income (loss)
|
(47
|
)
|
210
|
|
(276
|
)
|
(113
|
)
|
||||||||
|
Balance at December 31, 2017
|
$
|
85
|
|
$
|
194
|
|
$
|
(114
|
)
|
$
|
165
|
|
||||
The amounts reclassified for gains and losses on cash flow hedges were recorded as part of Product sales on our Consolidated Statements of Income. See Note
4
, Derivative Financial Instruments for additional information. Amounts reclassified for gains and losses on available-for-sale securities were recorded as part of Other income (expense), net, on our Consolidated Statements of Income.
|
14
.
|
EMPLOYEE BENEFITS
|
We provide share based compensation in the form of various types of equity-based awards, including restricted stock units (RSUs), performance-based restricted stock units (PSUs) and stock options. Compensation expense is recognized on the Consolidated Statements of Income based on the estimated fair value of the award on the grant date. The estimated fair value of RSUs is based on the closing price of our common stock. For PSUs, estimated fair value is based on either the Monte Carlo valuation methodology or the stock price on the date of grant. For stock option awards, estimated fair value is based on the Black-Scholes option valuation model.
2004 Equity Incentive Plan
In May 2004, our stockholders approved and we adopted the Gilead Sciences, Inc. 2004 Equity Incentive Plan (as amended, the 2004 Plan). The 2004 Plan is a broad based incentive plan that provides for the grant of equity-based awards, including stock options, restricted stock units, restricted stock awards and performance awards, to employees, directors and consultants. The 2004 Plan authorized the issuance of a total of
243 million
shares of common stock. In May 2017, the maximum number of shares that may be issued under the 2004 Plan was increased to
309 million
shares. As of
December 31, 2017
, a total of
98 million
shares remain available for future grant under the 2004 Plan.
Stock Options
The 2004 Plan provides for option grants designated as either non-qualified or incentive stock options. Prior to January 1, 2006, we granted both non-qualified and incentive stock options, but all stock options granted after January 1, 2006 have been non-qualified stock options. Under the 2004 Plan, employee stock options granted prior to 2011 generally vest over
five years
and stock options granted starting in 2011 generally vest over
four years
. All options are exercisable over a period not to exceed the contractual term of
ten years
from the date the stock options are issued and are granted at prices not less than the fair market value
95
of our common stock on the grant date. Stock option exercises are settled with common stock from the 2004 Plan’s previously authorized and available pool of shares.
The following table summarizes activity and related information under our stock option plans. All option grants presented in the table, except for the Kite-related replacement awards, had exercise prices not less than the fair value of the underlying common stock on the grant date:
|
Shares
(in thousands)
|
Weighted-
Average
Exercise Price
(in dollars)
|
Weighted-Average
Remaining
Contractual Term
(Years)
|
Aggregate
Intrinsic
Value
(in millions)
|
||||||||||
|
Outstanding at December 31, 2016
|
23,157
|
|
$
|
37.69
|
|
||||||||
|
Granted
|
6,056
|
|
$
|
71.75
|
|
||||||||
|
Granted-replacement awards
(1)
|
8,047
|
|
$
|
23.68
|
|
||||||||
|
Forfeited
|
(275
|
)
|
$
|
64.66
|
|
||||||||
|
Expired
|
(63
|
)
|
$
|
82.50
|
|
||||||||
|
Exercised
|
(6,702
|
)
|
$
|
21.99
|
|
||||||||
|
Outstanding at December 31, 2017
|
30,220
|
|
$
|
43.93
|
|
5.89
|
$
|
921
|
|
||||
|
Exercisable at December 31, 2017
|
16,112
|
|
$
|
35.78
|
|
3.61
|
$
|
624
|
|
||||
|
Expected to vest, net of estimated forfeitures at December 31, 2017
|
13,314
|
|
$
|
52.94
|
|
8.47
|
$
|
285
|
|
||||
|
_______________________
|
|||||||||||||
Note:
|
(1)
|
I
n 2017, in connection with our acquisitions of Kite and Cell Design Labs, we replaced unvested Kite and Cell Design Labs stock options with our stock options. These options were fair-valued using the lattice valuation methodology. See Note 5, Acquisitions for additional information.
|
Aggregate intrinsic value represents the value of our closing stock price on the last trading day of the year in excess of the weighted-average exercise price multiplied by the number of options outstanding or exercisable. Total intrinsic value of options exercised was
$337 million
for
2017
,
$452 million
for
2016
and
$1.1 billion
for
2015
.
The weighted-average grant date fair value of the stock options granted was
$38.78
per share for
2017
,
$20.04
per share for
2016
and
$29.73
per share for
2015
.
As of
December 31, 2017
, there was
$413 million
of unrecognized compensation cost related to stock options, which is expected to be recognized over an estimated weighted-average period of
2.5
years.
Performance-Based Restricted Stock Units
Under the 2004 Plan, we grant PSUs which vest upon the achievement of specified market or performance goals, which could include achieving a total shareholder return compared to a pre-determined peer group or achieving revenue targets. The actual number of common shares ultimately issued is calculated by multiplying the number of PSUs by a payout percentage ranging from
0%
to
200%
, and these awards generally vest only when a committee (or subcommittee) of our Board has determined that the specified market and performance goals have been achieved. The fair value of each PSU is estimated at the date of grant or when performance objectives are defined for the grants. Depending on the terms of the award, fair value on the date of grant is determined based on either the Monte Carlo valuation methodology or the closing stock price on the date of grant.
In addition, we have also granted other PSUs to certain of our employees under the 2004 Plan. The vesting of these awards is subject to the achievement of specified individual performance goals, typically within a
one year
period. The fair value of such an award is equal to the closing price of our common stock on the grant date.
96
The following table summarizes activity and related information for our PSUs:
|
Shares
(1)
(in thousands)
|
Weighted-
Average Grant Date Fair Value Per Share (1)
(in dollars)
|
||||||
|
Outstanding at December 31, 2016
|
509
|
|
$
|
92.32
|
|
||
|
Granted
|
388
|
|
$
|
74.42
|
|
||
|
Vested
|
(47
|
)
|
$
|
77.82
|
|
||
|
Forfeited
|
(93
|
)
|
$
|
99.61
|
|
||
|
Outstanding at December 31, 2017
|
757
|
|
$
|
82.80
|
|
||
|
_______________________
|
|||||||
Note:
|
(1)
|
Weighted-average grant-date fair value per share excludes shares related to grants that currently have no grant date as the performance objectives have not yet been defined.
|
The weighted-average grant date fair value of our PSUs granted was
$74.42
per share for
2017
,
$71.60
per share for
2016
and
$61.71
per share for
2015
. The total grant date fair value of our vested PSUs was
$4 million
for
2017
,
$33 million
for
2016
and
$76 million
for
2015
, and total fair value as of the respective vesting dates was
$3 million
for
2017
,
$45 million
for
2016
and
$160 million
for
2015
.
We recognized stock-based compensation expenses of
$24 million
in
2017
,
$20 million
in
2016
and
$40 million
in
2015
related to these PSUs. As of
December 31, 2017
, there was
$31 million
of unrecognized compensation costs related to these PSUs, which is expected to be recognized over an estimated weighted-average period of
1.3
years.
Restricted Stock Units
We grant time-based RSUs to certain employees as part of our annual employee equity compensation review program as well as to new hire employees and to non-employee members of our Board. RSUs are share awards that entitle the holder to receive freely tradable shares of our common stock upon vesting. RSUs generally vest over
four years
from the date of grant.
The fair value of an RSU is equal to the closing price of our common stock on the grant date. The following table summarizes our RSU activities and related information:
|
Shares
(in thousands) |
Weighted-
Average Grant Date Fair Value Per Share (in dollars) |
||||||
|
Outstanding at December 31, 2016
|
10,045
|
|
$
|
85.41
|
|
||
|
Granted
|
7,156
|
|
$
|
69.57
|
|
||
|
Granted-replacement awards
(1)
|
2,970
|
|
$
|
83.19
|
|
||
|
Vested
|
(4,103
|
)
|
$
|
79.19
|
|
||
|
Forfeited
|
(1,063
|
)
|
$
|
81.85
|
|
||
|
Outstanding at December 31, 2017
|
15,005
|
|
$
|
79.37
|
|
||
|
_______________________
|
|||||||
Note:
|
(1)
|
In 2017, in connection with our acquisition of Kite, we replaced unvested Kite restricted stock units with our restricted stock units. The estimated fair value on the date of the replacement was based on the closing price of our common stock on that date. See Note 5, Acquisitions for additional information.
|
The weighted-average grant date fair value of RSUs granted was
$73.56
per share for
2017
,
$84.51
per share for
2016
, and
$103.19
per share for
2015
. The total grant date fair value of our vested RSUs was
$325 million
for
2017
,
$284 million
for
2016
and
$249 million
for
2015
, and total fair value as of the respective vesting dates was
$285 million
for
2017
,
$408 million
for
2016
and
$666 million
for
2015
.
As of
December 31, 2017
, there was
$810 million
of unrecognized compensation cost related to unvested RSUs which is expected to be recognized over a weighted-average period of
2.6
years.
97
Employee Stock Purchase Plan
Under our Employee Stock Purchase Plan and the International Employee Stock Purchase Plan (together, as amended, the ESPP), employees can purchase shares of our common stock based on a percentage of their compensation subject to certain limits. The purchase price per share is equal to the lower of
85%
of the fair market value of our common stock on the offering date or the purchase date. Prior to 2016, the ESPP offered a two-year look-back feature as well as an automatic reset feature that provides for an offering period to be reset to a new lower-priced offering if the offering price of the new offering period is less than that of the current offering period. Beginning in the first quarter of 2016, the look-back feature for ESPP offering periods became six-months. ESPP purchases are settled with common stock from the ESPP’s previously authorized and available pool of shares. During
2017
,
1 million
shares were issued under the ESPP for
$83 million
. A total of
79 million
shares of common stock have been authorized for issuance under the ESPP, and there were
12 million
shares available for issuance under the ESPP as of
December 31, 2017
.
Stock-Based Compensation
The following table summarizes total stock-based compensation expenses included on our Consolidated Statements of Income (in millions):
|
Year Ended December 31,
|
||||||||||||
|
2017
|
2016
|
2015
|
||||||||||
|
Cost of goods sold
|
$
|
24
|
|
$
|
14
|
|
$
|
11
|
|
|||
|
Research and development expenses
|
232
|
|
176
|
|
173
|
|
||||||
|
Selling, general and administrative expenses
|
393
|
|
190
|
|
198
|
|
||||||
|
Stock-based compensation expense included in total costs and expenses
|
649
|
|
380
|
|
382
|
|
||||||
|
Income tax effect
|
(280
|
)
|
(104
|
)
|
(131
|
)
|
||||||
|
Stock-based compensation expense, net of tax
|
$
|
369
|
|
$
|
276
|
|
$
|
251
|
|
|||
We capitalized stock-based compensation costs to inventory totaling
$17 million
in
2017
,
$15 million
in
2016
and
$13 million
in
2015
. The capitalized stock-based compensation costs remaining in inventory were
$11 million
as of
December 31, 2017
,
$9 million
as of
December 31, 2016
and
$8 million
as of
December 31, 2015
.
Stock-based compensation is recognized as expense over the requisite service periods on our Consolidated Statements of Income using the straight-line expense attribution approach, reduced for estimated forfeitures. We estimate forfeitures based on our historical experience.
Valuation Assumptions
Fair value of options granted under our 2004 Plan and purchases under our ESPP were estimated at grant or purchase dates using a Black-Scholes option valuation model. The Black-Scholes option valuation model was developed for use in estimating the fair value of traded options, which have no vesting restrictions and are fully transferable. In addition, option valuation models require the input of highly subjective assumptions, including expected stock price volatility and expected award life. We used the following assumptions to calculate the estimated fair value of the awards:
|
Year Ended December 31,
|
|||||||||
|
2017
|
2016
|
2015
|
|||||||
|
Expected volatility:
|
|||||||||
|
Stock options
|
28
|
%
|
30
|
%
|
35
|
%
|
|||
|
ESPP
|
28
|
%
|
30
|
%
|
32
|
%
|
|||
|
Expected term in years:
|
|
|
|
|
|
|
|||
|
Stock options
|
4.6
|
|
5.5
|
|
5.7
|
|
|||
|
ESPP
|
0.5
|
|
0.5
|
|
1.2
|
|
|||
|
Risk-free interest rate:
|
|
|
|
|
|
|
|||
|
Stock options
|
2.1
|
%
|
1.4
|
%
|
1.4
|
%
|
|||
|
ESPP
|
1.8
|
%
|
1.1
|
%
|
1.4
|
%
|
|||
|
Expected dividend yield
|
2.7
|
%
|
1.9
|
%
|
1.7
|
%
|
|||
The fair value of stock options granted was calculated using the single option approach. We use a blend of historical volatility along with implied volatility for traded options on our common stock to determine our expected volatility. The expected term of
98
stock-based awards represents the weighted-average period the awards are expected to remain outstanding. We estimate the weighted-average expected term based on historical cancellation and historical exercise data related to our stock options as well as the contractual term and vesting terms of the awards. The risk-free interest rate is based upon observed interest rates appropriate for the term of the stock-based awards. The dividend yield is based on our history and expectation of dividend payouts.
Deferred Compensation
We maintain a retirement saving plan under which eligible U.S. employees may defer compensation for income tax purposes under Section 401(k) of the Internal Revenue Code (the Gilead Sciences 401k Plan). In certain foreign subsidiaries, we maintain defined benefit plans as required by local regulatory requirements. Our total matching contribution expense under the Gilead Sciences 401k Plan and other defined benefit plans was
$74 million
during
2017
,
$69 million
during
2016
and
$47 million
during
2015
.
We maintain a deferred compensation plan under which our directors and key employees may defer compensation. Amounts deferred by participants are deposited into a rabbi trust. The total assets and liabilities associated with the deferred compensation plan were
$116 million
as of
December 31, 2017
and
$84 million
as of
December 31, 2016
.
|
15
.
|
NET INCOME PER SHARE ATTRIBUTABLE TO GILEAD COMMON STOCKHOLDERS
|
Basic net income per share attributable to Gilead common stockholders is calculated based on the weighted-average number of shares of our common stock outstanding during the period. Diluted net income per share attributable to Gilead common stockholders is calculated based on the weighted-average number of shares of our common stock outstanding and other dilutive securities outstanding during the period. The potentially dilutive shares of our common stock resulting from the assumed exercise of outstanding stock options and equivalents, the assumed conversion of our outstanding Convertible Notes and the assumed exercise of the warrants related to our outstanding Convertible Notes were determined under the treasury stock method. Both the Convertible Notes and the associated warrants were settled in 2016.
We excluded stock options and equivalents of approximately
11 million
,
3 million
and
1 million
weighted-average shares of our common stock that were outstanding during
2017
,
2016
and
2015
, respectively, in the computation of diluted net income per share attributable to Gilead common stockholders because their effect was antidilutive.
The following table shows the calculation of basic and diluted net income per share attributable to Gilead common stockholders (in millions except per share amounts):
|
Year Ended December 31,
|
||||||||||||
|
2017
|
2016
|
2015
|
||||||||||
|
Net income attributable to Gilead
|
$
|
4,628
|
|
$
|
13,501
|
|
$
|
18,108
|
|
|||
|
Shares used in per share calculation - basic
|
1,307
|
|
1,339
|
|
1,464
|
|
||||||
|
Effect of dilutive securities:
|
||||||||||||
|
Stock options and equivalents
|
12
|
|
13
|
|
23
|
|
||||||
|
Conversion spread related to the Convertible Notes
|
—
|
|
2
|
|
14
|
|
||||||
|
Warrants related to the Convertible Notes
|
—
|
|
4
|
|
20
|
|
||||||
|
Shares used in per share calculation - diluted
|
1,319
|
|
1,358
|
|
1,521
|
|
||||||
|
Net income per share attributable to Gilead common stockholders - basic
|
$
|
3.54
|
|
$
|
10.08
|
|
$
|
12.37
|
|
|||
|
Net income per share attributable to Gilead common stockholders - diluted
|
$
|
3.51
|
|
$
|
9.94
|
|
$
|
11.91
|
|
|||
99
|
16
.
|
SEGMENT INFORMATION
|
We have one operating segment, which primarily focuses on the discovery, development and commercialization of innovative medicines in areas of unmet medical need. Therefore, our results of operations are reported on a consolidated basis consistent with internal management reporting reviewed by our chief operating decision maker, who is our chief executive officer. Enterprise-wide disclosures about product sales, revenues and long-lived assets by geographic area, and revenues from major customers are presented below.
Product Sales
Our product sales consist of the following (in millions):
|
Year Ended December 31,
|
||||||||||||
|
2017
|
2016
|
2015
|
||||||||||
|
Antiviral products:
|
||||||||||||
|
Harvoni
|
$
|
4,370
|
|
$
|
9,081
|
|
$
|
13,864
|
|
|||
|
Genvoya
|
3,674
|
|
1,484
|
|
45
|
|
||||||
|
Epclusa
|
3,510
|
|
1,752
|
|
—
|
|
||||||
|
Truvada
|
3,134
|
|
3,566
|
|
3,459
|
|
||||||
|
Atripla
|
1,806
|
|
2,605
|
|
3,134
|
|
||||||
|
Descovy
|
1,218
|
|
298
|
|
—
|
|
||||||
|
Stribild
|
1,053
|
|
1,914
|
|
1,825
|
|
||||||
|
Viread
|
1,046
|
|
1,186
|
|
1,108
|
|
||||||
|
Odefsey
|
1,106
|
|
329
|
|
—
|
|
||||||
|
Complera/Eviplera
|
966
|
|
1,457
|
|
1,427
|
|
||||||
|
Sovaldi
|
964
|
|
4,001
|
|
5,276
|
|
||||||
|
Vosevi
|
293
|
|
—
|
|
—
|
|
||||||
|
Other antiviral
|
196
|
|
72
|
|
69
|
|
||||||
|
Total antiviral products
|
23,336
|
|
27,745
|
|
30,207
|
|
||||||
|
Other products:
|
||||||||||||
|
Letairis
|
887
|
|
819
|
|
700
|
|
||||||
|
Ranexa
|
717
|
|
677
|
|
588
|
|
||||||
|
AmBisome
|
366
|
|
356
|
|
350
|
|
||||||
|
Zydelig
|
149
|
|
168
|
|
132
|
|
||||||
|
Other products
|
207
|
|
188
|
|
174
|
|
||||||
|
Total product sales
|
$
|
25,662
|
|
$
|
29,953
|
|
$
|
32,151
|
|
|||
Revenues by Geographic Region
The following table summarizes total revenues from external customers and collaboration partners by geographic region (in millions). Product sales and product-related contract revenue are attributed to regions based on ship-to location. Royalty and non-product related contract revenue are attributed to regions based on the location of the collaboration partner.
|
Year Ended December 31,
|
||||||||||||
|
2017
|
2016
|
2015
|
||||||||||
|
Revenues:
|
||||||||||||
|
United States
|
$
|
18,194
|
|
$
|
19,354
|
|
$
|
21,234
|
|
|||
|
Europe
|
5,311
|
|
6,365
|
|
7,528
|
|
||||||
|
Other countries
|
2,602
|
|
4,671
|
|
3,877
|
|
||||||
|
Total revenues
|
$
|
26,107
|
|
$
|
30,390
|
|
$
|
32,639
|
|
|||
100
Long-lived Assets
The net book value of our property, plant and equipment (less office and computer equipment) in the United States was
$2.6 billion
as of
December 31, 2017
,
$2.2 billion
as of
December 31, 2016
and
$1.8 billion
as of
December 31, 2015
. The corresponding amount in international locations was
$520 million
as of
December 31, 2017
,
$430 million
as of
December 31, 2016
and
$334 million
as of
December 31, 2015
. All individual international locations accounted for less than ten percent of the total balances.
Revenues from Major Customers
The following table summarizes revenues from each of our customers who individually accounted for
10%
or more of our total revenues (as a percentage of total revenues):
|
Year Ended December 31,
|
|||||||||
|
2017
|
2016
|
2015
|
|||||||
|
McKesson Corp.
|
23
|
%
|
22
|
%
|
24
|
%
|
|||
|
AmerisourceBergen Corp.
|
20
|
%
|
18
|
%
|
19
|
%
|
|||
|
Cardinal Health, Inc.
|
19
|
%
|
16
|
%
|
15
|
%
|
|||
17
. INCOME TAXES
Income before provision for income taxes consists of the following (in millions):
|
Year Ended December 31,
|
||||||||||||
|
2017
|
2016
|
2015
|
||||||||||
|
Domestic
|
$
|
8,099
|
|
$
|
7,646
|
|
$
|
7,953
|
|
|||
|
Foreign
|
5,430
|
|
9,451
|
|
13,706
|
|
||||||
|
Total income before provision for income taxes
|
$
|
13,529
|
|
$
|
17,097
|
|
$
|
21,659
|
|
|||
The provision for income taxes consists of the following (in millions):
|
Year Ended December 31,
|
||||||||||||
|
2017
|
2016
|
2015
|
||||||||||
|
Federal:
|
||||||||||||
|
Current
|
$
|
8,817
|
|
$
|
3,351
|
|
$
|
3,568
|
|
|||
|
Deferred
|
(123
|
)
|
(85
|
)
|
(313
|
)
|
||||||
|
|
8,694
|
|
3,266
|
|
3,255
|
|
||||||
|
State:
|
|
|
|
|
|
|
||||||
|
Current
|
97
|
|
131
|
|
158
|
|
||||||
|
Deferred
|
(20
|
)
|
28
|
|
(21
|
)
|
||||||
|
|
77
|
|
159
|
|
137
|
|
||||||
|
Foreign:
|
||||||||||||
|
Current
|
54
|
|
261
|
|
212
|
|
||||||
|
Deferred
|
60
|
|
(77
|
)
|
(51
|
)
|
||||||
|
|
114
|
|
184
|
|
161
|
|
||||||
|
Provision for income taxes
|
$
|
8,885
|
|
$
|
3,609
|
|
$
|
3,553
|
|
|||
On December 22, 2017, the Tax Cuts and Jobs Act (Tax Reform) was signed into law making significant changes to the Internal Revenue Code of 1986, as amended. Changes include, but are not limited to, a corporate tax rate decrease from
35%
to
21%
effective for tax years beginning after December 31, 2017, implementation of a modified territorial tax system and a repatriation tax on deemed repatriated earnings of foreign subsidiaries. We calculated a provisional estimate of the impact from Tax Reform in our 2017 income tax provision in accordance with our interpretation of Tax Reform and guidance available as of the date of this filing. As a result, we recorded an estimated
$5.5 billion
net charge to income tax expense in the fourth quarter of 2017, the period in which Tax Reform was enacted. This amount includes: i) a provisional
$308 million
deferred tax benefit related to the re-measurement of certain deferred tax assets and liabilities, based on the revised rates at which they are expected to reverse in the future, and ii) a provisional
$5.8 billion
charge related to the transition tax on the mandatory deemed repatriation of accumulated
101
foreign earnings determined as of December 31, 2017. The provisional transition tax charge includes federal (net of certain offsetting adjustments related to unrecognized tax benefits), state and local, and foreign withholding tax on the accumulated foreign earnings, which are no longer considered indefinitely reinvested as of December 31, 2017.
The accrued federal liability for the transition tax of
$6.1 billion
will be payable over an eight year period. As of December 31, 2017,
$487 million
of the transition tax was recorded within Other accrued liabilities and
$5.6 billion
was recorded in Long-term income taxes payable on our Consolidated Balance Sheets.
In accordance with the U.S. Securities and Exchange Commission (“SEC”) Staff Accounting Bulletin No. 118 (“SAB 118”), we have determined that the
$308 million
of the deferred tax benefit recorded in connection with the re-measurement of certain deferred tax assets and liabilities and the
$5.8 billion
of current tax expense recorded in connection with the transition tax on the mandatory deemed repatriation of foreign earnings are provisional and subject to further adjustment during the measurement period (not to exceed one year from the enactment of Tax Reform). Given the complexity of Tax Reform, we may be refining our estimates of these provisional amounts as further guidance is issued from the U.S. Treasury, the SEC and the FASB.
In February 2018, we repatriated
$28.0 billion
of cash, cash equivalents and marketable securities
to our parent company headquartered in the United States.
Prior to the enactment of Tax Reform, these earnings were considered indefinitely reinvested and no U.S. taxes had been provided. In 2017, U.S. taxes have been provided on these earnings through the accrual of the Tax Reform transition tax.
Additionally, we are continuing to evaluate the accounting policy election required with regard to the tax on Global Intangible Low-Taxed Income (the Global Minimum Tax). The FASB allows companies to adopt a policy election to account for the Global Minimum Tax under one of two methods: (i) account for the Global Minimum Tax as a component of tax expense in the period in which a company is subject to the rules (the period cost method), or (ii) account for the Global Minimum Tax in a company’s measurement of deferred taxes (the deferred method). We have not elected a method and will only do so after our completion of the analysis of the Global Minimum Tax provisions. Our election method will depend, in part, on analyzing expected future U.S. taxable income inclusions related to Global Minimum Tax under both methodologies in order to determine the most appropriate method. Should we decide to elect the deferred method of accounting for the Global Minimum Tax, it is possible that our provisional estimate for re-measuring our deferred taxes may materially change. We will finalize the analysis for the accounting policy election during the measurement period.
The reconciliation between the federal statutory tax rate applied to income before taxes and our effective tax rate is summarized as follows:
|
Year Ended December 31,
|
|||||||||
|
2017
|
2016
|
2015
|
|||||||
|
Federal statutory rate
|
35.0
|
%
|
35.0
|
%
|
35.0
|
%
|
|||
|
State taxes, net of federal benefit
|
0.1
|
%
|
0.7
|
%
|
0.5
|
%
|
|||
|
Foreign earnings at different rates
|
(10.0
|
)%
|
(15.3
|
)%
|
(18.5
|
)%
|
|||
|
Research and other credits
|
(0.6
|
)%
|
(0.7
|
)%
|
(0.7
|
)%
|
|||
|
Transition Tax
|
42.9
|
%
|
—
|
%
|
—
|
%
|
|||
|
Deferred Tax Revaluation
|
(2.3
|
)%
|
—
|
%
|
—
|
%
|
|||
|
Other
|
0.6
|
%
|
1.4
|
%
|
0.1
|
%
|
|||
|
Effective tax rate
|
65.7
|
%
|
21.1
|
%
|
16.4
|
%
|
|||
102
Deferred income taxes reflect the net tax effects of temporary differences between the carrying amounts of assets and liabilities for financial reporting purposes and the amounts used for income tax purposes. Significant components of our deferred tax assets and liabilities are as follows (in millions):
|
December 31,
|
||||||||
|
2017
|
2016
|
|||||||
|
Deferred tax assets:
|
|
|
||||||
|
Net operating loss carryforwards
|
$
|
322
|
|
$
|
175
|
|
||
|
Stock-based compensation
|
165
|
|
212
|
|
||||
|
Reserves and accruals not currently deductible
|
336
|
|
617
|
|
||||
|
Deferred revenue
|
27
|
|
56
|
|
||||
|
Depreciation related
|
56
|
|
88
|
|
||||
|
Research and other credit carryforwards
|
293
|
|
147
|
|
||||
|
Other, net
|
102
|
|
221
|
|
||||
|
Total deferred tax assets before valuation allowance
|
1,301
|
|
1,516
|
|
||||
|
Valuation allowance
|
(162
|
)
|
(126
|
)
|
||||
|
Total deferred tax assets
|
1,139
|
|
1,390
|
|
||||
|
Deferred tax liabilities:
|
|
|
|
|
||||
|
Intangibles
|
(1,316
|
)
|
(104
|
)
|
||||
|
Other
|
(70
|
)
|
(31
|
)
|
||||
|
Total deferred tax liabilities
|
(1,386
|
)
|
(135
|
)
|
||||
|
Net deferred tax assets (liabilities)
|
$
|
(247
|
)
|
$
|
1,255
|
|
||
The valuation allowance was
$162 million
as of
December 31, 2017
,
$126 million
as of
December 31, 2016
and
$6 million
as of December 31, 2015. The increase of our valuation allowance from December 31, 2016 to December 31, 2017 was primarily
related to Kite.
At
December 31, 2017
, we had U.S. federal net operating loss carryforwards of approximately
$1.1 billion
. The federal net operating loss carryforwards will start to expire in 2021, if not utilized. We also had federal tax credit carryforwards of approximately
$107 million
which will start to expire in 2020, if not utilized. In addition, we had state net operating loss and tax credit carryforwards of approximately
$627 million
and
$355 million
, respectively. The state net operating loss and tax credit carryforwards will start to expire in 2018 if not utilized.
Utilization of net operating losses and tax credits may be subject to an annual limitation due to ownership change limitations provided in the Internal Revenue Code of 1986, as amended, and similar state provisions. This annual limitation may result in the expiration of the net operating losses and credits before utilization.
We file federal, state and foreign income tax returns in the United States and in many foreign jurisdictions. For federal and California income tax purposes, the statute of limitations is open for 2010 and onwards. For certain acquired entities, the statute of limitations is open for all years from inception due to our utilization of their net operating losses and credits carried over from prior years.
Our income tax returns are subject to audit by federal, state and foreign tax authorities. We are currently under examination by the IRS for the tax years from 2010 to 2014 and by various state and foreign jurisdictions. There are differing interpretations of tax laws and regulations, and as a result, significant disputes may arise with these tax authorities involving issues of the timing and amount of deductions and allocations of income among various tax jurisdictions. We periodically evaluate our exposures associated with our tax filing positions.
Of the total unrecognized tax benefits,
$1.8 billion
at both
December 31, 2017
and
2016
, if recognized, would reduce our effective tax rate in the period of recognition. We have continued to classify interest and penalties related to unrecognized tax benefits as part of our income tax provision on our Consolidated Statements of Income. We had accrued interest and penalties related to unrecognized tax benefits of
$112 million
as of
December 31, 2017
and
$50 million
as of
December 31, 2016
.
As of
December 31, 2017
, we believe that it is reasonably possible that our unrecognized tax benefits will decrease by approximately
$800 million
in the next 12 months due to potential settlement of tax examinations and lapse of statute of limitations.
103
The following is a rollforward of our total gross unrecognized tax benefits (in millions):
|
December 31,
|
||||||||||||
|
2017
|
2016
|
2015
|
||||||||||
|
Balance, beginning of period
|
$
|
1,852
|
|
$
|
1,350
|
|
$
|
661
|
|
|||
|
Tax positions related to current year:
|
|
|
|
|
|
|
||||||
|
Additions
|
299
|
|
522
|
|
675
|
|
||||||
|
Reductions
|
—
|
|
—
|
|
—
|
|
||||||
|
Tax positions related to prior years:
|
|
|
|
|
||||||||
|
Additions
|
67
|
|
33
|
|
45
|
|
||||||
|
Reductions
|
(16
|
)
|
(3
|
)
|
—
|
|
||||||
|
Settlements
|
(12
|
)
|
(49
|
)
|
(24
|
)
|
||||||
|
Lapse of statute of limitations
|
(9
|
)
|
(1
|
)
|
(7
|
)
|
||||||
|
Balance, end of period
|
$
|
2,181
|
|
$
|
1,852
|
|
$
|
1,350
|
|
|||
104
SELECTED QUARTERLY FINANCIAL INFORMATION (UNAUDITED)
The following amounts are in millions, except per share amounts:
|
|
1st Quarter
|
2nd Quarter
|
3rd Quarter
|
4th Quarter
|
||||||||||||
|
2017
|
|
|
|
|||||||||||||
|
Total revenues
|
$
|
6,505
|
|
$
|
7,141
|
|
$
|
6,512
|
|
$
|
5,949
|
|
||||
|
Gross profit on product sales
|
$
|
5,420
|
|
$
|
5,920
|
|
$
|
5,370
|
|
$
|
4,581
|
|
||||
|
Net income (loss)
(1)
|
$
|
2,699
|
|
$
|
3,069
|
|
$
|
2,712
|
|
$
|
(3,836
|
)
|
||||
|
Net income (loss) attributable to Gilead
(1)
|
$
|
2,702
|
|
$
|
3,073
|
|
$
|
2,718
|
|
$
|
(3,865
|
)
|
||||
|
Net income (loss) per share attributable to Gilead common stockholders - basic
(1)
|
$
|
2.07
|
|
$
|
2.35
|
|
$
|
2.08
|
|
$
|
(2.96
|
)
|
||||
|
Net income (loss) per share attributable to Gilead common stockholders - diluted
(1)
|
$
|
2.05
|
|
$
|
2.33
|
|
$
|
2.06
|
|
$
|
(2.96
|
)
|
||||
|
2016
|
|
|
|
|
|
|
||||||||||
|
Total revenues
|
$
|
7,794
|
|
$
|
7,776
|
|
$
|
7,500
|
|
$
|
7,320
|
|
||||
|
Gross profit on product sales
|
$
|
6,488
|
|
$
|
6,787
|
|
$
|
6,276
|
|
$
|
6,141
|
|
||||
|
Net income
|
$
|
3,567
|
|
$
|
3,497
|
|
$
|
3,325
|
|
$
|
3,099
|
|
||||
|
Net income attributable to Gilead
|
$
|
3,566
|
|
$
|
3,497
|
|
$
|
3,330
|
|
$
|
3,108
|
|
||||
|
Net income per share attributable to Gilead common stockholders - basic
|
$
|
2.58
|
|
$
|
2.62
|
|
$
|
2.52
|
|
$
|
2.36
|
|
||||
|
Net income per share attributable to Gilead common stockholders - diluted
|
$
|
2.53
|
|
$
|
2.58
|
|
$
|
2.49
|
|
$
|
2.34
|
|
||||
|
_______________________
|
||||||||||||||||
|
Note:
|
||
|
(1)
|
In December 2017, we recorded an estimated $5.5 billion net charge related to the enactment of the Tax Cuts and Jobs Act. See Note 17, Income Taxes of the Notes to Consolidated Financial Statements included in Item 8 of this Annual Report on Form 10-K for additional details.
|
|
105
GILEAD SCIENCES, INC.
Schedule II: Valuation and Qualifying Accounts
(in millions)
|
Balance at Beginning of Period
|
Additions/Charged to Expense
|
Deductions
|
Balance at End of Period
|
|||||||||||||
|
Year ended December 31, 2017:
|
||||||||||||||||
|
Accounts receivable allowances
(1)
|
$
|
763
|
|
$
|
7,682
|
|
$
|
7,990
|
|
$
|
455
|
|
||||
|
Sales return allowance
|
$
|
195
|
|
$
|
23
|
|
$
|
56
|
|
$
|
162
|
|
||||
|
Valuation allowances for deferred tax assets
(2)
|
$
|
126
|
|
$
|
72
|
|
$
|
36
|
|
$
|
162
|
|
||||
|
Year ended December 31, 2016:
|
||||||||||||||||
|
Accounts receivable allowances
(1)
|
$
|
1,032
|
|
$
|
9,287
|
|
$
|
9,556
|
|
$
|
763
|
|
||||
|
Sales return allowance
|
$
|
371
|
|
$
|
(141
|
)
|
$
|
35
|
|
$
|
195
|
|
||||
|
Valuation allowances for deferred tax assets
(2)
|
$
|
6
|
|
$
|
120
|
|
$
|
—
|
|
$
|
126
|
|
||||
|
Year ended December 31, 2015:
|
||||||||||||||||
|
Accounts receivable allowances
(1)
|
$
|
356
|
|
$
|
6,934
|
|
$
|
6,258
|
|
$
|
1,032
|
|
||||
|
Sales return allowance
|
$
|
171
|
|
$
|
219
|
|
$
|
19
|
|
$
|
371
|
|
||||
|
Valuation allowances for deferred tax assets
(2)
|
$
|
9
|
|
$
|
—
|
|
$
|
3
|
|
$
|
6
|
|
||||
|
_______________________
|
||||||||||||||||
|
Notes:
|
|
|
(1)
|
Allowances are for doubtful accounts, cash discounts and chargebacks.
|
|
(2)
|
Valuation allowances for deferred tax assets include $48 million, $4 million and $4 million as of December 31, 2017, 2016 and 2015, respectively, related to our acquisitions.
|
106
|
ITEM 9.
|
CHANGES IN AND DISAGREEMENTS WITH ACCOUNTANTS ON ACCOUNTING AND FINANCIAL DISCLOSURE
|
Not applicable.
|
ITEM 9A.
|
CONTROLS AND PROCEDURES
|
(a) Evaluation of Disclosure Controls and Procedures
An evaluation as of
December 31, 2017
was carried out under the supervision and with the participation of our management, including our Chief Executive Officer and Chief Financial Officer, of the effectiveness of our “disclosure controls and procedures,” which are defined in Rule 13a-15(e) under the Securities Exchange Act of 1934, as amended (the Exchange Act), as controls and other procedures of a company that are designed to ensure that the information required to be disclosed by a company in the reports that it files or submits under the Exchange Act is recorded, processed, summarized and reported, within the time periods specified in the Securities and Exchange Commission’s rules and forms, and that such information is accumulated and communicated to the company’s management, including its Chief Executive Officer and Chief Financial Officer, as appropriate, to allow timely decisions regarding required disclosure. Based upon that evaluation, our Chief Executive Officer and Chief Financial Officer concluded that our disclosure controls and procedures were effective at
December 31, 2017
.
(b) Management’s Report on Internal Control over Financial Reporting
Our management is responsible for establishing and maintaining adequate internal control over financial reporting, as such term is defined in Rule 13a-15(f) of the Exchange Act. Our internal control system is designed to provide reasonable assurance regarding the preparation and fair presentation of financial statements for external purposes in accordance with generally accepted accounting principles. All internal control systems, no matter how well designed, have inherent limitations and can provide only reasonable assurance that the objectives of the internal control system are met.
Under the supervision and with the participation of our management, including our Chief Executive Officer and Chief Financial Officer, we conducted an evaluation of the effectiveness of our internal control over financial reporting, based on criteria established by the Committee of Sponsoring Organizations of the Treadway Commission (COSO) in its 2013 Internal Control-Integrated Framework. Based on our evaluation, we concluded that our internal control over financial reporting was effective as of
December 31, 2017
.
Our independent registered public accounting firm, Ernst & Young LLP, has audited our Consolidated Financial Statements included in Item 8 of this Annual Report on Form 10-K and have issued a report on our internal control over financial reporting as of
December 31, 2017
. Their report on the audit of internal control over financial reporting appears below.
(c) Changes in Internal Control over Financial Reporting
Our management, including our Chief Executive Officer and Chief Financial Officer, has evaluated any changes in our internal control over financial reporting that occurred during the quarter ended
December 31, 2017
, and has concluded that there was no change during such quarter that has materially affected, or is reasonably likely to materially affect, our internal control over financial reporting.
107
REPORT OF INDEPENDENT REGISTERED PUBLIC ACCOUNTING FIRM
To the Stockholders and the Board of Directors of Gilead Sciences, Inc.
Opinion on Internal Control over Financial Reporting
We have audited Gilead Sciences, Inc.’s internal control over financial reporting as of
December 31, 2017
, based on criteria established in Internal Control-Integrated Framework issued by the Committee of Sponsoring Organizations of the Treadway Commission (2013 framework)
(the COSO criteria). In our opinion, Gilead Sciences, Inc. (the Company) maintained, in all material respects, effective internal control over financial reporting as of
December 31, 2017
, based on the COSO criteria.
We also have audited, in accordance with the standards of the Public Company Accounting Oversight Board (United States) (PCAOB), the consolidated balance sheets of the Company as of December 31, 2017 and 2016, the related consolidated statements of income, comprehensive income, stockholders’ equity and cash flows for each of the three years in the period ended December 31, 2017, and the related notes and financial statement schedule listed in the Index at Item 15(a) and our report dated February 26, 2018 expressed an unqualified opinion thereon.
Basis for Opinion
The Company’s management is responsible for maintaining effective internal control over financial reporting and for its assessment of the effectiveness of internal control over financial reporting included in the accompanying Management’s Report on Internal Control over Financial Reporting. Our responsibility is to express an opinion on the Company’s internal control over financial reporting based on our audit. We are a public accounting firm registered with the PCAOB and are required to be independent with respect to the Company in accordance with the U.S. federal securities laws and the applicable rules and regulations of the Securities and Exchange Commission and the PCAOB.
We conducted our audit in accordance with the standards of the PCAOB. Those standards require that we plan and perform the audit to obtain reasonable assurance about whether effective internal control over financial reporting was maintained in all material respects.
Our audit included obtaining an understanding of internal control over financial reporting, assessing the risk that a material weakness exists, testing and evaluating the design and operating effectiveness of internal control based on the assessed risk, and performing such other procedures as we considered necessary in the circumstances. We believe that our audit provides a reasonable basis for our opinion.
Definition and Limitations of Internal Control Over Financial Reporting
A company’s internal control over financial reporting is a process designed to provide reasonable assurance regarding the reliability of financial reporting and the preparation of financial statements for external purposes in accordance with generally accepted accounting principles. A company’s internal control over financial reporting includes those policies and procedures that (1) pertain to the maintenance of records that, in reasonable detail, accurately and fairly reflect the transactions and dispositions of the assets of the company; (2) provide reasonable assurance that transactions are recorded as necessary to permit preparation of financial statements in accordance with generally accepted accounting principles, and that receipts and expenditures of the company are being made only in accordance with authorizations of management and directors of the company; and (3) provide reasonable assurance regarding prevention or timely detection of unauthorized acquisition, use, or disposition of the company’s assets that could have a material effect on the financial statements.
Because of its inherent limitations, internal control over financial reporting may not prevent or detect misstatements. Also, projections of any evaluation of effectiveness to future periods are subject to the risk that controls may become inadequate because of changes in conditions, or that the degree of compliance with the policies or procedures may deteriorate.
/s/ Ernst & Young LLP
Redwood City, California
February 26, 2018
108
|
ITEM 9B.
|
OTHER INFORMATION
|
Not applicable.
|
ITEM 10.
|
DIRECTORS, EXECUTIVE OFFICERS AND CORPORATE GOVERNANCE
|
The information required by this Item concerning our directors and executive officers is incorporated by reference to the sections of our Definitive Proxy Statement to be filed with the Securities and Exchange Commission pursuant to Regulation 14A in connection with our
2018
Annual Meeting of Stockholders (the Proxy Statement) under the headings “Nominees,” “Board Structure,” “Executive Officers,” and “Section 16(a) Beneficial Ownership Reporting Compliance.”
Our written Code of Ethics applies to all of our directors and employees, including our executive officers, including without limitation our principal executive officer, principal financial officer, principal accounting officer or controller or persons performing similar functions. The Code of Ethics is available on our website at http://www.gilead.com in the Investors section under “Corporate Governance.” Changes to or waivers of the Code of Ethics will be disclosed on the same website. We intend to satisfy the disclosure requirement under Item 5.05 of Form 8-K regarding any amendment to, or waiver of, any provision of the Code of Ethics by disclosing such information on the same website.
|
ITEM 11.
|
EXECUTIVE COMPENSATION
|
The information required by this Item is incorporated by reference to the sections of the Proxy Statement under the headings “Executive Compensation,” “Committees of our Board of Directors,” “Compensation Committee Report,” and “Compensation of Non-Employee Board Members.”
|
ITEM 12.
|
SECURITY OWNERSHIP OF CERTAIN BENEFICIAL OWNERS AND MANAGEMENT AND RELATED STOCKHOLDER MATTERS
|
The information required by this Item is incorporated by reference to the sections of the Proxy Statement under the headings “Security Ownership of Certain Beneficial Owners and Management” and “Securities Authorized for Issuance under Equity Compensation Plans.”
|
ITEM 13.
|
CERTAIN RELATIONSHIPS AND RELATED TRANSACTIONS, AND DIRECTOR INDEPENDENCE
|
The information required by this Item is incorporated by reference to the sections of the Proxy Statement under the headings “The Gilead Board of Directors,” and “Board Processes.”
|
ITEM 14.
|
PRINCIPAL ACCOUNTANT FEES AND SERVICES
|
The information required by this Item is incorporated by reference to the section of the Proxy Statement under the heading “Principal Accountant Fees and Services.”
|
ITEM 15.
|
EXHIBITS AND FINANCIAL STATEMENT SCHEDULES
|
(a) The following documents are filed as part of this Annual Report on Form 10-K:
(1) Index list to Consolidated Financial Statements:
|
|
|
(2) Schedule II is included on page 106 of this report. All other schedules are omitted because they are not required or the required information is included in the financial statements or notes thereto.
109
(3) Exhibits.
The following exhibits are filed herewith or incorporated by reference:
|
Exhibit
Footnote
|
Exhibit Number
|
Description of Document
|
||
|
(1)
|
3.1
|
|||
|
(2)
|
3.2
|
|||
|
4.1
|
Reference is made to Exhibit 3.1 and Exhibit 3.2
|
|||
|
(3)
|
4.2
|
|||
|
(3)
|
4.3
|
|||
|
(4)
|
4.4
|
|||
|
(5)
|
4.5
|
|||
|
(6)
|
4.6
|
|||
|
(7)
|
4.7
|
|||
|
(8)
|
4.8
|
|||
|
(9)
|
4.9
|
|||
|
(10)
|
10.1
|
|||
|
*(11)
|
10.2
|
|||
|
*(12)
|
10.3
|
|||
|
*(13)
|
10.4
|
|||
|
*(14)
|
10.5
|
|||
|
*(15)
|
10.6
|
|||
|
*(12)
|
10.7
|
|||
|
*(12)
|
10.8
|
|||
|
*(13)
|
10.9
|
|||
|
*(16)
|
10.10
|
|||
|
*(16)
|
10.11
|
|||
|
*(17)
|
10.12
|
|||
|
*(18)
|
10.13
|
|||
|
*(16)
|
10.14
|
|||
|
*(19)
|
10.15
|
|||
|
*(19)
|
10.16
|
|||
|
*(19)
|
10.17
|
|||
|
*(19)
|
10.18
|
|||
|
*(20)
|
10.19
|
|||
110
|
*(19)
|
10.20
|
|||
|
*(20)
|
10.21
|
|||
|
*(19)
|
10.22
|
|||
|
*(15)
|
10.23
|
|||
|
*(21)
|
10.24
|
|||
|
*(22)
|
10.25
|
|||
|
*(22)
|
10.26
|
|||
|
*(22)
|
10.27
|
|||
|
*(23)
|
10.28
|
|||
|
*(24)
|
10.29
|
|||
|
*(25)
|
10.30
|
|||
|
*(26)
|
10.31
|
|||
|
*(27)
|
10.32
|
|||
|
*(28)
|
10.33
|
|||
|
*(29)
|
10.34
|
|||
|
*(30)
|
10.35
|
Form of Indemnity Agreement entered into between Registrant and its directors and executive officers
|
||
|
*(30)
|
10.36
|
Form of Employee Proprietary Information and Invention Agreement entered into between Registrant and certain of its officers and key employees
|
||
|
*(31)
|
10.37
|
|||
|
+(32)
|
10.38
|
Amendment Agreement, dated October 25, 1993, between Registrant, the Institute of Organic Chemistry and Biochemistry (IOCB) and Rega Stichting v.z.w. (REGA), together with the following exhibits: the License Agreement, dated December 15, 1991, between Registrant, IOCB and REGA (the 1991 License Agreement), the License Agreement, dated October 15, 1992, between Registrant, IOCB and REGA (the October 1992 License Agreement) and the License Agreement, dated December 1, 1992, between Registrant, IOCB and REGA (the December 1992 License Agreement)
|
||
|
+(33)
|
10.39
|
|||
|
+(34)
|
10.40
|
|||
|
+(35)
|
10.41
|
|||
|
+(36)
|
10.42
|
|||
|
+(37)
|
10.43
|
|||
|
+(37)
|
10.44
|
|||
|
+(38)
|
10.45
|
|||
|
+(39)
|
10.46
|
|||
|
+(39)
|
10.47
|
|||
|
+(40)
|
10.48
|
|||
|
+(39)
|
10.49
|
|||
|
+(41)
|
10.50
|
|||
|
+(42)
|
10.51
|
|||
|
+(43)
|
10.52
|
|||
|
+(44)
|
10.53
|
|
||
|
21.1
|
||||
|
23.1
|
||||
111
|
31.1
|
||||
|
31.2
|
||||
|
32.1**
|
||||
|
101.INS***
|
XBRL Instance Document
|
|||
|
101.SCH***
|
XBRL Taxonomy Extension Schema Document
|
|||
|
101.CAL***
|
XBRL Taxonomy Extension Calculation Linkbase Document
|
|||
|
101.DEF***
|
XBRL Taxonomy Extension Definition Linkbase Document
|
|||
|
101.LAB***
|
XBRL Taxonomy Extension Label Linkbase Document
|
|||
|
101.PRE***
|
XBRL Taxonomy Extension Presentation Linkbase Document
|
|||
|
(1)
|
Filed as an exhibit to Registrant’s Current Report on Form 8-K filed on May 8, 2014, and incorporated herein by reference.
|
|
(2)
|
Filed as an exhibit to Registrant’s Current Report on Form 8-K filed on December 23, 2015, and incorporated herein by reference.
|
|
(3)
|
Filed as an exhibit to Registrant’s Current Report on Form 8-K filed on April 1, 2011, and incorporated herein by reference.
|
|
(4)
|
Filed as an exhibit to Registrant’s Current Report on Form 8-K filed on December 13, 2011, and incorporated herein by reference.
|
|
(5)
|
Filed as an exhibit to Registrant’s Current Report on Form 8-K filed on March 7, 2014, and incorporated herein by reference.
|
|
(6)
|
Filed as an exhibit to Registrant’s Current Report on Form 8-K filed on November 17, 2014, and incorporated herein by reference.
|
|
(7)
|
Filed as an exhibit to Registrant’s Current Report on Form 8-K filed on September 14, 2015, and incorporated herein by reference.
|
|
(8)
|
Filed as an exhibit to Registrant’s Current Report on Form 8-K filed on September 20, 2016, and incorporated herein by reference.
|
|
(9)
|
Filed as an exhibit to Registrant’s Current Report on Form 8-K filed on September 21, 2017, and incorporated herein by reference.
|
|
(10)
|
Filed as an exhibit to Registrant’s Current Report on Form 8-K filed on September 13, 2017, and incorporated herein by reference.
|
|
(11)
|
Filed as an exhibit to Registrant’s Current Report on Form 8-K filed on May 12, 2017, and incorporated herein by reference.
|
|
(12)
|
Filed as an exhibit to Registrant’s Annual Report on Form 10-K for the fiscal year ended December 31, 2007, and incorporated herein by reference.
|
|
(13)
|
Filed as an exhibit to Registrant’s Quarterly Report on Form 10-Q for the quarter ended June 30, 2009, and incorporated herein by reference.
|
|
(14)
|
Filed as an exhibit to Registrant’s Annual Report on Form 10-K for the fiscal year ended December 31, 2009, and incorporated herein by reference.
|
|
(15)
|
Filed as an exhibit to Registrant’s Quarterly Report on Form 10-Q for the quarter ended March 31, 2011, and incorporated herein by reference.
|
|
(16)
|
Filed as an exhibit to Registrant’s Quarterly Report on Form 10-Q for the quarter ended June 30, 2013, and incorporated herein by reference
|
|
(17)
|
Filed as an exhibit to Registrant’s Quarterly Report on Form 10-Q for the quarter ended June 30, 2014, and incorporated herein by reference.
|
|
(18)
|
Filed as an exhibit to Registrant’s Quarterly Report on Form 10-Q for the quarter ended June 30, 2012, and incorporated herein by reference.
|
|
(19)
|
Filed as an exhibit to Registrant’s Quarterly Report on Form 10-Q for the quarter ended March 31, 2016, and incorporated herein by reference.
|
|
(20)
|
Filed as an exhibit to Registrant’s Quarterly Report on Form 10-Q for the quarter ended March 31, 2015, and incorporated herein by reference.
|
|
(21)
|
Filed as an exhibit to Registrant’s Current Report on Form 8-K filed on May 8, 2015, and incorporated herein by reference.
|
|
(22)
|
Filed as an exhibit to Registrant’s Annual Report on Form 10-K for the fiscal year ended December 31, 2001, and incorporated herein by reference.
|
|
(23)
|
Filed as an exhibit to Registrant’s Annual Report on Form 10-K for the fiscal year ended December 31, 2008, and incorporated herein by reference.
|
|
(24)
|
Filed as an exhibit to Registrant’s Current Report on Form 8-K filed on March 11, 2016, and incorporated herein by reference.
|
|
(25)
|
Filed as an exhibit to Registrant’s Annual Report on Form 10-K for the fiscal year ended December 31, 2015, and incorporated herein by reference.
|
|
(26)
|
Filed as an exhibit to Registrant’s Current Report on Form 8-K filed on May 17, 2016, and incorporated herein by reference.
|
|
(27)
|
Filed on Registrant’s Current Report on Form 8-K filed on February 5, 2018, and incorporated herein by reference.
|
|
(28)
|
Filed as an exhibit to Registrant’s Quarterly Report on Form 10-Q for the quarter ended June 30, 2008, and incorporated herein by reference.
|
|
(29)
|
Filed as an exhibit to Registrant’s Quarterly Report on Form 10-Q for the quarter ended June 30, 2016, and incorporated herein by reference.
|
|
(30)
|
Filed as an exhibit to Registrant’s Registration Statement on Form S-1 (No. 33-55680), as amended, and incorporated herein by reference.
|
|
(31)
|
Filed as an exhibit to Registrant’s Annual Report on Form 10-K for the fiscal year ended December 31, 2006, and incorporated herein by reference.
|
|
(32)
|
Filed as an exhibit to Registrant’s Annual Report on Form 10-K for the fiscal year ended March 31, 1994, and incorporated herein by reference.
|
|
(33)
|
Filed as an exhibit to Registrant’s Annual Report on Form 10-K for the fiscal year ended December 31, 2000, and incorporated herein by reference.
|
|
(34)
|
Filed as an exhibit to Registrant’s Quarterly Report on Form 10-Q for the quarter ended September 30, 2006, and incorporated herein by reference.
|
|
(35)
|
Filed as an exhibit to Registrant’s Quarterly Report on Form 10-Q for the quarter ended September 30, 2013, and incorporated herein by reference.
|
|
(36)
|
Filed as an exhibit to Triangle Pharmaceuticals, Inc.’s Quarterly Report on Form 10-Q/A filed on November 3, 1999, and incorporated herein by reference.
|
|
(37)
|
Filed as an exhibit to Registrant’s Quarterly Report on Form 10-Q for the quarter ended September 30, 2005, and incorporated herein by reference.
|
|
(38)
|
Filed as an exhibit to Registrant’s Quarterly Report on Form 10-Q for the quarter ended March 31, 2005, and incorporated herein by reference.
|
|
(39)
|
Filed as an exhibit to Registrant’s Quarterly Report on Form 10-Q for the quarter ended September 30, 2011, and incorporated herein by reference.
|
|
(40)
|
Filed as an exhibit to Registrant’s Quarterly Report on Form 10-Q for the quarter ended June 30, 2015, and incorporated herein by reference.
|
|
(41)
|
Filed as an exhibit to Registrant’s Annual Report on Form 10-K for the fiscal year ended December 31, 2013, and incorporated herein by reference.
|
|
(42)
|
Filed as an exhibit to Registrant’s Quarterly Report on Form 10-Q for the quarter ended September 30, 2014, and incorporated herein by reference.
|
|
(43)
|
Filed as an exhibit to Registrant’s Annual Report on Form 10-K for the fiscal year ended December 31, 2014, and incorporated herein by reference.
|
|
(44)
|
Filed as an exhibit to Kite Pharma, Inc.’s Registration Statement on Form S-1/A (No. 333-196081) filed on June 17, 2014, and incorporated herein by reference.
|
|
*
|
Management contract or compensatory plan or arrangement.
|
|
**
|
This certification accompanies the Form 10-K to which it relates, is not deemed filed with the Securities and Exchange Commission and is not to be incorporated by reference into any filing of Registrant under the Securities Act of 1933, as amended, or the Securities Exchange Act of 1934, as amended (whether made before or after the date of the Form 10-K), irrespective of any general incorporation language contained in such filing.
|
|
***
|
XBRL information is filed herewith.
|
|
+
|
Certain confidential portions of this Exhibit were omitted by means of marking such portions with an asterisk (the Mark). This Exhibit has been filed separately with the Secretary of the Securities and Exchange Commission without the Mark pursuant to Registrant’s Application Requesting Confidential Treatment under Rule 24b-2 under the Securities Exchange Act of 1934, as amended.
|
|
ITEM 16.
|
FORM 10-K SUMMARY
|
None.
112
SIGNATURES
Pursuant to the requirements of Section 13 or 15(d) of the Securities Exchange Act of 1934, the registrant has duly caused this report to be signed on its behalf by the undersigned, thereunto duly authorized.
|
G
ILEAD
S
CIENCES
, I
NC
.
|
|
|
By:
|
/
S
/ J
OHN
F. M
ILLIGAN
|
|
|
John F. Milligan, Ph.D.
President and Chief Executive Officer
|
POWER OF ATTORNEY
KNOW ALL PERSONS BY THESE PRESENTS, that each person whose signature appears below constitutes and appoints John F. Milligan and Brett A. Pletcher, and each of them, as his true and lawful attorneys-in-fact and agents, with full power of substitution and resubstitution, for him or her and in his or her name, place, and stead, in any and all capacities, to sign any and all amendments to this Report, and to file the same, with all exhibits thereto, and other documents in connection therewith, with the Securities and Exchange Commission, granting unto said attorneys-in-fact and agents, and each of them, full power and authority to do and perform each and every act and thing requisite and necessary to be done in connection therewith, as fully to all intents and purposes as he might or could do in person, hereby ratifying and confirming that all said attorneys-in-fact and agents, or any of them or their or his substitute or substitutes, may lawfully do or cause to be done by virtue hereof.
Pursuant to the requirements of the Securities Exchange Act of 1934, as amended, this Report has been signed below by the following persons on behalf of the registrant and in the capacities and on the dates indicated.
113
|
Signature
|
Title
|
Date
|
||
|
/
S
/ J
OHN
F. M
ILLIGAN
|
President and Chief Executive Officer, Director
|
February 26, 2018
|
||
|
John F. Milligan, Ph.D.
|
(Principal Executive Officer)
|
|||
|
/
S
/ R
OBIN
L. W
ASHINGTON
|
Executive Vice President and Chief Financial Officer
|
February 26, 2018
|
||
|
Robin L. Washington
|
(Principal Financial and Accounting Officer)
|
|||
|
/
S
/ J
OHN
C. M
ARTIN
|
Executive Chairman
|
February 26, 2018
|
||
|
John C. Martin, Ph.D.
|
||||
|
Director
|
February 26, 2018
|
|||
|
Jacqueline K. Barton*
|
||||
|
/
S
/ J
OHN
F. C
OGAN
|
Director
|
February 26, 2018
|
||
|
John F. Cogan
|
||||
|
/
S
/ K
ELLY
A. K
RAMER
|
Director
|
February 26, 2018
|
||
|
Kelly A. Kramer
|
||||
|
/
S
/ K
EVIN
E. L
OFTON
|
Director
|
February 26, 2018
|
||
|
Kevin E. Lofton
|
||||
|
/
S
/ N
ICHOLAS
G. M
OORE
|
Director
|
February 26, 2018
|
||
|
Nicholas G. Moore
|
||||
|
/
S
/ R
ICHARD
J. W
HITLEY
|
Director
|
February 26, 2018
|
||
|
Richard J. Whitley
|
||||
|
/
S
/ G
AYLE
E. W
ILSON
|
Director
|
February 26, 2018
|
||
|
Gayle E. Wilson
|
||||
|
/
S
/ P
ER
W
OLD
-O
LSEN
|
Director
|
February 26, 2018
|
||
|
Per Wold-Olsen
|
||||
|
*
|
Dr. Barton was not a member of our Board of Directors during the reporting period. She was appointed to our Board on January 31, 2018.
|
114
TABLE OF CONTENTS
Part IItem 1. BusinessItem 1A. Risk FactorsItem 1B. Unresolved Staff CommentsItem 2. PropertiesItem 3. Legal ProceedingsItem 4. Mine Safety DisclosuresPart IIItem 5. Market For Registrant S Common Equity, Related Stockholder Matters and Issuer Purchases Of Equity SecuritiesItem 6. Selected Financial DataItem 7. Management S Discussion and Analysis Of Financial Condition and Results Of OperationsItem 7A. Quantitative and Qualitative Disclosures About Market RiskItem 8. Financial Statements and Supplementary DataItem 9. Changes in and Disagreements with Accountants on Accounting and Financial DisclosureItem 9A. Controls and ProceduresItem 9B. Other InformationPart IIIItem 10. Directors, Executive Officers and Corporate GovernanceItem 11. Executive CompensationItem 12. Security Ownership Of Certain Beneficial Owners and Management and Related Stockholder MattersItem 13. Certain Relationships and Related Transactions, and Director IndependenceItem 14. Principal Accountant Fees and ServicesPart IVItem 15. Exhibits and Financial Statement SchedulesItem 16. Form 10-k Summary