SECURITIES AND EXCHANGE COMMISSION
WASHINGTON, D.C. 20549
FORM 20-F
|
o
|
REGISTRATION STATEMENT PURSUANT TO SECTION 12(b) OR (g) OF THE SECURITIES EXCHANGE ACT OF 1934
|
or
|
x
|
ANNUAL REPORT PURSUANT TO SECTION 13 OR 15(d) OF THE SECURITIES EXCHANGE ACT OF 1934
|
For the fiscal year ended December 31, 2014
or
|
o
|
TRANSITION REPORT PURSUANT TO SECTION 13 OR 15(d) OF THE SECURITIES EXCHANGE ACT OF 1934
|
For the transition period from __________ to __________
or
|
o
|
SHELL COMPANY REPORT PURSUANT TO SECTION 13 OR 15(d) OF THE SECURITIES EXCHANGE ACT OF 1934
|
Date of event requiring this shell company report _________
Commission file number:
0-21218
GILAT SATELLITE NETWORKS LTD.
(Exact name of Registrant as specified in its charter)
ISRAEL
(Jurisdiction of incorporation or organization)
Gilat House, 21 Yegia Kapayim Street, Kiryat Arye, Petah Tikva, 4913020 Israel
(Address of principal executive offices)
Securities registered or to be registered pursuant to Section 12(b) of the Act:
|
Title of each class
Ordinary Shares, NIS 0.20 nominal value
|
Name of each exchange on which registered
NASDAQ Global Select Market
|
Securities registered or to be registered pursuant of Section 12(g) of the Act:
None
Securities for which there is a reporting obligation pursuant to Section 15(d) of the Act:
None
Indicate the number of outstanding shares of each of the issuer’s classes of capital or common stock at the close of the period covered by the annual report:
42,730,424 Ordinary Shares, NIS 0.20 nominal value per share
(as of December 31, 2014)
Indicate by check mark if the registrant is a well-known seasoned issuer, as defined in Rule 405 of the Securities Act.
Yes
o
No
x
If this report is an annual or transition report, indicate by check mark if the registrant is not required to file reports pursuant to Section 13 or 15(d) of the Securities Exchange Act of 1934.
Yes
o
No
x
Indicate by check mark whether the registrant (1) has filed all reports required to be filed by Section 13 or 15(d) of the Securities Exchange Act of 1934 during the preceding 12 months (or for such shorter period that the registrant was required to file such reports), and (2) has been subject to such filing requirements for the past 90 days.
Yes
x
No
o
Indicate by check mark whether the registrant has submitted electronically and posted on its corporate Web site, if any, every Interactive Data File required to be submitted and posted pursuant to Rule 405 of Regulation S-T (232.405 of this chapter) during the preceding 12 months (or for such shorter period that the registrant was required to submit and post such files).
Yes
x
No
o
Indicate by check mark whether the registrant is a large accelerated filer, an accelerated filer, or a non-accelerated filer. See definition of “accelerated filer and large accelerated filer” in Rule 12b-2 of the Exchange Act. (Check one):
|
Large accelerated filer
o
|
Accelerated filer
x
|
Non-accelerated filer
o
|
Indicate by check mark which basis of accounting the registrant has used to prepare the financial statements included in this filing:
|
x
U.S. GAAP
|
o
|
International Financial Reporting Standards as issued by the International Accounting Standards Board |
o
Other
|
If “Other” has been checked in response to the previous question, indicate by check mark which financial statement item the registrant has elected to follow.
Item 17
o
Item 18
o
If this is an annual report, indicate by check mark whether the registrant is a shell company (as defined in Rule 12b-2 of the Exchange Act).
Yes
o
No
x
This report on Form 20-F is being incorporated by reference into our Registration Statements on Form F-3 (Registration No. 333-195680) and the Registration Statements on Form S-8 (Registration Nos. 333-113932, 333-123410, 333-132649, 333-158476, 333-180552 and 333-187021 ).
INTRODUCTION
We are a leading global provider of broadband satellite communication and networking solutions and services. We design, produce and market very small aperture terminals, or VSATs, solid-state power amplifiers, or SSPAs, block up converters, or BUCs, low-profile antennas and on-the-Move / on-the-Pause terminals. VSATs are earth-based terminals that transmit and receive broadband Internet, voice, data and video via satellite. VSAT networks have significant advantages over wireline and wireless networks, as VSATs can provide highly reliable, cost-effective, end-to-end communications regardless of the number of sites or their geographic locations. In addition, we provide for the cellular market integrated small cell with our satellite backhaul.
We have a large installed customer base and since 1989 we have shipped more than one million VSAT units, over 3,000 low profile antennas and approximately 15,000 BUCs and SSPAs to customers in approximately 90 countries on six continents. We have 20 sales and support offices worldwide, three network operations centers, or NOCs, and five R&D centers. Our products are sold to communication service providers and operators that use VSATs to serve enterprise, government and residential users, to mobile network operators and to system integrators that use our technology. Our solutions and services are also sold to defense and homeland security organizations as well as governments. In addition, we provide services directly to end-users in various market segments, including in certain countries in Latin America and also provide managed network services , such as in Australia, over a VSAT network owned by a third party.
Starting in 2012, in accordance with the organizational changes within our company, we operate three business divisions, comprised of our Commercial, Mobility (formerly known as “Defense”) and Services divisions:
|
|
•
|
Commercial Division - provides VSAT networks, satellite communication products, small cell solutions and associated professional services to service providers, satellite operators and Mobile Network Operators (MNOs) worldwide, including for high throughput satellites, or HTS, initiatives worldwide.
|
|
|
•
|
Mobility Division - provides on-the-Move / on-the-Pause satellite communication products and solutions to system integrators, defense and homeland security organizations worldwide and also includes the operations of Wavestream Corporation, or Wavestream, our subsidiary, whose sales are primarily to system integrators, defense and homeland security organizations.
|
|
|
•
|
Services Division – provides rural telephony and Internet access solutions services and operates these networks in Peru and Colombia.
|
In December 2013, we sold our Spacenet subsidiary, to SageNet for approximately $16 million, subject to certain post-closing adjustments and expenses. During 2014, the post-closing adjustments were resolved and consequently we incurred additional expenses of approximately $0.8 million related to those adjustments. Spacenet was previously accounted under the Service Division. Following its sale, Spacenet’s results are accounted as discontinued operations. The results presented in this Annual Report on Form 20-F were adjusted to present Spacenet’s results and income and costs related to the sale of Spacenet in a separate line as “Discontinued Operations”.
Our ordinary shares are traded on the NASDAQ Global Select Market under the symbol “GILT” and on the Tel Aviv Stock Exchange, or the TASE. As used in this annual report, the terms “we”, “us”, “Gilat” and “our” mean Gilat Satellite Networks Ltd. and its subsidiaries, unless otherwise indicated.
The mark “Gilat®” and the marks ”SkyEdge®,” “Wavestream®”, “AeroStream™”, and “Raysat™” and other marks appearing in this annual report on Form 20-F marked with “® “ or “™” are trademarks of our company and its subsidiaries. Other trademarks appearing in this Annual Report on Form 20-F are owned by their respective holders.
This Annual Report on Form 20-F contains various “forward-looking statements” within the meaning of Section 27A of the Securities Act of 1933, as amended, and Section 21E of the Securities Exchange Act of 1934, as amended, and within the Private Securities Litigation Reform Act of 1995, as amended. Such forward-looking statements reflect our current view with respect to future events and, financial results of operations. Forward-looking statements usually include the verbs, “anticipates,” “believes,” “estimates,” “expects,” “intends,” “plans,” “projects,” “understands" and other verbs suggesting uncertainty. We remind readers that forward-looking statements are merely predictions and therefore inherently subject to uncertainties and other factors and involve known and unknown risks that could cause the actual` results, performance, levels of activity, or our achievements, or industry results to be materially different from any future results, performance, levels of activity, or our achievements expressed or implied by such forward-looking statements. Readers are cautioned not to place undue reliance on these forward-looking statements which speak only as of the date hereof. We undertake no obligation to publicly release any revisions to these forward-looking statements to reflect events or circumstances after the date hereof or to reflect the occurrence of unanticipated events. We have attempted to identify additional significant uncertainties and other factors affecting forward-looking statements in the Risk Factors section which appears in Item 3D: “Key Information–Risk Factors”.
Our consolidated financial statements appearing in this annual report are prepared in U.S. dollars and in accordance with U.S. generally accepted accounting principles, or U.S. GAAP. All references in this annual report to “dollars” or “$” are to U.S. dollars and all references in this annual report to “NIS” are to New Israeli Shekels. The representative exchange rate between the NIS and the dollar as published by the Bank of Israel on December 31, 2014 was NIS 3.889 per $1.00.
Statements made in this Annual Report concerning the contents of any contract, agreement or other document are summaries of such contracts, agreements or documents and are not complete descriptions of all of their terms. If we filed any of these documents as an exhibit to this Annual Report or to any registration statement or annual report that we previously filed, you may read the document itself for a complete description of its terms.
TABLE OF CONTENTS
|
PART I
|
|
1
|
|
1
|
||
|
1
|
||
|
1
|
||
|
A.
|
Selected Consolidated Financial Data
|
1
|
|
B.
|
Capitalization and Indebtedness
|
2
|
|
C.
|
Reasons for the Offer and Use of Proceeds
|
2
|
|
D.
|
Risk Factors
|
2
|
| 22 | ||
|
A.
|
History and Development of the Company
|
22
|
|
B.
|
Business Overview
|
23
|
|
C.
|
Organizational Structure
|
38 |
|
D.
|
Property, Plants and Equipment
|
38 |
|
39
|
||
|
39
|
||
|
A.
|
Operating Results
|
39
|
|
B.
|
Liquidity and Capital Resources
|
57
|
|
C.
|
Research and Development
|
59
|
|
D.
|
Trend Information
|
60
|
|
E.
|
Off-Balance Sheet Arrangements
|
60
|
|
F.
|
Tabular Disclosure of Contractual Obligations
|
61
|
|
61
|
||
|
A.
|
Directors and Senior Management
|
61
|
|
B.
|
Compensation of Directors and Officers
|
66
|
|
C.
|
Board Practices
|
69
|
|
D.
|
Employees
|
76
|
|
E.
|
Share Ownership
|
77
|
|
79
|
||
|
A.
|
Major Shareholders
|
79
|
|
B.
|
Related Party Transactions.
|
82
|
|
C.
|
Interests of Experts and Counsel.
|
82
|
|
82
|
||
| A. | Consolidated Statements | 82 |
| B. | Significant Changes | 83 |
|
84
|
||
|
A.
|
Offer and Listing Details
|
84
|
|
B.
|
Plan of Distribution
|
85
|
|
C.
|
Markets
|
85
|
|
D.
|
Selling Shareholders
|
85
|
|
E.
|
Dilution
|
85
|
|
F.
|
Expense of the Issue
|
85
|
|
85
|
||
|
A.
|
Share Capital
|
85
|
|
B.
|
Memorandum and Articles of Association
|
85
|
|
C.
|
Material Contracts
|
90
|
|
D.
|
Exchange Controls
|
90
|
|
E.
|
Taxation
|
91
|
|
F.
|
Dividend and Paying Agents
|
91
|
|
G.
|
Statement by Experts
|
99
|
|
H.
|
Documents on Display
|
99
|
|
I.
|
Subsidiary Information
|
100
|
|
100
|
||
|
101
|
||
|
PART II
|
102
|
|
|
102
|
||
|
102
|
||
|
102
|
||
|
104
|
||
|
104
|
||
|
104
|
||
| 104 | ||
|
105
|
||
|
105
|
||
|
105
|
||
|
105
|
||
|
106
|
||
|
PART III
|
|
106
|
|
106
|
||
|
106
|
||
|
106
|
||
|
108
|
||
|
IDENTITY OF DIRECTORS, SENIOR MANAGEMENT AND ADVISORS
|
Not Applicable.
|
OFFER STATISTICS AND EXPECTED TIMETABLE
|
Not Applicable.
|
KEY INFORMATION
|
|
A.
|
Selected Consolidated Financial Data
|
The selected consolidated statement of operations data set forth below for the years ended December 31, 2014, 2013 and 2012, and the selected consolidated balance sheet data as of December 31, 2014 and 2013 are derived from our audited consolidated financial statements that are included elsewhere in this Annual Report. These financial statements have been prepared in accordance with U.S. GAAP. The selected consolidated statement of operations data set forth below for the years ended December 31, 2011 and 2010 and the selected consolidated balance sheet data as of December 31, 2012, 2011 and 2010 are derived from our audited consolidated financial statements that are not included in this Annual Report.
The selected consolidated financial data set forth below should be read in conjunction with and is qualified entirely by reference to
Item 5: “Operating and Financial Review and Prospects”
and the Consolidated Financial Statements and Notes thereto included in Item 18 in this Annual Report on Form 20-F.
Statement of Operations Data for Year ended December 31,
|
2014
|
2013
|
2012
|
2011
|
2010
|
||||||||||||||||
|
U.S. Dollars in thousands, except for share data
|
||||||||||||||||||||
|
Revenues:
|
||||||||||||||||||||
|
Products
|
157,531 | 133,554 | 155,691 | 174,313 | 104,113 | |||||||||||||||
|
Services
|
77,602 | 101,312 | 115,875 | 71,018 | 52,180 | |||||||||||||||
|
Total
|
235,133 | 234,866 | 271,566 | 245,331 | 156,293 | |||||||||||||||
|
Cost of revenues:
|
||||||||||||||||||||
|
Products
|
106,905 | 86,304 | 96,805 | 93,989 | 47,083 | |||||||||||||||
|
Services
|
44,593 | 68,906 | 76,832 | 48,409 | 41,475 | |||||||||||||||
|
Total
|
151,498 | 155,210 | 173,637 | 142,398 | 88,558 | |||||||||||||||
|
Gross profit
|
83,635 | 79,656 | 97,929 | 102,933 | 67,735 | |||||||||||||||
|
Operating expenses:
|
||||||||||||||||||||
|
Research and development, net
|
25,158 | 27,900 | 29,241 | 31,701 | 18,945 | |||||||||||||||
|
Selling and marketing
|
32,537 | 32,214 | 34,988 | 35,370 | 24,347 | |||||||||||||||
|
General and administrative
|
20,903 | 23,071 | 23,618 | 24,738 | 19,110 | |||||||||||||||
|
Costs related to acquisition transactions
|
— | — | — | — | 3,842 | |||||||||||||||
|
Restructuring costs
|
- | 564 | 315 | 398 | — | |||||||||||||||
|
Impairment of goodwill and intangible assets
|
— | — | 31,879 | 17,846 | — | |||||||||||||||
|
Operating income (loss)
|
5,037 | (4,093 | ) | (22,112 | ) | (7,120 | ) | 1,491 | ||||||||||||
|
Financial expenses, net
|
(3,837 | ) | (6,239 | ) | (3,432 | ) | (3,235 | ) | (410 | ) | ||||||||||
|
Other income
|
— | — | 2,729 | 8,074 | 37,360 | |||||||||||||||
|
Income (loss) before taxes on income
|
1,200 | (10,332 | ) | (22,815 | ) | (2,281 | ) | 38,441 | ||||||||||||
|
Taxes on income (tax benefit)
|
1,901 | (755 | ) | (1,893 | ) | (430 | ) | 11 | ||||||||||||
|
Net income (loss) from continuing operations
|
(701 | ) | (9,577 | ) | (20,922 | ) | (1,851 | ) | 38,430 | |||||||||||
|
Net loss from discontinued operations
|
(795 | ) | (8,320 | ) | (2,270 | ) | (3,999 | ) | (7,811 | ) | ||||||||||
|
Net income (loss)
|
(1,496 | ) | (17,897 | ) | (23,192 | ) | (5,850 | ) | 30,619 | |||||||||||
|
Basic net earnings (loss) per share from continuing operations
|
(0.02 | ) | (0.23 | ) | (0.51 | ) | (0.04 | ) | 0.95 | |||||||||||
|
Basic net loss per share from discontinued operations
|
(0.02 | ) | (0.20 | ) | (0.05 | ) | (0.10 | ) | (0.19 | ) | ||||||||||
|
Basic net earnings (loss) per share
|
(0.04 | ) | (0.43 | ) | (0.56 | ) | (0.14 | ) | 0.76 | |||||||||||
|
Diluted net earnings (loss) per share from continuing operations
|
(0.02 | ) | (0.23 | ) | (0.51 | ) | (0.04 | ) | 0.92 | |||||||||||
|
Diluted net loss per share from discontinued operations
|
(0.02 | ) | (0.20 | ) | (0.05 | ) | (0.10 | ) | (0.19 | ) | ||||||||||
|
Diluted net earnings (loss) per share
|
(0.04 | ) | (0.43 | ) | (0.56 | ) | (0.14 | ) | 0.73 | |||||||||||
Balance sheet data as of December 31 (including the assets and liabilities, short term and long term, related to Spacenet accounted as discontinued operations),
|
2014
|
2013
|
2012
|
2011
|
2010
|
||||||||||||||||
|
U.S. dollars in thousands
|
||||||||||||||||||||
|
Working capital
|
66,588 | 77,307 | 108,401 | 62,704 | 78,808 | |||||||||||||||
|
Total assets. .
|
364,908 | 368,768 | 414,643 | 446,678 | 455,378 | |||||||||||||||
|
Short-term bank credit and loans and current maturities
|
20,452 | 4,665 | 11,480 | 22,063 | 4,315 | |||||||||||||||
|
Convertible subordinated notes, net of current maturities
|
— | — | — | — | 14,379 | |||||||||||||||
|
Long term loan, net of current maturities
|
26,271 | 31,251 | 40,747 | 40,353 | 45,202 | |||||||||||||||
|
Other long-term liabilities
|
13,336 | 14,505 | 21,848 | 34,786 | 43,832 | |||||||||||||||
|
Shareholders’ equity
|
225,139 | 226,033 | 241,957 | 260,075 | 264,113 | |||||||||||||||
|
B.
|
Capitalization and Indebtedness
|
Not applicable.
|
C.
|
Reasons for the Offer and Use of Proceeds
|
Not applicable.
|
D.
|
Risk Factors
|
Investing in our ordinary shares involves a high degree of risk and uncertainty. You should carefully consider the risks and uncertainties described below before investing in our ordinary shares. If any of the following risks actually occurs, our business, prospects, financial condition and results of operations could be materially harmed. In that case, the value of our ordinary shares could decline substantially, and you could lose all or part of your investment.
2
Risks Relating to Our Business
We have incurred major losses in past years and may not operate profitably in the future.
We reported an operating profit of $5 million and a net loss from continuing operations of $0.7 million in the year ended December 31, 2014, compared to an operating loss of $4.1 million and a net loss from continuing operations of $9.6 million in 2013. Our improved operating results in 2014 are mainly due to cost reductions. Our 2013 net loss is mainly attributable to the decrease in our revenues compared to 2012We incurred major losses in prior years and as of December 31, 2014 have an accumulated deficit of $652 million. We cannot assure you that we can operate profitably in the future. If we do not achieve profitable operations, our share price will decline and the viability of our company will be in question.
Our available cash balance may decrease in the future if we cannot generate cash from operations.
Our cash and cash equivalents as of December 31, 2014 was $27.7 million compared to $58.4 million as of December 31, 2013. Our negative cash flow from continuing operating activities was approximately $16.2 million in the year ended December 31, 2014, compared to a positive cash flow from continuing operating activities of $16.4 million in the year ended December 31, 2013.The decline in our cash flow from operating activities is mainly attributable to our investments in projects in Peru and Colombia. If we do not generate sufficient cash from operations in the future, including from our large-scale projects, our cash balance will decline and the unavailability of cash could have a material adverse effect on our business, operating results and financial condition.
The delivery of our large scale projects requires us to invest significant funds and incur significant expenses before we receive full payment from our customers. This applies to the FITEL Regional Projects awarded to our subsidiary, Gilat Peru, by the Peruvian government (through FITEL), which are expected to generate $285 million in revenues over approximately 11 years. In general we use bank loans to finance such projects. If we fail to obtain the necessary funding or if we fail to obtain such funds on favorable terms, we will not be able to meet our commitments and our cash flow and operational results may be adversely affected.
If the commercial satellite communications markets fail to grow, our business could be materially harmed.
A number of the commercial markets for our products and services in the satellite communications area, including high throughput satellite and commercial on the move, have emerged in recent years. Because these markets are relatively new, it is difficult to predict the rate at which these markets will grow, if at all. If the markets for commercial satellite communications products fail to grow, our business could be materially harmed. Conversely, growth in these markets could result in satellite capacity limitations which in turn could materially harm our business and impair the value of our shares. Specifically, we derive most of our revenues from sales of satellite based communications networks and related equipment and provision of services related to these networks and products. A significant decline in this market or the replacement of VSAT and other satellite based technologies by an alternative technology could materially harm our business and impair the value of our shares.
Because we compete for large-scale contracts in competitive bidding processes, losing a small number of bids or a decrease in the revenues generated from our large scale projects could have a significant adverse impact on our operating results.
A significant portion of our revenues is derived from large -scale contracts that we are awarded from time to time in competitive bidding processes. These large- scale contracts sometimes involve the installation of thousands of VSATs. The number of major bids for these large-scale contracts for satellite-based networks in any given year is limited and the competition is intense. Losing or defaulting on a relatively small number of bids each year could have a significant adverse impact on our operating results.
3
In March 2015, the Peruvian government awarded Gilat Peru the Regional FITEL Projects for the construction of networks, operation of the networks for a defined period and their transfer to the government, which are expected to generate revenues of $285 million, to be recognized over a period of approximately 11 years. In accordance with the bid conditions, we will establish a Peruvian subsidiary to enter into written agreements with the Peruvian government for each of the three regional projects that were awarded.
In December 2013, Gilat Colombia was awarded a project, which is expected to generate revenues of $99 million over approximately three and a half years as part of the Kioscos Digitales project initiated by the Colombian Ministry of Information Technologies and Communications. In December 2013, Gilat Peru won a $30 million contract from FITEL for construction of a network, its operation over 10 years and other related services. See Item 4.B. – “Information on the Company – Business Overview – Services Division – overview”. If we default on any such large scale contract or bid requirements or if such contract is terminated, completed or reduced for any other reason, this could have an adverse impact on our operating results.
Many of our large scale contracts are with governments or large governmental agencies in Latin America and other parts of the world, so that any volatility in the political or economic situation or any unexpected unilateral termination or suspension of payments could have a significant adverse impact on our business.
In recent years, a significant portion of our revenues has been derived from large scale contracts with foreign governments and agencies, either directly or through contractors and system integrators, including those in Peru, Colombia, and Australia. Agreements with the governments in these countries typically include unilateral early termination clauses and involve other risks such as the imposition of new government regulations and taxation that could pose additional financial burdens on us. Changes in the political or economic situation in these countries can result in the early termination of our business there. Any termination of our business in any of the aforementioned countries could have a significant adverse impact on our business.
In March 2015, the Peruvian government (through FITEL) awarded Gilat Peru the Regional FITEL Projects with expected revenues of $285 million over approximately 11 years for the construction of networks, operation of the networks for a defined period and their transfer to the government. In December 2013, Gilat Colombia was awarded a three and a half year long project valued at $99 million as part of the Kioscos Digitales project initiated by the Colombian Ministry of Information Technologies and Communications. In December 2013, Gilat Peru won a $30 million contract from the Peruvian government (through FITEL) for construction of a network, its operation over 10 years and other related services. See Item 4.B. – “Information on the Company – Business Overview – Services Division – overview.”
Our failure to deliver upon our large-scale projects in an economical manner or a delay in collection of payments due to us in connection with any such large-scale project, could have a significant adverse impact on our operating results.
We have been awarded a number of large-scale projects by foreign governments. The Peruvian FITEL Regional Projects that we were awarded in March 2015 are expected to generate revenues of $285 million over approximately 11 years, for the construction of networks to be operated by us for a defined period, and then transferred to the Peruvian government. While we have experience in the successful
implementation of
large-scale network infrastructure projects in rural areas, the FITEL Regional Projects are complex and require cooperation of certain third parties. Additionally, the delivery of such large-scale projects requires us to invest significant funds and incur significant expenses prior to generating revenues and receiving payment to cover such expenses. A failure to meet the projects’ schedule or fulfill our obligations in a timely manner could result in payment of fines and impact our ability to receive and recognize the expected revenues in part or in full in a timely manner, which could have a significant adverse impact on our operating results. Further, a failure to deliver upon our projects in an economical manner within the project’s budget could result in losses and significantly adversely impact our operating results.
4
We operate in the highly competitive network communications industry. We may be unsuccessful in competing effectively.
We operate in a highly competitive industry of network communications, both in the sales of our products and our services. As a result of the rapid technological changes that characterize our industry, we face intense worldwide competition to capitalize on new opportunities, to introduce new products and to obtain proprietary and standard technologies that are perceived by the market as being superior to those of our competitors. Some of our competitors have greater financial resources, providing them with greater research and development and marketing capabilities. Our competitors may also be more experienced in obtaining regulatory approvals for their products and services and in marketing them. Our relative position in the network communications industry may place us at a disadvantage in responding to our competitors' pricing strategies, technological advances and other initiatives. Our principal competitors in the supply of VSAT networks are Hughes Network Systems, LLC, or HNS, ViaSat Inc. or Viasat, iDirect Technologies, or iDirect, and Newtec
Cy N.V. Most of our competitors have developed or adopted different technology standards for their VSAT products.
Our low-profile in-motion antennas target a market that has not yet matured and we compete with products from competitors such as General Dynamics, Cobham, Orbit Communication Systems, Qest Quantum Electronic Systems GmbH, L-3 Communications Holdings, Inc. , or L-3, Tecom Industries, Inc., or Tecom, and Thinkom Solutions. Wavestream’s competitors include Comtech Xicom Technology, Inc., CPI Satcom (which acquired Codan Satcom in 2012), General Dynamics SATCOM Technologies, and Paradise Datacom.
In addition, ViaSat and HNS have launched their own satellites, which enable them to offer vertically integrated solutions to their customers, which may further change the competitive environment in which we operate and could have an adverse effect on our business.
In Peru and Colombia, where we primarily operate public rural telecom services (voice, data and Internet) and recently undertook construction of fiber-optic transport and access networks based on wireless, we typically encounter competition on government subsidized bids from various service providers, system integrators and consortiums. Some of these competitors offer solutions based on VSAT technology and some on terrestrial technologies (typically, fiber and wireless technologies). In addition, as competing technologies such as cellular telephones and fiber optics in Peru and Colombia become available in rural areas where not previously available, our business could be adversely affected.
Our lengthy sales cycles could harm our results of operations if forecasted sales are delayed or do not occur.
The length of time between the date of initial contact with a potential customer or sponsor and the execution of a contract with the potential customer or sponsor may be lengthy and vary significantly depending on the nature of the arrangement. During any given sales cycle, we may expend substantial funds and management resources and not obtain significant revenue, resulting in a negative impact on our operating results. In some cases, we have seen longer sales cycles in all of the regions in which we do business. In addition, we have seen projects delayed or even canceled, which would also have an adverse impact on our sales cycles. In our mobility and defense businesses, in particular, sales cycles may be longer and it may be difficult to accurately forecast sales due to the uncertainty around defense projects and their award and starting periods.
We have made acquisitions and may in the future enter into acquisitions that could harm our business, results of operations and financial condition, and dilute our shareholders' equity.
We generally seek to acquire businesses that enhance our capabilities and add new technologies, products, services and customers to our existing businesses. We may not be able to continue to identify acquisition candidates on commercially reasonable terms or at all. If we make additional business acquisitions, we may not realize the benefits anticipated from these acquisitions, including sales growth, cost synergies and improving margins. Furthermore, we may not be able to obtain additional financing for business acquisitions, since such additional financing could be restricted or limited by the terms of our debt agreements or due to unfavorable capital market conditions.
5
Further, once integrated, acquisitions may not achieve comparable levels of revenues, profitability or productivity as our existing business or otherwise perform as expected. The occurrence of any of these events could harm our business, financial condition or results of operations.
In 2010, we completed the acquisition of RaySat Antenna Systems, or RAS, a leading provider of -on-the-move antenna solutions, of RaySat BG, a Bulgarian research and development center, and of Wavestream, a provider of SSPAs and BUCs, with high performance solutions designed for mobile and fixed satellite communication, or Satcom, systems worldwide. We may not be able to successfully integrate the businesses or exploit the solutions that we acquired or will acquire in the future. Further, we may not be able to achieve our growth targets for the acquired businesses, which could result in our incurring impairment charges. If our projection for growth in the airborne business does not materialize and we fail to obtain other business in our Defense Division, we would likely record an impairment of goodwill.
Future acquisitions may require substantial capital resources, which may not be available to us or may require us to seek additional debt or equity financing.
The risks associated with acquisitions by us include the following, any of which could seriously harm our results of operations or the price of our shares:
|
|
·
|
issuance of equity securities as consideration for acquisitions that would dilute our current shareholders' percentages of ownership;
|
|
|
·
|
significant acquisition costs;
|
|
|
·
|
decrease of our cash balance;
|
|
|
·
|
the incurrence of debt and contingent liabilities;
|
|
|
·
|
difficulties in the assimilation and integration of operations, personnel, technologies, products and information systems of the acquired companies;
|
|
|
·
|
diversion of management's attention from other business concerns;
|
|
|
·
|
contractual disputes;
|
|
|
·
|
risks of entering geographic and business markets in which we have no or only limited prior experience;
|
|
|
·
|
potential loss of key employees of acquired organizations.
|
|
|
·
|
the possibility that business cultures will not be compatible;
|
|
|
·
|
the difficulty of incorporating acquired technology and rights into our products and services;
|
|
|
·
|
unanticipated expenses related to integration of the acquired companies;
|
|
|
·
|
difficulties in implementing and maintaining uniform standards, controls and policies;
|
Any of these events would likely result in a material adverse effect on our financial position, results of operations and cash flows.
6
The continued decline in or a redirection of the U.S. defense budget could result in a material decrease in our sales, results of operations and cash flows.
Our contracts and sales with and to systems integrators in connection with government contracts in the U.S. are subject to the congressional budget authorization and appropriations process. Congress appropriates funds for a given program on a fiscal year basis, even though contract periods of performance may extend over many years. Consequently, at the beginning of a major program, the contract is partially funded, and additional monies are normally committed to the contract by the procuring agency only as appropriations are made by Congress in future fiscal years. Department of Defense, or DoD, budgets are a function of factors beyond our control, including, but not limited to, changes in U.S. procurement policies, budget considerations, current and future economic conditions, presidential administration priorities, changing national security and defense requirements, geopolitical developments and actual fiscal year congressional appropriations for defense budgets. Any of these factors could result in a significant decline in, or redirection of, current and future DoD budgets and impact our future results of operations.
The cuts in the DoD budget from the sequestration that was in effect in 2013 have had an adverse effect on the results of our Wavestream subsidiary in 2013 and 2012. In 2013 and 2012, Wavestream’s revenues from sales of SSPAs to systems integrators for government contracts decreased compared to our forecast and its revenues in the prior year, and we recorded impairment charges to goodwill and other intangible assets related to our investment in Wavestream of $31.9 million in 2012. See Item 5 – “Operating and Financial Review and Prospects
–
Operating Results”. In 2014, Wavestream’s revenues from sales of SSPAs to systems integrators for government contracts increased compared to 2013. In 2013 and 2014 we performed an impairment test and no impairment charges were identified.
Concerns about increased deficit spending, along with continued economic challenges, continue to place pressure on the DoD budget and international customer budgets. These may result in reduced demand for our products, resulting in a reduction in our revenues, and an adverse effect on our business and results of operations, which could potentially trigger further goodwill impairment charges. Uncertainties in governmental spending may also adversely affect our efforts to further penetrate the defense market with our defense-related products. Any of these events would likely result in a material adverse effect on our financial position, results of operations and cash flows.
If we are unable to competitively operate within the network communications market and respond to new technologies, our business could be adversely affected.
The network communications market, which our products and services target, is characterized by rapid technological changes, new product introductions and evolving industry standards. If we fail to stay abreast of significant technological changes, our existing products and technology could be rendered obsolete. Historically, we have endeavored to enhance the applications of our existing products to meet the technological changes and industry standards. Our success is dependent upon our ability to continue to develop new innovative products, applications and services and meet developing market needs.
To remain competitive in the network communications market, we must continue to be able to anticipate changes in technology, market demands and industry standards and to develop and introduce new products, applications and services, as well as enhancements to our existing products, applications and services. Competitors in satellite ground equipment market and low-profile antenna market are introducing new and improved products and our ability to remain competitive in this field will depend in part on our ability to advance our own technology. New products and technologies for power amplifiers, such as Gallium Nitride, or GaN, may compete with our current Wavestream SSPA offerings and may reduce the market prices and success of Wavestream’s products. If we are unable to respond to technological advances on a cost-effective and timely basis, or if our new products or applications are not accepted by the market, our business, financial condition and operating results could be adversely affected.
7
A decrease in the selling prices of our products and services could materially harm our business.
The average selling prices of wireless communications products historically decline over product life cycles. In particular, we expect the average selling prices of our products to decline as a result of competitive pricing pressures and customers who negotiate discounts based on large unit volumes. A decrease in the selling prices of our products and services could have a material adverse effect on our business.
If we are unable to competitively operate within the HTS satellite environment, our business could be adversely affected.
In the U.S. market, some of our competitors have launched Ka-band satellites. These actions may affect our competitiveness due to the relative lower cost of Ka-band space segment per user as well as the increased integration of the VSAT technology in the satellite solution. Due to the current nature of the HTS solution where the initial investment in ground segment gateway equipment is relatively high, ground segment equipment effectively becomes tightly coupled to the specific satellite technology. As such, there may be circumstances where it is difficult for competitors to compete with the incumbent VSAT vendor using the particular HTS satellite. If this occurs, the market dynamics may change to favor a VSAT vendor partnering with the satellite service provider, which may decrease the number of vendors who may be able to succeed. If we are unable to forge such a partnership our business could be adversely affected.
Although we have entered the HTS market with responsive HTS VSAT technology, we expect that our penetration into that market will be gradual and our success is not assured. In addition, our competitors, who are producing large numbers of HTS VSATs, may benefit from cost advantages. If we are unable to reduce our HTS VSAT costs sufficiently, we may not be competitive in the international market. We also expect that competition in this industry will continue to increase.
If we lose existing contracts or orders for our products are not renewed, our ability to generate revenues will be harmed.
A significant part of our business in previous years, including in 2014, was generated from recurring customers. Accordingly, the termination or non-renewal of our contracts could have a material adverse effect on our business, financial condition and operating results. Some of our existing contracts could be terminated due to any of the following reasons, among others:
|
|
·
|
dissatisfaction of our customers with our products and/or the services we provide or our inability to provide or install additional products or requested new applications on a timely basis;
|
|
|
·
|
customers' default on payments due;
|
|
|
·
|
our failure to comply with financial covenants in our contracts;
|
|
|
·
|
the cancellation of the underlying project by the sponsoring government body; or
|
|
|
·
|
the loss of existing contracts or a decrease in the number of renewals of orders or a decrease in the number of new large orders.
|
If we are not able to retain our present customer base and gain new customers, our revenues will decline significantly. In addition, if our service businesses in Peru and Colombia do not win new government related contracts, this could materially adversely affect our financial position.
8
If we fail to penetrate new markets and expand our business in markets other than the defense market in the U.S., our business in the U.S. will remain dependent on the defense market, a reduction of which
could have a material adverse effect on our overall business
.
A substantial portion of our product revenues from North America are dependent on business from the defense market, being derived directly or indirectly through contractors and system integrators from sales to government agencies, mainly the DoD, pursuant to contracts awarded under defense-related programs. Government spending under such contracts may cease or may be reduced, which would cause a negative effect on our revenues, results of operations, cash flow and financial condition. We experienced a reduction in revenues from such customers in recent years and there is no assurance that there will not be a further reduction in the future. Although we have begun to move into the avionics and international markets, we may not be successful in our plans to penetrate these markets, which are relatively new and untried for our SSPA product line and will require additional expenditures for research and development and sales and marketing. We may also not be able to develop new technologies for those markets on a timely basis. Barriers to entry into those markets or delays in our development programs could have a material adverse effect on our business and operating results.
Our failure to obtain or maintain authorizations under the U.S. export control and trade sanctions laws and regulations could have a material adverse effect on our business.
The export of some of our satellite communication products, related technical information and services is subject to U.S. State Department, Commerce Department and Treasury Department regulations, including International Traffic in Arms Regulations, or ITAR. Under ITAR, our non US employees, including employees of our headquarters in Israel are barred from accessing certain information of our U.S. subsidiaries, unless appropriate licenses are obtained. In addition to the U.S. export control laws and regulations applicable to us, some of our subcontractors and vendors may also be subject to U.S. export control laws and regulations. These subcontractors and vendors may be forced to flow down requirements and restrictions imposed on products and services we purchase from them. If we do not maintain our existing authorizations or obtain necessary future authorizations under the export control laws and regulations of the U.S., including by entering into technical assistance agreements to disclose technical data or provide services to foreign persons, we may be unable to export technical information or equipment to non-U.S. persons and companies, including to our own non-U.S. employees, as may be required to fulfill contracts we may enter into.
In addition, to participate in classified U.S. government programs, we would have to obtain security clearances from the DoD, for one or more of our subsidiaries that would want to participate. Such clearance may require that we enter into a proxy agreement or another similar arrangement with the U.S. government, which would limit our ability to control the operations of the subsidiary and which may impose on us substantial administrative burdens in order to comply. Further, if we materially violate the terms of any proxy agreement, the subsidiary holding the security clearances may be suspended or debarred from performing any government contracts, whether classified or unclassified. If we fail to maintain or obtain the necessary authorizations under the U.S. export control laws and regulations, we may not be able to realize our market focus and our business could be materially adversely affected.
If we are unable to comply with Israel’s enhanced export control regulations our ability to export our products from Israel could be negatively impacted
.
Our export of military products and related technical information is also subject to enhanced Israeli Ministry of Defense regulations regarding defense export controls and the export of “dual use” items (items that are typically sold in the commercial market but that may also be used in the defense market). Some of our products are exempted from Israeli Ministry of Defense export control. The Israeli Ministry of Defense may change the classification of our existing commercial products or may determine that new products we develop are not exempt from Israeli Ministry of Defense export control. This would place such products subject to the Israeli Ministry of Defense export control regulations as military products or “dual use” items, which would impose on our sales process stringent constraints in relation to each sale transaction and limit our markets. If we do not maintain our existing authorizations and exemption or obtain necessary future authorizations and exemptions under the export control laws and regulations of Israel, including export licenses for the sale of our equipment and the transfer of technical information, we may be unable to export technical information or equipment outside of Israel, we may not be able to realize our market focus and our business could be materially adversely affected /
9
We are dependent on contracts with governments around the world for a significant portion of our revenue. These contracts may expose us to additional business risks and compliance obligations.
We have focused on expanding our business to include contracts with or for various governments and governmental agencies around the world, including U.S. federal, state, and local government agencies through contractors or systems integrators. Our contracts with international governments generally contain unfavorable termination provisions.
Our
governmental customers generally may unilaterally suspend us from receiving new contracts pending resolution of alleged violations of procurement laws or regulations and terminate existing contracts and audit our contract-related costs. If a termination right is exercised by a governmental customer, it could have a material adverse effect on our business, financial condition, results of operations and cash flows.
Additionally, our business generated from government contracts may be materially adversely affected if:
|
|
·
|
our reputation or relationship with government agencies is impaired;
|
|
|
·
|
we are suspended or otherwise prohibited from contracting with a domestic or foreign government or any significant law enforcement agency;
|
|
|
·
|
levels of government expenditures and authorizations for law enforcement and security related programs decrease or shift to program in areas where we do not provide products and services;
|
|
|
·
|
we are prevented from entering into new government contracts or extending existing government contracts based on violations or suspected violations of laws or regulations, including those related to procurement;
|
|
|
·
|
we are not granted security clearances that are required to sell our products to domestic or foreign governments or such security clearances are deactivated;
|
|
|
·
|
there is a change in government procurement procedures or conditions of remuneration; or
|
|
|
·
|
there is a change in the political climate that adversely affects our existing or prospective relationships.
|
We depend on our main facility in Israel and are susceptible to any event that could adversely affect its condition as well as the condition of our facilities elsewhere.
A material portion of our laboratory capacity, our principal offices and principal research and development facilities are concentrated in a single location in Israel. We also have significant facilities for research and development and manufacturing of components for our low profile antennas at a single location in Bulgaria as well as a research and development center in Moldova. Wavestream’s principal offices, research and development and engineering and manufacturing facilities are located at a single location in California and its additional research and development and engineering facility is located in Singapore. Fire, natural disaster or any other cause of material disruption in our operation in any of these locations could have a material adverse effect on our business, financial condition and operating results.
10
We are dependent upon a limited number of suppliers for key components that are incorporated in our products, including those used to build our hubs and VSATs, and may be significantly harmed if we are unable to obtain such components on favorable terms or on a timely basis. We are also dependent upon a limited number of suppliers of space segment, or transponder capacity, and may be significantly harmed if we are unable to obtain the space segment for the provision of services on favorable terms or on a timely basis.
Several of the components required to build our VSATs and hubs are manufactured by a limited number of suppliers. Although we have managed to solve the difficulties we had with our suppliers with respect to availability of components, we cannot assure you of the continued availability of key components or our ability to forecast our component requirements sufficiently in advance. Our research and development and operations groups are continuously working with our suppliers and subcontractors to obtain components for our products on favorable terms in order to reduce the overall price of our products. If we are unable to obtain the necessary volume of components at sufficiently favorable terms or prices, we may be unable to produce our products at competitive prices. As a result, sales of our products may be lower than expected, which could have a material adverse effect on our business, financial condition and operating results. In addition, our suppliers are not always able to meet our requested lead times. If we are unable to satisfy customers' needs on time, we could lose their business.
In 2007, we entered into an outsourcing manufacturing agreement with a single source manufacturer for almost all of our VSAT indoor units. This agreement exposes us to certain risks related to our dependence on a single manufacturer which could include failure in meeting time tables and quantities, or material price increases which may affect our ability to provide competitive prices. We estimate that the replacement of the outsourcing manufacturer would, if necessary, take a period of between six to nine months.
There are only a limited number of suppliers of satellite transponder capacity and a limited amount of space segment available. We are dependent on these suppliers for our provision of services in Peru, and Colombia. While we do secure long term agreements with our satellite transponder providers, we cannot assure the continuous availability of space segment, the pricing upon renewals of space segment and the continuous availability and coverage in the regions where we supply services. If we are unable to secure contracts with satellite transponder providers with reliable service at competitive prices, our services business could be adversely affected.
We would be adversely affected if we are unable to attract and retain key personnel
Our success depends in part on key management, sales, marketing and development personnel and our continuing ability to attract and retain highly qualified personnel, including with respect to our acquired companies. There is competition for the services of such personnel. The loss of the services of senior management and key personnel, and the failure to attract highly qualified personnel in the future, may have a negative impact on our business. Moreover, our competitors may hire and gain access to the expertise of our former employees or our former employees may compete with us. In 2014, three key employees of our Wavestream subsidiary, including Wavestream’s chief executive officer, resigned from Wavestream. While we have successfully found replacements for these employees in a timely manner, there is no assurance that such former employees will not compete with us or that we will be able to find replacements for departing key employees in the future.
If demand for our Satcom-On-The-Move products, VSATs and other products declines or if we are unable to develop products to meet demand,
our business could be adversely affected
.
Our low-profile in-motion antenna systems and a portion of our SSPA product lines are intended for mobile Satcom-On-The-Move applications. If the demand for such products, our VSATs or other products declines, or if we are unable to develop products that are competitive in technology and pricing, we may not be able to realize our market focus and our Satcom-On-The-Move business and other businesses could be materially adversely affected.
11
We may be unable to adequately protect our proprietary rights, which may limit our ability to compete effectively.
Our business is based mainly on our proprietary technology and related products and services. We establish and protect proprietary rights and technology used in our products by the use of patents, trade secrets, copyrights and trademarks. We also utilize non-disclosure and intellectual property assignment agreements. Because of the rapid technological changes and innovation that characterize the network communications industry, our success will depend in large part on our ability to protect and defend our intellectual property rights. Our actions to protect our proprietary rights in our VSAT and SSPAs technology and other products may be insufficient to protect our intellectual property rights and prevent others from developing products similar to our products. In addition, the laws of many foreign countries do not protect our intellectual property rights to the same extent as the laws of the U.S. or we may have failed to enter into non-disclosure and intellectual property assignment agreements with certain persons. If we are unable to protect our intellectual property, our ability to operate our business and generate expected revenues may be harmed.
Breaches of network or information technology security, natural disasters or terrorist attacks could have an adverse effect on our business.
Breaches of network or information technology (IT) security, including unauthorized access or security breaches, inclement weather, natural or man-made disasters, earthquakes, explosions, terrorist attacks, acts of war, floods, fires, cyber-attacks, computer viruses, power loss, telecommunications or equipment failures, transportation interruptions, accidents or other disruptive events or attempts to harm our systems
may cause equipment failures or disrupt our systems and operations. In particular, both unsuccessful and successful cyber-attacks on companies have increased in frequency, scope and potential harm in recent years. Any such event result in our inability to operate our facilities, which, even if the event is for a limited period of time, may result in significant expenses and/or loss of market share to other competitors in the market for telemanagement products and invoice management solutions. While we maintain insurance coverage for some of these events, which could offset some of the losses, the potential liabilities associated with these events could exceed the insurance coverage we maintain. A failure to protect the privacy of customer and employee confidential data against breaches of network or IT security could result in damage to our reputation. Any of these occurrences could result in a material adverse effect on our results of operations and financial condition.
We have been subject, and will likely continue to be subject, to attempts to breach the security of our networks and IT infrastructure through cyber-attack, malware, computer viruses and other means of unauthorized access. However, to date, we have not been subject to cyber-attacks or other cyber incidents which, individually or in the aggregate, resulted in a material impact to our operations or financial condition.
Trends and factors affecting the telecommunications industry are beyond our control and may result in reduced demand and pricing pressure on our products.
We operate in the telecommunication industry and are influenced by trends of that industry, which are beyond our control and may affect our operations. These trends include:
|
|
·
|
adverse changes in the public and private equity and debt markets and our ability, as well as the ability of our customers and suppliers, to obtain financing or to fund working capital and capital expenditures;
|
|
|
·
|
adverse changes in the credit ratings of our customers and suppliers;
|
|
|
·
|
adverse changes in the market conditions in our industry and the specific markets for our products;
|
|
|
·
|
access to, and the actual size and timing of, capital expenditures by our customers;
|
|
|
·
|
inventory practices, including the timing of product and service deployment, of our customers;
|
|
|
·
|
the amount of network capacity and the network capacity utilization rates of our customers, and the amount of sharing and/or acquisition of new and/or existing network capacity by our customers;
|
|
|
·
|
the overall trend toward industry consolidation and rationalization among our customers, competitors, and suppliers;
|
12
|
|
·
|
price reductions by our direct competitors and by competing technologies including, for example, the introduction of HTS satellite systems by our direct competitors which could significantly drive down market prices or limit the availability of satellite capacity for use with our VSAT systems;
|
|
|
·
|
conditions in the broader market for communications products, including data networking products and computerized information access equipment and services;
|
|
|
·
|
governmental regulation or intervention affecting communications or data networking;
|
|
|
·
|
monetary instability in the countries where we operate; and
|
|
|
·
|
the effects of war and acts of terrorism, such as disruptions in general global economic activity, changes in logistics and security arrangements, and reduced customer demand for our products and services.
|
These trends and factors may reduce the demand for our products and services or require us to increase our research and development expenses and may harm our financial results.
Unfavorable global economic conditions could have a material adverse effect on our business, operating results and financial condition
The financial and economic conditions in the countries in which we operate may cause revenues of our customers to decrease. This may result in reductions in sales of our products and services in some markets, longer sales cycles, slower adoption of new technologies and increased price competition. In addition, weakness in the end-user market could negatively affect the cash flow of our customers who could, in turn, delay paying their obligations to us or ask us for vendor financing. This could increase our credit risk exposure and cause delays in our recognition of revenues on future sales to these customers. Specific economic trends, such as declines in the demand for telecommunications products and services, the tightening of credit markets, or weakness in corporate spending, could have a direct impact on our business. Any of these events would likely harm our business, operating results and financial condition. If global economic and market conditions do not improve, or weaken further, it may have a material adverse effect on our business, operating results and financial condition.
Our international sales expose us to changes in foreign regulations and tariffs, tax exposures, political instability and other risks inherent to international business, any of which could adversely affect our operations.
We sell and distribute our products and provide our services internationally, particularly in the U.S., Latin America, Asia, Asia Pacific, Africa and Europe. A component of our strategy is to continue and expand in international markets. Our operations can be limited or disrupted by various factors known to affect international trade. These factors include the following:
|
|
·
|
imposition of governmental controls, regulations and taxation which might include a government's decision to raise import tariffs or license fees in countries in which we do business;
|
|
|
·
|
government regulations that may prevent us from choosing our business partners or restrict our activities;
|
|
|
·
|
the U.S. Foreign Corrupt Practices Act, or the FCPA, and similar anti-corruption laws in other jurisdictions, which include anti-bribery provisions. We have adopted internal policies mandating compliance with these laws. Nevertheless, we may not always be protected in cases of violation of the FCPA or other anti-corruption laws by our employees or third-parties acting on our behalf. A violation of anti-corruption laws by our employees or third-parties during the performance of their obligations for us may have a material adverse effect on our reputation, operating results and financial condition;
|
13
|
|
·
|
tax exposures in various jurisdictions relating to our activities throughout the world;
|
|
|
·
|
political and/or economic instability in countries in which we do or desire to do business. Such unexpected changes could have an adverse effect on the gross margin of some of our projects. This includes similar risks from potential or current political and economic instability as well as volatility of foreign currencies in countries such as Colombia, Brazil, Venezuela and certain countries in East Asia;
|
|
|
·
|
difficulties in staffing and managing foreign operations that might mandate employing staff in various countries to manage foreign operations. This requirement could have an adverse effect on the profitability of certain projects;
|
|
|
·
|
longer payment cycles and difficulties in collecting accounts receivable;
|
|
|
·
|
foreign exchange risks due to fluctuations in local currencies relative to the dollar; and
|
|
|
·
|
relevant zoning ordinances that may restrict the installation of satellite antennas and might also reduce market demand for our service. Additionally, authorities may increase regulation regarding the potential radiation hazard posed by transmitting earth station satellite antennas' emissions of radio frequency energy that may negatively impact our business plan and revenues.
|
Any decline in commercial business in any country may have an adverse effect on our business as these trends often lead to a decline in technology purchases or upgrades by private companies. We expect that in difficult economic periods, countries in which we do business will find it more difficult to raise financing from investors for the further development of the telecommunications industry and private companies will find it more difficult to finance the purchase or upgrade of our technology. Any such changes could adversely affect our business in these and other countries.
We may face difficulties in obtaining regulatory approvals for our telecommunication services and products, which could adversely affect our operations.
Certain of our telecommunication operations require licenses and approvals by the Israeli Ministry of Communication, the Federal Communications Commission, or FCC, in the U.S. and by regulatory bodies in other countries. In Israel and the U.S., the operation of satellite earth station facilities and VSAT systems such as ours are prohibited except under licenses issued by the Israeli Ministry of Communication and the FCC in the U.S. Our airborne products require licenses and approvals by the Federal Aviation Agency, or FAA. We must also obtain approval of the regulatory authority in each country in which we propose to provide network services or operate VSATs. The approval process in Latin America and elsewhere can often take a substantial amount of time and require substantial resources.
In addition, any licenses and approvals that are granted may be subject to conditions that may restrict our activities or otherwise adversely affect our operations. Also, after obtaining the required licenses and approvals, the regulating agencies may, at any time, impose additional requirements on our operations. We cannot assure you that we will be able to comply with any new requirements or conditions imposed by such regulating agencies on a timely or economically efficient basis.
Our products are also subject to requirements to obtain certification of compliance with local regulatory standards. Delays in receiving such certification could adversely affect our operations.
14
Currency exchange rates and fluctuations of currency exchange rates may adversely affect our results of operations, liabilities, and assets.
Since we operate in several countries, we are impacted by currency exchange rates and fluctuations of various currencies. Although partially mitigated by our hedging activities, we are impacted by currency exchange rates and fluctuations thereof in a number of ways, including the following:
|
|
·
|
A significant portion of our expenses, principally salaries and related personnel expenses, are incurred in new Israeli shekels (or NIS), and to a lesser extent, other non-U.S. dollar currencies, whereas the currency we use to report our financial results is the U.S. dollar and a significant portion of our revenue is generated in U.S. dollars. A significant strengthening of the NIS against the U.S. dollar can considerably increase the U.S. dollar value of our expenses in Israel and our results of operations may be adversely affected;
|
|
|
·
|
A portion of our international sales is denominated in currencies other than the U.S. dollar, including the Colombian Peso, Australian Dollar, Brazilian Real, Peruvian Sol, Russian Ruble and the Mexican Peso, therefore we are exposed to the risk of devaluation of such currencies relative to the dollar which could have a negative impact on our revenues;
|
|
|
·
|
We have assets and liabilities that are denominated in non-U.S. dollar currencies. Therefore, significant fluctuation in these other currencies could have significant effect on our results; and
|
|
|
·
|
A portion of our U.S. dollar revenues are derived from customers operating in local currencies which are different from the U.S. dollar. Therefore, devaluation in the local currencies of our customers relative to the U.S. dollar could cause our customers to cancel or decrease orders or delay payment.
|
We are also subject to other foreign currency risks including repatriation restrictions in certain countries, particularly in Latin America.
As noted above, from time to time, we enter into hedging transactions to attempt to limit the impact of foreign currency fluctuations. However, the protection provided by such hedging transactions may be partial and leave certain exchange rate-related losses and risks uncovered. Therefore, our business and profitability may be harmed by such exchange rate fluctuations.
The transfer and use of some of our technology and its production is limited because of the research and development grants we received from the Israeli government to develop such technology.
Our research and development efforts associated with the development of certain of our products have been partially financed through grants from the Office of the Chief Scientist of the Israeli Ministry of Economy, or the OCS. We are subject to certain restrictions under the terms of the OCS grants. Specifically, any product incorporating technology developed with the funding provided by these grants may not be manufactured, nor may the technology which is embodied in our products be transferred outside of Israel without appropriate governmental approvals. Such approvals, if granted, may involve increased royalties payments to the OCS (for royalty-bearing programs). These restrictions do not apply to the sale or export from Israel of our products developed with this technology.
We may be subject to claims by third parties alleging that we infringe intellectual property owned by them. We may be required to commence litigation to protect our intellectual property rights. Any intellectual property litigation may continue for an extended period and may materially adversely affect our business, financial condition and operating results.
There are numerous patents, both pending and issued, in the network communications industry. We may unknowingly infringe on a patent. We may from time to time be notified of claims that we are infringing on patents, copyrights or other intellectual property rights owned by third parties. While we do not believe that we have infringed in the past or are infringing at present on any intellectual property rights of third parties, we cannot assure you that we will not be subject to such claims or that damages for any such claim will not be awarded against us by court.
15
In addition, we may be required to commence litigation to protect our intellectual property rights and trade secrets, to determine the validity and scope of the proprietary rights of others or to defend against third-party claims of invalidity or infringement. An adverse result of any litigation could force us to pay substantial damages, stop designing, manufacturing, using or selling related products, spend significant resources to develop alternative technologies, discontinue using certain processes or obtain licenses. In addition, we may not be able to develop alternative technology, and we may not be able to find appropriate licenses on reasonably satisfactory terms. Any such litigation, could result in substantial costs and diversion of resources and could have a material adverse effect on our business, financial condition and operating results.
We are subject to new regulations related to “conflict minerals”, which could adversely impact our business.
In August 2012, based on the Dodd-Frank Wall Street Reform and Consumer Protection Act, the Securities and Exchange Commission adopted annual disclosure and reporting requirements for those companies who use
certain minerals known as “conflict minerals” mined from the Democratic Republic of Congo and adjoining countries
in their products. These new requirements
became effective for calendar year 2013 and annually thereafter
, with initial disclosure requirements beginning in May 2014. There have been and will continue to be costs associated with complying with these disclosure requirements, including for diligence to determine the sources of conflict minerals used in our products and potentially changes to products, processes or sources of supply as a consequence of such verification activities. The implementation of these rules could adversely affect the sourcing, supply and pricing of materials used in our products. As there may be only a limited number of suppliers offering “conflict free" minerals, we cannot be sure that we will be able to obtain the necessary minerals from such suppliers in sufficient quantities or at competitive prices. Also, we may face reputational challenges if we determine that certain of our products contain minerals not determined to be conflict free or if we are unable to sufficiently verify the origins for all conflict minerals used in our products through the procedures we may implement.
Potential product liability claims relating to our products could have a material adverse effect on our business.
We may be subject to product liability claims relating to the products we sell. Potential product liability claims could include, among other things, those for exposure to electromagnetic radiation from the antennas we provide. We endeavor to include in our agreements with our business customers provisions designed to limit our exposure to potential claims. We also maintain a product liability insurance policy. However, our contractual limitation of liability may be rejected or limited in certain jurisdiction and our insurance may not cover all relevant claims or may not provide sufficient coverage. To date, we have not experienced any material product liability claim. Our business, financial condition and operating results could be materially adversely affected if costs resulting from future claims are not covered by our insurance or exceed our coverage.
Our insurance coverage may not be sufficient for every aspect or risk related to our business.
Our business includes risks, only some of which are covered by our insurance. For example, in our satellite capacity agreements, we do not have a backup for satellite capacity, and we do not have indemnification or insurance in the event that our supplier's satellite malfunctions or data is lost.
Satellites utilize highly complex technology and operate in the harsh environment of space and therefore are subject to significant operational risks while in orbit. The risks include in-orbit equipment failures, malfunctions and other kinds of problems commonly referred to as anomalies. Satellite anomalies include, for example, circuit failures, transponder failures, solar array failures, telemetry transmitter failures, battery cell and other power system failures, satellite control system failures and propulsion system failures. Liabilities in connection with our products may be covered by insurance only to a limited extent or not covered at all. In addition, we are not covered by our insurance for acts of fraud or theft. Our business, financial condition and operating results could be materially adversely affected if we incur significant costs resulting from these exposures.
16
Environmental laws and regulations may subject us to significant liability.
Our operations are subject to various Israeli, U.S. federal, state and local as well as certain other foreign environmental laws and regulations within the countries in which we operate relating to the discharge, storage, treatment, handling, disposal and remediation of certain materials, substances and wastes used in our operations.
New laws and regulations, stricter enforcement of existing laws and regulations, the discovery of previously unknown contamination or the imposition of new clean-up requirements may require us to incur a significant amount of additional costs in the future and could decrease the amount of cash flow available to us for other purposes, including capital expenditures, research and development and other investments and could have a material adverse effect on our business, financial condition, results of operations, cash flows and future prospects.
Risks Related to Ownership of Our Ordinary Shares
Our share price has been highly volatile and may continue to be volatile and decline.
The trading price of our shares has fluctuated widely in the past and may continue to do so in the future as a result of a number of factors, many of which are outside our control. In addition, the stock market has experienced extreme price and volume fluctuations that have affected the market prices of many technology companies, particularly telecommunication and Internet-related companies, and that have often been unrelated or disproportionate to the operating performance of these companies. These broad market fluctuations could adversely affect the market price of our shares. In the past, following periods of volatility in the market price of a particular company's securities, securities class action litigation has often been brought against that company. Securities class action litigation against us could result in substantial costs and a diversion of our management's attention and resources.
Our operating results may vary significantly from quarter to quarter and these quarterly variations in operating results, as well as other factors, may contribute to the volatility of the market price of our shares.
Our operating results have and may continue to vary significantly from quarter to quarter. The causes of fluctuations include, among other things:
|
|
·
|
the timing, size and composition of orders from customers;
|
|
|
·
|
the timing of introducing new products and product enhancements by us and the level of their market acceptance;
|
|
|
·
|
the mix of products and services we offer; and
|
|
|
·
|
the changes in the competitive environment in which we operate.
|
The quarterly variation of our operating results, may, in turn, create volatility in the market price for our shares. Other factors that may contribute to wide fluctuations in our market price, many of which are beyond our control, include, but are not limited to:
|
|
·
|
economic instability;
|
|
|
·
|
announcements of technological innovations;
|
|
|
·
|
customer orders or new products or contracts;
|
|
|
·
|
competitors' positions in the market;
|
|
|
·
|
changes in financial estimates by securities analysts;
|
17
|
|
·
|
conditions and trends in the VSAT and other technology industries relevant to our businesses;
|
|
|
·
|
our earnings releases and the earnings releases of our competitors; and
|
|
|
·
|
the general state of the securities markets (with particular emphasis on the technology and Israeli sectors thereof).
|
In addition to the volatility of the market price of our shares, the stock market in general and the market for technology companies in particular have been highly volatile and at times thinly traded. Investors may not be able to resell their shares during and following periods of volatility.
We may in the future be classified as a passive foreign investment company, or PFIC, which will subject our U.S. investors to adverse tax rules.
Holders of our ordinary shares who are U.S. residents may face income tax risks. There is a risk that we will be treated as a “passive foreign investment company” or PFIC. Our treatment as a PFIC could result in a reduction in the after-tax return to the holders of our ordinary shares and would likely cause a reduction in the value of such shares. A foreign corporation will be treated as a PFIC for U.S. federal income tax purposes if either (1) at least 75% of its gross income for any taxable year consists of certain types of “passive income,” or (2) at least 50% of the average value of the corporation’s gross assets produce, or are held for the production of, such types of “passive income.” For purposes of these tests, “passive income” includes dividends, interest, gains from the sale or exchange of investment property and rents and royalties other than rents and royalties that are received from unrelated parties in connection with the active conduct of trade or business. For purposes of these tests, income derived from the performance of services does not constitute “passive income”. Those holders of shares in a PFIC who are citizens or residents of the U.S. or domestic entities would alternatively be subject to a special adverse U.S. federal income tax regime with respect to the income derived by the PFIC, the distributions they receive from the PFIC and the gain, if any, they derive from the sale or other disposition of their shares in the PFIC. In particular, any dividends paid by us, if any, would not be treated as “qualified dividend income” eligible for preferential tax rates in the hands of non-corporate U.S. shareholders. U.S. residents should carefully read Item 10E. “Additional Information – Taxation”, of this annual report on Form 20-F for a more complete discussion of the U.S. federal income tax risks related to owning and disposing of our ordinary shares.
The concentration of our ordinary share ownership may limit our shareholders’ ability to influence corporate matters.
As of March 25
,
2015, FIMI Opportunity IV, L.P., FIMI Israel Opportunity IV, Limited Partnership, FIMI Opportunity V, L.P. and FIMI Israel Opportunity Five, Limited Partnership, or the FIMI Funds, and entities affiliated with the FIMI Funds beneficially own approximately 34.9% of our outstanding ordinary shares.
As a result, the FIMI Funds may have a substantial influence over matters that require approval by our shareholders, including the election of directors and approval of significant corporate transactions. This concentration of ownership might also have the effect of delaying or preventing a change of control of our company that other shareholders may view as beneficial.
Future sales of our ordinary shares and the future exercise of options may cause the market price of our ordinary shares to decline and may result in a substantial dilution.
We cannot predict what effect, if any, future sales of our ordinary shares by the FIMI Funds and our other significant shareholders, or the availability for future sale of our ordinary shares, including shares issuable upon the exercise of our options, will have on the market price of our ordinary shares. In May 2014 we filed a shelf registration statement with the Securities and Exchange Commission allowing for our issuance and sale of up to $50 million in ordinary shares, warrants to purchase ordinary shares or debt securities, debt securities consisting of debentures, notes or other evidences of indebtedness, subscription rights or units comprised of one or more of the other aforementioned securities. The shelf registration statement will expire in May 2017. Sales of substantial amounts of our ordinary shares in the public market by our company or our significant shareholders, or the perception that such sales could occur, could adversely affect the market price of our ordinary shares and may make it more difficult for you to sell your ordinary shares at a time and price you deem appropriate.
18
We have never paid cash dividends and have no intention to pay dividends in the foreseeable future.
We have never paid cash dividends on our shares and do not anticipate paying any cash dividends in the foreseeable future. We intend to continue retaining earnings for use in our business, in particular to fund our research and development, which are important to capitalize on technological changes and develop new products and applications. In addition, the terms of some of our financing arrangements restrict us from paying dividends to our shareholders. Any future dividend distributions are subject to the discretion of our board of directors and will depend on various factors, including our operating results, future earnings, capital requirements, financial condition, tax implications of dividend distributions on our income, future prospects and any other factors deemed relevant by our board of directors. The distribution of dividends is also limited by Israeli law, which permits the distribution of dividends by an Israeli corporation only out of its retained earnings as defined in Israel’s Companies Law, 5759-1999, or the Companies Law, provided that there is no reasonable concern that such payment will cause us to fail to meet our current and expected liabilities as they become due, or otherwise with the court’s permission. You should not invest in our company if you require dividend income from your investment.
Our ordinary shares are traded on more than one market and this may result in price variations.
Our ordinary shares are traded on the NASDAQ Global Select Market and on the TASE. Trading in our ordinary shares on these markets is made in different currencies (U.S. dollars on the NASDAQ Global Select Market, and NIS on the TASE), and at different times (resulting from different time zones, different trading days and different public holidays in the U.S. and Israel). Consequently, the trading prices of our ordinary shares on these two markets often differ. Any decrease in the trading price of our ordinary shares on one of these markets could cause a decrease in the trading price of our ordinary shares on the other market.
If we are unable to maintain effective internal control over financial reporting in accordance with Section 404 of the Sarbanes-Oxley Act of 2002, the reliability of our financial statements may be questioned and our share price may suffer.
The Sarbanes-Oxley Act of 2002 imposes certain duties on us and on our executives and directors. To comply with this statute, we are required to document and test our internal control over financial reporting, and our independent registered public accounting firm must issue an attestation report on our internal control procedures, and our management is required to assess and issue a report concerning our internal control over financial reporting. Our efforts to comply with these requirements have resulted in increased general and administrative expenses and a diversion of management time and attention, and we expect these efforts to require the continued commitment of significant resources. We may identify material weaknesses or significant deficiencies in our assessments of our internal controls over financial reporting. Failure to maintain effective internal control over financial reporting could result in investigation or sanctions by regulatory authorities, and could adversely affect our operating results, investor confidence in our reported financial information and the market price of our ordinary shares.
Risks Related to Our Location in Israel
Political and economic conditions in Israel may limit our ability to produce and sell our products. This could have a material adverse effect on our operations and business
condition, harm our results of operations and adversely affect our share price.
We are incorporated under the laws of the State of Israel, where we also maintain our headquarters, manufacturing facilities and most of our research and development facilities. As a result, political, economic and military conditions affecting Israel directly influence us. Any major hostilities involving Israel, a full or partial mobilization of the reserve forces of the Israeli army, the interruption or curtailment of trade between Israel and its present trading partners, or a significant downturn in the economic or financial condition of Israel could adversely affect our business, financial condition and results of operations.
19
Since its establishment in 1948, Israel has been involved in a number of armed conflicts with its Arab neighbors and a state of hostility, varying from time to time in intensity and degree, has continued into 2014. In recent years, there was an escalation in violence among Israel, Hamas, the Palestinian Authority and other groups, as well as extensive hostilities along Israel’s border with the Gaza Strip such as the missiles fired from the Gaza Strip into Israel during July-August 2014. On July 21, 2014, all U.S. airlines and most major airlines of other nationalities suspended their flights to Israel’s Ben-Gurion International Airport for several days after a missile landed approximately 1.5 km away. Also, riots and uprisings in several countries in the Middle East and neighboring regions have led to severe political instability in several neighboring states and to a decline in the regional security situation. Such instability may affect the local and global economy, could negatively affect business conditions and, therefore, could adversely affect our operations. In addition, Iran has threatened to attack Israel and is widely believed to be developing nuclear weapons. Iran is also believed to have a strong influence among extremist groups in areas that neighbor Israel, such as Hamas in Gaza and Hezbollah in Lebanon. To date, these matters have not had any material effect on our business and results of operations; however, the regional security situation and worldwide perceptions of it are outside our control and there can be no assurance that these matters will not negatively affect us in the future.
Furthermore, there are a number of countries, primarily in the Middle East, as well as Malaysia and Indonesia that restrict business with Israel or Israeli companies, and we are precluded from marketing our products to these countries directly from Israel. Restrictive laws or policies directed towards Israel or Israeli businesses may have an adverse impact on our operations, our financial results or the expansion of our business.
Your rights and responsibilities as a shareholder are governed by Israeli law and differ in some respects from those under Delaware law.
Because we are an Israeli company, the rights and responsibilities of our shareholders are governed by our articles of association and by Israeli law. These rights and responsibilities differ in some respects from the rights and responsibilities of shareholders in a Delaware corporation. In particular, a shareholder of an Israeli company has a duty to act in good faith towards the company and other shareholders and to refrain from abusing his, her or its power in the company, including, among other things, in voting at the general meeting of shareholders on certain matters. Israeli law provides that these duties are applicable to shareholder votes on, among other things, amendments to a company’s articles of association, increases in a company’s authorized share capital, mergers and interested party transactions requiring shareholder approval. In addition, a shareholder who knows that it possesses the power to determine the outcome of a shareholders’ vote or to appoint or prevent the appointment of a director or executive officer in the company has a duty of fairness towards the company. However, Israeli law does not define the substance of this duty of fairness. There is little case law available to assist in understanding the implications of these provisions that govern shareholder behavior.
As a foreign private issuer whose shares are listed on the NASDAQ Global Select Market, we follow certain home country corporate governance practices instead of certain NASDAQ requirements, which may not afford shareholders with the same protections that shareholders of domestic companies have.
As a foreign private issuer whose shares are listed on the NASDAQ Global Select Market, we are permitted to follow certain home country corporate governance practices instead of certain requirements of The NASDAQ Marketplace Rules. We follow Israeli law and practice instead of The NASDAQ Marketplace Rules with respect to the director nominations process
and the requirement to obtain shareholder approval for the establishment or material amendment of certain equity-based compensation plans and arrangements. As a foreign private issuer listed on the NASDAQ Global Select Market, we may also follow home country practice with regard to, among other things, the requirement to obtain shareholder approval for certain dilutive events (such as for an issuance that will result in a change of control of the company, certain transactions other than a public offering involving issuances of a 20% or more interest in the company and certain acquisitions of the stock or assets of another company). A foreign private issuer that elects to follow a home country practice instead of NASDAQ requirements must submit to NASDAQ in advance a written statement from an independent counsel in such issuer’s home country certifying that the issuer’s practices are not prohibited by the home country’s laws. In addition, a foreign private issuer must disclose in its annual reports filed with the Securities and Exchange Commission each such requirement that it does not follow and describe the home country practice followed by the issuer instead of any such requirement. Accordingly, our shareholders may not be afforded the same protection as provided under NASDAQ’s corporate governance rules.
20
Our results of operations may be negatively affected by the obligation of our personnel to perform military service.
A significant number of our employees in Israel are obligated to perform annual reserve duty in the Israeli Defense Forces and may be called for active duty under emergency circumstances at any time. If a military conflict or war arises, these individuals could be required to serve in the military for extended periods of time. Our operations could be disrupted by a significant absence of one or more of our key employees or a significant number of other employees due to military service. Any disruption in our operations could adversely affect our business.
You may not be able to enforce civil liabilities in the U.S. against our officers and directors.
We are incorporated in Israel. Almost all of our directors and executive officers reside outside the U.S., and a significant portion of our assets and the personal assets of most of our directors and executive officers are located outside the U.S. Therefore, it may be difficult to effect service of process upon any of these persons within the U.S. In addition, a judgment obtained in the U.S. against us, or against such individuals, including but not limited to judgments based on the civil liability provisions of the U.S. federal securities laws, may not be collectible within the U.S.
Additionally, it may be difficult for an investor or any other person or entity, to assert U.S. securities law claims in original actions instituted in Israel. Israeli courts may refuse to hear a claim based on a violation of U.S. securities laws on the ground that Israel is not the most appropriate forum in which to bring such a claim. Even if an Israeli court agrees to hear a claim, it may determine that Israeli law is applicable to the claim. Certain matters of procedures will also be governed by Israeli law.
Israeli law may delay, prevent or make difficult a merger with or an acquisition of us, which could prevent a change of control and therefore depress the price of our shares.
Provisions of Israeli law may delay, prevent or make undesirable a merger or an acquisition of all or a significant portion of our shares or assets. Israeli corporate law regulates acquisitions of shares through tender offers and mergers, requires special approvals for transactions involving significant shareholders and regulates other matters that may be relevant to these types of transactions. These provisions of Israeli law could have the effect of delaying or preventing a change in control and may make it more difficult for a third party to acquire us, even if doing so would be beneficial to our shareholders. These provisions may limit the price that investors may be willing to pay in the future for our ordinary shares. Furthermore, Israeli tax considerations may make potential transactions undesirable to us or to some of our shareholders.
Under current Israeli law and the laws of other jurisdictions, we may not be able to enforce covenants not to compete and therefore may be unable to prevent our competitors from benefiting from the expertise of some of our former employees.
We currently have non-competition clauses in the employment agreements of substantially all of our employees. The provisions of such clauses prohibit our employees, if they cease working for us, from directly competing with us or working for our competitors for a certain period of time. Israeli labor courts have required employers, seeking to enforce non-compete undertakings against former employees, to demonstrate that the competitive activities of the former employee will cause harm to one of a limited number of material interests of the employer recognized by the courts (for example, the confidentiality of certain commercial information or a company's intellectual property). In the event that any of our employees chooses to leave and work for one of our competitors, we may be unable to prevent our competitors from benefiting from the expertise of our former employee obtained from us, if we cannot demonstrate to the court that our interests as defined by case law would be harmed. Non-competition clauses may be unenforceable or enforceable only to a limited extent in other jurisdictions as well.
21
ITEM 4:
INFORMATION ON THE COMPANY
|
A.
|
History and Development of the Company
|
We were incorporated in Israel in 1987 and are subject to the laws of the State of Israel. We are a public limited liability company under Israel’s Companies Law and operate under that law and associated legislation. Our corporate headquarters, executive offices and main research and development and engineering facilities, as well as facilities for some manufacturing and product assembly are located at Gilat House, 21 Yegia Kapayim Street, Kiryat Arye, Petah Tikva 4913020, Israel. Our address in the U.S. is c/o Gilat North America LLC at 1750 Old Meadow Road, McLean, VA. Our telephone number is (972) 3-925-2000. Our web-site address is www.gilat.com. The information on our website is not incorporated by reference into this annual report.
We are a leading global provider of broadband satellite communication and networking solutions and services. We design, produce and market VSATs, SSPAs, BUCs, low-profile antennas and on-the-Move / on-the-Pause terminals. We have a large installed customer base and have shipped more than one million VSAT units to customers in approximately 90 countries on six continents.
We shipped our first generation VSAT in 1989 and since then we have been among the technological leaders in the VSAT industry. Our continuous investment in research and development has resulted in the development of new and industry-leading products and our intellectual property portfolio includes 54 issued patents (47 U.S. and 7 foreign) relating to our VSAT and other systems as well as 16 issued patents (14 U.S. and 2 foreign) relating to our Satcom-On-The-Move antenna solutions and 13 issued patents (3 U.S. and 10 foreign)
for our high power SSPAs. As of December 31, 2014, we had 936 full-time employees, including approximately 277 persons engaged in research, development and engineering activities.
We have 20 sales and support offices worldwide, three network operations centers and five R&D centers. Our products are primarily sold to communication service providers and operators that use VSATs for their customers and to government organizations and system integrators that use our technology. We provide services directly to end-users in various market sectors including in certain countries in Latin America and provide managed network services, such as in Australia, over a VSAT network owned by a third party.
Former Line of Business
In December 2013, we sold our Spacenet subsidiary to SageNet for approximately $16 million, subject to certain post-closing adjustments and expenses. During 2014 the post-closing adjustments were resolved and consequently we incurred additional expenses of approximately $0.8 million related to those adjustments. Through Spacenet we previously provided managed network communications services utilizing satellite wireline and wireless networks and associated technology. Spacenet served enterprise, government, industrial small office/home office, or SOHO, and residential customers throughout North America. Spacenet provided three primary lines of service: custom commercial grade networks for large enterprise and government customers; Connexstar networks, which are standardized commercial grade services; and StarBand services, which are typically geared towards SOHO and residential users. Spacenet was previously accounted under the Service division. As a result of this transaction, we recorded in 2014 approximately $0.8 million of transaction related expenses, and in 2013 a loss of $1.385 million, which includes banker’s fees, legal fees and other transaction related expenses.
In 2014, 2013 and 2012, our property and equipment purchases related to our continuing operations amounted to approximately $12.6 million, $4.1 million, and $4.0 million, respectively. These amounts do not include the reclassification of inventory to property and equipment made during 2014, 2013 and 2012 in the amount of approximately $2.9 million, $3.8 million, and $2.1 million, respectively.
22
|
B.
|
Business Overview
|
We are a leading provider of satellite ground segment and other network communications solutions and services. We design and manufacture satellite ground segment and networking communications equipment, which we sell to our customers either as network components (BUCs, antennas) or as complete network solutions (which include hubs and related services) or turnkey projects. The equipment that we develop includes commercial VSAT systems, defense and homeland security satcom systems, SSPAs, Bucs, low-profile antennas and on-the-Move / on-the-Pause terminals. Our equipment is used by satellite operators, service providers, system integrators, government and defense organizations, large corporations and enterprises. We also provide connectivity services, Internet access and telephony, to enterprise, government and residential customers in Peru and Colombia over our own networks which are built using our own and other equipment purchased from other manufacturers in various technologies. We also provide NOC operations and hub services, such as in Australia, over a VSAT network owned by SingTel Optus Pty Limited, or Optus, a large telecommunication company in Australia.
In 2012, in line with our efforts to improve our business structure and organization for our target markets, we have started operating as three business divisions – Commercial Division, Mobility Division (previously known as Defense division) (including Wavestream, which provides its products primarily to defense and homeland security organizations) and our Services Division (which is comprised of our service businesses in Peru and Colombia).
Commercial Division,
providing VSAT networks, satellite communication products and associated professional services to service providers and operators worldwide, including broadband access and consumer
HTS initiatives worldwide. Representative customers of Gilat’s Commercial Division include Oi in Brazil, Optus in Australia, Bharti in India, Entel in Bolivia, Nepal Telecom, Telkom in South Africa and Telefonica in Latin America. According to the latest COMSYS VSAT Report, published in 2013 by a leading satellite industry research firm - Communications Systems Limited, or COMSYS, we are the second-largest manufacturer of VSATs to the enterprise market. We also provide industry specific solutions for cellular backhaul, business continuity and disaster recovery.
Mobility Division
, providing satellite communication products and solutions to defense and homeland security organizations worldwide as well as Satcom-on-the-move solutions to various industries including avionics. Wavestream provides high-power SSPAs mainly to system integrators that serve various defense and homeland security agencies and to the avionics industry. Wavestream is an independent designer and manufacturer of SSPAs and BUCs for mission-critical satellite communications worldwide. Representative customers of Wavestream include General Dynamics, TCS, L-3, Honeywell, Tecom and Astronics AeroSat Corporation, or AeroSat. Wavestream’s patented leading-edge spatial power combining technology enables higher output power from smaller packages with greater efficiency, reliability and lower cost than other existing technologies in high frequency bands like Ka. Wavestream provides product solutions for multiple applications targeting defense, commercial and broadcast satellite communications systems. In addition, we provide Raysat low profile antennas for various military and commercial applications such as homeland security, emergency response and trains. Typical customers include various military and special forces, directly or through integrators. We also provide On-The-Pause terminals such as Satrooper, our manpack solution that are quick deploy terminals for broadband communications. We also provide UAV terminals that provide beyond line of sight (BOS) communications to different size UAVs. Our typical customers are various platform manufactures.
Services Division
, comprised of our service businesses in Peru and Colombia, or Gilat Peru & Colombia, offering rural telephony, data transmission and Internet access solutions and operating these networks through our subsidiaries there. These services are primarily telephony, Internet access and data services for rural areas under projects that are subsidized by governmental entities. In Peru we also provide Internet and data services to public institutions and to the private sector, generally awarded by means of public bids.
23
In the year ended December 31, 2014, we derived approximately 55% of our revenues from our Commercial Division, approximately 23% from our Mobility Division and approximately 22% of our revenues from our Services Division.
We have diversified revenue streams that result from both sales of equipment and services. In the year ended December 31, 2014, approximately 67% of our revenues were derived from equipment sales and 33% from services. During the same period, we derived 47% from Latin America, 22% of our revenues from Asia and Asia Pacific, 18% from North America, 7% from Europe and 6% from Africa. As of December 31, 2014, we had a backlog of $174 million for equipment and multi-year service contracts.
Industry Overview
There is global demand for satellite-based communications solutions for a number of reasons. Primarily, this is still the only truly ubiquitous networking solution. Secondly, satellite communications are more readily available as compared to alternative terrestrial communications networks. Lastly, satellite communications solutions offer rapidly deployed secure broadband connectivity and broadband communications on the move.
A two-way broadband satellite communications solution is comprised of the following elements:
|
|
·
|
Communications satellite – Typically a satellite in geostationary orbit (synchronized with the earth’s orbit) with a fixed coverage of a portion of the earth (up to approximately one third).
|
|
|
·
|
Satellite communications ground station equipment – These are devices that have a combination of datacom and RF (Radio Frequency) elements designed to deliver data via communication satellites. Examples of ground station equipment are remote site terminals, such as VSATs, and central hub station systems. Gilat is a leading provider of VSAT ground station equipment. Ground station equipment is typically comprised of the following elements: modem, amplifiers, BUCs and antennas.
|
|
|
·
|
Modem – This is the device that modulates the digital data into an analog RF signal for delivery to the upconverter, and demodulates the analog signals from the downconverter back into digital data. The modem, which is typically located indoors, performs data processing functions such as traffic management and prioritization and provides the digital interfaces (Ethernet port/s) for connecting to the user’s equipment (PC, switch, etc.).
|
|
|
·
|
Amplifiers and BUCs – These are the components that connect the ground station equipment with the antenna. The purpose of the amplifiers and BUCs is to amplify the power and convert the frequency of the transmitted RF signal. Wavestream is a leading provider of high power SSPAs and BUCs.
|
|
|
·
|
Antenna – Antennas can vary quite significantly in size, power and complexity depending on the ground equipment they are connected to, and their application. For example, antennas connected to remote sites generally are in the range of one meter in diameter while those connected to the central hub system can be in the range of ten meters in diameter. Antennas used on moving vehicles need to be compact and have an auto-pointing mechanism so that they can remain locked onto the satellite during motion. Gilat is a leading provider of low-profile in-motion satellite antennas.
|
24
Broadband satellite networks are comprised of ground stations at multiple locations that communicate through a satellite in geostationary orbit, providing continent-wide wireless connectivity. Satellite broadband networks are used to provide a variety of traffic types such as broadband data, video and voice. The value chain of satellite network services consists of the following four main elements:
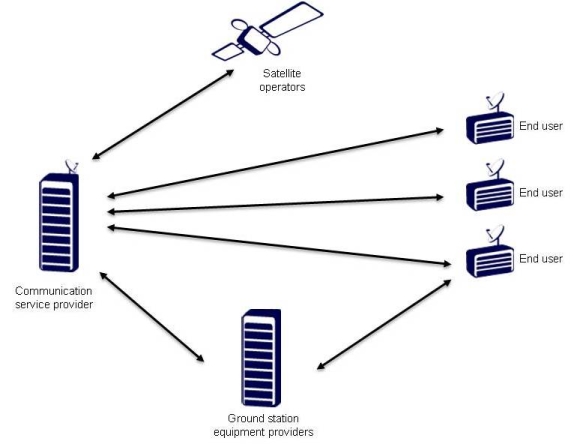
Satellite operators
provide satellite transponder capacity on satellites positioned in geostationary orbit above the equator. A typical satellite can cover a geographic area the size of the continental U.S. or larger. The satellite receives information from the ground station equipment, amplifies it and transmits it back to earth on a different frequency. Satellite operators sell the capacity in a variety of leasing agreements to their customers. The current generation of high-power satellites uses Ku-band frequencies. Other frequencies are C-band and the more recently introduced Ka-band which usually operates on a multi-beam configuration. Our technology is compatible with C-band, Ku-band and Ka-band satellites including special extended C-band and extended Ku-band satellites. Some of the leading satellite operators are Intelsat, SES and Eutelsat.
Ground station equipment providers
manufacture network equipment for both VSAT networks and broadcast markets. VSAT systems connect a large central earth station, called a hub, with multiple remote sites (ranging from tens to thousands of sites), which communicate via satellite. Gilat is a leading ground station equipment provider for VSAT systems, high-power amplifiers and low-profile antennas for satcom-on-the-move.
Communication service providers
buy equipment from ground station equipment providers, install and maintain such equipment, lease capacity from satellite operators and sell a full package of communication services to the end user. Gilat Peru & Colombia is leading communication service providers in Peru and Colombia.
End users
are customers that use equipment and satellite communication services. Examples of end users range from enterprises, to government ministries and defense organizations, to residential consumers.
System integrators
are companies that provide customized solutions to end users by integrating the necessary equipment and services. For example, defense organizations often work with specialized system integrators that integrate various components, such as power amplifiers and low profile antennas, into a satellite terminal.
Satellite broadband networks are typically VSAT systems deployed in a hub-and-spoke configuration, with remote locations connecting via satellite to a central hub station. VSAT networks have a diverse range of uses and applications, and provide communication services as a stand-alone, alternative, or complementary service to terrestrial networks.
25
We believe that the advantages of VSAT networks include:
|
|
·
|
Universal availability
- VSATs provide service to any location within a satellite footprint.
|
|
|
·
|
Timely implementation -
Large VSAT networks with thousands of remote sites can be deployed within a few weeks.
|
|
|
·
|
Broadcast and multicast capabilities
- Satellite is an optimal solution for broadcast and multicast transmission as the satellite signal is simultaneously received by any group of users in the satellite footprint.
|
|
|
·
|
Reliability and service availability
- VSAT network availability is high due to the satellite and ground equipment reliability, the small number of components in the network and terrestrial infrastructure independence.
|
|
|
·
|
Scalability
- VSAT networks scale easily from a single site to thousands of locations.
|
|
|
·
|
Cost-effectiveness
- The cost of VSAT networks is independent of distance and therefore it is a cost-effective solution for networks comprised of multiple sites in remote locations.
|
|
|
·
|
Applications delivery
– VSAT networks offer a wide variety of customer applications such as e-mail, virtual private networks, video, voice, Internet access, distance learning, cellular backhaul and financial transactions.
|
|
|
·
|
Portability and Mobility
- VSAT solutions can be mounted on vehicles for communications on the move, or deployed rapidly for communications in fixed locations and then relocated or moved as required.
|
Given the technological and implementation benefits afforded by VSAT networks, we believe that the market for VSAT products and services will continue to grow. In particular, according to a 2014 report from NSR, a leading international telecom market research and consulting firm, the number of broadband satellite sites and subscribers is expected to grow at a compounded annual growth rate, or CAGR, of 12.5% through 2023.
In addition, Satellite Communications is an effective solution for mobility, especially for maritime and for international flight.
The availability of auto-pointing satellite antennas designed for in-motion two way, the availability of auto-pointing satellite antennas designed for in-motion two way communications has created market demand particularly from the defense and first responders, such as emergency services, segments. These antennas are usually mounted on the roof of a vehicle and connected to a satellite terminal within the vehicle. An important requirement that defense organizations have in this mission-critical application is for low-profile antennas, to avoid drawing unnecessary attention to the vehicle. We believe that the demand for light-weight, low-profile antenna systems will increase as well.
Another important requirement emerging is for next generation solid-state power amplifiers able to provide high output power, greater efficiency and field-proven reliability in smaller, lighter weight product packages suitable for fixed, mobile, and flyaway antenna systems. The amplifiers should be designed and thoroughly tested for use in extreme environments, helping provide uninterrupted connectivity to support mission-critical defense operations, as well as demanding inflight connectivity and consumer broadband applications.
26
There are five primary categories of markets that require broadband satellite products and services:
Enterprise and Business.
These end-users include large companies and organizations, small- medium enterprises, or SMEs, and SOHO end users. For enterprises, VSAT networks offer network connectivity and deliver voice, data and video within corporations (known as corporate intranets), Internet access, transaction-based connectivity to enable on-line data delivery such as point-of-sale (credit and debit card authorization), inventory control and real time stock exchange trading.
High-End.
The high-end market consists of customers that have more demanding network performance requirements. These requirements usually include higher level of Quality of Service, or QoS, than the typical user, higher speed connectivity, segregation of their traffic from other users’ traffic and more control over the network. Examples of customers belonging to the high-end market are industrial energy organizations such as oil & gas and mining companies, Digital Satellite News gathering, or DSNG, maritime companies and mobile operators. Another emerging area is airborne which requires reliable, compact solutions that can operate in extreme environments to provide in-flight connectivity services to business, commercial and aviation customers around the world.
Rural Telecommunications.
The rural telecommunications market is comprised of communities throughout the world that require telephone, facsimile and Internet access in areas that are underserved by existing telecommunications services. These communication services are usually provided to the rural population via government-subsidized initiatives. This market sector is comprised of "Build-Operate" projects, in which governments subsidize the establishment and the operation of a rural network to be served by a satellite, wireless or cellular service provider that is usually selected in a bid process. In other instances, local communications operators have universal service obligations, or USOs, which require them to serve rural areas lacking terrestrial infrastructure. Some local communications operators elect to fulfill this obligation by hiring third parties in a model known as "Build-Operate-Transfer." In these instances, the network is established and made operational by a third party service provider, which operates it for a certain period of time and then it is transferred to the operator.
Consumer.
The consumer market consists of residential users. These users require a high-speed internet connection similar to a digital subscriber line, or DSL, or cable modem service. According to a forecast in the NSR 2014 report, North America is expected to see the biggest increase in satellite broadband access subscribers.
Government.
The government sector consists of homeland security and military users. The versatility, reliability, and resiliency of satellite broadband networks, the in-motion low profile antennas and the lightweight SSPAs are a perfect fit for security and armed forces. Spatial-combining technology implemented on the Wavestream SSPAs introduces significant efficiency, size and weight advantages. For example, satcom systems with low power lightweight amplifiers can be quickly deployed in disaster areas, as a replacement for destroyed wireless or wire line networks, providing communication services to emergency personnel and law enforcement units. In military applications, satcom networks can be used as a reliable overlay to manage the entire battlefield communications, serve as communication backup infrastructure, and be used for primary tactical communications offering communications from a moving vehicle. In these cases the low-profile antennas provide additional benefit to the end-user. Smaller, light weight and reliable BUCs are also important for aviation applications.
Our Competitive Strengths
We are a leading provider of satellite communication and networking products and services. Our competitive strengths include:
Market leadership in large and growing markets.
Since our inception, we have sold more than one million VSATs, over 3,000 low profile antennas and approximately 15,000 BUCs and SSPAs to customers in approximately 90 countries. Our customer base includes a large number of satellite-based communications service providers, system integrators and operators worldwide. In addition, we are one of the largest satellite communications service providers to rural communities in Latin America.
27
The large installed base of our equipment also provides opportunities for new and incremental sales to existing customers. According to the last COMSYS report published in 2014, our global market share to the enterprise market is 22.9% based on the number of terminals shipped, making us the second largest VSAT manufacturer in the world for this segment.
Our installed base for low profile Satcom-On-The-Move antennas provides us opportunities for new and incremental sales to existing customers. Specifically, we are focused on the DoD market and China.
We have a large installed base of SSPAs in the DoD, based on power amplifiers sold to the system integrators, who provided a complete satellite terminal based on our equipment. Our SSPAs are widely used in the DoD, for both Ka Band and Ku Band terminals. In addition, we gained traction during the three years ended December 31, 2014 in the avionics industry working with system integrators, including Tecom, AeroSat and Honeywell, providing airborne solutions to commercial airlines.
We are experiencing growing interest for our terminals, such as the SatTrooper, our Manpack solution, and the BlackRay 71, our terminal for Unmanned Aircraft Systems (UASs).
Technology leadership.
We have been at the forefront of VSAT technology and services for over 25 years and continue to be an innovator and developer of new satellite technologies. Our highly customizable VSAT technology enables us to provide our customers with a wide range of broadband, Internet, voice, data and video solutions. Our product and operations infrastructure is capable of running hubs with greater than 99.8% availability while rolling out thousands of new VSAT site locations each month. Our SkyEdge II-c, state-of-the-art solution, provides high performance and excellent space segment efficiency. Our legacy product lines are known for their durability and resilience. Our low-profile, Satcom-On-The-Move, antennas provide reliable broadband communications for defense and homeland security applications. Our state-of-the-art SSPAs provide excellent performance, even at the extreme end of temperature and environmental performance specifications. Our research, development and engineering team is comprised of 277 persons, enabling us to rapidly develop new features and applications. Moreover, by directly serving end-users through our service organizations, we are able to quickly respond to changing market conditions to ensure we maintain our leadership position.
Global presence and local support worldwide.
We have sold our products in around 90 countries on six continents. Our products and services are used by a large and diverse group of customers including some of the largest enterprises in the world, several government agencies and many rural communities. We have 20 sales and service offices worldwide. Through our network of offices we are able to maintain a two-tier customer support program offering local support offices and a centralized supply facility.
Complementary business lines for turnkey solutions.
Our business divisions are able to provide a full turnkey solution to our customers by integrating a diverse range of value-added products and services. Our product and service offerings -- VSAT network equipment, small cell solutions, power amplifiers, low-profile Satcom-On-The-Move antennas, installation, operation and maintenance -- provide communication services ranging from broadband, Internet, voice, data and video to managed solutions that can be customized and are highly flexible. Our business model enables us to be closely attuned to all of our customers' needs and to rapidly adapt to changing market trends. There are cases in which our VSAT-based networks serve as a platform for the delivery of a complete system, providing versatile solutions for corporate enterprises, government agencies, SMEs, rural communities, SOHOs and consumers.
Diversified revenue streams and customer base.
For the year ended December 31, 2014, approximately 67% of our revenues were generated from equipment sales and 33% of our revenues were generated from services. Our equipment sales are generally independent equipment orders which often generate maintenance contracts and additional opportunities for future equipment sales. Our service sales are characterized by long-term contracts that provide a recurring revenue base. In the year ended December 31, 2014, our three business divisions, Commercial, Mobility and Services, accounted for 55%, 23%, and 22% of our revenues, respectively.
28
Financial position.
As of December 31, 2014, our cash balance was $53.5 million (including cash and cash equivalents, short and long term restricted cash and restricted cash held by trustees, net of short term bank credits and loans), and our debt was $30.9 million (comprised of long-term loans of $26.3 million and current maturities of long-term loans of $4.6 million).
Delivery Capabilities.
Over the years we have demonstrated our ability to deploy communication networks in the most remote areas, which are difficult both to reach and service. This experience enhances both our ability to plan and implement sophisticated communication networks in remote areas, as well as in challenging terrain, and our ability to meet technological challenges like a lack of electrical power infrastructure or a lack of any physical infrastructure. Our teams are proficient in delivering solutions in these areas, with a high success rate.
Experienced management team.
Our management is comprised of highly experienced executive team. Dov Baharav, the Chairman of our Board of Directors and who will be assuming the role of interim Chief Executive Officer in the second quarter of 2015, has broad experience in senior executive positions. Mr. Baharav served as Chairman of the Board of Directors of Israel Aerospace Industries Ltd. and was President and CEO and a member of the Board of Directors of Amdocs Management Limited (NASDAQ: DOX).
Our Growth Strategy
Our objective is to leverage our advanced technology and capabilities to:
Expand our presence in the on-the-move and defense satcom market
. We are focusing efforts on the airborne opportunities with products applicable for both commercial and defense applications. We are investing in this market segment, especially in the commercial aviation market, as we believe its global growth will contribute to our business
.
Building on our technology leadership and growing presence with armed forces around the world, we are continuing to focus on this growing market segment both in the United States and globally. We acquired RAS and Wavestream, whose customers are mainly in the defense and homeland security markets. We have also
developed products with specific capabilities required by armed forces and homeland security agencies globally.
Increase our presence in the Ka-band and HTS market.
Ka-band and
HTS technology is expanding to more regions in the world, offering new opportunities for satellite broadband with much higher capacities and at lower prices to subscribers. We are focused on the Ka-band and HTS market as one of the growth drivers for our company. We continued to develop our VSAT platform: SkyEdge II-c, including a hub and remote terminals supporting multiple applications, designed to operate multi spot-beam satellites to deliver high-throughput service speeds and high-speed browsing using advanced web acceleration technologies.
Strengthen and expand our technology leadership.
We are strengthening our technology leadership by our continued investment in research and development, with a view of expanding our product portfolio with new product offerings and new capabilities. Our flagship product, the SkyEdge II-c platform, which was designed for Ka-band and multi-spot beam high throughput satellites, has cutting edge space segment utilization and performance. Our new VSAT offerings, such as SkyEdge II-c, Capricorn, the world’s fastest TDMA VSAT, and additional recently introduced products like SkyEdge II-c Libra Hybrid terminal and CellEdge integrated small cell over satellite, enable our customers new opportunities in deploying communication networks suited to their needs. In addition, we have developed terminals for on-the Move and on-the-Pause for commercial, homeland security and defense applications (including integration of antenna, modem and BUC) as well as modems and manpacks designed for defense and homeland security applications and we are focusing on developments for enhanced performance and capabilities of our SSPAs, and Satcom-On-The-Move antenna offerings.
Focus on emerging markets
. We have expanded our focus on emerging markets. Traditionally, it has been considered too costly for service providers to provide full-terrestrial networks to these regions. As a result, many governments either require telecommunications operators to provide communications access through USOs to these communities or provide funding via Universal Service Funds, or USFs, to subsidize the provision of these services. We focus our sales efforts on offering solutions to service providers that are either being required by USOs to facilitate the rural expansion, or on offering solutions to service providers that are utilizing the subsidies created through USFs. We have developed a new integrated solution for this market. CellEdge include small cell and satellite backhaul.
29
Evaluate opportunities for acquisitions that will support and enable our growth strategy.
As we continue to focus on expanding the target markets for our products, services and solutions, we may have opportunities to acquire companies or technologies that would be complementary or additive to our existing platform and global distribution channels. We will continue to selectively evaluate opportunities to expand our business.
Our Businesses in 2014
Commercial Division
Overview
Our Commercial Division provides VSAT-based network systems, low-profile satcom-on-the-move antennas and associated professional services to satellite and telecom operators worldwide. Our operational experience in deploying large VSAT networks together with our global network of local offices enable us to work closely and directly with those providers. We provide equipment and solutions to the commercial, government and consumer markets.
Our SkyEdge product family, including the SkyEdge, SkyEdge II and SkyEdge II-c products, allows us to deliver efficient, reliable and affordable broadband connectivity such as Internet, voice, data and video.
As a single platform SkyEdge II-c supports multiple applications such as, Broadband Access, Enterprise Cellular Backhaul and Mobility.
We provide solutions tailored to the requirements of individual industries. Based on our open SkyEdge platform, our solutions provide added value to operators through better performance and integration as well as simpler deployment.
We also support satellite networking through professional services, training and a full range of turnkey solutions and outsourced network operations including "Build-Operate-Transfer" for networking facilities.
Our Commercial Division is headquartered in Petah Tikva, Israel and operates through 12 offices worldwide. In the year ended December 31, 2014, our Commercial Division had revenues of $130.3 million.
Products and Solutions
Broadband Satellite Network System
Our SkyEdge II product family is based on a single hub with multiple VSATs to support a variety of services and applications. The products were designed using advanced technology to enable them to process different types of user traffic such as voice, critical data, Internet traffic and video, to handle each type of traffic in an efficient manner and provide the necessary quality of service for each traffic stream. The SkyEdge II system also includes advanced mechanisms which ensure that the transmissions via the satellite utilize the available satellite bandwidth efficiently and enhance the user experience.
During 2012, we introduced our SkyEdge II-c system. The SkyEdge II-c system supports large scale broadband services for both consumer and enterprise applications, including fast web browsing, high-speed trunking, video streaming, Internet Protocol Television, or IPTV, Voice Over Internet Protocol, or VoIP, and other bandwidth-intensive services. It includes a unified, centralized network management system, or NMS which manages all hub elements at all gateways from a central NOC location. Enhanced FCAPS functions and the electronic machine to machine interface enable full visibility, control and seamless integration with the operator’s operations support system/ business support system, or OSS/BSS, environment.
30
The SkyEdge II-c platform supports three VSAT types; Gemini, Libra and Capricorn.
|
|
·
|
SkyEdge II-c Gemini
is a compact high-throughput VSAT, designed to enable high speed broadband services while meeting cost efficiencies required by residential customers and businesses. Gemini enables fast web browsing, video streaming, IPTV, VoIP, and other bandwidth intensive services.
|
|
|
·
|
SkyEdge II-c Libra
empowers mobile operators, ISPs and DTH service providers by combining satellite and cellular technologies. This hybrid terminal provides a low-cost solution for underserved areas where existing mobile network infrastructure or DSL cannot provide reliable high-speed broadband Internet. Libra offers satellite download speeds as fast as 20 Mbps. Meanwhile, upload traffic remains within the customer’s existing network, even if speeds of only a few Kbps are available. Libra enables MNOs and DTH providers to leverage their existing infrastructure to provide broadband service to the home.
|
|
|
·
|
SkyEdge II-c Capricorn
is the
latest addition to the SkyEdge II-c family of high-performance satellite routers. Capricorn has been designed to deliver ultra-high-speed broadband services while satisfying the need for cost efficiencies. Capricorn is a full-featured IP router, supporting Ku/Ka/C bands with throughput of up to 200Mbps. It is suitable for high performance and high bandwidth-hungry applications such as ultra-fast web browsing, video streaming, IPTV, VoIP, cellular backhauling, and IP trunks.
|
All SkyEdge II-c VSATs are full-featured IP routers, supporting enhanced IP routing features such as DHCP, NAT/PAT and IGMP. Advanced application-based QoS guarantees the performance of real-time applications such as VoIP and video streaming, while also supporting other data applications. SkyEdge II-c VSATs also support next generation IPv6 networking.
SkyEdge II-c VSATs provides operational simplicity and reduced operational expenditures. It provides simple, Do-It-Yourself, VSAT installation that expedites deployment and reduces costs. The VSAT kit is designed with minimum assembly parts and an easy to point antenna. In addition, the Gilat Ka-band transceiver is equipped with audible indicators to assist in the fine pointing. The VSAT customer premises equipment, or CPE, includes an intuitive graphical user interface that guide the installer step by step through the installation and service activation process.
Commercial Division Solutions
Vertical Solutions
We target specific vertical markets where our products and solutions are most suitable and in which we have multiple references and credibility. These vertical markets include the consumer market, cellular backhaul, oil and gas, banking and finance and rural and e-government, amongst others.
Cellular Backhaul and Rural connectivity
CellEdge is our integrated small cell over satellite solution that enables remote 2G/3G cellular connectivity in rural areas. Satellite backhaul is often the most cost effective means to bring cellular connectivity to remote areas. Successful, quick deployment requires an end-to-end integrated solution that combines the small cell, and satellite backhaul optimized to work together in the most efficient manner.
Mobile operators benefit from one point of contact providing an end-to-end solution enabling quick deployment, high reliability and outstanding user experience.
31
System Integration and Turnkey Implementation
We have expanded our business beyond core VSAT networks to deliver our customers complete and comprehensive solutions to their needs even where VSAT is not the main part of that solution. We see a growth in market demand for vendors capable of fully delivering integrated solutions for interdisciplinary, communication based projects.
In certain other situations we are required to provide our VSAT solution in a turnkey mode whereby we are responsible for the complete end-to-end solution. In the case of turnkey solutions, and occasionally in projects requiring system integrations, we provide our customers with a full and comprehensive solution including:
|
|
·
|
Project management – accompanying the customer through all stages of a project and ensuring that the project objectives are within the predefined scope, time and budget;
|
|
|
·
|
Satellite network design – translating the customer’s requirements into a system to be deployed, performing the sizing and dimensioning of the system and evaluating the available solutions;
|
|
|
·
|
Deployment logistics – transportation and rapid installation of equipment in all of the network sites;
|
|
|
·
|
Implementation and integration – combining our equipment with third party equipment such as solar panel systems and surveillance systems as well as developing tools to allow the customer to monitor and control the system;
|
|
|
·
|
Operational services – providing professional services, program management, network operations and field services; and
|
|
|
·
|
Maintenance and support – providing 24/7 helpdesk services, on-site technician support and equipment repairs and updates.
|
Manufacturing, Customer Support and Warranty
Our products are designed and tested at our facilities in Israel as well as our four additional R&D facilities around the world. We outsource a significant portion of the VSAT manufacturing of our products to third parties. We also work with third-party vendors for the development and manufacture of components integrated into our products, as well as for assembly of components for our products.
We offer a customer care program for our VSAT products, which we refer to as SatCare, and professional services programs that improve customer network availability through ongoing support and maintenance cycles.
As part of our professional services, we provide:
|
|
·
|
Outsourced operations such as VSAT installation, service commissioning and hub operations;
|
|
|
·
|
Proactive troubleshooting, such as periodic network analysis, to identify symptoms in advance; and
|
|
|
·
|
Training and certification to ensure customers and local installers are proficient in VSAT operation.
|
We typically provide a one-year warranty to our customers as part of our standard contract.
32
Marketing and Sales
We use both direct and indirect sales channels to market our products, solutions and services. Our commercial division has organized its marketing activities by geographic areas, with groups or subsidiaries covering most regions of the world. Our sales teams are comprised of account managers and sales engineers who establish account relationships and determine technical and business requirements for the customer’s network. These teams also support the other distribution channels with advanced technical capabilities and application experience. Sales cycles in the VSAT network market vary significantly, with some sales requiring 18 months and even more, from an initial lead through signing of the contract and others stemming from an immediate need for product delivery within two to three months. The sales process includes gaining an understanding of customer needs, several network design iterations and network demonstrations.
Customers and Markets
We sell VSAT communications networks and solutions primarily to service providers that mostly serve the enterprise market. We have more than 200 such customers worldwide.
Enterprise and service provider customers use our networks for Internet access, broadband data, voice and video connectivity and for applications such as credit card authorizations, online banking, corporate intranet, interactive distance learning, lottery transactions, retail point-of-sale, inventory control and Supervisory Control and Data Acquisition, or SCADA, services.
Service providers serving the rural communications market are typically public telephony and Internet operators providing telephony and Internet services through public call offices, telecenters, Internet cafes or pay phones. Some of the rural communication projects are for government customers. Examples of our rural telecom customers include Telefonica in Peru, Entel in Bolivia and SCT in Mexico
Service providers for the consumer market are typically telecom operators planning to expand Internet service to the consumer markets. We have signed an agreement with SES Broadband Services, or SBBS, (formerly known as SES and before that as ASTRA2Connect) for the delivery of network equipment and Ka-band end-user terminals for their European satellite-based consumer Internet service - SES Broadband Services. The SBBS Ka service was launched in December 2012. As part of the SBBS consumer rollout, we received orders from several European Internet service providers, or ISPs. The SBBS Ka service allows European households to benefit from broadband satellite access, enabling internet, video and VoIP services.
Our VSAT networks also provide underserved areas with a high-speed Internet connection similar to DSL service provided to residential users. An example of such a customer is Optus in Australia, Hispasat in Spain and SBBS in several countries in Europe.
Public Rural Telecom Services:
In a large number of remote and rural areas, primarily in developing countries, there is limited or no telephone or Internet service, due to inadequate terrestrial telecommunications infrastructure. In these areas, VSAT networks utilize existing satellites to rapidly provide high-quality, cost-effective telecommunications solutions. In contrast to terrestrial networks, VSAT networks are simple to reconfigure or expand, relatively immune to difficulties of topography and can be situated almost anywhere. Additionally, VSATs can be installed and connected to a network quickly without the need to rely on local infrastructure. For example, some of our VSATs are powered by solar energy where there is no existing power infrastructure. Our VSATs provide reliable service, seldom require maintenance and, when necessary, repair is relatively simple.
As a result of the above advantages, there is a demand for government-sponsored, VSAT-based bundled services of fixed telephony and Internet access. Many of these government-funded projects have been expanded to provide not only telephony services and Internet access, but to also provide telecenters that can serve the local population. These telecenters typically include PCs, printers, fax machines, photocopiers, VCRs and TVs for educational programs. Additional revenue may be received, both in the form of subsidies and direct revenues from the users, when these additional services are provided.
33
VSAT Services to Telecom Operators:
In some markets, existing telecom operators are mandated by the government to provide universal services. Providing these services in remote areas is a challenge to these operators, and they sometimes outsource these services to rural telecom service providers. The exact nature of these outsourcing projects varies, but they are typically a "Build-Transfer" model or a "Build-Operate-Transfer" model. Cable & Wireless in Panama was Gilat’s first "Build-Operate-Transfer" customer.
Mobility Division
Raysat Low-Profile Satcom-On-The-Move Antenna Systems
Our RaySat series consists of low-profile, in-motion, one-way and two-way antennas for mobile communications-on-the-move (COTM). Compact, aerodynamic and vehicle-mounted, RaySat antennas deliver mission-critical data, voice and video for secure, real-time information flow.
Gilat’s RaySat products operate in Ku, Ka and X bands and are ideal for both civilian and military SatCom On-The-Move applications such as:
|
|
•
|
Military - strategic military advantage by supporting the transfer of real-time intelligence while on-the-move with a small, low profile, hard to track antenna;
|
|
|
•
|
Digital satellite news gathering – always on, no set up time, real-time streaming video;
|
|
|
•
|
First responders - supports vehicles’ mobility, agility and stability required for teams to be the first to reach the scene; and
|
|
|
•
|
Search and exploration teams, close-to-shore vessels etc.
|
Raysat antenna products are designed, manufactured and assembled at our facilities in Bulgaria.
Wavestream BUCs and SSPA
Wavestream, founded in 2001, designs and manufactures next generation solid-state power amplifiers for mission-critical defense and broadcast satellite communications systems. Wavestream’s innovative, patented Spatial Power advantage™ technology provides higher output power, greater reliability and lower energy usage in more compact packages than traditional amplifier solutions. Wavestream’s proven family of products meet the growing demand for greater efficiency and significant lifecycle cost reductions for satellite communications systems worldwide. Since 2005, Wavestream has built and deployed approximately 15,000 BUCs and SSPAs worldwide. We acquired Wavestream in November 2010.
Wavestream’s headquarters, research and development, engineering and manufacturing facilities are located in San Dimas, California, with additional research and development center in Singapore. Wavestream has 111 employees. Our Wavestream BUCs are manufactured in our facility in San Dimas, California.
Wavestream Market and Customers
Wavestream addresses the following applications and markets:
|
|
·
|
Defense Communications - satellite-based airborne and highly secured point-to-point. This market is typically categorized by customers requiring high quality products – at times for mission critical communications in extreme environmental conditions. The satellite terminals (
e.g
., VSAT, Single Channel Per Carrier, or SCPC) are usually provided to the defense agencies via system integrators, and not directly from the power amplifier suppliers;
|
34
|
|
·
|
Government - public safety, emergency response and disaster recovery. Similar to the market for defense agencies, though usually less demanding in terms of environmental conditions, these terminals are provided to various local, state and federal agencies that need to manage emergency communications. The satellite terminals (e.g., VSAT, SCPC) are usually provided via system integrators or service providers and not directly from the power amplifier suppliers;
|
|
|
·
|
Commercial terminals - A high power amplifier is used with high-end VSAT terminals for various applications where there is the requirement to transmit large amounts of data. Examples include airborne terminals in commercial airplanes for Internet access;
|
|
|
·
|
Commercial broadcast - Broadcast providers and teleport operators require high power amplifiers in order to transmit large carriers, such as for TV broadcast, multicast of video and high-speed IP connectivity.
|
Wavestream’s customers include General Dynamics, Telecommunications Systems (TCS), L-3, Honeywell, Tecom and AeroSat.
Wavestream Products
We believe that Wavestream has established market leadership with its compact, highly efficient SSPAs with a field-proven family of Ka, Ku, X and C-band products. Wavestream’s products are designed and tested to meet strenuous requirements for temperature, shock and vibration, as well as over the full range of frequency and temperature.
The Wavestream AeroStream™ is state-of-the-art transceiver for challenging inflight satellite communications environments. AeroStream products meet RTCA/DO-160G, Boeing, Airbus and ARINC specifications for commercial aircraft as well as MIL-STD requirements for military aircraft. AeroStream™ transceiver is in certification process with the FAA. AeroStream incorporates Wavestream’s next generation Spatial Power Advantage™ technology to provide high power output with greater efficiency and reliability for airborne satellite communications applications. The AeroStream transceiver provides all necessary interfaces to work seamlessly with leading modems and Antenna Control Units (ACU) to provide a convenient turnkey solution.
Wavestream designs and manufactures RF amplifiers, BUCs and transceivers that use solid-state sources to produce high power at microwave and millimeter-wave frequencies. Our patented Spatial Power Advantage™ technology allows us to create more compact product packages that provide higher power, greater reliability and improved efficiency for any mission-critical application.
The spatially power combined amplifier employs a different technique for combining the transistor outputs than traditional Monolithic Microwave Integrated Circuit, or MMIC, based amplifiers. Rather than combining in multiple steps, increasing loss and size with each combining stage, all transistor outputs are combined in a single step. Many amplifying elements synchronously amplify the input signal, and their outputs are combined in free space for very high combining efficiency.
Our patented technology allows us to create amplifiers and BUCs with high output power in more compact product packages that generate less heat, use less energy, and reduce lifecycle costs. Our products help customers meet the stringent power requirements for mission-critical communications system. We perform full factory acceptance testing on every unit we manufacture and deliver, ensuring each product has guaranteed performance over the full temperature range and over extended frequency bands. Since 2007, Wavestream has shipped approximately 15,000 BUCs and SPPAs across C, X, Ku and Ka spectrums.
35
Services Division
Overview
Gilat Peru & Colombia
Through our operations in Peru and Colombia, we are service providers for public telephony and Internet services to rural areas there, using our hubs and VSATs equipment and in Peru also wireless terrestrial technologies (microwave, unlicensed radio frequencies). In these countries, we have built the infrastructure and act as a licensed telecommunications operator (Build-and-Operate model) in subsidized government projects. Our services include operating public phones (most of it prepaid cards) and providing internet connectivity to schools and other public entities. In addition, Gilat Peru uses its infrastructure to provide services to enterprise, SME, SOHO and residential customers.
Gilat Peru & Colombia has local offices in Lima, Peru and Bogota, Colombia and employs 230 persons on a full-time basis.
Services and Solutions
We began to operate in Peru in 1998, with the award of our first rural telephony project called "Frontera Norte" for FITEL, with approximately 200 sites. Since then, we have participated in most rural communications projects launched by the Peruvian government and have won various projects, either wholly or partially. Overall, we operate almost 8,700 telephony sites in Peru, of which approximately 1,000 have Internet connectivity, and have been awarded over $45 million in government subsidies to build and operate these networks. In 2011, we won our seventh FITEL project for an additional 770 sites with subsidies of approximately $14.5 million. In addition, we have developed services for financial sector customers, such as Banco de la Nacion, utilizing our current infrastructure and providing those customers with Internet, data and telephony services. In 2012, we won an additional $9.6 million project from Banco de la Nacion to provide services for three years. Our rural network manages millions of incoming and outgoing minutes every month, serving more than six million people in rural areas. On average, deployment of the network in Peru has
reduced the distance between rural phone locations from 50km to 5km. In January 2013, we were awarded a contract by the Ministry of Education in Peru to provide Internet connectivity to 2,600 schools nationwide for approximately $12.8 million. This contract was expanded in 2014 for an amount of approximately $2 million for the deployment of 302 additional schools and for some adaptation works of the Ministry’s HUB center in Lima. In December 2013, we were awarded a contract from the Peruvian government (through FITEL) for the deployment and operation of a wireless transport and distribution network in the northern Amazonas region of Peru. The contract, worth $30 million, is for construction of the network, its operation for 10 years and the provision of services to 88 villages along the network’s path. This contract was expanded in 2014 for approximately $6 million for the deployment and operations of Internet and telephony services in 24 additional localities along the Amazonas river. In March 2015, Gilat Peru was awarded the Regional FITEL Projects from the Peruvian government (through FITEL) as part of a bid issued for the construction of networks in three regions in Peru , operation of the networks for a defined period and their transfer to the government. We will establish a Peruvian subsidiary to enter into written agreements with the Peruvian government for each of the three regional projects that were awarded, in accordance with the bid conditions. A fiber-optic transport networks will be built, operated for one year and transferred to the Peruvian government, while the access networks based on wireless technologies will be operated for 10 years before being transferred to the government. The FITEL Regional Projects are expected to generate revenues of $285 million of revenues to be recognized over approximately 11 years. , We also expect to generate additional revenues by enabling cellular carriers to acquire network capacity to address the growing needs for voice, data, and internet in these regions.
Gilat Colombia started operations in 1999 by winning the government's Compartel I project focused on rural telephony (Compartel is now known as dirección de conectividad, or DirCon). This project was followed by two additional projects awarded by the Colombian government to Gilat Colombia for Rural Communitarian Telephony (TRC I and TRC II) and Telecentros. Until March 31, 2013, Gilat Colombia operated a network of approximately 2,000 rural sites spread throughout the country, serving over four million persons. The services for those rural sites included telephony, Internet, fax and other services. Our agreements with the Ministry of Information Technology and Communications (MINTIC) in Colombia for the provision of
communitarian
telecomm services were renegotiated and extended several times, until they finally expired as of March 31, 2013. Additionally, in December 2011, Gilat Colombia entered into a contract with MINTIC to provide broadband Internet connectivity to over 1,676 schools throughout the country’s rural regions, which ended at December 2013. The contract’s aggregate worth, including extensions, was $26 million. In December 2013, Gilat Colombia was awarded a project valued at $99 million over approximately three and a half year period as part of the Kioscos Digitales project initiated by the MINTIC. Gilat is to provide Internet/telephony connectivity for assimilation of educational programs in 1903 Kioscos sites, which were deployed in 2014 in two of the six regions that cover all of Colombia.
36
Enterprise and Government Agencies:
We provide private network equipment and related services to selected enterprises and government agencies. These customers contract directly with Gilat Peru for VSAT equipment and associated network services to be deployed at customer locations, typically for a contract term of three to five years. We also resell managed terrestrial connectivity equipment and services from facilities-based Local Exchange Carrier partners. One such customer is Banco de la Nacion in Peru.
Customer Support Operations
Gilat Peru & Colombia complement their services with back office support for subsidized telephony and Internet networks as well as for private Internet, data and telephony clients including a call center, network operations center, field service maintenance and a pre-paid calling card platform and distribution channels.
Our Services Division has local offices in Lima Peru and Bogota Colombia. In the year ended December 31, 2014, revenues from our Services Division were $50 million
.
Sales and Marketing
We use direct and indirect sales channels to market our equipment and related services. Our sales team of account managers and sales engineers are the primary account interfaces and work to establish account relationships and determine technical and business demands.
Competition
The telecommunications industry operates in a competitive market. In the equipment market, we face competition from other VSAT manufacturers, such as Hughes, ViaSat, iDirect and a few other smaller manufacturers.
We compete in some HTS (High Throughput Satellite) markets with competitors such as ViaSat and HNS who have launched high throughput satellites. Although we have entered the HTS market with competitive VSAT technology, our penetration into that market will be gradual and our success is not assured. We also expect that competition in this industry will continue to increase.
Due to the nature of the HTS solution, where the VSAT technology is sometimes commercially tied to the satellite technology itself, there may be circumstances where it is difficult for competitors to compete with the incumbent VSAT vendor using the particular HTS satellite.
Our low-profile in-motion antennas compete with products from competitors such as Cobham, ERA, Panasonic, Orbit, Thinkom, Wiworld, Tracstar and L-3. This market is nascent, and not as mature as the fixed VSAT or satellite services markets.
Wavestream’s primary competitors are Comtech Xicom Technology, Inc., CPI Satcom (which acquired Codan Satcom in 2012), General Dynamics SATCOM Technologies, and Paradise Datacom.
In Peru and Colombia, where we primarily operate public rural telecom services, we typically encounter competition on bids for projects subsidized by the government or other public entities from various service providers, system integrators and consortiums. Some of these competitors offer solutions based on VSAT technology and some on alternate technologies (typically cellular or wireless. As operators that offer terrestrial or cellular networks expand their reach to certain Peru and Colombia regions, they compete with our VSAT solutions. Examples of such competitors are Telefonica Peru, Empresas Telefonicas de Bogota, Internet Por Colombia and SkyNet.
37
Geographic Distribution of our Business
The following table sets forth our revenues from continued operations by geographic area for the periods indicated below as a percent of our total sales:
|
Years Ended December 31,
|
|||||||||||||
|
2014
|
2013
|
2012
|
|||||||||||
|
South America and Central America
|
47 | % | 36 | % | 43 | % | |||||||
|
Asia and Asia Pacific
|
22 | % | 39 | % | 31 | % | |||||||
|
North America
|
18 | % | 11 | % | 14 | % | |||||||
|
Europe
|
7 | % | 10 | % | 9 | % | |||||||
|
Africa
|
6 | % | 4 | % | 3 | % | |||||||
|
Total
|
100 | % | 100 | % | 100 | % | |||||||
Backlog
As of December 31, 2014, our backlog for equipment sales and revenues from multi-year service contracts for our products was approximately $174 million, down from approximately $228 million at year-end 2013. Backlog does not include revenues from future traffic on our rural networks, future revenues from subscribers, from our consumer operation and other cancelable agreements. Backlog is not necessarily indicative of future sales. Many of our contracts can be terminated at the convenience of the customer. In addition, some of our contracts may include product specifications that require us to complete additional product development. Any inability to meet the specifications or complete the product development on time could lead to a termination of the related contract.
|
C.
|
Organizational Structure
|
|
Significant Subsidiaries
|
Country/State of Incorporation
|
% ownership
|
|
1. Gilat Satellite Networks (Holland) B.V.
|
Netherlands
|
100%
|
|
2. Gilat Colombia S.A. E.S.P
|
Colombia
|
100%
|
|
3. Gilat to Home Peru S.A
|
Peru
|
100%
|
|
4. Gilat do Brazil Ltda.
|
Brazil
|
100%
|
|
5. Gilat Satellite Networks (Mexico) S.A. de C.V.
|
Mexico
|
100%
|
|
6. Wavestream Corporation
|
Delaware
|
100%
|
|
7. Gilat North America LLC (former name: Raysat Antenna Systems LLC)
|
Delaware
|
100%
|
|
8. Gilat Australia Pty Ltd.
|
Australia
|
100%
|
|
9.
Gilat Satellite Networks (Eurasia) Limited
|
Russia
|
100%
|
|
10. Gilat Satellite Networks MDC (Moldova)
|
Moldova
|
100%
|
|
11. Raysat Bulgaria EOOD
|
Bulgaria
|
100%
|
|
12. Gilat Satellite Communication Technology (Beijing) Ltd.
|
China
|
100%
|
|
D.
|
Property, Plants and Equipment
|
Our headquarters are located in a modern office park which we own in Petah Tikva, Israel. This facility consists of approximately 380,000 square feet, out of which approximately 179,300 square feet are currently used by us and the remainder is subleased or offered for sublease to third parties,.
38
We have network operations centers in Australia, Peru and Colombia from which we perform network services and customer support functions.
We lease approximately 3,900 square feet of office space in McLean, Virginia for Gilat North America LLC. We own facilities on approximately 140,400 square feet of land in Backnang, Germany. Since May, 2002, these facilities are leased to a third party. We own approximately 13,800 square feet of research and development and rent approximately 12,600 square feet of manufacturing facilities in Sofia, Bulgaria, and rent approximately 6,500 square feet in Moldova for research and development activities. Wavestream currently occupies approximately 32,500 square feet of facilities for office space, research and development and manufacturing in San Dimas, California under a lease which will expire on November 30, 2016 and 3,838 square feet under a lease in Singapore, which will expire on August 24, 2016.
We also maintain facilities in Brazil, Colombia, Mexico, China, Peru and Australia, along with representative offices in Pretoria (South Africa), Bangkok (Thailand), New Delhi (India), Almaty (Kazakhstan), Jakarta (Indonesia), Moscow (Russia) and small facilities in other locations throughout the world.
We consider our current office space sufficient to meet our anticipated needs for the foreseeable future and suitable for the conduct of our business.
There are no unresolved staff comments.
|
A.
|
Operating Results
|
The following discussion of our results of operations should be read together with our audited consolidated financial statements and the related notes, which appear elsewhere in this annual report. The following discussion contains forward-looking statements that reflect our current plans, estimates and beliefs and involve risks and uncertainties. Our actual results may differ materially from those discussed in the forward-looking statements. Factors that could cause or contribute to such differences include those discussed below and elsewhere in this annual report.
Introduction
We were incorporated in 1987 and began trading on the NASDAQ Stock Market in 1993 and on the TASE in 2004. We are a leading global provider of broadband satellite communication and networking solutions and services. We design, produce and market VSAT systems, integrated small cells, SSPAs, BUCs, low-profile antennas and on-the-Move / on-the-Pause terminals. Our equipment is used by satcom operators, service providers, system integrators, government and defense organizations, large corporations and enterprises. We also provide connectivity services, Internet access and telephony, to enterprise, government and residential customers in Peru and Colombia over our own networks which are built using our own equipment. We also provide managed network services such as in Australia, over a VSAT network owned by Optus.
We have a large customer installed base and have shipped more than one million VSAT units to customers in approximately 90 countries on six continents since 1989
.
We have twenty sales and support offices worldwide, three NOCs and five R&D centers. Our products are primarily sold to communication service providers and operators that use VSATs to serve enterprise, government and residential users. We also provide services directly to end-users in certain countries in Latin America.
Commencing in 2010, following the acquisitions of RAS and Wavestream, we develop and provide Satcom-on-the-move antenna solutions, terminals, SSPAs and BUCs, for commercial and defense broadband communications.
39
We operate three business divisions, comprised of our Commercial, Mobility and Services divisions:
|
|
·
|
Commercial Division – provides VSAT networks, satellite communication products, small cell solutions and associated professional services to service providers, satellite operators and MNOs worldwide, including for HTS initiatives worldwide;
|
|
|
·
|
Mobility Division - provides on-the-Move / on-the-Pause satellite communication products and solutions to system integrators, defense and homeland security organizations worldwide and also includes the operations of Wavestream, whose sales are primarily to system integrators, defense and homeland security organizations;
|
|
|
·
|
Service Division - consisting of our service businesses in Peru and Colombia, which offer rural telephony and Internet access solutions and operate these networks.
|
In December 2013, we sold our Spacenet subsidiary, to SageNet for approximately $16 million, subject to certain post-closing adjustments and expenses. During 2014 the post-closing adjustments were resolved and consequently we incurred additional expenses of approximately $0.8 million related to those adjustments.
Spacenet was previously accounted under the Service Division. Following its sale, Spacenet’s results, as well as income and costs related to the sale of Spacenet, are accounted as discontinued operations.
Financial Statements in U.S. Dollars
The currency of the primary economic environment in which most of our operations are conducted is the U.S. dollar and, therefore, we use the U.S. dollar as our functional and reporting currency. Transactions and balances originally denominated in U.S. dollars are presented at their original amounts. Gains and losses arising from non-U.S. dollar transactions and balances are included in the consolidated statements of operations. The financial statements of certain foreign subsidiaries, whose functional currency has been determined to be their local currency, have been translated into U.S. dollars. The assets and liabilities of these subsidiaries have been translated using the exchange rates in effect at the balance sheet date. Statements of operations amounts have been translated using specific rates. The resulting translation adjustments are reported as a component of shareholders' equity in accumulated other comprehensive income (loss).
Explanation of Key Income Statement Items - Significant Revenues and Expenses
Revenues
We generate revenues mainly from the sale of products and services for satellite-based communications networks. Sale of products includes mainly the sale of VSATs, hubs, SSPAs, low-profile antennas and on-the-Move / on-the-Pause terminals. Service revenues include access to and communication via satellites, or space segment, installation of network equipment, telephone services, internet services, consulting, on-line network monitoring, network maintenance and repair services. We sell our products primarily through our direct sales force and indirectly through resellers or system integrators. Sales consummated by our sales force and sales to resellers or system integrators are considered sales to end-users.
In 2014, we did not have any customer who accounted for more than 10% of our revenues. In 2013, one customer accounted for 21% of our revenues (included in our Commercial Division). In 2012, one customer accounted for 17% of our revenues (included in our Commercial Division) and an additional customer accounted for 13% of our revenues (included in our Services Division).
40
Costs and Operating Expenses
Cost of revenues, for both products and services, includes the cost of system design, equipment, satellite capacity, customer service, interconnection charges and third party maintenance and installation.
Our research and development expenses, net of grants received, consist of salaries, raw materials, subcontractor expenses, related depreciation costs and overhead allocated to research and development activities.
Our selling and marketing expenses consist primarily of salaries and related costs, commissions earned by sales and marketing personnel, trade show expenses, promotional expenses and overhead costs allocated to selling and marketing activities, as well as depreciation expenses and travel costs.
Our general and administrative expenses consist primarily of salaries and related costs, allocated overhead costs, office supplies and administrative costs, fees and expenses of our directors, information technology, depreciation, and professional service fees, including legal, insurance and audit fees.
Our operating results are significantly affected by, among other things, the timing of contract awards and the performance of agreements. As a result, our revenues and income (loss) may fluctuate substantially from quarter to quarter, and we believe that comparisons over longer periods of time may be more meaningful. The nature of certain of our expenses is mainly fixed or partially fixed and any fluctuation in revenues will generate a significant variation in gross profit and net income (loss)
Critical Accounting Policies and Estimates
The preparation of the financial information in conformity with generally accepted accounting principles requires us to make estimates and judgments that affect the reported amounts of assets, liabilities, revenues and expenses, and related disclosure of contingent assets and liabilities. On an ongoing basis, we evaluate our estimates, mainly related to trade receivables, inventories, deferred charges, long-lived assets, intangibles and goodwill, revenues, stock based compensation relating to options and contingencies. We base our estimates on historical experience and on various assumptions that are believed to be reasonable under the circumstances, the results of which form the basis for making judgments about the carrying values of assets and liabilities that are not readily apparent from other sources. Actual results may differ from these estimates.
We believe the following critical accounting policies affect our more significant judgments and estimates used in the preparation of the financial information included in this annual report.
Consolidation.
Our consolidated financial statements include the accounts of our company and those of our subsidiaries, in which we have a controlling voting interest, as well as entities consolidated under the Variable Interest Entities, or VIEs, provisions of ASC 810, "Consolidation", or ASC 810. Inter-company balances and transactions have been eliminated upon consolidation.
We apply the provisions of ASC 810, which provides a framework for identifying VIEs and determining when a company should include the assets, liabilities, non-controlling interests and results of activities of a VIE in our consolidated financial statements.
In general, a VIE is a corporation, partnership, limited-liability corporation, trust, or any other legal structure used to conduct activities or hold assets that either: (i) has an insufficient amount of equity to carry out its principal activities without additional subordinated financial support; (ii) has a group of equity owners that is unable to make significant decisions about its activities;(iii) has a group of equity owners that does not have the obligation to absorb losses or the right to receive returns generated by its operations; or (iv) the voting rights of some investors are not proportional to their obligations to absorb the expected losses of the entity, their rights to receive the expected residual returns of the entity, or both, and substantially all of the entity’s activities (for example, providing financing or buying assets) either involve or are conducted on behalf of an investor that has disproportionately few voting rights.
41
ASC 810 requires a VIE to be consolidated by the party with an ownership, contractual or other financial interest in the VIE (a variable interest holder) that has both of the following characteristics: (a) the power to direct the activities of a VIE that most significantly impacts the VIE’s economic performance; (b) the obligation to absorb losses of the VIE that could potentially be significant to the VIE or the right to receive benefits from the VIE that could be potentially be significant to the VIE.
A variable interest holder that consolidates the VIE is called the primary beneficiary. Upon consolidation, the primary beneficiary generally must initially record all of the VIE's assets, liabilities and non-controlling interests at fair value and subsequently account for the VIE as if it were consolidated based on a majority voting interest. ASC 810 also requires disclosures about VIEs in which the variable interest holder is not required to consolidate but in which it has a significant variable interest.
Most of the activity of Gilat Colombia consists of operating subsidized projects for the governmental authority, dirección de conectividad, or DirCon, (formerly known as Compartel) (collectively, the DirCon Projects). The DirCon Projects were originally awarded to our Colombian subsidiaries in 1999 and 2002 and were extended several times. An additional DirCon project that was awarded to us in 2011 was completed in December 2013. We were awarded another DirCon project in 2013 that is ongoing and is scheduled to be completed in 2017.
As required in the bid documents for the DirCon Projects, we established trusts, or the Trusts, and entered into a governing trust agreement for each project, or collectively the Trust Agreements. The Trusts were established for the purpose of holding the network equipment, processing payments to subcontractors, and holding the funds received through the subsidy from the government until they are released in accordance with the terms of the subsidy and paid to us. The Trusts are a mechanism to allow the government to review amounts to be paid with the subsidy and to verify that such funds are used in accordance with the transaction document of the project and the terms of the subsidy. We generate revenues both from the subsidy, as well as from the use of the network that Gilat Colombia operates.
The Trusts are considered VIEs and we are identified as the primary beneficiary of the Trusts. As such, the Trusts were consolidated in our financial statements since their inception.
Under ASC 810, we perform ongoing reassessments of whether we are the primary beneficiary of a VIE. As our assessment provides that we have the power to direct the activities of a VIE that most significantly impacts the VIE’s activities (we are responsible for establishing and operating the networks), the obligation to absorb losses of the VIE that could potentially be significant to the VIE and the right to receive benefits from the VIE that could potentially be significant to the VIE economic performance, we therefore concluded that we are the primary beneficiary of the Trusts. As such, the Trusts were consolidated in our financial statements since their inception.
As of December 31, 2014 and 2013, the Trusts' assets, amounted to $15.4 million and $3.2 million, respectively. These assets are consolidated within our financial statements and are classified as "Restricted cash held by trustees". As of December 31, 2014 and 2013, the Trusts' liabilities, classified as "Short-term advances from customers, held by trustees", are consolidated within our financial statements and amounted to $12.9 million and $0 million, respectively.
Revenues.
Revenues from product sales are recognized in accordance with Securities and Exchange Commission Staff Accounting Bulletin, or SAB No. 104, "Revenue Recognition", when delivery has occurred, persuasive evidence of an agreement exists, the vendor's fee is fixed or determinable, no further obligation exists and collectability is probable. When significant acceptance provision is included in the arrangement, revenues are deferred until the acceptance occurs. Generally, we do not grant rights of return. Service revenues are recognized ratably over the period of the contract or as services are performed, as applicable.
We adopted Accounting Standards Update (''ASU'') No. 2009-13, ''Multiple-Deliverable Revenue Arrangements'' (''ASU 2009-13'') as of the beginning of fiscal year 2011 on a prospective basis for new and materially modified transactions originating after January 1, 2011. Starting from 2011, pursuant to the guidance of ASU 2009-13, when a sales arrangement contains multiple elements, such as equipment and services, we allocate revenues to each element based on a selling price hierarchy. The selling price for a deliverable is based on its vendor specific objective evidence, or VSOE, if available, third party evidence, or TPE, if VSOE is not available, or estimated selling price, or ESP, if neither VSOE nor TPE is available. In multiple element arrangements, revenues are allocated to each separate unit of accounting for each of the deliverables using the relative selling prices of each of the deliverables in the arrangement based on the aforementioned selling price hierarchy where VSOE or TPE does not exist we establish ESP, based on our management judgment, considering internal factors such as margin objectives, pricing practices and etc.
42
Revenues from products under sales-type-lease contracts are recognized in accordance with ASC 840 "Leases", or ASC 840, upon installation or upon shipment, in cases where the customer obtains its own or other's installation services. The net investments in sales-type-leases are discounted at the interest rates implicit in the leases. The present values of payments due under sales-type-lease contracts are recorded as revenues at the time of shipment or installation, as appropriate. Future interest income is deferred and recognized over the related lease term as financial income.
Revenues from products and services under operating leases of equipment are recognized ratably over the lease period, in accordance with ASC 840.
Revenues from contracts in which we provide construction or production of products (“Production-Type Contracts”) which are significantly customized to the buyer's specifications are recognized in accordance with ASC 605-35, "Construction-Type and Production-Type Contracts". In Production-Type Contracts under which we produce units of a basic product in a continuous or sequential production process, we recognize revenues based on the units-of-delivery method, recognizing revenue for each unit on the date that unit is delivered. In other Production-Type Contracts, that require significant construction and customization to the customer's specifications, we recognize revenues using the percentage-of-completion method of accounting based on the input measure by using the ratio of costs related to construction performance incurred to the total estimated amount of such costs. The amount of revenue recognized is based on the total fees under the arrangement and the percentage of completion achieved. Provisions for estimated losses on uncompleted contracts, if any, are made in the period in which such losses are first determined, in the amount of the estimated loss on the entire contact.
Deferred revenue and advances from customers represent amounts received by our company when the criteria for revenue recognition as described above are not met and are included in "Other current liabilities" and "Other long term liabilities", as appropriate. When deferred revenue is recognized as revenue, the associated deferred costs are also recognized as cost of sales.
Income Taxes.
We account for uncertain tax position in accordance with ASC 740-10, "Income Taxes", or ASC 740-10. ASC 740-10 clarifies the accounting for income taxes by prescribing the minimum recognition threshold that a tax position is required to meet before being recognized in the financial statements. ASC 740-10 utilizes a two-step approach for evaluating tax positions. Recognition (step one) occurs when an enterprise concludes that a tax position, based solely on its technical merits, is more-likely-than-not to be sustained upon examination. Measurement (step two) is only addressed if step one has been satisfied (i.e., the position is more-likely-than-not to be sustained). Otherwise, a full liability in respect of a tax position not meeting the more-than-likely-than-not criteria is recognized. ASC 740-10 also provides guidance on derecognition of tax positions, classification on the balance sheet, interest and penalties, accounting in interim periods, disclosure and transition. ASC 740-10 requires significant judgment in determining what constitutes an individual tax position as well as assessing the outcome of each tax position. Changes in judgment as to recognition or measurement of tax positions can materially affect the estimate of the effective tax rate and consequently, affect the operating results of our company.
Accounts Receivable and Allowance for Doubtful Accounts.
We are required to estimate our ability to collect our trade receivables. A considerable amount of judgment is required in assessing their ultimate realization. We provided allowances for receivables relating to customers that were specifically identified by our management as having difficulties paying their respective receivables. If the financial condition of our customers deteriorates, resulting in their inability to make payments, additional allowances may be required. These estimates are based on historical bad debt experience and other known factors
pertaining to these customers. If the historical data we used to determine these estimates does not properly reflect future realization, additional allowances may be required.
43
Inventory Valuation.
We are required to state our inventories at the lower of cost or market value. At each balance sheet date, we evaluate our inventory balance for excess quantities and obsolescence. This evaluation includes an analysis of sales levels by product and projections of future demand. In addition, we write-off inventories that are considered obsolete. Remaining inventory balances are adjusted to the lower of cost or market value. If future demand for our old or new products or market conditions is less favorable than our projections, inventory write-offs may be required and would be reflected in cost of revenues for such period.
Impairment of Intangible Assets and Long-Lived Assets.
We periodically evaluate our intangible assets and long-lived assets (mainly property and equipment) in all of our reporting units for potential impairment indicators in accordance with ASC 360, “Property, Plant and Equipment”, or “ASC 360”. Our judgments regarding the existence of impairment indicators are based on legal factors, market conditions, operational performance and prospects of our acquired businesses and investments. Our long-lived assets are reviewed for impairment whenever events or changes in circumstances indicate that the carrying amount of an asset may not be recoverable. Recoverability of assets to be held and used is measured by a comparison of the carrying amount of the assets to the future undiscounted cash flows expected to be generated by the assets. If such assets are considered to be impaired, the impairment to be recognized is measured by the amount by which the carrying amount of the assets exceeds the fair value of the assets. In measuring the recoverability of assets, we are required to make estimates and judgments in assessing our future cash flows which derive from the estimated useful life of our current primary assets, and compare that with the carrying amount of the assets. Additional significant estimates used by management in the methodologies employed to assess the recoverability of our long-lived assets include estimates of future short-term and long-term growth rates, useful lives of assets, market acceptance of products and services, our success in winning bids and other judgmental assumptions, which are also affected by factors detailed in our risk factors section in this annual report.
During 2012, the continuing pressure on the DoD budget along with ongoing uncertainties surrounding future spending by the DoD, as well as other elements, reflected in the reduction of Wavestream’s revenues and operational results compared to forecasts and prior years’ results were considered as indicators of potential impairment of Wavestream's intangible assets, property and equipment and goodwill and led us to re-evaluate the value of Wavestream’s intangible assets based on the future undiscounted cash flows expected to be generated by it. Following such valuation, we came to the conclusion that the value of Wavestream’s technology was impaired. In order to assess the amount of the impairment, we assessed the fair value of Wavestream’s technology using the discounted cash flow method. As a result, we recorded an impairment loss related to Wavestream’s technology in the amount of approximately $ 8 million in 2012. The impairment loss was recorded as part of "Impairment of goodwill and intangible assets” in our Statement of Operations in the consolidated financial statements included in this annual report.
Future events could cause us to conclude that impairment indicators exist, and that additional intangible assets associated with our acquired businesses and our long-lived assets are impaired. Any resulting impairment loss could have a material adverse impact on our financial condition and results of operations.
During 2014 and 2013, no impairment losses were identified.
Goodwill
. Goodwill represents the excess of the purchase price in a business combination over the fair value of the net tangible and intangible assets acquired. Under ASC 350 "Intangibles - Goodwill and Others", or ASC 350, goodwill is not amortized, but rather is subject to an annual impairment test. ASC 350 requires goodwill to be tested for impairment at least annually or between annual tests in certain circumstances, and written off if and to the extent it is impaired. We conduct our impairment testing in the fourth quarter of each year. Goodwill for all of our reporting units is tested for impairment by comparing the fair value of the reporting unit with its carrying value. Fair value is determined using discounted cash flows. Significant estimates used in the fair value methodologies include estimates of future cash flows, future growth rates and the weighted average cost of capital of the reporting units.
44
In 2012, we identified certain indicators that affected the carrying value of the goodwill and other intangible assets of Wavestream within our Mobility Division. The continuing pressure on the DoD budget along with uncertainties regarding the DoD’s future spending, as well as other elements, were reflected in the reduction of Wavestream’s revenues and operational results in 2012 compared to forecasts and prior years’ results. We performed an analysis of Wavestream’s implied carrying value in accordance with ASC 350. As a result of the impairment test, we recorded goodwill impairment losses of approximately $23.9 million in 2012. The impairment losses were recorded as part of "Impairment of goodwill and intangible assets” in our Statement of Operations in the consolidated financial statements included in this annual report.
We estimated the fair value of Wavestream using the discounted cash flow method. In order to determine fair value, we relied upon five-year forecasts for sales and operating expenses, including capital expenditures, and assume a reasonable annual growth rate of cash flows for periods after the five-year forecast period of 4%. We developed a weighted average cost of capital, or WACC, to discount the expected future cash flows of 14% for 2014, 14.5% for 2013 and 13.5% for 2012. In determining the WACC, we primarily considered factors such as the risk free rate of return, the volatility of the business relative to the market, the equity risk premium and small stock premium.
During 2014 and 2013, no impairment losses were identified.
Legal and Other Contingencies.
We are currently involved in certain legal and other proceedings and are also aware of certain tax and other legal exposures relating to our business. We are required to assess the likelihood of any adverse judgments or outcomes of these proceedings or contingencies as well as potential ranges of probable losses. A determination of the amount of accruals required, if any, for these contingencies is made after careful analysis.
Liabilities related to legal proceedings, demands and claims are recorded in accordance with ASC 450, "Contingencies", or ASC 450, which defines a contingency as "an existing condition, situation, or set of circumstances involving uncertainty as to possible gain or loss to an enterprise that will ultimately be resolved when one or more future events occur or fail to occur." In accordance with ASC 450, accruals for exposures or contingencies are being provided when the expected outcome is probable and when the amount of loss can be reasonably estimated. It is possible, however, that future results of operations for any particular quarter or annual period could be materially affected by changes in our assumptions, the actual outcome of such proceedings or as a result of the effectiveness of our strategies related to these proceedings.
In 2014 we joined a tax amnesty program in Brazil (“Refis”). The Refis program allows companies to pay significantly reduced amounts of interest and fines, or none at all, in order to settle their open tax cases (direct and indirect taxes). We paid approximately $2 million under the Refis program. We reversed accruals we had on our books for some of these claims and therefore recorded income of $0.6 million in general and administrative expenses, $1.8 million in financial income and an expense of $0.3 million in tax expenses.
Accounting for Stock-Based Compensation.
We account for stock based compensation in accordance with ASC 718, "Compensation-Stock Compensation”, or ASC 718, which requires us to measure all employee stock-based compensation awards using a fair value method and recognize such expense in our consolidated financial statements. We adopted ASC 718 using the modified prospective transition method. We estimate the fair value of stock options granted using the Black-Scholes option pricing model, and the fair value of Restricted Share Units, or RSUs, based on the market stock price on the date of grant. We recognized stock-based compensation expense of $2.4 million, $2.3 million and $1.9 million in 2014, 2013 and 2012, respectively. As of December 31, 2014, we had $3.3 million of total unrecognized compensation costs related to non-vested share-based awards granted under our stock option plans. That cost is expected to be recognized over a weighted average period of 1.06 years.
45
Discontinued Operations
.
Under ASC 205, "Presentation of Financial Statements - Discontinued Operation" when a component of an entity, as defined in ASC 205, has been disposed of or is classified as held for sale, the results of its operations, including the gain or loss on its component are classified as discontinued operations and the assets and liabilities of such component are classified as assets and liabilities attributed to discontinued operations; that is, provided that the operations, assets and liabilities and cash flows of the component have been eliminated from the Company's consolidated operations and the Company will have no significant continuing involvement in the operations of the component
.
Subsequent to the sale of Spacenet to SageNet, Spacenet’s results are accounted as discontinued operation and appear in this annual report in a separate line item as “Discontinued Operations”.
Year Ended December 31, 2014 Compared to Year Ended December 31, 2013
Revenues.
Revenues for the years ended December 31, 2014 and 2013 for our three segments were as follows:
|
Year Ended
|
Year Ended
|
|||||||||||||||||||
|
December 31,
|
December 31,
|
|||||||||||||||||||
|
2014
|
2013
|
Percentage
|
2014
|
2013
|
||||||||||||||||
|
U.S. dollars in thousands
|
change
|
Percentage of revenues
|
||||||||||||||||||
|
Commercial
|
||||||||||||||||||||
|
Equipment
|
82,488 | 85,405 | (3.4 | )% | 35.1 | % | 36.4 | % | ||||||||||||
|
Services
|
47,818 | 56,171 | (14.9 | )% | 20.3 | % | 23.9 | % | ||||||||||||
| 130,306 | 141,576 | (8.0 | )% | 55.4 | % | 60.3 | % | |||||||||||||
|
Mobility
|
||||||||||||||||||||
|
Equipment
|
51,318 | 41,893 | 22.5 | % | 21.8 | % | 17.8 | % | ||||||||||||
|
Services
|
3,499 | 6,318 | (44.6 | )% | 1.5 | % | 2.7 | % | ||||||||||||
| 54,817 | 48,211 | 13.7 | % | 23.3 | % | 20.5 | % | |||||||||||||
|
Services
|
||||||||||||||||||||
|
Equipment
|
23,725 | 6,256 | 279.2 | % | 10.1 | % | 2.7 | % | ||||||||||||
|
Services
|
26,285 | 38,823 | (32.3 | )% | 11.2 | % | 16.5 | % | ||||||||||||
| 50,010 | 45,079 | 10.9 | % | 21.3 | % | 19.2 | % | |||||||||||||
|
Total
|
||||||||||||||||||||
|
Equipment
|
157,531 | 133,554 | 18.0 | % | 67.0 | % | 56.9 | % | ||||||||||||
|
Services
|
77,602 | 101,312 | (23.4 | )% | 33.0 | % | 43.1 | % | ||||||||||||
|
Total
|
235,133 | 234,866 | 0.1 | % | 100.0 | % | 100.0 | % | ||||||||||||
Revenues in 2014 remained almost at the same level as 2013, with a slight increase of $0.3 million, or 0.1%.
In our Commercial Division, revenues decreased by approximately $11.3 million in 2014 compared to 2013. The decrease was primarily attributable to the completion of the National Broadband Networks (NBN) project in Australia, which was awarded to us in the second quarter of 2011 and whose rollout was completed in 2013.
46
In our Mobility Division, revenues increased by approximately $6.6 million in 2014 compared to 2013. The increase is mainly attributable to an increase in Wavestream revenues that resulted mainly from sales to system integrators for commercial aviation and increase in sales to DoD systems integrators.
In our Services Division, revenues increased by approximately $4.9 million in 2014 compared to 2013. The increase is mainly attributable to the FITEL project in the Amazonas region of Peru, which was deployed in 2014.
We derived approximately 67% of our revenues from equipment sales and 33% from services in 2014 and in 2013.
Gross profit.
The gross profit of our three segments for the years ended December 31, 2014 and 2013 was as follows:
|
Year Ended
|
Year Ended
|
|||||||||||||||
|
December 31,
|
December 31,
|
|||||||||||||||
|
2014
|
2013
|
2014
|
2013
|
|||||||||||||
|
U.S. dollars in thousands
|
Percentage of revenues per segment
|
|||||||||||||||
|
Commercial
|
||||||||||||||||
|
Equipment
|
25,184 | 30,340 | 30.5 | % | 35.5 | % | ||||||||||
|
Services
|
27,535 | 16,270 | 57.6 | % | 29.0 | % | ||||||||||
| 52,719 | 46,610 | 40.5 | % | 32.9 | % | |||||||||||
|
Mobility
|
||||||||||||||||
|
Equipment
|
15,688 | 9,383 | 30.6 | % | 22.4 | % | ||||||||||
|
Services
|
2,106 | 5,055 | 60.2 | % | 80.0 | % | ||||||||||
| 17,794 | 14,438 | 32.5 | % | 29.9 | % | |||||||||||
|
Services
|
||||||||||||||||
|
Equipment
|
9,756 | 7,527 | 41.1 | % | 120.3 | % | ||||||||||
|
Services
|
3,366 | 11,081 | 12.8 | % | 28.5 | % | ||||||||||
| 13,122 | 18,608 | 26.2 | % | 41.3 | % | |||||||||||
|
Total
|
||||||||||||||||
|
Equipment
|
50,628 | 47,250 | 32.1 | % | 35.4 | % | ||||||||||
|
Services
|
33,007 | 32,406 | 42.5 | % | 32.0 | % | ||||||||||
|
Total
|
83,635 | 79,656 | 35.6 | % | 33.9 | % | ||||||||||
Our gross profit is affected year-to-year by the mix of revenues between equipment and services, the regions in which we operate, the size of our transactions and the timing of when such transactions are consummated. As such, we are subject to year-to-year fluctuation in our gross profit.
47
Our gross profit margin increased to 35.6% in 2014 from 33.9% in 2013. The increase in our gross profit margin in 2014 is attributable to the increase in the gross profit margin of our Commercial Division, which was partly off-set by a decrease in the gross profit margin of our Services Division.
In our Commercial Division, the increase in our gross profit margin is mainly attributable to the completion of the deployment of a large international transaction in 2013, which carried lower margins.
In our Mobility Division, the slight increase in our gross profit margin is mainly attributable to the increase in revenues, while the fixed costs remained substantially at the same level as in 2013.
In our Services Division, the decrease in our gross profit margin is mainly attributable to extension of certain projects in Colombia in 2013 which carried higher margins than the projects in 2014 and to the allocation of overhead costs to the Services Division in 2014. During 2014, we revised the measurement of each segment, due to a new allocation of corporate overhead that was based on new
key performance indicators determined by our management, as reviewed by our Chief Operating Decision Maker (“CODM”).
Research and development expenses, net
. Our research and development expenses are incurred by our Commercial and Mobility Divisions. Our research and development expenses for the years ended December 31, 2014 and 2013 were as follows:
|
Year Ended
|
Year Ended
|
|||||||||||||||||||
|
December 31,
|
December 31,
|
|||||||||||||||||||
|
2014
|
2013
|
Percentage
|
2014
|
2013
|
||||||||||||||||
|
U.S. dollars in thousands
|
change
|
Percentage of revenues per segment
|
||||||||||||||||||
|
Commercial
|
||||||||||||||||||||
|
Expenses incurred
|
19,099 | 18,403 | 3.8 | % | 14.7 | % | 13.0 | % | ||||||||||||
|
Less - grants
|
2,015 | 1,203 | 67.5 | % | 1.5 | % | 0.8 | % | ||||||||||||
| 17,084 | 17,200 | (0.7 | )% | 13.1 | % | 12.2 | % | |||||||||||||
|
Mobility
|
||||||||||||||||||||
|
Expenses incurred
|
8,536 | 11,088 | (23 | )% | 15.6 | % | 23.0 | % | ||||||||||||
|
Less - grants
|
462 | 388 | 19 | % | 0.8 | % | 0.8 | % | ||||||||||||
| 8,074 | 10,700 | (24.5 | )% | 14.7 | % | 22.2 | % | |||||||||||||
|
Total, net
|
25,158 | 27,900 | (9.8 | )% | 10.7 | % | 14.7 | % | ||||||||||||
Net research and development expenses decreased by approximately $2.7 million in 2014 compared to 2013. The decrease in research and development expenses is attributable to both Mobility and Commercial Divisions. We continue to concentrate our efforts in the integration of and growing synergies between our research and development activities worldwide. Gross R&D expenses were reduced by approximately $1.9 million while OCS grants increased by $0.9 million in 2014 compared to 2013. The increase in OCS grants was due to a higher allocated budget by the Israeli government in 2014 compared to 2013.
48
Selling and marketing expenses.
The selling and marketing expenses of our three reportable segments for the years ended December 31, 2014 and 2013 were as follows:
|
Year Ended
|
Year Ended
|
|||||||||||||||||||
|
December 31,
|
December 31,
|
|||||||||||||||||||
|
2014
|
2013
|
Percentage
|
2014
|
2013
|
||||||||||||||||
|
U.S. dollars in thousands
|
change
|
Percentage of revenues per segment
|
||||||||||||||||||
|
Commercial
|
23,401 | 22,759 | 2.8 | % | 18.0 | % | 16.1 | % | ||||||||||||
|
Mobility
|
7,809 | 8,139 | (4.1 | )% | 14.2 | % | 16.9 | % | ||||||||||||
|
Services
|
1,327 | 1,316 | 0.8 | % | 2.7 | % | 2.9 | % | ||||||||||||
|
Total
|
32,537 | 32,214 | 1 | % | 13.8 | % | 13.7 | % | ||||||||||||
Selling and marketing expenses increased by approximately $0.3 million in 2014, compared to 2013. Selling and marketing expenses increased in our Commercial Division by approximately $0.6 million, off-set by a decrease of approximately $0.3 million in our Mobility Division.
In our Commercial Division, the $0.6 million increase in expenses is mainly attributable to increased vacation expenses.
In our Mobility Division, the decrease of $0.3 million is mainly attributable to the decrease in subcontractors and travel expenses due to cost efficiencies as well as tighter budget controls.
In our Services Division, expenses in 2014 remained at the same level as 2013.
General and administrative expenses.
The general and administrative expenses of our three segments for the years ended December 31, 2014 and 2013 were as follows:
|
Year Ended
|
Year Ended
|
|||||||||||||||||||
|
December 31,
|
December 31,
|
|||||||||||||||||||
|
2014
|
2013
|
Percentage
|
2014
|
2013
|
||||||||||||||||
|
U.S. dollars in thousands
|
change
|
Percentage of revenues per segment
|
||||||||||||||||||
|
Commercial
|
7,808 | 9,973 | (21.7 | )% | 6.0 | % | 7.0 | % | ||||||||||||
|
Mobility
|
5,961 | 7,744 | (23.0 | )% | 10.9 | % | 16.1 | % | ||||||||||||
|
Services
|
7,134 | 5,354 | 33.2 | % | 14.3 | % | 11.9 | % | ||||||||||||
|
Total
|
20,903 | 23,071 | (9.4 | )% | 8.9 | % | 9.8 | % | ||||||||||||
General and administrative expenses decreased by approximately $2.2 million in 2014 compared to 2013. The decrease is attributable to our Commercial and Mobility Divisions, in which expenses declined by $2.2 million and $1.8 million, respectively, offset by an increase of $1.8 million in our Services Division.
49
In our Commercial Division, the $2.2 million decrease is primarily attributable to lower subcontractor expenses due to our continuing efforts to reduce costs, and a reduction in bad debt expense due to higher specific bad debts which we incurred in 2013 for certain customers and setoff of costs due to our participation in the Refis program and the reversal of related accruals. In addition, there was a decrease due to a change in the method of allocation of overhead expenses to the divisions in 2014 compared to 2013.
In our Mobility Division, the $1.8 million decrease is primarily attributable to lower subcontractor expenses and depreciation expenses due to our continuing efforts to reduce costs. In addition, there was a decrease due to different allocation of overhead expenses to the divisions in 2014 compared to 2013.
In our Services Division, the $1.8 million increase is primarily attributable to higher legal expenses related to an arbitration claim we filed in Peru. In addition, there was an increase due to a change in the method of allocation of overhead expenses to the divisions in 2014 compared to 2013.
Impairment of goodwill and intangible assets
. We conducted our impairment testing in the fourth quarter of 2014 and 2013. Goodwill for all of our reporting units was tested for impairment by comparing the fair value of the reporting unit with its carrying. No impairment losses were identified in 2014 or 2013.
Restructuring Costs
. At the end of 2013, we initiated a restructuring plan to improve our operating efficiency at various operating sites and to reduce our operating expenses in the future. As a result of these plans we recognized expenses of $0.6 million for employee contract termination costs and other related expenses in 2013.
Financial expenses, net.
In the year ended December 31, 2014, we had financial expenses of approximately $3.8 million compared to financial expenses of approximately $6.2 million in 2013. The decrease of $2.4 million in our financial expenses is primarily attributable to changes in exchange rate between the local currency and the U.S. dollar in the countries where we operate, mainly in Israel.
Taxes on income.
Taxes on income are dependent upon where our profits are generated, such as the location and taxation of our subsidiaries
as well as changes in deferred tax assets and liabilities recorded mainly as part of business combinations. Tax expenses in 2014 were approximately $1.9 million compared to tax benefits of approximately $0.8 million in 2013.
In 2013, the tax benefit was mainly as result of a decrease in valuation allowance on deferred tax assets related to Wavestream due to the expected realization of Wavestream’s carryforward tax losses, while in 2014 we incurred tax expenses in several entities.
Year Ended December 31, 2013 Compared to Year Ended December 31, 2012
Revenues.
Revenues for the years ended December 31, 2013 and 2012 for our three segments were as follows:
|
Year Ended
|
Year Ended
|
|||||||||||||||||||
|
December 31,
|
December 31,
|
|||||||||||||||||||
|
2013
|
2012
|
Percentage
|
2013
|
2012
|
||||||||||||||||
|
U.S. dollars in thousands
|
change
|
Percentage of revenues
|
||||||||||||||||||
|
Commercial
|
||||||||||||||||||||
|
Equipment
|
85,405 | 101,455 | (15.8 | )% | 36.4 | % | 37.4 | % | ||||||||||||
|
Services
|
56,171 | 57,427 | (2.2 | )% | 23.9 | % | 21.1 | % | ||||||||||||
| 141,576 | 158,882 | (10.9 | )% | 60.3 | % | 58.5 | % | |||||||||||||
|
Mobility
|
||||||||||||||||||||
|
Equipment
|
41,893 | 51,703 | (19.0 | )% | 17.8 | % | 19.0 | % | ||||||||||||
|
Services
|
6,318 | 3,668 | 72.2 | % | 2.7 | % | 1.4 | % | ||||||||||||
| 48,211 | 55,371 | (12.9 | )% | 20.5 | % | 20.4 | % | |||||||||||||
|
Services
|
||||||||||||||||||||
|
Equipment
|
6,256 | 2,533 | 147.0 | % | 2.7 | % | 0.9 | % | ||||||||||||
|
Services
|
38,823 | 54,780 | (29.1 | )% | 16.5 | % | 20.2 | % | ||||||||||||
| 45,079 | 57,313 | (21.3 | )% | 19.2 | % | 21.1 | % | |||||||||||||
|
Total
|
||||||||||||||||||||
|
Equipment
|
133,554 | 155,691 | (14.2 | )% | 56.9 | % | 57.3 | % | ||||||||||||
|
Services
|
101,312 | 115,875 | (12.6 | )% | 43.1 | % | 42.7 | % | ||||||||||||
|
Total
|
234,866 | 271,566 | (13.5 | )% | 100.0 | % | 100.0 | % | ||||||||||||
50
Revenues in 2013 decreased by approximately $36.7 million compared to 2012, representing a decrease of 13.5%. The decrease of $36.7 million was attributable to decreases of $17.3 million, $7.2 million and $12.2 million in our Commercial, Mobility and Services divisions, respectively.
In our Commercial Division, revenues decreased by approximately $17.3 million in 2013 compared to 2012. The decrease was primarily attributable to the decrease in our Latin American and Asian revenues of $14.9 million and $2.1 million, respectively. The decrease in Latin American revenues is mainly attributable to a delay in two projects, whose revenues were shifted to 2014. The delays in the two projects were due to a delay in the selling process to the customers. The agreements closed later than anticipated and therefore the delivery of the projects was partly delayed to 2014, resulting in significantly lower revenues than expected from these projects in 2013.
In our Mobility Division, revenues decreased by approximately $7.2 million in 2013 compared to 2012. The decrease is primarily attributable to the slowdown in Wavestream revenues in the first half of 2013 that resulted from the DoD sequestration and government shut down in the U.S.
In our Services Division, revenues decreased by approximately $12.2 million in 2013 compared to 2012. The decrease is mainly attributable to decreased revenues from the DirCon project in Colombia, which ended on March 31, 2013, which was partially offset by increased revenues in Peru that was primarily attributable to a substantial equipment sale.
We derived approximately 57% of our revenues from equipment sales and 43% from services in 2013 and in 2012.
Gross profit.
The gross profit of our three segments for the years ended December 31, 2013 and 2012 was as follows:
|
Year Ended
|
Year Ended
|
|||||||||||||||
|
December 31,
|
December 31,
|
|||||||||||||||
|
2013
|
2012
|
2013
|
2012
|
|||||||||||||
|
U.S. dollars in thousands
|
Percentage of revenues per segment
|
|||||||||||||||
|
Commercial
|
||||||||||||||||
|
Equipment
|
30,340 | 44,145 | 35.5 | % | 43.5 | % | ||||||||||
|
Services
|
16,270 | 17,427 | 29.0 | % | 30.3 | % | ||||||||||
| 46,610 | 61,572 | 32.9 | % | 38.8 | % | |||||||||||
|
Mobility
|
||||||||||||||||
|
Equipment
|
9,383 | 13,333 | 22.4 | % | 25.8 | % | ||||||||||
|
Services
|
5,055 | 1,040 | 80.0 | % | 28.4 | % | ||||||||||
| 14,438 | 14,373 | 29.9 | % | 26.0 | % | |||||||||||
|
Services
|
||||||||||||||||
|
Equipment
|
7,527 | 1,408 | 120.3 | % | 55.6 | % | ||||||||||
|
Services
|
11,081 | 20,576 | 28.5 | % | 37.6 | % | ||||||||||
| 18,608 | 21,984 | 41.3 | % | 38.4 | % | |||||||||||
|
Total
|
||||||||||||||||
|
Equipment
|
47,250 | 58,886 | 35.4 | % | 37.8 | % | ||||||||||
|
Services
|
32,406 | 39,043 | 32.0 | % | 33.7 | % | ||||||||||
|
Total
|
79,656 | 97,929 | 33.9 | % | 36.1 | % | ||||||||||
51
Our gross profit is affected year-to-year by the mix of revenues between equipment and services, the regions in which we operate, the size of our transactions and the timing in which such transactions are consummated. As such, we are subject to year-to-year fluctuation in our gross profit. Our gross profit decreased mainly due to the decrease in overall sales. Our gross profit margin decreased to 33.9% in 2013 from 36.1% in 2012. The decrease in our gross profit margin in 2013 is attributable to the decrease in our overall sales and specifically to decreased equipment sales in 2013 compared to 2012. In general, as a result of the fixed cost component in our costs of goods sold, the decrease in overall sales resulted in a significant decrease in overall gross margin, as further discussed below.
Our gross profit from our Commercial Division decreased mainly due to the decrease in revenues. In addition, the decrease in revenues from equipment sales was significantly higher than the decrease in our revenues from services, which had a lower gross margin. Accordingly, the change in the mix of revenues with services revenues increasing as a percentage of total revenues resulted in a decrease in the gross margin of the total division. In addition, there was a significant decrease in our equipment gross margin due to the decrease in revenues and the continuing fixed cost component of our costs of goods sold.
In our Mobility Division, the increase in our gross profit is mainly attributable to certain international sales transactions which carried higher margins. In 2012, the portion of the sales of products to DoD systems integrators, which have a lower gross margin, out of the total sales was higher than in 2013. In 2013, a higher proportion of our equipment sales and related services were made directly to end customers in the international market (not related to the DoD) and included different equipment and related services than those sold to the DoD, which carried higher gross margins. In addition, there was a significant increase in our services gross margin due to the increase in services revenues and the continuing fixed cost component of our costs of services.
Our gross profit from our Services Division decreased mainly due to the decrease in revenues. This decrease was slightly offset by an increase in our gross profit margin attributable to the increase in equipment sales, which was offset by the significant decrease in revenues generated from services, which have a lower gross margin. The increase in equipment sales is attributable to a substantial equipment transaction in Peru. In addition, the gross margin from services decreased substantially since we continued to incur fixed costs during 2013, while our revenues from the DirCon project in Colombia ended on March 31, 2013, resulting in lower revenues for the entire year.
Research and development expenses, net
.
Our research and development expenses are incurred by our Commercial and Mobility Divisions. Our research and development expenses for the years ended December 31, 2013 and 2012 were as follows:
|
Year Ended
|
Year Ended
|
|||||||||||||||||||
|
December 31,
|
December 31,
|
|||||||||||||||||||
|
2013
|
2012
|
Percentage
|
2013
|
2012
|
||||||||||||||||
|
U.S. dollars in thousands
|
change
|
Percentage of revenues per segment
|
||||||||||||||||||
|
Commercial
|
||||||||||||||||||||
|
Expenses incurred
|
18,403 | 19,561 | (5.9 | )% | 13.0 | % | 12.3 | % | ||||||||||||
|
Less - grants
|
1,203 | 2,261 | (46.8 | )% | 0.8 | % | 1.4 | % | ||||||||||||
| 17,200 | 17,300 | (0.6 | )% | 12.2 | % | 10.9 | % | |||||||||||||
|
Mobility
|
||||||||||||||||||||
|
Expenses incurred
|
11,088 | 12,735 | (12.9 | )% | 23.0 | % | 23.0 | % | ||||||||||||
|
Less - grants
|
388 | 794 | (51.1 | )% | 0.8 | % | 1.4 | % | ||||||||||||
| 10,700 | 11,941 | (10.4 | )% | 22.2 | % | 21.6 | % | |||||||||||||
|
Total, net
|
27,900 | 29,241 | (4.6 | )% | 14.7 | % | 13.6 | % | ||||||||||||
Net research and development expenses decreased by approximately $1.3 million in 2013 compared to 2012. The decrease in research and development expenses is attributable to both Mobility and Commercial Divisions. In both divisions, we concentrate our efforts on the integration of and growing synergies between our research and development activities worldwide mainly following the acquisitions of Wavestream and RAS in 2010. Gross research and development expenses were reduced by approximately $2.8 million, which was offset by an approximately $1.5 million decrease in OCS grants in 2013 compared to 2012. The reduction in OCS grants was due to a lower allocated budget by the Israeli government in 2013 compared to 2012.
52
Selling and marketing expenses.
The selling and marketing expenses of our three segments for the years ended December 31, 2013 and 2012 were as follows:
|
Year Ended
|
Year Ended
|
|||||||||||||||||||
|
December 31,
|
December 31,
|
|||||||||||||||||||
|
2013
|
2012
|
Percentage
|
2013
|
2012
|
||||||||||||||||
|
U.S. dollars in thousands
|
change
|
Percentage of revenues per segment
|
||||||||||||||||||
|
Commercial
|
22,759 | 24,184 | (5.9 | )% | 16.1 | % | 15.2 | % | ||||||||||||
|
Mobility
|
8,139 | 9,128 | (10.8 | )% | 16.9 | % | 16.5 | % | ||||||||||||
|
Services
|
1,316 | 1,676 | (21.5 | )% | 2.9 | % | 2.9 | % | ||||||||||||
|
Total
|
32,214 | 34,988 | (7.9 | )% | 13.7 | % | 12.9 | % | ||||||||||||
Selling and marketing expenses decreased by approximately $2.8 million in 2013, compared to 2012. Selling and marketing expenses declined in all of divisions as revenues declined in all divisions.
In our Commercial Division, the decrease in expenses of $1.4 million is mainly attributable to the decrease in variable expenses associated with the decrease in Commercial Division revenues.
In our Mobility Division, the decrease of $1 million is mainly attributable to the decrease in variable expenses associated with the decrease in Mobility Division revenues as well as the continued efforts to integrate both Wavestream and RAS. These efforts are mainly due to cost efficiencies as well as from tighter budget controls and a reduction in headcount and related expenses.
In our Services Division, the decrease of $0.4 million is mainly attributable to lower levels of variable expenses related to lower levels of revenues, mainly in Colombia, compared to 2012.
General and administrative expenses.
The general and administrative expenses of our three segments for the years ended December 31, 2013 and 2012 were as follows:
|
Year Ended
|
Year Ended
|
|||||||||||||||||||
|
December 31,
|
December 31,
|
|||||||||||||||||||
|
2013
|
2012
|
Percentage
|
2013
|
2012
|
||||||||||||||||
|
U.S. dollars in thousands
|
change
|
Percentage of revenues per segment
|
||||||||||||||||||
|
Commercial
|
9,973 | 11,221 | (11.1 | )% | 7.0 | % | 7.1 | % | ||||||||||||
|
Mobility
|
7,744 | 4,940 | 56.8 | % | 16.1 | % | 8.9 | % | ||||||||||||
|
Services
|
5,354 | 7,457 | (28.2 | )% | 11.9 | % | 13.0 | % | ||||||||||||
|
Total
|
23,071 | 23,618 | (2.3 | )% | 9.8 | % | 8.7 | % | ||||||||||||
General and administrative expenses decreased by approximately $0.5 million in 2013 compared to 2012. The decrease is mainly attributable to our Commercial and Services Divisions, where expenses declined by $1.2 million and $2.1 million, respectively, offset by an increase of $2.8 million in our Mobility Division.
In our Commercial Division, the $1.2 million decrease is attributable to our continuing efforts to reduce costs, primarily reflected in decreased salary expenses due to a decrease in our headcount.
53
In our Services Division, the $2.1 million decrease is attributable to our ongoing cost reduction efforts and also to revised overhead allocations, primarily associated with decreased salary costs, legal and other professional services expenses.
In our Mobility Division, the $2.8 million increase is primarily attributable to lower expenses in 2012 resulting from the reversal of certain provisions associated with the acquisition of Raysat Antennas System (RAS) in 2010 and to reduction in other professional services expenses.
Impairment of goodwill and intangible assets
. During 2012, the continuing pressure on the DoD budget along with uncertainties as to the DoD’s future spending, as well as other elements, reflected in the reduction of Wavestream’s revenues
and operational results in 2012 and 2011 compared to the forecasts and prior years’ results were considered as indicators of potential impairment of Wavestream's intangible assets, property and equipment and goodwill. This led us to reduce our projections for Wavestream’s results in future years and resulted in a charge for impairment of goodwill and intangible assets. In 2012, following the performance of the two-step analysis of Wavestream’s implied carrying value in accordance with ASC 350, we recorded $31.9 million of impairment charges in goodwill and intangible assets, consisting of a $23.9 million goodwill impairment charge and a $8 million technology impairment charge. The impairment charges were recorded as part of "Impairment of goodwill and intangible assets” in our Statement of Operations in the consolidated financial statements included in this annual report. In 2013 the impairment test was performed but no impairment losses were identified.
Restructuring Costs
. At the end of 2013 and 2012, we initiated restructuring plans to improve our operating efficiency at various operating sites and to reduce our operating expenses for the upcoming years. As a result of these plans we recognized expenses of $0.6 million and $0.3 million in 2013 and 2012, respectively, for employee contract termination costs and other related expenses.
Financial expenses, net.
In the year ended December 31, 2013, we had financial expenses of approximately $6.2 million compared to financial expenses of approximately $3.4 million in 2012. The increase of $2.8 million in our financial expenses is primarily attributable to changes in exchange rate between local currency and the U.S. dollar in the countries where some of our subsidiaries operate, mainly in Latin America and Australia.
Other income
. In 2012, we recorded $2.7 million of other income, mainly due to a settlement agreement with a consortium of private equity investors in connection with the termination of a merger agreement entered into in 2008, pursuant to which we were to be acquired by certain private equity investors.
Taxes on income.
Taxes on income are dependent upon where our profits are generated, such as the location and taxation of our subsidiaries
as well as changes in deferred tax assets and liabilities recorded mainly as part of business combinations. Tax benefits in 2013 were approximately $0.8 million compared to tax benefits of approximately $1.9 million in 2012. The decrease in tax benefit during 2013 is mainly attributable to the decrease in deferred tax liabilities related to Wavestream’s intangible assets in 2012 due to the impairment of Wavestream’s technology.
Variability of Quarterly Operating Results
Our revenues and profitability may vary from quarter to quarter and in any given year, depending primarily on the sales mix of our family of products and the mix of the various components of the products (i.e. the volume of sales of remote terminals versus hub equipment), sale prices, and production costs, as well as on entering into new service contracts, the termination of existing service contracts, or different profitability levels between different service contracts. Sales of our products to a customer typically consist of numerous remote terminals and related hub equipment, SSPAs, BUCs, and low-profile antennas, which carry varying sales prices and margins.
54
Annual and quarterly fluctuations in our results of operations may be caused by the timing and composition of orders by our customers and the timing of our ability to recognize revenues. Our future results may also be affected by a number of factors, including our ability to continue to develop, introduce and deliver new and enhanced products on a timely basis and expand into new product offerings at competitive prices, to integrate our recent acquisitions, to anticipate effectively customer demands and to manage future inventory levels in line with anticipated demand. Our results may also be affected by currency exchange rate fluctuations and economic conditions in the geographical areas in which we operate. In addition, our revenues may vary significantly from quarter to quarter as a result of, among other factors, the timing of new product announcements and releases by our competitors and us. We cannot be certain that revenues, gross profit and net income (or loss) in any particular quarter will not vary from the preceding or comparable quarters. Our expense levels are based, in part, on expectations as to future revenues. If revenues are below expectations, operating results are likely to be adversely affected. In addition, a substantial portion of our expenses are fixed (
e.g
. space segment, lease payments) and adjusting expenses in the event revenues drop unexpectedly often takes considerable time. As a result, we believe that period-to-period comparisons of our results of operations are not necessarily meaningful and should not be relied upon as indications of future performance. Due to all of the foregoing factors, it is possible that in some future quarters our revenues or operating results will be below the expectations of public market analysts or investors. In such event, the market price of our shares would likely be materially adversely affected.
Conditions in Israel
We are organized under the laws of the State of Israel, where we also maintain our headquarters and a material portion of our laboratory capacity and principal research and development facilities. See Item 3.D. “Key Information – Risk Factors – Risks Relating to Our Location in Israel” for a description of governmental, economic, fiscal, monetary or political factors that have materially affected or could materially affect our operations.
Impact of Inflation and Currency Fluctuations
While most of our sales and service contracts are in U.S. dollars, most of our expenses are in NIS and various currencies other than U.S. Dollar. The foreign exchange risks are often significant due to fluctuations in local currencies relative to the U.S. dollar.
The influence on the U.S. dollar cost of our operations in Israel relates primarily to the cost of salaries in Israel, which are paid in NIS and constitute a substantial portion of our expenses in NIS.
In 2014, the rate of deflation in Israel was 0.2% and the U.S. dollar appreciated in relation to the NIS at a rate of 12%, from NIS 3.471 per $1 on December 31, 2013 to NIS 3.889 per $1 on December 31, 2014.
In 2013, inflation in Israel was 1.8% while the U.S. dollar depreciated in relation to the NIS at a rate of 7%. If future inflation in Israel exceeds the devaluation of the NIS against the U.S. dollar or if the timing of such devaluation lags behind increases in inflation in Israel, our results of operations may be materially adversely affected. In 2014 and 2013, in order to mitigate these risks, we entered into hedging contracts to cover certain of our NIS to U.S. dollar exchange rate exposures.
Regarding the changes in the value of other foreign currencies in relation to the U.S. dollar, our monetary balances that are not linked to the U.S. dollar impacted our financial expenses during 2014 and 2013. This is due to significant fluctuations in currencies in certain regions of Latin America, Europe and Asia in which we do business. There can be no assurance that in the future our results of operations may not be materially adversely affected by other currency fluctuations.
Effective Corporate Tax Rate
The regular corporate tax rate in Israel for 2014 was 26.5%compared to a tax rate of 25% in 2012 and 2013.
The Law for the Encouragement of Capital Investments, 1959, or Investments Law, provides that a capital investment in eligible facilities may, upon application to the Investment Center of the Ministry of Industry, Trade and Labor of the State of Israel, be designated as an “Approved Enterprise”. An Approved Enterprise is eligible for tax benefits on taxable income derived from its approved enterprise programs.
55
On April 1, 2005, an amendment to the Israeli Law for the Encouragement of Capital Investments, 1959, or the Investment Law, came into effect that limits the scope of enterprises which may be approved by the Investment Center by setting criteria for the approval of a facility, such as provisions generally requiring that at least 25% of their business income will be derived from export. A facility that is approved is called a "Benefitted Enterprise." Additionally, the 2005 amendment enacted major changes in the manner in which tax benefits are awarded under the Investment Law, so that companies no longer require Investment Center approval in order to qualify for tax benefits.
We have been granted “Approved Enterprise” status under the Investment Law for nine investment programs. The period of benefits for all of these programs has expired. In addition, our company chose 2005 and 2011 as the years of election in order to receive tax benefits as Benefitted Enterprise under the amendment. See “Item 10 - Additional Information - Israeli Tax Consideration”.
To the extent we become profitable for Israeli tax purposes, we may therefore be eligible for a tax exemption for a limited period on undistributed Benefitted Enterprise income, and an additional subsequent period of reduced corporate tax rates (ranging between 10% and 25%, depending on the level of foreign ownership of our shares), on such undistributed Benefitted Enterprise income. Income from sources other than the “Benefitted Enterprises” during the relevant period of benefits will be taxable at the regular corporate tax rates. As of December 31, 2014, we did not generate income under the provisions of the Investment Law.
Under an amendment to the Investment Law effective January 1, 2011, upon an irrevocable election made by the company, a uniform rate of corporate tax will apply to all qualified income of certain industrial companies, as opposed to the currently applicable law's incentives that are limited to income from Benefitted Enterprises during their benefits period. Under the amended law, the uniform tax rates were 10% in geographical areas in Israel designated as Development Zone A and 15% elsewhere in Israel during 2011-2012. The uniform tax rates were reduced to 7% and 12.5%, respectively to the mentioned geographic areas in 2013. The uniform tax rate for 2014 and onwards is set to 9% in areas in Israel designated as Development Zone A and 16% elsewhere in Israel. The profits of these industrial companies will be freely distributable as dividends, subject to a 20% withholding tax (or lower, under an applicable tax treaty).
Under the transitory provisions of the 2011 Legislation, we may elect whether to irrevocably implement the new law, while waiving benefits provided under the currently applicable law, or rather to keep implementing the currently applicable law during the next years. Changing from the currently applicable law to the new January 1, 2011 law is permissible at any stage.
Cash outlays for income taxes in the future might be different from tax expenses, mainly due to cash tax payments for previous years that might be triggered by tax audits in the various tax jurisdictions, deferred tax expenses (income) and payments usually made in arrears for annual taxes in profitable years.
Impact of Recently Issued Accounting Pronouncements
In May 2014, Financial Accounting Standards Board ("FASB") issued ASU 2014-09, "Revenue from Contracts with Customers (Topic 606)", a comprehensive new revenue recognition standard that will supersede existing revenue guidance under US GAAP and IFRS ("ASU 2014-09"). ASU 2014-09's core principle is that a company will recognize revenue when it transfers promised goods or services to customers in an amount that reflects the consideration to which the company expects to be entitled in exchange for those goods or services. ASU 204-09 is effective for annual periods beginning after December 15, 2016, including interim periods within that period. Early adoption is not permitted under US GAAP. We are currently evaluating the method of adoption, as well as the effect that adoption of the ASU 2014-09 will have on our consolidated financial statements.
56
|
B.
|
Liquidity and Capital Resources
|
Since our inception, our financing requirements have been met through cash from funds generated by private equity investments, public offerings, issuances of convertible subordinate notes, bank loans, operations, as well as funding from research and development grants. In addition, we also finance our operations through available credit facilities as discussed below. We have used available funds primarily for working capital, capital expenditures and strategic investments.
As of December 31, 2014, we had cash and cash equivalents of $27.7 million, short-term and long-term restricted cash of $26.2 million, short-term restricted cash held in trustees' accounts of $ 15.4 million and short term bank credits and loans of $15.9 million. As of December 31, 2013, we had cash and cash equivalents of $58.4 million, short-term and long-term restricted cash of $25.2 million and short-term restricted cash held in trustees' accounts of $3.2 million. We believe that our working capital is sufficient for our present requirements.
As of December 31, 2014, our long-term debt was approximately $30.9 million, comprised of long-term loans of $26.3 million and current maturities of long-term loans of $4.6 million.
The long term loans primarily consist of a loan that was received in December 2010 in the amount of $40 million from First International Bank of Israel and bears interest of 4.77%. As of December 31, 2014, the principal outstanding balance of this loan was $28 million. Under the provisions of that loan, we undertook to satisfy certain financial and other covenants. As of December 31, 2014 we are in compliance with these covenants.
Our credit agreements contain various restrictions and limitations that may impact us, including a floating charge on our assets to secure the repayment of the loan to First International Bank of Israel and other pledges on our assets and property. These restrictions and limitations relate to incurrence of indebtedness, contingent obligations, liens, mergers and acquisitions, asset sales, dividends and distributions, redemption or repurchase of equity interests, certain debt payments and modifications of loans and investments.
The following table summarizes our cash flows for the periods presented:
|
Years ended December 31,
|
||||||||||||
|
2014
|
2013
|
2012
|
||||||||||
|
U.S. Dollars
in thousands
|
||||||||||||
|
Net cash provided by (used in) continuing operating activities
|
(16,162 | ) | 16,397 | 19,957 | ||||||||
|
Net cash used in continuing investing activities
|
(26,753 | ) | (30,908 | ) | (1,597 | ) | ||||||
|
Net cash provided by (used in) continuing financing activities
|
12,389 | (16,387 | ) | (9,974 | ) | |||||||
|
Net cash provided by (used in) discontinued operating activities
|
- | (5,996 | ) | 1,614 | ||||||||
|
Net cash provided by discontinued investing activities
|
- | 15,791 | 999 | |||||||||
|
Net cash provided by discontinued financing activities
|
- | 12,884 | - | |||||||||
|
Total cash flows from discontinued operations
|
- | 22,679 | 2,613 | |||||||||
|
Effect of exchange rate changes on cash and cash equivalents
|
(172 | ) | (325 | ) | (262 | ) | ||||||
|
Net increase (decrease) in cash and cash equivalents
|
(30,698 | ) | (8,544 | ) | 10,737 | |||||||
|
Cash and cash equivalents at beginning of the period
|
58,424 | 66,968 | 56,231 | |||||||||
|
Cash and cash equivalents at end of the period
|
27,726 | 58,424 | 66,968 | |||||||||
57
Our cash and cash equivalents decreased by approximately $30.7 million during the year ended December 31, 2014 as a result of the following:
Continuing Operation:
Operating activities. Net cash used in our continuing operating activities was approximately $16.2 million in 2014 compared to cash provided by continuing operating activities of approximately $16.4 million in 2013. The net cash used in our continuing operating activities in 2014 was mainly attributable to increase in advances from customers and deferred charges, mainly related to our operations under our Services Division, which was offset partly by depreciation and amortization expenses.
Investing activities. Net cash used in continuing investing activities was approximately $26.8 million in 2014 and $30.9 million in 2013. The net cash used in continuing investing activities consisted mainly of net investment in restricted cash held by trustees and to our purchase of property and equipment, both of which are mainly related to our project in Colombia.
Financing activities. Net cash provided by continuing financing activities was approximately $12.4 million in 2014, compared to net cash used in continuing financing activities in 2013 of approximately $16.4 million. The net cash provided by continuing financing activities in 2014 was derived mainly from short terms bank credit received for our Colombia project, offset partly by repayment of long term loans. The net cash used in continuing financing activities in 2013 was primarily attributable to repayment of short term bank credit and to repayment of long term loans.
Our cash and cash equivalents decreased by approximately $8.5 million during the year ended December 31, 2013 as a result of the following:
Continuing Operation:
Operating activities. Net cash provided by our continuing operating activities was approximately $16.4 million in 2013 compared to $20 million in 2012. The decrease of $3.6 million is mainly attributable to decrease in our operational results in 2013 compared to 2012 due to the decrease in our revenues. The decrease in our operational results was offset by significant increase in advance payments from customers mainly in Latin America.
Investing activities. Net cash used in continuing investing activities was approximately $31 million, mainly attributable to $26.8 million that were released from restricted Net cash accounts and to our purchase of $4.1 million of property and equipment.
Financing activities. Net cash used in continuing financing activities was approximately $16.4 million, primarily attributable to repayment of short term bank credit of $3.5 million and to repayment of long term loans of $13 million.
Discontinued Operation:
Operating activities. Net cash used in our discontinued operating activities was approximately $6 million in 2013 compared to net cash of approximately $1.6 million provided by discontinued operating activities in 2012. The decrease of $7.6 million is mainly attributable to decrease in operational results in 2013 compared to 2012, mainly associated with the decrease in revenues, as well as to costs related to sale of Spacenet.
Investing activities. Net cash provided by discontinued investing activities was approximately $15.8 million, mainly attributable to the proceeds received from the sale of Spacenet.
Financing activities. Net cash provided by discontinued financing activities was approximately $12.9 million, primarily attributable to a financing agreement Spacenet entered into with a U.S financing company in March 2013, for a partially non-recourse loan of $14.7 million.
58
|
C.
|
Research and Development
|
We devote significant resources to research and development projects designed to enhance our VSAT, Satcom-On-The-Move antennas, SSPA and GLT-1000 modem products, to expand the applications for which they can be used and to develop new products, including expanding our VSAT portfolio with high speed And hybrid VSATs. We intend to continue to devote significant resources to complete the development of certain features, to improve functionality, including supporting higher throughput, to improve space segment utilization, and to reduce the cost of our products.
Our research and development activities are located in Israel, Bulgaria, Moldova, California and Singapore. The Bulgarian center is dedicated to developments related to our Satcom-On-The-Move antennas and Wavestream’s facilities both in California and Singapore are focused on the continuing design and development for SSPAs. Our facilities in Moldova and in Israel support our research and development efforts.
We devoted significant research and development resources in the last few years to the development of our SkyEdge family of products, including to the development of our own proprietary hardware platforms for both baseband equipment and software. In 2014, we invested heavily into developing the new baseband equipment (x-chassis) optimized for multi-spot beam networks. We develop our own network software and software for our VSATs. Our resources in the years 2011 through 2014 were also used for the acquired family of products from Raysat and Wavestream as well as for our Ka-band VSAT products and for development of our GLT-1000, MLT-1000 products, point to point or point to multipoint satellite modems. These modems deliver satellite communications for on-the-move, stationary, point-to-point (SCPC), and point-to-multipoint (managed MCPC) operations.
Our software and our internally developed hardware are proprietary and we have implemented protective measures both of a legal and practical nature. We have obtained and registered patents in the U.S. and in various other countries in which we offer our products and services. We rely upon the copyright laws to protect against unauthorized copying of the object code of our software and upon copyright and trade secret laws for the protection of the source code of our software. We derive additional protection for our software by generally licensing only the object code to customers and keeping the source code confidential. In addition, we enter into confidentiality agreements with our customers and other business partners to protect our software technology and trade secrets. We have also obtained trademark registrations in the U.S. and various other countries for additional protection of our intellectual property. Despite all of these measures, it is possible that competitors could copy certain aspects of our technology or obtain information that we regard as a trade secret in violation of our legal rights.
In accordance with our agreements with the OCS, we are eligible to participate in programs under which we have received and eligible to receive future research and development grants for financing research and development projects in Israel pursuant to the provisions of The Encouragement of Industrial Research and Development Law, 1984. We are also participating in a funding program of the Israel US binational industrial R&D foundation. With respect to some of our funding programs, we are obligated to pay royalties from the revenues derived from products developed within the framework of such programs. However, most of our programs are non-royalty bearing programs.
59
The following table sets forth, for the years indicated, our gross research and development expenditures, the portion of such expenditures which was funded mainly by non-royalty bearing grants and the net cost of our research and development activities:
| Years ended December 31, | ||||||||||||
|
2014
|
2013
|
2012
|
||||||||||
|
(U.S. dollars in thousands)
|
||||||||||||
|
Gross research and development costs
|
27,635 | 29,491 | 32,296 | |||||||||
|
Less:
|
||||||||||||
|
Grants
|
2,477 | 1,591 | 3,055 | |||||||||
|
Research and development costs - net
|
25,158 | 27,900 | 29,241 | |||||||||
|
D.
|
Trend Information
|
The satellite communications industry is moving toward Ka technology that employs multi-beam transmission for more efficient use of space segment. With the scheduled launch of numerous HTS, we believe that development of products using this technology will be an important competitive factor in the VSAT market. We are continuing our efforts to enhance our current products and develop new ones to support the advantages of this technology.
The continued increase in HTS supply is projected to produce a reduction in the bandwidth price. This reduction is expected to make many Broadband, Cellular and Mobility applications economically viable over satellite, which is expected to be a good solution to the need to economically increase cellular coverage in rural areas in developing countries. This trend may result in the growth of the small-cell market and the need to rapidly deploy LTE backhaul in the developed regions.
We also continue to focus on the Satellite-on-the-Move trend which has been driven by the projected growth of Satellite-on-the-Move applications, especially on airplanes, and possibly on trains, as well as defense-related applications. The Satellite-on-the-Move trend in the Defense market is driven by the move towards a net-centric military environment that promotes the delivery of IT and communications systems down to the tactical level. The ability to provide communication at the tactical level will need to be underpinned by equipment capable of providing these capabilities within the size, weight and power, or SWaP, requirements for On-the-Move communications and beyond line of sight, or BLOS, capabilities for unmanned airborne systems (UAVs).
In the past few years the satellite communications market has experienced increasing competition both from within its sector and from competing communication technologies. Specifically, the expansion of cellular coverage in rural areas worldwide, increased terrestrial infrastructures as well as the advancement of wireless technologies, increases the options for our potential and existing customers. In addition, the number of satellite communications providers in the market has increased and prices of technologies continue to decline. Another development in our industry is the increasing demand for complete solutions which encompass far more than a single platform of a communications solution.
We believe that the political environment in Israel could continue to prevent certain countries from doing business with us and this, in addition to the increased competition and reduced prices in the telecommunications industry overall, may have adverse effect on our business. Given all of the above, we cannot guarantee or predict what our sales will be, what trends will develop, and if any changes in our business and marketing strategy will be implemented.
|
E.
|
Off-Balance Sheet Arrangements
|
At times, we guarantee the performance of our work to some of our customers, primarily government entities. Guarantees are often required for our performance during the installation and operational periods of long-term rural telephony projects such as in Latin America, and for the performance of other projects (government and corporate) throughout the rest of the world. The guarantees typically expire when certain operational milestones are met. In addition, from time to time, we provide corporate guarantees to guarantee the performance of our subsidiaries. No guarantees have ever been exercised against us.
60
As of December 31, 2014, the aggregate amount of bank guarantees outstanding to secure our various performance obligations was approximately $35.9 million, including an aggregate of approximately $26.8 million on behalf of our subsidiary in Peru. We have restricted cash of approximately $13.5 million as collateral for these guarantees.
In order to guarantee our performance obligations for our current activities in Colombia, we purchased insurance from an insurance company in Colombia. We have provided the insurance company with various corporate guarantees, guaranteeing our performance and our employee salary and benefit costs of approximately $18.2 million and $4 million respectively.
|
F.
|
Tabular Disclosure of Contractual Obligations
|
The following table summarizes our minimum contractual obligations as of December 31, 2014 and the effect we expect them to have on our liquidity and cash flow in future periods:
|
Contractual Obligations
|
Payments due by period (in U.S. dollars in thousands)
|
|||||||||||||||||||
|
Total
|
2015
|
2016-2017 | 2018-2019 |
2020 and after
|
||||||||||||||||
|
Long-term loans *
|
30,866 | 4,595 | 9,196 | 8,972 | 8,103 | |||||||||||||||
|
Operating lease (mainly space segment)
|
21,573 | 8,931 | 12,348 | 294 | - | |||||||||||||||
|
Purchase commitments (mainly inventory)
|
29,747 | 29,747 | - | - | - | |||||||||||||||
|
Other long-term debt
|
3,915 | - | 1,864 | 2,051 | - | |||||||||||||||
|
Total contractual cash obligations
|
86,101 | 43,273 | 23,408 | 11,317 | 8,103 | |||||||||||||||
(*) Future interest payments are not included due to variability in interest rates.
In addition, according to ASC 740-10 we have recorded a provision in the amount of $$1.2 million, included in "Other long term liabilities", related to our uncertain tax positions.
ITEM
6:
DIRECTORS AND SENIOR MANAGEMENT
A. Directors and Senior Management
The following table sets forth the name, age, position(s) and a brief account of the business experience of each of the directors and executive officers:
|
Name
|
Age
|
Position(s)
|
||
|
Dov Baharav (1)
|
64
|
Chairman of the Board of Directors
|
||
|
Erez Antebi (1)
|
56
|
Chief Executive Officer
|
||
|
Amiram Boehm (4)
|
43
|
Director
|
||
|
Dafna Cohen (2)(3)(5)(6)
|
45
|
Director
|
||
|
Ishay Davidi
|
53
|
Director
|
||
|
Gilead Halevy (2)(5)
|
49
|
Director
|
||
|
Dr. Zvi Lieber (2)(3)(5)(6)
|
62
|
Director
|
||
|
Amir Ofek (4)
|
39
|
Director
|
||
|
Kainan Rafaeli (2)(3)(5)
|
59
|
Director
|
||
|
Orna Balderman
|
47
|
Vice President, Human Resources
|
||
|
Gai Berkovich
|
46
|
Chief Operating Officer
|
||
|
Doron Elinav
|
49
|
Vice President, Corporate Business Development
|
||
|
Assaf Eyal
|
54
|
Vice President, Commercial Division
|
||
|
Danny Fridman
|
55
|
Chief Executive Officer, Gilat Peru & Colombia
|
||
|
Bob Huffman
|
55
|
General Manager, Wavestream
|
||
|
Yaniv Reinhold(7)
|
45
|
Chief Financial Officer
|
||
|
Moshe (Chico) Tamir
|
50
|
Vice President, Mobility Division
|
||
|
Alik Shimelmits
|
53
|
Vice President, Research & Development
|
|
|
(1)
|
As previously announced, Mr. Antebi will be leaving our company during the second quarter of 2015, and the Chairman of the Board, Mr. Baharav, will replace him as interim Chief Executive Officer until a new chief executive officer is appointed. Mr. Baharav will remain in his position as Chairman of the Board.
|
61
|
|
(2)
|
Member of our Audit Committee.
|
|
|
(3)
|
Member of our Compensation and Stock Option Committee.
|
|
|
(4)
|
“Independent Director” under the applicable NASDAQ Marketplace Rules (see explanation below)
|
|
|
(5)
|
“Independent Director” under the applicable NASDAQ Marketplace Rules and the applicable rules of the U.S. Securities and Exchange Commission (the “SEC”) (see explanation below)
|
|
|
(6)
|
“External Director” as required by Israel’s Companies Law (see explanation below)
|
|
|
(7)
|
As previously announced, Mr. Reinhold will be leaving our company on April 12, 2015, on which date his successor, Mr. Yuval Ronen, will replace him as Chief Financial Officer.
|
Dov Baharav
has served as the Chairman of our Board of Directors since May 2014. During the second quarter of 2015, Mr. Baharav will replace Mr. Erez Antebi as interim Chief Executive Officer until a new chief executive officer is appointed.
Mr. Baharav has served as a member of board of directors of Mellanox Technologies Ltd., a leading supplier of end-to-end InfiniBand and Ethernet connectivity solutions and services for servers and storage, since November 2010. Mr. Baharav served as the chairman of the board of directors of Israel Aerospace Industries, Ltd., a defense and civil aerospace technology company, from July 2011 until October 2013. Mr. Baharav served as a member of the Board of directors of Allot Communications Ltd., a leading global provider of intelligent broadband solutions, from March 2013 until July 2014. From July 2002 until November 2010, Mr. Baharav served as president and chief executive officer of Amdocs Management Limited, or Amdocs, a communications services company. He also served as a member of Amdocs' board of directors and executive committee from July 2002 until November 2010. Mr. Baharav joined Amdocs in 1991 as vice president and then president of Amdocs' principal U.S. subsidiary, Amdocs, Inc., and served as chief financial officer of Amdocs from 1995 until June 2002. From 1983 until 1991, Mr. Baharav served as chief operating officer of Oprotech Ltd., an electro-optical device company. Mr. Baharav is involved with the College of Management Academic Studies in Rishon Lezion, Israel. Mr. Baharav holds a Bachelor of Science degree in Physics and Accounting, as well as M.B.A. degree from Tel Aviv University
Erez Antebi
has served as our Chief Executive Officer since January 1, 2012. From April 2010 through 2011, Mr. Antebi was an Executive Advisor to senior management after serving from June 2005 until April 2010 as the Chief Executive Officer of Gilat Network Systems, then the equipment sales division of our company. Mr. Antebi also served from February 2008 until April 2010 as the Chief Executive Officer of our then Latin America rural communications division. Mr. Antebi served as our Chief Operating Officer from October 2002 until September 2003. He was Chief Executive Officer of Clariton Networks Ltd. from October 2003 until April 2005. Prior to that, from January 1998 to October 2002, Mr. Antebi served as our Vice President, General Manager for Asia, Africa and Pacific Rim. From September 1994 until the beginning of 1998, Mr. Antebi served in the U.S. as Vice President and General Manager of Gilat Satellite Networks Inc. From August 1993 until August 1994, he served as Vice President of Engineering and Program Management of Gilat Satellite Networks Inc., having first joined our company in May 1991 as product manager for the Skystar Advantage VSAT product. Prior to joining us, Mr. Antebi served from 1987 to 1989 as marketing manager for high frequency radio communications of Tadiran Limited, a defense electronics and telecommunications company, and as a radar systems development engineer at Rafael, the research and development and manufacturing arm of the Israel Defense Forces, from 1981 to 1987. Mr. Antebi worked for a private importing business from 1989 to 1991. Mr. Antebi holds a B.Sc. (summa cum laude) degree and a M.Sc. degree in Electrical Engineering from the Technion.
62
Amiram Boehm
has served on our Board of Directors since December 2012. Mr. Boehm has been a Partner in the FIMI Opportunity Funds, Israel’s largest group of private equity funds, since 2004. Mr. Boehm serves as the Managing Partner and Chief Executive Officer of FITE GP (2004), and as a director at Ham-Let (Israel-Canada) Ltd., a company traded on the TASE, Pharm-up Ltd. (private company), Magal S3 Security Systems Ltd. (NASDAQ) and DIMAR Ltd. (private company). Mr. Boehm previously served as a director at Ormat Technologies Inc. (previously traded on TASE), Scope Metal Trading, Ltd. (TASE), Inter Industries, Ltd. (TASE), Global Wire Ltd. (TASE), Telkoor Telecom Ltd. (TASE) and Solbar Industries Ltd. (previously traded on the TASE) . Prior to joining FIMI, from 1999 until 2004, Mr. Boehm served as Head of Research at Discount Capital Markets, the investment arm of Israel Discount Bank. Mr. Boehm holds a B.A. degree in Economics and a LL.B. degree from Tel Aviv University and a Joint M.B.A. degree from Northwestern University and Tel Aviv University.
Dafna Cohen
has served on our Board of Directors as an external director (within the meaning of the Israeli Companies Law) since December 2014. Ms. Cohen is the Head of Business control and Investor Relations of EL-AL Israel Airlines Ltd., a company traded on the TASE and as an independent business and financial advisor. Ms. Cohen has served as a member of board of directors of Formula Systems (1985) Ltd since 2009 (NASDAQ and TASE). Ms. Cohen served as Director of Global Treasury of MediaMind Technologies Inc. (previously traded on NASDAQ) and as a member of Investment committee of the Board from 2010 to 2011. Prior to that, Ms. Cohen served as a Director of Investments and as a Treasurer of Emblaze Ltd. and as a member of Investment committee of the Board from 2005 to 2009 (London Stock Exchange). Prior to that, Ms. Cohen served as an Investment Manager for Leumi Partners, a wholly owned subsidiary of Bank Leumi and as a manager at the derivatives sector of the Investment Division of Bank Leumi. Ms. Cohen previously served as a member of boards of directors of XTL Biopharmaceuticals Ltd. (NASDAQ and TASE) from 2009 to 2015, Europort Ltd from 2012 to 2014 (TASE) and of Inventech Central Ltd from 2011 to 2012 (TASE). Ms. Cohen previously served as a member of Investment committee of: Matrix ltd (TASE) and Magic Software Enterprises Ltd. (NASDAQ and TASE). Ms. Cohen holds an M.B.A. in finance and accounting and a B.A. degree in economics and political science, both from The Hebrew University of Jerusalem.
Ishay Davidi
has served on our Board of Directors since December 2012. Mr. Davidi is the Founder and has served as Chief Executive Officer of the FIMI Opportunity Funds, Israel’s largest group of private equity funds, since 1996. Mr. Davidi currently serves as Chairman of the board of directors of Inrom Industries Ltd. and as director at Ham-Let (Israel-Canada) Ltd. (TASE), C. Mer Industries Ltd. (TASE), Pharm Up Ltd. and Overseas Commerce Ltd. Mr. Davidi previously served as the Chairman of the board of directors of Retalix (previously traded on NASDAQ and TASE) from August 2008 until January 2010, of Tefron Ltd. (New York Stock Exchange and TASE) and of Tadir-Gan (TASE), and as a director at Ormat Industries Ltd. (previously traded on TASE), Retalix, Tadiran Communications Ltd. (TASE), Lipman Electronic Engineering Ltd. (NASDAQ and TASE), Merhav Ceramic and Building Materials Center Ltd. (TASE), TAT Technologies Ltd. (NASDAQ and TASE), Orian C.M. Ltd. (TASE), Ophir Optronics Ltd. (TASE), Scope Metals Group Ltd. (TASE) and Formula Systems Ltd. (NASDAQ and TASE). Prior to establishing FIMI, from 1993 until 1996, Mr. Davidi was the Founder and Chief Executive Officer of Tikvah Fund, a private Israeli investment fund. From 1992 until 1993 Mr. Davidi was the Chief Executive Officer of Zer Science Industries Ltd., a developer of diagnostics equipment for the healthcare industry. Mr. Davidi holds a B.Sc. degree in Industrial and Management Engineering from Tel Aviv University, Israel, and a M.B.A. degree from Bar Ilan University, Israel.
Gilead Halevy
has served on our Board of Directors since January 2011. Mr. Halevy is a founding member and general partner of Kedma Capital Partners, or Kedma, a leading Israeli private equity fund. Mr. Halevy is a member of the Kedma investment committee. Prior to establishing Kedma, Mr. Halevy was a Director at Giza Venture Capital from April 2001 to January 2006, where he led investments in communication and information technology companies, and directed Giza's European business activities. Previously, from 1998 to 2001, Mr. Halevy practiced law at White & Case LLP, where he advised in connection with mergers and acquisitions in the Telecom Media and Technology group. Mr. Halevy was also a founding member of the White & Case Israel practice group during that time. From 1993 to 1998, he was a senior associate with Zellermayer & Pelossof, one of Israel's leading commercial law firms, where he advised in connection with public securities, cross-border mergers and acquisitions and private equity transactions. Mr. Halevy currently serves as Chairman of Brand Industries Ltd. (TASE), Chairman of Carmor Integrated Solutions Ltd and Chairman of Carmel Wineries. Mr. Halevy previously served as chairman of the Marina Galil Group Ltd. Mr. Halevy holds a LL.B. degree (magna cum laude) and B.A. degree in Humanities (interdisciplinary course for exceptional students), both from the Hebrew University.
63
Dr. Zvi Lieber
has served on our Board of Directors as an external director (within the meaning of the Israeli Companies Law) since May 2014.
Dr. Lieber is a financial and investment consultant, an Actuary and an economist. Dr. Lieber has served as Chairman of the Board of Directors of Analyst Provident Funds Ltd. since 2011, and as member of the boards of directors of Baran Ltd.,
a global provider of engineering, technology, and construction for challenging projects
since 2008. From 2006 until 2014, Mr. Lieber served as member of the board of directors of Ampa Capital Ltd. a company
specializes in non-bank financing,
and from 2010 until 2014, as a member of the board of Europort Ltd., a holding company mainly focused on the area of senior living residence projects. Dr. Lieber was a faculty member in Tel Aviv University, The Leon Recanati Graduate School of Business Administration for about 30 years between 1972 and 2002. He lectured on accounting, finance and value creation. Dr. Lieber was also a visiting professor at the business school of NYU in 1971-2 and 1977-8 where he lectured on accounting, and in recent years he lectured in various colleges in Israel. Dr. Lieber has published numerous papers in leading academic journals. From 2008 until 2011 Dr. Lieber was a member of the board of directors of Retalix Ltd., a company previously traded on NASDAQ and TASE. From 2010 until 2011 he served as Chairman of the board of directors of Analyst Underwriters Ltd. From 2005 until 2009, Dr. Lieber served as a board member of Provident and Pension Fund of the workers of the Jewish Agency. From 2002 until 2006 he served as a board member of the Tel Aviv Stock Exchange. Prior to that he served as a board member of numerous public and private companies. Dr. Lieber also participated in key public committees appointed by the Israeli government. Dr. Lieber holds a PhD in Business Administration from Chicago University.
Amir Ofek
has served on our Board of Directors since December 2014. Mr. Ofek is a partner at Baharav Ventures Ltd. (“BVL”), a company wholly owned by our Chairman of the Board of Directors, Mr. Baharav. Mr. Ofek serves as director on the board of Cyberint Inc. a provider of cybersecurity services and products solutions, since September 2014. Prior to joining BVL, Mr. Ofek worked at Amdocs Inc., or Amdocs, the leading BSS/OSS provider, from 2006 to 2014, where he served as VP Client Business Executive SingTel Group at Amdocs, based in Singapore from 2009. Prior to this role, Mr. Ofek served as Director of Management Services at Amdocs from 2007 to 2009 and in the Corporate Strategy unit from 2006 to 2007. Before joining Amdocs in 2006, Mr. Ofek worked for Elbit Systems Ltd., a leading aerospace defense company, from 2001 to 2005. Mr. Ofek holds a BSc. degree (Cum Laude) in Industrial Engineering and Management, majoring in Information Systems from the Technion- Israel Institute of Technology and an M.B.A. degree from INSEAD.
Kainan Rafaeli
has served on our Board of Directors since December 2012. Mr. Rafaeli is a private investor and has served since September 2009 as the Chairman of Senso Optics Ltd., an Israeli defense contractor. Mr. Rafaeli was a founder, shareholder and Chief Executive Officer of Kinetics Ltd., an Israeli company which develops and manufactures hydraulic, air conditioning, NBC protection and electric systems for military vehicles and aircraft, from 1985 until 2009. From 1999 until 2009, he was also the Chief Executive Officer of Real Time Laboratories LLC, a U.S. based defense contractor. Mr. Rafaeli holds a BSc. degree in Mechanical Engineering from the Technion and a M.B.A. degree from Tel Aviv University.
Orna Balderman
has served as our Vice President, Human Resources since December 2010. Prior to joining Gilat, Ms. Balderman served as Vice President, Human Resources at Discretix Ltd. from 2008 to 2009 and was Vice President, Human Resources at Trivnet Ltd. from 2006 through 2008. From 1998 until 2006, Ms. Balderman held various senior positions at Comverse Ltd., having last served there as Associate Vice President, Human Resources. From 1995 to 1998, Ms. Balderman served as the Training and Organizational Development Manager in the operations division at Teva Pharmaceutical Industries Ltd. Ms. Balderman holds a B.A. degree in Sociology and Film and an executive M.B.A. degree from the Recanati Faculty of Management, both from Tel Aviv University.
64
Gai Berkovich
has served as our Chief Operating Officer since June 2013 and has been Vice President, Research and Development since April 2009. Prior to joining Gilat, from 2007 to 2009, Mr. Berkovich served as Vice President, Research and Development for Intercast Networks Ltd. Mr. Berkovich held various positions at Verint Systems Ltd. from 1997 to 2007, having served there as Vice President, Product Development and Delivery from 2006 to 2007, as Director of Research and Development from 2000 to the end of 2005, and as development and team leader. Mr. Berkovich holds a M.B.A. degree from the Interdisciplinary Center of Herzeliya and a B.Sc. degree in Computer Science from the Technion.
Doron Elinav
has served as our Vice President Corporate Business Development since June 2013 and has been Vice President, Ka-band Strategic Projects since March 2012. From March 2008 to February 2012, Mr. Elinav was our Vice President, Marketing and Business Development and from 2005 to March 2008 he was our Director of Strategic Marketing. Prior to joining Gilat, Mr. Elinav held various senior marketing positions in the hi-tech industry, including as Project Manager, New Technologies from 2003 to 2005 at Flash Networks Ltd., as Product Manager and Director of Product Marketing from 2001 to 2003 at Communications Systems Ltd. (Comsys), as Product Manager from 1998 to 2000 Radcom Ltd. and as Product Manager from 1995 to 1998 at Eltek Ltd. Mr. Elinav holds a BSc. degree in Industrial Engineering from Tel Aviv University.
Assaf Eyal
has served as our Vice President, Commercial Division since March 2012. Prior to joining Gilat, Mr. Eyal was the President and Chief Executive Officer of Ultrashape Ltd. from August 2008 through December 2011 and continued as a Director of Ultrashape until it was sold to Syneron Medical in February 2012. Mr. Eyal served as Executive Vice President at NUR Macroprinters Ltd. from May 2006 to March 2008, when NUR was sold to Hewlett Packard. Prior to that, Mr. Eyal served as Co-President of the Display Division of Orbotech Ltd. from 2001 to 2006 and from 1998 to 2001, he managed the Display Division from Orbotech’s Asian headquarters in Hong Kong. From 1989 through 1998, he served in various management positions with Orbotech in the U.S. and in Israel. Mr. Eyal holds a B.Sc. degree in Material Engineering from Ben Gurion University and a M.Sc. degree in Management from Lesley College, Boston, Massachusetts.
Danny Fridman
has served as Chief Executive Officer of Gilat Peru & Colombia since April 2011. He joined Gilat in 2006, and served as the company’s Corporate Internal Auditor until March 2011. Prior to joining Gilat, Mr. Fridman worked for Bezeq, the Israeli Telecommunication Corporation Ltd., as Corporate Internal Auditor from 2002 through 2006 and from 1984 through 2002 in various senior positions in the Internal Audit Department. Mr. Fridman holds a BA degree in Accountings from the Hebrew University of Jerusalem and holds certifications as CIA (Certified Internal Auditor, U.S.), CISA (Certified in Information Systems Auditor, U.S.) and CRISC (Certified in Risks Control). He also holds a Masters degree in Economics and Statistics from the Hebrew University of Jerusalem.
Bob Huffman
has served as General Manager of our Wavestream subsidiary since June 2014. Prior to that, from 2011 until 2014, Mr. Huffman served as president of Applied Technologies Group at L-3. Prior to that, From 2010 until 2011, Mr. Huffman served as Vice President of Projects for the Electronic Systems Group at L-3. Mr. Huffman was the President of Interstate Electronics Corporation, or IEC, at L-3 from 2001-2010, and prior to that, Vice President of Marketing and Sales at IEC. From 1992 until 2000, Mr. Huffman served in various executive positions at IEC. From 1998 to 2000, Mr. Huffman was Vice President of Engineering at IEC. From 1994 to 1998, Mr. Huffman served as General Manager of the Military GPS and Communication Systems Department at IEC, and prior to that as Operations Director for Figgie Medical Systems, IEC’s parent company. Mr. Huffman joined IEC as an Associate Engineer in 1984 and held various engineering positions there. Mr. Huffman holds a Bachelor of Science degree in Electronic Engineering degree from California State Polytechnic University. Mr. Huffman is a member of the AEA/Stanford Executive Institute.
Yaniv Reinhold
has served as our Chief Financial Officer since March 2012 and has been Vice President, Finance since September 2010. From July 2008 until September 2010, Mr. Reinhold served as Vice President Financial Planning and Treasury, having been Associate Vice President, Financial Planning and Treasury from May 2005 until 2008. Prior to that, Mr. Reinhold was Chief of Staff to our then CEO from September 2003 through May 2005. He joined Gilat in 1999, and was in sales and then in business development until 2003. Prior to joining Gilat, he was an economist with Tadiran Communications from 1997 through 1999 and from 1996 through 1997, he was Assistant to the CFO of Applitec. Mr. Reinhold holds a B.A. degree in Economics and a M.B.A. degree, both from Tel Aviv University.
65
Moshe (Chico/Shlomi) Tamir
has served as our Vice President, Mobility Division since March 2012, having first joined Gilat in January 2011 as Vice President, Defense and Homeland Security. Prior to joining Gilat, between 1981 and 2009, Mr. Tamir served in the IDF, including in senior command positions: He was Division Commander from 2006 through 2009; General Command Chief of Staff from 2004 to 2006; and Golani Brigade Commander from 2001 through 2003. Mr. Tamir currently holds the rank of Brigadier General (reserve).
Alik Shimelmits
has served as our Vice President, Research and Development since June 2013. Prior to joining Gilat, from 2007 to 2013, Mr. Shimelmits served as Head of Transport Networks R&D for ECI Telecom Ltd. and prior to that as VP Research and Development for Axerra Networks Ltd. from 1999 to 2007. From 1991 to 1999, Mr. Shimelmits held various technical and managerial positions at ECI Telecom, having last served there as Associate Vice President R&D, Software Development, SDH Product Line. Mr. Shimelmits holds M.Sc. degree in Applied Mathematics from Moscow Institute of Electronic Engineering and B.Sc degree in Computer Science from Moscow Institute of Chemical Engineering.
|
B.
|
Compensation of Directors and Officers
|
The following table sets forth the aggregate compensation paid to or accrued on behalf of all of our directors and officers as a group for the year ended December 31, 2014:
|
Salaries, Fees, Directors' Fees,
Commissions and Bonuses(1)
|
Amounts Set Aside for Pension, Retirement and
Similar Benefits
|
|||||||
|
All directors and officers as a group (25 persons)(2)
|
$ | 3,766,333 | $ | 484,472 | ||||
|
|
(1)
|
Includes bonuses and equity-based compensation accrued in 2014, but does not include business travel, professional and business association dues and expenses reimbursed to our directors and officers, and other benefits commonly reimbursed or paid by companies in Israel. Our financial statements for 2014 include a provision of $150,000 for bonus payments to our officers for 2014.
However, no determination with respect to such bonus allocation has been made to date.
Accordingly, the amounts reported above do not include any such bonus payments.
|
|
|
(2)
|
Includes three officers and four directors that ceased to hold office during 2014, respectively.
|
The table below sets forth the compensation paid to our five most highly compensated senior office holders (as defined in the Companies Law) during or with respect to the year ended December 31, 2014, in the disclosure format of Regulation 21 of the Israeli Securities Regulations (Periodic and Immediate Reports), 1970. We refer to the five individuals for whom disclosure is provided herein as our “Covered Executives.”
For purposes of the table and the summary below, and in accordance with the above mentioned securities regulations, “compensation” includes base salary, bonuses, equity-based compensation, retirement or termination payments, benefits and perquisites such as car, phone and social benefits and any undertaking to provide such compensation.
66
Summary Compensation Table
|
Information Regarding the Covered Executive
(1)
|
||||||||||||||||||||
|
Name and Principal Position
(
2)
|
Base Salary
|
Benefits and
Perquisites
(3)
|
Variable
Compensation
(4)
|
Equity-Based
Compensation
(5)
|
Total
|
|||||||||||||||
|
Erez Antebi,
Chief Executive Officer
|
$ | 368,759 | $ | 72,023 | - | $ | 173,954 | $ | 614,736 | |||||||||||
|
Gai Berkovich,
Chief Operating Officer
|
$ | 211,027 | $ | 35,523 | - | $ | 29,863 | $ | 276,413 | |||||||||||
|
Assaf Eyal,
VP, Commercial Division
|
$ | 241,355 | $ | 51,767 | - | $ | 73,486 | $ | 366,608 | |||||||||||
|
Danny Fridman,
CEO, Gilat Peru & Colombia
|
$ | 185,051 | $ | 34,293 | $ | 22,929 | $ | 24,924 | $ | 267,197 | ||||||||||
|
Moshe (Chico) Tamir,
VP, Mobility Division
|
$ | 239,162 | $ | 46,489 | - | $ | 73,808 | $ | 359,459 | |||||||||||
|
(1)
|
All amounts reported in the table are in terms of cost to our company, as recorded in our financial statements.
|
|
(2)
|
All current executive officers listed in the table are employed or provide services on a full-time basis.
|
|
(3)
|
Amounts reported in this column include benefits and perquisites, including those mandated by applicable law. Such benefits and perquisites may include, to the extent applicable to each executive, payments, contributions and/or allocations for savings funds, pension, severance, vacation, car or car allowance, medical insurances and benefits, risk insurances (e.g., life, disability, accident), convalescence pay, payments for social security and other benefits and perquisites consistent with our guidelines, but do not include business travel, relocation, professional and business association dues and expenses reimbursed to our directors and officers.
|
|
(4)
|
Amounts reported in this column refer to Variable Compensation such as commission, incentive and bonus payments as recorded in our financial statements for the year ended December 31, 2014. Our financial statements for 2014 include a provision of an aggregate of $150,000 for bonus payments to our officers for 2014. However, no determination with respect to such bonus allocation has been made to date.
Accordingly, the amounts reported above do not include any such bonus payments
.
|
|
(5)
|
Amounts reported in this column represent the expense recorded in our financial statements for the year ended December 31, 2014 with respect to equity-based compensation granted to the Covered Executive.
|
In accordance with the approval of our shareholders and in accordance with Israeli corporate law regarding compensation of external directors, each of our non-employee directors and external directors (all of our current directors except for our Chairman of the Board of Directors) is entitled to receive annual compensation payable quarterly of approximately NIS 93,690 (currently equivalent to approximately $23,600), and an additional fee of approximately NIS 1,924 (currently equivalent to approximately $480) for each board or committee meeting attended. In addition, Board members are compensated for telephone participation in board and committee meetings in an amount of 60% of what would be received for physical attendance and for written resolutions in an amount equal to 50% of same. All the above amounts are linked to changes in the Israeli consumer price index as of September 2013 and subject to changes in the amounts payable pursuant to Israeli law from time to time.
During 2014, we granted options to purchase 50,000 ordinary shares to three non-employee directors who were first appointed to our Board of Directors, and options to purchase 250,000 ordinary shares to the Chairman of our Board of Directors. The exercise price per share of such options granted in 2014 ranged from $5.06 to $5.24 and in accordance with our Executive Compensation Policy (as discussed below) reflected an exercise price 8% greater than the closing price of our ordinary shares on the NASDAQ Global Select market on the last trading day prior to the respective grant dates. In each case, the options vest in 12 equal quarterly installments over a three-year period and will remain exercisable for 12 months following cessation or termination of service (other than for cause), except with respect to the grant to the Chairman of our Board of Directors, in which the options vest in 16 equal quarterly installments over a four-year period. In accordance with the our Executive Compensation Policy, the value of options granted to any director other than the Chairman of the Board of Directors (determined based on generally accepted accounting principles applicable to our company) that vest in any calendar year (calculated on a linear basis) may not at the time of grant exceed $70,000.
As of December 31, 2014, our directors and executive officers as a group, consisting of 18 persons, held options to purchase an aggregate of 2,006,000 ordinary shares, having exercise prices ranging from $3.00 to $8.10. Generally, the options granted to our directors vest over a three-year period (except in the case of our Chairman, Dov Baharav, which vest over a four-year period) and the options granted to our executive officers vest over a four-year period. The options will expire between 2015 and 2020. In addition, as of December 31, 2014, our directors and executive officers as a group (18 persons), held 33,750 RSUs. All of such options and RSUs were awarded under our stock option plans described in Item 6E - “Directors, Senior Management and Employees - Share Ownership - Stock Option Plans.”
67
Chairman Services.
Pursuant to an agreement effective May 20, 2014, Mr. Baharav provides Chairman services to the company for a period of four years. Under the agreement, Mr. Baharav serves as Chairman of the Board on a 40% scope of work basis and is entitled (directly or through his controlled company) to: (i) a monthly fee in the amount of NIS 44,000; (ii) payment of the cash value of various fringe benefits, in an aggregate amount of up to NIS 18,697 per month, which is equal to the employer’s cost that would have been incurred by the Company for such benefits if the Chairman served in an employee status; and (iii) full time office space and secretarial assistance and reimbursement for out-of-pocket expenses incurred by him in connection with his service. In May 2014, Mr. Baharav was granted options to purchase 250,000 of our ordinary shares, at an exercise price of $5.06 per share, under our 2008 Option Plan. The options vest ratably, each quarter over a four-year period so long as Mr. Baharav continues to serve as Chairman of the Board of our company, and will remain exercisable during such service and for an additional 12 month period following termination of service (other than for cause). We may terminate the agreement prior to the end of its term by providing two months of paid notice and an additional two months’ salary.
In accordance with the Israeli Companies Law, we have adopted in September 2013 an Executive Compensation Policy for our executive officers and directors. The purpose of the policy is to describe our overall compensation strategy for our executive officers and directors and to provide guidelines for setting their compensation, as prescribed by the Israeli Companies Law. In accordance with the Israeli Companies Law, the Executive Compensation Policy must be reviewed and readopted at least once every three years.
Approval of the Compensation Committee, the Board of Directors and our shareholders, in that order, is required for the adoption of the Executive Compensation Policy. The shareholders’ approval must include the majority of shares voted at the meeting. In addition to the majority vote, the shareholders’ approval must satisfy either of two additional tests:
|
|
·
|
the majority includes at least a majority of the shares voted by shareholders other than our controlling shareholders or shareholders who have a personal interest in the adoption of the Executive Compensation Policy; or
|
|
|
·
|
the total number of shares held by non-controlling shareholders and disinterested shareholders that voted against the adoption of the Executive Compensation Policy does not exceed 2% of the aggregate voting rights of our company.
|
In the event that the Executive Compensation Policy is not approved by the shareholders, the compensation committee and the board of directors may still approve the policy, if the compensation committee and the board of directors determine, based on specified reasons and following further discussion of the matter, that the compensation policy is in the best interests of the company.
Under the Israeli Companies Law, the compensation arrangements for “office holders” (other than the Chief Executive Officer) who are not directors require the approval of the Compensation Committee and the Board of Directors; provided, however, that if the compensation arrangement is not in compliance with our Executive Compensation Policy, the arrangement may only be approved by the Compensation Committee and the Board of Directors for special reasons to be noted, and the compensation arrangement shall also require a special shareholder approval. If the compensation arrangement is an immaterial amendment to an existing compensation arrangement of an “office holder” who is not a director and is in compliance with our Executive Compensation Policy, the approval of the Compensation Committee is sufficient. An “office holder” is defined in the Israeli Companies Law as a general manager, chief executive officer, chief business manager, deputy general manager, vice general manager, any other person assuming the responsibilities of any of the foregoing positions without regard to such person’s title, a director and a manager directly subordinate to the chief executive officer.
68
Arrangements regarding the compensation of directors require the approval of the Compensation Committee, the Board and the shareholders, in that order.
Arrangements regarding the compensation of the Chief Executive Officer require the approval of the Compensation Committee, the Board and the shareholders by special majority, in that order. In certain limited cases, the compensation of a new Chief Executive Officer who is not a director may be approved without approval of the shareholders.
|
C.
|
Board Practices
|
Election of Directors
Our Articles of Association provide that our Board of Directors shall consist of not less than five and not more than nine directors as shall be determined from time to time by a majority vote at the general meeting of our shareholders. On January 31, 2011, our shareholders resolved to set the size of our Board of Directors at eight members, including two external directors.
Pursuant to our Articles of Association, each beneficial owner of 14% or more of our issued and outstanding ordinary shares is entitled to appoint, at each annual general meeting of our shareholders, one member to our Board of Directors, provided that a total of not more than four directors are so appointed. In the event that more than four qualifying beneficial owners notify us that they desire to appoint a member to our board of directors, only the four shareholders beneficially owning the greatest number of shares shall each be entitled to appoint a member to our Board of Directors. So long as our ordinary shares are listed for trading on NASDAQ, we may require that any such appointed director qualify as an “independent director” as provided for in the NASDAQ rules then in effect. Our Board of Directors has the right to remove any such appointed director when the beneficial ownership of the shareholder who appointed such director falls below 14% of our issued and outstanding ordinary shares.
Our Articles of Association provide that a majority of the voting power at the annual general meeting of our shareholders will elect the remaining members of the board of directors, including external directors as required under the Companies Law. At any annual general meeting at which directors are appointed pursuant to the preceding paragraph, the calculation of the vote of any beneficial owner who appointed a director pursuant to the preceding paragraph shall not take into consideration, for the purpose of electing the remaining directors, ordinary shares constituting 14% of our issued and outstanding ordinary shares held by such appointing beneficial owner.
Each of our directors (except for external directors) serve, subject to early resignation or vacation of office in certain circumstances as set forth in our Articles of Association, until the adjournment of the next annual general meeting of our shareholders following the general meeting in which such director was elected. The holders of a majority of the voting power represented at a general meeting of our shareholders in person or by proxy will be entitled to (i) remove any director(s), other than external directors and directors appointed by beneficial holders of 14% or more of our issued and outstanding ordinary shares as set forth above, (ii) elect directors instead of directors so removed, or (iii) fill any vacancy, however created, in the board of directors. Our board of directors may also appoint additional directors, whether to fill a vacancy or in order to bring the total number of serving directors to the number determined by our shareholders. Such directors will serve until the next general meeting of our shareholders following such appointment.
Currently, no shareholder beneficially holding 14% or more of our issued and outstanding ordinary shares has exercised its right to appoint a director.
69
|
External Directors
and Independent Directors
|
External Directors
.
Under the Israeli Companies Law, public companies are required to elect at least two external directors who must meet specified standards of independence. External directors may not have had during the two years preceding their appointment, directly or indirectly through a relative, partner, employer or controlled entity, any affiliation with (i) the company, (ii) those of its shareholders who are controlling shareholders at the time of appointment and/or their relatives, or (iii) any entity controlled by the company or by its controlling shareholders.
The term “affiliation” includes an employment relationship, a business or professional relationship maintained on a regular basis, control and services as an office holder. The term “controlling shareholder” is defined as a shareholder who has the ability to direct the activities of a company, other than if this power derives solely from the shareholder’s position on the board of directors or any other position with the company. The definition also includes shareholders that hold 25% or more of the voting rights if no other shareholder holds more than 50% of the voting rights in the company.
In addition, an individual may not be appointed as an external director in a company that does not have a controlling shareholder, in the event that he has affiliation, at the time of his appointment, to the chairman, chief executive officer, a 5% shareholder or the chief financial officer. An individual may not be appointed as an external director if his relative, partner, employer, supervisor, or an entity he controls, has other than negligible business or professional relations with any of the persons with which the external director himself may not be affiliated.
No person can serve as an external director if the person’s other positions or business creates or may create conflicts of interest with the person’s responsibilities as an external director. Until the lapse of two years from termination of office, a company may not engage an external director as an employee or otherwise. If, at the time an external director is to be appointed, all current members of the board of directors, who are not controlling shareholders of the company or their relatives, are of the same gender, then at least one external director appointed must be of the other gender.
The Israeli Companies Law further requires that external directors have either financial and accounting expertise or professional competence, as determined by the company’s board of directors. Under relevant regulations, a director having financial and accounting expertise is a person who, due to his or her education, experience and talents, is highly skilled in respect of, and understands, business and accounting matters and financial reports, in a manner that enables him or her to have an in-depth understanding of the company’s financial information and to stimulate discussion in respect of the manner in which the financial data is presented. Under the regulations, a director having professional competence is a person who meets any of the following criteria: (i) has an academic degree in either economics, business administration, accounting, law or public administration; (ii) has a different academic degree or has completed higher education in an area relevant to the company’s business or in an area relevant to his or her position; or (iii) has at least five years’ experience in any of the following, or has a total of five years’ experience in at least two of the following: (a) a senior position in the business management of a corporation with a substantial scope of business, (b) a senior public position or a senior position in public service, or (c) a senior position in the main field of the company’s business.
At least one of the external directors is required to qualify as a financial and accounting expert, as determined by the board of directors. Our Board of Directors has determined that both Ms. Dafna Cohen and Dr. Zvi Lieber have “accounting and financial expertise” as defined by the Israeli Companies law.
External directors serve for an initial three-year term. The initial three-year term of service can be extended, at the election of a company subject to certain conditions, by two additional three-year terms. External directors will be elected by a majority vote at a shareholders’ meeting, provided that either the majority of shares voted at the meeting, including at least half of the shares held by non-controlling shareholders voted at the meeting, vote in favor; or the total number of shares held by non-controlling shareholders voted against does not exceed two percent of the aggregate voting rights in the company.
70
The term of office of external directors of Israeli companies traded on certain foreign stock exchanges, including the NASDAQ Global Select Market, may be further extended, indefinitely, in increments of additional three-year terms, in each case provided that, in addition to reelection in such manner described above, (i) the audit committee and subsequently the board of directors of the Company confirm that, in light of the external director’s expertise and special contribution to the work of the board of directors and its committees, the reelection for such additional period is beneficial to the Company, and (ii) prior to the approval of the reelection of the external director, the Company’s shareholders have been informed of the term previously served by such nominee and of the reasons why the board of directors and audit committee recommended the extension of such nominee’s term.
External directors can be removed from office only by the court or by the same special majority of shareholders that can elect them, and then only if the external directors cease to meet the statutory qualifications with respect to their appointment or if they violate their fiduciary duty to the company. The court may additionally remove external directors from office if they were convicted of certain offenses by a non-Israeli court or are permanently unable to fulfill their position.
An external director is entitled to compensation as provided in regulations adopted under the Companies Law and is otherwise prohibited from receiving any other compensation, directly or indirectly, in connection with such service.
The Companies Law requires external directors to submit to the company, prior to the date of the notice of the general meeting convened to elect the external directors, a declaration stating their compliance with the requirements imposed by Companies Law for the office of external director.
Our Board of Directors currently has two external directors under Israeli law: (i) Dr. Zvi Lieber, who was elected to serve as an external director in May 2014; and (ii) Ms. Dafna Cohen, who was elected to serve as an external director in December 2014.
Independent Directors
. In general, NASDAQ Marketplace Rules require that the board of directors of a NASDAQ-listed company have a majority of independent directors, within the meaning of NASDAQ rules. Our Board of Directors has determined that six out of the eight members of our Board of Directors are independent directors under NASDAQ requirements.
Pursuant to the Israeli Companies Law, a director may be qualified as an independent director if such director is either (i) an external director; or (ii) a director that served as a board member less than nine years and the audit committee has approved that he or she meets the independence requirements of an external director. A majority of the members serving on the audit committee and the compensation committee must be independent under the Israeli Companies Law.
Committees of the Board of Directors
Our Articles of Association provide that the Board of Directors may delegate its powers to committees of the Board of Directors as it deems appropriate, to the extent permitted by the Israeli Companies Law. All of the external directors must serve on our audit committee and compensation committee (including one external director serving as the chair of the audit committee and compensation committee), and at least one external director must serve on each other committee that may be established by our Board of Directors.
Audit Committee.
Under the Israeli Companies Law, publicly traded companies must establish an audit committee. The audit committee must consist of at least three members, and must include all of the company's external directors, including one external director serving as chair of the audit committee. A majority of an audit committee must be comprised of “independent directors” (as such term is defined in the Companies Law). The chairman of the board of directors, directors employed by, or that provide services on a regular basis to, the company or to a controlling shareholder or a company controlled by a controlling shareholder (or whose main livelihood depends on a controlling shareholder), any controlling shareholder and any relative of a controlling shareholder may not be a member of the audit committee. An audit committee may not approve an action or a transaction with an officer or director, a transaction in which an officer or director has a personal interest, a transaction with a controlling shareholder and certain other transactions specified in the Companies Law, unless at the time of approval two external directors are serving as members of the audit committee and at least one of the external directors was present at the meeting in which an approval was granted.
71
In addition, the NASDAQ Marketplace Rules require us to establish an audit committee comprised of at least three members, all of whom must be independent directors, each of whom is financially literate and satisfies the respective “independence” requirements of the Securities and Exchange Commission and NASDAQ and one of whom has accounting or related financial management expertise at senior levels within a company.
Our Audit Committee oversees (in addition to the Board) the accounting and financial reporting processes of our company and audits of our financial statements, including the integrity of our financial statements, compliance with legal and regulatory requirements, our independent auditors ’ qualifications, independence, compensation, and performance, and the performance of our internal audit function . Our Audit Committee is also required to determine if there are deficiencies in the business management of our company and in such event propose to our Board of Directors ways to correct such deficiencies, determine whether certain related party actions and transactions are "material" or "extraordinary" in connection with their approval procedures, approve related-party transactions as required by Israeli law, establish whistle blower procedures (including in respect of the protections afforded to whistle blowers). ). The Audit Committee may consult from time to time with our independent auditors and internal auditor with respect to matters involving financial reporting and internal accounting controls.
Our Audit Committee consists of Ms. Cohen, Mr. Halevy, Dr. Lieber, and Mr. Rafaeli. All of the members of our Audit Committee satisfy the respective “independence” requirements of the Securities and Exchange Commission, NASDAQ and Israeli law for audit committee members. Our Board of Directors has determined that both Ms. Cohen and Dr. Lieber qualify as Audit Committee financial experts, as required by the rules of the Securities and Exchange Commission and NASDAQ.
Compensation and Stock Option Committee.
Under the Israeli Companies Law, publicly traded companies must establish a compensation committee, including an external director serving as chair of the compensation committee. The compensation committee must consist of at least three members, and must include all of the company's external directors. The additional members of the compensation committee must satisfy the criteria for remuneration applicable to the external directors.
Our Compensation and Stock Option Committee consists of Ms. Cohen, Dr. Lieber and Mr. Rafaeli. All of the members of our Compensation and Stock Option Committee are independent directors, within the meaning of NASDAQ rules and the Israeli Companies Law.
Under the Israeli Companies Law, the compensation committee is responsible for: (i) making recommendations to the Board of Directors with respect to the approval of the Executive Compensation Policy; (ii) providing the Board of Directors with recommendations with respect to any amendments or updates to the Executive Compensation Policy and periodically reviewing the implementation thereof; (iii) reviewing and approving arrangements with respect to the terms of office and employment of office holders; and (iv) determining whether or not to exempt a transaction with a candidate for chief executive officer from shareholder approval.
In addition, our Compensation and Stock Option Committee offers recommendations to the Board of Directors regarding equity compensations issues
(with the Board also approving compensation of our executive officers)
, and administers our option plans, subject to general guidelines determined by our Board of Directors from time to time. The Compensation and Stock Option Committee also makes recommendations to our Board of Directors in connection with the terms of employment of our chief executive officer and all other executive officers.
72
Internal Audit
The Israeli Companies Law requires the board of directors of a public company to appoint an internal auditor nominated by the audit committee. The internal auditor must meet certain statutory requirements of independence. The role of the internal auditor is to examine, among other things, the compliance of the company’s conduct with applicable law and orderly business practice. Mr. Dror Bar Moshe has served as our internal auditor since June 2011.
Directors’ Service Contracts
There are no arrangements or understandings with any of our directors providing for benefits upon termination of their employment or service as directors of our company or any of our subsidiaries, other than with our Chairman of the Board, Mr. Dov Baharav. Mr. Baharav’s agreement with us stipulates that we may terminate his agreement prior to the end of its four year term by providing Mr. Baharav with two-month notice and an additional two months’ salary.
Approval of Related Party Transactions under Israeli Law
Fiduciary Duties of Office Holders
The Israeli Companies Law codifies the fiduciary duties that “office holders,” including directors and executive officers, owe to a company. An office holder’s fiduciary duties consist of a duty of care and a duty of loyalty. The duty of care requires an office holder to act at a level of care that a reasonable office holder in the same position would employ under the same circumstances. This includes the duty to utilize reasonable means to obtain: (i) information regarding the business feasibility of a given action brought for his approval or performed by him by virtue of his position; and (ii) all other information of importance pertaining to the foregoing actions. The duty of loyalty requires that an office holder act in good faith and for the benefit of the company, including: (i) avoiding any conflict of interest between the office holder’s position in the company and any other position he holds or his personal affairs; (ii) avoiding any competition with the company’s business; (iii) avoiding exploiting any business opportunity of the company in order to receive personal gain for the office holder or others; and (iv) disclosing to the company any information or documents relating to the company’s affairs that the office holder has received by virtue of his position as an office holder.
Disclosure of Personal Interests of an Office Holder; Approval of Transactions with Office Holders
The Israeli Companies Law requires that an office holder promptly, and no later than the first board meeting at which such transaction is considered, disclose any personal interest that he or she may have and all related material information known to him or her and any documents in their possession, in connection with any existing or proposed transaction relating to our company. In addition, if the transaction is an extraordinary transaction, that is, a transaction other than in the ordinary course of business, other than on market terms, or likely to have a material impact on the company’s profitability, assets or liabilities, the office holder must also disclose any personal interest held by the office holder’s spouse, siblings, parents, grandparents, descendants, spouse’s descendants and the spouses of any of the foregoing (“relatives”), or by any corporation in which the office holder or a relative is a 5% or greater shareholder, director or general manager or in which he or she has the right to appoint at least one director or the general manager.
Under the Israeli Companies Law, all arrangements as to compensation of office holders who are not directors other than the chief executive officer require approval by both the compensation committee and the board of directors. The terms of office and employment of the chief executive officer and the directors require the approval of the compensation committee, the board of directors and shareholders. See also “Item 6.C—Board Practices; Compensation of Office Holders”.
Some other transactions, actions and arrangements involving an office holder (or a third party in which an office holder has an interest) must be approved by the board of directors or as otherwise provided for in a company’s articles of association, however, a transaction that is not for the benefit of the company may not be approved. In some cases, such a transaction must be approved by the audit committee and by the board of directors, and under certain circumstances shareholder approval may be required as well. Generally, in all matters in which a director has a personal interest he or she shall not be permitted to vote on the matter or be present in the meeting in which the matter is considered, except in case of a transaction that is not extraordinary or for the purpose of presenting the proposed transaction, if the chairman of the audit committee or board of directors (as applicable) determines it necessary. Should a majority of the audit committee or of the board of directors have a personal interest in the matter, then: (a) all of the directors are permitted to vote on the matter and attend the meeting at which the matter is considered; and (b) the matter requires approval of the shareholders at a general meeting.
73
Disclosure of Personal Interests of a Controlling Shareholder; Approval of Transactions with Controlling Shareholders
The disclosure requirements that apply to an office holder also apply to a transaction in which a controlling shareholder of the company has a personal interest. The Israeli Companies Law provides that extraordinary transactions with a controlling shareholder or in which a controlling shareholder has a personal interest, and agreements relating to employment and compensation of a controlling shareholder, generally require the approval of the audit committee (or with respect to terms of office and employment, the compensation committee), the board of directors and the shareholders. Shareholders’ approval shall either include at least a half of the shares held by disinterested shareholders participating in the vote, or, alternatively, the total shareholdings of disinterested shareholders voting against the transaction must not represent more than two percent of the voting rights. Agreements relating to engagement or provision of services for a period exceeding three years, must generally be approved once every three years.
For these purposes, a shareholder that holds 25% or more of the voting rights in a company is considered a controlling shareholder if no other shareholder holds more than 50% of the voting rights.
Under the Companies Regulations (Relief regarding Related Party Transactions), 5760-2000, promulgated under the Israeli Companies Law, as amended, certain extraordinary transactions between a public company and its controlling shareholder(s) do not require shareholder approval. In addition, under such regulations, directors’ compensation and employment arrangements in a public company do not require the approval of the shareholders if both the compensation committee and the board of directors agree that such arrangements are solely for the benefit of the company or if the directors’ compensation does not exceed the maximum amount of compensation for external directors determined by applicable regulations. Also, employment and compensation arrangements for an office holder that is a controlling shareholder of a public company do not require shareholder approval if certain criteria are met. The foregoing exemptions from shareholder approval will not apply if one or more shareholders holding at least 1% of the issued and outstanding share capital of the company or of the company’s voting rights, objects to the use of these exemptions, provided that such objection is submitted to the company in writing not later than fourteen days from the date of the filing of a report regarding the adoption of such resolution by the company. If such objection is duly and timely submitted, then the transaction or compensation arrangement of the directors will require shareholders’ approval as detailed above.
The Israeli Companies Law provides that an acquisition of shares in a public company must be made by means of a tender offer if as a result of the acquisition a person would become a 25% or greater shareholder of the company. This rule does not apply if there is already another 25% or greater shareholder of the company. Similarly, the Israeli Companies Law provides that an acquisition of shares in a public company must be made by means of a tender offer if as a result of the acquisition a person would hold greater than a 45% interest in the company, unless there is another shareholder holding more than a 45% interest in the company. These requirements do not apply if (i) in general, the acquisition was made in a private placement that received shareholder approval, (ii) was from a 25% or greater shareholder of the company which resulted in the acquirer becoming a 25% or greater shareholder of the company, if there is not already a 25% or greater shareholder of the company, or (iii) was from a shareholder holding a 45% interest in the company which resulted in the acquirer becoming a holder of a 45% interest in the company if there is not already a 45% or greater shareholder of the company.
74
If, as a result of an acquisition of shares, a person will hold more than 90% of a public company’s outstanding shares or a class of shares, the acquisition must be made by means of a full tender offer for all of the outstanding shares or a class of shares. If less than 5% of the outstanding shares are not tendered in such full tender offer, all of the outstanding shares or class of shares will be transferred to the acquirer. The Israeli Companies Law provides for appraisal rights if any shareholder files a request in court within six months following the consummation of a full tender offer. However, the acquirer may stipulate in the tender offer that any shareholder tendering his shares will not be entitled to appraisal rights. If more than 5% of the outstanding shares are not tendered in the tender offer, then the acquirer may not acquire shares in the tender offer that will cause his shareholding to exceed 90% of the outstanding shares.
Exemption, Indemnification and Insurance of Directors and Officers
Under the Israeli Companies Law, a company may not exempt an office holder from liability with respect to a breach of his fiduciary duty, but may exempt in advance an office holder from his liability to the company, in whole or in part, with respect to a breach of his duty of care. However, a company may not exculpate in advance a director from his or her liability to the company with respect to a breach of his duty of care in connection with distributions (as defined in the Companies Law) or for such breaches as listed below.
Pursuant to the Companies Law, a company may indemnify an office holder against: (i) a financial obligation imposed on him in favor of another person by a court judgment, including a compromise judgment or an arbitrator’s award approved by court; (ii) reasonable litigation expenses, including attorney’s fees, expended by the office holder as a result of an investigation or proceeding instituted against him by a competent authority, provided that such investigation or proceeding concluded without the filing of an indictment against him and either (A) concluded without the imposition of any financial liability in lieu of criminal proceedings or (B) concluded with the imposition of a financial liability in lieu of criminal proceedings but relates to a criminal offense that does not require proof of criminal intent; and (iii) expenses, including reasonable litigation expenses and legal fees, incurred by an office holder as a result of a proceeding instituted against such office holder in relation to (A) infringements that may impose financial sanction pursuant to the provisions of Chapter H'3 under the Israeli Securities Law, 1968, or the Securities Law, or (B) administrative infringements pursuant to the provisions of Chapter H'4 under the Securities Law, or (C) infringements pursuant to the provisions of Chapter I'1 under the Securities Law.
The indemnification of an office holder must be expressly allowed in the articles of association, under which the company may (i) undertake in advance to indemnify its office holders with respect to categories of events that can be foreseen at the time of giving such undertaking and up to an amount determined by the board of directors to be reasonable under the circumstances, or (ii) provide indemnification retroactively at amounts deemed to be reasonable by the board of directors.
A company may also procure insurance for an office holder's liability in consequence of an act performed in the scope of his office, in the following cases: (i) a breach of the duty of care of such office holder, (ii) a breach of the fiduciary duty, only if the office holder acted in good faith and had reasonable grounds to believe that such act would not be detrimental to the company, or (iii) a monetary obligation imposed on the office holder for the benefit of another person. Subject to the provisions of the Companies Law and the Securities Law, a company may also enter into a contract for procurement of insurance for an office holder for (a) expenses, including reasonable litigation expenses and legal fees, incurred by the office holder as a result of a proceeding instituted against such office holder in relation to (A) infringements that may impose financial sanction pursuant to the provisions of Chapter H'3 under the Securities Law or (B) administrative infringements pursuant to the provisions of Chapter H'4 under the Securities Law or (C) infringements pursuant to the provisions of Chapter I'1 under the Securities Law and (b) payments made to the injured parties of such infringement under Section 52ND(a)(1)(a) of the Securities Law.
75
A company may not indemnify an office holder against, nor enter into an insurance contract which would provide coverage for, any monetary liability incurred as a result of any of the following:
|
|
·
|
a breach by the office holder of his fiduciary duty unless the office holder acted in good faith and had a reasonable basis to believe that the act would not prejudice the company;
|
|
|
·
|
a breach by the office holder of his duty of care if such breach was done intentionally or recklessly
;
|
|
|
·
|
any act or omission done with the intent to derive an illegal personal gain; or
|
|
|
·
|
any fine or penalty levied against the office holder as a result of a criminal offense.
|
Under the Companies Law, exemption and indemnification of, and procurement of insurance coverage for, a company’s office holders, must be approved under the same terms that apply to approval of the terms of office and employment of the office holders. For more information, see Item 6.B - “Directors, Senior Management and Employees – Compensation of Directors and Officers”.
Our Articles of Association allow us to exempt any office holder to the maximum extent permitted by law, before or after the occurrence giving rise to such exemption. Our Articles of Association also provide that we may indemnify any office holder, to the maximum extent permitted by law, against any liabilities he or she may incur in such capacity, limited with respect (i) to the categories of events that can be foreseen in advance by our Board of Directors when authorizing such undertaking and (ii) to the amount of such indemnification as determined retroactively by our Board of Directors to be reasonable in the particular circumstances. Similarly, we may also agree to indemnify an office holder for past occurrences, whether or not we are obligated under any agreement to provide such indemnification. Our Articles of Association also allow us to procure insurance covering any past or present officer holder against any liability which he or she may incur in such capacity, to the maximum extent permitted by law. Such insurance may also cover the company for indemnifying such office holder.
We have obtained directors’ and officers’ liability insurance covering our officers and directors and those of our subsidiaries for certain claims. In addition, we have provided our directors and officers with letters providing them with exemption and indemnification to the fullest extent permitted under Israeli law.
Israeli Securities Authority Administrative Enforcement
Under the Israeli Securities Law, the Israeli Securities Authority, or ISA, may take certain administrative enforcement actions against a company or a person, including a director, officer or shareholder of a company, if performing certain transgressions designated in the Securities Law.
The Securities Law also requires that the chief executive officer of a company supervise and take all reasonable measures to prevent the company or any of its employees from breaching certain provisions of the Israeli Securities Law. The chief executive officer is presumed to have fulfilled such supervisory duty if the company adopts internal enforcement procedures designed to prevent such breaches, appoints a representative to supervise the implementation of such procedures and takes measures to correct the breach and prevent its reoccurrence. The ISA is authorized to impose fines on any person or company breaching certain provisions designated under the Companies Law.
We have adopted several codes and policies, which contain various corporate governance principles, including a Code of Ethics (which includes Whistle Blower procedures), Insider Trading Policy and a Policy Prohibiting Bribery and Corruption, all of which are available on our website at www.gilat.com. See “Item 16B – Code of Ethics”.
|
D.
|
Employees
|
As of December 31, 2014, we had approximately 936 full-time employees, including 277 employees in engineering, research and development, 423 employees in manufacturing, operations and technical support, 93 employees in marketing and sales, 97 employees in administration and finance and 46 in other departments. Of these employees, 328 were based in our facilities in Israel, 109 were employed in the U.S., 268 were employed in Latin America and 231 were employed in Asia, the Far East and other parts of the world. These numbers reflect a decrease in headcount since December 31, 2013 of 45 employees worldwide.
76
As of December 31, 2013, we had approximately 981 full-time employees, including 270 employees in engineering, research and development, 389 employees in manufacturing, operations and technical support, 115 employees in marketing and sales, 160 employees in administration and finance and 47 in other departments. Of these employees, 346 were based in our facilities in Israel, 126 were employed in the U.S., 287 were employed in Latin America and 222 were employed in Asia, the Far East and other parts of the world. These numbers reflect a decrease in headcount since December 31, 2012 of 76 employees worldwide.
As of December 31, 2012, we had approximately 1,055 full-time employees, including 255 employees in engineering, research and development, 354 employees in manufacturing, operations and technical support, 115 employees in marketing and sales, 283 employees in administration and finance and 48 in other departments. Of these employees, 429 were based in our facilities in Israel, 135 were employed in the U.S., 292 were employed in Latin America and 199 were employed in Asia, the Far East and other parts of the world. These numbers reflect a decrease in headcount since December 31, 2011 of 68 employees worldwide. These numbers exclude the employees of Spacenet.
We also utilize temporary employees, as necessary, to supplement our manufacturing and other capabilities.
We provide our employees around the world with fringe benefits in accordance with applicable law.
With respect to our employees in Israel, we are subject to various Israeli labor laws and labor practices. Recent rulings by Israel's National Labor Court and changes to Israel's largest labor union's bylaws substantially facilitate the organization of a labor union in companies in Israel .We and our employees are not parties to any collective bargaining agreements and our employees are not represented by any labor union. However, certain provisions of the collective bargaining agreements between the Histadrut (General Federation of Labor in Israel) and the Coordination Bureau of Economic Organizations (including the Manufacturers’ Association of Israel) are applicable to all Israeli employees by order of the Israeli Minister of Economy. These provisions principally concern the length of the work day and the work week, minimum wages for workers, contributions to a pension fund, insurance for work-related accidents, procedures for dismissing employees, determination of severance pay and other conditions of employment. These provisions are modified from time to time.
Israeli law generally requires severance pay upon termination, resignation in certain instances or death of an employee. Our ongoing severance obligations are partially funded by making monthly payments to approved severance funds or insurance policies, with the remainder accrued as a long-term liability in our consolidated financial statements. In addition, Israeli employees and employers are required to pay specified amounts to the National Insurance Institute, which is, in essence, parallel to the U.S. Social Security Administration. Our permanent employees are generally covered by life and pension insurance policies providing customary benefits to employees, including retirement and severance benefits.
Our U.S. subsidiaries sponsor a retirement plan for eligible employees. Their 401(k) Plan is a “safe harbor” 401(k) Plan and allows eligible employees to defer compensation up to the maximum amount allowed under the current Internal Revenue Code. As a “safe harbor plan, our US subsidiaries must make a mandatory contribution to the 401(k) Plan to satisfy certain nondiscrimination requirements under the Internal Revenue Code. This mandatory contribution is made to all eligible employees.
|
E.
|
Share Ownership
|
Beneficial Ownership of Executive Officers and Directors
Except for Mr. Dov Baharav and Mr. Erez Antebi, none of our directors and executive officers beneficially owns more than 1% of our outstanding shares. Mr. Baharav beneficially owns approximately 2.1% of our ordinary shares, consisting of 849,182 ordinary shares and options to purchase 62,500 ordinary shares exercisable within 60 days from the date of this Annual Report Mr. Antebi beneficially owns approximately 1.8% of our ordinary shares, consisting of 54,000 ordinary shares and options to purchase 710,000 ordinary shares exercisable within 60 days from the date of this Annual Report. Additionally, Mr. Ishay Davidi shares voting and dispositive power with Shira and Ishay Davidi Management Ltd. with respect to the shares held by the FIMI Funds, and he controls Shira and Ishay Davidi Management Ltd. as described in Item 7A – “Major Shareholders and Related Party Transactions” – “Major Shareholders”.
77
As of December 31, 2014, our directors and executive officers as a group (18 persons) held options to purchase 2,006,000 of our ordinary shares under our share options plans (described below), exercisable at a weighted average exercise price of $4.59 per share with expiration dates ranging from February 2015 to December 2020. The amount of options includes options to purchase 100,000 ordinary shares granted to FIMI IV 2007 Ltd. by our company in connection with the service of its executives, Ishay Davidi and Amiram Boehm, as members of our Board. In addition, as of December 31, 2014, our directors and executive officers as a group held 33,750 RSUs under our share options plans. See Item 7A “Major Shareholders and Related Party Transactions – Major Shareholders”.
Option Plans
2003 Share Option Plan
In September 2003, we adopted the 2003 Share Option Plan (Incentive and Restricted Share Options), or the 2003 ISO/RSO Plan and the Section 102 Share Option Plan 2003, and together, the “2003 Plans”, for grant of options to our officers, directors, employees or service providers or any of the employees or service providers of our subsidiaries. The 2003 Plans expired in June 2013.
As of December 31, 2014, options to purchase a total of 2,656,050 ordinary shares were outstanding under the 2003 Plans, and options to purchase 1,861,080 ordinary shares had been exercised. The exercise prices for the outstanding options range from $3.77 to $8.10 and such options expire at various times from February 2015 to February 2018.
2005 Share Incentive Plan
In December 2005, our shareholders adopted the 2005 Share Incentive Plan, or the 2005 Plan, for grant of options and RSUs to our officers, directors, employees or service providers or any of the employees or service providers of our subsidiaries (including Section 102 sub-plan adopted in 2008 to enable qualified optionees certain tax benefits under the Israeli Income Tax Ordinance). The 2005 Plan expired in December 2012.
As of December 31, 2014, a total of 32,925 RSUs were outstanding under the 2005 Plan, and 1,328,297 ordinary shares were issued as a result of RSUs vesting under the 2005 Plan. All options granted under the 2005 Plan were canceled or expired without being exercised.
The options and RSUs granted under the 2005 Plan generally vested or vest quarterly or annually over a four-year period (15%, 25%, 30% and 30% each year, respectively).
2008 Share Incentive Plan
In October 2008, our Board of Directors adopted the 2008 Share Incentive Plan, or the 2008 Plan
,
for issuance of options, RSUs and other forms of equity based awards to
our and our subsidiaries’ directors, officers, consultants and employees. Our Board of Directors also adopted a sub-plan to enable qualified optionees certain tax benefits under the Israeli Income Tax Ordinance. Following increases approved by our Board of Directors, the total number of ordinary shares reserved for issuance of options under the 2008 Plan is 4 million. As of December 31, 2014, we have granted options to purchase 2,286,831 ordinary shares under the 2008 Plan (excluding options that were granted and cancelled), pursuant to which 476,498 ordinary shares have been issued as of December 31, 2014. The exercise prices for the outstanding options range from $3.00 to $5.40 and such options expire at various times from November 2015 to December 2020. As of December 31, 2014, we have granted 1,403,936 RSUs under the 2008 Plan (excluding RSUs that were granted and canceled), pursuant to which, 863,736 ordinary shares have been issued as of December 31, 2014.
78
The term of the options granted under the Plans is 6, 7 years or 10 years, depending on the terms of the specific plan and grant letter.
The RSUs and options granted under the 2008 Plan to our executives generally vest quarterly or annually over a four-year period (15%, 25%, 30% and 30% each year, respectively). The options granted under the 2008 Plan to our directors generally vest ratably each quarter over a three-year period except in the case of the grant to our Chairman of the Board of Directors, in which the options vest ratably each quarter over a four-year period.
The purpose of the 2003, 2005 and 2008 Plans, referred to together as the Plans, is to enable us to attract and retain qualified persons as employees, officers, directors, consultants and advisors and to motivate such persons by providing them with an equity participation in our company. The Section 102 Plans are designed to afford qualified optionees certain tax benefits under the Israeli Income Tax Ordinance.
The Plans are administered by the Compensation and Stock Option Committee appointed by our Board of Directors. The Compensation and Stock Option Committee recommends to our Board, or in case of office holders, approves, the persons entitled to receive options and RSUs, the terms and conditions on which options or rights to purchase are granted and the number of shares subject thereto. The grants of options and RSUs are approved by our Board.
Options issued pursuant to the Plans may be granted to our and our subsidiaries’ directors, officers, consultants and employees. The exercise price of incentive share options issued pursuant to the Plans must be not less than the closing price of our ordinary shares on NASDAQ on the date of grant of the options or, if the closing price is not quoted on such date, on the preceding trading day.
Options are exercisable and restrictions on disposition of shares lapse according to the terms of the applicable plan and of the individual agreements under which such options were granted or awards issued.
|
A.
|
Major Shareholders
|
The following table sets forth certain information with respect to the beneficial ownership of our ordinary shares as of March 25, 2015 (including options currently exercisable or exercisable within 60 days after the date of this Annual Report and RSUs vesting within 60 days after the date of this Annual Report) with respect to: (i) each person who is known to us to be the beneficial owner of more than 5% of the ordinary shares; and (ii) all directors and officers as a group.
The information in the table below is based on 42,940,273 ordinary shares outstanding as of March 25, 2015. Except where otherwise indicated, we believe, based on information furnished by the owners, that the beneficial owners of the ordinary shares listed below have sole investment and voting power with respect to such shares, subject to any applicable community property laws.
79
|
Name and Address
|
Number of
Ordinary
Shares
Beneficially
Owned
|
Percent of
Ordinary
Shares
Outstanding
(1)
|
||||||
|
FIMI Funds
(2)
|
15,017,672 | 34.9 | % | |||||
|
Itshak Sharon (Tshuva)
(3)
|
3,904,874 | 9.1 | % | |||||
|
Meitav Dash Investments Ltd
(4)
|
2,720,162 | 6.3 | % | |||||
|
Mivtah Shamir Holdings Ltd.
(
5)
|
2,216,944 | 5.2 | % | |||||
|
All officers and directors as a group
(18 persons)
(6)
|
2,168,553 | 4.9 | % | |||||
____________
|
(1)
|
Ordinary shares relating to options currently exercisable or exercisable within 60 days of the date of this table and ordinary shares relating to RSUs vesting within 60 days, after the date of this Annual Report are deemed outstanding for computing the percentage of the person holding such securities but are not deemed outstanding for computing the percentage of any other person.
|
|
(2)
|
Based on a Schedule 13D/A filed on December 4, 2014 and information provided to the Company, FIMI Opportunity IV, L.P., FIMI Israel Opportunity IV, Limited Partnership (the “FIMI IV Funds”), FIMI Opportunity V, L.P., FIMI Israel Opportunity Five, Limited Partnership (the "FIMI V Funds" and together with the FIMI IV Funds, the "FIMI Funds"), FIMI IV 2007 Ltd., FIMI FIVE 2012 Ltd., Shira and Ishay Davidi Management Ltd. and Mr. Ishay Davidi share voting and dispositive power with respect to the 15,017,672
shares held by the FIMI Funds. FIMI IV 2007 Ltd. is the managing general partner of the FIMI IV Funds. FIMI FIVE 2012 Ltd. is the managing general partner of the FIMI V Funds. Shira and Ishay Davidi Management Ltd. controls FIMI IV 2007 Ltd. and FIMI FIVE 2012 Ltd. Mr. Ishay Davidi controls Shira and Ishay Davidi Management Ltd. and is the Chief Executive Officer of all the entities listed above. These holdings include options to purchase 75,000 ordinary shares held by FIMI IV 2007 Ltd., which are currently exercisable or are exercisable within 60 days of the date hereof granted to it by our company in connection with the service of its executives, Ishay Davidi and Amiram Boehm, as members of our Board (out of the 50,000 options granted to FIMI IV 2007 Ltd. in connection with each of Mr. Davidi’s and Mr. Boehm’s services as our directors).
|
On October 24, 2014, FIMI Funds commenced a tender offer to purchase 5,166,348 shares of the Company for a cash price of US$4.95 per share, less any required withholding taxes and without interest. The tender offer expired on November 29, 2014 and FIMI Funds successfully completed the tender offer to purchase the 5,166,348 shares.
The principal business address of each of the above entities and of Mr. Davidi is c/o FIMI IV 2007 Ltd., Electra Tower, 98 Yigal Alon St., Tel-Aviv 67891, Israel.
|
(3)
|
Based on a Schedule 13G filed on March 7, 2013 by Itshak Sharon (Tshuva), Delek Group Ltd. and The Phoenix Holding Ltd. and information provided to us by the shareholders as of March 18, 2015. The ordinary shares are beneficially owned by various direct or indirect, majority or wholly-owned subsidiaries of the Phoenix Holding Ltd. (“the Subsidiaries”) as follows: (i) 90,804 ordinary shares owned by Excellence Gemel & Pension; (ii) 104,411 ordinary shares owned by Excellence Karnot Neemanut; (iii) 958,806 ordinary shares owned by Excellence Teudot Sal; (iv) 286,419 ordinary shares owned by Phoenix – Nostro; (v) 1,300 ordinary shares owned by Phoenix – Mishtatef; (vi) 2,355,410 ordinary shares owned by Shutfut Menayot Israel; and (vii) 107,724 ordinary shares owned by Shutfut Tel Aviv 100. The Subsidiaries manage their own funds and/or the funds of others, including for holders of exchange-traded notes or various insurance policies, members of pension or provident funds, unit holders of mutual funds, and portfolio management clients. Each of the Subsidiaries operates under independent management and makes its own independent voting and investment decisions. The Phoenix Holding Ltd. is a majority-owned subsidiary of Delek Group Ltd. The majority of Delek Group Ltd.'s outstanding share capital and voting rights are owned, directly and indirectly, by Itshak Sharon (Tshuva) through private companies wholly-owned by him, and the remainder is held by the public. The principal business address of Itshak Sharon (Tshuva) and Delek Investments and Properties Ltd. is 7 Giborei Israel Street, P.O.B. 8464, Netanya, 42504, Israel. The principal business address of the Phoenix Holding Ltd. is Derech Hashalom 53, Givataim, 53454, Israel.
|
|
(4)
|
Based on a Schedule 13G filed on January 20, 2015 and information provided to us by the shareholder as of February 28, 2015, Meitav Dash Investments Ltd. (“Meitav”) is controlled by: (1) BRM Group Ltd. (“BRM Group”) which holds Meitav’s shares through BRM Finance Ltd., a wholly owned subsidiary of BRM Group. The shareholders of BRM Group are Messrs. Eli Barkat, Nir Barkat (Messrs. Eli Barkat and Nir Barkat are brothers) and Yuval Rakavy, each holds 33.3% through his controlled companies; and (2) Mr. Zvi Stepak who holds Meitav’s shares through Maya Holdings (Ye'elim) Ltd.
(“
Maya holdings”) a company which he controls and Nili
(
Amir
)
Holdings
Ltd.
(
a wholly owned subsidiary of Maya Holdings). Meitav holds2,720,162 ordinary shares as follows: (i) 475,889
ordinary shares owned by Mutual Funds of Meitav DS Investments LTD group; (ii) 1,200,612
ordinary shares owned by Provident Funds of Meitav DS Investments LTD group; and (iii)
1,043,661
ordinary shares owned by ETF’s of Meitav DS Investments LTD group. The principal business address of Meitav is 30 Derekh Sheshet Ha-yamim, Bene-Beraq, Israel.
|
|
(5)
|
Based on a Schedule 13G filed on March 24, 2015 by Mivtah Shamir Holdings Ltd. The principal office of Mivtah Shamir Holdings Ltd. is 27 Habarzel Street, Tel-Aviv.
|
|
(6)
|
Includes options that are currently exercisable or are exercisable within 60 days of the date of this report and RSUs vested within 60 days from the date of this report that are held by our directors and executive officers.
|
80
Significant Changes in the Ownership of Major Shareholders
As of April 7, 2013, our major shareholders were York Capital Management, or York, holding 8,121,651ordinary shares (approximately 19.4% ownership), FIMI Funds, holding 7,678,533 ordinary shares (approximately 18.3 % ownership) and Itshak Sharon (Tshuva), holding 2,676,484 ordinary shares (approximately 6.4% ownership).
As of March 28, 2014, our major shareholders were FIMI Funds, holding 9,817,990 ordinary shares (approximately 23.2 % ownership), York, holding 6,015,530 ordinary shares (approximately 14.2% ownership), and Itshak Sharon (Tshuva), holding 2,553,792 ordinary shares (approximately 6% ownership).
As of March 26, 2015, our major shareholders are FIMI Funds, holding 14,942,672 ordinary shares (approximately 34.9% ownership), Itshak Sharon (Tshuva), holding 3,904,874 ordinary shares (approximately 9.1% ownership), Meitav Dash Investments Ltd., holding 2,720,162 ordinary shares (approximately 6.3% ownership) and Mivtah Shamir Holdings Ltd. holding 2,216,944 ordinary shares (approximately 5.2% ownership).
Major Shareholders Voting Rights
The voting rights of our major shareholders do not differ from the voting rights of other holders of our ordinary shares, except to the extent that they hold more than 14% and as such, they will have a right to appoint a director, subject to certain conditions set forth in our Articles of Association.
81
Record Holders
Based on a review of the information provided to us by our transfer agent, as of March 22, 2015, there were 76 holders of record of our ordinary shares, of which 53 record holders holding approximately 90% of our ordinary shares had registered addresses in the U.S. These numbers are not representative of the number of beneficial holders of our shares nor is it representative of where such beneficial holders reside since many of these ordinary shares were held of record by brokers or other nominees, including CEDE & Co., the nominee for the Depositary Company (the central depositary for the U.S. brokerage community), which held approximately
78%
of our outstanding ordinary shares as of said date.
|
B.
|
Related Party Transactions.
|
In March 2014, our Board approved that we enter into an agreement for purchase of infrastructure, construction and integration services from C. Mer Industries Ltd., or C. Mer, for an aggregate amount of approximately $4 million. FIMI holds approximately 30% of C. Mer’s share capital and Ishay Davidi is a member of the board of directors of C. Mer. The transaction was approved by our Board of Directors as a related party transaction (after our Audit Committee concluded that the transaction is in the ordinary course of business).
|
C.
|
Interests of Experts and Counsel.
|
Not applicable.
A.
Consolidated Statements
See the consolidated financial statements, including the notes thereto, and the exhibits listed in Item 18 hereof and incorporated herein by this reference.
Export Sales
For information on our revenues breakdown for the past three years, see Item 5: “Operating and Financial Review and Prospects.”
Legal Proceedings
We are a party to various legal proceedings incident to our business. Except as noted below, there are no material legal proceedings pending or, to our knowledge, threatened against us or our subsidiaries, and we are not involved in any legal proceedings that our management believes, individually or in the aggregate, would have a material adverse effect on our business, financial condition or operating results.
In September 2003, Nova Mobilcom S.A., or Mobilcom, filed a lawsuit in Brazil against our subsidiaries, Gilat do Brazil Ltda. and Gilat Satellite Networks (Holland) B.V., for specific performance of a memorandum of understanding for performance of a government education project. The lawsuit was not for a specified amount. In June 2011, the Brazilian court ruled in favor of Gilat. Mobilcom filed an appeal to the State Court of Appeals of Brazil, which appeal was rejected. In September 2012, Mobilcom filed a Special Appeal, which was refused to be admitted by the State Court of Appeals of Brazil. In January 2013, Mobilcom filed an interlocutory appeal with the Superior Court of Justice of Brazil, which was rejected in August 2014. An additional interlocutory appeal filed by Mobilcom in September 2014 was rejected as well, resulting in the Court’s ruling becoming final and not appealable.
82
In 2003, the Brazilian tax authority filed a claim against our subsidiary in Brazil, SPC International Ltda, (an inactive company), for the payment of taxes allegedly due by the subsidiary in the amount of approximately $4 million. In January 2004 and December 2005, the subsidiary filed its administrative defense, which was denied by the first and second level Brazilian courts, respectively. In September 2006, our subsidiary filed an annulment action seeking judicial cancellation of the claim. In May 2009, the subsidiary received notice of the court’s first level decision, which cancelled a significant portion of the claim, but upheld two items of the assessment. Under this decision, the subsidiary’s principal liability was reduced to approximately $1.5 million. This decision was appealed by both the subsidiary and the Brazilian tax authority. In June 2012, the São Paulo Court of Appeals ruled against the inactive subsidiary, accepting the claims of the Brazilian tax authority. In September 2012, the subsidiary filed an appeal to the Brazilian Superior Court of Justice and to the Brazilian Supreme Court. In October 2014, the appeals were not admitted by the São Paulo Court of Appeals and our subsidiary filed appeals on such decision, which are pending. Accordingly, as of December 31, 2014, our inactive subsidiary faces a tax exposure of approximately $10.4 million, including interest, penalties, legal fees and exchange rate differences. Based on external counsel’s opinion, our company believes that it has a reasonable chance of success to reverse the ruling of the São Paulo Court of Appeals. The Brazilian tax authority issued a foreclosure certificate against the subsidiary and certain of its former managers and representatives and decided that these individuals should be summoned to appear in court. Based on the company’s Brazilian external counsel's opinion, we believe that the inclusion of any additional co-obligors in the tax foreclosure certificate should be barred due to the applicable statute of limitations. Based on such opinion of counsel, we believe that the foreclosure procedures legally cannot be redirected to other group entities and managers who have not been cited in the foreclosure certificate. Accordingly, the chances that such redirection will lead to a loss recognition are remote.
In October 2014, our Peruvian subsidiary applied to the Chamber of Commerce of Lima, Peru for initiation of arbitration proceedings against the Ministry of Transport and Communications of Peru and FITEL. The arbitration is related to the FITEL projects awarded to the subsidiary in 2000-2001. Under these projects, our subsidiary has provided fixed public telephony services in rural areas of Peru. Our subsidiary’s main claim is related to damages caused to it by the promotion of mobile telephony in such areas by the Peruvian government. The arbitral tribunal was established and our subsidiary is to file its detailed statement of claim by April 2015, to be followed by a response statement of the Ministry of Transport and Communications of Peru and FITEL.
We are also a party to various regulatory proceedings incident to our business. To the knowledge of our management, none of such proceedings is material to us or to our subsidiaries.
Dividend Policy
We have never paid cash dividends on our ordinary shares and do not anticipate paying any cash dividends in the foreseeable future. Israeli law limits the distribution of cash dividends to the greater of retained earnings or earnings generated over the two most recent years, in either case provided that we reasonably believe that the dividend will not render us unable to meet our current or foreseeable obligations when due. Notwithstanding the foregoing, dividends may be paid with the approval of a court, provided that there is no reasonable concern that such dividend distribution will prevent the company from satisfying its current and foreseeable obligations, as they become due. In the event we declare dividends in the future, we will pay those dividends in NIS. Because exchange rates between NIS and the dollar fluctuate continuously, a U.S. shareholder will be subject to currency fluctuation between the date when the dividends are declared and the date the dividends are paid.
B. Significant Changes
Not applicable.
83
|
A.
|
Offer and Listing Details
|
Annual Share Price Information
The following table sets forth, each of the years indicated, the high and low market prices of our ordinary shares on the NASDAQ Global Market and the TASE. In January 2011, our ordinary shares started trading on the NASDAQ Global Select Market.
|
NASDAQ
|
TASE
|
|||||||||||||||
|
Year
|
High
|
Low
|
High
|
Low
|
||||||||||||
|
2010
|
$ | 6.25 | $ | 3.96 | $ | 6.25 | $ | 3.99 | ||||||||
|
2011
|
$ | 5.85 | $ | 3.11 | $ | 5.85 | $ | 3.18 | ||||||||
|
2012
|
$ | 5.57 | $ | 2.35 | $ | 5.56 | $ | 2.43 | ||||||||
|
2013
|
$ | 6.04 | $ | 4.17 | $ | 5.96 | $ | 4.11 | ||||||||
|
2014
|
$ | 5.59 | $ | 4.52 | $ | 5.57 | $ | 4.55 | ||||||||
Quarterly Share Price Information
The following table sets forth, for each of the full financial quarters in the years indicated the high and low market prices of our ordinary shares on the NASDAQ Global Market on the Global Select Market and the TASE:
|
NASDAQ
|
TASE
|
|||||||||||||||
|
High
|
Low
|
High
|
Low
|
|||||||||||||
|
2013
|
||||||||||||||||
|
First quarter
|
$ | 5.88 | $ | 5.26 | $ | 5.79 | $ | 5.25 | ||||||||
|
Second quarter
|
$ | 5.72 | $ | 5.20 | $ | 5.78 | $ | 5.26 | ||||||||
|
Third quarter
|
$ | 6.04 | $ | 4.60 | $ | 5.96 | $ | 4.64 | ||||||||
|
Fourth quarter
|
$ | 5.24 | $ | 4.17 | $ | 5.28 | $ | 4.11 | ||||||||
|
2014
|
||||||||||||||||
|
First quarter
|
$ | 5.59 | $ | 4.63 | $ | 5.57 | $ | 4.64 | ||||||||
|
Second quarter
|
$ | 5.03 | $ | 4.52 | $ | 5.15 | $ | 4.61 | ||||||||
|
Third quarter
|
$ | 5.11 | $ | 4.58 | $ | 5.09 | $ | 4.55 | ||||||||
|
Fourth quarter
|
$ | 5.13 | $ | 4.66 | $ | 5.15 | $ | 4.67 | ||||||||
|
2015
|
||||||||||||||||
|
First quarter (as of March 30, 2015)
|
$ | 6.08 | $ | 4.49 | $ | 5.99 | $ | 4.42 | ||||||||
Monthly Share Price Information
The following table sets forth, for the most recent six months, the high and low market prices of our ordinary shares on the NASDAQ Global Select Market and the TASE:
|
NASDAQ
|
Tel Aviv Stock Exchange
|
|||||||||||||||
|
High
|
Low
|
High
|
Low
|
|||||||||||||
|
October 2014
|
$ | 5.03 | $ | 4.81 | $ | 5.01 | $ | 4.79 | ||||||||
|
November 2014
|
$ | 5.13 | $ | 4.85 | $ | 5.13 | $ | 4.79 | ||||||||
|
December 2014
|
$ | 5.04 | $ | 4.66 | $ | 5.15 | $ | 4.67 | ||||||||
|
January 2015
|
$ | 4.75 | $ | 4.49 | $ | 4.73 | $ | 4.42 | ||||||||
|
February 2015
|
$ | 4.94 | $ | 4.67 | $ | 5.04 | $ | 4.67 | ||||||||
|
March 2015 (as of March 30, 2015)
|
$ | 6.08 | $ | 4.87 | $ | 5.99 | $ | 4.85 | ||||||||
84
|
B.
|
Plan of Distribution
|
Not applicable.
|
C.
|
Markets
|
Our ordinary shares are listed on the NASDAQ Global Select Market under the symbol “GILT” and are also traded on the TASE.
|
D.
|
Selling Shareholders
|
Not applicable.
|
E.
|
Dilution
|
Not applicable.
|
F.
|
Expense of the Issue
|
Not applicable.
ITEM
10:
ADDITIONAL INFORMATION
|
A.
|
Share Capital
|
Not applicable.
|
B.
|
Memorandum and Articles of Association
|
Set out below is a description of certain provisions of our Articles of Association and of the Israeli Companies Law related to such provisions. This description is only a summary and does not purport to be complete and is qualified by reference to the full text of the Articles of Association, which are incorporated by reference as exhibits to this annual report, and to Israeli law.
Registration and Purposes
We are an Israeli public company registered with the Israel companies register, registration No. 52-003893-6.
Under the Companies Law, a company may define its purposes as to engage in any lawful business and may broaden the scope of its purposes to the grant of reasonable donations for any proper charitable cause, even if the basis for any such donation is not dependent upon business considerations. Our Articles of Association provide that our purpose is to engage in any business permitted by law and that we can also grant reasonable donations for any proper charitable cause.
Powers of the Directors
Under the provisions of the Israeli Companies Law and our articles of association, a director cannot vote on a proposal, arrangement or contract in which he or she has a personal interest, nor attend a meeting during which such transaction is considered, except in event of a transaction that is not extraordinary or for the purpose of presenting the proposed transaction, if the chairman of the audit committee or board of directors (as applicable) determines it necessary. In addition, the terms of office and employment of the directors require the approval of the compensation committee, the board of directors and shareholders. For more information regarding the requirements for approval of certain transactions, see Item 6B - “Directors, Senior Management and Employees – “Compensation of Directors and Officers”.
85
Rights Attached to Ordinary Shares
Our authorized share capital consists of 90,000,000 ordinary shares, nominal value NIS 0.2 per share. All outstanding ordinary shares are validly issued and fully paid. Certain rights attached to the ordinary shares are as described below.
Voting Rights
.
Holders of ordinary shares have one vote for each ordinary share held on all matters submitted to a vote of shareholders. Shareholders may vote in person or by proxy. These voting rights may be affected by the grant of any special voting rights to the holders of a class of shares with preferential rights that may be authorized in the future by the shareholders.
Dividend and Liquidation Rights; Rights to Shares in our Company’s Profits.
Our ordinary shares are entitled to the full amount of any cash or share dividend declared, in proportion to the paid up nominal value of their respective holdings. In the event of liquidation, after satisfaction of liabilities to creditors, our assets will be distributed to the holders of our ordinary shares in proportion to the paid up nominal value of their respective holdings. Such rights may be affected by the grant of preferential dividend or distribution rights to the holders of a class of shares with preferential rights that may be authorized in the future by the shareholders.
Generally, pursuant to the Israeli Companies Law, the decision to distribute dividends and the amount to be distributed, whether interim or final, is made by the board of directors. Accordingly, under our Articles of Association, our Board of Directors has the authority to determine the amount and time for payment of interim dividends and final dividends.
Under the Israeli Companies Law, dividends may be paid only out of a company’s net profits for the two years preceding the distribution of the dividends, or from accumulated retained earnings, calculated in the manner prescribed in the Israeli Companies Law. Pursuant to the Israeli Companies Law, in any distribution of dividends, our Board of Directors is required to determine that there is no reasonable concern that the distribution of dividends will prevent our company from meeting our existing and foreseeable obligations as they become due. Our Articles of Association provide that no dividends shall be paid otherwise than out of our profits and that any such dividend shall carry no interest. In addition, upon the recommendation of our Board of Directors, approved by the shareholders, we may cause dividends to be paid in kind.
Our shareholders have the right to share in our profits distributed as a dividend and any other permitted distribution, if any.
Annual and Special General Meetings
Record Date for General Meeting
Under the regulations promulgated under the Israeli Companies Law, for the purpose of a shareholder vote, the record date for companies traded outside of Israel, such as our company, can be set between four and 40 days before the date of the meeting.
Notice of General Meetings; Omission to Give Notice
The Companies Law provides that a company whose shares are traded on an exchange must give notice of a general meeting to its shareholders of record at least 21 days, and in certain instances at least 35 days, prior to the meeting, unless the company’s articles provide that a notice need not be sent. Accordingly, our Articles of Association provide that not less than 21 days’ prior notice shall be given to shareholders of record of every general meeting of shareholders. It further provides that notice of a general meeting of shareholders shall be given in accordance with any law and otherwise as the Board of Directors may determine. In addition, our Articles of Association provide that no shareholder present, in person or by proxy, at the commencement of a general meeting of shareholders shall be entitled to seek the revocation of any proceedings or resolutions adopted at such general meeting of shareholders on grounds of any defect in the notice of such meeting relating to the time or the place thereof.
86
Annual General Meetings and Special General Meetings
Under the Israeli Companies Law, an annual meeting of the shareholders should be held once in every calendar year and not more than 15 months from the last annual meeting. The Israeli Companies Law provides that a special meeting of shareholders must be called by the board of directors upon the written request of (i) two directors, (ii) one-fourth of the serving directors, (iii) one or more shareholders who hold(s) at least five percent of the issued share capital and at least one percent of the voting power of the company, or (iv) one or more shareholders who have at least five percent of the voting power of the company. Within 21 days of receipt of such demand, the board of directors is required to convene the special meeting for a time not later than 35 days after notice has been given to the shareholders. Our Articles of Association provide that our Board of Directors may call a special meeting of the shareholders at any time and shall be obligated to call a special meeting as specified above.
Quorum at General Meetings
Under our Articles of Association, the required quorum for any general meeting of shareholders and for any class meeting is two or more shareholders present in person or by proxy and holding at least twenty five percent (25%) of the issued shares (or of the issued shares of such class in the event of a class meeting). The required quorum in a meeting that was adjourned because a quorum was not present, shall be two shareholders present in person or by proxy. Under our Articles of Association, if the original meeting was called as a special meeting, the quorum in the adjourned meeting shall be one or more shareholders, present in person or by proxy and holding the number of shares required to call such a meeting.
Adoption of Resolutions at General Meetings
Our Articles of Association provide for voting by a written ballot only. In addition, in accordance with the Companies Law, our Articles of Association provide that the declaration of the Chairman of the Meeting as to the results of a vote is not considered to be conclusive, but rather prima facie evidence of the fact. Under our Articles of Association, unless a different majority is required by law, any resolution of the shareholders, except a resolution for a voluntary liquidation of the company and, in certain circumstances, a resolution to amend our Articles of Association, shall be deemed adopted if approved by the vote of the holders of a majority of the voting power represented at such meeting in person or by proxy.
Election and Removal of Directors
Under our Articles of Association, the ordinary shares do not have cumulative voting rights in the election of directors.
Under our Articles of Association, our Board of Directors shall consist of not less than five and not more than nine directors as shall be determined from time to time by a majority vote at the general meeting of our shareholders. Our shareholders have resolved that our Board of Directors should consist of a total of eight directors, including two external directors.
Our Articles of Association further provide that each beneficial owner of 14% or more of our issued and outstanding ordinary shares shall be entitled to appoint, at each annual general meeting of our shareholders, one member to our Board of Directors referred to as an “Appointed Director”, provided that a total of not more than four Appointed Directors are so appointed. In the event more than four such qualifying beneficial owners notify us that they desire to appoint an Appointed Director, only the four shareholders beneficially owning the greatest number of shares shall each be entitled to appoint an Appointed Director.
87
For the purposes of the preceding paragraph, a “beneficial owner” of ordinary shares means any person or entity who, directly or indirectly, has the power to vote, or to direct the voting of, such ordinary shares. All ordinary shares beneficially owned by a person or entity, regardless of the form which such beneficial ownership takes, shall be aggregated in calculating the number of ordinary shares beneficially owned by such person or entity. All persons and entities that are affiliates (as defined below) of each other shall be deemed to be one person or entity for the purposes of this definition. For the purposes of the preceding paragraph, an “affiliate” means, with respect to any person or entity, any other person or entity controlling, controlled by, or under common control with such person or entity. “Control” shall have the meaning ascribed to it in the Israeli Securities Law – 1968, i.e., the ability to direct the acts of a company. Any person holding one half or more of the voting power of a company of the right to appoint directors or to appoint the chief executive officer is presumed to have control of the company.
The Articles of Association further stipulate that as a condition to the appointment of an Appointed Director, any appointing shareholder that delivers to our company a letter of appointment shall, prior to such delivery, be required to file with the Securities and Exchange Commission a Schedule 13D, or an amendment to its Schedule 13D if there is any change in the facts set forth in its Schedule 13D already on file with the Securities and Exchange Commission which discloses any such change in its holdings of ordinary shares, regardless of whether any filing or amendment is required to be filed under the rules of the Securities Exchange Act of 1934, as amended, and the rules and regulations promulgated thereunder. In addition, any Appointing Shareholder shall be obligated to notify us in writing of any sale, transfer, assignment or other disposition of any kind of ordinary shares by such appointing shareholder that results in the reduction of its beneficial ownership to below the percentage indicated above, immediately after the occurrence of such disposition of shares but in any event not later than the earliest of (i) ten (10) days thereafter, or (ii) the next Annual General Meeting. Without derogating from the foregoing, so long as an Appointed Director serves on the Board of Directors, the appointing shareholder which appointed such Appointed Director shall provide us, upon our written request at any time and from time to time, with reasonable evidence of its beneficial ownership in our company.
Under our Articles of Association, so long as our ordinary shares are listed for trading on NASDAQ, we may require that any Appointed Director qualify as an “independent director” as provided for in the NASDAQ rules then in effect. In addition, in no event may a person become an Appointed Director unless such person does not, at the time of appointment, and did not, within two years prior thereto, engage, directly or indirectly, in any activity which competes with us, whether as a director, officer, employee, contractor, consultant, partner or otherwise.
Under our Articles of Association, the annual general meeting of our shareholders, by the vote of the holders of a majority of the voting power represented at such meeting in person or by proxy, will elect the remaining members of the Board of Directors. At any annual general meeting at which Appointed Directors are appointed as set forth above, the calculation of the vote of any beneficial owner who appointed a director pursuant to the preceding paragraph shall not take into consideration, for the purpose of electing the remaining directors, ordinary shares constituting 14% of our issued and outstanding ordinary shares held by such appointing beneficial owner.
Appointed Directors may be removed by our Board of Directors when the beneficial ownership of the shareholder who appointed such Appointed Director falls below 14% of our ordinary shares. In addition, the office of an Appointed Director will expire upon the removal of the Appointed Director by the shareholder who appointed such Appointed Director or when the Appointed Director ceases to qualify as an “independent director” as set forth above.
Currently, no shareholder beneficially holding 14% or more of our issued and outstanding ordinary shares has exercised its right to appoint an Appointed Director.
Our Articles of Association further provide that the affirmative vote of a majority of the shares then represented at a general meeting of shareholders shall be entitled to remove director(s) other than Appointed Directors from office (unless pursuant to circumstances or events prescribed under the Companies Law), to elect directors instead of directors so removed or to fill any vacancy, however created, in the Board of Directors. Subject to the foregoing and to early resignation or ipso facto termination of office as provided in our Articles of Association, each director shall serve until the adjournment of the annual general meeting following the general meeting at which such director was elected.
88
Our directors may, at any time and from time to time, appoint a director to temporarily fill a vacancy on the Board of Directors or in their body (subject to the maximum number of directors in the Board of Directors as set forth above), except that if the number of directors then in office constitutes less than a majority of the number of directors set by the shareholders, as mentioned above, they may only act in an emergency, or to fill the vacancy up to the minimum number required to effect corporate action or in order to call a general meeting for the purpose of electing directors.
Qualification of Directors
Our Articles of Association provide that no person shall be disqualified to serve as a director by reason of him not holding shares in our company or by reason of him having served as director in the past. Our directors are not subject under the Israeli Companies Law or our Articles of Association to an age limit requirement. Under the Companies Law, a person cannot serve as a director if such person has been convicted of certain offenses (generally, for 5 years after such conviction, unless specifically authorized by the court), if an administrative decision by the ISA disqualified such director to be nominated to the board of a public company, or if the person has been declared bankrupt.
Borrowing Powers
The Israeli Companies Law authorizes the board of directors of a company, among other things, to determine the credit limit of a company and to issue bonds. Our Articles of Association state that our Board of Directors may, from time to time, at its discretion, cause us to borrow or secure the payment of any sum or sums of money, and may secure or provide for the repayment of such sum or sums in such manner, at such times and upon such terms and conditions as it deems fit.
Foreign Ownership
Neither our Articles of Association nor Israeli law restrict in any way the ownership of our ordinary shares by nonresidents of Israel, or restrict the voting or other rights of nonresidents of Israel. Notwithstanding, under Israeli law, nationals of certain countries that are, or have been, in a state of war with Israel may not be recognized as owners of ordinary shares, without a special government permit.
Change of Control Provisions Under Israeli Law
The Israeli Companies Law provides that an acquisition of shares in a public company, such as ours, must be made by means of a tender offer, if, as a result of the acquisition, the purchaser would become a holder of 25% or more of the voting rights in the company. This rule does not apply if there is already another holder of 25% percent of the voting rights. Similarly, the Israeli Companies Law provides that an acquisition of the shares must be made by means of a tender offer, if, as a result of the acquisition, a person would become a holder of 45% of the voting rights in the company, unless there is another person holding at that time more than 45% of the voting rights of the company.
The Israeli Companies Law provides for mergers between Israeli companies, if each party to the transaction obtains the appropriate approval of its board of directors and shareholders. A “merger” is defined in the Companies Law as a transfer of all assets and liabilities (including conditional, future, known and unknown liabilities) of a target company to another company, the consequence of which is the dissolution of the target company in accordance with the provisions of the Companies Law. For purposes of the shareholder vote of each merging entity, unless a court rules otherwise, the merger requires the approval of a majority of the shares of that entity that are not held by the other entity or are not held by any person who holds 25% or more of the shares or the right to appoint 25% or more of the directors of the other entity. Our Articles of Association provide that a merger requires the approval of the holders of a majority of the shares voting thereon.
89
If, however, the merger involves a merger with a company’s own controlling shareholder or if the controlling shareholder has a personal interest in the merger, then the merger is subject to the same special majority approval that governs all extraordinary transactions with controlling shareholders (as described above in Item 6 E under “—Approval of Related Party Transactions Under Israeli Law”). In the event that the merger transaction has not been approved by either of the above-described special majorities (as applicable), the holders of at least 25% of the voting rights of the company may apply to a court for approval of the merger. The court may approve the merger if it is found that the merger is fair and reasonable, taking into account the valuation of the parties to the merger and the consideration offered to the shareholders.
Upon the request of a creditor of either party to the proposed merger, a court may delay or prevent the merger if it concludes that there exists a reasonable concern that as a result of the merger, the surviving company will be unable to satisfy the obligations of any of the parties of the merger to their creditors.
A merger may not be completed unless at least 50 days have passed from the date that a proposal of the merger was filed with the Israeli Registrar of Companies by each merging company and 30 days from the date that shareholder approval of both merging companies was obtained. The merger proposal may be filed once a shareholder meeting has been called to approve the merger.
Modification of Rights Attached to Shares
The rights attached to any class of shares (unless otherwise provided by the terms of issue of such class), such as voting, dividends and the like, may be modified by the affirmative vote of a majority of the issued shares of the class at a general meeting of the holders of the shares of such class.
|
C.
|
Material Contracts
|
While we have numerous contracts with customers and distributors, we do not deem any individual contract to be a material contract that is not in the ordinary course of our business, except as set forth below:
In March 2015, the Peruvian government awarded Gilat Peru the FITEL Regional Projects which are expected to generate revenues of approximately $285 million in revenues over a period of approximately 11 years. The projects provide for the construction and operation of networks and their transfer to the government of Peru. In accordance with the bid conditions, we will establish a Peruvian subsidiary to enter into written agreements with the Peruvian government for each of the three regional projects that were awarded..
|
D.
|
Exchange Controls
|
There are no Israeli currency control restrictions on payments of dividends or other distributions with respect to our ordinary shares or the proceeds from the sale of the shares. However, legislation remains in effect pursuant to which currency controls can be imposed by administrative action at any time.
Non-residents of Israel who purchase our securities with non-Israeli currency will be able to repatriate dividends (if any), liquidation distributions and the proceeds of any sale of such securities, into non-Israeli currencies at the rate of exchange prevailing at the time of repatriation, provided that any applicable Israeli taxes have been paid (or withheld) on such amounts.
Neither our Articles of Association nor the laws of the State of Israel restrict in any way the ownership or voting of Ordinary Shares by non-residents of Israel, except with respect to citizens of countries that are in a state of war with Israel.
90
|
E.
|
Taxation
|
The following is a discussion of Israeli and U.S. tax consequences material to our shareholders. To the extent that the discussion is based on new tax legislation which has not been subject to judicial or administrative interpretation, the views expressed in the discussion might not be accepted by the tax authorities in question. The discussion is not intended, and should not be construed, as legal or professional tax advice and does not exhaust all possible tax considerations.
Holders of our ordinary shares should consult their own tax advisors as to the U.S., Israeli or other tax consequences of the purchase, ownership and disposition of ordinary shares, including, in particular, the effect of any foreign, state or local taxes.
ISRAELI TAX CONSIDERATIONS
The following is a summary of certain Israeli income tax and capital gains tax consequences for non-Israeli residents as well as Israeli residents holding our ordinary shares. The summary is based on provisions of the Israeli Income Tax Ordinance (new version), 1961 and regulations promulgated thereunder, as well as on administrative and judicial interpretations, all as currently in effect, and all of which are subject to change (possibly with retroactive effect) and to differing interpretations. There might be changes in the tax rates and in the circumstances in which they apply, and other modifications which might change the tax consequences to you. The summary is intended for general purposes only, and does not relate to all relevant tax aspects. The discussion is not intended and should not be construed as legal or professional tax advice sufficient for decision making. This summary does not discuss all aspects of Israeli income and capital gain taxation that may be applicable to investors in light of their particular circumstances or to investors who are subject to special status or treatment under Israeli tax law.
FOR THE FOREGOING AND OTHER REASONS, YOU ARE URGED TO CONSULT YOUR OWN TAX ADVISOR REGARDING THE TAX CONSEQUENCES OF YOUR HOLDINGS. WE ARE NOT MAKING ANY REPRESENTATIONS REGARDING THE PARTICULAR TAX CONSEQUENCES AS TO ANY HOLDER, NOR ARE WE OR OUR ADVISORS RENDERING ANY FORM OF LEGAL OPINION OR PROFESSIONAL TAX ADVICE AS TO SUCH TAX CONSEQUENCES.
Generally, income of Israeli companies is subject to corporate tax. The Israeli corporate tax rate was 25% in 2012 and 2013, and was increased to 26.5% in 2014 and onwards.
Israeli Tax Consequences of Holding Our Stock
Non-Israeli residents
Non-Israeli residents are subject to tax on income accrued or derived from Israeli sources. These include, inter alia, dividends, royalties and interest, as well as other types of income (e.g., from provision of services in Israel). We are required to withhold income tax on any such payments we make to non-residents. Israel presently has no estate or gift tax.
Capital Gains
Israeli law generally imposes tax on capital gains derived from the sale of securities and other Israeli capital assets, including shares in Israeli resident companies, unless a specific exemption is available or a treaty between Israel and the country of the non-resident provides otherwise. Capital gains from sales of our ordinary shares will be tax exempt for non-Israeli residents provided certain conditions are met (one of these conditions is that the gains are not derived through a permanent establishment that the non-resident maintains in Israel).
Subject to the exemptions provided by the Israeli law, as described above, pursuant to the tax treaty between Israel and the U.S., or the Treaty, U.S. residents are generally exempt from Israeli capital gains tax on capital gain derived from the sale of our shares. This exemption does not apply to U.S. residents holding (at the time of the sale or in the preceding 12 months) 10% or more of the voting power in the Company.
91
Dividends
The statutory withholding tax rate for dividends distributed by an Israeli company to non-resident shareholders is generally 25%. The rate is reduced to 15% for dividends distributed out of income generated by an Approved Enterprise. A different withholding tax rate may apply as a result of a tax treaty between Israel and shareholder's country of residence.
Under the Treaty, the maximum Israeli tax rate on dividends paid to a corporate holder of our ordinary shares who is a U.S. resident is 25%. However, dividends paid to a U.S. corporation holding at least 10% of our voting power in the year of the sale and in the entire preceding tax year shall be subject to a 15% tax withholding rate, if the dividend is generated by an Approved Enterprise or 12.5% if the dividends are not generated by an Approved Enterprise.
Interest
Interest paid by us (e.g., on our convertible notes) is treated as income derived from an Israeli source and is subject to Israeli tax. Generally, interest payments are subject to withholding of a standard tax rate of 25% (the rate may be reduced to 15% for certain debt instruments), unless reduced pursuant to an applicable tax treaty. In some instances (e.g., where the recipient of the interest is an individual holding 10% or more of our shares or voting rights) a higher tax rate would apply.
Filing of Tax Returns in Israel
Non-Israeli residents who receive interest, dividend or royalty income derived or accrued in Israel, from which Israeli tax was withheld, are generally exempt from Israeli tax filing obligations, provided that: (i) such income was not derived from a business conducted in Israel, and (ii) the taxpayer has no other taxable sources of income in Israel with respect to which a tax return is required to be filed.
Israeli Residents
Capital Gains
Israeli law imposes capital gains tax on capital gains derived from the sale of securities and other capital assets, including ordinary shares. Generally, gains from sale of ordinary shares acquired prior to January 1, 2012 are subject to a 20% capital gains tax for individuals. The tax rate is increased to 25% for sale of shares by an individual shareholder holding 10% or more of the shares or voting power in the company (i.e., a substantial shareholder). Corporate shareholders are subject to a 25% capital gains tax rate.
Following enactment of the Tax Burden Law, starting January 1, 2012, the capital gains tax rate applicable to individuals upon the sale of our shares is such individual's marginal (income) tax rate but not more than 25% (or 30% with respect to a substantial shareholder). With respect to corporate investors, the rate of capital gains tax imposed on the sale of shares is equal to the corporate tax rate, which is 25% in 2012 and 2013 and 26.5% from January 1, 2014.
Individual shareholders dealing with securities in Israel are taxed at their marginal tax rates applicable to business income (up to 48% in 2013 and 2014).
Furthermore, beginning on January 1, 2013, an additional tax liability at the rate of 2% was added to the applicable tax rate on the annual taxable income of the individuals (whether any such individual is an Israeli resident or non-Israeli resident) exceeding NIS 811,560 (in 2013 and 2014) (hereinafter, “Excess Tax”).
92
Dividends
Distribution of dividend income, other than bonus shares (stock dividends), to Israeli residents holding our ordinary shares is generally subject to income tax at a rate of 25% for individuals and 30% for a substantial individual shareholder. Israeli resident corporations are exempt from income tax on dividends, provided the dividend was paid out of income generated in Israel.
Generally, dividends distributed from taxable income accrued during the period of benefits of a Benefitted Enterprise, are taxable at the rate of 15%, if the dividend is distributed during the tax benefit period, or within an additional 12 years after the lapse of that period.
Interest
Interest income is generally subject to a tax rate of up to 25% for individuals. The rate applicable to an individual who is substantial shareholder is the marginal tax rate. The rate may be reduced to 15% for certain debt instruments. Interest paid to Israeli companies is taxed at the standard corporate income tax rate applicable to companies. We may be required to withhold tax on interest payments up to the applicable corporate tax rate for companies, and in certain instances up to the marginal tax rate for individuals.
Tax Benefits under the Law for the Encouragement of Capital Investments, 1959
Tax benefits prior to the Amendment of 2005
The Investment Law provides that a capital investment in eligible facilities may, upon application to the Investment Center of the Ministry of Industry, Trade and Labor of the State of Israel, be designated as an Approved Enterprise.
An Approved Enterprise is eligible for tax benefits on taxable income derived from its approved enterprise programs. We have been granted “Approved Enterprise” status under the Investment Law for nine investment programs.
Tax benefits under the 2005 Amendment
On April 1, 2005, a comprehensive amendment to the Investment Law came into effect, (the "Amendment"). The Amendment includes revisions to the criteria for investments qualified to receive tax benefits as an Approved Enterprise. The Amendment applies to new investment programs and investment programs commencing after 2004, and does not apply to investment programs approved prior to December 31, 2004.
As a result of the Amendment, it is no longer necessary for a company to apply to the Investment Center in order to acquire Approved Enterprise status. Instead, a company whose facilities meet the criteria for tax benefits set out by the Amendment, may receive the tax benefits afforded to a “Benefitted Enterprise” by independently selecting the tax year from which the period of benefits under the Investment Law are to commence and notifying the Israeli Tax Authority within 12 months of the end of that year.
Generally, tax benefits under the Amendment are available to production facilities (or other eligible facilities), that derive more than 25% of their business income from exports. In order to receive the tax benefits, the company must make a certain minimum investment in the acquisition of manufacturing assets such as machinery and equipment. Such investment may be made over a period of no more than three years ending at the end of the year in which the company requested to have the tax benefits apply to its Benefitted Enterprise.
We were eligible under the terms of minimum qualification investment and elected the years 2005 and 2011 to have the tax benefits apply.
93
Tax benefits are available until the earlier of: 7 or 10 years from the date that the period of benefits commenced, and the lapse of 12 years from the first day of the year in which the election was made. Our periods of benefits as a Benefitted Enterprise will expire in 2017 and in 2023.
The tax benefits include exemption from corporate tax on undistributed income for a period of two to ten years, depending on the geographic location of the Benefitted Enterprise within Israel, and a reduced corporate tax rate of 10% to 25% for the remainder of the benefits period, depending on the level of foreign investment in the company. If the company pays a dividend out of income derived from the Benefited Enterprise during the tax exemption period, such income will be subject to corporate tax at the applicable rate (10%-25%) in respect of the grossed up amount of the dividend that we may distribute. We would be required to withhold tax at a rate of 15% from any dividends distributed from income derived from the Benefitted Enterprise.
Benefits
under
the 2011 Amendment
Under an amendment to the Investment Law effective January 1, 2011, upon an irrevocable election made by the company, a uniform corporate tax rate will apply to all qualifying income of the company, as opposed to the previous law's tax incentives that were limited to income only from Benefitted Enterprises during their benefits period. Under the amended law, the uniform tax rate was 10% in geographical areas in Israel designated as Development Zone A and 15% elsewhere in Israel during 2011-2012. The uniform tax rates were reduced to 7% and 12.5%, respectively to the mentioned geographic areas in 2013. The uniform tax rate for 2014 and onwards is set to 9% in areas in Israel designated as Development Zone A and 16% elsewhere in Israel.
The profits of these industrial companies will be freely distributable as dividends, subject to a 20% withholding tax (or lower, under an applicable tax treaty).
Under the transitory provisions of the January 1, 2011 legislation, we may opt whether to irrevocably implement the 2011 Amendment and waive benefits provided under the prior law or keep the prior benefits. This decision may be taken at any stage. We will consider in the future whether to opt for the benefits under the 2011 Amendment.
Israeli Transfer Pricing Regulations
Israeli transfer pricing legislation generally provides that all cross-border transactions carried out between related parties be conducted on an arm’s length basis and be taxed accordingly. The transfer pricing regulations are not expected to have a material effect on our company.
United States Federal Income Taxation
The following is a description of the material U.S. federal income tax consequences of the acquisition, ownership and disposition of our ordinary shares. This description addresses only the U.S. federal income tax considerations that are relevant to U.S. Holders (as defined below) who hold our ordinary shares as capital assets. This summary is based on the U.S. Internal Revenue Code of 1986, as amended, or the Code, Treasury regulations promulgated thereunder, judicial and administrative interpretations thereof, and the U.S.-Israel Tax Treaty, or the Treaty, all as in effect on the date hereof and all of which are subject to change either prospectively or retroactively. There can be no assurance that the U.S. Internal Revenue Service, or the IRS, will not take a different position concerning the tax consequences of the acquisition, ownership and disposition of our ordinary shares or that such a position would not be sustained. This description does not address all tax considerations that may be relevant with respect to an investment in our ordinary shares. This description does not account for the specific circumstances of any particular investor, such as:
|
|
·
|
broker-dealers;
|
|
|
·
|
financial institutions;
|
94
|
|
·
|
certain insurance companies;
|
|
|
·
|
investors liable for alternative minimum tax;
|
|
|
·
|
regulated investment companies or real estate investment trusts, regulated investment companies or grantor trusts;
|
|
|
·
|
dealers or traders in securities, commodities or currencies;
|
|
|
·
|
persons subject to the alternative minimum tax and tax-exempt organizations;
|
|
|
·
|
non-resident aliens of the United States or taxpayers whose functional currency is not the U.S. dollar;
|
|
|
·
|
persons who hold ordinary shares through partnerships or other pass-through entities;
|
|
|
·
|
persons who acquire their ordinary shares through the exercise or cancellation of employee stock options or otherwise as compensation for services;
|
|
|
·
|
direct, indirect or constructive owners of investors that actually or constructively own 10% or more of our shares by vote or value; or
|
|
|
·
|
investors holding ordinary shares as part of a straddle, appreciated financial position, a hedging transaction or conversion transaction
|
If a partnership or an entity treated as a partnership for U.S. federal income tax purposes owns our ordinary shares, the U.S. federal income tax treatment of a partner in such a partnership will generally depend upon the status of the partner and the activities of the partnership. A partnership that owns our ordinary shares and the partners in such partnership should consult their tax advisors about the U.S. federal income tax consequences of holding and disposing of ordinary shares.
This summary does not address the effect of any U.S. federal taxation (such as estate and gift tax) other than U.S. federal income taxation. In addition, this summary does not include any discussion of state, local or foreign taxation. You are urged to consult your tax advisors regarding the foreign and U.S. federal, state and local tax consequences of an investment in ordinary shares.
For purposes of this summary, a U.S. Holder is:
As used herein, the term “U.S. Holder” means a beneficial owner of an ordinary share who is, for U.S. federal income tax purposes:
|
|
·
|
an individual who is a citizen or, for U.S. federal income tax purposes, a resident of the United States;
|
|
|
·
|
a corporation or other entity taxable as a corporation created or organized in or under the laws of the United States or any political subdivision thereof;
|
|
|
·
|
an estate the income of which is subject to U.S. federal income taxation regardless of its source; or
|
|
|
·
|
a trust if such trust has validly elected to be treated as a U.S. person for U.S. federal income tax purposes or if (1) a court within the United States is able to exercise primary supervision over its administration and (2) one or more U.S. persons have the authority to control all of the substantial decisions of such trust.
|
Unless otherwise indicated, this discussion assumes that the Company is not, and will not become, a “passive foreign investment company”, or a PFIC, for U.S. federal income tax purposes. See
“—Passive Foreign Investment Companies
” below.
95
Taxation of Distributions
Subject to the discussion, below, under the heading
“—Passive Foreign Investment Companies
,” the gross amount of any distributions received with respect to our ordinary shares, including the amount of any Israeli taxes withheld therefrom, will constitute dividends for U.S. federal income tax purposes to the extent of our current and accumulated earnings and profits, as determined for U.S. federal income tax purposes. Because we do not expect to maintain calculations of our earnings and profits under U.S. federal income tax principles, it is expected that the entire amount of any distribution will generally be reported as dividend income to you. Dividends are included in gross income as ordinary income. Distributions in excess of our current and accumulated earnings and profits will be treated as a non-taxable return of capital to the extent of your tax basis in our ordinary shares and any amount in excess of your tax basis will be treated as gain from the sale of ordinary shares. See “
—Disposition of Ordinary Shares
” below for a discussion of the taxation of capital gains. Our dividends will not qualify for the dividends-received deduction generally available to corporations under section 243 of the Code.
Dividends that we pay in NIS, including the amount of any Israeli taxes withheld therefrom, will be included in your income in a U.S. dollar amount calculated by reference to the exchange rate in effect on the day such dividends are received, regardless of whether the payment is in fact converted into U.S. dollars. A U.S. Holder who receives payment in NIS and converts NIS into U.S. dollars at an exchange rate other than the rate in effect on such day may have a foreign currency exchange gain or loss that would be treated as U.S.-source ordinary income or loss. U.S. Holders should consult their own tax advisors concerning the U.S. tax consequences of acquiring, holding and disposing of NIS.
Subject to complex limitations, some of which vary depending upon the U.S. Holder’s circumstances, any Israeli withholding tax imposed on dividends paid with respect to our ordinary shares will be a foreign income tax eligible for credit against a U.S. Holder's U.S. federal income tax liability (or, alternatively, for deduction against income in determining such tax liability). The limitation on foreign income taxes eligible for credit is calculated separately with respect to specific classes of income. Dividends generally will be treated as foreign-source passive category income or, in the case of certain U.S. Holders, general category income for U.S. foreign tax credit purposes. Further, there are special rules for computing the foreign tax credit limitation of a taxpayer who receives dividends subject to a reduced tax rate (see discussion below). A U.S. Holder may be denied a foreign tax credit with respect to Israeli income tax withheld from dividends received on our ordinary shares if such U.S. Holder fails to satisfy certain minimum holding period requirements or to the extent such holder’s position in ordinary shares is hedged. The rules relating to the determination of the foreign tax credit are complex, and you should consult with your own tax advisors to determine whether and to what extent you would be entitled to this credit.
Subject to certain limitations (including the PFIC rules discussed below), “qualified dividend income” received by a non-corporate U.S. Holder will be subject to tax at the lower long-term capital gain rates (currently at 20%). Distributions taxable as dividends paid on our ordinary shares should qualify for a reduced rate provided that either: (i) we are entitled to benefits under the Treaty or (ii) our ordinary shares are readily tradable on an established securities market in the United States and certain other requirements are met. We believe that we are entitled to benefits under the Treaty and that our ordinary shares currently are readily tradable on an established securities market in the United States. However, no assurance can be given that our ordinary shares will remain readily tradable. The rate reduction does not apply unless certain holding period requirements are satisfied, nor does it apply to dividends received from a passive foreign investment company (see discussion below) or in respect of certain risk-reduction transactions or in certain other situations. The legislation enacting the reduced tax rate on qualified dividend income contains special rules for computing the foreign tax credit limitation of a taxpayer who receives dividends subject to the reduced tax rate. U.S. Holders of our ordinary shares should consult their own tax advisors regarding the effect of these rules in their particular circumstances.
96
Sale or Disposition of Ordinary Shares
Subject to the discussion of PFIC rules below, if you sell or otherwise dispose of our ordinary shares, you will generally recognize gain or loss for U.S. federal income tax purposes in an amount equal to the difference between the amount realized on the sale or other disposition and your adjusted tax basis in our ordinary shares, in each case determined in U.S. dollars. Such gain or loss will generally be capital gain or loss and will be long-term capital gain or loss if you have held the ordinary shares for more than one year at the time of the sale or other disposition. Long-term capital gain realized by a non-corporate U.S. Holder is generally eligible for a preferential tax rate (currently at 20%). In general, any gain that you recognize on the sale or other disposition of ordinary shares will be U.S.-source for purposes of the foreign tax credit limitation; losses will generally be allocated against U.S. source income. Deduction of capital losses is subject to certain limitations under the Code.
In the case of a cash basis U.S. Holder who receives NIS in connection with the sale or disposition of our ordinary shares, the amount realized will be based on the U.S. dollar value of the NIS received with respect to the ordinary shares as determined on the settlement date of such exchange. A cash basis U.S. Holder who receives payment in NIS and converts NIS into U.S. dollars at a conversion rate other than the rate in effect on the settlement date may have a foreign currency exchange gain or loss, which would be treated as ordinary income or loss.
An accrual basis U.S. Holder may elect the same treatment required of cash basis taxpayers with respect to a sale or disposition of our ordinary shares that are traded on an established securities market, provided that the election is applied consistently from year to year. Such election may not be changed without the consent of the IRS. In the event that an accrual basis U.S. Holder does not elect to be treated as a cash basis taxpayer (pursuant to the Treasury regulations applicable to foreign currency transactions), such U.S. Holder may have a foreign currency gain or loss for U.S. federal income tax purposes because of differences between the U.S. dollar value of the currency received prevailing on the trade date and the settlement date. Any such currency gain or loss would be treated as ordinary income or loss and would be in addition to the gain or loss, if any, recognized by such U.S. Holder on the sale or disposition of such ordinary shares.
Any foreign currency gain or loss a U.S. Holder realizes will be U.S. source ordinary income or loss.
Passive Foreign Investment Companies
If we were to be classified as a ‘‘passive foreign investment company’’, or a PFIC, in any taxable year, a U.S. Holder would be subject to special rules generally intended to reduce or eliminate any benefits from the deferral of U.S. federal income tax that a U.S. Holder could otherwise derive from investing in a non-U.S. company that does not distribute all of its earnings on a current basis. We will be considered a PFIC, for any taxable year in which either (i) 75% or more of our gross income is passive income, or (ii) at least 50% of the average value of all of our assets for the taxable year produce or are held for the production of passive income. For this purpose, passive income generally includes dividends, interest, royalties, rents, annuities and the excess of gains over losses from the disposition of assets that produce passive income. Included in the calculation of our income and assets is our proportionate share of the income and assets of each corporation in which we own, directly or indirectly, at least a 25% interest, by value. If we were determined to be a PFIC for U.S. federal income tax purposes, unfavorable and highly complex rules would apply to U.S. Holders owning ordinary shares directly or indirectly. Accordingly, you are urged to consult your own tax advisors regarding the application of such rules.
Based on our current and projected income, assets and activities, we believe that we are not currently a PFIC, nor do we expect to become a PFIC in the foreseeable future. However, because the determination of whether we are a PFIC is based upon the composition of our income and assets from time to time, there can be no assurance that we will not become a PFIC for any future taxable year. In particular, in determining the average quarterly value of our gross assets, the aggregate value of our assets will generally be deemed to be equal to the sum of the aggregate value of our outstanding shares (our “market capitalization”) plus our liabilities. We intend to take the position that the excess of our market capitalization plus liabilities over the book value of our assets may generally be treated as non-passive assets to the extent of our non-passive activities. Accordingly, we may become a PFIC if our market capitalization were to decrease significantly while we hold substantial cash.
97
If we are treated as a PFIC for any taxable year, dividends would not qualify for the reduced tax rate on qualified dividend
income, discussed above, and, unless you elect either
"mark-to
-market" your ordinary shares, as described below,
|
|
·
|
you would be required to allocate income recognized upon receiving certain dividends or gain recognized upon the disposition of ordinary shares ratably over your holding period for such ordinary shares,
|
|
|
·
|
the amount allocated to the current taxable year, and to any taxable years in your holding period prior to the first day in which we were treated as a PFIC will be treated as ordinary income, and
|
|
|
·
|
the amount allocated to each prior taxable year during which we are considered a PFIC would be subject to tax at the highest individual or corporate tax rate, as the case may be, and an interest charge would be imposed with respect to the resulting tax liability allocated to each such year.
|
If we were a PFIC for any taxable year during which a U.S. Holder holds our ordinary shares and any of our non-U.S. subsidiaries is also a PFIC, such U.S. Holder would generally be treated as owning a proportionate amount (by value) of the underlying shares of each such non-U.S. subsidiary classified as a PFIC for purposes of the application of these rules. U.S. Holders are urged to consult their tax advisers regarding the application of the PFIC rules to any of our subsidiaries.
If we are a PFIC for any taxable year during which a U.S. Holder holds our ordinary shares, then in lieu of being subject to the tax and interest charge rules discussed above, a U.S. Holder may make an election to include gain on the stock of a PFIC as ordinary income under a mark-to-market method, provided that such ordinary shares are “regularly traded” on a “qualified exchange.” In general, our ordinary shares will be treated as “regularly traded” for a given calendar year if more than a de minimis quantity of our ordinary shares is traded on a qualified exchange on at least 15 days during each calendar quarter of such calendar year. Our ordinary shares are listed on the Tel Aviv Stock Exchange and the NASDAQ. However, no assurance can be given that our ordinary shares will be regularly traded for purposes of the mark-to-market election. In addition, because a mark-to-market election cannot be made for any lower-tier PFICs that we may own, a U.S. Holder may continue to be subject to the PFIC rules with respect to such holder’s indirect interest in any investments held by us that are treated as an equity interest in a PFIC for U.S. federal income tax purposes.
If the ordinary shares are considered "marketable stock" and if you elect to mark to market your ordinary shares, you will generally include in income, in each year in which we are considered a PFIC, any excess of the fair market value of your ordinary shares at the close of each tax year over your adjusted basis in the ordinary shares. If the fair market value of the ordinary shares had depreciated below your adjusted basis at the close of the tax year, you may generally deduct the excess of the adjusted basis of the ordinary shares over its fair market value at that time. However, such deductions would generally be limited to the net mark-to-market gains, if any, that you included in income with respect to such ordinary shares in prior years. A U.S. Holder’s adjusted tax basis in the ordinary shares will be increased by the amount of any income inclusion and decreased by the amount of any deductions under the mark-to-market rules. Income recognized and deductions allowed under the mark-to-market provisions, as well as any gain or loss on the disposition of ordinary shares with respect to which the mark-to-market election is made in a year in which we are classified as a PFIC, is treated as ordinary income or loss (except that loss on a disposition of ordinary shares is treated as capital loss to the extent the loss exceeds the net mark-to-market gains, if any, that you included in income with respect to such ordinary shares in prior years). Gain or loss from the disposition of ordinary shares (as to which a mark-to-market election was made) in a year in which we are no longer classified as a PFIC, will be capital gain or loss.
98
If a U.S. Holder owns our ordinary shares during any year in which we are a PFIC, the U.S. Holder generally must file an IRS Form 8621 with respect to the company, generally with the U.S. Holder’s federal income tax return for that year. U.S. Holders should consult their tax advisers regarding whether we are a PFIC and the potential application of the PFIC rules.
Additional Tax on Investment Income
In addition to the income taxes described above, U.S. Holders that are individuals, estates or trusts and whose income exceeds certain thresholds will be subject to a 3.8% Medicare contribution tax on net investment income, which includes dividends and capital gains from the sale or exchange of our ordinary shares.
Backup Withholding and Information Reporting
Payments in respect of our ordinary shares may be subject to information reporting to the IRS and to U.S. backup withholding tax at the rate (currently) of 28%. Backup withholding will not apply, however, if you (i) are a corporation, or fall within certain exempt categories, and demonstrate the fact when so required, or (ii) furnish a correct taxpayer identification number and make any other required certification.
Backup withholding is not an additional tax. Amounts withheld under the backup withholding rules may be credited against a U.S. Holder’s U.S. tax liability. A U.S. Holder may obtain a refund of any excess amounts withheld under the backup withholding rules by filing the appropriate claim for refund with the IRS.
U.S. individuals that hold certain specified foreign financial assets, including stock in a foreign corporation, with values in excess of certain thresholds, are required to file with their U.S. federal income tax return Form 8938, on which information about the assets, including their value, is provided. Taxpayers who fail to file the form when required are subject to penalties. An exemption from reporting applies to foreign assets held through a financial institution. Investors are encouraged to consult with their own tax advisors regarding the possible application of this disclosure requirement to their investment in our ordinary shares.
The above description is not intended to constitute a complete analysis of all tax consequences relating to acquisition, ownership and disposition of our ordinary shares. You should consult your tax advisor concerning the tax consequences of your particular situation.
|
F.
|
Dividend and Paying Agents
|
Not applicable.
|
G.
|
Statement by Experts
|
Not applicable.
|
H.
|
Documents on Display
|
We are subject to certain of the reporting requirements of the Securities and Exchange Act of 1934, as amended, or the Exchange Act, as applicable to “foreign private issuers” as defined in Rule 3b-4 under the Exchange Act. As a foreign private issuer, we are exempt from certain provisions of the Exchange Act. Accordingly, our proxy solicitations are not subject to the disclosure and procedural requirements of Regulation 14A under the Exchange Act, and transactions in our equity securities by our officers and directors are exempt from reporting and the “short-swing” profit recovery provisions contained in Section 16 of the Exchange Act. In addition, we are not required under the Exchange Act to file periodic reports and financial statements as frequently or as promptly as U.S. companies whose securities are registered under the Exchange Act. However, we file with the Securities and Exchange Commission an annual report on Form 20-F containing financial statements audited by an independent accounting firm. We also submit to the Securities and Exchange Commission reports on Form 6-K containing (among other things) press releases and unaudited financial information. We post our annual report on Form 20-F on our website (
http://www.gilat.com
) promptly following the filing of our annual report with the Securities and Exchange Commission. The information on our website is not incorporated by reference into this annual report.
99
This annual report and the exhibits thereto and any other document we file pursuant to the Exchange Act may be inspected without charge and copied at prescribed rates at the Securities and Exchange Commission public reference room at 100 F Street, N.E., Room 1580, Washington, D.C. 20549. You may obtain information on the operation of the Securities and Exchange Commission’s public reference room in Washington, D.C. by calling the Securities and Exchange Commission at 1-800-SEC-0330. The Exchange Act file number for our Securities and Exchange Commission filings is 000-21218.
The Securities and Exchange Commission maintains a website at
www.sec.gov
that contains reports, proxy and information statements, and other information regarding registrants that make electronic filings with the Securities and Exchange Commission using its EDGAR (Electronic Data Gathering, Analysis, and Retrieval) system.
The documents concerning our company that are referred to in this annual report may also be inspected at our offices located at
Gilat House, 21 Yegia Kapayim Street, Kiryat Arye, Petah Tikva, 4913020 Israel.
|
I.
|
Subsidiary Information
|
Not applicable.
Foreign Currency Risk
A significant portion of our revenues are generated in U.S. dollars or linked to the dollar. In addition, a substantial portion of our costs are incurred in U.S. dollars. We believe that the U.S. dollar is the primary currency of the economic environment in which our Company and certain of our subsidiaries operate. Thus, the functional and reporting currency of our Company and certain of our subsidiaries is the U.S. dollar.
Accordingly, monetary accounts maintained in currencies other than the U.S. dollar are remeasured into U.S. dollars in accordance with ASC 830, "Foreign Currency Matters" ("ASC 830"). All transaction gains and losses of the remeasurement of monetary balance sheet items are reflected in the consolidated statements of operations as financial income or expenses, as appropriate.
The financial statements of some of our foreign subsidiaries, whose functional currency has been determined to be their local currency, have been translated into U.S. dollars. Assets and liabilities
have been translated using the exchange rates in effect at the balance sheet date. Statements of operations amounts have been translated using specific rates. The resulting translation adjustments are reported as a component of equity in accumulated other comprehensive income (loss).
While the a significant portion of our revenues and expenses are generated in U.S. dollars, a portion of our expenses are denominated in NIS, and to a lesser extent, other non-U.S. dollar currencies which lead us to be exposed to financial market risk associated with changes in foreign currency exchange rates. In order to reduce the impact of foreign currency rate volatility of future cash flows caused by changes in foreign exchange rates, we use currency forward contracts. If our currency forward contracts meet the definition of a hedge, and are so designated, changes in the fair value of the contracts will be offset against changes in the fair value of the hedged assets or liabilities through earnings. For derivative instruments not designated as hedging instruments, the gain or loss is recognized in current earnings during the period of change. Our hedging reduces, but does not eliminate, the impact of foreign currency rate movements, and due to such movements the results of our operations may be adversely affected.
100
During the year ended December 31, 2014, we recognized a net loss of $1 million related to the effective portion of our hedging instruments. The effective portion of the hedged instruments was included as an offset to payroll expenses and other operating expenses in the statement of operations. The ineffective portion of the hedged instrument during the year ended December 31, 2014 was immaterial and was recorded as a financial income.
During 2014 we entered into additional forward contracts in order to hedge the exposure to variability in expected future cash flows resulting from changes in related foreign currency exchange rates. These contracts did not meet the requirement for hedge accounting. The amount recorded as financial income related to these contracts in 2014 was $1.9 million.
As of December 31, 2014, the fair value of the liabilities of the outstanding forward contracts that met the requirement for hedge accounting was $0.8 million and the fair value of the liabilities of the outstanding forward contracts that did not meet the requirement for hedge accounting was $ 1.9 million.
The table below details our balance sheet exposure by currency and interest rates:
|
Expected Maturity Dates
|
||||||||||||||||||||
|
2015
|
2016
|
2017
|
2018
|
2019 and thereafter
|
||||||||||||||||
|
(In thousands)
|
||||||||||||||||||||
|
Assets:
|
||||||||||||||||||||
|
Restricted cash - in U.S. dollars
|
21,204 | - | - | - | - | |||||||||||||||
|
Weighted interest rate
|
0.41 | % | - | - | - | - | ||||||||||||||
|
In other currency
|
4,780 | - | - | - | 215 | |||||||||||||||
|
Weighted interest rate
|
0.31 | % | - | - | - | 7.78 | % | |||||||||||||
|
Restricted cash held by Trustees
In other currency
|
15,441 | |||||||||||||||||||
|
Weighted interest rate
|
0.30 | % | ||||||||||||||||||
|
Liabilities:
|
||||||||||||||||||||
|
Long-term loans (including current maturities)
|
||||||||||||||||||||
|
In U.S. dollars
|
4,000 | 4,000 | 4,000 | 4,000 | 12,000 | |||||||||||||||
|
Weighted interest rate
|
4.77 | % | 4.77 | % | 4.77 | % | 4.77 | % | 4.77 | % | ||||||||||
|
In other currency
|
595 | 604 | 592 | 486 | 589 | |||||||||||||||
|
Weighted interest rate
|
3.75 | % | 3.81 | % | 3.73 | % | 2.82 | % | 2.82 | % | ||||||||||
Not applicable.
101
None
Not applicable.
Disclosure Controls and Procedures
Our chief executive officer and chief financial officer, after evaluating the effectiveness of our disclosure controls and procedures (as defined in Rule 13a-15(e) of the Securities Exchange Act of 1934, as amended) as of December 31, 2014, have concluded that, as of such date, our disclosure controls and procedures were effective and ensured that information required to be disclosed by us in reports that we file or submit under the Securities Exchange Act is accumulated and communicated to our management, including our chief executive officer and chief financial officer, to allow timely decisions regarding required disclosure and is recorded, processed, summarized and reported within the time periods specified by the rules of the Securities and Exchange Commission.
Management's Annual Report on Internal Control over Financial Reporting
Our management is responsible for establishing and maintaining adequate internal control over our financial reporting. Internal control over financial reporting is defined in Rule 13a-15(f) or 15d-15(f) promulgated under the Securities Exchange Act of 1934 as a process designed by, or under the supervision of, the company’s principal executive and principal financial officers and effected by the company’s board of directors, management and other personnel, to provide reasonable assurance regarding the reliability of financial reporting and the preparation of financial statements for external purposes in accordance with generally accepted accounting principles and includes those policies and procedures that:
|
|
·
|
Pertain to the maintenance of records that in reasonable detail accurately and fairly reflect the transaction and dispositions of the assets of the company;
|
|
|
·
|
Provide reasonable assurance that transactions are recorded as necessary to permit preparation of financial statements in accordance with generally accepted accounting principles, and that receipts and expenditures of the company are being made only in accordance with authorizations of management and directors of the company; and
|
|
|
·
|
Provide reasonable assurance regarding prevention or timely detection of unauthorized acquisition, use of disposition of the company’s assets that could have a material effect on the financial statements.
|
Because of its inherent limitations, internal control over financial reporting may not prevent or detect misstatements. Projections of any evaluation of effectiveness to future periods are subject to the risk that controls may become inadequate because of changes in conditions, or that the degree of compliance with the policies or procedures may deteriorate.
Our management assessed the effectiveness of our internal control over financial reporting, as of December 31, 2014. In making this assessment, our management used the criteria set forth by the Committee of Sponsoring Organizations of the Treadway Commission (COSO) in Internal Control-Integrated Framework. Based on that assessment, our management concluded that as of December 31, 2014, our internal control over financial reporting is effective.
The effectiveness of management’s internal control over financial reporting as of December 31, 2014 has been audited by our company’s independent registered public accountants, Kost Forer Gabbay & Kasierer, a member of Ernst & Young Global, and their report below expresses an unqualified opinion on our company’s internal control over financial reporting
102
REPORT OF INDEPENDENT REGISTERED PUBLIC ACCOUNTING FIRM
To the Board of Directors and Shareholders of
GILAT SATELLITE NETWORKS LTD.
We have audited Gilat Satellite Networks Ltd.'s ("Gilat") internal control over financial reporting as of December 31, 2014, based on criteria established in Internal Control-Integrated Framework issued by the Committee of Sponsoring Organizations of the Treadway Commission (2013 framework) (the "COSO criteria"). Gilat's management is responsible for maintaining effective internal control over financial reporting, and for its assessment of the effectiveness of internal control over financial reporting included in the accompanying management's report on internal control over financial reporting. Our responsibility is to express an opinion on the Company's internal control over financial reporting based on our audit.
We conducted our audit in accordance with the standards of the Public Company Accounting Oversight Board (United States). Those standards require that we plan and perform the audit to obtain reasonable assurance about whether effective internal control over financial reporting was maintained in all material respects. Our audit included obtaining an understanding of internal control over financial reporting, assessing the risk that a material weakness exists, testing and evaluating the design and operating effectiveness of internal control based on the assessed risk, and performing such other procedures as we considered necessary in the circumstances. We believe that our audit provides a reasonable basis for our opinion.
A company’s internal control over financial reporting is a process designed to provide reasonable assurance regarding the reliability of financial reporting and the preparation of financial statements for external purposes in accordance with generally accepted accounting principles. A company’s internal control over financial reporting includes those policies and procedures that (1) pertain to the maintenance of records that, in reasonable detail, accurately and fairly reflect the transactions and dispositions of the assets of the company; (2) provide reasonable assurance that transactions are recorded as necessary to permit preparation of financial statements in accordance with generally accepted accounting principles, and that receipts and expenditures of the company are being made only in accordance with authorizations of management and directors of the company; and (3) provide reasonable assurance regarding prevention or timely detection of unauthorized acquisition, use, or disposition of the company’s assets that could have a material effect on the financial statements.
Because of its inherent limitations, internal control over financial reporting may not prevent or detect misstatements. Also, projections of any evaluation of effectiveness to future periods are subject to the risk that controls may become inadequate because of changes in conditions, or that the degree of compliance with the policies or procedures may deteriorate.
In our opinion, Gilat maintained, in all material respects, effective internal control over financial reporting as of December 31, 2014, based on the COSO criteria.
We also have audited, in accordance with the standards of the Public Company Accounting Oversight Board (United States), the consolidated balance sheets of Gilat and its subsidiaries as of December 31, 2014 and 2013, and the related consolidated statements of operations and comprehensive income, changes in equity and cash flows for each of the three years in the period ended December 31, 2014, and our report dated April 1, 2015, expressed an unqualified opinion thereon.
|
Tel-Aviv, Israel
|
KOST FORER GABBAY & KASIERER
|
|
April 1, 2015
|
A Member of Ernst & Young Global
|
103
Changes in Internal Control over Financial Reporting
During the period covered by this Annual Report on Form 20-F, no changes in our internal control over financial reporting have occurred that materially affected, or are reasonably likely to materially affect, our internal control over financial reporting.
Our Board of Directors has determined that each of Ms. Cohen and Dr. Lieber meets the definition of an audit committee financial expert as defined by rules of the Securities and Exchange Commission. Our Board also determined that each of Ms. Cohen and Dr. Lieber is independent under the requirements of the NASDAQ Marketplace Rules. For a brief listing of Ms. Cohen and Dr. Lieber’s relevant experience, see Item 6.A. “Directors, Senior Management and Employees - Directors and Senior Management.”
We have adopted a Code of Ethics for executive and financial officers that also applies to all of our employees. The Code of Ethics is publicly available on our website at www.gilat.com. Written copies are available upon request. If we make any substantive amendments to the Code of Ethics or grant any waivers, including any implicit waiver, from a provision of this code to our chief executive officer, chief financial officer or corporate controller, we will disclose the nature of such amendment or waiver on our website. Our Code of Ethics includes a whistleblower policy which provides an anonymous means for employees and others to communicate with various bodies within our company, including our Audit Committee.
Fees Billed by Independent Auditors
The following table sets forth, for each of the years indicated, the fees billed to us by our independent auditors and the percentage of each of the fees out of the total amount paid to the auditors.
|
Year Ended December 31,
|
||||||||||||||||
|
|
2014
|
2013
|
||||||||||||||
|
Services Rendered
|
Fees
|
Percentages
|
Fees
|
Percentages
|
||||||||||||
|
Audit fees (1)
|
$ | 810,677 | 94.25 | % | $ | 831,604 | 83.96 | % | ||||||||
|
Tax fees (2)
|
$ | 32,841 | 3.82 | % | $ | 144,638 | 14.60 | % | ||||||||
|
Other (3)
|
$ | 16,639 | 1.93 | % | $ | 14,233 | 1.44 | % | ||||||||
|
Total
|
$ | 860,157 | 100 | % | $ | 990,475 | 100 | % | ||||||||
|
(1)
|
Audit fees are fees for audit services for each of the years shown in this table, including fees associated with the annual audit, services provided in connection with audit of our internal control over financial reporting and audit services provided in connection with other statutory or regulatory filings.
|
|
(2)
|
Tax fees are fees for professional services rendered by our auditors for tax compliance, tax planning and tax advice on actual or contemplated transactions.
|
|
(3)
|
Other fees are fees for professional services other than audit or tax related fees, rendered in connection with our business activities; such fees in 2014 were mainly related to certain certifications to government authorities and in 2013 to review of the implementation of a new accounting system.
|
104
Policies and Procedures
Our Audit Committee has adopted a policy and procedures for the approval of audit and non-audit services rendered by our principal accountants, Kost Forer Gabbay & Kasierer, a Member of Ernst & Young Global and other members of Ernst & Young Global. The policy generally requires the Audit Committee’s approval of the scope of the engagement of our principal accountants
or on an individual engagement basis. The policy prohibits retention of our principal accountants
to perform the prohibited non-audit functions defined in Section 201 of the Sarbanes-Oxley Act of 2002 or the rules of the SEC, and also considers whether proposed services are compatible with the independence of the public auditors.
Not applicable.
In the year ended December 31, 2014, neither we nor any affiliated purchaser purchased any of our securities.
None.
Under NASDAQ Marketplace Rule 5615(a)(3) or Rule 5615(a)(3), foreign private issuers, such as our company, are permitted to follow certain home country corporate governance practices in lieu of certain requirements of Listing Rule 5600 Series, with the exception of those rules which are required to be followed pursuant to the provisions of Listing Rule 5615(a)(3).
We have elected to follow Israeli law and practice instead of the requirements of Listing Rule 5600 Series, as described below:
|
|
·
|
The requirement to obtain shareholder approval for the establishment or material amendment of certain equity based compensation plans and arrangements, under which shares may be acquired by officers, directors, employees or consultants. Under Israeli law and practice, the approval of the board of directors is required for the establishment or material amendment of such equity based compensation plans and arrangements. However, any equity based compensation arrangement with a director or the Chief Executive Officer or the material amendment of such an arrangement must be approved by our Compensation and Stock Option Committee, Board of Directors and shareholders, in that order
|
105
|
|
·
|
The requirements regarding the director nominations process. We do not have a nomination committee. Under Israeli law and practice, our Board of Directors is authorized to recommend to our shareholders director nominees for election, and
certain of our shareholders
may nominate candidates for election as directors by the general meeting of shareholders.
|
Not applicable.
Not applicable.
The financial statements required by this item are found at the end of this annual report, beginning on page F-1.
|
1.1
|
Memorandum of Association, as amended. Previously filed as Exhibit 1.1 to our Annual Report on Form 20-F for the fiscal year ending December 31, 2000, which Exhibit is incorporated herein by reference.
|
|
1.2
|
Articles of Association, as amended and restated as of December 29, 2011. Previously filed as Exhibit 1.2 to our Annual Report on Form 20-F for the fiscal year ending December 31, 2011, which Exhibit is incorporated herein by reference.
|
|
4.1
|
Summary of material provisions of the loan documents between Gilat Satellite Networks Ltd. and First International Bank of Israel, dated December 14, 2010. Previously filed as Exhibit 4.4 to our Annual Report on Form 20-F for the fiscal year ending December 31, 2010, which Exhibit is incorporated herein by reference.
|
|
4.2
|
Summary of material provisions of an amendment dated
February 7, 2013
to the loan documents between Gilat Satellite Networks Ltd. and First International Bank of Israel, dated December 14, 2010. Previously filed as Exhibit 4.5 to our Annual Report on Form 20-F for the fiscal year ending December 31, 2012, which Exhibit is incorporated herein by reference
|
|
4.3
|
Gilat Satellite Networks Ltd. 2008 Share Incentive Plan (including the Israeli Sub-plan to the Gilat Satellite Networks Ltd. 2008 Share Incentive Plan), previously filed on April 8, 2009 as Exhibit 4.4 to the our Registration Statement on Form S-8 (File No. 333-158476), and incorporated herein by reference.
|
|
4.4
|
Gilat Satellite Networks Ltd. 2005 Share Incentive Plan (including the Israeli Sub-plan to the Gilat Satellite Networks Ltd. 2005 Share Incentive Plan), previously filed on April 8, 2009 as Exhibit 4.3 to our Registration Statement on Form S-8 (File No. 333-158476), and incorporated herein by reference.
|
|
4.5
|
Gilat Satellite Networks Ltd. 2003 Stock Option Plan (including the Gilat Satellite Networks Ltd. Section 102 Employee Stock Option Plan (2003), previously filed on March 25, 2004 as Exhibit 4.3 to our Registration Statement on Form S-8 (File No. 333-113932), and incorporated herein by reference.
|
|
4.6
|
Executive Compensation Plan previously filed as Exhibit A to the proxy statement filed on Form 6-K on August 7, 2013, which Exhibit is incorporated herein by reference.
|
106
|
8.1
|
List of subsidiaries.
|
|
12.1
|
Certification of Chief Executive Officer pursuant to Rule 13a-14(a) under the Securities Exchange Act of 1934, as amended.
|
|
12.2
|
Certification of Chief Financial Officer pursuant to Rule 13a-14(a) under the Securities Exchange Act of 1934, as amended.
|
|
13.1
|
Certification by Chief Executive Officer pursuant to section 906 of the Sarbanes-Oxley Act of 2002.
|
|
13.2
|
Certification by Chief Financial Officer pursuant to section 906 of the Sarbanes-Oxley Act of 2002.
|
|
15.1
|
Consent of Kost Forer Gabbay & Kasierer, a member of Ernst & Young Global.
|
|
101.INS
|
XBRL Instance Document *. | |
|
101.SCH
|
XBRL Taxonomy Extension Schema Document. | |
|
101.PRE
|
XBRL Taxonomy Presentation Linkbase Document. | |
|
101.CAL
|
XBRL Taxonomy Calculation Linkbase Document. | |
|
101.LAB
|
XBRL Taxonomy Label Linkbase Document. | |
|
101.DEF
|
XBRL Taxonomy Extension Definition Linkbase Document. | |
| ___________________ | ||
|
*
|
Pursuant to Rule 406T of Regulation S-T, these interactive data files are deemed not filed or part of a registration statement or prospectus for purposes of Sections 11 or 12 of the Securities Act of 1933, as amended, are deemed not filed for the purposes of Section 18 of the Securities and Exchange Act of 1934, as amended, and otherwise are not subject to liability under those sections.
|
107
S I G
N
A T U R E S
The registrant hereby certifies that it meets all of the requirements for filing on Form 20-F and that it has duly caused and authorized the undersigned to sign this annual report on its behalf.
|
GILAT SATELLITE NETWORKS LTD.
|
|||
|
|
By:
|
/s/ Erez Antebi | |
| Erez Antebi | |||
|
Chief Executive Officer
|
|||
Date: Date: April 1, 2015
108
GILAT SATELLITE NETWORKS LTD. AND ITS SUBSIDIARIES
CONSOLIDATED FINANCIAL STATEMENTS
AS OF DECEMBER 31, 2014
IN U.S. DOLLARS
INDEX
|
Page
|
|
|
F-2
|
|
|
F-3 – F-4
|
|
|
F-5
|
|
|
F-6
|
|
|
F-7
|
|
|
F-8 - F-10
|
|
|
F-11- F-56
|

|
Kost Forer Gabbay & Kasierer
3 Aminadav St.
Tel-Aviv 6706703, Israel
|
Tel: +972-3-6232525
Fax: +972-3-5622555
ey.com
|
REPORT
OF INDEPENDENT REGISTERED PUBLIC ACCOUNTING FIRM
To the Board of Directors and Shareholders of
GILAT SATELLITE NETWORKS LTD.
We have audited the accompanying consolidated balance sheets of Gilat Satellite Networks Ltd. (the "Company") and subsidiaries as of December 31, 2014 and 2013, and the related consolidated statements of operations, comprehensive income (loss), shareholders' equity and cash flows for each of the three years in the period ended December 31, 2014. These consolidated financial statements are the responsibility of the Company's management. Our responsibility is to express an opinion on these financial statements based on our audits.
We conducted our audits in accordance with the standards of the Public Company Accounting Oversight Board (United States). Those standards require that we plan and perform the audit to obtain reasonable assurance about whether the financial statements are free of material misstatement. An audit includes examining, on a test basis, evidence supporting the amounts and disclosures in the financial statements. An audit also includes assessing the accounting principles used and significant estimates made by management, as well as evaluating the overall financial statement presentation. We believe that our audits provide a reasonable basis for our opinion.
In our opinion, the consolidated financial statements referred to above present fairly, in all material respects, the consolidated financial position of the Company and subsidiaries as of December 31, 2014 and 2013, and the consolidated results of their operations and their cash flows for each of the three years in the period ended December 31, 2014, in conformity with U.S. generally accepted accounting principles.
We also have audited, in accordance with the standards of the Public Company Accounting Oversight Board (United States), the Company's internal control over financial reporting as of December 31, 2014, based on criteria established in Internal Control-Integrated Framework issued by the Committee of Sponsoring Organizations of the Treadway Commission (2013 framework) and our report dated April 1, 2015, expressed an unqualified opinion thereon.
|
Tel-Aviv, Israel
|
KOST FORER GABBAY & KASIERER
|
|
April 1, 2015
|
A Member of Ernst & Young Global
|
F - 2
GILAT SATELLITE NETWORKS LTD. AND ITS SUBSIDIARIES
CONSOLIDATED
BALANCE SHEETS
U.S. dollars in thousands
|
December 31,
|
||||||||
|
2014
|
2013
|
|||||||
|
ASSETS
|
||||||||
|
CURRENT ASSETS:
|
||||||||
|
Cash and cash equivalents
|
$ | 27,726 | $ | 58,424 | ||||
|
Restricted cash
|
25,983 | 18,891 | ||||||
|
Restricted cash held by trustees
|
15,441 | 3,221 | ||||||
|
Trade receivables, net
|
57,728 | 56,466 | ||||||
|
Inventories
|
25,112 | 27,141 | ||||||
|
Other current assets
|
14,760 | 10,143 | ||||||
|
Total
current assets
|
166,750 | 174,286 | ||||||
|
LONG-TERM INVESTMENTS AND RECEIVABLES:
|
||||||||
|
Severance pay funds
|
8,085 | 9,856 | ||||||
|
Long-term restricted cash
|
216 | 6,279 | ||||||
|
Other long-term receivables
|
12,124 | 278 | ||||||
|
Total
long-term investments and receivables
|
20,425 | 16,413 | ||||||
|
PROPERTY AND EQUIPMENT, NET
|
90,893 | 85,369 | ||||||
|
INTANGIBLE ASSETS, NET
|
22,970 | 28,830 | ||||||
|
GOODWILL
|
63,870 | 63,870 | ||||||
|
Total
assets
|
$ | 364,908 | $ | 368,768 | ||||
The accompanying notes are an integral part of the consolidated financial statements.
F - 3
GILAT SATELLITE NETWORKS LTD. AND ITS SUBSIDIARIES
CONSOLIDATED BALANCE SHEETS
U.S. dollars in thousands (except share and per share data)
|
December 31,
|
||||||||
|
2014
|
2013
|
|||||||
|
LIABILITIES AND EQUITY
|
||||||||
|
CURRENT LIABILITIES:
|
||||||||
|
Short-term bank credit and loans
|
$ | 15,857 | $ | - | ||||
|
Current maturities of long-term loans
|
4,595 | 4,665 | ||||||
|
Trade payables
|
22,850 | 20,900 | ||||||
|
Accrued expenses
|
22,475 | 16,748 | ||||||
|
Short-term advances from customers held by trustees
|
12,858 | - | ||||||
|
Other current liabilities
|
21,527 | 54,666 | ||||||
|
Total
current liabilities
|
100,162 | 96,979 | ||||||
|
LONG-TERM LIABILITIES:
|
||||||||
|
Long-term loans, net of current maturities
|
26,271 | 31,251 | ||||||
|
Accrued severance pay
|
8,157 | 9,628 | ||||||
|
Other long-term liabilities
|
5,179 | 4,877 | ||||||
|
Total
long-term liabilities
|
39,607 | 45,756 | ||||||
|
COMMITMENTS AND CONTINGENCIES
|
||||||||
|
EQUITY:
|
||||||||
| Share capital - | ||||||||
|
Ordinary shares of NIS 0.2 par value: Authorized - 90,000,000 shares at December 31, 2014 and 2013; Issued and outstanding –
42,730,424 and 42,125,774 shares at December 31, 2014 and 2013, respectively
|
1,966 | 1,932 | ||||||
|
Additional paid-in capital
|
876,624 | 873,045 | ||||||
|
Accumulated other comprehensive income (loss)
|
(1,420 | ) | 1,591 | |||||
|
Accumulated deficit
|
(652,031 | ) | (650,535 | ) | ||||
|
Total
equity
|
225,139 | 226,033 | ||||||
|
Total
liabilities and equity
|
$ | 364,908 | $ | 368,768 | ||||
The accompanying notes are an integral part of the consolidated financial statements.
F - 4
GILAT SATELLITE NETWORKS LTD. AND ITS SUBSIDIARIES
CONSOLIDATED
STATEMENTS OF OPERATIONS
U.S. dollars in thousands (except share and per share data)
|
Year ended
December 31,
|
||||||||||||
|
2014
|
2013
|
2012
|
||||||||||
|
Revenues:
|
||||||||||||
|
Products
|
$ | 157,531 | $ | 133,554 | $ | 155,691 | ||||||
|
Services
|
77,602 | 101,312 | 115,875 | |||||||||
|
Total
revenues
|
235,133 | 234,866 | 271,566 | |||||||||
|
Cost of revenues:
|
||||||||||||
|
Products
|
106,905 | 86,304 | 96,805 | |||||||||
|
Services
|
44,593 | 68,906 | 76,832 | |||||||||
|
Total
cost of revenues
|
151,498 | 155,210 | 173,637 | |||||||||
|
Gross profit
|
83,635 | 79,656 | 97,929 | |||||||||
|
Operating expenses:
|
||||||||||||
|
Research and development, net
|
25,158 | 27,900 | 29,241 | |||||||||
|
Selling and marketing
|
32,537 | 32,214 | 34,988 | |||||||||
|
General and administrative
|
20,903 | 23,071 | 23,618 | |||||||||
|
Restructuring costs
|
- | 564 | 315 | |||||||||
|
Impairment of goodwill and intangible assets
|
- | - | 31,879 | |||||||||
|
Total
operating expenses
|
78,598 | 83,749 | 120,041 | |||||||||
|
Operating income (loss)
|
5,037 | (4,093 | ) | (22,112 | ) | |||||||
|
Financial expenses, net
|
(3,837 | ) | (6,239 | ) | (3,432 | ) | ||||||
|
Other income
|
- | - | 2,729 | |||||||||
|
Income (loss) before taxes on income
|
1,200 | (10,332 | ) | (22,815 | ) | |||||||
|
Taxes on income (tax benefit)
|
1,901 | (755 | ) | (1,893 | ) | |||||||
|
Net loss from continuing operations
|
(701 | ) | (9,577 | ) | (20,922 | ) | ||||||
|
Net loss from discontinued operations
|
(795 | ) | (8,320 | ) | (2,270 | ) | ||||||
|
Net loss
|
$ | (1,496 | ) | $ | (17,897 | ) | $ | (23,192 | ) | |||
|
Net loss per share (basic and diluted):
|
||||||||||||
|
Continuing operations
|
$ | (0.02 | ) | $ | (0.23 | ) | $ | (0.51 | ) | |||
|
Discontinued operations
|
$ | (0.02 | ) | $ | (0.20 | ) | $ | (0.05 | ) | |||
|
Total loss per share
|
$ | (0.04 | ) | $ | (0.43 | ) | $ | (0.56 | ) | |||
|
Weighted average number of shares used in computing net loss per share:
|
||||||||||||
|
Basic and diluted
|
42,444,482 | 41,960,925 | 41,410,409 | |||||||||
The accompanying notes are an integral part of the consolidated financial statements.
F - 5
GILAT SATELLITE NETWORKS LTD. AND ITS SUBSIDIARIES
CONSOLIDATED
STATEMENTS OF COMPREHENSIVE LOSS
U.S. dollars in thousands
|
Year ended
December 31,
|
||||||||||||
|
2014
|
2013
|
2012
|
||||||||||
|
Net loss
|
$ | (1,496 | ) | $ | (17,897 | ) | $ | (23,192 | ) | |||
|
Other comprehensive income (loss):
|
||||||||||||
|
Foreign currency translation adjustments
|
(2,205 | ) | 90 | 161 | ||||||||
|
Reclassification adjustments for realized loss (gain) on
hedging instruments, net
|
985 | (1,931 | ) | 748 | ||||||||
|
Unrealized gain (loss) on hedging instruments, net
|
(1,791 | ) | 568 | 1,414 | ||||||||
|
|
||||||||||||
|
Total Comprehensive loss
|
$ | (4,507 | ) | $ | (19,170 | ) | $ | (20,869 | ) | |||
The accompanying notes are an integral part of the consolidated financial statements.
F - 6
GILAT SATELLITE NETWORKS LTD. AND ITS SUBSIDIARIES
CONSOLIDATED
STATEMENTS OF CHANGES IN EQUITY
U.S. dollars in thousands (except share data)
|
Number of
Ordinary shares
(in thousands)
|
Share
capital
|
Additional
paid-in
capital
|
Accumulated
other
comprehensive
income (loss)
|
Accumulated
deficit
|
Total
shareholders'
equity
|
|||||||||||||||||||
|
Balance as of January 1, 2012
|
41,182 | $ | 1,882 | $ | 867,098 | $ | 541 | $ | (609,446 | ) | $ | 260,075 | ||||||||||||
|
Issuance of restricted share units (RSU)
|
459 | 24 | - | - | - | 24 | ||||||||||||||||||
|
Stock-based compensation of options and RSUs related to employees and non- employees
|
- | - | 2,445 | - | - | 2,445 | ||||||||||||||||||
|
Conversion of convertible subordinated notes
|
3 | *) - | 52 | - | - | 52 | ||||||||||||||||||
|
Exercise of stock options
|
56 | 3 | 227 | - | - | 230 | ||||||||||||||||||
|
Comprehensive loss
|
- | - | - | 2,323 | (23,192 | ) | (20,869 | ) | ||||||||||||||||
|
Balance as of December 31, 2012
|
41,700 | 1,909 | 869,822 | 2,864 | (632,638 | ) | 241,957 | |||||||||||||||||
|
Issuance of restricted share units (RSU)
|
271 | 15 | - | - | - | 15 | ||||||||||||||||||
|
Stock-based compensation of options and RSUs related to employees and non- employees
|
- | - | 2,665 | - | - | 2,665 | ||||||||||||||||||
|
Exercise of stock options
|
155 | 8 | 558 | - | - | 566 | ||||||||||||||||||
|
Comprehensive loss
|
- | - | - | (1,273 | ) | (17,897 | ) | (19,170 | ) | |||||||||||||||
|
Balance as of December 31, 2013
|
42,126 | 1,932 | 873,045 | 1,591 | (650,535 | ) | 226,033 | |||||||||||||||||
|
Issuance of restricted share units (RSU)
|
332 | 19 | - | - | - | 19 | ||||||||||||||||||
|
Stock-based compensation of options and RSUs related to employees and non- employees
|
- | - | 2,427 | - | - | 2,427 | ||||||||||||||||||
|
Exercise of stock options
|
272 | 15 | 1,152 | - | - | 1,167 | ||||||||||||||||||
|
Comprehensive loss
|
- | - | - | (3,011 | ) | (1,496 | ) | (4,507 | ) | |||||||||||||||
|
Balance as of December 31, 2014
|
42,730 | $ | 1,966 | $ | 876,624 | $ | **) (1,420 | ) | $ | (652,031 | ) | $ | 225,139 | |||||||||||
|
*)
|
Represents an amount lower than $ 1.
|
|
**)
|
As of December 31, 2014 the comprehensive loss consists of foreign currency translation adjustments at the amount of $ 614 and unrealized loss on forward contracts at the amount of $ 806.
|
The accompanying notes are an integral part of the consolidated financial statements.
F - 7
GILAT SATELLITE NETWORKS LTD. AND ITS SUBSIDIARIES
CONSOLIDATED
STATEMENTS OF CASH FLOWS
U.S. dollars in thousands
|
Year ended
December 31,
|
||||||||||||
|
2014
|
2013
|
2012
|
||||||||||
|
Cash flows from continuing operations
|
||||||||||||
|
Cash flows from operating activities
:
|
||||||||||||
|
Net loss
|
$ | (1,496 | ) | $ | (17,897 | ) | $ | (23,192 | ) | |||
|
Net loss from discontinued operations
|
(795 | ) | (8,320 | ) | (2,270 | ) | ||||||
|
Net loss from continuing operations
|
(701 | ) | (9,577 | ) | (20,922 | ) | ||||||
|
Reconciliation of net loss to net cash provided by (used in) operating activities:
|
||||||||||||
|
Depreciation and amortization
|
15,951 | 17,559 | 18,672 | |||||||||
|
Impairment of goodwill and other intangible assets
|
- | - | 31,879 | |||||||||
|
Stock-based compensation of options and RSUs related to employees and non- employees
|
2,427 | 2,268 | 1,934 | |||||||||
|
Accrued severance pay, net
|
300 | (38 | ) | 88 | ||||||||
|
Accrued interest and exchange rate differences on restricted cash and deposits, net
|
858 | 307 | (209 | ) | ||||||||
|
Exchange rate differences on long-term loans
|
(416 | ) | 157 | 90 | ||||||||
|
Capital loss from disposal of property and equipment
|
430 | 48 | 43 | |||||||||
|
Deferred income taxes
|
7 | (2,733 | ) | (3,656 | ) | |||||||
|
Increase in trade receivables, net
|
(2,457 | ) | (4,228 | ) | (11,735 | ) | ||||||
|
Decrease (increase) in other assets (including short-term, long-term and deferred charges)
|
(20,251 | ) | 10,740 | (3,293 | ) | |||||||
|
Decrease (increase) in inventories
|
(445 | ) | (6,502 | ) | 2,025 | |||||||
|
Increase (decrease) in trade payables
|
2,226 | (1,225 | ) | (727 | ) | |||||||
|
Increase (decrease) in accrued expenses
|
5,401 | (4,703 | ) | 250 | ||||||||
|
Increase (decrease) in advances from customers held by trustees, net
|
14,068 | (4,448 | ) | 2,897 | ||||||||
|
Increase (decrease) in other current liabilities and other long-term liabilities
|
(33,560 | ) | 18,772 | 2,621 | ||||||||
|
Net cash provided by (used in) operating activities
|
(16,162 | ) | 16,397 | 19,957 | ||||||||
The accompanying notes are an integral part of the consolidated financial statements.
F - 8
GILAT SATELLITE NETWORKS LTD. AND ITS SUBSIDIARIES
CONSOLIDATED STATEMENTS OF CASH FLOWS
U.S. dollars in thousands
|
Year ended
December 31,
|
||||||||||||
|
2014
|
2013
|
2012
|
||||||||||
|
Cash flows used in investing activities:
|
||||||||||||
|
Purchase of property and equipment
|
(12,630 | ) | (4,063 | ) | (3,965 | ) | ||||||
|
Investment in restricted cash (including long-term)
|
(12,788 | ) | (25,961 | ) | (903 | ) | ||||||
|
Proceeds from restricted cash (including long-term)
|
11,228 | 2,975 | 3,355 | |||||||||
|
Investment in restricted cash held by trustees
|
(24,869 | ) | (17,587 | ) | (35,442 | ) | ||||||
|
Proceeds from restricted cash held by trustees
|
12,306 | 13,744 | 35,447 | |||||||||
|
Purchase of intangible assets
|
- | (16 | ) | (89 | ) | |||||||
|
Net cash used in investing activities
|
(26,753 | ) | (30,908 | ) | (1,597 | ) | ||||||
|
Cash flows used in financing activities:
|
||||||||||||
|
Capital lease payments
|
(234 | ) | - | - | ||||||||
|
Exercise of stock options and issuance of restricted share units
|
1,186 | 581 | 254 | |||||||||
|
Payment of obligation related to the purchase of intangible asset
|
(500 | ) | (500 | ) | - | |||||||
|
Repayment of convertible subordinated notes
|
- | - | (14,322 | ) | ||||||||
|
Short-term bank credit, net
|
16,570 | (3,518 | ) | 546 | ||||||||
|
Proceeds from long-term loans
|
- | - | 10,000 | |||||||||
|
Repayment of long-term loans
|
(4,633 | ) | (12,950 | ) | (6,452 | ) | ||||||
|
Net cash provided by (used in) financing activities
|
12,389 | (16,387 | ) | (9,974 | ) | |||||||
|
Cash flows from discontinued operations
|
||||||||||||
|
Net cash provided by (used in) operating activities
|
- | (5,996 | ) | 1,614 | ||||||||
|
Net cash provided by investing activities
|
- | 15,791 | 999 | |||||||||
|
Net cash provided by financing activities
|
- | 12,884 | - | |||||||||
| - | 22,679 | 2,613 | ||||||||||
|
Effect of exchange rate changes on cash and cash equivalents
|
(172 | ) | (325 | ) | (262 | ) | ||||||
|
Increase (decrease) in cash and cash equivalents
|
(30,698 | ) | (8,544 | ) | 10,737 | |||||||
|
Cash and cash equivalents at the beginning of the year
|
58,424 | 66,968 | 56,231 | |||||||||
|
Cash and cash equivalents at the end of the year
|
$ | 27,726 | $ | 58,424 | $ | 66,968 | ||||||
The accompanying notes are an integral part of the consolidated financial statements.
F - 9
GILAT SATELLITE NETWORKS LTD. AND ITS SUBSIDIARIES
CONSOLIDATED STATEMENTS OF CASH FLOWS
U.S. dollars in thousands
|
Year ended
December 31,
|
||||||||||||
|
2014
|
2013
|
2012
|
||||||||||
|
Supplementary cash flow activities
:
|
||||||||||||
|
(1)
Cash paid during the year for continuing operations:
|
||||||||||||
|
Interest
|
$ | 1,681 | $ | 2,154 | $ | 4,135 | ||||||
|
Income taxes
|
$ | 1,582 | $ | 730 | $ | 602 | ||||||
|
(2)
Non-cash transactions:
|
||||||||||||
|
Conversion of long-term convertible subordinated notes
|
$ | - | $ | - | $ | 52 | ||||||
|
Classification from inventories to property and equipment
|
$ | 2,857 | $ | 3,778 | $ | 2,050 | ||||||
|
Classification from property and equipment to inventories
|
$ | 381 | $ | 691 | $ | 858 | ||||||
|
Purchase of intangible assets
|
$ | - | $ | - | $ | 1,505 | ||||||
|
Capital lease
|
$ | 1,123 | $ | - | $ | - | ||||||
The accompanying notes are an integral part of the consolidated financial statements.
F - 10
GILAT SATELLITE NETWORKS LTD. AND ITS SUBSIDIARIES
NOTES
TO CONSOLIDATED FINANCIAL STATEMENTS
U.S. dollars in thousands
|
NOTE 1:
|
GENERAL
|
|
|
a.
|
Organization:
|
Gilat Satellite Networks Ltd. (the "Company" or "Gilat") and its subsidiaries (the "Group") is a global provider of broadband satellite communication
and networking products and services. The Group designs, produces and markets very small aperture terminals, or VSATs, solid-state power amplifiers, or SSPAs, block up converters, or BUCs, low-profile antennas and on-the-Move / on-the-Pause terminals, and related network equipment. VSATs are earth based terminals that transmit and receive broadband, Internet, voice, data and video via satellite. VSAT networks combine a large central earth station, called a hub, with multiple remote sites (ranging from tens to thousands of sites), which communicate via satellite. The Group also provides services directly to end-users in various market segments, including in certain countries in Latin America, and managed network services over a VSAT network owned by third parties.
Gilat was incorporated in Israel in 1987 and launched its first generation VSAT in 1989. For a description of principal markets and customers, see Note 14.
Commencing in 2012, in accordance with the Company organizational changes instituted that year, the Company's business is managed and reported as three separate reportable segments, comprised of the Company's named Commercial, Mobility (previously named Defense) and Services Divisions:
|
|
·
|
Commercial Division - provides VSAT networks, satellite communication products, small cell solutions and associated professional services to service providers, satellite operators and Mobile Network Operators (MNOs) worldwide, including for high throughput satellites, or HTS, initiatives worldwide.
|
|
|
·
|
Mobility Division provides on-the-Move / on-the-Pause satellite communication products and solutions to system integrators, defense and homeland security organizations worldwide and also includes the operations of Wavestream, our subsidiary, whose sales are primarily to system integrators, defense and homeland security organizations.
|
|
|
·
|
Service Division comprised of service businesses in Peru and Colombia, which offer rural telephony and Internet access solutions.
|
In December 2, 2013, the Company sold its subsidiary, Spacenet Inc. or Spacenet, to SageNet of Tulsa, LLC for approximately $ 16,000, subject to certain post-closing adjustments and expenses. The Company recorded a loss of $ 1,385 as a result of this sale. The Company previously provided managed network communications services through Spacenet utilizing satellite wireline and wireless networks and associated technology mainly in the United States. Spacenet was sold in order to allow the Company to better focus its assets and management attention on its core business strategy and strategic target markets. During 2014 the post-closing adjustments were resolved and consequently the Company incurred additional expenses of $795 related to those adjustments. The Company recorded these expenses in discontinued operations in its results of operation.
F - 11
GILAT SATELLITE NETWORKS LTD. AND ITS SUBSIDIARIES
NOTES TO CONSOLIDATED FINANCIAL STATEMENTS
U.S. dollars in thousands
|
NOTE 1:
|
GENERAL (Cont.)
|
Spacenet was previously accounted under the Service Division. Following its sale, Spacenet's results, as well as income and costs related to the sale of Spacenet, are accounted as discontinued operation.
|
|
b.
|
Discontinued Operation:
|
Under ASC 205, "Presentation of Financial Statements - Discontinued Operation" ("ASC 205") when a component of an entity, as defined in ASC 205, has been disposed of or is classified as held for sale, the results of its operations, including the gain or loss on its component are classified as discontinued operations and the assets and liabilities of such component are classified as assets and liabilities attributed to discontinued operations; that is, provided that the operations, assets and liabilities and cash flows of the component have been eliminated from the Company's consolidated operations and the Company will have no significant continuing involvement in the operations of the component.
The results of the discontinued operations for the years ended December 31, 2014, 2013 and 2012, are presented below:
|
Year ended
December 31,
|
||||||||||||
|
2014
|
2013
|
2012
|
||||||||||
|
Revenues
|
$ | - | $ | 67,865 | $ | 76,797 | ||||||
|
Cost of revenues
|
- | 54,996 | 61,726 | |||||||||
|
Gross profit
|
- | 12,869 | 15,071 | |||||||||
|
Operating costs and expenses:
|
||||||||||||
|
Selling and marketing
|
- | 7,753 | 7,643 | |||||||||
|
General and administrative
|
- | 11,758 | 10,457 | |||||||||
|
Total operating expenses
|
- | 19,511 | 18,100 | |||||||||
|
Operating loss
|
- | (6,642 | ) | (3,029 | ) | |||||||
|
Loss from disposal of subsidiary
|
(795 | ) | (1,385 | ) | - | |||||||
|
Financial income (expenses), net
|
- | (255 | ) | 790 | ||||||||
|
Loss before taxes on income
|
(795 | ) | (8,282 | ) | (2,239 | ) | ||||||
|
Taxes on income
|
- | 38 | 31 | |||||||||
|
Net loss
|
$ | (795 | ) | $ | (8,320 | ) | $ | (2,270 | ) | |||
F - 12
GILAT SATELLITE NETWORKS LTD. AND ITS SUBSIDIARIES
NOTES TO CONSOLIDATED FINANCIAL STATEMENTS
U.S. dollars in thousands
|
NOTE 1:
|
GENERAL (Cont.)
|
|
|
c.
|
Impairment of goodwill and technology related to Wavestream
|
The continuing pressure on the Department of Defense (DoD) budget in the United State along with uncertainties regarding the DoD's future spending as well as other elements, were reflected in the reduction of Wavestream's revenues and operating results in 2012. This led the Company to evaluate the value of Wavestream's tangible and intangible assets based on the future undiscounted cash flows expected to be generated by the assets in accordance with ASC 360 "Property, Plant and Equipment". The projected undiscounted cash flows as of December 31, 2012 indicated that the carrying amount of the technology deemed to be impaired. In order to assess the amount of the impairment, the Company estimated the fair value of the technology using the discounted cash flow method and as a result the Company recorded an impairment loss of $ 7,948.
In addition, in accordance with ASC 350 "Intangibles - Goodwill and Others", the Company performed its annual goodwill impairment test as of December 31, 2014 and 2013. As a result of such impairment test in 2014 and 2013 no impairment loss was recorded. As of December 31, 2012 the Company recorded goodwill impairment losses of $ 23,931 attributed to Wavestream reporting unit.
The material assumptions used for the income approach for 2014, 2013 and 2012 were five (5) years of projected cash flows, a long-term growth rate of 4% and a discount rate of 14%, 14.5% and 13.5%, respectively.
The impairment losses recorded in 2012 were recorded as part of "Impairment of goodwill and intangible assets" in the Statement of Operations and are attributed to the Defense segment.
|
|
d.
|
The Company depends on a major supplier to supply certain components and services for the production of its products or providing services. If this supplier fails to deliver or delays the delivery of the necessary components or services, the Company will be required to seek alternative sources of supply. A change in suppliers could result in manufacturing delays or services delays which could cause a possible loss of sales and, or, additional incremental costs and, consequently, could adversely affect the Company's results of operations and financial position.
|
F - 13
GILAT SATELLITE NETWORKS LTD. AND ITS SUBSIDIARIES
NOTES TO CONSOLIDATED FINANCIAL STATEMENTS
U.S. dollars in thousands
The consolidated financial statements have been prepared in accordance with generally accepted accounting principles in the United States ("U.S. GAAP"), followed on a consistent basis.
|
|
a.
|
Use of estimates:
|
The preparation of the consolidated financial statements in conformity with U.S. GAAP requires management to make estimates, judgments and assumptions. The Company's management believes that the estimates, judgments and assumptions used are reasonable based upon information available at the time they are made. These estimates, judgments and assumptions can affect the reported amounts of assets and liabilities and disclosure of contingent assets and liabilities at the dates of the financial statements, and the reported amounts of revenue and expenses during the reporting period. Actual results could differ from those estimates.
|
|
b.
|
Functional currency:
|
The majority of the revenues of the Company and certain of its subsidiaries are generated in U.S. dollars ("dollar") or linked to the dollar. In addition, a substantial portion of the Company's and certain of its subsidiaries' costs are incurred in dollar. The Company's management believes that the dollar is the primary currency of the economic environment in which the Company and certain of its subsidiaries operate. Thus, the functional and reporting currency of the Company and certain of its subsidiaries is the dollar.
Accordingly, monetary accounts maintained in currencies other than the dollar are remeasured into dollars in accordance with ASC 830, "Foreign Currency Matters" ("ASC 830"). All transaction gains and losses of the remeasurement of monetary balance sheet items are reflected in the consolidated statements of operations as financial income or expenses, as appropriate.
The financial statements of certain foreign subsidiaries, whose functional currency has been determined to be their local currency, have been translated into dollars. Assets and liabilities have been translated using the exchange rates in effect at the balance sheet date. Statements of operations amounts have been translated using specific rates. The resulting translation adjustments are reported as a component of equity in accumulated other comprehensive income (loss).
|
|
c.
|
Principles of consolidation:
|
The consolidated financial statements include the accounts of the Company and its subsidiaries, in which the Company has a controlling voting interest and entities consolidated under the variable interest entities ("VIE") provisions of ASC 810, "Consolidation" ("ASC 810"). Inter-company balances and transactions have been eliminated upon consolidation.
F - 14
GILAT SATELLITE NETWORKS LTD. AND ITS SUBSIDIARIES
NOTES TO CONSOLIDATED FINANCIAL STATEMENTS
U.S. dollars in thousands
NOTE 2:- SIGNIFICANT ACCOUNTING POLICIES (Cont.)
The Company applies the provisions of ASC 810 which provides a framework for identifying VIEs and determining when a company should include the assets, liabilities, noncontrolling interests and results of activities of a VIE in its consolidated financial statements.
In general, a VIE is a corporation, partnership, limited-liability corporation, trust, or any other legal structure used to conduct activities or hold assets that either (1) has an insufficient amount of equity to carry out its principal activities without additional subordinated financial support, (2) has a group of equity owners that is unable to make significant decisions about its activities, (3) has a group of equity owners that does not have the obligation to absorb losses or the right to receive returns generated by its operations or (4) the voting rights of some investors are not proportional to their obligations to absorb the expected losses of the entity, their rights to receive the expected residual returns of the entity, or both and substantially all of the entity's activities (for example, providing financing or buying assets) either involve or are conducted on behalf of an investor that has disproportionately fewer voting rights.
ASC 810 requires a VIE to be consolidated by the party with an ownership, contractual or other financial interest in the VIE (a variable interest holder) that has both of the following characteristics: a) the power to direct the activities of a VIE that most significantly impact the VIE's economic performance and b) the obligation to absorb losses of the VIE that could potentially be significant to the VIE, or the right to receive benefits from the VIE that could potentially be significant to the VIE.
A variable interest holder that consolidates the VIE is called the primary beneficiary. Upon consolidation, the primary beneficiary generally must initially record all of the VIE's assets, liabilities and noncontrolling interests at fair value and subsequently account for the VIE as if it were consolidated based on a majority voting interest. ASC 810 also requires disclosures about VIEs in which the variable interest holder is not required to consolidate but in which it has a significant variable interest.
Most of the activity of Gilat Colombia consists of operating subsidized projects for the governmental authority, dirección de conectividad, or DirCon, (formerly known as Compartel) (collectively, the "DirCon Projects"). The DirCon Projects were originally awarded to Gilat's Colombian subsidiaries in 1999 and 2002 and were extended several times. Additional DirCon Project that was awarded to the subsidiary in 2011 was completed in December 2013. The subsidiary was awarded another DirCon project in 2013 which is scheduled to be completed in 2017.
F - 15
GILAT SATELLITE NETWORKS LTD. AND ITS SUBSIDIARIES
NOTES TO CONSOLIDATED FINANCIAL STATEMENTS
U.S. dollars in thousands
NOTE 2:- SIGNIFICANT ACCOUNTING POLICIES (Cont.)
As required by the Projects' bid documents, the Group established trusts (the "Trusts") and entered into governing Trust Agreements (one for each project awarded) (collectively, the "Trust Agreements"). The Trusts were established for the purpose of holding the network equipment, processing payments to subcontractors, and holding the funds received through the subsidy (the "Subsidy") until they are released in accordance with the terms of the Subsidy and paid to the Group. The Trusts are a mechanism to allow the Colombia government to review amounts to be paid with the Subsidy and verify that such funds are used in accordance with the transaction document of the project and the terms of the Subsidy. Gilat Colombia generates revenues from the Subsidy, as well as from the use of the network that Gilat Colombia operates.
The Trusts are considered VIEs and Gilat Colombia is identified as the primary beneficiary of the Trusts.
Under ASC 810 the Company performs ongoing reassessments of whether it is the primary beneficiary of a VIE. As the assessment of Company's management is that the Company has the power to direct the activities of a VIE that most significantly impact the VIE's activities (it is responsible for establishing and operating the networks), and the obligation to absorb losses of the VIE that could potentially be significant to the VIE and the right to receive benefits from the VIE that could potentially be significant to the VIE economic performance, it was therefore concluded by management that the Company is the primary beneficiary of the Trusts. As such, the Trusts were consolidated in the financial statements of the Company since their inception.
As of December 31, 2014 and December 31, 2013, the Trusts' assets amounted to $15,441 and $ 3,221, respectively. These assets are consolidated within the financial statements of the Company and are classified as "Restricted cash held by trustees".
As of December 31, 2014, the Trusts' liabilities amounted to $ 12,858. These liabilities are consolidated within the financial statements of the Company and are classified as "Short-term advances from customers, held by trustees".
As of December 31, 2013, the Trusts did not have any liabilities.
|
|
d.
|
Cash equivalents:
|
Cash equivalents are short-term highly liquid investments that are not restricted as to withdrawals or use with maturities of three months or less at the date acquired.
|
|
e.
|
Short-term and long-term restricted cash:
|
Short-term restricted cash is primarily invested in certificates of deposit, which mature within one year. As of December 31, 2014, the vast majority of this amount was linked to the dollar. Such certificates of deposit are used as collateral for the lease of the Group's offices, performance guarantees to customers and loans, and bears weighted average interest rates of 0.39 % and 0.24% as of December 31, 2014 and 2013, respectively.
F - 16
GILAT SATELLITE NETWORKS LTD. AND ITS SUBSIDIARIES
NOTES TO CONSOLIDATED FINANCIAL STATEMENTS
U.S. dollars in thousands
NOTE 2:- SIGNIFICANT ACCOUNTING POLICIES (Cont.)
Long-term restricted cash is primarily invested in certificates of deposit, which mature in more than one year. As of December 31, 2014, the amount is linked to currencies other than dollar. It bears annual weighted average interest rates of 7.78% and 0.5% as of December 31, 2014 and 2013, respectively. Such certificates of deposit are used as collateral for the lease of the Group's offices, performance guarantees to customers and loans.
|
|
f.
|
Restricted cash held by trustees:
|
As of December 31, 2014 and 2013, short-term restricted cash held by trustees is invested in a savings bank account linked to the Colombian Peso. The restricted cash is being released based upon performance milestones as stipulated in the agreements with the government of Colombia.
|
|
g.
|
Inventories:
|
Inventories are stated at the lower of cost or market value. Inventory write-offs are provided to cover risks arising from slow-moving items, excess inventories, discontinued products, new products introduction and for market prices lower than cost. Any write-off is recognized in the consolidated statement of operations as cost of revenue.
Cost is determined as follows:
Raw materials, parts and supplies - with the addition of allocable indirect manufacturing costs using the average cost method.
Work-in-progress - represents the cost of manufacturing with the addition of allocable indirect manufacturing costs, using the average cost method.
Finished products - calculated on the basis of raw materials, direct manufacturing costs with the addition of allocable indirect manufacturing costs, using the average cost method.
|
|
h.
|
Property and equipment, net:
|
Property and equipment are stated at cost, net of accumulated depreciation. Depreciation is calculated by the straight-line method over the estimated useful lives of the assets as follows:
|
Years
|
|
|
Buildings
|
50
|
|
Computers, software and electronic equipment
|
3 - 12
|
|
Office furniture and equipment
|
3 - 17
|
|
Vehicles
|
3 - 7
|
|
Leasehold improvements
|
Over the term of the lease or the useful life
of the improvements, whichever is shorter
|
F - 17
GILAT SATELLITE NETWORKS LTD. AND ITS SUBSIDIARIES
NOTES TO CONSOLIDATED FINANCIAL STATEMENTS
U.S. dollars in thousands
NOTE 2:- SIGNIFICANT ACCOUNTING POLICIES (Cont.)
Equipment leased to others under operating leases is carried at cost less accumulated depreciation and depreciated using the straight-line method over the useful life of the assets.
The Group has accounted for its assets which are under a capital lease arrangement in accordance with ASC 840 "Leases". Accordingly, assets under a capital lease are stated as assets of the Group on the basis of ordinary purchase prices (without the financing component), and depreciated according to the usual depreciation rates applicable to such assets. The lease payments payable in forthcoming years, net of the interest component included in them, are included in liabilities. The interest in respect of such amounts is accrued on a current basis and is charged to earnings.
|
|
i.
|
Intangible assets:
|
Intangible assets subject to amortization are initially recognized based on the fair value allocated to them, and subsequently stated at amortized cost. The assets are amortized over their estimated useful lives using the straight line method over an estimated period during which benefits are expected to be received, in accordance with ASC 350, "Intangible - Goodwill and Other" ("ASC 350") as the following weighted average
in years:
|
Years
|
|
|
Technology
|
7.9
|
|
Customer relationships
|
6.8
|
|
Marketing rights and patents
|
12.1
|
|
Backlog
|
1.0
|
As for the impairment loss related to Wavestream's technology recorded in 2012, see note 1c.
Regarding the Company's accounting policy for impairment of intangible assets see note 2k.
|
|
j.
|
Goodwill:
|
Goodwill represents the excess of the purchase price in a business combination over the fair value of the net tangible and intangible assets acquired. Under ASC 350, goodwill is not amortized, but rather is subject to an annual impairment test. Goodwill is tested for impairment at the reporting unit level by comparing the fair value of the reporting unit with its carrying value. The Company performs its annual impairment analysis of goodwill in the fourth quarter of the year, or more often if there are indicators of impairment present. The provisions of ASC 350 require that a two-step impairment test be performed on goodwill at the level of the reporting units. In the first step, or Step 1, the Company compares the fair value of each reporting unit to its carrying value. If the fair value exceeds the carrying value of the net assets, goodwill is considered not impaired, and the Company is not required to perform further testing. If the carrying value of the net assets exceeds the fair value, then the Company must perform the second step, or Step 2, of the impairment test in order to determine the implied fair value of goodwill.
F - 18
GILAT SATELLITE NETWORKS LTD. AND ITS SUBSIDIARIES
NOTES TO CONSOLIDATED FINANCIAL STATEMENTS
U.S. dollars in thousands
NOTE 2:- SIGNIFICANT ACCOUNTING POLICIES (Cont.)
To determine the fair value used in Step 1, the Company uses discounted cash flows. If and when the Company is required to perform a Step 2 analysis, determining the fair value of its net assets and its off-balance sheet intangibles would require it to make judgments that involve the use of significant estimates and assumptions.
The Company determines the fair value of each reporting unit using the Income Approach, which utilizes a discounted cash flow model, as it believes that this approach best approximates the reporting unit's fair value. Judgments and assumptions related to revenue, operating income, future short-term and long-term growth rates, weighted average cost of capital, interest, capital expenditures, cash flows, and market conditions are inherent in developing the discounted cash flow model. The Company considers historical rates and current market conditions when determining the discount and growth rates to use in its analyses. If these estimates or their related assumptions change in the future, the Company may be required to record impairment charges for its goodwill.
In 2014 and 2013, no impairment losses were identified.
As for the goodwill impairment loss recorded in 2012, see note 1c and note 6.
|
|
k.
|
Impairment of long-lived assets and long-lived assets to be disposed of:
|
The Group's long-lived assets are reviewed for impairment in accordance with ASC 360, "Property, Plant and Equipment" ("ASC 360"), whenever events or changes in circumstances indicate that the carrying amount of an asset may not be recoverable. Recoverability of assets to be held and used is measured by a comparison of the carrying amount of an asset to the future undiscounted cash flows expected to be generated by the assets. Such measurement includes significant estimates. If such assets are considered to be impaired, the impairment to be recognized is measured by the amount by which the carrying amount of the assets exceeds the fair value of the assets.
However, the carrying amount of a group of assets is not to be reduced below its fair value.
Assets to be disposed of are reported at the lower of the carrying amount or fair value less costs to sell. (See also note 2i).
In 2014 and 2013, no impairment losses were identified.
As for the impairment loss related to Wavestream's technology recorded in 2012, see note 1c.
|
|
l.
|
Contingencies
|
The Company is currently involved in various claims and legal proceedings. The Company reviews the status of each matter and assesses its potential financial exposure. If the potential loss from any claim or legal proceeding is considered probable and the amount can be reasonably estimated, the Company accrues a liability for the estimated loss.
F - 19
GILAT SATELLITE NETWORKS LTD. AND ITS SUBSIDIARIES
NOTES TO CONSOLIDATED FINANCIAL STATEMENTS
U.S. dollars in thousands
NOTE 2:- SIGNIFICANT ACCOUNTING POLICIES (Cont.)
|
|
m.
|
Revenue recognition:
|
The Group generates revenue mainly from the sale of products and services for satellite-based communications networks. Sale of products includes mainly the sale of VSATs, hubs and amplifiers. Service revenue include access to and communication via satellites ("space segment"), installation of network equipment, telephone services, internet services, consulting, on-line network monitoring, network maintenance and repair services. The Group sells its products primarily through its direct sales force and indirectly through resellers or system integrators. Sales consummated by the Group's sales force and sales to resellers or system integrators are considered sales to end-users.
Revenue from product sales is recognized in accordance with SEC Staff Accounting Bulletin ("SAB") No. 104, "Revenue Recognition" ("SAB No. 104"), when delivery has occurred, persuasive evidence of an agreement exists, the vendor's fee is fixed or determinable, no further obligation exists and collectability is probable. When significant acceptance provisions are included in the arrangement revenues are deferred until the acceptance occurs. Generally, the Group does not grant rights of return. Service revenues are recognized ratably over the period of the contract or as services are performed, as applicable.
The Company has adopted Accounting Standards Update (''ASU'') No. 2009-13, ''Multiple-Deliverable Revenue Arrangements'' (''ASU 2009-13'') as of the beginning of fiscal 2011 on a prospective basis for new and materially modified transaction originating after January 1, 2011.
For 2011 and future periods, pursuant to the guidance of ASU 2009-13, when a sales arrangement contains multiple elements, such as equipment and services, the Company allocates revenues to each element based on a selling price hierarchy. The selling price for a deliverable is based on its vendor specific objective evidence (''VSOE'') if available, third party evidence (''TPE'') if VSOE is not available, or estimated selling price (''ESP'') if neither VSOE nor TPE is available. In multiple element arrangements, revenues are allocated to each separate unit of accounting for each of the deliverables using the relative selling prices of each of the deliverables in the arrangement based on the aforementioned selling price hierarchy. Where VSOE or TPE does not exist the Group establishes ESP, based on management judgment, considering internal factors such as margin objectives, pricing practices and etc.
Revenue from products under sales-type lease contracts is recognized in accordance with ASC 840, "Leases" ("ASC 840") upon installation or upon delivery, in cases where the customer obtains its own or other's installation services. The net investments in sales-type leases are discounted at the interest rates implicit in the leases. The present values of payments due under sales-type lease contracts are recorded as revenue at the time of shipment or installation, as appropriate. Future interest income is deferred and recognized over the related lease term as financial income.
Revenue from products and services under operating leases of equipment is recognized ratably over the lease period, in accordance with ASC 840.
F - 20
GILAT SATELLITE NETWORKS LTD. AND ITS SUBSIDIARIES
NOTES TO CONSOLIDATED FINANCIAL STATEMENTS
U.S. dollars in thousands
NOTE 2:- SIGNIFICANT ACCOUNTING POLICIES (Cont.)
|
|
|
Revenues from contracts under which the Group provides construction or production of products ("Production-Type Contracts") which are significantly customized to the buyer's specifications are recognized in accordance with ASC 605-35, "Construction-Type and Production-Type Contracts". In Production-Type Contracts under which units of a basic product in a continuous or sequential production process are produced, revenues are recognized based on the units-of-delivery method, recognizing revenue for each unit on the date that unit is delivered. In other Production-Type Contracts, which require significant construction and customization to the customer's specifications, revenues are recognized using the percentage-of-completion method of accounting based on the input measure by using the ratio of costs related to construction performance incurred to the total estimated amount of such costs. The amount of revenue recognized is based on the total fees under the arrangement and the percentage of completion achieved. Provisions for estimated losses on uncompleted contracts, if any, are made in the period in which such losses are first determined, in the amount of the estimated loss on the entire contact.
Deferred revenue and advances from customers represent amounts received by the Group when the criteria for revenue recognition as described above are not met and are included in "Other current liabilities" and "Other long-term liabilities". When deferred revenue is recognized as revenue, the associated deferred charges are also recognized as cost of sales
.
|
|
|
n.
|
Shipping and advertising expenses:
Selling and marketing expenses include shipping expenses in the amounts of $ 2,685, $ 4,047 and $ 3,808 for the years ended December 31, 2014, 2013 and 2012, respectively.
Advertising costs are expensed as incurred. Advertising expenses amounted to $ 273, $ 412 and $ 479 for the years ended December 31, 2014, 2013 and 2012, respectively.
|
|
|
o.
|
Warranty costs:
Generally, the Group provides product warranties for periods between twelve to eighteen months at no extra charge. A provision is recorded for estimated warranty costs based on the Group's experience. Warranty expenses for the years ended December 31, 2014, 2013 and 2012 were immaterial.
|
|
|
p.
|
Research and development expenses, net:
Research and development expenses, net of grants received, are charged to expenses as incurred.
|
F - 21
GILAT SATELLITE NETWORKS LTD. AND ITS SUBSIDIARIES
NOTES TO CONSOLIDATED FINANCIAL STATEMENTS
U.S. dollars in thousands
NOTE 2:- SIGNIFICANT ACCOUNTING POLICIES (Cont.)
|
|
q.
|
Grants:
The Group receives royalty-bearing and non-royalty-bearing grants from the Government of Israel and from other funding sources, for approved research and development projects. These grants are recognized at the time the Group is entitled to such grants on the basis of the costs incurred or milestones achieved as provided by the relevant agreement and included as a deduction from research and development expenses.
Research and development grants deducted from research and development expenses amounted to $ 2,477, $ 1,591 and $ 3,055 in the years ended December 31, 2014, 2013 and 2012, respectively.
|
|
|
r.
|
Accounting for stock-based compensation:
|
The Group accounts for stock-based compensation in accordance with ASC 718, "Compensation-Stock Compensation" ("ASC 718"). ASC 718 requires companies to estimate the fair value of equity-based payment awards on the date of grant using an option-pricing model. The value of the portion of the award that is ultimately expected to vest is recognized as an expense over the requisite service periods in the Company's consolidated statement of operations.
The Group recognizes compensation expenses for the value of its awards, based on the straight line method over the requisite service period of each of the awards, net of estimated forfeitures. ASC 718 requires forfeitures to be estimated at the time of grant and revised, if necessary, in subsequent periods if actual forfeitures differ from those estimates.
The Group selected the Black-Scholes-Merton option pricing model as the most appropriate fair value method for its stock-options awards and the fair value of restricted share units, or RSUs, based on the market stock price on the date of grant. The option-pricing model requires a number of assumptions, of which the most significant are the expected stock price volatility and the expected option term. Expected volatility was calculated based upon actual historical stock price movements. The expected term of options granted is based upon historical experience and represents the period of time that options granted are expected to be outstanding. The risk-free interest rate is based on the yield from U.S. treasury bonds with an equivalent term. The Group has historically not paid dividends and has no foreseeable plans to pay dividends.
The Group accounts for equity instruments issued to third party service providers (non-employees) in accordance with the fair value based on an option-pricing model, pursuant to the guidance in ASC 505-50, "Equity-Based Payments to Non-Employees" ("ASC 505-50"). The fair value of the options granted and are unvested is revalued over the related service periods and recognized over the remaining vesting period. (See also note 9).
F - 22
GILAT SATELLITE NETWORKS LTD. AND ITS SUBSIDIARIES
NOTES TO CONSOLIDATED FINANCIAL STATEMENTS
U.S. dollars in thousands
NOTE 2:- SIGNIFICANT ACCOUNTING POLICIES (Cont.)
|
|
s.
|
Income taxes:
|
The Group accounts for income taxes in accordance with ASC 740, "Income Taxes" ("ASC 740"). ASC 740 prescribes the use of the liability method whereby deferred tax assets and liability account balances are determined based on differences between the financial reporting and the tax basis of assets and liabilities and are measured using the enacted tax rates and laws that will be in effect when the differences are expected to reverse. The Group provides a valuation allowance, if necessary, to reduce deferred tax assets to their estimated realizable value, if it is more likely than not that a portion or all of the deferred tax assets will not be realized.
The Group accounts for uncertain tax position in accordance with ASC 740-10, "Income Taxes" ("ASC 740-10"). ASC 740-10 clarifies the accounting for income taxes by prescribing the minimum recognition threshold a tax position is required to meet before being recognized in the financial statements. ASC 740-10 utilizes a two-step approach for evaluating tax positions.
Recognition (step one) occurs when an enterprise concludes that a tax position, based solely on its technical merits, is more-likely-than-not to be sustained upon examination. Measurement (step two) is only addressed if step one has been satisfied (i.e., the position is more-likely-than-not to be sustained) otherwise a full liability in respect of a tax position not meeting the more-than-likely-than-not criteria is recognized.
Under step two, the tax benefit is measured as the largest amount of benefit, determined on a cumulative probability basis that is more-likely-than-not to be realized upon ultimate settlement.
ASC 740-10, applies to all tax positions related to income taxes. This includes tax positions considered to be "routine" as well as those with a high degree of uncertainty. ASC 740-10 has expanded disclosure requirements, which include a tabular roll forward of the beginning and ending aggregate unrecognized tax benefits as well as specific detail related to tax uncertainties for which it is reasonably possible the amount of unrecognized tax benefit will significantly increase or decrease within twelve months (See also note 11).
|
|
t.
|
Concentrations of credit risks:
|
Financial instruments that potentially subject the Group to concentrations of credit risk consist principally of cash and cash equivalents, short-term and long-term restricted cash, short-term restricted cash held by trustees, trade receivables, long-term trade receivables and foreign currency derivative contracts (See also note 8).
The majority of the Group's cash and cash equivalents, and short-term and long-term restricted cash are invested in dollars with major banks in Israel and in the United States. Generally, these cash equivalents may be redeemed upon demand and, therefore management believes that they bear lower risk.
F - 23
GILAT SATELLITE NETWORKS LTD. AND ITS SUBSIDIARIES
NOTES TO CONSOLIDATED FINANCIAL STATEMENTS
U.S. dollars in thousands
NOTE 2:- SIGNIFICANT ACCOUNTING POLICIES (Cont.)
The Group also has restricted cash held by trustees, which is invested in Colombian Pesos with major banks in Colombia. As of December 31, 2014, restricted cash held by the trustees amounted to $ 15,441. The Group is entitled to receive the restricted cash held by the trustee in stages based upon operational milestones. The cash held in the trusts is reflected in the Company's balance sheet as "Restricted cash held by trustees".
Trade receivables and other long-term receivables of the Group are mainly derived from sales to major customers located in the North America, Europe, Asia and Asia Pacific, South and Central America and Africa. The Group performs ongoing credit evaluations of its customers and obtains letters of credit and bank guarantees for certain receivables. An allowance for doubtful accounts is determined with respect to specific debts that the Group has determined to be doubtful of collection.
|
|
u.
|
Employee related benefits:
Severance pay:
|
The Company's liability for severance pay is calculated pursuant to the Israeli Severance Pay Law based on the most recent salary of the employees multiplied by the number of years of employment, as of the balance sheet date. Employees whose employment is terminated by the Company or who are otherwise entitled to severance pay in accordance with Israeli law or labor agreements are entitled to one month's salary for each year of employment or a portion thereof. The Company's liability for all of its Israeli employees is partly provided for by monthly deposits for insurance policies and the remainder by an accrual. The value of these policies is recorded as an asset in the Company's consolidated balance sheet.
During April and May 2008 (the "transition date"), the Company amended the contracts of most of its Israeli employees so that starting on the transition date, such employees are subject to Section 14 of the Severance Pay Law, 1963 ("Section 14") for severance pay accumulated in periods of employment subsequent to the transition date. In accordance with Section 14, upon termination, the release of the contributed amounts from the fund to the employee shall relieve the Company from any further severance liability and no additional payments shall be made by the Company to the employee. As a result, the related obligation and amounts deposited on behalf of such obligation are not stated on the balance sheet, as the Company is legally released from severance obligation to employees once the amounts have been deposited, and the Company has no further legal ownership of the amounts deposited.
The carrying value for the deposited funds for the Company's employees' severance pay for employment periods prior to April and May 2008 include profits and losses accumulated up to the balance sheet date. The deposited funds may be withdrawn only upon the fulfillment of the obligation pursuant to the Israeli Severance Pay Law or labor agreements.
Severance pay expenses for the years ended December 31, 2014, 2013 and 2012, amounted to approximately $ 2,652, $ 2,881 and $ 2,802, respectively.
F - 24
GILAT SATELLITE NETWORKS LTD. AND ITS SUBSIDIARIES
NOTES TO CONSOLIDATED FINANCIAL STATEMENTS
U.S. dollars in thousands
NOTE 2:- SIGNIFICANT ACCOUNTING POLICIES (Cont.)
|
|
401K profit sharing plans:
|
The Group has a number of savings plans in the United States that qualify under Section 401(k) of the Internal Revenue Code. U.S employees may contribute up to 100% of their pretax salary, but not more than statutory limits. Generally, the Group contributes one dollar for each dollar a participant contributes in this plan, in an amount of up to 3% of salary and in addition, in some plans, it contributes fifty cents for each dollar a participant contributes in this plan, for an additional 3%. Matching contributions for all the plans were approximately $ 311, $ 317 and $ 351 for the years ended 2014, 2013 and 2012, respectively. Matching contributions are invested in proportion to each participant's voluntary contributions in the investment options provided under the plan.
|
|
v.
|
Fair value of financial instruments:
|
The Group applies ASC 820, "Fair Value Measurements and Disclosures" (“ASC 820”). Under this standard, fair value is defined as the price that would be received to sell an asset or paid to transfer a liability (i.e., the "exit price") in an orderly transaction between market participants at the measurement date.
In determining fair value, the Group uses various valuation approaches. ASC 820 establishes a hierarchy for inputs used in measuring fair value that maximizes the use of observable inputs and minimizes the use of unobservable inputs by requiring that the most observable inputs be used when available. Observable inputs are inputs that market participants would use in pricing the asset or liability developed based on market data obtained from sources independent of the Group. Unobservable inputs are inputs that reflect the Company's assumptions about the assumptions market participants would use in pricing the asset or liability developed based on the best information available in the circumstances.
The hierarchy is broken down into three levels based on the inputs as follows:
|
|
Level 1 -
|
Valuations based on quoted prices in active markets for identical assets that the Company has the ability to access. Valuation adjustments and block discounts are not applied to Level 1 instruments. Since valuations are based on quoted prices that are readily and regularly available in an active market, valuation of these products does not entail a significant degree of judgment.
|
|
|
Level 2 -
|
Valuations based on one or more quoted prices in markets that are not active or for which all significant inputs are observable, either directly or indirectly.
|
|
|
Level 3 -
|
Valuations based on inputs that are unobservable and significant to the overall fair value measurement.
|
F - 25
GILAT SATELLITE NETWORKS LTD. AND ITS SUBSIDIARIES
NOTES TO CONSOLIDATED FINANCIAL STATEMENTS
U.S. dollars in thousands
NOTE 2:- SIGNIFICANT ACCOUNTING POLICIES (Cont.)
The availability of observable inputs can vary from investment to investment and is affected by a wide variety of factors, including, for example, the type of investment, the liquidity of markets and other characteristics particular to the transaction. To the extent that valuation is based on models or inputs that are less observable or unobservable in the market, the determination of fair value requires more judgment and the investments are categorized as Level 3.
The carrying amounts of cash and cash equivalents, restricted cash, trade receivable, other current assets, trade payable, accrued expenses and other current liabilities approximate fair value due to the short-term maturities of such instruments.
|
|
w.
|
Restructuring Costs:
During the fourth quarters of 2013 and 2012, the Company initiated restructuring plans to improve its operating efficiency at its various operating sites and to reduce its operating expenses. The Company has accounted for the restructuring plan in accordance with ASC 420, "Exit or Disposal Cost Obligations". (See also note 10).
|
|
|
x.
|
Net loss per share:
|
Basic net loss per share is computed based on the weighted average number of Ordinary shares outstanding during each period. Diluted net loss per share is computed based on the weighted average number of Ordinary shares outstanding during each period, plus dilutive potential Ordinary shares considered outstanding during the period, in accordance with ASC 260, "Earning per Share" ("ASC 260"). The total weighted average number of shares related to the outstanding options excluded from the calculations of diluted net loss per share, as they would have been anti-dilutive, was 5,546,082, 6,832,576 and 6,833,367 for the years ended December 31, 2014, 2013 and 2012, respectively.
The following table sets forth the computation of basic and diluted net loss per share:
|
|
1.
|
Numerator:
|
|
Year ended
December 31,
|
||||||||||||
|
2014
|
2013
|
2012
|
||||||||||
|
Numerator for basic and diluted net loss per share -
|
||||||||||||
|
Net loss available to holders of Ordinary shares:
|
||||||||||||
|
From continuing operations
|
$ | (701 | ) | $ | (9,577 | ) | $ | (20,922 | ) | |||
|
From discontinued operations
|
(795 | ) | (8,320 | ) | (2,270 | ) | ||||||
| (1,496 | ) | (17,897 | ) | (23,192 | ) | |||||||
F - 26
GILAT SATELLITE NETWORKS LTD. AND ITS SUBSIDIARIES
NOTES TO CONSOLIDATED FINANCIAL STATEMENTS
U.S. dollars in thousands
NOTE 2:- SIGNIFICANT ACCOUNTING POLICIES (Cont.)
|
|
2.
|
Denominator (number of shares in thousands):
|
|
Year ended
December 31,
|
||||||||||||
|
2014
|
2013
|
2012
|
||||||||||
|
Denominator for basic net loss per share -
|
||||||||||||
|
Weighted average number of shares
|
42,444 | 41,961 | 41,410 | |||||||||
|
Add-employee stock options and convertible subordinated notes
|
*) - | *) - | *) - | |||||||||
|
Denominator for diluted net loss per share - adjusted weighted average shares assuming exercise of options
|
42,444 | 41,961 | 41,410 | |||||||||
|
|
*)
|
Anti-dilutive.
|
|
|
y.
|
Derivatives and hedging activities:
|
ASC 815, "Derivatives and Hedging" ("ASC 815"), as amended, requires the Company to recognize all derivatives on the balance sheet at fair value. Derivatives that are not hedges must be adjusted to fair value through income (loss). If the derivative is a hedge, depending on the nature of the hedge, changes in the fair value of derivatives are either offset against the change in fair value of the hedged assets, liabilities, or firm commitments through earnings or recognized in other comprehensive income until the hedged item is recognized in earnings. The ineffective portion of a derivative's change in fair value is immediately recognized in earnings.
The Company measured the fair value of the forward contracts in accordance with ASC 820 (classified as level 2).
The Company's subsidiary entered into forward contracts in order to hedge the exposure to variability in expected future cash flows resulting from changes in related foreign currency exchange rates. As of December 31, 2014 and 2013, the fair value of the outstanding assets (liabilities) forward contracts that did not meet the requirement for hedge accounting was $ 1,949 and $ 0, respectively.
The Company entered into forward contracts to hedge against the risk of changes in future cash flow from payments of payroll and related expenses denominated in Israeli Shekels. As of December 31, 2014 and 2013, the fair value of the outstanding assets (liabilities) forward contracts that did met the requirement for cash flow hedge accounting was $ (806) and $ 0, respectively.
F - 27
GILAT SATELLITE NETWORKS LTD. AND ITS SUBSIDIARIES
NOTES TO CONSOLIDATED FINANCIAL STATEMENTS
U.S. dollars in thousands
|
|
z.
|
Comprehensive income (loss):
|
The Company accounts for comprehensive income in accordance with ASC No. 220, "Comprehensive Income". Comprehensive income (loss) generally represents all changes in shareholders' equity during the period except those resulting from investments by, or distributions to, shareholders. The Company determined that its items of other comprehensive income (loss) relate to unrealized gains and losses on hedging derivative instruments and foreign currency translation adjustments.
The following table shows the components of Accumulated other comprehensive income, as of December 31, 2014:
|
Year ended
December 31, 2014
|
||||||||||||
|
Foreign currency translation adjustments
|
Unrealized gains (losses) on cash flow hedges
|
Total
|
||||||||||
|
Beginning balance
|
$ | 1,591 | $ | - | $ | 1,591 | ||||||
|
Other comprehensive income (loss) before reclassifications
|
(2,205 | ) | (1,791 | ) | (3,996 | ) | ||||||
|
Amounts reclassified from accumulated other comprehensive income
|
- | 985 | 985 | |||||||||
|
Net current-period other comprehensive loss
|
(2,205 | ) | (806 | ) | (3,011 | ) | ||||||
|
Ending balance
|
$ | (614 | ) | $ | (806 | ) | $ | (1,420 | ) | |||
|
|
aa.
|
Impact of recently issued accounting pronouncements:
|
In May 2014, Financial Accounting Standards Board ("FASB") issued ASU 2014-09, "Revenue from Contracts with Customers (Topic 606)", a comprehensive new revenue recognition standard that will supersede existing revenue guidance under US GAAP and IFRS ("ASU 2014-09"). ASU 2014-09's core principle is that a company will recognize revenue when it transfers promised goods or services to customers in an amount that reflects the consideration to which the company expects to be entitled in exchange for those goods or services. ASU 2014-09 is effective for annual periods beginning after December 15, 2016, including interim periods within that period. Early adoption is not permitted under US GAAP. The Company is currently evaluating the method of adoption, as well as the effect that adoption of this ASU will have on its consolidated financial statements.
F - 28
GILAT SATELLITE NETWORKS LTD. AND ITS SUBSIDIARIES
NOTES TO CONSOLIDATED FINANCIAL STATEMENTS
U.S. dollars in thousands
|
NOTE 3:-
|
INVENTORIES
|
|
|
a.
|
Inventories are comprised of the following:
|
|
December 31,
|
||||||||
|
2014
|
2013
|
|||||||
|
Raw materials, parts and supplies
|
$ | 8,130 | $ | 5,364 | ||||
|
Work in progress
|
5,477 | 5,036 | ||||||
|
Finished products
|
11,505 | 16,741 | ||||||
| $ | 25,112 | $ | 27,141 | |||||
|
|
b.
|
Inventory write-offs totaled $ 1,002, $ 2,080 and $ 1,332 in 2014, 2013 and 2012, respectively.
|
|
NOTE 4:-
|
PROPERTY AND EQUIPMENT, NET
|
|
|
a.
|
Composition of property and equipment, grouped by major classifications, is as follows:
|
|
December 31,
|
||||||||
|
2014
|
2013
|
|||||||
|
Cost:
|
||||||||
|
Buildings and land
|
$ | 93,094 | $ | 92,267 | ||||
|
Computers, software and electronic equipment
|
67,874 | 63,290 | ||||||
|
Equipment leased to others
|
75,606 | 63,128 | ||||||
|
Office furniture and equipment
|
7,823 | 8,524 | ||||||
|
Vehicles
|
455 | 506 | ||||||
|
Leasehold improvements
|
2,747 | 2,671 | ||||||
| 247,599 | 230,386 | |||||||
|
Accumulated depreciation *)
|
156,706 | 145,017 | ||||||
|
Depreciated cost
|
$ | 90,893 | $ | 85,369 | ||||
|
|
*)
|
The accumulated depreciation of equipment leased to others as of December 31, 2014 and 2013 is $ 63,956 and $ 58,623, respectively.
|
|
|
b.
|
Depreciation expenses totaled $ 10,091, $ 9,162 and $ 8,554 in 2014, 2013 and 2012, respectively.
|
|
|
c.
|
At December 31, 2014 and 2013, property and equipment under capital leases consisted of assets with a depreciated cost of $ 1,095 and $ 0, respectively. Depreciation of property and equipment under capital leases totaled $ 110, $ 0 and $ 0 for the years ended December 31, 2014, 2013 and 2012, respectively.
|
|
|
d.
|
As for pledges and securities, see also note 12d.
|
F - 29
GILAT SATELLITE NETWORKS LTD. AND ITS SUBSIDIARIES
NOTES TO CONSOLIDATED FINANCIAL STATEMENTS
U.S. dollars in thousands
|
NOTE 5:-
|
INTANGIBLE ASSETS, NET
|
|
|
a.
|
Composition of intangible assets, grouped by major classifications, is as follows:
|
|
December 31,
|
||||||||
|
2014
|
2013
|
|||||||
|
Original amounts:
|
||||||||
|
Technology
|
$ | 42,504 | $ | 42,504 | ||||
|
Customer relationships
|
4,466 | 4,466 | ||||||
|
Marketing rights and patents
|
3,421 | 3,421 | ||||||
|
Backlog
|
432 | 432 | ||||||
| 50,823 | 50,823 | |||||||
|
Accumulated amortization:
|
||||||||
|
Technology
|
23,299 | 18,321 | ||||||
|
Customer relationships
|
2,795 | 2,133 | ||||||
|
Marketing rights and patents
|
1,327 | 1,107 | ||||||
|
Backlog
|
432 | 432 | ||||||
| 27,853 | 21,993 | |||||||
| $ | 22,970 | $ | 28,830 | |||||
|
|
b.
|
Amortization expenses amounted to $ 5,860, $ 8,397 and $ 10,118 for the years ended December 31, 2014, 2013 and 2012, respectively.
|
|
|
c.
|
Estimated amortization expenses for the following years is as follows:
|
|
Year ending
December
31,
|
||||
|
2015
|
$ | 5,816 | ||
|
2016
|
5,771 | |||
|
2017
|
5,674 | |||
|
2018
|
3,275 | |||
|
2019
|
911 | |||
|
2020 and thereafter
|
1,523 | |||
| $ | 22,970 | |||
F - 30
GILAT SATELLITE NETWORKS LTD. AND ITS SUBSIDIARIES
NOTES TO CONSOLIDATED FINANCIAL STATEMENTS
U.S. dollars in thousands
|
NOTE 6:-
|
GOODWILL
|
|
December 31,
|
||||||||||||
|
2014
|
2013
|
2012
|
||||||||||
|
Goodwill
|
$ | 105,647 | $ | 105,647 | $ | 105,647 | ||||||
|
Accumulated impairment losses *)
|
(41,777 | ) | (41,777 | ) | (41,777 | ) | ||||||
| $ | 63,870 | $ | 63,870 | $ | 63,870 | |||||||
|
|
*)
|
During the year ended December 31, 2012, the Company recorded an impairment loss of $ 23,931.
|
|
NOTE 7:-
|
COMMITMENTS AND CONTINGENCIES
|
|
|
a.
|
Lease commitments:
|
Minimum lease commitments of certain subsidiaries under non-cancelable operating lease agreements with respect to premises occupied by them, at rates in effect subsequent to December 31, 2014, are as follows:
|
Lease
|
||||
|
Year ending December 31,
|
Commitments
|
|||
|
2015
|
$ | 1,779 | ||
|
2016
|
1,404 | |||
|
2017
|
583 | |||
|
2018
|
210 | |||
|
2019 and after
|
84 | |||
| $ | 4,060 | |||
Rent expenses during the years ended December 31, 2014, 2013 and 2012 were $ 2,966, $ 2,349 and $ 2,501, respectively.
Some of the Group's lease agreements do not include renewal options.
|
|
b.
|
Commitments with respect to space segment services:
|
Future minimum payments due for space segment services to be rendered subsequent to December 31, 2014, are as follows:
|
Year ending December 31,
|
||||
|
2015
|
$ | 7,152 | ||
|
2016
|
6,716 | |||
|
2017*)
|
3,645 | |||
| $ | 17,513 | |||
F - 31
GILAT SATELLITE NETWORKS LTD. AND ITS SUBSIDIARIES
NOTES TO CONSOLIDATED FINANCIAL STATEMENTS
U.S. dollars in thousands
|
NOTE 7:-
|
COMMITMENTS AND CONTINGENCIES (Cont.)
|
Space segment services expenses totaled $ 7,913, $ 10,352 and $ 12,932 in 2014, 2013 and 2012, respectively.
|
|
*)
|
The Group does not have any commitments with respect to space segments after 2017.
|
|
|
c.
|
In 2014 and 2013, the Company's primary material purchase commitments were with inventory suppliers. The Company's material inventory purchase commitments are based on purchase orders, or on outstanding agreements with some of the Company's suppliers of inventory. As of December 31, 2014 and 2013, the Company's major outstanding inventory purchase commitments amounted to $ 29,747 and $ 28,134, respectively, all of which were orders placed or commitments made in the ordinary course of its business. As of December 31, 2014 and 2013, $ 2,774 and $ 7,255, respectively, of these orders and commitments, were from suppliers which can be considered sole or limited in number.
|
|
|
d.
|
Royalty commitments:
|
|
|
1.
|
The Company is committed to pay royalties to the Office of the Chief Scientist ("OCS") of the Ministry of Economy of the Government of Israel on proceeds from sales of products resulting from the research and development projects in which the OCS participated with royalty bearing grants. In the event that development of a specific product in which the OCS participated is successful, the Company will be obligated to repay the grants through royalty payments at the rate of 3% to 5% based on the sales of the Company, up to 100% of the grants received linked to the dollar. Grants are subject to interest at a rate equal to the 12 month LIBOR rate. The obligation to pay these royalties is contingent upon actual sales of the products and, in the absence of such sales, no payment is required.
As of December 31, 2014 and 2013, the Company had a contingent liability to pay royalties in the amount of approximately $ 744 and $ 96, respectively.
The Company did not pay or accrue any amounts for such royalties during the years ended December 31, 2014, 2013 and 2012.
|
|
|
2.
|
Research and development projects undertaken by the Company were partially financed by the Binational Industrial Research and Development Fund ("BIRD") Foundation. The Company is committed to pay royalties to the BIRD Foundation at a rate of 5% of sales proceeds generating from projects for which the BIRD Foundation provided funding up to 150% of the sum financed by the BIRD Foundation.
The obligation to pay these royalties is contingent on actual sales of the products and in the absence of such sales, no payment is required.
As of December 31, 2014 and 2013, the Company had a contingent liability to pay royalties in the amount of approximately $ 85 and $ 0, respectively.
|
F - 32
GILAT SATELLITE NETWORKS LTD. AND ITS SUBSIDIARIES
NOTES TO CONSOLIDATED FINANCIAL STATEMENTS
U.S. dollars in thousands
|
NOTE 7:-
|
COMMITMENTS AND CONTINGENCIES (Cont.)
|
|
|
|
The Company did not pay or accrue any amounts for such royalties during the years ended December 31, 2014, 2013 and 2012.
|
|
|
e.
|
Legal and tax contingencies:
|
|
|
1.
|
In 2003, the Brazilian tax authority filed a claim against the Company's subsidiary in Brazil (an inactive company), for the payment of taxes allegedly due by the subsidiary in the amount of approximately $ 4,000. In January 2004 and December 2005, the subsidiary filed its administrative defense, which was denied by the first and second level Brazilian courts, respectively. In September 2006, our subsidiary filed an annulment action seeking judicial cancellation of the claim. In May 2009, the subsidiary received notice of the court's first level decision, which cancelled a significant portion of the claim, but upheld two items of the assessment. Under this decision, the subsidiary's principal liability was reduced to approximately $ 1,500. This decision was appealed by both the subsidiary and the Brazilian tax authorities.
In June 2012, the São Paulo Court of Appeals ruled against the subsidiary, which is an inactive company, accepting the claims of the tax authorities. In September 2012, the subsidiary filed an appeal to the Brazilian Superior Court of Justice and to the Brazilian Supreme Court. In October 2014, the appeals were not admitted by the São Paulo Court of Appeals and the Company's subsidiary filed appeals on such decision, which are pending. Based on external counsel's opinion, the Company believes that it has a reasonable chance of success to reverse the ruling of the São Paulo Court of Appeals. Accordingly, as of December 31, 2014, the Company’s inactive subsidiary faces a tax exposure of approximately $ 10,353, including interest, penalties, legal fees and exchange rate differences. The Brazilian tax authorities issued a foreclosure certificate against the subsidiary and certain of its former managers and representatives and decided that these individuals should be summoned to appear in court. Based on the Company’s Brazilian external counsel's opinion, the Company believes that the inclusion of any additional co-obligors in the tax foreclosure certificate should be barred due to the applicable statute of limitations. Based on such opinion of counsel, the Company believes
that the foreclosure procedures legally cannot be redirected to other Group entities and managers who have not been cited in the foreclosure certificate. Accordingly, the chances that such redirection will lead to a loss recognition are remote.
|
|
|
2.
|
The Group has certain tax exposures in some of the jurisdictions in which it conducts business. Specifically, in certain jurisdictions in Latin America the Group is in the midst of different stages of audits and has received certain tax assessments. The tax authorities in these and in other jurisdictions in which the Group operates as well as the Israeli Tax Authorities may raise additional claims, which might result in increased exposures and ultimately, payment of additional taxes.
|
F - 33
GILAT SATELLITE NETWORKS LTD. AND ITS SUBSIDIARIES
NOTES TO CONSOLIDATED FINANCIAL STATEMENTS
U.S. dollars in thousands
|
NOTE 7:-
|
COMMITMENTS AND CONTINGENCIES (Cont.)
|
|
|
3.
|
The Group has accrued $ 3,441 and $ 7,888 as of December 31, 2014 and 2013, respectively, for the expected implications of such legal and tax contingencies. These accruals are comprised of $ 2,689 and $ 6,857 of tax related accruals and $ 752 and $ 1,031 of legal and other accruals as of December 31, 2014 and 2013, respectively. The accruals related to tax contingencies have been assessed by the Group's management based on the advice of outside legal and tax advisers. The total estimated exposure for the aforementioned tax related accruals is $ 12,053 and $ 22,540 as of December 31, 2014 and 2013, respectively. The estimated exposure for legal and other related accruals is $ 2,472 and $ 2,902 as of December 31, 2014 and 2013, respectively.
In 2014 the Company's subsidiary joined a federal tax amnesty program in Brazil ("Refis"). The Refis program allows companies to pay reduced amounts of interest and fines, or none at all, in order to settle their open tax cases (direct and indirect taxes). The subsidiary paid approximately $ 2,059 under the Refis program. The Company reversed accruals which it recorded previously in its books for some of these claims and therefore recorded income of approximately $ 619 in general and administrative expenses, $ 1,811 in financial income and an expense of $ 315 in tax expenses.
The tax accruals include various tax matters such as taxes on income, property taxes, sales and use tax and value added tax, that are in different stages of audits, for which tax assessments have been received, or various tax exposures in which the Group has assessed the exposure and determined that an accrual is necessary. The accruals related to legal contingencies have been assessed by the Group's management based on the advice of independent legal advisers and are comprised of matters for which legal proceedings have been initiated against the Group.
The exposures and provisions related to income taxes have been assessed and provided for in accordance with ASC 740-10. Liabilities related to legal proceedings, demands and claims and other taxes are recorded in accordance with ASC 450, "Contingencies" ("ASC 450"), when it is probable that a liability has been incurred and the associated amount can be reasonably estimated. The Group's management, based on its legal counsels' opinions', believes that it had provided an adequate accrual to cover the costs to resolve the aforementioned legal proceedings, demands and claims.
|
|
|
f.
|
Pledges and securities - see note 12d.
|
F - 34
GILAT SATELLITE NETWORKS LTD. AND ITS SUBSIDIARIES
NOTES TO CONSOLIDATED FINANCIAL STATEMENTS
U.S. dollars in thousands
|
NOTE 7:-
|
COMMITMENTS AND CONTINGENCIES (Cont.)
|
|
|
g.
|
Guarantees:
|
The Group guarantees its performance to certain customers (generally to government entities) through bank guarantees and corporate guarantees. Guarantees are often required for the Group's performance during the installation and operational periods of long-term rural telephony projects such as in Latin America, and for the performance of other projects (government and corporate) throughout the rest of the world. The guarantees typically expire when certain operational milestones are met.
As of December 31, 2014, the aggregate amount of bank guarantees outstanding in order to secure the Group's various performance obligations was $ 35,850, including an aggregate of $ 26,779 on behalf of the subsidiary in Peru. The Group has $ 13,503 of restricted cash as collateral for these guarantees.
In order to guarantee the Group's performance obligations for its activities in Colombia, the Group secured insurance from a Colombian insurance company. The Group has provided the insurance company with various corporate guarantees, guaranteeing the Group's performance and its employee salary and benefit costs of approximately $ 18,205 and $ 3,958, respectively.
In accordance with ASC 460, "Guarantees" ("ASC 460"), as the guarantees above are performance guarantees for the Group's own performance, such guarantees are excluded from the scope of ASC 460. The Group has not recorded any liability for such amounts, since the Group expects that its performance will be acceptable. To date, no guarantees have ever been exercised against the Group.
|
NOTE 8:-
|
DERIVATIVE INSTRUMENTS
|
To protect against changes in value of forecasted foreign currency cash flows resulting from salaries and related payments that are denominated in NIS, the Company has entered into foreign currency forward contracts. These contracts are designated as cash flows hedges, as defined by ASC 815, as amended, and are considered highly effective as hedges of these expenses.
During the years ended December 31, 2014, 2013 and 2012, the Company recognized net income (loss) related to the effective portion of its hedging instruments. The effective portion of the hedged instruments has been included as an offset (addition) of payroll expenses and other operating expenses in the statement of operations in the following line items:
F - 35
GILAT SATELLITE NETWORKS LTD. AND ITS SUBSIDIARIES
NOTES TO CONSOLIDATED FINANCIAL STATEMENTS
U.S. dollars in thousands
|
NOTE 8:-
|
DERIVATIVE INSTRUMENTS (Cont.)
|
|
December 31,
|
||||||||||||
|
2014
|
2013
|
2012
|
||||||||||
|
Cost of revenues of products
|
$ | (107 | ) | $ | 339 | $ | (89 | ) | ||||
|
Cost of revenues of services
|
(413 | ) | 148 | (90 | ) | |||||||
|
Research and development, net
|
- | 717 | (285 | ) | ||||||||
|
Selling and marketing
|
(166 | ) | 297 | (106 | ) | |||||||
|
General and administrative
|
(201 | ) | 402 | (153 | ) | |||||||
| $ | (887 | ) | $ | 1,903 | $ | (723 | ) | |||||
The ineffective portion of the hedged instrument which was recorded during the years ended December 31, 2014, 2013 and 2012, was immaterial and has been recorded as financial income (loss).
The Company's subsidiary entered into forward contracts in order to hedge the exposure to variability in expected future cash flows resulting from changes in related foreign currency exchange rates. These contracts did not meet the requirement for hedge accounting. The amount recorded as financial income related to these contracts in 2014, 2013 and 2012 was $1,949, $0 and $0, respectively.
|
NOTE 9:-
|
EQUITY
|
|
|
a.
|
Share capital:
Ordinary shares confer upon their holders voting rights, the right to receive cash dividends and the right to share in excess assets upon liquidation of the Company.
|
|
|
b.
|
Stock Option Plans:
|
Description of Plans
The Company had three stock option plans, the 2003 Stock Option and Incentive Plans and the 2005 and 2008 Stock Incentive Plans (the "Plans").
The 2003 Plan expired in 2013 although there are still options outstanding under the plan.
The exercise price per share under the 2003 Plan is the higher of (i) $ 5.00 per share; and (ii) the market value of the shares as of the date of the option grant, unless otherwise provided in the stock option agreement.
In December 2005, the Company's shareholders approved the adoption of a new plan, the 2005 Plan with 1,500,000 shares or stock options available for grant. In October 2008, the Company's Board of Directors approved the adoption of a sub-plan to enable qualified optionees certain tax benefits under the Israeli Income Tax Ordinance.
F - 36
GILAT SATELLITE NETWORKS LTD. AND ITS SUBSIDIARIES
NOTES TO CONSOLIDATED FINANCIAL STATEMENTS
U.S. dollars in thousands
|
NOTE 9:-
|
EQUITY (Cont.)
|
The 2005 Plan expired in 2012 although there are still options and RSU's outstanding under the plan.
In October 2008, the compensation stock option committee of the Company's Board of Directors approved the adoption of a new plan, the 2008 Plan with 1,000,000 shares or stock options available for grant and a sub-plan to enable qualified optionees certain tax benefits under the Israeli Income Tax Ordinance. Among the incentives that may be adopted are share options, performance share awards, performance share unit awards, restricted shares, restricted share unit awards and other stock-based awards. In October 2010 and April 2012 the Company's Board of Directors approved, in aggregate, a 3,000,000 shares increase in the number of shares or stock options available for grant under the 2008 Plan to a total of 4,000,000 shares available for future grants. As of December 31, 2014, an aggregate of 309,233 shares of the Company are still available for future grants under the 2008 Plan.
Options granted under the Plans above vest quarterly over two to four years or annually over four years. The options expire six, seven or ten years from the date of grant. RSUs granted under the Plans above (excluding the 2003 plan) vest quarterly or annually over four years. Any options or RSUs, which are forfeited or canceled before expiration, become available for future grants.
Valuation Assumptions
The Company estimates the fair value of stock options granted using the Black-Scholes-Merton option-pricing model. The option-pricing model requires a number of assumptions, of which the most significant are expected stock price volatility and the expected option term. Expected volatility was calculated based upon actual historical stock price movements.
The expected option term represents the period that the Company's stock options are expected to be outstanding and are based on historical incidence of exercise of options. The expected term of options granted is based upon historical experience complying with SAB 110. The risk-free interest rate is based on the yield from U.S. Treasury zero-coupon bonds with an equivalent term. The Company has historically not paid dividends and has no foreseeable plans to pay dividends.
F - 37
GILAT SATELLITE NETWORKS LTD. AND ITS SUBSIDIARIES
NOTES TO CONSOLIDATED FINANCIAL STATEMENTS
U.S. dollars in thousands
|
NOTE 9:-
|
EQUITY (Cont.)
|
Options granted to Employees and Non-employees
The fair value of the Company's stock options granted to employees for the years ended December 31, 2014, 2013 and 2012 was estimated using the following weighted average assumptions:
|
Year ended
December 31,
|
||||||
|
2014
|
2013
|
2012
|
||||
|
Risk free interest
|
1.63%
|
0.90%
|
0.68%
|
|||
|
Dividend yields
|
0%
|
0%
|
0%
|
|||
|
Volatility
|
36%
|
46%
|
45%
|
|||
|
Expected term (in years)
|
4.8
|
5
|
5
|
|||
No options were granted to non-employees during the years ended December 31, 2014 and December 31, 2013. The fair value of the Company's stock options granted to non-employees for the year ended December 31, 2012 was estimated using the following weighted average assumptions: risk free interest of 0.79%, dividend yield of 0%, volatility of 45% and expected term of 6.0 years.
A summary of employee option balances under the Plans as of December 31, 2014 and changes during the year ended December 31, 2014 are as follows:
|
Number of options
|
Weighted-
average
exercise
price
|
Weighted-
average
remaining
contractual term
(in years)
|
Aggregate
intrinsic value
(in thousands)
|
|||||||||||||
|
Outstanding at January 1, 2014
|
5,374,000 | $ | 5.0 | 2.7 | $ | 2,122 | ||||||||||
|
Granted
|
600,000 | $ | 5.2 | |||||||||||||
|
Exercised
|
(272,000 | ) | $ | 4.0 | ||||||||||||
|
Expired
|
(21,750 | ) | $ | 6.5 | ||||||||||||
|
Forfeited
|
(1,248,867 | ) | $ | 5.2 | ||||||||||||
|
Outstanding at December 31, 2014
|
4,431,383 | $ | 5.0 | 2.2 | $ | 1,405 | ||||||||||
|
Exercisable at December 31, 2014
|
3,357,465 | $ | 5.2 | 1.5 | $ | 807 | ||||||||||
|
Vested and expected to vest at December 31, 2014
|
4,339,522 | $ | 5.0 | 2.4 | $ | 1,383 | ||||||||||
F - 38
GILAT SATELLITE NETWORKS LTD. AND ITS SUBSIDIARIES
NOTES TO CONSOLIDATED FINANCIAL STATEMENTS
U.S. dollars in thousands
|
NOTE 9:-
|
EQUITY (Cont.)
|
A summary of employee option balances under the Plans as of December 31, 2013 and 2012 and changes during the years ended on those dates are as follows:
|
Year ended
December 31,
|
||||||||||||||||
|
2013
|
2012
|
|||||||||||||||
|
|
Number
of options
|
Weighted-
average
exercise
price
|
Number
of options
|
Weighted-
average
exercise
price
|
||||||||||||
|
Options outstanding at beginning of year
|
5,879,798 | $ | 5.0 | 4,996,438 | $ | 5.5 | ||||||||||
|
Granted
|
40,000 | $ | 5.3 | 1,150,000 | $ | 3.4 | ||||||||||
|
Exercised
|
(154,498 | ) | $ | 4.2 | (56,000 | ) | $ | 4.1 | ||||||||
|
Expired
|
(151,900 | ) | $ | 5.0 | (8,938 | ) | $ | 77.6 | ||||||||
|
Forfeited
|
(239,400 | ) | $ | 6.0 | (201,702 | ) | $ | 5.7 | ||||||||
|
Options outstanding at end of year
|
5,374,000 | $ | 5.0 | 5,879,798 | $ | 5.0 | ||||||||||
|
Options exercisable at end of year
|
4,097,913 | $ | 5.4 | 4,150,546 | $ | 5.6 | ||||||||||
A summary of non-employee option balances under the Plans as of December 31, 2014 and changes during the year ended December 31, 2014 are as follows:
|
Number of options
|
Weighted-
average
exercise
price
|
Weighted-
average
remaining
contractual term
(in years)
|
Aggregate
intrinsic value
(in thousands)
|
|||||||||||||
|
Outstanding at January 1, 2013
|
35,000 | $ | 4.1 | 4.1 | $ | 34 | ||||||||||
|
Granted
|
- | |||||||||||||||
|
Exercised
|
- | |||||||||||||||
|
Expired
|
- | |||||||||||||||
|
Forfeited
|
- | |||||||||||||||
|
Outstanding at December 31, 2014
|
35,000 | $ | 4.1 | 3.1 | $ | 33 | ||||||||||
|
Exercisable at December 31, 2014
|
23,000 | $ | 4.7 | 2.9 | $ | 13 | ||||||||||
|
Vested and expected to vest at December 31, 2014
|
31,700 | $ | 4.3 | 3.1 | $ | 28 | ||||||||||
F - 39
GILAT SATELLITE NETWORKS LTD. AND ITS SUBSIDIARIES
NOTES TO CONSOLIDATED FINANCIAL STATEMENTS
U.S. dollars in thousands
|
NOTE 9:-
|
EQUITY (Cont.)
|
A summary of non-employee option balances under the Plans as of December 31, 2013 and 2012 and changes during the years ended on those dates are as follows:
|
Year ended
December 31,
|
||||||||||||||||
|
2013
|
2012
|
|||||||||||||||
|
|
Number
of options
|
Weighted-
average
exercise
price
|
Number
of options
|
Weighted-
average
exercise
price
|
||||||||||||
|
Options outstanding at beginning of year
|
35,000 | $ | 4.1 | 365,000 | $ | 6.0 | ||||||||||
|
Granted
|
- | 20,000 | $ | 3.0 | ||||||||||||
|
Exercised
|
- | - | - | |||||||||||||
|
Expired
|
- | - | - | |||||||||||||
|
Forfeited
|
- | (350,000 | ) | $ | 6.0 | |||||||||||
|
Options outstanding at end of year
|
35,000 | $ | 4.1 | 35,000 | $ | 4.1 | ||||||||||
|
Options exercisable at end of year
|
14,625 | $ | 5.1 | 7,125 | $ | 5.7 | ||||||||||
The weighted-average grant-date fair value of options granted to employees during the years ended December 31, 2014, 2013 and 2012 was $1.51, $ 2.17 and $ 1.36, respectively. The weighted-average grant-date fair value of options granted to non-employees during the year ended December 31, 2012 was $ 1.24. The aggregate intrinsic value in the tables above represents the total intrinsic value (the difference between the Company's closing stock price on the last trading day of the year 2014 and the exercise price, multiplied by the number of in-the-money options) that would have been received by the option holders had all option holders exercised their options on December 31, 2014. These amounts change based on the fair market value of the Company's stock. Total intrinsic value of options exercised for the years ended December 31, 2014, 2013 and 2012 was approximately $ 247, $ 201, $ 65 and nil, respectively.
Total grant-date fair value of options and RSUs granted to employees that vested during the years ended December 31, 2014, 2013 and 2012 was approximately $ 1,973, $ 1,747 and $ 1,867, respectively.
Total grant-date fair value of options and RSUs granted to non-employees that vested during the years ended December 31, 2014, 2013 and 2012 was approximately $ 63, $ 62 and $ 134, respectively.
F - 40
GILAT SATELLITE NETWORKS LTD. AND ITS SUBSIDIARIES
NOTES TO CONSOLIDATED FINANCIAL STATEMENTS
U.S. dollars in thousands
|
NOTE 9:-
|
EQUITY (Cont.)
|
The outstanding and exercisable options granted to employees under the Plans as of December 31, 2014, have been separated into ranges of exercise price as follows:
|
Options
|
Weighted
-
|
Options
|
Weighted-
average
|
||||||||||||||||||
|
outstanding
|
average
|
Weighted
|
exercisable
|
exercise
|
|||||||||||||||||
|
Ranges of
|
as of
|
remaining
|
Average
|
as of
|
price of
|
||||||||||||||||
|
Exercise
|
December 31,
|
contractual
|
Exercise
|
December 31,
|
exercisable
|
||||||||||||||||
|
Price
|
2014
|
life (years)
|
Price
|
2014
|
options
|
||||||||||||||||
| $3.00-4.00 | 1,258,000 | 2.4 | $ | 3.6 | 803,500 | $ | 3.7 | ||||||||||||||
| $4.54-6.77 | 3,163,383 | 2.1 | $ | 5.6 | 2,543,965 | $ | 5.7 | ||||||||||||||
| $8.10 | 10,000 | 1.6 | $ | 8.1 | 10,000 | $ | 8.1 | ||||||||||||||
| 4,431,383 | 2.2 | 5.0 | 3,357,465 | 5.2 | |||||||||||||||||
The outstanding and exercisable options granted to non-employees under the Plans as of December 31, 2014, have been separated into ranges of exercise price as follows:
|
Range of
Exercise
Price
|
Options
Outstanding
as of
December 31,
2014
|
Weighted-
average
remaining
contractual
life (years)
|
Weighted-
Average
Exercise
Price
|
Options
exercisable
as of
December 31,
2014
|
Weighted-
average exercise
price of
exercisable
options
|
|||||||||||||||
|
$3.00-5.65
|
35,000 | 3.1 | 4.1 | 23,000 | 4.7 | |||||||||||||||
Restricted Share Units ("RSUs") granted to Employees and Non-employees
The fair value of RSUs is estimated based on the market value of the Company's stock on the date of the award.
During 2014, 2013 and 2012, the Company granted 0, 47,000 and 1,112,500 RSUs, respectively. The entitlement to these RSUs vests over a four-year period (15%, 25%, 30% and 30% each year, respectively) in quarterly or in annual trenches. The following table summarizes information regarding the number of RSUs issued and outstanding as of December 31, 2014, 2013 and 2012 and changes during the years ended on those dates:
Employees:
|
Year ended December 31,
|
||||||||||||||||||||||||
|
2014
|
2013
|
2012
|
||||||||||||||||||||||
|
Number of RSUs
|
Weighted-
average
grant date
fair value
|
Number of RSUs
|
Weighted-
average
grant date
fair value
|
Number of RSUs
|
Weighted-
average
grant date
fair value
|
|||||||||||||||||||
|
RSUs outstanding at the beginning of the year
|
991,276 | $ | 4.1 | 1,348,452 | $ | 4.1 | 846,147 | $ | 4.2 | |||||||||||||||
|
Granted
|
- | 47,000 | $ | 5.8 | 1,112,500 | $ | 3.9 | |||||||||||||||||
|
Vested
|
(323,650 | ) | $ | 4.1 | (262,426 | ) | $ | 4.3 | (445,731 | ) | $ | 3.4 | ||||||||||||
|
Forfeited
|
(96,001 | ) | $ | 4.1 | (141,750 | ) | $ | 4.3 | (164,464 | ) | $ | 5.1 | ||||||||||||
|
RSUs outstanding at the end of the year
|
571,625 | $ | 4.1 | 991,276 | $ | 4.1 | 1,348,452 | $ | 4.1 | |||||||||||||||
F - 41
GILAT SATELLITE NETWORKS LTD. AND ITS SUBSIDIARIES
NOTES TO CONSOLIDATED FINANCIAL STATEMENTS
U.S. dollars in thousands
|
NOTE 9:-
|
EQUITY (Cont.)
|
Non-employees:
|
Year ended December 31,
|
||||||||||||||||||||||||
|
2014
|
2013
|
2012
|
||||||||||||||||||||||
|
Number of RSUs
|
Weighted-
average
grant date
fair value
|
Number of RSUs
|
Weighted-
average
grant date
fair value
|
Number of RSUs
|
Weighted-
average
grant date
fair value
|
|||||||||||||||||||
|
RSUs outstanding at the beginning of the year
|
10,500 | $ | 5.2 | 19,250 | $ | 5.2 | 32,250 | $ | 4.7 | |||||||||||||||
|
Granted
|
- | - | - | - | - | $ | - | |||||||||||||||||
|
Vested
|
(9,000 | ) | $ | 5.2 | (8,750 | ) | $ | 5.2 | (13,000 | ) | $ | 4.0 | ||||||||||||
|
Forfeited
|
- | - | - | - | - | - | ||||||||||||||||||
|
RSUs outstanding at the end of the year
|
1,500 | $ | 5.2 | 10,500 | $ | 5.2 | 19,250 | $ | 5.2 | |||||||||||||||
Additional Stock-based Compensation Data
As of December 31, 2014, there was approximately $ 3,250 of unrecognized compensation costs related to non-vested stock-based compensation arrangements granted to employees under the Plans and approximately $ 19 of unrecognized compensation costs related to non-vested stock-based compensation arrangements granted to non-employees under the Plans. The cost related to employees is expected to be recognized over a weighted-average period of 1.06 years and the cost related to non-employees is expected to be recognized over the weighted-average period of 0.90 year.
|
|
c.
|
In December 2012, the Company approved the grant of 150,000 stock options to three new directors (out of which 100,000 stock options were granted to FIMI IV 2007 LTD, a shareholder in the Company, in connection with director services provided by two of the new directors) at an exercise price of $ 5.31 per share. These options vest ratably, each quarter, over a three year period. The fair value of these options was estimated at $ 299, using the Black-Scholes option-pricing valuation model which is expected to be recognized over a weighted-average period of 1.63 years starting from the grant date. These grants are included in the above tables as employee grants.
|
|
|
d.
|
In May 2014, the Company approved the grant of 50,000 stock options to a new director at an exercise price of $ 5.24 per share. These options vest ratably, each quarter, over a three-year period. The fair value of these options was estimated at $ 73, using the Black-Scholes option-pricing valuation model which is expected to be recognized over a weighted-average period of 1.63 years starting from the grant date. This grant is included in the above tables as employee grants.
|
|
|
e.
|
In July 2014, the Company approved the grant of 250,000 stock options to its Chairman of the Board of Directors at an exercise price of $ 5.06 per share. These options vest ratably, each quarter, over a four-year period. The fair value of these options was estimated at $ 345, using the Black-Scholes option-pricing valuation model which is expected to be recognized over a weighted-average period of 2.01 years starting from the grant date. This grant is included in the above tables as employee grants.
|
F - 42
GILAT SATELLITE NETWORKS LTD. AND ITS SUBSIDIARIES
NOTES TO CONSOLIDATED FINANCIAL STATEMENTS
U.S. dollars in thousands
|
NOTE 9:-
|
EQUITY (Cont.)
|
|
|
f.
|
In December 2014, the Company approved the grant of 100,000 stock options to two new directors at exercise prices of $ 5.15 and $ 5.13 per share. These options vest ratably, each quarter, over a three-year period. The fair value of these options was estimated at $ 125, using the Black-Scholes option-pricing valuation model which is expected to be recognized over a weighted-average period of 1.63 years starting from the grant date. These grants are included in the above tables as employee grants.
|
|
|
g.
|
Dividends:
|
|
|
1.
|
In the event that cash dividends are declared by the Company, such dividends will be declared and paid in Israeli currency. Under current Israeli regulations, any cash dividend in Israeli currency paid in respect of ordinary shares purchased by non-residents of Israel with non-Israeli currency, may be freely repatriated in such non-Israeli currency, at the exchange rate prevailing at the time of repatriation. The Company does not expect to pay cash dividends in the foreseeable future.
|
|
|
2.
|
Pursuant to the terms of a credit line from a bank (see also note 12d), the Company is restricted from paying cash dividends to its shareholders without initial approval from the bank.
|
|
NOTE 10:-
|
RESTRUCTURING COST
|
During the fourth quarters of 2013 and 2012, the Company initiated restructuring plans to improve its operating efficiency at its various operating sites and to reduce its operating expenses. As a result of the restructuring plans the Company recognized $ 564 and $ 315 of employee contract termination costs on its statement of operations included at "Restructuring costs" for the years ended December 31, 2013 and 2012, respectively. The restructuring expenses for the 2012 and 2013 plans were fully paid in 2013 and 2014, respectively.
F - 43
GILAT SATELLITE NETWORKS LTD. AND ITS SUBSIDIARIES
NOTES TO CONSOLIDATED FINANCIAL STATEMENTS
U.S. dollars in thousands
|
NOTE 11:-
|
TAXES ON INCOME
|
|
|
a.
|
Accounting for uncertainty in income taxes:
|
Interest associated with uncertain tax positions are classified as financial expenses in the financial statements and penalties as general and administrative expenses.
A reconciliation of the beginning and ending amount of unrecognized tax benefits is as follows:
|
December 31,
|
||||||||
|
2014
|
2013
|
|||||||
|
Balance at beginning of year
|
$ | 4,752 | $ | 4,548 | ||||
|
Reductions for prior years' tax position
|
(3,571 | ) | (234 | ) | ||||
|
Additions for current year's tax position
|
36 | 438 | ||||||
|
Balance at the end of year
|
$ | 1,214 | $ | 4,752 | ||||
The unrecognized tax benefits include accrued penalties and interest of $ 263 and $ 2,604 at December 31, 2014 and 2013, respectively. During the years ended December 31, 2014, and 2013, the Group recorded income of $ 2,290 and $ 61 for penalties and interest, respectively. The unrecognized tax benefits as of December 31, 2014 and 2013 would, if recognized, reduce the annual effective tax rate.
The Group does not expect a reversal of unrecognized tax benefits in the next 12 months.
The Company and its subsidiaries file income tax returns in Israel and in other jurisdictions of its subsidiaries. As of December 31, 2014, the tax returns of the Company and its main subsidiaries are open to examination by the tax authorities for the tax years 2006 through 2013.
|
|
b.
|
Corporate tax rates:
|
Generally, income of Israeli companies is subject to corporate tax. The Israeli corporate tax rate was 26.5% for tax year 2014 and 25% for years 2013 and 2012.
|
|
c.
|
Tax benefits under the Law for the Encouragement of Capital Investments, 1959 ("the Law"):
|
The Company has been granted an "Approved Enterprise" status, under the Law, for nine investment programs in the alternative program, by the Israeli Government.
F - 44
GILAT SATELLITE NETWORKS LTD. AND ITS SUBSIDIARIES
NOTES TO CONSOLIDATED FINANCIAL STATEMENTS
U.S. dollars in thousands
|
NOTE 11:-
|
TAXES ON INCOME (Cont.)
|
On April 1, 2005, an amendment to the Law came into effect (the "Amendment") which significantly changed the provisions of the Law. The Amendment enacted major changes in the manner in which tax benefits are awarded under the Law so that companies no longer require Investment Center approval in order to qualify for tax benefits.
Tax benefits are available under the Amendment for production facilities, which are generally required to derive more than 25% of the Company's business income from export. The Amendment states that a company must make an investment of a minimum amount in the acquisition of productive assets such as machinery and equipment. Such investment may be made over a period of no more than three years ending at the end of the year in which the company requested to have the tax benefits apply to the Beneficiary Enterprise (the "Year of Election"). A facility that is approved under the Amendment is called a "Beneficiary Enterprise".
The Company was eligible under the terms of minimum qualifying investment and elected 2005 and 2011 as the Years of Election.
The duration of tax benefits is subject to a limitation of the earlier of 7-10 years from the Commencement Year, or 12 years from the first day of the Year of Election. The period of benefits of the Benefitted Enterprise will expire in 2017 and in 2023. As of December 31, 2014, the Company did not generate income under the provisions of the Amendment.
The tax benefits includes exemption from corporate tax on undistributed income for a period of two to ten years, depending on the geographic location of the Benefitted Enterprise within Israel, and a reduced corporate tax rate of 10% to 25% for the remainder of the benefits period, depending on the level of foreign investment in the company.
On January 1, 2011, new legislation that constitutes a major amendment to the Investment Law was enacted (the "Amendment Legislation"). Under the Amendment Legislation, a uniform rate of corporate tax would apply to all qualified income of certain Industrial Companies, as opposed to the current law's incentives that are limited to income from "beneficiary Enterprises" during their benefits period. According to the Amendment Legislation, the uniform tax rate during 2011-2012 was 10% in geographical areas in Israel designated as Development Zone A and 15% elsewhere in Israel, 7% and 12.5%, respectively, in 2013. The uniform tax rate for 2014 and onwards is set to 9% in geographical areas in Israel designated as Development Zone A and 16% elsewhere in Israel. The profits of these Industrial Companies would be freely distributable as dividends, subject to a 20% withholding tax as of 2014 (or lower, under an applicable tax treaty). The Company is not located in Development Zone A.
Under the transitory provisions of the Amendment Legislation, the Company may elect whether to irrevocably implement the new law in its Israeli company while waiving benefits provided under the current law or keep implementing the current law during the next years. Changing from the current law to the new law is permissible at any stage. The Company is examining the possible effect of the Amendment Legislation on its results.
F - 45
GILAT SATELLITE NETWORKS LTD. AND ITS SUBSIDIARIES
NOTES TO CONSOLIDATED FINANCIAL STATEMENTS
U.S. dollars in thousands
|
NOTE 11:-
|
TAXES ON INCOME (Cont.)
|
The Company does not expect to pay any cash dividends. In the event of distribution of dividends from the above mentioned tax exempt income, the amount distributed would be taxed at the corporate tax rate applicable to such profits as if the Company had not elected the alternative program of benefits (depending on the level of foreign investment in the Company), currently between 10% to 25% for an Benefitted Enterprise.
Income from sources other than a "Beneficiary Enterprise" during the benefit period is subject to tax at the regular corporate tax rate (26.5% from January 1, 2014 and onwards).
|
|
d.
|
Non-Israeli subsidiaries:
|
Non-Israeli subsidiaries are taxed according to the tax laws in their respective domiciles of residence. The Company has not made any provisions relating to undistributed earnings of the Company's foreign subsidiaries since the Company has no current plans to distribute such earnings. If earnings are distributed to Israel in the form of dividends or otherwise, the Company may be subject to additional Israeli income taxes (subject to an adjustment for foreign tax credits) and foreign withholding taxes. It is not practicable to determine the amount of the unrecognized deferred tax liability for temporary differences related to investments in foreign subsidiaries.
|
|
e.
|
Carryforward tax losses and credits:
|
As of December 31, 2014, the Company had operating loss carry forwards for Israeli income tax purposes of approximately $ 69,000, which may be offset indefinitely against future taxable income.
The Company's U.S. subsidiaries had carryforward tax losses of approximately $ 28,000 as of December 31, 2014. Utilization of U.S. net operating losses may be subject to substantial annual limitation due to the "change in ownership" provisions of Internal Revenue Code of 1986 and similar state provisions. The annual limitations may result in the expiration of net operating loss before utilization. In the U.S, carryforward tax losses can be utilized within 20 years.
The Group has carryforward tax losses relating to other subsidiaries in Europe and Latin America of approximately $ 6,500 and $ 18,000, as of December 31, 2014 respectively.
|
|
f.
|
Deferred income taxes:
|
Deferred income taxes reflect the net tax effects of temporary differences between the carrying amounts of assets and liabilities for financial reporting purposes and the amounts used for income tax purposes. Significant components of the Groups' deferred tax liabilities and assets are as follows:
F - 46
GILAT SATELLITE NETWORKS LTD. AND ITS SUBSIDIARIES
NOTES TO CONSOLIDATED FINANCIAL STATEMENTS
U.S. dollars in thousands
|
NOTE 11:-
|
TAXES ON INCOME (Cont.)
|
|
December 31,
|
|||||||||
|
2014
|
2013
|
||||||||
| 1. |
Provided in respect of the following:
|
||||||||
|
Carryforward tax losses
|
$ | 26,274 | $ | 44,694 | |||||
|
Temporary differences relating to property, equipment and intangibles
|
2,501 | 1,207 | |||||||
|
Other
|
8,517 | 8,039 | |||||||
|
Gross deferred tax assets
|
37,292 | 53,940 | |||||||
|
Valuation allowance
|
(30,120 | ) | (44,901 | ) | |||||
|
Net deferred tax assets
|
7,172 | 9,039 | |||||||
|
Gross deferred tax liabilities
|
|||||||||
|
Temporary differences relating to property, equipment and intangibles
|
(7,103 | ) | (8,966 | ) | |||||
|
Other
|
- | (7 | ) | ||||||
| $ | (7,103 | ) | $ | (8,973 | ) | ||||
|
Net deferred tax assets (liabilities)
|
$ | 69 | $ | 66 | |||||
|
Domestic
|
$ | - | $ | - | |||||
|
Foreign
|
69 | 66 | |||||||
| $ | 69 | $ | 66 | ||||||
| 2. |
Deferred taxes are included in the consolidated balance sheets, as follows:
|
||||||||
|
Current assets
|
$ | 69 | $ | 66 | |||||
| $ | 69 | $ | 66 | ||||||
|
|
3.
|
As of December 31, 2014, the Group decreased the valuation allowance by approximately $ 14,781, resulting from changes in other temporary differences and from carryforward tax losses, mainly forfeiture of carryforward tax losses. The Company provided valuation allowance for a significant portion of the deferred tax regarding the carryforwards losses and other temporary differences that management believes is not expected to be realized in the foreseeable future.
|
|
|
4.
|
The functional and reporting currency of the Company and certain of its subsidiaries is the dollar. The difference between the annual changes in the NIS/dollar exchange rate causes a further difference between taxable income and the income before taxes shown in the financial statements. In accordance with ASC 740-10, the Company has not provided deferred income taxes on the difference between the functional currency and the tax basis of assets and liabilities.
|
F - 47
GILAT SATELLITE NETWORKS LTD. AND ITS SUBSIDIARIES
NOTES TO CONSOLIDATED FINANCIAL STATEMENTS
U.S. dollars in thousands
|
NOTE 11:-
|
TAXES ON INCOME (Cont.)
|
|
|
g.
|
Reconciling items between the statutory tax rate of the Company and the effective tax rate:
|
|
Year ended
December 31,
|
||||||||||||
|
2014
|
2013
|
2012
|
||||||||||
|
Income (loss) before taxes, as reported in the consolidated statements of operations
|
$ | 1,200 | $ | (10,332 | ) | $ | (22,815 | ) | ||||
|
Statutory tax rate
|
26.5 | % | 25 | % | 25 | % | ||||||
|
Theoretical tax expenses (income) on the above amount at the Israeli statutory tax rate
|
$ | 318 | $ | (2,583 | ) | $ | (5,704 | ) | ||||
|
Currency differences
|
2,545 | 1,395 | (713 | ) | ||||||||
|
Tax adjustment in respect of different tax rates and "Approved Enterprise" status
|
1,425 | 3,041 | (2,961 | ) | ||||||||
|
Changes in valuation allowance
|
(14,781 | ) | (17,580 | ) | (4,567 | ) | ||||||
|
Taxes in respect of prior years
|
332 | (68 | ) | 835 | ||||||||
|
Stock compensation relating to options per ASC 718
|
471 | 364 | 331 | |||||||||
|
Changes in valuation allowance related to capital gains
|
(222 | ) | (2,067 | ) | (713 | ) | ||||||
|
Forfeiture of carryforward tax losses
|
13,549 | 16,542 | 2,551 | |||||||||
|
Wavestream goodwill impairment
|
- | - | 8,831 | |||||||||
|
Exempt revenues - subsidy
|
(2,561 | ) | (1,089 | ) | (798 | ) | ||||||
|
Nondeductible expenses and other differences
|
825 | 1,290 | 1,015 | |||||||||
| $ | 1,901 | $ | (755 | ) | $ | (1,893 | ) | |||||
|
|
h.
|
Taxes on income included in the consolidated statements of operations:
|
|
Year ended
December 31,
|
||||||||||||
|
2014
|
2013
|
2012
|
||||||||||
|
Current year
|
$ | 1,562 | $ | 2,046 | $ | 928 | ||||||
|
Prior years
|
332 | (68 | ) | 835 | ||||||||
|
Deferred income taxes
|
7 | (2,733 | ) | (3,656 | ) | |||||||
| $ | 1,901 | $ | (755 | ) | $ | (1,893 | ) | |||||
|
Domestic
|
$ | 800 | $ | 648 | $ | 1,471 | ||||||
|
Foreign
|
1,101 | (1,403 | ) | (3,364 | ) | |||||||
| $ | 1,901 | $ | (755 | ) | $ | (1,893 | ) | |||||
F - 48
GILAT SATELLITE NETWORKS LTD. AND ITS SUBSIDIARIES
NOTES TO CONSOLIDATED FINANCIAL STATEMENTS
U.S. dollars in thousands
|
NOTE 11:-
|
TAXES ON INCOME (Cont.)
|
|
|
i.
|
Income (loss) before taxes on income from continuing operations:
|
|
Year ended
December 31,
|
||||||||||||
|
2014
|
2013
|
2012
|
||||||||||
|
Domestic
|
$ | ( 9,568 | ) | $ | (14,021 | ) | $ | 1,644 | ||||
|
Foreign
|
10,768 | 3,689 | (24,459 | ) | ||||||||
| $ | 1,200 | $ | (10,332 | ) | $ | (22,815 | ) | |||||
|
NOTE 12:-
|
SUPPLEMENTARY BALANCE SHEET INFORMATION
|
|
|
a.
|
Other current assets:
|
|
December 31,
|
||||||||
|
2014
|
2013
|
|||||||
|
VAT receivables
|
$ | 2,755 | $ | 2,214 | ||||
|
Prepaid expenses
|
1,707 | 2,512 | ||||||
|
Deferred charges
|
1,735 | 1,273 | ||||||
|
Tax receivables
|
843 | 596 | ||||||
|
Employees
|
215 | 58 | ||||||
|
Income receivable
|
858 | 332 | ||||||
|
Advance payments to suppliers
|
3,611 | 1,197 | ||||||
|
Short term deferred taxes
|
69 | 66 | ||||||
|
Financial instruments
|
1,949 | - | ||||||
|
Other
|
1,018 | 1,895 | ||||||
| $ | 14,760 | $ | 10,143 | |||||
|
|
b.
|
Short-term bank credit:
|
The following is classified by currency and interest rates:
|
Weighted-
average
interest rate
|
||||||||||||||||
|
December 31,
|
December 31,
|
|||||||||||||||
|
2014
|
2013
|
2014
|
2013
|
|||||||||||||
|
%
|
||||||||||||||||
|
In dollar
|
2.43 | % | - | $ | 15,857 | $ | - | |||||||||
The Group has restricted cash of $ 12,500 as collateral for part of its short-term bank credit.
F - 49
GILAT SATELLITE NETWORKS LTD. AND ITS SUBSIDIARIES
NOTES TO CONSOLIDATED FINANCIAL STATEMENTS
U.S. dollars in thousands
|
NOTE 12:-
|
SUPPLEMENTARY BALANCE SHEET INFORMATION (Cont.)
|
|
|
c.
|
Other current liabilities:
|
|
December 31,
|
||||||||
|
2014
|
2013
|
|||||||
|
Advances from customers
|
$ | 2,940 | $ | 28,878 | ||||
|
Payroll and related employee accruals
|
6,793 | 6,323 | ||||||
|
Deferred revenue
|
3,987 | 6,255 | ||||||
|
Provision for vacation pay
|
5,101 | 6,008 | ||||||
|
Derivative instruments
|
806 | - | ||||||
|
Government authorities
|
1,173 | 2,233 | ||||||
|
Other
|
727 | 4,969 | ||||||
| $ | 21,527 | $ | 54,666 | |||||
|
|
d.
|
Long-term loans:
|
|
Interest rate for
|
December 31,
|
||||||||||||||||||
|
2014
|
2013
|
2014
|
2013
|
||||||||||||||||
|
Linkage
|
%
|
%
|
Maturity
|
||||||||||||||||
|
Loans from banks:
|
|||||||||||||||||||
|
(a)
|
U.S.dollar
|
4.77% | 4.77% | 2012-2022 | $ | 28,000 | $ | 32,000 | |||||||||||
|
(b)
|
Euro
|
EURIBOR +2.75%
|
EURIBOR +2.75%
|
2001-2020 | 2,534 | 3,425 | |||||||||||||
|
(c)
|
Euro
|
7.9% | 7.9% | 2012-2017 | 332 | 491 | |||||||||||||
| 30,866 | 35,916 | ||||||||||||||||||
|
Less - current maturities
|
4,595 | 4,665 | |||||||||||||||||
| $ | 26,271 | $ | 31,251 | ||||||||||||||||
|
|
(a)
|
The Company entered into a loan agreement with an Israeli bank. The loan is secured
by a floating charge on the assets of the Company, and is further secured by a fixed pledge (mortgage) on the Company's real estate in Israel. In addition, there are financial covenants associated with the loan. As of December 31, 2014 the Company is in compliance with these covenants.
|
|
|
(b)
|
A Dutch subsidiary of the Company entered into a mortgage and loan agreement with a German bank. The amount of the mortgage is collateralized by the subsidiary's facilities in Germany.
|
|
|
(c)
|
Raysat BG entered into a mortgage business loan with a Bulgarian bank. The amount of the mortgage is collateralized by Raysat BG building in Bulgaria.
|
F - 50
GILAT SATELLITE NETWORKS LTD. AND ITS SUBSIDIARIES
NOTES TO CONSOLIDATED FINANCIAL STATEMENTS
U.S. dollars in thousands
|
NOTE 12:-
|
SUPPLEMENTARY BALANCE SHEET INFORMATION (Cont.)
|
|
|
e.
|
Long-term debt maturities for loans after December 31, 2014, are as follows:
|
|
Year ending December 31,
|
||||
|
2015
|
$ | 4,595 | ||
|
2016
|
4,604 | |||
|
2017
|
4,592 | |||
|
2018
|
4,486 | |||
|
2019
|
4,486 | |||
|
2020 and thereafter
|
8,103 | |||
| $ | 30,866 | |||
Interest expenses on the long-term loans amounted to $1,553, $ 1,854 and $ 2,153 for the years ended December 31, 2014, 2013 and 2012, respectively.
|
|
f.
|
Other long-term liabilities:
|
|
December 31,
|
||||||||
|
2014
|
2013
|
|||||||
|
Long-term tax accrual
|
$ | 1,174 | $ | 4,274 | ||||
|
Deferred revenue
|
32 | 76 | ||||||
|
Other
|
3,973 | 527 | ||||||
| $ | 5,179 | $ | 4,877 | |||||
|
NOTE 13:-
|
SELECTED STATEMENTS OF OPERATIONS DATA
|
|
|
a.
|
Allowance for doubtful accounts:
|
|
Year ended
December 31,
|
||||||||||||
|
2014
|
2013
|
2012
|
||||||||||
|
Balance at beginning of year
|
$ | 3,179 | $ | 3,602 | $ | 3,525 | ||||||
|
Increase during the year
|
218 | 808 | 986 | |||||||||
|
Amounts collected
|
(130 | ) | (235 | ) | (222 | ) | ||||||
|
Write-off of bad debts
|
(791 | ) | (996 | ) | (687 | ) | ||||||
|
Balance at the end of year
|
$ | 2,476 | $ | 3,179 | $ | 3,602 | ||||||
F - 51
GILAT SATELLITE NETWORKS LTD. AND ITS SUBSIDIARIES
NOTES TO CONSOLIDATED FINANCIAL STATEMENTS
U.S. dollars in thousands
|
NOTE 13:-
|
SELECTED STATEMENTS OF OPERATIONS DATA (Cont.)
|
|
|
b.
|
Financial expenses, net:
|
|
Year ended
December 31,
|
||||||||||||
|
2014
|
2013
|
2012
|
||||||||||
|
Income:
|
||||||||||||
|
Interest on cash equivalents, bank deposits and restricted cash
|
$ | 288 | $ | 411 | $ | 689 | ||||||
|
Other
|
169 | - | 156 | |||||||||
| 457 | 411 | 845 | ||||||||||
|
Expenses:
|
||||||||||||
|
Interest with respect to short-term bank credit and other
|
240 | 138 | 177 | |||||||||
|
Interest with respect to long-term loans
|
1,553 | 1,854 | 2,153 | |||||||||
|
Exchange rate differences
|
2,501 | 3,269 | 1,067 | |||||||||
|
Other
|
- | 1,389 | 880 | |||||||||
| 4,294 | 6,650 | 4,277 | ||||||||||
|
Total financial expenses, net
|
$ | (3,837 | ) | $ | (6,239 | ) | $ | (3,432 | ) | |||
|
|
c.
|
Other income:
|
|
Year ended
December 31,
|
||||||||||||
|
2014
|
2013
|
2012
|
||||||||||
|
Settlement agreements relating to the aborted Agreement and Plan of Merger
|
$ | - | $ | - | $ | 2,727 | ||||||
|
Other
|
- | - | 2 | |||||||||
| $ | - | $ | - | $ | 2,729 | |||||||
F - 52
GILAT SATELLITE NETWORKS LTD. AND ITS SUBSIDIARIES
NOTES TO CONSOLIDATED FINANCIAL STATEMENTS
U.S. dollars in thousands
|
NOTE 14:-
|
CUSTOMERS, GEOGRAPHIC AND SEGMENT INFORMATION
|
The Group applies ASC 280, "Segment Reporting" ("ASC 280"). Segments are managed separately and can be described as follows:
Commencing in 2012, in accordance with the Company organizational changes instituted that year, the Company's business is managed and reported as three separate reportable segments, comprised of the Company's named Commercial, Mobility (previously named Defense) and Services Divisions:
|
|
·
|
Commercial Division - provides VSAT networks, satellite communication products, small cell solutions and associated professional services to service providers, satellite operators and Mobile Network Operators (MNOs) worldwide, including for high throughput satellites, or HTS, initiatives worldwide.
|
|
|
·
|
Mobility Division provides on-the-Move / on-the-Pause satellite communication products and solutions to system integrators, defense and homeland security organizations worldwide and also includes the operations of Wavestream Corporation, or Wavestream, our subsidiary, whose sales are primarily to system integrators, defense and homeland security organizations.
|
|
|
·
|
Service Division comprised of service businesses in Peru and Colombia, which offer rural telephony and Internet access solutions.
|
|
|
a.
|
Information on the reportable segments:
|
|
|
1.
|
The measurement of the reportable operating segments is based on the same accounting principles applied in these financial statements which includes certain corporate overhead allocations. During 2014, the Company revised the measurement of each segment, due to a new allocation of corporate overhead that was based on new key performance indicators determined by Company's management as reviewed by the Chief Operating Decision Maker (“CODM”). Applying the same method of corporate overhead allocations used in 2014 to the results of the year ended December 31, 2013 would result in an operating income (loss) of $ (2,292), $ (10,738) and $ 8,937 for the Commercial, Mobility and Services segments, respectively and would have no effect on the operating income of the segments in the year ended December 31, 2012.
|
F - 53
GILAT SATELLITE NETWORKS LTD. AND ITS SUBSIDIARIES
NOTES TO CONSOLIDATED FINANCIAL STATEMENTS
U.S. dollars in thousands
|
NOTE 14:-
|
CUSTOMERS, GEOGRAPHIC AND SEGMENT INFORMATION (Cont.)
|
|
|
2.
|
Financial data relating to reportable operating segments:
|
|
Year ended
December 31, 2014
|
||||||||||||||||
|
Commercial
|
Mobility
|
Services
|
Total
|
|||||||||||||
|
Revenues
|
130,306 | 54,817 | 50,010 | 235,133 | ||||||||||||
|
Cost of Revenues
|
77,587 | 37,023 | 36,888 | 151,498 | ||||||||||||
|
Gross profit
|
52,719 | 17,794 | 13,122 | 83,635 | ||||||||||||
|
R&D expenses:
|
||||||||||||||||
|
Expenses incurred
|
19,099 | 8,536 | - | 27,635 | ||||||||||||
|
Less - grants
|
2,015 | 462 | - | 2,477 | ||||||||||||
| 17,084 | 8,074 | - | 25,158 | |||||||||||||
|
Selling and marketing
|
23,401 | 7,809 | 1,327 | 32,537 | ||||||||||||
|
General and administrative
|
7,808 | 5,961 | 7,134 | 20,903 | ||||||||||||
|
Operating income (loss)
|
4,426 | (4,050 | ) | 4,661 | 5,037 | |||||||||||
|
Financial expenses, net
|
(3,837 | ) | ||||||||||||||
|
Income before taxes
|
1,200 | |||||||||||||||
|
Taxes on income
|
1,901 | |||||||||||||||
|
Net loss from continuing operations
|
(701 | ) | ||||||||||||||
|
Net loss from discontinued operations
|
(795 | ) | ||||||||||||||
|
Net loss
|
(1,496 | ) | ||||||||||||||
|
Depreciation and amortization expenses
|
4,885 | 8,220 | 2,846 | 15,951 | ||||||||||||
|
Year ended
December 31, 2013
|
||||||||||||||||
|
Commercial
|
Mobility
|
Services
|
Total
|
|||||||||||||
|
Revenues
|
141,576 | 48,211 | 45,079 | 234,866 | ||||||||||||
|
Cost of Revenues
|
94,966 | 33,773 | 26,471 | 155,210 | ||||||||||||
|
Gross profit
|
46,610 | 14,438 | 18,608 | 79,656 | ||||||||||||
|
R&D expenses:
|
||||||||||||||||
|
Expenses incurred
|
18,403 | 11,088 | - | 29,491 | ||||||||||||
|
Less - grants
|
1,203 | 388 | - | 1,591 | ||||||||||||
| 17,200 | 10,700 | - | 27,900 | |||||||||||||
|
Selling and marketing
|
22,759 | 8,139 | 1,316 | 32,214 | ||||||||||||
|
General and administrative
|
9,973 | 7,744 | 5,354 | 23,071 | ||||||||||||
|
Restructuring costs
|
406 | 158 | - | 564 | ||||||||||||
|
Operating income (loss)
|
(3,728 | ) | (12,303 | ) | 11,938 | (4,093 | ) | |||||||||
|
Financial expenses, net
|
(6,239 | ) | ||||||||||||||
|
Loss before taxes
|
(10,332 | ) | ||||||||||||||
|
Tax benefit
|
(755 | ) | ||||||||||||||
|
Net loss from continuing operations
|
(9,577 | ) | ||||||||||||||
|
Net loss from discontinued operations
|
(8,320 | ) | ||||||||||||||
|
Net loss
|
(17,897 | ) | ||||||||||||||
|
Depreciation and amortization expenses
|
4,996 | 8,469 | 4,094 | 17,559 | ||||||||||||
F - 54
GILAT SATELLITE NETWORKS LTD. AND ITS SUBSIDIARIES
NOTES TO CONSOLIDATED FINANCIAL STATEMENTS
U.S. dollars in thousands
|
NOTE 14:-
|
CUSTOMERS, GEOGRAPHIC AND SEGMENT INFORMATION (Cont.)
|
|
Year ended
December 31, 2012
|
||||||||||||||||
|
Commercial
|
Mobility
|
Services
|
Total
|
|||||||||||||
|
Revenues
|
158,882 | 55,371 | 57,313 | 271,566 | ||||||||||||
|
Cost of Revenues
|
97,310 | 40,998 | 35,329 | 173,637 | ||||||||||||
|
Gross profit
|
61,572 | 14,373 | 21,984 | 97,929 | ||||||||||||
|
R&D expenses:
|
||||||||||||||||
|
Expenses incurred
|
19,561 | 12,735 | - | 32,296 | ||||||||||||
|
Less - grants
|
2,261 | 794 | - | 3,055 | ||||||||||||
| 17,300 | 11,941 | - | 29,241 | |||||||||||||
|
Selling and marketing
|
24,184 | 9,128 | 1,676 | 34,988 | ||||||||||||
|
General and administrative
|
11,221 | 4,940 | 7,457 | 23,618 | ||||||||||||
|
Restructuring costs
|
219 | 96 | - | 315 | ||||||||||||
|
Impairment of goodwill and intangible assets
|
- | 31,879 | - | 31,879 | ||||||||||||
|
Operating income (loss)
|
8,648 | (43,611 | ) | 12,851 | (22,112 | ) | ||||||||||
|
Financial expenses, net
|
(3,432 | ) | ||||||||||||||
|
Other income
|
2,729 | |||||||||||||||
|
Loss before taxes
|
(22,815 | ) | ||||||||||||||
|
Tax benefit
|
(1,893 | ) | ||||||||||||||
|
Net loss from continuing operations
|
(20,922 | ) | ||||||||||||||
|
Net loss from discontinued operations
|
(2,270 | ) | ||||||||||||||
|
Net loss
|
(23,192 | ) | ||||||||||||||
|
Depreciation and amortization expenses
|
4,960 | 9,723 | 3989 | 18,672 | ||||||||||||
|
|
b.
|
Revenues by geographic areas:
|
Following is a summary of revenues by geographic areas. Revenues attributed to geographic areas, based on the location of the end customers and in accordance with ASC 280, are as follows:
|
Year ended
December 31,
|
||||||||||||
|
2014
|
2013
|
2012
|
||||||||||
|
South America and Central America
|
$ | 110,825 | $ | 84,048 | $ | 115,190 | ||||||
|
Asia and Asia Pacific
|
51,983 | 91,616 | 84,482 | |||||||||
|
North America
|
41,951 | 26,155 | 39,087 | |||||||||
|
Europe
|
16,393 | 23,096 | 23,906 | |||||||||
|
Africa
|
13,981 | 9,951 | 8,901 | |||||||||
| $ | 235,133 | $ | 234,866 | $ | 271,566 | |||||||
|
|
c.
|
During 2014, the Group did not have any customer generating revenues exceeding 10% of the Group's total revenues.
Revenues from a major Commercial Division customer located in Australia accounted for 21% of total consolidated revenues for the year ended December 31, 2013.
|
F - 55
GILAT SATELLITE NETWORKS LTD. AND ITS SUBSIDIARIES
NOTES TO CONSOLIDATED FINANCIAL STATEMENTS
U.S. dollars in thousands
|
NOTE 14:-
|
CUSTOMERS, GEOGRAPHIC AND SEGMENT INFORMATION (Cont.)
|
Revenues from two major customers located in Australia and in Latin America accounted for 17% (included in Commercial Division) and 13% (included in Services Division) of total consolidated revenues for the year ended December 31, 2012, respectively.
|
|
d.
|
The Group's long-lived assets are located as follows:
|
|
December 31,
|
||||||||
|
2014
|
2013
|
|||||||
|
Israel
|
$ | 66,457 | $ | 68,527 | ||||
|
Latin America
|
11,932 | 4,276 | ||||||
|
United States
|
1,999 | 1,936 | ||||||
|
Europe
|
9,486 | 9,453 | ||||||
|
Other
|
1,019 | 1,177 | ||||||
| $ | 90,893 | $ | 85,369 | |||||
|
NOTE 15:-
|
SUBSEQUENT EVENTS
|
In March 2015, the Company's subsidiary was awarded three Built, Operate and Transfer ("BOT") projects, valued at a total amount of approximately $285,000 from the Peruvian government (through its Telecommunications Investment Fund, or FITEL). These projects are for a total period of approximately 11 years. Accordingly, the Company expects to invest significant funds prior to receiving payment to cover such funds. The Company will be required to establish a Peruvian subsidiary and enter into final written agreements with respect to those projects.
F - 56
TABLE OF CONTENTS
Part IItem 1: Identity Of Directors, Senior Management and AdvisorsItem 2: Offer Statistics and Expected TimetableItem 3: Key InformationItem 4: Information on The CompanyItem 4A: Unresolved Staff CommentsItem 5: Perating and Financial Review and ProspectsItem 6: Directors and Senior ManagementItem 7: Major Shareholders and Related Party TransactionsItem 8: Financial InformationItem 9: The Offer and ListingItem 10: Additional InformationItem 11: Quantitative and Qualitative Disclosures About Market RiskItem 12: Description Of Securities Other Than Equity SecuritiesPart IIItem 13: Defaults, Dividend Arrearages and DelinquenciesItem 14: Material Modifications To The Rights Of Security Holders and Use Of ProceedsItem 15: Controls and ProceduresItem 16: ReservedItem 16A: Audit Committee Financial ExpertItem 16B: Code Of EthicsItem 16C: Principal Accountant Fees and ServicesItem 16D. Exemptions From The Listing Standards For Audit CommitteesItem 16E: Purchase Of Equity Securities By The Issuer and Affiliated PurchasersItem 16F: Changes in Registrant S Certifying AccountantItem 16G. Corporate GovernanceItem 16H. Mine Safety DisclosurePart IIIItem 17: Financial StatementsItem 18: Financial StatementsItem 19: ExhibitsNote 1: GeneralNote 1: General (cont.)Note 2:- Significant Accounting PoliciesNote 2:- Significant Accounting Policies (cont.)Note 3:- InventoriesNote 4:- Property and Equipment, NetNote 5:- Intangible Assets, NetNote 6:- GoodwillNote 7:- Commitments and ContingenciesNote 7:- Commitments and Contingencies (cont.)Note 8:- Derivative InstrumentsNote 8:- Derivative Instruments (cont.)Note 9:- EquityNote 9:- Equity (cont.)Note 10:- Restructuring CostNote 11:- Taxes on IncomeNote 11:- Taxes on Income (cont.)Note 12:- Supplementary Balance Sheet InformationNote 12:- Supplementary Balance Sheet Information (cont.)Note 13:- Selected Statements Of Operations DataNote 13:- Selected Statements Of Operations Data (cont.)Note 14:- Customers, Geographic and Segment InformationNote 14:- Customers, Geographic and Segment Information (cont.)Note 15:- Subsequent Events