SECURITIES AND EXCHANGE COMMISSION
WASHINGTON, D.C. 20549
FORM 20-F
☐ REGISTRATION STATEMENT PURSUANT TO SECTION 12(b) OR (g) OF THE SECURITIES EXCHANGE ACT OF 1934
or
☒ ANNUAL REPORT PURSUANT TO SECTION 13 OR 15(d) OF THE SECURITIES EXCHANGE ACT OF 1934
For the fiscal year ended December 31, 2018
or
☐ TRANSITION REPORT PURSUANT TO SECTION 13 OR 15(d) OF THE SECURITIES EXCHANGE ACT OF 1934
For the transition period from __________ to __________
or
☐ SHELL COMPANY REPORT PURSUANT TO SECTION 13 OR 15(d) OF THE SECURITIES EXCHANGE ACT OF 1934
Date of event requiring this shell company report _________
Commission file number:
0-21218
GILAT SATELLITE NETWORKS LTD.
(Exact name of Registrant as specified in its charter)
(Exact name of Registrant as specified in its charter)
ISRAEL
(Jurisdiction of incorporation or organization)
(Jurisdiction of incorporation or organization)
Gilat House, 21 Yegia Kapayim Street, Kiryat Arye, Petah Tikva, 4913020 Israel
(Address of principal executive offices)
(Address of principal executive offices)
Yael Shofar, Adv.
General Counsel
Gilat Satellite Networks Ltd.
Gilat House, 21 Yegia Kapayim Street,
Kiryat Arye, Petah Tikva, 4913020 Israel
Kiryat Arye, Petah Tikva, 4913020 Israel
Tel: +972 3 929 3020
Fax: +972 3 925 2945
(Name, telephone, e-mail and/or facsimile number and address of company contact person)
Securities registered or to be registered pursuant to Section 12(b) of the Act:
|
Title of each class
Ordinary Shares, NIS 0.20 nominal value
|
Name of each exchange on which registered
NASDAQ Global Select Market
|
Securities registered or to be registered pursuant of Section 12(g) of the Act:
None
Securities for which there is a reporting obligation pursuant to Section 15(d) of the Act: None
Indicate the number of outstanding shares of each of the issuer’s classes of capital or common stock at the close of the period covered by the annual report:
55,176,107 Ordinary Shares, NIS 0.20 nominal value per share
(as of December 31, 2018)
Indicate by check mark if the registrant is a well-known seasoned issuer, as defined in Rule 405 of the Securities Act.
Yes ☐ No ☒
If this report is an annual or transition report, indicate by check mark if the registrant is not required to file reports pursuant to Section 13 or 15(d) of the Securities Exchange Act of 1934.
Yes ☐ No ☒
Indicate by check mark whether the registrant (1) has filed all reports required to be filed by Section 13 or 15(d) of the Securities Exchange Act of 1934 during the preceding 12 months (or for such shorter period that the registrant was required to file such reports), and (2) has been subject to such filing requirements for the past 90 days.
Yes ☒ No ☐
Indicate by check mark whether the registrant has submitted electronically and posted on its corporate Web site, if any, every Interactive Data File required to be submitted and posted pursuant to Rule 405 of Regulation S-T (232.405 of this chapter) during the preceding 12 months (or for such shorter period that the registrant was required to submit and post such files).
Yes ☒ No ☐
Indicate by check mark whether the registrant is a large accelerated filer, an accelerated file, a non-accelerated filer, or an emerging growth company. See the definitions of “accelerated filer,” “large accelerated filer” and “emerging growth company” in Rule 12b-2 of the Exchange Act (Check one):
|
Large accelerated filer ☐
|
Accelerated filer ☒
|
|
Non-accelerated filer ☐
|
Emerging growth company ☐
|
If an emerging growth company that prepares its financial statements in accordance with U.S. GAAP, indicate by check mark if the registrant has elected not to use the extended transition period for complying with any new or revised financial accounting standards† provided pursuant to Section 13(a) of the Exchange Act.
☐
The term "new or revised financial accounting standard" refers to any update issued by the Financial Accounting Standards Board to its Accounting Standards Codification after April 5, 2012
Indicate by check mark which basis of accounting the registrant has used to prepare the financial statements included in this filing:
|
☒ U.S. GAAP
|
☐ |
International Financial Reporting Standards as issued by the International Accounting Standards Board
|
☐ Other
|
If “Other” has been checked in response to the previous question, indicate by check mark which financial statement item the registrant has elected to follow.
Item 17 ☐ Item 18 ☐
If this is an annual report, indicate by check mark whether the registrant is a shell company (as defined in Rule 12b-2 of the Exchange Act).
Yes ☐ No ☒
This report on Form 20-F is being incorporated by reference into our Registration Statements on Form S-8 (Registration Nos., 333-180552, 333-187021,
333-204867, 333-210820, 333-217022, 333-221546 and 333-223839)
.
ii
INTRODUCTION
We are a leading global provider of satellite-based broadband communications. We design and manufacture ground-based satellite communications equipment and provide comprehensive solutions and end-to-end services, powered by our innovative technology. Our portfolio comprises a cloud- based satellite network platform, Very Small Aperture Terminals, or VSATs, amplifiers, high-speed modems, high performance on-the-move antennas and high efficiency, high power Solid State Amplifiers, or SSPAs and Block Upconverters, or BUCs. Our comprehensive solutions support multiple applications with a full portfolio of products to address key applications including broadband access, cellular backhaul, enterprise, in-flight connectivity, or IFC, maritime, trains, defense and public safety, all while meeting the most stringent service level requirements. We have a large installed base, having sold over 1.5 million satellite terminals spanning approximately 90 countries and currently have over 500 active networks.
In addition to developing and marketing ground-based satellite communications equipment, we provide managed network and services through terrestrial and satellite networks. We have proven experience in delivering complex projects and services worldwide. We offer complete turnkey integrated solutions including:
| • |
fully managed satellite network services solutions, including services over our own networks;
|
| • |
network planning and optimization;
|
| • |
provision of satellite capacity;
|
| • |
remote network operation;
|
| • |
call center support;
|
| • |
hub and field operations; and
|
| • |
construction and installation of communication networks, typically on a Build, Operate and Transfer, or BOT, contract basis.
|
In these BOT projects, we build telecommunication infrastructure typically using fiber-optic and wireless technologies for broadband connectivity.
We have a large installed base, having sold over 1.5 million satellite terminals spanning approximately 90 countries and currently have over 500 active networks.
We have 20 sales and support offices worldwide, four Network Operation Centers, or NOCs, and five R&D centers. Our products are sold to communication service providers and operators that use satellite communications to serve enterprise, government and residential users, to mobile network operators and to system integrators that use our technology. Our solutions and services are also sold to defense and homeland security organizations. In addition, we provide services directly to end-users in various market segments, including in certain countries in Latin America.
Prior to 2018, we operated in three business segments, comprised of our Commercial, Mobility and Services divisions. Commencing in 2018, in order to more accurately reflect management’s focus, organizational alignment, our customer base and end markets, we
operate in three new business segments, as follows:
| · |
Fixed Networks provides advanced fixed broadband satellite communication networks, satellite communication systems and associated professional services and comprehensive turnkey solutions and fully managed satellite network services solutions. Our customers are service providers, satellite operators, mobile network operators, or MNOs, telecommunication companies, or Telcos, and large enterprises, consumers and governments worldwide. In addition, it includes our network operation and managed satellite network services solutions in Peru and Colombia. We focus on high throughput satellites, or HTS, opportunities worldwide, with focus on cellular backhaul, and are driving meaningful partnerships with satellite operators to leverage our technology and breadth of services to deploy and operate the ground-based satellite communication networks.
|
iii
| · |
Mobility Solutions provides advanced on-the-move satellite communications equipment, systems and solutions, including airborne, maritime and ground-mobile satellite systems and solutions. This segment provides solutions for land, sea and air connectivity, while placing major focus on the high-growth market of In-Flight Connectivity, or IFC, with our unique leading technology as well as defense and homeland security activities. Our product portfolio comprises of high-speed modems, high performance on-the-move antennas and high efficiency, high power SSPAs and BUCs. Our customers are service providers, system integrators, defense and homeland security organizations, as well as other commercial entities worldwide.
|
| · |
Terrestrial Infrastructure Projects provides network infrastructure construction, of the Fondo De Inversion En Telecomunicaciones
, or
FITEL, fiber and microwave network in Peru.
|
We have retrospectively revised our segment information for the years ended December 31, 2017 and 2016 to conform to the new business segments presentation.
Our ordinary shares are traded on the NASDAQ Global Select Market under the symbol “GILT” and on the Tel Aviv Stock Exchange, or the TASE. As used in this annual report, the terms “we”, “us”, “Gilat” and “our” mean Gilat Satellite Networks Ltd. and its subsidiaries, unless otherwise indicated.
The marks “Gilat®”, “SkyEdge®”, “Wavestream®”, “AeroStream™”, “Raysat®”, “SatTrooper
TM
”, “SatRanger
TM
” and
“Spatial AdvantEdge™” and other marks appearing in this annual report on Form 20-F marked with “®” or “™” are trademarks of our company and its subsidiaries. Other trademarks appearing in this Annual Report on Form 20-F are owned by their respective holders.
This Annual Report on Form 20-F contains various “
forward‑looking statements” within the meaning of Section 27A of the Securities Act of 1933, as amended, and Section 21E of the Securities Exchange Act of 1934, as amended, and within the Private Securities Litigation Reform Act of 1995, as amended.
Such
forward-looking statements reflect our current view with respect to future events and, financial results of operations. Forward-looking statements usually include the verbs, “anticipates,” “believes,” “estimates,” “expects,” “intends,” “plans,” “projects,” “understands” and other verbs suggesting uncertainty. We remind readers that forward-looking statements are merely predictions and therefore inherently subject to uncertainties and other factors and involve known and unknown risks that could cause the actual` results, performance, levels of activity, or our achievements, or industry results to be materially different from any future results, performance, levels of activity, or our achievements expressed or implied by such forward-looking statements. Readers are cautioned not to place undue reliance on these forward‑looking statements which speak only as of the date hereof. We undertake no obligation to publicly release any revisions to these forward-looking statements to reflect events or circumstances after the date hereof or to reflect the occurrence of unanticipated events. We have attempted to identify additional significant uncertainties and other factors affecting forward-looking statements in the Risk Factors section which appears in Item 3D: “Key Information–Risk Factors”.
Our consolidated financial statements appearing in this annual report are prepared in U.S. dollars and in accordance with U.S. generally accepted accounting principles, or U.S. GAAP. All references in this annual report to “dollars” or “$” are to U.S. dollars and all references in this annual report to “NIS” are to New Israeli Shekels.
Statements made in this Annual Report concerning the contents of any contract, agreement or other document are summaries of such contracts, agreements or documents and are not complete descriptions of all of their terms. If we filed any of these documents as an exhibit to this Annual Report or to any registration statement or annual report that we previously filed, you may read the document itself for a complete description of its terms.
iv
TABLE OF CONTENTS
|
1
|
|||
|
1
|
|||
|
1
|
|||
|
|
1
|
||
|
A. Selected Consolidated Financial Data
|
1
|
||
|
B. Capitalization and Indebtedness
|
2
|
||
|
C. Reasons for the Offer and Use of Proceeds
|
2
|
||
|
D. Risk Factors
|
2
|
||
|
|
24
|
||
|
A. History and Development of the Company
|
24
|
||
|
B. Business Overview
|
25
|
||
|
C. Organizational Structure
|
41
|
||
|
D. Property, Plants and Equipment
|
41
|
||
|
41
|
|||
|
41
|
|||
|
A. Operating Results
|
41
|
||
|
B. Liquidity and Capital Resources
|
54
|
||
|
C. Research and Development
|
55
|
||
|
D. Trend Information
|
56
|
||
|
E. Off-Balance Sheet Arrangements
|
57
|
||
|
F. Tabular Disclosure of Contractual Obligations
|
58
|
||
|
58
|
|||
|
A. Directors and Senior Management
|
58
|
||
|
B. Compensation of Directors and Officers
|
62
|
||
|
C. Board Practices
|
65
|
||
|
D. Employees
|
73
|
||
|
E. Share Ownership
|
74
|
||
|
75
|
|||
|
A. Major Shareholders
|
75
|
||
|
B. Related Party Transactions.
|
77
|
||
|
C. Interests of Experts and Counsel.
|
77
|
||
|
77
|
|||
|
A. Consolidated Statements
|
77
|
||
|
B.
Significant Changes
|
78
|
||
|
79
|
|||
|
A. Offer and Listing Details
|
79
|
||
|
B. Plan of Distribution
|
79
|
||
|
C. Markets
|
79
|
||
|
D. Selling Shareholders
|
79
|
||
|
E. Dilution
|
79
|
||
|
F. Expense of the Issue
|
79
|
||
|
|
79
|
||
|
A. Share Capital
|
79
|
||
|
B. Memorandum and Articles of Association
|
79
|
||
|
C. Material Contracts
|
84
|
||
|
D. Exchange Controls
|
84
|
||
|
E. Taxation
|
85
|
||
|
F. Dividend and Paying Agents
|
93
|
||
|
G. Statement by Experts
|
93
|
||
|
H. Documents on Display
|
93
|
||
|
I. Subsidiary Information
|
94
|
||
|
94
|
|||
|
95
|
|||
v
|
95
|
|||
|
95
|
|||
|
95
|
|||
|
95
|
|||
|
96
|
|||
|
96
|
|||
|
|
96
|
||
|
96
|
|||
|
97
|
|||
|
97
|
|||
| ITEM 16F: CHANGES IN REGISTRANT’S CERTIFYING ACCOUNTANT |
97
|
||
|
97
|
|||
|
98
|
|||
|
98
|
|||
|
|
98
|
||
|
|
98
|
||
|
|
98
|
||
|
102
|
|||
vi
Not Applicable.
Not Applicable.
| A. |
Selected Consolidated Financial Data
|
The selected consolidated statement of operations data set forth below for the years ended December 31, 2018, 2017 and 2016,
and the selected consolidated balance sheet data as of December 31, 2018 and 2017 are derived from our audited consolidated financial statements that are included elsewhere in this Annual Report. These financial statements have been prepared in accordance with U.S. GAAP. The selected consolidated statement of operations data set forth below for the years ended December 31, 2015 and
2014
and the selected consolidated balance sheet data as of December 31,
2016, 2015 and 2014
are derived from our audited consolidated financial statements that are not included in this Annual Report.
The selected consolidated financial data set forth below should be read in conjunction with and is
qualified entirely by reference to
Item 5: “Operating and Financial Review and Prospects”
and the Consolidated Financial Statements and Notes thereto included in Item 18 in this Annual Report on Form 20-F
.
Statement of Operations Data for Year ended December 31,
|
2018
|
2017
|
2016
|
2015
|
2014
|
||||||||||||||||
|
U.S. dollars in thousands, except for share data
|
||||||||||||||||||||
|
Revenues:
|
||||||||||||||||||||
|
Products
|
173,966
|
214,522
|
214,291
|
128,970
|
157,531
|
|||||||||||||||
|
Services
|
92,425
|
68,234
|
65,260
|
68,573
|
77,602
|
|||||||||||||||
|
Total
|
266,391
|
282,756
|
279,551
|
197,543
|
235,133
|
|||||||||||||||
|
Cost of revenues:
|
||||||||||||||||||||
|
Products
|
121,147
|
153,167
|
162,563
|
94,683
|
106,905
|
|||||||||||||||
|
Services
|
51,207
|
47,094
|
41,498
|
48,635
|
44,593
|
|||||||||||||||
|
Impairment of long lived assets
|
-
|
-
|
-
|
10,137
|
-
|
|||||||||||||||
|
Total Cost of revenues
|
172,354
|
200,261
|
204,061
|
153,455
|
151,498
|
|||||||||||||||
|
Gross profit
|
94,037
|
82,495
|
75,490
|
44,088
|
83,635
|
|||||||||||||||
|
Operating expenses:
|
||||||||||||||||||||
|
Research and development, net
|
33,023
|
28,014
|
24,853
|
22,412
|
25,158
|
|||||||||||||||
|
Selling and marketing
|
22,706
|
23,759
|
23,411
|
24,823
|
32,537
|
|||||||||||||||
|
General and administrative
|
17,024
|
19,861
|
26,471
|
18,644
|
20,903
|
|||||||||||||||
|
Restructuring costs
|
-
|
-
|
-
|
1,508
|
-
|
|||||||||||||||
|
Goodwill impairment
|
-
|
-
|
-
|
20,402
|
-
|
|||||||||||||||
|
Total Operating expenses
|
72,753
|
71,634
|
74,735
|
87,789
|
78,598
|
|||||||||||||||
|
Operating income (loss)
|
21,284
|
10,861
|
755
|
(43,701
|
)
|
5,037
|
||||||||||||||
|
Financial expenses, net
|
4,298
|
4,307
|
4,843
|
7,243
|
3,837
|
|||||||||||||||
|
Income (loss) before taxes on income
|
16,986
|
6,554
|
(4,088
|
) |
(50,944
|
)
|
1,200
|
|||||||||||||
|
Taxes on income (tax benefit)
|
(1,423
|
)
|
(247
|
)
|
1,252
|
1,190
|
1,901
|
|||||||||||||
|
Net income (loss) from continuing operations
|
18,409
|
6,801
|
(5,340
|
)
|
(52,134
|
)
|
(701
|
)
|
||||||||||||
|
Loss from discontinued operations (1)
|
-
|
-
|
-
|
(200
|
)
|
(795
|
)
|
|||||||||||||
|
Net income (loss)
|
18,409
|
6,801
|
(5,340
|
)
|
(52,334
|
)
|
(1,496
|
)
|
||||||||||||
|
Net income (loss) per share (basic) from continuing operations (2)
|
0.34
|
0.12
|
(0.10
|
)
|
(1.16
|
)
|
(0.02
|
)
|
||||||||||||
|
Net income (loss) per share (diluted) from continuing operations (2)
|
0.33
|
0.12
|
(0.10
|
)
|
(1.16
|
)
|
(0.02
|
)
|
||||||||||||
|
Loss per share (basic and diluted) from discontinued operations (2)
|
-
|
-
|
-
|
-
|
(0.02
|
)
|
||||||||||||||
|
Net income (loss) per share (basic) (2)
|
0.34
|
0.12
|
(0.10
|
)
|
(1.16
|
)
|
(0.04
|
)
|
||||||||||||
|
Net income (loss) per share (diluted) (2)
|
0.33
|
0.12
|
(0.10
|
)
|
(1.16
|
)
|
(0.04
|
)
|
||||||||||||
1
Balance Sheet Data as of December 31,
|
2018
|
2017
|
2016
|
2015
|
2014
|
||||||||||||||||
|
U.S. dollars in thousands
|
||||||||||||||||||||
|
Working capital
|
105,765
|
92,035
|
92,609
|
60,529
|
66,588
|
|||||||||||||||
|
Total assets
|
394,747
|
391,556
|
383,198
|
370,833
|
364,908
|
|||||||||||||||
|
Short‑term bank credit and loans and current maturities
|
4,458
|
4,479
|
4,617
|
11,542
|
20,452
|
|||||||||||||||
|
Long term loan, net of current maturities
|
8,098
|
12,582
|
16,932
|
21,493
|
26,271
|
|||||||||||||||
|
Other long-term liabilities
|
7,229
|
9,007
|
9,766
|
11,484
|
13,336
|
|||||||||||||||
|
Shareholders’ equity
|
239,072
|
218,322
|
209,826
|
178,082
|
225,139
|
|||||||||||||||
| (1) |
In December 2013, we sold Spacenet Inc., a provider of managed network communications services utilizing satellite wireline and wireless networks and associated technology.
|
| (2) |
The loss per share for the years ended December 31, 2015 and 2014 was adjusted, following the rights offering that the Company concluded in March 2016.
|
| (3) |
On January 1, 2018, we adopted the new revenue standards (Topic 606) using a modified retrospective method with the cumulative effect recognized in the accumulated deficit as of December 1, 2018. The consolidated financial statements for the year ended December 31, 2018 are reported under Topic 606, whereas the consolidated financial statements for 2017 and prior years are reported under Topic 605. See Note 2z, “Recently Adopted Accounting Pronouncements" to the consolidated financial statements for more details.
|
| B. |
Capitalization and Indebtedness
|
Not applicable.
| C. |
Reasons for the Offer and Use of Proceeds
|
Not applicable
| D. |
Risk Factors
|
Investing in our ordinary shares involves a high degree of risk and uncertainty. You should carefully consider the risks and uncertainties described below before investing in our ordinary shares. If any of the following risks actually occurs, our business, prospects, financial condition and results of operations could be materially harmed. In that case, the value of our ordinary shares could decline substantially, and you could lose all or part of your investment.
2
Risks Relating to Our Business
A significant portion of our revenue in 2018 was attributable to a limited number of large scale customers.
We depend on several large-scale contracts for a significant percentage of our revenues. In 2018, a significant portion of our revenue was attributable to our contracts with a large U.S. system integrator, with the Colombian Ministry of Information Technologies and Communications, or Ministry of ITC, and with a Peruvian governmental authority with respect to six regions in Peru, or the FITEL Regional Projects, as well as with an additional large service provider. The agreement with our U.S. system integrator customer accounted for approximately 15% of our revenue in the year ended December 31, 2018 and was with our U.S. based subsidiary, Wavestream Corporation, or Wavestream. The agreement with the Ministry of ITC accounted for approximately 13% of our revenue in the year ended December 31, 2018. The agreement was signed in 2013 with our subsidiary, Gilat Colombia S.A. E.S.P., or Gilat Colombia, and was extended several times for additional periods, with the last extension ending in the second quarter of 2019, and is expected to generate (from its initiation and including all extensions) aggregate revenues of approximately 312 billion Colombian Pesos (approximately $103 million). The FITEL Regional Projects accounted for approximately 10% of our revenue in the year ended December 31, 2018. The FITEL Regional Projects were awarded to us in 2015 and in 2018, and during their terms are expected to generate $393 million and $154 million in revenues respectively. The expected duration of the 2015 FITEL Regional Projects was significantly prolonged from their scheduled delivery dates due to continued delays in the construction phase, and is expected to continue for approximately 14-15 years. See Item 4.B. – “Information on the Company – Business Overview – Terrestrial Infrastructure Projects – Overview”. If we fail to deliver in a timely manner upon any of our large contracts or if FITEL or the U.S. system integrator customer were to terminate their existing contracts with us or substantially reduce the services or quantity of products they purchase from us, our revenues and operating results could be materially adversely affected.
Our failure to deliver upon our large-scale projects in an economical or a timely manner, or a delay in collection of payments due to us in connection with any such large-scale project could have a significant adverse impact on our operating results.
We have been awarded a number of large-scale projects by our customers, including foreign governments, such as the Peruvian FITEL Regional Projects in 2015 and in 2018, and contracts with a U.S. system integrator and a large service provider. While we have successfully implemented large-scale network infrastructure projects and operations in rural areas, the FITEL Regional Projects as well as other projects are complex and require cooperation of third parties. A failure to execute these projects in an economical manner within the projects’ budgets and schedules could result in significant penalties, impact our ability to receive and recognize the expected revenues, and cause us losses, which would significantly adversely impact our operating results. The expected duration of the 2015 FITEL Regional Projects was significantly prolonged from their scheduled delivery dates, due to continued delays in the construction phase and is expected to continue for approximately 14-15 years. As a result, our revenues and collection from these 2015 FITEL Regional Projects were delayed and therefore were less than initially expected in 2018. Such delays also increased our expenses which adversely impacted our operating results in 2018. Failure to complete the projects in a timely manner and pursuant to the updated schedule , will have a significant adverse effect on our business and financial results.
Additionally, the delivery of our large-scale projects requires us to invest significant funds in order to obtain bank guarantees and requires us to incur significant expenses before we receive full payment from our customers.
In the past, we incurred major losses and we may not be able to continue to operate profitably in the future.
We reported an operating profit of $21.3 million and net income from continuing operations of $18.4 million in the year ended December 31, 2018, an operating profit of $10.9 million and net income from continuing operations of $6.8 million in the year ended December 31, 2017 and operating profit of $0.8 million and a loss from continuing operations of $5.3 million in the year ended December 31, 2016. We also incurred major losses in years prior to fiscal 2016 and as of December 31, 2018 have an accumulated deficit of $683 million. We cannot assure you that we can operate profitably in the future.
If we do not continue to operate profitably, our share price will decline and the viability of our company will be in question.
3
Our available cash balance may decrease in the future if we cannot generate cash from operations.
Our cash, cash equivalents and restricted cash as of December 31, 2018 were $104.2 million compared to $86.8 million as of December 31, 2017. Our positive cash flow (including restricted cash) from operating activities was approximately $32 million in the year ended December 31, 2018 compared to negative cash flow from operating activities of $17.2 million in the year ended December 31, 2017 and negative cash flow of $36.9 million in the year ended December 31, 2016. If we do not generate sufficient cash from operations in the future, including from our large-scale projects, our cash balance will decline and the unavailability of cash could have a material adverse effect on our business, operating results and financial condition.
The delivery of our large-scale projects
requires us to invest significant funds in order to obtain bank guarantees and may
require
us to incur significant expenses before we receive full payment from our customers. This applies mainly to
the FITEL Regional Projects awarded to us in 2015 and in 2018, which are expected to generate $393 million and $154 million in revenues respectively, over a period of 13-15 years. We have used the advance payment received from FITEL as well as internal cash resources in order to finance the FITEL Regional Projects. We have used surety bonds and our internal resources in order to provide the required bank guarantees for the FITEL Regional Projects, which were approximately $127.2 million in the aggregate as of December 31, 2018.
If we fail to obtain the necessary funding or if we fail to obtain such funds on favorable terms, we will not be able to meet our commitments and our cash flow and operational results may be adversely affected.
If the satellite communications markets fail to grow, our business could be materially harmed.
A number of the markets for our products and services in the satellite communications area, including high throughput satellite and commercial on the move products, have emerged in recent years. In addition, over the next few years the market is expected to move towards non-geostationary orbits, or NGSO, constellation networks and this may reduce interest and investments in
geostationary satellite technology and services.
Because these markets are constantly changing, it is difficult to predict the rate at which these markets will grow or decline. We also believe that there are many companies that are seeking ways to improve the ability of existing terrestrial infrastructure, such as fiber optic cable and point-to-point microwave, to transmit signals. Any significant improvement or increase in the amount of terrestrial capacity, particularly with respect to the existing fiber optic cable infrastructure and point-to-point microwave, may cause our fixed networks customers to shift their transmissions to terrestrial capacity or make it more difficult for us to obtain new customers. If fiber optic cable networks or other terrestrial-based high-capacity transmission systems are available to service a particular point, that capacity, when available, is generally less expensive than satellite capacity. As terrestrial-based telecommunications services expand, demand for some fixed satellite-based services may be reduced.
If the markets for commercial satellite communications products fail to grow, or if we fail to penetrate the NGSO market operating in low or medium earth orbits networks, or LEO/MEO, our business could be materially harmed. Conversely, growth in these markets could result in satellite capacity limitations which in turn could materially harm our business and impair the value of our shares. Specifically, we derive most of our revenues from sales of satellite based communications networks and related equipment and provision of services related to these networks and products a significant decline in this market or the replacement of VSAT and other satellite based technologies by an alternative technology could materially harm our business and impair the value of our shares.
Because we compete for large‑scale contracts in competitive bidding processes, losing a small number of bids or a decrease in the revenues generated from our large-scale projects could have a significant adverse impact on our operating results.
A significant portion of our revenues is derived from large-scale contracts that we are awarded from time to time in competitive bidding processes. The bidding process sometimes requires us to make significant investments upfront, while the final award is not assured. These large‑scale contracts sometimes involve the installation of thousands of VSATs
or massive fiber-optic transport and access networks or production of customized products
. The number of major bids for these large‑scale contracts for satellite-based networks
and massive telecommunications infrastructure projects
in any given year is limited and the competition is intense. Losing or defaulting on a relatively small number of bids each year could have a significant adverse impact on our operating results.
4
A large portion of our large-scale contracts are with governments or large governmental agencies in Latin America and any volatility in the political or economic climate or any unexpected unilateral termination or suspension of payments could have a significant adverse impact on our business.
In March and December 2015,
the Peruvian government
awarded us the FITEL Regional Projects under four separate bids for the construction of networks, operation of the networks for a defined period and their transfer to the government. In 2018, we were awarded two additional FITEL Regional Projects. These awards are expected to generate in the aggregate revenues of $547 million over a period of 13-15 years. The project with the Ministry of ITC that was awarded in
December 2013 was extended several times for additional periods, with the last extension ending in the second quarter of 2019. The total amount of revenue expected to be generated from this contract, from its initiation and including all its extensions,
is approximately 312 billion Colombian Pesos (approximately $103 million).
Agreements
with the governments in these countries typically include unilateral early termination clauses and involve other risks such as the imposition of new government regulations and taxation that could pose additional financial burdens on us. Changes in the political or economic situation in these countries can result in the early termination of our business there. Any termination of our business in any of the aforementioned countries could have a significant adverse impact on our business. See Item 4.B. – “Information on the Company – Business Overview –
Terrestrial Infrastructure Projects
– Overview”.
We submit bids on large-scale contracts through regulated bid processes with governments and large governmental agencies and our awards can be challenged by losing parties. If successful, such challenges could significantly adversely affect our business and financial results.
Our awards in bids submitted to governments and large governmental agencies can be challenged by losing parties, and if such challenges succeed our financial results will be adversely affected. In 2018, we were awarded two additional FITEL Regional Projects in Peru, with expected revenues of approximately $154
million over approximately 13-15 years.
The losing bidder consortium, which was disqualified by the bid issuer, applied for cancellation of the bid and obtained a preliminary injunction against the award. This matter
is currently pending a judicial decision.
Based on advice of counsel, we believe that the appeal’s chances of success are remote, yet if successful it could significantly adversely affect our business and financial results.
Some of our large-scale customers are highly leveraged and if any of them encounters financial difficulties, this could have a significant adverse effect on our business and financial results.
Some of our current and potential customers, including large-scale customers
who contribute significantly to our profitability, are highly leveraged. If a major customer encounters financial difficulty, our business and operating results may be adversely affected and we may find it difficult to collect outstanding receivables. As an example, in June 2016, our customer, Oi SA, filed for judicial reorganization in a bankruptcy petition in Brazil. Collection of any outstanding amounts due to us prior to the petition is subject to implementation of the creditor arrangements which includes a discount on the amounts due us.
Actual results could differ from the estimates and assumptions that we use to prepare our financial statements.
In order to prepare our financial statements in conformity with generally accepted accounting principles in the United States (“U.S. GAAP”), our management is required to make estimates and assumptions, as of the date of the financial statements, which affect the reported values of assets and liabilities, revenues and expenses, and disclosures of contingent assets and liabilities. Areas that require significant estimates by our management include contract costs and profits, application of percentage-of-completion accounting, provisions for uncollectible receivables and customer claims, impairment of long-term assets, goodwill impairment, valuation of assets acquired and liabilities assumed in connection with business combinations, accruals for estimated liabilities, including litigation and insurance reserves, and stock-based compensation. Our actual results could differ from, and could require adjustments to, those estimates.
5
In particular, we recognize revenues generated from the FITEL Regional Projects using the percentage-of-completion method. Under this method, estimated revenue is recognized by applying the percentage of completion of the contract for the period (based on the ratio of costs incurred to total estimated costs of the contract) to the total estimated revenue for the contract. As a result, revisions made to the estimates of revenues and profits are recorded in the period in which the conditions that require such revisions become known and can be estimated. Although we believe that our profit margins are fairly stated and that adequate provisions for losses for fixed-price contracts are recorded in the financial statements, as required under U.S. GAAP, we cannot assure you that our contract profit margins will not decrease or that any loss provisions will not increase materially in the future.
Tax authorities may disagree with our intercompany charges, cross-jurisdictional transfer pricing or other matters and assess additional taxes
.
We are subject to income taxation in the United States, Israel and numerous other jurisdictions. Determining our provision for income taxes requires significant management judgment. In addition, our provision for income taxes could be adversely affected by many factors, including, among other things, changes to our operating structure, changes in the amounts of earnings in jurisdictions with different statutory tax rates, changes in the valuation of deferred tax assets and liabilities and changes in tax laws. We are subject to ongoing tax examinations in various jurisdictions. Tax authorities may disagree with our intercompany charges, cross-jurisdictional transfer pricing or other matters and assess additional taxes. While we regularly evaluate the likely outcomes of these examinations to determine the adequacy of our provision for income taxes, there can be no assurance that the outcomes of such examinations will not have a material impact on our results of operations and cash flows. In addition, we may be audited in various jurisdictions, and such jurisdictions may assess additional taxes against us. Although we believe our tax estimates are reasonable, the final determination of any tax audit or litigation could be materially different from our historical tax provisions and accruals, which could have a material adverse effect on our results of operations or cash flows in the period or periods for which a determination is made.
Our insurance coverage may not be sufficient for every aspect or risk related to our business.
Our business includes risks, only some of which are covered by our insurance. For example, in our satellite capacity agreements, we do not have a backup for satellite capacity, and we do not have indemnification or insurance in the event that our supplier’s satellite malfunctions or data is lost. Satellites utilize highly complex technology and operate in the harsh environment of space and therefore are subject to significant operational risks while in orbit. The risks include in-orbit equipment failures, malfunctions and other kinds of problems commonly referred to as anomalies. Satellite anomalies include, for example, circuit failures, transponder failures, solar array failures, telemetry transmitter failures, battery cell and other power system failures, satellite control system failures and propulsion system failures. Liabilities in connection with our products, services, managed networks services or in connection with our construction and deployment projects or in connection with our premises may not be covered by insurance or may be covered only to a limited extent. Our third-party suppliers do not always have back to back insurance coverage to the same extent
guaranteed by Gilat towards its customers
.
In addition, we are not covered by our insurance for acts of fraud or theft. Our business, financial condition and operating results could be materially adversely affected if we incur significant costs resulting from these exposures.
We operate in the highly competitive network communications industry and may be unsuccessful in competing effectively in the future.
We operate in a highly competitive industry of network communications, both in the sales of our products and our services. As a result of the rapid technological changes that characterize our industry, we face intense worldwide competition to capitalize on new opportunities, to introduce new products and to obtain proprietary and standard technologies that are perceived by the market as being superior to those of our competitors.
Some of our competitors have greater financial resources, providing them with greater research and development and marketing capabilities. Our competitors may also be more experienced in obtaining regulatory approvals for their products and services and in marketing them. Our relative position in the network communications industry may place us at a disadvantage in responding to our competitors’ pricing strategies, technological advances and other initiatives.
Our principal competitors in the supply of VSAT networks are Hughes Network Systems, LLC (acquired by EchoStar Corporation), or HNS, ViaSat Inc., or ViaSat, VT iDirect®, or iDirect,
Comtech Telecommunications Corp., or Comtech, and Newtec
Cy N.V, or Newtec.
In managed satellite network services solutions, our competitors are Speedcast International Ltd., or Speedcast, SES and Intelsat. Most of our competitors have developed or adopted different technology standards for their VSAT products.
6
Our low-profile in-motion ground, aero and maritime antennas target a competitive market with multiple players such as Honeywell, Astronics AeroSat Corporation, or AeroSat, Qest Quantum Electronic Systems GmbH or Quest, Tecom Industries, Inc., or Tecom, and Thinkom Solutions or Thinkom. Competitors in the defense sector
include General Dynamics Satcom Technologies,
Orbit Communication Systems, or Orbit, Elbit Systems Ltd., or Elbit, and L-3 Communications Holdings, Inc. or L-3. Multiple additional competitors are entering the low-profile in-motion arena and specifically electronically steered antenna market, some with new and advanced technologies. If these new entrants and/or new technologies are able to significantly penetrate the market our business could be negatively affected.
In addition, ViaSat, SES
and HNS have launched their own satellites, which enable them to offer vertically integrated solutions to their customers, which may further change the competitive environment in which we operate and could have an adverse effect on our business.
Where we primarily operate public rural telecom services (voice, data and internet) and are engaged in construction of fiber-optic transport and access networks based on wireless systems, we typically encounter competition on government subsidized bids from various service providers, system integrators and consortiums. Some of these competitors offer solutions based on VSAT technology and some on terrestrial technologies (typically, fiber-optic and wireless technologies). In addition, as competing technologies such as cellular network and fiber-optic become available in rural areas where not previously available, our business could be adversely affected.
We may not be able to compete successfully against current or future competitors. Such competition may adversely affect our future revenues and, consequently, our business, operating results and financial condition.
Our lengthy sales cycles could harm our results of operations if forecasted sales are delayed or do not occur.
The length of time between the date of initial contact with a potential customer or sponsor and the execution of a contract with the potential customer or sponsor may be lengthy and vary significantly depending on the nature of the arrangement. During any given sales cycle, we may expend substantial funds and management resources and not obtain significant revenue, resulting in a negative impact on our operating results. In some cases, we have seen longer sales cycles in all of the regions in which we do business. In addition, we have seen projects delayed or even canceled, which would also have an adverse impact on our sales cycles. As a result, it may be difficult for us to accurately forecast sales due to the uncertainty around these projects and their award and starting periods.
We may need to make acquisitions or form strategic alliances or partnerships in order to remain competitive in our market, and such acquisitions, strategic alliances or partnerships could be difficult to integrate, disrupt our business and dilute shareholder value.
We generally seek to acquire businesses that enhance our capabilities and add new technologies, products, services and customers to our existing businesses. We may not be able to identify acquisition candidates on commercially reasonable terms or at all. If we make additional business acquisitions, we may not be able to successfully integrate the business acquired or we might not realize the benefits anticipated from these acquisitions, including sales growth, cost synergies and improving margins. Furthermore, we might not be able to obtain additional financing for business acquisitions, since such additional financing could be restricted or limited by the terms of our debt agreements or due to unfavorable capital market conditions.
Further, once integrated, acquisitions may not achieve comparable levels of revenues, profitability or productivity as our existing business or otherwise perform as expected. The occurrence of any of these events could harm our business, financial condition or results of operations.
7
In 2010, we completed the acquisition of RaySat Antenna Systems, or RAS, a leading provider of on-the-move antenna solutions, of RaySat BG, a Bulgarian research and development center, and of Wavestream, a
provider of SSPAs and BUCs.
If our projection for growth in the airborne business does not materialize
and we fail to obtain additional business in our Mobility Solutions segment, we would likely record an impairment of goodwill
.
In 2015, we performed an analysis of implied carrying value of our Wavestream subsidiary in accordance with ASC 350 and recorded goodwill impairment losses of approximately $20.4 million. In 2016, 2017 and 2018, no impairment losses were identified.
The risks associated with acquisitions by us include the following, any of which could seriously harm our results of operations or the price of our shares:
| · |
issuance of equity securities as consideration for acquisitions that would dilute our current shareholders’ percentages of ownership;
|
| · |
significant
acquisition costs;
|
| · |
decrease
of our cash balance;
|
| · |
the incurrence of debt and contingent liabilities;
|
| · |
difficulties in the assimilation and integration of operations, personnel, technologies, products and information systems of the acquired companies;
|
| · |
diversion of management’s attention from other business concerns;
|
| · |
contractual disputes;
|
| · |
risks of entering geographic and business markets in which we have no or only limited prior experience;
|
| · |
potential loss of key employees of acquired organizations;
|
| · |
the possibility that business cultures will not be compatible;
|
| · |
the difficulty of incorporating acquired technology and rights into our products and services;
|
| · |
unanticipated expenses related to integration of the acquired companies; and
|
| · |
difficulties in implementing and maintaining uniform standards, controls and policies.
|
Any of these events would likely result in a material adverse effect on our results of operations, cash flows and financial position.
U.S.
Government spending priorities and terms may change in a manner adverse to our businesses.
Our contracts with and sales to systems integrators in connection with government contracts in the U.S. are subject to the congressional budget authorization and appropriations process. Congress appropriates funds for a given program on a fiscal year basis, even though contract periods of performance may extend over many years. Consequently, at the beginning of a major program, the contract is partially funded, and additional monies are normally committed to the contract by the procuring agency only as appropriations are made by Congress in future fiscal years. Department of Defense, or DoD, budgets are a function of factors beyond our control, including, but not limited to, changes in U.S. procurement policies, budget considerations, current and future economic conditions, presidential administration priorities, changing national security and defense requirements, geopolitical developments and actual fiscal year congressional appropriations for defense budgets. Any of these factors could result in a significant decline in, or redirection of, current and future DoD budgets and impact our future results of operations.
8
Our customers’ products compete with other government policy needs, which may be viewed as more necessary, for limited resources and an ever-changing amount of available funding in the budget and appropriation process. Budget and appropriations decisions made by the U.S. Government are outside of our control and have long-term consequences for our business. U.S. Government spending priorities and levels remain uncertain and difficult to predict and are affected by numerous factors, including until recently sequestration (automatic, across-the-board U.S. Government budgetary spending cuts), and
the
purchase of our products could be superseded by alternate arrangements. A change in U.S.
Government spending priorities or an increase in non-procurement spending at the expense of our programs, or a reduction in total U.S. Government spending, could have material adverse consequences on our future business.
Since we generate significant revenues from clients that bid on contracts with U.S. government agencies, our operating
results
could be adversely affected by spending caps or changes in the budgetary priorities of the U.S. government, as well as by delays in bidding processes, program starts or the award of contracts or task orders under contracts.
Furthermore, in light of the current geopolitical situation, with reductions in U.S. operational presence in Iraq, Afghanistan and potentially in the Middle East, there may be additional declines in the U.S. government’s demand for and use of commercial satellite services in the future.
If procurement priorities related to defense transformation or overseas operations cease or slow down, then our business, financial condition and results of operations could be impacted negatively.
If we are unable to competitively operate within the network communications market and respond to new technologies, our business could be adversely affected.
The network communications market, which our products and services target, is characterized by rapid technological changes, new product introductions and evolving industry standards. If we fail to stay abreast of significant technological changes, our existing products and technology could be rendered obsolete. Historically, we have endeavored to enhance the applications of our existing products to meet the technological changes and industry standards. Our success is dependent upon our ability to continue to develop new innovative products, applications and services and meet developing market needs.
To remain competitive in the network communications market, we must continue to be able to anticipate changes in technology, market demands and industry standards and to develop and introduce new products, applications and services, as well as enhancements to our existing products, applications and services. Competitors in satellite ground equipment market, low-profile antenna market and high power transceivers market are introducing new and improved products and our ability to remain competitive in this field will depend in part on our ability to advance our own technology. New communications networks that integrate satellites operating in low or medium earth orbits (NGSO) may compete significantly with current networks and may reduce the market prices and success of our current products until such time as we adapt our technology to support NGSO satellites. If we are unable to respond to technological advances on a cost-effective and timely basis, or if our new products or applications are not accepted by the market, our business, financial condition and operating results could be adversely affected.
If we are unable to competitively operate within the GEO, HTS/VHTS and NGSO satellite environments, our business could be adversely affected.
Some of our competitors have launched Ka-band satellites. These actions may affect our competitiveness due to the relative lower cost of Ka-band space segment per user as well as the increased integration of the VSAT technology in the satellite solution. Due to the current nature of the HTS solution where the initial investment in ground-based satellite communication gateway equipment is relatively high, ground-based satellite communication equipment effectively becomes tightly coupled to the specific satellite technology. As such, there may be circumstances where it is difficult for competitors to compete with the incumbent VSAT vendor using the particular HTS satellite. If this occurs, the market dynamics may change to favor a VSAT vendor partnering with the satellite service provider, which may decrease the number of vendors who may be able to succeed. We believe that this trend will intensify as the market moves toward very high throughput satellite, or VHTS and NGSO constellation networks. If we are unable to forge such a partnership our business could be adversely affected.
9
Although we have entered the HTS market with responsive HTS VSAT technology, we expect that our penetration into that market will be gradual and
our success
is not assured. In addition, our competitors, who are producing large numbers of HTS VSATs, may benefit from cost advantages. If we are unable to reduce our HTS VSAT costs sufficiently, we may not be competitive in the international market. We also expect that competition in this industry will continue to increase.
If we lose existing contracts, or orders for our products are not renewed, our ability to generate revenues will be harmed.
A significant part of our business in previous years, including in 2018, was generated from recurring customers. Accordingly
, the termination or non-renewal of our contracts could have a material adverse effect on our business, financial condition and operating results. Some of our existing contracts could be terminated or not renewed due to any of the following reasons, among others:
| · |
dissatisfaction of our customers with our products and/or the services we provide or our inability to provide or install additional products or requested new applications on a timely basis;
|
| · |
customers’ default on payments due;
|
| · |
our failure to comply with covenants or obligations in our contracts;
|
| · |
the cancellation of the underlying project by the sponsoring government body; or
|
| · |
change in the shareholders controlling our company.
|
If we are not able to retain our present customer base and gain new customers, our revenues will decline significantly. In addition, if our service businesses in Peru and Colombia do not win new government related contracts, our financial position may be adversely affected.
Failure to expand our business into the IFC,
cellular backhaul or NGSO
markets,
could have a material adverse effect on our overall business.
Although we have signed contracts with Telcos and other customers in the IFC, commercial and cellular backhaul markets, we may not be successful in our plans to expand our business in these markets or in expanding into the NGSO markets. These markets are relatively new and are highly concentrated with a limited number of players and will require additional expenditures for research and development and sales and marketing. In addition, the cellular backhaul market with Telcos, the commercial IFC market and the NGSO market may fail to grow in accordance with our expectations.
We may also not be able to develop new technologies for those markets on a timely basis. Some of
our projects include long and costly development programs, which could incur unexpected delays, or may require additional investment of resources, broader than expected. If we fail to meet the requirements of our development programs in a timely manner, we will incur penalties and other losses, which could have a significant adverse impact on our business and operating results.
Barriers to further develop those markets could have a material adverse effect on our business and operating results.
Our failure to obtain or maintain authorizations under the U.S. export control and trade sanctions laws and regulations could have a material adverse effect on our business.
The export of some of our satellite communication products, related technical information and services is subject to U.S. State Department, Commerce Department and Treasury Department regulations, including International Traffic in Arms Regulations, or ITAR, and Export Administration Regulations, or EAR. Under these laws and regulations, our non-U.S. employees, including employees of our headquarters in Israel, might be barred from accessing certain information of our U.S. subsidiaries unless appropriate licenses are obtained. In addition to the U.S. export control laws and regulations applicable to us, some of our subcontractors and vendors may also be subject to U.S. export control laws and regulations and required to flow down requirements and restrictions imposed on products and services we purchase from them. If we do not maintain our existing authorizations or obtain necessary future authorizations under the export control laws and regulations of the U.S., including potential requirements related to entering into technical assistance agreements to disclose technical data or provide services to non-U.S. persons, we may be unable to export technical information or equipment to non-U.S. persons and companies, including to our own non-U.S. employees, as may be required to fulfill contracts we may enter into.
We may also be subjected to export control compliance audits in the future that may uncover improper or illegal activities that would subject us to material remediation costs, civil and criminal fines, penalties or an injunction.
10
In addition, to participate in classified U.S. government programs, we may have to obtain security clearances from the DoD for one or more of our subsidiaries that want to participate. Such clearance may require us to enter into a proxy agreement or another similar arrangement with the U.S. government, which would limit our ability to control the operations of the subsidiary and which may impose substantial administrative requirements in order for us to comply. Further, if we materially violate the terms of any proxy agreement, the subsidiary holding the security clearance may be suspended or debarred from performing any government contracts, whether classified or unclassified. If we fail to maintain or obtain the necessary authorizations under the U.S. export control and national security laws and regulations, we may not be able to realize our market focus and our business could be materially adversely affected
.
We are dependent on contracts with governments around the world for a significant portion of our revenue. These contracts may expose us to additional business risks and compliance obligations.
We have focused on expanding our business to include contracts with or for various governments and governmental agencies around the world, including the Peruvian and Colombian governments and U.S. federal, state, and local government agencies through contractors or systems integrators. Such contracts account for a significant portion of our revenues.
Our contracts with international governments generally contain
unfavorable termination provisions.
Governmental customers generally may unilaterally suspend us from receiving new contracts pending resolution of alleged violations of procurement laws or regulations and terminate existing contracts and audit our contract-related costs. If a termination right is exercised by a governmental customer, it could have a material adverse effect on our business, financial condition, results of operations and cash flows.
Additionally, the business we generate from government contracts may be materially adversely affected if:
| · |
our reputation or relationship with government agencies is impaired;
|
| · |
we are suspended or otherwise prohibited from contracting with a domestic or foreign government or any significant law enforcement agency;
|
| · |
levels of government expenditures and authorizations for law enforcement and security related programs decrease or shift to program in areas where we do not provide products and services;
|
| · |
we are prevented from entering into new government contracts or extending existing government contracts based on violations or suspected violations of laws or regulations, including those related to procurement;
|
| · |
we are not granted security clearances that are required to sell our products to domestic or foreign governments or such security clearances are deactivated;
|
| · |
there is a change in government procurement procedures or conditions of remuneration; or
|
| · |
there is a change in the political climate that adversely affects our existing or prospective relationships.
|
11
We
depend
on our main facility in Israel and are susceptible to any event that could adversely affect its condition or the condition of our other facilities.
A material portion of our laboratory capacity, our principal offices and principal research and development facilities for the principal part of our business are concentrated in a single location in Israel. We also have
significant facilities for research and development and manufacturing of components for our low-profile antennas at a single location in Bulgaria as well as a research and development center in Moldova and offices, research and development, engineering and manufacturing facilities in California and in Singapore
.
Fire, natural disaster or any other cause of material disruption in our operations in any of these locations could have a material adverse effect on our business, financial condition and operating results.
We are dependent upon a limited number of suppliers for key components
that are incorporated in our products, including those used
to build our hub systems and VSATs, and may be significantly harmed if we are unable to
obtain such components on favorable terms or on a timely basis.
We are also dependent upon a limited number of suppliers of
space segment, or transponder
capacity and may be significantly harmed if we are unable to obtain the space segment for the provision of services on favorable terms or on a timely basis.
Several of the components required to build our products are manufactured by a limited number of suppliers. Although we have managed to solve the difficulties we experienced in the past with our suppliers with respect to availability of components,
we cannot assure the continued availability of key components or our ability to forecast our component requirements sufficiently in advance. Although we are working with our suppliers to obtain components for our products on favorable terms there is no assurance that our efforts will be successful. If we are unable to obtain the necessary volume of components at sufficiently favorable terms or prices, we may be unable to produce our products at competitive prices. As a result, sales of our products may be lower than expected, which could have a material adverse effect on our business, financial condition and operating results. In addition, our suppliers are not always able to meet our requested lead times. If we are unable to satisfy customers’ needs on time, we could lose their business.
Certain of the significant components
required to build
almost all of our VSAT units, our hub systems as well as
our
other products are manufactured by a sole manufacturer. Such dependency exposes us to certain risks in connection with the availability of the
respective
component, which could include failure in meeting time tables and production requirements and may expose
us
to material price increases which may affect our ability to provide competitive prices or require us to re-design some of our products. We estimate that the replacement of sole manufacturers would, if necessary, take a substantial period of time.
There are a limited number of suppliers of satellite transponder capacity and a limited amount of space segment available (although the space segment availability is increasing and prices are generally decreasing). We are dependent on these suppliers for our provision of services mainly in Peru, Colombia and North America.
While we do secure long-term agreements with our satellite transponder providers, we cannot assure the continuous availability of space segment, the pricing upon renewals of space segment and the continuous availability and coverage in the regions where we supply services. If
we are unable to secure contracts with satellite transponder providers with reliable service at competitive prices, our
services business could be adversely affected
.
We rely on satellite capacity providers, who commit to certain key performance indicators, or KPIs, in connection with the operation of our managed networks and services. Such KPIs are limited and do not always reflect the same level of KPIs guaranteed by us towards our customers.
We would be adversely affected if we are unable to attract and retain key personnel
Our success depends in part on key management, sales, marketing and development personnel and our continuing ability to attract and retain highly qualified personnel, including with respect to our acquired companies. There is competition for the services of such personnel. The loss of the services of senior management and key
personnel
, and the failure to attract highly qualified personnel in the future, may have a negative impact on our business. Moreover, our competitors may hire and gain access to the expertise of our former employees or our former employees may compete with us.
There is no assurance that former employees will not compete with us or that we will be able to find replacements for departing key employees in the future.
12
If demand for our mobility applications for air, land and sea, VSATs and other products declines or if we are unable to develop
products
to meet demand,
our business could be adversely affected
.
Our low-profile in-motion antenna systems
and a portion of our SSPA product line are intended for mobility applications for air, land and sea. If the demand for such products, our VSATs or other products declines, or if we are unable to develop products that are competitive in technology and pricing, we may not be able to realize our market focus and our satellite communication on the move business and other businesses could be materially adversely affected.
We may be unable to adequately protect our proprietary rights, which may limit our ability to compete effectively.
Our business is based mainly on our proprietary technology and related products and services. We establish and protect proprietary rights and technology used in our products by the use of patents, trade secrets, copyrights and trademarks. We also utilize non-disclosure and intellectual property assignment agreements. Because of the rapid technological changes and innovation that characterize the network communications industry, our success will depend in large part on our ability to protect and defend our intellectual property rights. Our actions to protect our proprietary rights in our VSATs, hubs, SSPAs and antennas technology as well as other products may be insufficient to protect our intellectual property rights and prevent others from developing products similar to our products. In addition, the laws of many foreign countries do not protect our intellectual property rights to the same extent as the laws of the U.S., or we may have failed to enter into non-disclosure and intellectual property assignment agreements with certain persons, or the agreements we entered into may be found inadequate. If we are unable to protect our intellectual property, our ability to operate our business and generate expected revenues may be harmed.
Failure to protect against cyber-attacks, natural disasters or terrorist attacks, and failures of our information technology systems, infrastructure and data could have an adverse effect on our business.
Failure to protect against cyber-attack
s,
unauthorized access or network security breaches, inclement weather, natural or man-made disasters, earthquakes, explosions, terrorist attacks, acts of war, floods, fires, computer viruses, power loss, telecommunications or equipment failures, transportation interruptions, accidents or other disruptive events or attempts to harm our systems may cause equipment failures or disrupt our systems and operations. In particular, both unsuccessful and successful cyber-attacks on companies have increased in frequency, scope and potential harm in recent years. Criminal hackers may develop and deploy viruses, worms and other malicious software programs, some of which may be specifically designed to attack our products, systems, computers or networks. Additionally, external parties may induce our employees or users of our products to disclose sensitive information in order to gain access to our data or our customers' data. We have been subject, and will likely continue to be subject, to attempts to breach the security of our networks and Information Technology, or IT, infrastructure through cyber-attack, malware, computer viruses, social engineering, email phishing attacks and other means of unauthorized access. While none of these actual or attempted breaches has had a material impact on our operations or financial condition, we cannot provide any assurance that our business operations will not be negatively materially affected by such breaches in the future.
Any disruption, disabling, or attack affecting our equipment and systems and the hardware, software and infrastructure on which we rely could result in a security or privacy breach. Whether such event is physical human error or malfeasance (whether accidental, fraudulent or intentional) or electronic in nature (such as malware, virus, or other malicious code) such an event could result in our inability to operate our facilities or continually operate our networks, which, even if the event is for a limited period of time, may result in significant expenses and/or loss of market share to other competitors in the market for tele-management products and invoice management solutions. While we maintain insurance coverage for some of these events, which could offset some of the losses, the potential liabilities associated with these events could exceed the insurance coverage we maintain. Any of the events described above could result in litigation and potential liability or fines for us, a material impact to our operations or financial condition, damage our brand and reputation or otherwise harm our business.
13
Regulators globally are also imposing greater monetary fines for privacy violations. For example, in 2016, the European Union adopted new regulations governing data practices and privacy called the General Data Protection Regulation, or GDPR, which became effective in May 2018. The law establishes new requirements regarding the handling of personal data, and non-compliance with the GDPR may result in monetary penalties of up to 4% of worldwide revenue. In addition, violation of applicable local privacy laws may entail criminal consequences. The GDPR and other changes in laws or regulations associated with the enhanced protection of certain types of sensitive data, such as healthcare data or other personal information, could greatly increase our cost of providing our products and services or even prevent us from offering certain services in jurisdictions that we operate
.
Further, if we fail to comply with the GDPR and other privacy regulations applicable to us we may incur high monetary and other penalties, which may have significant adverse effect on our business.
A decrease in the selling prices of our products and services could materially harm our business.
The average selling prices of communications products historically decline over product life cycles. In particular, we expect the average selling prices of our products to decline as a result of competitive pricing pressures and customers who negotiate discounts based on large unit volumes. A decrease in the selling prices of our products and services could have a material adverse effect on our business.
Trends and factors affecting the telecommunications industry are beyond our control and may result in reduced demand and pricing pressure on our products
.
We
operate
in the telecommunication industry and are influenced by trends of
that
industry, which are beyond our control and may affect our operations. These trends include:
| · |
adverse changes in the public and private equity and debt markets and our ability, as well as the ability of our customers and suppliers, to obtain financing or to fund working capital and capital expenditures;
|
| · |
adverse changes in the credit ratings of our customers and suppliers;
|
| · |
adverse changes in the market conditions in our industry and the specific markets for our products;
|
| · |
access to, and the actual size and timing of, capital expenditures by our customers;
|
| · |
inventory practices, including the timing of product and service deployment, of our customers;
|
| · |
the amount of network capacity and the network capacity utilization rates of our customers, and the amount of sharing and/or acquisition of new and/or existing network capacity by our customers;
|
| · |
the overall trend toward industry consolidation among our customers, competitors, and suppliers;
|
| · |
price reductions by our direct competitors and by competing technologies including, for example, the introduction of
HTS
satellite systems by our direct competitors which could significantly drive down market prices or limit the availability of satellite capacity for use with our VSAT systems;
|
| · |
conditions in the broader market for communications products, including data networking products and computerized information access equipment and services;
|
| · |
governmental regulation or intervention affecting communications or data networking;
|
| · |
monetary instability in the countries where we operate; and
|
| · |
the effects of war and acts of terrorism, such as disruptions in general global economic activity, changes in logistics and security arrangements and reduced customer demand for our products and services.
|
14
These trends and factors may reduce the demand for our products and services or require us to increase our research and development expenses and may harm our financial results.
Our international sales and business expose us to changes in foreign regulations and tariffs, tax exposures, political instability and other risks inherent to international business, any of which could adversely affect our operations.
We sell and distribute our products and provide our services internationally, particularly in the United States, Latin America, Asia, Asia Pacific, Africa, Europe and CIS (Russian Commonwealth). We also operate our business and manufacture our products internationally. A component of our strategy is to continue and expand in international markets. Our operations can be limited or disrupted by various factors known to affect international trade. These factors include the following:
| · |
imposition of governmental controls, regulations and taxation which might include a government’s decision to raise import tariffs or license fees in countries in which we do business;
|
| · |
government regulations that may prevent us from choosing our business partners or restrict our activities;
|
| · |
the U.S. Foreign Corrupt Practices Act, or the FCPA, and applicable anti-corruption laws in other jurisdictions, which include anti-bribery provisions. Our policies mandate compliance with these laws. Nevertheless, we may not always be protected in cases of violation of the FCPA or other applicable anti-corruption laws by our employees or third-parties acting on our behalf. A violation of anti-corruption laws by our employees or third-parties during the performance of their obligations for us may have a material adverse effect on our reputation, operating results and financial condition;
|
| · |
tax exposures in various jurisdictions relating to our activities throughout the world;
|
| · |
political and/or economic instability in countries in which we do or desire to do business or where we operate or manufacture our products. Such unexpected changes could have an adverse effect on the gross margin of some of our projects. This includes similar risks from potential or current political and economic instability as well as volatility of foreign currencies in countries such as Colombia, Brazil, Venezuela and certain countries in East Asia;
|
| · |
difficulties in staffing and managing foreign operations that might mandate employing staff in various countries to manage foreign operations. This requirement could have an adverse effect on the profitability of certain projects;
|
| · |
longer payment cycles and difficulties in collecting accounts receivable;
|
| · |
foreign exchange risks due to fluctuations in local currencies relative to the dollar; and
|
| · |
relevant zoning ordinances that may restrict the installation of satellite antennas and might also reduce market demand for our service. Additionally, authorities may increase regulation regarding the potential radiation hazard posed by transmitting earth station satellite antennas’ emissions of radio frequency energy that may negatively impact our business plan and revenues.
|
Any decline in commercial business in any country may have an adverse effect on our business as these trends often lead to a decline in technology purchases or upgrades by private companies. We expect that in difficult economic periods, countries in which we do business will find it more difficult to raise financing from investors for the further development of the telecommunications industry and private companies will find it more difficult to finance the purchase or upgrade of our technology. Any such changes could adversely affect our business in these and other countries.
15
If we fail to meet the covenants in our loan agreements with banks, or otherwise breach the terms of our credit agreements, the banks may accelerate payment of outstanding loans and our business could be seriously harmed.
Our loan agreements and credit and guarantee facilities with banks contain covenants regarding our maintenance of certain financial ratios. The covenants contained in our credit facilities triggers acceleration of payments or restrict, among other things, our ability to pledge our assets, dispose of assets, give guarantees or restrict certain changes in the ownership of our shares. Our ability to continue to comply with these and other obligations depends in part on the future performance of our business. We cannot assure you that we shall be able to continue to comply with the covenants included in our agreements with the banks. If we fail to comply, we shall be required to renegotiate the terms of our credit facilities with the banks. We cannot assure you that we shall be able to reach an agreement with the banks or that such agreements will be on favorable terms to us. Our ability to restructure or refinance our credit facilities depends on the condition of the capital markets and our financial condition. Any refinancing of our existing credit facilities could be at higher interest rates and may require us to comply with different covenants, which could restrict our business operations.
We may face difficulties in obtaining regulatory approvals for our telecommunication services and products, which could adversely affect our operations.
Certain of our telecommunication operations require licenses and approvals by the Israeli Ministry of Communication, the Federal Communications Commission in the U.S., or FCC, and by regulatory bodies in other countries. In Israel and the U.S., the operation of satellite earth station facilities and VSAT
systems
such as ours are prohibited except under licenses issued by the Israeli Ministry of Communication and the FCC in the U.S. Our airborne products require licenses and approvals by the Federal Aviation Agency, or FAA, which are obtained by our customers or our Wavestream subsidiary. We must also obtain approval of the regulatory authority in each country in which we propose to provide network services or operate VSATs. The approval process in Latin America and elsewhere can often take a substantial amount of time and require substantial resources.
In addition, any licenses and approvals that are granted may be subject to conditions that may restrict our activities or otherwise adversely affect our operations. Also, after obtaining the required licenses and approvals, the regulating agencies may, at any time, impose additional requirements on our operations. Failure to obtain the required license where such license is required may result in high monetary and other penalties. We cannot assure you that we will be able to comply with any new requirements or conditions imposed by such regulating agencies on a timely or economically efficient basis.
Our products are also subject to requirements to obtain certification of compliance with local regulatory standards. Delays in receiving such certification could also adversely affect our operations.
Currency exchange rates and fluctuations of currency exchange rates may adversely affect our results of operations, liabilities, and assets.
Since we operate in several countries, we are impacted by currency exchange rates and fluctuations of various currencies. Although partially mitigated by our hedging activities, we are impacted by currency exchange rates and fluctuations thereof in a number of ways, including the following:
| · |
A significant portion of our expenses, principally salaries and related personnel expenses, are incurred in NIS,
and to a lesser extent, other non-U.S. dollar currencies,
whereas the currency we use to report our financial results is the U.S. dollar and a significant portion of our revenue is generated in U.S. dollars. A significant strengthening of the NIS against the U.S. dollar can considerably increase the U.S. dollar value of our expenses in Israel and our results of operations may be adversely affected;
|
| · |
A portion of our international sales is denominated in currencies other than the U.S. dollar, including but not limited to the Euro, Colombian Peso, Australian Dollar, Brazilian Real, Peruvian Sol, Russian Ruble, Malaysian Ringgit and the Mexican Peso,
therefore we are exposed to the risk of devaluation of such currencies relative to the dollar which could have a negative impact on our revenues
;
|
| · |
We have assets and liabilities that are denominated in non-U.S. dollar currencies. Therefore, significant fluctuation in these other currencies could have significant effect on our results; and
|
| · |
A portion of our U.S. dollar revenues are derived from customers operating in local currencies which are different from the U.S. dollar. Therefore, devaluation in the local currencies of our customers relative to the U.S. dollar could cause our customers to cancel or decrease orders or delay payment.
|
16
We are also subject to other foreign currency risks including repatriation restrictions in certain countries, particularly in Latin America.
As noted above, from time to time, we enter into hedging transactions to attempt to limit the impact of foreign currency fluctuations. However, the protection provided by such hedging transactions may be partial and leave certain exchange rate-related losses and risks uncovered. Therefore, our business and profitability may be harmed by such exchange rate fluctuations.
The transfer and use of some of our technology and its production outside of Israel is limited because of the research and development grants we received from the Israeli government to develop such technology.
Our research and development efforts associated with the development of certain of our products have been partially financed through grants from the Innovation Authority, formerly the Office of the Chief Scientist of the Israeli Ministry of Economy. We are subject to certain restrictions under the terms of these grants. Specifically, manufacturing outside Israel, of any product incorporating technology developed with the funding provided by these grants is limited to a certain extent as set forth in the relevant program. In addition, the technology developed with the funding provided by these grants (which is embodied in our products) may not be transferred, without appropriate governmental approvals. Such approvals, if granted, may involve increased royalty payments to the Innovation Authority for royalty-bearing programs. These restrictions do not apply to the sale or export from Israel of our products developed with this technology.
We may not be compliant, currently or in the future, with
the requirements for Benefited Enterprise status
and
may be denied benefits. Israeli government programs and tax benefits may be terminated or reduced in the future.
We participate in programs of the Innovation Authority and the Israel Investment Center, for which we receive tax and other benefits as well as funding for the development of technologies and products. Our company chose 2011 as the year of election in order to receive tax benefits as a “Benefited Enterprise”. Our period of benefits as a Benefitted Enterprise under the 2011 election will expire in 2023. If we fail to comply with the conditions applicable to this status under the Investment Law, we may be required to pay additional taxes and penalties or make refunds and may be denied future benefits. From time to time, the government of Israel has discussed reducing or eliminating the benefits available under such programs, and therefore these benefits may not be available in the future at current levels or at all.
We may be subject to claims by third parties alleging that we infringe intellectual property owned by them. We may be required to commence litigation to protect our intellectual property rights. Any intellectual property litigation may continue for an extended period and may materially adversely affect our business, financial condition and operating results.
There are numerous patents, both pending and issued, in the network communications industry. We may unknowingly infringe on a patent. We may from time to time be notified of claims that we are infringing on patents, copyrights or other intellectual property rights owned by third parties. While we do not believe that we have infringed in the past or are infringing at present on any intellectual property rights of third parties, we cannot assure you that we will not be subject to such claims or that damages for any such claim will not be awarded against us by a court.
17
In addition, we may be required to commence litigation to protect our intellectual property rights and trade secrets, to determine the validity and scope of the proprietary rights of others or to defend against third‑party claims of invalidity or infringement. An adverse result of any litigation could force us to pay substantial damages, stop designing, manufacturing, using or selling related products, spend significant resources to develop alternative technologies, discontinue using certain processes or obtain licenses. In addition, we may not be able to develop alternative technology, and we may not be able to find appropriate licenses on reasonably satisfactory terms. Any such litigation could result in substantial costs and diversion of resources and could have a material adverse effect on our business, financial condition and operating results.
Regulations related to conflict minerals may cause us to incur additional expenses and could limit the supply and increase the costs of certain metals used in the manufacturing of our solutions.
The Dodd-Frank Wall Street Reform and Consumer Protection Act imposes disclosure requirements regarding the use in components of our products of “conflict minerals” mined from the Democratic Republic of Congo and adjoining countries, whether the components of our products are manufactured by us or third parties. These requirements could affect the pricing, sourcing and availability of minerals used in the manufacture of components we use in our products. Although the U.S. Securities and Exchange Commission, or the
SEC, has provided guidance with respect to a portion of the conflict mineral filing requirements that may somewhat reduce our reporting practices, there are costs associated with complying with the disclosure requirements and customer requests, such as costs related to our due diligence to determine the source of any conflict minerals used in our products. We may face difficulties in satisfying customers who may require that all of the components of our products are certified as conflict mineral free or free of numerous other hazardous materials.
Potential product liability claims relating to our products could have a material adverse effect on our business.
We may be subject to product liability claims relating to the products we sell. Potential product liability claims could include, among others, claims for exposure to electromagnetic radiation from the antennas we provide. We endeavor to include in our agreements with our business customers provisions designed to limit our exposure to potential claims. We also maintain a product liability insurance policy. However, our contractual limitation of liability may be rejected or limited in certain jurisdictions and our insurance may not cover all relevant claims or may not provide sufficient coverage. To date, we have not been subject to any material product liability claim. Our business, financial condition and operating results could be materially adversely affected if costs resulting from future claims are not covered by our insurance or exceed our coverage.
Environmental laws and regulations may subject us to significant liability.
Our operations are subject to various Israeli, U.S. federal, state and local as well as certain other foreign environmental laws and regulations within the countries in which we operate relating to the discharge, storage, treatment, handling, disposal and remediation of certain materials, substances and wastes used in our operations.
New laws and regulations, stricter enforcement of existing laws and regulations, the discovery of previously unknown contamination or the imposition of new clean-up requirements may require us to incur a significant amount of additional costs in the future and could decrease the amount of cash flow available to us for other purposes, including capital expenditures, research and development and other investments and could have a material adverse effect on our business, financial condition, results of operations, cash flows and future prospects.
We may identify deficiencies in our compliance with local legislation within countries in which we operate. Failure to comply with such legislation could result in sanctions by regulatory authorities and could adversely affect our operating results
. Examples of these laws and regulations include the E.U. Restriction on the Use of Certain Hazardous Substances in Electrical and Electronic Equipment Directive, and the E.U. Waste Electrical and Electronic Equipment Directive.
18
Risks Related to Ownership of Our Ordinary Shares
Our share price has been highly volatile and may continue to be volatile and decline.
The trading price of our shares has fluctuated widely in the past and may continue to do so in the future as a result of a number of factors, many of which are outside our control. In addition, the stock market has experienced extreme price and volume fluctuations that have affected the market prices of many technology companies, particularly telecommunication and internet‑related companies, and that have often been unrelated or disproportionate to the operating performance of these companies. These broad market fluctuations could adversely affect the market price of our shares. In the past, following periods of volatility in the market price of a particular company’s securities, securities class action litigation has often been brought against that company. Securities class action litigation against us could result in substantial costs and a diversion of our management’s attention and resources.
Our operating results may vary significantly from quarter to quarter and from year to year and these quarterly and yearly variations in operating results, as well as other factors, may contribute to the volatility of the market price of our shares.
Our operating results have and may continue to vary significantly from quarter to quarter. The causes of fluctuations include, among other things:
| · |
the timing, size and composition of requests for proposals or orders from customers;
|
| · |
the timing of introducing new products and product enhancements by us and the level of their market acceptance;
|
| · |
the mix of products and services we offer;
|
| · |
the level of our expenses; and
|
| · |
the changes in the competitive environment in which we operate.
|
The quarterly variation of our operating results, may, in turn, create volatility in the market price for our shares. Other factors that may contribute to wide fluctuations in our market price, many of which are beyond our control, include, but are not limited to:
| · |
economic instability;
|
| · |
announcements of technological innovations;
|
| · |
customer orders or new products or contracts;
|
| · |
competitors’ positions in the market;
|
| · |
changes in financial estimates by securities analysts;
|
| · |
conditions and trends in the VSAT and other technology industries relevant to our businesses;
|
| · |
our earnings releases and the earnings releases of our competitors; and
|
| · |
the general state of the securities markets (with particular emphasis on the technology and Israeli sectors thereof).
|
In addition to the volatility of the market price of our shares, the stock market in general and the market for technology companies in particular has been highly volatile and at times thinly traded. Investors may not be able to resell their shares during and following periods of volatility.
19
We may in the future be classified as a passive foreign investment company, or PFIC, which would subject our U.S. investors to adverse tax rules
.
U.S. holders of our ordinary shares may face income tax risks. There is a risk that we will be treated as a “passive foreign investment company”. Our treatment as a PFIC could result in a reduction in the after-tax return to the holders of our ordinary shares and would likely cause a reduction in the value of such shares. A foreign corporation will be treated as a PFIC for U.S. federal income tax purposes if either (1) at least 75% of its gross income for any taxable year consists of certain types of “passive income,” or (2) at least 50% of the average value of the corporation’s gross assets produce, or are held for the production of, such types of “passive income.” For purposes of these tests, “passive income” includes dividends, interest, gains from the sale or exchange of investment property and rents and royalties other than rents and royalties that are received from unrelated parties in connection with the active conduct of a trade or business. For purposes of these tests, income derived from the performance of services does not constitute “passive income”.
If we are treated as a PFIC, U.S. Holders of shares (or rights) would be subject to a special adverse U.S. federal income tax regime with respect to the income derived by us, the distributions they receive from us, and the gain, if any, they derive from the sale or other disposition of their ordinary shares (or rights). In particular, any dividends paid by us, if any, would not be treated as “qualified dividend income” eligible for preferential tax rates in the hands of non-corporate U.S. shareholders. We believe that we were not a PFIC for the 2018 taxable year. However, since PFIC status depends upon the composition of our income and the market value of our assets from time to time, there can be no assurance that we will not become a PFIC in any future taxable year. U.S. Holders should carefully read Item 10E. “Additional Information – Taxation” for a more complete discussion of the U.S. federal income tax risks related to owning and disposing of our ordinary shares (or rights).
Future sales of our ordinary shares and the future exercise of options may cause the market price of our ordinary shares to decline and may result in a substantial dilution.
We cannot predict what effect, if any, future sales of our ordinary shares by the private equity firm, FIMI Opportunity Funds, or FIMI Funds and our other significant shareholders, or the availability for future sale of our ordinary shares, including shares issuable upon the exercise of our options, will have on the market price of our ordinary shares. Sales of substantial amounts of our ordinary shares in the public market by our company or our significant shareholders, or the perception that such sales could occur, could adversely affect the market price of our ordinary shares and may make it more difficult for you to sell your ordinary shares at a time and price you deem appropriate.
Certain of our shareholders beneficially own a substantial percentage of our ordinary shares.
FIMI, our controlling shareholder, holds approximately 34.1% of our outstanding ordinary shares and each of our other three major shareholders hold between 5.3% and 9.7% of our outstanding ordinary shares. This concentration of ownership of our ordinary shares could delay or prevent mergers, tender offers, or other purchases of our ordinary shares that might otherwise give our shareholders the opportunity to realize a premium over the then-prevailing market price for our ordinary shares. This concentration could also accelerate these same transactions in lieu of others depriving shareholders of opportunities. This concentration of ownership may also cause a decrease in the volume of trading or otherwise adversely affect our share price.
We recently announced that our board of directors expects to declare a cash dividend for the first time. No assurance can be given that we will be able to pay dividends in the future.
On the date of this Annual Report on Form 20-F our board of directors declared a cash dividend in the amount of $0.45 per share (approximately $25 million in the aggregate), payable on April 11, 2019 to shareholders of record on March 28, 2019.
This dividend will be the first time that we will pay a dividend, but we have not adopted a general policy regarding the distribution of dividends and make no statements as to the distribution of dividends in the foreseeable future. The terms of some of our financing arrangements require us to meet certain financial covenants regarding minimum cash balance and
require prior approval of certain banks which extended us loans.
Any future dividend distributions are subject to the discretion of our board of directors and will depend on various factors, including our operating results, future earnings, capital requirements, financial condition, and tax implications of dividend distributions on our income, future prospects and any other factors deemed relevant by our board of directors. The distribution of dividends is also limited by Israeli law, which permits the distribution of dividends by an
Israeli corporation
only out of
its retained earnings as defined in Israel’s Companies Law, 5759-1999, or the Companies Law, provided that there is no reasonable concern that such payment will cause us to fail to meet our current and expected liabilities as they become due, or otherwise with the court’s permission.
You should not invest in our company if you seek a secured dividend income from your investment. For information regarding taxation of dividend, see ITEM 10.E
– “
Additional Information - Taxation - Israeli Tax Consequences of Holding Our Stock - Dividends”.
20
Our ordinary shares are traded on more than one market and this may result in price variations.
Our ordinary shares are traded on the NASDAQ Global Select Market and on the TASE. Trading in our ordinary shares on these markets is made in different currencies (U.S. dollars on the NASDAQ Global Select Market, and NIS on the TASE), and at different times (resulting from different time zones, different trading days and different public holidays in the U.S. and Israel). Consequently, the trading prices of our ordinary shares on these two markets often differ. Any decrease in the trading price of our ordinary shares on one of these markets could cause a decrease in the trading price of our ordinary shares on the other market.
If we are unable to maintain effective internal control over financial reporting in accordance with Section 404 of the Sarbanes-Oxley Act of 2002, the reliability of our financial statements may be questioned and our share price may suffer
.
The Sarbanes-Oxley Act of 2002 imposes certain duties on us and on our executives and directors. To comply with this statute, we are required to document and test our internal control over financial reporting, and our independent registered public accounting firm must issue an attestation report on our internal control procedures, and our management is required to assess and issue a report concerning our internal control over financial reporting. Our efforts to comply with these requirements have resulted in increased general and administrative expenses and a diversion of management time and attention, and we expect these efforts to require the continued commitment of significant resources. We may identify material weaknesses or significant deficiencies in our assessments of our internal controls over financial reporting. Failure to maintain effective internal control over financial reporting could result in investigation or sanctions by regulatory authorities, and could adversely affect our operating results, investor confidence in our reported financial information and the market price of our ordinary shares.
Risks Related to Our Location in Israel
Political and economic conditions in Israel may limit our ability to produce and sell our products. This could have a material adverse effect on our operations and business condition, harm our results of operations and adversely affect our share price.
We are incorporated under the laws of the State of Israel, where we also maintain our headquarters and most of our manufacturing and research and development facilities.
As a result, political, economic and military conditions affecting Israel directly influence us. Any major hostilities involving Israel, a full or partial mobilization of the reserve forces of the Israeli army, the interruption or curtailment of trade or air traffic between Israel and its trading partners, or a significant downturn in the economic or financial condition of Israel could adversely affect our business, financial condition and results of operations.
Conflicts in North Africa and the Middle East, including in Egypt and Syria which countries border
Israel, have resulted in continued
political uncertainty and violence in the region. Efforts to improve Israel’s relationship with the Palestinian Authority have failed to result in a permanent solution, and there have been numerous periods of hostility in recent years. In addition, relations between
Israel and Iran continue to be seriously strained, especially with regard to Iran’s nuclear program.
Such instability may affect the economy, could negatively affect business conditions and, therefore, could adversely affect our operations. To date, these matters have not had any material effect on our business and results of operations; however, the regional security situation and worldwide perceptions of it are outside our control and there can be no assurance that these matters will not negatively affect our business, financial condition and results of operations in the future.
21
Furthermore, there are a number of countries, primarily in the Middle East, as well as Malaysia and Indonesia that restrict business with Israel or Israeli companies, and we are precluded from marketing our products to these countries directly from Israel. Restrictive laws or policies directed towards Israel or Israeli businesses may have an adverse impact on our operations, our financial results or the expansion of our business. In addition, there have been increased efforts by activists to cause companies and consumers to boycott Israeli goods. Such actions, particularly if they become more widespread, may adversely impact our ability to sell our products.
Your rights and responsibilities as a shareholder are governed by Israeli law and differ in some respects from those under Delaware law
.
Because we are an Israeli company, the rights and responsibilities of our shareholders are governed by our Articles of Association and by Israeli law. These rights and responsibilities differ in some respects from the rights and responsibilities of shareholders in a Delaware corporation. In particular, a shareholder of an Israeli company has a duty to act in good faith towards the company and other shareholders and to refrain from abusing his, her or its power in the company, including, among other things, in voting at the general meeting of shareholders on certain matters. Israeli law provides that these duties are applicable to shareholder votes on, among other things, amendments to a company’s articles of association, increases in a company’s authorized share capital, mergers and interested party transactions requiring shareholder approval. In addition, a shareholder who knows that it possesses the power to determine the outcome of a shareholders’ vote or to appoint or prevent the appointment of a director or executive officer in the company has a duty of fairness towards the company. However, Israeli law does not define the substance of this duty of fairness. There is little case law available to assist in understanding the implications of these provisions that govern shareholder behavior.
As a foreign private issuer whose shares are listed on the NASDAQ Global Select Market, we follow certain home country corporate governance practices instead of certain NASDAQ requirements, which may not afford shareholders with the same protections that shareholders of domestic companies have
.
As a foreign private issuer whose shares are listed on the NASDAQ Global Select Market, we are permitted to follow certain home country corporate governance practices instead of certain requirements of The NASDAQ Marketplace Rules.
We follow Israeli law and practice instead of The NASDAQ Marketplace Rules with respect to the director nominations process
and the requirement to obtain shareholder approval for the establishment or material amendment of certain equity-based compensation plans and arrangements. As a foreign private issuer listed on the NASDAQ Global Select Market, we may also follow home country practice with regard to, among other things, the requirement to obtain shareholder approval for certain dilutive events (such as for an issuance that will result in a change of control of the company, certain transactions other than a public offering involving issuances of a 20% or more interest in the company and certain acquisitions of the stock or assets of another company).
A foreign private issuer that elects to follow a home country practice instead of NASDAQ requirements must submit to NASDAQ in advance a written statement from an independent counsel in such issuer’s home country certifying that the issuer’s practices are not prohibited by the home country’s laws. In addition, a foreign private issuer must disclose in its annual reports filed with the SEC each such requirement that it does not follow and describe the home country practice followed by the issuer instead of any such requirement.
Accordingly, our shareholders may not be afforded the same protection as provided under NASDAQ’s corporate governance rules.
If we are unable to comply with Israel’s enhanced export control regulations our ability to export our products from Israel could be negatively impacted.
Our export of military products and related technical information is also subject to enhanced Israeli Ministry of Defense regulations regarding defense export controls and the export of “dual use” items (items that are typically sold in the commercial market but that may also be used in the defense market). Some of our products may include features, such as encryption, that require an export license. Some of our products are exempted from Israeli Ministry of Defense export control. The Israeli Ministry of Defense may change the classification of our existing commercial products or may determine that new products we develop are not exempt from Israeli Ministry of Defense export control. This would place such products subject to the Israeli Ministry of Defense export control regulations as military products or “dual use” items, which would impose on our sales process stringent constraints in relation to each sale transaction and limit our markets. If we do not maintain our existing authorizations and exemption or obtain necessary future authorizations and exemptions under the export control laws and regulations of Israel, including export licenses for the sale of our equipment and the transfer of technical information, we may be unable to export technical information or equipment outside of Israel, we may not be able to realize our market focus and our business could be materially adversely affected.
22
Our results of operations may be negatively affected by the obligation of our personnel to perform military service.
A significant number of our employees in Israel are obligated to perform annual reserve duty in the Israeli Defense Forces and may be called for active duty under emergency circumstances at any time. If a military conflict or war arises, these individuals could be required to serve in the military for extended periods of time. Our operations could be disrupted by a significant absence of one or more of our key employees or a significant number of other employees due to military service. Any disruption in our operations could adversely affect our business.
You may not be able to enforce civil liabilities in the U.S. against our officers and directors.
We are incorporated in Israel. All of our directors and executive officers reside outside the U.S., and a significant portion of our assets and the personal assets of most of our directors and executive officers are located outside the U.S. Therefore, it may be difficult to effect service of process upon any of these persons within the U.S. In addition, a judgment obtained in the U.S. against us, or against such individuals, including but not limited to judgments based on the civil liability provisions of the U.S. federal securities laws, may not be collectible within the U.S.
Additionally, it may be difficult for an investor or any other person or entity, to assert U.S. securities law claims in original actions instituted in Israel. Israeli courts may refuse to hear a claim based on a violation of U.S. securities laws on the ground that Israel is not the most appropriate forum in which to bring such a claim. Even if an Israeli court agrees to hear a claim, it may determine that Israeli law is applicable to the claim. Certain matters of procedures will also be governed by Israeli law.
Israeli law may delay, prevent or make difficult a merger with or an acquisition of us, which could prevent a change of control and therefore depress the price of our shares.
Provisions of Israeli law may delay, prevent or make undesirable a merger or an acquisition of all or a significant portion of our shares or assets. Israeli corporate law regulates acquisitions of shares through tender offers and mergers, requires special approvals for transactions involving significant shareholders and regulates other matters that may be relevant to these types of transactions. These provisions of Israeli law could have the effect of delaying or preventing a change in control and may make it more difficult for a third party to acquire us, even if doing so would be beneficial to our shareholders. These provisions may limit the price that investors may be willing to pay in the future for our ordinary shares. Furthermore, Israeli tax considerations may make potential transactions undesirable to us or to some of our shareholders.
Under current Israeli law, U.S. law and the laws of other jurisdictions, we may not be able to enforce covenants not to compete and therefore may be unable to prevent our competitors from benefiting from the expertise of some of our former employees.
We currently generally include non-competition clauses in the employment agreements of our employees in certain regions. The provisions of such clauses prohibit our employees, if they cease working for us, from directly competing with us or working for our competitors for a certain period of time. Israeli labor courts have required employers, seeking to enforce non-compete undertakings against former employees, to demonstrate that the competitive activities of the former employee will cause harm to one of a limited number of material interests of the employer recognized by the courts (for example, the confidentiality of certain commercial information or a company’s intellectual property). In the event that any of our employees chooses to leave and work for one of our competitors, we may be unable to prevent our competitors from benefiting from the expertise of our former employee obtained from us, if we cannot demonstrate to the court that our interests as defined by case law would be harmed. Non-competition clauses may be unenforceable or enforceable only to a limited extent in other jurisdictions as well.
23
| A. |
History and Development of the Company
|
We were incorporated in Israel in 1987 and are subject to the laws of the State of Israel. We are a public limited liability company under Israel’s Companies Law and operate under that law and associated legislation. Our corporate headquarters, executive offices and main research and development and engineering facilities, as well as facilities for some manufacturing and product assembly are located at Gilat House, 21 Yegia Kapayim Street, Kiryat Arye, Petah Tikva 4913020, Israel. Our telephone number is (972) 3-925-2000. Our address in the U.S. is c/o Wavestream Corporation at 545 West Terrace Drive, San Dimas, California 91773. Our web-site address is
www.gilat.com
. The information on our website is not incorporated by reference into this annual report.
We are a leading global provider of satellite-based broadband communications. We design and manufacture ground-based satellite communications equipment and provide comprehensive solutions and end-to-end services, powered by our innovative technology. Our portfolio comprises a cloud based satellite network platform, VSAT terminals, amplifiers, high-speed modems, high performance on-the-move antennas, high efficiency, high power SSPA amplifiers and BUCs. Our comprehensive solutions support multiple applications with a full portfolio of products to address key applications including broadband access, cellular backhaul, enterprise, in-flight connectivity, maritime, trains, defense and public safety, all while meeting stringent service level requirements. We also provide connectivity services, internet access and telephony to enterprise, government and residential customers over networks built using our own equipment and also over other networks that we install, mainly on the basis of BOT contracts. In these BOT projects, we build telecommunication infrastructure typically using fiber-optic and wireless technologies for broadband connectivity.
Our products are primarily sold to communication service providers and operators that use satellite communications for their customers and to government organizations and system integrators that use our technology. We are
particularly active in the following market sectors: enterprise and government broadband applications; consumer broadband access; cellular connectivity; national telecommunication connectivity; defense and homeland security organization and mobility applications for air, land and sea.
We provide services directly to end-users in various market sectors including in certain countries in Latin America and
provide managed network services, such as in Australia and the U.S., over a satellite network owned by a third party.
We have 20
sales and support
offices worldwide
, three network operations centers and five R&D centers
.
We shipped our first generation VSAT in 1989 and since then we have been among the technological leaders in the satellite ground equipment industry. Our continuous investment in research and development has resulted in the development of new and industry‑leading products and our intellectual property portfolio includes 74 issued patents (61 U.S. and 13 foreign) relating to our VSAT and other systems as well as 18 issued patents (16 U.S. and 2 foreign) relating to our
satellite communication on the
move antenna solutions and
13 issued patents (3 U.S. and 10 foreign)
for our
high power SSPAs
.
In December 2013, we sold our Spacenet subsidiary, a provider of managed network communications services utilizing satellite wireline and wireless networks and associated technology
.
In 2018, 2017 and 2016, our property and equipment purchases related to our continuing operations amounted to approximately $10.8 million, $3.7 million, and $4.3 million respectively. These amounts do not include the reclassification of inventory to property and equipment and other non-cash purchases made during 2018, 2017 and 2016 in the approximate amounts of $2.3 million, $5.7 million, and $2.5 million, respectively.
24
| B. |
Business Overview
|
We are a leading provider ground-based satellite communications and other network communications solutions and services. We design and manufacture ground-based satellite networking communications equipment, which we sell to our customers either as network components (modems, BUCs, antennas) or as complete network solutions (which include hubs and related terminals and services) or turnkey projects. The equipment that we develop includes commercial VSAT systems, defense and homeland security satellite communications systems, SSPAs, BUCs, low-profile antennas, on-the-Move / on-the-Pause terminals and modems. Our equipment is used by satellite operators, service providers, telecommunications operators, system integrators, government and defense organizations, large corporations and enterprises. We sell and distribute our products and provide our services internationally, in Latin America, Asia, Asia Pacific, North America, Africa, Europe and
CIS (Russian Commonwealth)
. In particular, we provide connectivity services, internet access and telephony, to enterprise, government and residential customers over our own networks, built using both our equipment and equipment purchased from other manufacturers in various technologies. We also provide NOC operations and hub services.
Prior to 2018, we operated in three business divisions: Commercial, Mobility and Services. Commencing in 2018, in order to more accurately reflect management’s focus, organizational alignment, our customer base and end markets, we
operate in three business segments, as follows:
| · |
Fixed Networks provides advanced fixed broadband satellite communication networks, satellite communication systems and associated professional services and comprehensive turnkey solutions and fully managed satellite network services solutions. Our customers are service providers, satellite operators, MNOs, Telcos, and large enterprises, consumers and governments worldwide. In addition, it includes our network operation and managed satellite network services solutions activity in Peru and Colombia. We focus on HTS, opportunities worldwide, with focus on cellular backhaul, and are driving meaningful partnerships with satellite operators to leverage our technology and breadth of services to deploy and operate the ground-based satellite communication networks.
|
| · |
Mobility Solutions provides advanced on-the-move satellite communications equipment, systems, and solutions, including airborne, maritime and ground-mobile satellite systems and solutions. This segment provides solutions for land, sea and air connectivity, while placing major focus on the high-growth market of IFC, with our unique leading technology as well as defense and homeland security activities. Our product portfolio comprises of high-speed modems, high performance on-the-move antennas and high efficiency, high power SSPAs and BUC. Our customers are service providers, system integrators, defense and homeland security organizations, as well as other commercial entities worldwide.
|
| · |
Terrestrial Infrastructure Projects provides network infrastructure construction of the fiber and microwave network of FITEL in Peru.
|
We have retrospectively revised our segment information for the years ended December 31, 2017 and 2016 to conform to the new business segments presentation.
The above changes in our reportable segments will have no effect on the goodwill assignment among the divisions.
In the year ended December 31, 2018, we derived approximately 54%, 37% and 9% of our revenues from our Fixed Networks, Mobility Solutions and Terrestrial Infrastructure Projects segments, respectively.
We have diversified revenue streams that result from both sales of products, which include construction of networks, and services. In the year ended December 31, 2018, approximately 65% of our revenues were derived from sales of products and 35% from services. During the same period, we derived 36%, 36%, 15% and 13% of our revenues from Latin America, North America, APAC and EMEA, respectively.
25
Industry Overview
There is a global demand for satellite-based communications solutions for a number of reasons. Primarily, satellite-based communication is still the only truly ubiquitous networking solution. Secondly, satellite communications are more readily available as compared to alternative terrestrial communications networks. Lastly, satellite communications solutions offer rapidly deployed secure broadband connectivity and broadband communications on the move.
A two-way broadband satellite communications solution is comprised of the following elements:
| · |
Communications satellite – Typically a satellite in geostationary orbit (synchronized with the earth’s orbit) with a fixed coverage of a portion of the earth (up to approximately one third).
|
| · |
Satellite communications ground station equipment – These are devices that have a combination of data communications and Radio Frequency, or RF elements designed to deliver data via communication satellites. Examples of ground station equipment are remote site terminals, such as VSATs, central hub station systems, modem, amplifiers, BUCs and antennas.
|
| · |
VSAT - which is comprised of the following elements:
|
| o |
Modem – This is the device that modulates the digital data into an analog RF signal for delivery to the upconverter, and demodulates the analog signals from the downconverter back into digital data. The modem, which is typically located indoors, performs data processing functions such as traffic management and prioritization and provides the digital interfaces (Ethernet port/s) for connecting to the user’s equipment (PC, switch, etc.).
|
| o |
Amplifiers and BUCs – These are the components that connect the ground station equipment with the antenna. The purpose of the amplifiers and BUCs is to amplify the power and convert the frequency of the transmitted RF signal.
|
| o |
Antenna – Antennas can vary quite significantly in size, power and complexity depending on the ground equipment they are connected to, and their application. For example, antennas connected to remote sites generally are in the range of one meter in diameter while those connected to the central hub system can be in the range of ten meters in diameter. Antennas used on moving platforms need to be compact and have a mechanically or electronically auto-pointing mechanism so that they can remain locked onto the satellite during motion.
|
26
Broadband satellite networks are comprised of ground stations at multiple locations that communicate through a satellite in geostationary orbit, providing continent-wide wireless connectivity. Satellite broadband networks are used to provide a variety of traffic types such as broadband data, video and voice. The value chain of satellite network services consists of the following four main elements:
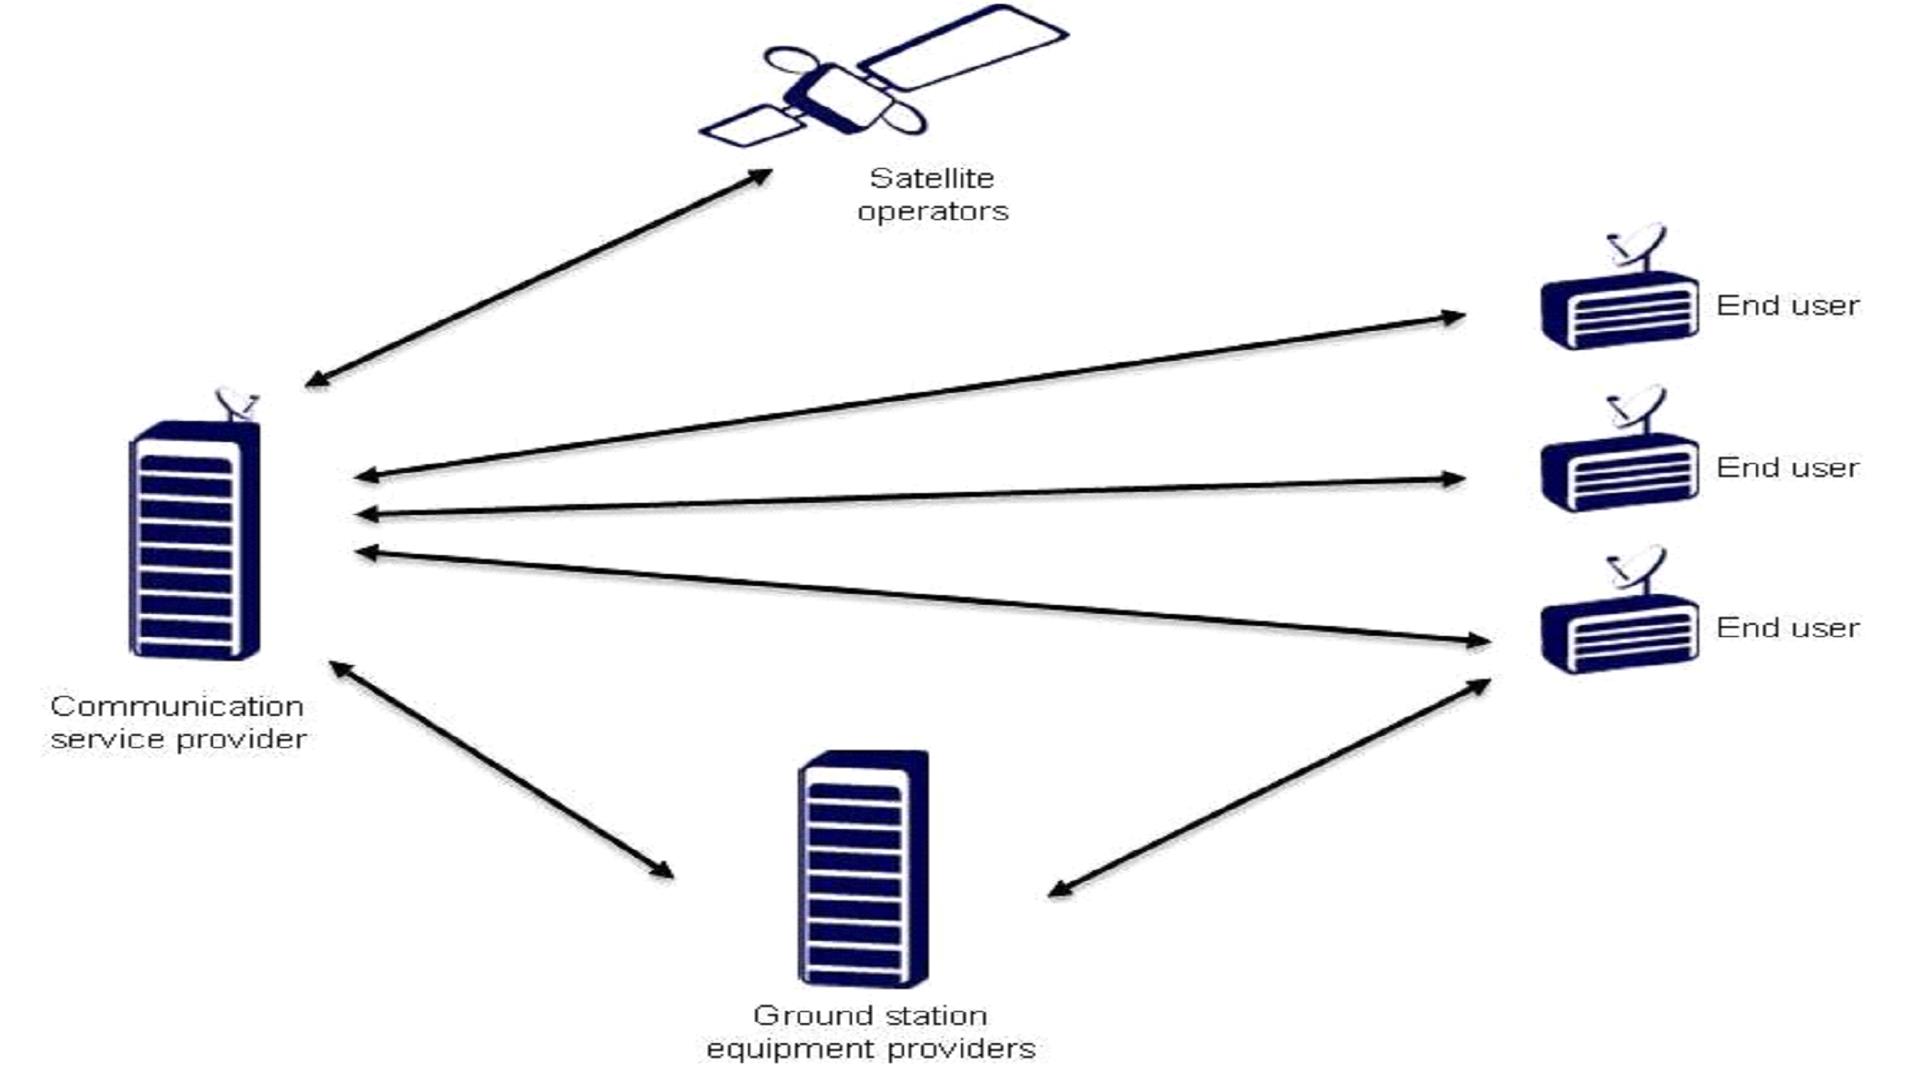
Satellite operators
provide satellite transponder capacity (a portion of the satellite’s bandwidth and power which is used to establish one or more communication channels)
on satellites positioned in geostationary orbit above the equator.
A typical satellite can cover a geographic area the size of the continental U.S. or larger. The satellite receives information from the ground station equipment, amplifies it and transmits it back to earth on a different frequency. Satellite operators sell the capacity in a variety of leasing agreements to their customers. Our technology is compatible with C‑band, Ku‑band and Ka‑band satellites including special extended C‑band and extended Ku‑band satellites. Some of the leading satellite operators are Intelsat, SES, Chinasat, Hispasat and Eutelsat.
Ground equipment providers
manufacture network equipment for both satellite communications networks and broadcast markets. Satellite communications systems connect a large central earth station, called a hub, with multiple remote sites equipment, called VSATs (ranging from tens to thousands of sites), which communicate via satellite. We are a leading ground equipment provider for hubs, VSATs, high-power amplifiers and low-profile antennas for satellite communications on-the-move.
Communication service providers
buy equipment from ground equipment providers, install and maintain such equipment, lease capacity from satellite operators and sell a full package of communication services to the end user.
End users
are customers that use satellite communications equipment and services. Examples of end users range from enterprises, to government ministries and defense organizations, to residential consumers.
System integrators
are companies that provide customized solutions to end users by integrating the necessary equipment and services. For example, defense organizations often work with specialized system integrators that integrate various components, such as power amplifiers and low profile antennas, into a satellite terminal.
Satellite broadband networks are typically systems deployed in a hub-and-spoke configuration, with remote locations connecting via satellite to a central hub station. Satellite communications networks have a diverse range of uses and applications, and provide communication services as a stand‑alone, alternative, or complementary service to terrestrial networks.
We believe that the advantages of satellite communications networks include:
| · |
Universal availability
– Satellite communications provide service to any location within a satellite footprint.
|
27
| · |
Timely implementation –
Large satellite communications networks with thousands of remote sites can be deployed within a few weeks.
|
| · |
Broadcast and multicast capabilities
– Satellite is an optimal solution for broadcast and multicast transmission as the satellite signal is simultaneously received by any group of users in the satellite footprint.
|
| · |
Reliability and service availability
– Satellite communications network availability is high due to the satellite and ground equipment reliability, the small number of components in the network and terrestrial infrastructure independence.
|
| · |
Scalability
– Satellite communications networks scale easily from a single site to thousands of locations.
|
| · |
Cost-effectiveness
– The cost of satellite communications networks is independent of distance and therefore it is a cost-effective solution for networks comprised of multiple sites in remote locations.
|
| · |
Applications delivery
– Satellite communications networks offer a wide variety of customer applications such as e‑mail, virtual private networks, video, voice, internet access, distance learning, cellular backhaul and financial transactions.
|
| · |
Portability and Mobility
– Satellite communications solutions can be mounted on moving platforms for communications on the move, or deployed rapidly for communications in fixed locations and then relocated or moved as required.
|
Given the technological and implementation benefits afforded by satellite communications networks, we believe that the market for satellite communications products and services will continue to grow. In particular, according to a 2018 report from NSR, a leading international telecom market research and consulting firm, the number of unit shipments to broadband satellite sites, platforms and subscribers is expected to grow at a compounded annual growth rate, or CAGR, of 19% through 2026.
Further, according to a 2017 report of EuroConsult, a leading global consulting firm specializing in space markets, aggregated satellite capacity has grown significantly in recent years and is forecasted to grow further in the coming years. According to the report, the growing availability of satellite capacity has resulted in significant reduction in the cost of satellite capacity.
In addition, satellite communications is an effective solution for mobility, especially for maritime and for international flights.
New communications networks that integrate satellites operating in low or medium earth orbits (NGSO) are scheduled to be launched in the coming years and are forecasted to account for a significant portion of the aggregated satellite capacity and of the equipment unit shipments to broadband satellite sites, platforms and subscribers.
The availability of auto-pointing satellite antennas designed for in-motion two way communications has created market demand from both commercial and government/defense segments. These antennas are usually mounted on a moving platform (airplane, boat, train, unmanned aerial vehicles, or
UAVs) and connected to a satellite terminal within or on the platform. An important requirement for these applications is that they have light-weight and low-profile antennas, to minimize air drag and fuel consumption. We believe that the demand for light-weight, low-profile antenna systems will increase as well.
Another important requirement emerging is for next generation solid-state power amplifiers able to provide high output power, greater efficiency and field-proven reliability in smaller, lighter weight product packages suitable for fixed, mobile, and airborne antenna systems. These amplifiers, designed and thoroughly tested for use in extreme environments, help provide uninterrupted connectivity to support mission-critical defense operations, as well as demanding inflight connectivity and consumer broadband applications.
28
There are six primary market categories that require broadband satellite products and services:
Enterprise and Business.
End-users include large companies and organizations, Small- Medium Enterprises, or SMEs, and Small Office / Home Office (SOHO) users. For enterprises, satellite communications networks offer network connectivity and deliver voice, data and video within corporations (known as corporate intranets), internet access, transaction‑based connectivity that enables on‑line data delivery such as point‑of‑sale (credit and debit card authorization), inventory control and real time stock exchange trading.
Cellular Backhaul.
Cellular networks comprised of backhaul connections to connect the cellular base stations that serve multiple customers. Cellular backhaul connectivity requires more demanding network performance. These requirements usually include a high level of quality of service, or QoS, high speed connectivity, and more control over the network. Satellite backhaul applications include both primary and backup connectivity.
Rural Telecommunications.
The rural telecommunications market is comprised of communities throughout the world that require telephone, and internet access in areas that are unserved or underserved by existing telecommunications services. These communication services are usually provided to the rural population via government‑subsidized initiatives. This market sector is comprised of “Build‑Operate” projects, in which governments subsidize the establishment and the operation of a rural network to be served by a satellite, wireless or cellular service provider that is usually selected in a bid process.
In other instances, local communications operators have universal service obligations, or USOs, which require them to serve rural areas lacking terrestrial infrastructure. Some local communications operators elect to fulfill this obligation by hiring third parties in a model known as BOT. In these instances, the network is established and made operational by a third party service provider, which operates it for a certain period of time and then it is transferred to the operator.
Consumer.
The consumer market consists of residential users. These users require a high‑speed internet connection similar to a digital subscriber line, or DSL, or cable modem service.
Government.
The government sector consists of homeland security and military users. The versatility, reliability, and resiliency of satellite broadband networks, the in-motion low profile antennas and the lightweight SSPAs are a perfect fit for security and armed forces. For example, low power lightweight satellite communications systems can be quickly deployed in disaster areas, as a replacement for destroyed wireless or wire line networks, providing communication services to emergency personnel and law enforcement units.
Mobility.
The mobility market is comprised of on the move platforms, on land at sea and in the air, such as aircraft, ships, trains and vehicles, that require broadband connectivity. Satellite-based solutions for these platforms include ground network platform, modems, on-the-move antennas and transceivers.
Our Competitive Strengths
We are a leading provider of satellite communication and networking products and services. Our competitive strengths include:
Market leadership in large and growing markets.
Since our inception, we have sold more than 1. 5 million satellite terminals (VSATs), over 15,000 low profile antennas and over 30,000 BUCs and SSPAs to customers in approximately 90 countries. Our customer base includes a large number of satellite‑based communications service providers, system integrators and operators worldwide. In addition, we are one of the largest satellite communications service providers to rural communities in Latin America.
29
Technology leadership.
We have been at the forefront of satellite communications technology and services for over 30 years and continue to be an innovator and developer of new satellite technologies. Our customizable satellite communications technology enables us to provide a wide range of broadband, internet, voice, data and video solutions to our customers. We offer hubs and optimized satellite terminals (VSATs) which can attain a rate of up to 400 Mbps. Our product and operations infrastructure is capable of running hubs with greater than 99.8% availability while rolling out thousands of new VSAT site locations each month. Our SkyEdge II-c, state-of-the-art solution, provides high performance and space segment efficiency. Our legacy product lines are known for their durability and resilience. We provide advanced on-the- move terminals, including all components such as antennas, BUCs and modems. Our low-profile, satellite communications on-the-move solutions antennas provide reliable broadband communications for commercial and defense applications. Our SSPAs provide good performance, even at the extreme end of temperature and environmental performance specifications. X-Architecture, our new cloud-based distributed architecture, and our Electronically-Steered Array / Phased Array Antenna (ESA/PAA) are our two most recent innovations that, we believe, have positioned us as a leader in providing satellite communications technology. Our research, development and engineering team, comprised of 268
persons, enable
us to rapidly develop new features and applications. Moreover, by directly serving end-users through our service organizations, we are able to quickly respond to changing market conditions and maintain our position in the market.
Global presence and local support.
We have sold our products in approximately 90 countries on six continents. Our products and services are used by a large and diverse group of customers including some of the largest enterprises in the world, several government agencies and many rural communities. We have 20 sales and service offices worldwide. Through our network of offices, we are able to maintain a two-tier customer support program offering local support offices and a centralized supply facility.
Complementary business lines for turnkey solutions.
Our business segments are able to provide a full turnkey solution to our customers by integrating a diverse range of value‑added products and services. Our product and service offerings - satellite communications network equipment, small cell solutions, power amplifiers, low-profile satellite communications on-the-move terminals, antennas, installation, operation and maintenance – provide communication services ranging from broadband, internet, voice, data and video to managed solutions that can be customized and are flexible. Our business model enables us to be attuned to our customers’ needs and to adapt to changing market trends. Our satellite communications-based networks sometimes serve as platforms for the delivery of complete systems, providing versatile solutions for enterprises, government agencies, SMEs, rural communities, SOHOs and consumers.
Diversified revenue streams and customer base.
In the year ended December 31, 2018, approximately 65% of our revenues were generated from equipment sales and 35% of our revenues were generated from services. Our equipment sales are generally independent equipment orders which often generate maintenance contracts and additional opportunities for future equipment sales and also include the revenues from the construction phase of large-scale projects. Our service sales are characterized by long-term contracts that provide a recurring revenue base. In the year ended December 31, 2018, our three business segments, Fixed Networks, Mobility Solutions and Terrestrial Infrastructure Projects, accounted for 54%, 37% and 9%
of our revenues, respectively.
Delivery Capabilities.
Over the years we have demonstrated our ability to deploy communication networks in the most remote areas, which are difficult both to reach and service. This experience enhances both our ability to plan and implement sophisticated communication networks in remote areas, as well as in challenging terrain, and our ability to meet technological challenges like a lack of electrical power infrastructure or a lack of any physical infrastructure. Our teams are proficient in delivering solutions in these areas.
Experienced management team.
Our management is comprised of an experienced executive team. Both Mr. Dov Baharav, the Chairman of our Board of Directors, and Mr. Yona Ovadia, our Chief Executive Officer, have broad experience in senior executive positions. Mr. Baharav served as Chairman of the Board of Directors of Israel Aerospace Industries Ltd. and was President and CEO and a member of the Board of Directors of Amdocs Management Limited, or Amdocs, (NASDAQ: DOX). Mr. Ovadia served as Group President and Head of Services Group at Amdocs and in various other executive positions.
Our Growth Strategy
Our objective is to leverage our technology and services capabilities in order to:
Expand Presence in the IFC Market
– We continue to develop our hub and modem technology to serve connectivity needs of aviation service providers. We are also placing a major focus on developing a new dual band Ka/Ku terminal, as well as leveraging our unique Phased Array antennas technology. These solutions are designed to serve the high growth of IFC services in the commercial aviation and business aviation markets.
30
Fortify our Leadership Position in the 4G/LTE Backhaul Market
- We intend to continue to leverage our technology, as well as our experience, to serve mobile network operators’ 4G/LTE and 5G
connectivity needs in rural, metro-edge and metro areas with long term projects.
Continue to Serve as a Key Partner of VHTS/HTS Satellite Operators
– We intend to continue to serve as a meaningful partner of VHTS/HTS operators, leveraging our leading technology in the market and our breadth of services to deploy and operate both GEO and NGSO ground-based satellite communication networks.
Provide internet Broadband to Rural Areas
– We intend to build on our experience in bringing broadband internet to rural areas in Latin America and identify additional markets to expand into.
Our Businesses in 2018
Fixed Networks Segment
Overview
Our Fixed Networks segment provides satellite communications network systems and associated professional and managed satellite network services to satellite operators, governments, Telcos and service providers worldwide. Our operational experience in deploying large networks together with our global network of local offices enable us to work closely and directly with those providers. We provide equipment, solutions and services to the commercial, mobile, government, enterprise and consumer markets. We provide solutions tailored to the requirements of individual industries. Based on our open SkyEdge platform, our solutions provide added value to operators through better performance and integration as well as simpler deployment.
Our SkyEdge product family, including SkyEdge II-c products, allow us to deliver efficient, reliable and affordable broadband connectivity such as internet, voice, data and video. As a single platform SkyEdge II-c supports multiple applications such as Broadband Access, Enterprise Cellular Backhaul and Mobility applications.
We also support satellite networking through professional services, training and a full range of turnkey solutions and outsourced network operations.
Products and Solutions
Broadband Satellite Network System
Our SkyEdge II-c system supports large-scale broadband services for both consumer and enterprise applications, including fast web browsing, high-speed trunking, video streaming, internet Protocol Television, or IPTV, Voice Over internet Protocol, or VoIP, and other bandwidth-intensive services. This system also supports cellular backhauling of 2G, 3G and 4G (LTE) technologies. The SkyEdge II-c is designed with highest scalability supporting multi satellite - multi beam networks, with any number of gateways and user terminals. The SkyEdge II-c platform supports four VSAT types: Scorpio, Gemini, Capricorn and Taurus. It includes a unified, centralized network management system, or NMS which manages all hub elements at all gateways from a central NOC location and enables the definition of different types of virtual network operators to support different types of business models and services in multiple regions. Enhanced FCAPS functions, or
fault-management, configuration, accounting, performance, and security, a network management framework created by the International Organization for Standardization and the electronic machine to machine interface, enable full visibility, control and seamless integration with the operator’s operations support system/ business support system, or OSS/BSS, environment.
31
SkyEdge II-c Scorpio
is a cutting-edge, fully integrated Ka-band terminal. Scorpio unifies in a single weatherproof box all VSAT components, including BUC, Low Noise Block (downconverter) or LNB, OrthoMode Transducer, or OMT, feed assembly and a high speed modem/router. A single cable connects the outdoor Scorpio to the home network, thus providing a simple demarcation point for improved network diagnostics and increased customer satisfaction.
SkyEdge II-c Gemini
is a family of compact high-throughput routers, designed to enable high speed broadband services while meeting cost efficiencies required by residential customers and businesses. Gemini enables fast web browsing, video streaming, IPTV, VoIP, and other bandwidth intensive services. This solution comes in variations for enterprise applications such as retail, banking, automatic teller machines, or ATMs, lotteries and USO/USF government-funded programs aimed to expand broadband connectivity to underserved regions.
SkyEdge II-c Capricorn
, including our recently announced, SkyEdge II-c Capricorn PLUS, is a family of ultra-high-performance satellite routers that are used for corporate services, 3G/LTE cellular backhauling, IP trunks and mobility services. For IP trunks and mobility, Capricorn delivers acceleration and packet-per-second performance that support hundreds of users per VSAT. For LTE cellular backhauling, Capricorn includes our patented (granted in Japan and patent-pending in other countries) cellular data acceleration technology that enables full LTE speeds of up to 150Mbps for cellular handheld devices. To reach these high return speeds, Capricorn supports both Time Division Multiple Access, or TDMA, and Single Channel Per Carrier, or SCPC, transmission.
SkyEdge II-c VSATs
provide operational simplicity and reduced operational expenditures. They provide simple, Do-It-Yourself, VSAT installation that expedites deployment and reduces costs. The VSAT kit is designed with minimum assembly parts and an easy to point antenna. In addition, our Ka-band transceiver Scorpio terminals and Ka transceivers are equipped with audible indicators to assist in the fine pointing. The VSAT customer premises equipment, or CPE, includes an intuitive graphical user interface that guide the installer step by step through the installation and service activation process.
Our SkyEdge II product family is the legacy generation of our platform, based on a single hub with multiple VSATs to support a variety of services and applications, are capable of efficiently processing different types of data traffic and ensure that the transmissions via the satellite utilize the available satellite bandwidth efficiently and enhance the user experience.
Fixed Networks Solutions
Vertical Solutions
We target specific vertical markets where our products and solutions are most suitable and in which we have multiple references and credibility. These vertical markets include the consumer market, cellular backhaul, oil and gas, banking and finance and rural and e-government markets, among others.
System Integration and Turnkey Implementation
We have expanded our business beyond core VSAT networks to deliver complete and comprehensive solutions to meet our customers’ needs even where VSATs are not the main part of the solution. We see a growth in market demand for vendors capable of fully delivering integrated solutions for interdisciplinary, communication based projects.
In certain other situations, we are required to provide our VSAT solutions in a turnkey mode where we are responsible for the complete end-to-end solution. In the case of turnkey solutions, and occasionally in projects requiring system integrations, we provide our customers with a full and comprehensive solution including:
| · |
Project management – accompanying the customer through all stages of a project and ensuring that the project objectives are within the predefined scope, time and budget;
|
32
| · |
Satellite network design – translating the customer’s requirements into a system to be deployed, performing the sizing and dimensioning of the system and evaluating the available solutions;
|
| · |
Deployment logistics – transportation and rapid installation of equipment in all of the network sites;
|
| · |
Implementation and integration – combining our equipment with third party equipment such as solar panel systems and surveillance systems as well as developing tools to allow the customer to monitor and control the system;
|
| · |
Operational services – providing professional services, program management, network operations and field services; and
|
| · |
Maintenance and support – providing 24/7 helpdesk services, on-site technician support and equipment repairs and updates.
|
Manufacturing, Customer Support and Warranty
Our products are designed and tested at our facilities in Israel as well as our four other R&D facilities around the world. We outsource a significant portion of the VSAT manufacturing of our products to third parties. We also work with third‑party vendors for the development and manufacture of components integrated into our products, as well as for assembly of components for our products.
We offer a customer care program for our VSAT products, which we refer to as SatCare or SkyCare, and professional services programs that improve customer network availability through ongoing support and maintenance cycles.
As part of our professional services, we provide:
| · |
Outsourced operations such as VSAT installation, service commissioning and hub operations;
|
| · |
Proactive troubleshooting, such as periodic network analysis, to identify symptoms in advance; and
|
| · |
Training and certification to ensure customers and local installers are proficient in VSAT operation.
|
We typically provide a one-year warranty to our customers as part of our standard contract.
In addition, we provide back office support in Peru and Colombia for subsidized telephony and internet networks as well as for private internet, data and telephony clients including a call center, network operations center, field service maintenance and a pre-paid calling card platform and distribution channels.
Marketing and Sales
We use both direct and indirect sales channels to market our products, solutions and services. Our Fixed Networks segment has organized its marketing activities by geographic areas, with groups or subsidiaries covering most regions of the world. Our sales teams are comprised of account managers and sales engineers who establish account relationships and determine technical and business requirements for the customer’s network. These teams also support the other distribution channels with advanced technical capabilities and application experience. Sales cycles in the VSAT network market vary significantly, with some sales requiring 18 months and even more, from an initial lead through signing of the contract, while sales stemming from an immediate need for product delivery can be completed within two to three months. The sales process includes gaining an understanding of customer needs, several network design iterations and network demonstrations.
33
Customers and Markets
We provide our Satellite Communication solutions to satellite operators, governments, system integrators, telecommunication companies and MNOs, satellite communication providers, ISPs, and homeland security and defense agencies. Our customers benefit from:
| • |
a single accountable partner for all of their satellite communication network needs;
|
| • |
high credibility and experience;
|
| • |
local presence and partnerships;
|
| • |
industry-leading technology and system integration;
|
| • |
flexibility and customization; and
|
| • |
proven ability to deliver innovative end-to-end solutions.
|
We sell and distribute our products and provide services internationally, particularly in Latin America, Asia, Asia Pacific, the U.S., Africa, CIS (Russian Commonwealth) and Europe.
We sell VSAT communications networks and solutions primarily to service providers that mostly serve the enterprise consumer, cellular backhauling, and mobility market. We have more than 300 such customers worldwide.
Enterprise and service provider customers use our networks for internet access, broadband data, voice and video connectivity and for applications such as credit card authorizations, online banking, corporate intranet, interactive distance learning, lottery transactions, retail point‑of‑sale, inventory control and supervisory control and data acquisition, or SCADA, services.
Service providers serving the rural communications market are typically public telephony and internet operators providing telephony and internet services through public call offices, telecenters, internet cafes or pay phones. Some of the rural communication projects are for government customers. Examples of our rural telecom customers include Telefonica in Peru, Cable & Wireless in Panama and SCT in Mexico.
Service providers for the consumer market are typically Telcos planning to expand internet service to the consumer markets.
Our VSAT networks also provide underserved areas with a high-speed internet connection similar to DSL service provided to residential users. Among such customers are Optus in Australia, Hispasat in Latin America, Eutelsat in Russia and SBBS in several countries in Europe.
Public Rural Telecom Services
:
In a large number of remote and rural areas, primarily in developing countries, there is limited or no telephone or internet service, due to inadequate terrestrial telecommunications infrastructure. In these areas, VSAT networks utilize existing satellites to rapidly provide high-quality, cost-effective telecommunications solutions. In contrast to terrestrial networks, VSAT networks are simple to reconfigure or expand, relatively immune to difficulties of topography and can be situated almost anywhere. Additionally, VSATs can be installed and connected to a network quickly without the need to rely on local infrastructure. For example, some of our VSATs are powered by solar energy where there is no existing power infrastructure. Our VSATs provide reliable service, seldom require maintenance and, when necessary, repair is relatively simple.
As a result of the above advantages, there is a demand for government‑sponsored, VSAT-based bundled services of fixed telephony and internet access. Many of these government‑funded projects have been expanded to provide not only telephony services and internet access, but to also provide tele-centers that can serve the local population. These tele-centers include computers, printers, fax machines, photocopiers and TVs for educational programs. Additional revenue may be received, both in the form of subsidies and direct revenues from the users, when these additional services are provided.
We provide broadband services and public telephony in rural areas, incorporating our hubs, satellite network equipment and terrestrial technologies (typically, fiber-optic and wireless technologies) as described under this Item below. The operation of our terrestrial fixed networks is provided under our fixed networks segment.
34
Since our first rural telephony project for FITEL in Peru in 1998, we have been awarded several of the rural communications projects by the Peruvian government, with the most recent project scheduled to end at the end of 2019. Overall, we operate approximately 7,500 telephony sites in Peru, and approximately 850 internet services sites, and have been awarded large-scale government contracts to build and operate, or to build, operate and transfer, these networks, Additionally, we have developed services for financial sector companies, such as Banco de la Nacion, providing internet, data and telephony services. Our rural networks serve more than six million people.
In December 2013, we were awarded a contract by the Peruvian government (through FITEL)
for the deployment and operation of a wireless transport and distribution network in the northern Amazonas region of Peru. The contract, including extension worth $36 million, is for a period of over 12 years.
We
expect to generate additional revenues from the FITEL Regional Projects to be operated by us by enabling cellular carriers and other service providers to acquire capacity over these networks to address the growing need for voice, data, and internet in these regions, as well as the development of platforms for e-learning, e-health and similar applications. These additional revenues together with the revenue from the operation of the networks will be part of our Fixed Networks segment revenues, while the
construction of the FITEL Regional Projects is accounted under our Terrestrial Infrastructure Projects segment (see in this Item below).
Our first project in Colombia was awarded to us in 1999 by the government and was followed by several projects under which Gilat Colombia operated large networks encompassing thousands of rural sites and provided broadband internet connectivity, telephony, fax and other services. In
December 2013, we were awarded a project,
as part of the Kioscos Digitales project by the Ministry of ITC, for provision of
internet/telephony connectivity for assimilation of educational and small communities in 1903 Kioscos sites in rural areas. The contract term was extended several times with the last extension ending in the second quarter of 2019. This project, from its initiation and including all its extensions, is expected to generate aggregate revenues of approximately 312 billion Colombian Pesos (approximately $103 million).
During 2015, we recorded an impairment of long lived assets charge of $10.1 million related to the Kioscos Digitales project. For more information, see ITEM 5.A - “Operating and Financial Review and Prospects - Operating Results - Impairment of Intangible Assets and Long-Lived Assets”.
Enterprise and Government Agencies
We provide network equipment and related services to selected enterprises and government agencies. In some markets, existing telecom operators are mandated by the government to provide universal services. Providing these services in remote areas is a challenge to these operators, and they sometimes outsource these services to rural telecom service providers. These customers contract with Gilat Peru for VSAT equipment and associated network services to be deployed at customer locations, typically for a contract term of three to five years. We also resell managed terrestrial connectivity equipment and services from facilities‑based Local Exchange Carrier partners.
Mobility Segment Solutions
We provide satellite communication on the move systems with solutions for land, sea and air, while placing major focus on IFC. Our portfolio includes a cloud based VSAT network platform, high-speed modems, high performance on-the-move antennas and high efficiency, high power SSPAs and BUCs.
SkyEdge Satellite Network System
We utilize our SkyEdge II-c, to deliver efficient, reliable and affordable broadband connectivity such as internet, voice, data and video in travelling environments. The SkyEdge II-c system supports bandwidth-intensive services with a network management system that manages all hub elements at all gateways from a central NOC location.
35
SkyEdge II-c Taurus
SkyEdge II-c Taurus manages the entire in-flight satellite communication connectivity
with simultaneous support for broadband IFC and internet Protocol Television, or IPTV and will be a key component of our Ku/Ka aeronautical satellite communication solution, as our ultra-high-performance aero-modem manager (MODMAN) for in-flight connectivity. All SkyEdge II-c VSATs are full-featured IP routers, supporting enhanced IP routing features such as DHCP, NAT/PAT and IGMP. Advanced application-based QoS, guarantees the performance of real-time applications such as VoIP and video streaming, while also supporting other data applications. SkyEdge II-c VSATs also support next generation IPv6 networking.
Raysat Low-Profile Satellite Communication on the Move Antenna Systems
Our RaySat series consists of low-profile, in-motion, two-way antennas for satellite communication on the move. Compact, aerodynamic and vehicle-mounted, RaySat antennas deliver mission-critical data, voice and video for secure, real-time information flow. Our RaySat products operate in Ku, Ka and X bands and are ideal for both civilian and military satellite communication on the move applications such as:
| • |
Military - strategic military advantage by supporting the transfer of real-time intelligence while on-the-move with a small, low profile, hard to track antenna;
|
| • |
Digital satellite news gathering – always on, no set up time, real-time streaming video;
|
| • |
First responders - supports vehicles’ mobility, agility and stability required for teams to be the first to reach the scene; and
|
| • |
Search and exploration teams, close-to-shore vessels etc.
|
A full suite of two-way, low-profile antennas is available with multiple onboard tracking sensors, enabling accurate tracking, short initial acquisition and instantaneous reacquisition. RaySat antenna products are designed, manufactured and assembled at our facilities in Bulgaria.
RaySat Products
| · |
RaySat SR300
(X, Ka, Ku) antennas feature an advanced flat-panel array which covers both the Rx and Tx. Minimal size, weight and power (SWaP) permit installation on small vehicles or marine vessels. The antenna’s light weight ensures easy and safe mounting for quick and easy operation by non-technical personnel.
|
| · |
RaySat ER5000
(Ka, Ku) has a sturdy structure and compact size allowing for implementation on a wide range of vehicles. ER5000 antennas maximize throughput using high-efficiency waveguide panel technology. The low profile, ruggedized two-way antenna system enables real-time Ka- and Ku-band satellite communications for video, voice and data transfer.
|
| · |
RaySat ER7000
maximizes throughput using high-efficiency waveguide panel technology and the antenna’s light weight ensures easy and safe vehicle mounting. It has been widely deployed on trains and large vehicles worldwide.
|
| · |
RaySat ER6000
is a high capacity versatile dual-band airborne satellite two-way antenna for IFC that is capable of being switched between Ka and Ku bands during flight, and can operate in either band as required. This solution enables aeronautical real-time broadband satellite communications for video, voice and data. The antenna is designed to maximize throughput by using high-efficiency waveguide panel technology. Its low profile and light weight will permit easy and safe mounting on aircraft. The rugged antenna structure will be particularly suited for operation in challenging environments, providing reliable, continuous, in-flight broadband communications.
|
| · |
Electronically-Steered-Array, Phased-Array Antenna (ESA/PAA)
(Ka, Ku) is an ultra-slim (low-profile) antenna with no moving parts that electronically steers the transmission and reception beams towards the satellite, allowing operation even around the equator. The antenna design is highly scalable, with array dimensions that can be changed to optimally match specific gain requirements, making it suitable for a wide range of mobile platforms (aerial, land and maritime) and various throughput performance needs. Owing to its scalability and ultra-low profile, the antenna is particularly suited to supporting mobile connectivity for platforms that are constrained by size and weight.
|
36
Wavestream
Our Wavestream subsidiary designs and manufactures next generation solid-state power amplifiers for mission-critical defense and broadcast satellite communications systems. Wavestream’s innovative, patented Spatial AdvantEdge™ technology provides higher output power, greater reliability and lower energy usage in more compact packages than traditional amplifier solutions. Wavestream’s product line meets the growing demand for greater efficiency and significant lifecycle cost reductions for satellite communications systems worldwide.
Wavestream’s headquarters, research and development, engineering and manufacturing facilities are located in San Dimas, California, with an additional research and development center in Singapore. Our BUCs are manufactured in the San Dimas facility.
The Wavestream product line addresses the following applications and markets:
| · |
Defense Communications - satellite-based airborne and highly secured point-to-point. This market is typically categorized by customers requiring high quality products – at times for mission critical communications in extreme environmental conditions. The satellite terminals (
e.g
., VSAT, Single Channel Per Carrier, or SCPC) are usually provided to the defense agencies via system integrators and not directly from the power amplifier suppliers;
|
| · |
Government - public safety, emergency response and disaster recovery. Similar to the market for defense agencies, though usually less demanding in terms of environmental conditions, these terminals are provided to various local, state and federal agencies that need to manage emergency communications. The satellite terminals (e.g., VSAT, SCPC) are usually provided via system integrators or service providers and not directly from the power amplifier suppliers;
|
| · |
Commercial terminals - A high power amplifier is used with high-end VSAT terminals for various applications where there is the requirement to transmit large amounts of data. Examples include airborne IFC terminals/antennas in commercial and business airplanes high speed for internet access. The satellite terminals/antennas are usually provided via system integrators, service providers or airframe manufacturers and not directly from the power amplifier suppliers;
|
| · |
Commercial broadcast - Broadcast providers and teleport operators require high power amplifiers in order to transmit large carriers, such as for TV broadcast, multicast of video and high-speed IP connectivity.
|
Wavestream’s customers include AeroSat, GATR Technologies (a subsidiary of Cubic Corporation), General Dynamics Satcom Technologies, Honeywell International Inc.,
L-3 and Tecom.
RF amplifiers, BUCs and transceivers
The Wavestream product line consists of
RF amplifiers, BUCs and transceivers that use solid-state sources to produce high power at microwave and millimeter-wave frequencies. Our
Wavestream patented Spatial A
dvantEdge™
technology allows us to create more compact product packages that provide higher power, greater reliability and improved efficiency for any mission-critical applications.
The spatially power combined amplifier employs a different technique for combining the transistor outputs than traditional Monolithic Microwave Integrated Circuit, or MMIC, based amplifiers. Rather than combining in multiple steps, increasing loss and size with each combining stage, all transistor outputs are combined in a single step. Many amplifying elements synchronously amplify the input signal, and their outputs are combined in free space for very high combining efficiency.
37
Our Wavestream patented technology allows us to create amplifiers and BUCs with high output power in more compact product packages that generate less heat, use less energy, and reduce lifecycle costs. Our Wavestream products help customers meet the stringent power requirements for mission-critical communications system. We perform full factory acceptance testing on every unit we manufacture and deliver, ensuring each product has guaranteed performance over the full temperature range and over extended frequency bands.
We believe that we have established a leadership position with our compact, highly efficient SSPAs with a field-proven family of Ka, Ku, X and C-band products. Our Wavestream line of products are designed and tested to meet strenuous requirements for temperature, shock and vibration, over the full range of frequency and at the extremes of environmental performance specifications. Our Wavestream field-proven technology and reputation for innovation and quality drive solutions for multiple applications targeting military, aerospace, commercial and broadcast satellite systems.
Wavestream AeroStream™
The Wavestream AeroStream™ is a state-of-the-art transceiver for challenging inflight satellite communications environments. AeroStream products meet RTCA/DO-160G, Boeing, Airbus and ARINC specifications for commercial aircraft as well as MIL-STD requirements for military aircraft. The AeroStream™ transceiver is in certification process with the FAA. AeroStream incorporates Wavestream’s next generation Spatial AdvantEdge™ technology to provide high power output with greater efficiency and reliability for airborne satellite communications applications. The AeroStream transceiver offers all necessary interfaces to work seamlessly with leading modems and Antenna Control Units, or ACUs, to provide a convenient turnkey solution.
Integrated Solutions
We offer fully integrated solutions based on our own technology and components. Our integrated solutions feature the highest standards of reliability and efficiency combining our own VSAT/modems, antennas and BUCs. We leverage our innovative and industry-leading technological capabilities from R&D centers around the world.
We provide an integrated quick-deploy mobile Satellite Communication solution for net-centric emergency and battle situations. We offer both commercial and military manpack terminals, named SatRanger and SatTrooper, respectively. These lightweight, portable solutions provide data, video and telephony under the toughest environmental and battle conditions. The small-size antenna can be set up in just a few minutes with automatic pointing and does not require any tools for assembly. The manpacks are highly integrated with our operationally proven components: antennas, built-in modems, BUCs and LNBs, all incorporated into one ruggedized enclosure. Low power consumption enables long hours of battery operation. The manpacks provide high availability, secure communications and excellent performance in extremely low signal to noise ratio conditions.
Our BlackRay Satellite Communication terminals are specially designed for UAV and USV applications. These terminals have been used worldwide in commercial and military applications which require high-throughput communications and minimal size, weight, and power. The system’s miniscule dimensions allow Beyond-Line-of-Sight (BLoS) operations for even the smallest platforms, in harsh weather conditions, while supporting video and data downlink and uplink applications. These highly integrated terminals feature best-of-breed antenna, modem and BUC technologies developed and manufactured by us. Customized solutions of the BlackRay platform are also available for specific customer platforms and needs.
| · |
Unmanned Aerial Vehicles -
Our BlackRay 71 and parabolic systems serve the critical need to exploit the full capabilities of an aircraft’s operational range. As one of the industry’s smallest and most compact aerial solutions in its category, our integrated approach can dramatically increase mission effectiveness. We offer a full range of Satellite Communication systems for Group 3, 4 and 5 UAVs, operating in Ku-, Ka- and X- band, and available in different sizes and bit rates.
|
| · |
Unmanned Surface Vehicles -
Our BlackRay Maritime 300 is a compact system that can be quickly implemented to deliver high-throughput communication, even for small USVs. The BlackRay Maritime 300 has been designed to meet minimal size, weight and power requirements and can transmit more than 2Mbps for IP-based video or data BLoS applications. This maritime terminal delivers spectrum-efficient IP connectivity, adaptive in real time to varying link conditions.
|
38
Terrestrial Infrastructure Projects Segment
Overview
We provide network infrastructure construction of the fiber and microwave network of FITEL in Peru mainly through BOT contracts subsidized by the government. Accordingly, we build the infrastructure, act as a licensed telecommunications operator for a defined period and almost in all cases, then transfer the network to the customer.
In March and December 2015, we were awarded four FITEL Regional Projects by
the Peruvian government
with expected revenues of $393 million, for the construction of networks, operation of the networks for a defined period and their transfer to the government. Pursuant to the FITEL Regional Projects awarded in March 2015, we are building fiber-optic transport networks and will operate them for up to one year before transferring them to the Peruvian government. Under the projects awarded in December 2015, we will transfer the transport networks that we build to the Peruvian government immediately upon completion. Additionally, we are constructing access networks, based on wireless technologies that we will operate for 10 years, prior to transferring them to the Peruvian government. The construction phase was extended several times due to continued delays. As a result, the expected duration of these 2015 FITEL Regional Projects was significantly prolonged from their scheduled delivery dates and is expected to continue for 14-15 years from their commencement. Our revenues and collections from these projects in 2018 were delayed and therefore were less than initially expected. Such delays also increased our expenses which adversely impacted our operating results in 2018. Failure to complete the 2015 FITEL Regional Projects in a timely manner and pursuant to the updated schedule will have a significant adverse effect on our business and financial results.
In 2018, we were awarded two additional FITEL Regional Projects
for the construction and operation of networks over approximately 13-15 years with expected revenues of approximately $154 million. Under these FITEL Regional Projects we will deliver transport networks and operate them for up to eighteen months before transferring them to the Peruvian government. The access networks, which we will operate for 10 years, will be owned by us.
The construction of the FITEL Regional Projects is part of our Terrestrial Infrastructure Projects segment, while the services provided over these networks are part of our Fixed Networks segment (See this Item above).
Our Peruvian subsidiary has local offices in Lima, Peru as well as in the main cities of the regions awarded.
Sales and Marketing
We use direct and indirect sales channels to market our equipment and related services. Our sales team of account managers and sales engineers are the primary account interfaces and work to establish account relationships and determine technical and business demands.
Competition
The telecommunications industry operates in a competitive, rapidly changing market. In some cases, our competitors can also be our customers or partners. Accordingly, maintaining an open and cooperative relationship is important.
39
In the equipment market, we face competition from providers of satellite communications systems, products and services, such as HNS, ViaSat, iDirect, Newtec, Comtech and a few other smaller providers.
In managed satellite network services solutions our main competitors are Speedcast, SES and Intelsat.
We compete in some HTS markets with competitors such as ViaSat and HNS that have launched high throughput satellites. Although we have entered the HTS market with competitive technology, we continue to expect competition in this market to increase.
Due to the nature of the satellite solution, the VSAT technology is, at times, commercially tied to the satellite technology itself, and, consequently, there may be circumstances where it is difficult for competitors to compete with an incumbent VSAT vendor using the particular satellite.
Our low-profile in-motion antennas compete with products from competitors such as Cobham, ERA, Panasonic, Orbit, Thinkom, C-Com Satellite Systems Inc., Wiworld, Tracstar, L-3, SATPRO M&C Tech Co., Ltd and
Tecom. This market is nascent, and not as mature as the satellite communications or satellite services markets.
Our primary competitors with respect to our BUCs and other Wavestream products are Comtech Xicom Technology, Inc., CPI Satcom, General Dynamics Satcom Technologies, Paradise Datacom and Mission Microwave Technologies.
Where we primarily operate public rural telecom services (voice, data and internet) and are engaged in construction of fiber-optic transport and access networks based on wireless systems, we typically encounter competition on government subsidized bids from various service providers, system integrators and consortiums. Some of these competitors offer solutions based on VSAT technology and some on terrestrial technologies (typically, fiber-optic and wireless technologies). In addition, as competing technologies such as cellular network and fiber-optic become available in rural areas where not previously available, our business could be adversely affected.
We may not be able to compete successfully against current or future competitors. Such competition may adversely affect our future revenues and, consequently, our business, operating results and financial condition.
Geographic Distribution of Our Business
The following table sets forth our revenues from continued operations by geographic area for the periods indicated below as a percent of our total sales:
|
Years Ended December 31,
|
||||||||||||
|
2018
|
2017
|
2016
|
||||||||||
|
Latin America
|
36
|
%
|
47
|
%
|
51
|
%
|
||||||
|
North America
|
36
|
%
|
26
|
%
|
20
|
%
|
||||||
|
APAC
|
15
|
%
|
12
|
%
|
17
|
%
|
||||||
|
EMEA
|
13
|
%
|
15
|
%
|
12
|
%
|
||||||
|
Total
|
100
|
%
|
100
|
%
|
100
|
%
|
||||||
40
| C. |
Organizational Structure
|
| Significant Subsidiaries |
Country/State
of Incorporation
|
% ownership |
| 1. Gilat Satellite Networks (Holland) B.V. |
Netherlands
|
100%
|
| 2. Gilat Colombia S.A. E.S.P |
Colombia
|
100%
|
| 3. Gilat to Home Peru S.A |
Peru
|
100%
|
| 4. Gilat do Brazil Ltda. |
Brazil
|
100%
|
| 5. Gilat Satellite Networks (Mexico) S.A. de C.V. |
Mexico
|
100%
|
| 6. Wavestream Corporation |
Delaware (U.S)
|
100%
|
| 7. Gilat Networks Peru S.A |
Peru
|
100%
|
| 8. Gilat Satellite Networks Australia Pty Ltd. |
Australia
|
100%
|
| 9. Gilat Satellite Networks (Eurasia) Limited |
Russia
|
100%
|
| 10. Gilat Satellite Networks MDC (Moldova) |
Moldova
|
100%
|
| 11. Raysat Bulgaria EOOD |
Bulgaria
|
100%
|
| 12. Gilat Satellite Communication Technology (Beijing) Ltd. |
China
|
100%
|
|
13. Gilat Satellite Networks (Philippines) Inc.
|
Philippines
|
100%
|
| D . |
Property, Plants and Equipment
|
Our headquarters are located in a modern office park which we own in Petah Tikva, Israel. This facility consists of approximately 380,000 square feet, a substantial part of which are currently used by us and the remainder is subleased or offered for sublease to third parties.
We have local Global NOCs coverage in Australia, Moldova, Peru and Colombia from which we perform network services and customer support functions
We own facilities located on approximately 137,150 square feet of land in Backnang, Germany. Since May 2002, these facilities are leased to a third party, which lease expires on December 31, 2025. We own approximately 13,800 square feet of research and development facilities and rent approximately 12,600 square feet of manufacturing facilities in Sofia, Bulgaria, which lease will expire on May 31, 2020, and rent approximately 7,750 square feet in Moldova for research and development and Global NOC activities. Our Wavestream subsidiary currently occupies approximately 32,500
square feet of facilities for office space, research and development and manufacturing in San Dimas, California under a lease which will expire on March 31, 2020.
We also maintain facilities in Brazil, Colombia, Mexico, China, Peru and Australia, along with representative offices in Bangkok (Thailand), New Delhi (India), Almaty (Kazakhstan), Jakarta (Indonesia), Moscow (Russia), Singapore and small facilities in other locations throughout the world.
We consider our current office space, research and development and manufacturing facilities sufficient to meet our anticipated needs for the foreseeable future and suitable for the conduct of our business.
There are no unresolved staff comments.
| A. |
Operating Results
|
The following discussion of our results of operations should be read together with our audited consolidated financial statements and the related notes, which appear elsewhere in this annual report. The following discussion contains forward-looking statements that reflect our current plans, estimates and beliefs and involve risks and uncertainties. Our actual results may differ materially from those discussed in the forward-looking statements. Factors that could cause or contribute to such differences include those discussed below and elsewhere in this annual report.
41
Introduction
We are a global provider of satellite-based broadband communications. We design and manufacture ground-based satellite communications equipment, and provide comprehensive solutions and end-to-end services, powered by our e technology. Our portfolio comprises a cloud based satellite network platform, VSATs, amplifiers, high-speed modems, on-the-move antennas and high power SSPAs and BUCs. Our solutions support multiple applications with a full portfolio of products to address key applications including broadband access, cellular backhaul, enterprise, in-flight connectivity, maritime, trains, defense and public safety, all while meeting stringent service level requirements. We also provide connectivity services, internet access and telephony, to enterprise, government and residential customers utilizing both our own networks, and also other networks that we install, mainly based on BOT contracts. We also provide managed network services over VSAT networks owned by others.
We have a large installed base and have shipped more than 1.5 million satellite terminals to customers in approximately 90 countries on six continents since 1989. We have twenty sales and support offices worldwide, four NOCs (which include Global NOC) and five R&D centers. Our products are primarily sold to communication service providers and operators that use satellite communications to serve enterprise, government and residential users. We also provide services directly to end‑users in certain countries.
Through 2017, we operated in three business segments, comprised of our Commercial, Mobility and Services divisions. Commencing in 2018, in order to more accurately reflect management’s focus, organizational alignment, our customer base and end markets, we
operate in three new business segments, as follows:
| · |
Fixed Networks provides advanced fixed broadband satellite communication networks, satellite communication systems, and associated professional services and comprehensive turnkey solutions and fully managed satellite network services solutions. Our customers are service providers, satellite operators, MNOs, Telcos, and large enterprises, consumers and governments worldwide. In addition, it includes our network operation and managed satellite network services activity in Peru and Colombia. We focus on HTS, opportunities worldwide, with focus on cellular backhaul, and are driving meaningful partnerships with satellite operators to leverage our technology and breadth of services to deploy and operate the ground-based satellite communication networks
|
| · |
Mobility Solutions provides advanced on-the-move satellite communications equipment, systems and solutions, including airborne, maritime and ground-mobile satellite systems and solutions. This segment provides solutions for land, sea and air connectivity, while placing major focus on IFC, with our unique leading technology as well as defense and homeland security activities. Our product portfolio comprises of high-speed modems, high performance on-the-move antennas and high efficiency, high power SSPAs and BUC. Our customers are service providers, system integrators, defense and homeland security organizations, as well as other commercial entities worldwide.
|
| · |
Terrestrial Infrastructure Projects provides network infrastructure construction of the fiber and microwave network of FITEL in Peru.
|
We have retrospectively revised our segment information for the years ended December 31, 2017 and 2016 to conform to the new business segments presentation.
The above changes in our reportable segments will have no effect on the goodwill assignment among the divisions.
42
Financial Statements in U.S. Dollars
The currency of the primary economic environment in which most of our operations are conducted is the U.S. dollar and, therefore, we use the U.S. dollar as our functional and reporting currency. Transactions and balances originally denominated in U.S. dollars are presented at their original amounts. Gains and losses arising from non-U.S. dollar transactions and balances are included in the consolidated statements of operations. The financial statements of certain foreign subsidiaries, whose functional currency has been determined to be their local currency, have been translated into U.S. dollars. The assets and liabilities of these subsidiaries have been translated using the exchange rates in effect at the balance sheet date. Statements of operations amounts have been translated using specific rates. The resulting translation adjustments are reported as a component of shareholders’ equity in accumulated other comprehensive income (loss).
Explanation of Key Income Statement Items
Revenues
We generate revenues mainly from the sale of products, including construction of networks, from services for satellite-based communications networks and from providing connectivity, internet access and telephony services to enterprise, government and residential customers under large-scale contracts that utilize both our own networks and also other networks that we install, mainly based on BOT contracts.
These large‑scale contracts sometimes involve the installation of thousands of VSATs
or massive fiber-optic transport and access networks
.
Sales of products includes principally the sale of VSATs, hubs, SSPAs, low-profile antennas and on-the-Move / on-the-Pause terminals and the construction phase of large-scale projects. Service revenues include access to and communication via satellites, or space segment, installation of network equipment, telephone services, internet services, consulting, on-line network monitoring, network maintenance and repair services. We sell our products primarily through our direct sales force and indirectly through resellers or system integrators. Sales consummated by our sales force and sales to resellers or system integrators are considered sales to end-users.
In 2018, the Ministry of ITC and
our large U.S. system integrator customer
, which are customers of the
Fixed Networks
segment, accounted for 13% and 15% of our revenues, respectively. In 2018, 2017 and 2016, FITEL, a customer under
Terrestrial Infrastructure Projects and the Fixed Networks segment
, accounted for 10%, 28% and 34% of our revenues, respectively
.
Costs and Operating Expenses
Cost of revenues, for both products and services, includes the cost of system design, equipment,
including inventory write-off costs, satellite capacity, salaries and related costs, allocated overhead costs, depreciation and amortization, customer service, interconnection charges and third party maintenance and installation.
Our research and development expenses, net of grants received, consist of salaries and related costs, raw materials, subcontractor expenses, related depreciation costs and overhead allocated to research and development activities.
Our selling and marketing expenses consist primarily of salaries and related costs, commissions earned by sales and marketing personnel, commissions to agents, trade show expenses, promotional expenses and overhead costs allocated to selling and marketing activities, as well as depreciation expenses and travel costs.
Our general and administrative expenses consist primarily of salaries and related costs, allocated overhead costs, office supplies and administrative costs, bad debts, fees and expenses of our directors, depreciation, and professional service fees, including legal, insurance and audit fees, net of rental income.
Our operating results are significantly affected by, among other things, the timing of contract awards and the performance of agreements. As a result, our revenues and income (loss) may fluctuate substantially from quarter to quarter, and we believe that comparisons over longer periods of time may be more meaningful. The nature of certain of our expenses is mainly fixed or partially fixed and any fluctuation in revenues will generate a significant variation in gross profit and net income (loss).
43
Critical Accounting Policies and Estimates
The preparation of the financial information in conformity with generally accepted accounting principles requires us to make estimates and judgments that affect the reported amounts of assets, liabilities, revenues and expenses, and related disclosure of contingent assets and liabilities. On an ongoing basis, we evaluate our estimates, mainly related to trade receivables, inventories, deferred charges, long-lived assets, intangibles and goodwill, revenues, stock based compensation relating to options and contingencies. We base our estimates on historical experience and on various assumptions that are believed to be reasonable under the circumstances, the results of which form the basis for making judgments about the carrying values of assets and liabilities that are not readily apparent from other sources. Actual results may differ from these estimates.
We believe the following critical accounting policies affect our more significant judgments and estimates used in the preparation of the financial information included in this annual report.
Consolidation.
Our consolidated financial statements include the accounts of our company and those of our subsidiaries, in which we have a controlling voting interest, as well as entities consolidated under the Variable Interest Entities, or VIEs, provisions of ASC 810, “Consolidation”
, or
ASC 810. Inter-company balances and transactions have been eliminated upon consolidation.
Most of the activity of Gilat Colombia consists of operating subsidized projects for the Ministry of ITC. The first projects were awarded to our Colombian subsidiaries in 1999 and 2002 and were extended several times. An additional project was awarded to us in 2011 and was completed in December 2013. Another project was awarded to us in 2013 and was extended several times. The project is ongoing and the current extension is until the second quarter of 2019.
As required in the bid documents for the Ministry of ITC projects, we established trusts, or the Trusts, and entered into a governing trust agreement for each project, or collectively the Trust Agreements. The Trusts were established for the purpose of holding the network equipment, processing payments to subcontractors, and holding the funds received through the subsidy from the government until they are released in accordance with the terms of the subsidy and paid to us. The Trusts are a mechanism to allow the government to review amounts to be paid with the subsidy and to verify that such funds are used in accordance with the transaction documents and the terms of the subsidy. We generate revenues both from the subsidy, as well as from the use of the network that we operate.
The Trusts are considered VIEs and we are identified as the primary beneficiary of the Trusts. Under ASC 810, we perform ongoing assessments of whether we are the primary beneficiary of a VIE. As our assessment provides that we have the power to direct the activities of a VIE that most significantly impacts the VIE’s activities (we are responsible for establishing and operating the networks), the obligation to absorb losses of the VIE that could potentially be significant to the VIE and the right to receive benefits from the VIE that could potentially be significant to the VIE economic performance, we therefore concluded that we are the primary beneficiary of the Trusts. As such, the Trusts were consolidated in our financial statements since their inception.
The cash held by the Trusts is consolidated within our financial statements and classified as “Restricted cash held by trustees”. The advances from customers received by the Trusts are consolidated within our financial statements and classified as “Advances from customers held by trustees”.
Revenues.
We generate revenue mainly from the sale of products (including construction of networks), satellite-based communications networks services and from providing connectivity, internet access and telephony services. We sell our products and services to enterprises, government and residential customers under large-scale contracts that utilize both our networks and other networks that we install, mainly based on BOT contracts. These large scale contracts sometimes involve the installation of thousands of VSATs or construction of massive fiber-optic and microwave networks. Sale of products includes mainly the sale of hubs, VSATs, SSPAs, low-profile antennas, on-the-move/on-the-pause terminals, and construction and installation of large-scale networks based on BOT contracts. Sale of services includes access to and communication via satellites, or space segment, installation of equipment, telephone services, internet services, consulting, on-line network monitoring, network maintenance and repair services. We sell our products primarily through our direct sales force and indirectly through resellers or system integrators. Sales consummated by our sales force and sales to resellers or system integrators are considered sales to end-users.
44
We recognize revenue in accordance with ASC No. 606, “Revenue from Contracts with Customers”. As such, we apply the following five steps: (1) identify the contract with a customer, (2) identify the performance obligations in the contract, (3) determine the transaction price, (4) allocate the transaction price to the performance obligations in the contract, and (5) recognize revenue when a performance obligation is satisfied.
If the contract contains a single performance obligation, the entire transaction price is allocated to the single performance obligation. Contracts that contain multiple performance obligations require an allocation of the transaction price to each performance obligation based on a relative standalone selling price (“SSP”) basis. We establish SSP based on management judgment, considering internal factors such as margin objectives, pricing practices and historical sales.
Consideration from contracts that is assessed as not being probable of collection is not recognized as revenue until the contract is completed and cash is received. Collectability is re-assessed when there is a significant change in facts or circumstances. Our assessment of collectability considers whether it may limit our exposure to credit risk through its right to stop transferring additional service in the event the customer is delinquent as well as certain contract terms such as down payments that reduce its exposure to credit risk.
Revenue from the sale of equipment is recognized once the customer has obtained control over the items purchased. When significant acceptance provisions are included in the arrangement, we defer recognizing the revenue until the acceptance occurs. We generally do not grant a right of return to our customers. Revenue from periodic services is recognized ratably over the term the services are rendered. Revenue from other services is recognized upon their completion.
Revenues from contracts under which we provide significant construction to the customer's specifications (mostly governmental projects) are generally recognized over time because of continuous transfer of control to the customer. This continuous transfer of control to the customer is supported by clauses in the contract that allow the customer to unilaterally terminate the contract for convenience, pay us for costs incurred plus a reasonable profit and take control of any work in process. We generally use the cost-to-cost measure of progress for these contracts because it best depicts the transfer of control to the customer, which occurs as costs are incurred on the contracts. Under the cost-to-cost measure of progress, the extent of progress towards completion is measured based on the ratio of costs incurred to date to the total estimated costs at completion of the performance obligation. Revenues, are recorded proportionally as costs are incurred. Costs to fulfill include labor, materials and subcontractors’ costs and other direct and allocated indirect costs. When estimates of total costs to be incurred exceed total estimates of revenue to be earned on the uncompleted contracts, a provision for the entire loss on the contract is recognized in the period the loss is identified.
Under the typical payment terms of government fixed-price contracts, the customer pays us milestones-based payments. Those payments are based on quantifiable measures of performance or on the achievement of specified events or milestones. Because those payments are due upon completion of those milestones, they may result in revenue recognized in excess of billings and are presented as part of contract assets on the balance sheet.
Amounts recognized as revenue and which we have unconditional right to receive are classified as receivables on the balance sheet.
Revenue from products under lease contracts is recognized in accordance with ASC 840 upon installation or upon delivery, in cases where the customer obtains its own or other's installation services. The net investments in sales-type leases are discounted at the interest rates implicit in the leases. The present values of payments due under sales-type lease contracts are recorded as revenue at the time of shipment or installation, as appropriate.
Future interest income is deferred and recognized over the related lease term as financial income.
45
Deferred revenue and advances from customers are recorded when we receive payments from customers before performance obligations have been performed. Deferred revenue is recognized as revenue as (or when) we perform the performance obligation under the contract.
We pay sales commissions to sales and marketing and certain management personnel based on their attainment of certain predetermined sales goals. Sales commissions earned by our employees are considered incremental and recoverable costs of obtaining a contract with a customer. Sales commissions are capitalized and amortized upon recognition of the related revenue, consistently with the transfer to the customer of the goods or services to which they relate. Amortization expenses related to these costs are mostly included in sales and marketing expenses in our consolidated statements of operations.
Income Taxes.
We are subject to income taxation in Israel, the United States and numerous other jurisdictions. Determining our provision for income taxes requires significant management judgment. In addition, our provision for income taxes could be adversely affected by many factors, including, among other things, changes to our operating structure, changes in the amounts of earnings in jurisdictions with different statutory tax rates, changes in the valuation of deferred tax assets and liabilities and changes in tax laws. We are subject to ongoing tax examinations in various jurisdictions. Tax authorities may disagree with our intercompany charges, cross-jurisdictional transfer pricing or other matters and assess additional taxes. While we regularly evaluate the likely outcomes of these examinations to determine the adequacy of our provision for income taxes, there can be no assurance that the outcomes of such examinations will not have a material impact on our results of operations and cash flows. In addition, we may be audited in various jurisdictions, and such jurisdictions may assess additional taxes against us. Although we believe our tax estimates are reasonable, the final determination of any tax audits or litigation could be materially different from our historical tax provisions and accruals, which could have a material adverse effect on our results of operations or cash flows in the period or periods for which a determination is made.
Significant judgment is required to determine the recognition and measurement attributes prescribed in Accounting Standards Codification, (“ASC 740-10-25”). In addition, ASC 740-10-25 applies to all income tax positions, including the potential recovery of previously paid taxes, which if settled unfavorably could adversely impact our provision for income taxes. Further, as a result of certain of our ongoing employment and capital investment actions and commitments, our income in certain countries is subject to reduced tax rates. Our failure to meet these commitments could adversely impact our provision for income taxes. In addition, we are subject to the continuous examination of our income tax returns by Israeli, U.S. and other tax authorities. We regularly assess the likelihood of adverse outcomes resulting from these examinations to determine the adequacy of our provision for income taxes. There can be no assurance that the outcomes from these continuous examinations will not have an adverse effect on our results of operations.
Accounts Receivable and Allowance for Doubtful Accounts.
We are required to estimate our ability to collect our trade receivables. A considerable amount of judgment is required in assessing their ultimate realization. We provided
allowances
for receivables relating to customers that were specifically identified by our management as having difficulties paying their respective receivables. If the financial condition of our customers deteriorates, resulting in their inability to make payments, additional allowances may be required. These estimates are based on historical bad debt experience and other known factors
pertaining to these customers
. If the historical data we used to determine these estimates does not properly reflect future realization, additional allowances may be required.
Inventory Valuation.
We are required to state our inventories at the lower of cost or net realizable value. Net realizable value is the estimated selling prices in the ordinary course of business, less reasonably predictable costs of completion, disposal, and transportation. At each balance sheet date, we evaluate our inventory balance for excess quantities and obsolescence. This evaluation includes an analysis of sales levels by product and projections of future demand. We write-off inventories that are considered obsolete. Remaining inventory balances are adjusted to the lower of cost or net realizable value. If future demand for our old or new products or market conditions is less favorable than our projections, inventory write-offs may be required and would be reflected in cost of revenues for such period.
46
Impairment of Intangible Assets and Long-Lived Assets.
We periodically evaluate our intangible assets and long-lived assets
(mainly property and equipment) in all of our reporting units
for potential impairment indicators in accordance with ASC 360, “Property, Plant and Equipment”, or “ASC 360”. Our judgments regarding the existence of impairment indicators are based on legal factors, market conditions, operational performance
and prospects
of our acquired businesses and investments. Our long-lived assets are reviewed for impairment whenever events or changes in circumstances indicate that the carrying amount of an asset may not be recoverable. Recoverability of assets to be held and used is measured by a comparison of the carrying amount of the assets to the future undiscounted cash flows expected to be generated by the assets. If such assets are considered to be impaired, the impairment to be recognized is measured by the amount by which the carrying amount of the assets exceeds the fair value of the assets. In measuring the recoverability of assets, we are required to make estimates and judgments in assessing our future cash flows which derive from the estimated useful life of our current primary assets, and compare that with the carrying amount of the assets. Additional significant estimates used by management in the methodologies employed to assess the recoverability of our long-lived assets include estimates of future short-term and long-term growth rates, useful lives of assets, market acceptance of products and services, our success in winning bids and other judgmental assumptions, which are also affected by factors detailed in our risk factors section in this annual report.
During 2018 and 2017, we did not identify any impairment losses of long-lived assets. Future events could cause us to conclude that impairment indicators exist, and that additional long-lived assets and intangible assets associated with our acquired businesses are impaired. Any resulting impairment loss could have a material adverse impact on our financial condition and results of operations.
Goodwill
. Goodwill represents the excess of the purchase price in a business combination over the fair value of the net tangible and intangible assets acquired. Under ASC 350 “Intangibles - Goodwill and Others”
, or ASC 350
, goodwill is not amortized, but rather is subject to an annual impairment test. ASC 350 requires goodwill to be tested for impairment at least annually or between annual tests in certain circumstances, and written off if and to the extent it is impaired. We conduct our impairment testing in the fourth quarter of each year,
or more often if there are indicators of impairment present. We first assess qualitative factors, for all of our reporting units, to determine whether it is necessary to perform the quantitative goodwill impairment test. If the qualitative assessment does not result in a more likely than not indication of impairment, no further impairment testing is required, otherwise the goodwill is tested for impairment by comparing the fair value of the reporting unit with its carrying value. Fair value is determined using discounted cash flows. Significant estimates used in the fair value methodologies include estimates of future cash flows, future growth rates and the weighted average cost of capital of the reporting units.
In 2018 and 2017, following an improvement in the Mobility Solutions segment results, we performed a qualitative assessment and concluded that it is not more likely than not that the fair value of the reporting units is less than their carrying amounts and accordingly it is unnecessary to perform the two-step quantitative goodwill impairment test. In 2016, we performed both qualitative and quantitative assessment and concluded that no impairment of goodwill needs to be recorded.
Legal and Other Contingencies.
We are currently involved in certain legal and other proceedings and are also aware of certain tax and other legal exposures relating to our business. We are required to assess the likelihood of any adverse judgments or outcomes of these proceedings or contingencies as well as potential ranges of probable losses. A determination of the amount of accruals required, if any, for these contingencies is made after careful analysis.
Liabilities related to legal proceedings, demands and claims are recorded in accordance with ASC 450, “Contingencies”
, or ASC 450
, which defines a contingency as “an existing condition, situation, or set of circumstances involving uncertainty as to possible gain or loss to an enterprise that will ultimately be resolved when one or more future events occur or fail to occur.” In accordance with ASC 450, accruals for exposures or contingencies are being provided when the expected outcome is probable and when the amount of loss can be reasonably estimated. It is possible, however, that future results of operations for any particular quarter or annual period could be materially affected by changes in our assumptions, the actual outcome of such proceedings or as a result of the effectiveness of our strategies related to these proceedings.
47
Year Ended December 31, 2018 Compared to Year Ended December 31, 2017
Revenues.
Revenues for the years ended December 31, 2018 and 2017 for our three segments were as follows:
|
Year Ended
|
Year Ended
|
|||||||||||||||||||
|
December 31,
|
December 31,
|
|||||||||||||||||||
|
|
2018
|
2017
|
2018
|
2017
|
||||||||||||||||
|
|
U.S. dollars in thousands
|
Percentage change
|
Percentage of revenues
|
|||||||||||||||||
|
|
||||||||||||||||||||
|
Fixed Networks
|
144,208
|
116,105
|
24.2
|
%
|
54.1
|
%
|
41.1
|
%
|
||||||||||||
|
Mobility Solutions
|
97,180
|
88,397
|
9.9
|
%
|
36.5
|
%
|
31.2
|
%
|
||||||||||||
|
Terrestrial Infrastructure Projects
|
25,003
|
78,254
|
(68.0
|
)%
|
9.4
|
%
|
27.7
|
%
|
||||||||||||
|
Total
|
266,391
|
282,756
|
(5.8
|
)%
|
100.0
|
%
|
100.0
|
%
|
||||||||||||
Our total revenues for the years ended December 31, 2018 and 2017 were $266.4 million and $282.8 million, respectively. The decrease in 2018 is mainly attributable to a decrease of approximately $53.3 million in Terrestrial Infrastructure Projects revenues, largely offset by an increase of $28.1 million in Fixed Networks revenues and an increase of $8.8 million in
Mobility Solutions
revenues.
The decrease in Terrestrial Infrastructure Projects revenues is attributable to the expected decline in revenues as the first three awarded FITEL Regional Projects (Huancavelica, Ayacucho, Apurimac) are nearing the end of their construction phase, coupled with slower than expected progress and slower final acceptance of these projects by FITEL than we anticipated.
The increase in our Fixed Networks revenues is primarily attributable to higher sales in Latin America, especially in Colombia, North America and Asia regions mainly as a result of increased revenue from our managed satellite network services and cellular backhaul solutions deals.
The increase in
Mobility Solutions
revenues is primarily attributable to an increase in sales related to airborne mobility products, principally IFC products and our Wavestream products.
Gross profit.
The gross profit and the gross margin of our three segments for the years ended December 31, 2018 and 2017 was as follows:
|
|
Year Ended
|
Year Ended
|
||||||||||||||
|
|
December 31,
|
December 31,
|
||||||||||||||
|
|
2018
|
2017
|
2018
|
2017
|
||||||||||||
|
U.S. dollars in thousands
|
Percentage of revenues
|
|||||||||||||||
|
Fixed Networks
|
50,463
|
34,185
|
35.0
|
%
|
29.4
|
%
|
||||||||||
|
Mobility Solutions
|
49,185
|
41,904
|
50.6
|
%
|
47.4
|
%
|
||||||||||
|
Terrestrial Infrastructure Projects
|
(5,611
|
)
|
6,406
|
(22.4
|
)%
|
8.2
|
%
|
|||||||||
|
Total
|
94,037
|
82,495
|
35.3
|
%
|
29.2
|
%
|
||||||||||
Our gross profit is affected year-to-year by the mix of our products sold, the mix of revenues between products and services, the regions in which we operate, the size of our transactions and the timing of when such transactions are consummated. Moreover, from time to time we may have large-scale projects which can cause material fluctuations in our gross profit. We recognize revenue from the FITEL Regional Projects using the percentage-of-completion method, and as such any changes to our estimated profits in these projects may cause material fluctuations in our gross profit. As such, we are subject to significant
year-to-year
fluctuations in our gross profit.
48
Our gross profit margin increased to 35.3% in 2018 from 29.2% in 2017. The increase in our gross profit margin in
the year ended December 31, 2018
is mainly attributable to different revenue mix with substantial lower revenue volume in our Terrestrial Infrastructure Projects which is characterized by low gross profit margins compared to our other segments
.
The increase in the gross profit margin of the Mobility Solutions is mainly attributable to a higher revenue volume
in
the year ended December 31, 2018 compared to the year ended December 31,
2017
from IFC products, which carry higher margins.
The increase in the Fixed Networks gross profit margin is mainly attributable to higher revenue volume and different revenue mix, specifically increased revenues from our cellular backhaul solutions which have higher margins, with approximately the same level of fixed expenses
in
the year ended December 31, 2018, compared to the year ended December 31,
2017.
In the
Terrestrial Infrastructure Projects
, the decrease in the gross profit margin is mainly attributable to a delay in some of our FITEL Regional Projects which resulted in additional project costs and lower revenue in 2018.
Operating expenses
:
|
|
Year Ended
|
|||||||||||
|
|
December 31,
|
|||||||||||
|
|
2018
|
2017
|
||||||||||
|
|
U.S. dollars in thousands
|
Percentage change
|
||||||||||
|
|
||||||||||||
|
Operating expenses:
|
||||||||||||
|
Research and development, net
|
33,023
|
28,014
|
17.9
|
%
|
||||||||
|
Selling and marketing
|
22,706
|
23,759
|
(4.4
|
)%
|
||||||||
|
General and administrative
|
17,024
|
19,861
|
(14.2
|
)%
|
||||||||
|
Total operating expenses
|
72,753
|
71,634
|
1.6
|
%
|
||||||||
Our research and development expenses
are incurred by our Fixed Networks and Mobility Solutions. Research and development expenses
, net increased by approximately $5 million in 2018 compared to 2017. The increase in expenses is related to our increased investments in R&D efforts in the Mobility Solutions to support our growing business needs, especially due to the increase in headcount and salary related expenses and subcontractor expenses.
Selling and marketing expenses decreased by approximately $1.1 million in the year ended December 31, 2018 compared to the year ended December 31, 2017. This decrease is mainly due to a decrease in variable expenses and in amortization expenses since we finished amortizing part of our intangible assets, partially offset by an increase in salary related expenses due to additional headcount and to higher travel expenses.
General and administrative expenses decreased by approximately $2.8 million
in the year ended December 31, 2018 compared to the year ended December 31, 2017
. This decrease is mainly attributable to lower bad debt expenses in 2018 as we managed to collect some of our old debts in the year ended December 31, 2018.
Financial expenses, net.
In the year ended December 31, 2018 and 2017, we had financial expenses of approximately $4.3 million.
Taxes on income.
Taxes on income are dependent upon where our profits are generated, such as the location and taxation of our subsidiaries
as well as changes in deferred tax assets and liabilities recorded mainly as part of business combinations and changes in valuation allowance attributable to changes in our profit estimates in different regions. In the year ended December 31, 2018 we had a tax benefit of approximately $1.4 million compared to tax benefit of approximately $0.2 million in the year ended December 31, 2017. During the year ended December 31, 2018, our U.S. subsidiary determined that the positive evidence outweighs the negative evidence for deferred tax assets and concluded that these deferred tax assets are realizable on a "more likely than not" basis. This determination was mainly due to expected future results of positive operations and earnings history.
49
Year Ended December 31, 2017 Compared to Year Ended December 31, 2016
Revenues.
Revenues for the years ended December 31, 2017 and 2016 for our three business segments were as follows:
|
Year Ended
|
Year Ended
|
|||||||||||||||||||
|
December 31,
|
December 31,
|
|||||||||||||||||||
|
|
2017
|
2016
|
2017
|
2016
|
||||||||||||||||
|
|
U.S. dollars in thousands
|
Percentage change
|
Percentage of revenues
|
|||||||||||||||||
|
|
||||||||||||||||||||
|
Fixed Networks
|
116,105
|
124,930
|
(7.1
|
)%
|
41.1
|
%
|
44.7
|
%
|
||||||||||||
|
Mobility Solutions
|
88,397
|
62,911
|
40.5
|
%
|
31.2
|
%
|
22.5
|
%
|
||||||||||||
|
Terrestrial Infrastructure projects
|
78,254
|
91,710
|
(14.7
|
)%
|
27.7
|
%
|
32.8
|
%
|
||||||||||||
|
Total
|
282,756
|
279,551
|
1.1
|
%
|
100.0
|
%
|
100.0
|
%
|
||||||||||||
Our total revenues for the years ended December 31, 2017 and 2016 were $282.8 million and $279.6 million, respectively. The increase in 2017 is mainly attributable to an increase of approximately $25.5 million in Mobility Solutions revenues, largely offset by decreases of $13.5 million in
Terrestrial Infrastructure Projects
revenues and $8.8 million in Fixed Networks revenues.
The increase in Mobility Solutions revenues is primarily attributable to an increase in sales related to airborne mobility products, principally IFC products and our Wavestream products.
The decrease in
Terrestrial Infrastructure Projects
revenues is attributable to decreased revenues from the FITEL Regional Projects which we were awarded in 2015. We began deploying the first three projects during 2015 and the fourth in 2016 (we were awarded two additional projects in 2018). The four FITEL Regional Projects awarded in 2015 are expected to generate revenues of approximately $393 million over a period of approximately 14-15 years. All construction revenues are accounted as Terrestrial Infrastructure Projects revenues.
The decrease in our Fixed Networks revenues is primarily attributable to lower sales in the Asia Pacific and China regions partially offset by higher revenues in the Latin America region.
Gross profit.
The gross profit and the gross margin of our three business segments for the years ended December 31, 2017 and 2016 was as follows:
|
|
Year Ended
|
Year Ended
|
||||||||||||||
|
|
December 31,
|
December 31,
|
||||||||||||||
|
|
2017
|
2016
|
2017
|
2016
|
||||||||||||
|
|
U.S. dollars in thousands
|
Percentage of revenues
|
||||||||||||||
|
|
||||||||||||||||
|
Fixed Networks
|
34,185
|
39,944
|
29.4
|
%
|
32.0
|
%
|
||||||||||
|
Mobility Solutions
|
41,904
|
21,949
|
47.4
|
%
|
34.9
|
%
|
||||||||||
|
Terrestrial Infrastructure projects
|
6,406
|
13,597
|
8.2
|
%
|
14.8
|
%
|
||||||||||
|
Total
|
82,495
|
75,490
|
29.2
|
%
|
27.0
|
%
|
||||||||||
50
Our gross profit margin increased to 29.2% in 2017 from 27% in 2016. The increase in our gross profit margin in
the year ended December 31, 2017
is mainly attributable to substantial higher revenue volume in our Mobility Solutions segment which is characterized by higher gross profit margins compared to our other segments
. This increase was partially offset by a decrease in
our gross profit margin in the Terrestrial Infrastructure Projects and Fixed Networks segments.
The increase in the gross profit margin of the Mobility Solutions is mainly attributable to different revenue mix and higher revenue volume in the year ended December 31, 2017 compared to the year ended December 31,
2016
.
The decrease in the Fixed Networks gross profit margin is mainly attributable to lower revenue volume and a slightly higher fixed expenses level
in
the year ended December 31, 2017, compared to the year ended December 31,
2016.
In the
Terrestrial Infrastructure Projects
, the decrease in the gross profit margin is mainly attributable to the fact that in 2017 we recognized a higher portion of our revenue from projects which carry lower margins and in addition a delay in some of our FITEL Regional Projects resulted in additional project costs and lower revenue in the year ended December 31, 2017 compared to the year ended December 31, 2016.
Operating expenses
:
|
|
Year Ended
|
|||||||||||
|
|
December 31,
|
|||||||||||
|
|
2017
|
2016
|
||||||||||
|
|
U.S. dollars in thousands
|
Percentage change
|
||||||||||
|
|
||||||||||||
|
Operating expenses:
|
||||||||||||
|
Research and development, net
|
28,014
|
24,853
|
12.7
|
%
|
||||||||
|
Selling and marketing
|
23,759
|
23,411
|
1.5
|
%
|
||||||||
|
General and administrative
|
19,861
|
26,471
|
(25
|
)%
|
||||||||
|
Total operating expenses
|
71,634
|
74,735
|
4.1
|
%
|
||||||||
Our research and development expenses
are incurred by our Fixed Networks and Mobility Solutions.
Research and development expenses, net increased by approximately $3.2 million in 2017 compared to 2016. The increase in expenses is related to our increased investments in R&D efforts in the Mobility Solutions segment to support our growing business, especially due to the increase in headcount and salary related expenses.
Selling and marketing expenses increased by approximately $0.3 million in the year ended December 31, 2017 compared to the year ended December 31, 2016, mainly as a result an increase in variable expenses and subcontractor expenses, offset partially by lower amortization expenses.
General and administrative expenses decreased by approximately $6.6 million
in the year ended December 31, 2017 compared to the year ended December 31, 2016
. This decrease is mainly attributable an accrual for bad debt recorded in 2016 related to a governmental customer in Venezuela arising from the worsening economic situation and the credit downgrade in that country and to lower legal expenses
due to the conclusion of trade secrets litigation that we initiated in 2015 against former employees in the U.S.
Financial expenses, net.
In the year ended December 31, 2017, we had financial expenses of approximately $4.3 million compared to financial expenses of approximately $4.8 million in 2016. The decrease in our financial expenses is
primarily attributable to
lower
bank charges, surety and guaranty expenses, mainly related to our projects in Latin America.
51
Taxes on income.
Taxes on income are dependent upon where our profits are generated, such as the location and taxation of our subsidiaries
as well as changes in deferred tax assets and liabilities recorded mainly as part of business combinations. In the year ended December 31, 2017 we had a tax benefit of approximately $0.2 million compared to tax expenses of approximately $1.3 million in the year ended December 31, 2016.
Variability of Quarterly Operating Results
Our revenues and profitability may vary from quarter to quarter and in any given year, depending primarily on the sales mix of our family of products and the mix of the various components of the products, sale prices, and production costs, as well as on entering into new service contracts, the termination of existing service contracts, or different profitability levels between different service contracts. Sales of our products to a customer typically consist of numerous VSATs and related hub equipment, SSPAs, BUCs, and low-profile antennas, which carry varying sales prices and margins.
Annual and quarterly fluctuations in our results of operations may be caused by the timing and composition of orders by our customers and the timing of our ability to recognize revenues. Our future results may also be affected by a number of factors, including our ability to continue to develop, introduce and deliver new and enhanced products on a timely basis and expand into new product offerings at competitive prices, to integrate our recent acquisitions, to anticipate effectively customer demands and to manage future inventory levels in line with anticipated demand. Our results may also be affected by currency exchange rate fluctuations and economic conditions in the geographical areas in which we operate. In addition, our revenues may vary significantly from quarter to quarter as a result of, among other factors, the timing of new product announcements and releases by our competitors and us. We cannot be certain that revenues, gross profit and net income (or loss) in any particular quarter will not vary from the preceding or comparable quarters. Our expense levels are based, in part, on expectations as to future revenues. If revenues are below expectations, operating results are likely to be adversely affected. In addition, a substantial portion of our expenses are fixed (
e.g
. space segment, lease payments) and adjusting expenses in
the event
revenues drop unexpectedly often takes considerable time. As a result, we believe that period-to-period comparisons of our results of operations are not necessarily meaningful and should not be relied upon as indications of future performance. Due to all of the foregoing factors, it is possible that in some future quarters our revenues or operating results will be below the expectations of public market analysts or investors. In such event, the market price of our shares would likely be materially adversely affected.
Conditions in Israel
We are organized under the laws of the State of Israel, where we also maintain our headquarters and
a material portion of our laboratory capacity and principal
research and development facilities. See Item 3.D. “Key Information – Risk Factors – Risks Relating to Our Location in Israel” for a description of governmental, economic, fiscal, monetary or political factors that have materially affected or could materially affect our operations.
Impact of Inflation and Currency Fluctuations
While most of our sales and service contracts are in U.S. dollars or are linked to the U.S. dollar and most of our expenses are in U.S. dollars and NIS, portions of our projects in Latin America as well as our operation in Australia, Asia and Europe are linked to their respective local currencies. The foreign exchange risks are often significant due to fluctuations in local currencies relative to the U.S. dollar.
The influence on the U.S. dollar cost of our operations in Israel relates primarily to the cost of salaries in Israel, which are paid in NIS and constitute a substantial portion of our expenses in NIS. In 2018, the rate of inflation in Israel was 0.8% and the U.S. dollar depreciated in relation to the NIS at a rate of 8.1%, from NIS 3.467 per $1 on December 31, 2017 to NIS 3.748 per $1 on December 31, 2018. If future inflation in Israel exceeds the devaluation of the NIS against the U.S. dollar or if the timing of such devaluation lags behind increases in inflation in Israel, our results of operations may be materially adversely affected. In 2018 and 2017, in order to limit these risks, we entered into hedging agreements to cover certain of our NIS to U.S. dollar exchange rate exposures.
52
Our monetary balances that are not linked to the U.S. dollar impacted our financial expenses during the 2018 and 2017 periods. This is due to heavy fluctuations in currency rates in certain regions in which we do business, mainly in Latin America, Australia and Europe. There can be no assurance that our results of operations will not be materially adversely affected by other currency fluctuations in the future.
Recently Adopted Accounting Pronouncements
In May 2014, the Financial Accounting Standards Board ("FASB") issued Accounting Standards Update ("ASU") No. 2014-09, Revenue from Contracts with Customers (Topic 606). The standard replaced the revenue recognition guidance in U.S. GAAP under Topic 605, and was required to be applied retrospectively to each prior period presented, or applied using a modified retrospective method with the cumulative effect recognized in the beginning retained earnings during the period of initial application. Subsequently, the FASB issued several additional ASUs related to ASU No. 2014-09, collectively they are referred to as the “new revenue standards”, which became effective for the Company beginning January 1, 2018.
On January 1, 2018, we adopted Topic 606 using the modified retrospective method for contracts which were not completed as of January 1, 2018. Under the modified retrospective method, we recognized the cumulative effect of initially applying the new revenue standard as an adjustment to the opening balance of accumulated deficit. This adjustment did not have a material impact on our consolidated financial statements. The Standard requires the deferral and amortization of “incremental” costs incurred to obtain a contract. Our primary contract acquisition costs are sales commissions. Under Topic 605, we expensed sales commissions as incurred while under the Topic 606 such costs will be classified as a contract asset and amortized over a period that approximates the timing of revenue recognition on the underlying contracts. Adoption of the standard resulted in an increase to our other current assets and accrued expenses and decrease in our accumulated deficit in an amount of $2,004, $483 and $1,521, respectively. This effect is due to the change in accounting for contract acquisition costs. See Note 2z, “Recently Adopted Accounting Pronouncements" to the consolidated financial statements for more details.
In November 2016, the FASB issued ASU 2016-18, “Statement of Cash Flows (Topic 230): Restricted Cash”, which requires companies to include amounts generally described as restricted cash and restricted cash equivalents in cash and cash equivalents when reconciling beginning-of-period and end-of-period total amounts shown on the statement of cash flows. This ASU is effective for annual and interim periods beginning after December 15, 2017. We adopted this standard effective December 31, 2017 using the retrospective transition method, as required by the new standard.
Recently Issued Accounting Pronouncements
In February 2016, the FASB issued ASU No. 2016-02, Leases (Topic 842). The standard requires lessees to recognize almost all leases on the balance sheet as a right-of-use asset and a lease liability and requires leases to be classified as either an operating or a finance type lease. The standard excludes leases of intangible assets or inventory. Leases with a term of 12 months or less will be accounted for in a manner similar to the accounting under existing guidance for operating leases today. The new standard requires lessors to account for leases using an approach that is substantially equivalent to existing guidance for sales-type leases, direct financing leases and operating leases. ASC 842 supersedes the previous leases standard, ASC 840, "Leases". Topic 842 becomes effective for our company beginning January 1, 2019. We expect that the adoption of the standard will have an impact of approximately $5.6 million on our consolidated balance sheet for the recognition of the right-of-use assets and lease liabilities related to our operating leases. The standard is not expected to have a material impact on our company’s results of operations or cash flows. We are continuing our assessment of the impact that the adoption of this standard, will have on our consolidated financial statements and disclosures.
53
In January 2017, the FASB issued ASU 2017-04, Intangibles - Goodwill and Other (Topic 350): Simplifying the Accounting for Goodwill Impairment ("ASU 2017-04"). ASU 2017-04 eliminates Step 2 of the goodwill impairment test, which requires the calculation of the implied fair value of goodwill by assigning the fair value of a reporting unit to all of its assets and liabilities as if that reporting unit had been acquired in a business combination. Instead, an entity will compare the fair value of a reporting unit with its carrying amount and recognize an impairment charge for the amount by which the carrying amount exceeds the reporting unit's fair value. ASU 2017-04 is effective for annual or any interim goodwill impairment tests in fiscal years beginning after December 15, 2019. We are currently evaluating the expected impact of the standard on our consolidated financial statements.
In August 2017, the FASB issued ASU 2017-12, Derivatives and Hedging (Topic 815): Targeted Improvements to Accounting for Hedging Activities, which expands the activities that qualify for hedge accounting and simplifies the rules for reporting hedging transactions. The standard is effective for our company beginning January 1, 2019. Early adoption is permitted. We are currently evaluating the expected impact of the standard on our consolidated financial statements.
| B . |
Liquidity and Capital Resources
|
Since our inception, our financing requirements have been met through cash from funds generated by private equity investments, public offerings, issuances of convertible subordinate notes, bank loans and credit facilities, operations, as well as funding from research and development grants. We have used available funds primarily for working capital, capital expenditures and strategic investments.
As of December 31, 2018, we had cash and cash equivalents of $67.4 million, short-term and long-term restricted cash of $32.5 million and short-term restricted cash held in trustees’ accounts of $4.3 million. As of December 31, 2017, we had cash and cash equivalents of $53 million, short-term and long-term restricted cash of $29.5 million, short-term restricted cash held in trustees’ accounts of $4.3 million.
In March 2016, we concluded a rights offering, raising gross proceeds of approximately $35.3 million and issuing 9,874,170 ordinary shares. Under the rights offering we granted, at no charge to the holders of our ordinary shares as of the record date for the rights offering, one non-transferable subscription right to purchase two ordinary shares for each nine (9) ordinary shares owned at a price of $7.16 (reflecting a price of $3.58 per share).
We believe that our working capital is sufficient for our present requirements over the next 12 months.
As of December 31, 2018, our long-term debt was approximately $12.6 million, comprised of long-term loans of $8.1 million and current maturities of long-term loans of $4.5 million. The long term loans primarily consist of a loan that was received in December 2010 in the amount of $40 million from First International Bank of Israel, or FIBI, which
bears interest of 4.77%
.
As of December 31, 2018, the principal outstanding balance of this loan was $12 million.
In addition, in connection with the FITEL Regional Projects, we were required to post certain advance payment guarantees and performance guarantees with FITEL. These requirements were principally satisfied through surety bonds issued by Amtrust Europe Limited, or Amtrust, for the benefit of FITEL, through a Peruvian bank as well as through the issuance of bank guarantees by FIBI and by
The Hong Kong and Shanghai Banking Corporation, or HSBC (also through a Peruvian bank)
. Under the arrangements with FIBI, HSBC and Amtrust, we are required to observe certain conditions, including the requirement to maintain an amount of restricted cash. As of December 31, 2018, we were in compliance with these requirements.
Under the provisions of our agreements with FIBI and HSBC, we undertook to
satisfy certain financial and other covenants. As of December 31, 2018, we are in compliance with these covenants.
Our credit and guarantee agreements also contain various restrictions and limitations that may impact us. These restrictions and limitations relate to incurrence of indebtedness, contingent obligations, negative pledges, liens, mergers and acquisitions, change of control, asset sales, dividends and distributions, redemption or repurchase of equity interests, certain debt payments and modifications of loans and investments. The agreements also stipulate a floating charge on our assets to secure fulfillment of our obligations to FIBI and HSBC as well as other pledges, including a fixed pledge, on certain assets and property.
54
The following table summarizes our cash flows for the periods presented:
|
Years Ended December 31
|
||||||||||||
|
2018
|
2017
|
2016
|
||||||||||
|
U.S. dollars in thousands
|
||||||||||||
|
Net cash provided by (used in) operating activities
|
32,017
|
(17,223
|
)
|
(36,879
|
)
|
|||||||
|
Net cash used in investing activities
|
(10,759
|
)
|
(3,692
|
)
|
(4,307
|
)
|
||||||
|
Net cash provided by (used in) financing activities
|
(2,321
|
)
|
(4,012
|
)
|
23,921
|
|||||||
|
Effect of exchange rate changes on cash, cash equivalents and restricted cash
|
(1,490
|
)
|
51
|
981
|
||||||||
|
Net increase (decrease) in cash, cash equivalents and restricted cash
|
17,447
|
(24,876
|
)
|
(16,284
|
)
|
|||||||
|
Cash, cash equivalents and restricted cash at beginning of the period
|
86,757
|
111,633
|
127,917
|
|||||||||
|
Cash, cash equivalents and restricted cash at end of the period..
|
104,204
|
86,757
|
111,633
|
|||||||||
Our cash, cash equivalents and restricted cash increased by approximately $17.4 million during the year ended December 31, 2018 as a result of the following:
Operating activities
. Cash provided by our operating activities was approximately $32 million in 2018 compared to cash used in operating activities of approximately $17.2 million in 2017. The cash provided by our operating activities in 2018 was primarily attributable to our improved operating results, including payments received from our operations in Peru in 2018.
Investing activities
. Cash used in investing activities was approximately $10.8 million in 2018 compared to approximately $3.7 million in 2017. The changes in our cash in 2018 derived from purchase of property and equipment.
Financing activities
. Cash used in financing activities was approximately $2.3 million in 2018 compared to cash used in financing activities of approximately $4 million in 2017. The cash used in financing activities are mainly repayments of long term loans, partially offset by cash paid to us for exercise of stock options.
Our cash, cash equivalents and restricted cash decreased by approximately $24.9 million during the year ended December 31, 2017 as a result of the following:
Operating activities
. Cash used in our operating activities was approximately $17.2 million in 2017 compared to cash used in operating activities of approximately $36.9 million in 2016. The cash used by our operating activities in 2017 was primarily attributable to our improved operating results in 2017.
Investing activities
. Cash used in investing activities was approximately $3.7 million in 2017 compared to cash provided by investing activities of approximately $4.3 million in 2016. The changes in our cash in 2017 derived from the purchase of property and equipment.
Financing activities
. Cash used in financing activities was approximately $4 million in 2017 compared to cash provided by financing activities of approximately $23.9 million in 2016. The cash used in financing activities are mainly repayments of long term loans.
| C . |
Research and Development
|
We devote significant resources to research and development projects designed to enhance our hubs, VSATs, Satellite Communication on-the-move antennas and SSPAs products and to multiply the applications for which they can be used. In particular, we continue to invest into expanding our portfolio to address mobility applications, both IFC and maritime as well as cellular backhaul solutions. We intend to continue to devote substantial resources to complete the development of certain features, including improving functionality, support higher throughput, improving space segment utilization and network resilience, thereby contributing to reducing the cost of proposed solutions for our customers.
We conduct our research and development activities in Israel, Bulgaria, Moldova, the United States (California) and Singapore. Our Bulgarian center focuses on developments related to our Satellite Communication on-the-move antennas, or SOTM antennas. Our facilities in California and Singapore are dedicated to the continuing design and development of SSPAs. Our facilities in Moldova and Israel work on research and development of VSATs, baseband equipment and network management. A dedicated group in our R&D center in Israel develops state-of-the-art Radio Frequency Integrated Circuits, or RFICs, for our electronically-steered SOTM antennas.
55
In 2018, we invested heavily in development of the SOTM antennas for IFC applications. In addition, we invested in development of our electronically-steered SOTM antennas. Our ER6000 dual band Ka and Ku antenna successfully passed DO-160 qualification.
We devoted significant research and development resources over the last few years to the development of our SkyEdge family of products, including development of our own proprietary hardware platforms for both baseband equipment and software. In 2018, we invested heavily in improving space spectral efficiency, including release of the new VSAT platform supporting advanced coding schemas, in developing new enhanced functionality for IFC application and global bandwidth management. We continued to invest in optimizing solutions for cellular backhaul, improving throughput, supported security and resilience. We develop our own network software as well as software for our VSATs.
Our software and our internally developed hardware are proprietary and we have implemented protective measures both of a legal and practical nature. We have obtained and registered patents in the U.S. and in various other countries in which we offer our products and services. We rely upon the copyright laws to protect against unauthorized copying of the object code of our software and upon copyright and trade secret laws for the protection of the source code of our software. We derive additional protection for our software by generally licensing only the object code to customers and keeping the source code confidential. In addition, we enter into confidentiality agreements with our customers and other business partners to protect our software technology and trade secrets. We have also obtained trademark registrations in the U.S. and various other countries for additional protection of our intellectual property. Despite all of these measures, it is possible that competitors could copy certain aspects of our technology or obtain information that we regard as a trade secret in violation of our legal rights.
We participate in various programs under which we have received and are eligible to receive research and development grants for financing research and development projects in Israel, pursuant to the provisions of The Encouragement of Industrial Research and Development Law, 1984. We are also participating in grant research programs of the European Union, Horizon 2020 and from time to time we participate in programs through bilateral R&D foundations such as Canada Israel R&D foundation (CIIRD). With respect to some of our funding programs, we are obligated to pay royalties from the revenues derived from products developed within the framework of such programs. However, most of our programs are non-royalty bearing programs.
The following table sets forth, for the years indicated, our gross research and development expenditures, the portion of such expenditures which was funded mainly by non-royalty bearing grants and the net cost of our research and development activities:
|
Years Ended December 31,
|
||||||||||||
|
2018
|
2017
|
2016
|
||||||||||
|
(U.S. dollars in thousands)
|
||||||||||||
|
Gross research and development costs
|
34,449
|
29,433
|
26,477
|
|||||||||
|
Less:
|
||||||||||||
|
Grants
|
1,426
|
1,419
|
1,624
|
|||||||||
|
Research and development costs - net
|
33,023
|
28,014
|
24,853
|
|||||||||
| D. |
Trend Information
|
The satellite communications industry is moving toward HTS technology that employs multi-beam transmission for more efficient use of space segment. In addition to GEO-HTS, new satellite constellations of HTS-MEO and HTS-LEO (NGSO) are scheduled to be launched in the coming years. With the scheduled launch of numerous HTS, we believe that development of products using this technology for the different satellites and constellations will be an important competitive factor in the satellite communications market. We are continuing our efforts to enhance our current products and develop new ones to support the advantages of this technology.
56
The continued increase in HTS supply is projected to produce a reduction in bandwidth price. This reduction is expected to make satellite communications economically viable for more broadband, cellular and mobility applications. Accordingly, satellite communications are expected to economically increase cellular coverage and service in rural, metro-edge and metro areas in developed and developing countries.
We continue to focus on the mobility trend which has been driven by the
projected growth of mobility applications, especially on airplanes, and also on trains and seagoing vessels, as well as defense-related applications.
In the past few years the satellite communications market has experienced increasing competition both from within its sector and from competing communication technologies. Specifically, the expansion of cellular coverage in rural areas worldwide, increased terrestrial infrastructures as well as the advancement of wireless technologies, increases the options for our potential and existing customers. In addition, the number of satellite communications providers in the market has increased and prices of technologies continue to decline. Another development in our industry is the increasing demand for complete solutions which encompass far more than a single platform of a communications solution.
We believe that the political environment in Israel could continue to prevent certain countries from doing business with us and this, in addition to the increased competition and reduced prices in the telecommunications industry overall, may have an adverse effect on our business. Given all of the above, we cannot guarantee or predict what our sales will be, what trends will develop, and if any changes in our business and marketing strategy will be implemented.
| E. |
Off-Balance Sheet Arrangements
|
At times, we guarantee the performance of our work to some of our customers, primarily government entities. Guarantees are often required for our performance during the installation and operational periods of long-term rural telephony projects such as in Latin America, and for the performance of other projects (government and corporate) throughout the rest of the world. The guarantees typically expire when certain operational milestones are met. In addition, from time to time, we provide corporate guarantees to guarantee the performance of our subsidiaries. No guarantees have ever been exercised against us.
In order to guarantee our performance obligations and the down payment we received under the FITEL Regional Projects, we provided bank guarantees by FIBI and by HSBC and surety bonds by Amtrust through a Peruvian bank.
The aggregate amount of the bank guarantees issued on our behalf by HSBC and FIBI as of December 31, 2018, was approximately $98.6 million. The surety bonds issued by Amtrust on our behalf are in the amount of approximately $28.6 million. We have provided HSBC and FIBI with various pledges and have deposited approximately $29.1 million held as restricted cash as collateral for HSBC and FIBI guarantees.
Our credit and guarantee agreements also contain various covenants, restrictions and limitations that may impact us. These covenants, restrictions and limitations relate to incurrence of indebtedness, contingent obligations, negative pledges, liens, mergers and acquisitions, change of control, asset sales, dividends and distributions, redemption or repurchase of equity interests, certain debt payments and modifications of loans and investments. The agreements also stipulate a floating charge on our assets to secure fulfillment of our obligations to FIBI and HSBC as well as other pledges, including a fixed pledge, on certain assets and property. As of December 31, 2018, the aggregate amount of bank guarantees and surety bonds from insurance companies outstanding to secure our various performance obligations was approximately $149.5 million, including an aggregate of approximately $136 million on behalf of our subsidiaries in Peru. We have restricted cash of approximately $32.4 million as collateral for these guarantees.
57
In order to guarantee our performance obligations for our current activities in Colombia, we purchased insurance from an insurance company in Colombia to guarantee our various contractual and other obligations, including our performance and our employee salary and benefit costs, of approximately 133.5 billion Colombian Pesos (approximately $41.08 million based on the representative rate of exchange published as of December 31, 2018).
| F. |
Tabular Disclosure of Contractual Obligations
|
The following table summarizes our minimum contractual obligations as of December 31, 2018 and the effect we expect them to have on our liquidity and cash flow in future periods:
|
Contractual Obligations
|
Payments due by period (in U.S. dollars in thousands)
|
|||||||||||||||||||
|
|
Total
|
2019
|
2020-2021
|
2022-2023
|
2024
|
|||||||||||||||
|
Long-term loans *
|
12,556
|
4,458
|
8,098
|
-
|
-
|
|||||||||||||||
|
Operating lease (mainly offices)
|
4,381
|
1,973
|
1,470
|
938
|
-
|
|||||||||||||||
|
Space segment services
|
15,970
|
8,367
|
7,603
|
-
|
-
|
|||||||||||||||
|
Purchase commitments (mainly inventory)
|
18,418
|
18,418
|
-
|
-
|
-
|
|||||||||||||||
|
Total contractual cash obligations
|
51,325
|
33,216
|
17,171
|
938
|
-
|
|||||||||||||||
(*) Future interest payments are not included due to variability in interest rates.
| A. |
Directors and Senior Management
|
The following table sets forth the name, age, position(s) and a brief account of the business experience of each of the
directors and executive officers:
|
Name
|
Age
|
Position(s)
|
|
Dov Baharav
|
68
|
Chairman of the Board of Directors
|
|
Yona Ovadia
|
59
|
Chief Executive Officer
|
|
Amiram Boehm (3)
|
47
|
Director
|
|
Dafna Cohen (1)(2)(4)(5)
|
49
|
Director
|
|
Ishay Davidi
|
57
|
Director
|
|
Amir Ofek (3)
|
43
|
Director
|
|
Aylon (Lonny)
Rafaeli (1) (2)(4)
|
65
|
Director
|
|
Meir Shamir
(3)
|
67
|
Director
|
|
Dafna Sharir
(1)(4)
|
50
|
Director
|
|
Elyezer Shkedy (1)(2)(4)(5)
|
60
|
Director
|
|
Adi Sfadia
|
48
|
Chief Financial Officer
|
|
Yuval Shani
|
53
|
Chief Operating Officer
|
|
Michal Aharonov
|
47
|
Vice President,
Global Broadband Networks
|
|
Ron Levin
|
44
|
Vice President, Mobility and Global Accounts
|
|
Alik Shimelmits
|
57
|
Vice President, Research & Development
|
|
Nirit Barnea
|
51
|
Vice President, Human Resources
|
| (1) |
Member of our Audit Committee.
|
| (2) |
Member of our Compensation Committee.
|
| (3) |
“Independent Director” under the applicable NASDAQ Marketplace Rules (see explanation below)
|
| (4) |
“Independent Director” under the applicable NASDAQ Marketplace Rules and the applicable rules of the SEC (see explanation below)
|
| (5) |
“External Director” as required by Israel’s Companies Law (see explanation below)
|
58
Dov Baharav
has served as the Chairman of our Board of Directors since May 2014 and also served as our interim Chief Executive Officer from May 2015 until March 31, 2016.
Mr. Baharav has served as the chairman of the board of directors of Cyberint Inc., a provider of cyber security services and products solutions, since October 2014.
Mr. Baharav
has served as a member of the board of directors of Mellanox Technologies Ltd., a supplier of end-to-end InfiniBand and Ethernet connectivity solutions, since November 2010 till October 2018. Mr. Baharav served as the chairman of the board of directors of Israel Aerospace Industries, Ltd., a defense and civil aerospace technology company, from July 2011 until October 2013. Mr. Baharav served as a member of the Board of directors of Allot Communications Ltd., a global provider of intelligent broadband solutions, from March 2013 until July 2014. From July 2002 until November 2010, Mr. Baharav served as president and chief executive officer of Amdocs Limited, a communications services company. He also served as a member of Amdocs’ board of directors and executive committee from July 2002 until November 2010. Mr. Baharav joined Amdocs in 1991 as vice president and then became president of Amdocs’ principal U.S. subsidiary, Amdocs, Inc., and served as chief financial officer of Amdocs from 1995 until June 2002. From 1983 until 1991, Mr. Baharav served as chief operating officer of Oprotech Ltd., an electro-optical device company. Mr. Baharav is Chairman of the scholarship fund of the College of Management Academic Studies in Rishon Lezion, Israel. Mr. Baharav holds a Bachelor of Science degree in Physics and Accounting, as well as an M.B.A. degree from Tel Aviv University, Israel.
Yona Ovadia
joined our company in March 2015 as Vice President, Services and Commercial Division. He has served as our Chief Executive Officer since March 31, 2016. Prior to joining our company, Mr. Ovadia served as Group President & Head of Services Group at Amdocs from 2013 to 2015. Prior to such time, from 2010 until 2013 Mr. Ovadia served as Head of Delivery & Managed Services at Amdocs Ltd. and prior thereto he served in various executive positions at Amdocs, mainly in the areas of services and managed services, with a position as management member since 1997. Mr. Ovadia holds a B.Sc. degree in Mathematics and Computer Science from Tel Aviv University, Israel.
Amiram Boehm
has served on our Board of Directors since December 2012. Mr. Boehm
has been a Partner in the FIMI Opportunity Funds, Israel’s largest group of private equity funds, since 2004. Mr. Boehm serves as the Managing Partner and Chief Executive Officer of FITE GP (2004), and as a director of Ham-Let (Israel-Canada) Ltd., Hadera Paper Ltd (TASE)., Rekah Pharmaceuticals Ltd (TASE), Pharm-up Ltd (TASE)., TAT Technologies Ltd. (NASDAQ, TASE), PCB Technologies Ltd. (TASE) and DIMAR Ltd, DelekSon Ltd and Galam Ltd. Mr. Boehm previously served as a director of Ormat Technologies Inc. (NYSE, TASE), Scope Metal Trading, Ltd. (TASE), Inter Industries, Ltd. (TASE), Global Wire Ltd. (TASE), Telkoor Telecom Ltd. (TASE) and Solbar Industries Ltd. (previously traded on the TASE). Prior to joining FIMI, from 1999 until 2004, Mr. Boehm served as Head of Research of Discount Capital Markets, the investment arm of Israel Discount Bank. Mr. Boehm holds a B.A. degree in Economics and
a LL.B. degree
from Tel Aviv University, Israel and a Joint M.B.A. degree from Northwestern University and Tel Aviv University, Israel.
Dafna Cohen
has served on our Board of Directors as an external director
(within the meaning of the Israeli Companies Law)
since December 2014. Ms. Cohen is the Head of Business Control and Investor Relations of EL-AL Israel Airlines Ltd. (TASE) and also serves as an independent business and financial advisor. Ms. Cohen served as Director of Global Treasury of MediaMind Technologies Inc. (previously traded on NASDAQ) from 2010 to 2011. Prior to that, Ms. Cohen served as a Director of Investments and as a Treasurer of Emblaze Ltd. from 2005 to 2009 (London Stock Exchange). Prior to that, Ms. Cohen served as an Investment Manager for Leumi Partners and as a manager and a dealer at the derivatives Sector of Bank Leumi. Ms. Cohen previously
served as a member of board of directors of Formula Systems (1985) Ltd. (NASDAQ and TASE)
from 2009
until January 2019,
XTL Biopharmaceuticals Ltd. (NASDAQ and TASE) from 2009 to 2015,
Europort Ltd. (TASE) and of Inventech Central Ltd. (TASE). Ms. Cohen holds a B.A. degree in Economics and Political Science and a M.B.A. degree in Finance and Accounting, both from The Hebrew University of Jerusalem, Israel.
59
Ishay Davidi
has served on our Board of Directors since December 2012. Mr. Davidi
is the Founder and has served as Chief Executive Officer of the FIMI Opportunity Funds, Israel’s largest group of private equity funds, since 1996. Mr. Davidi currently serves as Chairman of the board of directors of Inrom Industries Ltd., Hadera Paper Ltd. (TASE) and Polyram plastics, Dimar Cutting Tools, and as director at Ham-Let (Israel-Canada) Ltd. (TASE), Rekah Pharmaceuticals Ltd. (TASE), Tadir-Gan Precision materials (TASE),
C. Mer Industries Ltd. (TASE), GI Ltd., (TASE), SOS Ltd., DelekSon Ltd., Bet Shemesh Engines Holdings (TASE) and P.C.B Technologies Ltd.
Mr. Davidi previously served as the Chairman of the board of directors of Retalix (previously traded on NASDAQ and TASE) from August 2008 until January 2010, of Tefron Ltd. (New York Stock Exchange and TASE) and of Tadir-Gan (TASE), and as a director at Pharm Up Ltd (TASE), Ormat Industries Ltd. (previously traded on TASE), Retalix, Tadiran Communications Ltd. (TASE), Lipman Electronic Engineering Ltd. (NASDAQ and TASE), Merhav Ceramic and Building Materials Center Ltd. (TASE), TAT Technologies Ltd. (NASDAQ and TASE), Orian C.M. Ltd. (TASE), Ophir Optronics Ltd., Overseas Commerce Ltd, (TASE),
Scope Metals Group Ltd. (TASE)
and Formula Systems Ltd. (NASDAQ and TASE). Prior to establishing FIMI, from 1993 until 1996, Mr. Davidi was the Founder and Chief Executive Officer of Tikvah Fund, a private Israeli investment fund. From 1992 until 1993 Mr. Davidi was the Chief Executive Officer of Zer Science Industries Ltd., a developer of diagnostics equipment for the healthcare industry. Mr. Davidi holds a B.Sc. degree in Industrial and Management Engineering from Tel Aviv University, Israel, and a M.B.A. degree from Bar Ilan University, Israel.
Amir Ofek
has served on our Board of Directors since December 2014. Mr. Ofek is President of Cyberint Inc., a provider of cyber security services and products solutions, and prior was its Chief Executive Office for over 3 years from January 2016 until February 2019. Mr. Ofek has served as a director on the board of Cyberint since September 2014 until 2018. Mr. Ofek was a partner at Baharav Ventures Ltd. (“BVL”), a company wholly owned by the Chairman of our Board of Directors, Mr. Baharav from 2014 until 2016. Prior to joining BVL, Mr. Ofek worked at Amdocs Inc., the leading BSS/OSS provider, from 2006 to 2014, where he served as VP Client Business Executive SingTel Group at Amdocs, based in Singapore from 2009. Prior to this role, Mr. Ofek served as Director of Management Services at Amdocs from 2007 to 2009 and in the Corporate Strategy unit from 2006 to 2007. Before joining Amdocs in 2006, Mr. Ofek worked for Elbit Systems Ltd., a leading aerospace defense company, from 2001 to 2005. Mr. Ofek holds a BSc. degree (Cum Laude) in Industrial Engineering and Management, majoring in Information Systems from the Technion-Israel Institute of Technology, Israel and a M.B.A. degree from the European Institute of Business Administration (INSEAD) in Fontainebleau, France.
Aylon (Lonny) Rafaeli
has served on our Board of Directors since May 2016. Mr. Rafaeli
is a strategy and business development manager and consultant. From 2007 through 2012, Mr. Rafaeli was Director of Business Development at MST, a concentrated photo voltaic company. Prior to joining MST, Mr. Rafaeli was Managing Partner at E. Barak Associates, a strategic consulting company. Prior to this role, Mr. Rafaeli was Chief Executive Officer of Hasbro Israel (toys). Mr. Rafaeli is a member of the board of directors of the TALI Education Fund and a veteran association of an IDF elite unit. Mr. Rafaeli also served in the past as a director of Lenox Investment and Azimuth Technologies. Mr. Rafaeli holds an Executive M.B.A. degree in Strategic Management from The Hebrew University of Jerusalem, Israel.
Meir Shamir
has served on our Board of Directors since May 2016. Mr. Shamir is the chief executive officer and a director of Mivtach Shamir holdings Ltd., a public company traded on the Tel Aviv Stock Exchange. Mivtach Shamir is a holding company active in spotting and initiating investments in technology and in commercial real estate development in Israel and throughout Europe, the U.S. India. Mr. Shamir served as a navigator in the Israeli Air Force. Mr. Shamir is an active philanthropist and since 2012 he has served as the Head of the Presidency of “Taglit” (Birthright Israel)
.
Mr. Shamir holds a Business & Economics Administration degree and received an Honorary Doctorate from Bar Ilan University, Israel.
Dafna Sharir
has served on our Board of Directors since May 2016. Ms. Sharir is an independent consultant in the areas of mergers and acquisitions and business development. Ms. Sharir served as Senior Vice President Investments of Ampal Corp. between 2002 and 2005. Before that she served as Director of Mergers and Acquisitions at Amdocs (until 2002). Between 1994 and 1996, Ms. Sharir worked as a tax attorney with Cravath, Swaine & Moore in New York. Ms. Sharir is a director of Ormat Technologies Inc. and ECI Telecom, and served in the past as a director of Frutarom Industries Ltd. Ms. Sharir holds a B.A. degree in Economics and a LL.B degree, both from Tel Aviv University, Israel, LL.M. degree in Tax Law from New York University, and M.B.A. degree from INSEAD.
60
Major General (ret.) Elyezer Shkedy
,
has served on our Board of Directors since June 2017. Mr. Shkedy is a business development manager and consultant. From January 2010 to March 2014, Mr. Shkedy was the Chief Executive Officer of El-Al Israel Airlines. Prior to joining El-Al, Mr. Shkedy served as Commander of the Israeli Air Force, from April 2004 until May 2008, after a long career as a fighter pilot and moving up through several command positions in the Israeli Air Force. Mr. Shkedy serves as board member in Paz Oil Company, Ltd. (TASE), as chairman of the board (pro bono) at Osim Shinui Shamaym Vearetz Ltd., a company for a public cause, and as member of managing boards at several other non-profit companies and organizations. Mr. Shkedy holds an M.A. degree (with distinction) in Systems Management from NPS, the Naval Postgraduate School in Monterey, California, U.S. and a B.Sc. degree in Mathematics and Computer Science (with distinction) from Ben Gurion University in Israel.
Adi Sfadia
has served as our Chief Financial Officer since November 2015. Prior to joining Gilat Mr. Sfadia served as CFO of Starhome Ltd., a wholly owned subsidiary of Fortissimo Capital, from January 2013. From 2008 to 2013, Mr. Sfadia served as CFO of Radvision Ltd. (previously traded on NASDAQ and TASE). From 2004 until 2008, Mr. Sfadia served as Radvision’s Corporate Controller and Vice President of Finance.
Prior to that, Mr. Sfadia served in several senior financial positions in Israeli companies, where he gained wide financial and managerial experience. Mr. Sfadia served five years in a public accounting position with Kost Forer Gabbay & Kasierer, a member of Ernst & Young Global. Mr. Sfadia holds a B.A. degree in Business Administration and an M.B.A. degree (magna cum laude) from The College of Management in Tel Aviv and Rishon Lezion, and is a Certified Public Accountant in Israel.
Yuval Shani
serves as our Chief Operating Officer. Mr. Shani has over 20 years of executive experience in the fields of Global Operations, Supply Chain and Delivery Management. Prior to joining Gilat, Yuval served as Vice President Global Operations at Lumenis. Previously, he headed Global Operations and Manufacturing at Check Point. Mr. Shani has also worked at Microsemi as Vice President Operations and General Manager of the company’s Israeli site. During his career, Mr. Shani has served in various management positions in high growth public companies such as Nice and 3Com, and has been the lead person responsible for the implementation of operational excellence practices. Mr. Shani holds an M.B.A. degree, specializing in Finance, and a B.A. degree (cum laude) in Economics & Management, both from Manchester University.
Michal Aharonov
has served as our Vice President, Global Accounts and Telecom Services since October 2015 and was promoted in August 2017 to Vice President, Global Broadband Networks. Prior to joining Gilat, from 2013 until 2015, Ms. Aharonov served as Vice President, Head of Sales and Services at Essence Group. Prior thereto, from 2008 until 2012, Ms. Aharonov served as Vice President, Global Strategic Sourcing at Amdocs, after having served since 2000 in various positions at Amdocs. Ms. Aharonov holds a Master’s degree in Public Administration focusing on financial information systems from Clark University (U.S). and a B.A. degree in Business Management and Finance from the College of Management – Academic Studies in Tel Aviv, Israel.
Ron Levin
serves as our Vice President, Mobility and Global Accounts. He leads our activities in air, land and maritime mobility as well as our business with Satellite Operators on HTS/VHTS and NGSO constellations. Prior to joining Gilat, he headed Strategic Sales at ECI Telecom, a leading telecom equipment provider. Previously Mr. Levin headed Product Management at Jungo Software Technologies, a software company of home and small business gateways, which was later acquired by NDS and Cisco. Mr. Levin holds a M.Sc. degree in Management from the University of Tel Aviv and a B.Sc. degree in Computer Engineering from the Technion, Israel Institute of Technology, in Israel.
Alik Shimelmits
has served as our Vice President, Research and Development since May 2013. Prior to joining Gilat, from 2007 to 2013, Mr. Shimelmits served as Head of Transport Networks R&D for ECI Telecom Ltd. and prior to that as VP Research and Development for Axerra Networks Ltd. from 1999 to 2007. From 1991 to 1999, Mr. Shimelmits held various technical and managerial positions at ECI Telecom, having last served there as Associate Vice President R&D, Software Development, SDH Product Line. Mr. Shimelmits holds a M.Sc. degree in Applied Mathematics from Moscow Institute of Electronic Engineering and a B.Sc. degree in Computer Science from Moscow Institute of Chemical Engineering.
Nirit Barnea
has served as our Vice President, Human Resources since June 2015. Prior to joining Gilat, from 2010 until 2014, Ms. Barnea served as the Global VP HR of 3M Attenti Ltd. (formerly DMATEK Ltd.). Prior thereto, Ms. Barnea held several senior management HR positions for various software and telecommunications companies. Ms. Barnea holds an M.A. degree in Sociology from Tel Aviv University, Israel and a B.A. degree in Economics and Business Administration from Haifa University, israel.
61
| B. |
Compensation
of Directors and Officers
|
The following table sets forth the aggregate compensation paid to or accrued on behalf of all of our directors and officers as a group for the year ended December 31, 2018:
|
Salaries, Fees, Directors’ Fees,
Commissions and
Bonuses
(1)
|
Amounts Set Aside for Pension, Retirement and
Similar Benefits |
|||||||
|
All directors and officers as a group (17 persons)
(2)
|
$
|
4,082,844
|
$
|
478,069
|
||||

| (1) |
Includes bonuses and equity-based compensation accrued in 2018, but does not include business travel, professional and business association dues and expenses reimbursed to our directors and officers, and other benefits commonly reimbursed or paid by companies in Israel.
|
| (2) |
Includes one officer that ceased to hold office during 2018.
|
In accordance with Israeli law requirements, the table below sets forth the compensation paid to our five most highly compensated senior office holders (as defined in the Companies Law) during or with respect to the year ended December 31, 2018, in accordance with the expenses recorded in our financial statements for the year ended December 31, 2018. We refer to the five individuals for whom disclosure is provided herein as our “Covered Executives.”
For purposes of the table and the summary below, and in accordance with the above mentioned securities regulations, “compensation” includes base salary, bonuses, equity-based compensation, retirement or termination payments, benefits and perquisites such as car, phone and social benefits and any undertaking to provide such compensation.
| Summary Compensation Table | ||||||||||||||||||||
|
Information Regarding the Covered Executive in U.S. dollars
(1)
|
||||||||||||||||||||
|
Name and Principal Position
(2)
|
Base Salary
|
Benefits and
Perquisites (3) |
Variable Compensation
(4)
|
Equity-Based
Compensation (5) |
Total
|
|||||||||||||||
|
Yona Ovadia, CEO
|
366,318
|
136,780
|
230,459
|
186,619
|
920,176
|
|||||||||||||||
|
Yuval Shani,
Chief Operating Officer
|
230,451
|
62,944
|
129,642
|
49,070
|
472,107
|
|||||||||||||||
|
Adi Sfadia, CFO
|
218,926
|
62,887
|
105,342
|
50,466
|
437,621
|
|||||||||||||||
|
Michal Aharonov, Vice President, Global Fixed Networks
|
218,926
|
53,781
|
92,843
|
35,962
|
401,512
|
|||||||||||||||
|
Alik Shimelmits, Vice President, Research & Development
|
202,275
|
49,550
|
88,394
|
35,254
|
375,473
|
|||||||||||||||
|
(1)
|
All amounts reported in the table are in terms of cost to our company, as recorded in our financial statements.
|
|
(2)
|
All executive officers listed in the table were employed or provided services on a full-time basis during 2018. The compensation information in the table above includes compensation accrued for full year 2018.
|
|
(3)
|
Amounts reported in this column include benefits and perquisites, including those mandated by applicable law. Such benefits and perquisites may include, to the extent applicable to each executive, payments, contributions and/or allocations for savings funds, pension, severance, vacation, car or car allowance, medical insurances and benefits, risk insurances (e.g., life, disability, accident), convalescence pay, payments for social security and other benefits and perquisites consistent with our guidelines, but do not include business travel, relocation, professional and business association dues and expenses reimbursed to our directors and officers.
|
|
(4)
|
Amounts reported in this column refer to Variable Compensation such as commission, incentive and bonus payments as recorded in our financial statements for the year ended December 31, 2018.
|
|
(5)
|
Amounts reported in this column represent the expense recorded in our financial statements for the year ended December 31, 2018, with respect to equity-based compensation granted to the Covered Executive.
|
62
In accordance with the approval of our shareholders and in accordance with Israeli corporate law regarding compensation of external directors, each of our non-employee directors and external directors (all of our current directors except for our Chairman of the Board of Directors) is entitled to receive annual compensation payable quarterly of approximately NIS
93,690
(currently equivalent to approximately $25,909), and an additional fee of approximately NIS 1,924 (currently equivalent to approximately $532) for each board or committee meeting attended. In addition, Board members are compensated for telephone participation in board and committee meetings in an amount of 60% of what would be received for physical attendance and for written resolutions in an amount equal to 50% of same. All the above amounts are linked to changes in the Israeli consumer price index as of September 2014 and subject to changes in the amounts payable pursuant to Israeli law from time to time.
As of December 31, 2018, our directors and executive officers as a group, consisting of 16 persons, held options to purchase an aggregate of 1,828,110 ordinary shares, having exercise prices ranging from $3.77 to $7.86. Generally, the options granted to our directors, vest over a three-year period (except in the case of our Chairman, Dov Baharav, which vest over a four-year period) and the options granted to our executive officers vest over a four-year period. The options will expire between 2020 and 2024. All of such options were awarded under our stock option plans described in Item 6E - “Directors, Senior Management and Employees - Share Ownership - 2008 Share Incentive Plan”.
Chairman Services.
We and Mr. Baharav, through his controlled company, entered into an agreement dated May 20, 2014, or the Chairman Agreement, under which Mr. Baharav serves as Chairman of the Board of Directors of our company. Mr. Baharav also served as interim Chief Executive Officer from May 2015 until March 2016. For his services as Chairman, since April 2016 and until May 2018, Mr. Baharav was entitled (directly or through his controlled company) to: (i) a monthly fee in the amount of NIS 44,000 (approximately $11,739); (ii) payment of the cash value of various fringe benefits, in an aggregate amount of up to NIS 18,697 (approximately $4,988) per month, which is equal to the employer’s cost that would have been incurred by us for such benefits if the Chairman served in an employee status; and (iii) full time office space and secretarial assistance and reimbursement for out-of-pocket expenses incurred by him in connection with his service. In May 2014, Mr. Baharav was granted options to purchase 250,000 of our ordinary shares, at an exercise price of $5.06 per share, and in May 2015, Mr. Baharav was granted options to purchase 150,000 of our ordinary shares exercisable at a price of $6.72 per share. The options were granted under our 2008 Option Plan and vest ratably, each quarter over a four-year period so long as Mr. Baharav continues to serve as Chairman of our company, and will remain exercisable during such service and for an additional 12 months period following termination of service (other than for cause). Unvested options will immediately vest in the event of a change in control. In May 2018, the Chairman Agreement was extended for an additional three years period and amended such that the scope of Mr. Baharav’s role was reduced from a 40% position to a 20% position, with corresponding adjustments to the monthly fee and cash value of the fringe benefits. Accordingly, as of May 2018, Mr. Baharav is entitled (directly or through his controlled company) to a monthly fee in the amount of NIS 22,000 (approximately $6,094) and payment of the cash value of various fringe benefits, in an aggregate amount of up to NIS 9,350 (approximately $2,590) per month. We may terminate the agreement prior to the end of its term by providing two months paid notice and an additional two months
’
salary. An annual cash bonus plan of 3.6 base monthly salaries was approved for the years 2016 to 2018, upon achievement of a threshold of 80% of the company’s target operating profit metric. Additionally, Mr. Baharav may be eligible for an over- achievement bonus of up to one and a half base monthly salaries. An annual cash bonus plan for 2019 and
o
nward will be presented for approval at the annual shareholders meeting in 2019.
63
CEO.
Mr. Ovadia has served as our Chief Executive Officer since March 31, 2016. Under his employment agreement, Mr. Ovadia is entitled to
a monthly salary in the amount of NIS 110,000 (approximately $30,470)
and fringe benefits including social benefits, annual vacation and reimbursement of expenses. An
annual cash bonus plan of six base monthly salaries was approved for the years 2016 to 2018, upon achievement of a threshold of 80% of the company’s target operating profit metric. Additionally, Mr. Ovadia may be eligible for an over- achievement bonus of up to two and a half base monthly salaries. An annual cash bonus plan for 2019 and onward will be presented for approval at the annual shareholders meeting in 2019. Additionally, in 2016, Mr. Ovadia was granted options under our 2008 Option Plan, to purchase 400,000 of our ordinary shares at an exercise price of $5.02 per share. The options were granted under our 2008 Option Plan and vest in 16 equal quarterly installments over a four-year period so long as Mr. Ovadia serves at our company. During 2018, Mr. Ovadia was granted options to purchase 100,000 ordinary shares at an exercise price of $7.86 per share. The options were granted under our 2008 Option Plan and will vest over a period of four years so long as Mr. Ovadia continues to serve at the Company. The options, will remain exercisable for 12 months following cessation or termination of service (other than for cause). Unvested options will immediately vest in the event of a change in control. The options will expire on the sixth anniversary of the date of the grant.
In accordance with the Israeli Companies Law, we adopted an Executive Compensation Policy for our executive officers and directors. The purpose of the policy is to describe our overall compensation strategy for our executive officers and directors and to provide guidelines for setting their compensation, as prescribed by the Israeli Companies Law. In accordance with the Israeli Companies Law, the Executive Compensation Policy must be reviewed and readopted at least once every three years. The policy was last amended in June 2017.
Approval by the Compensation Committee, the Board of Directors and our shareholders, in that order, is required for the adoption of the Executive Compensation Policy. The shareholders’ approval must include the majority of shares voted at the meeting. In addition to the majority vote, the shareholders’ approval must satisfy either of two additional tests:
| · |
the majority includes at least a majority of the shares voted by shareholders other than our controlling shareholders or shareholders who have a personal interest in the adoption of the Executive Compensation Policy; or
|
| · |
the total number of shares held by non-controlling shareholders and disinterested shareholders that voted against the adoption of the Executive Compensation Policy does not exceed 2% of the aggregate voting rights of our company.
|
In the event that the Executive Compensation Policy is not approved by the shareholders, the compensation committee and the board of directors may still approve the policy, if the compensation committee and the board of directors determine, based on specified reasons and following further discussion of the matter, that the compensation policy is in the best interests of the company.
Under the Israeli Companies Law, the compensation arrangements for “office holders” (other than the Chief Executive Officer) who are not directors require the approval of the Compensation Committee and the Board of Directors; provided, however, that if the compensation arrangement is not in compliance with our Executive Compensation Policy, the arrangement may only be approved by the Compensation Committee and the Board of Directors for special reasons to be noted, and the compensation arrangement shall also require a special shareholder approval. If the compensation arrangement is an immaterial amendment to an existing compensation arrangement of an “office holder” who is not a director and is in compliance with our Executive Compensation Policy, the approval of the Compensation Committee is sufficient. An “office holder” is defined under Israeli Companies Law as a general manager, chief executive officer, chief business manager, deputy general manager, vice general manager, any other person assuming the responsibilities of any of the foregoing positions without regard to such person’s title, a director and a manager directly subordinate to the chief executive officer.
64
Arrangements regarding the compensation of directors require the approval of the Compensation Committee, the Board and our shareholders, in that order.
Arrangements regarding the compensation of the Chief Executive Officer require the approval of the Compensation Committee, the Board and our shareholders by special majority, in that order. In certain limited cases, the compensation of a new Chief Executive Officer who is not a director may be approved without approval of our shareholders.
| C. |
Board Practices
|
Election of Directors
Our Articles of Association provide that our Board of Directors shall consist of not less than five and not more than nine directors as shall be determined from time to time by a majority vote at the general meeting of our shareholders. Our shareholders resolved to set the size of our Board of Directors at nine members, including two external directors.
Pursuant to our Articles of Association, each beneficial owner of 14% or more of our issued and outstanding ordinary shares is entitled to appoint, at each annual general meeting of our shareholders, one member to our Board of Directors, provided that a total of not more than four directors are so appointed. In the event that more than four qualifying beneficial owners notify us that they desire to appoint a member to our board of directors, only the four shareholders beneficially owning the greatest number of shares shall each be entitled to appoint a member to our Board of Directors. So long as our ordinary shares are listed for trading on NASDAQ, we may require that any such appointed director qualify as an “independent director” as provided in the NASDAQ rules then in effect. Our Board of Directors has the right to remove any such appointed director when the beneficial ownership of the shareholder who appointed such director falls below 14% of our issued and outstanding ordinary shares.
Our Articles of Association provide that a majority of the voting power at the annual general meeting of our shareholders will elect the remaining members of the board of directors, including external directors as required under the Companies Law. At any annual general meeting at which directors are appointed pursuant to the preceding paragraph, the calculation of the vote of any beneficial owner who appointed a director pursuant to the preceding paragraph shall not take into consideration, for the purpose of electing the remaining directors, ordinary shares constituting 14% of our issued and outstanding ordinary shares held by such appointing beneficial owner.
Each of our directors (except for external directors) serve, subject to early resignation or vacation of office in certain circumstances as set forth in our Articles of Association, until the adjournment of the next annual general meeting of our shareholders following the general meeting in which such director was elected. The holders of a majority of the voting power represented at a general meeting of our shareholders in person or by proxy will be entitled to (i) remove any director(s), other than external directors and directors appointed by beneficial holders of 14% or more of our issued and outstanding ordinary shares as set forth above, (ii) elect directors instead of directors so removed, or (iii) fill any vacancy, however created, in the board of directors. Our board of directors may also appoint additional directors, whether to fill a vacancy or in order to bring the total number of serving directors to the number determined by our shareholders. Such directors will serve until the next general meeting of our shareholders following such appointment.
Currently, no shareholder beneficially holding 14% or more of our issued and outstanding ordinary shares has exercised its right to appoint a director.
External Directors
and Independent Directors
External Directors
.
Under the Israeli Companies Law, public companies are required to elect at least two external directors who must meet specified standards of independence. External directors may not have had during the two years preceding their appointment, directly or indirectly through a relative, partner, employer or controlled entity, any affiliation with (i) the company, (ii) those of its shareholders who are controlling shareholders at the time of appointment and/or their relatives, or (iii) any entity controlled by the company or by its controlling shareholders.
65
The term “affiliation” includes an employment relationship, a business or professional relationship maintained on a regular basis, control and services as an office holder.
The term “controlling shareholder” is defined as a shareholder who has the ability to direct the activities of a company, other than if this power derives solely from the shareholder’s position on the board of directors or any
other position with the company. The definition also includes shareholders that hold 25% or more of the voting rights if no other shareholder holds more than 50% of the voting rights in the company.
In addition, an individual may not be appointed as an external director in a company that does not have a controlling shareholder, in the event that he has affiliation, at the time of his appointment, to the chairman, chief executive officer, a 5% shareholder or the chief financial officer. An individual may not be appointed as an external director if his relative, partner, employer, supervisor, or an entity he controls, has other than negligible business or professional relations with any of the persons with which the external director himself may not be affiliated.
No person can serve as an external director if the person’s other positions or business creates or may create conflicts of interest with the person’s responsibilities as an external director. Until the lapse of two years from termination of office, a company may not engage an external director as an employee or otherwise.
If, at the time an external director is to be appointed, all current members of the board of directors, who are not controlling shareholders of the company or their relatives, are of the same gender, then at least one external director appointed must be of the other gender.
The Israeli Companies Law further requires that external directors have either financial and accounting expertise or professional competence, as determined by the company’s board of directors. Under relevant regulations, a director having financial and accounting expertise is a person who, due to his or her education, experience and talents, is highly skilled in respect of, and understands, business and accounting matters and financial reports, in a manner that enables him or her to have an in-depth understanding of the company’s financial information and to stimulate discussion in respect of the manner in which the financial data is presented. Under the regulations, a director having professional competence is a person who meets any of the following criteria: (i) has an academic degree in either economics, business administration, accounting, law or public administration; (ii) has a different academic degree or has completed higher education in an area relevant to the company’s business or in an area relevant to his or her position; or (iii) has at least five years’ experience in any of the following, or has a total of five years’ experience in at least two of the following: (a) a senior position in the business management of a corporation with a substantial scope of business, (b) a senior public position or a senior position in public service, or (c) a senior position in the main field of the company’s business.
At least one of the external directors is required to qualify as a financial and accounting expert, as determined by the board of directors.
Our Board of Directors has determined that both Ms. Dafna Cohen and Mr. Elyezer Shkedy have “accounting and financial expertise” as defined by the Israeli Companies law.
External directors serve for an initial three-year term. The initial three-year term of service can be extended, at the election of a company subject to certain conditions, by two additional three-year terms. External directors will be elected by a majority vote at a shareholders’ meeting, provided that either the majority of shares voted at the meeting, including at least half of the shares held by non-controlling shareholders voted at the meeting, vote in favor; or the total number of shares held by non-controlling shareholders voted against does not exceed two percent of the aggregate voting rights in the company.
The term of office of external directors of Israeli companies traded on certain foreign stock exchanges, including the NASDAQ Global Select Market, may be further extended, indefinitely, in increments of additional three-year terms, in each case provided that, in addition to reelection in such manner described above, (i) the audit committee and subsequently the board of directors of the Company confirm that, in light of the external director’s expertise and special contribution to the work of the board of directors and its committees, the reelection for such additional period is beneficial to the Company, and (ii) prior to the approval of the reelection of the external director, the Company’s shareholders have been informed of the term previously served by such nominee and of the reasons why the board of directors and audit committee recommended the extension of such nominee’s term.
66
External directors can be removed from office only by the court or by the same special majority of shareholders that can elect them, and then only if the external directors cease to meet the statutory qualifications with respect to their appointment or if they violate their fiduciary duty to the company. The court may additionally remove external directors from office if they were convicted of certain offenses by a non-Israeli court or are permanently unable to fulfill their position.
An external director is entitled to compensation as provided in regulations adopted under the Companies Law and is otherwise prohibited from receiving any other compensation, directly or indirectly, in connection with such service.
The Companies Law requires external directors to submit to the company, prior to the date of the notice of the general meeting convened to elect the external directors, a declaration stating their compliance with the requirements imposed by Companies Law for the office of external director.
Our Board of Directors
currently
has
two external directors
under Israeli law
: (i) Ms. Dafna Cohen, who was re
elected to serve as an external director in January 2018
; and (ii) Mr. Elyezer Shkedy who was
elected to serve as an external director in June 2017.
Independent Directors
. In general, NASDAQ Marketplace Rules require that the board of directors of a NASDAQ-listed company have a majority of independent directors, within the meaning of NASDAQ rules. Our Board of Directors has determined that seven out of the nine members of our Board of Directors are independent directors under NASDAQ requirements.
Pursuant to the Israeli Companies Law, a director may be qualified as an independent director if such director is either (i) an external director; or (ii) a director that served as a board member less than nine years and the audit committee has approved that he or she meets the independence requirements of an external director. A majority of the members serving on the audit committee and the compensation committee must be independent under the Israeli Companies Law.
Chairman of the Board
Under the Companies Law, the Chief Executive Officer (referred to as a “general manager” under the Companies Law) or a relative of the Chief Executive may not serve as the chairman of the board of directors, and the chairman or a relative of the chairman may not be vested with authorities of the Chief Executive Officer without shareholder approval consisting of a majority vote of the shares present and voting at a shareholders meeting, provided that either:
| · |
such majority includes at least a majority of the shares held by all shareholders who are not controlling shareholders and do not have a personal interest in such appointment, present and voting at such meeting; or
|
| · |
the total number of shares of non-controlling shareholders and shareholders who do not have a personal interest in such appointment voting against such appointment does not exceed two percent of the aggregate voting rights in the company.
|
In addition, a person subordinated, directly or indirectly, to the Chief Executive Officer may not serve as the chairman of the board of directors; the chairman of the board may not be vested with authorities that are granted to those subordinated to the Chief Executive Officer; and the chairman of the board may not serve in any other position in the company or a controlled company, but he may serve as a director or chairman of a subsidiary.
Committees of the Board of Directors
Our Articles of Association provide that the Board of Directors may delegate its powers to committees of the Board of Directors as it deems appropriate, to the extent permitted by Israeli Companies Law. All of the external directors must serve on our audit committee and compensation committee (including one external director serving as the chair of the audit committee and compensation committee), and at least one external director must serve on each other committee that may be established by our Board of Directors.
67
Audit Committee.
Under the Israeli Companies Law, publicly traded companies must establish an audit committee. The audit committee must consist of at least three members, and must include all of the company’s external directors, including one external director serving as chair of the audit committee. A majority of an audit committee must be comprised of “independent directors” (as such term is defined in the Companies Law). The chairman of the board of directors, directors employed by, or that provide services on a regular basis to, the company or to a controlling shareholder or a company controlled by a controlling shareholder (or whose main livelihood depends on a controlling shareholder), any controlling shareholder and any relative of a controlling shareholder may not be a member of the audit committee. An audit committee may not approve an action or a transaction with an officer or director, a transaction in which an officer or director has a personal interest, a transaction with a controlling shareholder and certain other transactions specified in the Companies Law, unless at the time of approval two external directors are serving as members of the audit committee and at least one of the external directors was present at the meeting in which approval was granted.
In addition, the NASDAQ Marketplace Rules require us to establish an audit committee comprised of at least three members, all of whom must be independent directors, each of whom is financially literate and satisfies the respective “independence” requirements of the Securities and Exchange Commission and NASDAQ and one of whom has accounting or related financial management expertise at senior levels within a company.
Our Audit Committee oversees (in addition to the Board) the accounting and financial reporting processes of our company and audits of our financial statements, including the integrity of our financial statements, compliance with legal and regulatory requirements, our independent auditors’ qualifications, independence, compensation, and performance, and the performance of our internal audit function. Our Audit Committee is also required to determine whether there are deficiencies in the business management of our company and in such event propose to our Board of Directors the means of correcting such deficiencies,
determine whether certain related party actions and transactions are “material” or “extraordinary” in connection with their approval procedures,
approve related-party transactions as required by Israeli law and
establish whistle blower procedures (including in respect of the protections afforded to whistle blowers).
The Audit Committee may consult from time to time with our independent auditors and internal auditor with respect to matters involving financial reporting and internal accounting controls.
Our Audit Committee consists of Ms. Cohen, Ms. Sharir, Mr. Shkedy and Mr. Rafaeli. All of the members of our Audit Committee satisfy the respective “independence” requirements of the Securities and Exchange Commission and NASDAQ, and the composition of our Audit Committee satisfies the audit committee composition requirements of the Israeli Companies Law. Our Board of Directors has determined that both Ms. Cohen and
Mr. Shkedy
qualify as Audit Committee financial experts, as required by the rules of the Securities and Exchange Commission and NASDAQ.
Compensation Committee.
Under the Israeli Companies Law, publicly traded companies must establish a compensation committee, including an external director serving as chair of the compensation committee. The compensation committee must consist of at least three members, and must include all of the company’s external directors. The additional members of the compensation committee must satisfy the criteria for remuneration applicable to the external directors.
Our Compensation Committee consists of
Ms. Cohen,
Mr. Shkedy and Mr. Rafaeli. All of the members of our Compensation Committee are independent directors, within the meaning of NASDAQ rules and the composition of our Compensation Committee complies with the compensation committee composition requirements of the Israeli Companies Law.
Under Israeli Companies Law, the compensation committee is responsible for: (i) making recommendations to the Board of Directors with respect to the approval of the Executive Compensation Policy; (ii) providing the Board of Directors with recommendations with respect to any amendments or updates to the Executive Compensation Policy and periodically reviewing the implementation thereof; (iii) reviewing and approving arrangements with respect to the terms of office and employment of office holders; and (iv) determining whether or not to exempt a transaction with a candidate for chief executive officer from shareholder approval.
68
In addition, our Compensation Committee offers recommendations to the Board of Directors regarding equity compensation issues
(with the Board also approving compensation of our executive officers)
, and administers our option plans, subject to general guidelines determined by our Board of Directors from time to time. The Compensation Committee also makes recommendations to our Board of Directors in connection with the terms of employment of our chief executive officer and all other executive officers.
Israeli Regulations
In March 2016, the Israeli Companies Law Regulations were amended to reduce certain duplicative regulatory burdens to which Israeli companies publicly-traded on NASDAQ are subject. Generally, pursuant to the new regulations, an Israeli company traded on NASDAQ that does not have a “controlling shareholder” (as defined in the Israeli Companies Law) will be able to elect not to appoint External Directors to its Board of Directors and not to comply with the Audit Committee and Compensation Committee composition and chairman requirements of the Israeli Companies Law (as described above); provided, the company complies with the applicable NASDAQ independent director requirements and the NASDAQ Audit Committee and Compensation Committee composition requirements.
Since our largest shareholder, the FIMI funds, are deemed to be a “controlling shareholder” under the Israeli Companies Law, we are not currently eligible to benefit from the relief provided by these new amended Israeli regulations.
Internal Audit
The Israeli Companies Law requires the board of directors of a public company to appoint an internal auditor nominated by the audit committee. The internal auditor must meet certain statutory requirements of independence. The role of the internal auditor is to examine, among other things, the compliance of the company’s conduct with applicable law and orderly business practice. Our internal auditor is Mr. Doron Cohen, CPA of Fahn Kanne, Grant Thornton.
Directors’ Service Contracts
There are no arrangements or understandings with any of our directors providing for benefits upon termination of their employment or service as directors of our company or any of our subsidiaries, other than with our Chairman of the Board, Mr. Dov Baharav. Mr. Baharav’s agreement with us which was extended in May 2018 for an additional three years, stipulates that we may terminate his agreement prior to the end of its three-year term by providing Mr. Baharav with two months’ notice and an additional two months’ salary.
Approval of Related Party Transactions under Israeli Law
Fiduciary Duties of Office Holders
The Israeli Companies Law codifies the fiduciary duties that “office holders,” including directors and executive officers, owe to a company. An office holder’s fiduciary duties consist of a duty of care and a duty of loyalty. The duty of care requires an office holder to act at a level of care that a reasonable office holder in the same position would employ under the same circumstances. This includes the duty to utilize reasonable means to obtain: (i) information regarding the business feasibility of a given action brought for his approval or performed by him by virtue of his position; and (ii) all other information of importance pertaining to the foregoing actions. The duty of loyalty requires that an office holder act in good faith and for the benefit of the company, including: (i) avoiding any conflict of interest between the office holder’s position in the company and any other position he holds or his personal affairs; (ii) avoiding any competition with the company’s business; (iii) avoiding exploiting any business opportunity of the company in order to receive personal gain for the office holder or others; and (iv) disclosing to the company any information or documents relating to the company’s affairs that the office holder has received by virtue of his position as an office holder.
69
Disclosure of Personal Interests of an Office Holder; Approval of Transactions with Office Holders
The Israeli Companies Law requires that an office holder promptly, and no later than the first board meeting at which such transaction is considered, disclose any personal interest that he or she may have and all related material information known to him or her and any documents in their possession, in connection with any existing or proposed transaction relating to our company. In addition, if the transaction is an extraordinary transaction, that is, a transaction other than in the ordinary course of business, other than on market terms, or likely to have a material impact on the company’s profitability, assets or liabilities, the office holder must also disclose any personal interest held by the office holder’s spouse, siblings, parents, grandparents, descendants, spouse’s descendants and the spouses of any of the foregoing (“relatives”), or by any corporation in which the office holder or a relative is a 5% or greater shareholder, director or general manager or in which he or she has the right to appoint at least one director or the general manager.
Under the Israeli Companies Law, all arrangements as to compensation of office holders who are not directors other than the chief executive officer require approval by both the compensation committee and the board of directors. The terms of office and employment of the chief executive officer and the directors require the approval of the compensation committee, the board of directors and shareholders. See also “Item 6.C—Board Practices; Compensation of Office Holders”.
Some other transactions, actions and arrangements involving an office holder (or a third party in which an office holder has an interest) must be approved by the board of directors or as otherwise provided for in a company’s articles of association, however, a transaction that is not for the benefit of the company may not be approved. In some cases, such a transaction must be approved by the audit committee and by the board of directors, and under certain circumstances shareholder approval may be required as well. Generally, in all matters in which a director has a personal interest he or she shall not be permitted to vote on the matter or be present at the meeting in which the matter is considered, except in case of a transaction that is not extraordinary or for the purpose of presenting the proposed transaction, if the chairman of the audit committee or board of directors (as applicable) determines it necessary. Should a majority of the audit committee or of the board of directors have a personal interest in the matter, then: (a) all of the directors are permitted to vote on the matter and attend the meeting at which the matter is considered; and (b) the matter requires approval of the shareholders at a general meeting.
Disclosure of Personal Interests of a Controlling Shareholder; Approval of Transactions with Controlling Shareholders
The disclosure requirements that apply to an office holder also apply to a transaction in which a controlling shareholder of the company has a personal interest. The Israeli Companies Law provides that extraordinary transactions with a controlling shareholder or in which a controlling shareholder has a personal interest, and agreements relating to employment and compensation of a controlling shareholder, generally require the approval of the audit committee (or with respect to terms of office and employment, the compensation committee), the board of directors and the shareholders. Shareholders’ approval shall either include at least half of the shares held by disinterested shareholders participating in the vote, or, alternatively, the total shareholdings of disinterested shareholders voting against the transaction must not represent more than two percent of the voting rights. Agreements relating to engagement or provision of services for a period exceeding three years, must generally be approved once every three years.
For these purposes, a shareholder that holds 25% or more of the voting rights in a company is considered a controlling shareholder if no other shareholder holds more than 50% of the voting rights.
Under the Companies Regulations (Relief regarding Related Party Transactions), 5760-2000, promulgated under the Israeli Companies Law, as amended, certain extraordinary transactions between a public company and its controlling shareholder(s) do not require shareholders’ approval. In addition, under such regulations, directors’ compensation and employment arrangements in a public company do not require the approval of the shareholders if both the compensation committee and the board of directors agree that such arrangements are solely for the benefit of the company or if the directors’ compensation does not exceed the maximum amount of compensation for external directors determined by applicable regulations. Also, employment and compensation arrangements for an office holder that is a controlling shareholder of a public company do not require shareholders’ approval if certain criteria are met. The foregoing exemptions from shareholders’ approval will not apply if one or more shareholders holding at least 1% of the issued and outstanding share capital of the company or of the company’s voting rights, objects to the use of these exemptions, provided that such objection is submitted to the company in writing not later than fourteen days from the date of the filing of a report regarding the adoption of such resolution by the company. If such objection is duly and timely submitted, then the transaction or compensation arrangement of the directors will require shareholders’ approval as detailed above.
70
The Israeli Companies Law provides that an acquisition of shares in a public company must be made by means of a tender offer if as a result of the acquisition a person would become a 25% or greater shareholder of the company. This rule does not apply if there is already another 25% or greater shareholder of the company. Similarly, the Israeli Companies Law provides that an acquisition of shares in a public company must be made by means of a tender offer if as a result of the acquisition a person would hold greater than a 45% interest in the company, unless there is another shareholder holding more than a 45% interest in the company. These requirements do not apply if (i) in general, the acquisition was made in a private placement that received shareholders’ approval, (ii) was from a 25% or greater shareholder of the company which resulted in the acquirer becoming a 25% or greater shareholder of the company, if there is not already a 25% or greater shareholder of the company, or (iii) was from a shareholder holding a 45% interest in the company which resulted in the acquirer becoming a holder of a 45% interest in the company if there is not already a 45% or greater shareholder of the company.
If, as a result of an acquisition of shares, a person will hold more than 90% of a public company’s outstanding shares or a class of shares, the acquisition must be made by means of a full tender offer for all of the outstanding shares or a class of shares. If less than 5% of the outstanding shares are not tendered in such full tender offer, all of the outstanding shares or class of shares will be transferred to the acquirer. The Israeli Companies Law provides for appraisal rights if any shareholder files a request in court within six months following the consummation of a full tender offer.
However, the acquirer may stipulate in the tender offer that any shareholder tendering his shares will not be entitled to appraisal rights.
If more than 5% of the outstanding shares are not tendered in the tender offer, then the acquirer may not acquire shares in the tender offer that will cause his shareholding to exceed 90% of the outstanding shares.
Exemption, Indemnification and Insurance of Directors and Officers
Under the Israeli Companies Law, a company may not exempt an office holder from liability with respect to a breach of his fiduciary duty, but may exempt in advance an office holder from his liability to the company, in whole or in part, with respect to a breach of his duty of care. However, a company may not exculpate in advance a director from his or her liability to the company with respect to a breach of his duty of care in connection with distributions (as defined in the Companies Law) or for certain breaches listed below.
Pursuant to the Companies Law, a company may indemnify an office holder against: (i) a financial obligation imposed on him in favor of another person by a court judgment, including a compromise judgment or an arbitrator’s award approved by court; (ii) reasonable litigation expenses, including attorney’s fees, expended by the office holder as a result of an investigation or proceeding instituted against him by a competent authority, provided that such investigation or proceeding concluded without the filing of an indictment against him and either (A) concluded without the imposition of any financial liability in lieu of criminal proceedings or (B) concluded with the imposition of a financial liability in lieu of criminal proceedings but relates to a criminal offense that does not require proof of criminal intent; and (iii) expenses, including reasonable litigation expenses and legal fees, incurred by an office holder as a result of a proceeding instituted against such office holder in relation to (A) infringements that may impose financial sanction pursuant to the provisions of Chapter H’3 under the Israeli Securities Law, 1968, or the Securities Law, or (B) administrative infringements pursuant to the provisions of Chapter H’4 under the Securities Law, or (C) infringements pursuant to the provisions of Chapter I’1 under the Securities Law.
The indemnification of an office holder must be expressly permitted in the articles of association, under which the company may (i) undertake in advance to indemnify its office holders with respect to certain types of events that can be foreseen at the time of giving such undertaking and up to an amount determined by the board of directors to be reasonable under the circumstances, or (ii) provide indemnification retroactively in amounts deemed to be reasonable by the board of directors.
71
A company may also procure insurance for an office holder’s liability in consequence of an act performed in the scope of his office, in the following cases: (i) a breach of the duty of care of such office holder, (ii) a breach of fiduciary duty, only if the office holder acted in good faith and had reasonable grounds to believe that such act would not be detrimental to the company, or (iii) a monetary obligation imposed on the office holder for the benefit of another person. Subject to the provisions of the Companies Law and the Securities Law, a company may also enter into a contract for procurement of insurance for an office holder for (a) expenses, including reasonable litigation expenses and legal fees, incurred by the office holder as a result of a proceeding instituted against such office holder in relation to (A) infringements that may impose financial sanction pursuant to the provisions of Chapter H’3 under the Securities Law or (B) administrative infringements pursuant to the provisions of Chapter H’4 under the Securities Law or (C) infringements pursuant to the provisions of Chapter I’1 under the Securities Law and (b) payments made to the injured parties of such infringement under Section 52ND(a)(1)(a) of the Securities Law.
A company may not indemnify an office holder against, nor enter into an insurance contract which would provide coverage for, any monetary liability incurred as a result of any of the following:
| · |
a breach by the office holder of his fiduciary duty unless the office holder acted in good faith and had a reasonable basis to believe that the act would not prejudice the company;
|
| · |
a breach by the office holder of his duty of care if such breach was performed intentionally or recklessly
;
|
| · |
any act or omission carried out with the intent to derive an illegal personal gain; or
|
| · |
any fine or penalty levied against the office holder as a result of a criminal offense
.
|
Under the Companies Law, exemption and indemnification of, and procurement of insurance coverage for, a company’s office holders, must be approved under the same terms that apply to approval of the terms of office and employment of the office holders. For more information, see Item 6.B - “Directors, Senior Management and Employees – Compensation of Directors and Officers”
.
Our Articles of Association allow us to exempt any office holder to the maximum extent permitted by law, before or after the occurrence giving rise to such exemption. Our Articles of Association also provide that we may indemnify any office holder, to the maximum extent permitted by law, against any liabilities he or she may incur in such capacity, limited with respect (i) to the categories of events that can be foreseen in advance by our Board of Directors when authorizing such undertaking and (ii) to the amount of such indemnification as determined retroactively by our Board of Directors to be reasonable in the particular circumstances. Similarly, we may also agree to indemnify an office holder for past occurrences, whether or not we are obligated under any agreement to provide such indemnification. Our Articles of Association also allow us to procure insurance covering any past or present officer holder against any liability which he or she may incur in such capacity, to the maximum extent permitted by law. Such insurance may also cover the company for indemnifying such office holder.
We have obtained directors’ and officers’ liability insurance covering our officers and directors and those of our subsidiaries for certain claims. In addition, we have provided our directors and officers with letters providing them with exemption and indemnification to the fullest extent permitted under Israeli law (except that we are not required to exempt our directors and officers from liability for damages caused as a result of a breach of the office holder’s duty of care in transactions in which our controlling shareholder or an office holder has a personal interest).
Israeli Securities Authority Administrative Enforcement
Under the Israeli Securities Law, the Israeli Securities Authority, or ISA, may take certain administrative enforcement actions against a company or a person, including a director, officer or shareholder of a company, if carrying out certain transgressions designated in the Securities Law.
The Securities Law also requires that the chief executive officer of a company supervise and take all reasonable measures to prevent the company or any of its employees from breaching certain provisions of the Israeli Securities Law. The chief executive officer is presumed to have fulfilled such supervisory duty if the company adopts internal enforcement procedures designed to prevent such breaches, appoints a representative to supervise the implementation of such procedures and takes measures to correct the breach and prevent its reoccurrence. The ISA is authorized to impose fines on any person or company breaching certain provisions designated under the Companies Law.
We have adopted several codes and policies, which contain various corporate governance principles, including a Code of Ethics (which includes Whistle Blower procedures), Insider Trading Policy and a Policy Prohibiting Bribery and Corruption, all of which are available on our website at www.gilat.com. See “Item 16B – Code of Ethics”.
72
| D. |
Employees
|
As of December 31, 2018, we had 1,012 full-time employees, including 268 employees in engineering, research and development, 441 employees in manufacturing, operations and technical support, 77 employees in marketing and sales, 120 employees in administration and finance and 106 in other departments. Of these employees, 323 were based in our facilities in Israel, 122 were employed in the U.S., 337 were employed in Latin America and 229 were employed in Asia, the Far East and other parts of the world. These numbers reflect a decrease in headcount since December 31, 2017 of 29 employees worldwide.
As of December 31, 2017, we had 1,041 full-time employees, including 251 employees in engineering, research and development, 485 employees in manufacturing, operations and technical support, 83 employees in marketing and sales, 122 employees in administration and finance and 100 in other departments. Of these employees, 313 were based in our facilities in Israel, 116 were employed in the U.S., 399 were employed in Latin America and 213 were employed in Asia, the Far East and other parts of the world. These numbers reflect a decrease in headcount since December 31, 2016 of 27 employees worldwide.
As of December 31, 2016, we had 1,068 full-time employees, including 259 employees in engineering, research and development, 512 employees in manufacturing, operations and technical support, 76 employees in marketing and sales, 125 employees in administration and finance and 96 in other departments. Of these employees, 318 were based in our facilities in Israel, 104 were employed in the U.S., 430 were employed in Latin America and 216 were employed in Asia, the Far East and other parts of the world. These numbers reflect an increase in headcount since December 31, 2015 of 31 employees worldwide.
We also utilize temporary employees, as necessary, to supplement our manufacturing and other capabilities.
We provide our employees around the world with fringe benefits in accordance with applicable law and we are subject to various labor laws and labor practices around the world.
Recent rulings by Israel’s National Labor Court and changes to Israel’s largest labor union’s bylaws substantially facilitate the organization of a labor union in companies in Israel
. We and our employees are not parties to any collective bargaining agreements and our employees are not represented by any labor union. However, certain provisions of the collective bargaining agreements between the Histadrut (General Federation of Labor in Israel) and the Coordination Bureau of Economic Organizations (including the Manufacturers’ Association of Israel) are applicable to all Israeli employees by order of the Israeli Minister of Economy and Industry. These provisions principally concern the length of the work day and the work week, minimum wages for workers, contributions to a pension fund, insurance for work-related accidents, procedures for dismissing employees, determination of severance pay and other conditions of employment. These provisions are modified from time to time.
Israeli law generally requires severance pay upon termination, resignation in certain instances or death of an employee. Our ongoing severance obligations are partially funded by making monthly payments to approved severance funds or insurance policies, with the remainder accrued as a long-term liability in our consolidated financial statements. In addition, Israeli employees and employers are required to pay specified amounts to the National Insurance Institute, which is, in essence, parallel to the U.S. Social Security Administration. Our permanent employees are generally covered by life and pension insurance policies providing customary benefits to employees, including retirement and severance benefits.
Our U.S. subsidiaries sponsor a retirement plan for eligible employees. Their 401(k) Plan is a “safe harbor” 401(k) Plan and allows eligible employees to defer compensation up to the maximum amount allowed under the current Internal Revenue Code. As a “safe harbor” plan, our U.S. subsidiary must make a mandatory contribution to the 401(k) Plan to satisfy certain nondiscrimination requirements under the Internal Revenue Code. This mandatory contribution is made to all eligible employees.
73
| E. |
Share Ownership
|
Beneficial Ownership of Executive Officers and Directors
Except for Mr. Dov Baharav, none of our directors and executive officers beneficially owns more than 1% of our outstanding shares. Mr. Baharav beneficially owns approximately 2.6% of our ordinary shares, consisting of 1,068,497 ordinary shares and options to purchase 400,000 ordinary shares exercisable within 60 days from the date of this Annual Report. Additionally, Mr. Ishay Davidi shares voting and dispositive power with Shira and Ishay Davidi Management Ltd. with respect to the shares held by the FIMI Funds, and he controls Shira and Ishay Davidi Management Ltd. as described in Item 7A – “Major Shareholders and Related Party Transactions” – “Major Shareholders”.
As of December 31, 2018, our directors and executive officers as a group (16 persons) held options to purchase 1,828,110 of our ordinary shares under our share options plans (described below), exercisable at a weighted average exercise price of $5.6 per share with expiration dates ranging from May 2020 to February 2024.
2008 Share Incentive Plan
In October 2008, our Board of Directors adopted the 2008 Share Incentive Plan,
or the 2008 Plan,
for issuance of options, restricted share units, or RSUs, and other forms of equity based awards to
our directors, officers, consultants and employees. The term of the 2008 Plan had been extended by an additional ten-year period, commencing in October 2015. Our Board of Directors also adopted
a sub-plan to enable qualified optionees certain tax benefits under the Israeli Income Tax Ordinance. F
ollowing increases approved by our Board of Directors,
the total
number of ordinary shares reserved for issuance of options under the 2008 Plan is 6.1 million shares. As of December 31, 2018, we have granted options to purchase 4,630,426 ordinary shares under the 2008 Plan (excluding options that were granted and cancelled), pursuant to which1,747,016 ordinary shares have been issued as of December 31, 2018. As of December 31, 2018, we had outstanding options to purchase 2,883,410 ordinary share, with exercise prices ranging from $3.77 to $9.34 and such options expire
at various times from
February 2019 to August 2024.
As of December 31, 2018, we have granted 1,344,686 RSUs under the 2008 Plan
(excluding RSUs that were granted and canceled), pursuant to which, 1,344,686 ordinary shares have been issued
as of December 31, 2018
.
As of December 31, 2018, we had no outstanding RSUs.
The term of the options granted under the 2008 Plan is six years, subject to the terms of the specific plan and grant letter.
The RSUs and options granted under the 2008 Plan to our executives generally vest quarterly or annually over a four-year period. The options granted under the 2008 Plan to our directors generally vest ratably each quarter over a three-year period except in the case of the grant to our Chairman of the Board of Directors, in which the options vest ratably each quarter over a four-year period.
The purpose of the 2008 Plan is to enable us to attract and retain qualified persons as employees, officers, directors, consultants and advisors and to motivate such persons by providing them with an equity participation in our company. The Section 102 Plans are designed to afford qualified optionees certain tax benefits under the Israeli Income Tax Ordinance.
The 2008 Plan is administered by the Compensation Committee appointed by our Board of Directors. The Compensation Committee recommends to our Board, or in case of office holders, approves, the persons entitled to receive options and RSUs, the terms and conditions on which options or rights to purchase are granted and the number of shares subject thereto. The grants of options and RSUs are approved by our Board.
74
Options issued pursuant to the 2008 Plan may be granted to our
and our subsidiaries’ directors, officers, consultants and
employees. The exercise price of incentive share options issued pursuant to the Plans must be not less than the closing price of our ordinary shares on NASDAQ on the date of grant of the options or, if the closing price is not quoted on such date, on the preceding trading day.
Options are exercisable and restrictions on disposition of shares lapse according to the terms of the applicable plan and of the individual agreements under which such options were granted or awards issued.
| A. |
Major Shareholders
|
The following table sets forth certain information regarding the beneficial ownership of our ordinary shares, as of March 13, 2019, by each person who we believe beneficially owns 5% or more of our outstanding ordinary shares and all of our directors and executive officers as a group.
Beneficial ownership of shares is determined under rules of the SEC and generally includes any shares over which a person exercises sole or shared voting or investment power. The percentage ownership of each such person is based on the number of ordinary Shares outstanding as of March 13, 2019 and includes the number of ordinary shares underlying options and RSUs that are exercisable within sixty (60) days from the date of March 13, 2019. Ordinary Shares subject to these options and RSUs are deemed to be outstanding for the purpose of computing the ownership percentage of the person holding these options and RSUs, but are not deemed to be outstanding for the purpose of computing the ownership percentage of any other person. The information in the table below is based on 55,242,354 Ordinary Shares outstanding as of March 13, 2019. Each of our outstanding ordinary shares has identical rights in all respects. The information in the table below with respect to the beneficial ownership of shareholders is based on the public filings of such shareholders with the SEC through March 13, 2019 and information provided to us by such shareholders.
|
Name
|
Number of Shares
|
Percent
|
||||||
|
FIMI Funds (1).
|
18,801,865
|
34
|
%
|
|||||
|
Itshak Sharon (Tshuva) (2)
|
3,988,624
|
7.2
|
%
|
|||||
|
Mivtah Shamir Holdings Ltd. (3)
|
5,375,647
|
9.7
|
%
|
|||||
|
Renaissance Technologies LLC., and Renaissance Technologies Holdings Corporation (4)
|
2,938,405
|
5.3
|
%
|
|||||
|
All directors and executive officers as a group (16 persons) (5)
|
2,204,534
|
3.9
|
%
|
|||||
____________________________________________________
| (1) |
Based on a Schedule 13D/A filed on April 7, 2016 with the SEC and information provided to our company, FIMI Opportunity IV, L.P., FIMI Israel Opportunity IV, Limited Partnership (the “FIMI IV Funds”), FIMI Opportunity V, L.P., FIMI Israel Opportunity Five, Limited Partnership (the “FIMI V Funds” and together with the FIMI IV Funds, the “FIMI Funds”), FIMI IV 2007 Ltd., FIMI FIVE 2012 Ltd., Shira and Ishay Davidi Management Ltd. and Mr. Ishay Davidi share voting and dispositive power with respect to the 18,801,865 shares held by the FIMI Funds. FIMI IV 2007 Ltd. is the managing general partner of the FIMI IV Funds. FIMI FIVE 2012 Ltd. is the managing general partner of the FIMI V Funds. Shira and Ishay Davidi Management Ltd. controls FIMI IV 2007 Ltd. and FIMI FIVE 2012 Ltd. Mr. Ishay Davidi controls Shira and Ishay Davidi Management Ltd. and is the Chief Executive Officer of all the entities listed above. The principal business address of each of the above entities and of Mr. Davidi is c/o FIMI IV 2007 Ltd., Electra Tower, 98 Yigal Alon St., Tel-Aviv 6789141, Israel.
|
75
| (2) |
Based on a Schedule 13G/A filed on February 14, 2019 with the SEC by Itshak Sharon (Tshuva), Delek Group Ltd. and The Phoenix Holding Ltd and other information provided to us by such shareholders. The ordinary shares are beneficially owned by various direct or indirect, majority or wholly-owned subsidiaries of the Phoenix Holding Ltd. (“the Subsidiaries”).
The Subsidiaries manage their own funds and/or the funds of others, including for holders of exchange-traded notes or various insurance policies, members of pension or provident funds, unit holders of mutual funds, and portfolio management clients. Each of the Subsidiaries operates under independent management and makes its own independent voting and investment decisions. Itshak Sharon (Tshuva) holds 3,988,624 ordinary shares as follows : (i) 45,688 ordinary shares are held by Excellence trust funds; (ii) 395,236 ordinary shares are held by certain Excellence ETF's, (iii) 303,900 ordinary shares are held by The Phoenix "nostro" accounts (iv) 3,028,996 ordinary shares are held by certain partnership that invests in Israeli securities; (v) 212,750 ordinary shares are held by a partnership that invests in shares indexes; and (vi) 2,054 ordinary shares are held by certain Excellence provident funds. The Phoenix Holding Ltd. is a majority-owned subsidiary of Delek Group Ltd. The principal business address of Itshak Sharon (Tshuva) and Delek Investments and Properties Ltd. is 7 Giborei Israel Street, P.O.B. 8464, Netanya, 4250407, Israel. The principal business address of the Phoenix Holding Ltd. is Derech Hashalom 53, Givataim, 5345433, Israel.
|
| (3) |
Based on a Schedule 13G/A filed on April 7, 2016 by Mivtach Shamir Holdings Ltd. and information provided to us by such shareholder. The principal office of Mivtach Shamir Holdings Ltd. is 27 Habarzel Street, Tel-Aviv.
|
| (4) |
Based on Schedule 13G/A filed on February 13, 2019, with the SEC by Renaissance Technologies LLC., or RTC and Renaissance Technologies Holdings Corporation.
|
| (5) |
As of
March 13
, 2019, all directors and executive officers as a group (16 persons) held 1,133,530 options that are vested or that vest within 60 days of March 13, 2019.
|
Significant Changes in the Ownership of Major Shareholders
As of March 21, 2017, our major shareholders were FIMI Funds, beneficially owning 18,901,865 ordinary shares (approximately 34.4% ownership), Itshak Sharon (Tshuva), beneficially owning 6,279,235 ordinary shares (approximately 11.5% ownership),
Mivtah Shamir Holdings Ltd.
beneficially owning 5,375,647
ordinary shares (approximately 9.8% ownership) and Meitav Dash Investments Ltd. beneficially owning
2,865,219
ordinary shares (approximately 5.5% ownership).
As of March 13, 2018, our major shareholders were FIMI Funds, beneficially owning 18,901,865 ordinary shares (approximately 34.4% ownership), Mivtah Shamir Holdings Ltd. beneficially owning 5,375,647 ordinary shares (approximately 9.8% ownership), Itshak Sharon (Tshuva), beneficially owning 4,479,411 ordinary shares (approximately 8.2% ownership), and Renaissance
Technologies
LLC. and Renaissance Technologies Holdings Corporation, together beneficially owning 2,814,930 ordinary shares (approximately 5.1% ownership).
As of March 13, 2019, our major shareholders were FIMI Funds, beneficially owning 18,801,865 ordinary shares (approximately 34% ownership), Mivtah Shamir Holdings Ltd. beneficially owning 5,375,647 ordinary shares (approximately 9.7% ownership), Itshak Sharon (Tshuva), beneficially owning 3,988,624 ordinary shares (approximately 7.2% ownership), and Renaissance
Technologies
LLC. and Renaissance Technologies Holdings Corporation, together beneficially owning 2,938,405 ordinary shares (approximately 5.3% ownership).
Major Shareholders Voting Rights
The voting rights of our major shareholders do not differ from the voting rights of other holders of our ordinary shares, except to the extent that they hold more than 14% and as such, they will have a right to appoint a director, subject to certain conditions set forth in our Articles of Association.
Record Holders
Based on a review of the information provided to us by our transfer agent, as of March 13, 2019, there were 78 holders of record of our ordinary shares, of which 53 record holders holding approximately 82.56% of our ordinary shares had registered addresses in the U.S. These numbers are not representative of the number of beneficial holders of our shares nor is it representative of where such beneficial holders reside since many of these ordinary shares were held of record by brokers or other nominees, including CEDE & Co., the nominee for the Depositary Company (the central depositary for the U.S. brokerage community), which held approximately 82.56
%
of our outstanding ordinary shares as of said date.
76
| B. |
Related Party Transactions
|
Since 2014, our Board of Directors has approved our entering into several agreements for the purchase of infrastructure, construction and services from C. Mer Industries Ltd., or C. Mer. FIMI holds approximately 36.6% of C. Mer’s share capital and our director, Ishay Davidi, is also a member of the board of directors of C. Mer, a publicly traded company (TASE). These transactions were approved by our Audit Committee and Board of Directors in accordance with the requirements of the Israeli Companies Law. In the three years ending on December 31, 2018, our total expenses related to these transactions amounted to $16.75 million.
In addition, in December 2015 we entered into a memorandum of understanding with Orbit Communication Systems, or Orbit, a publicly traded company (TASE), for development and manufacturing of antenna and related services. In August 2017, FIMI acquired approximately 33.4% of Orbit’s share capital and representatives of FIMI serve on Orbit’s board of directors. This transaction was ratified by our Audit Committee and Board of Directors in accordance with the requirements of the Israeli Companies Law. Our total purchases received from Orbit in the period starting in August 2017 and ending on December 31, 2018 amounted to $0.7 million.
| C. |
Interests of Experts and Counsel
|
Not applicable.
| A. |
Consolidated Statements
|
See the consolidated financial statements, including the notes thereto, and the exhibits listed in Item 18 hereof and incorporated herein by this reference.
Export Sales
For information on our revenues breakdown for the past three years, see Item 5: “Operating and Financial Review and Prospects.”
Legal Proceedings
We are a party to various legal proceedings incident to our business. Except as noted below, there are no material legal proceedings pending or, to our knowledge, threatened against us or our subsidiaries, and we are not involved in any legal proceedings that our management believes, individually or in the aggregate, would have a material adverse effect on our business, financial condition or operating results.
In 2003, the Brazilian tax authority filed a claim against our inactive subsidiary in Brazil, SPC International Ltda, for the payment of taxes allegedly due from the subsidiary. After numerous hearings and appeals at various appellate levels in Brazil, the Superior Court and the Supreme Court in February and March 2016 ruled against the subsidiary in final non-appealable decisions. The total amount of this claim, including interest, penalties and legal fees is approximately U.S. $9 million, of which approximately U.S. $1 million is the principal. The Brazilian tax authorities initiated foreclosure proceedings against the subsidiary and certain of its former managers. Pursuant to the court’s decision, published in March 2016, the foreclosure proceedings against the former managers were cancelled. The tax authorities appealed such decision which appeal was rejected in July 2017. This court ruling is final and
is not appealable. Based on Brazilian external counsel’s opinion, we believe that the subsidiary has solid arguments to sustain its position that further collection proceedings are barred due to statute of limitation and that the inclusion of any additional co-obligors in the tax foreclosure certificate should be barred due to the applicable statute of limitations and that the foreclosure procedures cannot legally be redirected to other group entities and managers who were not cited in the foreclosure certificate. Accordingly, we believe that the chances that such redirection will lead to a loss recognition are remote.
77
In 2014, our Peruvian subsidiary,
GNP,
initiated arbitration proceedings in Lima against the Ministry of Transport and Communications of Peru or MTC, and FITEL. The arbitration is related to the FITEL projects awarded to us in 2000-2001. Under these projects, GNP provided fixed public telephony services in rural areas of Peru. Our subsidiary’s main claim is related to damages caused by the promotion of mobile telephony in such areas by the Peruvian government. In June 2018, the arbitration tribunal issued an arbitration award ordering MTC and FITEL to pay our subsidiary an amount of approximately U.S. $13.5 million. FITEL has applied the Superior Court in Lima to declare such award null and void, which such proceedings are currently pending.
In October 2017, the Temporary Union UGC-FUSA, a former subcontractor that we hired in connection with the Kioskos Project in Colombia, initiated an arbitration proceeding against our local subsidiary for breach of contract. The amount of the claim is approximately U.S. $6.6 million. In July 2018, our subsidiary filed its response and a counterclaim against UGC-Fusa and its insurer, Seguros del Estado. The amount of the counter claim is approximately U.S. $8 million plus interest. The arbitration is currently pending the counter parties’ filing their response. Based on legal advice, we believe that we have made adequate accruals relating to this proceeding.
In 2018
, our subsidiary GNP won a government bid for the two additional regional projects for FITEL in Peru in the aggregate amount of approximately $
154 million. GMC Engineering Solutions and SATEL Comunicacio
nes y Datos, which are two of the three entities comprising the losing bidder consortium, applied to the superior court in Lima for cancellation of the bid and obtained a preliminary injunction against the award. Although we are not a party to the main action, our subsidiary was served as an interested third party and filed its objection and preliminary defense
. Currently, our subsidiary continues performing these projects.
Based on advice of counsel, we believe that the appeal’s chances of success are remote.
We are also a party to various regulatory proceedings incident to our business. To the knowledge of our
management
, none of such proceedings is material to us or to our subsidiaries.
Dividend Policy
On the date of this Annual Report on Form 20-F our board of directors declared a cash dividend in the amount of $0.45 per share (approximately $25 million in the aggregate), payable on April 11, 2019 to shareholders of record on March 28, 2019.
The dividend will be the first time that we will pay a dividend, but we have not adopted a general policy regarding the distribution of dividends and make no statements as to the distribution of dividends in the foreseeable future. The terms of some of our financing arrangements restrict us from paying dividends to our shareholders and require prior approval of certain banks which extended us loans. Israeli law limits the distribution of cash dividends to the greater of retained earnings or earnings generated over the two most recent years, in either case provided that we reasonably believe that the dividend will not render us unable to meet our current or foreseeable obligations when due. Notwithstanding the foregoing, dividends may be paid with the approval of a court, provided that there is no reasonable concern that such dividend distribution will prevent the company from satisfying its current and foreseeable obligations, as they become due. Our Articles of Association provide that no dividends shall be paid otherwise than out of our profits and that any such dividend shall carry no interest. For information regarding taxation of dividend, see ITEM 10.E – “Additional Information - Taxation - Israeli Tax Consequences of Holding Our Stock - Dividends”.
B.
Significant Changes
Not applicable.
78
| A. |
Offer and Listing Details
|
Our ordinary shares are listed on the NASDAQ Global Select Market under the symbol “GILT” and are also traded on the TASE.
| B. |
Plan of Distribution
|
Not applicable.
| C. |
Markets
|
Our ordinary shares are listed on the NASDAQ Global Select Market under the symbol “GILT” and are also traded on the TASE.
| D. |
Selling Shareholders
|
Not applicable.
| E. |
Dilution
|
Not applicable.
| F. |
Expense of the Issue
|
Not applicable.
| A. |
Share Capital
|
Not applicable.
| B. |
Memorandum and Articles of Association
|
Set out below is a description of certain provisions of our Articles of Association and of the Israeli Companies Law related to such provisions. This description is only a summary, does not purport to be complete and is qualified by reference to the full text of the Articles of Association, which are incorporated by reference as exhibits to this annual report, and to Israeli law.
Registration and Purposes
We are an Israeli public company registered with the Israel companies register, registration No. 52-003893-6.
Under the Companies Law, a company may define its purpose as to engage in any lawful business and may broaden the scope of its purpose to the grant of reasonable donations for any proper charitable cause, even if the basis for any such donation is not dependent upon business considerations. Our Articles of Association provide that our purpose is to engage in any business permitted by law and that we may also grant reasonable donations for any proper charitable cause.
Powers of the Directors
Under the provisions of the Israeli Companies Law and our Articles of Association, a director cannot vote on a proposal, arrangement or contract in which he or she has a personal interest, nor attend a meeting during which such transaction is considered, except in event of a transaction that is not extraordinary or for the purpose of presenting the proposed transaction, if the chairman of the audit committee or board of directors (as applicable) determines it necessary. In addition, the terms of office and employment of the directors require the approval of the compensation committee, the board of directors and shareholders. For more information regarding the requirements for approval of certain transactions, see Item 6B - “Directors, Senior Management and Employees – “Compensation of Directors and Officers”.
79
Rights Attached to Ordinary Shares
Our authorized share capital consists of 90,000,000 ordinary shares, nominal value NIS 0.2 per share. All outstanding ordinary shares are validly issued and fully paid. Certain rights attached to the ordinary shares are as described below.
Voting Rights
.
Holders of ordinary shares have one vote for each ordinary share held on all matters submitted to a vote of shareholders. Shareholders may vote in person or by proxy. These voting rights may be affected by the grant of any special voting rights to the holders of a class of shares with preferential rights that may be authorized in the future by the shareholders.
Dividend and Liquidation Rights; Rights to Shares in our Company’s Profits.
Our ordinary shares are entitled to the full amount of any cash or share dividend declared, in proportion to the paid up nominal value of their respective holdings. In the event of liquidation, after satisfaction of liabilities to creditors, our assets will be distributed to the holders of our ordinary shares in proportion to the paid up nominal value of their respective holdings. Such rights may be affected by a grant of preferential dividend or distribution rights to the holders of a class of shares with preferential rights that may be authorized in the future by the shareholders.
Generally, pursuant to the Israeli Companies Law, the decision to distribute dividends and the amount to be distributed, whether interim or final, is made by the board of directors. Accordingly, under our Articles of Association, our Board of Directors has the authority to determine the amount and time for payment of interim dividends and final dividends.
Under the Israeli Companies Law, dividends may be paid only out of a company’s net profits for the two years preceding the distribution of the dividends, or from accumulated retained earnings, calculated in the manner prescribed in the Israeli Companies Law. Pursuant to Israeli Companies Law, in any distribution of dividends, our Board of Directors is required to determine that there is no reasonable concern that the distribution of dividends will prevent our company from meeting our existing and foreseeable obligations as they become due. Our Articles of Association provide that no dividends shall be paid otherwise than out of our profits and that any such dividend shall carry no interest. In addition, upon the recommendation of our Board of Directors, approved by the shareholders, we may cause dividends to be paid in kind.
Our shareholders have the right to share in our profits distributed as a dividend and any other permitted distribution, if any.
Annual and Special General Meetings
Record Date for General Meeting
Under the regulations promulgated under the Israeli Companies Law, for the purpose of a shareholder vote, the record date for companies traded outside of Israel, such as our company, can be set between four and 40 days before the date of the meeting.
Notice of General Meetings; Omission to Give Notice
The Companies
Law provides that a company, the shares of which are traded on an exchange must give notice of a general meeting to its shareholders of record of at least 21 days, and in certain instances at least 35 days prior to the meeting, unless the company’s Articles of Association provide that a notice need not be sent. Accordingly, our Articles of Association provide that not less than 21 days’ prior notice shall be given to shareholders of record of every general meeting of shareholders. They further provide that notice of a general meeting of shareholders shall be given in accordance with any law and otherwise as the Board of Directors may determine. In addition, our Articles of Association provide that no shareholder present, in person or by proxy, at the commencement of a general meeting of shareholders shall be entitled to seek the revocation of any proceedings or resolutions adopted at such general meeting of shareholders on grounds of any deficiency in the notice given for such meeting relating to the time or place thereof.
80
Annual General Meetings and Special General Meetings
Under Israeli Companies Law, an annual meeting of the shareholders should be held once in every calendar year and not more than 15 months from the last annual meeting. Israeli Companies Law provides that a special meeting of shareholders must be called by the board of directors upon the written request of (i) two directors, (ii) one‑fourth of the serving directors, (iii) one or more shareholders who hold(s) at least five percent of the issued share capital and at least one percent of the voting power of the company, or (iv) one or more shareholders who have at least five percent of the voting power of the company. Within 21 days of receipt of such request, the board of directors is required to convene the special meeting for a time no later than 35 days after notice is given to the shareholders. Our Articles of Association provide that our Board of Directors may call a special meeting of the shareholders at any time and shall be obligated to call a special meeting as specified above.
Quorum at General Meetings
Under our Articles of Association, the required quorum for any general meeting of shareholders and for any class meeting is two or more shareholders present in person or by proxy and holding at least twenty- five percent (25%) of the issued shares (or of the issued shares of such class in the event of a class meeting). The required quorum in a meeting that was adjourned because a quorum was not present, shall be two shareholders present in person or by proxy. Under our Articles of Association, if the original meeting was called as a special meeting, the quorum in the adjourned meeting shall be one or more shareholders, present in person or by proxy and holding the number of shares required to call such a meeting.
Adoption of Resolutions at General Meetings
Our Articles of Association provide for voting by a written ballot only. In addition, in accordance with Companies Law, our Articles of Association provide that the declaration of the Chairman of the Meeting as to the results of a vote is not deemed to be conclusive, but rather prima facie evidence of the fact. Under our Articles of Association,
unless a different majority is required by law,
any resolution of the shareholders, except a resolution for voluntary liquidation of the company and, in certain circumstances, a resolution to amend our Articles of Association, shall be deemed adopted if approved by the vote of the holders of a majority of the voting power represented at such meeting in person or by proxy.
Election and Removal of Directors
Under our Articles of Association, the ordinary shares do not have cumulative voting rights in the election of directors.
Under our Articles of Association, our Board of Directors shall consist of not less than five and not more than nine directors as shall be determined from time to time by a majority vote at the general meeting of our shareholders. Our shareholders have resolved that our Board of Directors shall consist of a total of nine directors, including two external directors.
Our Articles of Association further provide that each beneficial owner of 14% or more of our issued and outstanding ordinary shares shall be entitled to appoint, at each annual general meeting of our shareholders, one member to our Board of Directors referred to as an “Appointed Director”, provided that a total of not more than four Appointed Directors are so appointed. In the event more than four such qualifying beneficial owners notify us that they desire to appoint an Appointed Director, only the four shareholders beneficially owning the greatest number of shares shall each be entitled to appoint an Appointed Director.
81
For the purposes of the preceding paragraph, a “beneficial owner” of ordinary shares means any person or entity who, directly or indirectly, has the power to vote, or to direct the voting of, such ordinary shares. All ordinary shares beneficially owned by a person or entity, regardless of the form which such beneficial ownership takes, shall be aggregated in calculating the number of ordinary shares beneficially owned by such person or entity. All persons and entities that are affiliates (as defined below) of each other shall be deemed to be one person or entity for the purposes of this definition. For the purposes of the preceding paragraph, an “affiliate” means, with respect to any person or entity, any other person or entity controlling, controlled by, or under common control with such person or entity. “Control” shall have the meaning ascribed to it in the Israeli Securities Law – 1968, i.e., the ability to direct the acts of a company. Any person holding one half or more of the voting power of a company of the right to appoint directors or to appoint the chief executive officer is presumed to have control of the company.
The Articles of Association further stipulate that as a condition to the appointment of an Appointed Director, any appointing shareholder that delivers to our company a letter of appointment shall, prior to such delivery, be required to file with the Securities and Exchange Commission a Schedule 13D, or an amendment to its Schedule 13D if there is any change in the facts set forth in its Schedule 13D already on file with the Securities and Exchange Commission which discloses any such change in its holdings of ordinary shares, regardless of whether any filing or amendment is required to be filed under the rules of the Securities Exchange Act of 1934, as amended, and the rules and regulations promulgated thereunder. In addition, any Appointing Shareholder shall be obligated to notify us in writing of any sale, transfer, assignment or other disposition of any kind of ordinary shares by such appointing shareholder that results in the reduction of its beneficial ownership to below the percentage indicated above, immediately after the occurrence of such disposition of shares but in any event not later than the earliest of (i) ten (10) days thereafter, or (ii) the next Annual General Meeting. Without derogating from the foregoing, so long as an Appointed Director serves on the Board of Directors, the appointing shareholder which appointed such Appointed Director shall provide us, upon our written request at any time and from time to time, with reasonable evidence of its beneficial ownership in our company.
Under our Articles of Association, so long as our ordinary shares are listed for trading on NASDAQ, we may require that any Appointed Director qualify as an “independent director” as provided for in the NASDAQ rules then in effect. In addition, in no event may a person become an Appointed Director unless such person does not, at the time of appointment, and did not, within two years prior thereto, engage, directly or indirectly, in any activity which competes with us, whether as a director, officer, employee, contractor, consultant, partner or otherwise.
Under our Articles of Association, the annual general meeting of our shareholders, by the vote of the holders of a majority of the voting power represented at such meeting in person or by proxy, will elect the remaining members of the Board of Directors. At any annual general meeting at which Appointed Directors are appointed as set forth above, the calculation of the vote of any beneficial owner who appointed a director pursuant to the preceding paragraph shall not take into consideration, for the purpose of electing the remaining directors, ordinary shares constituting 14% of our issued and outstanding ordinary shares held by such appointing beneficial owner.
Appointed Directors may be removed by our Board of Directors when the beneficial ownership of the shareholder who appointed such Appointed Director falls below 14% of our ordinary shares. In addition, the office of an Appointed Director will expire upon the removal of the Appointed Director by the shareholder who appointed such Appointed Director or when the Appointed Director ceases to qualify as an “independent director” as set forth above.
Currently, no shareholder beneficially holding 14% or more of our issued and outstanding ordinary shares has exercised its right to appoint an Appointed Director.
Our Articles of Association further provide that the affirmative vote of a majority of the shares then represented at a general meeting of shareholders shall be entitled to remove director(s) other than Appointed Directors from office (unless pursuant to circumstances or events prescribed under the Companies Law), to elect directors instead of directors so removed or to fill any vacancy, however created, in the Board of Directors. Subject to the foregoing and to early resignation or ipso facto termination of office as provided in our Articles of Association, each director shall serve until the adjournment of the annual general meeting following the general meeting at which such director was elected.
82
Our directors may, at any time and from time to time, appoint a director to temporarily fill a vacancy on the Board of Directors or in their body (subject to the maximum number of directors in the Board of Directors as set forth above), except that if the number of directors then in office constitutes less than a majority of the number of directors set by the shareholders, as mentioned above, they may only act in an emergency, or to fill the vacancy up to the minimum number required to effect corporate action or in order to call a general meeting for the purpose of electing directors.
Qualification of Directors
Our Articles of Association provide that no person shall be disqualified to serve as a director by reason of such person not holding shares in our company or by reason of not having served as a director in the past. Our directors are not subject, under the Israeli Companies Law or our Articles of Association, to an age limit requirement. Under the Israeli Companies Law, a person cannot serve as a director if such person has been convicted of certain offenses (generally, for 5 years after such conviction, unless specifically authorized by the court), if an administrative decision by the Israel Securities Authority disqualified such director’s nomination to the board of a public company, or if the person has been declared bankrupt.
Borrowing Powers
The Israeli Companies Law authorizes the board of directors of a company, among other things, to determine the credit limit of a company and to issue bonds. Our Articles of Association state that our Board of Directors may, from time to time, at its discretion, cause us to borrow or secure the payment of any sum or sums of money, and may secure or provide for the repayment of such sum or sums in such manner, at such times and upon such terms and conditions as it deems fit.
Foreign Ownership
Neither our Articles of Association nor Israeli law restrict in any way the ownership of our ordinary shares by nonresidents of Israel, or restrict the voting or other rights of nonresidents of Israel. Notwithstanding, under Israeli law, nationals of certain countries that are, or have been, in a state of war with Israel may not be recognized as owners of ordinary shares, without a special government permit.
Change of Control Provisions Under Israeli Law
The Israeli Companies Law provides that an acquisition of shares in a public company, such as ours, must be made by means of a tender offer, if, as a result of the acquisition, the purchaser would become a holder of 25% or more of the voting rights in the company. This rule does not apply if there is already another holder of 25% percent of the voting rights. Similarly, the Israeli Companies Law provides that an acquisition of the shares must be made by means of a tender offer, if, as a result of the acquisition, a person would become a holder of 45% of the voting rights in the company, unless there is another person holding at that time more than 45% of the voting rights of the company.
The Israeli Companies Law provides for mergers between Israeli companies, if each party to the transaction obtains the appropriate approval of its board of directors and shareholders. A “merger” is defined in the Companies Law as a transfer of all assets and liabilities (including conditional, future, known and unknown liabilities) of a target company to another company, the consequence of which is the dissolution of the target company in accordance with the provisions of the Companies Law. For purposes of the shareholder vote of each merging entity, unless a court rules otherwise, the merger requires the approval of a majority of the shares of that entity that are not held by the other entity or are not held by any person who holds 25% or more of the shares or the right to appoint 25% or more of the directors of the other entity. Our Articles of Association provide that a merger requires the approval of the holders of a majority of the shares voting thereon.
If, however, the merger involves a merger with a company’s own controlling shareholder or if the controlling shareholder has a personal interest in the merger, then the merger is subject to the same special majority approval that governs all extraordinary transactions with controlling shareholders (as described above in Item 6 E under “—Approval of Related Party Transactions Under Israeli Law”). In the event that the merger transaction has not been approved by either of the above-described special majorities (as applicable), the holders of at least 25% of the voting rights of the company may apply to a court for approval of the merger. The court may approve the merger if it is found that the merger is fair and reasonable, taking into account the valuation of the parties to the merger and the consideration offered to the shareholders.
83
Upon the request of a creditor of either party to the proposed merger, a court may delay or prevent the merger if it concludes that there exists a reasonable concern that as a result of the merger, the surviving company will be unable to satisfy the obligations of any of the parties of the merger to their creditors.
A merger may not be completed unless at least 50 days have passed from the date that a proposal of the merger was filed with the Israeli Registrar of Companies by each merging company and 30 days from the date that shareholder approval of both merging companies was obtained. The merger proposal may be filed once a shareholder meeting has been called to approve the merger.
Modification of Rights Attached to Shares
The rights attached to any class of shares (unless otherwise provided by the terms of issue of such class), such as voting, dividends and the like, may be modified by the affirmative vote of a majority of the issued shares of the class at a general meeting of the holders of the shares of such class.
| C. |
Material Contracts
|
While we have numerous contracts with customers and distributors, we do not deem any individual contract to be a material contract that is not in the ordinary course of our business, except as set forth below:
In March and December 2015,
the Peruvian government
awarded us the FITEL Regional Projects for the construction of networks, operation of the networks for a defined period and their transfer to the government, which are expected to generate aggregate revenues of $393 million to be recognized over approximately 14-15 years. In accordance with the bid conditions, we established a subsidiary in Peru, GNP, to enter into written agreements with the Peruvian government for each of the four regional projects that were awarded. In 2018, we were awarded two additional FITEL Regional Projects
with expected revenues of approximately $154 million over approximately 13-15 years for the construction of networks, operation of the networks for a defined period and transfer of the transport networks to the government. See Item 4.B. – “Information on the Company – Business Overview”.
In order to guarantee our performance obligations and the down payment we received under the FITEL Regional Projects, we issued bank guarantees and surety bonds for the benefit of FITEL. The bank guarantees were issued by FIBI and HSBC through a Peruvian bank, and the surety bonds were issued by Amtrust through a Peruvian bank.
The aggregate amount of the bank guarantees issued on our behalf by HSBC and FIBI as of December 31, 2018, was approximately $98.6 million. The surety bonds issued by Amtrust on our behalf are in the amount of approximately $28.6 million. We have provided HSBC and FIBI with various pledges and have deposited approximately $29.1 million held as restricted cash as collateral for HSBC and FIBI guarantees.
| D. |
Exchange Controls
|
There are no Israeli currency control restrictions on payments of dividends or other distributions with respect to our ordinary shares or the proceeds from the sale of the shares. However, legislation remains in effect pursuant to which currency controls can be imposed by administrative action at any time.
Non-residents of Israel who purchase our securities with non-Israeli currency will be able to repatriate dividends (if any), liquidation distributions and the proceeds of any sale of such securities, into non-Israeli currencies at the rate of exchange prevailing at the time of repatriation, provided that any applicable Israeli taxes have been paid (or withheld) on such amounts.
Neither our Articles of Association nor the laws of the State of Israel restrict in any way the ownership or voting of Ordinary Shares by non-residents of Israel, except with respect to citizens of countries that are in a state of war with Israel.
84
| E. |
Taxation
|
The following is a discussion of Israeli and U.S. tax consequences material to our shareholders. To the extent that the discussion is based on new tax legislation which has not been subject to judicial or administrative interpretation, the views expressed in the discussion might not be accepted by the tax authorities in question. The discussion is not intended, and should not be construed, as legal or professional tax advice and does not exhaust all possible tax considerations.
Holders of our ordinary shares should consult their own tax advisors as to the U.S., Israeli or other tax consequences of the purchase, ownership and disposition of ordinary shares, including, in particular, the effect of any foreign, state or local taxes.
ISRAELI TAX CONSIDERATIONS
The following is a summary of certain Israeli income tax and capital gains tax consequences for non-Israeli residents as well as Israeli residents holding our ordinary shares. The summary is based on provisions of the Israeli Income Tax Ordinance (new version), 1961 and regulations promulgated thereunder, as well as on administrative and judicial interpretations, all as currently in effect, and all of which are subject to change (possibly with retroactive effect) and to differing interpretations. There might be changes in the tax rates and in the circumstances in which they apply, and other modifications which might change the tax consequences to you. The summary is intended for general purposes only, and does not relate to all relevant tax aspects. The discussion is not intended and should not be construed as legal or professional tax advice sufficient for decision making. This summary does not discuss all aspects of Israeli income and capital gain taxation that may be applicable to investors in light of their particular circumstances or to investors who are subject to special status or treatment under Israeli tax law.
FOR THE FOREGOING AND OTHER REASONS, YOU ARE URGED TO CONSULT YOUR OWN TAX ADVISOR REGARDING THE TAX CONSEQUENCES OF YOUR HOLDINGS. WE ARE NOT MAKING ANY REPRESENTATIONS REGARDING THE PARTICULAR TAX CONSEQUENCES AS TO ANY HOLDER, NOR ARE WE OR OUR ADVISORS RENDERING ANY FORM OF LEGAL OPINION OR PROFESSIONAL TAX ADVICE AS TO SUCH TAX CONSEQUENCES.
Generally, income of Israeli companies is subject to corporate tax
. The Israeli corporate
tax rate since January 1, 2018 is 23%, compared with 24% in 2017 and 25% in 2016
Israeli Tax Consequences of Holding Our Stock
Non-Israeli residents
Non-Israeli residents are subject to tax on income accrued or derived from Israeli sources. These include, inter alia, dividends, royalties and interest, as well as other types of income (e.g., from provision of services in Israel). We are required to withhold income tax on any such payments we make to non-residents. Israel presently has no estate or gift tax.
Capital Gains
Israeli law generally imposes tax on capital gains derived from the sale of securities and other Israeli capital assets, including shares in Israeli resident companies, unless a specific exemption is available or a treaty between Israel and the country of the non-resident provides otherwise. Capital gains from sales of our ordinary shares will be tax exempt for non-Israeli residents provided certain conditions are met (one of these conditions is that the gains are not derived through a permanent establishment that the non-resident maintains in Israel).
Subject to the exemptions provided by the Israeli law, as described above, pursuant to the tax treaty between Israel and the U.S., or the Treaty, U.S. residents are generally exempt from Israeli capital gains tax on capital gain derived from the sale of our shares. This exemption does not apply to U.S. residents holding (at the time of the sale or in the preceding 12 months) 10% or more of the voting power in the Company.
85
Dividends
The
statutory withholding tax rate for dividends distributed by an Israeli company to non-resident shareholders
is
generally
25%. The rate is reduced to 15% for dividends distributed out of income generated by an Approved Enterprise. A different withholding tax rate may apply as a result of a tax treaty between Israel and shareholder’s country of residence.
Under the Treaty, the maximum Israeli tax rate on dividends paid to a corporate holder of our ordinary shares who is a U.S. resident is 25%. However, dividends paid to a U.S. corporation holding at least 10% of our voting power in the year of the sale and in the entire preceding tax year shall be subject to a 15% tax withholding rate, if the dividend is generated by an Approved Enterprise or 12.5% if the dividends are not generated by an Approved Enterprise.
Interest
Interest paid by us (e.g., on our convertible notes) is treated as income derived from an Israeli source and is subject to Israeli tax. Generally, interest payments are subject to withholding of a standard tax rate of 25% (the rate may be reduced to 15% for certain debt instruments), unless reduced pursuant to an applicable tax treaty. In some instances (e.g., where the recipient of the interest is an individual holding 10% or more of our shares or voting rights) a higher tax rate would apply.
Filing of Tax Returns in Israel
Non-Israeli residents who receive interest, dividend or royalty income derived or accrued in Israel, from which Israeli tax was withheld, are generally exempt from Israeli tax filing obligations, provided that: (i) such income was not derived from a business conducted in Israel, and (ii) the taxpayer has no other taxable sources of income in Israel with respect to which a tax return is required to be filed.
Israeli Residents
Capital Gains
Israeli law imposes capital gains tax on capital gains derived from the sale of securities and other capital assets, including ordinary shares. Generally, gains from sale of ordinary shares acquired prior to January 1, 2012 are subject to a 20% capital gains tax for individuals. The tax rate is increased to 25% for sale of shares by an individual shareholder holding 10% or more of the shares or voting power in the company (i.e., a substantial shareholder). Corporate shareholders are subject to a 25% capital gains tax rate.
Following enactment of the Tax Burden Law, starting January 1, 2012, the capital gains tax rate applicable to individuals upon the sale of our shares is such individual’s marginal (income) tax rate but not more than 25% (or 30% with respect to a substantial shareholder).
With respect to corporate investors,
the rate of
capital gains tax
imposed on the sale of shares is
equal to the corporate tax rate
, which was
25% in 2016, 24% in 2017 and 23% effective as of January 1, 2018.
Individual shareholders dealing with securities in Israel are taxed at their marginal tax rates applicable to business income (up to 48% in 2016 and up to 47% in 2017 and 2018).
In addition, as of January 1, 2013, shareholders that are individuals who have taxable income that exceeds ILS 800,000 in a tax year (linked to the CPI each year –ILS 803,520 in 2016), will be subject to an additional tax, referred to as High Income Tax, at the rate of 2% on their taxable income for such tax year which is in excess of such amount. Effective January 1, 2017, the High Income tax rate increased to 3% and its threshold was lowered to ILS 640,000 in 2017 to ILS 641,880 in 2018 and to ILS 649,560 in 2019. For this purpose taxable income will include taxable capital gains from the sale of our shares and taxable income from dividend distributions.
86
Dividends
Distribution of dividend income, other than bonus shares (stock dividends), to Israeli residents holding our ordinary shares is generally subject to income tax at a rate of 25% for individuals and 30% for a substantial individual shareholder. Israeli resident corporations are exempt from income tax on dividends, provided the dividend was paid out of income generated in Israel.
Generally, dividends distributed from taxable income accrued during the period of benefits of Approved Enterprise are taxable at a rate of 15% and dividends distributed from taxable income accrued during the period of benefits of a Benefitted Enterprise, are taxable at the rate of 15%, if the dividend is distributed during the tax benefit period, or within an additional 12 years after the lapse of that period.
Interest
Interest income is generally subject to a tax rate of up to 25% for individuals. The rate applicable to an individual who is substantial shareholder is the marginal tax rate. The rate may be reduced to 15% for certain debt instruments. Interest paid to Israeli companies is taxed at the standard corporate income tax rate applicable to companies. We may be required to withhold tax on interest payments up to the applicable corporate tax rate for companies, and in certain instances up to the marginal tax rate for individuals.
Tax Benefits under the Law for the Encouragement of Capital Investments, 1959
Tax Benefits prior to the Amendment of 2005
The Law for the Encouragement of Capital Investments, 1959
, or
Investments Law, provides that a capital investment in eligible facilities may, upon application to the Investment Center of the Ministry of Industry, Trade and Labor of the State of Israel, be designated as an “Approved Enterprise”.
An Approved Enterprise is eligible for tax benefits on taxable income derived from its approved enterprise programs. We have been granted “Approved Enterprise” status under the Investment Law for nine investment programs.
Tax Benefits under the 2005 Amendment
On April 1, 2005, a comprehensive amendment to the Investment Law came into effect, (the “Amendment”). The Amendment includes revisions to the criteria for investments qualified to receive tax benefits as an Approved Enterprise. The Amendment applies to new investment programs and investment programs commencing after 2004, and does not apply to investment programs approved prior to December 31, 2004.
As a result of the Amendment, it was no longer necessary for a company to apply to the Investment Center in order to acquire Approved Enterprise status. Instead, a company whose facilities meet the criteria for tax benefits set out by the Amendment, may receive the tax benefits afforded to a “Benefitted Enterprise” by independently selecting the tax year from which the period of benefits under the Investment Law are to commence and notifying the Israeli Tax Authority within 12 months of the end of that year.
Generally, tax benefits under the Amendment are available to production facilities (or other eligible facilities), that derive more than 25% of their business income from exports. In order to receive the tax benefits, the company must make a certain minimum investment in the acquisition of manufacturing assets such as machinery and equipment. Such investment may be made over a period of no more than three years ending at the end of the year in which the company requested to have the tax benefits apply to its Benefitted Enterprise.
87
We were eligible under the terms of minimum qualification investment and elected 2011 to have the tax benefits apply.
Tax benefits are available until the earlier of 7 or 10 years from the
date that the period of benefits
commenced, and the lapse of 12 years from the first day of the
year in which the election was made.
Our periods of benefits as a Benefitted Enterprise under the 2011 election will expire in 2023.
The tax benefits include exemption from corporate tax on undistributed income for a period of two to ten years, depending on the geographic location of the Benefitted Enterprise within Israel, and a reduced corporate tax rate of 10% to 25% for the remainder of the benefits period, depending on the level of foreign investment in the company. If the company pays a dividend out of income derived from the Benefited Enterprise during the tax exemption period, such income will be subject to corporate tax at the applicable rate (10%-25%) in respect of the grossed up amount of the dividend that we may distribute. We would be required to withhold tax at a rate of 15% from any dividends distributed from income derived from the Benefitted Enterprise.
Benefits under
the 2011 and 2016 Amendments
Under an amendment to the Investment Law effective January 1, 2011, upon an irrevocable election made by the company, a uniform corporate tax rate will apply to all qualifying income of the company, as opposed to the previous law’s tax incentives that were limited to income only from Benefitted Enterprises during their benefit period (Preferred Enterprise). Under the amended law, the uniform tax rate was 7% in geographical areas in Israel designated as Development Zone A and 12.5% elsewhere in Israel in 2013 The uniform tax rate from 2014 and onwards is set to 9% in areas in Israel designated as Development Zone A and 16% elsewhere in Israel.
A dividend distributed from income which is attributed to a Preferred Enterprise will be subject to withholding tax at the following rates: (i) Israeli resident corporation –0%, (ii) Israeli resident individual – 20% in 2014 and onwards (iii) non-Israeli resident - 20% in 2014 and onwards, subject to a reduced tax rate under the provisions of an applicable double tax treaty.
According to an Amendment from December 2016, a preferred enterprise located in development area A will be subject to a tax rate of 7.5% instead of 9% effective from January 1, 2017 and thereafter (the tax rate applicable to preferred enterprises located in other areas remains at 16%).
Under the transitory provisions of the January 1, 2011 legislation, we may opt whether to irrevocably implement the Amendment and waive benefits provided under the prior law or keep the prior benefits. This decision may be taken at any stage. We will consider in the future whether to opt for the benefits under the Amendment.
The December 2016 amendment also prescribes special tax tracks for technological enterprises. The new tax tracks under the amendment are as follows:
Technological preferred enterprise
- an enterprise whose total consolidated revenues (parent company and all subsidiaries) is less than NIS 10 billion. A technological preferred enterprise, as defined in the Law, which is located in the center of Israel will be subject to tax at a rate of 12% on profits deriving from intellectual property (in development area A - a tax rate of 7.5%).
Special technological preferred enterprise
- an enterprise whose total consolidated revenues (parent company and all subsidiaries) exceeds NIS 10 billion. Such enterprise will be subject to tax at a rate of 6% on profits deriving from intellectual property, regardless of the enterprise’s geographical location.
Any dividends distributed to “foreign companies”, as defined in the Law, deriving from income from the technological enterprises will be subject to tax at a rate of 4%.
88
Israeli Transfer Pricing Regulations
Israeli transfer pricing legislation generally provides that all cross-border transactions carried out between related parties be conducted on an arm’s length basis and be taxed accordingly. The transfer pricing regulations are not expected to have a material effect on our company.
United States Federal Income Taxation
The following is a general discussion of the material U.S. federal income tax consequences of the acquisition, ownership and disposition of our ordinary shares. This description addresses only the U.S. federal income tax considerations that may be relevant to U.S. Holders (as defined below) who hold our ordinary shares as capital assets. This summary is based on the U.S. Internal Revenue Code of 1986, as amended, (the "Code") Treasury regulations promulgated thereunder, judicial and administrative interpretations thereof, and the U.S.-Israel Tax Treaty, or the Treaty, all as in effect on the date hereof and all of which are subject to change either prospectively or retroactively or to differing interpretations. There can be no assurance that the U.S. Internal Revenue Service, or the IRS, will not take a different position concerning the tax consequences of the acquisition, ownership and disposition of our ordinary shares or that such a position would not be sustained. This discussion does not address all tax considerations that may be relevant with respect to an investment in our ordinary shares. In addition, this description does not account for the specific circumstances of any particular investor, such as:
| · |
broker-dealers;
|
| · |
financial institutions or financial services entities;
|
| · |
certain insurance companies;
|
| · |
investors liable for alternative minimum tax;
|
| · |
regulated investment companies,
real estate investment trusts, or grantor trusts;
|
| · |
dealers or traders in securities, commodities or currencies;
|
| · |
tax-exempt organizations;
|
| · |
retirement plans;
|
| · |
S corporations
|
| · |
pension funds;
|
| · |
certain former citizens or long-term residents of the United States;
|
| · |
non-resident aliens of the United States or taxpayers whose functional currency is not the U.S. dollar;
|
| · |
persons who hold ordinary shares through partnerships or other pass-through entities;
|
| · |
persons who acquire their ordinary shares through the exercise or cancellation of employee stock options or otherwise as compensation for services;
|
| · |
direct, indirect or constructive owners of
investors that actually or constructively own at least 10% of the total combined voting power of our shares or at least 10% of our shares by value; or
|
| · |
investors holding ordinary shares as part of a straddle, appreciated financial position, a hedging transaction or conversion transaction.
|
89
If a partnership or an entity treated as a partnership for U.S. federal income tax purposes owns our ordinary shares, the U.S. federal income tax treatment of a partner in such a partnership will generally depend upon the status of the partner and the activities of the partnership. A partnership that owns our ordinary shares and the partners in such partnership should consult their tax advisors about the U.S. federal income tax consequences of holding and disposing of ordinary shares.
This summary does not address the effect of any U.S. federal taxation (such as estate and gift tax) other than U.S. federal income taxation. In addition, this summary does not include any discussion of state, local or
non-U.S. taxation.
For purposes of this summary,
as used herein, the term “U.S. Holder” means a person that is eligible for the benefits of the Treaty and is a beneficial owner of an ordinary share who is, for U.S. federal income tax purposes:
| · |
an individual who is a citizen or a resident of the United States;
|
| · |
a corporation or other entity taxable as a corporation for United States federal income tax purposes, created or organized in or under the laws of the United States or any political subdivision thereof or the District of Columbia;
|
| · |
an estate the income of which is subject to U.S. federal income taxation regardless of its source; or
|
| · |
a trust if such trust has validly elected to be treated as a U.S. person for U.S. federal income tax purposes or if (1) a court within the United States is able to exercise primary supervision over its administration and (2) one or more U.S. persons have the authority to control all of the substantial decisions of such trust.
|
Unless otherwise indicated, it is assumed for the purposes of this discussion that the Company is not, and will not become, a “passive foreign investment company,” or a PFIC, for U.S. federal income tax purposes. See
“—Passive Foreign Investment Companies
” below.
Taxation of Distributions
Subject to the discussion below under the heading
“—Passive Foreign Investment Companies
,” the gross amount of any distributions received with respect to our ordinary shares, including the amount of any Israeli taxes withheld therefrom, will constitute dividends for U.S. federal income tax purposes when such distribution is actually or constructively received, to the extent such distribution is paid out of our current and accumulated earnings and profits, as determined for U.S. federal income tax purposes. Because we do not expect to maintain calculations of our earnings and profits under U.S. federal income tax principles, it is expected that the entire amount of any distribution will generally be reported as dividend income to you. Dividends are included in gross income as ordinary income unless such dividends meet the requirements of "qualified dividend income" as set forth in more detail below. Distributions in excess of our current and accumulated earnings and profits would be treated as a non-taxable return of capital to the extent of your adjusted tax basis in our ordinary shares and any amount in excess of your tax basis would be treated as gain from the sale of ordinary shares. See “
—Sale, Exchange or Other Disposition of Ordinary Shares
” below for a discussion of the taxation of capital gains. Our dividends would not qualify for the dividends-received deduction generally available to corporations under section 243 of the Code.
Dividends that we pay in NIS, including the amount of any Israeli taxes withheld therefrom, will be included in your income in a U.S. dollar amount calculated by reference to the exchange rate in effect on the day such dividends are received, regardless of whether the payment is in fact converted into U.S. dollars. A U.S. Holder who receives payment in NIS and converts NIS into U.S. dollars at an exchange rate other than the rate in effect on such day may have a foreign currency exchange gain or loss that would generally be treated as U.S.-source ordinary income or loss. U.S. Holders should consult their own tax advisors concerning the U.S. tax consequences of acquiring, holding and disposing of NIS.
90
Subject to complex limitations, some of which vary depending upon the U.S. Holder’s circumstances, any Israeli withholding tax imposed on dividends paid with respect to our ordinary shares, may be a foreign income tax eligible for credit against a U.S. Holder’s U.S. federal income tax liability (or, alternatively, for deduction against income in determining such tax liability). Israeli taxes withheld in excess of the applicable rate allowed by the Treaty (if any) will not be eligible for credit against a U.S. Holder’s federal income tax liability. The limitation on foreign income taxes eligible for credit is calculated separately with respect to specific classes of income. Dividends paid with respect to our common stock generally will be treated as foreign-source passive category income or, in the case of certain U.S. Holders, general category income for U.S. foreign tax credit purposes. Further, there are special rules for computing the foreign tax credit limitation of a taxpayer who receives dividends subject to a reduced tax rate. A U.S. Holder may be denied a foreign tax credit with respect to Israeli income tax withheld from dividends received on our ordinary shares if such U.S. Holder fails to satisfy certain minimum holding period requirements or to the extent such U.S. Holder’s position in ordinary shares is hedged. An election to deduct foreign taxes instead of claiming foreign tax credit applies to all foreign taxes paid or accrued in the taxable year. The rules relating to the determination of the foreign tax credit are complex, and you should consult with your own tax advisors to determine whether and to what extent you would be entitled to this credit.
Subject to certain limitations (possibly including the PFIC rules discussed below), “qualified dividend income” received by a non-corporate U.S. Holder may be subject to tax at the lower long-term capital gain rates (currently, a maximum rate of 20%). Distributions taxable as dividends paid on our ordinary shares should qualify for a reduced rate if we are a “qualified foreign corporation,” as defined in Code section 1(h)(11)(C). We will be a qualified foreign corporation if either: (i) we are entitled to benefits under the Treaty, or (ii) our ordinary shares are readily tradable on an established securities market in the United States and certain other requirements are met.
We believe that we are entitled to benefits under the Treaty and that our ordinary shares currently are readily tradable on an established securities market in the United States (see discussion below). However, no assurance can be given that our ordinary shares will remain readily tradable. The rate reduction does not apply unless certain holding period requirements are satisfied, nor does it apply to dividends received from a PFIC (see discussion below), in respect of certain risk-reduction transactions, or in certain other situations. U.S. Holders of our ordinary shares should consult their own tax advisors regarding the effect of these rules in their particular circumstances.
Sale, Exchange or Other Disposition of Ordinary Shares
Subject to the discussion of PFIC rules below,
if you sell or otherwise dispose of our ordinary shares (other than with respect to certain non-recognition transactions), you will generally recognize gain or loss for U.S. federal income tax purposes in an amount equal to the difference between the amount realized on the sale or other disposition and your adjusted tax basis in our ordinary shares, in each case determined in U.S. dollars. Such gain or loss will generally be capital gain or loss and will be long-term capital gain or loss if you have held the ordinary shares for more than one year at the time of the sale or other disposition. Long-term capital gain realized by a non-corporate U.S. Holder is generally eligible for a preferential tax rate (currently at a maximum of 20%). In general, any gain that you recognize on the sale or other disposition of ordinary shares will be U.S.-source for purposes of the foreign tax credit limitation; losses will generally be allocated against U.S. source income. Deduction of capital losses is subject to certain limitations under the Code.
In the case of a cash basis U.S. Holder who receives NIS in connection with the sale or disposition of our ordinary shares, the amount realized will be based on the U.S. dollar value of the NIS received with respect to the ordinary shares as determined on the settlement date of such exchange. A cash basis U.S. Holder who receives payment in NIS and converts NIS into U.S. dollars at a conversion rate other than the rate in effect on the settlement date may have a foreign currency exchange gain or loss, based on any appreciation or depreciation in the value of the foreign currency against the U.S. dollar, which would be treated as ordinary income or loss.
An accrual basis U.S. Holder may elect the same treatment required of cash basis taxpayers with respect to a sale or disposition of our ordinary shares that are traded on an established securities market, provided that the election is applied consistently from year to year. Such election may not be changed without the consent of the IRS. In the event that an accrual basis U.S. Holder does not elect to be treated as a cash basis taxpayer (pursuant to the Treasury regulations applicable to foreign currency transactions), such U.S. Holder is required to calculate the value of the proceeds as of the "trade date" and may have a foreign currency gain or loss for U.S. federal income tax purposes in the event of any difference between the U.S. dollar value of NIS prevailing on the trade date and on the settlement date. Any such currency gain or loss generally would be treated as U.S.- source ordinary income or loss and would be subject to tax in addition to the gain or loss, if any, recognized by such U.S. Holder on the sale or disposition of such ordinary shares.
91
Passive Foreign Investment Companies
We believe that we were not a PFIC for U.S. federal income tax purposes for the taxable year of 2018. However, since PFIC status depends upon the composition of our income and assets and the market value of our assets from time to time, there can be no assurance that our analysis prevails or that we will not be considered a PFIC for any future taxable year. If we were a PFIC for any taxable year during which a U.S. Holder owned ordinary shares, certain adverse consequences could apply to the U.S. Holder. Specifically, unless a U.S. Holder makes one of the elections mentioned below, gain recognized by the U.S. Holder on a sale or other disposition of ordinary shares would be allocated ratably over the U.S. Holder’s holding period for the ordinary shares. The amounts allocated to the taxable year of the sale or other disposition and to any year before we became a PFIC would be taxed as ordinary income. The amount allocated to each other taxable year would be subject to tax at the highest rate in effect for individuals or corporations, as appropriate, for that taxable year, and an interest charge would be imposed on the resulting tax liability. Further, any distribution in excess of 125% of the average of the annual distributions received by the U.S. Holder on our ordinary shares during the preceding three years or the U.S. Holder’s holding period, whichever is shorter, would be subject to taxation as described immediately above. Certain elections (such as a mark-to-market election or a QEF election) may be available to U.S. Holders and may result in alternative tax treatment. U.S. Holders should consult their tax advisors as to the availability and consequences of a mark-to-market election or a QEF election with respect to their ordinary shares.
In addition, if we were a PFIC for a taxable year in which we pay a dividend or the prior taxable year, the favorable dividend rates discussed above with respect to dividends paid to certain non-corporate U.S. Holders would not apply. If we were a PFIC for any taxable year in which a U.S. Holder owned our shares, the U.S. Holder would generally be required to file annual returns with the IRS on IRS Form 8621.
Additional Tax on Investment Income
In addition to the income taxes described above,
U.S. Holders that are individuals, estates or trusts and whose income exceeds certain thresholds may be subject to a 3.8% Medicare contribution tax on net investment income, which includes dividends and capital gains from the sale or exchange of our ordinary shares
.
Backup Withholding and Information Reporting
Payments in respect of our ordinary shares may be subject to information reporting to the IRS and to U.S. backup withholding tax at the rate (currently) of 24%.
Backup withholding will not apply, however, if you (i) fall within certain exempt categories, and demonstrate the fact when so required, or (ii) furnish a correct taxpayer identification number and make any other required certification.
Backup withholding is not an additional tax. Amounts withheld under the backup withholding rules may be credited against a U.S. Holder’s U.S. tax liability. Alternatively, a U.S. Holder may obtain a refund of any excess amounts withheld under the backup withholding rules by filing the appropriate claim for refund with the IRS.
U.S. citizens and individuals taxable as resident aliens of the United States that own “specified foreign financial assets” (as defined in Section 6038D of the Code and the regulations thereunder) with an aggregate value in a taxable year in excess of certain thresholds (as determined under rules in Treasury regulations) and that are required to file a U.S. federal income tax return generally will be required to file an information report with respect to those assets with their tax returns. IRS Form 8938 has been issued for that purpose. “Specified foreign financial assets” include any financial accounts maintained by foreign financial institutions, foreign stocks held directly, and interests in foreign estates, foreign pension plans or foreign deferred compensation plans. Under those rules, our ordinary shares, whether owned directly or through a financial institution, estate or pension or deferred compensation plan, would be “specified foreign financial assets.” Under Treasury regulations, the reporting obligation applies to certain U.S. entities that hold, directly or indirectly, specified foreign financial assets. Penalties can apply if there is a failure to satisfy this reporting obligation. In addition, in the event a U.S. Holder that is required to file IRS Form 8938 does not file such form, the statute of limitations on the assessment and collection of U.S. federal income taxes of such U.S. Holder for the related tax year may not close until three years after the date that the required information is filed. A U.S. Holder is urged to consult the U.S. Holder’s tax advisor regarding the reporting obligation.
92
Any U.S. Holder who acquires more than $100,000 of our ordinary shares or holds 10% or more in vote or value of our ordinary shares may be subject to certain additional U.S. information reporting requirements.
The above description is not intended to constitute a complete analysis of all tax consequences relating to acquisition, ownership and disposition of our ordinary shares. You should consult your tax advisor concerning the tax consequences of your particular situation.
| F. |
Dividend and Paying Agents
|
Not applicable.
| G. |
Statement by Experts
|
Not applicable.
| H. |
Documents on Display
|
We are subject to certain of the reporting requirements of the Securities and Exchange Act of 1934, as amended, or the Exchange Act, as applicable to “foreign private issuers” as defined in Rule 3b-4 under the Exchange Act. As a foreign private issuer, we are exempt from certain provisions of the Exchange Act. Accordingly, our proxy solicitations are not subject to the disclosure and procedural requirements of Regulation 14A under the Exchange Act, and transactions in our equity securities by our officers and directors are exempt from reporting and the “short-swing” profit recovery provisions contained in Section 16 of the Exchange Act. In addition, we are not required under the Exchange Act to file periodic reports and financial statements as frequently or as promptly as U.S. companies whose securities are registered under the Exchange Act. However, we file with the Securities and Exchange Commission an annual report on Form 20-F containing financial statements audited by an independent accounting firm. We also submit to the Securities and Exchange Commission reports on Form 6-K containing (among other things) press releases and unaudited financial information. We post our annual report on Form 20-F on our website (
http://www.gilat.com
) promptly following the filing of our annual report with the Securities and Exchange Commission. The information on our website is not incorporated by reference into this annual report.
This annual report and the exhibits thereto and any other document we file pursuant to the Exchange Act may be inspected without charge and copied at prescribed rates at the Securities and Exchange Commission public reference room at 100 F Street, N.E., Room 1580, Washington, D.C. 20549. You may obtain information on the operation of the Securities and Exchange Commission’s public reference room in Washington, D.C. by calling the Securities and Exchange Commission at 1-800-SEC-0330. The Exchange Act file number for our Securities and Exchange Commission filings is 000-21218.
The Securities and Exchange Commission maintains a website at
www.sec.gov
that contains reports, proxy and information statements, and other information regarding registrants that make electronic filings with the Securities and Exchange Commission using its EDGAR (Electronic Data Gathering, Analysis, and Retrieval) system.
The documents concerning our company that are referred to in this annual report may also be inspected at our offices located at
Gilat House, 21 Yegia Kapayim Street, Kiryat Arye, Petah Tikva, 4913020 Israel.
93
| I. |
Subsidiary Information
|
Not applicable.
Foreign Currency Risk
A significant portion of our revenues are generated in U.S. dollars or linked to the dollar. In addition, a substantial portion of our costs are incurred in U.S. dollars. We believe that the U.S. dollar is the primary currency of the economic environment in which our Company and certain of our subsidiaries operate. Thus, the functional and reporting currency of our Company and certain of our subsidiaries is the U.S. dollar.
Accordingly, monetary accounts maintained in currencies other than the U.S. dollar are remeasured into U.S. dollars in accordance with ASC 830, “Foreign Currency Matters” (“ASC 830”). All transaction gains and losses of the remeasurement of monetary balance sheet items are reflected in the consolidated statements of operations as financial income or expenses, as appropriate.
The financial statements of some of our foreign subsidiaries, whose functional currency has been determined to be their local currency, have been translated into U.S. dollars. Assets and liabilities
have been translated using the exchange rates in effect at the balance sheet date. Statements of operations amounts have been translated using specific rates. The resulting translation adjustments are reported as a component of equity in accumulated other comprehensive income (loss).
While a significant portion of our revenues and expenses are generated in U.S. dollars, a portion of our expenses are denominated in NIS,
and to a lesser extent, other non-U.S. dollar currencies
which lead us to be exposed to financial market risk associated with changes in foreign currency exchange rates. In order to reduce the impact of foreign currency rate volatility of future cash flows caused by changes in foreign exchange rates, in some cases we use currency forward contracts. If our currency forward contracts meet the definition of a hedge, and are so designated, changes in the fair value of the contracts will be offset against changes in the fair value of the hedged assets or liabilities through earnings. For derivative instruments not designated as hedging instruments, the gain or loss is recognized in current earnings during the period of change. Our hedging reduces, but does not eliminate, the impact of foreign currency rate movements, and due to such movements the results of our operations may be adversely affected.
The following sensitivity analysis illustrates the impact on our non-dollar net monetary liabilities assuming an instantaneous 10% change in foreign currency exchange rates from year-end levels, with all other variables held constant. At December 31, 2018, a 10% strengthening of the U.S. dollar versus other currencies would have resulted in a decrease of approximately $0.6 million in our net monetary liabilities, while a 10% weakening of the dollar versus all other currencies would have resulted in an increase of approximately $0.8 million in our net monetary liabilities.
During the year ended December 31, 2018, we recognized a net loss of $1.1 million related to the effective portion of our hedging instruments. The effective portion of the hedged instruments was included as an offset or addition to payroll expenses in the statement of operations. The ineffective portion of the hedged instrument during the year ended December 31, 2018 was immaterial and was recorded as financial expenses, net.
As of December 31, 2018, the fair value of the liabilities of the outstanding forward contracts that meet the requirement for hedge accounting was $0.3 million. There are no outstanding forward contracts that did not meet the requirement for hedge accounting.
94
Not applicable.
PART II
None
Not applicable.
Disclosure Controls and Procedures
Our chief executive officer and chief financial officer, after evaluating the effectiveness of our disclosure controls and procedures (as defined in Rule 13a-15(e) of the Securities Exchange Act of 1934, as amended) as of December 31, 2018, have concluded that, as of such date, our disclosure controls and procedures were effective and ensured that information required to be disclosed by us in reports that we file or submit under the Securities Exchange Act is accumulated and communicated to our management, including our chief executive officer and chief financial officer, to allow timely decisions regarding required disclosure and is recorded, processed, summarized and reported within the time periods specified by the rules of the Securities and Exchange Commission.
Management’s Annual Report on Internal Control over Financial Reporting
Our management is responsible for establishing and maintaining adequate internal control over our financial reporting. Internal control over financial reporting is defined in Rule 13a-15(f) or 15d-15(f) promulgated under the Securities Exchange Act of 1934 as a process designed by, or under the supervision of, the company’s principal executive and principal financial officers and effected by the company’s board of directors, management and other personnel, to provide reasonable assurance regarding the reliability of financial reporting and the preparation of financial statements for external purposes in accordance with generally accepted accounting principles and includes those policies and procedures that:
| · |
Pertain to the maintenance of records that in reasonable detail accurately and fairly reflect the transaction and dispositions of the assets of the company;
|
| · |
Provide reasonable assurance that transactions are recorded as necessary to permit preparation of financial statements in accordance with generally accepted accounting principles, and that receipts and expenditures of the company are being made only in accordance with authorizations of management and directors of the company; and
|
| · |
Provide reasonable assurance regarding prevention or timely detection of unauthorized acquisition, use of disposition of the company’s assets that could have a material effect on the financial statements.
|
Because of its inherent limitations, internal control over financial reporting may not prevent or detect misstatements. Projections of any evaluation of effectiveness for future periods are subject to the risk that controls may become inadequate because of changes in conditions, or that the degree of compliance with the policies or procedures may deteriorate.
95
Our management assessed the effectiveness of our internal control over financial reporting, as of December 31, 2018. In making this assessment, our management used the criteria set forth by the Committee of Sponsoring Organizations of the Treadway Commission (COSO) in Internal Control-Integrated Framework. Based on that assessment, our management concluded that as of December 31, 2018, our internal control over financial reporting is effective.
The effectiveness of management’s internal control over financial reporting as of December 31, 2018 has been audited by our company’s independent registered public accountants, Kost Forer Gabbay & Kasierer, a member of Ernst & Young Global. The report, which expresses an unqualified opinion on our company’s internal control over financial reporting, is included with our consolidated financial statements included elsewhere in this annual report.
Changes in Internal Control over Financial Reporting
During the period covered by this Annual Report on Form 20-F, no changes in our internal control over financial reporting have occurred that materially affected, or are reasonably likely to materially affect, our internal control over financial reporting.
Our Board of Directors has determined that each of Ms. Cohen and
Mr. Shkedy
meets the definition of an audit committee financial expert as defined
by rules of the Securities and Exchange Commission. Our Board also determined that each of Ms. Cohen and Mr. Shkedy is independent under the requirements of the NASDAQ Marketplace Rules. For a brief listing of
Ms. Cohen and Mr. Shkedy’s
relevant experience, see Item 6.A. “Directors, Senior Management and Employees - Directors and Senior Management.”
We have adopted a Code of Ethics for executive and financial officers that also applies to all of our employees. The Code of Ethics is publicly available on our website at www.gilat.com. Written copies are available upon request. If we make any substantive amendments to the Code of Ethics or grant any waivers, including any implicit waiver, from a provision of this code to our chief executive officer, chief financial officer or corporate controller, we will disclose the nature of such amendment or waiver on our website. Our Code of Ethics includes a whistleblower policy which provides an anonymous means for employees to communicate with various bodies within our company, including our Audit Committee.
Fees Billed
or Expected to be Billed by Independent Auditors
The following table sets forth, for each of the years indicated, the fees billed or expected to be billed to us by our independent auditors
and the percentage of each of the fees out of the total amount billed or expected to be billed by the auditors.
|
Year Ended December 31,
|
||||||||||||||||
|
2018
|
2017
|
|||||||||||||||
|
Services Rendered
|
Fees
(in thousands)
|
Percentages
|
Fees
(in thousands)
|
Percentages
|
||||||||||||
|
Audit
fees
(1)
|
$
|
670
|
79.48
|
%
|
$
|
691
|
88.57
|
%
|
||||||||
|
Tax
fees
(2)
|
$
|
75
|
8.90
|
%
|
$
|
38
|
4.93
|
%
|
||||||||
|
Other (3)
|
$
|
98
|
11.62
|
%
|
$
|
51
|
6.50
|
%
|
||||||||
|
Total
|
$
|
843
|
100
|
%
|
$
|
780
|
100
|
%
|
||||||||
| (1) |
Audit fees are fees for audit services for each of the years shown in this table, including fees associated with the annual audit, services provided in connection with audit of our internal control over financial reporting and audit services provided in connection with other statutory or regulatory filings.
|
96
| (2) |
Tax fees are fees for professional services rendered by our auditors for tax compliance, tax planning and tax advice on actual or contemplated transactions.
|
| (3) |
Other fees are fees for professional services other than audit or tax related fees, rendered in connection with our business activities; such fees in 2018 were mainly related to implementation of new accounting systems and in 2017 were mainly related to implementation of new accounting standards.
|
Policies and Procedures
Our Audit Committee has adopted a policy and procedures for the approval of all audit and non-audit services rendered by our principal accountants, Kost Forer Gabbay & Kasierer, a Member of Ernst & Young Global and other members of Ernst & Young Global. The policy generally requires the Audit Committee’s approval of the scope of the engagement of our principal accountants
or on an individual engagement basis.
Not applicable.
In the year ended December 31, 2018,
neither we nor any affiliated purchaser purchased
any of our securities.
None.
Under NASDAQ Marketplace
Rule 5615(a)(3)
or Rule
5615(a)(3)
, foreign private issuers, such as our company, are permitted to follow certain home country corporate governance practices in lieu of certain requirements of Listing Rule 5600 Series, with the exception of those rules which are required to be followed pursuant to the provisions of Listing Rule 5615(a)(3).
We have elected to follow
Israeli law and practice instead of the requirements of Listing Rule 5600 Series, as described below:
| · |
The requirement to obtain shareholder approval for the establishment or material amendment of certain equity based compensation plans and arrangements, under which shares may be acquired by officers, directors, employees or consultants. Under Israeli law and practice, the approval of the board of directors is required for the establishment or material amendment of such equity based compensation plans and arrangements. However, any equity based compensation arrangement with a director or the Chief Executive Officer or the material amendment of such an arrangement must be approved by our Compensation Committee, Board of Directors and shareholders, in that order.
|
| · |
The requirements regarding the director nominations process. We do not have a nomination committee. Under Israeli law and practice, our Board of Directors is authorized to recommend to our shareholders director nominees for election, and certain of our shareholders may nominate candidates for election as directors by the general meeting of shareholders.
|
97
Not applicable.
Not applicable.
The financial statements required by this item are found at the end of this annual report, beginning on page F-1.
|
1.1
|
Memorandum of Association, as amended. Previously filed as Exhibit 1.1 to our Annual Report on Form 20-F for the fiscal year ending December 31, 2000, which Exhibit is incorporated herein by reference.
|
98
99
100
| 101.INS |
XBRL Instance Document *.
|
| 101.SCH |
XBRL Taxonomy Extension Schema Document.
|
| 101.PRE |
XBRL Taxonomy Presentation Linkbase Document.
|
| 101.CAL |
XBRL Taxonomy Calculation Linkbase Document.
|
| 101.LAB |
XBRL Taxonomy Label Linkbase Document.
|
| 101.DEF |
XBRL Taxonomy Extension Definition Linkbase Document.
|
___________________
| * |
Pursuant to Rule 406T of Regulation S-T, these interactive data files are deemed not filed or part of a registration statement or prospectus for purposes of Sections 11 or 12 of the Securities Act of 1933, as amended, are deemed not filed for the purposes of Section 18 of the Securities and Exchange Act of 1934, as amended, and otherwise are not subject to liability under those sections.
|
101
The registrant hereby certifies that it meets all of the requirements for filing on Form 20-F and that it has duly caused and authorized the undersigned to sign this annual report on its behalf.
|
|
GILAT SATELLITE NETWORKS LTD.
By:
/s/ Yona Ovadia
Yona Ovadia
Chief Executive Officer
|
Date: March 18, 2019
102
GILAT SATELLITE NETWORKS LTD. AND ITS SUBSIDIARIES
CONSOLIDATED FINANCIAL STATEMENTS
AS OF DECEMBER 31, 2018
IN U.S. DOLLARS
INDEX
|
Page
|
|
|
F-2 - F-4
|
|
|
F-5 - F-6
|
|
|
F-7
|
|
|
F-8
|
|
|
F-9
|
|
|
F-10 - F-11
|
|
|
F-12 - F-55
|

|
Kost Forer Gabbay & Kasierer
144 Menachem Begin Road, Building A,
Tel-Aviv 6492102, Israel
|
Tel: +972-3-6232525
Fax: +972-3-5622555
ey.com
|
To the Shareholders and Board of Directors of
GILAT SATELLITE NETWORKS LTD.
Opinion on the Financial Statements
We have audited the accompanying consolidated balance sheets of Gilat Satellite Networks Ltd. ("the Company") and its subsidiaries as of December 31, 2018 and 2017, the related consolidated statements of comprehensive income (loss),
shareholders' equity and cash flows for each of the three years in the period ended December 31, 2018, and the related notes
(collectively referred to as the "consolidated
financial statements"). In our opinion, the consolidated financial statements present fairly, in all material respects, the financial position of the Company at December 31, 2018 and 2017, and the results of its operations and its cash flows for each of the three years in the period ended December 31, 2018, in conformity with U.S. generally accepted accounting principles.
We also have audited, in accordance with the standards of the Public Company Accounting Oversight Board (United States) (PCAOB), the Company's internal control over financial reporting as of December 31, 2018, based on criteria established in Internal Control-Integrated Framework issued by the Committee of Sponsoring Organizations of the Treadway Commission (2013 framework) and our report dated March 18, 2019 expressed an unqualified opinion thereon.
Basis for Opinion
These financial statements are the responsibility of the Company's management. Our responsibility is to express an opinion on the Company's financial statements based on our audits. We are a public accounting firm registered with the PCAOB and are required to be independent with respect to the Company in accordance with the U.S. federal securities laws and the applicable rules and regulations of the Securities and Exchange Commission and the PCAOB.
We conducted our audits in accordance with the standards of the PCAOB. Those standards require that we plan and perform the audit to obtain reasonable assurance about whether the financial statements are free of material misstatement, whether due to error or fraud. Our audits included performing procedures to assess the risks of material misstatement of the financial statements, whether due to error or fraud, and performing procedures that respond to those risks. Such procedures included examining, on a test basis, evidence regarding the amounts and disclosures in the financial statements. Our audits also included evaluating the accounting principles used and significant estimates made by management, as well as evaluating the overall presentation of the financial statements. We believe that our audits provide a reasonable basis for our opinion.
/s/ KOST FORER GABBAY & KASIERER
A Member of Ernst & Young Global
We have served as the Company's auditor since 2000.
Tel-Aviv, Israel
March 18 , 2019
F - 2
|
|
Kost Forer Gabbay & Kasierer
144 Menachem Begin Road, Building A,
Tel-Aviv 6492102, Israel
|
Tel: +972-3-6232525
Fax: +972-3-5622555
ey.com
|
Report of Independent Registered Public Accounting Firm
To the Shareholders and Board of Directors of
Gilat Satellite Networks Ltd.
Opinion on Internal Control over Financial Reporting
We have audited Gilat Satellite Networks Ltd. ("the Company") and its subsidiaries' internal control over financial reporting as of December 31, 2018, based on criteria established in Internal Control-Integrated Framework issued by the Committee of Sponsoring Organizations of the Treadway Commission (2013 framework), (the COSO criteria). In our opinion, the Company and its subsidiaries maintained, in all material respects, effective internal control over financial reporting as of December 31, 2018, based on the COSO criteria.
We also have audited, in accordance with the standards of the Public Company Accounting Oversight Board (United States) (PCAOB), the consolidated balance sheets of the Company as of December 31, 2018 and 2017, the related consolidated statements of comprehensive income (loss),
shareholders' equity and cash flows for each of the three years in the period ended December 31, 2018, and the related notes, and our report dated March 18, 2019 expressed an unqualified opinion thereon.
Basis for Opinion
The Company's management is responsible for maintaining effective internal control over financial reporting and for its assessment of the effectiveness of internal control over financial reporting included in the accompanying Management's Annual Report on Internal Control over Financial Reporting. Our responsibility is to express an opinion on the Company's internal control over financial reporting based on our audit. We are a public accounting firm registered with the PCAOB and are required to be independent with respect to the Company in accordance with the U.S. federal securities laws and the applicable rules and regulations of the Securities and Exchange Commission and the PCAOB.
We conducted our audit in accordance with the standards of the PCAOB. Those standards require that we plan and perform the audit to obtain reasonable assurance about whether effective internal control over financial reporting was maintained in all material respects.
Our audit included obtaining an understanding of internal control over financial reporting, assessing the risk that a material weakness exists, testing and evaluating the design and operating effectiveness of internal control based on the assessed risk, and performing such other procedures as we considered necessary in the circumstances. We believe that our audit provides a reasonable basis for our opinion.
F - 3
|
|
Kost Forer Gabbay & Kasierer
144 Menachem Begin Road, Building A,
Tel-Aviv 6492102, Israel
|
Tel: +972-3-6232525
Fax: +972-3-5622555
ey.com
|
Definition and Limitations of Internal Control Over Financial Reporting
A company's internal control over financial reporting is a process designed to provide reasonable assurance regarding the reliability of financial reporting and the preparation of financial statements for external purposes in accordance with generally accepted accounting principles. A company's internal control over financial reporting includes those policies and procedures that (1) pertain to the maintenance of records that, in reasonable detail, accurately and fairly reflect the transactions and dispositions of the assets of the company; (2) provide reasonable assurance that transactions are recorded as necessary to permit preparation of financial statements in accordance with generally accepted accounting principles, and that receipts and expenditures of the company are being made only in accordance with authorizations of management and directors of the company; and (3) provide reasonable assurance regarding prevention or timely detection of unauthorized acquisition, use, or disposition of the company's assets that could have a material effect on the financial statements.
Because of its inherent limitations, internal control over financial reporting may not prevent or detect misstatements. Also, projections of any evaluation of effectiveness to future periods are subject to the risk that controls may become inadequate because of changes in conditions, or that the degree of compliance with the policies or procedures may deteriorate.
/s/ KOST FORER GABBAY & KASIERER
A Member of Ernst & Young Global
Tel-Aviv, Israel
March 18 2019
F - 4
GILAT SATELLITE NETWORKS LTD.
AND ITS SUBSIDIARIES
U.S. dollars in thousands
|
December 31,
|
||||||||
|
2018
|
2017
|
|||||||
|
ASSETS
|
||||||||
|
CURRENT ASSETS:
|
||||||||
|
Cash and cash equivalents
|
$
|
67,381
|
$
|
52,957
|
||||
|
Restricted cash
|
32,305
|
29,288
|
||||||
|
Restricted cash held by trustees
|
4,372
|
4,325
|
||||||
|
Trade receivables, net
|
47,164
|
50,053
|
||||||
|
Contract assets
|
47,760
|
58,789
|
||||||
|
Inventories
|
21,109
|
28,853
|
||||||
|
Other current assets
|
26,022
|
19,415
|
||||||
|
Total
current assets
|
246,113
|
243,680
|
||||||
|
LONG-TERM ASSETS:
|
||||||||
|
Restricted cash
|
146
|
187
|
||||||
|
Severance pay funds
|
6,780
|
8,188
|
||||||
|
Deferred tax asset
|
4,127
|
861
|
||||||
|
Other receivables
|
7,276
|
7,217
|
||||||
|
Total
long-term assets
|
18,329
|
16,453
|
||||||
|
PROPERTY AND EQUIPMENT, NET
|
84,403
|
82,246
|
||||||
|
INTANGIBLE ASSETS, NET
|
2,434
|
5,709
|
||||||
|
GOODWILL
|
43,468
|
43,468
|
||||||
|
Total
assets
|
$
|
394,747
|
$
|
391,556
|
||||
The accompanying notes are an integral part of the consolidated financial statements.
F - 5
GILAT SATELLITE NETWORKS LTD.
AND ITS SUBSIDIARIES
CONSOLIDATED BALANCE SHEETS
U.S. dollars in thousands (except share and per share data)
|
December 31,
|
||||||||
|
2018
|
2017
|
|||||||
|
LIABILITIES AND SHAREHOLDERS' EQUITY
|
||||||||
|
CURRENT LIABILITIES:
|
||||||||
|
Current maturities of long-term loans
|
$
|
4,458
|
$
|
4,479
|
||||
|
Trade payables
|
24,636
|
33,715
|
||||||
|
Accrued expenses
|
67,533
|
75,270
|
||||||
|
Advances from customers and deferred revenues
|
29,133
|
16,721
|
||||||
|
Advances from customers held by trustees
|
-
|
1,416
|
||||||
|
Other current liabilities
|
14,588
|
20,044
|
||||||
|
Total
current liabilities
|
140,348
|
151,645
|
||||||
|
LONG-TERM LIABILITIES:
|
||||||||
|
Loans, net of current maturities
|
8,098
|
12,582
|
||||||
|
Accrued severance pay
|
6,649
|
7,999
|
||||||
|
Other liabilities
|
580
|
1,008
|
||||||
|
Total
long-term liabilities
|
15,327
|
21,589
|
||||||
|
COMMITMENTS AND CONTINGENCIES
|
||||||||
|
SHAREHOLDERS' EQUITY:
|
||||||||
|
Share capital -
Ordinary shares of NIS 0.2 par value: Authorized: 90,000,000 shares at December 31, 2018 and 2017; Issued and outstanding: 55,176,107 and 54,737,267 shares at December 31, 2018 and 2017, respectively
|
2,625
|
2,601
|
||||||
|
Additional paid-in capital
|
924,856
|
921,726
|
||||||
|
Accumulated other comprehensive loss
|
(5,380
|
)
|
(3,046
|
)
|
||||
|
Accumulated deficit
|
(683,029
|
)
|
(702,959
|
)
|
||||
|
Total
shareholders' equity
|
239,072
|
218,322
|
||||||
|
Total
liabilities and shareholders' equity
|
$
|
394,747
|
$
|
391,556
|
||||
The accompanying notes are an integral part of the consolidated financial statements.
F - 6
GILAT SATELLITE NETWORKS LTD.
AND ITS SUBSIDIARIES
U.S. dollars in thousands (except share and per share data)
|
Year ended
December 31,
|
||||||||||||
|
2018
|
2017
|
2016
|
||||||||||
|
Revenues:
|
||||||||||||
|
Products
|
$
|
173,966
|
$
|
214,522
|
$
|
214,291
|
||||||
|
Services
|
92,425
|
68,234
|
65,260
|
|||||||||
|
Total
revenues
|
266,391
|
282,756
|
279,551
|
|||||||||
|
Cost of revenues:
|
||||||||||||
|
Products
|
121,147
|
153,167
|
162,563
|
|||||||||
|
Services
|
51,207
|
47,094
|
41,498
|
|||||||||
|
Total
cost of revenues
|
172,354
|
200,261
|
204,061
|
|||||||||
|
Gross profit
|
94,037
|
82,495
|
75,490
|
|||||||||
|
Operating expenses:
|
||||||||||||
|
Research and development, net
|
33,023
|
28,014
|
24,853
|
|||||||||
|
Selling and marketing
|
22,706
|
23,759
|
23,411
|
|||||||||
|
General and administrative
|
17,024
|
19,861
|
26,471
|
|||||||||
|
Total
operating expenses
|
72,753
|
71,634
|
74,735
|
|||||||||
|
Operating income
|
21,284
|
10,861
|
755
|
|||||||||
|
Financial expenses, net
|
4,298
|
4,307
|
4,843
|
|||||||||
|
Net income (loss) before taxes on income
|
16,986
|
6,554
|
(4,088
|
)
|
||||||||
|
Taxes on income (tax benefit)
|
(1,423
|
)
|
(247
|
)
|
1,252
|
|||||||
|
Net income (loss)
|
$
|
18,409
|
$
|
6,801
|
$
|
(5,340
|
)
|
|||||
|
Total
earnings (loss) per share:
|
||||||||||||
|
Basic
|
$
|
0.34
|
$
|
0.12
|
$
|
(0.10
|
)
|
|||||
|
Diluted
|
$
|
0.33
|
$
|
0.12
|
$
|
(0.10
|
)
|
|||||
|
Weighted average number of shares used in computing earnings (loss) per share:
|
||||||||||||
|
Basic
|
54,927,272
|
54,680,822
|
51,970,458
|
|||||||||
|
Diluted
|
55,752,642
|
54,851,967
|
51,970,458
|
|||||||||
The accompanying notes are an integral part of the consolidated financial statements.
F - 7
GILAT SATELLITE NETWORKS LTD.
AND ITS SUBSIDIARIES
U.S. dollars in thousands
|
Year ended
December 31,
|
||||||||||||
|
2018
|
2017
|
2016
|
||||||||||
|
Net income (loss)
|
$
|
18,409
|
$
|
6,801
|
$
|
(5,340
|
)
|
|||||
|
Other comprehensive income (loss):
|
||||||||||||
|
Foreign currency translation adjustments
|
(1,845
|
)
|
(95
|
)
|
514
|
|||||||
|
Change in unrealized gain (loss) on hedging instruments, net
|
(1,548
|
)
|
1,419
|
396
|
||||||||
|
Less - reclassification adjustments for net loss (gain) realized and included in income (loss) on hedging instruments, net
|
1,059
|
(1,146
|
)
|
(407
|
)
|
|||||||
|
Total other comprehensive income (loss)
|
(2,334
|
)
|
178
|
503
|
||||||||
|
Comprehensive income (loss)
|
$
|
16,075
|
$
|
6,979
|
$
|
(4,837
|
)
|
|||||
The accompanying notes are an integral part of the consolidated financial statements.
F - 8
GILAT SATELLITE NETWORKS LTD.
AND ITS SUBSIDIARIES
U.S. dollars in thousands (except share data)
|
Number of
Ordinary shares
|
Share
capital
|
Additional
paid-in
capital
|
Accumulated
other
comprehensive
income (loss)
|
Accumulated
deficit
|
Total
shareholders' equity
|
|||||||||||||||||||
|
Balance as of January 1, 2016
|
44,333,047
|
$
|
2,048
|
$
|
884,126
|
$
|
(3,727
|
)
|
$
|
(704,365
|
)
|
$
|
178,082
|
|||||||||||
|
Issuance of shares in a rights offering, net of issuance costs
|
9,874,170
|
525
|
34,560
|
-
|
-
|
35,085
|
||||||||||||||||||
|
Issuance of restricted share units (RSUs)
|
214,350
|
11
|
-
|
-
|
-
|
11
|
||||||||||||||||||
|
Stock-based compensation of options and RSUs
|
-
|
-
|
908
|
-
|
-
|
908
|
||||||||||||||||||
|
Exercise of stock options
|
171,100
|
9
|
568
|
-
|
-
|
577
|
||||||||||||||||||
|
Comprehensive income (loss)
|
-
|
-
|
-
|
503
|
(5,340
|
)
|
(4,837
|
)
|
||||||||||||||||
|
Balance as of December 31, 2016
|
54,592,667
|
2,593
|
920,162
|
(3,224
|
)
|
(709,705
|
)
|
209,826
|
||||||||||||||||
|
Effect of adoption of ASU 2016-09
|
-
|
-
|
55
|
-
|
(55
|
)
|
-
|
|||||||||||||||||
|
Issuance of restricted share units (RSUs)
|
8,100
|
*
|
)
|
-
|
-
|
-
|
*
|
)
|
||||||||||||||||
|
Stock-based compensation of options and RSUs
|
-
|
-
|
856
|
-
|
-
|
856
|
||||||||||||||||||
|
Exercise of stock options
|
136,500
|
8
|
653
|
-
|
-
|
661
|
||||||||||||||||||
|
Comprehensive income
|
-
|
-
|
-
|
178
|
6,801
|
6,979
|
||||||||||||||||||
|
Balance as of December 31, 2017
|
54,737,267
|
2,601
|
921,726
|
(3,046
|
)
|
(702,959
|
)
|
218,322
|
||||||||||||||||
|
Effect of adoption of ASC 606
|
-
|
-
|
-
|
-
|
1,521
|
1,521
|
||||||||||||||||||
|
Stock-based compensation of options
|
-
|
-
|
1,006
|
-
|
-
|
1,006
|
||||||||||||||||||
|
Exercise of stock options
|
438,840
|
24
|
2,124
|
-
|
-
|
2,148
|
||||||||||||||||||
|
Comprehensive income (loss)
|
-
|
-
|
-
|
(2,334
|
)
|
18,409
|
16,075
|
|||||||||||||||||
|
Balance as of December 31, 2018
|
55,176,107
|
$
|
2,625
|
$
|
924,856
|
$
|
(5,380
|
)
|
$
|
(683,029
|
)
|
$
|
239,072
|
|||||||||||
*)
Represents an amount lower than $ 1.
The accompanying notes are an integral part of the consolidated financial statements.
F - 9
GILAT SATELLITE NETWORKS LTD.
AND ITS SUBSIDIARIES
U.S. dollars in thousands
|
Year ended
December 31,
|
||||||||||||
|
2018
|
2017
|
2016
|
||||||||||
|
Cash flows from operating activities:
|
||||||||||||
|
Net income (loss)
|
$
|
18,409
|
$
|
6,801
|
$
|
(5,340
|
)
|
|||||
|
Adjustments required to reconcile net income (loss) to net cash provided by (used in) operating activities:
|
||||||||||||
|
Depreciation and amortization
|
13,149
|
13,140
|
13,108
|
|||||||||
|
Capital loss (gain) from disposal of property and equipment
|
275
|
245
|
(88
|
)
|
||||||||
|
Stock-based compensation of options and RSUs
|
1,006
|
856
|
908
|
|||||||||
|
Accrued severance pay, net
|
57
|
118
|
(267
|
)
|
||||||||
|
Exchange rate differences on long-term loans
|
(34
|
)
|
186
|
(43
|
)
|
|||||||
|
Deferred income taxes, net
|
(3,672
|
)
|
189
|
4
|
||||||||
|
Decrease (increase) in trade receivables, net
|
2,061
|
(2,512
|
)
|
4,127
|
||||||||
|
Decrease (increase) in contract assets
|
11,029
|
(17,076
|
)
|
(41,713
|
)
|
|||||||
|
Increase in other assets and receivables
|
(4,917
|
)
|
(9,147
|
)
|
(2,966
|
)
|
||||||
|
Decrease (increase) in inventories
|
5,743
|
(10,763
|
)
|
2,221
|
||||||||
|
Increase (decrease) in trade payables
|
(8,926
|
)
|
4,087
|
12,454
|
||||||||
|
Increase (decrease) in accrued expenses
|
(7,206
|
)
|
19,633
|
30,149
|
||||||||
|
Increase (decrease) in advances from customers and deferred revenues
|
12,433
|
(20,858
|
)
|
(50,008
|
)
|
|||||||
|
Decrease in advances from customers held by trustees
|
(1,478
|
)
|
(6,185
|
)
|
(18
|
)
|
||||||
|
Increase (decrease) in other liabilities
|
(5,912
|
)
|
4,063
|
593
|
||||||||
|
Net cash provided by (used in) operating activities
|
32,017
|
(17,223
|
)
|
(36,879
|
)
|
|||||||
The accompanying notes are an integral part of the consolidated financial statements.
F - 10
GILAT SATELLITE NETWORKS LTD.
AND ITS SUBSIDIARIES
CONSOLIDATED STATEMENTS OF CASH FLOWS
U.S. dollars in thousands
|
Year ended
December 31,
|
||||||||||||
|
2018
|
2017
|
2016
|
||||||||||
|
Cash flows from investing activities:
|
||||||||||||
|
Purchase of property and equipment
|
(10,759
|
)
|
(3,692
|
)
|
(4,307
|
)
|
||||||
|
Net cash used in investing activities
|
(10,759
|
)
|
(3,692
|
)
|
(4,307
|
)
|
||||||
|
Cash flows from financing activities:
|
||||||||||||
|
Capital lease payments
|
-
|
-
|
(309
|
)
|
||||||||
|
Issuance of shares in a rights offering, net of issuance costs
|
-
|
-
|
35,085
|
|||||||||
|
Proceeds from exercise of stock option and restricted stock units
|
2,149
|
661
|
588
|
|||||||||
|
Short-term bank credit and loans, net
|
-
|
-
|
(7,000
|
)
|
||||||||
|
Repayment of long-term loans
|
(4,470
|
)
|
(4,673
|
)
|
(4,443
|
)
|
||||||
|
Net cash provided by (used in) financing activities
|
(2,321
|
)
|
(4,012
|
)
|
23,921
|
|||||||
|
Effect of exchange rate changes on cash, cash equivalents and restricted cash
|
(1,490
|
)
|
51
|
981
|
||||||||
|
Increase (decrease) in cash, cash equivalents and restricted cash
|
17,447
|
(24,876
|
)
|
(16,284
|
)
|
|||||||
|
Cash, cash equivalents and restricted cash at the beginning of the year
|
86,757
|
111,633
|
127,917
|
|||||||||
|
Cash, cash equivalents and restricted cash at the end of the year
|
$
|
104,204
|
$
|
86,757
|
$
|
111,633
|
||||||
|
Supplementary disclosure of cash flows activities:
|
||||||||||||
|
(1)
Cash paid during the year for:
|
||||||||||||
|
Interest
|
$
|
303
|
$
|
906
|
$
|
1,448
|
||||||
|
Income taxes
|
$
|
3,900
|
$
|
2,410
|
$
|
2,105
|
||||||
|
(2)
Non-cash transactions:
|
||||||||||||
|
Purchases of property and equipment that were not paid for and reclassification from inventories to property and equipment
|
$
|
2,307
|
$
|
5,710
|
$
|
2,452
|
||||||
|
Reclassification from property and equipment to inventories
|
$
|
343
|
$
|
129
|
$
|
733
|
||||||
The accompanying notes are an integral part of the consolidated financial statements.
F - 11
GILAT SATELLITE NETWORKS LTD
.
AND ITS SUBSIDIARIES
U.S. dollars in thousands
| NOTE 1: - |
GENERAL
|
| a. |
Organization:
|
Gilat Satellite Networks Ltd. and its subsidiaries (the “Company”) is a global provider of satellite-based broadband communications. The Company designs and manufactures ground-based satellite communications equipment, and provides comprehensive solutions and end-to-end services, powered by its technology. The Company’s portfolio comprises a cloud based satellite network platform, very small aperture terminals ("VSATs"), amplifiers, high-speed modems, on-the-move antennas and high power solid-state power amplifiers ("SSPAs") and block up converters (“BUCs”). The Company’s solutions support multiple applications with a full portfolio of products to address key applications including broadband access, cellular backhaul, enterprise, in-flight connectivity, maritime, trains, defense and public safety. The Company also provides connectivity services, internet access and telephony, to enterprise, government and residential customers utilizing both its own networks, and also other networks that it installs, mainly based on Build Operate Transfer (“BOT”) contracts. The Company also provides managed network services over VSAT networks owned by others.
The Company was incorporated in Israel in 1987 and launched its first generation VSAT in 1989.
Through December 31, 2017, the Company’s business was managed and reported in three business segments: Commercial, Mobility and Services. Commencing January 1, 2018, in order to more accurately reflect management focus, organizational alignment, the Company’s customer base and end markets, the Company operates in three new business segments consisting of Fixed Networks, Mobility and Terrestrial Infrastructure Projects. See Note 13 for additional information.
| b. |
The Company depends on a major suppliers to supply certain components and services for the production of its products or providing services. If these suppliers fail to deliver or delay the delivery of the necessary components or services, the Company will be required to seek alternative sources of supply. A change in suppliers could result in manufacturing delays or services delays which could cause a possible loss of sales and additional incremental costs and, consequently, could adversely affect the Company's results of operations and financial position.
|
F - 12
GILAT SATELLITE NETWORKS LTD
.
AND ITS SUBSIDIARIES
NOTES TO CONSOLIDATED FINANCIAL STATEMENTS
U.S. dollars in thousands
NOTE 2: -
SIGNIFICANT ACCOUNTING POLICIES
The consolidated financial statements have been prepared in accordance with generally accepted accounting principles in the United States ("U.S. GAAP"), followed on a consistent basis.
| a. |
Use of estimates:
|
The preparation of the consolidated financial statements in conformity with U.S. GAAP requires management to make estimates, judgments and assumptions. The Company's management believes that the estimates, judgments and assumptions used are reasonable based upon information available at the time they are made. These estimates, judgments and assumptions can affect the reported amounts of assets and liabilities and disclosure of contingent assets and liabilities at the dates of the financial statements, and the reported amounts of revenue and expenses during the reporting period. Actual results could differ from those estimates.
| b. |
Functional currency:
|
The majority of the revenues of Gilat Satellite Networks Ltd. and certain of its subsidiaries are generated in U.S. dollars ("dollar") or linked to the dollar. In addition, a substantial portion of Gilat Satellite Networks Ltd. and certain of its subsidiaries' costs are incurred in dollars. The Company's management believes that the dollar is the primary currency of the economic environment in which Gilat Satellite Networks Ltd. and certain of its subsidiaries operate. Thus, the functional and reporting currency of Gilat Satellite Networks Ltd. and certain of its subsidiaries is the dollar.
Accordingly, monetary accounts maintained in currencies other than the dollar are remeasured into dollars in accordance with ASC 830, "Foreign Currency Matters" ("ASC 830"). All transaction gains and losses of the remeasurement of monetary balance sheet items are reflected in the consolidated statements of income (loss) as financial income or expenses, as appropriate.
The financial statements of certain foreign subsidiaries, whose functional currency has been determined to be their local currency, have been translated into dollars. Assets and liabilities have been translated using the exchange rates in effect at the balance sheet date. Statements of income (loss) amounts have been translated using specific rates. The resulting translation adjustments are reported as a component of shareholders' equity in accumulated other comprehensive income (loss).
| c. |
Principles of consolidation:
|
The consolidated financial statements include the accounts of Gilat Satellite Networks Ltd. and its subsidiaries in which the Company has a controlling voting interest and entities consolidated under the variable interest entities ("VIE") provisions of ASC 810, "Consolidation" ("ASC 810"). Inter-company balances and transactions have been eliminated upon consolidation.
F - 13
GILAT SATELLITE NETWORKS LTD
.
AND ITS SUBSIDIARIES
NOTES TO CONSOLIDATED FINANCIAL STATEMENTS
U.S. dollars in thousands
NOTE 2:-
SIGNIFICANT ACCOUNTING POLICIES (Cont.)
Most of the activity of the subsidiary in Colombia ("Gilat Colombia") consists of operating subsidized projects for the Colombian Ministry of Information Technologies and Communications ("Ministry of ITC") through its "Dirección de Conectividad", or DirCon (formerly known as Compartel Program).
Gilat Colombia
was awarded a few projects from the Ministry of ITC, the latest of which was awarded in 2013, and was further extended several times in 2017 and 2018, and is scheduled to be completed in the second quarter of 2019.
As required in the bid documents for the Ministry of ITC projects, the Company established trusts (the "Trusts") and entered into governing trust agreements for each project (collectively, the "Trust Agreements"). The Trusts were established for the purpose of holding the network equipment, processing payments to subcontractors, and holding the funds received through the subsidy from the government until they are released in accordance with the terms of the subsidy and paid to Gilat Colombia. The Trusts are a mechanism to allow the Colombian government to review amounts to be paid with the subsidy and verify that such funds are used in accordance with the transaction document and the terms of the subsidy. Gilat Colombia generates revenues both from the subsidy, as well as from the use of the network that it operates.
The Trusts are considered VIEs and Gilat Colombia is identified as the primary beneficiary of the Trusts.
Under ASC 810, the Company performs ongoing reassessments of whether it is the primary beneficiary of the VIE. The assessment of Company's management is that the Company has the power to direct the activities of a VIE that most significantly impact the VIE's activities (it is responsible for establishing and operating the networks), and the obligation to absorb losses of the VIE that could potentially be significant to the VIE and the right to receive benefits from the VIE that could potentially be significant to the VIE's economic performance. As such, the Trusts were consolidated in the financial statements of the Company since their inception.
The cash held by the Trusts is consolidated within the financial statements of the Company and classified as Restricted cash held by trustees
.
The advances from customers received by the Trusts are consolidated within the financial statements of the Company and classified as Advances from customers held by trustees
.
| d. |
Cash equivalents:
|
Cash equivalents are short-term highly liquid investments that are not restricted as to withdrawals or use with maturities of three months or less at the date acquired.
F - 14
GILAT SATELLITE NETWORKS LTD
.
AND ITS SUBSIDIARIES
NOTES TO CONSOLIDATED FINANCIAL STATEMENTS
U.S. dollars in thousands
NOTE 2:-
SIGNIFICANT ACCOUNTING POLICIES (Cont.)
| e. |
Short-term and long-term restricted cash:
|
Short-term restricted cash is either invested in bank deposits, which mature within one year, or in short-term highly liquid investments that are restricted to withdrawals or use. As of December 31, 2018, the vast majority of this amount was linked to the dollar. Such deposits are used as collateral for performance and advance payment guarantees to customers, surety bonds and the lease of some of the Company’s offices, and bear weighted average interest rates of 2.36% and 1.23% as of December 31, 2018 and 2017, respectively.
Long-term restricted cash is primarily invested in bank deposits, which mature after more than one year. As of December 31, 2018, the amount is linked to currencies other than the dollar. It bears annual weighted average interest rates of 6.54% and 7.94% as of December 31, 2018 and 2017, respectively. Such deposits are used as collateral for performance guarantees to customers and the lease of some of the Company's offices.
| f. |
Restricted cash held by trustees:
|
As of December 31, 2018 and 2017, restricted cash held by trustees is invested in a savings bank account linked to the Colombian Peso. The restricted cash is being released based upon performance milestones as stipulated in the agreements with the Ministry of ITC (see Note 2c).
| g. |
Inventories:
|
Inventories are stated at the lower of cost or net realizable value. Net realizable value is the estimated selling prices in the ordinary course of business, less reasonably predictable costs of completion, disposal, and transportation. Inventory write-offs are provided to cover risks arising from slow-moving items, excess inventories, discontinued products, new products introduction and for market prices lower than cost. Any write-off is recognized in the consolidated statement of income (loss) as cost of revenues. In addition, if required, the Company records a liability for firm non-cancelable and unconditional purchase commitments with contract manufacturers for quantities in excess of the Company's future demands forecast consistent with its valuation of excess and obsolete inventory.
Cost is determined as follows:
Raw materials, parts and supplies - using the weighted average cost method.
Work-in-progress - represents the cost of manufacturing with the addition of allocable indirect manufacturing costs, using the weighted average cost method.
Finished products - calculated on the basis of raw materials, direct manufacturing costs with the addition of allocable indirect manufacturing costs, using the weighted average cost method.
F - 15
GILAT SATELLITE NETWORKS LTD
.
AND ITS SUBSIDIARIES
NOTES TO CONSOLIDATED FINANCIAL STATEMENTS
U.S. dollars in thousands
| NOTE 2:- |
SIGNIFICANT ACCOUNTING POLICIES (Cont.)
|
| h. |
Property and equipment, net:
|
Property and equipment are stated at cost, net of accumulated depreciation. Depreciation is calculated by the straight-line method over the estimated useful lives of the assets as follows:
|
Years
|
||
|
Buildings
|
50
|
|
|
Computers, software and electronic equipment
|
2 - 10
|
|
|
Office furniture and equipment
|
3 - 15
|
|
|
Vehicles
|
4 - 7
|
Leasehold improvements are amortized by the straight-line method over the term of the lease or the estimated useful life of the improvements, whichever is shorter.
Rental income generated from office spaces leased to others is included in general and administrative expenses.
Network equipment leased to others under operating leases is carried at cost less accumulated depreciation and depreciated using the straight-line method over the useful life of the assets of between 2 to 5 years. The Company has accounted for its assets which are under a capital lease arrangement in accordance with ASC 840 "Leases" ("ASC 840"). Accordingly, assets under a capital lease are stated as assets of the Company on the basis of ordinary purchase prices (without the financing component), and depreciated according to the usual depreciation rates applicable to such assets. The lease payments payable in forthcoming years, net of the interest component included in them, are included in liabilities. The interest in respect of such amounts is accrued on a current basis and is charged to earnings.
| i. |
Intangible assets:
|
Intangible assets subject to amortization are initially recognized based on the fair value allocated to them, and subsequently stated at amortized cost. The assets are amortized over their estimated useful lives using the straight-line method over an estimated period during which benefits are expected to be received, in accordance with ASC 350, "Intangible - Goodwill and Other" ("ASC 350") as follows:
|
Years
|
||
|
Technology
|
7.9
|
|
|
Customer relationships
|
6.8
|
|
|
Marketing rights and patents
|
12.1
|
F - 16
GILAT SATELLITE NETWORKS LTD
.
AND ITS SUBSIDIARIES
NOTES TO CONSOLIDATED FINANCIAL STATEMENTS
U.S. dollars in thousands
NOTE 2:-
SIGNIFICANT ACCOUNTING POLICIES (Cont.)
| j. |
Impairment of long-lived assets:
|
The Company's long-lived assets and identifiable intangible assets that are subject to amortization are reviewed for impairment in accordance with ASC 360, "Property, Plant and Equipment" ("ASC 360"), whenever events or changes in circumstances indicate that the carrying amount of an asset may not be recoverable.
Recoverability of assets to be held and used is measured by a comparison of the carrying amount of an asset to the future undiscounted cash flows expected to be generated by the assets. Such measurement includes significant estimates. If such assets are considered to be impaired, the impairment to be recognized is measured by the amount by which the carrying amount of the assets exceeds the fair value of the assets.
However, the carrying amount of a group of assets is not to be reduced below its fair value.
Assets to be disposed of are reported at the lower of the carrying amount or fair value less costs to sell.
In the years ended December 31, 2018 and 2017, no impairments of long-lived assets were recorded.
k.
Goodwill:
Goodwill represents the excess of the purchase price in a business combination over the fair value of the net tangible and intangible assets acquired. Under ASC 350, goodwill is not amortized, but rather is subject to an annual impairment test. Goodwill is tested for impairment at the reporting unit level by comparing the fair value of the reporting unit with its carrying value. The Company performs its annual impairment analysis of goodwill in the fourth quarter of the year and whenever events or changes in circumstances indicate that the carrying value of these assets may not be recoverable.
ASC 350 allows an entity to first assess qualitative factors to determine whether it is necessary to perform the two-step quantitative goodwill impairment test. If the qualitative assessment does not result in a more likely than not indication of impairment, no further impairment testing is required. If it does result in a more likely than not indication of impairment, the two-step impairment test is performed. Alternatively, ASC 350 permits an entity to bypass the qualitative assessment for any reporting unit and proceed directly to performing the first step of the goodwill impairment test.
In the years ended December 31, 2018 and 2017, following an improvement in the Mobility segment results, the Company performed a qualitative assessment and concluded that it is not more likely than not that the fair value of the reporting units is less than their carrying amounts and accordingly it is unnecessary to perform the two-step quantitative goodwill impairment test.
In the year ended December 31, 2016, the Company performed both qualitative and quantitative assessments and concluded that no impairment of goodwill was required to be recorded.
F - 17
GILAT SATELLITE NETWORKS LTD
.
AND ITS SUBSIDIARIES
NOTES TO CONSOLIDATED FINANCIAL STATEMENTS
U.S. dollars in thousands
NOTE 2:-
SIGNIFICANT ACCOUNTING POLICIES (Cont.)
| l. |
Contingencies:
|
The Company is currently involved in various claims and legal proceedings. The Company reviews the status of each matter and assesses its potential financial exposure. If the potential loss from any claim or legal proceeding is considered probable and the amount can be reasonably estimated, the Company accrues a liability for the estimated loss.
| m. |
Revenue recognition:
|
The Company generates revenues mainly from the sale of products (including construction of networks),
satellite
-based communication networks services and from providing connectivity, internet access and telephony services. The Company sells its products and services to enterprises, government and residential customers under large-scale contracts that utilize both the Company's networks and other networks that the Company installs, mainly based on BOT contracts. These large‑scale contracts sometimes involve the installation of thousands of VSATs or massive fiber-optic and microwave networks. Sale of products includes mainly the sale of VSATs, hubs, SSPAs, low-profile antennas, on-the-move/on-the-pause terminals, and construction and installation of large-scale networks based on BOT contracts. Sale of services includes access to and communication via satellites ("space segment"), installation of equipment, telephone services, internet services, consulting, on-line network monitoring, network maintenance and repair services. The Company sells its products primarily through its direct sales force and indirectly through resellers or system integrators. Sales consummated by the Company's sales force and sales to resellers or system integrators are considered sales to end-users.
The Company recognizes revenue when (or as) it satisfies performance obligations by transferring promised products or services to its customers in an amount that reflects the consideration the Company expects to receive. The Company applies the following five steps: (1) identify the contract with a customer, (2) identify the performance obligations in the contract, (3) determine the transaction price, (4) allocate the transaction price to the performance obligations in the contract, and (5) recognize revenue when a performance obligation is satisfied. See Note 2z for additional information.
If the contract contains a single performance obligation, the entire transaction price is allocated to the single performance obligation. Contracts that contain multiple performance obligations require an allocation of the transaction price to each performance obligation based on a relative standalone selling price (“SSP”) basis. The Company establishes SSP based on management judgment, considering internal factors such as margin objectives, pricing practices and historical sales.
F - 18
GILAT SATELLITE NETWORKS LTD
.
AND ITS SUBSIDIARIES
NOTES TO CONSOLIDATED FINANCIAL STATEMENTS
U.S. dollars in thousands
NOTE 2:-
SIGNIFICANT ACCOUNTING POLICIES (Cont.)
Consideration from contracts that is assessed as not being probable of collection is not recognized as revenue until the contract is completed and cash is received. Collectability is re-assessed when there is a significant change in facts or circumstances. The Company’s assessment of collectability considers whether it may limit its exposure to credit risk through its right to stop transferring additional service in the event the customer is delinquent as well as certain contract terms such as down payments that reduce its exposure to credit risk.
Revenue from the sale of equipment is recognized at a point in time, once the customer has obtained control
over
the items purchased. When significant acceptance provisions are included in the arrangement, the Company
defer recognition of
the revenue until the acceptance occurs. The Company generally does not grant a right of return to its customers. Revenue from periodic services is recognized ratably over the term the services are rendered. Revenue from other services is recognized upon their completion.
Revenues from contracts under which the Company provides significant construction to the customer's specifications (mostly governmental projects) are generally recognized over time because of continuous transfer of control to the customer. This continuous transfer of control to the customer is supported by clauses in the contract that allow the customer to unilaterally terminate the contract for convenience, pay the Company for costs incurred plus a reasonable profit and take control of any work in process. The Company generally uses the cost-to-cost measure of progress for its contracts because it best depicts the transfer of control to the customer, which occurs as it incurs costs on the contracts. Under the cost-to-cost measure of progress, the extent of progress towards completion is measured based on the ratio of costs incurred to date to the total estimated costs at completion of the performance obligation. Revenues are recorded proportionally as costs are incurred. Costs to fulfill include labor, materials and subcontractors’ costs and other direct and allocated indirect costs. When estimates of total costs to be incurred exceed total estimates of revenue to be earned on the uncompleted contracts, a provision for the entire loss on the contract is recognized in the period the loss is identified.
Under the typical payment terms of government fixed-price contracts, the customer pays the Company milestones-based payments. Those payments are based on quantifiable measures of performance or on the achievement of specified events or milestones. Because those payments are due upon completion of those milestones, they may result in revenue recognized in excess of billings and are presented as part of contract assets on the balance sheet.
Amounts recognized as revenue and which the Company has unconditional right to receive are classified as
trade
receivables on the balance sheet.
Revenue from products under lease contracts is recognized in accordance with ASC 840 upon installation or upon delivery, in cases where the customer obtains its own or other's installation services. The net investments in sales-type leases are discounted at the interest rates implicit in the leases. The present values of payments due under sales-type lease contracts are recorded as revenue at the time of shipment or installation, as appropriate.
Future interest income is deferred and recognized over the related lease term as financial income.
F - 19
GILAT SATELLITE NETWORKS LTD
.
AND ITS SUBSIDIARIES
NOTES TO CONSOLIDATED FINANCIAL STATEMENTS
U.S. dollars in thousands
NOTE 2:-
SIGNIFICANT ACCOUNTING POLICIES (Cont.)
Deferred revenue and advances from customers are recorded when the Company receives payments from customers before performance obligations have been performed. Deferred revenue is recognized as revenue as (or when) the Company performs the performance obligation under the contract.
For information regarding disaggregated revenues, please refer to Note 13.
The Company pays sales commissions to sales and marketing and certain management personnel based on their attainment of certain predetermined sales goals. Sales commissions earned by its employees are considered incremental and recoverable costs of obtaining a contract with a customer. Sales commissions are capitalized and amortized upon recognition of the related revenue, consistently with the transfer to the customer of the goods or services to which they relate. Amortization expenses related to these costs are mostly included in sales and marketing expenses in the accompanying consolidated statements of operations.
| n. |
Selling and marketing expenses:
|
Selling and marketing expenses include shipping expenses in the amounts of $1,303, $1,225 and $1,367 for the years ended December 31, 2018, 2017 and 2016, respectively.
Advertising costs are expensed as incurred. Advertising expenses amounted to $247, $204, and $243 for the years ended December 31, 2018, 2017 and 2016, respectively.
| o. |
Warranty costs:
|
Generally, the Company provides product assurance warranties for periods between twelve to twenty four months at no extra charge that covers the compliance of the products with agreed-upon specifications. A provision is recorded for estimated warranty costs based on the Company's experience. Warranty expenses amounted to $591, $323 and $704 for the years ended December 31, 2018, 2017 and 2016, respectively.
| p. |
Research and development expenses:
|
Research and development costs are charged to the consolidated statements of income (loss) as incurred and are presented net of government grants. ASC 985, "Software", requires capitalization of certain software development costs subsequent to the establishment of technological feasibility.
Based on the Company's product development process, technological feasibility is established upon completion of a working model. Costs incurred by the Company between completion of the working models and the point at which the products are ready for general release has been insignificant. Therefore, all research and development costs have been expensed.
F - 20
GILAT SATELLITE NETWORKS LTD
.
AND ITS SUBSIDIARIES
NOTES TO CONSOLIDATED FINANCIAL STATEMENTS
U.S. dollars in thousands
NOTE 2:-
SIGNIFICANT ACCOUNTING POLICIES (Cont.)
| q. |
Research and development grants:
|
The Company receives royalty-bearing and non-royalty-bearing grants from the Government of Israel and from other funding sources, for approved research and development projects. These grants are recognized at the time the Company is entitled to such grants on the basis of the costs incurred or milestones achieved as provided by the relevant agreement and included as a deduction from research and development expenses.
Research and development grants deducted from research and development expenses amounted to $1,426, $1,419 and $1,624 for the years ended December 31, 2018, 2017 and 2016, respectively.
| r. |
Accounting for stock-based compensation:
|
The Company accounts for stock-based compensation in accordance with ASC 718, "Compensation-Stock Compensation" ("ASC 718"). ASC 718 requires companies to estimate the fair value of equity-based payment awards on the date of grant using an option-pricing model. The value of the portion of the award that is ultimately expected to vest is recognized as an expense over the requisite service period in the Company's consolidated statement of income (loss).
The Company recognizes compensation expenses for the value of its awards, based on the straight-line method over the requisite service period of each of the awards.
F - 21
GILAT SATELLITE NETWORKS LTD
.
AND ITS SUBSIDIARIES
NOTES TO CONSOLIDATED FINANCIAL STATEMENTS
U.S. dollars in thousands
NOTE 2:-
SIGNIFICANT ACCOUNTING POLICIES (Cont.)
Effective as of January 1, 2017, the Company adopted Accounting Standards Update 2016-09, "Compensation-Stock Compensation (Topic 718)" ("ASU 2016-09") on a modified, retrospective basis. ASU 2016-09 permits entities to make an accounting policy election related to how forfeitures will impact the recognition of compensation cost for stock - based compensation: to estimate the total number of awards for which the requisite service period will not be rendered or to account for forfeitures as they occur. Upon adoption of ASU 2016-09, the Company elected to change its accounting policy to account for forfeitures as they occur. The change was applied on a modified, retrospective basis with a cumulative effect adjustment to retained earnings of $55 (which increased the accumulated deficit) as of January 1, 2017.
| s. |
Income taxes:
|
The Company accounts for income taxes in accordance with ASC 740, "Income Taxes" ("ASC 740"). ASC 740 prescribes the use of the liability method whereby deferred tax assets and liability account balances are determined based on differences between the financial reporting and the tax basis of assets and liabilities and are measured using the enacted tax rates and laws that will be in effect when the differences are expected to reverse. The Company provides a valuation allowance, if necessary, to reduce deferred tax assets to their estimated realizable value if it is more likely than not that a portion or all of the deferred tax assets will not be realized.
ASC 740 contains a two-step approach to recognizing and measuring a liability for uncertain tax positions. The first step is to evaluate the tax position taken or expected to be taken in a tax return by determining if the weight of available evidence indicates that it is more likely than not that, on an evaluation of the technical merits, the tax position will be sustained on audit, including resolution of any related appeals or litigation processes. The second step is to measure the tax benefit as the largest amount that is more than 50% likely to be realized upon ultimate settlement.
The Company classifies interest and penalties on income taxes as financial expenses and general and administrative expenses, respectively.
F - 22
GILAT SATELLITE NETWORKS LTD
.
AND ITS SUBSIDIARIES
NOTES TO CONSOLIDATED FINANCIAL STATEMENTS
U.S. dollars in thousands
NOTE 2:-
SIGNIFICANT ACCOUNTING POLICIES (Cont.)
| t. |
Concentrations of credit risks:
|
Financial instruments that potentially subject the Company to concentrations of credit risk consist principally of cash and cash equivalents, short-term and long-term restricted cash, restricted cash held by trustees trade receivables and contract assets.
The majority of the Company's cash and cash equivalents are invested in dollars with major banks in Israel, the United States and South America. Generally, these cash and cash equivalents may be redeemed upon demand and therefore, management believes that they bear low risk.
The majority of the Company's short-term and long-term restricted cash are invested in dollars with major banks in Israel. The Company is generally entitled to receive the restricted cash based upon actual performance of its projects.
The Company also has restricted cash held by trustees, which is invested in Colombian Pesos with major banks in Colombia. As of December 31, 2018, restricted cash held by the trustees amounted to $4,372. The Company is entitled to receive the restricted cash held by the trustee in stages based upon operational milestones. The cash held in the Trusts is reflected in the Company's consolidated balance sheet as Restricted cash held by trustees.
Trade receivables and contract assets of the Company are mainly derived from sales to major customers located in North, South and Central America, Europe and Asia. The Company performs ongoing credit evaluations of its customers and obtains letters of credit and bank guarantees for certain receivables. An allowance for doubtful accounts is determined with respect to specific debts that the Company has determined to be doubtful of collection. As of December 31, 2018 and 2017 the Company has recorded a provision for doubtful accounts in the amounts of $3,202 and $3,896, respectively.
The Company has recorded a net expense (income) from bad debts in the amount of ($376), $2,231 and $6,222 for the years ended December 31, 2018, 2017 and 2016, respectively.
F - 23
GILAT SATELLITE NETWORKS LTD
.
AND ITS SUBSIDIARIES
NOTES TO CONSOLIDATED FINANCIAL STATEMENTS
U.S. dollars in thousands
NOTE 2:-
SIGNIFICANT ACCOUNTING POLICIES (Cont.)
| u. |
Employee related benefits:
|
Severance pay:
The Company's liability for severance pay for its Israeli employees is calculated pursuant to the Israeli Severance Pay Law based on the most recent salary of the employees multiplied by the number of years of employment, as of the balance sheet date. Employees whose employment is terminated by the Company or who are otherwise entitled to severance pay in accordance with Israeli law or labor agreements are entitled to one month's salary for each year of employment or a portion thereof. The Company's liability for all of its Israeli employees is partly provided for by monthly deposits for insurance policies and the remainder by an accrual. The value of these policies is recorded as an asset in the Company's consolidated balance sheet.
During April and May 2008 (the "transition date"), the Company amended the contracts of most of its Israeli employees so that starting on the transition date, such employees are subject to Section 14 of the Severance Pay Law, 1963 ("Section 14") for severance pay accumulated in periods of employment subsequent to the transition date. In accordance with Section 14, upon termination, the release of the contributed amounts from the fund to the employee shall relieve the Company from any further severance liability and no additional payments shall be made by the Company to the employee. As a result, the related obligation and amounts deposited on behalf of such obligation are not stated on the consolidated balance sheet, as the Company is legally released from severance obligation to employees once the amounts have been deposited, and the Company has no further legal ownership of the amounts deposited.
The carrying value for the deposited funds for the Company's employees' severance pay for employment periods prior to the transition date include profits and losses accumulated up to the balance sheet date. The deposited funds may be withdrawn only upon the fulfillment of the obligation pursuant to the Israeli Severance Pay Law or labor agreements.
Severance pay expenses for the years ended December 31, 2018, 2017 and 2016, amounted to $3,138, $2,819 and $2,577, respectively.
401(k) profit sharing plans:
The Company has a number of savings plans in the United States that qualify under Section 401(k) of the current Internal Revenue Code as a "safe harbor" plan. The Company must make a mandatory contribution to the 401(k) plan to satisfy certain nondiscrimination requirements under the Internal Revenue Code. This mandatory contribution is made to all eligible employees. The contribution costs for all the plans were $479, $411 and $357 for the years ended December 31, 2018, 2017 and 2016, respectively.
F - 24
GILAT SATELLITE NETWORKS LTD
.
AND ITS SUBSIDIARIES
NOTES TO CONSOLIDATED FINANCIAL STATEMENTS
U.S. dollars in thousands
NOTE 2:-
SIGNIFICANT ACCOUNTING POLICIES (Cont.)
| v. |
Fair value of financial instruments:
|
The Company applies ASC 820, "Fair Value Measurements and Disclosures" ("ASC 820"). Under this standard, fair value is defined as the price that would be received to sell an asset or paid to transfer a liability (i.e., "the exit price") in an orderly transaction between market participants at the measurement date.
In determining fair value, the Company uses various valuation approaches. ASC 820 establishes a hierarchy for inputs used in measuring fair value that maximizes the use of observable inputs and minimizes the use of unobservable inputs by requiring that the most observable inputs be used when available. Observable inputs are inputs that market participants would use in pricing the asset or liability developed based on market data obtained from sources independent of the Company. Unobservable inputs are inputs that reflect the Company's assumptions about the assumptions market participants would use in pricing the asset or liability developed based on the best information available in the circumstances.
The hierarchy is broken down into three levels based on the inputs as follows:
| Level 1 - |
Valuations based on quoted prices in active markets for identical assets that the Company has the ability to access. Valuation adjustments and block discounts are not applied to Level 1 instruments. Since valuations are based on quoted prices that are readily and regularly available in an active market, valuation of these products does not entail a significant degree of judgment.
|
| Level 2 - |
Valuations based on one or more quoted prices in markets that are not active or for which all significant inputs are observable, either directly or indirectly.
|
| Level 3 - |
Valuations based on inputs that are unobservable and significant to the overall fair value measurement.
|
The availability of observable inputs can vary from investment to investment and is affected by a wide variety of factors, including, for example, the type of investment, the liquidity of markets and other characteristics particular to the transaction. To the extent that valuation is based on models or inputs that are less observable or unobservable in the market, the determination of fair value requires more judgment and the investments are categorized as Level 3.
The carrying amounts of cash and cash equivalents, restricted cash, trade receivables, contract assets, other current assets, trade payables, accrued expenses and other current liabilities approximate their fair value due to the short-term maturities of such instruments.
Based on the borrowing rates currently available to the Company for bank loans with similar terms and maturities, the Company estimates that the carrying value of its long-term debt approximates their fair value.
F - 25
GILAT SATELLITE NETWORKS LTD
.
AND ITS SUBSIDIARIES
NOTES TO CONSOLIDATED FINANCIAL STATEMENTS
U.S. dollars in thousands
NOTE 2:-
SIGNIFICANT ACCOUNTING POLICIES (Cont.)
The Company measured the fair value of the forward contracts in accordance with ASC 820 and classified them as Level 2. Forward contracts are classified within Level 2 as the valuation inputs are based on quoted prices and market observable data of similar instruments.
| w. |
Earnings (loss) per share:
|
In accordance with ASC 260, "Earnings per Share", basic earnings (loss) per share is computed based on the weighted average number of Ordinary shares outstanding during each period. Diluted earnings (loss) per share is computed based on the weighted average number of Ordinary shares outstanding during each period, plus dilutive potential Ordinary shares considered outstanding during the period. The total weighted average number of shares related to the outstanding options excluded from the calculations of diluted earnings (loss) per share, as they would have been anti-dilutive, was 573,552, 1,627,552 and 2,227,150 for the years ended December 31, 2018, 2017 and 2016, respectively.
| x. |
Derivatives and hedging activities:
|
ASC 815, "Derivatives and Hedging" ("ASC 815"), as amended, requires the Company to recognize all derivatives on the balance sheet at fair value. Derivatives that are not hedges must be adjusted to fair value through income (loss). If the derivative is a hedge, depending on the nature of the hedge, changes in the fair value of derivatives are either offset against the change in fair value of the hedged assets, liabilities, or firm commitments through earnings or recognized in other comprehensive income (loss) until the hedged item is recognized in earnings. The ineffective portion of a derivative's change in fair value is immediately recognized in earnings.
The Company measured the fair value of the forward contracts in accordance with ASC 820 (classified as Level 2).
The Company entered into forward and cylinder option contracts to hedge against the risk of changes in future cash flow from payments of payroll and related expenses denominated in New Israeli Shekels ("NIS").
F - 26
GILAT SATELLITE NETWORKS LTD
.
AND ITS SUBSIDIARIES
NOTES TO CONSOLIDATED FINANCIAL STATEMENTS
U.S. dollars in thousands
NOTE 2:-
SIGNIFICANT ACCOUNTING POLICIES (Cont.)
| y. |
Comprehensive income (loss):
|
The Company accounts for comprehensive income (loss) in accordance with ASC 220, "Comprehensive Income". Comprehensive income (loss) generally represents all changes in shareholders' equity during the period except those resulting from investments by, or distributions to, shareholders. The Company determined that its items of other comprehensive income (loss) relate to unrealized gains and losses on forward contracts and foreign currency translation adjustments.
The following tables shows the components of accumulated other comprehensive income (loss), as of December 31, 2018 and 2017:
|
Year ended
December 31, 2018
|
||||||||||||
|
Foreign currency translation adjustments
|
Unrealized gains (losses) on cash flow hedges
|
Total
|
||||||||||
|
Beginning balance
|
$
|
(3,217
|
)
|
$
|
171
|
$
|
(3,046
|
)
|
||||
|
Other comprehensive loss before reclassifications
|
(1,845
|
)
|
(1,548
|
)
|
(3,393
|
)
|
||||||
|
Amounts reclassified from accumulated other comprehensive income
|
-
|
1,059
|
1,059
|
|||||||||
|
Net current-period other comprehensive loss
|
(1,845
|
)
|
(489
|
)
|
(2,334
|
)
|
||||||
|
Ending balance
|
$
|
(5,062
|
)
|
$
|
(318
|
)
|
$
|
(5,380
|
)
|
|||
|
Year ended
December 31, 2017
|
||||||||||||
|
Foreign currency translation adjustments
|
Unrealized gains (losses) on cash flow hedges
|
Total
|
||||||||||
|
Beginning balance
|
$
|
(3,122
|
)
|
$
|
(102
|
)
|
$
|
(3,224
|
)
|
|||
|
Other comprehensive income before reclassifications
|
(95
|
)
|
1,419
|
1,324
|
||||||||
|
Amounts reclassified from accumulated other comprehensive income
|
-
|
(1,146
|
)
|
(1,146
|
)
|
|||||||
|
Net current-period other comprehensive income (loss)
|
(95
|
)
|
273
|
178
|
||||||||
|
Ending balance
|
$
|
(3,217
|
)
|
$
|
171
|
$
|
(3,046
|
)
|
||||
F - 27
GILAT SATELLITE NETWORKS LTD
.
AND ITS SUBSIDIARIES
NOTES TO CONSOLIDATED FINANCIAL STATEMENTS
U.S. dollars in thousands
NOTE 2:-
SIGNIFICANT ACCOUNTING POLICIES (Cont.)
| z. |
Recently adopted accounting pronouncements:
|
| 1. |
In May 2014, the Financial Accounting Standards Board ("FASB") issued Accounting Standards Update ("ASU") No. 2014-09, Revenue from Contracts with Customers (“Topic 606”). The standard replaced the revenue recognition guidance in U.S. GAAP under Topic 605, and was required to be applied retrospectively to each prior period presented, or applied using a modified retrospective method with the cumulative effect recognized in the opening balance of the accumulated deficit during the period of initial application. Subsequently, the FASB issued several additional ASUs related to ASU No. 2014-09, collectively they are referred to as the “new revenue standards”, which became effective for the Company beginning January 1, 2018.
|
On January 1, 2018, the Company adopted Topic 606 using the modified retrospective method for contracts which were not completed as of January 1, 2018. Under the modified retrospective method, the Company recognized the cumulative effect of initially applying the new revenue standard as an adjustment to the opening balance of accumulated deficit. This adjustment did not have a material impact on the Company’s consolidated financial statements. The Standard requires the deferral and amortization of “incremental” costs incurred to obtain a contract. The primary contract acquisition costs for the Company are sales commissions. Under Topic 605, the Company expensed sales commissions as incurred while under Topic 606 such costs will be classified as a contract asset and amortized over a period that approximates the timing of revenue recognition on the underlying contracts.
The cumulative effect of the changes made to the consolidated balance sheet as of January 1, 2018 for the adoption of Topic 606-10 was as follows:
|
December 31, 2017
|
Impact of Adoption
|
January 1, 2018
|
||||||||||
|
Condensed Consolidated Balance Sheet
|
||||||||||||
|
Other current assets
|
$
|
19,415
|
2,004
|
$
|
21,419
|
|||||||
|
Accrued expenses
|
75,270
|
483
|
75,753
|
|||||||||
|
Accumulated deficit
|
$
|
(702,959
|
)
|
1,521
|
$
|
(701,438
|
)
|
|||||
Results for reporting periods beginning after January 1, 2018 are presented under Topic 606, while prior period amounts are not adjusted and continue to be reported in accordance with the Company’s historic accounting under Revenue Recognition (“Topic 605”).
The Company reclassified an amount of $58,789 from trade receivables to contract assets as of December 31, 2017.
The adoption of Topic 606 represents a change in accounting principle that will provide financial statement readers with enhanced revenue recognition disclosures. In accordance with Topic 606, revenue is recognized when obligations under the terms of a contract with the Company’s customer are satisfied; generally, this occurs with the transfer of control of the Company’s products or services.
F - 28
GILAT SATELLITE NETWORKS LTD
.
AND ITS SUBSIDIARIES
NOTES TO CONSOLIDATED FINANCIAL STATEMENTS
U.S. dollars in thousands
NOTE 2:-
SIGNIFICANT ACCOUNTING POLICIES (Cont.)
In accordance with Topic 606-10, the disclosure of the impact of adoption on the consolidated balance sheet as of December 31, 2018 was as follows:
|
December 31, 2018
|
||||||||||||
|
As Reported
|
Impact of Adoption
|
Amounts under Topic 605
|
||||||||||
|
Condensed Consolidated Balance Sheet
|
||||||||||||
|
Contract assets
|
$
|
47,760
|
(1,221
|
)
|
$
|
46,539
|
||||||
|
Other current assets
|
26,022
|
(2,342
|
) |
23,680
|
||||||||
|
Accrued expenses
|
67,533
|
(1,023
|
) |
66,510
|
||||||||
|
Accumulated deficit
|
$
|
(683,029
|
)
|
(2,540
|
)
|
$
|
(685,569
|
)
|
||||
In accordance with Topic 606-10, the disclosure of the impact of adoption on the consolidated statement of operations and cash flows was as follows:
|
Year ended December 31, 2018
|
||||||||||||
|
As Reported
|
Impact of Adoption
|
Amounts under Topic 605
|
||||||||||
|
Condensed Consolidated Statement of Operations
|
||||||||||||
|
Total revenues
|
$
|
266,391
|
(1,221
|
)
|
$
|
265,170
|
||||||
|
Cost of revenues
|
172,354
|
-
|
172,354
|
|||||||||
|
Gross profit
|
94,037
|
(1,221
|
)
|
92,816
|
||||||||
|
Operating expenses
|
72,753
|
(202
|
)
|
72,551
|
||||||||
|
Operating profit
|
$
|
21,284
|
(1,019
|
)
|
$
|
20,265
|
||||||
|
Condensed Consolidated Statement of Cash Flows
|
||||||||||||
|
Cash flows from operating activities:
|
||||||||||||
|
Net income
|
$
|
18,409
|
(1,019
|
)
|
$
|
17,390
|
||||||
|
Increase (decrease) in accrued expenses
|
(7,206
|
)
|
(540
|
)
|
(6,666
|
)
|
||||||
|
Increase (decrease) in other assets and receivables
|
(4,917
|
)
|
338
|
(4,579
|
)
|
|||||||
|
Increase (decrease) in contract assets
|
$
|
11,029
|
1,221
|
$
|
12,250
|
|||||||
Deferred revenue as of December 31, 2018 and December 31, 2017 was $8,658 and $6,010, respectively, and primarily relates to revenue that is recognized over time for service contracts. The changes in balance are related to the satisfaction or partial satisfaction of these contracts. Approximately $4,145 of the December 31, 2017 balance was recognized as revenue during the year ended December 31, 2018.
The balance of deferred revenues approximates the aggregate amount of the billed and collected amount allocated to the unsatisfied performance obligations at the end of reporting period.
F - 29
GILAT SATELLITE NETWORKS LTD
.
AND ITS SUBSIDIARIES
NOTES TO CONSOLIDATED FINANCIAL STATEMENTS
U.S. dollars in thousands
NOTE 2:-
SIGNIFICANT ACCOUNTING POLICIES (Cont.)
All of the Company’s performance obligations in contracts with customers, other than large scale governmental projects (expected to be recognized over periods of approximately 13-15 years), principally relate to contracts with a duration of less than one year, as such, the Company is not required to disclose the aggregate amount of the transaction price allocated to performance obligations that are unsatisfied or partially unsatisfied at the end of the reporting period.
| 2. |
In November 2016, the FASB issued ASU 2016-18, “Statement of Cash Flows (Topic 230): Restricted Cash”, which requires companies to include amounts generally described as restricted cash and restricted cash equivalents in cash and cash equivalents when reconciling beginning-of-period and end-of-period total amounts shown on the statement of cash flows. This ASU is effective for annual and interim periods beginning after December 15, 2017. The Company applied this standard to each prior period presented using the full retrospective transition method, as required by the new standard.
|
|
December 31,
|
||||||||
|
2018
|
2017
|
|||||||
|
Cash and cash equivalents
|
$
|
67,381
|
$
|
52,957
|
||||
|
Restricted cash
|
32,305
|
29,288
|
||||||
|
Restricted cash held by trustees
|
4,372
|
4,325
|
||||||
|
Long term restricted cash
|
146
|
187
|
||||||
|
$
|
104,204
|
$
|
86,757
|
|||||
| aa. |
Recently issued accounting pronouncements:
|
In February 2016, the FASB issued ASU 2016-02, Leases (“Topic 842” or “ASC 842”). The standard requires lessees to recognize almost all leases on the balance sheet as a right-of-use asset and a lease liability and requires leases to be classified as either an operating or a finance type lease. The standard excludes leases of intangible assets or inventory. Leases with a term of 12 months or less will be accounted for in a manner similar to the accounting under existing guidance for operating leases today. The new standard requires lessors to account for leases using an approach that is substantially equivalent to existing guidance for sales-type leases, direct financing leases and operating leases. ASC 842 supersedes the previous leases standard, ASC 840, "Leases". Topic 842 becomes effective for the Company beginning January 1, 2019. The Company expects that the adoption of the standard will have an impact of approximately $5,600 on its consolidated balance sheet for the recognition of the right-of-use assets and lease liabilities related to the Company's operating leases. The standard is not expected to have a material impact on the Company's results of operations or cash flows. The Company is continuing its assessment, which may identify additional impacts this guidance will have on its consolidated financial statements and disclosures.
F - 30
GILAT SATELLITE NETWORKS LTD
.
AND ITS SUBSIDIARIES
NOTES TO CONSOLIDATED FINANCIAL STATEMENTS
U.S. dollars in thousands
NOTE 2:-
SIGNIFICANT ACCOUNTING POLICIES (Cont.)
In January 2017, the FASB issued ASU 2017-04, Intangibles - Goodwill and Other (Topic 350): Simplifying the Accounting for Goodwill Impairment ("ASU 2017-04"). ASU 2017-04 eliminates Step 2 of the goodwill impairment test, which requires the calculation of the implied fair value of goodwill by assigning the fair value of a reporting unit to all of its assets and liabilities as if that reporting unit had been acquired in a business combination. Instead, an entity will compare the fair value of a reporting unit with its carrying amount and recognize an impairment charge for the amount by which the carrying amount exceeds the reporting unit's fair value. ASU 2017-04 is effective for annual or any interim goodwill impairment tests in fiscal years beginning after December 15, 2019. The Company is currently evaluating the expected impact of the standard on its consolidated financial statements.
In August 2017, the FASB issued ASU 2017-12, Derivatives and Hedging (Topic 815): Targeted Improvements to Accounting for Hedging Activities, which expands the activities that qualify for hedge accounting and simplifies the rules for reporting hedging transactions. The standard is effective for the Company beginning January 1, 2019. Early adoption is permitted. The Company is currently evaluating the expected impact of the standard on its consolidated financial statements.
ab.
Reclassifications:
Certain comparative figures have been reclassified to conform to the current year presentation. The reclassification had no effect on previously reported net income or shareholders' equity.
F - 31
GILAT SATELLITE NETWORKS LTD
.
AND ITS SUBSIDIARIES
NOTES TO CONSOLIDATED FINANCIAL STATEMENTS
U.S. dollars in thousands
| NOTE 3:- |
INVENTORIES
|
| a. |
Inventories are comprised of the following:
|
|
December 31,
|
||||||||
|
2018
|
2017
|
|||||||
|
Raw materials, parts and supplies
|
$
|
5,885
|
$
|
7,367
|
||||
|
Work in progress
|
10,548
|
10,300
|
||||||
|
Finished products
|
4,676
|
11,186
|
||||||
|
$
|
21,109
|
$
|
28,853
|
|||||
| b. |
Inventory write-offs amounted to $6,354, $3,270 and $4,833 for the years ended December 31, 2018, 2017 and 2016, respectively.
|
| NOTE 4:- |
PROPERTY AND EQUIPMENT, NET
|
| a. |
Property and equipment, net consisted of the following:
|
|
December 31,
|
||||||||
|
2018
|
2017
|
|||||||
|
Cost:
|
||||||||
|
Buildings and land
|
$
|
92,025
|
$
|
90,914
|
||||
|
Computers, software and electronic equipment
|
50,390
|
45,119
|
||||||
|
Network equipment
|
40,502
|
40,016
|
||||||
|
Office furniture and equipment
|
5,317
|
5,387
|
||||||
|
Vehicles
|
324
|
390
|
||||||
|
Leasehold improvements
|
3,556
|
2,522
|
||||||
|
192,114
|
184,348
|
|||||||
|
Accumulated depreciation
|
107,711
|
102,102
|
||||||
|
Depreciated cost
|
$
|
84,403
|
$
|
82,246
|
||||
| *) |
The Company recorded a reduction of $732 and $46,051 to the cost and accumulated depreciation of fully depreciated equipment and leasehold improvements that are no longer in use for the years ended December 31, 2018 and 2017, respectively.
|
| b. |
Depreciation expenses amounted to $9,874, $7,465 and $7,337 in the years ended December 31, 2018, 2017 and 2016, respectively.
|
| c. |
As for pledges and securities, see also Note 11c.
|
F - 32
GILAT SATELLITE NETWORKS LTD
.
AND ITS SUBSIDIARIES
NOTES TO CONSOLIDATED FINANCIAL STATEMENTS
U.S. dollars in thousands
| NOTE 5:- |
INTANGIBLE ASSETS, NET
|
| a. |
Intangible assets, net consisted of the following:
|
|
December 31,
|
||||||||
|
2018
|
2017
|
|||||||
|
Original amounts:
|
||||||||
|
Technology
|
$
|
42,504
|
$
|
42,504
|
||||
|
Customer relationships
|
4,466
|
4,466
|
||||||
|
Marketing rights and patents
|
3,421
|
3,421
|
||||||
|
50,391
|
50,391
|
|||||||
|
Accumulated amortization:
|
||||||||
|
Technology
|
41,281
|
38,231
|
||||||
|
Customer relationships
|
4,466
|
4,466
|
||||||
|
Marketing rights and patents
|
2,210
|
1,985
|
||||||
|
47,957
|
44,682
|
|||||||
|
$
|
2,434
|
$
|
5,709
|
|||||
| b. |
Amortization expenses amounted to $3,275, $5,675 and $5,771 for the years ended December 31, 2018, 2017 and 2016, respectively.
|
| c. |
Estimated amortization expenses for the following years is as follows:
|
|
Year ending December 31,
|
||||
|
2019
|
$
|
911
|
||
|
2020
|
441
|
|||
|
2021
|
431
|
|||
|
2022
|
321
|
|||
|
2023 and thereafter
|
330
|
|||
|
$
|
2,434
|
|||
| NOTE 6:- |
GOODWILL
|
|
December 31,
|
||||||||
|
2018
|
2017
|
|||||||
|
Goodwill *)
|
$
|
105,647
|
$
|
105,647
|
||||
|
Accumulated impairment losses
|
(62,179
|
)
|
(62,179
|
)
|
||||
|
$
|
43,468
|
$
|
43,468
|
|||||
| *) |
The carrying amount of the goodwill is associated with the Mobility segment.
|
F - 33
GILAT SATELLITE NETWORKS LTD
.
AND ITS SUBSIDIARIES
NOTES TO CONSOLIDATED FINANCIAL STATEMENTS
U.S. dollars in thousands
| NOTE 7:- |
COMMITMENTS AND CONTINGENCIES
|
| a. |
Lease commitments:
|
The Company's subsidiaries entered into various non-cancelable operating lease agreements for certain of their offices and facilities, expiring between 2019 and 2023. Minimum lease commitments under non-cancelable operating lease agreements as of December 31, 2018, are as follows:
|
Year ending December 31,
|
||||
|
2019
|
$
|
1,973
|
||
|
2020
|
877
|
|||
|
2021
|
593
|
|||
|
2022
|
529
|
|||
|
2023
|
409
|
|||
|
$
|
4,381
|
|||
Rent expenses during the years ended December 31, 2018, 2017 and 2016 were $2,578, $2,599 and $2,568, respectively.
Some of the Company's lease agreements do not include renewal options.
| b. |
Commitments with respect to space segment services:
|
The Company provides its customers with space segment capacity services, which are purchased from third parties. Future minimum payments due for space segment services to be rendered subsequent to December 31, 2018, are as follows:
|
Year ending December 31,
|
||||
|
2019
|
$
|
8,367
|
||
|
2020
|
6,016
|
|||
|
2021
|
1,587
|
|||
|
$
|
15,970
|
|||
Space segment services expenses during the years ended December 31, 2018, 2017 and 2016 were $12,771, $11,184 and $10,278, respectively.
F - 34
GILAT SATELLITE NETWORKS LTD
.
AND ITS SUBSIDIARIES
NOTES TO CONSOLIDATED FINANCIAL STATEMENTS
U.S. dollars in thousands
| NOTE 7:- |
COMMITMENTS AND CONTINGENCIES (Cont.)
|
| c. |
In 2018 and 2017, the Company's primary material purchase commitments were with inventory suppliers. The Company's material inventory purchase commitments are based on purchase orders, or on outstanding agreements with some of the Company's suppliers of inventory. As of December 31, 2018, and 2017, the Company's major outstanding inventory purchase commitments amounted to $18,418 and $22,309, respectively, all of which were orders placed or commitments made in the ordinary course of its business. As of December 31, 2018 and 2017, $6,939 and $9,235, respectively, of these orders and commitments, were from suppliers which can be considered sole or limited in number. In addition, for the year ended December 31, 2018, the Company recorded a loss for firm non-cancelable and unconditional purchase commitments with contract manufacturers for quantities in excess of the Company's future demands forecast consistent with its valuation of excess and obsolete inventory in the amount of $1,448.
|
| d. |
Royalty commitments:
|
| 1. |
The Company is committed to pay royalties to the Israel
Innovation Authority ("IIA"), formerly known as the Office of the Chief Scientist
of the Ministry of Economy of the Government of Israel on proceeds from sales of products resulting from the research and development projects in which the
IIA
participated with royalty bearing grants. In the event that development of a specific product in which the
IIA
participated is successful, the Company will be obligated to repay the grants through royalty payments at the rate of 3% to 5% based on the sales of the Company, up to 100% of the grants received linked to the dollar. Grants are subject to interest at a rate equal to the 12 month LIBOR rate. The obligation to pay these royalties is contingent upon actual sales of the products and, in the absence of such sales, no payment is required.
|
As of December 31, 2018, the Company had a contingent liability to pay royalties in the amount of approximately $1,408.
The Company paid royalties in the amount of $20 during the year ended December 31, 2018. The Company did not pay or accrue any amounts for such royalties during the years ended December 31, 2017 and 2016.
| 2. |
Research and development projects undertaken by the Company were partially financed by the Binational Industrial Research and Development Foundation ("BIRD Foundation"). The Company is committed to pay royalties to the BIRD Foundation at a rate of 5% of sales proceeds generating from projects for which the BIRD Foundation provided funding up to 150% of the sum financed by the BIRD Foundation.
|
The obligation to pay these royalties is contingent on actual sales of the products and in the absence of such sales, no payment is required.
As of December 31, 2018, the Company had a contingent liability to pay royalties in the amount of approximately $253.
F - 35
GILAT SATELLITE NETWORKS LTD
.
AND ITS SUBSIDIARIES
NOTES TO CONSOLIDATED FINANCIAL STATEMENTS
U.S. dollars in thousands
| NOTE 7:- |
COMMITMENTS AND CONTINGENCIES (Cont.)
|
The Company did not pay or accrue any amounts for such royalties during the years ended December 31, 2018, 2017 and 2016.
| e. |
Litigation:
|
In 2003, the Brazilian tax authority filed a claim against the Company’s inactive subsidiary in Brazil, for the payment of taxes allegedly due from the subsidiary. After numerous hearings and appeals at various appellate levels in Brazil, the Superior Court and the Supreme Court in February and March 2016 ruled against the subsidiary in final non-appealable decisions. The total amount of this claim, including interest, penalties and legal fees is approximately $9,000, of which approximately $1,000 is the principal. The Brazilian tax authorities initiated foreclosure proceedings against the subsidiary and certain of its former managers. Pursuant to the court’s decision, published in March 2016, the foreclosure proceedings against the former managers were cancelled. The tax authorities appealed such decision which appeal was rejected in July 2017. This court ruling is final and is not appealable. Based on Brazilian external counsel’s opinion, the Company believes that the subsidiary has solid arguments to sustain its position that further collection proceedings are barred due to statute of limitation and that the inclusion of any additional co-obligors in the tax foreclosure certificate should be barred due to the applicable statute of limitations and that the foreclosure procedures cannot legally be redirected to any of the Company’s entities and managers who were not cited in the foreclosure certificate. Accordingly, the Company believes that the chances that such redirection will lead to a loss recognition are remote.
In October 2017, the Company was informed that a former subcontractor that was engaged in connection with the project of
Gilat
Colombia has initiated an arbitration proceeding against the subsidiary for a breach of contract. The amount of the claim is approximately $6,600. In July 2018 the subsidiary filed its response and a counterclaim against the subcontractor. The amount of the counter claim is approximately $7,900 plus interest. The arbitration is currently pending the counter parties’ filing their response. Based on legal advice, the Company believes that it has made adequate accruals relating to this proceeding.
In addition, the Company is in the midst of different stages of audits and disputes with various tax authorities in different parts of the world. Further, the Company is the defendant in various other lawsuits, including employment-related litigation claims and other legal proceedings in the normal course of its business. While the Company intends to defend the aforementioned matters vigorously, it believes that a loss in excess of its accrued liability with respect to these claims is not probable.
| f. |
Pledges and securities, see Note 11c.
|
F - 36
GILAT SATELLITE NETWORKS LTD
.
AND ITS SUBSIDIARIES
NOTES TO CONSOLIDATED FINANCIAL STATEMENTS
U.S. dollars in thousands
| NOTE 7:- |
COMMITMENTS AND CONTINGENCIES (Cont.)
|
| g. |
Guarantees:
|
The Company guarantees its performance to certain customers through bank guarantees, surety bonds from insurance companies and corporate guarantees. Guarantees are often required for the Company's performance during the installation and operational periods. The guarantees typically expire when certain operational milestones are met.
As of December 31, 2018, the aggregate amount of bank guarantees and surety bonds from insurance companies outstanding in order to secure the Company's various obligations was $149,523, including an aggregate of $136,003 on behalf of its subsidiaries in Peru. The Company has $32,451 of restricted cash to secure these guarantees.
In accordance with ASC 460, "Guarantees" ("ASC 460"), as the guarantees above are performance guarantees for the Company's own performance, such guarantees are excluded from the scope of ASC 460. The Company has not recorded any liability for such amounts, since the Company expects that its performance will be acceptable. To date, no guarantees have ever been exercised against the Company.
| NOTE 8:- |
DERIVATIVE INSTRUMENTS
|
The following table details the fair value of derivative instruments in the consolidated balance sheet:
|
Fair value of derivative instruments
|
|||||||||
|
December 31,
|
|||||||||
|
2018
|
2017
|
||||||||
|
Derivative:
|
|||||||||
|
Foreign exchange forward contracts / options (1)
|
Other current assets (liabilities)
|
$
|
(320
|
)
|
$
|
170
|
|||
| (1) |
To protect against changes in value of forecasted foreign currency cash flows resulting from salaries and related payments that are denominated in NIS, the Company has entered into foreign currency forward contracts. These contracts are designated as cash flow hedges, as defined by ASC 815, as amended, and are considered highly effective as hedges of these expenses. The forward contracts are expected to occur at various dates within the following twelve months.
|
During the years ended December 31, 2018, 2017 and 2016, the Company recognized net income (loss) related to the effective portion of its hedging instruments. The effective portion of the hedged instruments has been included as an offset (addition) of payroll expenses and other operating expenses in the consolidated statement of income (loss) amounted to $(1,056), $1,114 and $393 in the years ended December 31, 2018, 2017 and 2016, respectively
F - 37
GILAT SATELLITE NETWORKS LTD
.
AND ITS SUBSIDIARIES
NOTES TO CONSOLIDATED FINANCIAL STATEMENTS
U.S. dollars in thousands (except share and per share data)
| NOTE 8:- |
DERIVATIVE INSTRUMENTS (Cont.)
|
The ineffective portion of the hedged instrument which was recorded during the years ended December 31, 2018, 2017 and 2016, was immaterial and has been recorded as financial income (expenses). As of December 31, 2018 and 2017, the Company had outstanding forward contracts in the notional amount of $27,153 and $16,007, respectively.
| NOTE 9:- |
SHAREHOLDERS' EQUITY
|
| a. |
Share capital:
|
| 1. |
Ordinary shares confer upon their holders voting rights, the right to receive cash dividends and the right to share in excess assets upon liquidation of the Company.
|
| 2. |
In March 2016, the Company consummated a rights offering, in which the Company granted, at no charge to the holders of the Company's ordinary shares as of the record date for the rights offering, for each nine (9) ordinary shares owned, one non-transferable subscription right to purchase two ordinary shares at a price of $7.16 (reflecting a price of $3.58 per share). Through this rights offering the Company issued 9,874,170 ordinary shares and raised a gross amount of $35,350. Issuance expenses amounted to $265.
|
| b. |
Stock option plans:
|
Description of plans
:
In October 2008, the compensation stock option committee of the Company's Board of Directors approved the adoption of the 2008 Stock Incentive Plan (the "2008 Plan") with 1,000,000 shares or stock options available for grant and a sub-plan to enable qualified optionees certain tax benefits under the Israeli Income Tax Ordinance. Among the incentives that may be adopted are stock options, performance share awards, performance share unit awards, restricted shares, restricted share unit awards and other stock-based awards. During the years commencing in 2010 and through December 31, 2018, the Company's Board of Directors approved, in the aggregate, an increase of 5,104,000 shares to the number of shares available for grant under the 2008 Plan, bringing the total amount of shares available for grant to 6,104,000. As of December 31, 2018, an aggregate of 128,888 shares are still available for future grants under the 2008 Plan.
Options granted under the 2008 Plan vest quarterly over two to four years or 50% at the second anniversary and 25% at the third and fourth anniversary. The options expire after six, seven or ten years from the date of grant. Restricted share units (“RSUs”) granted under the 2008 Plan vest quarterly or annually over four years. Any options or RSUs, which are forfeited or canceled before expiration of the 2008 Plan, become available for future grants.
F - 38
GILAT SATELLITE NETWORKS LTD
.
AND ITS SUBSIDIARIES
NOTES TO CONSOLIDATED FINANCIAL STATEMENTS
U.S. dollars in thousands
| NOTE 9:- |
SHAREHOLDERS' EQUITY
(Cont.)
|
Valuation assumptions:
The Company selected the Black-Scholes-Merton option-pricing model as the most appropriate fair value method for its stock options awards and the fair value of RSUs is based on the market stock price on the date of grant. The option-pricing model requires a number of assumptions, of which the most significant are the expected stock price volatility and the expected option term. Expected volatility was calculated based upon actual historical stock price movements. The expected term of options granted is based upon historical experience and represents the period of time that options granted are expected to be outstanding. The risk-free interest rate is based on the yield from U.S. treasury bonds with an equivalent term. The Company has historically not paid dividends. The Company’s Board of directors declared on the date of this annual report a cash dividend in the amount of $
0.45 per share
(or approximately $
25,000
) to be paid in April 2019 (for which a protective adjustment is applied to the outstanding equity awards). This will be the first time the Company pays dividend. However, the Company has not adopted a general policy regarding the distribution of dividends and makes no statements as to the distribution of dividends in the foreseeable future.
For additional information see
Note 15.
Options granted to employees:
The fair value of the Company's stock options granted to employees for the years ended December 31, 2018, 2017 and 2016 was estimated using the following weighted average assumptions:
|
Year ended December 31,
|
||||||
|
2018
|
2017
|
2016
|
||||
|
Risk free interest
|
2.48%-2.82%
|
1.66%-2.00%
|
1.08%-1.62%
|
|||
|
Dividend yields
|
0%
|
0%
|
0%
|
|||
|
Volatility
|
33%
|
33%
|
33%-35%
|
|||
|
Expected term (in years)
|
4.3-4.39
|
4.52
|
4.8
|
|||
A summary of employee option balances under the 2008 Plan as of December 31, 2018 and changes during the year then ended are as follows:
|
Number of options
|
Weighted-average exercise price
|
Weighted- average remaining contractual term
(in years)
|
Aggregate intrinsic value
(in thousands)
|
|||||||||||||
|
Outstanding at January 1, 2018
|
2,808,000
|
$
|
5.2
|
|||||||||||||
|
Granted
|
740,000
|
$
|
8.2
|
|||||||||||||
|
Exercised
|
(438,840
|
)
|
$
|
4.9
|
||||||||||||
|
Forfeited
|
(225,750
|
)
|
$
|
5.3
|
||||||||||||
|
Outstanding at December 31, 2018
|
2,883,410
|
$
|
6.0
|
3.7
|
$
|
9,087
|
||||||||||
|
Exercisable at December 31, 2018
|
1,209,910
|
$
|
5.2
|
2.6
|
$
|
4,804
|
||||||||||
F - 39
GILAT SATELLITE NETWORKS LTD
.
AND ITS SUBSIDIARIES
NOTES TO CONSOLIDATED FINANCIAL STATEMENTS
U.S. dollars in thousands
| NOTE 9:- |
SHAREHOLDERS' EQUITY
(Cont.)
|
The weighted-average grant-date fair value of options granted to employees during the year ended December 31, 2018 was $2.3. The aggregate intrinsic value in the table above represents the total intrinsic value (the difference between the Company's closing stock price on the last trading day of the year 2018 and the exercise price, multiplied by the number of in-the-money options) that would have been received by the option holders had all option holders exercised their options on December 31, 2018. These amounts change based on the fair market value of the Company's stock. Total intrinsic value of options exercised for the year ended December 31, 2018 was $1,789.
The outstanding and exercisable options granted to employees under the 2008 Plan as of December 31, 2018, have been separated into ranges of exercise price as follows:
|
Options
|
Weighted
|
Options
|
Weighted
|
|||||||||||||||||
|
outstanding
|
average
|
Weighted
|
exercisable
|
average exercise
|
||||||||||||||||
|
Ranges of
|
as of
|
remaining
|
average
|
as of
|
price of
|
|||||||||||||||
|
exercise
|
December 31,
|
contractual
|
exercise
|
December 31,
|
exercisable
|
|||||||||||||||
|
price
|
2018
|
life (years)
|
price
|
2018
|
options
|
|||||||||||||||
|
$3.77-5.63
|
1,773,410
|
3.1
|
$
|
5.0
|
1,060,660
|
5.0
|
||||||||||||||
|
$5.86-8.14
|
925,000
|
4.4
|
$
|
7.3
|
149,250
|
6.7
|
||||||||||||||
|
$9.34
|
185,000
|
5.6
|
$
|
9.3
|
-
|
|||||||||||||||
|
2,883,410
|
3.7
|
$
|
6.0
|
1,209,910
|
5.2
|
|||||||||||||||
Additional stock-based compensation data:
As of December 31, 2018, there was $2,254 of unrecognized compensation costs related to non-vested stock-based compensation arrangements granted to employees under the 2008 Plan. The cost related to employees is expected to be recognized over a weighted-average period of 2.78 years.
| c. |
Dividends:
|
| 1. |
In the event that cash dividends are declared by the Company, such dividends will be declared and paid in Israeli currency. Under current Israeli regulations, any cash dividend in Israeli currency paid in respect of ordinary shares purchased by non-residents of Israel with non-Israeli currency, may be freely repatriated in such non-Israeli currency, at the exchange rate prevailing at the time of repatriation. As set forth in Note 15, the Company’s Board of Directors declared a cash dividend
in the amount
of $
0.45 per share
(or approximately $
25,000
) to be paid in April 2019. However, the Company has not adopted a general policy regarding the distribution of dividends and makes no statements as to the distribution of dividends in the foreseeable future.
|
| 2. |
Pursuant to the terms of a loan from a bank (see also Note 11c), the Company is restricted from paying cash dividends to its shareholders without initial approval from the bank, the company has obtained such an approval with respect to the expected
distribution
.
|
F - 40
GILAT SATELLITE NETWORKS LTD
.
AND ITS SUBSIDIARIES
NOTES TO CONSOLIDATED FINANCIAL STATEMENTS
U.S. dollars in thousands
| NOTE 10:- |
TAXES ON INCOME
|
| a. |
Israeli taxation:
|
| 1. |
Corporate tax rates:
|
Generally, income of Israeli companies is subject to corporate tax. The corporate tax rate in Israel is 23% in 2018, compared with 24% in 2017 and 25% in 2016.
| 2. |
Tax benefits under the Law for the Encouragement of Capital Investments, 1959 (the "Law"):
|
The Company has been granted an "Approved Enterprise" status, under the Law, for nine investment programs in the alternative program, by the Israeli Government.
Certain production facilities of the Company have been granted
"Benefitted Enterprise"
status under the provision of the Law. The Company was eligible under the terms of minimum qualifying investment and elected 2011 as the Year of Election.
Income derived from Approved
Enterprise
or Benefitted Enterprises is tax exempt for a period of two years out of the period of benefits. Based on the percentage of foreign shareholding in the Company, income derived during the remaining years of benefits is taxable at the rate of 10%-25%.
The period of benefits of the Benefitted Enterprises under the 2011 election will expire in 2023
.
As of December 31, 2018, the Company did not generate income from the Benefitted Enterprises.
In the event of distribution of dividends from the above mentioned tax exempt income, the amount distributed would be taxed at a corporate tax rate of 10% to 25%, depending on the level of foreign investment in the Company. Dividends distributed from taxable income accrued during the period of benefits of Approved Enterprise are taxable at a rate of 15%. Dividends distributed from taxable income accrued during the period of benefits of a Benefitted Enterprise, are taxable at the rate of 15%, if the dividend is distributed during the tax benefit period, or within an additional 12 years after the lapse of that period.
F - 41
GILAT SATELLITE NETWORKS LTD
.
AND ITS SUBSIDIARIES
NOTES TO CONSOLIDATED FINANCIAL STATEMENTS
U.S. dollars in thousands
| NOTE 10:- |
TAXES ON INCOME (Cont.)
|
Income from sources other than a "Benefitted Enterprise" during the benefit period is subject to tax at the regular corporate tax rate (25% in 2016, 24% in 2017 and 23% in 2018).
On January 1, 2011, new legislation that constitutes a major amendment to the Law was enacted (the "Amendment Legislation"). Under the Amendment Legislation, a uniform rate of corporate tax would apply to all qualified income of certain industrial companies, as opposed to the current law's incentives that are limited to income from "Benefitted Enterprises" during their benefits period. According to the Amendment Legislation, the applicable tax rate for 2014 and onwards is set at 9% in geographical areas in Israel designated as Development Zone A and 16% elsewhere in Israel applicable to the company. The profits of these Industrial Companies would be freely distributable as dividends, subject to a 20% withholding tax (or lower, under an applicable tax treaty). The Company is not located in Development Zone A.
According to an Amendment from December 2016, a preferred enterprise located in Development Zone A will be subject to a tax rate of 7.5% instead of 9% effective from January 1, 2017 and thereafter (the tax rate applicable to preferred enterprises located in other areas remains at 16%).
Under the transitory provisions of the Amendment Legislation, the Company may elect whether to irrevocably implement the new law in its Israeli company while waiving benefits provided under the current law or keep implementing the current law during the next years. Changing from the current law to the new law is permissible at any stage.
The Amendment also prescribes special tax tracks for technological enterprises.
The new tax tracks under the Amendment are as follows:
Technological preferred enterprise - an enterprise for which total consolidated revenues of its parent company and all subsidiaries are less than NIS 10 billion. A technological preferred enterprise, as defined in the Law, which is located in the center of Israel will be subject to tax at a rate of 12% on profits deriving from intellectual property (in Development Zone A- a tax rate of 7.5%).
Special technological preferred enterprise - an enterprise for which total consolidated revenues of its parent company and all subsidiaries exceed NIS 10 billion. Such enterprise will be subject to tax at a rate of 6% on profits deriving from intellectual property, regardless of the enterprise's geographical location.
Any dividends distributed to "foreign companies", as defined in the Law, deriving from income from the technological enterprises will be subject to tax at a rate of 4%.
F - 42
GILAT SATELLITE NETWORKS LTD
.
AND ITS SUBSIDIARIES
NOTES TO CONSOLIDATED FINANCIAL STATEMENTS
U.S. dollars in thousands
| NOTE 10:- |
TAXES ON INCOME (Cont.)
|
| b. |
Income taxes on non-Israeli subsidiaries:
|
Non-Israeli subsidiaries are taxed according to the tax laws in their respective domiciles of residence. The Company has not made any provisions relating to undistributed earnings of the Company's foreign subsidiaries since the Company has no current plans to distribute such earnings. If earnings are distributed to Israel in the form of dividends or otherwise, the Company may be subject to additional Israeli income taxes (subject to an adjustment for foreign tax credits) and foreign withholding taxes. As of December 31, 2018, the amount of undistributed earnings of non-Israeli subsidiaries, which is considered indefinitely reinvested, was $3,134 with a corresponding unrecognized deferred tax liability of $398.
In December 2017, the U.S. enacted significant tax reform through the U.S. Tax Cuts & Jobs Acts (“TCJA”). The TCJA enacted significant changes affecting the year ended December 31, 2017, including, but not limited to, (1) reducing the U.S. federal corporate income tax rate from 35% to 21% effective 2018, and (2) imposing a one-time Transition Tax on certain unrepatriated earnings of foreign subsidiaries of U.S. companies that had not been previously taxed in the U.S.
The TCJA also established new tax provisions affecting 2018, including, but not limited to, (1) creating a new provision designed to tax global intangible low-tax income (“GILTI”); (2) generally eliminating U.S. federal taxes on dividends from foreign subsidiaries; (3) eliminating the corporate alternative minimum tax (“AMT”); (4) creating the base erosion anti-abuse tax (“BEAT”); (5) establishing a deduction for foreign derived intangible income ("FDII"); (6) repealing the domestic production activity deduction; and (7) establishing new limitations on deductible interest expense and certain executive compensation.
The reduction of the U.S. federal corporate income tax rate required the Company to remeasure its deferred tax assets and liabilities as of the date of enactment. For the year ended December 31, 2017, the Company decreased its deferred tax assets as a result of such remeasurement with a corresponding decrease to the valuation allowance as provisional amounts, resulting in no net effect on the benefit from taxes on income for the year ended December 31, 2017. As of December 31, 2018, the Company has completed the accounting for all the impacts of the TCJA with no material adjustments to the provisional amounts recorded as of December 31, 2017.
| c. |
Carryforward tax losses and credits:
|
As of December 31, 2018, the Company had operating loss carry forwards for Israeli income tax purposes of approximately $92,000 which may be offset indefinitely against future taxable income.
As of December 31, 2018, the Company's U.S. subsidiary had approximately $8,600 carryforward tax losses for federal tax purposes, $11,400 for state tax purposes and R&D credits carryforwards of approximately $5,700. These U.S. net operating losses can be utilized within 20 years and may be subject to substantial annual limitation due to the "change in ownership" provisions of Internal Revenue Code of 1986 and similar state provisions. These annual limitations may result in the expiration of net operating loss before utilization.
F - 43
GILAT SATELLITE NETWORKS LTD
.
AND ITS SUBSIDIARIES
NOTES TO CONSOLIDATED FINANCIAL STATEMENTS
U.S. dollars in thousands
| NOTE 10:- |
TAXES ON INCOME (Cont.)
|
The Company has carryforward tax losses relating to other subsidiaries in Europe and Latin America of approximately $41,400 (which can be utilized within 9 years) and $
30
,000 ($18,900 can be utilized within 4 years and $
11
,100 can be utilized indefinitely), as of December 31, 2018 respectively.
| d. |
Deferred income taxes:
|
Deferred income taxes reflect the net tax effects of temporary differences between the carrying amounts of assets and liabilities for financial reporting purposes and the amounts used for income tax purposes. Significant components of the Company's deferred tax liabilities and assets are as follows:
|
December 31,
|
|||||||||
|
2018
|
2017
|
||||||||
| 1. |
Provided in respect of the following:
|
||||||||
|
Carryforward tax losses and credits *)
|
$
|
41,561
|
$
|
38,918
|
|||||
|
Property, equipment and intangibles
|
904
|
1,484
|
|||||||
|
Deferred revenues
|
823
|
2,224
|
|||||||
|
Research and development costs
|
804
|
1,716
|
|||||||
|
Other
|
7,202
|
7,435
|
|||||||
|
Gross deferred tax assets
|
51,294
|
51,777
|
|||||||
|
Valuation allowance
|
(40,943
|
)
|
(44,882
|
)
|
|||||
|
Net deferred tax assets
|
10,351
|
6,895
|
|||||||
|
Gross deferred tax liabilities
|
|||||||||
|
Property, equipment and intangibles
|
(3,208
|
)
|
(3,098
|
)
|
|||||
|
Subsidy income
|
(3,574
|
)
|
(3,093
|
)
|
|||||
|
Other
|
(22
|
)
|
(829
|
)
|
|||||
|
Gross deferred tax liabilities
|
(6,804
|
)
|
(7,020
|
)
|
|||||
|
Net deferred tax assets (liabilities)
|
$
|
3,547
|
$
|
(125
|
)
|
||||
|
*) The amounts are shown after reduction for unrecognized tax benefits of $ 1,989 as of December 31, 2018.
|
|||||||||
| 2. |
Deferred taxes are included in the consolidated balance sheets, as follows:
|
||||||||
|
Long term assets
|
$
|
4,127
|
$
|
861
|
|||||
|
Long term liabilities
|
$
|
(580
|
)
|
$
|
(986
|
)
|
|||
F - 44
GILAT SATELLITE NETWORKS LTD
.
AND ITS SUBSIDIARIES
NOTES TO CONSOLIDATED FINANCIAL STATEMENTS
U.S. dollars in thousands
| NOTE 10:- |
TAXES ON INCOME (Cont.)
|
| 3. |
The
Peruvian government
awarded the Company's subsidiary in Peru ("the Subsidiary") the Regional FITEL Projects under six separate bids for the construction of fiber and wireless networks, operation of the networks for a defined period and their transfer to the government. The income derived from the construction of the project is an exempt subsidy, and therefore a significant uncertainty arises about the Subsidiary's eligibility to deduct certain construction costs incurred in generating the exempt income against future taxable income. Accordingly, as of December 31, 2017 and 2018, the Company did not record deferred income taxes to reflect the total net tax effects of the potential temporary differences.
|
| 4. |
As of December 31, 2018, the Company decreased the valuation allowance by $ 3,939, resulting from changes in temporary differences relating to property, equipment and intangibles and from carryforward tax losses. The Company provided valuation allowance for a significant portion of the deferred tax regarding the carryforwards losses and other temporary differences that management believes is not expected to be realized in the foreseeable future.
During the year ended December 31, 2018, the Company released valuation allowance against the deferred tax assets primarily related to carryforward tax credits related to its U.S. subsidiary.
|
| 5. |
The functional and reporting currency of the Company and certain of its subsidiaries is the dollar. The difference between the annual changes in the NIS/dollar exchange rate causes a further difference between taxable income and the income before taxes shown in the financial statements. In accordance with ASC 740, the Company has not provided deferred income taxes on the difference between the functional currency and the tax basis of assets and liabilities.
|
F - 45
GILAT SATELLITE NETWORKS LTD
.
AND ITS SUBSIDIARIES
NOTES TO CONSOLIDATED FINANCIAL STATEMENTS
U.S. dollars in thousands
| NOTE 10:- |
TAXES ON INCOME (Cont.)
|
| e. |
Reconciling items between the statutory tax rate of the Company and the actual taxes on income (tax benefit):
|
|
Year ended
December 31,
|
||||||||||||
|
2018
|
2017
|
2016
|
||||||||||
|
Income (loss) before taxes on income from continuing operations , as reported in the consolidated statements of income (loss)
|
$
|
16,986
|
$
|
6,554
|
$
|
(4,088
|
)
|
|||||
|
Statutory tax rate
|
23.0
|
%
|
24.0
|
%
|
25.0
|
%
|
||||||
|
Theoretical taxes on income (tax benefit)
|
$
|
3,907
|
$
|
1,573
|
$
|
(1,022
|
)
|
|||||
|
Currency differences
|
3,089
|
(3,225
|
)
|
(2,174
|
)
|
|||||||
|
Tax adjustment in respect of different tax rates and "Benefitted Enterprise" status
|
345
|
2,849
|
(5,580
|
)
|
||||||||
|
Changes in valuation allowance
|
(3,939
|
)
|
(3,343
|
)
|
11,832
|
|||||||
|
Loss from liquidation of subsidiaries *)
|
(8,930
|
)
|
-
|
-
|
||||||||
|
Forfeiture of carryforward tax losses
|
-
|
622
|
261
|
|||||||||
|
Exempt subsidy income (loss)
|
394
|
(2,646
|
)
|
(4,224
|
)
|
|||||||
|
U.S. Tax Cuts and Jobs Acts effect
|
56
|
2,138
|
-
|
|||||||||
|
Nondeductible expenses and other differences
|
3,655
|
1,785
|
2,159
|
|||||||||
|
$
|
(1,423
|
)
|
$
|
(247
|
)
|
$
|
1,252
|
|||||
| *) | In 2018 the Company’s Dutch subsidiary liquidated some of its subsidiaries and consequently recognized losses for tax purposes. These losses can be offset from taxable income in future periods under the tax regulations in the Netherlands. The Company does not expect these losses to be realized in the foreseeable future and respectively provided a full valuation allowance. |
| f. |
Taxes on income (tax benefit) included in the consolidated statements of income (loss):
|
|
Year ended
December 31,
|
||||||||||||
|
2018
|
2017
|
2016
|
||||||||||
|
Current
|
$
|
2,249
|
$
|
(436
|
)
|
$
|
1,248
|
|||||
|
Deferred
|
(3,672
|
)
|
189
|
4
|
||||||||
|
$
|
(1,423
|
)
|
$
|
(247
|
)
|
$
|
1,252
|
|||||
|
Domestic
|
$
|
610
|
$
|
768
|
$
|
555
|
||||||
|
Foreign
|
(2,033
|
)
|
(1,015
|
)
|
697
|
|||||||
|
$
|
(1,423
|
)
|
$
|
(247
|
)
|
$
|
1,252
|
|||||
F - 46
GILAT SATELLITE NETWORKS LTD
.
AND ITS SUBSIDIARIES
NOTES TO CONSOLIDATED FINANCIAL STATEMENTS
U.S. dollars in thousands
| NOTE 10:- |
TAXES ON INCOME (Cont.)
|
| g. |
Income (loss) before taxes on income (tax benefit) from continuing operations:
|
|
Year ended
December 31,
|
||||||||||||
|
2018
|
2017
|
2016
|
||||||||||
|
Domestic
|
$
|
6,596
|
$
|
1,289
|
$
|
(8,056
|
)
|
|||||
|
Foreign
|
10,390
|
5,265
|
3,968
|
|||||||||
|
$
|
16,986
|
$
|
6,554
|
$
|
(4,088
|
)
|
||||||
| h. |
Unrecognized tax benefits:
|
A reconciliation of the beginning and ending gross amount of unrecognized tax benefits is as follows:
|
December 31,
|
||||||||
|
2018
|
2017
|
|||||||
|
Balance at beginning of year
|
$
|
129
|
$
|
776
|
||||
|
Settlements with tax authorities
|
-
|
(718
|
)
|
|||||
|
Reductions for prior years' tax position
|
-
|
(58
|
)
|
|||||
|
Additions for prior years' tax position
|
1,809
|
129
|
||||||
|
Additions for current years' tax position
|
296
|
-
|
||||||
|
Balance at the end of year *)
|
$
|
2,234
|
$
|
129
|
||||
*) The amount for the year ended December 31, 2018 includes $1,989 of unrecognized tax benefits which are presented as a reduction from deferred tax assets, see Note 10d.
The unrecognized tax benefits include accrued penalties and interest of $ 193 and $ 107 as of December 31, 2018 and 2017, respectively. During the years ended December 31, 2018 and December 31, 2017, the Company recorded an expense of $86 accrued on the unrecognized tax benefits and an income of $197 on the reversal of penalties and interest, respectively.
The Company and its subsidiaries file income tax returns in Israel and in other jurisdictions of its subsidiaries.
The Company's tax assessments through 2014 are considered final.
As of December 31, 2018, the tax returns of the Company and its main subsidiaries are still subject to audits by the tax authorities for the tax years 2011 through 2017.
F - 47
GILAT SATELLITE NETWORKS LTD
.
AND ITS SUBSIDIARIES
NOTES TO CONSOLIDATED FINANCIAL STATEMENTS
U.S. dollars in thousands
| NOTE 11:- |
SUPPLEMENTARY CONSOLIDATED BALANCE SHEET INFORMATION
|
| a. |
Other current assets:
|
|
December 31,
|
||||||||
|
2018
|
2017
|
|||||||
|
Governmental authorities
|
$
|
6,264
|
$
|
5,196
|
||||
|
Prepaid expenses
|
6,612
|
4,220
|
||||||
|
Deferred charges
|
9,446
|
7,100
|
||||||
|
Advance payments to suppliers
|
2,651
|
1,136
|
||||||
|
Other
|
1,049
|
1,763
|
||||||
|
$
|
26,022
|
$
|
19,415
|
|||||
| b. |
Other current liabilities:
|
|
December 31,
|
||||||||
|
2018
|
2017
|
|||||||
|
Payroll and related employee accruals
|
$
|
13,229
|
$
|
14,644
|
||||
|
Derivative instruments
|
320
|
-
|
||||||
|
Governmental authorities
|
506
|
2,206
|
||||||
|
Other
|
533
|
3,194
|
||||||
|
$
|
14,588
|
$
|
20,044
|
|||||
c.
Long-term loans:
|
Interest rate for
|
December 31,
|
||||||||||||||||||||
|
2018
|
2017
|
2018
|
2017
|
||||||||||||||||||
|
Linkage
|
%
|
Maturity
|
|||||||||||||||||||
|
Loans from banks:
|
|||||||||||||||||||||
|
(a)
|
U.S. dollars
|
4.77
|
4.77
|
2021
|
$
|
12,000
|
$
|
16,000
|
|||||||||||||
|
(b)
|
Euro
|
EURIBOR +2.75
|
EURIBOR +2.75
|
2020
|
556
|
1,061
|
|||||||||||||||
|
12,556
|
17,061
|
||||||||||||||||||||
|
Less - current maturities
|
4,458
|
4,479
|
|||||||||||||||||||
|
$
|
8,098
|
$
|
12,582
|
||||||||||||||||||
| (a) |
The Company entered into a loan agreement with an Israeli bank secured
by a floating charge on the assets of the Company, and is further secured by a fixed pledge (mortgage) on the Company's real estate in Israel. In addition, there are financial covenants associated with the loan. As of December 31, 2018 the Company is in compliance with these covenants.
|
| (b) |
A Dutch subsidiary of the Company entered into a mortgage and loan agreement with a German bank. The amount of the mortgage is collateralized by the subsidiary's facilities in Germany.
|
F - 48
GILAT SATELLITE NETWORKS LTD
.
AND ITS SUBSIDIARIES
NOTES TO CONSOLIDATED FINANCIAL STATEMENTS
U.S. dollars in thousands
NOTE 11:-
SUPPLEMENTARY CONSOLIDATED BALANCE SHEET INFORMATION (Cont.)
Long-term debt maturities for loans after December 31, 2018, are as follows:
|
Year ending December 31,
|
||||
|
2020
|
$
|
4,098
|
||
|
2021
|
4,000
|
|||
|
$
|
8,098
|
|||
Interest expenses on the long-term loans amounted to $614, $822 and $1,066 for the years ended December 31, 2018, 2017 and 2016, respectively.
| d. |
Other long-term liabilities:
|
|
December 31,
|
||||||||
|
2018
|
2017
|
|||||||
|
Long-term tax accrual
|
$
|
-
|
$
|
22
|
||||
|
Long-term deferred taxes
|
580
|
986
|
||||||
|
$
|
580
|
$
|
1,008
|
|||||
| NOTE 12:- |
SELECTED CONSOLIDATED STATEMENTS OF INCOME (LOSS) DATA
|
a.
Financial expenses, net:
|
Year ended
December 31,
|
||||||||||||
|
2018
|
2017
|
2016
|
||||||||||
|
Income:
|
||||||||||||
|
Interest on cash equivalents, bank deposits and restricted cash
|
$
|
981
|
$
|
447
|
$
|
1,027
|
||||||
|
Other
|
29
|
355
|
81
|
|||||||||
|
1,010
|
802
|
1,108
|
||||||||||
|
Expenses:
|
||||||||||||
|
Interest with respect to bank credit, loans and other
|
614
|
844
|
1,098
|
|||||||||
|
Exchange rate differences, net
|
1,074
|
226
|
452
|
|||||||||
|
Bank charges including guarantees
|
3,560
|
3,857
|
4,323
|
|||||||||
|
Other
|
60
|
182
|
78
|
|||||||||
|
5,308
|
5,109
|
5,951
|
||||||||||
|
Total financial expenses, net
|
$
|
4,298
|
$
|
4,307
|
$
|
4,843
|
||||||
F - 49
GILAT SATELLITE NETWORKS LTD
.
AND ITS SUBSIDIARIES
NOTES TO CONSOLIDATED FINANCIAL STATEMENTS
U.S. dollars in thousands
| NOTE 12:- |
SELECTED CONSOLIDATED STATEMENTS OF INCOME (LOSS) DATA (Cont.)
|
b.
Earnings (loss) per share:
The following table sets forth the computation of basic and diluted net earnings (loss) per share:
| 1. |
Numerator:
|
|
Year ended
December 31,
|
||||||||||||
|
2018
|
2017
|
2016
|
||||||||||
|
Numerator for basic and diluted earnings (loss) per share -
|
||||||||||||
|
Net income (loss) available to holders of Ordinary shares:
|
$
|
18,409
|
$
|
6,801
|
$
|
(5,340
|
)
|
|||||
| 2. |
Denominator (number of shares in thousands):
|
|
Denominator for basic net loss per share -
|
||||||||||||
|
Weighted average number of shares
|
54,927
|
54,681
|
51,970
|
|||||||||
|
Add-employee stock options
|
826
|
171
|
* ) |
-
|
||||||||
|
Denominator for diluted net earnings (loss) per share - adjusted weighted average shares assuming exercise of options
|
55,753
|
54,852
|
51,970
|
|||||||||
| *) |
Anti-dilutive effect.
|
F - 50
GILAT SATELLITE NETWORKS LTD
.
AND ITS SUBSIDIARIES
NOTES TO CONSOLIDATED FINANCIAL STATEMENTS
U.S. dollars in thousands
| NOTE 13:- |
CUSTOMERS, GEOGRAPHIC AND SEGMENT INFORMATION
|
The Company applies ASC 280, "Segment Reporting" ("ASC 280"). Operating segments are defined as components of an enterprise for which separate financial information is available and is evaluated regularly by the chief operating decision maker. Segments are managed separately and can be described as follows:
Prior to 2018
, the Company operated in three business divisions: Commercial, Mobility and Services.
Commencing in 2018, following changes in the Company's strategy and organizational structure and in order to more accurately reflect the Company's management focus, organizational alignment, customer base and end markets, the Company operates in three business segments, as follows:
Fixed Networks
provides advanced fixed broadband satellite communication networks, satellite communication systems and associated professional services and comprehensive turnkey solutions and fully managed satellite network services solutions. The Company’s customers are service providers, satellite operators, mobile network operators, or MNOs, telecommunication companies, or Telcos, and large enterprises, consumers and governments worldwide. In addition, it includes the Company’s network operation and managed satellite network services solutions in Peru and Colombia.
Mobility Solutions
provides advanced on-the-move satellite communications equipment, systems and solutions, including airborne, maritime and ground-mobile satellite systems and solutions. The Company’s product portfolio comprises of high-speed modems, high performance on-the-move antennas and high efficiency, high power SSPAs and BUCs. The Company’s customers are service providers, system integrators, defense and homeland security organizations, as well as other commercial entities worldwide.
Terrestrial Infrastructure Projects
includes the Company's construction of fiber network in Peru.
The Company has retrospectively revised its segment information for the prior comparative periods to conform to the new business segments presentation.
| a. |
Information on the reportable segments:
|
|
1.
|
The measurement of the reportable operating segments is based on the same accounting principles applied in these financial statements which includes certain corporate overhead allocations.
|
|
2.
|
The above changes in the Company's reportable segments had no effect on the goodwill assignment among the divisions.
|
F - 51
GILAT SATELLITE NETWORKS LTD
.
AND ITS SUBSIDIARIES
NOTES TO CONSOLIDATED FINANCIAL STATEMENTS
U.S. dollars in thousands
| NOTE 13:- |
CUSTOMERS, GEOGRAPHIC AND SEGMENT INFORMATION (Cont.)
|
| 3. |
Financial data relating to reportable operating segments:
|
|
Year ended
December 31, 2018
|
||||||||||||||||
|
Fixed Networks
|
Mobility Solutions
|
Terrestrial Infrastructure
Projects
|
Total
|
|||||||||||||
|
Revenues
|
$
|
144,208
|
$
|
97,180
|
$
|
25,003
|
$
|
266,391
|
||||||||
|
Cost of revenues
|
93,745
|
47,995
|
30,614
|
172,354
|
||||||||||||
|
Gross profit
|
50,463
|
49,185
|
(5,611
|
)
|
94,037
|
|||||||||||
|
Research and development, net
|
11,764
|
21,259
|
-
|
33,023
|
||||||||||||
|
Selling and marketing
|
16,106
|
6,421
|
179
|
22,706
|
||||||||||||
|
General and administrative
|
11,302
|
4,436
|
1,286
|
17,024
|
||||||||||||
|
Operating income (loss)
|
11,291
|
17,069
|
(7,076
|
)
|
21,284
|
|||||||||||
|
Financial expenses, net
|
4,298
|
|||||||||||||||
|
Income before taxes
|
16,986
|
|||||||||||||||
|
Taxes on income (benefit)
|
(1,423
|
)
|
||||||||||||||
|
Net income
|
18,409
|
|||||||||||||||
|
Depreciation and amortization expenses
|
$
|
6,811
|
$
|
6,128
|
$
|
210
|
$
|
13,149
|
||||||||
|
Year ended
December 31, 2017
|
||||||||||||||||
|
Fixed Networks
|
Mobility Solutions
|
Terrestrial Infrastructure
Projects
|
Total
|
|||||||||||||
|
Revenues
|
$
|
116,105
|
$
|
88,397
|
$
|
78,254
|
$
|
282,756
|
||||||||
|
Cost of revenues
|
81,920
|
46,493
|
71,848
|
200,261
|
||||||||||||
|
Gross profit
|
34,185
|
41,904
|
6,406
|
82,495
|
||||||||||||
|
Research and development, net
|
12,172
|
15,842
|
-
|
28,014
|
||||||||||||
|
Selling and marketing
|
17,782
|
5,782
|
195
|
23,759
|
||||||||||||
|
General and administrative
|
10,987
|
6,326
|
2,548
|
19,861
|
||||||||||||
|
Operating income (loss)
|
(6,756
|
)
|
13,954
|
3,663
|
10,861
|
|||||||||||
|
Financial expenses, net
|
4,307
|
|||||||||||||||
|
Income before taxes
|
6,554
|
|||||||||||||||
|
Taxes on income (benefit)
|
(247
|
)
|
||||||||||||||
|
Net income
|
6,801
|
|||||||||||||||
|
Depreciation and amortization expenses
|
$
|
5,046
|
$
|
7,902
|
$
|
192
|
$
|
13,140
|
||||||||
F - 52
GILAT SATELLITE NETWORKS LTD
.
AND ITS SUBSIDIARIES
NOTES TO CONSOLIDATED FINANCIAL STATEMENTS
U.S. dollars in thousands
| NOTE 13:- |
CUSTOMERS, GEOGRAPHIC AND SEGMENT INFORMATION (Cont.)
|
|
Year ended
December 31, 2016
|
||||||||||||||||
|
Fixed Networks
|
Mobility Solutions
|
Terrestrial Infrastructure
Projects
|
Total
|
|||||||||||||
|
Revenues
|
$
|
124,930
|
$
|
62,911
|
$
|
91,710
|
$
|
279,551
|
||||||||
|
Cost of revenues
|
84,986
|
40,962
|
78,113
|
204,061
|
||||||||||||
|
Gross profit
|
39,944
|
21,949
|
13,597
|
75,490
|
||||||||||||
|
Research and development, net
|
12,599
|
12,254
|
-
|
24,853
|
||||||||||||
|
Selling and marketing
|
17,710
|
5,483
|
218
|
23,411
|
||||||||||||
|
General and administrative
|
13,750
|
9,138
|
3,583
|
26,471
|
||||||||||||
|
Operating income (loss)
|
(4,115
|
)
|
(4,926
|
)
|
9,796
|
755
|
||||||||||
|
Financial expenses, net
|
(4,843
|
)
|
||||||||||||||
|
Loss before taxes
|
(4,088
|
)
|
||||||||||||||
|
Taxes on income
|
1,252
|
|||||||||||||||
|
Loss
|
(5,340
|
)
|
||||||||||||||
|
Depreciation and amortization expenses
|
$
|
5,394
|
$
|
7,530
|
$
|
184
|
$
|
13,108
|
||||||||
| b. |
Geographic information:
|
Following is a summary of revenues by geographic areas. Revenues attributed to geographic areas, based on the location of the end customers and in accordance with ASC 280, are as follows:
|
Year ended
December 31,
|
||||||||||||
|
2018
|
2017
|
2016
|
||||||||||
|
Latin America
|
$
|
94,707
|
$
|
132,134
|
$
|
143,491
|
||||||
|
Asia Pacific
|
39,381
|
34,586
|
47,094
|
|||||||||
|
North America
|
97,122
|
73,921
|
54,728
|
|||||||||
|
Europe, the Middle East and Africa
|
35,181
|
42,115
|
34,238
|
|||||||||
|
$
|
266,391
|
$
|
282,756
|
$
|
279,551
|
|||||||
| c. |
The Company's long-lived assets are located as follows:
|
Property and Equipment, net:
|
December 31,
|
||||||||
|
2018
|
2017
|
|||||||
|
Israel
|
$
|
64,018
|
$
|
62,606
|
||||
|
Latin America
|
4,564
|
5,000
|
||||||
|
United States
|
5,620
|
3,733
|
||||||
|
Europe
|
9,117
|
9,426
|
||||||
|
Other
|
1,084
|
1,481
|
||||||
|
$
|
84,403
|
$
|
82,246
|
|||||
F - 53
GILAT SATELLITE NETWORKS LTD
.
AND ITS SUBSIDIARIES
NOTES TO CONSOLIDATED FINANCIAL STATEMENTS
U.S. dollars in thousands
| NOTE 13:- |
CUSTOMERS, GEOGRAPHIC AND SEGMENT INFORMATION (Cont.)
|
| d. |
The table below represents the revenues from major customers:
|
|
Year ended
December 31,
|
||||||||||||
|
2018
|
2017
|
2016
|
||||||||||
|
Customer A
|
10
|
%
|
28
|
%
|
34
|
%
|
||||||
|
Customer B
|
15
|
%
|
*
|
)
|
*
|
)
|
||||||
|
Customer C
|
13
|
%
|
*
|
)
|
*
|
)
|
||||||
*) Less than 10%
Customer A is located in Peru, Customer B is located in North America and Customer C is located in Colombia.
| NOTE 14:- |
RELATED PARTY BALANCES AND TRANSACTIONS
|
| a. |
The Company entered into a number of agreements for the purchase of infrastructure, construction and services from C. Mer Industries Ltd. ("C. Mer"), a publicly traded company in Israel (TASE). The Company's controlling shareholder, FIMI Opportunity Funds ("FIMI"), holds approximately 36.6% of C. Mer's share capital.
|
| b. |
In December 2015 the Company entered into a memorandum of understanding with Orbit Communication Systems, ("Orbit"), a publicly traded company (TASE), for development and manufacture of antenna for an aggregate amount of approximately $1,750. The memorandum specifies prices per additional product units ordered in the future by the Company. In August 2017, FIMI acquired approximately 33.4% of Orbit's share capital and representatives of FIMI serve on Orbit's board of directors. Transactions with Orbit are presented for the period starting August 2017.
|
c. T ransactions with the related parties:
|
Year ended
December 31,
|
||||||||||||
|
2018
|
2017
|
2016
|
||||||||||
|
Cost of revenues of products
|
$
|
764
|
$
|
3,770
|
$
|
12,280
|
||||||
|
Research and development
|
$
|
346
|
$
|
61
|
$
|
-
|
||||||
|
Purchase of property and equipment and inventory
|
$
|
101
|
$
|
100
|
$
|
-
|
||||||
F - 54
GILAT SATELLITE NETWORKS LTD
.
AND ITS SUBSIDIARIES
NOTES TO CONSOLIDATED FINANCIAL STATEMENTS
U.S. dollars in thousands
| NOTE 14:- |
RELATED PARTY BALANCES AND TRANSACTIONS (Cont.)
|
| d. |
B
alances with the related parties:
|
|
December 31,
|
||||||||
|
2018
|
2017
|
|||||||
|
Advance payments
|
$
|
144
|
$
|
-
|
||||
|
Trade payables
|
$
|
125
|
$
|
1,220
|
||||
|
Accrued expenses
|
$
|
1,797
|
$
|
2,241
|
||||
NOTE 15:- SUBSEQUENT EVENT
The Company’s Board of Directors declared on the date of this annual report a cash dividend in the amount of $0.45 per share (or approximately $25,000), payable on April 11, 2019 to shareholders' of record on March 29, 2019. This will be the first time that the Company will pay a dividend, however the Company has not adopted a general policy regarding the distribution of dividends and makes no statements as to the distribution of dividends in the foreseeable future.
F - 55
TABLE OF CONTENTS
Part IItem 1: Identity Of Directors, Senior Management and AdvisorsItem 2: Offer Statistics and Expected TimetableItem 3: Key InformationItem 5: Operating and Financial Review and ProspectsItem 4: Information on The CompanyItem 4A: Unresolved Staff CommentsItem 6: Directors and Senior ManagementItem 7: Major Shareholders and Related Party TransactionsItem 8: Financial InformationItem 9: The Offer and ListingItem 10: Additional InformationItem 11: Quantitative and Qualitative Disclosures About Market RiskItem 12: Description Of Securities Other Than Equity SecuritiesPart IIItem 13: Defaults, Dividend Arrearages and DelinquenciesItem 14: Material Modifications To The Rights Of Security Holders and Use Of ProceedsItem 15: Controls and ProceduresItem 16: ReservedItem 16A: Audit Committee Financial ExpertItem 16B: Code Of EthicsItem 16C: Principal Accountant Fees and ServicesItem 16D. Exemptions From The Listing Standards For Audit CommitteesItem 16E: Purchase Of Equity Securities By The Issuer and Affiliated PurchasersItem 16F: Changes in Registrant S Certifying AccountantItem 16G. Corporate GovernanceItem 16H. Mine Safety DisclosurePart IIIItem 17: Financial StatementsItem 18: Financial StatementsItem 19: ExhibitsNote 1: - GeneralNote 2: - Significant Accounting PoliciesNote 2:- Significant Accounting Policies (cont.)Note 3:- InventoriesNote 4:- Property and Equipment, NetNote 5:- Intangible Assets, NetNote 6:- GoodwillNote 7:- Commitments and ContingenciesNote 7:- Commitments and Contingencies (cont.)Note 8:- Derivative InstrumentsNote 8:- Derivative Instruments (cont.)Note 9:- Shareholders' EquityNote 9:- Shareholders' Equity (cont.)Note 10:- Taxes on IncomeNote 10:- Taxes on Income (cont.)Note 11:- Supplementary Consolidated Balance Sheet InformationNote 11:- Supplementary Consolidated Balance Sheet Information (cont.)Note 12:- Selected Consolidated Statements Of Income (loss) DataNote 12:- Selected Consolidated Statements Of Income (loss) Data (cont.)Note 13:- Customers, Geographic and Segment InformationNote 13:- Customers, Geographic and Segment Information (cont.)Note 14:- Related Party Balances and TransactionsNote 14:- Related Party Balances and Transactions (cont.)Note 15:- Subsequent Event