GLOBE LIFE INC.
10-Ks and 10-Qs
|
|
|
|
|
|
|
|
|
|
|
|
|
|
|
|
|
|
|
|
|
|
|
|
|
|
|
|
|
|
|
|
|
|
|
|
|
|
|
|
|
|
|
|
|
|
|
|
|
|
|
|
|
|
|
|
UNITED STATES
SECURITIES AND EXCHANGE COMMISSION
Washington, D.C. 20549
FORM 10-Q
|
(Mark one)
|
|
|
ý
|
Quarterly Report Pursuant to Section 13 or 15(d) of the Securities Exchange Act of 1934
|
|
For the quarterly period ended September 30, 2018
|
|
|
¨
|
Transition Report Pursuant to Section 13 or 15(d) of the Securities Exchange Act of 1934
|
|
For the transition period from _________to_________
|
|
Commission File Number 1-8052

TORCHMARK CORPORATION
(Exact name of registrant as specified in its charter)
|
DELAWARE
|
|
63-0780404
|
|
(State or other jurisdiction of incorporation or organization)
|
|
(I.R.S. Employer Identification No.)
|
|
|
||
|
3700 South Stonebridge Drive, McKinney, Texas
|
|
75070
|
|
(Address of principal executive offices)
|
|
(Zip Code)
|
Registrant’s telephone number, including area code (972) 569-4000
NONE
Former name, former address and former fiscal year, if changed since last report.
Indicate by check mark whether the registrant (1) has filed all reports required to be filed by Section 13 or 15 (d) of the Securities Exchange Act of 1934 during the preceding 12 months (or for such shorter period that the registrant was required to file such reports), and (2) has been subject to such filing requirements for the past 90 days.
Yes
ý
No
¨
Indicate by check mark whether the registrant has submitted electronically and posted on its corporate Web site, if any, every Interactive Data File required to be submitted and posted pursuant to Rule 405 of Regulation S-T (§232.405 of this chapter) during the preceding 12 months (or for such shorter period that the registrant was required to submit and post such files).
Yes
ý
No
¨
Indicate by check mark whether the registrant is a large accelerated filer, an accelerated filer, a non-accelerated filer, a smaller reporting company, or an emerging growth company. See definitions of “large accelerated filer,” “accelerated filer”, “smaller reporting company” and "emerging growth company" in Rule 12b-2 of the Exchange Act.
|
Large accelerated filer
|
|
ý
|
|
Accelerated filer
|
|
¨
|
|
Non-accelerated filer
|
|
¨
|
|
Smaller reporting company
|
|
¨
|
|
Emerging growth company
|
¨
|
|||||
|
If an emerging growth company, indicate by check mark if the registrant has elected not to use the extended transition period for complying with any new or revised financial accounting standards provided pursuant to Section 13(a) of the Exchange Act.
|
¨
|
|||||
Indicate by check mark whether the registrant is a shell company (as defined in Rule 12b-2 of the Exchange Act).
Yes
¨
No
ý
Indicate the number of shares outstanding for each of the issuer’s classes of common stock, as of the last practicable date.
|
CLASS
|
|
OUTSTANDING AT October 30, 2018
|
||
|
Common Stock,
$1.00 Par Value
|
|
111,540,403
|
||
INDEX
|
Page
|
|||
|
Item 1.
|
|||
|
Item 2.
|
|||
|
Item 3.
|
|||
|
Item 4.
|
|||
|
Item 1.
|
|||
|
Item 1A.
|
|||
|
Item 2.
|
|||
|
Item 6.
|
|||
|
Item 1.
|
Condensed Consolidated Financial Statements
|
TORCHMARK CORPORATION
(Unaudited)
(Dollar amounts in thousands, except per share data)
|
September 30,
2018 |
December 31,
2017 |
||||||
|
Assets:
|
|
|
|||||
|
Investments:
|
|||||||
|
Fixed maturities—available for sale, at fair value (amortized cost: 2018—$15,462,364; 2017—$14,995,101)
|
$
|
16,231,471
|
|
$
|
16,969,325
|
|
|
|
Policy loans
|
543,836
|
|
529,529
|
|
|||
|
Other long-term investments (includes: 2018—$107,996; 2017—$0, under the fair value option)
|
191,191
|
|
108,559
|
|
|||
|
Short-term investments
|
633,490
|
|
127,071
|
|
|||
|
Total investments
|
17,599,988
|
|
17,734,484
|
|
|||
|
Cash
|
77,439
|
|
118,563
|
|
|||
|
Accrued investment income
|
244,851
|
|
233,453
|
|
|||
|
Other receivables
|
406,907
|
|
391,775
|
|
|||
|
Deferred acquisition costs
|
4,091,601
|
|
3,958,063
|
|
|||
|
Goodwill
|
441,591
|
|
441,591
|
|
|||
|
Other assets
|
538,540
|
|
528,536
|
|
|||
|
Assets related to discontinued operations
|
68,571
|
|
68,520
|
|
|||
|
Total assets
|
$
|
23,469,488
|
|
$
|
23,474,985
|
|
|
|
Liabilities:
|
|||||||
|
Future policy benefits
|
$
|
13,842,694
|
|
$
|
13,439,472
|
|
|
|
Unearned and advance premiums
|
62,139
|
|
61,430
|
|
|||
|
Policy claims and other benefits payable
|
337,981
|
|
333,294
|
|
|||
|
Other policyholders' funds
|
97,007
|
|
97,635
|
|
|||
|
Total policy liabilities
|
14,339,821
|
|
13,931,831
|
|
|||
|
Current and deferred income taxes payable
|
1,072,856
|
|
1,312,002
|
|
|||
|
Other liabilities
|
493,726
|
|
489,609
|
|
|||
|
Short-term debt
|
615,011
|
|
328,067
|
|
|||
|
Long-term debt (estimated fair value: 2018—$1,387,229; 2017—$1,228,392)
|
1,358,947
|
|
1,132,201
|
|
|||
|
Liabilities related to discontinued operations
|
50,222
|
|
49,854
|
|
|||
|
Total liabilities
|
17,930,583
|
|
17,243,564
|
|
|||
|
Commitments and Contingencies (
Note 6
)
|
|
|
|||||
|
Shareholders’ equity:
|
|||||||
|
Preferred stock, par value $1 per share—Authorized 5,000,000 shares; outstanding: 0 in 2018 and 2017
|
—
|
|
—
|
|
|||
|
Common stock, par value $1 per share—Authorized 320,000,000 shares; outstanding: (2018— 124,218,183 issued, less 12,050,407 held in treasury and 2017—124,218,183 issued, less 9,625,104 held in treasury)
|
124,218
|
|
124,218
|
|
|||
|
Additional paid-in capital
|
527,489
|
|
508,476
|
|
|||
|
Accumulated other comprehensive income
|
477,624
|
|
1,424,274
|
|
|||
|
Retained earnings
|
5,267,964
|
|
4,806,208
|
|
|||
|
Treasury stock, at cost
|
(858,390
|
)
|
(631,755
|
)
|
|||
|
Total shareholders’ equity
|
5,538,905
|
|
6,231,421
|
|
|||
|
Total liabilities and shareholders’ equity
|
$
|
23,469,488
|
|
$
|
23,474,985
|
|
|
See accompanying Notes to Condensed Consolidated Financial Statements.
1
TMK 2018 FORM 10-Q QTR 3
TORCHMARK CORPORATION
(Unaudited)
(Dollar amounts in thousands, except per share data)
|
|
Three Months Ended
September 30, |
Nine Months Ended
September 30, |
|||||||||||||
|
|
2018
|
2017
|
2018
|
2017
|
|||||||||||
|
Revenue:
|
|||||||||||||||
|
Life premium
|
$
|
605,547
|
|
$
|
576,223
|
|
$
|
1,806,384
|
|
$
|
1,725,896
|
|
|||
|
Health premium
|
255,201
|
|
242,991
|
|
758,439
|
|
730,557
|
|
|||||||
|
Other premium
|
2
|
|
3
|
|
12
|
|
9
|
|
|||||||
|
Total premium
|
860,750
|
|
819,217
|
|
2,564,835
|
|
2,456,462
|
|
|||||||
|
Net investment income
|
221,627
|
|
213,872
|
|
658,279
|
|
634,930
|
|
|||||||
|
Realized investment gains (losses)
|
1,032
|
|
12,595
|
|
14,796
|
|
6,142
|
|
|||||||
|
Other income
|
393
|
|
331
|
|
1,104
|
|
1,140
|
|
|||||||
|
Total revenue
|
1,083,802
|
|
1,046,015
|
|
3,239,014
|
|
3,098,674
|
|
|||||||
|
Benefits and expenses:
|
|||||||||||||||
|
Life policyholder benefits
|
396,701
|
|
386,445
|
|
1,196,616
|
|
1,168,383
|
|
|||||||
|
Health policyholder benefits
|
162,574
|
|
155,774
|
|
483,654
|
|
470,104
|
|
|||||||
|
Other policyholder benefits
|
8,581
|
|
9,000
|
|
25,852
|
|
26,923
|
|
|||||||
|
Total policyholder benefits
|
567,856
|
|
551,219
|
|
1,706,122
|
|
1,665,410
|
|
|||||||
|
Amortization of deferred acquisition costs
|
129,492
|
|
122,334
|
|
388,189
|
|
370,363
|
|
|||||||
|
Commissions, premium taxes, and non-deferred acquisition costs
|
69,632
|
|
67,863
|
|
208,698
|
|
198,011
|
|
|||||||
|
Other operating expense
|
74,059
|
|
63,019
|
|
209,503
|
|
187,788
|
|
|||||||
|
Interest expense
|
22,433
|
|
20,970
|
|
66,466
|
|
62,825
|
|
|||||||
|
Total benefits and expenses
|
863,472
|
|
825,405
|
|
2,578,978
|
|
2,484,397
|
|
|||||||
|
Income before income taxes
|
220,330
|
|
220,610
|
|
660,036
|
|
614,277
|
|
|||||||
|
Income taxes
|
(41,630
|
)
|
(67,264
|
)
|
(123,232
|
)
|
(183,390
|
)
|
|||||||
|
Income from continuing operations
|
178,700
|
|
153,346
|
|
536,804
|
|
430,887
|
|
|||||||
|
Income (loss) from discontinued operations, net of tax
|
24
|
|
(12
|
)
|
(55
|
)
|
(3,739
|
)
|
|||||||
|
Net income
|
$
|
178,724
|
|
$
|
153,334
|
|
$
|
536,749
|
|
$
|
427,148
|
|
|||
|
Basic net income (loss) per common share:
|
|
||||||||||||||
|
Continuing operations
|
$
|
1.59
|
|
$
|
1.32
|
|
$
|
4.74
|
|
$
|
3.69
|
|
|||
|
Discontinued operations
|
—
|
|
—
|
|
(0.01
|
)
|
(0.03
|
)
|
|||||||
|
Total basic net income per common share
|
$
|
1.59
|
|
$
|
1.32
|
|
$
|
4.73
|
|
$
|
3.66
|
|
|||
|
Diluted net income (loss) per common share:
|
|
||||||||||||||
|
Continuing operations
|
$
|
1.55
|
|
$
|
1.29
|
|
$
|
4.64
|
|
$
|
3.61
|
|
|||
|
Discontinued operations
|
—
|
|
—
|
|
—
|
|
(0.03
|
)
|
|||||||
|
Total diluted net income per common share
|
$
|
1.55
|
|
$
|
1.29
|
|
$
|
4.64
|
|
$
|
3.58
|
|
|||
|
Dividends declared per common share
|
$
|
0.16
|
|
$
|
0.15
|
|
$
|
0.48
|
|
$
|
0.45
|
|
|||
See accompanying Notes to Condensed Consolidated Financial Statements.
2
TMK 2018 FORM 10-Q QTR 3
TORCHMARK CORPORATION
CONDENSED CONSOLIDATED STATEMENTS OF COMPREHENSIVE INCOME
(Unaudited)
(Dollar amounts in thousands)
|
|
Three Months Ended
September 30, |
Nine Months Ended
September 30, |
|||||||||||||
|
|
2018
|
2017
|
2018
|
2017
|
|||||||||||
|
Net income
|
$
|
178,724
|
|
$
|
153,334
|
|
$
|
536,749
|
|
$
|
427,148
|
|
|||
|
Other comprehensive income (loss):
|
|||||||||||||||
|
Investments:
|
|||||||||||||||
|
Unrealized gains (losses) on securities:
|
|||||||||||||||
|
Unrealized holding gains (losses) arising during period
|
(173,598
|
)
|
83,216
|
|
(1,202,762
|
)
|
692,747
|
|
|||||||
|
Reclassification adjustment for (gains) losses on securities included in net income
|
(1,510
|
)
|
(12,910
|
)
|
(12,327
|
)
|
(13,264
|
)
|
|||||||
|
Reclassification adjustment for amortization of (discount) and premium
|
1,052
|
|
119
|
|
2,612
|
|
(379
|
)
|
|||||||
|
Foreign exchange adjustment on securities recorded at fair value
|
8,624
|
|
1,173
|
|
7,360
|
|
1,418
|
|
|||||||
|
Unrealized gains (losses) on securities
|
(165,432
|
)
|
71,598
|
|
(1,205,117
|
)
|
680,522
|
|
|||||||
|
Unrealized gains (losses) on other investments
|
1,310
|
|
473
|
|
(492
|
)
|
3,544
|
|
|||||||
|
Total unrealized investment gains (losses)
|
(164,122
|
)
|
72,071
|
|
|
(1,205,609
|
)
|
|
684,066
|
|
|||||
|
Less applicable tax (expense) benefit
|
34,464
|
|
(25,225
|
)
|
253,176
|
|
(239,479
|
)
|
|||||||
|
Unrealized investment gains (losses), net of tax
|
(129,658
|
)
|
46,846
|
|
(952,433
|
)
|
444,587
|
|
|||||||
|
Deferred acquisition costs:
|
|||||||||||||||
|
Unrealized gains (losses) attributable to deferred acquisition costs
|
1,178
|
|
505
|
|
3,669
|
|
(992
|
)
|
|||||||
|
Less applicable tax (expense) benefit
|
(248
|
)
|
(177
|
)
|
(771
|
)
|
347
|
|
|||||||
|
Unrealized gains (losses) attributable to deferred acquisition costs, net of tax
|
930
|
|
328
|
|
2,898
|
|
(645
|
)
|
|||||||
|
Foreign exchange translation:
|
|||||||||||||||
|
Foreign exchange translation adjustments, other than securities
|
(168
|
)
|
8,533
|
|
(7,684
|
)
|
16,049
|
|
|||||||
|
Less applicable tax (expense) benefit
|
36
|
|
(2,986
|
)
|
1,615
|
|
(4,567
|
)
|
|||||||
|
Foreign exchange translation adjustments, other than securities, net of tax
|
(132
|
)
|
5,547
|
|
(6,069
|
)
|
11,482
|
|
|||||||
|
Pension:
|
|||||||||||||||
|
Amortization of pension costs
|
3,778
|
|
3,108
|
|
11,334
|
|
9,326
|
|
|||||||
|
Experience gain (loss)
|
—
|
|
—
|
|
—
|
|
371
|
|
|||||||
|
Pension adjustments
|
3,778
|
|
3,108
|
|
11,334
|
|
9,697
|
|
|||||||
|
Less applicable tax (expense) benefit
|
(793
|
)
|
(1,087
|
)
|
(2,380
|
)
|
(3,393
|
)
|
|||||||
|
Pension adjustments, net of tax
|
2,985
|
|
2,021
|
|
8,954
|
|
6,304
|
|
|||||||
|
Other comprehensive income (loss)
|
(125,875
|
)
|
54,742
|
|
(946,650
|
)
|
461,728
|
|
|||||||
|
Comprehensive income (loss)
|
$
|
52,849
|
|
$
|
208,076
|
|
$
|
(409,901
|
)
|
$
|
888,876
|
|
|||
See accompanying Notes to Condensed Consolidated Financial Statements.
3
TMK 2018 FORM 10-Q QTR 3
TORCHMARK CORPORATION
CONDENSED CONSOLIDATED STATEMENTS OF SHAREHOLDERS' EQUITY
(Unaudited)
(Dollar amounts in thousands, except per share data)
|
Preferred Stock
|
Common Stock
|
Additional Paid-in Capital
|
Accumulated Other Comprehensive Income (Loss)
|
Retained Earnings
|
Treasury Stock
|
Total Shareholders’ Equity
|
||||||||||||||||||||||
|
Balance at January 1, 2017
|
$
|
—
|
|
$
|
127,218
|
|
$
|
490,421
|
|
$
|
577,574
|
|
$
|
3,890,798
|
|
$
|
(519,150
|
)
|
$
|
4,566,861
|
|
|||||||
|
Comprehensive income (loss)
|
|
|
|
461,728
|
|
427,148
|
|
|
888,876
|
|
||||||||||||||||||
|
Common dividends declared ($0.45 per share)
|
|
|
|
|
(52,304
|
)
|
|
(52,304
|
)
|
|||||||||||||||||||
|
Acquisition of treasury stock
|
|
|
|
|
|
(301,448
|
)
|
(301,448
|
)
|
|||||||||||||||||||
|
Stock-based compensation
|
|
|
17,965
|
|
|
(606
|
)
|
7,450
|
|
24,809
|
|
|||||||||||||||||
|
Exercise of stock options
|
|
|
|
|
|
(25,454
|
)
|
66,345
|
|
40,891
|
|
|||||||||||||||||
|
Balance at September 30, 2017
|
$
|
—
|
|
$
|
127,218
|
|
$
|
508,386
|
|
$
|
1,039,302
|
|
$
|
4,239,582
|
|
$
|
(746,803
|
)
|
$
|
5,167,685
|
|
|||||||
|
Preferred Stock
|
Common Stock
|
Additional Paid-in Capital
|
Accumulated Other Comprehensive Income (Loss)
|
Retained Earnings
|
Treasury Stock
|
Total Shareholders’ Equity
|
||||||||||||||||||||||
|
Balance at January 1, 2018
|
$
|
—
|
|
$
|
124,218
|
|
$
|
508,476
|
|
$
|
1,424,274
|
|
$
|
4,806,208
|
|
$
|
(631,755
|
)
|
$
|
6,231,421
|
|
|||||||
|
Adoption of ASU 2016-01
(1)
|
4,896
|
|
4,896
|
|
||||||||||||||||||||||||
|
Comprehensive income (loss)
|
|
|
|
(946,650
|
)
|
536,749
|
|
|
(409,901
|
)
|
||||||||||||||||||
|
Common dividends declared ($0.48 per share)
|
|
|
|
|
(54,231
|
)
|
|
(54,231
|
)
|
|||||||||||||||||||
|
Acquisition of treasury stock
|
|
|
|
|
|
(298,314
|
)
|
(298,314
|
)
|
|||||||||||||||||||
|
Stock-based compensation
|
|
|
19,013
|
|
|
(1,803
|
)
|
12,759
|
|
29,969
|
|
|||||||||||||||||
|
Exercise of stock options
|
|
|
|
|
|
(23,855
|
)
|
58,920
|
|
35,065
|
|
|||||||||||||||||
|
Balance at September 30, 2018
|
$
|
—
|
|
$
|
124,218
|
|
$
|
527,489
|
|
$
|
477,624
|
|
$
|
5,267,964
|
|
$
|
(858,390
|
)
|
$
|
5,538,905
|
|
|||||||
|
(1)
|
See further discussion in
Note 2—New Accounting Standards
and
Note 4—Investments
.
|
See accompanying Notes to Condensed Consolidated Financial Statements.
4
TMK 2018 FORM 10-Q QTR 3
TORCHMARK CORPORATION
(Unaudited)
(Dollar amounts in thousands)
|
|
Nine Months Ended
September 30, |
||||||
|
|
2018
|
2017
|
|||||
|
Cash provided from operating activities
|
$
|
937,289
|
|
$
|
1,085,842
|
|
|
|
Cash provided from (used for) investing activities:
|
|||||||
|
Investments sold or matured:
|
|||||||
|
Fixed maturities available for sale—sold
|
12,162
|
|
52,951
|
|
|||
|
Fixed maturities available for sale—matured, called, and repaid
|
266,736
|
|
306,132
|
|
|||
|
Other long-term investments
|
47
|
|
3,523
|
|
|||
|
Total investments sold or matured
|
278,945
|
|
362,606
|
|
|||
|
Acquisition of investments:
|
|||||||
|
Fixed maturities—available for sale
|
(727,296
|
)
|
(1,042,705
|
)
|
|||
|
Other long-term investments
|
(74,396
|
)
|
(16,775
|
)
|
|||
|
Total investments acquired
|
(801,692
|
)
|
(1,059,480
|
)
|
|||
|
Net (increase) decrease in policy loans
|
(14,307
|
)
|
(15,343
|
)
|
|||
|
Net (increase) decrease in short-term investments
|
(506,419
|
)
|
6,556
|
|
|||
|
Additions to property and equipment
|
(27,316
|
)
|
(13,451
|
)
|
|||
|
Sale of other assets
|
17
|
|
18
|
|
|||
|
Investment in low-income housing interests
|
(19,075
|
)
|
(13,852
|
)
|
|||
|
Cash provided from (used for) investing activities
|
(1,089,847
|
)
|
(732,946
|
)
|
|||
|
Cash provided from (used for) financing activities:
|
|||||||
|
Issuance of common stock
|
35,065
|
|
40,891
|
|
|||
|
Cash dividends paid to shareholders
|
(53,481
|
)
|
(51,532
|
)
|
|||
|
Proceeds from issuance of debt
|
550,000
|
|
—
|
|
|||
|
Payment for debt issuance costs
|
(6,797
|
)
|
—
|
|
|||
|
Repayment of debt
|
(23,125
|
)
|
(1,250
|
)
|
|||
|
Net borrowing (repayment) of commercial paper
|
(7,196
|
)
|
42,652
|
|
|||
|
Acquisition of treasury stock
|
(298,314
|
)
|
(301,448
|
)
|
|||
|
Net receipts (payments) from deposit-type product
|
(87,561
|
)
|
(65,912
|
)
|
|||
|
Cash provided from (used for) financing activities
|
108,591
|
|
(336,599
|
)
|
|||
|
Effect of foreign exchange rate changes on cash
|
2,843
|
|
(3,998
|
)
|
|||
|
Net increase (decrease) in cash
|
(41,124
|
)
|
12,299
|
|
|||
|
Cash at beginning of year
|
118,563
|
|
76,163
|
|
|||
|
Cash at end of period
|
$
|
77,439
|
|
$
|
88,462
|
|
|
See accompanying Notes to Condensed Consolidated Financial Statements.
5
TMK 2018 FORM 10-Q QTR 3
TORCHMARK CORPORATION
NOTES TO CONDENSED CONSOLIDATED FINANCIAL STATEMENTS
(UNAUDITED)
(Dollar amounts in thousands, except per share data)
Basis of Presentation:
The accompanying condensed consolidated financial statements of Torchmark Corporation (Torchmark or alternatively, the Company) have been prepared in accordance with the instructions to Form 10-Q. Therefore, they do not include all of the annual disclosures required by accounting principles generally accepted in the United States of America (GAAP). However, in the opinion of management, these statements include all adjustments, consisting of normal recurring adjustments, which are necessary for a fair presentation of the condensed consolidated financial position at
September 30, 2018
, and the condensed consolidated results of operations, comprehensive income, and cash flows for the periods ended
September 30, 2018
and
2017
. The interim period condensed consolidated financial statements should be read in conjunction with the
Consolidated Financial Statements
that are included in the Form 10-K filed with the Securities Exchange Commission (SEC) on February 26, 2018.
Accounting Pronouncements Adopted in the Current Year:
ASU 2016-01:
In January 2016, the Financial Accounting Standards Board (FASB) issued Accounting Standards Update (ASU) No. 2016-01,
Financial Instruments—Overall (Subtopic 825-10): Recognition and Measurement of Financial Assets and Financial Liabilities,
which primarily revises the classification and measurement of certain equity investments such that they will be measured at fair value through net income. Additionally, the guidance eliminates the cost method for partnerships and joint ventures and requires these types of investments to be accounted for under the fair value through net income or equity method. This standard became effective for the Company on January 1, 2018.
On January 1, 2018, the Company adopted this standard on a modified retrospective basis for two types of investments: equity securities and certain limited partnerships. The adoption resulted in a
$4.9 million
after-tax positive adjustment to the opening balance of retained earnings. Subsequent to the adoption, the Company elected to measure its investment in certain limited partnerships at fair value in accordance with the fair value option for financial instruments with changes recognized in "Realized Investment Gains (Losses)" in the
Condensed Consolidated Statements of Operations
.
As of
September 30, 2018
, the fair value balance of the limited partnerships were
$108 million
. See
Note 4—Investments
for further discussion.
ASU 2016-15:
In August 2016, the FASB issued ASU No. 2016-15,
Statement of Cash Flows (Topic 230): Classification of Certain Cash Receipts and Cash Payments
to provide uniformity in the classification of cash receipts and payments recorded in the statement of cash flows including debt prepayment or debt extinguishment costs, settlement of zero-coupon bonds, and proceeds from the settlement of insurance claims. This standard became effective on January 1, 2018 and did not have a significant impact to the classification on the
Condensed
Statement of Cash Flows
.
ASU 2016-16:
In October 2016, the FASB issued ASU No. 2016-16,
Income Taxes (Topic 740): Intra-Entity Transfer of Assets Other Than Inventory.
This guidance was issued to improve the accounting for income tax consequences of intra-entity transfers of assets other than inventory by allowing the immediate recognition of the current and deferred income tax effects. Current guidance prohibits the recognition of current and deferred income taxes for an intra-entity transfer until the asset has been sold to an outside party. This guidance is applied on a modified retrospective approach and became effective on January 1, 2018. This adoption did not have a significant impact on the financial statements.
ASU 2017-07:
In March 2017, the FASB issued ASU No. 2017-07,
Compensation—Retirement Benefits (Topic 715): Improving the Presentation of Net Periodic Pension Cost and Net Periodic Postretirement Benefit Cost.
This guidance was issued to simplify the reporting of pension costs by disaggregating the service-cost component from the other components of net benefit costs and reporting it separately on the income statement. The service-cost component is the only component of net benefit cost that will be eligible for capitalization. The guidance became effective on January 1, 2018 with a retrospective transition method for separation of net benefit costs and a prospective transition method for the capitalization of service costs. The Company will record approximately
$3.2 million
in additional expense to the 2018
Condensed Consolidated Statements of Operations
due to the elimination of the ability to capitalize a portion of the benefit costs. For the
nine
months ended
September 30, 2018
, the Company recorded
$2.4 million
in additional expense.
6
TMK 2018 FORM 10-Q QTR 3
TORCHMARK CORPORATION
NOTES TO CONDENSED CONSOLIDATED FINANCIAL STATEMENTS
(UNAUDITED)
(Dollar amounts in thousands, except per share data)
Note 2—New Accounting Standards (continued)
ASU 2017-09:
In May 2017, the FASB issued ASU No. 2017-09,
Compensation—Stock Compensation (Topic 718): Scope of Modification Accounting.
This guidance was issued to provide clarity and guidance regarding changes to the terms or conditions of a share-based payment award that requires an entity to apply modification accounting. It became effective on January 1, 2018. The adoption had no significant impact on the financial statements as modifications to stock compensation are infrequent.
ASU 2018-02
: In February 2018, the FASB issued ASU No. 2018-02,
Income Statement—Reporting Comprehensive Income (Topic 220): Reclassification of Certain Tax Effects from Accumulated Other Comprehensive Income
(AOCI)
.
This guidance was issued to allow the reclassification of taxes from AOCI to retained earnings as a result of the reduction in corporate income tax rates due to the Tax Cuts and Jobs Act of 2017 (Tax Legislation). Current accounting requires the effect of changes in tax rates used to measure deferred tax assets and liabilities to be reported in net income as of the date of enactment even though deferred taxes were previously recognized in AOCI (stranded taxes). This guidance, however, allows a company to elect to reclassify the stranded taxes in AOCI to retained earnings and is effective for years beginning after December 15, 2018, with early adoption permitted. The Company elected to early adopt this guidance resulting in a reclassification of
$252 million
from AOCI to retained earnings for the period ended December 31, 2017.
Accounting Pronouncements Not Yet Adopted
ASU 2016-02/ASU 2018-11:
In February 2016, the FASB issued ASU No. 2016-02,
Leases (Topic 842)
, with clarification guidance issued in July 2018. The guidance requires lessees to record a right-of-use asset and corresponding lease liability on the balance sheet for all operating leases that do not qualify for the practical expedients allowed for in this standard. Additional qualitative and quantitative disclosures will be required. This standard will become effective for the Company beginning January 1, 2019. The Company plans to adopt the optional transition method allowed for under ASU 2018-11 by not restating comparative periods and recognizing a cumulative-effect adjustment to the opening balance of retained earnings on the period of adoption. The Company is not a lessor.
The Company has made significant progress during 2018 and has implemented appropriate solutions to identify and quantify applicable operating leases in accordance with this guidance. The Company is in the process of finalizing the analysis of the impact of the new guidance, but does not expect the adoption to have a significant impact on the financial statements. Refer to
Note 15—Commitments and Contingencies
of the 2017 10-K for consideration of the noncancelable operating lease commitments.
ASU 2016-13:
In June 2016, the FASB issued ASU No. 2016-13,
Financial Instruments—Credit Losses (Topic 326): Measurement of Credit Losses on Financial Instruments
to provide financial statement users with more decision-useful information about the expected credit losses on financial instruments as well as to change the loss impairment methodology for available-for-sale debt securities by use of an allowance rather than a direct write-down. This standard will become effective on January 1, 2020. The applicable section of the standard related to debt securities requires a prospective transition. The Company does not expect the adoption to have a significant impact on the financial statements as we have limited credit losses with respect to our current available-for-sale portfolio.
ASU 2017-04:
In January 2017, the FASB issued ASU No. 2017-04,
Intangibles—Goodwill and Other (Topic 350): Simplifying the Test for Goodwill Impairment.
This guidance was issued to simplify the subsequent measurement of goodwill through the elimination of Step 2 from the goodwill impairment test which required a hypothetical purchase price allocation. It will become effective on January 1, 2020 and should be applied on a prospective basis. This adoption will not have an impact on the financial statements.
ASU 2017-08:
In March 2017, the FASB issued ASU No. 2017-08,
Receivables—Nonrefundable Fees and Other Costs (Topic 310-20): Premium Amortization on Purchased Callable Debt Securities.
This guidance was issued to shorten the amortization period for certain callable debt securities held at a premium. The guidance requires the premium to be amortized to the earliest call date. It will become effective on January 1, 2019 with early adoption permitted, including during interim periods. The adoption is to be applied on a modified retrospective basis through an adjustment to retained earnings. This adoption will not have a significant impact on the financial statements.
7
TMK 2018 FORM 10-Q QTR 3
TORCHMARK CORPORATION
NOTES TO CONDENSED CONSOLIDATED FINANCIAL STATEMENTS
(UNAUDITED)
(Dollar amounts in thousands, except per share data)
ASU 2018-12:
In August 2018, the FASB issued ASU No. 2018-12,
Financial Services - Insurance (Topic 944): Targeted Improvements to the Accounting for Long-Duration Contracts
. The guidance was primarily issued to 1) improve the timeliness of recognizing changes in the liability for future policy benefits and modify the rate used to discount future cash flows, 2) simplify and improve the accounting for certain market-based options or guarantees associated with deposit (or account balance) contracts, 3) simplify the amortization of deferred acquisition costs, and 4) improve the effectiveness of the required disclosures. This guidance is effective beginning January 1, 2021, and should be applied on a retrospective basis. Early adoption of the amendments is permitted. ASU 2018-12 will require changes to the Company's actuarial systems and data inputs related to the valuation of the liabilities. The Company is in the process of evaluating the impact this guidance will have on the financial statements and cannot reasonably estimate at this time.
ASU 2018-13:
In August 2018, the FASB issued ASU No. 2018-13,
Fair Value Measurement (Topic 820): Disclosure Framework-Changes to the Disclosure Requirements for Fair Value Measurement
. The amendment modifies the disclosure requirements for fair value measurements by removing, modifying, or adding certain disclosures. The revised guidance is effective beginning January 1, 2020. The removed and modified disclosures will be adopted on a retrospective basis and the new disclosures will be adopted on a prospective basis. Early adoption of the amendments is permitted. The Company does not expect the adoption of this guidance to have a material impact on the financial statements.
ASU 2018-14:
In August 2018, the FASB issued ASU No. 2018-14,
Compensation-Retirement Benefits-Defined Benefit Plans-General (Subtopic 715-20), Changes to the Disclosure Requirements for Defined Benefit Plans
. The guidance removes disclosures that are no longer considered cost beneficial, clarifies the specific requirements of disclosures and adds disclosure requirements identified as relevant. This guidance is effective beginning January 1, 2021, and will be applied retrospectively. Early adoption is permitted. The Company does not expect the adoption of this guidance to have a material impact on the financial statements.
ASU 2018-15:
In August 2018, the FASB issued ASU No. 2018-15,
Intangibles-Goodwill and Other-Internal-Use Software (Subtopic 350-40): Customer’s Accounting for Implementation Costs Incurred in a Cloud Computing Arrangement that is a Service Contract.
The guidance was issued to align the accounting for implementation costs of hosting arrangements, regardless of whether they convey a license to the hosted software. Accordingly, the standard requires the capitalization of implementation costs incurred in a hosting arrangement that is a service contract, similar to the treatment for developed or obtained internal-use software. The guidance is effective beginning January 1, 2020, and the Company plans to apply the standards on a prospective basis. Early adoption of the amendments is also permitted. The Company is in the process of determining the impact this guidance will have on the financial statements.
8
TMK 2018 FORM 10-Q QTR 3
TORCHMARK CORPORATION
NOTES TO CONDENSED CONSOLIDATED FINANCIAL STATEMENTS
(UNAUDITED)
(Dollar amounts in thousands, except per share data)
An analysis of the change in balance by component of Accumulated Other Comprehensive Income is as follows for the
three and nine
month periods ended
September 30, 2018
and
2017
.
Components of Accumulated Other Comprehensive Income
|
|
Three Months Ended September 30, 2017
|
||||||||||||||||||
|
|
Available
for Sale Assets |
Deferred
Acquisition Costs |
Foreign
Exchange |
Pension
Adjustments |
Total
|
||||||||||||||
|
Balance at July 1, 2017
|
$
|
1,090,055
|
|
$
|
(7,655
|
)
|
$
|
10,902
|
|
$
|
(108,742
|
)
|
$
|
984,560
|
|
||||
|
Other comprehensive income (loss) before reclassifications, net of tax
|
55,160
|
|
328
|
|
5,547
|
|
—
|
|
61,035
|
|
|||||||||
|
Reclassifications, net of tax
|
(8,314
|
)
|
—
|
|
—
|
|
2,021
|
|
(6,293
|
)
|
|||||||||
|
Other comprehensive income (loss)
|
46,846
|
|
328
|
|
5,547
|
|
2,021
|
|
54,742
|
|
|||||||||
|
Balance at September 30, 2017
|
$
|
1,136,901
|
|
$
|
(7,327
|
)
|
$
|
16,449
|
|
$
|
(106,721
|
)
|
$
|
1,039,302
|
|
||||
|
|
Three Months Ended September 30, 2018
|
||||||||||||||||||
|
|
Available
for Sale Assets |
Deferred
Acquisition Costs |
Foreign
Exchange |
Pension
Adjustments |
Total
|
||||||||||||||
|
Balance at July 1, 2018
|
$
|
746,514
|
|
$
|
(6,579
|
)
|
$
|
10,365
|
|
$
|
(146,801
|
)
|
$
|
603,499
|
|
||||
|
Other comprehensive income (loss) before reclassifications, net of tax
|
(129,296
|
)
|
930
|
|
(132
|
)
|
—
|
|
(128,498
|
)
|
|||||||||
|
Reclassifications, net of tax
|
(362
|
)
|
—
|
|
—
|
|
2,985
|
|
2,623
|
|
|||||||||
|
Other comprehensive income (loss)
|
(129,658
|
)
|
930
|
|
(132
|
)
|
2,985
|
|
(125,875
|
)
|
|||||||||
|
Balance at September 30, 2018
|
$
|
616,856
|
|
$
|
(5,649
|
)
|
$
|
10,233
|
|
$
|
(143,816
|
)
|
$
|
477,624
|
|
||||
9
TMK 2018 FORM 10-Q QTR 3
TORCHMARK CORPORATION
NOTES TO CONDENSED CONSOLIDATED FINANCIAL STATEMENTS
(UNAUDITED)
(Dollar amounts in thousands except, per share data)
Note 3—Supplemental Information about Changes to Accumulated Other Comprehensive Income (continued)
|
|
Nine Months Ended September 30, 2017
|
|||||||||||||||||||
|
|
Available
for Sale Assets |
Deferred
Acquisition Costs |
Foreign
Exchange |
Pension
Adjustments |
Total
|
|||||||||||||||
|
Balance at January 1, 2017
|
$
|
692,314
|
|
$
|
(6,682
|
)
|
$
|
4,967
|
|
$
|
(113,025
|
)
|
$
|
577,574
|
|
|||||
|
Other comprehensive income (loss) before reclassifications, net of tax
|
453,455
|
|
(645
|
)
|
11,482
|
|
241
|
|
464,533
|
|
||||||||||
|
Reclassifications, net of tax
|
(8,868
|
)
|
—
|
|
—
|
|
6,063
|
|
(2,805
|
)
|
||||||||||
|
Other comprehensive income (loss)
|
444,587
|
|
(645
|
)
|
11,482
|
|
6,304
|
|
461,728
|
|
||||||||||
|
Balance at September 30, 2017
|
$
|
1,136,901
|
|
$
|
(7,327
|
)
|
$
|
16,449
|
|
$
|
(106,721
|
)
|
$
|
1,039,302
|
|
|||||
|
|
Nine Months Ended September 30, 2018
|
|||||||||||||||||||
|
|
Available
for Sale Assets |
Deferred
Acquisition Costs |
Foreign
Exchange |
Pension
Adjustments |
Total
|
|||||||||||||||
|
Balance at January 1, 2018
|
$
|
1,569,289
|
|
$
|
(8,547
|
)
|
$
|
16,302
|
|
$
|
(152,770
|
)
|
$
|
1,424,274
|
|
|||||
|
Other comprehensive income (loss) before reclassifications, net of tax
|
(944,758
|
)
|
2,898
|
|
(6,069
|
)
|
—
|
|
(947,929
|
)
|
||||||||||
|
Reclassifications, net of tax
|
(7,675
|
)
|
—
|
|
—
|
|
8,954
|
|
1,279
|
|
||||||||||
|
Other comprehensive income (loss)
|
(952,433
|
)
|
2,898
|
|
(6,069
|
)
|
8,954
|
|
(946,650
|
)
|
||||||||||
|
Balance at September 30, 2018
|
$
|
616,856
|
|
$
|
(5,649
|
)
|
$
|
10,233
|
|
$
|
(143,816
|
)
|
$
|
477,624
|
|
|||||
10
TMK 2018 FORM 10-Q QTR 3
TORCHMARK CORPORATION
NOTES TO CONDENSED CONSOLIDATED FINANCIAL STATEMENTS
(UNAUDITED)
(Dollar amounts in thousands except, per share data)
Reclassifications out of Accumulated Other Comprehensive Income are presented below for the
three and nine
month periods ended
September 30, 2018
and
2017
.
|
Reclassification Adjustments
|
||||||||||||||||||
|
|
Three Months Ended
September 30, |
Nine Months Ended
September 30, |
Affected line items in the
Statement of Operations
|
|||||||||||||||
|
|
2018
|
2017
|
2018
|
2017
|
||||||||||||||
|
Unrealized investment gains (losses) on available for sale assets:
|
||||||||||||||||||
|
Realized (gains) losses
|
$
|
(1,510
|
)
|
$
|
(12,910
|
)
|
$
|
(12,327
|
)
|
$
|
(13,264
|
)
|
Realized investment gains (losses)
|
|||||
|
Amortization of (discount) premium
|
1,052
|
|
119
|
|
2,612
|
|
(379
|
)
|
Net investment income
|
|||||||||
|
Total before tax
|
(458
|
)
|
(12,791
|
)
|
(9,715
|
)
|
(13,643
|
)
|
||||||||||
|
Tax
|
96
|
|
4,477
|
|
2,040
|
|
4,775
|
|
Income taxes
|
|||||||||
|
Total after-tax
|
(362
|
)
|
(8,314
|
)
|
(7,675
|
)
|
(8,868
|
)
|
||||||||||
|
Pension adjustments:
|
||||||||||||||||||
|
Amortization of prior service cost
|
119
|
|
118
|
|
357
|
|
356
|
|
Other operating expense
|
|||||||||
|
Amortization of actuarial gain (loss)
|
3,659
|
|
2,990
|
|
10,977
|
|
8,970
|
|
Other operating expense
|
|||||||||
|
Total before tax
|
3,778
|
|
3,108
|
|
11,334
|
|
9,326
|
|
||||||||||
|
Tax
|
(793
|
)
|
(1,087
|
)
|
(2,380
|
)
|
(3,263
|
)
|
Income taxes
|
|||||||||
|
Total after-tax
|
2,985
|
|
2,021
|
|
8,954
|
|
6,063
|
|
||||||||||
|
Total reclassifications (after-tax)
|
$
|
2,623
|
|
$
|
(6,293
|
)
|
$
|
1,279
|
|
$
|
(2,805
|
)
|
||||||
11
TMK 2018 FORM 10-Q QTR 3
TORCHMARK CORPORATION
NOTES TO CONDENSED CONSOLIDATED FINANCIAL STATEMENTS
(UNAUDITED)
(Dollar amounts in thousands, except per share data)
Portfolio Composition
:
A summary of fixed maturities available for sale by cost or amortized cost and estimated fair value at
September 30, 2018
and
December 31, 2017
is as follows:
|
September 30, 2018
|
|||||||||||||||||
|
Cost or
Amortized
Cost
|
Gross
Unrealized
Gains
|
Gross
Unrealized
Losses
|
Fair Value
(1)
|
% of Total
Fixed
Maturities
(2)
|
|||||||||||||
|
Fixed maturities available for sale:
|
|||||||||||||||||
|
U.S. Government direct, guaranteed, and government-sponsored enterprises
|
$
|
392,779
|
|
$
|
255
|
|
$
|
(11,643
|
)
|
$
|
381,391
|
|
3
|
||||
|
States, municipalities, and political subdivisions
|
1,262,710
|
|
84,503
|
|
(4,853
|
)
|
1,342,360
|
|
8
|
||||||||
|
Foreign governments
|
18,918
|
|
1,721
|
|
—
|
|
20,639
|
|
—
|
||||||||
|
Corporates, by sector:
|
|||||||||||||||||
|
Financial
|
3,363,794
|
|
239,614
|
|
(62,445
|
)
|
3,540,963
|
|
21
|
||||||||
|
Utilities
|
1,964,029
|
|
215,959
|
|
(21,005
|
)
|
2,158,983
|
|
13
|
||||||||
|
Energy
|
1,635,710
|
|
136,144
|
|
(37,978
|
)
|
1,733,876
|
|
11
|
||||||||
|
Other corporate sectors
|
6,242,246
|
|
329,169
|
|
(165,172
|
)
|
6,406,243
|
|
40
|
||||||||
|
Total corporates
|
13,205,779
|
|
920,886
|
|
(286,600
|
)
|
13,840,065
|
|
85
|
||||||||
|
Collateralized debt obligations
|
57,794
|
|
26,119
|
|
(4,997
|
)
|
78,916
|
|
—
|
||||||||
|
Other asset-backed securities
|
150,218
|
|
1,845
|
|
(872
|
)
|
151,191
|
|
1
|
||||||||
|
Redeemable preferred stocks, by sector:
|
|||||||||||||||||
|
Financial
|
345,651
|
|
46,022
|
|
(4,197
|
)
|
387,476
|
|
3
|
||||||||
|
Utilities
|
28,515
|
|
1,332
|
|
(414
|
)
|
29,433
|
|
—
|
||||||||
|
Total redeemable preferred stocks
|
374,166
|
|
47,354
|
|
(4,611
|
)
|
416,909
|
|
3
|
||||||||
|
Total fixed maturities
|
$
|
15,462,364
|
|
$
|
1,082,683
|
|
$
|
(313,576
|
)
|
$
|
16,231,471
|
|
100
|
||||
|
(1)
|
Amounts reported on the balance sheet.
|
|
(2)
|
At fair value.
|
12
TMK 2018 FORM 10-Q QTR 3
TORCHMARK CORPORATION
NOTES TO CONDENSED CONSOLIDATED FINANCIAL STATEMENTS
(UNAUDITED)
(Dollar amounts in thousands, except per share data)
Note 4—Investments (continued)
|
December 31, 2017
|
|||||||||||||||||
|
Cost or
Amortized
Cost
|
Gross
Unrealized
Gains
|
Gross
Unrealized
Losses
|
Fair Value
(1)
|
% of Total
Fixed
Maturities
(2)
|
|||||||||||||
|
Fixed maturities available for sale:
|
|||||||||||||||||
|
U.S. Government direct, guaranteed, and government-sponsored enterprises
|
$
|
390,646
|
|
$
|
18,173
|
|
$
|
(1,373
|
)
|
$
|
407,446
|
|
2
|
||||
|
States, municipalities, and political subdivisions
|
1,091,960
|
|
127,890
|
|
(135
|
)
|
1,219,715
|
|
7
|
||||||||
|
Foreign governments
|
20,236
|
|
1,782
|
|
—
|
|
22,018
|
|
—
|
||||||||
|
Corporates, by sector:
|
|
|
|||||||||||||||
|
Financial
|
3,282,526
|
|
475,961
|
|
(23,392
|
)
|
3,735,095
|
|
22
|
||||||||
|
Utilities
|
1,955,737
|
|
369,406
|
|
(1,298
|
)
|
2,323,845
|
|
14
|
||||||||
|
Energy
|
1,619,349
|
|
226,140
|
|
(25,392
|
)
|
1,820,097
|
|
11
|
||||||||
|
Other corporate sectors
|
6,065,803
|
|
747,612
|
|
(20,616
|
)
|
6,792,799
|
|
40
|
||||||||
|
Total corporates
|
12,923,415
|
|
1,819,119
|
|
(70,698
|
)
|
14,671,836
|
|
87
|
||||||||
|
Collateralized debt obligations
|
59,150
|
|
20,084
|
|
(7,653
|
)
|
71,581
|
|
—
|
||||||||
|
Other asset-backed securities
|
144,520
|
|
4,835
|
|
—
|
|
149,355
|
|
1
|
||||||||
|
Redeemable preferred stocks, by sector:
|
|||||||||||||||||
|
Financial
|
336,621
|
|
62,892
|
|
(2,727
|
)
|
396,786
|
|
3
|
||||||||
|
Utilities
|
28,553
|
|
2,132
|
|
(97
|
)
|
30,588
|
|
—
|
||||||||
|
Total redeemable preferred stocks
|
365,174
|
|
65,024
|
|
(2,824
|
)
|
427,374
|
|
3
|
||||||||
|
Total fixed maturities
|
$
|
14,995,101
|
|
$
|
2,056,907
|
|
$
|
(82,683
|
)
|
$
|
16,969,325
|
|
100
|
||||
|
(1)
|
Amounts reported on the balance sheet.
|
|
(2)
|
At fair value.
|
A schedule of fixed maturities available for sale by contractual maturity date at
September 30, 2018
is shown below on an amortized cost basis and on a fair value basis. Actual disposition dates could differ from contractual maturities due to call or prepayment provisions.
|
September 30, 2018
|
|||||||
|
Amortized
Cost |
Fair Value
|
||||||
|
Fixed maturities available for sale:
|
|||||||
|
Due in one year or less
|
$
|
189,867
|
|
$
|
193,934
|
|
|
|
Due after one year through five years
|
611,511
|
|
632,417
|
|
|||
|
Due after five years through ten years
|
1,686,348
|
|
1,820,952
|
|
|||
|
Due after ten years through twenty years
|
5,023,824
|
|
5,505,111
|
|
|||
|
Due after twenty years
|
7,742,061
|
|
7,848,163
|
|
|||
|
Mortgage-backed and asset-backed securities
|
208,753
|
|
230,894
|
|
|||
|
$
|
15,462,364
|
|
$
|
16,231,471
|
|
||
13
TMK 2018 FORM 10-Q QTR 3
TORCHMARK CORPORATION
NOTES TO CONDENSED CONSOLIDATED FINANCIAL STATEMENTS
(UNAUDITED)
(Dollar amounts in thousands, except per share data)
Note 4—Investments (continued)
Selected information about sales of fixed maturities available for sale is as follows.
|
Three Months Ended
September 30, |
Nine Months Ended
September 30, |
||||||||||||||
|
|
2018
|
2017
|
2018
|
2017
|
|||||||||||
|
Fixed maturities available for sale:
|
|||||||||||||||
|
Proceeds from sales
|
$
|
12,162
|
|
$
|
52,951
|
|
$
|
12,162
|
|
$
|
52,951
|
|
|||
|
Gross realized gains
|
66
|
|
4,851
|
|
66
|
|
4,851
|
|
|||||||
|
Gross realized losses
|
—
|
|
—
|
|
—
|
|
—
|
|
|||||||
Fair Value Measurements
: The following tables represent the fair value of fixed maturities available for sale measured on a recurring basis at
September 30, 2018
and
December 31, 2017
.
|
Fair Value Measurements at September 30, 2018 using:
|
|||||||||||||||
|
Description
|
Quoted Prices in
Active Markets
for Identical
Assets (Level 1)
|
Significant Other
Observable
Inputs (Level 2)
|
Significant
Unobservable
Inputs (Level 3)
|
Total Fair
Value
|
|||||||||||
|
Fixed maturities available for sale:
|
|||||||||||||||
|
U.S. Government direct, guaranteed, and government-sponsored enterprises
|
$
|
—
|
|
$
|
381,391
|
|
$
|
—
|
|
$
|
381,391
|
|
|||
|
States, municipalities, and political subdivisions
|
—
|
|
1,342,360
|
|
—
|
|
1,342,360
|
|
|||||||
|
Foreign governments
|
—
|
|
20,639
|
|
—
|
|
20,639
|
|
|||||||
|
Corporates, by sector:
|
|||||||||||||||
|
Financial
|
—
|
|
3,497,807
|
|
43,156
|
|
3,540,963
|
|
|||||||
|
Utilities
|
—
|
|
2,006,462
|
|
152,521
|
|
2,158,983
|
|
|||||||
|
Energy
|
—
|
|
1,694,481
|
|
39,395
|
|
1,733,876
|
|
|||||||
|
Other corporate sectors
|
—
|
|
6,085,281
|
|
320,962
|
|
6,406,243
|
|
|||||||
|
Total corporates
|
—
|
|
13,284,031
|
|
556,034
|
|
13,840,065
|
|
|||||||
|
Collateralized debt obligations
|
—
|
|
—
|
|
78,916
|
|
78,916
|
|
|||||||
|
Other asset-backed securities
|
—
|
|
138,407
|
|
12,784
|
|
151,191
|
|
|||||||
|
Redeemable preferred stocks, by sector:
|
|||||||||||||||
|
Financial
|
—
|
|
387,476
|
|
—
|
|
387,476
|
|
|||||||
|
Utilities
|
—
|
|
29,433
|
|
—
|
|
29,433
|
|
|||||||
|
Total redeemable preferred stocks
|
—
|
|
416,909
|
|
—
|
|
416,909
|
|
|||||||
|
Total fixed maturities
|
$
|
—
|
|
$
|
15,583,737
|
|
$
|
647,734
|
|
$
|
16,231,471
|
|
|||
|
Percent of total
|
—
|
%
|
96.0
|
%
|
4.0
|
%
|
100.0
|
%
|
|||||||
14
TMK 2018 FORM 10-Q QTR 3
TORCHMARK CORPORATION
NOTES TO CONDENSED CONSOLIDATED FINANCIAL STATEMENTS
(UNAUDITED)
(Dollar amounts in thousands, except per share data)
Note 4—Investments (continued)
|
Fair Value Measurements at December 31, 2017 using:
|
|||||||||||||||
|
Description
|
Quoted Prices in
Active Markets
for Identical
Assets (Level 1)
|
Significant Other
Observable
Inputs (Level 2)
|
Significant
Unobservable
Inputs (Level 3)
|
Total Fair
Value
|
|||||||||||
|
Fixed maturities available for sale:
|
|||||||||||||||
|
U.S. Government direct, guaranteed, and government-sponsored enterprises
|
$
|
—
|
|
$
|
407,446
|
|
$
|
—
|
|
$
|
407,446
|
|
|||
|
States, municipalities, and political subdivisions
|
44
|
|
1,219,671
|
|
—
|
|
1,219,715
|
|
|||||||
|
Foreign governments
|
—
|
|
22,018
|
|
—
|
|
22,018
|
|
|||||||
|
Corporates, by sector:
|
|
|
|||||||||||||
|
Financial
|
—
|
|
3,673,089
|
|
62,006
|
|
3,735,095
|
|
|||||||
|
Utilities
|
—
|
|
2,168,115
|
|
155,730
|
|
2,323,845
|
|
|||||||
|
Energy
|
—
|
|
1,779,281
|
|
40,816
|
|
1,820,097
|
|
|||||||
|
Other corporate sectors
|
—
|
|
6,468,541
|
|
324,258
|
|
6,792,799
|
|
|||||||
|
Total corporates
|
—
|
|
14,089,026
|
|
582,810
|
|
14,671,836
|
|
|||||||
|
Collateralized debt obligations
|
—
|
|
—
|
|
71,581
|
|
71,581
|
|
|||||||
|
Other asset-backed securities
|
—
|
|
135,306
|
|
14,049
|
|
149,355
|
|
|||||||
|
Redeemable preferred stocks, by sector:
|
|||||||||||||||
|
Financial
|
—
|
|
396,786
|
|
—
|
|
396,786
|
|
|||||||
|
Utilities
|
—
|
|
30,588
|
|
—
|
|
30,588
|
|
|||||||
|
Total redeemable preferred stocks
|
—
|
|
427,374
|
|
—
|
|
427,374
|
|
|||||||
|
Total fixed maturities
|
$
|
44
|
|
$
|
16,300,841
|
|
$
|
668,440
|
|
$
|
16,969,325
|
|
|||
|
Percentage of total
|
—
|
%
|
96.1
|
%
|
3.9
|
%
|
100.0
|
%
|
|||||||
The following tables represent an analysis of changes in fair value measurements using significant unobservable inputs (Level 3)
for the nine months ended September 30, 2018
and
2017
.
Analysis of Changes in Fair Value Measurements Using
Significant Unobservable Inputs (Level 3)
|
|
Nine Months Ended September 30, 2018
|
||||||||||||||
|
|
Asset-
Backed Securities |
Collateralized
Debt Obligations |
Corporates
(1)
|
Total
|
|||||||||||
|
Balance at January 1, 2018
|
$
|
14,049
|
|
$
|
71,581
|
|
$
|
582,810
|
|
$
|
668,440
|
|
|||
|
Total gains or losses:
|
|||||||||||||||
|
Included in realized gains/losses
|
—
|
|
—
|
|
698
|
|
698
|
|
|||||||
|
Included in other comprehensive income
|
(950
|
)
|
8,691
|
|
(21,854
|
)
|
(14,113
|
)
|
|||||||
|
Acquisitions
|
—
|
|
—
|
|
27,453
|
|
27,453
|
|
|||||||
|
Sales
|
—
|
|
—
|
|
—
|
|
—
|
|
|||||||
|
Amortization
|
—
|
|
3,572
|
|
13
|
|
3,585
|
|
|||||||
|
Other
(2)
|
(315
|
)
|
(4,928
|
)
|
(37,619
|
)
|
(42,862
|
)
|
|||||||
|
Transfers in and/or out of Level 3
(3)
|
—
|
|
—
|
|
4,533
|
|
4,533
|
|
|||||||
|
Balance at September 30, 2018
|
$
|
12,784
|
|
$
|
78,916
|
|
$
|
556,034
|
|
$
|
647,734
|
|
|||
|
Percent of total fixed maturities
|
0.1
|
%
|
0.5
|
%
|
3.4
|
%
|
4.0
|
%
|
|||||||
|
(1)
|
Includes redeemable preferred stocks.
|
|
(2)
|
Includes capitalized interest, foreign exchange adjustments, and principal repayments.
|
|
(3)
|
Considered to be transferred at the end of the period. Transfers into Level 3 occur when observable inputs are no longer available. Transfers out of Level 3 occur when observable inputs become available.
|
15
TMK 2018 FORM 10-Q QTR 3
TORCHMARK CORPORATION
NOTES TO CONDENSED CONSOLIDATED FINANCIAL STATEMENTS
(UNAUDITED)
(Dollar amounts in thousands, except per share data)
Note 4—Investments (continued)
|
|
Nine Months Ended September 30, 2017
|
||||||||||||||
|
|
Asset-
Backed Securities |
Collateralized
Debt Obligations |
Corporates
(1)
|
Total
|
|||||||||||
|
Balance at January 1, 2017
|
$
|
—
|
|
$
|
63,503
|
|
$
|
559,600
|
|
$
|
623,103
|
|
|||
|
Total gains or losses:
|
|||||||||||||||
|
Included in realized gains/losses
|
—
|
|
—
|
|
—
|
|
—
|
|
|||||||
|
Included in other comprehensive income
|
595
|
|
7,787
|
|
10,614
|
|
18,996
|
|
|||||||
|
Acquisitions
|
14,000
|
|
—
|
|
21,666
|
|
35,666
|
|
|||||||
|
Sales
|
—
|
|
—
|
|
—
|
|
—
|
|
|||||||
|
Amortization
|
—
|
|
3,705
|
|
14
|
|
3,719
|
|
|||||||
|
Other
(2)
|
(212
|
)
|
(5,227
|
)
|
(7,411
|
)
|
(12,850
|
)
|
|||||||
|
Transfers in and/or out of Level 3
(3)
|
—
|
|
—
|
|
—
|
|
—
|
|
|||||||
|
Balance at September 30, 2017
|
$
|
14,383
|
|
$
|
69,768
|
|
$
|
584,483
|
|
$
|
668,634
|
|
|||
|
Percent of total fixed maturities
|
0.1
|
%
|
0.4
|
%
|
3.5
|
%
|
4.0
|
%
|
|||||||
|
(1)
|
Includes redeemable preferred stocks.
|
|
(2)
|
Includes capitalized interest, foreign exchange adjustments, and principal repayments.
|
|
(3)
|
Considered to be transferred at the end of the period. Transfers into Level 3 occur when observable inputs are no longer available. Transfers out of Level 3 occur when observable inputs become available.
|
The following table presents transfers in and out of each of the valuation levels of fair values.
|
Nine Months Ended September 30,
|
||||||||||||||||||||||||
|
2018
|
2017
|
|||||||||||||||||||||||
|
|
In
|
Out
|
Net
|
In
|
Out
|
Net
|
||||||||||||||||||
|
Level 1
|
$
|
—
|
|
$
|
—
|
|
$
|
—
|
|
$
|
42,328
|
|
$
|
(597
|
)
|
$
|
41,731
|
|
||||||
|
Level 2
|
—
|
|
(4,533
|
)
|
(4,533
|
)
|
597
|
|
(42,328
|
)
|
(41,731
|
)
|
||||||||||||
|
Level 3
|
4,533
|
|
—
|
|
4,533
|
|
—
|
|
—
|
|
—
|
|
||||||||||||
16
TMK 2018 FORM 10-Q QTR 3
TORCHMARK CORPORATION
NOTES TO CONDENSED CONSOLIDATED FINANCIAL STATEMENTS
(UNAUDITED)
(Dollar amounts in thousands, except per share data)
Note 4—Investments (continued)
Fair Value Option
:
As discussed in
Note 2—New Accounting Standards
, the Company elected the fair value option in the first quarter of 2018, subsequent to the adoption of ASU 2016-01, to record its investment in certain limited partnerships at fair value with changes recognized in "Realized Investment Gains (Losses)" in the
Condensed Consolidated Statements of Operations
.
Distributions received on a semi-annual basis are recorded in Net Investment Income. The limited partnerships are recorded in Other Long-Term Investments on the
Condensed Consolidated Balance Sheets
.
The following table represents the fair value of investments elected for the fair value option method measured on a recurring basis at
September 30, 2018
, and the changes in fair value for the
nine
months ended
September 30, 2018
.
|
Fair Value Measurements at September 30, 2018
|
Changes in Fair Values for the Period for Items Measured at Fair Value Pursuant to Election of the Fair Value Option
|
||||||||||||||||||||||||||
|
Quoted Prices in Active Markets for Identical Assets (Level 1)
|
Significant Other Observable Inputs (Level 2)
|
Significant Unobservable Inputs
(Level 3) |
Total Fair Value
|
Net Gains and Losses Recognized During the Period
|
Less Net Gains and Losses Recognized due to Sales
|
Total Changes in Fair Values Included in Current-Period Earnings
|
|||||||||||||||||||||
|
Limited partnerships
|
$
|
—
|
|
$
|
107,996
|
|
$
|
—
|
|
$
|
107,996
|
|
$
|
2,405
|
|
$
|
—
|
|
$
|
2,405
|
|
||||||
Other-Than-Temporary Impairments
:
In accordance with the other-than-temporary impairment (OTTI) policy, the Company evaluated its fixed maturities available for sale in an unrealized loss position to determine if there was any impairment for the quarter. Gross unrealized losses may fluctuate quarter over quarter due to adverse factors in the market that affect our holdings, such as changes in the interest rates or credit spreads. While the Company holds securities that may be in an unrealized loss position from time to time, Torchmark has the ability and intent to hold these investments to recovery. Additionally, Torchmark does not expect to be required to sell any of its securities due to the strong cash flows generated by its insurance operations.
For the
nine
months ended
September 30, 2018
, the Company concluded that there were
no
other-than-temporary impairments. For the
nine
months ended
September 30, 2017
, the Company recorded
$245 thousand
(
$159 thousand
, net of tax) in OTTI.
Unrealized Loss Analysis
:
The following table discloses information about fixed maturities available for sale in an unrealized loss position.
|
Less than
Twelve Months
|
Twelve Months
or Longer
|
Total
|
|||||||
|
Number of issues (CUSIP numbers) held:
|
|||||||||
|
As of September 30, 2018
|
598
|
|
122
|
|
720
|
|
|||
|
As of December 31, 2017
|
92
|
|
102
|
|
194
|
|
|||
Torchmark’s entire fixed maturity portfolio consisted of
1,538
issues at
September 30, 2018
and
1,502
issues at
December 31, 2017
. The weighted average quality rating of all unrealized loss positions as of
September 30, 2018
was
BBB+
compared with
BBB-
as of
December 31, 2017
.
17
TMK 2018 FORM 10-Q QTR 3
TORCHMARK CORPORATION
NOTES TO CONDENSED CONSOLIDATED FINANCIAL STATEMENTS
(UNAUDITED)
(Dollar amounts in thousands, except per share data)
Note 4—Investments (continued)
The following tables disclose unrealized investment losses by class and major sector of fixed maturities available for sale at
September 30, 2018
and
December 31, 2017
, respectively. Torchmark considers these investments to be only temporarily impaired.
Analysis of Gross Unrealized Investment Losses
At
September 30, 2018
|
|
Less than
Twelve Months
|
Twelve Months
or Longer
|
Total
|
||||||||||||||||||||
|
Description of Securities
|
Fair
Value
|
Unrealized
Loss
|
Fair
Value |
Unrealized
Loss
|
Fair
Value |
Unrealized
Loss
|
|||||||||||||||||
|
Fixed maturities available for sale:
|
|||||||||||||||||||||||
|
Investment grade securities:
|
|||||||||||||||||||||||
|
U.S. Government direct, guaranteed, and government-sponsored enterprises
|
$
|
291,797
|
|
$
|
(8,844
|
)
|
$
|
66,160
|
|
$
|
(2,799
|
)
|
$
|
357,957
|
|
$
|
(11,643
|
)
|
|||||
|
States, municipalities and political subdivisions
|
181,894
|
|
(4,832
|
)
|
1,632
|
|
(21
|
)
|
183,526
|
|
(4,853
|
)
|
|||||||||||
|
Corporates, by sector:
|
|||||||||||||||||||||||
|
Financial
|
934,194
|
|
(38,148
|
)
|
69,993
|
|
(5,518
|
)
|
1,004,187
|
|
(43,666
|
)
|
|||||||||||
|
Utilities
|
420,921
|
|
(17,417
|
)
|
45,084
|
|
(3,540
|
)
|
466,005
|
|
(20,957
|
)
|
|||||||||||
|
Energy
|
216,903
|
|
(8,981
|
)
|
49,052
|
|
(7,689
|
)
|
265,955
|
|
(16,670
|
)
|
|||||||||||
|
Other corporate sectors
|
2,611,151
|
|
(122,430
|
)
|
235,655
|
|
(25,153
|
)
|
2,846,806
|
|
(147,583
|
)
|
|||||||||||
|
Total corporates
|
4,183,169
|
|
(186,976
|
)
|
399,784
|
|
(41,900
|
)
|
4,582,953
|
|
(228,876
|
)
|
|||||||||||
|
Other asset-backed securities
|
64,963
|
|
(872
|
)
|
—
|
|
—
|
|
64,963
|
|
(872
|
)
|
|||||||||||
|
Redeemable preferred stocks, by sector:
|
|||||||||||||||||||||||
|
Financial
|
10,050
|
|
(725
|
)
|
—
|
|
—
|
|
10,050
|
|
(725
|
)
|
|||||||||||
|
Utilities
|
—
|
|
—
|
|
5,594
|
|
(414
|
)
|
5,594
|
|
(414
|
)
|
|||||||||||
|
Total redeemable preferred stocks
|
10,050
|
|
(725
|
)
|
5,594
|
|
(414
|
)
|
15,644
|
|
(1,139
|
)
|
|||||||||||
|
Total investment grade securities
|
4,731,873
|
|
(202,249
|
)
|
473,170
|
|
(45,134
|
)
|
5,205,043
|
|
(247,383
|
)
|
|||||||||||
|
Below investment grade securities:
|
|||||||||||||||||||||||
|
Corporates, by sector:
|
|
|
|
|
|
|
|
|
|||||||||||||||
|
Financial
|
24,873
|
|
(5,895
|
)
|
62,073
|
|
(12,884
|
)
|
86,946
|
|
(18,779
|
)
|
|||||||||||
|
Utilities
|
15,059
|
|
(48
|
)
|
—
|
|
—
|
|
15,059
|
|
(48
|
)
|
|||||||||||
|
Energy
|
12,647
|
|
(533
|
)
|
68,890
|
|
(20,775
|
)
|
81,537
|
|
(21,308
|
)
|
|||||||||||
|
Other corporate sectors
|
47,218
|
|
(1,713
|
)
|
68,813
|
|
(15,876
|
)
|
116,031
|
|
(17,589
|
)
|
|||||||||||
|
Total corporates
|
99,797
|
|
(8,189
|
)
|
199,776
|
|
(49,535
|
)
|
299,573
|
|
(57,724
|
)
|
|||||||||||
|
Collateralized debt obligations
|
—
|
|
—
|
|
15,003
|
|
(4,997
|
)
|
15,003
|
|
(4,997
|
)
|
|||||||||||
|
Redeemable preferred stocks, by sector:
|
|||||||||||||||||||||||
|
Financial
|
—
|
|
—
|
|
23,611
|
|
(3,472
|
)
|
23,611
|
|
(3,472
|
)
|
|||||||||||
|
Total redeemable preferred stocks
|
—
|
|
—
|
|
23,611
|
|
(3,472
|
)
|
23,611
|
|
(3,472
|
)
|
|||||||||||
|
Total below investment grade securities
|
99,797
|
|
(8,189
|
)
|
238,390
|
|
(58,004
|
)
|
338,187
|
|
(66,193
|
)
|
|||||||||||
|
Total fixed maturities
|
$
|
4,831,670
|
|
$
|
(210,438
|
)
|
$
|
711,560
|
|
$
|
(103,138
|
)
|
$
|
5,543,230
|
|
$
|
(313,576
|
)
|
|||||
18
TMK 2018 FORM 10-Q QTR 3
TORCHMARK CORPORATION
NOTES TO CONDENSED CONSOLIDATED FINANCIAL STATEMENTS
(UNAUDITED)
(Dollar amounts in thousands, except per share data)
Analysis of Gross Unrealized Investment Losses
At
December 31, 2017
|
|
Less than
Twelve Months
|
Twelve Months
or Longer
|
Total
|
||||||||||||||||||||
|
Description of Securities
|
Fair
Value
|
Unrealized
Loss
|
Fair Value
|
Unrealized
Loss
|
Fair Value
|
Unrealized
Loss
|
|||||||||||||||||
|
Fixed maturities available for sale:
|
|||||||||||||||||||||||
|
Investment grade securities:
|
|||||||||||||||||||||||
|
U.S. Government direct, guaranteed, and government-sponsored enterprises
|
$
|
34,388
|
|
$
|
(422
|
)
|
$
|
47,514
|
|
$
|
(951
|
)
|
$
|
81,902
|
|
$
|
(1,373
|
)
|
|||||
|
States, municipalities and political subdivisions
|
4,561
|
|
(21
|
)
|
1,771
|
|
(9
|
)
|
6,332
|
|
(30
|
)
|
|||||||||||
|
Corporates, by sector:
|
|||||||||||||||||||||||
|
Financial
|
133,080
|
|
(652
|
)
|
35,302
|
|
(1,429
|
)
|
168,382
|
|
(2,081
|
)
|
|||||||||||
|
Utilities
|
48,562
|
|
(569
|
)
|
32,345
|
|
(729
|
)
|
80,907
|
|
(1,298
|
)
|
|||||||||||
|
Energy
|
23,463
|
|
(81
|
)
|
67,775
|
|
(3,682
|
)
|
91,238
|
|
(3,763
|
)
|
|||||||||||
|
Other corporate sectors
|
220,661
|
|
(2,312
|
)
|
163,886
|
|
(4,257
|
)
|
384,547
|
|
(6,569
|
)
|
|||||||||||
|
Total corporates
|
425,766
|
|
(3,614
|
)
|
299,308
|
|
(10,097
|
)
|
725,074
|
|
(13,711
|
)
|
|||||||||||
|
Redeemable preferred stocks, by sector:
|
|||||||||||||||||||||||
|
Utilities
|
—
|
|
—
|
|
5,953
|
|
(97
|
)
|
5,953
|
|
(97
|
)
|
|||||||||||
|
Total redeemable preferred stocks
|
—
|
|
—
|
|
5,953
|
|
(97
|
)
|
5,953
|
|
(97
|
)
|
|||||||||||
|
Total investment grade securities
|
464,715
|
|
(4,057
|
)
|
354,546
|
|
(11,154
|
)
|
819,261
|
|
(15,211
|
)
|
|||||||||||
|
Below investment grade securities:
|
|||||||||||||||||||||||
|
States, municipalities and political subdivisions
|
200
|
|
(105
|
)
|
—
|
|
—
|
|
200
|
|
(105
|
)
|
|||||||||||
|
Corporates, by sector:
|
|||||||||||||||||||||||
|
Financial
|
—
|
|
—
|
|
84,432
|
|
(21,311
|
)
|
84,432
|
|
(21,311
|
)
|
|||||||||||
|
Energy
|
8,114
|
|
(104
|
)
|
75,204
|
|
(21,525
|
)
|
83,318
|
|
(21,629
|
)
|
|||||||||||
|
Other corporate sectors
|
25,334
|
|
(5,066
|
)
|
54,383
|
|
(8,981
|
)
|
79,717
|
|
(14,047
|
)
|
|||||||||||
|
Total corporates
|
33,448
|
|
(5,170
|
)
|
214,019
|
|
(51,817
|
)
|
247,467
|
|
(56,987
|
)
|
|||||||||||
|
Collateralized debt obligations
|
—
|
|
—
|
|
12,347
|
|
(7,653
|
)
|
12,347
|
|
(7,653
|
)
|
|||||||||||
|
Redeemable preferred stocks, by sector:
|
|||||||||||||||||||||||
|
Financial
|
—
|
|
—
|
|
24,376
|
|
(2,727
|
)
|
24,376
|
|
(2,727
|
)
|
|||||||||||
|
Total redeemable preferred stocks
|
—
|
|
—
|
|
24,376
|
|
(2,727
|
)
|
24,376
|
|
(2,727
|
)
|
|||||||||||
|
Total below investment grade securities
|
33,648
|
|
(5,275
|
)
|
250,742
|
|
(62,197
|
)
|
284,390
|
|
(67,472
|
)
|
|||||||||||
|
Total fixed maturities
|
$
|
498,363
|
|
$
|
(9,332
|
)
|
$
|
605,288
|
|
$
|
(73,351
|
)
|
$
|
1,103,651
|
|
$
|
(82,683
|
)
|
|||||
19
TMK 2018 FORM 10-Q QTR 3
TORCHMARK CORPORATION
NOTES TO CONDENSED CONSOLIDATED FINANCIAL STATEMENTS
(UNAUDITED)
(Dollar amounts in thousands, except per share data)
In 2017, the newly enacted tax legislation revised the corporate income tax rate from 35% to 21%, effective January 1, 2018. The change in tax rates was the primary reason for the difference in the Company’s effective tax rate as compared with the prior year periods.
The effective income tax rate differed from the expected rate for the
three and nine
month periods ended
September 30, 2018
and
2017
as shown below:
|
|
Three Months Ended September 30,
|
||||||||||||
|
|
2018
|
%
|
2017
|
%
|
|||||||||
|
Expected income taxes
|
$
|
46,270
|
|
21.0
|
|
$
|
77,214
|
|
35.0
|
|
|||
|
Increase (reduction) in income taxes resulting from:
|
|||||||||||||
|
Low income housing investments
|
(2,779
|
)
|
(1.3
|
)
|
(4,367
|
)
|
(2.0
|
)
|
|||||
|
Share-based awards
|
(2,601
|
)
|
(1.2
|
)
|
(5,075
|
)
|
(2.3
|
)
|
|||||
|
Other
|
740
|
|
0.4
|
|
(508
|
)
|
(0.2
|
)
|
|||||
|
Income tax expense (benefit) from continuing operations
|
$
|
41,630
|
|
18.9
|
|
$
|
67,264
|
|
30.5
|
|
|||
|
|
Nine Months Ended September 30,
|
||||||||||||
|
|
2018
|
%
|
2017
|
%
|
|||||||||
|
Expected income taxes
|
$
|
138,608
|
|
21.0
|
|
$
|
214,997
|
|
35.0
|
|
|||
|
Increase (reduction) in income taxes resulting from:
|
|||||||||||||
|
Low income housing investments
|
(9,428
|
)
|
(1.4
|
)
|
(13,665
|
)
|
(2.2
|
)
|
|||||
|
Share-based awards
|
(6,855
|
)
|
(1.0
|
)
|
(14,513
|
)
|
(2.4
|
)
|
|||||
|
Other
|
907
|
|
0.1
|
|
(3,429
|
)
|
(0.5
|
)
|
|||||
|
Income tax expense (benefit) from continuing operations
|
$
|
123,232
|
|
18.7
|
|
$
|
183,390
|
|
29.9
|
|
|||
As of December 31, 2017, the Company recorded
$877 million
of tax benefits in net income, which results from remeasuring its deferred tax assets and liabilities using the lower corporate tax rate as of the legislation’s enactment date. The Company was able to determine that the adjustment recorded in 2017 was a reasonable estimate of the impact of the tax legislation in accordance with SAB 118. The guidance allows companies up to one year to finalize the impact. The Company did not make any adjustments to this estimate for the period ended
September 30, 2018
. However, the Company will continue to analyze relevant information to complete the accounting for income taxes process in the fourth quarter of 2018.
Litigation
:
Torchmark and its subsidiaries, in common with the insurance industry in general, are subject to litigation involving various matters where we are either the defendant or the plaintiff. Torchmark subsidiaries are also currently the subject of audits regarding the identification, reporting and escheatment of unclaimed property arising from life insurance policies and a limited number of annuity contracts. In each of these matters, based upon information presently available, management does not believe that such litigation or audits will have a material adverse effect on Torchmark’s financial condition, future operating results or liquidity.
On February 1, 2018, putative class action litigation was filed against American Income Life Insurance Company in U.S. District Court for the Northern District of Texas, Dallas Division (
Bruce v. American Income Life Insurance Company, et al.
, Case No. 3:18-cv-00258-G). The plaintiff, a former insurance sales agent of American Income who is suing on
20
TMK 2018 FORM 10-Q QTR 3
TORCHMARK CORPORATION
NOTES TO CONDENSED CONSOLIDATED FINANCIAL STATEMENTS
(UNAUDITED)
(Dollar amounts in thousands, except per share data)
behalf of all current and former American Income sales agents contracted through State General Agent Stephen Jubrey’s agency office at any time since January 31, 2015 through the final disposition of this matter, asserts that such agents are employees rather than independent contractors as they are classified by American Income. He alleges failure to pay minimum wages, overtime wages and other applicable monies in accordance with the Fair Labor Standards Act. The plaintiff seeks, in a jury trial, actual and punitive damages, pre- and post-judgment interest, attorney fees, costs and other relief, including injunctive relief. On February 27, 2018, the Company filed a motion to compel arbitration of this matter and on July 27, 2018, the Court granted the Company’s motion.
On September 12, 2018, putative class action litigation was filed against American Income Life Insurance Company in California’s Contra Costa County Superior Court (
Joh v. American Income Life Insurance Company
, Case No. C18-01863). The plaintiff, a former insurance sales agent of American Income, is suing on behalf of all current and former sales agents who sold insurance for American Income in the state of California for the last four years prior to the filing of the complaint. The complaint alleges that sales agents are employees and asserts claims under the California Labor Code and California Business and Professions Code. The complaint seeks compensatory damages, penalties and attorney fees on claims for failure to pay wages/commissions, failure to appropriately pay agents at termination, failure to provide itemized wage statements, failure to reimburse expenses and unfair business practices. The Company continues to assess the amount and thus does not have a reasonable estimate of any potential liability.
On October 18, 2018, putative class action litigation was filed against Torchmark Corporation and American Income Life Insurance Company in California’s Los Angeles County Superior Court (
Golz v. American Income Life Insurance Company
,
et al
Case No. 18STCV01354). The complaint alleges that the putative class members are employees and asserts claims under the California Labor Code, California Business and Professions Code, and the Fair Labor Standards Act. The complaint alleges that plaintiff was an American Income insurance agent trainee in California who seeks to represent classes of individuals whom American Income classified as independent contractors during the class periods alleged. One class period based on California Labor Code claims is alleged to begin four years prior to the complaint’s filing. Another class period, which is based on the Fair Labor Standards Act claim, is alleged to begin three years prior to the complaint’s filing and is pleaded as a national class. The complaint seeks compensatory damages, penalties, and attorney fees on claims for failure to pay wages due, failure to appropriately pay wages at termination, failure to provide itemized wage statements, and unfair business practices. The Company continues to assess the amount and thus does not have a reasonable estimate of any potential liability.
With respect to current litigation, at this time management believes that the possibility of a material judgment adverse to Torchmark is remote, and no estimate of range can be made for loss contingencies that are at least reasonably possible but not accrued.
Guarantees:
Torchmark has guaranteed letters of credit in connection with its credit facility with a group of banks. The letters of credit were issued by TMK Re, Ltd., a wholly-owned subsidiary, to secure TMK Re, Ltd.’s obligation for claims on certain policies reinsured by TMK Re, Ltd. that were sold by other Torchmark insurance companies. These letters of credit facilitate TMK Re, Ltd.’s ability to reinsure the business of Torchmark’s insurance carriers. The agreement expires in 2021. The maximum amount of letters of credit available is
$250 million
. Torchmark would be liable to the extent that TMK Re, Ltd. does not pay the reinsured party. On March 14, 2018, the letters of credit were amended to reduce the current amount outstanding to
$155 million
from
$177 million
as of December 31, 2017.
21
TMK 2018 FORM 10-Q QTR 3
TORCHMARK CORPORATION
NOTES TO CONDENSED CONSOLIDATED FINANCIAL STATEMENTS
(UNAUDITED)
(Dollar amounts in thousands, except per share data)
Activity in the liability for unpaid health claims is summarized as follows:
|
|
Nine Months Ended
September 30, |
||||||
|
|
2018
|
2017
|
|||||
|
Balance at beginning of period
|
$
|
146,865
|
|
$
|
143,128
|
|
|
|
Incurred related to:
|
|||||||
|
Current year
|
411,662
|
|
393,747
|
|
|||
|
Prior years
|
(3,795
|
)
|
(10,745
|
)
|
|||
|
Total incurred
|
407,867
|
|
383,002
|
|
|||
|
Paid related to:
|
|||||||
|
Current year
|
293,800
|
|
279,563
|
|
|||
|
Prior years
|
113,109
|
|
103,010
|
|
|||
|
Total paid
|
406,909
|
|
382,573
|
|
|||
|
Balance at end of period
|
$
|
147,823
|
|
$
|
143,557
|
|
|
Below is the reconciliation of the liability for
"Policy claims and other benefits payable"
in the
Condensed Consolidated Balance Sheets
.
|
September 30,
2018 |
December 31, 2017
|
||||||
|
Policy claims and other benefits payable:
|
|||||||
|
Life insurance
|
$
|
190,158
|
|
$
|
186,429
|
|
|
|
Health insurance
|
147,823
|
|
146,865
|
|
|||
|
Total
|
$
|
337,981
|
|
$
|
333,294
|
|
|
22
TMK 2018 FORM 10-Q QTR 3
TORCHMARK CORPORATION
NOTES TO CONDENSED CONSOLIDATED FINANCIAL STATEMENTS
(UNAUDITED)
(Dollar amounts in thousands except per share data)
The following tables present a summary of post-retirement benefit costs by component for the
three and nine
month periods ended
September 30, 2018
and
2017
.
Components of Post-Retirement Benefit Costs
|
|
Three Months Ended September 30,
|
||||||||||||||
|
|
Pension Benefits
|
Other Benefits
|
|||||||||||||
|
|
2018
|
2017
|
2018
|
2017
|
|||||||||||
|
Service cost
|
$
|
5,277
|
|
$
|
4,486
|
|
$
|
—
|
|
$
|
—
|
|
|||
|
Interest cost
|
5,496
|
|
5,552
|
|
228
|
|
249
|
|
|||||||
|
Expected return on assets
|
(6,363
|
)
|
(5,900
|
)
|
—
|
|
—
|
|
|||||||
|
Amortization:
|
|||||||||||||||
|
Prior service cost
|
119
|
|
118
|
|
—
|
|
—
|
|
|||||||
|
Actuarial (gain) loss
|
3,636
|
|
2,952
|
|
23
|
|
38
|
|
|||||||
|
Direct recognition of expense
|
—
|
|
—
|
|
80
|
|
111
|
|
|||||||
|
Net periodic benefit cost
|
$
|
8,165
|
|
$
|
7,208
|
|
$
|
331
|
|
$
|
398
|
|
|||
|
|
Nine Months Ended September 30,
|
||||||||||||||
|
|
Pension Benefits
|
Other Benefits
|
|||||||||||||
|
|
2018
|
2017
|
2018
|
2017
|
|||||||||||
|
Service cost
|
$
|
15,831
|
|
$
|
13,457
|
|
$
|
—
|
|
$
|
—
|
|
|||
|
Interest cost
|
16,482
|
|
16,653
|
|
684
|
|
749
|
|
|||||||
|
Expected return on assets
|
(19,089
|
)
|
(17,697
|
)
|
—
|
|
—
|
|
|||||||
|
Amortization:
|
|||||||||||||||
|
Prior service cost
|
357
|
|
356
|
|
—
|
|
—
|
|
|||||||
|
Actuarial (gain) loss
|
10,908
|
|
8,855
|
|
69
|
|
115
|
|
|||||||
|
Direct recognition of expense
|
—
|
|
—
|
|
305
|
|
323
|
|
|||||||
|
Net periodic benefit cost
|
$
|
24,489
|
|
$
|
21,624
|
|
$
|
1,058
|
|
$
|
1,187
|
|
|||
23
TMK 2018 FORM 10-Q QTR 3
TORCHMARK CORPORATION
NOTES TO CONSOLIDATED FINANCIAL STATEMENTS
(UNAUDITED)
(Dollar amounts in thousands except per share data)
Note 8—Postretirement Benefit Plans (continued)
The following tables present the assets of Torchmark’s defined benefit pension plans at
September 30, 2018
and
December 31, 2017
.
Pension Assets by Component at
September 30, 2018
|
|
Fair Value Determined by:
|
|
|
||||||||||||||
|
|
Quoted Prices in
Active Markets
for Identical
Assets (Level 1)
|
Significant
Observable
Inputs (Level 2)
|
Significant
Unobservable
Inputs (Level 3)
|
Total
Amount
|
% to
Total
|
||||||||||||
|
Corporate bonds:
|
|||||||||||||||||
|
Financial
|
$
|
$
|
47,522
|
|
$
|
$
|
47,522
|
|
11
|
||||||||
|
Utilities
|
39,258
|
|
39,258
|
|
9
|
||||||||||||
|
Energy
|
23,632
|
|
23,632
|
|
6
|
||||||||||||
|
Other corporates
|
84,388
|
|
84,388
|
|
20
|
||||||||||||
|
Total corporate bonds
|
—
|
|
194,800
|
|
—
|
|
194,800
|
|
46
|
||||||||
|
Exchange traded fund
(1)
|
181,449
|
|
181,449
|
|
43
|
||||||||||||
|
Other bonds
|
242
|
|
242
|
|
—
|
||||||||||||
|
Other long-term investments
|
5,366
|
|
5,366
|
|
1
|
||||||||||||
|
Guaranteed annuity contract
(2)
|
26,418
|
|
26,418
|
|
7
|
||||||||||||
|
Short-term investments
|
9,304
|
|
9,304
|
|
2
|
||||||||||||
|
Other
|
4,179
|
|
4,179
|
|
1
|
||||||||||||
|
Total Pension Assets
|
$
|
194,932
|
|
$
|
226,826
|
|
$
|
—
|
|
$
|
421,758
|
|
100
|
||||
|
(1)
|
A fund including marketable securities that mirror the S&P 500 index.
|
|
(2)
|
Representing a guaranteed annuity contract issued by Torchmark's subsidiary, American Income Life Insurance Company, to fund the obligations of the American Income Pension Plan.
|
Pension Assets by Component at
December 31, 2017
|
|
Fair Value Determined by:
|
|
|
||||||||||||||
|
|
Quoted Prices in
Active Markets
for Identical
Assets (Level 1)
|
Significant
Observable
Inputs (Level 2)
|
Significant
Unobservable
Inputs (Level 3)
|
Total
Amount
|
% to
Total
|
||||||||||||
|
Corporate bonds:
|
|||||||||||||||||
|
Financial
|
$
|
$
|
43,451
|
|
$
|
$
|
43,451
|
|
12
|
||||||||
|
Utilities
|
46,144
|
|
46,144
|
|
12
|
||||||||||||
|
Energy
|
25,023
|
|
25,023
|
|
7
|
||||||||||||
|
Other corporates
|
65,888
|
|
65,888
|
|
17
|
||||||||||||
|
Total corporate bonds
|
—
|
|
180,506
|
|
—
|
|
180,506
|
|
48
|
||||||||
|
Exchange traded fund
(1)
|
164,351
|
|
164,351
|
|
43
|
||||||||||||
|
Other bonds
|
256
|
|
256
|
|
—
|
||||||||||||
|
Other long-term investments
|
2,304
|
|
2,304
|
|
1
|
||||||||||||
|
Guaranteed annuity contract
(2)
|
21,202
|
|
21,202
|
|
6
|
||||||||||||
|
Short-term investments
|
3,984
|
|
3,984
|
|
1
|
||||||||||||
|
Other
|
5,021
|
|
5,021
|
|
1
|
||||||||||||
|
Total Pension Assets
|
$
|
173,356
|
|
$
|
204,268
|
|
$
|
—
|
|
$
|
377,624
|
|
100
|
||||
|
(1)
|
A fund including marketable securities that mirror the S&P 500 index.
|
|
(2)
|
Representing a guaranteed annuity contract issued by Torchmark's subsidiary, American Income Life Insurance Company, to fund the obligations of the American Income Pension Plan.
|
24
TMK 2018 FORM 10-Q QTR 3
TORCHMARK CORPORATION
NOTES TO CONSOLIDATED FINANCIAL STATEMENTS
(UNAUDITED)
(Dollar amounts in thousands except per share data)
The following table presents liabilities for the defined-benefit pension plans at
September 30, 2018
and
December 31, 2017
.
Pension Liability
|
September 30,
2018 |
December 31, 2017
|
||||||
|
Funded defined benefit pension
|
$
|
494,323
|
|
$
|
518,141
|
|
|
|
SERP
(1)
|
85,732
|
|
84,465
|
|
|||
|
Pension Benefit Obligation
|
$
|
580,055
|
|
$
|
602,606
|
|
|
|
(1)
|
Supplemental executive retirement plan (SERP).
|
The following table includes information regarding the SERP at
September 30, 2018
and
December 31, 2017
.
|
September 30,
2018 |
December 31, 2017
|
||||||
|
Premiums paid for insurance coverage
|
$
|
2,997
|
|
$
|
2,050
|
|
|
|
Total investments:
|
|||||||
|
Company owned life insurance
|
$
|
43,976
|
|
$
|
40,273
|
|
|
|
Exchange traded funds
|
56,776
|
|
55,442
|
|
|||
|
$
|
100,752
|
|
$
|
95,715
|
|
||
|
|
|
||||||
|
Liability:
|
|
|
|||||
|
Active plan
|
$
|
83,320
|
|
$
|
81,457
|
|
|
|
Closed plan
|
2,412
|
|
3,008
|
|
|||
|
$
|
85,732
|
|
$
|
84,465
|
|
||
A reconciliation of basic and diluted weighted-average shares outstanding is as follows:
|
|
Three Months Ended September 30,
|
Nine Months Ended
September 30, |
|||||||||
|
|
2018
|
2017
|
2018
|
2017
|
|||||||
|
Basic weighted average shares outstanding
|
112,587,623
|
|
115,921,134
|
|
113,366,465
|
|
116,772,652
|
|
|||
|
Weighted average dilutive options outstanding
|
2,386,831
|
|
2,521,815
|
|
2,418,281
|
|
2,540,955
|
|
|||
|
Diluted weighted average shares outstanding
|
114,974,454
|
|
118,442,949
|
|
115,784,746
|
|
119,313,607
|
|
|||
|
Antidilutive shares
|
1,375,186
|
|
—
|
|
1,097,439
|
|
1,174,469
|
|
|||
25
TMK 2018 FORM 10-Q QTR 3
TORCHMARK CORPORATION
NOTES TO CONDENSED CONSOLIDATED FINANCIAL STATEMENTS
(UNAUDITED)
(Dollar amounts in thousands, except per share data)
Issuance of long-term debt:
On September 27, 2018, Torchmark completed the issuance and sale of
$550 million
in aggregate principal of Torchmark’s
4.55%
Senior Notes due
September 15, 2028
. The notes were sold pursuant to Torchmark’s shelf registration statement on Form S-3. The net proceeds from the sale of the notes were
$543 million
, after giving effect to the underwriting discounts and commissions and offering expenses payable by Torchmark. Torchmark used the net proceeds from the sale of the notes to redeem the
$293 million
outstanding principal amount on Torchmark’s
9.25%
Senior Notes on October 29, 2018, the payment of
$10.7 million
for the make-whole premium plus accrued and unpaid interest to, but excluding, the date of redemption of such Senior Notes, and to fund
$150 million
of additional capital to its insurance subsidiaries. Torchmark intends to use any remaining net proceeds for general corporate purposes, which may include additional holding company liquidity and the repayment of a portion of Torchmark’s outstanding commercial paper.
Torchmark's reportable segments are based on the insurance product lines it markets and administers: life insurance, health insurance, and annuities. These major product lines are set out as reportable segments because of the common characteristics of products within these categories, comparability of margins, and the similarity in regulatory environment and management techniques. Torchmark's chief operating decision makers evaluate the overall performance of the operations of the Company in accordance with these segments.
Management’s measure of profitability for each insurance segment is insurance underwriting margin, which is underwriting income before other income and insurance administrative expenses. It represents the profit margin on insurance products before administrative expenses, and is calculated by deducting net policy obligations (claims incurred and change in reserves), commissions and other acquisition expenses from premium revenue. Torchmark further views the profitability of each insurance product segment by the marketing groups that distribute the products of that segment: direct response, independent agencies, or captive agencies.
Torchmark’s management prefers to evaluate the performance of its underwriting and investment activities separately, rather than allocating investment income to the underwriting results. As such, the investment function is presented as a stand-alone segment. The investment segment includes the management of the investment portfolio, debt, and cash flow. Management’s measure of profitability for this segment is excess investment income, which is the income earned on the investment portfolio less the required interest on net policy liabilities and financing costs. Financing costs include the interest on Torchmark’s debt. Other income and insurance administrative expense are classified in a separate Corporate and other segment.
The majority of the Company’s required interest on net policy liabilities (benefit reserves less the deferred acquisition cost asset) is not credited to policyholder accounts. Instead, it is an actuarial assumption for discounting cash flows in the computation of benefit reserves and the amortization of the deferred acquisition cost asset. Investment income required to fund the required interest on net policy liabilities is removed from the investment segment and applied to the insurance segments to eliminate the effect of the required interest from the insurance segments. As a result, the investment segment measures net investment income against the required interest on net policy liabilities and financing costs, while the insurance segments simply measure premiums against net policy benefits and expenses. Management believes this presentation facilitates a more meaningful analysis of the Company’s underwriting and investment performance as the underwriting results are based on premiums, claims, and expenses and are not affected by unanticipated fluctuations in investment yields.
As noted, Torchmark’s core operations are insurance and investment management. The insurance segments issue policies for which premiums are collected for the eventual payment of policy benefits. In addition to policy benefits, operating expenses are incurred including acquisition costs, administrative expenses, and taxes. Because life and health contracts can be long term, premium receipts in excess of current expenses are invested. Investment activities, conducted by the investment segment, focus on seeking quality investments with a yield and term appropriate to support the insurance product obligations. These investments generally consist of fixed maturities, and, over the long term, the expected yields are taken into account when setting insurance premium rates and product profitability
26
TMK 2018 FORM 10-Q QTR 3
TORCHMARK CORPORATION
NOTES TO CONDENSED CONSOLIDATED FINANCIAL STATEMENTS
(UNAUDITED)
(Dollar amounts in thousands, except per share data)
Note 11—Business Segments (continued)
expectations. As a result, fixed maturities are generally held for long periods to support the liabilities, and Torchmark generally expects to hold investments until maturity. However, dispositions of investments occur from time to time, generally for reasons such as credit concerns, calls by issuers, or other factors.
Since Torchmark does not actively trade investments, realized gains and losses from the disposition and write down of investments are generally incidental to operations and are not considered a material factor in insurance pricing or product profitability. While from time to time these realized gains and losses could be significant to net income in the period in which they occur, they generally have a limited effect on the yield of the total investment portfolio. Further, the disposals have little effect on the size of the portfolio as the proceeds of the disposals are reinvested in the portfolio and the income from the reinvestments is included in net investment income. Therefore, management removes realized investment gains and losses from results of core operations when evaluating the performance of the Company. For this reason, these gains and losses are excluded from Torchmark’s operating segments.
Torchmark accounts for its stock options and restricted stock under current accounting guidance requiring stock options and stock grants to be expensed based on fair value at the time of grant. Management considers stock compensation expense to be an expense of the Parent Company. Therefore, stock compensation expense is treated as a corporate expense in Torchmark’s segment analysis. The following tables set forth a reconciliation of Torchmark’s revenues and operations by segment to its pre-tax income and each significant line item in its
Condensed Consolidated Statements of Operations
.
During the third quarter of 2018, Torchmark recorded
$3.6 million
in administrative settlements related to state regulatory examinations.
27
TMK 2018 FORM 10-Q QTR 3
TORCHMARK CORPORATION
NOTES TO CONDENSED CONSOLIDATED FINANCIAL STATEMENTS
(UNAUDITED)
(Dollar amounts in thousands, except per share data)
Note 11—Business Segments (continued)
Reconciliation of Segment Operating Information to the Condensed Consolidated Statement of Operations
|
Three Months Ended September 30, 2018
|
||||||||||||||||||||||||||||
|
|
Life
|
Health
|
Annuity
|
Investment
|
Corporate & Other
|
Adjustments
|
|
Consolidated
|
||||||||||||||||||||
|
Revenue:
|
||||||||||||||||||||||||||||
|
Premium
|
$
|
605,547
|
|
$
|
255,201
|
|
$
|
2
|
|
$
|
860,750
|
|
||||||||||||||||
|
Net investment income
|
$
|
221,627
|
|
221,627
|
|
|||||||||||||||||||||||
|
Other income
|
$
|
416
|
|
$
|
(23
|
)
|
(2)
|
393
|
|
|||||||||||||||||||
|
Total revenue
|
605,547
|
|
255,201
|
|
2
|
|
221,627
|
|
416
|
|
(23
|
)
|
1,082,770
|
|
||||||||||||||
|
Expenses:
|
||||||||||||||||||||||||||||
|
Policy benefits
|
396,701
|
|
162,574
|
|
8,581
|
|
|
|
|
567,856
|
|
|||||||||||||||||
|
Required interest on reserves
|
(160,058
|
)
|
(20,965
|
)
|
(11,831
|
)
|
192,854
|
|
—
|
|
||||||||||||||||||
|
Required interest on DAC
|
48,907
|
|
6,136
|
|
145
|
|
(55,188
|
)
|
—
|
|
||||||||||||||||||
|
Amortization of acquisition costs
|
103,792
|
|
25,162
|
|
538
|
|
129,492
|
|
||||||||||||||||||||
|
Commissions, premium taxes, and non-deferred acquisition costs
|
47,609
|
|
22,041
|
|
5
|
|
(23
|
)
|
(2)
|
69,632
|
|
|||||||||||||||||
|
Insurance administrative expense
(1)
|
55,812
|
|
3,590
|
|
(3)
|
59,402
|
|
|||||||||||||||||||||
|
Parent expense
|
2,667
|
|
1,578
|
|
(4)
|
4,245
|
|
|||||||||||||||||||||
|
Stock-based compensation expense
|
10,412
|
|
10,412
|
|
||||||||||||||||||||||||
|
Interest expense
|
22,433
|
|
22,433
|
|
||||||||||||||||||||||||
|
Total expenses
|
436,951
|
|
194,948
|
|
(2,562
|
)
|
160,099
|
|
68,891
|
|
5,145
|
|
863,472
|
|
||||||||||||||
|
Subtotal
|
168,596
|
|
60,253
|
|
2,564
|
|
61,528
|
|
(68,475
|
)
|
(5,168
|
)
|
219,298
|
|
||||||||||||||
|
Non-operating items
|
5,168
|
|
(3,4)
|
5,168
|
|
|||||||||||||||||||||||
|
Measure of segment profitability (pretax)
|
$
|
168,596
|
|
$
|
60,253
|
|
$
|
2,564
|
|
$
|
61,528
|
|
$
|
(68,475
|
)
|
$
|
—
|
|
224,466
|
|
||||||||
|
Deduct applicable income taxes
|
(41,744
|
)
|
||||||||||||||||||||||||||
|
Net operating income
|
182,722
|
|
||||||||||||||||||||||||||
|
Add back income taxes applicable to segment profitability
|
41,744
|
|
||||||||||||||||||||||||||
|
Add (deduct) realized investment gains (losses)
|
|
1,032
|
|
|||||||||||||||||||||||||
|
Add (deduct) administrative settlements
|
(3,590
|
)
|
||||||||||||||||||||||||||
|
Add (deduct) non-operating costs
|
(1,578
|
)
|
||||||||||||||||||||||||||
|
Income before income taxes per
Condensed Consolidated Statement of Operations
|
|
$
|
220,330
|
|
||||||||||||||||||||||||
|
(1)
|
Administrative expense is not allocated to insurance segments.
|
|
(2)
|
Elimination of intersegment commission.
|
|
(3)
|
Administrative settlements.
|
|
(4)
|
Non-operating costs.
|
28
TMK 2018 FORM 10-Q QTR 3
TORCHMARK CORPORATION
NOTES TO CONDENSED CONSOLIDATED FINANCIAL STATEMENTS
(UNAUDITED)
(Dollar amounts in thousands, except per share data)
Note 11—Business Segments (continued)
|
Three Months Ended September 30, 2017
|
||||||||||||||||||||||||||||
|
|
Life
|
Health
|
Annuity
|
Investment
|
Corporate & Other
|
Adjustments
|
|
Consolidated
|
||||||||||||||||||||
|
Revenue:
|
||||||||||||||||||||||||||||
|
Premium
|
$
|
576,223
|
|
$
|
242,991
|
|
$
|
3
|
|
$
|
819,217
|
|
||||||||||||||||
|
Net investment income
|
$
|
213,872
|
|
213,872
|
|
|||||||||||||||||||||||
|
Other income
|
$
|
361
|
|
$
|
(30
|
)
|
(2)
|
331
|
|
|||||||||||||||||||
|
Total revenue
|
576,223
|
|
242,991
|
|
3
|
|
|
213,872
|
|
361
|
|
(30
|
)
|
1,033,420
|
|
|||||||||||||
|
Expenses:
|
||||||||||||||||||||||||||||
|
Policy benefits
|
386,445
|
|
155,774
|
|
9,000
|
|
|
|
|
551,219
|
|
|||||||||||||||||
|
Required interest on reserves
|
(152,862
|
)
|
(19,617
|
)
|
(12,433
|
)
|
184,912
|
|
—
|
|
||||||||||||||||||
|
Required interest on DAC
|
46,893
|
|
5,881
|
|
172
|
|
(52,946
|
)
|
—
|
|
||||||||||||||||||
|
Amortization of acquisition costs
|
98,268
|
|
23,458
|
|
608
|
|
122,334
|
|
||||||||||||||||||||
|
Commissions, premium taxes, and non-deferred acquisition costs
|
44,748
|
|
21,746
|
|
7
|
|
1,362
|
|
(2,3)
|
67,863
|
|
|||||||||||||||||
|
Insurance administrative expense
(1)
|
52,426
|
|
|
|
52,426
|
|
||||||||||||||||||||||
|
Parent expense
|
2,330
|
|
2,330
|
|
||||||||||||||||||||||||
|
Stock-based compensation expense
|
8,263
|
|
8,263
|
|
||||||||||||||||||||||||
|
Interest expense
|
20,970
|
|
20,970
|
|
||||||||||||||||||||||||
|
Total expenses
|
423,492
|
|
187,242
|
|
(2,646
|
)
|
152,936
|
|
63,019
|
|
1,362
|
|
825,405
|
|
||||||||||||||
|
Subtotal
|
152,731
|
|
55,749
|
|
2,649
|
|
60,936
|
|
(62,658
|
)
|
(1,392
|
)
|
208,015
|
|
||||||||||||||
|
Non-operating items
|
1,392
|
|
(3)
|
1,392
|
|
|||||||||||||||||||||||
|
Measure of segment profitability (pretax)
|
$
|
152,731
|
|
$
|
55,749
|
|
$
|
2,649
|
|
$
|
60,936
|
|
$
|
(62,658
|
)
|
$
|
—
|
|
209,407
|
|
||||||||
|
Deduct applicable income taxes
|
(63,342
|
)
|
||||||||||||||||||||||||||
|
Net operating income
|
146,065
|
|
||||||||||||||||||||||||||
|
Add back income taxes applicable to segment profitability
|
63,342
|
|
||||||||||||||||||||||||||
|
Add (deduct) realized investment gains (losses)
|
|
12,595
|
|
|||||||||||||||||||||||||
|
Add (deduct) guaranty fund assessments
|
(1,392
|
)
|
||||||||||||||||||||||||||
|
Income before income taxes per
Condensed Consolidated Statement of Operations
|
|
$
|
220,610
|
|
||||||||||||||||||||||||
|
(1)
|
Administrative expense is not allocated to insurance segments.
|
|
(2)
|
Elimination of intersegment commission.
|
|
(3)
|
Guaranty fund assessments.
|
29
TMK 2018 FORM 10-Q QTR 3
TORCHMARK CORPORATION
NOTES TO CONDENSED CONSOLIDATED FINANCIAL STATEMENTS
(UNAUDITED)
(Dollar amounts in thousands, except per share data)
Note 11—Business Segments (continued)
|
|
Nine Months Ended September 30, 2018
|
|||||||||||||||||||||||||||
|
|
Life
|
Health
|
Annuity
|
Investment
|
Corporate & Other
|
Adjustments
|
|
Consolidated
|
||||||||||||||||||||
|
Revenue:
|
||||||||||||||||||||||||||||
|
Premium
|
$
|
1,806,384
|
|
$
|
758,439
|
|
$
|
12
|
|
|
|
|
|
|
$
|
2,564,835
|
|
|||||||||||
|
Net investment income
|
|
|
|
$
|
658,279
|
|
|
|
|
|
658,279
|
|
||||||||||||||||
|
Other income
|
|
|
|
|
$
|
1,180
|
|
$
|
(76
|
)
|
(2)
|
1,104
|
|
|||||||||||||||
|
Total revenue
|
1,806,384
|
|
758,439
|
|
12
|
|
658,279
|
|
1,180
|
|
(76
|
)
|
|
3,224,218
|
|
|||||||||||||
|
Expenses:
|
||||||||||||||||||||||||||||
|
Policy benefits
|
1,196,616
|
|
483,654
|
|
25,852
|
|
|
|
|
|
|
1,706,122
|
|
|||||||||||||||
|
Required interest on reserves
|
(474,373
|
)
|
(62,095
|
)
|
(35,733
|
)
|
572,201
|
|
|
|
|
—
|
|
|||||||||||||||
|
Required interest on DAC
|
145,126
|
|
18,228
|
|
448
|
|
(163,802
|
)
|
|
|
|
—
|
|
|||||||||||||||
|
Amortization of acquisition costs
|
312,168
|
|
74,311
|
|
1,710
|
|
|
|
|
|
388,189
|
|
||||||||||||||||
|
Commissions, premium taxes, and non-deferred acquisition costs
|
142,253
|
|
66,502
|
|
19
|
|
|
|
|
|
(76
|
)
|
(2)
|
208,698
|
|
|||||||||||||
|
Insurance administrative expense
(1)
|
|
|
|
|
|
|
|
|
166,560
|
|
3,590
|
|
(3)
|
170,150
|
|
|||||||||||||
|
Parent expense
|
|
|
|
|
|
|
|
|
7,806
|
|
1,578
|
|
(4)
|
9,384
|
|
|||||||||||||
|
Stock-based compensation expense
|
|
|
|
|
|
|
|
|
29,969
|
|
|
|
|
29,969
|
|
|||||||||||||
|
Interest expense
|
|
|
|
|
|
|
66,466
|
|
|
|
|
|
|
66,466
|
|
|||||||||||||
|
Total expenses
|
1,321,790
|
|
580,600
|
|
(7,704
|
)
|
474,865
|
|
204,335
|
|
5,092
|
|
2,578,978
|
|
||||||||||||||
|
Subtotal
|
484,594
|
|
177,839
|
|
7,716
|
|
183,414
|
|
(203,155
|
)
|
(5,168
|
)
|
645,240
|
|
||||||||||||||
|
Non-operating items
|
5,168
|
|
(3,4)
|
5,168
|
|
|||||||||||||||||||||||
|
Measure of segment profitability (pretax)
|
$
|
484,594
|
|
$
|
177,839
|
|
$
|
7,716
|
|
$
|
183,414
|
|
$
|
(203,155
|
)
|
$
|
—
|
|
650,408
|
|
||||||||
|
Deduct applicable income taxes
|
(120,456
|
)
|
||||||||||||||||||||||||||
|
Net operating income
|
529,952
|
|
||||||||||||||||||||||||||
|
Add back income taxes applicable to segment profitability
|
120,456
|
|
||||||||||||||||||||||||||
|
Add (deduct) realized investment gains (losses)
|
|
14,796
|
|
|||||||||||||||||||||||||
|
Add (deduct) administrative settlements
|
(3,590
|
)
|
||||||||||||||||||||||||||
|
Add (deduct) non-operating costs
|
(1,578
|
)
|
||||||||||||||||||||||||||
|
Income before income taxes per
Condensed Consolidated Statements of Operations
|
|
$
|
660,036
|
|
||||||||||||||||||||||||
|
(1)
|
Administrative expense is not allocated to insurance segments.
|
|
(2)
|
Elimination of intersegment commission.
|
|
(3)
|
Administrative settlements.
|
|
(4)
|
Non-operating costs.
|
30
TMK 2018 FORM 10-Q QTR 3
TORCHMARK CORPORATION
NOTES TO CONDENSED CONSOLIDATED FINANCIAL STATEMENTS
(UNAUDITED)
(Dollar amounts in thousands, except per share data)
|
|
Nine Months Ended September 30, 2017
|
|||||||||||||||||||||||||||
|
|
Life
|
Health
|
Annuity
|
Investment
|
Corporate & Other
|
Adjustments
|
|
Consolidated
|
||||||||||||||||||||
|
Revenue:
|
||||||||||||||||||||||||||||
|
Premium
|
$
|
1,725,896
|
|
$
|
730,557
|
|
$
|
9
|
|
|
$
|
2,456,462
|
|
|||||||||||||||
|
Net investment income
|
|
|
|
|
|
|
$
|
634,930
|
|
|
634,930
|
|
||||||||||||||||
|
Other income
|
|
|
|
|
|
|
|
|
$
|
1,239
|
|
$
|
(99
|
)
|
(2)
|
1,140
|
|
|||||||||||
|
Total revenue
|
1,725,896
|
|
730,557
|
|
9
|
|
634,930
|
|
1,239
|
|
(99
|
)
|
3,092,532
|
|
||||||||||||||
|
Expenses:
|
||||||||||||||||||||||||||||
|
Policy benefits
|
1,166,289
|
|
470,104
|
|
26,923
|
|
|
|
|
|
2,094
|
|
(3)
|
1,665,410
|
|
|||||||||||||
|
Required interest on reserves
|
(452,339
|
)
|
(57,859
|
)
|
(37,245
|
)
|
547,443
|
|
|
|
|
|
|
—
|
|
|||||||||||||
|
Required interest on DAC
|
139,042
|
|
17,530
|
|
524
|
|
(157,096
|
)
|
|
|
|
|
|
—
|
|
|||||||||||||
|
Amortization of acquisition costs
|
296,646
|
|
71,801
|
|
1,916
|
|
|
|
|
|
|
|
|
370,363
|
|
|||||||||||||
|
Commissions, premium taxes, and non-deferred acquisition costs
|
132,094
|
|
64,599
|
|
25
|
|
|
|
|
|
1,293
|
|
(2,4)
|
198,011
|
|
|||||||||||||
|
Insurance administrative expense
(1)
|
|
|
|
|
|
|
|
|
155,751
|
|
|
|
|
155,751
|
|
|||||||||||||
|
Parent expense
|
|
|
|
|
|
|
|
|
7,228
|
|
|
|
|
7,228
|
|
|||||||||||||
|
Stock-based compensation expense
|
|
|
|
|
|
|
|
|
24,809
|
|
|
|
|
24,809
|
|
|||||||||||||
|
Interest expense
|
|
|
|
|
|
|
62,825
|
|
|
|
|
|
|
62,825
|
|
|||||||||||||
|
Total expenses
|
1,281,732
|
|
566,175
|
|
(7,857
|
)
|
|
453,172
|
|
187,788
|
|
3,387
|
|
2,484,397
|
|
|||||||||||||
|
Subtotal
|
444,164
|
|
164,382
|
|
7,866
|
|
181,758
|
|
(186,549
|
)
|
(3,486
|
)
|
608,135
|
|
||||||||||||||
|
Non-operating items
|
3,486
|
|
(3,4)
|
3,486
|
|
|||||||||||||||||||||||
|
Measure of segment profitability (pretax)
|
$
|
444,164
|
|
$
|
164,382
|
|
$
|
7,866
|
|
$
|
181,758
|
|
$
|
(186,549
|
)
|
$
|
—
|
|
611,621
|
|
||||||||
|
Deduct applicable income taxes
|
(184,703
|
)
|
||||||||||||||||||||||||||
|
Net operating income
|
426,918
|
|
||||||||||||||||||||||||||
|
Add back income taxes applicable to segment profitability
|
184,703
|
|
||||||||||||||||||||||||||
|
Add (deduct) realized investment gains (losses)
|
|
6,142
|
|
|||||||||||||||||||||||||
|
Add (deduct) administrative settlements
|
(2,094
|
)
|
||||||||||||||||||||||||||
|
Add (deduct) guaranty fund assessments
|
(1,392
|
)
|
||||||||||||||||||||||||||
|
Income before income taxes per
Condensed Consolidated Statements of Operations
|
|
$
|
614,277
|
|
||||||||||||||||||||||||
|
(1)
|
Administrative expense is not allocated to insurance segments.
|
|
(2)
|
Elimination of intersegment commission.
|
|
(3)
|
Administrative settlements.
|
|
(4)
|
Guaranty fund assessments.
|
31
TMK 2018 FORM 10-Q QTR 3
Results of Operations
How Torchmark Views Its Operations:
Torchmark is the holding company for a group of insurance companies which primarily market individual life and supplemental health insurance to middle income households throughout the United States. We view our operations by segments, which are the insurance product lines of life, health, and annuities, and the investment segment that supports the product lines. Segments are aligned based on their common characteristics, comparability of the profit margins, and management techniques used to operate each segment.
Insurance Product Line Segments.
The insurance product line segments involve the marketing, underwriting, and the administration of policies. Each product line is further segmented by the various distribution units that market the insurance policies. Each distribution unit operates in a niche market offering insurance products designed for that particular market. Whether analyzing profitability of a segment as a whole, or the individual distribution units within the segment, the measure of profitability used by management is the underwriting margin, which is:
Premium revenue
Less:
Policy obligations
Policy acquisition costs and commissions
Investment Segment.
The investment segment involves the management of our capital resources, including investments and the management of corporate debt and liquidity. Our measure of profitability for the investment segment is excess investment income, which is:
Net investment income
Less:
Required interest on net policy liabilities
Financing costs
See analysis of profitability by segment below.
32
TMK 2018 FORM 10-Q QTR 3
Current Highlights, comparing the first
nine
months of
2018
with the first
nine
months of
2017
.
|
•
|
Net income as a return on equity (ROE) was
12.4%
(1)
and net operating income as an ROE, excluding net unrealized gains on the fixed maturity portfolio was
14.7%
(1,2)
.
|
|
•
|
Total premium
increased
4%
over the prior year to
$2.6 billion
. Life premium
increased
5%
over the prior year to
$1.8 billion
. Life underwriting margin
increased
9%
from
$444 million
in
2017
to
$485 million
in
2018
.
|
|
•
|
Through
September 30,
2018
, the Company repurchased
3 million
shares at a total cost of
$250 million
for an average share price of
$85.54
.
|
The following represents net income and net operating income for the
nine
months ended
September 30,
2018
and
2017
.
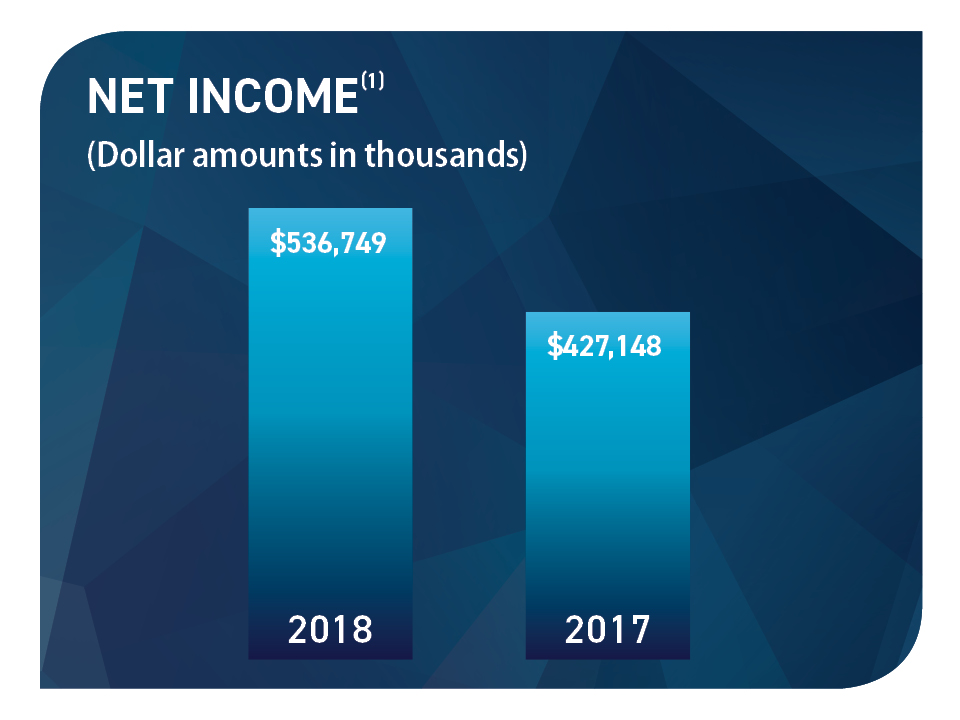
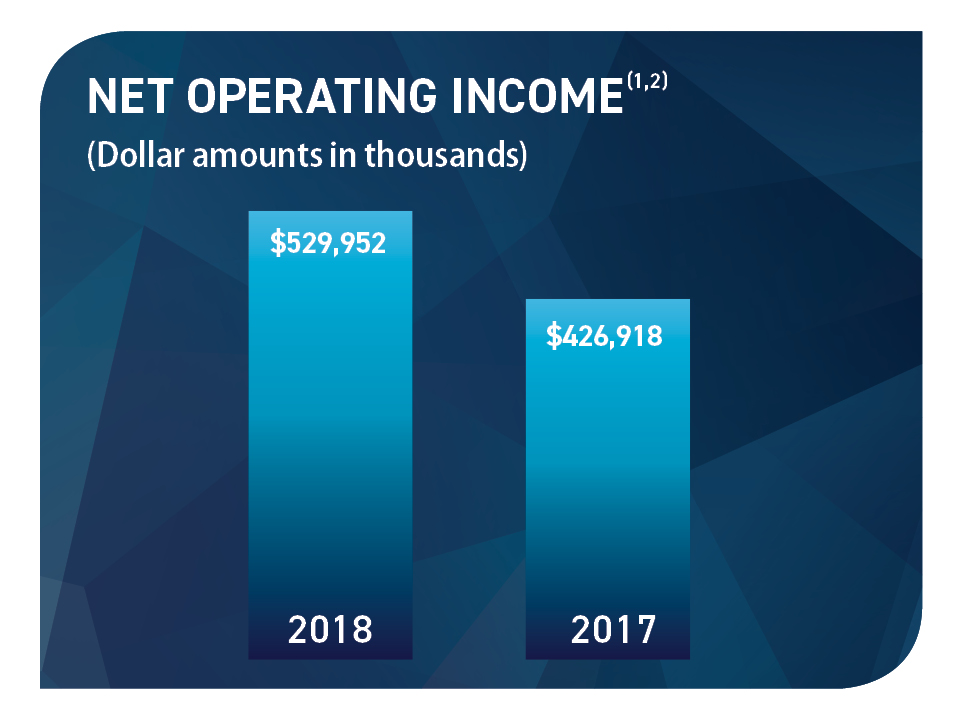
|
(1)
|
In 2017, new tax legislation revised the corporate income tax rate from 35% to 21% effective January 1, 2018.
See Note 5—Income Taxes
for further discussion. In
2018
, income tax expense was calculated based on the 21% rate as compared with a 35% rate for
2017
.
|
|
(2)
|
Net operating income is considered a non-GAAP measure and it has been used consistently by Torchmark’s management for many years to evaluate the operating performance of the Company, and is a measure commonly used in the life insurance industry. It differs from net income primarily because it excludes certain non-operating items such as realized investment gains and losses and certain significant and unusual items included in net income. Net income is the most directly comparable GAAP measure.
|
Net operating income as an ROE, excluding net unrealized gains on the fixed maturity portfolio, is also considered a non-GAAP measure. Management utilizes this measure to view the business without the effect of the unrealized gains or losses, which are primarily attributable to fluctuation in interest rates on the available for sale portfolio.
Summary of Operations
. Net income
increased
26%
to
$537 million
during the first nine months of 2018, compared with
$427 million
in the same period in 2017. This increase was primarily related to the tax reform enacted in 2017 which reduced corporate income tax rates. Included in net income were after-tax realized
gains
of
$12 million
in
2018
, compared with realized after-tax
gains
of
$6 million
for the same period in
2017
. On a diluted per common share basis, net income per common share for the
nine
months ended
September 30,
2018
increased
30%
from
$3.58
to
$4.64
. The per share results have exceeded the growth in dollar amounts due to our share repurchase program. Realized gains and losses are presented more fully under the caption
Realized Gains and Losses
in this report.
Net operating income is the consolidated total of segment profits after-tax and as such is considered a non-GAAP measure. Net operating income increased
24%
, or
$103 million
, to
$530 million
for the
nine
months ended
September 30,
2018
, compared with
$427 million
for the same
2017
period.
33
TMK 2018 FORM 10-Q QTR 3
Torchmark's operations on a segment-by-segment basis are discussed in depth below. The life insurance segment is our strongest segment and the largest contributor to earnings in each year presented.
Analysis of Profitability by Segment
(Dollar amounts in thousands)
|
|
Nine Months Ended
September 30, |
||||||||||||||
|
|
2018
|
2017
|
Change
|
%
|
|||||||||||
|
Life insurance underwriting margin
|
$
|
484,594
|
|
$
|
444,164
|
|
$
|
40,430
|
|
9
|
|
||||
|
Health insurance underwriting margin
|
177,839
|
|
164,382
|
|
13,457
|
|
8
|
|
|||||||
|
Annuity underwriting margin
|
7,716
|
|
7,866
|
|
(150
|
)
|
(2
|
)
|
|||||||
|
Excess investment income
|
183,414
|
|
181,758
|
|
1,656
|
|
1
|
|
|||||||
|
Other insurance:
|
|||||||||||||||
|
Other income
|
1,180
|
|
1,239
|
|
(59
|
)
|
(5
|
)
|
|||||||
|
Administrative expense
|
(166,560
|
)
|
(155,751
|
)
|
(10,809
|
)
|
7
|
|
|||||||
|
Corporate and other
|
(37,775
|
)
|
(32,037
|
)
|
(5,738
|
)
|
18
|
|
|||||||
|
Pre-tax total
|
650,408
|
|
611,621
|
|
38,787
|
|
6
|
|
|||||||
|
Applicable taxes
|
(120,456
|
)
|
(184,703
|
)
|
64,247
|
|
(35
|
)
|
|||||||
|
Net operating income
|
529,952
|
|
426,918
|
|
103,034
|
|
24
|
|
|||||||
|
Reconciling items, net of tax:
|
|
||||||||||||||
|
Realized gains (losses)
|
11,689
|
|
6,235
|
|
5,454
|
|
|||||||||
|
|
(55
|
)
|
(3,739
|
)
|
3,684
|
|
|||||||||
|
Non-operating costs
|
(1,247
|
)
|
—
|
|
(1,247
|
)
|
|||||||||
|
Administrative settlements
|
(3,590
|
)
|
(1,361
|
)
|
(2,229
|
)
|
|||||||||
|
Guaranty Fund Assessment
|
—
|
|
(905
|
)
|
905
|
|
|||||||||
|
Net income
|
$
|
536,749
|
|
$
|
427,148
|
|
$
|
109,601
|
|
26
|
|
||||
Total premium income
rose
4%
for the
nine
months ended
September 30,
2018
to
$2.6 billion
. Total net sales
increased
2%
to
$428 million
, when compared with the same period in
2017
. First-year collected premium was
$350 million
for the
2018
period, compared with
$339 million
for the
2017
period.
Life insurance premium income
increased
5%
to
$1.8 billion
over the prior year total of
$1.7 billion
. Life net sales
fell
1%
to
$313 million
for the
nine
month period of
2018
. First-year collected life premium
rose
1%
to
$241 million
. Life underwriting margins, as a percent of premium,
increased
to
27%
in
2018
from
26%
in the prior year period, due to lower policy obligations. Underwriting income
increased
to
$485 million
for the first
nine
months of
2018
,
9%
over the same period in
2017
.
Health insurance premium income
increased
4%
to
$758 million
over the prior year total of
$731 million
. Health net sales
rose
11%
to
$115 million
for the
nine
month period of
2018
. First-year collected health premium
rose
9%
to
$109 million
. Health underwriting margins, as a percent of premium,
were flat at
23%
in both
2018
and
2017
. Underwriting income
increased
to
$178 million
for the first
nine
months of
2018
,
8%
over the same period in
2017
.
Excess investment income, the measure of profitability of our investment segment,
increased
1%
during the first
nine
months of
2018
to
$183 million
from
$182 million
in the same period in
2017
. Growth in excess investment income continues to be impeded by investing at yields lower than the yield on dispositions and the average yield on the entire portfolio. Excess investment income per common share, reflecting the impact of our share repurchase program,
increased
4%
in
2018
to
$1.58
from
$1.52
in the same period last year.
Insurance administrative expenses
were up
6.9%
in
2018
when compared with the prior year period. These expenses were
6.5%
as a percentage of premium during the first
nine
months of
2018
compared with
6.3%
a year earlier. The increase in administrative expenses was primarily due to an increase in pension and other employee costs and investments in information technology.
34
TMK 2018 FORM 10-Q QTR 3
Share Repurchases.
We have an on-going share repurchase program which began in 1986 that is reviewed quarterly and is reaffirmed by the Board of Directors on an annual basis. The program was reaffirmed on
August 7, 2018
. With no specified authorization amount, we determine the amount of repurchases based on the amount of our excess cash flow, general market conditions, and other alternative uses. These purchases are made at the Parent Company with excess cash flow. Excess cash flow is primarily made up of cash received from the insurance subsidiaries less dividends paid to shareholders and interest paid on our debt. See further discussion in the
Capital Resources
section below. Share purchases are also made with the proceeds from option exercises by current and former employees in order to reduce dilution. The following chart summarizes share purchases for the
nine
month periods ended
September 30, 2018
and
2017
.
Analysis of Share Purchases
(Amounts in thousands, except per share data)
|
|
Nine Months Ended September 30,
|
||||||||||||||||||||
|
|
2018
|
2017
|
|||||||||||||||||||
|
|
Shares
|
Amount
|
Average
Price |
Shares
|
Amount
|
Average
Price |
|||||||||||||||
|
Purchases with:
|
|||||||||||||||||||||
|
Excess cash flow at the Parent Company
|
2,919
|
|
$
|
249,670
|
|
$
|
85.54
|
|
3,176
|
|
$
|
242,841
|
|
$
|
76.46
|
|
|||||
|
Option exercise proceeds
|
555
|
|
48,644
|
|
87.57
|
|
760
|
|
58,607
|
|
77.16
|
|
|||||||||
|
Total
|
3,474
|
|
$
|
298,314
|
|
$
|
85.87
|
|
3,936
|
|
$
|
301,448
|
|
$
|
76.59
|
|
|||||
Throughout the remainder of this discussion, share purchases will only refer to those made from excess cash flow at the Parent Company.
A detailed discussion of our operations by component segment follows.
Life insurance, comparing the first
nine
months of
2018
with the first
nine
months of
2017
. Life insurance is our predominant segment, representing
70%
of premium income and
72%
of insurance underwriting margin in the first
nine
months of
2018
. In addition, investments supporting the reserves for life business generate the majority of investment income attributable to the investment segment.
We use three statistical measures as indicators of premium growth and sales over the near term: “annualized premium in force,” “net sales,” and “first-year collected premium.”
|
•
|
Annualized premium in force
is defined as the premium income that would be received over the following twelve months at any given date on all active policies if those policies remain in force throughout the twelve-month period. Annualized premium in force is an indicator of potential growth in premium revenue.
|
|
•
|
Net sales
is annualized premium issued (Gross premium that would be received during the policies' first year in force and assuming that none of the policies lapsed or terminated.), net of cancellations in the first thirty days after issue, except in the case of Globe Life Direct Response where net sales is annualized premium issued at the time the first full premium is paid after any introductory offer period has expired. We believe that net sales is a better indicator of the rate of premium growth as compared to annualized premium issued.
|
|
•
|
First-year collected premium
is defined as the premium collected during the reporting period for all policies in their first policy year. First-year collected premium takes lapses into account in the first year when lapses are more likely to occur, and thus is a useful indicator of how much new premium is expected to be added to premium income in the future.
|
35
TMK 2018 FORM 10-Q QTR 3
The following table presents the summary of results for life insurance.
|
Life Insurance
Summary of Results (Dollar amounts in thousands) |
|||||||||||||||||||
|
|
Nine Months Ended September 30,
|
Increase
|
|||||||||||||||||
|
|
2018
|
2017
|
(Decrease)
|
||||||||||||||||
|
|
Amount
|
% of
Premium |
Amount
|
% of
Premium |
Amount
|
%
|
|||||||||||||
|
Premium and policy charges
|
$
|
1,806,384
|
|
100
|
|
$
|
1,725,896
|
|
100
|
|
$
|
80,488
|
|
5
|
|||||
|
Policy obligations
|
1,196,616
|
|
66
|
|
1,166,289
|
|
67
|
|
30,327
|
|
3
|
||||||||
|
Required interest on reserves
|
(474,373
|
)
|
(26
|
)
|
(452,339
|
)
|
(26
|
)
|
(22,034
|
)
|
5
|
||||||||
|
Net policy obligations
|
722,243
|
|
40
|
|
713,950
|
|
41
|
|
8,293
|
|
1
|
||||||||
|
Commissions, premium taxes, and non-deferred acquisition expenses
|
142,253
|
|
8
|
|
132,094
|
|
8
|
|
10,159
|
|
8
|
||||||||
|
Amortization of acquisition costs
|
457,294
|
|
25
|
|
435,688
|
|
25
|
|
21,606
|
|
5
|
||||||||
|
Total expense
|
1,321,790
|
|
73
|
|
1,281,732
|
|
74
|
|
40,058
|
|
3
|
||||||||
|
Insurance underwriting margin before other income and administrative expenses
|
$
|
484,594
|
|
27
|
|
$
|
444,164
|
|
26
|
|
$
|
40,430
|
|
9
|
|||||
The following table presents Torchmark’s life insurance premium by distribution channel.
Life Insurance
Premium by Distribution Channel
(Dollar amounts in thousands)
|
|
Nine Months Ended September 30,
|
Increase
|
||||||||||||||||
|
|
2018
|
2017
|
(Decrease)
|
|||||||||||||||
|
|
Amount
|
% of
Total |
Amount
|
% of
Total |
Amount
|
|
%
|
|||||||||||
|
American Income Exclusive Agency
|
$
|
805,372
|
|
45
|
$
|
741,392
|
|
43
|
$
|
63,980
|
|
9
|
|
|||||
|
Globe Life Direct Response
|
628,525
|
|
35
|
613,568
|
|
35
|
14,957
|
|
2
|
|
||||||||
|
Liberty National Exclusive Agency
|
209,224
|
|
11
|
205,775
|
|
12
|
3,449
|
|
2
|
|
||||||||
|
Other Agencies
|
163,263
|
|
9
|
165,161
|
|
10
|
(1,898
|
)
|
(1
|
)
|
||||||||
|
Total
|
$
|
1,806,384
|
|
100
|
$
|
1,725,896
|
|
100
|
$
|
80,488
|
|
5
|
|
|||||
Annualized life premium in force was
$2.5 billion
at
September 30, 2018
, an increase of
4%
over
$2.4 billion
a year earlier.
36
TMK 2018 FORM 10-Q QTR 3
An analysis of life net sales, an indicator of new business production, by distribution channel is presented below.
|
Life Insurance
Net Sales by Distribution Channel
(Dollar amounts in thousands)
|
||||||||||||||||||
|
|
Nine Months Ended September 30,
|
Increase
|
||||||||||||||||
|
|
2018
|
2017
|
(Decrease)
|
|||||||||||||||
|
|
Amount
|
% of
Total |
Amount
|
% of
Total |
Amount
|
%
|
||||||||||||
|
American Income Exclusive Agency
|
$
|
169,442
|
|
54
|
$
|
167,478
|
|
53
|
$
|
1,964
|
|
1
|
|
|||||
|
Globe Life Direct Response
|
96,978
|
|
31
|
106,652
|
|
34
|
(9,674
|
)
|
(9
|
)
|
||||||||
|
Liberty National Exclusive Agency
|
36,189
|
|
12
|
34,609
|
|
11
|
1,580
|
|
5
|
|
||||||||
|
Other Agencies
|
9,901
|
|
3
|
7,501
|
|
2
|
2,400
|
|
32
|
|
||||||||
|
Total
|
$
|
312,510
|
|
100
|
$
|
316,240
|
|
100
|
$
|
(3,730
|
)
|
(1
|
)
|
|||||
First-year collected life premium by distribution channel is presented in the table below.
|
Life Insurance
First-Year Collected Premium by Distribution Channel
(Dollar amounts in thousands)
|
||||||||||||||||||
|
|
Nine Months Ended September 30,
|
Increase
|
||||||||||||||||
|
|
2018
|
2017
|
(Decrease)
|
|||||||||||||||
|
|
Amount
|
% of
Total |
Amount
|
% of
Total |
Amount
|
|
%
|
|||||||||||
|
American Income Exclusive Agency
|
$
|
143,498
|
|
60
|
$
|
135,935
|
|
57
|
$
|
7,563
|
|
6
|
|
|||||
|
Globe Life Direct Response
|
62,889
|
|
26
|
70,989
|
|
30
|
(8,100
|
)
|
(11
|
)
|
||||||||
|
Liberty National Exclusive Agency
|
27,369
|
|
11
|
24,587
|
|
10
|
2,782
|
|
11
|
|
||||||||
|
Other Agencies
|
7,424
|
|
3
|
7,325
|
|
3
|
99
|
|
1
|
|
||||||||
|
Total
|
$
|
241,180
|
|
100
|
$
|
238,836
|
|
100
|
$
|
2,344
|
|
1
|
|
|||||
While
American Income Exclusive Agency
has historically marketed primarily to members of labor unions, this agency has diversified in recent years by focusing heavily on other affinity groups, third party internet vendor leads, and referrals which has driven growth despite declines in North American union membership. This agency is Torchmark’s largest contributor to life premium at
45%
of Torchmark’s
2018
year-to-date total. This agency produced premium income during the first
nine
months of
$805 million
,
an increase of
9%
over the comparable prior year period of
$741 million
. First-year collected premium was
$143 million
,
an increase of
6%
. Net sales
increased
1%
to
$169 million
in
2018
over the
2017
total of
$167 million
. Over the long-term, sales growth in our exclusive agencies is generally dependent on growth in the size of the agency force. The American Income Exclusive Agency's average agent count
was flat at
6,983
for the
nine
months ended
September 30, 2018
, compared with
6,962
for the same period in
2017
. As is the case with all Torchmark agencies, the average agent count is based on the actual count at the end of each week during the period.
The American Income Exclusive Agency continues to focus on growing and strengthening middle management to support sustainable growth of the agency force. To accomplish this, the agency places an emphasis on agent training programs and financial incentives that appropriately reward agents at all levels for helping develop and train its agents, including more home-office and webinar training programs. These programs are designed to provide each agent, from new recruits to top level managers, coaching and instruction specifically designed for their level of experience and responsibility. We have made considerable investments in information technology in support of the agency, including the launching of a lead mapping and management tool to the agency force. We anticipate this tool will help the agency enhance agent productivity and agent retention.
37
TMK 2018 FORM 10-Q QTR 3
The
Globe Life Direct Response
unit offers adult and juvenile life insurance through a variety of direct-to-consumer marketing approaches, which include direct mailings, insert media, and electronic media. These different approaches support and complement one another in the unit’s efforts to reach the consumer. The Globe Life Direct Response channel’s growth has been fueled over the years by constant innovation. In recent years, electronic media production has grown rapidly as management has aggressively increased marketing activities related to internet and mobile technology, and has focused on driving traffic to the inbound call center. We continually introduce new initiatives in this unit in an attempt to increase response rates.
While the juvenile market is an important source of sales, it also is a vehicle to reach the parents and grandparents of juvenile policyholders, who are more likely to respond favorably to a Globe Life Direct Response solicitation for life coverage on themselves than is the general adult population. Also, both juvenile policyholders and their parents are low acquisition-cost targets for sales of additional coverage over time.
Globe Life Direct Response’s life premium income
rose
2%
to
$629 million
, representing
35%
of Torchmark’s total life premium in the first
nine
months of
2018
. Net sales for this group
decreased
9%
due to operational changes designed to maximize profitability on new business. We expect the decline in sales to moderate over the remainder of
2018
. First-year collected premium
decreased
11%
to
$63 million
. The underwriting margin, as a percent of premium, was
17%
,
up
from
15%
in the
nine
months ended
September 30, 2017
. This increase was primarily attributable to favorable claims in the first nine months compared to higher-than-normal claims in the same period in
2017
.
The
Liberty National Exclusive Agency
markets individual and group life insurance to middle-income customers. Life premium income for this agency was
$209 million
in the first
nine
months of
2018
compared with
$206 million
for the same period in
2017
. Net sales for the Liberty National Agency
increased
5%
to
$36 million
. The continued increases in net sales reflect changes in the structure of the agency that were put in place several years ago. Recent growth in middle management within the agency will help continue this growth. First-year collected premium
increased
11%
to
$27 million
. The underwriting margin as a percent of premium was
24%
,
down
from
27%
for the
nine
months ended
September 30, 2017
.
The decrease is primarily attributable to higher policy obligations during the first nine months compared with slightly lower policy obligations during the same period in 2017. The agency also incurred higher acquisition costs associated with investments in technology and other areas to maximize long term business profits.
The Liberty National average agent count
increased
8%
to
2,151
for the
nine
months ended
September 30, 2018
compared with
1,985
for the same period in
2017
. We continue to execute our long term plan to grow this agency through expansion from small-town markets in the southeast to more densely populated areas with larger pools of potential agent recruits and customers. Continued expansion of this agency’s presence into more heavily populated, less-penetrated areas will help create long term agency growth. Additionally, the agency's prospecting training program continues to help improve the ability of agents to develop new worksite marketing business.
The
Other Agencies
distribution channels primarily include independent agencies selling predominantly life insurance. The Other Agencies contributed
$163 million
of life premium income, or
9%
of Torchmark’s total in the first
nine
months of
2018
, but contributed only
3%
of net sales for the period.
38
TMK 2018 FORM 10-Q QTR 3
Health insurance, comparing the first
nine
months of
2018
with the first
nine
months of
2017
.
Health insurance sold by Torchmark includes Medicare Supplement insurance and limited-benefit plans (e.g. dread disease and critical illness coverage).
Health premium accounted for
30%
of our total premium in the
2018
period. Health underwriting margin accounted for
27%
of total underwriting margin, reflective of the lower underwriting margin as a percentage of premium for health compared with life insurance. As noted under the caption
Life Insurance
, we have emphasized life insurance sales relative to health due to life’s superior profitability and its greater contribution to investment income.
The following table presents underwriting margin data for health insurance.
Health Insurance
Summary of Results
(Dollar amounts in thousands)
|
|
Nine Months Ended September 30,
|
Increase
|
|||||||||||||||||
|
|
2018
|
2017
|
(Decrease)
|
||||||||||||||||
|
|
Amount
|
% of
Premium |
Amount
|
% of
Premium |
Amount
|
%
|
|||||||||||||
|
Premium
|
$
|
758,439
|
|
100
|
|
$
|
730,557
|
|
100
|
|
$
|
27,882
|
|
4
|
|||||
|
Policy obligations
|
483,654
|
|
64
|
|
470,104
|
|
64
|
|
13,550
|
|
3
|
||||||||
|
Required interest on reserves
|
(62,095
|
)
|
(8
|
)
|
(57,859
|
)
|
(8
|
)
|
(4,236
|
)
|
7
|
||||||||
|
Net policy obligations
|
421,559
|
|
56
|
|
412,245
|
|
56
|
|
9,314
|
|
2
|
||||||||
|
Commissions, premium taxes, and non-deferred acquisition expenses
|
66,502
|
|
9
|
|
64,599
|
|
9
|
|
1,903
|
|
3
|
||||||||
|
Amortization of acquisition costs
|
92,539
|
|
12
|
|
89,331
|
|
12
|
|
3,208
|
|
4
|
||||||||
|
Total expense
|
580,600
|
|
77
|
|
566,175
|
|
77
|
|
14,425
|
|
3
|
||||||||
|
Insurance underwriting margin before other income and administrative expense
|
$
|
177,839
|
|
23
|
|
$
|
164,382
|
|
23
|
|
$
|
13,457
|
|
8
|
|||||
39
TMK 2018 FORM 10-Q QTR 3
The following table is an analysis of our health premium by distribution channel.
Health Insurance
Premium by Distribution Channel
(Dollar amounts in thousands)
|
|
Nine Months Ended September 30,
|
Increase
|
||||||||||||||||
|
|
2018
|
2017
|
(Decrease)
|
|||||||||||||||
|
|
Amount
|
% of
Total |
Amount
|
% of
Total |
Amount
|
%
|
||||||||||||
|
United American Independent Agency
|
||||||||||||||||||
|
Limited-benefit plans
|
$
|
8,370
|
|
$
|
8,686
|
|
$
|
(316
|
)
|
(4
|
)
|
|||||||
|
Medicare Supplement
|
275,365
|
|
263,904
|
|
11,461
|
|
4
|
|
||||||||||
|
283,735
|
|
37
|
272,590
|
|
37
|
11,145
|
|
4
|
|
|||||||||
|
Family Heritage Agency
|
||||||||||||||||||
|
Limited-benefit plans
|
202,915
|
|
188,350
|
|
14,565
|
|
8
|
|
||||||||||
|
Medicare Supplement
|
—
|
|
—
|
|
—
|
|
—
|
|
||||||||||
|
202,915
|
|
27
|
188,350
|
|
26
|
14,565
|
|
8
|
|
|||||||||
|
Liberty National Exclusive Agency
|
||||||||||||||||||
|
Limited-benefit plans
|
110,617
|
|
108,085
|
|
2,532
|
|
2
|
|
||||||||||
|
Medicare Supplement
|
33,981
|
|
39,988
|
|
(6,007
|
)
|
(15
|
)
|
||||||||||
|
144,598
|
|
19
|
148,073
|
|
20
|
(3,475
|
)
|
(2
|
)
|
|||||||||
|
American Income Exclusive Agency
|
||||||||||||||||||
|
Limited-benefit plans
|
69,579
|
|
66,077
|
|
3,502
|
|
5
|
|
||||||||||
|
Medicare Supplement
|
172
|
|
198
|
|
(26
|
)
|
(13
|
)
|
||||||||||
|
69,751
|
|
9
|
66,275
|
|
9
|
3,476
|
|
5
|
|
|||||||||
|
Direct Response
|
||||||||||||||||||
|
Limited-benefit plans
|
338
|
|
425
|
|
(87
|
)
|
(20
|
)
|
||||||||||
|
Medicare Supplement
|
57,102
|
|
54,844
|
|
2,258
|
|
4
|
|
||||||||||
|
57,440
|
|
8
|
55,269
|
|
8
|
2,171
|
|
4
|
|
|||||||||
|
Total Health Premium
|
||||||||||||||||||
|
Limited-benefit plans
|
391,819
|
|
52
|
371,623
|
|
51
|
20,196
|
|
5
|
|
||||||||
|
Medicare Supplement
|
366,620
|
|
48
|
358,934
|
|
49
|
7,686
|
|
2
|
|
||||||||
|
|
$
|
758,439
|
|
100
|
$
|
730,557
|
|
100
|
$
|
27,882
|
|
4
|
|
|||||
40
TMK 2018 FORM 10-Q QTR 3
We market supplemental health insurance products through a number of distribution channels. Presented below is a table of health net sales by distribution channel.
Health Insurance
Net Sales by Distribution Channel
(Dollar amounts in thousands)
|
|
Nine Months Ended September 30,
|
Increase
|
||||||||||||||||
|
|
2018
|
2017
|
(Decrease)
|
|||||||||||||||
|
|
Amount
|
% of
Total |
Amount
|
% of
Total |
Amount
|
%
|
||||||||||||
|
United American Independent Agency
|
||||||||||||||||||
|
Limited-benefit plans
|
$
|
347
|
|
$
|
388
|
|
$
|
(41
|
)
|
(11
|
)
|
|||||||
|
Medicare Supplement
|
39,868
|
|
33,052
|
|
6,816
|
|
21
|
|
||||||||||
|
40,215
|
|
35
|
33,440
|
|
32
|
6,775
|
|
20
|
|
|||||||||
|
Family Heritage Agency
|
||||||||||||||||||
|
Limited-benefit plans
|
45,047
|
|
41,755
|
|
3,292
|
|
8
|
|
||||||||||
|
Medicare Supplement
|
—
|
|
—
|
|
—
|
|
—
|
|
||||||||||
|
45,047
|
|
39
|
41,755
|
|
40
|
3,292
|
|
8
|
|
|||||||||
|
Liberty National Exclusive Agency
|
||||||||||||||||||
|
Limited-benefit plans
|
15,706
|
|
14,558
|
|
1,148
|
|
8
|
|
||||||||||
|
Medicare Supplement
|
—
|
|
—
|
|
—
|
|
—
|
|
||||||||||
|
15,706
|
|
14
|
14,558
|
|
14
|
1,148
|
|
8
|
|
|||||||||
|
American Income Exclusive Agency
|
||||||||||||||||||
|
Limited-benefit plans
|
10,697
|
|
10,369
|
|
328
|
|
3
|
|
||||||||||
|
Medicare Supplement
|
—
|
|
—
|
|
—
|
|
—
|
|
||||||||||
|
10,697
|
|
9
|
10,369
|
|
10
|
328
|
|
3
|
|
|||||||||
|
Direct Response
|
||||||||||||||||||
|
Limited-benefit plans
|
—
|
|
—
|
|
—
|
|
—
|
|
||||||||||
|
Medicare Supplement
|
3,439
|
|
3,790
|
|
(351
|
)
|
(9
|
)
|
||||||||||
|
3,439
|
|
3
|
3,790
|
|
4
|
(351
|
)
|
(9
|
)
|
|||||||||
|
Total Net Sales
|
||||||||||||||||||
|
Limited-benefit plans
|
71,797
|
|
62
|
67,070
|
|
65
|
4,727
|
|
7
|
|
||||||||
|
Medicare Supplement
|
43,307
|
|
38
|
36,842
|
|
35
|
6,465
|
|
18
|
|
||||||||
|
|
$
|
115,104
|
|
100
|
$
|
103,912
|
|
100
|
$
|
11,192
|
|
11
|
|
|||||
41
TMK 2018 FORM 10-Q QTR 3
The following table presents health insurance first-year collected premium by distribution channel.
Health Insurance
First-Year Collected Premium by Distribution Channel
(Dollar amounts in thousands)
|
|
Nine Months Ended September 30,
|
Increase
|
||||||||||||||||||
|
|
2018
|
2017
|
(Decrease)
|
|||||||||||||||||
|
|
Amount
|
% of
Total |
Amount
|
% of
Total |
Amount
|
%
|
||||||||||||||
|
United American Independent Agency
|
||||||||||||||||||||
|
Limited-benefit plans
|
$
|
296
|
|
$
|
344
|
|
$
|
(48
|
)
|
(14
|
)
|
|||||||||
|
Medicare Supplement
|
44,721
|
|
39,306
|
|
5,415
|
|
14
|
|
||||||||||||
|
45,017
|
|
41
|
|
39,650
|
|
40
|
|
5,367
|
|
14
|
|
|||||||||
|
Family Heritage Agency
|
||||||||||||||||||||
|
Limited-benefit plans
|
35,196
|
|
33,116
|
|
2,080
|
|
6
|
|
||||||||||||
|
Medicare Supplement
|
—
|
|
—
|
|
—
|
|
—
|
|
||||||||||||
|
35,196
|
|
32
|
|
33,116
|
|
33
|
|
2,080
|
|
6
|
|
|||||||||
|
Liberty National Exclusive Agency
|
||||||||||||||||||||
|
Limited-benefit plans
|
13,330
|
|
12,256
|
|
1,074
|
|
9
|
|
||||||||||||
|
Medicare Supplement
|
—
|
|
2
|
|
(2
|
)
|
(100
|
)
|
||||||||||||
|
13,330
|
|
12
|
|
12,258
|
|
12
|
|
1,072
|
|
9
|
|
|||||||||
|
American Income Exclusive Agency
|
||||||||||||||||||||
|
Limited-benefit plans
|
11,352
|
|
10,840
|
|
512
|
|
5
|
|
||||||||||||
|
Medicare Supplement
|
—
|
|
—
|
|
—
|
|
—
|
|
||||||||||||
|
11,352
|
|
11
|
|
10,840
|
|
11
|
|
512
|
|
5
|
|
|||||||||
|
Direct Response
|
||||||||||||||||||||
|
Limited-benefit plans
|
—
|
|
—
|
|
—
|
|
—
|
|
||||||||||||
|
Medicare Supplement
|
3,862
|
|
4,108
|
|
(246
|
)
|
(6
|
)
|
||||||||||||
|
3,862
|
|
4
|
|
4,108
|
|
4
|
|
(246
|
)
|
(6
|
)
|
|||||||||
|
Total First-Year Collected Premium
|
|
|
||||||||||||||||||
|
Limited-benefit plans
|
60,174
|
|
55
|
|
56,556
|
|
57
|
|
3,618
|
|
6
|
|
||||||||
|
Medicare Supplement
|
48,583
|
|
45
|
|
43,416
|
|
43
|
|
5,167
|
|
12
|
|
||||||||
|
|
$
|
108,757
|
|
100
|
|
$
|
99,972
|
|
100
|
|
$
|
8,785
|
|
9
|
|
|||||
A discussion of health operations by distribution channel follows.
The
UA Independent Agency
consists of independent agencies appointed with Torchmark who can also sell for other companies. The UA Independent Agency was Torchmark’s
largest
health agency in terms of health premium income. Premium income was
$284 million
, representing
37%
of Torchmark’s total health premium. Net sales were
$40 million
, or
35%
of Torchmark’s health sales. This agency primarily produces Medicare Supplement insurance, with Medicare Supplement premium income of
$275 million
. The UA Independent Agency represents approximately
75%
of all Torchmark Medicare Supplement premium and
92%
of Medicare Supplement net sales. Medicare Supplement premium in this agency
rose
4%
. Net sales of the Medicare Supplement product has
increased
21%
in
2018
primarily as a result of an increase in individual sales. First-year collected health premium
rose
14%
to
$45 million
.
The
Family Heritage Agency
primarily markets limited-benefit supplemental health insurance in non-urban areas. Most of their policies include a cash-back feature, such as a return of premium whereby any excess of premiums over claims paid is returned to the policyholder at the end of a specified period stated within the insurance policy. The Family Heritage Agency contributed
$45 million
, representing
39%
of Torchmark's total net health sales in the first
nine
months of
2018
. Health premium income was
$203 million
for the
nine
month period of
2018
, representing
27%
of Torchmark’s health premium compared with
$188 million
or
26%
of health premium in the prior year period. Underwriting margin as a percent of premium was
24%
,
up
from
22%
for the
nine
months ended
September 30, 2017
. The increase was primarily attributed to the runoff of older business and the growing portion of new business sold at higher margins. The
42
TMK 2018 FORM 10-Q QTR 3
average agent count was
1,042
for the
nine
months ended
September 30, 2018
compared with
984
for the same period in
2017
,
an increase of
6%
.
The
Liberty National Exclusive Agency
represented
19%
of all Torchmark health premium income at
$145 million
in the
nine
months of
2018
. The Liberty Agency markets limited-benefit health supplemental products consisting primarily of critical illness insurance. Much of Liberty’s health business is now generated through worksite marketing targeting small businesses of 10 to 25 employees. In
2018
, health premium income in the Liberty Agency
declined
$3 million
to
$145 million
from prior year premium. Liberty’s health premium decline is primarily due to the runoff of a block of discontinued Medicare Supplement policies previously sold by the agency.
Other distribution
. While some of the Company's distribution channels market health products, their main emphasis is on life insurance. On a combined basis, they accounted for
17%
of health premium in the
2018
period. The American Income Exclusive Agency primarily markets accident plans. The Direct Response unit markets primarily Medicare Supplements to employer or union-sponsored groups.
Annuities.
Annuities represent an insignificant part of our business and are not expected to be an important part of our marketing strategy going forward.
Operating expenses, comparing the first
nine
months of
2018
with the first
nine
months of
2017
.
Operating expenses consist of insurance administrative expenses and Parent Company expenses. Also included is stock compensation expense, which is viewed by us as Parent Company expense. Insurance administrative expenses relate to premium income for a given period; therefore, we measure those expenses as a percentage of premium income. Total expenses are measured as a percentage of total revenues. An analysis of operating expenses is shown below.
Operating Expenses Selected Information
(Dollar amounts in thousands)
|
|
Nine Months Ended September 30,
|
||||||||||
|
|
2018
|
2017
|
|||||||||
|
Amount
|
% of
Premium |
Amount
|
% of
Premium |
||||||||
|
Insurance administrative expenses:
|
|||||||||||
|
Salaries
|
$
|
74,844
|
|
2.9
|
$
|
70,505
|
|
2.9
|
|||
|
Other employee costs
|
27,169
|
|
1.1
|
25,320
|
|
1.0
|
|||||
|
Information technology costs
|
20,878
|
|
0.8
|
19,325
|
|
0.8
|
|||||
|
Legal costs
|
6,371
|
|
0.2
|
6,520
|
|
0.2
|
|||||
|
Other administrative costs
|
37,298
|
|
1.5
|
34,081
|
|
1.4
|
|||||
|
Total insurance administrative expenses
|
166,560
|
|
6.5
|
155,751
|
|
6.3
|
|||||
|
Parent company expense
|
7,806
|
|
7,228
|
|
|||||||
|
Stock compensation expense
|
29,969
|
|
24,809
|
|
|||||||
|
Administrative settlements
|
3,590
|
|
—
|
|
|||||||
|
Non-operating costs
|
1,578
|
|
—
|
|
|||||||
|
Total operating expenses, per
Condensed Consolidated Statements of Operations
|
$
|
209,503
|
|
$
|
187,788
|
|
|||||
|
Insurance administrative expenses:
|
|||||||||||
|
Increase (decrease) over prior year
|
6.9
|
%
|
6.6
|
%
|
|||||||
|
Total operating expenses:
|
|||||||||||
|
Increase (decrease) over prior year
|
11.6
|
%
|
8.5
|
%
|
|||||||
The
6.9%
increase in administrative expenses was primarily due to an increase in other employee costs and information technology salaries and expenses. The increase in other employee costs was primarily attributed to higher pension expense driven by lower interest rates.
43
TMK 2018 FORM 10-Q QTR 3
The increase in information technology costs reflects investments related to data analytics capabilities, systems modernizations, customer experience enhancements, and information security programs.
The increase in stock compensation expense was primarily due to higher expense associated with equity awards, reflecting Torchmark's higher share price as compared with the same period a year ago.
During the third quarter of 2018, Torchmark recorded
$3.6 million
in administrative settlements related to state regulatory examinations.
Investments (excess investment income), comparing the first
nine
months of
2018
with the first
nine
months of
2017
.
We manage our capital resources including investments, debt, and cash flow through the investment segment. Excess investment income represents the profit margin attributable to investment operations and is the measure that we use to evaluate the performance of the investment segment as described in
Note 11—Business Segments
.
It is defined as net investment income less the required interest on net policy liabilities and the interest cost associated with capital funding or “financing costs.”
We also view excess investment income per diluted common share as an important and useful measure to evaluate the performance of the investment segment. It is defined as excess investment income divided by the total diluted weighted average shares outstanding, representing the contribution by the investment segment to the consolidated earnings per share of the Company. Since implementing our share repurchase program in 1986, we have used
$7.4 billion
of cash flow to repurchase Torchmark shares (average split-adjusted price per diluted common share of $
16.51
) after determining that the repurchases provided a greater return than other investment alternatives. If we had not used this excess cash to repurchase shares, but had instead invested it in interest-bearing assets, we would have earned more investment income and had more shares outstanding. Because excess investment income per diluted common share incorporates all capital resources, we believe that excess investment income per diluted share is a useful measure to evaluate the investment segment.
The following table summarizes Torchmark’s investment income, excess investment income, and excess investment income per diluted common share.
Excess Investment Income
(Dollar amounts in thousands)
|
|
Nine Months Ended
September 30, |
Increase
(Decrease) |
|||||||||||
|
|
2018
|
2017
|
Amount
|
%
|
|||||||||
|
Net investment income
|
$
|
658,279
|
|
$
|
634,930
|
|
$
|
23,349
|
|
4
|
|||
|
Interest on net insurance policy liabilities:
|
|||||||||||||
|
Interest on reserves
|
(572,201
|
)
|
(547,443
|
)
|
(24,758
|
)
|
5
|
||||||
|
Interest on deferred acquisition costs
|
163,802
|
|
157,096
|
|
6,706
|
|
4
|
||||||
|
Net required interest
|
(408,399
|
)
|
(390,347
|
)
|
(18,052
|
)
|
5
|
||||||
|
Financing costs
|
(66,466
|
)
|
(62,825
|
)
|
(3,641
|
)
|
6
|
||||||
|
Excess investment income
|
$
|
183,414
|
|
$
|
181,758
|
|
$
|
1,656
|
|
1
|
|||
|
Excess investment income per diluted share
|
$
|
1.58
|
|
$
|
1.52
|
|
$
|
0.06
|
|
4
|
|||
|
Mean invested assets (at amortized cost)
|
$
|
16,101,519
|
|
$
|
15,275,412
|
|
$
|
826,107
|
|
5
|
|||
|
Average net insurance policy liabilities
(1)
|
9,702,313
|
|
9,306,010
|
|
396,303
|
|
4
|
||||||
|
Average debt and preferred securities (at amortized cost)
|
1,648,035
|
|
1,471,616
|
|
176,419
|
|
12
|
||||||
|
(1)
|
Net of deferred acquisition costs, excluding the associated unrealized gains and losses thereon.
|
As indicated in the table above, excess investment income increased
1%
compared with the year-ago period, while on a per diluted common share basis
increased
4%
from the year-ago period. Excess investment income per diluted common share generally increases at a faster pace than excess investment income because the number of diluted common shares outstanding generally decreases from year to year as result of our share repurchase program.
44
TMK 2018 FORM 10-Q QTR 3
Net investment income
during the
nine
months ending
September 30, 2018
is
$23 million
or
4%
greater than the same period last year. Mean invested assets during the first
nine
months of
2018
were
5%
higher than they were during the same period last year. The effective annual yield rate earned on the fixed maturity portfolio was
5.57%
in the first
nine
months of
2018
, compared with
5.68%
a year earlier. Growth in net investment income has been negatively impacted in recent years by the low interest rate environment during which time we have invested new money at rates less than the average portfolio yield rate and reinvested the proceeds from dispositions at yield rates less than what we earned on these bonds prior to disposition. As a result, growth in net investment income has been slower than the growth in mean invested assets in recent years. We currently expect that the average annual turnover of fixed maturity assets during the next five years will not exceed 1% to 3% of the portfolio and will not have a material negative impact on investment income.
Should long-term interest rates rise, Torchmark's net investment income would benefit due to higher interest rates on new investments. While such a rise in interest rates could adversely affect the fair value of the fixed maturities portfolio, we could withstand an increase in interest rates of approximately 45 to 50 basis points before the net unrealized gains on our fixed maturity portfolio as of
September 30, 2018
would be eliminated. Should interest rates increase further than that, we would not be concerned with potential interest rate driven unrealized losses in our fixed maturity portfolio because we have the intent and, more importantly, the ability, to hold our fixed maturities to maturity.
Required interest on net insurance policy liabilities
is the amount of net investment income considered by management necessary to “fund” net insurance policy liabilities, which is the net of the benefit reserve liability and deferred acquisition cost asset. As such, it is removed from the investment segment and applied to the insurance segments to offset the effect of the interest required by the insurance segments. As discussed in
Note 11—Business Segments
,
management believes this provides a more meaningful analysis of the investment and insurance segments. Required interest is based on the actuarial interest assumptions used to discount the benefit reserve liability and to amortize the deferred acquisition costs for our insurance policies in force.
The great majority of our life and health insurance policies are fixed interest-rate protection policies, not investment products, and are accounted for under current accounting guidance for long-duration insurance products which mandates that interest rate assumptions for a particular block of business be “locked in” for the life of that block. Each calendar year, we set the discount rate to be used to calculate the benefit reserve liability and deferred acquisition cost asset for all insurance policies issued that year. That rate is based on the new money yields that we expect to earn on cash flow received in the future from policies of that issue year, and cannot be changed. The discount rate used for policies issued in the current year has no impact on the in force policies issued in prior years as the rates of all prior issue years are also locked in. As such, the overall discount rate for the entire in force block is a weighted average of the discount rates being used from all issue years. Changes in the overall weighted-average discount rate over time are caused by changes in the mix of the reserves and the deferred acquisition cost asset by issue year on the entire block of in force business. Business issued in the current year has very little impact on the overall weighted-average discount rate due to the size of our in force business.
Required interest on net insurance policy liabilities
increased
$18 million
or
5%
to
$408 million
, in line with the growth in average net interest-bearing insurance policy liabilities.
Financing costs
for the segment primarily consist of interest on our various debt instruments. Interest on our debt
increased
in the first
nine
months of
2018
to
$66 million
compared with
$63 million
for the same period last year. The increase in financing costs was primarily due to higher interest rates on short-term debt. We expect the fourth quarter interest expense to be slightly higher due to costs of carrying the redeemed obligation for a portion of the quarter.
More information concerning debt can be found in the
Capital Resources
section of this report.
45
TMK 2018 FORM 10-Q QTR 3
Analysis of Financing Costs
(Dollar amounts in thousands)
|
|
Nine Months Ended
September 30, |
Increase
(Decrease) |
||||||||||||
|
|
2018
|
2017
|
Amount
|
%
|
||||||||||
|
Interest on funded debt
|
$
|
54,631
|
|
$
|
55,089
|
|
$
|
(458
|
)
|
(1
|
)
|
|||
|
Interest on term loan
|
2,298
|
|
1,706
|
|
592
|
|
35
|
|
||||||
|
Interest on short-term debt
|
9,533
|
|
6,026
|
|
3,507
|
|
58
|
|
||||||
|
Other
|
4
|
|
4
|
|
—
|
|
—
|
|
||||||
|
Financing costs
|
$
|
66,466
|
|
$
|
62,825
|
|
$
|
3,641
|
|
6
|
|
|||
Realized Gains and Losses, comparing the first
nine
months of
2018
with the first
nine
months of
2017
.
Our core business of providing insurance coverage requires us to maintain a large and diverse investment portfolio to support our insurance liabilities. From time to time, investments are disposed of or written down prior to maturity, resulting in realized gains or losses. Since these dispositions and write-downs are outside the course of our normal operations, management removes the effects of such gains and losses when evaluating its overall core operating results.
As discussed in
Note 4—Investments
, during the first quarter of 2018, the Company elected to measure its investment in certain limited partnerships at fair value in accordance with the fair value option for financial instruments with changes recognized in "Realized Investment Gains (Losses)" in the
Condensed Consolidated Statements of Operations.
The following table summarizes our tax-effected realized gains (losses) by component.
Analysis of Realized Gains (Losses), Net of Tax
(Dollar amounts in thousands, except per share data)
|
|
Nine Months Ended September 30,
|
||||||||||||||
|
|
2018
|
2017
|
|||||||||||||
|
|
Amount
|
Per Share
|
Amount
|
Per Share
|
|||||||||||
|
Fixed maturities:
|
|||||||||||||||
|
Sales
|
$
|
52
|
|
$
|
—
|
|
$
|
3,153
|
|
$
|
0.02
|
|
|||
|
Called or tendered
|
9,686
|
|
0.08
|
|
5,628
|
|
0.05
|
|
|||||||
|
Write-downs
|
—
|
|
—
|
|
(159
|
)
|
—
|
|
|||||||
|
Other long-term investments
|
1,905
|
|
0.02
|
|
—
|
|
—
|
|
|||||||
|
Other
|
46
|
|
—
|
|
(2,387
|
)
|
(0.02
|
)
|
|||||||
|
Total
|
$
|
11,689
|
|
$
|
0.10
|
|
$
|
6,235
|
|
$
|
0.05
|
|
|||
1) Written down due to other-than-temporary impairment
Investments (acquisitions), comparing the first
nine
months of
2018
with the first
nine
months of
2017
.
Torchmark’s investment policy calls for investing primarily in investment grade fixed maturities that meet our quality and yield objectives. We generally prefer to invest in securities with longer maturities because they more closely match the long-term nature of our policy liabilities. We believe this strategy is appropriate because our cash flows from operations and invested assets are positive, stable and predictable. If longer-term securities that meet our quality and yield objectives are not available, we do not relax our quality objectives; instead, we consider investing in shorter or lower yielding securities taking into consideration the slope of the yield curve and other factors.
46
TMK 2018 FORM 10-Q QTR 3
The following table summarizes selected information for fixed maturity purchases. The effective annual yield shown is the yield calculated to the “worst call date.” For non-callable bonds, the worst-call date is always the maturity date. For callable bonds, the worst-call date is the call date that produces the lowest yield (or the maturity date, if the yield calculated to the maturity date is lower than the yield calculated to each call date).
Fixed Maturity Acquisitions Selected Information
(Dollar amounts in thousands)
|
Nine Months Ended
September 30, |
|||||||
|
|
2018
|
2017
|
|||||
|
Cost of acquisitions:
|
|
|
|||||
|
Investment-grade corporate securities
|
$
|
566,250
|
|
$
|
1,046,773
|
|
|
|
Tax-exempt municipal securities
|
171,572
|
|
—
|
|
|||
|
Other investment-grade securities
|
8,708
|
|
5,932
|
|
|||
|
Total fixed maturity acquisitions
|
$
|
746,530
|
|
$
|
1,052,705
|
|
|
|
Effective annual yield (one year compounded)
(1)
|
4.82
|
%
|
4.74
|
%
|
|||
|
Average life (in years, to next call)
|
16.6
|
|
22.8
|
|
|||
|
Average life (in years, to maturity)
|
22.9
|
|
23.7
|
|
|||
|
Average rating
|
A-
|
BBB+
|
|
||||
|
(1)
|
Tax-equivalent basis, where the yield on tax-exempt securities is adjusted to produce a yield equivalent to the pretax yield on taxable securities.
|
Acquisitions in both periods consisted primarily of corporate bonds with securities spanning a diversified range of issuers, industry sectors, and geographical regions. The average rating was higher during the first
nine
months ended
September 30, 2018
due to investing in higher rated tax-exempt municipal bonds. All of the acquired securities were investment grade.
Investments (portfolio composition).
The composition of the investment portfolio at book value on
September 30, 2018
and
December 31, 2017
was as follows:
Invested Assets at
September 30, 2018
(Dollar amounts in thousands)
|
At September 30, 2018
|
At December 31, 2017
|
||||||||||
|
Amount
|
% of
Total |
Amount
|
% of
Total |
||||||||
|
Fixed maturities (at amortized cost)
|
$
|
15,462,364
|
|
92
|
$
|
14,995,101
|
|
95
|
|||
|
Policy loans
|
543,836
|
|
3
|
529,529
|
|
3
|
|||||
|
Other long-term investments
(1)
|
182,583
|
|
1
|
107,953
|
|
1
|
|||||
|
Short-term investments
|
633,490
|
|
4
|
127,071
|
|
1
|
|||||
|
Total
|
$
|
16,822,273
|
|
100
|
$
|
15,759,654
|
|
100
|
|||
|
(1)
|
Includes investments accounted for under the fair value option at amortized cost of
$100 million
(fair value of
$108 million
) as of
September 30, 2018
.
|
At
September 30, 2018
, approximately
92%
of our investments at book value are in a diversified fixed-maturity portfolio. Policy loans, which are secured by policy cash values, make up approximately
3%
of our investments. We also have insignificant investments in equity securities and other long-term investments. The increase in short-term investments is due to proceeds from the issuance of the 4.55% Senior Notes on
September 27, 2018
. Because fixed maturities represent such a significant portion of our investment portfolio, the remainder of the discussion of portfolio composition will focus on fixed maturities.
47
TMK 2018 FORM 10-Q QTR 3
Fixed Maturities.
The following tables summarize certain information about the major corporate sectors and security types held in our fixed maturity portfolio at
September 30, 2018
and
December 31, 2017
.
Fixed Maturities by Sector
At
September 30, 2018
(Dollar amounts in thousands)
|
|
Below Investment Grade
|
Total Fixed Maturities
|
% of Total Fixed Maturities
|
||||||||||||||||||||||||||
|
|
Cost or
Amortized Cost |
Gross
Unrealized Gains |
Gross
Unrealized Losses |
Fair
Value |
Cost or
Amortized Cost |
Gross
Unrealized Gains |
Gross
Unrealized Losses |
Fair
Value |
At Amortized Cost
|
At Fair Value
|
|||||||||||||||||||
|
Corporates:
|
|||||||||||||||||||||||||||||
|
Financial
|
|||||||||||||||||||||||||||||
|
Insurance - life, health, P&C
|
$
|
66,356
|
|
$
|
3,137
|
|
$
|
(5,895
|
)
|
$
|
63,598
|
|
$
|
1,979,977
|
|
$
|
196,468
|
|
$
|
(19,561
|
)
|
$
|
2,156,884
|
|
13
|
13
|
|||
|
Banks
|
27,083
|
|
—
|
|
(3,472
|
)
|
23,611
|
|
785,443
|
|
56,838
|
|
(13,269
|
)
|
829,012
|
|
5
|
5
|
|||||||||||
|
Other financial
|
74,957
|
|
—
|
|
(12,884
|
)
|
62,073
|
|
944,025
|
|
32,330
|
|
(33,812
|
)
|
942,543
|
|
6
|
6
|
|||||||||||
|
Total financial
|
168,396
|
|
3,137
|
|
(22,251
|
)
|
149,282
|
|
3,709,445
|
|
285,636
|
|
(66,642
|
)
|
3,928,439
|
|
24
|
24
|
|||||||||||
|
Utilities
|
|||||||||||||||||||||||||||||
|
Electric
|
20,107
|
|
356
|
|
(48
|
)
|
20,415
|
|
1,460,497
|
|
189,662
|
|
(10,936
|
)
|
1,639,223
|
|
10
|
10
|
|||||||||||
|
Gas and water
|
—
|
|
—
|
|
—
|
|
—
|
|
532,047
|
|
27,629
|
|
(10,483
|
)
|
549,193
|
|
3
|
3
|
|||||||||||
|
Total utilities
|
20,107
|
|
356
|
|
(48
|
)
|
20,415
|
|
1,992,544
|
|
217,291
|
|
(21,419
|
)
|
2,188,416
|
|
13
|
13
|
|||||||||||
|
Industrial - Energy
|
|||||||||||||||||||||||||||||
|
Pipelines
|
40,563
|
|
478
|
|
(1,782
|
)
|
39,259
|
|
907,381
|
|
71,015
|
|
(14,145
|
)
|
964,251
|
|
6
|
6
|
|||||||||||
|
Exploration and production
|
28,136
|
|
1,230
|
|
(146
|
)
|
29,220
|
|
526,801
|
|
46,877
|
|
(4,100
|
)
|
569,578
|
|
3
|
3
|
|||||||||||
|
Oil field services
|
33,857
|
|
—
|
|
(8,340
|
)
|
25,517
|
|
83,699
|
|
6,519
|
|
(8,339
|
)
|
81,879
|
|
1
|
1
|
|||||||||||
|
Refiner
|
—
|
|
—
|
|
—
|
|
—
|
|
72,992
|
|
11,733
|
|
(354
|
)
|
84,371
|
|
1
|
1
|
|||||||||||
|
Driller
|
44,837
|
|
—
|
|
(11,040
|
)
|
33,797
|
|
44,837
|
|
—
|
|
(11,040
|
)
|
33,797
|
|
—
|
—
|
|||||||||||
|
Total energy
|
147,393
|
|
1,708
|
|
(21,308
|
)
|
127,793
|
|
1,635,710
|
|
136,144
|
|
(37,978
|
)
|
1,733,876
|
|
11
|
11
|
|||||||||||
|
Industrial - Basic materials
|
|||||||||||||||||||||||||||||
|
Chemicals
|
—
|
|
—
|
|
—
|
|
—
|
|
554,326
|
|
13,517
|
|
(15,004
|
)
|
552,839
|
|
4
|
3
|
|||||||||||
|
Metals and mining
|
57,416
|
|
3,740
|
|
—
|
|
61,156
|
|
386,986
|
|
44,657
|
|
(262
|
)
|
431,381
|
|
2
|
3
|
|||||||||||
|
Forestry products and paper
|
—
|
|
—
|
|
—
|
|
—
|
|
111,757
|
|
8,255
|
|
(781
|
)
|
119,231
|
|
1
|
1
|
|||||||||||
|
Total basic materials
|
57,416
|
|
3,740
|
|
—
|
|
61,156
|
|
1,053,069
|
|
66,429
|
|
(16,047
|
)
|
1,103,451
|
|
7
|
7
|
|||||||||||
|
Industrial - Consumer, non-cyclical
|
21,332
|
|
—
|
|
(5,256
|
)
|
16,076
|
|
1,965,304
|
|
79,373
|
|
(63,245
|
)
|
1,981,432
|
|
13
|
12
|
|||||||||||
|
Other industrials
|
46,925
|
|
1,928
|
|
(809
|
)
|
48,044
|
|
1,351,458
|
|
79,074
|
|
(29,951
|
)
|
1,400,581
|
|
9
|
9
|
|||||||||||
|
Industrial -
Transportation |
26,328
|
|
1,161
|
|
(601
|
)
|
26,888
|
|
560,482
|
|
48,812
|
|
(7,452
|
)
|
601,842
|
|
3
|
4
|
|||||||||||
|
Other corporate sectors
|
135,952
|
|
2,687
|
|
(10,923
|
)
|
127,716
|
|
1,311,933
|
|
55,481
|
|
(48,477
|
)
|
1,318,937
|
|
8
|
8
|
|||||||||||
|
Total corporates
|
623,849
|
|
14,717
|
|
(61,196
|
)
|
577,370
|
|
13,579,945
|
|
968,240
|
|
(291,211
|
)
|
14,256,974
|
|
88
|
88
|
|||||||||||
|
Other fixed maturities:
|
|||||||||||||||||||||||||||||
|
Government (U.S., municipal, and foreign)
|
306
|
|
126
|
|
—
|
|
432
|
|
1,673,666
|
|
86,433
|
|
(16,496
|
)
|
1,743,603
|
|
11
|
11
|
|||||||||||
|
Collateralized debt obligations
|
57,794
|
|
26,119
|
|
(4,997
|
)
|
78,916
|
|
57,794
|
|
26,119
|
|
(4,997
|
)
|
78,916
|
|
—
|
—
|
|||||||||||
|
Other asset-backed securities
|
—
|
|
—
|
|
—
|
|
—
|
|
149,866
|
|
1,818
|
|
(872
|
)
|
150,812
|
|
1
|
1
|
|||||||||||
|
Mortgage-backed securities
(1)
|
—
|
|
—
|
|
—
|
|
—
|
|
1,093
|
|
73
|
|
—
|
|
1,166
|
|
—
|
—
|
|||||||||||
|
Total fixed maturities
|
$
|
681,949
|
|
$
|
40,962
|
|
$
|
(66,193
|
)
|
$
|
656,718
|
|
$
|
15,462,364
|
|
$
|
1,082,683
|
|
$
|
(313,576
|
)
|
$
|
16,231,471
|
|
100
|
100
|
|||
|
(1)
|
Includes GNMA's.
|
48
TMK 2018 FORM 10-Q QTR 3
Fixed Maturities by Sector
At
December 31, 2017
(Dollar amounts in thousands)
|
Below Investment Grade
|
Total Fixed Maturities
|
% of Total Fixed Maturities
|
||||||||||||||||||||||||||||
|
|
Cost or
Amortized Cost |
Gross
Unrealized Gains |
Gross
Unrealized Losses |
Fair
Value |
Cost or
Amortized Cost |
Gross
Unrealized Gains |
Gross
Unrealized Losses |
Fair
Value |
At Amortized Cost
|
At Fair Value
|
||||||||||||||||||||
|
Corporates:
|
||||||||||||||||||||||||||||||
|
Financial
|
||||||||||||||||||||||||||||||
|
Insurance - life, health, P&C
|
$
|
66,489
|
|
$
|
3,896
|
|
$
|
(3,650
|
)
|
$
|
66,735
|
|
$
|
2,018,315
|
|
$
|
346,364
|
|
$
|
(4,588
|
)
|
$
|
2,360,091
|
|
14
|
14
|
|
|||
|
Banks
|
27,104
|
|
—
|
|
(2,727
|
)
|
24,377
|
|
747,249
|
|
117,724
|
|
(3,007
|
)
|
861,966
|
|
5
|
5
|
|
|||||||||||
|
Other financial
|
74,956
|
|
—
|
|
(17,661
|
)
|
57,295
|
|
853,583
|
|
74,765
|
|
(18,524
|
)
|
909,824
|
|
6
|
6
|
|
|||||||||||
|
Total financial
|
168,549
|
|
3,896
|
|
(24,038
|
)
|
148,407
|
|
3,619,147
|
|
538,853
|
|
(26,119
|
)
|
4,131,881
|
|
25
|
25
|
|
|||||||||||
|
Utilities
|
||||||||||||||||||||||||||||||
|
Electric
|
20,713
|
|
1,159
|
|
—
|
|
21,872
|
|
1,463,872
|
|
306,812
|
|
(1,275
|
)
|
1,769,409
|
|
10
|
11
|
|
|||||||||||
|
Gas and water
|
—
|
|
—
|
|
—
|
|
—
|
|
520,418
|
|
64,726
|
|
(120
|
)
|
585,024
|
|
3
|
3
|
|
|||||||||||
|
Total utilities
|
20,713
|
|
1,159
|
|
—
|
|
21,872
|
|
1,984,290
|
|
371,538
|
|
(1,395
|
)
|
2,354,433
|
|
13
|
14
|
|
|||||||||||
|
Industrial - Energy
|
||||||||||||||||||||||||||||||
|
Pipelines
|
40,590
|
|
937
|
|
(1,092
|
)
|
40,435
|
|
880,379
|
|
117,765
|
|
(2,320
|
)
|
995,824
|
|
6
|
6
|
|
|||||||||||
|
Exploration and production
|
28,174
|
|
1,180
|
|
(85
|
)
|
29,269
|
|
527,581
|
|
79,784
|
|
(2,620
|
)
|
604,745
|
|
4
|
4
|
|
|||||||||||
|
Oil field services
|
33,867
|
|
—
|
|
(6,004
|
)
|
27,863
|
|
83,722
|
|
11,074
|
|
(6,004
|
)
|
88,792
|
|
1
|
1
|
|
|||||||||||
|
Refiner
|
—
|
|
—
|
|
—
|
|
—
|
|
73,106
|
|
17,430
|
|
—
|
|
90,536
|
|
—
|
—
|
|
|||||||||||
|
Driller
|
54,561
|
|
87
|
|
(14,448
|
)
|
40,200
|
|
54,561
|
|
87
|
|
(14,448
|
)
|
40,200
|
|
—
|
—
|
|
|||||||||||
|
Total energy
|
157,192
|
|
2,204
|
|
(21,629
|
)
|
137,767
|
|
1,619,349
|
|
226,140
|
|
(25,392
|
)
|
1,820,097
|
|
11
|
11
|
|
|||||||||||
|
Industrial - Basic materials
|
||||||||||||||||||||||||||||||
|
Chemicals
|
—
|
|
—
|
|
—
|
|
—
|
|
541,785
|
|
59,216
|
|
(20
|
)
|
600,981
|
|
3
|
3
|
|
|||||||||||
|
Metals and mining
|
57,438
|
|
7,727
|
|
—
|
|
65,165
|
|
387,134
|
|
85,105
|
|
—
|
|
472,239
|
|
3
|
3
|
|
|||||||||||
|
Forestry products and paper
|
—
|
|
—
|
|
—
|
|
—
|
|
112,175
|
|
16,911
|
|
—
|
|
129,086
|
|
1
|
1
|
|
|||||||||||
|
Total basic materials
|
57,438
|
|
7,727
|
|
—
|
|
65,165
|
|
1,041,094
|
|
161,232
|
|
(20
|
)
|
1,202,306
|
|
7
|
7
|
|
|||||||||||
|
Industrial - Consumer, non-cyclical
|
21,334
|
|
—
|
|
(4,498
|
)
|
16,836
|
|
1,834,778
|
|
192,887
|
|
(6,494
|
)
|
2,021,171
|
|
12
|
12
|
|
|||||||||||
|
Other industrials
|
47,136
|
|
2,965
|
|
—
|
|
50,101
|
|
1,326,051
|
|
179,694
|
|
(671
|
)
|
1,505,074
|
|
9
|
9
|
|
|||||||||||
|
Industrial -
Transportation |
26,443
|
|
1,581
|
|
(162
|
)
|
27,862
|
|
553,435
|
|
90,211
|
|
(195
|
)
|
643,451
|
|
3
|
4
|
|
|||||||||||
|
Other corporate sectors
|
143,995
|
|
5,076
|
|
(9,387
|
)
|
139,684
|
|
1,310,445
|
|
123,588
|
|
(13,236
|
)
|
1,420,797
|
|
9
|
8
|
|
|||||||||||
|
Total corporates
|
642,800
|
|
24,608
|
|
(59,714
|
)
|
607,694
|
|
13,288,589
|
|
1,884,143
|
|
(73,522
|
)
|
15,099,210
|
|
89
|
90
|
|
|||||||||||
|
Other fixed maturities:
|
||||||||||||||||||||||||||||||
|
Government (U.S., municipal, and foreign)
|
306
|
|
—
|
|
(105
|
)
|
201
|
|
1,501,865
|
|
147,772
|
|
(1,507
|
)
|
1,648,130
|
|
10
|
9
|
|
|||||||||||
|
Collateralized debt obligations
|
59,150
|
|
20,084
|
|
(7,653
|
)
|
71,581
|
|
59,150
|
|
20,084
|
|
(7,653
|
)
|
71,581
|
|
—
|
—
|
|
|||||||||||
|
Other asset-backed securities
|
—
|
|
—
|
|
—
|
|
—
|
|
144,040
|
|
4,790
|
|
—
|
|
148,830
|
|
1
|
1
|
|
|||||||||||
|
Mortgage-backed securities
(1)
|
—
|
|
—
|
|
—
|
|
—
|
|
1,457
|
|
118
|
|
(1
|
)
|
1,574
|
|
—
|
—
|
|
|||||||||||
|
Total fixed maturities
|
$
|
702,256
|
|
$
|
44,692
|
|
$
|
(67,472
|
)
|
$
|
679,476
|
|
$
|
14,995,101
|
|
$
|
2,056,907
|
|
$
|
(82,683
|
)
|
$
|
16,969,325
|
|
100
|
100
|
|
|||
|
(1)
|
Includes GNMA's.
|
49
TMK 2018 FORM 10-Q QTR 3
At
September 30, 2018
, fixed maturities had a fair value of
$16.2 billion
, compared with
$17.0 billion
at
December 31, 2017
. The net unrealized gain position in the fixed-maturity portfolio decreased from
$2.0 billion
at
December 31, 2017
to
$769 million
at
September 30, 2018
due to increases in interest rates during the period. The
September 30, 2018
net unrealized gain consisted of gross unrealized gains of
$1.1 billion
offset by
$314 million
of gross unrealized losses, compared with the
December 31, 2017
net unrealized gain which consisted of a gross unrealized gain of
$2.1 billion
and a gross unrealized loss of
$83 million
.
Corporate securities, which consist of bonds and redeemable preferred stocks, were the largest component of the fixed maturity portfolio, representing
88%
of amortized cost and fair value. The remainder of the portfolio is invested primarily in securities issued by the U.S. government and U.S. municipalities. The Company holds insignificant amounts in foreign government bonds, collateralized debt obligations, asset-backed securities, and agency mortgage-backed securities. Corporate securities are diversified over a variety of industry sectors and issuers; the total fixed maturity portfolio consisted of
612
issuers.
An analysis of the fixed maturity portfolio at
September 30, 2018
and
December 31, 2017
by a composite quality rating is shown in the table below. The composite quality rating for each security is the average of the security’s ratings as assigned by Moody’s Investor Service, Standard & Poor’s, Fitch Ratings, and Dominion Bond Rating Service, LTD. The ratings assigned by these four nationally recognized statistical rating organizations are evenly weighted when calculating the average. The composite quality rating is created using a methodology developed by Torchmark Corporation using ratings from the various rating agencies noted above (It should be noted that the composite quality rating is not a Standard & Poor's credit rating. Standard and Poor's does not sponsor, endorse or promote the composite quality rating and shall not be liable for any use of the composite quality rating.) Included in the chart below are private placement fixed maturity holdings of
$601 million
at amortized cost (
$598 million
at fair value). The ratings for these holdings were assigned by the third party managers of those securities.
Fixed Maturities by Rating
(Dollar amounts in thousands)
|
September 30, 2018
|
|||||||||||
|
Amortized
Cost |
%
|
Fair
Value |
%
|
||||||||
|
Investment grade:
|
|||||||||||
|
AAA
|
$
|
717,886
|
|
5
|
$
|
717,161
|
|
4
|
|||
|
AA
|
1,164,908
|
|
8
|
1,223,593
|
|
8
|
|||||
|
A
|
4,238,263
|
|
27
|
4,679,228
|
|
29
|
|||||
|
BBB+
|
3,400,528
|
|
22
|
3,546,631
|
|
22
|
|||||
|
BBB
|
3,517,209
|
|
23
|
3,622,670
|
|
22
|
|||||
|
BBB-
|
1,741,621
|
|
11
|
1,785,470
|
|
11
|
|||||
|
Investment grade
|
14,780,415
|
|
96
|
15,574,753
|
|
96
|
|||||
|
Below investment grade:
|
|||||||||||
|
BB
|
385,562
|
|
2
|
371,341
|
|
2
|
|||||
|
B
|
164,070
|
|
1
|
136,638
|
|
1
|
|||||
|
Below B
|
132,317
|
|
1
|
148,739
|
|
1
|
|||||
|
Below investment grade
|
681,949
|
|
4
|
656,718
|
|
4
|
|||||
|
|
$
|
15,462,364
|
|
100
|
$
|
16,231,471
|
|
100
|
|||
50
TMK 2018 FORM 10-Q QTR 3
Fixed Maturities by Rating
(Dollar amounts in thousands)
|
December 31, 2017
|
|||||||||||
|
Amortized
Cost |
%
|
Fair
Value |
%
|
||||||||
|
Investment grade:
|
|||||||||||
|
AAA
|
$
|
649,559
|
|
4
|
$
|
689,356
|
|
4
|
|||
|
AA
|
1,095,502
|
|
7
|
1,222,148
|
|
7
|
|||||
|
A
|
4,139,252
|
|
28
|
4,959,570
|
|
29
|
|||||
|
BBB+
|
3,493,309
|
|
23
|
3,936,939
|
|
23
|
|||||
|
BBB
|
3,302,118
|
|
22
|
3,696,880
|
|
22
|
|||||
|
BBB-
|
1,613,105
|
|
11
|
1,784,956
|
|
11
|
|||||
|
Investment grade
|
14,292,845
|
|
95
|
16,289,849
|
|
96
|
|||||
|
Below investment grade:
|
|||||||||||
|
BB
|
413,425
|
|
3
|
397,063
|
|
2
|
|||||
|
B
|
152,454
|
|
1
|
133,582
|
|
1
|
|||||
|
Below B
|
136,377
|
|
1
|
148,831
|
|
1
|
|||||
|
Below investment grade
|
702,256
|
|
5
|
679,476
|
|
4
|
|||||
|
$
|
14,995,101
|
|
100
|
$
|
16,969,325
|
|
100
|
||||
Of the
$15.5 billion
of fixed maturities at amortized cost as of
September 30, 2018
,
$14.8 billion
or
96%
were investment grade with an average rating of
A-
. Below-investment-grade bonds were
$682 million
with an average rating of
B+
. Below-investment-grade bonds at amortized cost were
14%
of our shareholders’ equity, excluding the effect of unrealized gains and losses on fixed maturities as of
September 30, 2018
. Overall, the total portfolio was rated
BBB+
based on amortized cost, the same as at the end of
2017
.
An analysis of the changes in our portfolio of below-investment-grade bonds at amortized cost during the first
nine
months of
2018
is as follows:
Below-Investment-Grade Bonds
(Dollar amounts in thousands)
|
Balance as of December 31, 2017
|
$
|
702,256
|
|
|
Downgrades by rating agencies
|
—
|
|
|
|
Upgrades by rating agencies
|
—
|
|
|
|
Disposals
|
(23,154
|
)
|
|
|
Amortization and other
|
2,847
|
|
|
|
Balance as of September 30, 2018
|
$
|
681,949
|
|
As noted earlier, our investment policy calls for investing primarily in fixed maturities that are investment grade and meet our quality and yield objectives. Thus, any increases in below-investment-grade issues are typically a result of ratings downgrades of existing holdings. Our investment portfolio does not contain counterparty risks as we are not a party to any derivatives contracts. We also do not participate in securities lending and we have no off-balance sheet investments.
51
TMK 2018 FORM 10-Q QTR 3
Additional information concerning the fixed-maturity portfolio is as follows:
Fixed Maturity Portfolio Selected Information
|
At
|
|||||
|
September 30,
2018 |
December 31, 2017
|
September 30,
2017 |
|||
|
Average annual effective yield
(1)
|
5.56%
|
5.60%
|
5.63%
|
||
|
Average life, in years, to:
|
|||||
|
Next call
(2)
|
17.0
|
17.5
|
17.4
|
||
|
Maturity
(2)
|
18.8
|
19.1
|
19.2
|
||
|
Effective duration to:
|
|||||
|
Next call
(2,3)
|
10.2
|
10.8
|
10.7
|
||
|
Maturity
(2,3)
|
10.9
|
11.5
|
11.4
|
||
|
(1)
|
Tax-equivalent basis. The yield on tax-exempt securities is adjusted to produce a yield equivalent to the pretax yield on taxable securities.
|
|
(2)
|
Torchmark calculates the average life and duration of the fixed maturity portfolio two ways: (a) based on the next call date which is the next call date for callable bonds and the maturity date for noncallable bonds, and (b) based on the maturity date of all bonds, whether callable or not.
|
|
(3)
|
Effective duration is a measure of the price sensitivity of a fixed-income security to a particular change in interest rates.
|
Financial Condition
Liquidity
. Liquidity provides Torchmark with the ability to meet on demand the cash commitments required to support our business operations and meet our financial obligations. Our liquidity is evidenced by consistent positive cash flow, a portfolio of marketable investments, and our credit facility.
Insurance subsidiary liquidity
.
The operations of our insurance subsidiaries have historically generated substantial cash inflows in excess of immediate cash needs. Sources of cash flows for the insurance subsidiaries include primarily premium and investment income. Cash outflows from operations include policy benefit payments, commissions, administrative expenses and taxes. The funds to provide for policy benefits, the majority of which are paid in future periods, are invested primarily in long-term fixed maturities as they better match the long-term nature of these obligations. In addition to investment income, maturities and scheduled repayments in the investment portfolio are sources of cash. Excess cash available from the insurance subsidiaries’ operations is generally distributed as a dividend to the Parent Company, subject to regulatory restriction. The dividends are generally paid in amounts equal to the subsidiaries’ prior year statutory net income excluding realized capital gains. While the leading source of the excess cash is investment income, a significant portion of the excess cash also comes from underwriting income due to our high underwriting margins and effective expense control.
Parent Company liquidity
.
An important source of Parent Company liquidity is the dividends from its insurance subsidiaries. These dividends are received throughout the year and are used by the Parent Company to pay dividends on common and preferred stock, interest and principal repayment requirements on Parent Company debt, and operating expenses of the Parent Company. In the first
nine
months of
2018
, the Parent Company received
$372 million
of cash dividends from subsidiaries, compared with
$309 million
in
2017
. The increase in cash dividends received from subsidiaries was primarily due to the timing of dividend payments. For the full year
2018
, cash dividends from subsidiaries are expected to total approximately
$420 million
. Including transfers from other subsidiaries, and after paying shareholder dividends, interest on debt obligations and other expenses, we expect the Parent Company to have approximately $340 million in excess cash flow in 2018.
Additional sources of liquidity for the Parent Company are cash, intercompany receivables, intercompany borrowings, public debt markets, and a credit facility. At
September 30, 2018
, the Parent Company had
$612 million
of invested cash and net intercompany receivables, including $543 million in net proceeds received at the end of the quarter from the issuance of the new senior debt. The credit facility is discussed below.
Credit Facility.
We have a credit facility with a group of lenders allowing for unsecured revolving borrowings and stand-by letters of credit up to $750 million, which could be extended up to $1 billion. We may request the extension, however, it is not guaranteed. Up to $250 million in letters of credit can be issued against the facility. The facility serves as a back-up credit line for a commercial paper program under which we may issue commercial paper at any time, with total commercial paper outstanding not to exceed the facility maximum, less any letters of credit issued. Interest on the commercial paper program is charged at variable rates. This facility was amended in May 2016 to extend the maturity date of the facility to May 2021. The amendment also allowed for an additional $100 million term loan to be
52
TMK 2018 FORM 10-Q QTR 3
issued under the facility rate structure. The term loan was issued during 2016 and will be repaid in quarterly escalating installments with a balloon payment of $75 million due in May 2021. Interest on the term loan is computed and paid monthly at 125 basis points plus 1 month LIBOR. In accordance with the agreement, we are subject to certain covenants regarding capitalization. As of
September 30, 2018
, we were in full compliance with those covenants.
Commercial paper outstanding and any amortization payments of the term loan due within one year are included in short-term debt. The remaining balance of the term loan is included in long-term debt. Also included in short-term debt at
September 30, 2018
are the
$293 million
par value of 9.25% Senior Notes due
June 15, 2019
which were redeemed on October 29, 2018 as discussed in
Note 10—Debt
and later under
Long-Term Debt
section.
The following table presents certain information about our commercial paper borrowings.
Credit Facility - Commercial Paper
(Dollar amounts in thousands)
|
At
|
||||||||||||
|
September 30,
2018 |
December 31, 2017
|
September 30,
2017 |
||||||||||
|
Balance of commercial paper at end of period (par value)
|
$
|
317,318
|
|
$
|
324,250
|
|
$
|
305,800
|
|
|||
|
Annualized interest rate
|
2.57
|
%
|
1.78
|
%
|
1.44
|
%
|
||||||
|
Letters of credit outstanding
|
$
|
155,000
|
|
$
|
177,000
|
|
$
|
177,000
|
|
|||
|
Remaining amount available under credit line
|
277,682
|
|
248,750
|
|
267,200
|
|
||||||
|
|
Nine Months Ended
September 30, |
|||||||
|
|
2018
|
2017
|
||||||
|
Average balance of commercial paper outstanding during period (par value)
|
$
|
386,663
|
|
$
|
336,664
|
|
||
|
Daily-weighted average interest rate (annualized)
|
2.32
|
%
|
1.24
|
%
|
||||
|
Maximum daily amount outstanding during period (par value)
|
$
|
525,990
|
|
$
|
455,912
|
|
||
The increase in commercial paper during the
nine months ended September 30, 2018
reflects timing of cash needs at the Parent Company and funds used to call the Company's $20 million Junior Subordinated Debentures. We had no difficulties in accessing the commercial paper market under this facility during the
nine
month periods ended
September 30, 2018
and
2017
.
In summary, Torchmark expects to have readily available funds for the foreseeable future to conduct its operations and to maintain target capital ratios in the insurance subsidiaries through internally-generated cash flow and the credit facility. In the unlikely event that more liquidity is needed, the Parent Company could generate additional funds through multiple sources including, but not limited to, the issuance of debt, an additional short-term credit facility, and intercompany borrowing.
Consolidated liquidity
.
Consolidated net cash inflows from operations were
$937 million
in the first
nine
months of
2018
, compared with
$1.1 billion
in the same period of
2017
. The decrease is primarily attributable to a reduction in cash flows from discontinued operations and fluctuations in the settlement of certain amounts included in other liabilities. In addition to cash inflows from operations, our insurance companies received proceeds from maturities, calls, and repayments of fixed maturities available for sale in the amount of
$267 million
during the
2018
period. As previously noted under the caption
Credit Facility,
we have in place a line of credit facility. The insurance companies have no additional outstanding credit facilities.
Cash and short-term investments were
$711 million
at
September 30, 2018
, compared with
$246 million
at
December 31, 2017
. The increase is attributed to the issuance of the new senior debt at quarter end. In addition to these liquid assets, the entire
$16.2 billion
(fair value at
September 30, 2018
) portfolio of fixed income securities is available for sale in the event of an unexpected need. Approximately
96%
of our fixed income securities are publicly traded, freely tradable under SEC Rule 144, or qualified for resale under SEC Rule 144A. We generally expect to hold fixed income securities to maturity, and even though these securities are classified as available for sale, we have the ability and intent to hold any securities which are temporarily impaired until they mature. Our strong cash flows from operations, on-going investment maturities, and credit line availability make any need to sell securities for liquidity highly unlikely.
53
TMK 2018 FORM 10-Q QTR 3
Capital Resources
.
Our goal is to maintain capital at levels necessary to support our current ratings. For the past several years, that level has been around a National Association of Insurance Commissioners (NAIC) Company Action Level Risk Based Capital (RBC) ratio of 325% on a consolidated basis. In June, the NAIC issued adjustments to certain RBC factors to reflect the reduction of the corporate income tax rate from 35% to 21%, which are effective for 2018. The effect of the adjustments is to increase the amount of required capital which comprises the denominator of the RBC ratio. In light of these adjustments and following discussions with our rating agencies, Torchmark is reducing the targeted consolidated RBC ratio to be in the range of 300% to 320%. While the consolidated target ratio has declined, the actual amount of capital at the insurance subsidiaries will be higher at December 31, 2018 than recent years.
Torchmark used approximately
$150 million
of the net proceeds from the recent issuance of new senior debt to provide additional capital to its insurance subsidiaries. To the extent that additional capital is needed in the future, the Company is confident that it can fund any capital with additional debt offerings or the use of Parent Company liquidity sources.
On a consolidated basis, Torchmark’s capital structure consists of short-term debt (comprised of the commercial paper outstanding discussed above, current maturities of the term loan, and current maturities of funded debt), long-term debt (comprised of long-term maturities of funded debt and long term maturities of the term loan), and shareholders’ equity.
The outstanding long-term debt at book value was
$1.4 billion
at
September 30, 2018
and
$1.1 billion
at
December 31, 2017
. An analysis of debt issues outstanding is as follows at
September 30, 2018
.
Selected Information about Debt Issues
As of
September 30, 2018
(Dollar amounts in thousands)
|
Instrument
|
Year
Due |
Interest
Rate |
|
Par
Value |
Book
Value |
Fair
Value |
||||||||||
|
Notes
|
2023
|
7.875%
|
$
|
165,612
|
|
$
|
164,437
|
|
$
|
191,786
|
|
|||||
|
Senior Notes
(1)
|
2019
|
9.250%
|
|
292,647
|
|
292,265
|
|
304,779
|
|
|||||||
|
Senior Notes
(2)
|
2022
|
3.800%
|
150,000
|
|
148,701
|
|
149,307
|
|
||||||||
|
Senior Notes
|
2028
|
4.550%
|
550,000
|
|
543,203
|
|
552,338
|
|
||||||||
|
Junior Subordinated Debentures
|
2056
|
6.125%
|
300,000
|
|
290,505
|
|
307,336
|
|
||||||||
|
Junior Subordinated Debentures
|
2057
|
5.275%
|
125,000
|
|
123,351
|
|
97,712
|
|
||||||||
|
Term loan
|
2021
|
3.326%
|
(3)
|
95,000
|
|
95,000
|
|
95,000
|
|
|||||||
|
1,678,259
|
|
1,657,462
|
|
1,698,258
|
|
|||||||||||
|
Less current maturity of term loan
(4)
|
6,250
|
|
6,250
|
|
6,250
|
|
||||||||||
|
Less current maturity of funded debt
|
292,647
|
|
292,265
|
|
304,779
|
|
||||||||||
|
Total long-term debt
|
1,379,362
|
|
1,358,947
|
|
1,387,229
|
|
||||||||||
|
Current maturity of term loan
(4)
|
6,250
|
|
6,250
|
|
6,250
|
|
||||||||||
|
Current maturity of funded debt
|
292,647
|
|
292,265
|
|
304,779
|
|
||||||||||
|
Commercial paper
|
317,318
|
|
316,496
|
|
316,496
|
|
||||||||||
|
Total short-term debt
|
616,215
|
|
615,011
|
|
627,525
|
|
||||||||||
|
Total debt
|
$
|
1,995,577
|
|
$
|
1,973,958
|
|
$
|
2,014,754
|
|
|||||||
|
(1)
|
Amount was redeemed on October 29, 2018.
|
|
(2)
|
An additional $150 million par value and book value is held by insurance subsidiaries that eliminates in consolidation.
|
|
(3)
|
Interest paid at 1 month LIBOR plus 125 basis points, resets each month.
|
|
(4)
|
The current amount of the term loan due of $6.3 million is classified as short term debt.
|
54
TMK 2018 FORM 10-Q QTR 3
Issuance of long-term debt:
On
September 27, 2018
, Torchmark completed the issuance and sale of
$550 million
in aggregate principal of Torchmark’s
4.55%
Senior Notes due
September 15, 2028
. The notes were sold pursuant to Torchmark’s shelf registration statement on Form S-3, filed September 26, 2018. The net proceeds from the sale of the notes were
$543 million
, after giving effect to the underwriting discounts and commissions and estimated offering expenses payable by Torchmark. Torchmark used a portion of the net proceeds from the sale of the notes to redeem the
$293 million
outstanding principal amount on Torchmark’s
9.25%
Senior Notes due June 15, 2019, including the payment of an approximately
$11 million
“make-whole” premium plus accrued and unpaid interest to, but excluding, the date of redemption. Torchmark has used approximately
$150 million
of the net proceeds to provide additional capital to its insurance subsidiaries and intends to use any remaining net proceeds for general corporate purposes, which may include additional holding company liquidity and the repayment of a portion of Torchmark’s outstanding commercial paper. The rating agencies assigned ratings for the new debt consistent with prior ratings.
Due to increasing variable interest rates, on
June 15, 2018
, the Company called its
$20 million
Junior Subordinated Debentures. As previously noted under the caption
Results of Operations
in this report, we acquired
2.9 million
of our outstanding common shares under our share repurchase program during the first
nine
months of
2018
. These shares were acquired at a cost of
$250 million
(average of
$85.54
per share), compared with purchases of
3.2 million
shares at a cost of
$243 million
(average of
$76.46
per share) in the first
nine
months of
2017
.
On
August 9, 2018
, the Company announced that it had declared a quarterly dividend of
$0.16
per share. This dividend was paid on
November 1, 2018
.
Shareholders’ equity was
$5.5 billion
at
September 30, 2018
. This compares with
$6.2 billion
at
December 31, 2017
and
$5.2 billion
at
September 30, 2017
. During the
nine
months since
December 31, 2017
, shareholders’ equity
decreased
due to
$949 million
of after-tax unrealized losses in the fixed-maturity portfolio as interest rates have increased over the period. In addition, shareholders' equity was increased by net income of
$537 million
. Share purchases of
$250 million
noted above during the period reduced shareholders’ equity.
We are required under GAAP to revalue our available for sale fixed maturity portfolio to fair market value at the end of each accounting period. These changes, net of their associated impact on deferred acquisition costs and income tax, are reflected directly in shareholders’ equity.
While GAAP requires our fixed maturity assets to be revalued, it does not permit interest-bearing insurance policy liabilities supported by those assets to be valued at fair value in a consistent manner, with changes in value applied directly to shareholders’ equity. However, due to the size of both the investment portfolio and our policy liabilities, this inconsistency in measurement can have a material impact on shareholders’ equity. Because of the long-term nature of our fixed maturities and liabilities and the strong cash flows generated by our insurance subsidiaries, we have the intent and ability to hold our securities to maturity. As such, we do not expect to incur realized gains or losses due to fluctuations in the market value of fixed maturities caused by interest rate changes or losses caused by temporarily illiquid markets. Accordingly, management removes the effect of this rule when analyzing Torchmark’s balance sheet, capital structure, and financial ratios in order to provide a more consistent and meaningful portrayal of the Company’s financial position from period to period.
55
TMK 2018 FORM 10-Q QTR 3
The following table presents selected data related to capital resources. Additionally, the table presents the effect of the GAAP requirement to revalue our fixed maturity assets on relevant items so that investors and other financial statement users may determine its impact on our capital structure.
Selected Financial Data
(Dollar amounts in thousands, except per share data)
|
At
|
|||||||||||||||||||||||
|
|
September 30, 2018
|
December 31, 2017
|
September 30, 2017
|
||||||||||||||||||||
|
GAAP
|
Effect of
Accounting Rule Requiring Revaluation (1) |
GAAP
|
Effect of
Accounting Rule Requiring Revaluation (1) |
GAAP
|
Effect of
Accounting Rule Requiring Revaluation (1) |
||||||||||||||||||
|
Fixed maturities
|
$
|
16,231,471
|
|
$
|
769,107
|
|
$
|
16,969,325
|
|
$
|
1,974,224
|
|
$
|
16,652,913
|
|
$
|
1,738,333
|
|
|||||
|
Deferred acquisition costs
(2)
|
4,091,601
|
|
(7,150
|
)
|
3,958,063
|
|
(10,819
|
)
|
3,911,800
|
|
(11,273
|
)
|
|||||||||||
|
Total assets
|
23,469,488
|
|
761,957
|
|
23,474,985
|
|
1,963,405
|
|
22,993,607
|
|
1,727,060
|
|
|||||||||||
|
Short-term debt
|
615,011
|
|
—
|
|
328,067
|
|
—
|
|
309,002
|
|
—
|
|
|||||||||||
|
Long-term debt
|
1,358,947
|
|
—
|
|
1,132,201
|
|
—
|
|
1,130,806
|
|
—
|
|
|||||||||||
|
Shareholders' equity
|
5,538,905
|
|
601,946
|
|
6,231,421
|
|
1,551,090
|
|
5,167,685
|
|
1,122,589
|
|
|||||||||||
|
Book value per diluted share
|
48.35
|
|
5.25
|
|
52.95
|
|
13.18
|
|
43.78
|
|
9.51
|
|
|||||||||||
|
Debt to capitalization
(3)
|
26.3
|
%
|
(2.3
|
)%
|
19.0
|
%
|
(4.8
|
)%
|
21.8
|
%
|
(4.5
|
)%
|
|||||||||||
|
Diluted shares outstanding
|
114,559
|
|
117,696
|
|
118,028
|
|
|||||||||||||||||
|
Actual shares outstanding
|
112,168
|
|
114,593
|
|
115,359
|
|
|||||||||||||||||
|
(1)
|
Amount added to (deducted from) comprehensive income to produce the stated GAAP item, per accounting rule ASC 320-10-35-1.
|
|
(2)
|
Includes the value of insurance purchased.
|
|
(3)
|
Torchmark’s debt covenants require that the effect of this accounting rule be removed to determine this ratio. This ratio is computed by dividing total debt by the sum of total debt and shareholders’ equity.
|
Interest coverage was
10.9
times in the first
nine
months of
2018
, compared with
10.8
times in the
2017
period. Interest coverage is computed by dividing interest expense into the sum of pretax income and interest expense.
56
TMK 2018 FORM 10-Q QTR 3
Cautionary Statements
We caution readers regarding certain forward-looking statements contained in the previous discussion and elsewhere in this document, and in any other statements made by, or on behalf of Torchmark whether or not in future filings with the Securities and Exchange Commission. Any statement that is not a historical fact or that might otherwise be considered an opinion or projection concerning Torchmark or its business, whether express or implied, is meant as and should be considered a forward-looking statement. Such statements represent management’s opinions concerning future operations, strategies, financial results or other developments. We specifically disclaim any obligation to update or revise any forward-looking statement because of new information, future developments, or otherwise.
Forward-looking statements are based upon estimates and assumptions that are subject to significant business, economic and competitive uncertainties, many of which are beyond our control. If these estimates or assumptions prove to be incorrect, the actual results of Torchmark may differ materially from the forward-looking statements made on the basis of such estimates or assumptions. Whether or not actual results differ materially from forward-looking statements may depend on numerous foreseeable and unforeseeable events or developments, which may be national in scope, related to the insurance industry generally, or applicable to Torchmark specifically. Such events or developments could include, but are not necessarily limited to:
|
1)
|
Economic and other conditions leading to unexpected changes in lapse rates and/or sales of our policies, as well as levels of mortality, morbidity, and utilization of health care services that differ from Torchmark’s assumptions;
|
|
2)
|
Regulatory developments, including changes in governmental regulations (particularly those impacting taxes and changes to the Federal Medicare program that would affect Medicare Supplement);
|
|
3)
|
Market trends in the senior-aged health care industry that provide alternatives to traditional Medicare (such as Health Maintenance Organizations and other managed care or private plans) and that could affect the sales of traditional Medicare Supplement insurance;
|
|
4)
|
Interest rate changes that affect product sales and/or investment portfolio yield;
|
|
5)
|
General economic, industry sector or individual debt issuers’ financial conditions that may affect the current market value of securities we own, or that may impair an issuer’s ability to make principal and/or interest payments due on those securities;
|
|
6)
|
Changes in pricing competition;
|
|
7)
|
Litigation results;
|
|
8)
|
Levels of administrative and operational efficiencies that differ from our assumptions;
|
|
9)
|
The ability to obtain timely and appropriate premium rate increases for health insurance policies from our regulators;
|
|
10)
|
The customer response to new products and marketing initiatives;
|
|
11)
|
Reported amounts in the financial statements which are based on management’s estimates and judgments which may differ from the actual amounts ultimately realized; and
|
|
12)
|
Compromise by a malicious actor or other event that causes a loss of secure data from, or inaccessibility to, our computer and other information technology systems.
|
57
TMK 2018 FORM 10-Q QTR 3
There have been no quantitative or qualitative changes with respect to market risk exposure during the
nine
months ended
September 30, 2018
.
Torchmark, under the direction of the Co-Chairmen and Chief Executive Officers and the Executive Vice President and Chief Financial Officer, has established disclosure controls and procedures that are designed to ensure that information required to be disclosed by Torchmark in the reports that it files or submits under the Securities Exchange Act of 1934 is recorded, processed, summarized and reported within the time periods specified in the SEC’s rules and forms. The disclosure controls and procedures are also intended to ensure that such information is accumulated and communicated to Torchmark’s management, including the Co-Chairmen and Chief Executive Officers and the Executive Vice President and Chief Financial Officer, as appropriate to allow timely decisions regarding required disclosures.
As of the end of the fiscal quarter completed
September 30, 2018
, an evaluation was performed under the supervision and with the participation of Torchmark management, including the Co-Chairmen and Chief Executive Officers and the Executive Vice President and Chief Financial Officer, of Torchmark’s disclosure controls and procedures (as those terms are defined in Rule 13a-15(e) under the Securities Exchange Act of 1934). Based upon their evaluation, the Co-Chairmen and Chief Executive Officers and the Executive Vice President and Chief Financial Officer have concluded that Torchmark’s disclosure controls and procedures are effective as of the date of this Form 10-Q. In compliance with Section 302 of the Sarbanes-Oxley Act of 2002 (18 U.S.C. §1350), each of these officers executed a Certification included as an exhibit to this Form 10-Q.
For the quarter ended
September 30, 2018
, there have not been any changes in Torchmark’s internal control over financial reporting or in other factors that could significantly affect this control over financial reporting subsequent to the date of their evaluation which have materially affected, or are reasonably likely to materially affect, Torchmark’s internal control over financial reporting. No material weaknesses in such internal controls were identified in the evaluation and as a consequence, no corrective action was required to be taken.
58
TMK 2018 FORM 10-Q QTR 3
Torchmark and its subsidiaries, in common with the insurance industry in general, are subject to litigation, including claims involving tax matters, alleged breaches of contract, torts, including bad faith and fraud claims based on alleged wrongful or fraudulent acts of agents of Torchmark’s subsidiaries, employment discrimination, and miscellaneous other causes of action. Based upon information presently available, and in light of legal and other factual defenses available to Torchmark and its subsidiaries, management does not believe that such litigation will have a material adverse effect on Torchmark’s financial condition, future operating results or liquidity; however, assessing the eventual outcome of litigation necessarily involves forward-looking speculation as to judgments to be made by judges, juries and appellate courts in the future. This bespeaks caution, particularly in states with reputations for high punitive damage verdicts. Torchmark’s management recognizes that large punitive damage awards bearing little or no relation to actual damages continue to be awarded by juries in jurisdictions in which Torchmark and its subsidiaries have substantial business, creating the potential for unpredictable material adverse judgments in any given punitive damage suit.
See further discussion of litigation and other legal proceedings in
Note 6—Commitments and Contingencies
.
Torchmark had no material changes to its risk factors.
(c) Purchases of Certain Equity Securities by the Issuer and Others
|
Period
|
(a) Total Number
of Shares
Purchased
|
(b) Average
Price Paid
Per Share
|
(c) Total Number of
Shares Purchased as Part
of Publicly Announced
Plans or Programs
|
(d) Maximum Number
of Shares (or
Approximate Dollar
Amount) that May
Yet Be Purchased
Under the Plans or
Programs
|
||||||||
|
July 1-31, 2018
|
257,785
|
|
$
|
83.20
|
|
257,785
|
|
|||||
|
August 1-31, 2018
|
289,533
|
|
87.84
|
|
289,533
|
|
||||||
|
September 1-30, 2018
|
517,746
|
|
86.61
|
|
517,746
|
|
||||||
At its
August 7, 2018
m
eeting, the Board of Directors reaffirmed the Company’s share repurchase program in amounts and with timing that management, in consultation with the Board, determines to be in the best interest of the Company. The program has no defined expiration date or maximum shares to be repurchased.
|
(a)
|
Exhibits
|
|
(31.1)
|
|
|
|
(31.2)
|
|
|
|
(31.3)
|
|
|
|
(32.1)
|
|
|
|
(101)
|
|
Interactive Data Files for the Torchmark Corporation Form 10-Q for the period ended September 30, 2018
|
59
TMK 2018 FORM 10-Q QTR 3
SIGNATURES
Pursuant to the requirement of the Securities Exchange Act of 1934, the registrant has duly caused this report to be signed on its behalf by the undersigned hereunto duly authorized.
|
|
TORCHMARK CORPORATION
|
||
|
Date: November 6, 2018
|
|
/s/ Gary L. Coleman
|
|
|
|
Gary L. Coleman
|
||
|
|
Co-Chairman and Chief Executive Officer
|
||
|
Date: November 6, 2018
|
|
/s/ Larry M. Hutchison
|
|
|
|
Larry M. Hutchison
|
||
|
|
Co-Chairman and Chief Executive Officer
|
||
|
Date: November 6, 2018
|
|
/s/ Frank M. Svoboda
|
|
|
|
Frank M. Svoboda
|
||
|
|
Executive Vice President and Chief Financial Officer
|
||
60
TMK 2018 FORM 10-Q QTR 3
TABLE OF CONTENTS
Part I Financial InformationItem 1. Condensed Consolidated Financial StatementsNote 1 Significant Accounting PoliciesNote 2 New Accounting StandardsNote 2 New Accounting Standards (continued)Note 15 Commitments and ContingenciesNote 3 Supplemental Information About Changes To Accumulated Other Comprehensive IncomeNote 3 Supplemental Information About Changes To Accumulated Other Comprehensive Income (continued)Note 4 InvestmentsNote 4 Investments (continued)Note 5 Income TaxesNote 6 Commitments and ContingenciesNote 6 Commitments and Contingencies (continued)Note 7 Liability For Unpaid ClaimsNote 8 Postretirement BenefitsNote 8 Postretirement Benefit Plans (continued)Note 9 Earnings Per ShareNote 10 DebtNote 11 Business SegmentsNote 11 Business Segments (continued)Item 2. Management S Discussion and Analysis Of Financial Condition and Results Of OperationsPart D Adjustment - Discontinued Operations (55) (3,739) 3,684Part D Adjustment - Discontinued OperationsItem 3. Quantitative and Qualitative Disclosures About Market RiskItem 4. Controls and ProceduresPart II Other InformationItem 1. Legal ProceedingsItem 1A. Risk FactorsItem 2. Changes in Securities, Use Of Proceeds and Issuer Purchases Of Equity SecuritiesItem 6. Exhibits