UNITED STATES
SECURITIES AND EXCHANGE COMMISSION
Washington, D.C. 20549
FORM 20-F
(Mark One)
|
[ ]
|
REGISTRATION STATEMENT PURSUANT TO SECTION 12(b) OR (g)
OF THE SECURITIES EXCHANGE ACT OF 1934
|
|
OR
|
|
[X]
|
ANNUAL REPORT PURSUANT TO SECTION 13 OR 15(d) OF THE SECURITIES EXCHANGE ACT OF 1934
|
|
For the fiscal year ended
|
December 31, 2013
|
|
|
OR
|
|
[ ]
|
TRANSITION REPORT PURSUANT TO SECTION 13 OR 15(d) OF THE SECURITIES EXCHANGE ACT OF 1934
|
|
For the transition period from
|
|
to
|
|
|
OR
|
|
[ ]
|
SHELL COMPANY REPORT PURSUANT TO SECTION 13 OR 15(d) OF THE SECURITIES EXCHANGE ACT OF 1934
|
|
Date of event requiring this shell company report
|
|
|
Commission file number
|
000-50113
|
|
|
Golar LNG Limited
|
|
(Exact name of Registrant as specified in its charter)
|
|
|
|
(Translation of Registrant's name into English)
|
|
|
|
Bermuda
|
|
(Jurisdiction of incorporation or organization)
|
|
|
|
Par-la-Ville Place, 14 Par-la-Ville Road, Hamilton, HM 08, Bermuda
|
|
(Address of principal executive offices)
|
|
|
Georgina Sousa, (1) 441 295 4705, (1) 441 295 3494
Par-la-Ville Place, 14 Par-la-Ville Road, Hamilton, HM 08, Bermuda
|
|
||
(Name, Telephone, E-mail and/or Facsimile number and Address of Company Contact Person)
Securities registered or to be registered pursuant to section 12(b) of the Act.
|
Title of each class
|
Name of each exchange
on which registered
|
|
Common Shares, par value, $1.00 per share
|
Nasdaq Global Select Market
|
Securities registered or to be registered pursuant to section 12(g) of the Act.
|
None
|
|
(Title of class)
|
Securities for which there is a reporting obligation pursuant to Section 15(d) of the Act.
|
None
|
|
(Title of class)
|
Indicate the number of outstanding shares of each of the issuer's classes of capital or common stock as of the close of the period covered by the annual report.
|
80,579,295 Common Shares, par $1.00, per share
|
Indicate by check mark if the registrant is a well-known seasoned issuer, as defined in Rule 405 of the Securities Act.
|
Yes
|
X
|
No
|
|
If this report is an annual or transition report, indicate by check mark if the registrant is not required to file reports pursuant to Section 13 of 15(d) of the Securities Exchange Act 1934.
|
Yes
|
|
No
|
X
|
Note- Checking the box above will not relieve any registrant required to file reports pursuant to Section 13 or 15(d) of the Securities Exchange Act of 1934 from their obligations under those Sections.
Indicate by check mark whether the registrant (1) has filed all reports required to be filed by Section 13 or 15(d) of the Securities Exchange Act of 1934 during the preceding 12 months (or for such shorter period that the registrant was required to file such reports), and (2) has been subject to such filing requirements for the past 90 days.
|
Yes
|
X
|
No
|
|
Indicate by check mark whether the registrant has submitted electronically and posted on its corporate Web site, if any, every Interactive Data File required to be submitted and posted pursuant to Rule 405 of Regulation S-T (§232.405 of this chapter) during the preceding 12 months (or for such shorter period that the registrant was required to submit and post such files).
|
Yes
|
X
|
No
|
|
Indicate by check mark whether the registrant is a large accelerated filer, an accelerated filer, or a non-accelerated filer. See definition of "accelerated filer and large accelerated filer" in Rule 12b-2 of the Exchange Act. (Check one).
|
Large accelerated filer
|
X
|
Accelerated filer
|
|
Non-accelerated filer
|
|
Indicate by check mark which basis of accounting the registrant has used to prepare the financial statements included in this filing:
|
U.S. GAAP
|
X
|
International Financial Reporting Standards as issued by the International Accounting
Standards Board
|
|
Other
|
|
If "Other" has been checked in response to the previous question, indicate by check mark which financial statement item the registrant has elected to follow.
|
|
|
Item 17
|
|
Item 18
|
|
If this is an annual report, indicate by check mark whether the registrant is a shell company (as defined in Rule 12b-2 of the Exchange Act).
|
Yes
|
|
|
No
|
X
|
|
(APPLICABLE ONLY TO ISSUERS INVOLVED IN BANKRUPTCY PROCEEDINGS DURING THE PAST FIVE YEARS)
Indicate by check mark whether the registrant has filed all documents and reports required to be filed by Sections 12, 13 or 15(d) of the Securities Exchange Act of 1934 subsequent to the distribution of securities under a plan confirmed by a court.
|
Yes
|
|
No
|
|
INDEX TO REPORT ON FORM 20-F
|
PART I
|
|
PAGE
|
|
|
|
|
|
ITEM 1.
|
||
|
|
|
|
|
ITEM 2.
|
||
|
|
|
|
|
ITEM 3.
|
||
|
|
|
|
|
ITEM 4.
|
||
|
|
|
|
|
ITEM 4A.
|
||
|
|
|
|
|
ITEM 5.
|
||
|
|
|
|
|
ITEM 6.
|
||
|
|
|
|
|
ITEM 7.
|
||
|
|
|
|
|
ITEM 8.
|
||
|
|
|
|
|
ITEM 9.
|
||
|
|
|
|
|
ITEM 10.
|
||
|
|
|
|
|
ITEM 11.
|
||
|
|
|
|
|
ITEM 12.
|
||
|
|
|
|
|
PART II
|
|
|
|
|
|
|
|
ITEM 13.
|
||
|
|
|
|
|
ITEM 14.
|
||
|
|
|
|
|
ITEM 15.
|
||
|
|
|
|
|
ITEM 16A.
|
||
|
|
|
|
|
ITEM 16B.
|
||
|
|
|
|
|
ITEM 16C.
|
||
|
|
|
|
|
ITEM 16D.
|
||
|
|
|
|
|
ITEM 16E.
|
||
|
|
|
|
|
ITEM 16F.
|
||
|
|
|
|
|
ITEM 16G.
|
||
|
|
|
|
|
ITEM 16H.
|
||
|
|
|
|
|
PART III
|
|
|
|
|
|
|
|
ITEM 17.
|
||
|
|
|
|
|
ITEM 18.
|
||
|
|
|
|
|
ITEM 19.
|
||
|
|
|
|
CAUTIONARY STATEMENT REGARDING FORWARD LOOKING STATEMENTS
Matters discussed in this report may constitute forward-looking statements. The Private Securities Litigation Reform Act of 1995 provides safe harbor protections for forward-looking statements in order to encourage companies to provide prospective information about their business. Forward-looking statements include statements concerning plans, objectives, goals, strategies, future events or performance, and underlying assumptions and other statements, which are other than statements of historical facts.
Golar LNG Limited and its subsidiaries or the Company, desires to take advantage of the safe harbor provisions of the Private Securities Litigation Reform Act of 1995 and is including this cautionary statement in connection with this safe harbor legislation. This report and any other written or oral statements made by us or on our behalf may include forward-looking statements, which reflect our current views with respect to future events and financial performance. When used in this report, the words "believe," "anticipate," "intend," "estimate," "forecast," "project," "plan," "potential," "will," "may," "should," "expect" and similar expressions identify forward-looking statements.
The forward-looking statements in this report are based upon various assumptions, many of which are based, in turn, upon further assumptions, including without limitation, management's examination of historical operating trends, data contained in our records and other data available from third parties. Although we believe that these assumptions were reasonable when made, because these assumptions are inherently subject to significant uncertainties and contingencies which are difficult or impossible to predict and are beyond our control, we cannot assure you that we will achieve or accomplish these expectations, beliefs or projections. As a result, shareholders are cautioned not to rely on any forward-looking statements.
In addition to these important factors and matters discussed elsewhere herein and in the documents incorporated by reference herein, important factors that, in our view, could cause actual results to differ materially from those discussed in the forward-looking statements include among other things:
|
•
|
inability of the Company to obtain financing for conversion of its vessel's into FLNGVs on terms acceptable to it or at all;
|
|
•
|
changes in demand for natural gas carried by sea;
|
|
•
|
a material decline or prolonged weakness in rates for liquefied natural gas, or LNG, carriers;
|
|
•
|
changes in demand for natural gas generally or in particular regions;
|
|
•
|
adoption of new rules and regulations applicable to LNG carriers and floating storage and regasification units, or FSRUs;
|
|
•
|
actions taken by regulatory authorities that may prohibit the access of LNG carriers or FSRUs to various ports;
|
|
•
|
inability of the Company to achieve successful utilization of our expanded fleet and inability to expand beyond the carriage of LNG;
|
|
•
|
increases in costs including among other things crew wages, insurance, provisions, repairs and maintenance;
|
|
•
|
changes in general domestic and international political conditions;
|
|
•
|
the current turmoil in the global financial markets;
|
|
•
|
ability of the Company to timely complete our FSRU and FLNGV conversions;
|
|
•
|
failure of shipyards to comply with delivery schedules on a timely basis or at all; and
|
|
•
|
other factors listed from time to time in registration statements, reports or other materials that the Company has filed with or furnished to the Securities and Exchange Commission, or the Commission.
|
We caution readers of this report not to place undue reliance on these forward-looking statements, which speak only as of their dates. These forward looking statements are not guarantees of our future performance, and actual results and future developments may vary materially from those projected in the forward looking statements.
Please see our Risk Factors in Item 3 of this report for a more complete discussion of these and other risks and uncertainties.
Not Applicable.
Not Applicable.
Throughout this report, the "Company," "Golar," "Golar LNG," "we," "us" and "our" all refer to Golar LNG Limited or any one or more of its consolidated subsidiaries, including Golar LNG Energy Limited ("Golar Energy") and to Golar Management Limited (or Golar Management), or to all such entities. References in this Annual Report to Golar Wilhelmsen refer to Golar Wilhelmsen AS, a company that is jointly controlled by both Golar and Wilhelmsen Ship Management (Norway) AS. References in this Annual Report to "Golar Partners" or the "Partnership" refer, depending on the context, to Golar LNG Partners LP (NasdaqGS: GMLP) and to any one or more of its direct and indirect subsidiaries. Under the provisions of Golar Partners' partnership agreement, the general partner has irrevocably delegated the authority to the Partnership's board of directors to have the power to oversee and direct the operations of, manage and to determine the strategies and policies of Golar Partners.
On December 13, 2012, Golar Partners, held its first Annual General Meeting ("AGM"). As of the first AGM held by Golar Partners, the majority of the board members became electable by common unit holders and since then we no longer retain the power to control the directors of Golar Partners. As a result, from December 13, 2012, Golar Partners has been considered an affiliated entity and not as our controlled subsidiary. Unless otherwise indicated, all references to "USD," "U.S.$" and "$" in this report are U.S. dollars.
A. Selected Financial Data
The following selected consolidated financial and other data, which includes our fleet and other operating data, summarize our historical consolidated financial information. We derived the balance sheet information as of December 31, 2013 and 2012 and for each of the years in the three-year period ended December 31, 2013 from our audited Consolidated Financial Statements included in Item 18 of this annual report on Form 20-F, which were prepared in accordance with accounting principles generally accepted in the United States of America, or U.S. GAAP.
The selected statements of operations data with respect to the years ended December 31, 2010 and 2009 and the selected balance sheet data as of December 31, 2011, 2010 and 2009 have been derived from audited consolidated financial statements prepared in accordance with U.S. GAAP not included herein.
The following table should also be read in conjunction with the section of this annual report entitled Item 5, "Operating and Financial Review and Prospects" and our Consolidated Financial Statements and Notes thereto included herein.
|
|
||||||||||
|
|
Fiscal Years Ended
December 31,
|
|||||||||
|
|
2013
(1)
|
2012
|
2011
|
2010
|
2009
|
|||||
|
|
(in thousands of U.S. $, except number of shares, per common share data, fleet and other financial data)
|
|||||||||
|
Statement of Operations Data:
|
|
|
|
|
|
|
||||
|
Total operating revenues
|
99,828
|
|
410,345
|
|
299,848
|
|
244,045
|
|
216,495
|
|
|
Vessel operating expenses (2)
|
43,750
|
|
86,672
|
|
62,872
|
|
52,910
|
|
60,709
|
|
|
Voyage and charter-hire expenses (3)
|
14,259
|
|
9,853
|
|
6,042
|
|
32,311
|
|
39,463
|
|
|
Administrative expenses
|
22,952
|
|
25,013
|
|
33,679
|
|
22,832
|
|
19,958
|
|
|
Depreciation and amortization
|
36,871
|
|
85,524
|
|
70,286
|
|
65,076
|
|
63,482
|
|
|
Impairment of long-term assets
|
500
|
|
500
|
|
500
|
|
4,500
|
|
1,500
|
|
|
Gain on sale of subsidiary
|
65,619
|
|
—
|
|
—
|
|
—
|
|
—
|
|
|
Other operating losses
|
—
|
|
(27
|
)
|
(5,438
|
)
|
(6,230
|
)
|
—
|
|
|
Operating income
|
47,115
|
|
202,756
|
|
121,031
|
|
60,186
|
|
31,383
|
|
1
|
|
||||||||||
|
Dividend Income
|
30,960
|
|
—
|
|
—
|
|
—
|
|
—
|
|
|
Gain on loss of control
|
—
|
|
853,996
|
|
—
|
|
—
|
|
—
|
|
|
Gain on business acquisition
|
—
|
|
4,084
|
|
—
|
|
—
|
|
—
|
|
|
Other non operating income
|
(3,355
|
)
|
(151
|
)
|
541
|
|
4,196
|
|
—
|
|
|
Net financial (income) expenses
|
(41,768
|
)
|
42,868
|
|
53,102
|
|
66,961
|
|
1,692
|
|
|
Income (loss) before equity in net earnings (losses) of affiliates, income taxes and non-controlling interests
|
116,488
|
|
1,017,817
|
|
68,470
|
|
(2,579
|
)
|
29,691
|
|
|
Income taxes
|
3,404
|
|
(2,765
|
)
|
1,705
|
|
(1,427
|
)
|
(1,643
|
)
|
|
Non-controlling interests
|
—
|
|
(43,140
|
)
|
(21,625
|
)
|
5,825
|
|
(8,419
|
)
|
|
Equity in net earnings (losses) of affiliates
|
15,821
|
|
(609
|
)
|
(1,900
|
)
|
(1,435
|
)
|
(4,902
|
)
|
|
Gain on sale of affiliate
|
—
|
|
—
|
|
—
|
|
—
|
|
8,355
|
|
|
Net income attributable to the shareholders
|
135,713
|
|
971,303
|
|
46,650
|
|
384
|
|
23,082
|
|
|
Earnings per common share
|
|
|
|
|
|
|
||||
|
- basic (4)
|
1.69
|
12.09
|
0.62
|
0.01
|
0.34
|
|||||
|
- diluted (4)
|
1.59
|
11.66
|
0.62
|
0.01
|
0.34
|
|||||
|
Cash dividends declared and paid per common share (5)
|
1.35
|
1.93
|
1.13
|
0.45
|
—
|
|
||||
|
Weighted average number of shares –
basic (4)
|
80,530
|
|
80,324
|
|
74,707
|
|
67,173
|
|
67,230
|
|
|
Weighted average number of shares –
diluted (4)
|
80,911
|
|
84,243
|
|
75,033
|
|
67,393
|
|
67,335
|
|
|
Balance Sheet Data (as of end of year):
|
|
|
|
|
|
|
||||
|
Cash and cash equivalents
|
125,347
|
|
424,714
|
|
66,913
|
|
164,717
|
|
122,231
|
|
|
Restricted cash and short-term investments (6)
|
23,432
|
|
1,551
|
|
28,012
|
|
21,815
|
|
40,651
|
|
|
Amounts due from related parties (short-term)
|
6,311
|
|
5,915
|
|
354
|
|
222
|
|
795
|
|
|
Amounts due from related parties (long-term)
|
—
|
|
34,953
|
|
—
|
|
—
|
|
—
|
|
|
Long-term restricted cash (6)
|
3,111
|
|
—
|
|
185,270
|
|
186,041
|
|
594,154
|
|
|
Investment in available-for-sale securities
|
267,352
|
|
353,034
|
|
—
|
|
—
|
|
—
|
|
|
Investments in affiliates
|
350,918
|
|
367,656
|
|
22,529
|
|
20,276
|
|
21,243
|
|
|
Cost method investments
|
204,172
|
|
198,524
|
|
7,347
|
|
7,347
|
|
7,347
|
|
|
Newbuildings
|
767,525
|
|
435,859
|
|
190,100
|
|
—
|
|
—
|
|
|
Vessels and equipment, net
|
811,715
|
|
573,615
|
|
1,203,003
|
|
1,103,137
|
|
653,496
|
|
|
Vessels under capital lease, net (7)
|
—
|
|
—
|
|
501,904
|
|
515,666
|
|
992,563
|
|
|
Total assets
|
2,665,221
|
|
2,414,399
|
|
2,232,634
|
|
2,077,772
|
|
2,492,436
|
|
|
Current portion of long-term debt
|
30,784
|
|
14,400
|
|
64,306
|
|
105,629
|
|
74,504
|
|
|
Current portion of obligations under capital leases
|
—
|
|
—
|
|
5,909
|
|
5,766
|
|
8,588
|
|
|
Long-term debt
|
686,244
|
|
490,506
|
|
707,243
|
|
691,549
|
|
707,722
|
|
|
Long-term obligations under capital leases (7)
|
—
|
|
—
|
|
399,934
|
|
406,109
|
|
844,355
|
|
|
Non-controlling interests (8)
|
—
|
|
—
|
|
78,055
|
|
188,734
|
|
162,673
|
|
|
Stockholders' equity
|
1,804,137
|
|
1,764,319
|
|
677,765
|
|
410,588
|
|
495,511
|
|
|
Common shares outstanding (4)
|
80,580
|
|
80,504
|
|
80,237
|
|
67,808
|
|
67,577
|
|
2
|
|
2013
(1)
|
2012
|
2011
|
2010
|
2009
|
||||||||||
|
Cash Flow Data:
|
|
|
|
|
|
|
|||||||||
|
Net cash provided by operating activities
|
67,722
|
|
233,810
|
|
116,608
|
|
51,710
|
|
43,763
|
|
|||||
|
Net cash (used in) provided by investing activities
|
(533,067
|
)
|
(290,700
|
)
|
(298,644
|
)
|
364,736
|
|
(56,460
|
)
|
|||||
|
Net cash provided by (used in) financing activities
|
165,978
|
|
414,691
|
|
84,232
|
|
(373,960
|
)
|
78,814
|
|
|||||
|
Fleet Data (unaudited)
|
|
|
|
|
|
|
|||||||||
|
Number of vessels at end of year (9)
|
7
|
|
6
|
|
12
|
|
12
|
|
13
|
|
|||||
|
Average number of vessels during year (9)
|
5.5
|
|
12.6
|
|
12
|
|
12.7
|
|
13
|
|
|||||
|
Average age of vessels (years)
|
18.7
|
|
25.4
|
|
18.8
|
|
17.8
|
|
15.6
|
|
|||||
|
Total calendar days for fleet
|
2,012
|
|
4,615
|
|
4,380
|
|
4,644
|
|
4,892
|
|
|||||
|
Total operating days for fleet (10)
|
1,501
|
|
3,684
|
|
3,255
|
|
2,939
|
|
3,351
|
|
|||||
|
Other Financial Data (Unaudited):
|
|
|
|
|
|
||||||||||
|
Average daily time charter equivalent earnings ("TCE") (11) (to the closest $100)
|
50,850
|
|
94,400
|
|
87,700
|
|
57,200
|
|
47,400
|
|
|||||
|
Average daily vessel operating costs (12)
|
$
|
38,300
|
|
$
|
18,780
|
|
$
|
14,354
|
|
$
|
12,080
|
|
$
|
13,410
|
|
Footnotes
(1) During the period from the IPO in April 2011 until the time of the first annual general meeting of unitholders ("AGM") on December 13, 2012, pursuant to the partnership agreement of Golar Partners, we retained the sole power to appoint, remove and replace all of the members of the Partnership's board of directors. Accordingly, Golar Partners was treated as our controlled subsidiary and Golar Partners' results were consolidated with that of the Company. From the first AGM held by Golar Partners, the majority of the Partnership's board members became electable by the common unitholders, from this date, we no longer retain the power to control the board of directors and hence the Partnership and accordingly, we deconsolidated Golar Partners and its subsidiaries from our consolidated financial statements. As a result, from December 13, 2012, Golar Partners has been considered our affiliate entity. The deconsolidation of Golar Partners resulted in a gain of $
854 million
recognized in 2012.
A summary of the key significant changes in our financial results that occurred in 2013 when compared to historic periods, as a consequence of the deconsolidation, include:
|
•
|
A decrease in operating income and individual line items therein, in relation to Golar Partner’s fleet;
|
|
•
|
A decrease in net financial expense in respect of Golar Partner’s debt and capital lease obligations, net of restricted cash deposits.
|
Offset by recognition of:
|
•
|
Gains on the sale of our vessel interests to Golar Partners, commencing with the Golar Maria in February 2013. However, any recognition from the gain related to the sale of our vessels to Golar Partners will be deferred to the extent it relates to the proportion of our interest accounted for under the equity method, which during the subordination period relates solely to our interest in Golar Partner’s subordinated units.
|
|
•
|
Management fee income from the provision of services to Golar Partners under each of the management and administrative services and the fleet management agreements.
|
|
•
|
Dividend income in respect of our interests in common units and general partner interests (during the subordination period) and IDRs.
|
|
•
|
Equity in net earnings of affiliates, will change to reflect our share of the results of Golar Partners calculated with respect to our interests in its subordinated units only, but offset by a charge for the amortization of the basis difference in relation to the $854 million gain on loss of control.
|
3
In addition, our Balance Sheet as at December 31, 2012 was affected in the following ways by the deconsolidation:
Balance Sheet:
|
•
|
"Investment in available-for-sale securities" of $353 million was initially recognized representing the Company's common unit interests held in Golar Partners.
|
|
•
|
"Investment in affiliates" of $362.1 million was initially recognized representing the Company's subordinated unit interests held in Golar Partners that during the subordination period will be accounted for under the equity method.
|
|
•
|
"Cost method investments"of $191.2 million was initially recognized representing the Company's 2% general partner interest and 100% of the Incentive Distribution Rights ("IDRs") held in Golar Partners.
|
|
•
|
The net book value of "Vessels and equipment" was reduced by $707.1 million.
|
|
•
|
The net book value of "Vessels under capital leases" was reduced by $485.6 million.
|
|
•
|
Restricted cash was reduced by $221.4 million.
|
|
•
|
Capital lease obligations were eliminated.
|
|
•
|
Long-term debt was reduced by $704.5 million.
|
|
•
|
Non-controlling interests were eliminated.
|
(2) Vessel operating expenses are the direct costs associated with running a vessel including crew wages, vessel supplies, routine repairs, maintenance, insurance, lubricating oils and management fees.
(3) All of our vessels operate under time charters. Under a time charter, the charterer pays substantially all of the voyage expenses, which are primarily fuel and port charges. However, we may incur voyage related expenses when positioning or repositioning vessels before or after the period of a time charter, during periods of commercial waiting time or while off-hire during a period of drydocking.
Charter-hire expense refers to the expenses related to vessels chartered-in under operating leases, but these all expired in September 2010.
(4) Basic earnings per share are calculated based on the income available to common shareholders and the weighted average number of our common shares outstanding. Treasury shares are not included in this calculation. The calculation of diluted earnings per share assumes the conversion of potentially dilutive instruments.
(5) During 2010, our board of directors declared and paid to our common shareholders three special dividends (with an aggregate value of $0.73 per share) that each consisted of the distribution of one share of Golar Energy for every seven shares of Golar LNG Limited.
(6) Restricted cash and short-term investments consist of bank deposits, which may only be used to settle certain pre-arranged loans or lease payments, deposits made in accordance with our contractual obligations under our equity swap line facilities, bid or performance bonds for projects we may enter.
(7) Prior to the deconsolidation of Golar Partners in December 2012, we were party to lease financing arrangements in respect of eight of our vessels. In respect of six of these leases we borrowed under term loans and deposited the proceeds into restricted cash accounts. Concurrently, we entered into capital leases for the vessels, and the vessels were recorded as assets on our balance sheet. These restricted cash deposits, plus the interest earned on those deposits, equaled the approximate remaining amounts we owed under the capital lease arrangements. When interest rates increased and there was a surplus in the restricted cash account, that surplus was released to us as working capital. Similarly, when interest rates decreased and there was a deficit, those deficits were funded out of our working capital. In these instances, we considered payments under our capital leases to be funded through our restricted cash deposits, and our continuing obligation was the repayment of the related term loans. During 2010, the outstanding lease liability on five vessels was settled, when we repaid the respective lease financing obligations out of the related restricted cash deposits. Under U.S. GAAP, we recorded both the obligations under the capital leases and the term loans as liabilities, and both the restricted cash deposits and our vessels under capital leases as assets on our balance sheet. This accounting treatment had the effect of increasing both our assets and liabilities by the amount of restricted cash deposits relating to the corresponding capital lease obligations. Pursuant to the deconslidation of Golar Partners in December 2012, the capital lease obligations and the related restricted cash with respect to our lease financing arrangements have been deconsolidated from our balance sheet.
4
(8) Our non-controlling interests have been reduced to $nil pursuant to the deconsolidation of Golar Partners on December 13, 2012. Our non-controlling interests in 2011 until the deconsolidation date of Golar Partners referred to a 45.9% (2011: 34.6%) ownership interest held by private investors in Golar Partners following its initial public offering in April 2011 and follow on equity offerings in 2012 (excluding the 40% ownership interest held by Chinese Petroleum Corporation, Taiwan, in the
Golar Mazo
).
In addition, as of December 31, 2010 and 2009, our non-controlling interests included 39% and 26%, respectively, in respect of Golar Energy, a formerly listed entity on the Oslo Axess. In mid 2011, we reacquired the non-controlling interest in Golar Enegy, thus increasing our ownership interest to 100% and delisted Golar Energy from the Oslo Axess in July 2011.
(9) As of December 31, 2013, we have 100% ownership interest in our remaining vessels. The increase in the number of vessels from 2012 to 2013 is a result of the delivery of two LNG carriers, offset by the sale of the interest in the company that owns and operates the
Golar Maria
to Golar Partners. The significant decrease in the number of vessels between 2011 and 2012 is principally a result of the deconsolidation of Golar Partners on December 13, 2012.
(10) The total operating days for our fleet is the total number of days in a given period that our vessels were in our possession less the total number of days off-hire. We define days off-hire as days lost to, among other things, operational deficiencies, drydocking for repairs, maintenance or inspection, equipment breakdowns, special surveys and vessel upgrades, delays due to accidents, crewing strikes, certain vessel detentions or similar problems, or our failure to maintain the vessel in compliance with its specifications and contractual standards or to provide the required crew, or periods of commercial waiting time during which we do not earn charter hire.
(11)
Non-GAAP Financial Measures
TCE: Represents the average time charter equivalent, or TCE, of our fleet. TCE rate is a measure of the average daily revenue performance of a vessel. For time charters, this is calculated by dividing total operating revenues, less any voyage expenses, by the number of calendar days minus days for scheduled off-hire. Under a time charter, the charterer pays substantially all of the vessel voyage related expenses. However, we may incur voyage related expenses when positioning or repositioning vessels before or after the period of a time charter, during periods of commercial waiting time or while off-hire during drydocking. TCE rate is a standard shipping industry performance measure used primarily to compare period-to-period changes in a company's performance despite changes in the mix of charter types (i.e., spot charters, time charters and bareboat charters) under which the vessels may be employed between the periods. We included average daily TCE, a non-GAAP measure, as we believe it provides additional meaningful information in conjunction with total operating revenues, the most directly comparable GAAP measure, because it assists our management in making decisions regarding the deployment and use of our vessels and in evaluating their financial performance. Our calculation of TCE may not be comparable to that reported by other companies. The following table reconciles our total operating revenues to average daily TCE.
(12) We calculate average daily vessel operating costs by dividing vessel operating costs by the number of calendar days.
|
|
Years Ended December 31,
|
|||||||||||||
|
|
2013
|
|
2012
|
|
2011
|
|
2010
|
|
2009
|
|
||||
|
|
||||||||||||||
|
Time charter revenues
|
90,558
|
|
409,593
|
|
299,848
|
|
244,045
|
|
216,495
|
|
||||
|
Voyage expenses
|
(14,259
|
)
|
(9,853
|
)
|
(6,042
|
)
|
(20,959
|
)
|
(20,093
|
)
|
||||
|
|
76,299
|
|
399,740
|
|
293,806
|
|
223,086
|
|
196,402
|
|
||||
|
Calendar days less scheduled off-hire days
|
1,994
|
|
4,245
|
|
3,352
|
|
3,901
|
|
4,145
|
|
||||
|
Average daily TCE (to the closest $100)
|
38,300
|
|
94,200
|
|
87,700
|
|
57,200
|
|
47,400
|
|
||||
B. Capitalization and Indebtedness
Not Applicable.
C. Reasons for the Offer and Use of Proceeds
Not Applicable.
5
D. Risk Factors
The following risks relate principally to our business or to the industry in which we operate. Other risks relate principally to the securities market and ownership of our common shares. Any of these risks, or any additional risks not presently known to us or risks that we currently deem immaterial, could significantly and adversely affect our business, our financial condition, our operating results and the trading price of our common shares.
Risks Related to our Company
Our loan agreements are secured by our vessels and contain operating and financial restrictions and other covenants that may restrict our business, financing activities and ability to make cash distributions to our shareholders.
Our obligations under our financing arrangements are secured by certain of our vessels and guaranteed by our subsidiaries holding the interests in our vessels. Our loan agreements impose, and future financial obligations may impose, operating and financial restrictions on us. These restrictions may require the consent of our lenders, or may prevent or otherwise limit our ability to, among other things:
|
•
|
merge into, or consolidate with, any other entity or sell, or otherwise dispose of, all or substantially all of their assets;
|
|
•
|
make or pay equity distributions;
|
|
•
|
incur additional indebtedness;
|
|
•
|
incur or make any capital expenditures;
|
|
•
|
materially amend, or terminate, any of our current charter contracts or management agreements; or
|
|
•
|
charter our vessels.
|
Our loan agreements also require us to maintain specific financial levels and ratios, including minimum amounts of available cash, ratios of current assets to current liabilities (excluding current long-term debt), the level of stockholders' equity and minimum loan to value clauses. If we were to fall below these levels without obtaining a waiver of covenant compliance or modification to our covenants, we would be in default of our loans agreements, which, unless waived by our lenders, provides our lenders with the right to, increase the minimum value held by us under our equity and liquidity covenants, increase our interest payments, pay down our indebtedness to a level where we are in compliance with our loan covenants, sell vessels in our fleet, reclassify our indebtedness as current liabilities and accelerate our indebtedness and foreclose their liens on our vessels, which could result in the loss of our vessels. If our indebtedness is accelerated, we may not be able to refinance our debt or obtain additional financing, which would impair our ability to continue to conduct our business.
Because of the presence of cross-default provisions in most of our and Golar Partners' loan and lease agreements, the refusal of any one lender or lessor to grant or extend a waiver could result in the acceleration of our indebtedness under our other loan agreements even if our or Golar Partner's other lenders or lessors have waived covenant defaults under the respective agreements. A cross-default provision means that if we or Golar Partners default on one loan or lease we would then default on our other loans.
In April 2013, Golar Partners received waivers relating to the requirement under the Golar LNG Partners credit facility and the Golar Freeze facility relating to change of control over the Partnership. Following the grant of such waivers, in order to permanently resolve this issue, the loan facilities affected by the loss of control which contained the change of control provisions were amended in June 2013. As of December 31, 2013, Golar Partners was in compliance with all covenants.
Moreover, in connection with any waivers and/or amendments to our loan agreements, our lenders may impose additional operating and financial restrictions on us and/or modify the terms of our existing loan agreements. These restrictions may limit our ability to, among other things, pay dividends, make capital expenditures and/or incur additional indebtedness, including through the issuance of guarantees. In addition, our lenders may require the payment of additional fees, require prepayment of a portion of our indebtedness to them, accelerate the amortization schedule for our indebtedness and increase the interest rates they charge us on our outstanding indebtedness.
Servicing our debt agreements substantially limits our funds available for other purposes.
A large portion of our cash flow from operations is used to repay the principal and interest on our debt agreements. As of December 31, 2013, our net indebtedness (including loan debt, net of restricted cash and short-term deposits and net of cash and cash equivalents) was $565.1 million and our ratio of net indebtedness to total capital (comprising net indebtedness plus shareholders' equity) was 0.24.
6
Our consolidated debt could increase substantially. We will continue to have the ability to incur additional debt. Our level of debt could have important consequences to us, including:
|
•
|
Our ability to obtain additional financing, if necessary, for working capital, capital expenditures, acquisitions or other purposes may be impaired or such financing may not be available on favorable terms;
|
|
•
|
We will need a substantial portion of our cash flow to make principal and interest payments on our debt, reducing the funds that would otherwise be available for operations, future business opportunities and dividends to stockholders;
|
|
•
|
Our debt level may make us more vulnerable than our competitors with less debt to competitive pressures or a downturn in our industry or the economy generally; and
|
|
•
|
Our debt level may limit our flexibility in obtaining additional financing, pursuing other business opportunities and responding to changing business and economic conditions.
|
Delay or default by the shipyards or if the shipyards do not meet certain performance requirements, our earnings and financial condition could suffer.
We have entered into contracts for the construction of thirteen newbuildings, including ten LNG carriers and three FSRUs for an aggregate purchase price of approximately $2.8 billion. As of April 25, 2014, three vessels (two LNG carriers and one FSRU) have been delivered and we have paid to the shipyards a total of approximately $1.3 billion of the aggregate purchase price. The remaining LNG carriers are due for delivery during 2014, and the remaining FSRU will be delivered the following year, subject to the outcome of negotiations with Samsung regarding the delayed delivery of certain vessels.
Of our remaining ten newbuilds, two are contracted with Hyundai Samho Heavy Industries Co., Ltd., or Hyundai and the remainder are contracted with Samsung Heavy Industries Co. Ltd., or Samsung. In the event shipyards do not perform under the contracts discussed above and we are unable to enforce certain refund guarantees with third party banks for any reason, we may lose all or part of our investment, which would have a material adverse effect on our results of operations, financial condition and cash flows.
In addition, these projects are subject to the risk of delay or default by the shipyards caused by, among other things, unforeseen quality or engineering problems, work stoppages or other labor disturbances at the shipyard, bankruptcy of or other financial crisis involving the shipyard, weather interference, unanticipated cost increases, delays in receipt of necessary equipment, political, social or economic disturbances, inability to finance the construction of the vessels, and inability to obtain the requisite permits or approvals. In accordance with industry practice, in the event the shipyards are unable or unwilling to deliver the vessels, we may not have substantial remedies. Failure to construct or deliver the ships by the shipyards or any significant delays could increase our expenses and diminish our net income and cash flows.
We have a substantial equity investment in our former subsidiary, Golar Partners, that from December 13, 2012, is no longer consolidated with our financial results, and our investment is subject to the risks related to its respective business.
As of December 31, 2013, we had an ownership interest of 41.4% (including our 2% general partner interest) in Golar Partners, in addition to 100% of the incentive distribution rights ("IDRs") of Golar Partners. The aggregate carrying value of our investments in Golar Partners as of December 31, 2013 was $809.0 million, which represents our total interests in the common, subordinated and general partner units and the IDRs. We account for our interests in the subordinated units under the equity method, the common units as available-for-sale securities and the general partner units and IDRs as cost-method investments. Please see Note 5 "Deconsolidation of Golar Partners to our Consolidated Financial Statements" for further detail.
In addition to the value of our investment, we receive cash distributions from Golar Partners, which amounted to $63.7 million for the year ended December 31, 2013. Furthermore, we receive management fee income from the provision of services to Golar Partners under each of the management and administrative services agreement and the fleet management agreements, which amounted to $9.2 million for the year ended December 31, 2013.
7
Accordingly, the value of our investment and the income generated from our investment in Golar Partners is subject to a variety of risks, including the risks related to its business as disclosed in its respective public filings with the SEC. The occurrence of any such risks may negatively affect our financial condition. As of April 25, 2014, Golar Partners had a fleet of nine vessels, that we manage under the management agreements referred to above, that operate under medium to long-term charters with a concentrated number of charterers which include BG Group, Petrobras, Pertamina, Dubai Supply Authority ("DUSUP"), PT Nusantara Regas ("PTNR") and Kuwait National Petroleum Company ("KNPC"). Accordingly, a significant risk to Golar Partners is the loss of any of these customers, charters or vessels, or under certain operational circumstances, a decline in payments under any of the charters, which could have a material adverse effect on its business and its ability to make cash distributions to its unitholders if the vessel was not re-chartered to another customer for an extended period of time.
The common units of Golar Partners are listed on the Nasdaq Global market and due to their preferential distribution and liquidation rights during the subordination period are accounted for as available-for-sale securities. As of December 31, 2013, the fair value of our investment in the common units of Golar Partners was $267.4 million. If the price of the common units of Golar Partners declines due to other than temporary reasons, we would be required to recognize future impairment charges which may have a material adverse effect on our results of operations for the period that the impairment charges are recognized.
A shortage of qualified officers and crew could have an adverse effect on our business and financial condition.
LNG carriers and FSRUs require a technically skilled officer staff with specialized training. Increases in our historical vessel operating expenses have been attributable primarily to the rising costs of recruiting and retaining officers for our fleet. The pool of technically competent crew members has not grown very much during the past few years as the demand for crew members was hampered by the lack of newbuild orders during the period between 2008 to 2010. However, more recently the number of orders for newbuild LNG carriers and FSRUs has grown and as deliveries of these new vessels start to materialize, the demand for technically skilled officers and crew has been increasing, which has led to a shortfall of such personnel. If we or our third-party ship managers are unable to employ technically skilled staff and crew, we will not be able to adequately staff our vessels particularly as we take delivery of our newbuildings. A material decrease in the supply of technically skilled officers or an inability of our third-party managers to attract and retain such qualified officers could impair our ability to operate, or increase the cost of crewing our vessels, which would materially adversely affect our business, financial condition and results of operations and significantly reduce our ability to make distributions to shareholders.
Our growth depends on our ability to expand relationships with existing customers and obtain new customers, for which we will face substantial competition.
One of our principal objectives is to enter into additional medium or long-term, fixed-rate time charters for our LNG carriers and FSRUs. The process of obtaining new long-term time charters is highly competitive and generally involves an intensive screening process and competitive bids, and often extends for several months. LNG carrier or FSRU time charters are awarded based upon a variety of factors relating to the vessel operator, including but not limited to:
|
•
|
LNG shipping and FSRU experience and quality of ship operations;
|
|
•
|
shipping industry relationships and reputation for customer service and safety;
|
|
•
|
technical ability and reputation for operation of highly specialized vessels, including FSRUs;
|
|
•
|
quality and experience of seafaring crew;
|
|
•
|
the ability to finance FSRUs and LNG carriers at competitive rates, and financial stability generally;
|
|
•
|
construction management experience, including, (i) relationships with shipyards and the ability to get suitable berths; and (ii) the ability to obtain on-time delivery of new FSRUs and LNG carriers according to customer specifications;
|
|
•
|
willingness to accept operational risks pursuant to the charter, such as allowing termination of the charter for force majeure events; and
|
|
•
|
competitiveness of the bid in terms of overall price.
|
8
We expect substantial competition for providing floating storage and regasification services and marine transportation services for potential LNG projects from a number of experienced companies, including state-sponsored entities and major energy companies. Many of these competitors have significantly greater financial resources and larger and more versatile fleets than we do. We anticipate that an increasing number of marine transportation companies, including many with strong reputations and extensive resources and experience, will enter the FSRU market and LNG transportation market. This increased competition may cause greater price competition for time charters. As a result of these factors, we may be unable to expand our relationships with existing customers or obtain new customers on a profitable basis, if at all, which could have a material adverse effect on our business, results of operations, financial condition and ability to make cash distributions.
Our growth also depends on continued growth in demand for LNG, FSRUs and LNG carriers.
Our growth strategy focuses on expansion in the floating storage and regasification sector and the LNG shipping sector. While global LNG demand has continued to rise, the rate of its growth has fluctuated for several reasons, including the global economic crisis and the continued increase in natural gas production from unconventional sources in regions such as North America. Accordingly, our growth depends on continued growth in world and regional demand for LNG, FSRUs and LNG carriers, which could be negatively affected by a number of factors, including but not limited to:
|
•
|
increases in the cost of natural gas derived from LNG relative to the cost of natural gas;
|
|
•
|
decreases in the cost of, or increases in the demand for, conventional land-based regasification systems, which could occur if providers or users of regasification services seek greater economies of scale than FSRUs can provide, or if the economic, regulatory or political challenges associated with land-based activities improve;
|
|
•
|
further development of, or decreases in the cost of, alternative technologies for vessel-based LNG regasification;
|
|
•
|
increases in the production of natural gas in areas linked by pipelines to consuming areas, the extension of existing, or the development of new, pipeline systems in markets we may serve, or the conversion of existing non-natural gas pipelines to natural gas pipelines in those markets; and
|
|
•
|
negative global or regional economic or political conditions, particularly in LNG-consuming regions, which could reduce energy consumption or its growth.
|
Reduced demand for LNG, FSRUs or LNG carriers would have a material adverse effect on our future growth and could harm our business, results of operations and financial condition.
We expect to enter the Floating Liquefaction "FLNG" market within the second quarter of 2014 through an investment, however, we cannot guarantee you that contract negotiations will progress favorably or our expansion into the FLNG market will be profitable.
We are currently in negotiations to convert certain of vessels into FLNG vessels. We anticipate a firm investment decision and the signing of a conversion contract with Keppel Shipyard ("Keppel") during the second quarter of 2014. We are currently marketing the FLNG vessels to several prospective customers. Our aim is to find a strong strategic partner that has an interest in utilizing one or several vessels to produce LNG from a specific defined gas reserve. It is uncertain however that a final strategic partnership can be concluded within the same time frame. This mismatch significantly increases the risk of the project but also gives the Company more flexibility in optimizing its project returns. Our inability to reach agreement on terms that are favorable to us may have an adverse effect on our financial condition.
We operate our vessels in the spot/short-term charter market for LNG vessels. Failure to find profitable employment for these vessels, or our newbuildings upon their delivery, could adversely affect our operations.
We currently have four vessels operating in the spot/short-term charter market, the market for chartering an LNG carrier for a single voyage, or for a short time period of up to two years. In addition, we have entered into newbuilding contracts for the construction of ten LNG carriers and three FSRUs, three of which (two LNG carriers and one FSRU), have been delivered. The remaining newbuilds will be delivered during 2014 and 2015. Medium to long-term time charters generally provide reliable revenues, but they also limit the portion of our fleet available to the spot/short-term market during an upswing in the LNG industry cycle, when spot/short-term market voyages might be more profitable. The charter rates payable under time charters or in the spot market may be uncertain and volatile and will depend upon, among other things, economic conditions in the LNG market. The supply and demand balance for LNG carriers and FSRUs is also uncertain.
9
We also cannot assure you that we will be able to successfully employ our vessels in the future or our newbuildings upon their delivery at rates sufficient to allow us to operate our business profitably or meet our obligations. If we are unable to find profitable employment or re-deploy an LNG carrier or FSRU, we will not receive any revenues from that vessel, but we may be required to pay expenses necessary to maintain that vessel in proper operating condition. A decline in charter or spot rates or a failure to successfully charter our vessels could have a material adverse effect on our results of operations and our ability to meet our financing obligations.
We are subject to certain risks with respect to our counterparties on contracts, and failure of such counterparties to meet their obligations could cause us to suffer losses or otherwise adversely affect our business.
We have entered into, and may enter in the future, contracts, conversion contracts with shipyards, credit facilities with banks, interest rate swaps, foreign currency swaps and equity swaps. Such agreements subject us to counterparty risks. The ability of each of our counterparties to perform its obligations under a contract with us will depend on a number of factors that are beyond our control and may include, among other things, general economic conditions and the overall financial condition of the counterparty. Should a counterparty fail to honor its obligations under agreements with us, we could sustain significant losses, which could have a material adverse effect on our business, financial condition, results of operations and cash flows.
The current and future state of the global financial markets and current economic conditions may adversely impact our ability to obtain new financing or to refinance our existing debt portfolio on terms acceptable to us, which would negatively impact our business.
Global financial markets and economic conditions have been, and continue to be, volatile. Recently, operating businesses in the global economy have faced tightening credit, weakening demand for goods and services, deteriorating international liquidity conditions, and declining markets. There has been a general decline in the willingness by banks and other financial institutions to extend credit, particularly in the shipping industry, due to the historically volatile asset values of vessels. As the shipping industry is highly dependent on the availability of credit to finance and expand operations, it has been negatively affected by this decline.
Also, as a result of concerns about the stability of financial markets generally and the solvency of counterparties specifically, the cost of obtaining money from the credit markets has increased as many lenders have increased interest rates, enacted tighter lending standards, refused to refinance existing debt at all or on terms similar to current debt and reduced, and in some cases ceased, to provide funding to borrowers. Due to these factors, we cannot be certain that financing will be available if needed and to the extent required, on acceptable terms. If financing is not available when needed, or is available only on unfavorable terms, we may be unable to meet our obligations as they come due or we may be unable to enhance our existing business, complete additional vessel acquisitions or otherwise take advantage of business opportunities as they arise.
If the current global economic environment persists or worsens, we may be negatively affected in the following ways:
|
•
|
we may not be able to employ our vessels at charter rates as favorable to us as historical rates or at all or operate our vessels profitably; and
|
|
•
|
the market value of our vessels could decrease, which may cause us to recognize losses if any of our vessels are sold or if their values are impaired.
|
The occurrence of any of the foregoing could have a material adverse effect on our business, results of operations, cash flows, financial condition and ability to pay dividends.
Due to the lack of diversification in our lines of business, adverse developments in the LNG industry would negatively impact our results of operations, financial condition and ability to pay dividends.
Currently, we rely primarily on the revenues generated from our LNG carriers and cash distributions from Golar Partners. Due to the lack of diversification in our lines of business, an adverse development in our LNG business, in the LNG industry or in the offshore energy infrastructure industry, generally, would have a significant impact on our business, financial condition, results of operations and ability to pay dividends to our shareholders.
10
An increase in costs could materially and adversely affect our financial performance.
Our vessel operating expenses and drydock capital expenditures depend on a variety of factors, including crew costs, provisions, deck and engine stores and spares, lubricating oil, insurance, maintenance and repairs and shipyard costs, many of which are beyond our control and affect the entire shipping industry. Also, while we do not bear the cost of fuel (bunkers) under our time charters, fuel is a significant, if not the largest, expense in our operations when our vessels are idle during periods of commercial waiting time or when positioning or repositioning before or after a time charter. If costs continue to rise, they could materially and adversely affect our results of operations.
We may be unable to attract and retain key management personnel in the LNG industry, which may negatively impact the effectiveness of our management and our results of operation.
Significant demands are placed on our management as a result of our growth. As we expand our operations, we must manage and monitor our operations, control costs and maintain quality and control. In addition, the provision of management services to our publicly traded affiliate, Golar Partners and the supervision of the construction of our newbuilding vessels has increased the complexity of our business and placed additional demands on our management. Our success depends, to a significant extent, upon the abilities and the efforts of our senior executives. While we believe that we have an experienced management team, the loss or unavailability of one or more of our senior executives for any extended period of time could have an adverse effect on our business and results of operations.
The derivative contracts we have entered into to hedge our exposure to fluctuations in interest rates could result in higher than market interest rates and charges against our income.
As of December 31, 2013, we had total outstanding long-term debt of $
717.0 million
, of which $
589.0 million
was exposed to a floating interest rate. In order to manage our exposure to interest rate fluctuations, we use interest rate swaps to effectively fix a part of our floating rate debt obligations. As of December 31, 2013, we have interest rate swaps with a notional amount of $1.6 billion representing approximately 228% of our total debt. While we are currently over-hedged, this will normalize as we drawdown on our $1.125 billion facility to take delivery of our newbuildings. Our hedging strategies, however, may not be effective and we may incur substantial losses if interest rates move materially differently from our expectations.
Our financial condition could be materially adversely affected to the extent we do not hedge our exposure to interest rate fluctuations under our financing arrangements, under which loans have been advanced at a floating rate based on LIBOR and for which we have not entered into an interest rate swap or other hedging arrangement. Any hedging activities we engage in may not effectively manage our interest rate exposure or have the desired impact on our financial conditions or results of operations. See "Item 11. Quantitative and Qualitative Disclosures about Market Risk."
The aging of our fleet may result in increased operating costs in the future, which could adversely affect our earnings.
In general, the costs to maintain a vessel in good operating condition increase with the age of the vessel. Our current fleet has a weighted average age of approximately 22.2 years. Due to improvements in engine technology, older vessels are typically less fuel-efficient and more costly to maintain than more recently constructed vessels. Cargo insurance rates also increase with the age of a vessel, making older vessels less desirable to charterers.
Governmental regulations, including environmental regulations, safety regulations, or other equipment standards related to the age of vessels may require expenditures for alterations, or the addition of new equipment, to our vessels to comply with safety or environmental laws or regulations that may be enacted in the future. These laws or regulations may also restrict the type of activities in which our vessels may engage or prohibit their operation in certain geographic regions. We cannot predict what alterations or modifications our vessels may be required to undergo as a result of requirements that may be promulgated in the future. As our vessels age, market conditions might not justify any required expenditures or enable us to operate our vessels profitably during the remainder of their useful lives.
11
We may not be able to obtain financing to fund our growth or our future capital expenditures, which could negatively impact our results of operations, financial condition and ability to pay dividends.
In order to fund future FSRU retrofitting projects, liquefaction projects, newbuilding programs, vessel acquisitions, increased working capital levels or other capital expenditures, we may be required to use cash from operations, incur additional borrowings or raise capital through the sale of debt or additional equity securities. Use of cash from operations may reduce the amount of cash available for dividend distributions. Our ability to obtain bank financing or to access the capital markets for any future debt or equity offerings may be limited by our financial condition at the time of such financing or offering, as well as by adverse market conditions resulting from, among other things, general economic conditions and contingencies and uncertainties that are beyond our control. Our failure to obtain funds for future capital expenditures could impact our results of operations, financial condition and our ability to pay dividends. The issuance of additional equity securities would dilute your interest in us and reduce dividends payable to you. Even if we are successful in obtaining bank financing, paying debt service would limit cash available for working capital and increasing our indebtedness could have a material adverse effect on our business, results of operations, cash flows, financial condition and ability to pay dividends.
We are exposed to U.S. Dollar and foreign currency fluctuations and devaluations that could harm our reported revenue and results of operations.
Our principal currency for our operations and financing is the U.S. dollar. We generate the majority of our revenues in the U.S. dollar. Apart from U.S. dollar, we incur a portion of capital, operating and administrative expenses in multiple currencies.
Due to a portion of our expenses are incurred in currencies other than the U.S. Dollar, our expenses may from time to time increase relative to our revenues as a result of fluctuations in exchange rates, particularly between the U.S. Dollar and the Euro, the British pound, and the Norwegian Kroner, which could affect the amount of net income that we report in future periods. We use financial derivatives to hedge some of our currency exposure. Our use of financial derivatives involves certain risks, including the risk that losses on a hedged position could exceed the nominal amount invested in the instrument and the risk that the counterparty to the derivative transaction may be unable or unwilling to satisfy its contractual obligations, which could have an adverse effect on our results.
We may be subject to litigation that, if not resolved in our favor and not sufficiently insured against, could have a material adverse effect on us.
We may be, from time to time, involved in various litigation matters. These matters may include, among other things, contract disputes, personal injury claims, environmental claims or proceedings, asbestos and other toxic tort claims, employment matters, governmental claims for taxes or duties and other litigation that arises in the ordinary course of our business. Although we intend to defend these matters vigorously, we cannot predict with certainty the outcome or effect of any claim or other litigation matter, and the ultimate outcome of any litigation or the potential costs to resolve them may have a material adverse effect on us. Insurance may not be applicable or sufficient in all cases and/or insurers may not remain solvent, which may have a material adverse effect on our financial condition.
We may have to pay tax on United States source income, which would reduce our earnings.
Under the United States Internal Revenue Code of 1986, or the Code, 50% of the gross shipping income of a vessel owning or chartering corporation, such as ourselves and our subsidiaries, that is attributable to transportation that begins or ends, but that does not both begin and end, in the United States, may be subject to a 4% U.S. federal income tax without allowance for deduction, unless that corporation qualifies for exemption from tax under Section 883 of the Code and the applicable Treasury Regulations recently promulgated thereunder.
We expect that we and each of our subsidiaries will qualify for this statutory tax exemption and we will take this position for U.S. federal income tax return reporting purposes. However, there are factual circumstances beyond our control that could cause us to lose the benefit of this tax exemption and thereby become subject to U.S. federal income tax on our U.S. source income. Therefore, we can give no assurances on our tax-exempt status or that of any of our subsidiaries.
If we or our subsidiaries are not entitled to exemption under Section 883 of the Code for any taxable year, we or our subsidiaries could be subject for those years to an effective 4% U.S. federal income tax on the gross shipping income we or our subsidiaries derive during the year that are attributable to the transport of cargoes to or from the United States. The imposition of this tax would have a negative effect on our business and would result in decreased earnings available for distribution to our shareholders.
12
United States tax authorities could treat us as a "passive foreign investment company", which could have adverse United States federal income tax consequences to U.S. shareholders.
A foreign corporation will be treated as a "passive foreign investment company," or PFIC, for U.S. federal income tax purposes if either (1) at least 75% of its gross income during the taxable year consists of certain types of "passive income" or (2) at least 50% of the average value of the corporation's assets during such taxable year produce or are held for the production of those types of "passive income." For purposes of these tests, "passive income" includes dividends, interest, and gains from the sale or exchange of investment property and rents and royalties other than rents and royalties which are received from unrelated parties in connection with the active conduct of a trade or business. For purposes of these tests, income derived from the performance of services does not constitute "passive income." U.S. shareholders of a PFIC are subject to a disadvantageous U.S. federal income tax regime with respect to the income derived by the PFIC, the distributions they receive from the PFIC and the gain, if any, they derive from the sale or other disposition of their shares in the PFIC.
Based on our current and expected future method of operation, we do not believe that we will be a PFIC with respect to any taxable year. In this regard, we intend to treat the gross income we derive or are deemed to derive from our time chartering activities as services income, rather than rental income. Accordingly, we believe that our income from our time chartering activities does not constitute "passive income," and the assets that we own and operate in connection with the production of that income do not constitute passive assets.
There is, however, no direct legal authority under the PFIC rules addressing our method of operation. We believe there is substantial legal authority supporting our position consisting of case law and United States Internal Revenue Service, or IRS, pronouncements concerning the characterization of income derived from time charters and voyage charters as services income for other tax purposes. However, we note that there is also authority which characterizes time charter income as rental income rather than services income for other tax purposes. Accordingly, no assurance can be given that the IRS or a court of law will accept our position, and there is a risk that the IRS or a court of law could determine that we are a PFIC. Moreover, no assurance can be given that we would not constitute a PFIC for any future taxable year if there were to be changes in the nature and extent of our operations.
If the IRS were to find that we are or have been a PFIC for any taxable year, our U.S. shareholders will face adverse U.S. tax consequences and certain information reporting requirements. Under the PFIC rules, unless those shareholders make an election available under the Code (which election could itself have adverse consequences for such shareholders), such shareholders would be liable to pay U.S. federal income tax at the then prevailing income tax rates on ordinary income plus interest upon excess distributions and upon any gain from the disposition of our common shares, as if the excess distribution or gain had been recognized ratably over the shareholder's holding period of our common shares. Please see the section of this annual report entitled "Taxation" under Item 10E for a more comprehensive discussion of the U.S. federal income tax consequences if we were to be treated as a PFIC.
We are a holding company, and our ability to pay dividends will be limited by the value of investments we currently hold and by the distribution of funds from our subsidiaries and affiliates.
We are a holding company whose assets mainly comprise of equity interests in our subsidiaries and other quoted and non-quoted companies and our interest in our affiliate, Golar Partners. As a result, should we decide to pay dividends, we would be dependent on the performance of our operating subsidiaries and other investments. If we were not able to receive sufficient funds from our subsidiaries and other investments, including from the sale of our investment interests, we would not be able to pay dividends unless we obtain funds from other sources. We may not be able to obtain the necessary funds from other sources on terms acceptable to us.
13
Because we are a Bermuda corporation, you may have less recourse against us or our directors than shareholders of a U.S. company have against the directors of that U.S. Company.
Because we are a Bermuda company, the rights of holders of our common shares will be governed by Bermuda law and our memorandum of association and bye-laws. The rights of shareholders under Bermuda law may differ from the rights of shareholders in other jurisdictions. Among these differences is a Bermuda law provision that permits a company to exempt a director from liability for any negligence, default, or breach of a fiduciary duty except for liability resulting directly from that director's fraud or dishonesty. Our bye-laws provide that no director or officer shall be liable to us or our shareholders unless the director's or officer's liability results from that person's fraud or dishonesty. Our bye-laws also require us to indemnify a director or officer against any losses incurred by that director or officer resulting from their negligence or breach of duty, except where such losses are the result of fraud or dishonesty. Accordingly, we carry directors' and officers' insurance to protect against such a risk. In addition, under Bermuda law, the directors of a Bermuda company owe their duties to that company and not to the shareholders. Bermuda law does not, generally, permit shareholders of a Bermuda company to bring an action for a wrongdoing against the company, but rather the company itself is generally the proper plaintiff in an action against the directors for a breach of their fiduciary duties. These provisions of Bermuda law and our bye-laws, as well as other provisions not discussed here, may differ from the law of jurisdictions with which investors may be more familiar and may substantially limit or prohibit shareholders ability to bring suit against our directors.
Because our offices and most of our assets are outside the United States, you may not be able to bring suit against us, or enforce a judgment obtained against us in the United States.
We, and most of our subsidiaries, are or will be incorporated in jurisdictions outside the U.S. and substantially all of our assets and those of our subsidiaries and will be located outside the U.S. In addition, most of our directors and officers are or will be non-residents of the U.S., and all or a substantial portion of the assets of these non-residents are or will be located outside the U.S. As a result, it may be difficult or impossible for U.S. investors to serve process within the U.S. upon us, our subsidiaries, or our directors and officers, or to enforce a judgment against us for civil liabilities in U.S. courts. In addition, you should not assume that courts in the countries in which we or our subsidiaries are incorporated or where our or our subsidiaries' assets are located would enforce judgments of U.S. courts obtained in actions against us or our subsidiaries based upon the civil liability provisions of applicable U.S. federal and state securities laws, or would enforce, in original actions, liabilities against us or our subsidiaries based on those laws.
Failure to comply with the U.S. Foreign Corrupt Practices Act and other anti-bribery legislation in other jurisdictions could result in fines, criminal penalties, contract terminations and an adverse effect on our business.
We may operate in a number of countries throughout the world, including countries known to have a reputation for corruption. We are committed to doing business in accordance with applicable anti-corruption laws and have adopted a code of business conduct and ethics which is consistent and in full compliance with the U.S. Foreign Corrupt Practices Act of 1977. We are subject, however, to the risk that we, our affiliated entities or our or their respective officers, directors, employees and agents may take actions determined to be in violation of such anti-corruption laws, including the U.S. Foreign Corrupt Practices Act. Any such violation could result in substantial fines, sanctions, civil and/or criminal penalties, curtailment of operations in certain jurisdictions, and might adversely affect our business, results of operations or financial condition. In addition, actual or alleged violations could damage our reputation and ability to do business. Furthermore, detecting, investigating, and resolving actual or alleged violations is expensive and can consume significant time and attention of our senior management.
Risks Related to Our Industry
The operation of LNG carriers and FSRUs is inherently risky, and an incident resulting in significant loss or environmental consequences involving any of our vessels could harm our reputation and business.
Our vessels and their cargoes are at risk of being damaged or lost because of events such as:
|
•
|
marine disasters;
|
|
•
|
piracy;
|
|
•
|
environmental accidents;
|
|
•
|
bad weather;
|
|
•
|
mechanical failures;
|
14
|
•
|
grounding, fire, explosions and collisions;
|
|
•
|
human error; and
|
|
•
|
war and terrorism.
|
An accident involving any of our vessels could result in any of the following:
|
•
|
death or injury to persons, loss of property or environmental damage;
|
|
•
|
delays in the delivery of cargo;
|
|
•
|
loss of revenues from or termination of charter contracts;
|
|
•
|
governmental fines, penalties or restrictions on conducting business;
|
|
•
|
higher insurance rates; and
|
|
•
|
damage to our reputation and customer relationships generally.
|
Any of these circumstances or events could increase our costs or lower our revenues. Additionally, the involvement of our vessels in an oil spill or other environmental disaster may harm our reputation as a safe and reliable LNG carrier operator.
If our vessels suffer damage, they may need to be repaired. The costs of vessel repairs are unpredictable and can be substantial. We may have to pay repair costs that our insurance policies do not cover. The loss of earnings while these vessels are being repaired, as well as the actual cost of these repairs, would decrease our results of operations. If one of our vessels were involved in an accident with the potential risk of environmental contamination, the resulting media coverage could have a material adverse effect on our business, our results of operations and cash flows, weaken our financial condition and negatively affect our ability to pay dividends. Further, the total loss of any of our vessels could harm our reputation as a safe and reliable LNG Carrier and FSRU owner and operator. If we are unable to adequately maintain or safeguard our vessels, we may be unable to prevent any such damage, costs or loss which could negatively impact our business, financial condition, results of operations, cash flows and ability to pay dividends.
Growth of the LNG market may be limited by many factors, including infrastructure constraints and community and political group resistance to new LNG infrastructure over concerns about environmental, safety and terrorism.
A complete LNG project includes production, liquefaction, regasification, storage and distribution facilities and LNG carriers. Existing LNG projects and infrastructure are limited, and new or expanded LNG projects are highly complex and capital intensive, with new projects often costing several billion dollars. Many factors could negatively affect continued development of LNG infrastructure and related alternatives, including floating storage and regasification, or disrupt the supply of LNG, including:
|
•
|
increases in interest rates or other events that may affect the availability of sufficient financing for LNG projects on commercially reasonable terms;
|
|
•
|
decreases in the price of LNG, which might decrease the expected returns relating to investments in LNG projects;
|
|
•
|
the inability of project owners or operators to obtain governmental approvals to construct or operate LNG facilities;
|
|
•
|
local community resistance to proposed or existing LNG facilities based on safety, environmental or security concerns;
|
|
•
|
any significant explosion, spill or similar incident involving an LNG facility, FSRU or LNG carrier; and
|
|
•
|
labor or political unrest affecting existing or proposed areas of LNG production and regasification.
|
We expect that, as a result of the factors discussed above, some of the proposals to expand existing or develop new LNG liquefaction and regasification facilities may be abandoned or significantly delayed. If the LNG supply chain is disrupted or does not continue to grow, or if a significant LNG explosion, spill or similar incident occurs, it could have a material adverse effect on our business, results of operations and financial condition and our ability to make cash distributions.
15
Terrorist attacks, piracy, increased hostilities or war could lead to further economic instability, increased costs and disruption of our business.
LNG facilities, shipyards, vessels (including FSRUs and conventional LNG carriers), pipelines and gas fields could be targets of future terrorist attacks or piracy. Terrorist attacks, war or other events beyond our control that adversely affect the production, storage, transportation or regasification of LNG to be shipped or processed by us could entitle our customers to terminate our charters, which would harm our cash flow and our business. Concern that LNG facilities may be targeted for attack by terrorists has contributed to significant community and environmental resistance to the construction of a number of LNG facilities, primarily in North America. If a terrorist incident involving an LNG facility, FSRU or LNG carrier did occur, the incident may adversely affect construction of additional LNG facilities or FSRUs or the temporary or permanent closing of various LNG facilities or FSRUs currently in operation.
An over-supply of vessel capacity may lead to a reduction in charter hire rates and profitability.
The supply of vessels generally increases with deliveries of new vessels and decreases with the scrapping of older vessels, conversion of vessels to other uses, and loss of tonnage as a result of casualties. Currently, there is significant newbuilding activity with respect to virtually all sizes and classes of vessels. While we currently believe that there is demand for additional tonnage in the near-term, an over-supply of vessel capacity combined with a decline in the demand for such vessels, may result in a reduction of charter hire rates. If such a reduction continues in the future, upon the expiration or termination of our vessels' current charters, we may only be able to re-charter our vessels or our newbuilds upon delivery at reduced or unprofitable rates or we may not be able to charter our vessels at all, which would have a material adverse effect on our revenues and profitability.
Hire rates for FSRUs and LNG carriers may fluctuate substantially.
Hire rates for LNG and to a lesser extent FSRU carriers may fluctuate over time as a result of changes in the supply-demand balance relating to current and future FSRU and LNG carrier capacity. This supply-demand relationship largely depends on a number of factors outside our control. The LNG market is closely connected to world natural gas prices and energy markets, which we cannot predict. A substantial or extended decline in natural gas prices could adversely affect our ability to recharter our vessels at acceptable rates or acquire and profitably operate new FSRUs or LNG carriers. Our ability from time to time to charter or re-charter any vessel at attractive rates will depend on, among other things, the prevailing economic conditions in the LNG industry. Hire rates for FSRUs and LNG carriers correlate to the price of newbuilding FSRUs and LNG carriers. If rates are lower when we are seeking a new charter, our earnings and ability to make distributions to our shareholders will suffer.
Vessel values may fluctuate substantially and, if these values are lower at a time when we are attempting to dispose of vessels, we may incur a loss.
Vessel values for LNG carriers can fluctuate substantially over time due to a number of different factors, including:
|
•
|
prevailing economic and market conditions in the natural gas and energy markets;
|
|
•
|
a substantial or extended decline in demand for LNG;
|
|
•
|
increases in the supply of vessel capacity;
|
|
•
|
the type, size and age of a vessel; and
|
|
•
|
the cost of newbuildings or retrofitting or modifying existing vessels, as a result of technological advances in vessel design or equipment, changes in applicable environmental or other regulations or standards, customer requirements or otherwise.
|
As our vessels age, the expenses associated with maintaining and operating them are expected to increase, which could have an adverse effect on our business and operations if we do not maintain sufficient cash reserves for maintenance and replacement capital expenditures. Moreover, the cost of a replacement vessel would be significant.
During the period a vessel is subject to a charter, we will not be permitted to sell it to take advantage of increases in vessel values without the charterers' agreement. If a charter terminates, we may be unable to re-deploy the affected vessels at attractive rates and, rather than continue to incur costs to maintain and finance them, we may seek to dispose of them. When vessel values are low, we may not be able to dispose of vessels at a reasonable price when we wish to sell vessels, and conversely, when vessel values are elevated, we may not be able to acquire additional vessels at attractive prices when we wish to acquire additional vessels, which could adversely affect our business, results of operations, cash flow, financial condition and ability to make distributions to shareholders. Please refer to Item 5. "Critical Accounting Estimates – Vessel Market Valuations" for further information.
16
The LNG transportation industry is competitive and we may not be able to compete successfully, which would adversely affect our earnings.
The LNG transportation industry in which we operate is competitive, especially with respect to the negotiation of long-term charters. Competition arises primarily from other LNG carrier owners, some of whom have substantially greater resources than we do. Furthermore, new competitors with greater resources could enter the market for LNG carriers and FSRUs and operate larger fleets through consolidations, acquisitions or the purchase of new vessels, and may be able to offer lower charter rates and more modern fleets. If we are not able to compete successfully, our earnings could be adversely affected. Competition may also prevent us from achieving our goal of profitably expanding into other areas of the LNG industry.
Our vessels may call on ports located in countries that are subject to restrictions imposed by the U.S. or other governments, which could adversely affect our business.
Although no vessels operated by us have called on ports located in countries subject to sanctions and embargoes imposed by the U.S. government and countries identified by the U.S. government as state sponsors of terrorism, such as Cuba, Iran, Sudan and Syria, in the future our vessels may call on ports in these countries from time to time on our charterers' instructions. None of our vessels made any port calls to Iran in 2013. The U.S. sanctions and embargo laws and regulations vary in their application, as they do not all apply to the same covered persons or proscribe the same activities, and such sanctions and embargo laws and regulations may be amended or strengthened over time. In 2010, the U.S. enacted the Comprehensive Iran Sanctions Accountability and Divestment Act, or CISADA, which expanded the scope of the Iran Sanctions Act. Among other things, CISADA expands the application of the prohibitions to companies such as ours and introduces limits on the ability of companies and persons to do business or trade with Iran when such activities relate to the investment, supply or export of refined petroleum or petroleum products. In addition, in 2012, President Obama signed Executive Order 13608 which prohibits foreign persons from violating or attempting to violate, or causing a violation of any sanctions in effect against Iran or facilitating any deceptive transactions for or on behalf of any person subject to U.S. sanctions. Any persons found to be in violation of Executive Order 13608 will be deemed a foreign sanctions evader and will be banned from all contacts with the United States, including conducting business in U.S. dollars. Also in 2012, President Obama signed into law the Iran Threat Reduction and Syria Human Rights Act of 2012, or the Iran Threat Reduction Act, which created new sanctions and strengthened existing sanctions. Among other things, the Iran Threat Reduction Act intensifies existing sanctions regarding the provision of goods, services, infrastructure or technology to Iran's petroleum or petrochemical sector. The Iran Threat Reduction Act also includes a provision requiring the President of the United States to impose five or more sanctions from Section 6(a) of the Iran Sanctions Act, as amended, on a person the President determines is a controlling beneficial owner of, or otherwise owns, operates, or controls or insures a vessel that was used to transport crude oil from Iran to another country and (1) if the person is a controlling beneficial owner of the vessel, the person had actual knowledge the vessel was so used or (2) if the person otherwise owns, operates, or controls, or insures the vessel, the person knew or should have known the vessel was so used. Such a person could be subject to a variety of sanctions, including exclusion from U.S. capital markets, exclusion from financial transactions subject to U.S. jurisdiction, and exclusion of that person's vessels from U.S. ports for up to two years.
On November 24, 2013, the P5+1 (the United States, United Kingdom, Germany, France, Russia and China) entered into an interim agreement with Iran entitled the “Joint Plan of Action” (“JPOA”). Under the JPOA it was agreed that, in exchange for Iran taking certain voluntary measures to ensure that its nuclear program is used only for peaceful purposes, the U.S. and EU would voluntarily suspend certain sanctions for a period of six months.
On January 20, 2014, the U.S. and E.U. indicated that they would begin implementing the temporary relief measures provided for under the JPOA. These measures include, among other things, the suspension of certain sanctions on the Iranian petrochemicals, precious metals, and automotive industries from January 20, 2014 until July 20, 2014.
Although it is our intention to comply with the provisions of the JPOA, there can be no assurance that we will be in compliance in the future as such regulations and U.S. Sanctions may be amended over time, and the U.S. retains the authority to revoke the aforementioned relief if Iran fails to meet its commitments under the JPOA.
17
Although we believe that we have been in compliance with all applicable sanctions and embargo laws and regulations, and intend to maintain such compliance, there can be no assurance that we will be in compliance in the future, particularly as the scope of certain laws may be unclear and may be subject to changing interpretations. Any such violation could result in fines, penalties or other sanctions that could severely impact our ability to access U.S. capital markets and conduct our business, and could result in some investors deciding, or being required, to divest their interest, or not to invest, in us. In addition, certain institutional investors may have investment policies or restrictions that prevent them from holding securities of companies that have contracts with countries identified by the U.S. government as state sponsors of terrorism. The determination by these investors not to invest in, or to divest from, our common stock may adversely affect the price at which our common stock trades. Moreover, our charterers may violate applicable sanctions and embargo laws and regulations as a result of actions that do not involve us or our vessels, and those violations could in turn negatively affect our reputation. In addition, our reputation and the market for our securities may be adversely affected if we engage in certain other activities, such as entering into charters with individuals or entities in countries subject to U.S. sanctions and embargo laws that are not controlled by the governments of those countries, or engaging in operations associated with those countries pursuant to contracts with third parties that are unrelated to those countries or entities controlled by their governments. Investor perception of the value of our common stock may be adversely affected by the consequences of war, the effects of terrorism, civil unrest and governmental actions in these and surrounding countries.
Our insurance coverage may be insufficient to cover losses that may occur to our property or result from our operations.
The operation of LNG carriers and FSRUs is inherently risky. Although we carry protection and indemnity insurance, all risks may not be adequately insured against, and any particular claim may not be paid. Any claims covered by insurance would be subject to deductibles, and since it is possible that a large number of claims may be brought, the aggregate amount of these deductibles could be material. Certain of our insurance coverage is maintained through mutual protection and indemnity associations and, as a member of such associations, we may be required to make additional payments over and above budgeted premiums if member claims exceed association reserves.
We may be unable to procure adequate insurance coverage at commercially reasonable rates in the future. For example, more stringent environmental regulations have led in the past to increased costs for, and in the future may result in the lack of availability of, insurance against risks of environmental damage or pollution. A marine disaster could exceed our insurance coverage, which could harm our business, financial condition and operating results. Any uninsured or underinsured loss could harm our business and financial condition. In addition, our insurance may be voidable by the insurers as a result of certain of our actions, such as our vessels failing to maintain certification with applicable maritime self-regulatory organizations.
Changes in the insurance markets attributable to terrorist attacks may also make certain types of insurance more difficult for us to obtain. In addition, upon renewal or expiration of our current policies, the insurance that may be available to us may be significantly more expensive than our existing coverage.
We may be subject to increased premium payments, or calls, if the value of our claim records, the claim records of our fleet managers, and/or the claim records of other members of the protection and indemnity associations through which we receive insurance coverage for tort liability (including pollution-related liability) significantly exceed projected claims. In addition, our protection and indemnity associations may not have enough resources to cover claims made against them. Our payment of these calls could result in significant expense to us, which could have a material adverse effect on our business, results of operations, cash flows, financial condition and ability to pay dividends.
Our vessels operating in international waters, now or in the future, will be subject to various federal, state and local laws and regulations relating to protection of the environment.
Our vessels traveling in international waters are subject to various existing regulations published by the International Maritime Organization or the IMO as well as marine pollution and prevention requirements imposed by the International Convention for the Prevention of Pollution from Ships (MARPOL Convention). In addition, our LNG vessels may become subject to the International Convention on Liability and Compensation for Damage in Connection with the Carriage of Hazardous and Noxious Substances by Sea (HNS), as amended by the April 2010 Protocol to the HNS Convention or the 2010 HNS Convention, if it is entered into force. In addition, national laws generally provide for a LNG carrier or offshore LNG facility owner or operator to bear strict liability for pollution, subject to a right to limit liability under applicable national or international regimes for limitation of liability. However, some jurisdictions are not a party to an international regime limiting maritime pollution liability, and, therefore, a vessel owner's or operator's rights to limit liability for maritime pollution in such jurisdictions may be uncertain.
Please see Item 4. "Information on the Company—Business Overview—Environmental and Other Regulations - International Maritime Regulations of LNG Vessels" and "—Other Regulation" below for a more detailed discussion on these topics.
18
Our vessels operating in U.S. waters now or, in the future, will be subject to various federal, state and local laws and regulations relating to protection of the environment.
Our vessels operating in U.S. waters now or, in the future, will be subject to various federal, state and local laws and regulations relating to protection of the environment, including the Oil Pollution Act of 1990 (OPA), the U.S. Comprehensive Environmental Response, Compensation, and Liability Act (CERCLA), the Clean Water Act, and the Clean Air Act. In some cases, these laws and regulations require us to obtain governmental permits and authorizations before we may conduct certain activities. These environmental laws and regulations may impose substantial penalties for noncompliance and substantial liabilities for pollution. Failure to comply with these laws and regulations may result in substantial civil and criminal fines and penalties. As with the industry generally, our operations will entail risks in these areas, and compliance with these laws and regulations, which may be subject to frequent revisions and reinterpretation, may increase our overall cost of business.
Please read "Item 4 Information on the Business Overview—Environmental and Other Regulations- International Maritime Regulations of LNG Vessels" and "Other Regulation" below for a more detailed discussion on these topics.
Our operations are subject to substantial environmental and other regulations, which may significantly increase our expenses.
Our operations are affected by extensive and changing international, national and local environmental protection laws, regulations, treaties and conventions in force in international waters, the jurisdictional waters of the countries in which our vessels operate, as well as the countries of our vessels' registration, including those governing oil spills, discharges to air and water, and the handling and disposal of hazardous substances and wastes. These regulations include the U.S. Oil Pollution Act of 1990, or the OPA, the U.S. Clean Water Act, the U.S. Maritime Transportation Security Act of 2002 and regulations of the IMO, including the International Convention on Civil Liability for Oil Pollution Damage of 1969, as from time to time amended and generally referred to as the CLC, the IMO International Convention for the Prevention of Pollution from Ships of 1973, as from time to time amended and generally referred to as MARPOL, the IMO International Convention for the Safety of Life at Sea of 1974, as from time to time amended and generally referred to as SOLAS, the IMO International Convention on Load Lines of 1966, as from time to time amended, and the International Management Code for the Safe Operation of Ships and for Pollution Prevention, or the ISM Code.
Many of these requirements are designed to reduce the risk of oil spills and other pollution. In addition, we believe that the heightened environmental, quality and security concerns of insurance underwriters, regulators and charterers will lead to additional regulatory requirements, including enhanced risk assessment and security requirements and greater inspection and safety requirements on vessels. We expect to incur substantial expenses in complying with these laws and regulation, including expenses for vessel modifications and changes in operating procedures.
These requirements can affect the resale value or useful lives of our vessels, ship modifications or operational changes or restrictions, lead to decreased availability of insurance coverage for environmental matters or result in the denial of access to certain jurisdictional waters or ports, or detention in, certain ports. Under local, national and foreign laws, as well as international treaties and conventions, we could incur material liabilities, including cleanup obligations, in the event that there is a release of hazardous substances from our vessels or otherwise in connection with our operations. We could also become subject to personal injury or property damage claims relating to the release of or exposure to hazardous materials associated with our operations. In addition, failure to comply with applicable laws and regulations may result in administrative and civil penalties, criminal sanctions or the suspension or termination of our operations, including, in certain instances, seizure or detention of our vessels.
Please read "Item 4 Information on the Business Overview—Environmental and Other Regulations - International Maritime Regulations of LNG Vessels" and "Other Regulation" below for a more detailed discussion on these topics.
Further changes to existing environmental legislation that is applicable to international and national maritime trade may have an adverse effect on our business.
We believe that the heightened environmental, quality and security concerns of insurance underwriters, regulators and charterers will generally lead to additional regulatory requirements, including enhanced risk assessment and security requirements and greater inspection and safety requirements on all LNG carriers in the marine transportation markets and offshore LNG terminals. These requirements are likely to add incremental costs to our operations and the failure to comply with these requirements may affect the ability of our vessels to obtain and, possibly, collect on insurance or to obtain the required certificates for entry into the different ports where we operate.
19
Further legislation, or amendments to existing legislation, applicable to international and national maritime trade are expected over the coming years in areas such as ship recycling, sewage systems, emission control (including emissions of greenhouse gases), ballast treatment and handling, etc. The United States has recently enacted legislation and regulations that require more stringent controls of air and water emissions from ocean-going vessels. Such legislation or regulations may require additional capital expenditures or operating expenses (such as increased costs for low-sulfur fuel) in order for us to maintain our vessels' compliance with international and/or national regulations.
Climate change and greenhouse gas restrictions may adversely impact our operations and markets.
Due to concern over the risk of climate change, a number of countries and the IMO have adopted, or are considering the adoption of, regulatory frameworks to reduce greenhouse gas emission from vessel emissions. These regulatory measures may include, among others, adoption of cap and trade regimes, carbon taxes, increased efficiency standards, and incentives or mandates for renewable energy. Additionally, a treaty may be adopted in the future that includes restrictions on shipping emissions. Compliance with changes in laws and regulations relating to climate change could increase our costs of operating and maintaining our vessels and could require us to make significant financial expenditures that we cannot predict with certainty at this time.
Adverse effects upon the oil and gas industry relating to climate change, including growing public concern about the environmental impact of climate change, may also have an effect on demand for our services. For example, increased regulation of greenhouse gases or other concerns relating to climate change may reduce the demand for oil and gas in the future or create greater incentives for use of alternative energy sources. Any long-term material adverse effect on the oil and gas industry could have a significant financial and operational adverse impact on our business that we cannot predict with certainty at this time.
Maritime claimants could arrest our vessels, which could interrupt our cash flow.
Crew members, suppliers of goods and services to our vessels, shippers of cargo or other parties may be entitled to a maritime lien against one or more of our vessels for unsatisfied debts, claims or damages. In many jurisdictions, a maritime lien holder may enforce its lien by arresting a vessel through foreclosure proceedings. In a few jurisdictions, such as South Africa, claimants could try to assert "sister ship" liability against one vessel in our fleet for claims relating to another of our vessels. The arrest or attachment of one or more of our vessels could interrupt our cash flow and require us to pay large sums of money to have the arrest lifted. In addition, in some jurisdictions, such as South Africa, under the "sister ship" theory of liability, a claimant may arrest both the vessel which is subject to the claimant's maritime lien and any "associated" vessel, which is any vessel owned or controlled by the same owner under some of our present charters. If the vessel is arrested or detained for as few as 14 days as a result of a claim against us, we may be in default of our charter and the charterer may terminate the charter.
Compliance with safety and other vessel requirements imposed by classification societies may be very costly and may adversely affect our business.
The hull and machinery of every large, oceangoing commercial vessel must be classed by a classification society authorized by its country of registry. The classification society certifies that a vessel is safe and seaworthy in accordance with the applicable rules and regulations of the country of registry of the vessel and the Safety of Life at Sea Convention. The
Golar Arctic
is certified by Lloyds Register, and all our other vessels are each certified by Det Norske Veritas. Both Lloyds Register and Det Norske Veritas are members of the International Association of Classification Societies. All of our vessels have been awarded ISM certification and are currently "in class".
As part of the certification process, a vessel must undergo annual surveys, intermediate surveys and special surveys. In lieu of a special survey, a vessel's machinery may be on a continuous survey cycle, under which the machinery would be surveyed periodically over a five-year period. Each of the vessels in our existing fleet is on a planned maintenance system approval, and as such the classification society attends onboard once every year to verify that the maintenance of the equipment onboard is done correctly. Each of the vessels in our existing fleet is required to be qualified within its respective classification society for drydocking once every five years subject to an intermediate underwater survey done using an approved diving company in the presence of a surveyor from the classification society.
If any vessel does not maintain its class or fails any annual survey, intermediate survey or special survey, the vessel will be unable to trade between ports and will be unemployable. We would lose revenue while the vessel was off-hire and incur costs of compliance. This would negatively impact our revenues and reduce our cash available for distributions to our shareholders.
20
We may be subject to litigation that, if not resolved in our favor and not sufficiently insured against, could have a material adverse effect on us.
We may be, from time to time, involved in various litigation matters. These matters may include, among other things, contract disputes, personal injury claims, environmental claims or proceedings, asbestos and other toxic tort claims, employment matters, governmental claims for taxes or duties and other litigation that arises in the ordinary course of our business. Although we intend to defend these matters vigorously, we cannot predict with certainty the outcome or effect of any claim or other litigation matter, and the ultimate outcome of any litigation or the potential costs to resolve them may have a material adverse effect on us. Insurance may not be applicable or sufficient in all cases and/or insurers may not remain solvent, which may have a material adverse effect on our financial condition. Please read "Item 8 Financial Information—Legal Proceedings and Claims".
Risks Related to our Common Shares
We depend on directors who are associated with affiliated companies, which may create conflicts of interest.
Our principal shareholder is World Shipholding Limited or World Shipholding. All of our directors serve as directors of other companies affiliated with World Shipholding. Our directors owe fiduciary duties to both us and other related parties, and may have conflicts of interest in matters involving or affecting us and our customers. In addition, they may have conflicts of interest when faced with decisions that could have different implications for other related parties than they do for us. We cannot assure you that any of these conflicts of interest will be resolved in our favor.
Our common share price may be highly volatile and future sales of our common shares could cause the market price of our common shares to decline.
Generally, stock markets have recently experienced extensive price and volume fluctuations, and the market prices of securities of shipping companies have experienced fluctuations that often have been unrelated or disproportionate to the operating results of those companies. Our common shares have traded on the Nasdaq Global Select Market, or Nasdaq, since December 12, 2002 under the symbol "GLNG." We cannot assure you that an active and liquid public market for our common shares will continue. The market price for our common shares has historically fluctuated over a wide range. In 2013, the closing market price of our common shares on the Nasdaq has ranged from a low of $30.51 on July 3, 2013 to a high of $41.55 per share on January 30, 2013. As of April 25, 2014, the closing market price of our common shares on Nasdaq was $43.65. The market price of our common shares may continue to fluctuate significantly in response to many factors such as actual or anticipated fluctuations in our quarterly or annual results and those of other public companies in our industry, the suspension of our dividend payments, mergers and strategic alliances in the shipping industry, market conditions in the LNG shipping industry, shortfalls in our operating results from levels forecast by securities analysts, announcements concerning us or our competitors, the general state of the securities market, and other factors, many of which are beyond our control. The market for common shares in this industry may be equally volatile. Therefore, we cannot assure you that you will be able to sell any of our common shares that you may have purchased at a price greater than or equal to its original purchase price.
Additionally, sales of a substantial number of our common shares in the public market, or the perception that these sales could occur, may depress the market price for our common shares. These sales could also impair our ability to raise additional capital through the sale of our equity securities in the future.
A. History and Development of the Company
Golar LNG Limited is a midstream LNG company engaged primarily in the transportation, regasification and liquefaction and trading of LNG. We are engaged in the acquisition, ownership, operation and chartering of LNG carriers and FSRUs through our subsidiaries and affiliates and the development of LNG projects.
We were incorporated as an exempted company under the Bermuda Companies Act of 1981 in the Islands of Bermuda on May 10, 2001 and maintain our principal executive headquarters at Par-la-Ville Place, 14 Par-la-Ville Road, Hamilton, Bermuda. Our telephone number at that address is 1 (441) 295-4705. Our principal administrative offices are located at One America Square, 17 Crosswall, London, United Kingdom and our telephone number at that address is +0 44 207 063 7900.
21
Our business was originally founded in 1946 as Gotaas-Larsen Shipping Corporation, or Gotaas-Larsen. Gotaas-Larsen entered the LNG shipping business in 1970 and in 1997 was acquired by Osprey Maritime Limited, or Osprey, then a Singapore listed publicly traded company. In May 2001, World Shipholding, a company indirectly controlled by trusts established by John Fredriksen for the benefit of his immediate family, acquired Osprey, which was subsequently delisted from the Singapore Stock Exchange. On May 21, 2001, we acquired the LNG shipping interests of Osprey and we listed on the Oslo Stock Exchange in July 2001 and traded under the symbol "GOL". We subsequently delisted from the Oslo Stock Exchange on August 30, 2012. We continue to be listed on the Nasdaq Global Select Market or Nasdaq since December 2002 and trade under the symbol "GLNG". As of December 31, 2013, World Shipholding owned 45.61% of our issued and outstanding common shares.
Our strategy to become a LNG floating solution provider began in 2002 when we undertook a study to consider the conversion of an existing LNG carrier into FSRU and continued in 2004 with a similar study for the conversion into a floating power generation plant, or FPGP. In December 2005, Keppel Shipyard Limited of Singapore signed a contract with us for the first ever conversion of an existing LNG carrier into a FSRU. In April 2007, we were awarded long-term charters by Petrobras to employ
Golar Winter
and
Golar Spirit
as FSRUs, our first firm FSRU charters.
Golar Partners
In September 2007, we formed Golar Partners under the laws of the Republic of the Marshall Islands as a wholly-owned subsidiary. Golar Partners was formed to own vessels with long-term charters typically five years or longer through wholly- owned subsidiaries in order to distribute the different risk profiles of the different vessel types of total fleet controlled or affiliated with Golar. Golar Operating LLC, or the General Partner, our wholly-owned subsidiary was also formed in September 2007 to act as the general partner of Golar Partners under the limited partnership agreement and received a 2% general partner interest and 100% of the incentive distributions rights or IDRs in Golar Partners.
Our interests in the vessel-owning subsidiaries which owned the LNG carrier, the
Golar Mazo
, and which leased the LNG carrier, the
Methane Princess
, and the FSRU, the
Golar Spirit
were transferred to Golar Partners in November 2008. In April 2011, our interests in the subsidiaries which leased the FSRU, the
Golar Winter
were also transferred to Golar Partners. These four vessels represented the initial fleet of Golar Partners.
In April 2011, we completed the initial public offering (the "IPO") of Golar Partners. In the IPO, we sold 13.8 million common units (including 1.8 million common units issued after the exercise of an over-allotment option) of Golar Partners, at a price of $22.50 per unit, receiving net proceeds of $287.8 million. As a result of the IPO, our ownership in Golar Partners was reduced to 65.4% (including our 2% general partner interest). Golar Partners is listed on the Nasdaq Global Market or Nasdaq under the symbol "GMLP".
We entered into the following agreements with Golar Partners in connection with its IPO: (a) a management and administrative services agreement pursuant to which Golar Management, one of our wholly-owned subsidiaries, provides certain management administrative support services; (b) fleet management agreements pursuant to which certain commercial management and technical management services are provided by our affiliates including Golar Management and Golar Wilhelmsen; and (c) an omnibus agreement with Golar governing, among other things when the Company and Golar Partners may compete against each other as well as rights of first offer on certain FSRUs and LNG carriers.
Under the provisions of Golar Partners' partnership agreement, the general partner irrevocably delegated the authority to Golar Partners' board of directors to have the power to oversee and direct the operations of, manage and determine the strategies and policies of the Partnership. During the period from the IPO of Golar Partners in April 2011 until the time of its first annual general meeting on December 13, 2012, we retained the sole power to appoint, remove and replace all members of Golar Partners' board of directors. As of the first annual general meeting of Golar Partners, the majority of the board members became electable by common unitholders and accordingly, from this date we no longer retain the power to control the board directors of Golar Partners. As a result, from December 13, 2012, Golar Partners has been considered as an affiliate entity and not as our controlled subsidiary.
Since the IPO of Golar Partners, they have conducted four follow-on offerings, such that as of April 25, 2014 our ownership interest has fallen to 41.4%.
Since the IPO of Golar Partners, we have sold equity interests in the following five vessels to Golar Partners, the
Golar Freeze
, the
NR Satu
, the
Golar Grand,
the
Golar Maria
, and more recently, the
Golar Igloo
(in March 2014) for an aggregate value of $1.5 billion. Accordingly, as of April 25, 2014, Golar Partners had a fleet of nine vessels acquired from or contributed by us.
22
The majority of the proceeds received from the sales of these vessels to Golar Partners have been used to make installment payments under our newbuilding program. Furthermore, the sale of these assets has made Golar Partners a more profitable company which has resulted in increased dividend payments to unitholders of Golar Partners. As a major shareholder of Golar Partners and the beneficial owner of Golar Partners' IDRs, we have benefited from the increased dividend payments.
As of April 25, 2014, together with the fleet held by Golar Partners, we own and operate seventeen vessels comprising of five FSRUs and twelve LNG carriers, including a 60% interest in the vessel-owning subsidiary that owns the
Golar Mazo
which is owned through a joint venture arrangement between Golar Partners and the Chinese Petroleum Corporation, the Taiwanese state-owned oil and gas company.
Golar Energy
In August 2009, our wholly-owned subsidiary, Golar Energy, completed a private placement offering for 59.8 million new ordinary shares at a price of $2 per share, for net proceeds of $115.4 million. As a result of the offering our ownership in Golar Energy was reduced to 68%.
In mid 2011, in a series of transactions we re-acquired 92.3 million shares in Golar Energy, thus increasing our ownership to 100%. Of the shares acquired, 70.3 million were exchanged for newly issued shares in Golar (amounting to 11.6 million Golar shares) and the balance acquired at a price of $5 per share amounting to $110 million. On July 4, 2011, Golar Energy was delisted from the Norwegian stock exchange, Oslo Axess.
Vessel acquisitions, disposals, conversions and other significant transactions
During the three years ended December 31, 2013, we invested $1.4 billion in our vessels, equipment and newbuildings.
During 2008 and 2009, we entered into time charter agreements which required the conversion or modification of two LNG carriers, the
Golar Winter
and the
Golar Freeze
into FSRUs. We entered into 10-year time charter agreements with Petrobras for
Golar Winter
and with DUSUP for the
Golar Freeze
that commenced upon delivery of each of these vessels. Employment commenced in September 2009 for the
Golar Winter
and May 2010 for the
Golar Freeze
. Of which
Golar Winter
formed part of Golar Partners' initial fleet.
In April 2011, we entered into a time charter agreement with PT Nusantara Regas ("PTNR") for the West Java FSRU project which required the retrofit of the
NR Satu
into an FSRU and the provision of associated mooring infrastructure. The vessel completed its FSRU retrofitting in April 2012. The project represents our fourth FSRU project and is on charter for a period of approximately 11 years with automatic conditional extension options up to 2025. In July 2012, we sold our interests in the companies that own and operate the
NR Satu
to Golar Partners for $385 million.
In July 2012, we entered into a 10 year time charter agreement with Gas Atacama Spa ("Gas Atacama"). Although the Chilean project remains subject to indeterminate delays, Golar LNG continues to engage in discussions with Gas Atacama and remains the exclusive FSRU provider. As the start-up of this project is now likely delayed beyond 2015, an additional newbuild FSRU will be considered and pricing under the contract shall be reviewed at the point in time in which the project is ready to go firm. Significant uncertainties are however linked to completion and possible start-up of this project
In October 2012, the Company announced that it had reached an agreement for the development of our first floating liquefied natural gas vessel with Keppel Shipyard Limited. The agreement contemplates the initial conversion of one existing LNG carrier in Golar's current fleet and includes option for further two vessel conversions.
In November 2012, we sold our interests in the wholly-owned subsidiaries that lease and operate the
Golar Grand
to Golar Partners for $265 million.
In November 2012, we entered into a five-year time charter agreement with LNG Shipping S.p.A. for our LNG carrier, the
Golar Maria
. In February 2013, we sold our equity interest on the company that owns and operates the
Golar Maria
to Golar Partners for $215 million.
23
In July 2013, we executed an agreement for a ten year time charter for the FSRU
Golar Eskimo
which is currently under construction with Samsung Heavy Industries. The charter, with the Government of the Hashemite Kingdom of Jordan, is expected to commence in the first quarter of 2015.
As of April 25, 2014, we have taken delivery of three of the thirteen contracted newbuildings, the
Golar Seal
, the
Golar Celsius
and the
Golar Igloo
. Accordingly, ten vessels (including two FSRUs) remain to be delivered and $1.4 billion of the newbuilding installments remain outstanding. All but one are scheduled to be delivered in 2014, with the final delivery timed for 2015 subject to outcome of negotiations with Samsung to delay deliveries of certain vessels.
Investments
During the three years ended December 31, 2013 and through April 25, 2014, we acquired and divested interests in a number of companies including:
In August 2012, we purchased 17,255 shares in GasLog for $0.2 million, a company established in Marshall Islands and listed in the New York Stock Exchange. The company is an owner, operator and manager of LNG carriers. In November 2013, we sold our interest in Gaslog.
In July 2008, we invested an initial sum of $22.0 million in a (50:50) Dutch Antilles incorporated joint venture named Bluewater Gandria N.V., ("Bluewater Gandria"), with Bluewater Energy Services B.V., or ("Bluewater"), formed for the purposes of pursuing opportunities to develop offshore LNG FSRU projects. The initial equity investment was used to acquire the 1977 built LNG carrier, the
Gandria
for conversion and use as a FSRU. In January 2012, Bluewater Gandria became a wholly-owned subsidiary of the Company pursuant to our acquisition of the remaining 50% equity interest for $19.5 million.
In December 2005, we entered into an agreement with The Egyptian Natural Gas Holding Company, ("EGAS"), and HK Petroleum Services to establish a jointly owned company ECGS, to develop hydrocarbon businesses in Egypt and in particular LNG related businesses. In March 2006, the Company acquired 500,000 common shares in ECGS at a subscription price of $1 per share. This represented a 50% interest in the voting rights of ECGS. ECGS is an incorporated unlisted company, which has been set up to develop hydrocarbon business and in particular LNG related business in Egypt. ECGS is jointly owned and operated together with other third parties. Accordingly, the Company has adopted the equity method of accounting for its 50% investment in ECGS, as it considers it to have joint significant influence. During December 2011, ECGS called up its remaining share capital amounting to $7.5 million. Of this, we paid $3.75 million in December 2011 to maintain our 50% equity interest.
LNG trading – business segment
During 2010, Golar established a wholly owned subsidiary, Golar Commodities which positioned the company in the market for managing and trading LNG cargoes. Activities include structured services to outside customers, the buying and selling of physical cargoes as well as proprietary trading. During the third quarter of 2011 Golar determined that, due to unfavorable market conditions, Golar Commodities would wind down its trading activities until such time as opportunities in this sector improved. Golar Commodities did not enter into any trades during the years ended December 31, 2013 and 2012.
During the first quarter of 2014, we entered into a Purchase and Sales Agreement to buy and sell LNG cargo. The LNG cargo was acquired and subsequently sold on a delivered basis to Kuwait Petroleum Corporation to facilitate the commissioning of the
Golar Igloo
which entered in her long term charter with KNPC in March 2014. The transaction was the first for the Company since 2011 when we scaled back our LNG trading actives but it’s now our intention to position ourself for managing and trading a number of LNG cargoes for the
Golar Igloo
during the course of her charter with KNPC.
24
B. Business Overview
Together with our affiliate, Golar Partners, we are a leading independent owner and operator of LNG carriers and FSRUs. Collectively, our fleet is comprised of twelve LNG carriers and five FSRUs. As of April 25, 2014, we have remaining newbuilding commitments for the construction of eight LNG carriers and two FSRUs with scheduled deliveries during 2014 and early 2015. Our vessels provide and have provided LNG shipping, storage and regasification services to leading players in the LNG industry including BG Group, ENI, Petrobras, Dubai Supply Authority, Pertamina and many others. Our business is focused on providing highly reliable, safe and cost efficient LNG shipping and FSRU operations. We seek to further develop our business in other midstream areas of the LNG supply chain with particular emphasis placed on innovative floating liquefaction solutions (FLNG) and participating as a gas off-taker from mid-scale liquefaction projects.
We intend to build on our relationships with existing customers and continue to develop relationships with other industry players. Our target is to earn higher margins through maintaining strong service-based relationships combined with flexible and innovative LNG shipping and FSRU solutions. We believe our customers will have the confidence to place their confidence in our shipping services based on the reliable and safe way we conduct our ship and FSRU operations.
In line with our desire to take control of a greater share of the value chain, we are looking to invest in a small scale LNG project in Canada amongst others and have completed a Front End Engineering and Design (FEED) study for the conversion of three of our oldest carriers into small-mid scale floating liquefaction units. Notwithstanding this, we remain firmly committed to growing our core business by way of the newbuild assets referred to above.
As well as growing our core business and pursuing new opportunities along our value chain, we also offer commercial and technical management services for Golar Partner's fleet. As of April 25, 2014, Golar Partner's fleet included five FSRUs and four LNG carriers (which are included within the combined fleet of seventeen vessels above). Pursuant to a Partnership Agreement, Golar Partners will reimburse Golar for all of the operating costs in connection with the management of their fleet. In addition, Golar also receives a management fee equal to 5% of our costs and expenses incurred in connection with the provision of these services. These management fees have been eliminated through the consolidation of Golar Partners until December 13, 2012 when Golar Partners was deconsolidated.
Lastly, we intend to maintain our relationship with Golar Partners and pursue mutually beneficial opportunities that we believe will include the sale of assets to Golar Partners to provide support for our LNG projects as well as to further our growth.
Our Business Strategy
Our primary business objective is to grow our business and to provide significant returns to our shareholders while providing safe, reliable and efficient LNG shipping, FSRU and other floating midstream services to our customers. We aim to meet this objective by executing the following strategies:
|
•
|
Operation of a high quality and modern fleet:
We currently own and operate a mixed high quality fleet. In response to a strengthening in industry dynamics, we are committed to a significant fleet expansion. Following the recent delivery of three newbuilds, currently, we have on order a further ten newbuilds comprising of eight LNG carriers and two FSRUs. All of these vessels on order will utilize state of the art technology and are configured to be very attractive to the chartering community with high performance specifications.
|
|
•
|
Capitalize on Golar's established reputation:
We are an experienced and professional provider of LNG shipping that places value on operating to the highest industry standards of safety, reliability and environmental performance. We believe our reputation and commercial relationships enables us to obtain favorable charters and other opportunities not readily available to other industry participants.
|
|
•
|
Utilize industry expertise to take advantage of opportunities within the LNG market:
We use our experience in the industry, sensitivity to trends and knowledge and expertise in identifying other untapped opportunities within the LNG market. Specifically, this is evidenced by the following:
|
25
|
▪
|
We are an industry leader in FSRUs and to date remain the only company to have successfully converted an existing LNG carrier for such service. We have a track record for successful operations on our projects which we plan to use as a foundation for further growth as more and more markets look to this technology to provide dependable access to incremental energy imports to fuel their economies.
|
|
▪
|
We have recently completed the front end engineering and design ("FEED") for our first floating liquefied natural gas vessel ("FLNGV") based on the conversion of the
Golar Hilli
first generation Moss vessel. The FEED will form the basis for the conversion of up to three of our existing Moss LNG vessel will enable us to facilitate the efficient development of gas monetization opportunities. In addition, FLNGV projects have the potential to be combined with our LNG carrier and FSRU franchise to create high value integrated midstream chains.
|
|
•
|
Maintain customer focus and reputation for service and safety:
Our success is directly linked to the service and value we deliver to our customers which provides us an advantageous competitive profile in an industry that place particular emphasis on these virtues.
|
|
•
|
Leverage on our affiliation with Golar Partners:
We believe our affiliation with Golar Partners positions us to pursue a broader array of opportunities. This is demonstrated by the following:
|
|
▪
|
Pursuit of strategic and mutually beneficial opportunities with Golar Partners - Since Golar Partners' IPO in April 2011, we have successfully sold five vessels in exchange for cash of approximately $1.5 billion which in part enables us to finance our newbuilding program as well as pursue other growth opportunities. In addition, we have entered into a firm agreement for the Jordan FSRU project which is anticipated to start up in early 2015. Following successful delivery and commissioning of the vessel, this FSRU will be an attractive candidate for potential dropdown into Golar Partners.
|
|
▪
|
Increased dividend income from our investment - Since Golar Partners' IPO, the quarterly dividend distributions of Golar Partners have increased from $0.385 pro-rated per unit to $0.52 per unit for the quarter ended December 31, 2013. This represents a 35% increase since the IPO. Golar Partners' long-term charters, provide stable cash flows which allows Golar Partners to meet its quarterly distributions obligations to its unit holders. As of April 25, 2014, we have a 41.4% interest (including our 2% general partner interest) in Golar Partners and hold 100% of Golar Partner's IDRs.
|
We can provide no assurance, however, that we will be able to implement our business strategies described above. For further discussion of the risks that we face, please read "Item 3 - Key Information - Risk Factors".
The Natural Gas Industry
Predominantly used to generate electricity and as a heating source, natural gas is one of the "big three" fossil fuels that make up the vast majority of world energy consumption. As a cleaner burning fuel than both oil and coal, natural gas has become an increasingly attractive fuel source in the last decade. As more emphasis is placed on reducing carbon emissions, Organization for Economic Cooperation and Development ("OECD") nations have come to view natural gas as a way of reducing their environmental footprint, particularly for electricity where natural gas-fired facilities have been gradually replacing oil, coal and older natural gas-fired plants. More recently, China has indicated a strong desire to address air quality issues that have arisen following a rapid expansion in the use of coal fired power plants. Gas fired electricity generation is expected to feature prominently in their efforts to address environmental issues as ageing coal fired plants are gradually replaced and to meet additional incremental electricity generation requirements.
According to the EIA International Energy Outlook for 2013, worldwide energy consumption is projected to increase by 56% from 2010 to 2040, with total energy demand in non-OECD countries increasing by 90%, compared with an increase of 17% in OECD countries. Natural gas consumption worldwide is forecast to increase by 63%, from 113 trillion cubic feet (or Tcf) in 2010 to 185 Tcf in 2040. Reduced emphasis placed on nuclear power which previously played a more prominent role in Japan and South Korea’s planned energy mix or its subsequent phasing out in other countries such as Germany together with a concerted effort by China to address domestic coal induced air quality issues over the coming years will see natural gas feature more prominently as the substitution fuel of choice. The lower carbon intensity of natural gas relative to coal and oil also make it the favored fuel for industrial and electric power sectors in an increasing number of other countries where governments are introducing policies to reduce greenhouse gasses.
The primary factors contributing to the growth of natural gas demand include:
26
|
•
|
Environmental
: Natural gas is a clean-burning fuel. It produces less carbon dioxide and other pollutants and particles per unit of energy produced than coal, fuel oil and other common hydrocarbon fuel sources;
|
|
•
|
Demand from Industry and Power Generation
: According to the EIA, electricity generation increases by 93%, from 20.2 trillion kilowatthours in 2010 to 39.0 trillion kilowatthours in 2040. In 2010, natural gas accounted for around 22% of global electricity generation. This share, projected to increase to 24% by 2040, does not take into account the emerging use of LNG in transportation, particularly in the marine sector. Natural-gas-fired combined-cycle technology is an attractive choice for new power plants because of its fuel efficiency, operating flexibility, low emissions, and relatively low capital costs. The industrial and electric power sectors together account for 77% of the total projected increase in natural gas consumption;
|
|
•
|
Market Deregulation
: Deregulation of the natural gas and electric power industries in the United States, Europe and Japan has resulted in new entrants and an increased market for natural gas;
|
|
•
|
Significant Natural Gas Reserves
: According to EIA estimates, as of January 1, 2013, the world's total proved natural gas reserves were 6,793 Tcf, 1% higher than the 2011 estimate. Current estimates of natural gas reserve levels indicate a large resource base to support growth in markets through 2040; and
|
|
•
|
Emerging Economies
: According to the EIA, natural gas consumption is forecast to increase by an average of 2.2% per year through 2040 in non-OECD countries, compared to an average of 1.0% per year in OECD countries. As a result, non-OECD countries are expected to account for 72% of the total increase in natural gas consumption over the period from 2010 to 2040.
|
These factors, in addition to overall global economic growth, are expected to contribute to an increase in the consumption of natural gas. There is a growing disparity between the amount of natural gas produced and the amount of natural gas consumed in many major consuming countries, which will likely cause those countries to rely on imports for a greater portion of their natural gas consumption. Importers must either import natural gas through a pipeline or, alternatively, in the form of LNG aboard ships. LNG is natural gas that has been converted into its liquid state through a cooling process, which allows for efficient transportation by sea. Upon arrival at its destination, LNG is returned to its gaseous state by either an FSRU or land based regasification facilities for distribution to consumers through pipelines.
Natural gas is an abundant fuel source, with the EIA estimating that, as of January 1, 2013, worldwide proved natural gas reserves were 6,793 Tcf having grown by 39% over the past 20 years. Almost three-quarters of the world's natural gas reserves are located in the Middle East and Eurasia. Russia, Iran and Qatar accounted for 55% of the world's natural gas reserves as of January 1, 2013, and the United States, the fifth largest holder of natural gas reserves, will see an increase in production growth from 21.2 tcf in 2010 to 33.1 tcf in 2040. Production in the Australia/New Zealand region is forecast to increase from 1.9tcf in 2010 to 6.7tcf in 2040 with most originating from Australia and much of this coming to market over the next 5-6 years. More recently, sizeable new discoveries are being made on the east coast of Africa in countries including Mozambique, Tanzania and Kenya.
The EIA predicts a substantial increase in the production of "unconventional" natural gas, including tight gas, shale gas and coalbed methane. Shale gas production is now underway outside the US (Canada) and is slated to commence elsewhere including China, Australia, Mexico, Britain and other parts of OECD Europe. Although reserves of unconventional natural gas are unknown, a 2013 EIA report on relatively near term technically recoverable shale gas indicates 7,299tcf of estimated risked recoverable resource. This estimate is 10% higher than that included in their 2011 report. Interestingly, the resource estimate for China is 13% lower than the 2011 expectation as a result of a downward revision to reserves in one particular basin. Much of the resource in this basin is deeper than what is currently considered to be commercially recoverable. Future advances in drilling technology have the potential to reverse this.
Although the growth in production of unconventional domestic natural gas has resulted in a reduced rate of growth in LNG demand in the U.S., the long-term impact of shale gas and other unconventional natural gas production on the global LNG trade is unclear. Substantial increases in the extraction of US shale gas in 2008-9 initially suppressed demand for US bound LNG and therefore shipping. Since 2010 there have been a number of cargoes redirected to the Far East which has increased LNG ton miles and demand for LNG shipping. The more recent grant of non-FTA export permits in respect of six US projects representing around 70 million tons of LNG per year raises the prospect of significant additional volumes being exported out of the US, the vast majority of would be transported on an LNG carrier.
27
The reduced rate of growth in LNG demand in the U.S. has been offset by increased demand for LNG in other nations, especially non-OECD countries. China, India and Latin America all represent significant areas of increasing demand and future growth prospects. China has significant shale gas reserves of its own however the economics of extracting this remain unclear. Many of the known reserves are at great depth which has the potential to constrain the economics of extraction, at least in the near term. Demand from two important and established OECD LNG importers, Japan and South Korea also has the potential to increase further over time following decisions in these respective countries to reduce the future role of nuclear in their energy mix. Additionally, due to recent developments in Ukraine, Europe is once again under pressure to reduce its dependence on piped gas from Russia. This has the potential to be a positive development for LNG demand.
Liquefied Natural Gas
Overview
The need to transport natural gas over long distances across oceans led to the development of the international LNG trade. The first shipments were made on a trial basis in 1959 between the United States and the United Kingdom, while 1964 saw the start of the first commercial-scale LNG project to ship LNG from Algeria to the United Kingdom. LNG shipping provides a cost-effective and safe means for transporting natural gas overseas. The LNG is transported overseas in specially built tanks on double-hulled ships to a receiving terminal, where it is offloaded and stored in heavily insulated tanks. In regasification facilities at the receiving terminal, the LNG is returned to its gaseous state (or regasified) and then carried by pipeline for distribution to natural gas customers.
The following diagram displays the flow of natural gas and LNG from production to regasification.
LNG Supply Chain
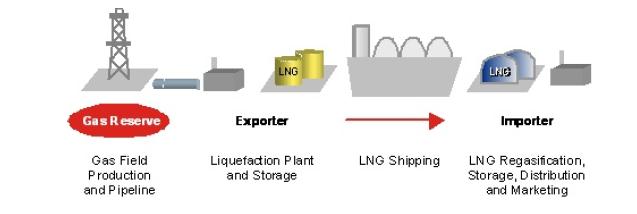
28
The LNG supply chain involves the following components:
Gas Field Production and Pipeline:
Natural gas is produced and transported via pipeline to natural gas liquefaction facilities located along the coast of the producing country. The advent of floating liquefaction will in some cases see the gas transported to a marine based liquefaction facility.
Liquefaction Plant and Storage:
Natural gas is cooled to a temperature of minus 260 degrees Fahrenheit, transforming the gas into a liquid, which reduces its volume to approximately 1/600th of its volume in a gaseous state. The reduced volume facilitates economical storage and transportation by ship over long distances, enabling countries with limited natural gas reserves or limited access to long-distance transmission pipelines to meet their demand for natural gas.
Shipping:
LNG is loaded onto specially designed, double-hulled LNG carriers and transported overseas from the liquefaction facility to the receiving terminal.
Regasification:
At the regasification facility (either onshore or aboard specialized LNG carriers), the LNG is returned to its gaseous state, or regasified.
Storage, Distribution and Marketing:
Once regasified, the natural gas is stored in specially designed facilities or transported to natural gas consumers and end-use markets via pipelines.
The basic costs of producing, liquefying, transporting and regasifying LNG are much higher than in an equivalent oil supply chain. This high unit cost of supply has, in the recent past, led to the pursuit of ever-larger land based facilities in order to achieve improved economies of scale. In some cases, even these large projects have cost substantially more than anticipated and this has resulted in increasingly detailed research into the viability of both large and small scale floating liquefaction. Results of these studies carried out by both oil and gas majors as well as independents including Golar support both the technical and economic feasibility of a floating liquefaction solution across a spectrum of project sizes. Previously uneconomic pockets of gas can now be monetized and this will add to reserves and further underpin the long term attractiveness of gas.
According to Poten and Partners ("Poten"), LNG Liquefaction delivered to market was 103 million tonnes per annum in 2000. This increased to 240 million tonnes by 2011. An unusually large number of unscheduled plant disruptions along with feedgas limitations prevented many export facilities from producing at, or in some cases, even near their nameplate capacity in 2012. This resulted in the 2012 global LNG trade dropping for the first time since 1980. Data from Poten indicates a further reduction in LNG liquefaction to 235 million tonnes in 2013. Although there were small reductions to production across a number of countries, most of the 2013 decline was due to Egypt’s lack of feedgas and a gas-starved domestic market, Nigeria LNG’s gas supply force majeure and Atlantic LNG’s scheduled maintenance. Poten indicate that liquefaction capacity is however expected to resume its growth trajectory over the coming years with approximately 117 million tonnes of capacity currently under construction and approximately 72 million tonnes scheduled to deliver between now and 2017. By 2020, Poten forecast long-term global LNG supply reaching approximately 360 million tonnes, an approximately 53% increase over 2013.
29
The LNG Fleet
As of the end of March 2014, the world LNG carrier fleet consisted of 397 LNG carriers (including 16 FSRUs and 17 vessels less than 18,000m3). By the end of March 2014, there were orders for 128 new LNG carriers (including 11 FSRUs and 4 floating production, storage and offloading ("FPSO")), the majority of which will be delivered between now and 2016.
The order book has now defined the next generation of tradeable tonnage in regards to size and propulsion. The current ”standard” size for LNG carriers is approximately 165,000 cbm, up from 125,000 cbm during the 1970s, while propulsion preference has shifted from a steam turbine to the more efficient Dual/Trifuel Disesel Electric (D/TFDE).
While there are a number of different types of LNG vessels and "containment systems," there are two dominant containment systems in use today:
|
•
|
The
Moss
system was developed in the 1970s and uses free standing insulated spherical tanks supported at the equator by a continuous cylindrical skirt. In this system, the tank and the hull of the vessel are two separate structures.
|
|
•
|
The
Membrane
system uses insulation built directly into the hull of the vessel, along with a membrane covering inside the tanks to maintain their integrity. In this system, the ship's hull directly supports the pressure of the LNG cargo.
|
Illustrations of these systems are included below:
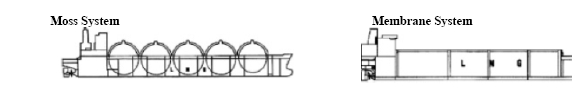
Of the vessels currently trading and on order, approximately 74% employ the Membrane containment system, 24% employ the Moss system and the remaining 2% employ other systems. Most newbuilds (89%) on order employ the membrane containment system, because it most efficiently utilizes the entire volume of a ship's hull. In general, the construction period for an LNG carrier is approximately 28-34 months.
Seasonality
Historically, LNG trade, and therefore charter rates, increased in the winter months and eased in the summer months as demand for LNG in the Northern Hemisphere rose in colder weather and fell in warmer weather. In general, the tanker industry including the LNG vessel industry, has become less dependent on the seasonal transport of LNG than a decade ago. The advent of FSRUs has opened up new markets and uses for LNG, spreading consumption more evenly over the year. There is a higher seasonal demand during the summer months due to energy requirements for air conditioning in some markets or reduced availability of hydro power in others and a pronounced higher seasonal demand during the winter months for heating in other markets.
Floating LNG Regasification
Floating LNG Storage and Regasification Vessels
Floating LNG regasification vessels are commonly known as FSRUs. The figure below depicts a FSRU.
30
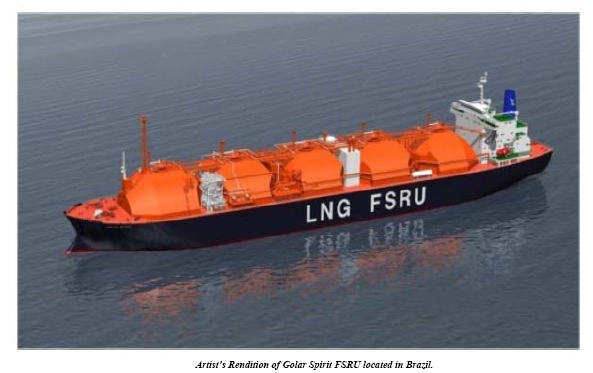
The FSRU regasification process involves the vaporization of LNG and injection of the natural gas directly into a pipeline. In order to regasify LNG, FSRUs are equipped with vaporizer systems that can operate in the open-loop mode, the closed-loop mode or in both modes. In the open-loop mode, seawater is pumped through the system to provide the heat necessary to convert the LNG to the vapor phase. In the closed-loop system, a natural gas-fired boiler is used to heat water circulated in a closed-loop through the vaporizer and a steam heater to convert the LNG to the vapor phase. In general, FSRUs can be divided into four subcategories:
|
•
|
FSRUs that are permanently located offshore;
|
|
•
|
FSRUs that are permanently near shore and attached to a jetty (with LNG transfer being either directly ship to ship or over a jetty);
|
|
•
|
shuttle carriers that regasify and discharge their cargos offshore (sometimes referred to as energy bridge); and
|
|
•
|
shuttle carriers that regasify and discharge their cargos alongside.
|
Our business model to date has been focused on FSRUs that are permanently offshore or near shore and provide continuous regasification service.
Demand for Floating LNG Regasification Facilities
The long-term outlook for global natural gas supply and demand has stimulated growth in LNG production and trade, which is expected to drive a necessary expansion of regasification infrastructure. While worldwide regasification exceeds worldwide liquefaction capacity, a large portion of the existing global regasification capacity is concentrated in a few markets such as Japan, Korea and the U.S. Gulf Coast. There remains a significant demand for regasification infrastructure in growing economies in Asia, Middle-East and Central/South America. We believe that the advantages of FSRUs compared to onshore facilities make them highly competitive in these markets. In the Middle East, Caribbean and South America almost all new regasification projects use an FSRU. FSRUs are also beginning to penetrate Asian markets led by Golar's
NR Satu
in Jakarta, Indonesia and a variety of projects in India and South East Asia.
Floating LNG regasification projects first emerged as a solution to the difficulties and protracted process of obtaining permits to build shore-based LNG reception facilities (especially along the North American coasts). Due to their offshore location, floating facilities are less likely than onshore facilities to be met with resistance in local communities, which is especially important in the case of a facility that is intended to serve a highly populated area where there is a high demand for natural gas. As a result, it is typically easier and faster for FSRUs to obtain necessary permits than for comparable onshore facilities. More recently, cost
31
and time have become the main drivers behind the growing interest in the various types of floating LNG regasification projects. FSRUs projects can typically be completed in less time (2 to 3 years compared to 4 or more years for land based projects) and at a significantly lower cost (20-50% less) than land based alternatives.
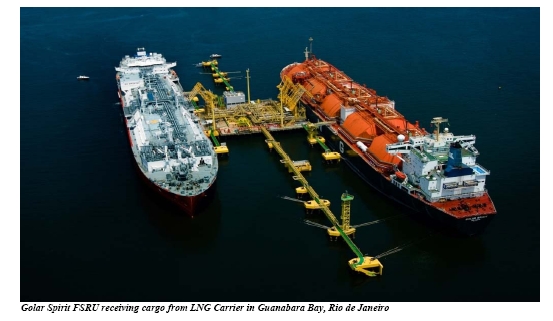
In addition, FSRUs offer a more flexible solution than land based terminals. They can be used as an LNG carrier, a regasification shuttle vessel or permanently moored as an FSRU. FSRUs can be used on a seasonal basis, as a short-term (1-2 years) regasification solution or as a long-term solution for up to 20 years. FSRUs offer a fast track regasification solution for markets that need immediate access to LNG supply. FSRUs can be utilized as bridging solutions until a land-based terminal is constructed. In this way. FSRUs are both a replacement for and complement to land-based regasification alternatives.
32
Floating LNG Regasification Vessel Fleet Size and Ownership
Compared to onshore terminals, the floating LNG regasification industry is fairly young. There are only a limited number of companies, including Golar as well as Exmar, Excelerate Energy, and Hoegh LNG that are operating FSRU terminals for LNG importers around the world. Golar was the first company to enter into an agreement for the long-term employment of an FSRU based on the conversion of an existing LNG carrier.
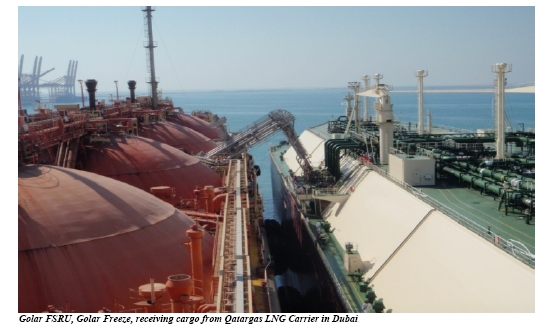
Competition – LNG Carriers and FSRUs
As the FSRU market continues to grow and mature new competitors are entering the market. In addition to Hoegh LNG, Excelerate and Golar, BW Gas and MOL have recently ordered FSRUs. The rapid growth of the FSRU market is giving owners the confidence to place orders for speculative regasification tonnage. The expansion and growth of the FSRU market has led to more competition for mid- and long-term LNG charters. Competition for these long-term charters is based primarily on price, vessel availability, size, age and condition of the vessel, relationships with LNG carrier users and the quality, LNG experience and reputation of the operator. In addition, vessels may operate in the emerging LNG carrier spot market that covers short-term charters of one year or less.
We believe that, together with Golar Partners, we are one of the world's largest independent LNG carrier and FSRU owners and operators. Together with Golar Partners, our existing fleet includes 16 vessels (eleven LNG carriers and five FSRUs) and a newbuilding order book of ten vessels: eight LNG carriers and two FSRUs. Our remaining LNG carrier newbuildings are scheduled to be delivered from 2014 into early 2015 with storage capacity of approximately 160,000 m
3
to 162,000 m
3
storage; 0.1% boil-off rate; tri-fuel engines; and capable of charter speeds of up to 19.5 knots. Our newbuild FSRUs range in capacity from 160,000 m
3
to 170,000 m
3
and can provide regasification throughput of up to 750 MCFD (or 5.8 MTA). The FSRUs can, subject to the customer's requirements, remain classified as an LNG Carrier, flexible for LNG carrier service or be classified for as an offshore unit, remaining permanently moored at site for a long contract duration.
We compete with other independent shipping companies who also own and operate LNG carriers.
In addition to independent LNG operators, some of the major oil and gas producers, including Royal Dutch Shell, BP, and BG own LNG carriers and have in the recent past contracted for the construction of new LNG carriers. National gas and shipping companies also have large fleets of LNG vessels that have expanded and will likely continue to expand. These include Malaysian International Shipping Company, or MISC, National Gas Shipping Company located in Abu Dhabi and Qatar Gas Transport Company, or Nakilat.
33
Floating Liquefaction Vessels
In late 2012, we entered into FEED agreements to develop our first FLNG production vessel. The agreements were based on the conversion of one of our existing Moss type vessels and include options for two further Moss vessel conversions. Golar are working with Keppel and Black & Veatch (“B&V”) to design the FLNG vessel. Keppel has previously worked with Golar converting comparable Moss type vessels into FSRUs.
Our FLNG strategy is very much analogous to what we were able to create in the FSRU side of our business and utilizes proven on-shore technology, quick and a low-cost execution model with a conversion time of less than three years. We are currently in the final phases of negotiating definitive agreements with Keppel and B&V for the conversion of the
Hilli
to an FLNG vessel at the Keppel shipyard in Singapore. When converted, the
Hilli
will have a production capacity of up to 2.8 million tonnes per annum and on board storage of approximately 125,000 m
3
of LNG.
We are targeting liquefaction projects to convert pipeline quality gas and unconventional natural gas reserves (such as coal bed methane and shale gas or lean gas sourced from offshore fields), to LNG. These feed gas streams require little to no gas processing prior to liquefaction.
Customers
During the year, we received the majority of our revenues from charter agreements with the following customers: BG Group, Gdf Suez, ENi SpA and a major Japanese trading company.
Following the deconsolidation of Golar Partners, our customer profile has changed and the following customers are now with Golar Partners: Petrobras, DUSUP, Pertamina and PT Nusantara Regas. BG Group continues to be a customer of both ours and the Golar Partners. We continue to maintain our relationship with these customers by virtue of the various management agreements entered into with Golar Partners. We also continue to develop relationships with other major players in the LNG industry and with new customers.
Since 2012, we have chartered vessels to a major Japanese trading company. Our revenues from this company were $47.7 million (53%) and $40.0 million (9%) for the years ended 2013 and 2012, respectively.
Since 2000, we have chartered vessels to BG Group. Our revenues from BG Group were $13.1 million (14%), $96.2 million (23%) and $25.1 million (8%) for the years ended 2013, 2012 and 2011, respectively. Two vessels in the Partnership's fleet are currently on charters with the BG Group.
Revenues from Gdf Suez and ENi Spa were under short-term charters, which commenced in in 2011 and 2013, respectively.
Since July 2008, we have chartered vessels to Petrobras under 10-year charters. Our revenues from Petrobras for the years ended 2013, 2012 and 2011 were $nil, $90.3 million (22%) and $93.7 million (31%) . Petrobras currently charters two vessels from Golar Partners.
We had charters with DUSUP since 2010. Our revenues from DUSUP were $nil, $46.0 million (11%) and $47.1 million (16%) for the years ended 2013, 2012 and 2011, respectively. The Partnership continues to charter a vessel to DUSUP.
Since 1989, we have chartered vessels to Pertamina, Our revenues from Pertamina were $nil, $35.5 million (9%) and $37.8 million (13%) for the years ended 2013, 2012 and 2011, respectively. The Partnership continues to charter a vessel with Pertamina.
Charters with Qatar Gas commenced in 2011. Our revenues from Qatar Gas were $nil, $23 million (6%) and $35.5 million (12%) for the years ended 2013, 2012 and 2011, respectively. The Partnership has one vessel currently on charter with Qatar Gas.
During 2012 we commenced chartering vessels to PT Nusantara Regas. Our revenue from PT Nusantara Regas for the years ended 2013 and 2012 was $nil and $38.8 million (9%) respectively. The Partnership currently has one vessel on charter with PT Nusantara Regas.
34
Fleet
Owned Fleet
As of April 25, 2014, we own and operate a fleet of seven LNG carriers. In addition, we currently have newbuild commitments for the construction of eight LNG carriers and two FSRUs which are due for delivery between 2014 and 2015.
The following table lists the LNG carriers and FSRUs in our current fleet including our newbuildings as of April 25, 2014:
|
Vessel Name
|
Year of
Delivery
|
Capacity cbm.
|
Flag
|
Type
|
Charterer
|
Current Charter Expiration
|
Charter Extension Options
|
|||||||
|
Owned Fleet
|
||||||||||||||
|
Existing Fleet
|
||||||||||||||
|
Hilli
|
1975
|
125,000
|
MI
|
Moss
|
n/a
|
n/a
|
n/a
|
|||||||
|
Gimi
|
1976
|
125,000
|
MI
|
Moss
|
n/a
|
n/a
|
n/a
|
|||||||
|
Golar Gandria
|
1977
|
126,000
|
MI
|
Moss
|
n/a
|
n/a
|
n/a
|
|||||||
|
Golar Arctic
|
2003
|
140,000
|
MI
|
Membrane
|
Major Japanese trading company
|
2015
|
n/a
|
|||||||
|
Golar Viking
|
2005
|
140,000
|
MI
|
Membrane
|
n/a
|
n/a
|
n/a
|
|||||||
|
Golar Seal
|
2013
|
160,000
|
MI
|
Membrane
|
n/a
|
n/a
|
n/a
|
|||||||
|
Golar Celsius
|
2013
|
160,000
|
MI
|
Membrane
|
n/a
|
n/a
|
n/a
|
|||||||
|
Newbuildings (1)
|
||||||||||||||
|
Hull 2023 (
Golar Penguin
)
|
2014
|
160,000
|
MI
|
Membrane
|
n/a
|
n/a
|
n/a
|
|||||||
|
Hull 2022 (
Golar Crystal
)
|
2014
|
160,000
|
MI
|
Membrane
|
n/a
|
n/a
|
n/a
|
|||||||
|
Hull 2024 (
Golar Eskimo
)
|
2014
|
160,000
|
MI
|
Membrane
(FSRU)
|
n/a
|
n/a
|
n/a
|
|||||||
|
Hull 2027 (
Golar Bear
)
|
2014
|
160,000
|
MI
|
Membrane
|
n/a
|
n/a
|
n/a
|
|||||||
|
Hull 2047 (
Golar Snow
)
|
2014
|
160,000
|
MI
|
Membrane
|
n/a
|
n/a
|
n/a
|
|||||||
|
Hull 2048 (
Golar Ice
)
|
2014
|
160,000
|
MI
|
Membrane
|
n/a
|
n/a
|
n/a
|
|||||||
|
Hull S658 (
Golar Glacier
)
|
2014
|
162,000
|
MI
|
Membrane
|
n/a
|
n/a
|
n/a
|
|||||||
|
Hull S659 (
Golar Kelvin
)
|
2014
|
162,000
|
MI
|
Membrane
|
n/a
|
n/a
|
n/a
|
|||||||
|
Hull 2055 (
Golar Frost
)
|
2014
|
160,000
|
MI
|
Membrane
|
n/a
|
n/a
|
n/a
|
|||||||
|
Hull 2056 (
Golar Tundra
)
|
2015
|
160,000
|
MI
|
Membrane
(FSRU) |
n/a
|
n/a
|
n/a
|
|||||||
Key to Flags:
MI – Marshall Islands
|
(1)
|
As at April 25, 2014, the Company has a total of ten newbuilds on order which are due for delivery through to 2015.
|
Our Charters
Three of our vessels, the
Hilli
, the
Golar Gandria
and the
Gimi
are earmarked for conversion in our floating liquefied natural gas project. In anticipation of their conversion, the
Hilli
and the
Golar Gandria
entered lay-up in April 2013. The
Gimi
entered lay-up in January 2014.
The
Golar Arctic
is under a medium-term charter with a major Japanese trading company. The contract expires in 2015.
35
The
Golar Viking
and
Golar Seal
are currently on spot charter.
Golar Celsius
is currently unchartered and available for spot-charters.
Our charterers may suspend their payment obligations under the charter agreements for periods when the vessels are not able to transport cargo for various reasons. These periods, which are also called off-hire periods, may result from, among other causes, mechanical breakdown or other accidents, the inability of the crew to operate the vessel, the arrest or other detention of the vessel as the result of a claim against us, or the cancellation of the vessel's class certification. The charters automatically terminate in the event of the loss of a vessel.
Golar Partners' Charters
The
Golar Mazo
, which is jointly owned by Golar Partners and Chinese Petroleum Corporation, Taiwan, transports LNG from Indonesia to Taiwan under an 18-year time charter with Pertamina, the state owned oil and gas company of Indonesia. The contract expires at the end of 2017. Pertamina has options to extend the
Golar Mazo
charter for two additional periods of five years each.
The
Methane Princess
is currently under a long-term charter with BG Group to transport LNG worldwide. The contract expires in 2024. BG Group has the option to extend the
Methane Princess
charter for two, five-year periods.
The
Golar Spirit
and the
Golar Winter
are currently under long-term charters with Petrobras to provide FSRU services. These contracts expire in 2018 and 2024, respectively. Petrobras has the option to terminate the charter after the fifth anniversary of delivery to Petrobras for a termination fee and also the option to extend the charter period for the
Golar Spirit
for up to five years.
The
Golar Freeze
is currently under a long-term charter with DUSUP to provide FSRU services. The contract expires in 2020. DUSUP has an option to terminate the charter in 2015 upon payment of a termination fee. DUSUP also has the option to extend this charter until October 2025.
The
NR Satu
is currently under a long term charter with PT Nusantara Regas that expire in 2022. PT Nusantara Regas has the option to extend the
NR Satu
charter until 2025.
The
Golar Maria
is under a medium-term charter with LNG Shipping S.p.A, a major Italian energy company. The contract expires in 2017.
The
Golar Grand
is under a medium-term charter with BG Group to transport LNG. The contract expires in 2015. BG Group has the option to extend the
Golar Grand
charter for three years. In addition, following our sale of interests in the companies that lease and operate the
Golar Grand
to Golar Partners in November 2012, we entered into an option agreement with Golar Partners wherein in the event BG Group does not extend their charter, Golar Partners may require us to charter-in the
Golar Grand
from them under a time charter expiring in October 2017.
The
Golar Igloo
is currently operating under a time charter with Kuwait National Petroleum Company (KNPC). The contract is for an initial term of five years. KNPC has the option to extend the charter for a further one year.
Golar Management Limited and Golar Wilhelmsen
Golar Management
Golar Management Limited, or Golar Management, our wholly-owned subsidiary which has offices in London and Oslo, provides commercial, operational and technical support and supervision and accounting and treasury services to us. In addition, under the management and administrative services agreement we entered into with Golar Partners, certain officers and directors of Golar Management provide executive officer functions to Golar Partner's benefit. In addition, the administrative services provided by Golar Management include: (i) assistance in commercial management; (ii) execution of business strategies of Golar Partners; (iii) bookkeeping, audit and accounting services; (iv) legal and insurance services; (v) administrative and clerical services; (vi) banking and financial services; (vii) advisory services; (viii) client and investor relations; and (viii) integration of any acquired business.
Golar Management is reimbursed for reasonable costs and expenses it incurs in connection with the provision of these services. In addition, Golar Management receives a management fee equal to 5% of its costs and expenses incurred in connection with providing these services.
36
Golar Wilhelmsen
In September 2010, Golar Wilhelmsen Management (or "GWM") was established as a joint venture between Golar and Wilhelmsen Ship Management (Norway) AS. GWM office staff consists of both Wilhelmsen and Golar employees. The office is located in Golar's office facilities at Aker Brygge, Oslo. Golar Management uses the services of GWM to provide technical, commercial and crew management.
GWM provides the following services both to our and Golar Partner's vessels: (i) manage suitably qualified crew; (ii) provision of competent personnel to supervise the maintenance and efficiency of the vessels; (iii) arrange and supervise drydockings, repairs, alterations and maintenance of vessels; and (iv) arrange and supply stores, spares and lubricating oils.
Vessel Maintenance
We are focused on operating and maintaining our vessels to the highest safety and industry standards and at the same time maximizing revenue from each vessel. It is our policy to have our crews perform planned maintenance on our vessels while underway, to reduce time required for repairs during dry-docking. This will reduce the overall off-hire period required for dockings and repairs. Since we generally do not earn hire from a vessel while it is dry-docking we believe that the additional revenue earned from reduced off-hire periods outweighs the expense of the additional crewmembers or subcontractors.
Risk of Loss, Insurance and Risk Management
The operation of any vessel, including LNG carriers and FSRUs, has inherent risks. These risks include mechanical failure, personal injury, collision, property loss, vessel or cargo loss or damage and business interruption due to political circumstances in foreign countries and/or war risk situations or hostilities. In addition, there is always an inherent possibility of marine disaster, including explosion, spills and other environmental mishaps, and the liabilities arising from owning and operating vessels in international trade. We believe that our present insurance coverage is adequate to protect us against the accident related risks involved in the conduct of our business and that we maintain appropriate levels of environmental damage and pollution insurance coverage consistent with standard industry practice. However, not all risks can be insured, and there can be no guarantee that any specific claim will be paid, or that we will always be able to obtain adequate insurance coverage at reasonable rates.
We have obtained hull and machinery insurance on all our vessels against marine and war risks, which include the risks of damage to our vessels, salvage or towing costs, and also insure against actual or constructive total loss of any of our vessels. However, our insurance policies contain deductible amounts for which we will be responsible. We have also arranged additional total loss coverage for each vessel. This coverage, which is called hull interest and freight interest coverage, provides us additional coverage in the event of the total loss of a vessel.
We have also obtained loss of hire insurance to protect us against loss of income in the event one of our vessels cannot be employed due to damage that is covered under the terms of our hull and machinery insurance. Under our loss of hire policies, our insurer will pay us the daily rate agreed in respect of each vessel for each day, in excess of a certain number of deductible days, for the time that the vessel is out of service as a result of damage, for a maximum of 218 days. The number of deductible days varies from 14 days for the new ships to 30 days for the older ships, also depending on the type of damage; machinery or hull damage.
Protection and indemnity insurance, which covers our third-party legal liabilities in connection with our shipping activities, is provided by a mutual protection and indemnity association, or P&I club. This includes third-party liability and other expenses related to the injury or death of crew members, passengers and other third-party persons, loss or damage to cargo, claims arising from collisions with other vessels or from contact with jetties or wharves and other damage to other third-party property, including pollution arising from oil or other substances, and other related costs, including wreck removal. Subject to the capping discussed below, our coverage, except for pollution, is unlimited.
37
Our current protection and indemnity insurance coverage for pollution is $1 billion per vessel per incident. The thirteen P&I clubs that comprise the International Group of Protection and Indemnity Clubs insure approximately 90% of the world's commercial tonnage and have entered into a pooling agreement to reinsure each association's liabilities. Each P&I club has capped its exposure in this pooling agreement so that the maximum claim covered by the pool and its reinsurance would be approximately $5.45 billion per accident or occurrence. We are a member of Gard and Skuld P&I Clubs. As a member of these P&I clubs, we are subject to a call for additional premiums based on the clubs' claims record, as well as the claims record of all other members of the P&I clubs comprising the International Group. However, our P&I clubs have reinsured the risk of additional premium calls to limit our additional exposure. This reinsurance is subject to a cap, and there is the risk that the full amount of the additional call would not be covered by this reinsurance.
The insurers providing the covers for Hull and Machinery, Hull and Cargo interests, Protection and Indemnity and Loss of Hire insurances have confirmed that they will consider the FSRUs as vessels for the purpose of providing insurance. For the FSRUs we have also arranged an additional Comprehensive General Liability ("CGL") insurance. This type of insurance is common for offshore operations and is additional to the P&I insurance.
We will use in our operations our thorough risk management program that includes, among other things, computer-aided risk analysis tools, maintenance and assessment programs, a seafarers' competence training program, seafarers' workshops and membership in emergency response organizations. We expect to benefit from our commitment to safety and environmental protection as certain of our subsidiaries assist us in managing our vessel operations. GWM received its ISO 9001certification in April 2011, and is certified in accordance with the IMO's International Management Code for the Safe Operation of Ships and Pollution Prevention (ISM) on a fully integrated basis.
Environmental and Other Regulations
General
Governmental and international agencies extensively regulate the carriage, handling, storage and regasification of LNG. These regulations include international conventions and national, state and local laws and regulations in the countries where our vessels, now or in the future, will operate or where our vessels are registered. We cannot predict the ultimate cost of complying with these regulations, or the impact that these regulations will have on the resale value or useful lives of our vessels. In addition, any serious marine incident that results in significant oil pollution or otherwise causes significant adverse environmental impact, including the 2010 Deepwater Horizon oil spill in the Gulf of Mexico, could result in additional legislation or regulation that could negatively affect our profitability. Various governmental and quasi-governmental agencies require us to obtain permits, licenses and certificates for the operation of our vessels.
Although we believe that we are substantially in compliance with applicable environmental laws and regulations and have all permits, licenses and certificates required for our vessels, future non-compliance or failure to maintain necessary permits or approvals could require us to incur substantial costs or temporarily suspend operation of one or more of our vessels. A variety of governmental and private entities inspect our vessels on both a scheduled and unscheduled basis. These entities, each of which may have unique requirements and each of which conducts frequent inspections, include local port authorities, such as the U.S. Coast Guard, harbor master or equivalent, classification societies, flag state, or the administration of the country of registry, charterers, terminal operators and LNG producers.
GWM is operating in compliance with the International Standards Organization (ISO), Environmental Standard for the management of the significant environmental aspects associated with the ownership and operation of a fleet of LNG carriers. GWM received its ISO 9001 certification (quality management systems) in April 2011 and the ISO 14001 Environmental Standard during summer 2012. This certification requires that Golar and GWM commit managerial resources to act on our environmental policy through an effective management system.
38
International Maritime Regulations of LNG Vessels
IMO is the United Nations agency that provides international regulations governing shipping and international maritime trade. The requirements contained in the ISM Code promulgated by the IMO, govern our operations. Among other requirements, the ISM Code requires the party with operational control of a vessel to develop an extensive safety management system that includes, among other things, the adoption of a policy for safety and environmental protection policy setting forth instructions and procedures for operating its vessels safely and also describing procedures for responding to emergencies. Our Ship Manager holds a Document of Compliance (DoC) under the ISM Code for operation of Gas Carriers.
Vessels that transport gas, including LNG carriers and FSRUs, are also subject to regulation under the International Gas Carrier Code, or the IGC Code, published by the IMO. The IGC Code provides a standard for the safe carriage of LNG and certain other liquid gases by prescribing the design and construction standards of vessels involved in such carriage. Compliance with the IGC Code must be evidenced by a Certificate of Fitness for the Carriage of Liquefied Gases in Bulk. Each of our vessels is in compliance with the IGC Code and each of our new buildings/conversion contracts requires that the vessel receive certification that it is in compliance with applicable regulations before it is delivered. Non-compliance with the IGC Code or other applicable IMO regulations may subject a shipowner or a bareboat charterer to increased liability, may lead to decreases in available insurance coverage for affected vessels and may result in the denial of access to, or detention in, some ports.
The IMO also promulgates ongoing amendments to the International Convention for the Safety of Life at Sea 1974 and its protocol of 1988, otherwise known as SOLAS. SOLAS provides rules for the construction of and equipment required for commercial vessels and includes regulations for safe operation. It requires the provision of lifeboats and other life-saving appliances, requires the use of the Global Maritime Distress and Safety System which is an international radio equipment and watch keeping standard, afloat and at shore stations, and relates to the Treaty on the Standards of Training and Certification of Watchkeeping Officers, or STCW, also promulgated by the IMO. Flag states that have ratified SOLAS and STCW generally employ the classification societies, which have incorporated SOLAS and STCW requirements into their class rules, to undertake surveys to confirm compliance.
SOLAS and other IMO regulations concerning safety, including those relating to treaties on training of shipboard personnel, lifesaving appliances, radio equipment and the global maritime distress and safety system, are applicable to our operations. Non-compliance with these types of IMO regulations may subject us to increased liability or penalties may lead to decreases in available insurance coverage for affected vessels and may result in the denial of access to or detention in some ports. For example, the U.S. Coast Guard and European Union authorities have indicated that vessels not in compliance with the ISM Code will be prohibited from trading in U.S. and European Union ports.
In the wake of increased worldwide security concerns, the IMO amended SOLAS and added the International Ship and Port Facility Security Code (ISPS Code) as a new chapter to that convention. The objective of the ISPS, which came into effect on July 1, 2004, is to detect security threats and take preventive measures against security incidents affecting ships or port facilities. GWM has developed Security Plans, appointed and trained Ship and Office Security Officers and all of our vessels have been certified to meet the ISPS Code. See “Vessel Security Regulations” for a more detailed discussion about these requirements.
The IMO continues to review and introduce new regulations. It is impossible to predict what additional regulations, if any, may be passed by the IMO and what effect, if any, such regulation may have on our operations.
Air Emissions
The International Convention for the Prevention of Marine Pollution from Ships, or MARPOL, is the principal international convention negotiated by the IMO governing marine pollution prevention and response. MARPOL imposes environmental standards on the shipping industry relating to oil spills, management of garbage, the handling and disposal of noxious liquids, sewage and air emissions. MARPOL 73/78 Annex VI “Regulations for the prevention of Air Pollution,” or Annex VI, entered into force on May 19, 2005, and applies to all ships, fixed and floating drilling rigs and other floating platforms. Annex VI sets limits on Sulphur oxide and nitrogen oxide emissions from ship exhausts, emissions of volatile compounds from cargo tanks, incineration of specific substances, and prohibits deliberate emissions of ozone depleting substances. Annex VI also includes a global cap on Sulphur content of fuel oil and allows for special areas to be established with more stringent controls on Sulphur emissions. The certification requirements for Annex VI depend on size of the vessel and time of periodical classification survey. Ships weighing more than 400 gross tons and engaged in international voyages involving countries that have ratified the conventions, or ships flying the flag of those countries, are required to have an International Air Pollution Certificate (or an IAPP Certificate). Annex VI came into force in the United States on January 8, 2009 and has been amended a number of times. As of the current date, all our ships delivered or drydocked since May 19, 2005 have all been issued with IAPP Certificates.
39
In March 2006, the IMO amended Annex I to MARPOL, including a new regulation relating to oil fuel tank protection, which became effective August 1, 2007. The new regulation applies to various ships delivered on or after August 1, 2010. It includes requirements for the protected location of the fuel tanks, performance standards for accidental oil fuel outflow, a tank capacity limit and certain other maintenance, inspection and engineering standards. IMO regulations also require owners and operators of vessels to adopt Ship Oil Pollution Emergency Plans. Periodic training and drills for response personnel and for vessels and their crews are required.
On July 1, 2010, amendments proposed by the United States, Norway and other IMO member states to Annex VI to the MARPOL Convention took effect that require progressively stricter limitations on Sulphur emissions from ships. In Emission Control Areas, or ECAs, limitations on Sulphur emissions require that fuels contain no more than 1% Sulphur. As of January 1, 2012, fuel used to power ships may contain no more than 3.5% Sulphur. This cap will then decrease progressively until it reaches 0.5% by January 1, 2020. The amendments all establish new tiers of stringent nitrogen oxide emissions standards for new marine engines, depending on their date of installation. The European directive 2005/33/EU, effective as of January 1, 2010, bans the use of fuel oils containing more than 0.1% Sulphur by mass by any merchant vessel while at berth in any EU country. Our vessels have achieved compliance, where necessary, by being arranged to burn gas only in their boilers when alongside. Low sulphur marine diesel oil (or LSDO) has been purchased as the only fuel for the Diesel Generators. In addition we are in the process modifying the boilers on some of our vessels to also allow operation on LSDO.
Additionally, more stringent emission standards could apply in coastal areas designated as ECAs, such as the United States and Canadian coastal areas designated by the IMO's Marine Environment Protection Committee, as discussed in "-U.S. Clean Air Act" below. Effective August 1, 2012, certain coastal areas of North America were designated ECAs, as has been from January 1, 2014 the United States Caribbean Sea. From January 1, 2014 the maximum fuel sulphur limit for both marine gas oil and marine diesel oil will be 0.1%.
U.S. air emissions standards are now equivalent to these amended Annex VI requirements. Additional or new conventions, laws and regulations may be adopted that could require the installation of expensive emission control systems. Because our vessels are largely powered by means other than fuel oil we do not anticipate that any emission limits that may be promulgated will require us to incur any material costs for the operation of our vessels but that possibility cannot be eliminated.
Ballast Water Management Convention
The IMO has negotiated international conventions that impose liability for pollution in international waters and the territorial waters of the signatories to such conventions. For example, IMO adopted an International Convention for the Control and Management of Ships' Ballast Water and Sediments, or the BWM Convention, in February 2004. The BWM Convention's implementing regulations call for a phased introduction of mandatory ballast water exchange requirements, to be replaced in time with mandatory concentration limits. The BWM Convention will not become effective until 12 months after it has been adopted by 30 states, the combined merchant fleets of which represent not less than 35% of the gross tonnage of the world's merchant shipping. The Convention has not yet entered into force because a sufficient number of states have failed to adopt it. As referenced below, the United States Coast Guard issued new ballast water management rules on March 23, 2012. Under the requirements of the BWM Convention for units with ballast water capacity more than 5,000 cubic meters that were constructed in 2011 or before, ballast water management exchange or treatment will be accepted until 2016. From 2016 (or not later than the first intermediate or renewal survey after 2016), only ballast water treatment will be accepted by the BWM Convention. Installation of ballast water treatments (BWT) systems will be needed on all our LNG Carriers. As long as our FSRUs are operating as FSRUs and kept stationary they will not need installation of a BWT system. Given that ballast water treatment technologies are still at the developmental stage, at this time the additional costs of complying with these rules are unclear, but current estimates suggest that additional costs will be in the range $2-$4 million.
Bunkers Convention / CLC State Certificate
The International Convention on Civil Liability for Bunker Oil Pollution 2001, or the Bunker Convention, entered into force in State Parties to the Convention on November 21, 2008. The Convention provides a liability, compensation and compulsory insurance system for the victims of oil pollution damage caused by spills of bunker oil. The Convention makes the ship owner liable to pay compensation for pollution damage (including the cost of preventive measures) caused in the territory, including the territorial sea of a State Party, as well as its economic zone or equivalent area. Registered owners of any sea going vessel and seaborne craft over 1,000 gross tonnage, of any type whatsoever, and registered in a State Party, or entering or leaving a port in the territory of a State Party, will be required to maintain insurance which meets the requirements of the Convention and to obtain a certificate issued by a State Party attesting that such insurance is in force. The State issued certificate must be carried on board at all times.
40
P&I Clubs in the International Group issue the required Bunkers Convention "Blue Cards" to enable signatory states to issue certificates. All of our vessels have received “Blue Cards” from their P&I Club and are in possession of a CLC State-issued certificate attesting that the required insurance cover is in force.
The flag state, as defined by the United Nations Convention on Law of the Sea, has overall responsibility for the implementation and enforcement of international maritime regulations for all ships granted the right to fly its flag. The "Shipping Industry Guidelines on Flag State Performance" evaluates flag states based on factors such as sufficiency of infrastructure, ratification of international maritime treaties, implementation and enforcement of international maritime regulations, supervision of surveys, casualty investigations and participation at the IMO meetings.
United States Environmental Regulation of LNG Vessels
Our vessels operating in U.S. waters now or in the future will be subject to various federal, state and local laws and regulations relating to protection of the environment. In some cases, these laws and regulations require us to obtain governmental permits and authorizations before we may conduct certain activities. These environmental laws and regulations may impose substantial penalties for noncompliance and substantial liabilities for pollution. Failure to comply with these laws and regulations may result in substantial civil and criminal fines and penalties. As with the industry generally, our operations will entail risks in these areas, and compliance with these laws and regulations, which may be subject to frequent revisions and reinterpretation, increases our overall cost of business.
Oil Pollution Act and CERCLA
The U.S. Oil Pollution act of 1990 or OPA 90 established an extensive regulatory and liability regime for environmental protection and clean up of oil spills. OPA 90 affects all owners and operators whose vessels trade with the United States or its territories or possessions, or whose vessels operate in the waters of the United States, which include the U.S. territorial waters and the 200 nautical mile exclusive economic zone of the United States. CERCLA applies to the discharge of hazardous substances whether on land or at sea. While OPA 90 and CERCLA would not apply to the discharge of LNG, they may affect us because we carry oil as fuel and lubricants for our engines, and the discharge of these could cause an environmental hazard. Under OPA 90, vessel operators, including vessel owners, managers and bareboat or “demise” charterers, are “responsible parties” who are all liable regardless of fault, individually and as a group, for all containment and clean-up costs and other damages arising from oil spills from their vessels. These “responsible parties” would not be liable if the spill results solely from the act or omission of a third party, an act of God or an act of war. The other damages aside from clean-up and containment costs are defined broadly to include:
|
•
|
natural resource damages and related assessment costs;
|
|
•
|
real and personal property damages;
|
|
•
|
net loss of taxes, royalties, rents, profits or earnings capacity;
|
|
•
|
net cost of public services necessitated by a spill response, such as protection from fire, safety or health hazards; and
|
|
•
|
loss of subsistence use of natural resources.
|
Effective July 31, 2009, the U.S. Coast Guard adjusted the limits of OPA liability to the greater of $2,000 per gross ton or $17.1 million for any double-hull tanker that is over 3,000 gross tons (subject to possible adjustment for inflation) (relevant to the Company's LNG carriers). These limits of liability do not apply, however, where the incident is caused by violation of applicable U.S. federal safety, construction or operating regulations, or by the responsible party's gross negligence or willful misconduct. These limits likewise do not apply if the responsible party fails or refuses to report the incident or to cooperate and assist in connection with the substance removal activities. OPA 90 specifically permits individual states to impose their own liability regimes with regard to oil pollution incidents occurring within their boundaries, and some states have enacted legislation providing for unlimited liability for discharge of pollutants within their waters. In some cases, states, which have enacted their own legislation, have not yet issued implementing regulations defining ship owners' responsibilities under these laws.
41
CERCLA, which also applies to owners and operators of vessels, contains a similar liability regime and provides for cleanup, removal and natural resource damages for releases of "hazardous substances". Liability under CERCLA is limited to the greater of $300 per gross ton or $0.5 million for each release from vessels not carrying hazardous substances as cargo or residue, and $300 per gross ton or $5 million for each release from vessels carrying hazardous substances as cargo or residue. As with OPA 90, these limits of liability do not apply where the incident is caused by violation of applicable U.S. federal safety, construction or operating regulations, or by the responsible party's gross negligence or willful misconduct or if the responsible party fails or refuses to report the incident or to cooperate and assist in connection with the substance removal activities. OPA 90 and CERCLA each preserve the right to recover damages under existing law, including maritime tort law. We believe that we are in substantial compliance with OPA 90, CERCLA and all applicable state regulations in the ports where our vessels call.
OPA 90 requires owners and operators of vessels to establish and maintain with the U.S. Coast Guard evidence of financial responsibility sufficient to meet the limit of their potential strict liability under OPA 90/CERCLA. Under the regulations, evidence of financial responsibility may be demonstrated by insurance, surety bond, self-insurance or guaranty. Under OPA 90 regulations, an owner or operator of more than one vessel is required to demonstrate evidence of financial responsibility for the entire fleet in an amount equal only to the financial responsibility requirement of the vessel having the greatest maximum liability under OPA 90/CERCLA. We currently maintain each of our ship owning subsidiaries that has vessels trading in U.S. waters has applied for, and obtained from the U.S. Coast Guard National Pollution Funds Center, three-year certificates of financial responsibility (or COFR), supported by guarantees which we purchased from an insurance based provider. We believe that we will be able to continue to obtain the requisite guarantees and that we will continue to be granted certificates of financial responsibility from the U.S. Coast Guard for each of our vessels that is required to have one.
In response to the BP Deepwater Horizon oil spill, the U.S. Congress is currently considering a number of bills that could potentially increase or even eliminate the limits of liability under OPA 90. For example, effective October 22, 2012, the U.S. bureau of safety and Environmental Enforcement (BSEE) implemented a final drilling safety rule for offshore oil and gas operations that strengthens the requirements for safety equipment, well control systems and blowout prevention practices. Compliance with any new requirements of OPA 90 may substantially impact our cost of operations or require us to incur additional expenses to comply with any new regulatory initiatives or statutes. Additional legislation or regulation applicable to the operation of our vessels that may be implemented in the future as a result of the 2010 BP Deepwater Horizon oil spill in the Gulf of Mexico could adversely affect our business and ability to make distributions to our shareholders.
Clean Water Act
The United States Clean Water Act (or CWA) prohibits the discharge of oil or hazardous substances in United States navigable waters unless authorized by a permit or exemption, and imposes strict liability in the form of penalties for unauthorized discharges. The CWA also imposes substantial liability for the costs of removal, remediation and damages and complements the remedies available under OPA and CERCLA. The EPA has enacted rules governing the regulation of ballast water discharges and other discharges incidental to the normal operation of vessels within U.S. waters. In March 2013, EPA released a final permit covering vessel discharges under the CWA that for the first time sets numeric effluent limits for ballast water discharges from large commercial vessels. The new Vessel General Permit (or VGP) replaced the prior VGP as of December 2013. The new VGP covers vessel discharges in all U.S. states and territories, including those jurisdictions that implement other aspects of the National Pollutant Discharge Elimination System (or NPDES) program. The permit covers owners and operators of non-recreational large vessels (79 feet and over) operating in a capacity as a means of transportation, such as cruise ships, ferries, barges, mobile offshore drilling units, oil tankers or petroleum tankers, bulk carriers, cargo ships, container ships, other cargo freighters, refrigerant ships, research vessels, and emergency response vessels.
The most significant change in the new VGP is the inclusion of numeric effluent limits for ballast water expressed as the maximum concentration of living organisms in ballast water, as opposed to the prior non-numeric requirements. The permit also contains maximum discharge limitations for biocides and residuals. The numeric effluent limits in the new VGP will not apply to all vessels. Those that will be required to comply with the numeric limits will do so under a staggered implementation schedule. Certain existing vessels must achieve the numeric effluent limits for ballast water by the first drydocking after January 1, 2014 or January 1, 2016, depending on the vessel size. “New build” vessels are subject to the numeric limits upon the effective date of the new permit. Vessels that have deferred deadlines for meeting the numeric standards must meet BMPs, which are substantially similar to past requirements.
Vessels that are subject to the numeric effluent limits for ballast water can meet these limits in four ways: (1) treat ballast water prior to discharge; (2) transfer the ship’s ballast water to a NPDES permitted third party treatment facility; (3) use treated municipal/potable water as ballast water; or (4) not discharge ballast water while within the territorial waters of the United States. As with the prior permit, vessels that are enrolled in and meet the requirements for the Coast Guard’s Shipboard Technology Evaluation Program would be deemed in compliance with the numeric limitations. The VGP includes multiple mandatory practices
42
for all vessels equipped with ballast water tanks, such as avoiding the discharge or uptake of ballast water in a manner that could impact sensitive areas (such as marine sanctuaries, preserves, parks, shellfish beds, or coral reefs), routine cleaning of ballast water tanks, using ballast water pumps in lieu of gravity draining, and minimizing ballast water discharges to the extent practible. Additional changes to the new VGP include numeric limits for exhaust gas scrubber effluent, and monitoring requirements for some larger vessels for graywater, exhaust gas scrubber effluent, and ballast water.
In addition to the requirements in the new VGP, vessel owners and operators must meet twenty-five sets of state-specific requirements under the CWA’s § 401 certification process. Because the CWA § 401 process allows tribes and states to impose their own requirements for vessels operating within their waters, vessels operating in multiple jurisdictions could face potentially conflicting conditions specific to each jurisdiction that they travel through.
The new VGP includes a tiered requirement for obtaining coverage based on the size of the vessel and the amount of ballast water carried. Vessels that are 300 gross tons or larger and have the capacity to carry more than eight cubic meters of ballast water must submit notices of intent (NOIs) to receive permit coverage between six and nine months after the permit’s issuance date. Vessels that do not need to submit NOIs are automatically authorized under the permit.
The National Invasive Species Act (or NISA) was enacted in 1996 in response to growing reports of harmful organisms being released into U.S. ports through ballast water taken on by ships in foreign ports. NISA established a ballast water management program for ships entering U.S. waters. Under NISA, mid-ocean ballast water exchange is voluntary, except for ships heading to the Great Lakes, Hudson Bay, or vessels engaged in the foreign export of Alaskan North Slope crude oil. However, NISA's exporting and record-keeping requirements are mandatory for vessels bound for any port in the United States. Although ballast water exchange is the primary means of compliance with the act's guidelines, compliance can also be achieved through the retention of ballast water onboard the ship, or the use of environmentally sound alternative ballast water management methods approved by the U.S. Coast Guard. If the mid-ocean ballast exchange is made mandatory throughout the United States, or if water treatment requirements or options are instituted, the costs of compliance could increase for ocean carriers.
As of June 21, 2012, the U.S. Coast Guard implemented revised regulations on ballast water management by establishing standards for the allowable concentration of living organisms in ballast water discharged in U.S. waters. The revised regulations adopt ballast water discharge standards for vessels calling on U.S. ports and intending to discharge ballast water equivalent to those set in IMO's BWM Convention. The final rule requires that ballast water discharge have no more than 10 living organisms per milliliter for organisms between 10 and 50 micrometers in size. For organisms larger than 50 micrometers, the discharge can have 10 living organisms per cubic meter of discharge. New ships constructed on or after December 1, 2012 must comply with these standards and some existing ships must comply with these standards and some existing ships must comply by their first dry dock after January 1, 2014. The Coast Guard will review the practicability of implementing a more stringent ballast water discharge standard and publish the results no later than January 1, 2016. Compliance with these regulations will require us to incur additional costs and other measures that may be significant.
Compliance with these regulations will entail additional costs and other measures that may be significant.
Clean Air Act
The U.S. Clean Air Act of 1970, as amended, or the CAA, requires the EPA to promulgate standards applicable to emissions of volatile organic compounds and other air contaminants. Our vessels are subject to vapor control and recovery requirements for certain cargoes when loading, unloading, ballasting, cleaning and conducting other operations in regulated port areas and emission standards for so-called “Category 3” marine diesel engines operating in U.S. waters. The marine diesel engine emission standards are currently limited to new engines beginning with the 2004 model year. On April 30, 2010, the EPA promulgated final emission standards for Category 3 marine diesel engines equivalent to those adopted in the amendments to Annex VI to MARPOL. The emission standards apply in two stages: near-term standards for newly-built engines will apply from 2011, and long-term standards requiring an 80% reduction in nitrogen dioxides, or Nox, will apply from 2016. Compliance with these standards may cause us to incur costs to install control equipment on our vessels in the future.
43
Regulation of Greenhouse Gas Emissions
In February 2005, the Kyoto Protocol entered into force. Pursuant to the Kyoto Protocol, adopting countries are required to implement national programs to reduce emissions of certain gases, generally referred to as greenhouse gases, which are suspected of contributing to global warming. Currently, the emissions of greenhouse gases from international transport are not subject to the Kyoto Protocol. In December 2009, more than 27 nations, including the United States and China, signed the Copenhagen Accord, which includes a non-binding commitment to reduce greenhouse gas emissions. In addition, in December 2011, the Conference of the Parties to the United Nations Convention on Climate Change adopted the Durban Platform which calls for a process to develop binding emissions limitations on both developed and developing countries under the United Nations Framework Convention on Climate Change applicable to all Parties. The European Union has indicated that it intends to propose an expansion of the existing European Union emissions trading scheme to include emissions of greenhouse gases from marine vessels and in January 2012, the European Commission launched a public consultation on possible measures to reduce greenhouse gas emissions from ships.
As of January 1, 2013, all ships (including rigs and drillships) must comply with mandatory requirements adopted by the MEPC in July 2011 relating to greenhouse gas emissions. The amendments to MARPOL Annex VI Regulations for the prevention of air pollution from ships add a new Chapter 4 to Annex VI on Regulations on energy efficiency requiring the Energy Efficiency Design Index (EEDI), for new ships, and the Ship Energy Efficiency Management Plan (SEEMP) for all ships. These measures entered into force on January 1, 2013. Other amendments to Annex VI add new definitions and requirements for survey and certification, including the format for the International Energy Efficiency Certificate. The regulations apply to all ships of 400 gross tonnage and above. When these regulations enter into force, these new rules will likely affect the operations of vessels that are registered in countries that are signatories to MARPOL Annex VI or vessels that call upon ports located within such countries. The implementation of the EEDI and SEEMP standards could cause us to incur additional compliance costs. The IMO is also considering the implementation of a market-based mechanism for greenhouse gas emissions from ships, but it is impossible to predict the likelihood that such a standard might be adopted or its potential impact on our operations at this time.
In the United States, the EPA has issued a final finding that greenhouse gases threaten public health and safety, and has promulgated regulations that regulate the emission of greenhouse gases. In 2009 and 2010, EPA adopted greenhouse reporting requirements for various onshore facilities, and also adopted a rule in 2011 imposing control technology requirements on certain stationary sources subject to the federal Clean Air Act. The EPA may decide in the future to regulate greenhouse gas emissions from ships and has already been petitioned by the California Attorney General to regulate greenhouse gas emissions from ocean-going vessels. Other federal and state regulations relating to the control of greenhouse gas emissions may follow, including climate change initiatives that have been considered in the U.S. Congress. Any passage of climate control legislation or other regulatory initiatives by the IMO, the European Union, the United States, or other countries where we operate, or any treaty adopted at the international level to succeed the Kyoto Protocol, that restrict emissions of greenhouse gases could require us to make significant financial expenditures that we cannot predict with certainty at this time. In addition, even without such regulation, our business may be indirectly affected to the extent that climate change results in sea level changes or more intense weather events.
Vessel Safety Regulations
The Maritime Safety Committee adopted a new paragraph 5 of SOLAS regulation III/1 to require lifeboat on-load release mechanisms not complying with new International Life-Saving Appliances (LSA) Code requirements to be replaced no later than the first scheduled dry-docking of the ship after 1 July 2014 but, in any case, not later than 1 July 2019. The SOLAS amendment, which entered into force on 1 January 2013, is intended to establish new, stricter, safety standards for lifeboat release and retrieval systems, aimed at preventing accidents during lifeboat launching, and will require the assessment and possible replacement of a large number of lifeboat release hooks.
All Golar vessels that were docked in 2013 had the lifeboat release and retrieval systems overhauled and modified where found necessary.
According to SOLAS Ch V/19.2.10, all vessels shall have an Electronic Chart Display and Information Systems (ECDIS) installed in the period 2012 to 2018. Our LNG vessels must have approved ECDIS fitted no later than the first survey on or after 1. July 2015. All our vessels that were drydocked in 2013 had an ECDIS installed and our Officers has been sent to specific training courses.
44
Security Regulations
Since the terrorist attacks of September 11, 2001, there have been a variety of initiatives intended to enhance vessel security. On November 25, 2002, the Maritime Transportation Act of 2002, or MTSA, came into effect. To implement certain portions of the MTSA, in July 2003, the U.S. Coast Guard issued regulations requiring the implementation of certain security requirements aboard vessels operating in waters subject to the jurisdiction of the United States. Similarly, in December 2002, amendments to SOLAS created a new chapter of the convention dealing specifically with maritime security. The new chapter became effective in July 2004 and imposes various detailed security obligations on vessels and port authorities, most of which are contained in the ISPS Code. The ISPS Code is designed to protect ports and international shipping against terrorism. After July 1, 2004, to trade internationally, a vessel must attain an International Ship Security Certificate, or ISSC, from a recognized security organization approved by the vessel's flag state. Among the various requirements are:
|
▪
|
on-board installation of automatic identification systems to provide a means for the automatic transmission of safety-related information from among similarly equipped ships and shore stations, including information on a ship's identity, position, course, speed and navigational status;
|
|
▪
|
on-board installation of ship security alert systems, which do not sound on the vessel but only alerts the authorities on shore;
|
|
▪
|
the development of vessel security plans;
|
|
▪
|
ship identification number to be permanently marked on a vessel's hull;
|
|
▪
|
a continuous synopsis record kept onboard showing a vessel's history including, the name of the ship and of the state whose flag the ship is entitled to fly, the date on which the ship was registered with that state, the ship's identification number, the port at which the ship is registered and the name of the registered owner(s) and their registered address; and
|
|
▪
|
compliance with flag state security certification requirements.
|
The U.S. Coast Guard regulations, intended to align with international maritime security standards, exempt non-U.S. vessels from obtaining U.S. Coast Guard-approved MTSA vessel security plans provided such vessels have on board an ISSC that attests to the vessel's compliance with SOLAS security requirements and the ISPS Code.
GWM has developed Security Plans, appointed and trained Ship and Office Security Officers and each of our vessels in our fleet complies with the requirements of the ISPS Code, SOLAS and the MTSA.
Other Regulations
Our LNG vessels may also become subject to the 2010 HNS Convention, if it is entered into force. The Convention creates a regime of liability and compensation for damage from hazardous and noxious substances (or HNS), including liquefied gases. The 2010 HNS Convention sets up a two-tier system of compensation composed of compulsory insurance taken out by ship owners and an HNS fund that comes into play when the insurance is insufficient to satisfy a claim or does not cover the incident. Under the 2010 HNS Convention, if damage is caused by bulk HNS, claims for compensation will first be sought from the ship owner up to a maximum of 100 million Special Drawing Rights (or SDR). If the damage is caused by packaged HNS or by both bulk and packaged HNS, the maximum liability is 115 million SDR. Once the limit is reached, compensation will be paid from the HNS Fund up to a maximum of 250 million SDR. The 2010 HNS Convention has not been ratified by a sufficient number of countries to enter into force, and we cannot estimate the costs that may be needed to comply with any such requirements that may be adopted with any certainty at this time.
Inspection by Classification Societies
Every large, commercial seagoing vessel must be "classed" by a classification society. A classification society certifies that a vessel is "in class," signifying that the vessel has been built and maintained in accordance with the rules of the vessel's country of registry and the international conventions of which that country is a member. In addition, where surveys are required by international conventions and corresponding laws and ordinances of a flag state, the classification society will undertake them on application or by official order, acting on behalf of the authorities concerned.
45
Generally FSRUs are "classed" as LNG carriers with the additional class notation REGAS-2 signifying that the regasification installations are designed and approved for continuous operation. The reference to "vessels" in the following, also apply to our FSRUs. For maintenance of the class certificate, regular and special surveys of hull, machinery, including the electrical plant and any special equipment classed, are required to be performed by the classification society, to ensure continuing compliance. Vessels are drydocked at least once during a five-year class cycle for inspection of the underwater parts and for repairs related to inspections. If any defects are found, the classification surveyor will issue a "condition of class" which must be rectified by the ship owner within prescribed time limits. The classification society also undertakes on request of the flag state other surveys and checks that are required by the regulations and requirements of that flag state. These surveys are subject to agreements made in each individual case and/or to the regulations of the country concerned.
The FSRU unit,
NR Satu
has dual class (DnV and BKI) with class notation +OI Floating Offshore LNG Regasification Terminal, REGAS, POSMOOR and is permanently moored without the ability to trade as a LNG carrier.
Most insurance underwriters make it a condition for insurance coverage that a vessel be certified as "in class" by a classification society, which is a member of the International Association of Classification Societies. All of our vessels have been certified as being "in class." The
Golar Arctic
and
Golar Mazo
are certified by Lloyds Register, and all our other vessels are each certified by Det Norske Veritas. Both being members of the International Association of Classification Societies. All of our vessels have been awarded ISM certification and are currently "in class".
In-House Inspections
GWM carries out inspections of the vessels on a regular basis; both at sea and when the vessels are in port, while we carry out inspection and vessel audits to verify conformity with manager's reports. The results of these inspections, which are conducted both in port and underway, result in a report containing recommendations for improvements to the overall condition of the vessel, maintenance, safety and crew welfare. Based in part on these evaluations, we create and implement a program of continual maintenance for our vessels and their systems.
C. Organizational Structure
As of April 25, 2014, all of our subsidiaries are wholly-owned.
|
Name
|
Jurisdiction of Incorporation
|
Purpose
|
|
Golar LNG 1460 Corporation
|
Marshall Islands
|
Owns
Golar Viking
|
|
Golar LNG 2216 Corporation
|
Marshall Islands
|
Owns
Golar Arctic
|
|
Golar Management Limited
|
United Kingdom
|
Management company
|
|
Golar GP LLC – Limited Liability Company
|
Marshall Islands
|
Holding company
|
|
Golar LNG Energy Limited
|
Bermuda
|
Holding company
|
|
Golar Gimi Limited
|
Marshall Islands
|
Owns
Gimi
|
|
Golar Hilli Limited
|
Marshall Islands
|
Owns
Hilli
|
|
Bluewater Gandria N.V.
|
Netherlands
|
Owns and Operates
Golar Gandria
|
|
Golar Hull M2021 Corporation
|
Marshall Islands
|
Owns Hull 2021 (
Golar Seal
)
|
|
Golar Hull M2022 Corporation
|
Marshall Islands
|
Owns Hull 2022 (
Golar Crystal
)
|
|
Golar Hull M2023 Corporation
|
Marshall Islands
|
Owns Hull 2023 (
Golar Penguin
)
|
|
Golar Hull M2024 Corporation
|
Marshall Islands
|
Owns Hull 2024 (
Golar Eskimo
)
|
|
Golar Hull M2026 Corporation
|
Marshall Islands
|
Owns Hull 2026 (
Golar Celsius
)
|
|
Golar Hull M2027 Corporation
|
Marshall Islands
|
Owns Hull 2027 (
Golar Bear
)
|
|
Golar Hull M2047 Corporation
|
Marshall Islands
|
Owns Hull 2047 (
Golar Snow
)
|
|
Golar Hull M2048 Corporation
|
Marshall Islands
|
Owns Hull 2048 (
Golar Ice
)
|
|
Golar LNG NB10 Corporation
|
Marshall Islands
|
Owns Hull S658 (
Golar Glacier
)
|
|
Golar LNG NB11 Corporation
|
Marshall Islands
|
Owns Hull S659 (
Golar Kelvin
)
|
|
Golar LNG NB12 Corporation
|
Marshall Islands
|
Owns Hull 2055 (
Golar Frost
)
|
|
Golar LNG NB13 Corporation
|
Marshall Islands
|
Owns Hull 2056 (
Golar Tundra
)
|
46
D. Property, Plant and Equipment
For information on our fleet, please see the section of this item entitled "Fleet."
We do not own any interest in real property. We sublease approximately 7,000 square feet and 10,000 square feet of office space in London for our ship management operations and in Tulsa for our LNG Trading business, respectively.
None.
The following discussion of our financial condition and results of operations should be read in conjunction with the sections of this annual report entitled Item 3. "Key Information - Selected Financial Data," Item 4. "Information on the Company" and our audited financial statements and notes thereto. Our financial statements have been prepared in accordance with U.S. GAAP. This discussion includes forward-looking statements based on assumptions about our future business. Please read the section of this annual report entitled "Cautionary Statement Regarding Forward Looking Statements" for more information. You should also review the section of this annual report entitled Item 3. "Key Information - Risk Factors" for a discussion of important factors that could cause our actual results to differ materially from the results described in or implied by the forward-looking statements.
Overview and Background
Golar is a midstream liquefied natural gas ("LNG") company engaged primarily in the transportation, regasification and liquefaction and trading of LNG. We are engaged in the acquisition, ownership, operation and chartering of LNG carriers and FSRUs through our subsidiaries and affiliates and the development of LNG projects.
Golar Partners
Golar Partners was formed initially as an indirect wholly-owned subsidiary of Golar in September 2007 under the laws of the Republic of the Marshall Islands for the purpose of holding interests in vessels with long-term charters (typically five years or more) in order to better manage the risk profiles of our total fleet through our dropdowns of our vessel interests into Golar Partners.
In April 2011, we completed the initial public offering (“IPO”) of Golar Partners. In the IPO, we sold 13.8 million common units (including the 1.8 million issued due to the exercise of the over-allotment option) of Golar Partners, at a price of $22.50 per unit, receiving net proceeds of $287.8 million. As a result of the IPO our ownership of Golar Partners was reduced to 65% (including our 2% general partner interest). Golar Partners is listed on the Nasdaq Global Market ("Nasdaq") under the symbol "GMLP".
As of April 25, 2014, Golar Partners has completed a further four follow-on offerings since its IPO, such that as of the current date, our ownership interest has fallen to 41.4% (including our 2% general partner interest).
Since the IPO of Golar Partners, we have sold the following five vessels to Golar Partners, the
Golar Freeze
, the
NR Satu
, the
Golar Grand
, the
Golar Maria
and more recently, the
Golar Igloo
for an aggregate value of $1.5 billion. Accordingly, as of April 25, 2014, Golar Partner's fleet consisted of four LNG carriers and five FSRUs that were acquired from or contributed by us.
Under the provisions of Golar Partner's partnership agreement, the general partner irrevocably delegated the authority to Golar Partners' board of directors to oversee and direct the operations, management and policy making of the Partnership. During the period from the IPO in April 2011 until the time of Golar Partners' first AGM on December 13, 2012, we retained the sole power to appoint, remove and replace all members of Golar Partners' board of directors. From the first Golar Partners' AGM, four of the seven board members became electable by common unitholders and accordingly, from this date we no longer retain the power to control the directors of Golar Partners. As a result, from December 13, 2012, Golar Partners has been considered as an affiliate entity and not as our controlled subsidiary.
47
Market Overview and Trends
Our principal focus and expertise is the transportation and regasification of LNG and liquefaction of natural gas. We are engaged in the acquisition, ownership, operation and chartering of LNG carriers and FSRUs through our subsidiaries and the development of liquefaction projects. As of April 25, 2014, together with our affiliate, Golar Partners, our fleet consisted of seventeen vessels. Our full fleet list is provided in Item 4.D, "Information on the Company – Fleet".
Historically, spot and short term charter hire rates for LNG carriers have been uncertain which reflects the variability in the supply and demand for LNG carriers. The industry has not however experienced a structural surplus of LNG carriers since the 1980s with fluctuations in rates and utilization over the intervening decades reflecting short-term timing disconnects between the delivery of new vessels and delivery of the new LNG they were ordered to transport. During the last cycle an excess of LNG carriers first became evident in 2004 before reaching a peak in the second quarter of 2010 when spot and short term charter hire rates together with utilization reached historic lows. Due to a lack of newbuild orders placed between 2008 and 2010, this trend then reversed from the third quarter of 2010 such that the demand for LNG shipping was not being met by available supply in 2011 and the first half of 2012. Spot and short-medium term charter hire rates together with fleet utilization reached historic highs as a result. Since then, hire rates and utilization slowly declined from these all-time highs reaching an equilibrium around the third quarter of 2013 when the supply and demand of vessels was broadly in alignment. Subsequent to this the pace of newbuild LNG carrier deliveries has outstripped the supply of new LNG liquefaction and this scenario is expected to prevail through to 2015. Hire rates and utilization will continue to be volatile over this timeframe. From 2016, the arrival of substantial new LNG volumes is expected to absorb the built-up surplus of LNG carriers and result in rapidly increasing hire rates and utilization of vessels exposed to the market at this time. This expectation is predicated on an observed reduction in LNG carrier orders which if sustained even over a relatively short period will result in insufficient carriers in the market to move the LNG volumes expected to deliver.
As of April 25, 2014, we have newbuilding commitments for eight LNG carriers and two FSRUs with delivery dates between 2014 through to 2015, a majority of which are uncommitted and available for employment upon delivery.
Please see the section of this annual report entitled Item 4, "Information on the Company – Business Overview – the LNG industry" for further discussion of the LNG market in 2013 and 2012.
Factors Affecting the Comparability of Future Results
Our historical results of operations and cash flows are not indicative of results of operations and cash flows to be expected in the future, principally for the following reasons:
|
•
|
Deconsolidation of Golar Partners from December 13, 2012.
Although our economic interests in the cashflows of Golar Partners remain the same since before and after the deconsolidation, the accounting effect of the deconsolidation resulted in a one-time gain of $854 million and since then, has had a material impact on the presentation of our financial results as compared to prior periods. A summary of the key significant changes that occurred in 2013 when compared to historic periods, as a consequence of the deconsolidation, include:
|
|
•
|
A decrease in operating income and individual line items therein, in relation to Golar Partner's fleet;
|
|
•
|
As well as a decrease in net financial expense in respect of Golar Partner's debt and capital lease obligations, net of restricted cash deposits.
|
Offset by, recognition of:
|
•
|
Gains on the sale of our vessel interests to Golar Partners, commencing with the
Golar Maria
in February 2013 and more recently, the
Golar Igloo
in March 2014. However, any recognition from the gain related to the sale of our vessels to Golar Partners will be deferred to the extent it relates to the proportion of our interest accounted for under the equity method, which during the subordination period relates solely to our interest in Golar Partner's subordinated units.
|
|
•
|
Management fee income from the provision of services to Golar Partners under each of the management and administrative services and the fleet management agreements.
|
|
•
|
Dividend income in respect of our interests in common units and general partner interests (during the subordination period) and IDRs.
|
48
|
•
|
Equity in net earnings of affiliates, to reflect our share of the results of Golar Partners calculated with respect to our interests in its subordinated units, but offset by a charge for the amortization of the basis difference in relation to the $854 million gain on loss of control.
|
|
•
|
For periods when vessels are in lay-up, vessel operating and voyage costs will be lower.
During 2011 and 2012, we had three vessels; the
Gimi
(August 2010 - June 2011),
Hilli
(April 2008 - April 2012) and the
Golar Gandria
(January 2012 to April 2012) which experienced periods of time in lay- up. The
Gimi
was reactivated in September 2011 while the
Hilli
and the
Gandria
were reactivated in April 2012. However, in 2013 and 2014, all three vessels were again placed back into lay-up, the
Hilli
and the
Gandria
since April 2013 and the
Gimi
from January 2014. These three vessels are currently in lay-up but have been earmarked for use in the Company's FLNG vessel conversion projects. While in lay-up we benefited from lower vessel operating costs principally from reduced crew on board, minimal maintenance requirement and voyage costs.
|
|
•
|
We expect continued inflationary pressure on crew costs
. Due to the specialized nature of operating FSRUs and LNG carriers, the increase in size of the worldwide LNG carrier fleet and the limited pool of qualified officers, we believe that crewing and labor related costs will experience significant increases.
|
|
•
|
We may enter into different financing arrangements.
Our current financing arrangements may not be representative of the arrangements we will enter into in the future. For example, we may amend our existing credit facilities or enter into other financing arrangements, which may be more expensive. For descriptions of our current financing arrangements, please read "Item 5 - Liquidity and Capital Resources-Borrowing Activities."
|
|
•
|
Investment in projects.
We are continuing to invest in and develop our various projects. The costs we have incurred historically may not be indicative of future costs.
|
|
•
|
Our results are affected by fluctuations in the fair value of our derivative instruments
. The change in fair value of some of our derivative instruments is included in our net income as some of our derivative instruments are not designated as hedges for accounting purposes. These changes may fluctuate significantly as interest rates fluctuate. See Note 32 - "Financial Instruments" in the notes to our consolidated financial statements. The unrealized gains or losses relating to the change in fair value of our derivatives do not impact our cash flows.
|
|
•
|
Expansion of our fleet.
As of April 25, 2014, we have newbuilding commitments for eight LNG carriers and two FSRUs for a total contract cost of $2.1 billion with scheduled deliveries between 2014 through 2015. In addition, in January 2012, we acquired the remaining 50% equity interest in our joint venture, Bluewater Gandria, which owns the vessel the
Golar Gandria
.
|
|
•
|
In 2010, we commenced a LNG trading business but ceased further activities during the third quarter of 2011, which negatively impacted our results for 2011.
In May 2010, we established a new subsidiary, Golar Commodities to position us in the market for managing and trading LNG cargoes. Activities included structured services to outside customers (such as risk management services), arbitrage activities as well as proprietary trading. During the third quarter of 2011, we determined that, due to unfavorable market conditions, Golar Commodities would wind down its trading activities until such time as opportunities in this sector improved. Golar Commodities had no trades during 2012 and 2013. However, in the first quarter of 2014, we entered into a trade in connection with the
Golar Igloo
charter.
|
49
Factors Affecting Our Results of Operations
We believe the principal factors that will affect our future results of operations include:
|
•
|
the number of vessels in our fleet;
|
|
•
|
our ability to maintain good relationships with our key existing customers and to increase the number of our customer relationships;
|
|
•
|
increased demand for LNG shipping services, including FSRU services, and in connection with this underlying demand and supply for natural gas and specifically LNG;
|
|
•
|
our ability to employ our vessels operating in the spot market and rates and levels of utilization achieved by our vessels;
|
|
•
|
the success or failure of the LNG infrastructure projects that we are working on or may work on in the future;
|
|
•
|
our ability to successfully employ our vessels at economically attractive rates, as our charters expire or are otherwise terminated;
|
|
•
|
our ability to execute strategic and mutually beneficial sales of our assets, similar to the sale of five of our vessels in exchange for cash of approximately $1.5 billion conducted with Golar Partners;
|
|
•
|
our ability to obtain debt financing in respect of our capital commitments;
|
|
•
|
the effective and efficient technical management of our and Golar Partner's vessels;
|
|
•
|
our ability to obtain and maintain major international energy company approvals and to satisfy their technical, health, safety and compliance standards; and
|
|
•
|
economic, regulatory, political and governmental conditions that affect the shipping industry. This includes changes in the number of new LNG importing countries and regions and availability of surplus LNG from projects around the world, as well as structural LNG market changes allowing greater flexibility and enhanced competition with other energy sources.
|
In addition to the factors discussed above, we believe certain specific factors have impacted, and will continue to impact, our results of operations. These factors include:
|
•
|
the hire rate earned by our vessels and unscheduled off-hire days;
|
|
•
|
non-utilization for vessels not subject to fixed rate charters;
|
|
•
|
pension and share option expense;
|
|
•
|
mark-to-market charges in interest rate swaps and foreign currency derivatives;
|
|
•
|
foreign currency exchange gains and losses;
|
|
•
|
our access to capital required to acquire additional vessels and/or to implement our business strategy;
|
|
•
|
the performance of our equity interests;
|
|
•
|
increases in operating costs; and
|
|
•
|
our level of debt and the related interest expense and amortization of principal.
|
Please see the section of this annual report entitled Item 3. "Key Information – Risk Factors" for a discussion of certain risks inherent in our business.
Important Financial and Operational Terms and Concepts
We use a variety of financial and operational terms and concepts when analyzing our performance. These include the following:
Total Operating Revenues
.
Total operating revenues primarily refers to time charter revenues. We recognize revenues from time charters over the term of the charter as the applicable vessel operates under the charter. We do not recognize revenue during days when the vessel is off-hire, unless the charter agreement makes a specific exception.
50
Off-hire (Including Commercial Waiting Time).
Our vessels may be out of service, off-hire, for three main reasons: scheduled drydocking or special survey or maintenance, which we refer to as scheduled off-hire; days spent waiting for a charter, which we refer to as commercial waiting time; and unscheduled repairs or maintenance, which we refer to as unscheduled off-hire.
Voyage Expenses.
Voyage expenses, which are primarily fuel costs but which also include other costs such as port charges, are paid by our customers under our time charters. However, we may incur voyage related expenses during off-hire periods when positioning or repositioning vessels before or after the period of a time charter or before or after drydocking. We also incur some voyage expenses, principally fuel costs, when our vessels are in periods of commercial waiting time.
Time Charter Equivalent Earnings.
In order to compare vessels trading under different types of charters, it is standard industry practice to measure the revenue performance of a vessel in terms of average daily time charter equivalent earnings, or "TCE." For our time charters, this is calculated by dividing time charter revenues by the number of calendar days minus days for scheduled off-hire. Where we are paid a fee to position or reposition a vessel before or after a time charter, this additional revenue, less voyage expenses, is included in the calculation of TCE. For shipping companies utilizing voyage charters (where the vessel owner pays voyage costs instead of the charterer), TCE is calculated by dividing voyage revenues, net of vessel voyage costs, by the number of calendar days minus days for scheduled off-hire. TCE is a non-GAAP financial measure. Please see the section of this annual report entitled Item 3, "Key Information – Selected Financial Data" for a reconciliation of TCE to our total operating revenues.
Vessel Operating Expenses
. Vessel operating expenses include direct vessel operating costs associated with operating a vessel, such as crew wages, which are the most significant component, vessel supplies, routine repairs, maintenance, lubricating oils, insurance and management fees for the provision of commercial and technical management services.
Depreciation and Amortization.
Depreciation and amortization expense, or the periodic cost charged to our income for the reduction in usefulness and long-term value of our ships, is related to the number of vessels we own or operate under long-term capital leases. We depreciate the cost of our owned vessels, less their estimated residual value, and amortize the amount of our capital lease assets over their estimated economic useful lives, on a straight-line basis. We amortize our deferred drydocking costs over two to five years based on each vessel's next anticipated drydocking. Income derived from sale and subsequently leased assets is deferred and amortized in proportion to the amortization of the leased assets.
Administrative Expenses.
Administrative expenses are comprised of general overhead, including personnel costs, legal and professional fees, costs associated with project development, property costs and other general administration expenses. Included within administrative expenses are pension and share option expenses. Pension expense includes costs associated with a defined benefit pension plan we maintain for some of our office-based employees (the U.K. Scheme). Although this scheme is now closed to new entrants the cost of provision of this benefit will vary with the movement of actuarial variables and the value of the pension fund assets.
Interest Expense and Interest Income.
Interest expense depends on our overall level of borrowings and may significantly increase when we acquire or lease ships. During construction of a newbuilding or a FSRU retrofitting period, interest expense incurred is capitalized in the cost of the newbuilding or vessel. Interest expense may also change with prevailing interest rates, although interest rate swaps or other derivative instruments may reduce the effect of these changes. Interest income will depend on prevailing interest rates and the level of our cash deposits and restricted cash deposits.
Impairment of Long-Term Assets
.
Our vessels are reviewed for impairment whenever events or changes in circumstances indicate that the carrying amount may not be recoverable. In assessing the recoverability of our vessels' carrying amounts, we must make assumptions regarding estimated future cash flows and estimates in respect of residual or scrap value. During 2013, we considered the softening in the LNG shipping market and the current operating losses of our vessels in lay-up as potential indicators of impairment of these three vessels. We assessed potential impairment of these three vessels in lay-up by comparing th expected discounted cash flows based on assumption that these vessels will be converted and operated as FLNGVs to their respective carrying values. We concluded there was no impairment of these vessels as of December 31, 2013 existed as the fair values of these vessels were substantially higher than their carrying values.
51
Other Financial Items.
Other financial items include financing fee arrangement costs such as commitment fees on credit facilities, amortization of deferred financing costs, market valuation adjustments for interest rate swap, interest rate cash settlements, foreign currency swap and equity swap derivatives and foreign exchange gains/losses. The market valuation adjustment for our derivatives may have a significant impact on our results of operations and financial position although it does not impact our liquidity. Historically, prior to the deconsolidation of Golar Partners, foreign exchange gains or losses arose primarily due to the retranslation of capital lease obligations and the cash deposits securing those obligations that were denominated in GBP. Any gain or loss represented an unrealized gain or loss that arose over time as a result of exchange rate movements. Our liquidity position was only affected to the extent that we chose or were required to withdraw monies from or pay additional monies into the deposits securing those capital lease obligations or if the leases were terminated.
Inflation and Cost Increases
Although inflation has had a moderate impact on operating expenses, interest costs, drydocking expenses and overhead, we do not expect inflation to have a significant impact on direct costs in the current and foreseeable economic environment other than potentially in relation to insurance costs and crew costs. It is anticipated that insurance costs, which have risen over the last three years, will continue to rise over the next few years and rates may exceed the general level of inflation. LNG transportation is a specialized area and the number of vessels has increased rapidly. Therefore, there has been an increased demand for qualified crews, which has and will continue to the same extent to put inflationary pressure on crew costs.
Results of Operations
Our results for the years ended December 31, 2013, 2012 and 2011 were affected by several key factors:
|
•
|
The deconsolidation of Golar Partners effective December 13, 2012, has had a material impact on our results for the year ended December 31, 2013 and thus comparability to prior periods. The key significant changes noted in 2013 were as follows:
|
|
◦
|
decrease in operating income in relation to Golar Partner's fleet and decrease in net financial expenses in respect of Golar Partner's debt and capital lease obligation, net of restricted cash;
|
|
◦
|
following the sale of the company that owns and operates the
Golar Maria
in February 2013 to Golar Partners, we recognized a gain on disposal of $65.6 million;
|
|
◦
|
included in our operating revenues is $9.3 million of management fee income from the provision of services to Golar Partners under our management and administrative services and fleet management agreements;
|
|
◦
|
Dividend income of $31.0 million in respect of our interests held in common units and general partner units (during the subordination period) and IDRs;
|
|
◦
|
Equity in net earnings of affiliates includes $36.0 million in relation to our share of the results of Golar Partners calculated with respect to our interests in its subordinated units but offset by a charge of $21.3 million for the amortization of the basis difference in relation to the $854 million gain on loss of control recognized in 2012; and
|
|
◦
|
Following the deconsolidation of Golar Partners on December 13, 2012, we recognized a gain on loss of control of $854.0 million in 2012.
|
52
|
•
|
Additional operating costs of $13.2 million and $3.4 million in 2013 and 2012, respectively, in connection with the increase in our crewing pool in anticipation of the delivery of our newbuilds;
|
|
•
|
The reactivation of both the
Hilli
and the
Golar Gandria
in April 2012 and the
Gimi
in September 2011 following their time in lay-up. We incurred mobilization costs of approximately $9.9 million in 2012 and $7.5 million in 2011;
|
|
•
|
Acquisition of the remaining 50% equity interest in
Golar Gandria
in January 2012 which resulted in a gain of $4.1 million net of acquisition-related costs of $0.2 million;
|
|
•
|
Commencement of our LNG trading business in 2010 through our subsidiary Golar Commodities which contributed to losses of $0.4 million, $1.6 million and $13.1 million to our net income in 2013, 2012 and 2011, respectively;
|
|
•
|
Bank loan and other financing arrangements we entered into or terminated. This included the entry into the $1.125 billion financing agreement in July 2013 relating to financing for eight of our newbuilding, which resulted in the recognition of $4.4 million commitment fees in 2013;
|
|
•
|
Interest costs of $22.5 million, $12.1 million and $5.5 million capitalized in 2013, 2012 and 2011, respectively in relation to newbuilds under construction and the FSRU retrofitting of the
NR Satu
;
|
|
•
|
The period of time our vessel, the
NR Satu
, spent in shipyard undergoing retrofitting for FSRU service. During the period of retrofitting, the vessel did not earn revenue;
|
|
•
|
Our vessels not on long-term charters are affected by commercial waiting time, including our vessels in lay-up. During 2011 and 2012, we had three vessels: the
Gimi
(August 2010 - June 2011),
Hilli
(April 2008 - April 2012) and the
Golar Gandria
(January 2012 - April 2012) which experienced periods of time in lay-up. The
Gimi
was reactivated in September 2011 while the
Hilli
and the
Golar Gandria
were reactivated in April 2012. However in 2013, these three vessels were again placed back into lay-up, the
Hilli
and the
Gandria
since April 2013 and the
Gimi
from January 2014; and
|
|
•
|
The realized and unrealized gains and losses on mark-to-market adjustment for our derivative instruments of $45.8 million, $11.0 million and $24.3 million in 2013, 2012 and 2011, respectively and the impact of hedge accounting for certain of our interest rate swap derivatives.
|
The impact of these factors is discussed in more detail below.
A. Operating Results
Year ended December 31, 2013, compared with the year ended December 31, 2012
As of December 31, 2013, we manage our business and analyze and report our results of operations on the basis of two segments: vessel operations and commodity trading. In order to provide investors with additional information we have provided analysis divided between these two segments. See Note 8 – "Segmental Information" to our audited financial statements.
For the year ended December 31, 2013, the impact of the deconsolidation of Golar Partners (effective December 13, 2012) had a material impact on our operating results and net income.
The following table presents details of our vessel operations segments consolidated revenues and expense information for each of the years ended December 31, 2013 and 2012.
Vessel Operations
Operating revenues, voyage and charter-hire expenses and average daily time charter equivalent
|
(in thousands of $)
|
2013
|
|
2012
|
|
Change
|
|
Change
|
|
|||
|
Total operating revenues
|
99,828
|
|
410,345
|
|
(310,517
|
)
|
(76
|
)%
|
|||
|
Voyage expenses
|
(14,259
|
)
|
(9,853
|
)
|
(4,406
|
)
|
45
|
%
|
|||
53
The decrease in total operating revenues of
$310.5 million
to
$99.8 million
in 2013 compared to
$410.3 million
in 2012 was primarily due to:
|
•
|
the deconsolidation of Golar Partners from December 13, 2012. In 2012, Golar Partner's fleet contributed $273.2 million to revenues prior to its deconsolidation;
|
|
•
|
$19.0 million reduction in revenues in relation to the
Golar Maria
following her disposal to Golar Partners in February 2013;
|
|
•
|
An overall decline in charter rates and lower utilization levels of our vessels trading on the spot market or in lay-up for the
Golar Viking
,
Gimi
,
Gandria
and
Hilli
. The total operating revenues generated by these vessels in 2013 were $87.6 million compared to $113.7 million in 2012. The
Hilli
and the
Golar
Gandria
also entered into lay-up in April 2013;
|
Partially offset by an increase in operating revenues arising from:
|
•
|
A full year of management fee income of $9.3 million in 2013 from the provision of services to Golar Partners under our management and administrative services and fleet management agreements compared to only $0.8 million in 2012 which represented approximately two weeks of income.
|
Voyage expenses largely relate to fuel costs associated with commercial waiting time and vessel positioning costs. While a vessel is on-hire, fuel costs are typically paid by the charterer, whereas during periods of commercial waiting time, fuel costs are paid by us. The increase of
$4.4 million
to
$14.3 million
in 2013 compared to
$9.9 million
in 2012 was primarily due to lower utilization of our spot vessels, the
Golar Viking
,
Gimi
,
Hilli
and the
Gandria
which resulted in 587 aggregate off-hire days in 2013 compared to 477 in 2012 for these vessels. In addition, both the
Golar Seal
and
Golar Celsius
, which were delivered in October 2013, were offhire from their delivery until the end of 2013 which further contributed to higher voyage expenses in 2013.
|
|
2013
|
|
2012
|
|
Change
|
|
Change
|
|
||||||
|
Calendar days less scheduled off-hire days
|
1,994
|
|
4,245
|
|
(2,251
|
)
|
(53
|
)%
|
||||||
|
Average daily TCE (to the closest $100)
|
$
|
38,300
|
|
$
|
94,200
|
|
$
|
(55,900
|
)
|
(59
|
)%
|
|||
The decrease of $55,900 in average daily time charter rates, or TCEs, for the year ended December 31, 2013 to $38,300 compared to $94,200 in 2012, is primarily due to the (i) deconsolidation of Golar Partners from December 13, 2012; (ii) sale of the
Golar Maria
to Golar Partners in February 2013; (iii) overall decline in charter rates and lower utilization levels of our vessels trading on the spot market or in lay-up for the
Golar Viking
,
Gimi
,
Golar
Gandria
and the
Hilli;
and (iv) the
Golar Seal
and
Golar Celsius
, which were offhire since their delivery in October 2013 until the end of 2013.
For a reconciliation of TCE, please see Item 3, "Key Information - Selected Financial Data".
Vessel Operating Expenses
|
(in thousands of $, except for average daily vessel operating costs)
|
2013
|
|
2012
|
|
Change
|
|
Change
|
|
|||
|
Vessel operating expenses
|
43,750
|
|
86,672
|
|
(42,922
|
)
|
(50
|
)%
|
|||
|
Average daily vessel operating costs
|
21,745
|
|
18,780
|
|
2,965
|
|
16
|
%
|
|||
54
Vessel operating expenses decreased by
$42.9 million
to
$43.8 million
for the year ended December 31, 2013 compared to
$86.7 million
in 2012 primarily due to:
|
•
|
The deconsolidation of Golar Partners from December 13, 2012. In 2012, Golar Partner's fleet incurred $39.0 million of vessel operating expenses prior to its deconsolidation;
|
|
•
|
Both the
Hilli
and the
Golar
Gandria
entered into lay-up in April 2013 resulting in lower operating costs. In April 2012, we recognized $9.9 million in respect of mobilization costs associated with the reactivation of both of these vessels. There were no comparable costs in 2013;
|
|
•
|
Reduced operating costs in relation to the
Golar Maria
following her sale to Golar Partners in February 2013;
|
Partially offset by an increase in vessel operating expenses arising from:
|
•
|
Higher operating costs in connection with the increase in our crewing pool in anticipation of the delivery of our newbuilds. The total operating costs in respect of our newbuild crewing pool in 2013 were $13.2 million compared to $3.4 million in 2012; and
|
|
•
|
Additional operating costs in relation to our newbuildings, the
Golar Seal
and
Golar Celsius
, of $2.2 million following their delivery in October 2013. There were no comparable costs in 2012.
|
Administrative Expenses
|
(in thousands of $)
|
2013
|
|
2012
|
|
Change
|
|
Change
|
|
|||
|
Administrative expenses
|
22,816
|
|
23,973
|
|
(1,157
|
)
|
(5
|
)%
|
|||
The decrease of
$1.2 million
in administrative expenses to
$22.8 million
in 2013 compared to
$24.0 million
in 2012 was mainly due to:
|
•
|
The deconsolidation of Golar Partners from December 13, 2012. Administrative expenses of $4.1 million were attributable to Golar Partners in 2012;
|
|
•
|
Decrease in legal and other professional fees of $1.2 million principally as a result of higher fees incurred in 2012 in relation to (i) legal fees incurred in respect of claims that we were involved in; and (ii) higher professional fees incurred in connection with the deconsolidation of Golar Partners; and
|
|
•
|
Decrease in our share option charge of $0.9 million due to a significant number of employee stock options becoming fully vested in 2012.
|
This was partially offset by an increase in project costs of $5.3 million primarily as a result of our work in developing our FLNG projects.
Depreciation and Amortization
|
(in thousands of $)
|
2013
|
|
2012
|
|
Change
|
|
Change
|
|
|||
|
Depreciation and amortization
|
36,562
|
|
85,187
|
|
(48,625
|
)
|
(57
|
)%
|
|||
Depreciation and amortization expense decreased by
$48.6 million
to
$36.6 million
in 2013 compared to
$85.2 million
in 2012 primarily due to the deconsolidation of Golar Partners from December 13, 2012. Depreciation and amortization expense of $48.4 million were attributable to Golar Partners in 2012; and (ii) lower depreciation and amortization expense on the
Golar Maria
following her disposal to Golar Partners in February 2013. This was partially offset by additional depreciation expense on the newbuildings,
Golar Seal
and
Golar Celsius
, of $2.1 million following their delivery in October 2013.
55
Impairment of long-term assets
|
(in thousands of $)
|
2013
|
|
2012
|
|
Change
|
|
Change
|
|
|||
|
Impairment of long-term assets
|
500
|
|
500
|
|
—
|
|
—
|
%
|
|||
The impairment charge of long-term assets of $0.5 million in both 2013 and 2012 refers to the unutilized parts originally ordered for the
Golar Spirit
FSRU retrofitting following changes to the original project specifications and therefore reflects a lower recoverable amount for these parts. Some of these parts were used in the retrofitting of the
NR
Satu
during 2011. As of December 31, 2013, the total carrying value of the remaining equipment is $2.5 million.
Gain on disposal of the Golar Maria (including amortization of deferred gain)
|
(in thousands of $)
|
2013
|
|
2012
|
|
Change
|
|
Change
|
|
|||
|
Gain on disposal of
Golar Maria
(including amortization of deferred gain)
|
65,619
|
|
—
|
|
65,619
|
|
100
|
%
|
|||
The gain on disposal of
Golar Maria
of
$65.6 million
for the year ended December 31, 2013 resulted from the sale of our interests in the company that owns and operates the
Golar Maria
in February 2013 to Golar Partners for a total consideration of $215.0 million, of which $127.9 million was paid in cash and the assumption of $89.5 million of the debt associated with the vessel. The total gain on disposal of the
Golar Maria
was $82.3 million however, we deferred $17.1 million which represents profit based on our holding in the subordinated units in Golar Partners measured as of the date of the dropdown. This is being released to income over the remaining useful life of the vessel or until she is sold. Please see: Note 6 - "Disposal of a subsidiary" to our consolidated financial statements.
Gain on loss of control
|
(in thousands of $)
|
2013
|
|
2012
|
|
Change
|
|
Change
|
|
|||
|
Gain on loss of control
|
—
|
|
853,996
|
|
(853,996
|
)
|
(100
|
)%
|
|||
The gain on loss of control of $854 million in 2012 was in connection with the deconsolidation of Golar Partners from December 13, 2012 as described earlier. Accordingly, as of this date, our investment in Golar Partners comprising of our interests in the common, subordinated and general partner units and IDRs were remeasured to fair value, which resulted in the recognition of a gain of $854 million being largely the difference between this and our share of the net assets of Golar Partners on such a date and the release of deferred tax benefits on intra-group transfers of long-term assets relating to the vessels, the
Golar Freeze
, the
Golar Spirit
and the
NR Satu
. Please see: Note 5 - "Deconsolidation of Golar Partners" to our consolidated financial statements.
Gain on business acquisition
|
(in thousands of $)
|
2013
|
|
2012
|
|
Change
|
|
Change
|
|
|||
|
Gain on business acquisition
|
—
|
|
4,084
|
|
(4,084
|
)
|
(100
|
)%
|
|||
The gain on business acquisition of $4.1 million in 2012 arose from the acquisition of the remaining 50% interest in Bluewater Gandria in January 2012, which owns and operates the
Golar Gandria
, which was formerly accounted for under the equity method.
Dividend income
|
(in thousands of $)
|
2013
|
|
2012
|
|
Change
|
|
Change
|
|
|||
|
Dividend income
|
30,960
|
|
—
|
|
30,960
|
|
100
|
%
|
|||
56
Following the deconsolidation of Golar Partners on December 13, 2012, we recognized dividend income of
$31.0 million
for the year ended December 31, 2013 relating to cash distributions received from Golar Partners in respect of our interests in common units and general partner interests (during the subordination period) and IDRs. Prior to the deconsolidation of Golar Partners, all cash distributions received from the Partnership were eliminated upon consolidation.
Other non-operating expenses
|
(in thousands of $)
|
2013
|
|
2012
|
|
Change
|
|
Change
|
|
|||
|
Other non-operating expenses
|
(3,355
|
)
|
(151
|
)
|
(3,204
|
)
|
2,122
|
%
|
|||
Other non-operating expense increased by
$3.2 million
to
$3.4 million
in 2013 compared to
$0.2 million
in 2012 mainly due to our indemnification under the provision of the Omnibus Agreement of certain expenses incurred by Golar Partners which amounted to $3.3 million in 2013.
Net Financial Income (expenses)
|
(in thousands of $)
|
2013
|
|
2012
|
|
Change
|
|
Change
|
|
|||
|
Interest income from capital lease restricted cash deposits
|
—
|
|
1,721
|
|
(1,721
|
)
|
(100
|
)%
|
|||
|
Interest income on high-yield bonds
|
1,972
|
|
128
|
|
1,844
|
|
1,441
|
%
|
|||
|
Interest income on short-term loan to third party
|
784
|
|
—
|
|
784
|
|
100
|
%
|
|||
|
Other interest income
|
793
|
|
970
|
|
(177
|
)
|
(18
|
)%
|
|||
|
Interest Income
|
3,549
|
|
2,819
|
|
730
|
|
26
|
%
|
|||
|
Capital lease interest expense
|
—
|
|
(5,940
|
)
|
5,940
|
|
(100
|
)%
|
|||
|
Other debt related interest expense
|
—
|
|
(25,984
|
)
|
25,984
|
|
(100
|
)%
|
|||
|
Interest Expense
|
—
|
|
(31,924
|
)
|
31,924
|
|
(100
|
)%
|
|||
|
Mark-to-market adjustment for interest rate swaps
|
56,461
|
|
1,223
|
|
55,238
|
|
4,517
|
%
|
|||
|
Interest expense on undesignated interest rate swaps
|
(10,626
|
)
|
(12,258
|
)
|
1,632
|
|
(13
|
)%
|
|||
|
Unrealized and realized gains (losses) on interest rate swaps
|
45,835
|
|
(11,035
|
)
|
56,870
|
|
(515
|
)%
|
|||
|
Net foreign currency adjustments for re-translation of lease related balances and mark-to-market adjustments for the Winter Lease related currency swap derivative
|
—
|
|
1,294
|
|
(1,294
|
)
|
(100
|
)%
|
|||
|
Mark-to-market adjustments for foreign currency derivatives (excluding the Winter Lease related currency swap derivative)
|
719
|
|
(454
|
)
|
1,173
|
|
(258
|
)%
|
|||
|
Financing arrangement fees and other costs
|
(5,632
|
)
|
(1,766
|
)
|
(3,866
|
)
|
219
|
%
|
|||
|
Other
|
(2,703
|
)
|
(1,798
|
)
|
(905
|
)
|
50
|
%
|
|||
|
Other Financial Items, net
|
38,219
|
|
(13,759
|
)
|
51,978
|
|
(378
|
)%
|
|||
Interest income increased by
$0.7 million
to
$3.5 million
in 2013 compared to
$2.8 million
in 2012 principally due to: (i) higher interest income of
$2.0 million
earned from our participation in Golar Partner's high yield bonds in 2013, representing eleven months of interest income until our disposal in November 2013 compared to
$0.1 million
in 2012 earned from the deconsolidation date; and (ii)
$0.8 million
of additional interest income earned in relation to a short-term loan provided to one of our project partners in 2013. There was no comparable income in 2012. This was partially offset by the loss of income contributed by Golar Partners prior to its deconsolidation, which amounted to $1.8 million in 2012.
Interest expense decreased by
$31.9 million
to $nil for the year ended December 31, 2013 compared to
$31.9 million
in 2012 primarily due to: (i) the deconsolidation of Golar Partners from December 13, 2012. Interest expense of $18.5 million was attributable to Golar Partners in 2012. Although, this was partially offset by $1.6 million of interest costs from the $1.125 billion newbuild facility of which a total of $256.3 million was drawn down upon delivery of the
Golar Seal
and
Golar Celsius
in October 2013. There was no comparable cost for the same period in 2012; and (ii) any interest expense we incurred in 2013 was fully offset by the effect of the capitalization of deemed interest costs in respect of our newbuilds, which increased to $22.5 million in 2013 from $10.3 million in 2012.
57
Net unrealized and realized gains (losses) on mark-to-market adjustments for interest rate swap derivatives increased by
$56.9 million
to a net gain of
$45.8 million
in 2013 compared to a net loss of
$11.0 million
in 2012. The increase in mark-to-market gains from our interest rate swap gain of $1.2 million in 2012 to $56.5 million in 2013 was due to the increase in long-term swap rates during 2013.
We hedge account for certain of our interest rate swaps. Accordingly, an additional $4.2 million gain was accounted for as a change in other comprehensive income which would have otherwise been recognized in earnings for the year ended December 31, 2013.
Unrealized foreign exchange gains and losses in respect of leases arose from the retranslation of capital lease obligations, the cash deposits securing those obligations and the movement on the currency swap used to hedge the Golar Winter lease obligation held by Golar Partners and its subsidiaries, which resulted in a net gain of $1.3 million in 2012. Following the deconsolidation of Golar Partners in December 2012, there was no comparable gain or loss in 2013.
Financing arrangement fees increased by
$3.9 million
to
$5.6 million
in 2013 compared to
$1.8 million
in 2012. This was due to higher commitment fees in respect of our $1.125 billion newbuild facility entered into in July 2013.
Other items represent, among other things, bank charges, amortization of deferred charges and debt guarantee, foreign currency differences arising on retranslation of foreign currency and gains or losses on short-term foreign currency forward contracts.
Income Taxes
|
(in thousands of $)
|
2013
|
|
2012
|
|
Change
|
|
Change
|
|
|||
|
Income taxes
|
(3,404
|
)
|
2,765
|
|
(6,169
|
)
|
(223
|
)%
|
|||
Prior to the deconsolidation of Golar Partners in December 2012, income taxes related primarily to the taxation of U.K. based vessel operating companies, our former Brazilian subsidiary established in connection with our Petrobras long-term charters and our former Indonesian subsidiary established in connection with the PTNR long-term charter of the
NR Satu
; partially offset by the amortization of the deferred gains on the intra-group transfers of long-term assets relating to five vessels. Following the deconsolidation of Golar Partners, income taxes for 2013 relate principally to the taxation of a significantly lower number of U.K. based entities; offset by the amortization of the deferred gains relating to only two vessels, such that in 2013 an income tax credit of $3.4 million was recognized.
Equity in Net Earnings (Losses) of Affiliates
|
(in thousands of $)
|
2013
|
|
2012
|
|
Change
|
|
Change
|
|
|||
|
Share of net earnings (losses) in Golar Partners
|
14,678
|
|
(735
|
)
|
15,413
|
|
(2,097
|
)%
|
|||
|
Share of net earnings in other affiliates
|
1,143
|
|
126
|
|
1,017
|
|
807
|
%
|
|||
|
15,821
|
|
(609
|
)
|
16,430
|
|
(2,698
|
)%
|
||||
Since its deconsolidation on December 13, 2012, Golar Partners has been considered to be our affiliate entity and not our controlled subsidiary. Our share of the results of Golar Partners is calculated with reference only to our interests in its subordinated units, but partially offset by a charge for the amortization of the basis difference in relation to the $854.0 million gain on loss of control recognized on deconsolidation.
Net Income
As a result of the foregoing, we recognized net income of $136.2 million in 2013, compared to
$1.0 billion
in 2012.
Net income attributable to Non-controlling Interests
Following the deconsolidation of Golar Partners from December 13, 2012, there was no comparable net income attributable to non-controlling interests in 2013.
58
LNG Trading
|
(in thousands of $)
|
2013
|
|
2012
|
|
Change
|
|
Change
|
|
||||
|
Administrative expenses
|
136
|
|
1,040
|
|
(904
|
)
|
(87
|
)%
|
||||
|
Depreciation
|
309
|
|
337
|
|
(28
|
)
|
(8
|
)%
|
||||
|
Other operating gains and losses
|
—
|
|
27
|
|
(27
|
)
|
(100
|
)%
|
||||
|
Loss of disposal of fixed assets
|
—
|
|
151
|
|
(151
|
)
|
(100
|
)%
|
||||
|
Net financial expenses
|
—
|
|
4
|
|
(4
|
)
|
(100
|
)%
|
||||
|
Net loss
|
445
|
|
1,559
|
|
(1,114
|
)
|
(71
|
)%
|
||||
The total loss for Golar Commodities for the year ended December 31, 2013 and 2012 amounted to
$0.4 million
and
$1.6 million
, respectively. Administrative expenses decreased by
$0.9 million
to
$0.1 million
for the year ended December 31, 2013 compared to
$1.0 million
in 2012. This was primarily due to our decision to continuously reduce the trading activities of Golar Commodities in response to unfavorable market conditions and other cost efficiency measures implemented by the Company.
Other operating gains and losses represent realized losses on physical cargo trades, financial derivative contracts and proprietary trades entered into. During 2013 and 2012 we did not enter into any trades. However, during the first quarter of 2014, we entered into a Purchase and Sales Agreement to buy and sell LNG cargo. The LNG cargo was acquired and subsequently sold on a delivered basis to Kuwait Petroleum Corporation to facilitate the commissioning of the
Golar Igloo
which entered in her long-term charter with KNPC in March 2014. The transaction was our first since 2011 when we scaled back our LNG trading activities but it’s now our intention to position ourself for managing and trading a number of LNG cargoes for the
Golar Igloo
during the course of her charter with KNPC.
Year ended December 31, 2012, compared with the year ended December 31, 2011
As of December 31, 2012, we manage our business and analyze and report our results of operations on the basis of two segments: vessel operations and commodity trading. In order to provide investors with additional information we have provided analysis divided between these two segments. See Note 8 – "Segmental Information" to our audited financial statements.
For the year ended December 31, 2012, except for the gain on loss of control, the impact of the deconsolidation of Golar Partners is not material to our operating results or individual line items as the deconsolidation date was effective only from December 13, 2012.
Vessel Operations
Operating revenues, voyage and charter-hire expenses and average daily time charter equivalent
|
(in thousands of $)
|
2012
|
|
2011
|
|
Change
|
|
Change
|
|
|||
|
Total operating revenues
|
410,345
|
|
299,848
|
|
110,497
|
|
37
|
%
|
|||
|
Voyage expenses
|
(9,853
|
)
|
(6,042
|
)
|
(3,811
|
)
|
63
|
%
|
|||
The increase in total operating revenues in 2012 compared to 2011 was primarily due to:
|
•
|
$37.6 million of additional revenue, representing approximately 8 months of revenues from the
NR Satu
following her successful conversion to an FSRU and the commencement of her 11-year charter with PTNR in May 2012. There were no corresponding revenues in 2011 as the
NR Satu
was principally undergoing its FSRU retrofitting.
|
|
•
|
Improved charter hire rates in 2012 compared to 2011 for our vessels, the
Golar
Viking
, the
Golar Maria
and the
Golar Arctic,
which were trading on the spot market
.
|
|
•
|
$22.3 million of additional revenues due to
Gimi
operating for the full year in 2012 compared to approximately only four months in 2011. During 2011, the
Gimi
was in lay-up until June 2011 when she entered the shipyard for her reactivation, which was completed in September 2011.
|
59
Voyage expenses largely relate to fuel costs associated with commercial waiting time and vessel positioning costs. While a vessel is on-hire, fuel costs are typically paid by the charterer, whereas during periods of commercial waiting time, fuel costs are paid by us. The increase of $3.8 million to $9.9 million in 2012 compared to $6.0 million in 2011 was primarily due to lower utilization of our spot vessels, the
Hilli
, the
Golar
Viking
and the
Golar Maria
which resulted in 300 aggregate offhire days in 2012 compared to 91 in 2011 for these vessels. In addition,
Golar Gandria
, which was acquired in January 2012, has been offhire from April 2012 following its reactivation which further contributed to higher voyage expenses in 2012.
|
|
2012
|
|
2011
|
|
Change
|
|
Change
|
|
||||||
|
Calendar days less scheduled off-hire days
|
4,245
|
|
3,352
|
|
893
|
|
27
|
%
|
||||||
|
Average daily TCE (to the closest $100)
|
$
|
94,200
|
|
$
|
87,700
|
|
$
|
6,500
|
|
7
|
%
|
|||
The increase of $6,500 in average daily time charter rates, or TCEs, for the year ended December 31, 2012 to $94,200 compared to $87,700 in 2011, is primarily due to the (i) commencement of the
NR Satu
's 11 year charter to PTNR; and (ii) improved charter-hire rates for the
Golar Maria
, the
Golar Arctic
and the
Golar Viking
.
For a reconciliation of TCE, please see Item 3, "Key Information - Selected Financial Data".
Vessel Operating Expenses
|
(in thousands of $, except for average daily vessel operating costs)
|
2012
|
|
2011
|
|
Change
|
|
Change
|
|
|||
|
Vessel operating expenses
|
86,672
|
|
62,872
|
|
23,800
|
|
38
|
%
|
|||
|
Average daily vessel operating costs
|
18,780
|
|
14,354
|
|
4,426
|
|
31
|
%
|
|||
Vessel operating expenses increased by $23.8 million to $86.7 million for the year ended December 31, 2012 compared to $62.9 million in 2011 primarily due to:
|
•
|
Re-activation of both the
Hilli
and the
Golar
Gandria
in April 2012
.
We recognized $9.9 million in 2012 in respect of mobilization costs associated with the reactivation of both of these vessels, compared to $7.5 million in 2011 which related to the reactivation of the
Gimi
. In addition, we incurred operating costs from their reactivation date, whereas in 2011, there were no comparable costs as both vessels were in lay-up. We only commenced consolidation of the results of the
Golar
Gandria
following her acquisition in January 2012;
|
|
•
|
Increased operating costs for the
NR Satu
following her successful FSRU retrofitting in April 2012 as compared to 2011 when she was primarily undergoing her FSRU retrofitting;
|
|
•
|
Higher operating costs in connection with the increase in our crewing pool in anticipation of the delivery of our newbuilds; and
|
|
•
|
Higher spares purchases during the maintenance window on the
Golar Winter
and the
Golar Spirit
in 2012.
|
Administrative Expenses
|
(in thousands of $)
|
2012
|
|
2011
|
|
Change
|
|
Change
|
|
|||
|
Administrative expenses
|
23,973
|
|
26,988
|
|
(3,015
|
)
|
(11
|
)%
|
|||
60
The decrease of $3 million in administrative expenses to $24.0 million in 2012 compared to $27.0 million in 2011 was mainly due to:
|
•
|
Decrease in salaries and benefits of $2.3 million which was mainly the result of lower social security contributions arising from the exercise of a lower volume of share options during 2012; and
|
|
•
|
Decrease in legal and other professional fees of $1.1 million principally as a result of higher fees incurred in 2011 in relation to (i) the termination of intragroup financing arrangements; and (ii) the delisting of Golar Energy from Oslo Axess.
|
This was partially offset by an increase in project costs of $0.5 million primarily as a result of our work in developing our FLNGV project.
Depreciation and Amortization
|
(in thousands of $)
|
2012
|
|
2011
|
|
Change
|
|
Change
|
|
|||
|
Depreciation and amortization
|
85,187
|
|
69,814
|
|
15,373
|
|
22
|
%
|
|||
Depreciation and amortization expense increased by $15.4 million to $85.2 million in 2012 compared to $69.8 million in 2011 primarily due to (i) the commencement of depreciation for the FSRU retrofitting expenditures relating to the
NR Satu
following the completion of her retrofitting in April 2012; (ii) a full year's depreciation of reactivation costs capitalized in relation to the
Gimi
compared to approximately four months in 2011; (iii) depreciation of the
Golar Gandria
following her acquisition in January 2012; and (iv) commencement of depreciation of the incremental reactivation costs capitalized in respect of the
Hilli
and the
Golar Gandria
pursuant to their reactivation in April 2012.
Impairment of long-term assets
|
(in thousands of $)
|
2012
|
|
2011
|
|
Change
|
|
Change
|
|
|||
|
Impairment of long-term assets
|
500
|
|
500
|
|
—
|
|
—
|
%
|
|||
The impairment charge of long-term assets of $0.5 million in both 2012 and 2011 refers to the unutilized parts originally ordered for the
Golar Spirit
FSRU retrofitting following changes to the original project specifications and therefore reflects a lower recoverable amount for these parts. Some of these parts were used in the retrofitting of the
NR
Satu
during 2011. As of December 31, 2012, the total carrying value of the remaining equipment is $3 million.
Gain on loss of control
|
(in thousands of $)
|
2012
|
|
2011
|
|
Change
|
|
Change
|
|
|||
|
Gain on loss of control
|
853,996
|
|
—
|
|
853,996
|
|
100
|
%
|
|||
The gain on loss of control of $854 million in 2012 was in connection with the deconsolidation of Golar Partners from December 13, 2012 as described earlier. Accordingly, as of this date, our investment in Golar Partners comprising of our interests in the common, subordinated and general partner units and IDRs were remeasured to fair value, which resulted in the recognition of a gain of $854 million being largely the difference between this and our share of the net assets of Golar Partners on such a date and the release of deferred tax benefits on intra-group transfers of long-term assets relating to the vessels, the
Golar Freeze
, the
Golar Spirit
and the
NR Satu
. Please see: Note 5 - "Deconsolidation of Golar Partners" to our consolidated financial statements.
Gain on business acquisition
|
(in thousands of $)
|
2012
|
|
2011
|
|
Change
|
|
Change
|
|
|||
|
Gain on business acquisition
|
4,084
|
|
—
|
|
4,084
|
|
100
|
%
|
|||
61
The gain on business acquisition of $4.1 million in 2012 arose from the acquisition of the remaining 50% interest in Bluewater Gandria in January 2012, which owns and operates the
Golar Gandria
, which was formerly accounted for under the equity method.
Net Financial Expenses
|
(in thousands of $)
|
2012
|
|
2011
|
|
Change
|
|
Change
|
|
|||
|
Interest income from capital lease restricted cash deposits
|
1,721
|
|
1,567
|
|
154
|
|
10
|
%
|
|||
|
Other interest income
|
1,098
|
|
190
|
|
908
|
|
478
|
%
|
|||
|
Interest Income
|
2,819
|
|
1,757
|
|
1,062
|
|
60
|
%
|
|||
|
Capital lease interest expense
|
(5,940
|
)
|
(5,866
|
)
|
(74
|
)
|
1
|
%
|
|||
|
Other debt related interest expense
|
(25,984
|
)
|
(19,419
|
)
|
(6,565
|
)
|
34
|
%
|
|||
|
Interest Expense
|
(31,924
|
)
|
(25,285
|
)
|
(6,639
|
)
|
26
|
%
|
|||
|
Mark-to-market adjustment for interest rate swap derivatives
|
1,223
|
|
(10,057
|
)
|
11,280
|
|
(112
|
)%
|
|||
|
Interest rate swap cash settlements
|
(12,258
|
)
|
(14,201
|
)
|
1,943
|
|
(14
|
)%
|
|||
|
Unrealized and realized losses on interest rate swaps
|
(11,035
|
)
|
(24,258
|
)
|
13,223
|
|
(55
|
)%
|
|||
|
Net foreign currency adjustments for re-translation of lease related balances and mark-to-market adjustments for the Winter Lease related currency swap derivative
|
1,294
|
|
(766
|
)
|
2,060
|
|
(269
|
)%
|
|||
|
Mark-to-market adjustments for foreign currency derivatives (excluding the Winter Lease related currency swap derivative)
|
(454
|
)
|
(470
|
)
|
16
|
|
(3
|
)%
|
|||
|
Financing arrangement fees and other costs
|
(1,766
|
)
|
(930
|
)
|
(836
|
)
|
90
|
%
|
|||
|
Other
|
(1,798
|
)
|
(2,641
|
)
|
843
|
|
(32
|
)%
|
|||
|
Other Financial Items, net
|
(13,759
|
)
|
(29,065
|
)
|
15,306
|
|
(53
|
)%
|
|||
Interest income increased by $1.1 million to $2.8 million in 2012 compared to $1.8 million in 2011 principally due to: (i) $0.7 million interest income due from Golar Partners earned from the deconsolidation date being the aggregate of income earned in relation to the
NR Satu
vendor financing loan facility and Golar's participation in the high yield bonds issued by Golar Partners in October 2012; and (ii) interest income of $0.3 million from our fixed deposits due to larger deposits held on short-term deposits.
Interest expense increased by $6.6 million to $31.9 million in 2012 compared to $25.3 million in 2011 primarily due to: (i) $11.4 million incurred from the Company's issuance of $250 million convertible bonds in March 2012; and (ii) $2.6 million interest costs from Golar Partner's high-yield bonds issued in October 2012. There were no comparable costs in 2011. This expense was partially offset by the effect of the capitalization of deemed interest costs, in respect of the Company's newbuilds and FSRU retrofittings, which increased to $12.1 million in 2012 from $5.5 million in 2011, thereby contributing to a reduction to interest expense by $6.6 million.
Net unrealized and realized (losses) gains on mark-to-market adjustments for interest rate swap derivatives decreased by $13.2 million to $11 million in December 31, 2012 compared to $24.3 million in 2011. The decrease in mark-to-market losses from our interest rate swap from a loss in 2011 of $10.1 million to a gain of $1.3 million in 2012, was largely due to a fairly stable long-term interest rate outlook during 2012. In contrast, the outlook during 2011 was that long-term interest rates were going to fall.
We hedge account for certain of our interest rate swaps. Accordingly, an additional $1.5 million gain was accounted for as a change in other comprehensive income which would have otherwise been recognized in earnings for the year ended December 31, 2012.
62
Unrealized foreign exchange gains and losses in respect of leases of $1.3 million arose as a result of the retranslation of our capital lease obligations, the cash deposits securing those obligations and the movement in the fair value currency swap used to hedge the
Golar Winter
lease obligation. Of this $1.3 million unrealized foreign exchange gain in 2012, an unrealized gain of $7.2 million (2011: $0.9 million unrealized loss) arose in respect of the mark-to-market valuation of the
Golar Winter
currency swap representing the movement in the fair value. This swap hedges the currency risk arising from lease rentals due in respect of the
Golar Winter
GBP lease rental obligation, by translating GBP payments into U.S. Dollar payments at a fixed GBP/USD exchange rate (i.e. Golar receives GBP and pays U.S. Dollars). The unrealized loss on retranslation of the lease obligation in respect of the
Golar Winter
lease, which this swap hedges, was $5.7 million (2011: $0.2 million unrealized gain). The above capital lease obligations and related cash deposits are held by Golar Partners and its subsidiaries. Accordingly, the above refer only to the gains/losses recognized through to the deconsolidation date of December 13, 2012.
Financing arrangement fees increased by $0.8 million to $1.8 million in 2012 compared to $0.9 million in 2011. This was due to higher commitment fees in respect of our revolving credit facility from a company related to our major shareholder, World Shipholding.
Other items represent, among other things, bank charges, the amortization of debt related expenses, foreign currency differences arising on retranslation of foreign currency and gains or losses on short term foreign currency forward contracts.
Income Taxes
|
(in thousands of $)
|
2012
|
|
2011
|
|
Change
|
|
Change
|
|
|||
|
Income taxes
|
2,765
|
|
(1,705
|
)
|
4,470
|
|
(262
|
)%
|
|||
Income taxes relate primarily to the taxation of our U.K. based vessel operating companies, our former Brazilian subsidiary established in connection with our Petrobras long-term charters and our former Indonesian subsidiary related to the ownership and management of the
NR Satu
with respect to its long-term charter with PTNR. However, the tax exposure in Indonesia is mitigated by revenue due under the charter such that taxes paid are fully recovered through the time charter rate. The increase of $4.5 million in 2012 was primarily due to $6.8 million tax expense incurred by the Indonesian subsidiary. This was partially offset by a full year's amortization of the deferred tax gains arising on the intra-group transfers of long-term assets relating to five vessels. Following the deconsolidation of Golar Partners, the deferred tax gains on the intra-group transfers of long-term assets relating to the
Golar Spirit
,
Golar Freeze
and
NR Satu
were written off as part of the gain on loss of control hence the effect of the amortization of the above will decrease going forwards as this will only relate to two vessels.
Equity in Net Earnings (losses) of Affiliates
|
(in thousands of $)
|
2012
|
|
2011
|
|
Change
|
|
Change
|
|
|||
|
Equity in net losses of Affiliates
|
(609
|
)
|
(1,900
|
)
|
1,291
|
|
(68
|
)%
|
|||
The decrease in equity in net losses of affiliates by $1.3 million to $0.6 million in 2012 compared to $1.9 million losses in 2011 was primarily due to our share of net losses and earnings from Golar Wilhelmsen, Golar Partners and ECGS. From December 13, 2012, Golar Partners is considered to be an affiliate entity and not as a controlled subsidiary of the Company.
Net Income
As a result of the foregoing, we recognized net income of $1 billion in 2012, compared to $81.4 million in 2011.
Net income attributable to Non-controlling Interests
|
(in thousands of $)
|
2012
|
|
2011
|
|
Change
|
|
Change
|
|
||||
|
Golar Mazo
|
(10,139
|
)
|
(9,863
|
)
|
(276
|
)
|
3
|
%
|
||||
|
Golar Energy
|
—
|
|
5,105
|
|
(5,105
|
)
|
(100
|
)%
|
||||
|
Golar Partners
|
(33,001
|
)
|
(16,867
|
)
|
(16,134
|
)
|
96
|
%
|
||||
|
Total Net income attributable to Non-controlling interests
|
(43,140
|
)
|
(21,625
|
)
|
(21,515
|
)
|
99
|
%
|
||||
63
Pursuant to Golar Partners' IPO in April 2011, our ownership in Golar Partners decreased to 65.4%, such that the public held a 34.6% non-controlling interest, excluding Chinese Petroleum Corporation's 40% ownership interest in the
Golar Mazo
. During 2012, Golar Partners' completed a further two follow-on public equity offerings, such that as of December 31, 2012 our ownership interest decreased to 54.1%. As discussed earlier, we have deconsolidated Golar Partners from December 13, 2012.
In mid-2011, in a series of share acquisitions, the Company re-acquired the remaining interest in Golar Energy as held by private investors, thus increasing our ownership to 100%. We delisted Golar Energy from the Oslo Axess in July 2011.
LNG Trading
|
(in thousands of $)
|
2012
|
|
2011
|
|
Change
|
|
Change
|
|
||||
|
Administrative expenses
|
1,040
|
|
6,691
|
|
(5,651
|
)
|
(84
|
)%
|
||||
|
Depreciation
|
337
|
|
472
|
|
(135
|
)
|
(29
|
)%
|
||||
|
Other operating gains and losses
|
27
|
|
5,438
|
|
(5,411
|
)
|
(100
|
)%
|
||||
|
Loss of disposal of fixed assets
|
151
|
|
—
|
|
151
|
|
(100
|
)%
|
||||
|
Net financial expenses
|
4
|
|
509
|
|
(505
|
)
|
(99
|
)%
|
||||
|
Net loss
|
1,559
|
|
13,110
|
|
(11,551
|
)
|
(88
|
)%
|
||||
The total loss for Golar Commodities for the year ended December 31, 2012 and 2011 amounted to $1.6 million and $13.1 million, respectively. Administrative expenses decreased by $5.7 million to $1.0 million for the year ended December 31, 2012 compared to the same period in 2011. This was primarily due to our decision in the third quarter of 2011 to reduce the trading activities of Golar Commodities in response to unfavorable market conditions and other cost efficiency measures implemented by the Company.
Other operating gains and losses represent realized losses on physical cargo trades, financial derivative contracts and proprietary trades entered into during the year. During 2012 we did not enter into any trades.
B. Liquidity and Capital Resources
Liquidity and cash requirements
We operate in a capital intensive industry and we have historically financed the purchase of our vessels, FSRU conversion projects and other capital expenditures through a combination of borrowings from debt transactions, leasing arrangements with commercial banks, cash generated from operations and equity capital. Our liquidity requirements relate to servicing our debt, funding our newbuilding program, funding future conversions, funding investments, including the equity portion of investments in vessels and investment in the development of our project portfolio, funding working capital, payment of dividends and maintaining cash reserves to satisfy certain of our borrowing covenants and to offset fluctuations in operating cash flows.
Our funding and treasury activities are conducted within corporate policies to maximize investment returns while maintaining appropriate liquidity for our requirements. Cash and cash equivalents are held primarily in U.S. dollars with some balances held in British Pounds, Singapore Dollars, Norwegian Kroners and Euros. We have not made use of derivative instruments other than for interest rate and currency risk management purposes.
Our short-term liquidity requirements are primarily for servicing our debt and working capital requirements. Sources of short-term liquidity include cash balances, restricted cash balances, short-term investments, available amounts under revolving credit facilities, quarterly cash distributions from Golar Partners (refer to Item 7B. Related Party Transactions - Golar Partners - Quarterly Cash Distributions, for detail) and receipts from our charters. Revenues from our time charters are generally received monthly in advance.
Given the negative short-term outlook in the LNG shipping market, which is forecast to continue for the remainder of 2014 through to its forecast recovery in 2015, we will require additional working capital for our vessels operating in the spot market depending on their employment and to a lesser extent our three vessels in lay-up pending FLNG conversion opportunities. As of the current date, we have four vessels operating on the spot market and a further nine uncommitted newbuildings due for delivery in 2014 through to 2015. During idle time we will be exposed to both the operating and fuel costs, although this is reduced for those vessels in lay-up.
64
As of December 31, 2013 and 2012, we had cash and cash equivalents including restricted cash of $148.8 million and $426.3 million, respectively. Since December 31, 2013, significant transactions impacting our cash flows include:
Receipts:
|
•
|
In February 2014, Golar Partners made a final cash distribution of $0.52 per unit in respect of the quarter ended December 31, 2013, of which we received $14.8 million in relation to our interests in the common units, subordinated units, 2% general partner interest and IDRs, held at the record date;
|
|
•
|
In March 2014, we sold our equity interests in the company that owns and operates the FSRU, Golar Igloo, to Golar Partners for the purchase price of $310 million. As consideration, Golar Partners assumed $161.3 million of bank debt in respect of the Golar Igloo, drew-down $20.0 million on the available $20 million revolving credit facility and paid us the balance of $128.7 million in cash using the proceeds of its equity offering in December 2013;
|
Payments:
|
•
|
Payments for our newbuildings are made in installments in accordance with our contracts with the shipyards. Excluding the
Golar Igloo
which was delivered in February 2014, for our ten remaining newbuilds, $1.3 billion of newbuild installments are due within the year ended December 31, 2014. Of this amount, $230.0 million has been paid as of April 25, 2014;
|
|
•
|
We made $7.7 million of scheduled debt repayments;
|
|
•
|
In March 2014, we paid a dividend of $0.45 per share to our shareholders for the quarter ended December 31, 2013. The dividend paid totalled $36.3 million; and
|
Other:
|
•
|
In February 2014, we executed a four ship sale and leaseback transaction with ICBC Financial Leasing Co. Ltd ("ICBL"). The financing structure will fund 90% of the shipyard purchase price of each vessel.
|
We believe our current financial resources that are available to us, including our existing undrawn credit facilities of $800.0 million, proceeds from the sale and leaseback new build financing arrangement of $742.4 million which will be available when the associated vessels are delivered, quarterly distributions from Golar Partners, potential sale of our vessel interests and surplus funds from our two newbuilding finance facilities will be sufficient to meet our liquidity requirements for our business, for at least the next twelve months. We have performed stress testing of our forecast cash reserves under extreme and largely theoretical scenarios, which include assumptions such as nil revenue contribution from our fleet, full operating costs and maintaining our dividend payments at current levels, and accordingly are confident of our ability to manage through the near term cash requirements.
Medium to Long-term Liquidity and Cash Requirements
Our medium and long-term liquidity requirements are primarily for funding the investments for our conversion projects and repayment of long-term debt balances. As of April 25, 2014, $1.4 billion of our newbuilding contractual commitments remain outstanding. Following the execution of both our $1.125 billion facility (eight-unit facility) in July 2013 and the four-unit ICBCL facility in February 2014, the undrawn balance on these facilities will cover our remaining newbuild commitments and indeed will provide surplus funds for use elsewhere in the business.
Sources of funding for our medium and long-term liquidity requirements include new loans, refinancing of existing arrangements, public and private debt offerings, potential sales of our interests in our vessel-owning subsidiaries operating under long-term charters, that may include the
Golar Eskimo
which is due for delivery in 2014 and will operate under a long-term time charter and sale of our holding in the common units of Golar Partners. We may also enter into financing arrangements with our related parties, such as World Shipholding (including its related companies) to provide intermediate financing for capital expenditures until longer term financing is obtained, at which time we will use all or a portion of the proceeds from the longer-term financings to repay outstanding amounts due under these arrangements. In addition, with respect to the Arctic debt facility, which matures with a balloon payment of $86 million due in January 2015, we are currently in the process of refinancing this debt and do not anticipate any issue with securing new debt finance prior to its maturity date.
65
Cash flows
The following table summarizes our cash flows from operating, investing and financing activities.
|
|
Year Ended December 31,
|
|||||||
|
|
2013
|
2012
|
2011
|
|||||
|
(in millions of )
|
|
|
||||||
|
Net cash provided by operating activities
|
67.7
|
|
233.8
|
|
116.6
|
|
||
|
Net cash used in investing activities
|
(533.1
|
)
|
(290.7
|
)
|
(298.6
|
)
|
||
|
Net cash provided by financing activities
|
166.0
|
|
414.7
|
|
84.2
|
|
||
|
Net (decrease) increase in cash and cash equivalents
|
(299.4
|
)
|
357.8
|
|
(97.8
|
)
|
||
|
Cash and cash equivalents at beginning of year
|
424.7
|
|
66.9
|
|
164.7
|
|
||
|
Cash and cash equivalents at end of year
|
125.3
|
|
424.7
|
|
66.9
|
|
||
In addition to our cash and cash equivalents noted above, as of December 31, 2013, we had restricted cash of $26.5 million relating to performance bond requirements for projects awarded to us during the year.
Net cash provided by operating activities
Cash generated from operations decreased by $166.1 million to $67.7 million in 2013 compared to $233.8 million in 2012, was primarily due to the effect of the deconsolidation of Golar Partners (effective from December 13, 2012). This resulted in a substantial decrease in our net cash generated from our operations by virtue of a loss of a sizeable portion of (Golar Partner’s) vessels, all on committed charters, no longer being reported together with our results and cash flows. This was partly mitigated by the receipt of dividends of $64.2 million in total from our various classes of equity investments in Golar Partners. Similarly our sale of the
Golar Maria
to Golar Partners in February 2013, also resulted in a decrease in her contribution to our operating cash flows 2013, in contrast to a full year in 2013. To a lesser extent, the softening LNG shipping market resulting in an overall decline in charter rates and lower utilization rates of our vessels trading on the spot market, in addition to our decision to place two vessels in lay-up in 2013 (pending conversion opportunities), also had an adverse effect on our operating cash flows in 2013.
Cash generated from operations increased by $117.2 million to $233.8 million in 2012 compared to $116.6 million in 2011, primarily due to an overall improvement in the charter hire rates of our vessels trading on the spot market. In addition, following
NR Satu's
FSRU retrofit in April 2012 and the
Gimi's
reactivation in September 2011, both vessels were on hire from May 2012 and September 2011, respectively, which further contributed to the net cash generated from operating activities. This was partially offset by the mobilization costs incurred in relation to the reactivation of the
Hilli
and the
Golar Gandria
in 2012 and the
Gimi
in 2011.
Net cash used in investing activities
Net cash used in investing activities of $533.1 million increased considerably in 2013 from $290.7 million in 2012 primarily due to:
|
•
|
higher installment payments made in respect of our newbuilds;
|
|
•
|
increase in restricted cash and short-term investments of $22.7 million due to performance bonds for certain projects awarded to us in 2013;
|
|
•
|
contributions of $5.6 million to Golar Partners to maintain our 2% general partner interest and payment of $12.4 million to acquire additional common units in connection with Golar Partners 2013 equity offerings;
|
|
•
|
granting of a short-term loan to a third party of $12.0 million, of which $2.5 million was repaid in 2013;
|
This was partially offset by:
66
|
•
|
consideration of $119.9 million received from Golar Partners in respect of the sale of
Golar Maria
in February 2013;
|
|
•
|
proceeds of $99.2 million from the partial sale of our interest in the common units of the Partnership in December 2013; and
|
|
•
|
proceeds of $34.5 million from the disposal of our high-yield bond participation in Golar Partners.
|
Net cash used in investing activities of $290.7 million in 2012 primarily due to installment payments made in respect of newbuilds and additions to vessels and equipment relating to the FSRU retrofitting of the
NR Satu
and reactivation of both the
Hilli
and the
Golar Gandria
. In addition, we acquired the remaining 50% equity interest in the Bluewater Gandria and removed the cash balances held by Golar Partners as of the deconsolidation date of December 13, 2012. These were partially offset by the repayment of the vendor financing loan of $155 million in respect of the
NR Satu
by Golar Partners at the end of December 2012.
Net cash used in investing activities of $298.6 million increased considerably in 2011 compared to 2010 primarily due to installment payments made in respect of newbuilds and additions to vessels and equipment relating to the FSRU retrofitting of the
NR Satu
.
Net cash provided by financing activities
Net cash provided by financing activities is principally generated from funds from new debt and new equity issuance offset by lease finance and debt repayments.
Net cash provided by financing activities in 2013 of $166.0 million was primarily a result of the following:
|
•
|
$256.4 million draw down in respect of our $1.125 billion facility to fund the final installment payments of the
Golar Seal
and
Golar Celsius
delivered in October 2013;
|
|
•
|
$50.0 million drawdown on our World Shipholding facility;
|
Partially offset by:
|
•
|
Payment of dividends during the year of $109.0 million;
|
|
•
|
Payment of financing costs of $22.6 million in respect of our $1.125 billion facility entered into July 2013; and
|
|
•
|
Scheduled repayments of $9.4 million on our long-term debt.
|
Net cash provided by financing activities in 2012 was $414.7 million and was primarily a result of the following:
|
•
|
Net proceeds of $317.1 million in respect of the follow-on equity public offerings of Golar Partners in 2012;
|
|
•
|
Proceeds of $442.2 million from the convertible bonds issued by the Company in March 2012 and issuance of Golar Partner's high-yield bonds issued by Golar Partners in October 2012;
|
|
•
|
Further drawdown of $200 million on the World Shipholding revolving credit facility;
|
Partially offset by:
|
•
|
Repayment of $280 million on the World Shipholding revolving credit facility;
|
|
•
|
Scheduled repayments of $45.2 million on our long-term debt; and
|
|
•
|
The payment of dividends during the year of $175.9 million. In addition to the payment of $32.1 million of dividends to non-controlling interests.
|
67
Net cash provided by financing activities in 2011 was $84.2 million and was primarily a result of: (i) net proceeds of $287.8 million arising in respect of the IPO of Golar Partners; (ii) drawdown of $80 million on the World Shipholding facility; and (iii) proceeds of $13.8 million from the exercise of share options. This was partially offset by payments of $108.1 million to increase our ownership of Golar Energy to 100%, Scheduled repayments of $105.8 million on our long-term debt and payment of dividends during the year of $65 million. In addition the payment of $12.5 million of dividends to non-controlling interests. The increase in 2011 is due to cash distributions made in respect of Golar Partners subsequent to its IPO in April 2011.
Borrowing activities
As of December 31, 2013, we had total long-term debt outstanding of $717.1 million. As of December 31, 2013, our long-term debt consisted of the following:
|
(in millions of $)
|
2013
|
|
Maturity date
|
||
|
World Shipholding revolving credit facility (a related party)
|
50.0
|
|
2015
|
||
|
Golar Arctic facility
|
91.3
|
|
2015
|
||
|
Golar Viking facility
|
86.4
|
|
2017
|
||
|
Convertible bonds
|
233.0
|
|
2017
|
||
|
$1.125 billion facility:
|
|||||
|
- Golar Seal facility
|
127.9
|
|
2018/2025*
|
||
|
- Golar Celsius facility
|
128.4
|
|
2018/2025*
|
||
|
|
717.0
|
|
|
||
* The commercial loan facility matures in 2018 with the balance maturing in 2025.
Our outstanding debt of $717.0 million as of December 31, 2013, is repayable as follows:
|
Year ending December 31,
|
||
|
(in millions of $)
|
|
|
|
2014
|
30.8
|
|
|
2015
|
162.0
|
|
|
2016
|
25.8
|
|
|
2017
|
94.6
|
|
|
2018
|
284.4
|
|
|
2019 and later
|
119.4
|
|
|
Total
|
717.0
|
|
The margins we pay under our current loan agreements are over and above LIBOR at a fixed or floating rate and currently range from 0.70% to 3.0%.
The following is a summary of our credit facilities. See Note 26 to our consolidated financial statements included herein for additional information relating to our credit facilities.
68
World Shipholding revolving credit facility (a related party)
In April 2011, we entered into a
$80 million
revolving credit facility with a company related to our major shareholder, World Shipholding. In January 2012, February 2012 and May 2012, the revolving credit facility was amended to $
145 million
, $
250 million
and $
120 million
, respectively without any further changes to the original terms of the facility. In July 2012, the facility was repaid in full with the proceeds received from the sale of the companies that own and operate the
NR Satu
to Golar Partners. In May 2013, the margin on the facility was amended from
3.5%
to
3.0%
. As of December 31, 2013, we had $
50 million
of borrowings under this facility. The facility is unsecured and bears interest at
LIBOR
plus
3.0%
together with a commitment fee of
0.75%
on any undrawn portion of the credit facility. The facility is available until September 2015, when all amounts must be repaid.
Golar Arctic facility
In January 2008, we entered into a secured loan facility for an amount of
$120 million
, for the purpose of financing the purchase of the
Golar Arctic
, which we refer to as the Golar Arctic facility. The facility bears interest at
LIBOR
plus a margin and is repayable in quarterly installments over a term of
seven
years with a final balloon payment of
$86.3 million
due in January 2015.
Golar Viking
In January 2005 we entered into a
$120 million
secured loan facility with a bank for the purpose of financing the newbuilding, the
Golar Viking
. This facility was refinanced in August 2007 for an amount of
$120 million
.
The structure of the Golar Viking facility is such that the bank loaned funds of
$120 million
to Golar, which we then re-loaned to a newly created entity of the bank, ("Investor Bank"). With the proceeds, Investor Bank then subscribed for preference shares in a Golar group company. Another Golar company issued a put option in respect of the preference shares. The effect of these transactions is that investor bank is required to pay fixed interest to us. The interest payments to us by Investor Bank are contingent upon receipt of these preference dividends. In the event these dividends are not paid, the preference dividends will accumulate until such time as there are sufficient cash proceeds to settle all outstanding arrearages. Applying ASC 810 to this arrangement, we have concluded that we are the primary beneficiary of Investor Bank and accordingly has consolidated it into our group. Accordingly, as at
December 31, 2013
, the Consolidated Balance Sheet and Consolidated Statement of Operations includes Investor Bank's net assets of $
nil
and net income of $
nil
, respectively, due to elimination on consolidation, of accounts and transactions arising between us and the Investor Bank.
The Golar Viking facility accrues floating interest at a rate of
LIBOR
plus a margin. The loan has a term of
10 years
and is repayable in quarterly installments with a final balloon payment of
$71.0 million
due in August 2017. The loan is secured by a mortgage on this vessel.
Convertible Bonds
In March 2012, we completed a private placement offering for convertible bonds, for gross proceeds of
$250.0 million
. Accordingly, on inception we recognized a liability of $
221.9 million
and an equity portion of $
25.0 million
. The liability component is recorded at its present value (discounted using an equivalent borrowing rate which does not include the conversion option) and the accretion from its initial discounted value to par. The equity component is valued as the residual of par less the liability value. The impact of this treatment over the life of the instrument is to increase the interest charge to a "normalized" interest rate as the discount on the liability unwinds over the period to settlement. The secured convertible bonds mature in March 2017 when the holder may convert the bonds into our common shares or redeem at
100%
of the principal amount. The convertible bonds have an annual coupon rate of
3.75%
which is payable quarterly in arrears and have a conversion price of
$55
. We declared dividends of
$1.35
and $1.60 for the year ended December 31, 2013 and 2012, respectively. The conversion price was adjusted from
$52.29
to
$50.28
effective on December 4, 2013.
We have a right to redeem the bonds at par plus accrued interest, provided that 90% or more of the bonds issued shall have been redeemed or converted to shares. Accordingly, if the bonds were converted,
4,972,155
shares would be issued if the bonds were converted at the conversion price of
$50.28
as at December 31, 2013.
The bond may be converted to our ordinary shares by the holders at any time starting on the forty first business day of the issuance until the tenth business day prior to March 7, 2017.
69
$1.125 billion facility
In July 2013, we entered into a
$1.125
billion facility to fund eight of our newbuildings. The facility bears interest at LIBOR plus a margin. The facility is divided into three tranches, with the following general terms:
|
Tranche
|
Amount
|
Proportion of facility
|
Term of loan from date of drawdown
|
Repayment terms
|
|
K-Sure
|
$449 million
|
40%
|
12 years
|
Six-monthly installments
|
|
KEXIM
|
$450 million
|
40%
|
12 years
|
Six-monthly installments
|
|
Commercial
|
$226 million
|
20%
|
5 years
|
Six-monthly installments, unpaid balance to be refinanced after 5 years
|
The K-Sure Tranche, is funded by a consortium of lenders of which 95% is guaranteed by a Korean Trade Insurance Corporation (or K-Sure) policy; the KEXIM tranche is funded by the Export Import Bank of Korea (or KEXIM). Repayments under the K-Sure and KEXIM tranches are due semi-annually with a 12 year repayment profile. The commercial tranche is funded by a syndicate of banks and is for a term of five years from date of drawdown with a final balloon payment of $131.0 million depending on drawdown dates of certain vessels. In the event the commercial tranche is not refinanced prior to the end of the five years, KEXIM has an option to demand repayment of the balance outstanding under the KEXIM tranche.
The facility is further divided into vessel-specific tranches dependent upon delivery and drawdown with each borrower being the subsidiary owning the respective vessel. Upon delivery of a newbuild, we have the ability to drawdown on the facility. On drawdown, the vessel will become secured against the facility. We drew down a total of
$256.3 million
in connection with the delivery of the
Golar Seal
and the
Golar Celsius
in October 2013. Accordingly, as of December 31, 2013, the remaining balance available to drawdown is $868.7 million in respect of the remaining six newbuilds yet to be delivered. A commitment fee is chargeable on any undrawn portion of this facility.
ICBC Finance Leasing Arrangement
We executed a four ship sale and leaseback transaction with ICBL Finance Leasing Co. Ltd ("ICBCL"). The financing structure will fund 90% of the shipyard purchase price of each vessel. This agreement was executed in February 2014.
Debt restrictions
Certain of our debt are collateralized by ship mortgages and, in the case of some debt, pledges of shares by each guarantor subsidiary. The existing financing agreements impose operating and financing restrictions which may significantly limit or prohibit, among other things, our ability to incur additional indebtedness, create liens, sell capital shares of subsidiaries, make certain investments, engage in mergers and acquisitions, purchase and sell vessels, enter into time or consecutive voyage charters or pay dividends without the consent of the Lenders. In addition, Lenders may accelerate the maturity of indebtedness under financing agreements and foreclose upon the collateral securing the indebtedness upon the occurrence of certain events of default, including a failure to comply with any of the covenants contained in the financing agreements. Various debt agreements of the Company contain certain covenants, which require compliance with certain financial ratios. Such ratios include equity ratio covenants and minimum free cash restrictions. With regards to cash restrictions, Golar has covenanted to retain at least
$25 million
of cash and cash equivalents on a consolidated group basis. In addition, there are cross default provisions in most of our and Golar Partners loan and lease agreements.
In April 2013, Golar Partners received waivers relating to the requirement under the Golar LNG Partners credit facility and the Golar Freeze facility relating to change of control over the Partnership. Following the grant of such waivers, in order to permanently resolve this issue, the loan facilities affected by the loss of control which contained the change of control provisions were amended in June 2013. Golar Partners is now in compliance with all covenants and expect to remain so for the foreseeable future.
In addition to mortgage security, some of our debt is also collaterized through pledges of equity shares by our guarantor subsidiaries.
70
Derivatives
We use financial instruments to reduce the risk associated with fluctuations in interest rates and foreign currency exchange rates. We have a portfolio of interest rate swaps that exchange or swap floating rate interest to fixed rates, which from a financial perspective, hedges our obligations to make payments based on floating interest rates. We have also entered into derivative instruments for trading purposes, in order to manage our exposure to the risk of movements in the price of natural gas and LNG and for speculative purposes within our LNG trading subsidiary.
As of December 31, 2013, we have interest rate swaps with a notional amount of $1.6 billion representing approximately 228% of our total debt. While we are currently over-hedged, this will normalize as we further drawdown on our $1.125 billion facility. This hedging level also takes into account $60.0 million swaps maturing between June and December 2014. Our swap agreements have expiration dates between 2014 and 2015 and have fixed rates of between 3.57% and 4.52%.
The majority of our gross earnings are receivable in U.S. dollars. The majority of our transactions, assets and liabilities are denominated in U.S. dollars, our functional currency. However, we also incur a small portion of expenditure in other currencies. We are affected by foreign currency fluctuations primarily through expenditure in respect of our ships drydocking, some operating expenses including the effect of paying the majority of our seafaring officers in Euros and the administrative costs of our U.K. office. The currencies which impact us the most include, but are not limited to, Euros, Norwegian Kroner, Singaporean Dollars and, to a lesser extent, Sterling.
In October 2012, Golar Partners issued NOK 1,300 million senior unsecured bonds of which NOK 200 million was purchased by Golar. In order to hedge our exposure, we entered into a currency swap that converts our NOK bonds to USD at a fixed rate. The swap hedges the full amount of the NOK bonds. In November 2013, we sold our participation in Golar Partners high yield bond, accordingly, the currency swap was terminated in January 2014.
Capital Commitments
Newbuilding contracts
As of April 25, 2014, we have newbuilding commitments for the construction of eight LNG carriers and two FSRUs for a total cost of $2.1 billion with expected deliveries between 2014 and 2015. The following table sets out as at December 31, 2013 and April 25, 2014, the estimated timing of the remaining commitments under our present newbuilding contracts. Actual dates for the payment of installments may vary due to progress of the construction.
|
(in millions of $)
|
April 25, 2014
|
|
December 31, 2013
|
|
|
|
2014
|
1,265.7
|
|
1,495.4
|
|
|
|
2015
|
152.2
|
|
152.2
|
|
|
|
|
1,417.9
|
|
1,647.6
|
|
|
Critical Accounting Estimates
The preparation of our Company's
financial statements in accordance with U.S. GAAP requires that management make estimates and assumptions affecting the reported amounts of assets and liabilities and disclosure of contingent assets and liabilities at the date of the financial statements and the reported amounts of revenues and expenses during the reporting period. The following is a discussion of the accounting policies applied by us that are considered to involve a higher degree of judgment in their application. See Note 2 "Summary of Significant Accounting Policies" to our consolidated financial statements.
Revenue Recognition
Our revenues include minimum lease payments under time charters, fees for repositioning vessels as well as the reimbursement of certain vessel operating and drydocking costs. We record revenues generated from time charters, which we classify as operating leases, over the term of the charter as service is provided. However, the Company does not recognize revenue if a charter has not been contractually committed to by a customer and the Company, even if the vessel has discharged its cargo and is sailing to the anticipated load port on its next voyage.
71
We recognize the reimbursement for drydocking costs evenly over the period to the next drydocking, which is generally between two to five years. We recognize repositioning fees (which are included in time charter revenue) received in respect of time charters at the end of the charter when the fee becomes fixed and determinable. However, where there is a fixed amount specified in the charter, which is not dependent upon redelivery location, we will recognize the fee evenly over the term of the charter. Where a vessel undertakes multiple single voyage time charters, revenue is recognized, including the repositioning fee if fixed and determinable, on a discharge-to-discharge basis. Under this basis, revenue is recognized evenly over the period from departure of the vessel from its last discharge port to departure from the next discharge port. For arrangements where operating costs are borne by the charterer on a pass through basis, the pass through of operating costs is reflected in revenue and expenses.
Revenues generated from management fees are recorded rateably over the term of the contract as services are provided.
Vessels and Impairment
Our vessels are reviewed for impairment whenever events or changes in circumstances indicate that the carrying amount may not be recoverable. In assessing the recoverability of our vessels' carrying amounts, we must make assumptions regarding estimated future cash flows and estimates in respect of residual or scrap value. Factors we consider important which could affect recoverability and trigger impairment include significant underperformance relative to expected operating results and significant negative industry or economic trends.
During 2013, we considered the softening in the LNG shipping market and the current operating losses of our vessels while in lay-up as potential indicators of impairment of those three vessels. However, as previously noted, although the
Gimi
,
Hilli
and the
Gandria
are currently in lay-up as these vessels have been earmarked for conversion into Floating Liquefied Natural Gas vessels ("FLNGVs"). In performing the fair value exercise, we determined that the highest and best use of the vessels is that they are used, in conjunction with the intellectual property from the FLNGV FEED (Front End Engineering Design) study, within FLNGV projects. As such, we determined the asset grouping to be the vessel plus access to the Company’s feasibility study. Accordingly, the fair values of these vessels were determined using cash flow projections based on assumptions that these vessels would be converted and operated as FLNGVs by a market participant.
The key assumptions are that a market participant would consider FLNGV conversion to be the highest and best use of the vessels and FEED study and that there is a high likelihood that these conversions will occur with associated financing being obtained for the significant capital investment required. Other assumptions within the cash flow projections relate to pricing and volume, operating costs, levels future of capital investment with the associated financing and the discount rate applied. We based our assumptions on external market data wherever possible. Other assumptions are based upon recent feasibility studies and project forecasts based upon our understanding of the future FLNGV economics. Our assessment concluded that no impairment of these vessels existed as at December 31, 2013 as the fair values of these vessels were substantially higher than their carrying values. No costs have been capitalised in relation to the FEED study.
A change to the assumption around the use of the vessels in FLNGV projects could result in a potential impairment. However, the substantial headroom would not be eroded by any reasonable change in underlying assumptions in the FLNGV cash flow projections.
In 2013, 2012 and 2011 impairment charges of $0.5 million, $0.5 million and $0.5 million, respectively, were recognized in respect of parts ordered for the FSRU conversion project that were not required for the retrofitting of the
Golar Spirit
. As of December 31, 2013, the carrying value of these was $2.5 million.
Vessel Market Values
In "Vessels and Impairment," we discuss our policy for assessing impairment of the carrying values of our vessels. During the past few years, the market values of certain vessels in the worldwide fleet have experienced particular volatility, with substantial declines in many vessel classes. There is a future risk that the sale value of certain of our vessels could decline below those vessels' carrying value, even though we would not impair those vessels' carrying value under our accounting impairment policy, due to our belief that future undiscounted and discounted cash flows expected to be earned by such vessels over their operating lives would exceed such vessels' carrying amounts.
With respect to ascertaining the fair market value of our owned vessels, we believe that the LNG carrier, FSRU markets and FLNGVs are illiquid, difficult to observe and therefore judgmental. Our valuation approach is to make an estimate of future net cash flows, with particular respect to cash flows derived from pre-existing contracts with counterparties from our vessels on long term charters. The principal assumptions we have used in this regard are:
72
|
•
|
Cash flows are assumed to be in line with pre-existing contracts and are utilized based on historical performance levels;
|
|
•
|
For our LNG carriers, once the initial contract period expires, we have estimated cash flows at the lower of our estimated current long-term charter rate or option renewal rate with the existing counterparty; where offhire, we have considered estimated future utilization levels based on historical knowledge;
|
|
•
|
We have used a discount rate applied to future cash flows equivalent to our estimated incremental borrowing rate, assuming 10 year interest rate swap rates plus a market risk premium;
|
|
•
|
We have made certain assumptions in relation to the scrap values of our vessels at the end of their useful lives; and
|
|
•
|
For our LNG carriers that are currently in lay-up but earmarked for conversion to FLNGVs, we have based our estimates upon the results of our feasibility study and projects, according to our understanding of the future FLNGV economics, which include assumptions such as pricing and volume, operating cost levels of future capital investment.
|
While we intend to hold and operate our vessels, were we to hold them for sale, we do not believe that the fair market value of any of our owned vessels would be lower than their respective historical book values presented as of December 31, 2013. Our estimates of fair market values assume that we would sell each of our owned vessels in the current environment, on industry standard terms, in cash transactions, and to a willing buyer where we are not under any compulsion to sell, and where the buyer is not under any compulsion to buy. For purposes of this calculation, we have assumed that each owned vessel would be sold at a price that reflects our estimate of its current fair market value. Our estimates of fair market values assume that our vessels are all in good and seaworthy condition without need for repair and if inspected would be certified in class without notations of any kind. As we obtain information from various sources of objective data and internal assumptions, our estimates of fair market value are inherently uncertain. In addition, vessel values are highly volatile; as such, our estimates may not be indicative of the current or future fair market value of our vessels or prices that we could achieve if we were to sell them.
Depreciation and Amortization
The cost of the vessels less estimated residual value is depreciated on a straight-line basis over the vessels' estimated remaining economic useful lives. The economic life of LNG carriers worldwide has generally been estimated to be 40 years, which is consistent with the estimated economic useful life of our vessels of 40 years. The estimated life of our vessels takes into account design life, commercial considerations and regulatory restrictions based on our fleet's historical performance. We amortize our deferred drydocking costs over two to five years on a straight-line basis based on each vessel's next anticipated drydocking.
If the estimated economic life or estimated residual value of a particular vessel is incorrect, or circumstances change and the estimated economic life or/ residual value have to be revised, an impairment loss could result in future periods. We monitor the carrying values of our vessels and revise the estimated useful lives and residual values of any vessels where appropriate.
Reactivation costs
Vessel reactivation costs incurred on vessels leaving lay-up include both costs of a capital and expense nature. The capital costs include the addition of new equipment or modifications to the vessel which enhance or increase the operational efficiency and functionality of the vessel. These expenditures are capitalized and depreciated over the remaining useful life of the vessel. Expenditures of a routine repairs and maintenance nature, that do not improve the operating efficiency or extend the useful lives of the vessels are expensed as incurred as mobilization costs.
Investment in Golar Partners and gain on loss of control
Pursuant to the deconsolidation of Golar Partners from December 13, 2012, we recognized a gain on loss of control of $854 million in our statement of operations and recorded $900.9 million as the aggregate of the fair value of our investments in Golar Partners as of this date, which represented our general partner interest including the IDRs ($191.2 million), our interests in the common units ($347.0 million) and subordinated units ($362.8 million). See Note 5 to our consolidated financial statements for further detail. The fair value of our equity interests held in Golar Partners, were determined as follows:
|
•
|
The common units were determined by reference to the quoted market price;
|
|
•
|
The subordinated units were based on the quoted market price of the listed common units but discounted principally for their non-tradability and reflect the subordinated dividend and liquidation rights during the subordination period;
|
73
|
•
|
The general partner units were based on the quoted market price of the listed common units but discounted for the non-tradability through to March 2021; and
|
|
•
|
The fair value of the IDRs was determined using a Monte Carlo simulation method. This simulation was performed within the Black Scholes option pricing model then solved via an iterative process by applying the Newton-Raphson method for the fair value of the IDRs, such that the price of a unit output by the Monte Carlo simulation equalled the price observed by the market. The method took into the account the historical volatility, share price of the common units as well as the dividend yield as at the deconsolidation date.
|
In connection with the deconsolidation of Golar Partners we allocated the excess between the fair value and the underlying book value of Golar Partner's net assets ("basis difference") across the Partnership's identifiable tangible and intangible assets and liabilities, with the residual assigned to goodwill. It was identified that the basis difference related primarily to the vessel, the charters and goodwill. The share of the basis difference relating to those units which are accounted for under the equity method (the subordinated units in the subordination period) is required to be amortized through the statement of operations as part of the equity accounting. This portion of the basis difference as it relates to each of Golar Partner's vessels and charters is amortized on a straight-line basis over the remaining useful economic life of the related vessel or the term of the charter, respectively, and recorded as an expense within the line "Equity in net earnings of affiliates". The allocation of the basis difference requires management to make significant estimates and assumptions, including estimates of future cash flows expected to be generated from Golar Partner's vessels and charters.
Accordingly, if our estimates of the fair value of our investments held in Golar Partners as of the deconsolidation date are incorrect, this could result in a material adjustment to the amount of the gain on loss of control recognized as of the deconsolidation date. Furthermore, this could also have a material impact on our share of the basis difference and thus the amortization expense to be applied against “equity in net earnings of affiliates” in our share of earnings with respect to Golar Partners on a prospective basis.
Time Charters
We account for time charters of vessels to our customers as operating leases and record the customers' lease payments as time charter revenues. We evaluate each contract to determine whether or not the time charter should be treated as an operating or capital lease, which involves estimates about our vessels' remaining economic useful lives, the fair value of our vessels, the likelihood of a lessee renewal or extension, incremental borrowing rates and other factors.
Our estimate of the remaining economic useful lives of our vessels is based on the common life expectancy applied to similar vessels in the FSRU and LNG shipping industries. The fair value of our vessels is derived from our estimate of expected present value, and is also benchmarked against open market values considering the point of view of a potential buyer. The likelihood of a lessee renewal or extension is based on current and projected demand and prices for similar vessels, which is based on our knowledge of trends in the industry, historic experience with customers in addition to knowledge of our customers' requirements. The incremental borrowing rate we use to discount expected lease payments and time charter revenues are based on the rates at the time of entering into the agreement.
A change in our estimates might impact the evaluation of our time charters, and require that we classify our time charters as capital leases, which would include recording an asset similar to a loan receivable and removing the vessel from our balance sheet. The lease payments to us would reflect a declining revenue stream to take into account our interest carrying costs, which would impact the timing of our revenue stream.
74
Pension Benefits
The determination of our defined benefit pension obligations and expense for pension benefits is dependent on our selection of certain assumptions used by actuaries in calculating such amounts. Those assumptions are described in Note 28 to our consolidated financial statements included in this annual report and include, among others, the discount rate, expected long-term rate of return on plan assets and rates of increase in compensation. In accordance with U.S. GAAP, actual results that differ from our assumptions are accumulated and amortized over future periods and therefore, generally affect our recognized expense and recorded obligation in such future periods. We are guided in selecting our assumptions by our independent actuaries and, while we believe that our assumptions are appropriate, significant differences in our actual experience or significant changes in our assumptions may materially affect our pension obligations and our future pension expense.
Valuation of Derivative Financial Instruments
Our risk management policies permit the use of derivative financial instruments to manage foreign currency fluctuation and interest rate. Changes in fair value of derivative financial instruments that are not designated as cash flow hedges for accounting purposes are recognized in earnings in the consolidated statement of income (loss). Changes in fair value of derivative financial instruments that are designated as cash flow hedges for accounting purposes are recorded in other comprehensive income (loss) and are reclassified to earnings in the consolidated statement of income (loss) when the hedged transaction is reflected in earnings. Ineffective portions of the hedges are recognized in earnings as they occur. During the life of the hedge, we formally assess whether each derivative designated as a hedging instrument continues to be highly effective in offsetting changes in the fair value or cash flows of hedged items. If it is determined that a hedge has ceased to be highly effective, we will discontinue hedge accounting prospectively.
The fair value of our derivative financial instruments is the estimated amount that we would receive or pay to terminate the agreements in an arm's length transaction under normal business conditions at the reporting date, taking into account current interest rates and foreign exchange rates, and estimates of the current credit worthiness of both us and the swap counterparty. Inputs used to determine the fair value of our derivative instruments are observable either directly or indirectly in active markets. The process of determining credit worthiness is highly subjective and requires significant judgment at many points during the analysis.
If our estimates of fair value are inaccurate, this could result in a material adjustment to the carrying amount of the derivative asset or liability and consequently the change in fair value for the applicable period that would have been recognized in earnings or comprehensive income.
Recently Issued Accounting Standards
In December 2011, the Financial Accounting Standards Board ("FASB") amended guidance on disclosures about offsetting assets and liabilities. The amendments require an entity to disclose information about offsetting and related arrangements to enable users of its financial statements to understand the effect of those arrangements on its financial position. The amendments will enhance disclosures required by U.S. GAAP by requiring improved information about financial instruments and derivative instruments that are either offset or subject to an enforceable master netting arrangement or similar agreement, irrespective of whether they are offset in accordance with U.S. GAAP. This information will enable users of an entity's financial statements to evaluate the effect or potential effect of netting arrangements on an entity's financial position, including the effect or potential effect of netting arrangements on an entity's financial position, including the effect or potential effect of rights of set-off associated with certain financial instruments and derivative instruments in the scope of this update. The amendments were required for annual reporting periods beginning on or after January 1, 2013, and interim periods within those annual periods. An entity should provide the disclosures required by those amendments retrospectively for all comparative periods presented. The amendment resulted in additional disclosures in the Company's consolidated financial statements included herein.
In July 2012, the FASB amended disclosure requirements relating to testing indefinite-lived intangible assets for impairment. The amendments no longer require entities to disclose the quantitative information about significant unobservable inputs used in fair value measurements categorized within Level 3 of the fair value hierarchy that relate to the financial accounting and reporting for an indefinite-lived intangible asset after its initial recognition. The amendment is effective for annual and interim impairment tests performed for fiscal years beginning after September 15, 2012. Early adoption is permitted. The amendment did not have a material impact on the Company’s consolidated financial statements.
In October 2012, the FASB amended several disclosure requirements of the FASB Accounting Standards Codification relating to investments, consolidation, accounting changes and error corrections, inventory, retirement benefits for defined benefit
75
plans, financial instruments and balance sheet. The amendments are effective for fiscal periods beginning after December 15, 2012. The amendment did not have a material impact on the Company’s consolidated financial statements.
In February 2013, further guidance was provided relating to the reporting of the effects on net income of significant amounts reclassified out of each component of accumulated other comprehensive income. Under the updated guidance, the effects on net income of significant amounts reclassified out of each component of accumulated other comprehensive income shall be shown, in one location, either on the face of the statement where net income is presented or as a separate disclosure in the notes to the financial statements. The amendment resulted in additional disclosures in the Company's consolidated financial statements included herein.
In July 2013, the FASB amended Accounting Standards Codification (ASC) Topic 815 permitting the Fed Funds Effective Swap Rate to be used as a U.S. benchmark interest rate for hedge accounting purposes, in addition to U.S. Treasury interest rates and the London Interbank Offered Rate. The amendments also remove the restriction on using different benchmark rates for similar hedges. The amendments shall be applied prospectively for qualifying new or redesignated hedging relationships entered into on or after July 17, 2013. The Company did not enter into any qualifying new or redesignated hedging relationships after July 17, 2013 up to the date of these consolidated financial statements and the adoption of this guidance did not have a material effect in the Company's consolidated financial statements.
New accounting standards not yet adopted
In February 2013, the FASB issued guidance for the recognition, measurement and disclosure of obligations resulting from joint and several liability arrangements for which the total amount of the obligation is fixed at the reporting date, including debt arrangements, other contractual obligations and settled litigation and judicial rulings. The guidance requires an entity to measure obligations resulting from joint and several liability arrangements for which the total amount of the obligation within the scope of this guidance is fixed at the reporting date, as the sum of (a) the amount the reporting entity agreed to pay on the basis of its arrangement among its co-obligors and (b) any additional amount the reporting entity expects to pay on behalf of its co-obligors. The guidance also requires an entity to disclose the nature and amount of the obligation as well as other information about those obligations. The amendments are effective for fiscal years, and interim periods within those years, beginning after December 15, 2013. The Company is evaluating the impact of the adoption of this amended guidance in the financial statements.
In July 2013, the FASB issued guidance for the presentation of an unrecognized tax benefit when a net operating loss carryforward, a similar tax loss, or a tax credit carryforward exists to provide guidance on the presentation of unrecognized tax benefits. The guidance
requires an entity to present an unrecognized tax benefit, or a portion of an unrecognized tax benefit, in the financial statements as a reduction to a deferred tax asset for a net operating loss carryforward, a similar tax loss, or a tax credit carryforward, to the extent a net operating loss carryforward, a similar tax loss, or a tax credit carryforward is not available at the reporting date under the tax law of the applicable jurisdiction to settle any additional income taxes that would result from the disallowance of a tax position or the tax law of the applicable jurisdiction does not require the entity to use, and the entity does not intend to use, the deferred tax asset for such purpose, the unrecognized tax benefit should be presented in the financial statements as a liability and should not be combined with deferred tax assets. The amendments are effective for fiscal years, and interim periods within those years, beginning after December 15, 2013. The Company is evaluating the impact of the adoption of this amended guidance in the financial statements.
C. Research and Development, Patents and Licenses
Not Applicable.
D. Trend Information
Please see the section of this item entitled "Market Overview and Trends."
E.
Off-Balance Sheet Arrangements
We are also committed to make rental payments under operating leases for office premises under operating leases. The future minimum rental payments under our non-cancellable operating leases for office premises are disclosed below in the tabular disclosure of contractual obligations.
76
F. Contractual Obligations
The following table sets forth our contractual obligations for the periods indicated as at December 31, 2013:
|
(in millions of $)
|
Total
Obligation
|
|
Due in 2014
|
|
Due in 2015 – 2016
|
|
Due in 2017 – 2018
|
|
Due Thereafter
|
|
||||
|
Long-Term Debt
|
717.0
|
|
30.8
|
|
187.8
|
|
379.0
|
|
119.4
|
|
||||
|
Interest commitments on long-term debt - floating and other interest rate swaps (1) (2)
|
249.6
|
|
59.9
|
|
98.5
|
|
52.7
|
|
38.5
|
|
||||
|
Operating Lease Obligations
|
1.8
|
|
0.4
|
|
0.8
|
|
0.6
|
|
—
|
|
||||
|
Purchase Obligations:
|
|
|
|
|
|
|
|
|
|
|
||||
|
Newbuildings (3)
|
1,647.6
|
|
1,495.4
|
|
152.2
|
|
—
|
|
—
|
|
||||
|
Egyptian Venture (4)
|
—
|
|
—
|
|
—
|
|
—
|
|
—
|
|
||||
|
Other Long-Term Liabilities (5)
|
—
|
|
—
|
|
—
|
|
—
|
|
—
|
|
||||
|
Total
|
2,616.0
|
|
1,586.5
|
|
439.3
|
|
432.3
|
|
157.9
|
|
||||
|
(1)
|
As of December 31, 2013, we are over-hedged as the notional value of our interest rate swap arrangements is greater than the principal of our debt obligation. However, we expect this level to normalize as we further drawdown on our $1.125 billion facility in connection with our newbuildings.
|
|
(2)
|
Our interest commitment on our long-term debt is calculated based on an assumed average USD LIBOR of 1.78% and taking into account our various margin rates and interest rate swaps associated with each debt.
|
|
(3)
|
The construction of our remaining ten newbuildings. The total contract cost for these vessels was approximately $2.1 billion of which, as of December 31, 2013, $1.6 billion remains with $1.5 billion payable in 2014 and $0.1 billion in 2015.
|
|
(4)
|
As at December 31, 2013, we had a commitment to pay $1.0 million to an unrelated third party, contingent upon the conclusion of a material commercial business transaction by ECGS as consideration for work performed in connection with the setting up and incorporation of ECGS. This liability has been excluded from the above table, as the timing of any cash payment is uncertain.
|
|
(5)
|
Our Consolidated Balance Sheet as of December 31, 2013, includes $84.3 million classified as "Other long-term liabilities" of which $35.6 million represents liabilities under our pension plans and $18.7 million represents other guarantees provided to Golar Partners. These liabilities have been excluded from the above table as the timing and/or the amount of any cash payment is uncertain. See Note 27 to our consolidated financial statements for additional information regarding our other long-term liabilities.
|
For details of the Company's outstanding legal proceedings and claims, please see: Note 35 – "Other Commitments and Contingencies" to our consolidated financial statements.
G. Safe harbor
Forward-looking information discussed in this Item 5 includes assumptions, expectations, projections, intentions and beliefs about future events. These statements are intended as "forward-looking statements." We caution that assumptions, expectations, projections, intentions and beliefs about future events may and often do vary from actual results and the differences can be material. Please see "Cautionary Statement Regarding Forward-Looking Statements" in this report.
A. Directors and Senior Management
Directors
The following provides information about each of our directors and secretary as o
f April 25, 2014.
|
Name
|
Age
|
Position
|
||
|
John Fredriksen
|
69
|
Chairman of our board of directors, President and Director
|
||
|
Kate Blankenship
|
49
|
Director and Audit Committee member
|
||
|
Tor Olav Trøim
|
51
|
Director
|
||
|
Hans Petter Aas
|
68
|
Director and Audit Committee member
|
||
|
Georgina Sousa
|
64
|
Director and Company Secretary
|
||
John Fredriksen
has served as the Chairman of our board of directors, President and a director of the Company since our inception in May 2001. He has been the Chief Executive Officer, Chairman of our board of directors, President and a director of Frontline Ltd since 1997. Frontline is a Bermuda based tanker owner and operator listed on the New York Stock Exchange (NYSE), the London Stock Exchange (LSE) and the Oslo Stock Exchange (OSE). He has been a director of Golden Ocean Group Limited, a Bermuda company listed on the Oslo Stock Exchange, since November 2004 and has also served as a director and the Chairman of Seadrill Limited, a Bermuda company listed on the Oslo Stock Exchange and recently NYSE, since May 2005.
Kate Blankenship
has served as a director since July 2003 and was Company Secretary from our inception in 2001 until November 2005. She served as our Chief Accounting Officer from May 2001 until May 31, 2003. Ms. Blankenship has also been a director of Frontline Limited (or Frontline) since August 2003 and served as Chief Accounting Officer and Secretary of Frontline from 1994 until October 2005. Ms. Blankenship has served as a director of Ship Finance International Limited since July 2003, Seadrill Limited since May 2005, Golden Ocean Group Limited since November 2004, Archer Limited since August 2007, Golar LNG Partners LP since September 2007, Seadrill Partners LLC since June 2012 and Avance Gas Holding Ltd since October 2013. She is a member of the Institute of Chartered Accountants in England and Wales.
Tor Olav Trøim
has served as a director of the Company since September, 2011, having previously served as a director and vice-president of the Company from its incorporation in May 2001 until October 2009, after which time he served as a director and Chairman of the Company's listed subsidiary, Golar LNG Energy Limited. Mr. Trøim graduated as M.Sc Naval Architect from the University of Trondheim, Norway in 1985. He was formerly an Equity Portfolio Manager with Storebrand ASA (1987-1990), and Chief Executive Officer for the Norwegian Oil Company DNO AS (1992-1995). Since 1995 Mr. Troim has been a director of Seatankers Management in Cyprus. Mr. Troim serves as a director of and Chairman of ITCL, a director of Seadrill Limited, Golden Ocean Group Limited, Golden State Petro (IOM I-A) Plc, Archer Limited, Golar LNG Partners LP, Seadrill Partners LLC and as an alternate director of Frontline Ltd.
Hans Petter Aas
has served as a director since September 2008. Mr. Aas has had a long career as a banker in the international shipping and offshore market, and retired from his position as Global Head of the Shipping, Offshore and Logistics Division of DnB NOR in August 2008. He joined DnB NOR (then Bergen Bank) in 1989, and has previously worked for the Petroleum Division of the Norwegian Ministry of Industry and the Ministry of Energy, as well as for Vesta Insurance and Nevi Finance. Mr. Aas is also a director and Chairman of Ship Finance and Knutsen Offshore Tanker Co ASA and has recently become a director of the Norwegian Export Credit Guarantee Institute.
Georgina E. Sousa
was appointed as director of the Company in April 2013 and has served as Secretary of the Company and its subsidiaries since November 30, 2005. She is also Head of Corporate Administration for Frontline. Up until January 2007, she was Vice-President-Corporate Services of Consolidated Services Limited, a Bermuda Management Company having joined the firm in 1993 as Manager of Corporate Administration. From 1976 to 1982 she was employed by the Bermuda law firm of Appleby, Spurling & Kempe as a Company Secretary and from 1982 to 1993 she was employed by the Bermuda law firm of Cox & Wilkinson as Senior Company Secretary.
77
Executive Officers
The following provides information about each of our executive officers as of April 26, 2013.
|
Name
|
Age
|
Position
|
||
|
Doug Arnell
|
48
|
Chief Executive Officer – Golar Management
|
||
|
Oistein Dahl
|
53
|
Chief Operating Officer and Managing Director of Golar Wilhelmsen Management (GWM)
|
||
|
Brian Tienzo
|
40
|
Chief Financial Officer – Golar Management
|
||
|
Hugo Skar
|
46
|
Chief Technical Officer - Golar Management
|
||
Doug Arnell
joined Golar Management as Chief Commercial Officer & Deputy Chief Executive Officer in September 2010 and became Chief Executive Officer of Golar Management in February 2011. He previously worked for BG Group since 2003 in leadership roles in the areas of LNG, downstream natural gas marketing and upstream exploration and development. Prior to that, he held positions of Managing Director for El Paso's European natural gas division and Senior Business Development Director for Enron International's LNG business. In total, Doug has worked in the global natural gas industry for over 22 years.
Oistein Dahl
is our Chief Operating Officer and Managing Director of Golar Wilhelmsen Management (GWM). GWM is Golar's own technical management company and is a joint venture (owned 60% by Golar) with Wilhelmsen Ship Management. Mr. Dahl started in Golar in September 2011. He previously worked for Höegh Fleet, where he was President for four years. He has served in Höegh for several years and has had several positions within vessel management, newbuilding and projects, as well as business development. Mr. Dahl has also worked within offshore engineering and with the Norwegian Class Society DNV. Mr. Dahl has a MSc degree from the NTNU technical university in Trondheim.
Brian Tienzo
has served as the Chief Financial Officer of Golar Management since June 2011. He previously served as the Group Financial Controller of Golar Management since 2008 having joined Golar Management in February 2001 as the Group Management Accountant. From 1995 to 2001 he worked for Z-Cards Europe Limited, Parliamentary Communications Limited and Interoute Communications Limited in various financial management positions. He is a member of the Association of Certified Chartered Accountants. Mr. Tienzo also serves as the Principal Accounting Officer for Golar LNG Partners LP since April 2011.
Hugo Skår
has served as Vice President, Project Management for Golar Management since 2004 and became CTO in 2009. Mr. Skår has been responsible for the successful FSRU conversion projects. Mr. Skår has an MSc degree in Naval Architecture. He worked 9 years in Bergesen (Newbuilding & Project Division) and has an extensive experience from newbuilding supervision and VLCC conversions to FPSO (Floating Production Storage Offshore). From 2001 to 2004, he served as Site Manager and Project Manager for the construction of Bergesen's new LNG carriers.
B. Compensation
For the year ended December 31, 2013, we paid to our directors and executive officers aggregate cash compensation of $1.7 million and an aggregate amount of $0.1 million for pension and retirement benefits. For a description of our stock option plan please refer to the section of this item entitled "Option Plan" below.
In addition to cash compensation, during 2013 we also recognized an expense of $0.5 million relating to stock options issued to certain of our directors and employees.
C. Board Practices
Our directors do not have service contracts and do not receive any benefits upon termination of their directorships. Our Board of directors established an audit committee in July 2005, which is responsible for overseeing the quality and integrity of our financial statements and its accounting, auditing and financial reporting practices, our compliance with legal and regulatory requirements, the independent auditor's qualifications, independence and performance and our internal audit function. Our audit committee consists of two members, Kate Blankenship and Hans Petter Aas who are both Company Directors. Except for an audit committee the Board does not have any other committees.
As a foreign private issuer we are exempt from certain requirements of the Nasdaq Global Select Market that are applicable to U.S. listed companies. Please see the section of this annual report entitled Item 16G. "Corporate Governance" for a discussion of how our corporate governance practices differ from those required of U.S. companies listed on the Nasdaq Global Select Market.
78
D. Employees
As of December 31, 2013, we employed approximately 26 people in our offices in London and Oslo. We contract with independent ship managers to manage, operate and to provide crew for our vessels. We also employ approximately 323 seagoing employees, all of whom are employed through our independent ship managers.
E. Share ownership
The table below shows the number
and percentage of common shares beneficially owned and of our issued and outstanding common shares for our directors and officers as of April 25, 2014. Als
o shown are their interests in share options awarded to them under our various share option schemes. The subscription price for options granted under the schemes will normally be reduced by the amount of all dividends declared by us in the period from the date of grant until the date the option is exercised.
|
Director or Officer
|
Beneficial Interest in
Common Shares of
$1.00 each
|
Interest in Options
|
|
|||||||||||
|
|
Number of shares
|
%
|
|
Total
number of
options
|
Exercise price
|
Expiry date
|
||||||||
|
John Fredriksen (2)
|
(2
|
)
|
(2
|
)
|
8,251
|
|
$
|
8.78
|
|
2014
|
||||
|
|
|
|
2,750
|
|
$
|
4.78
|
|
2015
|
||||||
|
Kate Blankenship
|
(1
|
)
|
(1
|
)
|
17,500
|
|
$
|
5.52
|
|
2016
|
||||
|
|
|
|
8,251
|
|
$
|
8.78
|
|
2014
|
||||||
|
|
|
|
2,750
|
|
$
|
4.78
|
|
2015
|
||||||
|
Tor Olav Trøim (3)
|
(1
|
)
|
(1
|
)
|
8,251
|
|
$
|
8.78
|
|
2014
|
||||
|
|
|
|
2,750
|
|
$
|
4.78
|
|
2015
|
||||||
|
Hans Petter Aas
|
(1
|
)
|
(1
|
)
|
25,000
|
|
$
|
5.77
|
|
2014
|
||||
|
Doug Arnell
|
—
|
|
—
|
|
123,762
|
|
$
|
4.78
|
|
2015
|
||||
|
Brian Tienzo
|
—
|
|
—
|
|
20,297
|
|
$
|
8.78
|
|
2014
|
||||
|
—
|
|
—
|
|
6,766
|
|
$
|
4.78
|
|
2015
|
|||||
|
Oistein Dahl
|
—
|
|
—
|
|
25,000
|
|
$
|
27.75
|
|
2016
|
||||
|
Hugo Skar
|
—
|
|
—
|
|
5,458
|
|
$
|
4.78
|
|
2015
|
||||
(1) Less than 1 %
(2) World Shipholding Ltd., a Liberian holding company, and other related companies which are collectively referred to herein as World Shipholding, the shares of which are held in trusts established by Mr. John Fredriksen for the benefit of certain members of his family. Mr. Fredriksen disclaims beneficial ownership of the 36,755,080 shares of our common stock held by World Shipholding, except to the extent of his voting and dispositive interest in such shares of common stock. Mr. Fredriksen has no pecuniary interest in the shares held by World Shipholding.
(3) In addition to the holdings of shares and options contained in the table above, as of April 25, 2014, T
or Olav Troim, is party to separate Total Return Swaps ("TRS") agreements relating to 375,000 of our common shares.
Our directors and executive officers have the same voting rights as all other holders of our Common Shares.
Option Plans
Our board of directors adopted the Golar LNG Ltd's Employee Share Option Plan ("Golar LNG Plan") in February 2002. The Plan authorizes our Board to award, at its discretion, options to purchase our common shares to employees of the Company, who are contracted to work more than 20 hours per week and to any director of the Company.
79
In August 2009 the board of directors of Golar Energy adopted the Golar Energy share option plan ("Energy Plan") with similar terms to the Company's share option plan. In June 2011, in connection with the delisting of Golar Energy, previously granted options in Golar Energy were cancelled and concurrently replaced with new options in Golar.
Under the terms of these plans, the Boards may determine the exercise price of the options, provided that the exercise price per share is not lower than the then current market value. Options that have not lapsed will become immediately exercisable at the earlier of the vesting date, the option holder's death or change of control of the Company. All options will expire on the tenth anniversary of the option's grant or at such earlier date as the board may from time to time prescribe. The Plan will expire 10 years from their date of adoption.
As of December 31, 2013, 7.1 million of the authorized and unissued common shares were reserved for issue pursuant to subscription under options granted under the Company's share option plans. For further detail on share options please see : Note 31 – "Share Capital and Share Options" to our consolidated financial statements.
The exercise price of options, granted in 2006 and later, are reduced by the value of dividends paid, on a per share basis. Accordingly, the above figures show the reduced exercise price a
s of April 25, 2014.
A. Major shareholders
The following table presents certain information as of March 31, 2014 regarding the beneficial ownership of our common shares with respect to each shareholder that we know to beneficially own more than 5% of our issued and outstanding common shares.
|
|
Common Shares
|
|||||
|
Owner
|
Number
|
Percent
|
||||
|
World Shipholding (1)
|
36,755,080
|
|
45.6
|
%
|
||
|
Steinberg Asset Management, LLC (2)
|
5,043,412
|
|
6.3
|
%
|
||
(1) For further information regarding World Shipholding, see "Item 6. Directors, Senior Management and Employees-E. Share Ownership."
(2) Information derived from the Schedule 13G/A of Steinberg Asset Management, LLC filed with the Commission on February 14, 2014.
Our major shareholders have the same voting rights as all of our other common shareholders. No corporation or foreign government owns more than 50% of issued and outstanding common shares. We are not aware of any arrangements, the operation of which may at a subsequent date result in a change in control of the Company.
B. Related party transactions
There are no provisions in our Memorandum of Association or Bye-Laws regarding related party transactions. However, our management's policy is to enter into related party transactions solely on terms that are at least equivalent to terms we would be able to obtain from unrelated third parties. The Bermuda Companies Act of 1981 provides that a company, or one of its subsidiaries, may enter into a contract with an officer of the company, or an entity in which an officer has a material interest, if the officer notifies the directors of their interest in the contract or proposed contract. The related party transactions that we have entered into during the year ended December 31, 2013 are discussed below.
80
Transactions with Golar Partners and subsidiaries:
Net revenues from related parties:
|
(in thousands of $)
|
2013
|
|
||
|
Transactions with Golar Partners and subsidiaries:
|
|
|
||
|
Management and administrative services fees income (i)
|
2,569
|
|
||
|
Ship management fees income (ii)
|
6,701
|
|
||
|
Interest income on high-yield bonds (iii)
|
1,972
|
|
||
|
Total
|
11,242
|
|
||
Receivables (payables):
|
(in thousands of $)
|
2013
|
|
||
|
Trading balances due from Golar Partners and affiliates (iv)
|
5,989
|
|
||
|
Methane Princess Lease security deposits movements (v)
|
(4,257
|
)
|
||
(i)
Management and administrative services agreement -
On March 30, 2011, Golar Partners entered into a management and administrative services agreement with Golar Management, a wholly-owned subsidiary of Golar, pursuant to which Golar Management will provide to Golar Partners certain management and administrative services. The services provided by Golar Management are charged at cost plus a management fee equal to 5% of Golar Management’s costs and expenses incurred in connection with providing these services. Golar Partners may terminate the agreement by providing
120 days
written notice.
(ii)
Ship management fees
- Golar and certain of its affiliates charged ship management fees to Golar Partners for the provision of technical and commercial management of the vessels. Each of Golar Partners’ vessels is subject to management agreements pursuant to which certain commercial and technical management services are provided by certain affiliates of Golar, including Golar Management and Golar Wilhelmsen, a partnership that is jointly controlled by Golar and by Wilhelmsen Ship Management (Norway) AS.
(iii)
High-yield bonds
- In October 2012, Golar Partners completed the issuance of NOK1,300 million in senior unsecured bonds that mature in October 2017. Of this amount, NOK 200 million, approximately
$35 million
, was issued to us. We sold our participation on the high-yield bond in November 2013.
(iv)
Trading balances -
Receivables and payables with Golar Partners and its subsidiaries are comprised primarily of unpaid management fees, advisory and administrative services. In addition, certain receivables and payables arise when the Company pays an invoice on behalf of a related party and vice versa. Receivables and payables are generally settled quarterly in arrears. Trading balances due from Golar Partners and its subsidiaries are unsecured, interest-free and intended to be settled in the ordinary course of business. They primarily relate to recharges for trading expenses paid on behalf of Golar Partners, including ship management and administrative service fees due to Golar.
(v)
Methane Princess Lease security deposit movements
- This represents net advances from Golar Partners since its IPO, which correspond with the net release of funds from the security deposits held relating to the Methane Princess Lease. This is in connection with the Methane Princess tax lease indemnity provided to Golar Partners under the Omnibus Agreement (see below). Accordingly, these amounts will be settled as part of the eventual termination of the Methane Princess Lease.
Other transactions:
a)
$20 million revolving credit facility:
On April 13, 2011, Golar Partners entered into a $20 million revolving credit facility with Golar. The facility matures in April 2015 and is unsecured and interest-free. In May 2013, Golar Partners drew down $20 million from the facility which it subsequently repaid in December 2013. As of April 25, 2014, Golar Partners has $20 million available under this facility.
81
b)
Quarterly Cash Distributions
We are entitled to distributions on our general and limited partner interests comprising of common and subordinated interests in Golar Partners. Under the Partnership Agreement, during the subordination period, the holders of the common units will have the right to receive distributions of available cash from operating surplus in an amount equal to the minimum quarterly distribution of $0.3850 per unit per quarter, plus any arrearages in the payment of minimum quarterly distribution on the common units from prior quarters, before any distributions of available cash from operating surplus may be made on the subordinated units.
In addition, we currently hold all of the incentive distribution rights, or IDRs in Golar Partners. IDRs represent the right to receive an increasing percentage of quarterly distributions of available cash from operating surplus after the minimum quarterly distribution and the target distribution levels have been achieved. In general, Golar Partners will distribute any additional available cash from operating surplus for that quarter among the unit holders and the General Partner in the following manner:
|
•
|
first
, 98.0% to all unit holders, pro rata, and 2.0% to the General Partner, until each unit holder receives a total of $0.4428 per unit for that quarter (the "first target distribution");
|
|
•
|
second
, 85.0% to all unit holders, pro rata, 2.0% to the General Partner and 13.0% to the holders of the incentive distribution rights, pro rata, until each unit holder receives a total of $0.4813 per unit for that quarter (the "second target distribution");
|
|
•
|
third
, 75.0% to all unit holders, pro rata, 2.0% to the General Partner and 23.0% to the holders of the incentive distribution rights, pro rata, until each unit holder receives a total of $0.5775 per unit for that quarter (the "third target distribution"); and
|
|
•
|
thereafter
, 50.0% to all unit holders, pro rata, 2.0% to the General Partner and 48.0% to the holders of the incentive distribution rights, pro rata.
|
In each case, the amount of the target distribution set forth above is exclusive of any distributions to common unit holders to eliminate any cumulative arrearages in payment of the minimum quarterly distribution. The percentage interests set forth above assume that the General Partner maintains its 2.0% general partner interest and that the Partnership does not issue additional classes of equity securities.
We received total distributions from Golar Partners of $63.7 million for the year ended December 31, 2013.
c)
Disposals to Golar Partners:
In February 2013, we disposed of our interest in the subsidiary which owns and operates the
Golar Maria.
Since the Partnership is no longer considered to be under the common control of Golar, this transaction was not accounted for as a transfer of equity interests under common control. Accordingly, a gain on disposal of
Golar Maria
was recognized by the Company.
Indemnifications and guarantees:
d)
Tax lease indemnifications:
Under the Omnibus Agreement, we have agreed to indemnify Golar Partners in the event of any liabilities in excess of scheduled or final settlement amounts arising from the
Methane Princess
leasing arrangement and the termination thereof.
In addition, to the extent Golar Partners incurs any liabilities as a consequence of a successful challenge by the U.K. Revenue Authorities with regard to the initial tax basis of the transactions relating to any of the U.K. tax leases or in relation to the lease restructuring terminations in 2010, we have agreed to indemnify Golar Partners.
The maximum possible amount in respect of the tax lease indemnification is unknown as the determination of this amount is dependent on the Company's intention of terminating this lease and the various market factors present at the point of termination. As of December 31, 2013, we have recognized a liability of
$11.5 million
in respect of the tax lease indemnification to Golar Partners (see note 5) representing the fair value at deconsolidation.
e)
Environmental and other indemnifications:
Under the Omnibus Agreement, we agreed to indemnify Golar Partners until April 13, 2016, against certain environmental and toxic tort liabilities with respect to the assets that we contributed or sold to Golar Partners to the extent arising prior to the time they were contributed or sold. However, claims are subject to a deductible of
$0.5 million
and an aggregate cap of
$5.0 million
.
82
In addition, pursuant to the Omnibus Agreement, we agreed to indemnify Golar Partners for any defects in title to the assets contributed or sold to Golar Partners and any failure to obtain, prior to April 13, 2011, certain consents and permits necessary to conduct Golar Partner's business, which liabilities arise within three years after the closing of its IPO on April 13, 2011.
f)
Performance guarantees:
We issued performance guarantees to third party charterers in connection with the Time Charter Party agreements entered into with the vessel operating entities who are now subsidiaries of Golar Partners. These performance guarantees relate to the
Golar Spirit
, the
Golar Freeze
, the
Methane Princess
, the
Golar Winter
and the
Golar Mazo
.
The maximum potential exposure in respect of the performance guarantees issued by us is unknown as these matters cannot be absolutely determined. The likelihood of triggering the performance guarantees is remote based on the past performance of our combined fleet.
g)
Debt guarantee:
We issued debt guarantees to third party banks in respect of certain secured debt facilities relating to Golar Partners and subsidiaries. The liability is being amortized over the remaining term of the respective debt facilities with the credit recognized in "Other financial items".
As of December 31, 2013, we guaranteed $533.5 million of Golar Partners' long-term debt and capital lease obligations, net of restricted cash. All of the facilities and lease obligations we have guaranteed are secured on specific vessels. As of December 31, 2013, these vessels have higher market values than the carrying amounts of the facilities and capital lease obligation to which the vessels are secured against.
h)
Legal claim:
In connection with the disposal of the
NR Satu
in July 2012, we agreed to indemnify Golar Partners against any losses that it may incur in relation to a possible claim of damage to the pipeline allegedly caused by Golar and its subcontractor in connection with the FSRU conversion of the
NR Satu
. Please read "Item 8. Financial Information - Consolidated Financial Statements and Other Financial Information - Legal Proceedings and Claims -
NR Satu
related claim" for further detail.
Omnibus Agreement
In connection with the IPO of Golar Partners, we entered into an Omnibus Agreement with Golar Partners governing, among other things, when we and Golar Partners may compete against each other as well as rights of first offer on certain FSRUs and LNG carriers. Under the Omnibus Agreement, Golar Partners and its subsidiaries agreed to grant a right of first offer on any proposed sale, transfer or other disposition of any vessel it may own. Likewise, we agreed to grant a similar right of first offer to Golar Partners for any vessel under a charter for five or more years, that we may own. These rights of first offer will not apply to a (a) sale, transfer or other disposition of vessels between any affiliated subsidiaries, or pursuant to the terms of any current or future charter or other agreement with a charter party or (b) merger with or into, or sale of substantially all of the assets to, an unaffiliated third-party. In addition, the Omnibus Agreement provides for certain indemnities to Golar Partners in connection with the assets transferred from us.
Net (expenses) income (due to) from other related parties (excluding Golar Partners):
|
(in thousands of $)
|
2013
|
|
|
|
Frontline Ltd. and subsidiaries ("Frontline") (i)
|
49
|
|
|
|
Seatankers Management Company Limited ("Seatankers") (i)
|
(45
|
)
|
|
|
Ship Finance AS ("Ship Finance") (i)
|
207
|
|
|
|
Golar Wilhelmsen (ii)
|
(4,899
|
)
|
|
|
World Shipholding (iii)
|
(976
|
)
|
|
83
Receivables (payables) from related parties (excluding Golar Partners):
|
(in thousands of $)
|
2013
|
|
|
|
World Shipholding Loan (iii)
|
(50,000
|
)
|
|
|
Frontline
|
(60
|
)
|
|
|
Seatankers
|
91
|
|
|
|
Ship Finance
|
2
|
|
|
|
Seadrill
|
(74
|
)
|
|
|
|
(50,041
|
)
|
|
i. We transact business with the following parties, being companies in which World Shipholding and companies associated with World Shipholding have a significant interest: Frontline, Ship Finance, Seatankers and Seadrill. Net expense/income from Frontline, Seatankers and Ship Finance comprise fees for management support, corporate and insurance administrative services, net of income from supplier rebates and income from the provision of serviced offices and facilities. Receivables and payables with related parties comprise primarily of unpaid management fees, advisory and administrative services. In addition, certain receivables and payables arise when we pay an invoice on behalf of a related party and vice versa. Receivables and payables are generally settled quarterly in arrears.
ii. As of
December 31, 2013
, we held a
60%
ownership interest in Golar Wilhelmsen, which we account for using the equity method. Golar Wilhelmsen recharges management fees in relation to provision of technical and ship management services.
iii.
World Shipholding revolving credit facility
- In April 2011, we entered into a
$80 million
revolving credit facility with a company related to our major shareholder, World Shipholding. In January, February and May of 2012, the revolving credit facility was amended to $
145 million
, $
250 million
and $
120 million
, respectively, without any further changes to the original terms of the facility. In July 2012, the facility was repaid in full with the proceeds received from the sale of the companies that own and operate the
NR Satu
to Golar Partners. In May 2013, the margin on the facility was amended from
3.5%
to
3.0%
. As of December 31, 2013, the Company had $
50 million
of borrowings under this facility. The facility is unsecured and bears interest at LIBOR plus
3.0%
together with a commitment fee of
0.75%
on any undrawn portion of the credit facility. The facility is available until September 2015.
For the year ended
December 31, 2013
, included within net expenses due to World Shipholding, are loan interest and commitment fees of
$0.8 million
.
C. Interests of Experts and Counsel
Not Applicable.
A. Consolidated Financial Statements and Other Financial Information
See Item 18.
Legal proceedings and claims
We may, from time to time, be involved in legal proceedings and claims that arise in the ordinary course of business. A provision will be recognized in the financial statements only where we believe that a liability will be probable and for which the amounts are reasonably estimable, based upon the facts known prior to the issuance of the financial statements.
NR Satu related claim
84
PT Golar Indonesia, a subsidiary of Golar Partners that is both the owner and operator of the
NR Satu,
has been notified of a claim that may be filed against it by PT Rekayasa, a subcontractor of the charterer, PT Nusantara Regas, claiming that Golar Partners and its subcontractor caused damage to the pipeline in connection with the FSRU conversion of the
NR Satu
and the related mooring. As of the current date, no suit has been filed and both we and Golar Partners are of the view that, were the claim to be filed with the Indonesian authorities, any resolution could potentially take years. We both continue to believe we have meritorious defences against these claims, however, we are currently involved in compromise settlement discussions with the other parties. An estimate of the compromise settlement amount is between $2 million and $4.8 million. Golar Partners considers it probable that any loss suffered will be recoverable from its subcontractor who is also a party to these settlement discussions.
As part of the disposal of the
NR Satu
in July 2012 by us, we have also agreed to indemnify Golar Partners against any non-recoverable losses.
Golar Viking related claim
In January 2011, Qatar Gas Trading Company Limited ("Nakilat") chartered the
Golar Viking
from us for a period of
15
months. In April 2012, the time charter party agreement was terminated early. On February 15, 2013, Nakilat formally commenced arbitration proceedings against Golar claiming damages of
$20.9 million
for breach of contract, including that of early termination of the charter. We believe that we have strong arguments to defend itself against any such claims and accordingly, as of December 31, 2013, have not recorded any provision. Given the proceedings have only commenced with the arbitration hearing timed for late 2014, it is possible that the outcome of the arbitration proceedings may result in a loss of anything up to a maximum of
$20.9 million
.
Douglas Channel LNG Assets Partnership claim
In May 2013, we provided a short-term loan of $12.0 million to Douglas Channel LNG Assets Partnership ("DCLAP") as part of the potential FLNG project in Douglas Channel, British Columbia. The General Partner of DCLAP is a company wholly owned by LNG Partner LLC ("LNGP"). The loan had a maturity date of September 30, 2013 and is secured by a general security agreement over the pipeline transportation capacity on the pipeline system that delivers natural gas to the area where the FLNG project is intended to operate. In September 2013, LNGP filed for bankruptcy. We have also since commenced legal proceedings against LNGP seeking to have a receiver appointed over the secured assets. Of the
$12.0 million
short-term loan,
$2.5 million
has been repaid to date. We believe that we have strong arguments regarding our claim and the outstanding loan is recoverable, accordingly, as of December 31, 2013, has not recorded any provision against the outstanding loan receivable.
Dividend Distribution Policy
Our long-term objective is to pay a regular dividend in support of our main objective to provide significant returns to shareholders. The level of our dividends will be guided by current earnings, market prospects, capital expenditure requirements and investment opportunities.
Any future dividends declared will be at the discretion of the board of directors and will depend upon our financial condition, earnings and other factors. Our ability to declare dividends is also regulated by Bermuda law, which prohibits us from paying dividends if, at the time of distribution, we will not be able to pay our liabilities as they fall due or the value of our assets is less than the sum of our liabilities, issued share capital and share premium.
In addition, since we are a holding company with no material assets other than the shares of our subsidiaries and affiliates through which we conduct our operations, our ability to pay dividends will depend on our subsidiaries and affiliates distributing to us their earnings and cash flow. Some of our loan agreements limit or prohibit our and our subsidiaries' and affiliates' ability to make distributions to us without the consent of our lenders.
For 2013, our board of directors declared quarterly dividends in May 2013, August 2013, November 2013 and February 2014 in the aggregate amount of $145.0 million, or $1.80 per share.
For 2012, our board of directors declared quarterly dividends in May 2012, August 2012 and November 2012 in the aggregate amount of
$128.7 million
, or $1.60 per share. The dividends declared in November 2012 represents the third quarter 2012 dividend of $0.425 plus an accelerated fourth quarter 2012 dividend of $0.425.
For 2011, our board of directors declared four quarterly dividends in June 2011, August 2011, November 2011 and March 2012 in the aggregate amount of $89.2 million, or $1.15 per share.
85
B. Significant Changes
None.
Listing Details and Markets
Our common shares have traded on the Oslo Stock Exchange, or OSE since July 12, 2001 under the symbol "GOL" and on the Nasdaq Global Select Market since December 12, 2002 under the symbol "GLNG".
In April 2012, the Board concluded there were limited benefits in continuing with two separate listings and as a result, we delisted from the Oslo Stock Exchange on August 30, 2012.
The following table sets forth, for the five most recent fiscal years from January 1, 2009 and for the period ended March 31, 2014, the high and low prices for the common shares on the OSE (until our delisting in August 2012) and the Nasdaq Global Select.
|
|
OSE
|
Nasdaq
|
|||||||||
|
High
|
Low
|
High
|
|
Low
|
|
||||||
|
First quarter 2014
|
*
|
*
|
$
|
43.94
|
|
$
|
33.35
|
|
|||
|
Fiscal years ended December 31
|
|
|
|
|
|||||||
|
2013
|
*
|
*
|
$
|
41.55
|
|
$
|
30.51
|
|
|||
|
2012
|
NOK288.90
|
NOK212.50
|
$
|
47.82
|
|
$
|
31.71
|
|
|||
|
2011
|
NOK274.00
|
NOK86.25
|
$
|
45.59
|
|
$
|
14.77
|
|
|||
|
2010
|
NOK98.50
|
NOK59.00
|
$
|
15.94
|
|
$
|
9.42
|
|
|||
|
2009
|
NOK77.75
|
NOK23.00
|
$
|
13.90
|
|
$
|
2.63
|
|
|||
* The share prices presented in the table relate only to the period from January 1, 2009 to August 30, 2012 when we delisted from the Oslo Stock Exchange.
The following table sets forth, for each full financial quarter for the two most recent fiscal years from January 1, 2012, the high and low prices of the common shares on the OSE and the Nasdaq Global Select Market.
|
|
Nasdaq
|
||||||||||
|
|
High
|
|
Low
|
|
|||||||
|
Fiscal year ended December 31, 2013
|
|
|
|
|
|||||||
|
First quarter
|
|
|
|
|
$
|
41.55
|
|
|
$
|
34.28
|
|
|
Second quarter
|
|
|
|
|
$
|
37.79
|
|
|
$
|
31.22
|
|
|
Third quarter
|
|
|
|
|
$
|
39.92
|
|
|
$
|
30.51
|
|
|
Fourth quarter
|
|
|
|
|
$
|
40.37
|
|
|
$
|
33.07
|
|
|
|
OSE*
|
Nasdaq
|
|||||||||
|
|
High
|
Low
|
High
|
|
Low
|
|
|||||
|
Fiscal year ended December 31, 2012
|
|
|
|
|
|||||||
|
First quarter
|
NOK288.90
|
NOK212.50
|
$
|
47.82
|
|
$
|
36.93
|
|
|||
|
Second quarter
|
NOK231.00
|
NOK185.80
|
$
|
40.52
|
|
$
|
31.71
|
|
|||
|
Third quarter
|
NOK248.00
|
NOK216.50
|
$
|
42.00
|
|
$
|
36.85
|
|
|||
|
Fourth quarter
|
*
|
*
|
$
|
43.56
|
|
$
|
35.64
|
|
|||
|
* The Company delisted from the Oslo Stock Exchange effective August 30, 2012.
|
|||||||||||
86
The following table sets forth, for the most recent six months, the high and low prices for our common shares on the Nasdaq Global Select Market.
|
|
Nasdaq
|
|||||||
|
High
|
|
Low
|
|
|||||
|
April 2014 (1)
|
$
|
46.70
|
|
$
|
39.93
|
|
||
|
March 2014
|
$
|
43.94
|
|
$
|
36.02
|
|
||
|
February 2014
|
$
|
37.40
|
|
$
|
33.38
|
|
||
|
January 2014
|
$
|
38.00
|
|
$
|
33.35
|
|
||
|
December 2013
|
$
|
36.71
|
|
$
|
33.07
|
|
||
|
November 2013
|
$
|
40.37
|
|
$
|
35.52
|
|
||
|
October 2013
|
$
|
38.81
|
|
$
|
34.81
|
|
||
(1) For the period from April 1, 2014 through April 25, 2014.
This section summarizes our share capital and the material provisions of our Memorandum of Association and Bye-Laws, including rights of holders of our common shares. The description is only a summary and does not describe everything that our Memorandum of Association and Bye-laws contain. The Memorandum of Association and the Bye-Laws of the Company have previously been filed as Exhibits 1.1 and 1.2, respectively to the Company's Registration Statement on Form 20-F, (File No. 000-50113) filed with the Commission on November 27, 2002, and are hereby incorporated by reference into this Annual Report.
At the 2007 Annual General Meeting of the Company, our shareholders voted to amend the Company's Bye-laws to ensure conformity with recent revisions to the Bermuda Companies Act 1981, as amended. These amended Bye-laws of the Company as adopted on September 28, 2007, were filed as Exhibit 1.2 to the Company's Annual Report on Form 20-F for the year ended December 31, 2007, (File No. 001-50113) filed with the Commission on May 12, 2008, and are hereby incorporated by reference into this Annual Report.
A. Share capital
Not Applicable.
B. Memorandum of Association and Bye-laws
The object of our business, as stated in Section Six of our Memorandum of Association, is to engage in any lawful act or activity for which companies may be organized under the Companies Act, 1981 of Bermuda, or the Companies Act, other than to issue insurance or re-insurance, to act as a technical advisor to any other enterprise or business or to carry on the business of a mutual fund. Our Memorandum of Association and Bye-laws do not impose any limitations on the ownership rights of our shareholders.
Shareholder Meetings
. Under our Bye-laws, annual shareholder meetings will be held in accordance with the Companies Act at a time and place selected by our board of directors. The quorum at any annual or general meeting is equal to one or more shareholders, either present in person or represented by proxy, holding in the aggregate shares carrying 33 1/3% of the exercisable voting rights. The meetings may be held at any place, in or outside of Bermuda that is not a jurisdiction which applies a controlled foreign company tax legislation or similar regime. Special meetings may be called at the discretion of the board of directors and at the request of shareholders holding at least one-tenth of all outstanding shares entitled to vote at a meeting. Annual shareholder meetings and special meetings must be called by not less than seven days' prior written notice specifying the place, day and time of the meeting. The board of directors may fix any date as the record date for determining those shareholders eligible to receive notice of and to vote at the meeting.
87
The Companies Act provides that a company must have a general meeting of its shareholders in each calendar year. The Companies Act does not impose any general requirements regarding the number of voting shares which must be present or represented at a general meeting in order for the business transacted at the general meeting to be valid. The Companies Act generally leaves the quorum for shareholder meetings to the company to determine in its Bye-laws. The Companies Act specifically imposes special quorum requirements where the shareholders are being asked to approve the modification of rights attaching to a particular class of shares (33.33%) or an amalgamation or merger transaction (33.33%) unless in either case the Bye-laws provide otherwise. The Company's Bye-laws do not provide for a quorum requirement other than 33.33%.
There are no limitations on the right of non-Bermudians or non-residents of Bermuda to hold or vote our common shares.
The key powers of our shareholders include the power to alter the terms of the Company's Memorandum of Association and to approve and thereby make effective any alterations to the Company's Bye-laws made by the directors. Dissenting shareholders holding 20% of the Company's shares may apply to the Court to annul or vary an alteration to the Company's Memorandum of Association. A majority vote against an alteration to the Company's Bye-laws made by the directors will prevent the alteration from becoming effective. Other key powers are to approve the alteration of the Company's capital including a reduction in share capital, to approve the removal of a director, to resolve that the Company be wound up or discontinued from Bermuda to another jurisdiction or to enter into an amalgamation or winding up. Under the Companies Act, all of the foregoing corporate actions require approval by an ordinary resolution (a simple majority of votes cast), except in the case of an amalgamation or merger transaction, which requires approval by 75% of the votes cast unless the Bye-Laws provide otherwise. The Company's Bye-laws only require an ordinary resolution to approve an amalgamation. In addition, the Company's Bye-laws confer express power on the board to reduce its issued share capital selectively with the authority of an ordinary resolution.
The Companies Act provides shareholders holding 10% of the Company's voting shares the ability to request that the board of directors shall convene a meeting of shareholders to consider any business which the shareholders wish to be discussed by the shareholders including (as noted below) the removal of any director. However, the shareholders are not permitted to pass any resolutions relating to the management of the Company's business affairs unless there is a pre-existing provision in the Company's Bye-laws which confers such rights on the shareholders. Subject to compliance with the time limits prescribed by the Companies Act, shareholders holding 20% of the voting shares (or alternatively, 100 shareholders) may also require the directors to circulate a written statement not exceeding 1000 words relating to any resolution or other matter proposed to be put before, or dealt with at, the annual general meeting of the Company.
Majority shareholders do not generally owe any duties to other shareholders to refrain from exercising all of the votes attached to their shares. There are no deadlines in the Companies Act relating to the time when votes must be exercised.
The Companies Act provides that a company shall not be bound to take notice of any trust or other interest in its shares. There is a presumption that all the rights attaching to shares are held by, and are exercisable by, the registered holder, by virtue of being registered as a member of the company. The company's relationship is with the registered holder of its shares. If the registered holder of the shares holds the shares for someone else (the beneficial owner) then if the beneficial owner is entitled to the shares, the beneficial owner may give instructions to the registered holder on how to vote the shares. The Companies Act provides that the registered holder may appoint more than one proxy to attend a shareholder meeting, and consequently where rights to shares are held in a chain, the registered holder may appoint the beneficial owner as the registered holder's proxy.
Directors.
The Companies Act provides that the directors shall be elected or appointed by the shareholders. A director may be elected by a simple majority vote of shareholders, at a meeting where shareholders holding not less than 33.33% of the voting shares are present in person or by proxy. A person holding 50% or more of the voting shares of the Company will be able to elect all of the directors, and to prevent the election of any person whom such shareholder does not wish to be elected. There are no provisions for cumulative voting in the Companies Act or the Bye-laws and the Company's Bye-laws do not contain any super-majority voting requirements. The appointment and removal of directors is covered by Bye-laws 86, 87 and 88.
There are procedures for the removal of one or more of the directors by the shareholders before the expiration of his term of office. Shareholders holding 10% or more of the voting shares of the Company may require the board of directors to convene a shareholder meeting to consider a resolution for the removal of a director. At least 14 days’ written notice of a resolution to remove a director must be given to the director affected, and that director must be permitted to speak at the shareholder meeting at which the resolution for his removal is considered by the shareholders.
88
The Companies Act stipulates that an undischarged bankruptcy of a director (in any country) shall prohibit that director from acting as a director, directly or indirectly, and taking part in or being concerned with the management of a company, except with leave of the court. The Company's Bye-Law 89 is more restrictive in that it stipulates that the office of a Director shall be vacated upon the happening of any of the following events (in addition to the Director's resignation or removal from office by the shareholders):
|
•
|
If he becomes of unsound mind or a patient for any purpose of any statute or applicable law relating to mental health and the Board resolves that he shall be removed from office;
|
|
•
|
If he becomes bankrupt or compounds with his creditors;
|
|
•
|
If he is prohibited by law from being a Director; or
|
|
•
|
If he ceases to be a Director by virtue of the Companies Act.
|
Under the Company's Bye-laws, the minimum number of directors comprising the board of directors at any time shall be two. The board of directors currently consists of five directors. The minimum and maximum number of directors comprising the board of directors from time to time shall be determined by way of an ordinary resolution of the shareholders of the Company. The shareholders may, at the annual general meeting by ordinary resolution, determine that one or more vacancies in the board of directors be deemed casual vacancies. The board of directors, so long as a quorum remains in office, shall have the power to fill such casual vacancies. Each director will hold office until the next annual general meeting or until his successor is appointed or elected. The shareholders may call a Special General Meeting for the purpose of removing a director, provided notice is served upon the concerned director 14 days prior to the meeting and he is entitled to be heard. Any vacancy created by such a removal may be filled at the meeting by the election of another person by the shareholders or in the absence of such election, by the board of directors.
Subject to the provisions of the Companies Act, a director of a company may, notwithstanding his office, be a party to or be otherwise interested in any transaction or arrangement with that company, and may act as director, officer, or employee of any party to a transaction in which the company is interested. Under our Bye-Law 92, provided an interested director declares the nature of his or her interest immediately or thereafter at a meeting of the board of directors, or by writing to the directors as required by the Companies Act, a director shall not by reason of his office be held accountable for any benefit derived from any outside office or employment. The vote of an interested director, provided he or she has complied with the provisions of the Companies Act and our Bye-Laws with regard to disclosure of his or her interest, shall be counted for purposes of determining the existence of a quorum.
The Company’s Bye-law 94 provides the board of directors the authority to exercise all of the powers of the Company to borrow money and to mortgage or charge all or any part of our property and assets as collateral security for any debt, liability or obligation. The Company’s directors are not required to retire because of their age, and the directors are not required to be holders of the Company’s common shares. Directors serve for one year terms, and shall serve until re-elected or until their successors are appointed at the next annual general meeting. The Company’s Bye-laws provide that no director, alternate director, officer or member of a committee, if any, resident representative, or his heirs, executors or administrators, whom we refer to collectively as an indemnitee, is liable for the acts, receipts, neglects or defaults of any other such person or any person involved in our formation, or for any loss or expense incurred by us through the insufficiency or deficiency of title to any property acquired by us, or for the insufficiency or deficiency of any security in or upon which any of our monies shall be invested, or for any loss or damage arising from the bankruptcy, insolvency, or tortuous act of any person with whom any monies, securities, or effects shall be deposited, or for any loss occasioned by any error of judgment, omission, default, or oversight on his part, or for any other loss, damage or misfortune whatever which shall happen in relation to the execution of his duties, or supposed duties, to us or otherwise in relation thereto. Each indemnitee will be indemnified and held harmless out of our funds to the fullest extent permitted by Bermuda law against all liabilities, loss, damage or expense (including but not limited to liabilities under contract, tort and statute or any applicable foreign law or regulation and all reasonable legal and other costs and expenses properly payable) incurred or suffered by him as such director, alternate director, officer, committee member or resident representative (or in his reasonable belief that he is acting as any of the above). In addition, each indemnitee shall be indemnified against all liabilities incurred in defending any proceedings, whether civil or criminal, in which judgment is given in such indemnitee’s favour, or in which he is acquitted or in connection with any application under the Companies Act in which relief from liability is granted to him by the court. The Company is authorized to purchase insurance to cover any liability it may incur under the indemnification provisions of its Bye-laws. The indemnity provisions are covered by Bye-laws 138 through 146.
Dividends.
Holders of common shares are entitled to receive dividend and distribution payments, pro rata based on the number of common shares held, when, as and if declared by the board of directors, in its sole discretion. Any future dividends declared will be at the discretion of the board of directors and will depend upon our financial condition, earnings and other factors.
89
As a Bermuda exempted company, we are subject to Bermuda law relating to the payment of dividends. We may not pay any dividends if, at the time the dividend is declared or at the time the dividend is paid, there are reasonable grounds for believing that, after giving effect to that payment;
|
•
|
we will not be able to pay our liabilities as they fall due; or
|
|
•
|
the realizable value of our assets is less than our liabilities.
|
In addition, since we are a holding company with no material assets, and conduct our operations through subsidiaries and our affiliates, our ability to pay any dividends to shareholders will depend on our subsidiaries' and affiliates distributing to us their earnings and cash flow. Some of our loan agreements currently limit or prohibit our subsidiaries' ability to make distributions to us and our ability to make distributions to our shareholders.
Share repurchases and preemptive rights
. Subject to certain balance sheet restrictions, the Companies Act permits a company to purchase its own shares if it is able to do so without becoming cash flow insolvent as a result. The restrictions are that the par value of the share must be charged against the company's issued share capital account or a company fund which is available for dividend or distribution or be paid for out of the proceeds of a fresh issue of shares. Any premium paid on the repurchase of shares must be charged to the company's current share premium account or charged to a company fund which is available for dividend or distribution. The Companies Act does not impose any requirement that the directors shall make a general offer to all shareholders to purchase their shares
pro rata
to their respective shareholdings. The Company's Bye-Laws do not contain any specific rules regarding the procedures to be followed by the Company when purchasing its own shares, and consequently the primary source of the Company's obligations to shareholders when the Company tenders for its shares will be the rules of the listing exchanges on which the Company's shares are listed. The Company’s power to purchase its own shares is covered by Bye-laws 9, 10 and 11.
The Companies Act does not confer any rights of pre-emption on shareholders when a company issues further shares, and no such rights of pre-emption are implied as a matter of common law. The Company's Bye-Laws do not confer any rights of pre-emption. Bye-Law 8 specifically provides that the issuance of more shares ranking
pari passu
with the shares in issue shall not constitute a variation of class rights, unless the rights attached to shares in issue state that the issuance of further shares shall constitute a variation of class rights. Bye-Law 12 confers on the directors the right to dispose of any number of unissued shares forming part of the authorized share capital of the Company without any requirement for shareholder approval. The Company’s power to issue shares is covered by Bye-laws 12, 13, 14, and 15.
Liquidation.
In the event of our liquidation, dissolution or winding up, the holders of common shares are entitled to share in our assets, if any, remaining after the payment of all of our debts and liabilities, subject to any liquidation preference on any outstanding preference shares.
90
C. Material contracts
The following is a summary of each material contract, other than material contracts entered into in the ordinary course of business, to which we or any of our subsidiaries is a party, for the two years immediately preceding the date of this Annual Report, each of which is included in the list of exhibits in Item 19:
|
1.
|
Purchase, Sale and Contribution Agreement, dated January 30, 2013, by and between Golar LNG Partners LP, Golar Partners Operating LLC and Golar LNG Ltd., providing for, among other things, the sale of the
Golar Maria.
|
|
2.
|
Bond Agreement dated March 5, 2012 between Golar LNG Ltd and Norsk Tillitsmann ASA as bond trustee.
|
|
3.
|
Facility Agreement between Golar Hull M2021 Corp, Golar Hull M2026 Corp, Golar Hull M2031 Corp, Golar Hull M2022 Corp, Golar Hull M2023 Corp, Golar Hull M2027 Corp, Golar Hull M2024 Corp, Golar LNG NB 12 Corporation, and a consortium of banks for a $1.125 billion facility, dated July 24, 2013.
|
D. Exchange Controls
The Bermuda Monetary Authority, or the BMA, must give permission for all issuances and transfers of securities of a Bermuda exempted company like us, unless the proposed transaction is exempted by the BMA's written general permissions. We have received a general permission from the BMA to issue any unissued common shares, and for the free transferability of the common shares as long as our common shares are listed on the Nasdaq or Oslo Bors. Our common shares may therefore be freely transferred among persons who are residents or non-residents of Bermuda.
Although we are incorporated in Bermuda, we are classified as non-resident of Bermuda for exchange control purposes by the BMA. Other than transferring Bermuda Dollars out of Bermuda, there are no restrictions on our ability to transfer funds into or out of Bermuda to pay dividends to U.S. residents who are holders of our common shares or other non-resident holders of our common shares in currency other than Bermuda Dollars.
E. Taxation
The following is a discussion of the material U.S. federal income tax, Bermuda tax and Liberian tax considerations relevant to a U.S. Holder, as defined below, of our common stock. This discussion does not purport to deal with the tax consequences of owning our common stock to all categories of investors, some of which, such as financial institutions, regulated investment companies, real estate investment trusts, tax-exempt organizations, insurance companies, persons holding our common stock as part of a hedging, integrated, conversion or constructive sale transaction or a straddle, traders in securities that have elected the mark-to-market method of accounting for their securities, persons liable for alternative minimum tax, persons who are investors in partners or other pass-through entities for U.S. federal income tax purposes, dealers in securities or currencies, U.S. Holders whose functional currency is not the U.S. dollar and investors that own, actually or under applicable constructive ownership rules, 10% or more of our shares of common stock, may be subject to special rules. This discussion deals only with holders who hold the shares of our common stock as a capital asset. You are encouraged to consult your own tax advisors concerning the overall tax consequences arising in your own particular situation under U.S. federal, state, local or foreign law of the ownership of our common stock.
Taxation of Operating Income
U.S. Taxation of our Company
Shipping income that is attributable to transportation that begins or ends, but that does not both begin and end, in the United States will be considered to be 50% derived from sources within the United States. Shipping income attributable to transportation that both begins and ends in the United States will be considered to be 100% derived from sources within the United States. We are not permitted by law to engage in transportation that gives rise to 100% U.S. source income.
Shipping income attributable to transportation exclusively between non-U.S. ports will be considered to be 100% derived from sources outside of the United States. Shipping income derived from sources outside of the United States will not be subject to U.S. federal income tax.
91
Unless exempt from U.S. federal income tax under section 883 of the Code, we will be subject to U.S. federal income tax, in the manner discussed below, to the extent our shipping income is derived from sources within the United States.
Based upon our current and anticipated shipping operations, our vessels are and will be operated in various parts of the world, including to or from U.S. ports. For the 2013, 2012 and 2011 taxable years, the U.S. source gross income that we derived from our vessels trading to or from U.S. ports was $nil, $2,079,309 and $2,755,244, respectively, and the potential U.S. federal income tax liability resulting from this income, in the absence of our qualification for exemption from tax under section 883 of the Code, or an applicable U.S. income tax treaty, as described below, would have been $nil, $83,172 and $118,842, respectively.
Application of Section 883 of the Code
We have made special U.S. federal tax elections in respect of all our vessel-owning or vessel-operating subsidiaries incorporated in the United Kingdom that are potentially subject to U.S. federal income tax on shipping income derived from sources within the United States. The effect of such elections is to disregard the subsidiaries for which such elections have been made as separate taxable entities for U.S. federal income tax purposes.
Under section 883 of the Code and the Treasury Regulations promulgated thereunder, we, and each of our subsidiaries, will be exempt from U.S. federal income taxation on our respective U.S. source shipping income if both of the following conditions are met:
|
•
|
we and each subsidiary are organized in a "qualified foreign country," defined as a country that grants an equivalent exemption from tax to corporations organized in the United States in respect of the shipping income for which exemption is being claimed under section 883 of the Code; this is also known as the "Country of Organization Requirement"; and
|
|
•
|
either
|
|
•
|
more than 50% of the value of our stock is treated as owned, directly or indirectly, by individuals who are "residents" of qualified foreign countries; this is also known as the "Ownership Requirement"; or
|
|
•
|
our stock is "primarily and regularly traded on an established securities market" in the United States or any qualified foreign country; this is also known as the "Publicly-Traded Requirement".
|
The U.S. Treasury Department has recognized (i) Bermuda, our country of incorporation, and (ii) the countries of incorporation of each of our subsidiaries that has earned shipping income from sources within the United States as qualified foreign countries. Accordingly, we and each such subsidiary satisfy the Country of Organization Requirement.
Due to the public nature of our shareholdings, we do not believe that we will be able to substantiate that we satisfy the Ownership Requirement. However, as described below, we believe that we will be able to satisfy the Publicly-Traded Requirement.
The Treasury Regulations under section 883 of the Code provide that the stock of a foreign corporation will be considered to be "primarily traded" on an "established securities market" if the number of shares of each class of stock that are traded during any taxable year on all "established securities markets" in that country exceeds the number of shares in each such class that are traded during that year on "established securities markets" in any other single country. Our stock was "primarily traded" on the Nasdaq Global Select Market, an "established securities market" in the United States, during 2013.
Under the Treasury Regulations, our common stock will be considered to be "regularly traded" on an "established securities market" if one or more classes of our stock representing more than 50% of our outstanding shares, by total combined voting power of all classes of stock entitled to vote and total value, is listed on the market; this is also known as the "Listing Requirement". Since our common shares are listed on the Nasdaq Global Select Market, we will satisfy the Listing Requirement.
The Treasury Regulations further require that with respect to each class of stock relied upon to meet the Listing Requirement: (i) such class of stock is traded on the market, other than in minimal quantities, on at least 60 days during the taxable year or one-sixth of the days in a short taxable year; this is also known as the "Trading Frequency Test"; and (ii) the aggregate number of shares of such class of stock traded on such market is at least 10% of the average number of shares of such class of stock outstanding during such year, or as appropriately adjusted in the case of a short taxable year; this is also known as the "Trading Volume Test". We believe that our common shares satisfied the Trading Frequency Test and the Trading Volume Test in 2013. Even if this were not the case, the Treasury Regulations provide that the Trading Frequency Test and the Trading Volume Test will be deemed satisfied by a class of stock if, as we expect to be the case with our common shares, such class of stock is traded on an "established securities market" in the United States and such class of stock is regularly quoted by dealers making a market in such stock.
92
Notwithstanding the foregoing, the Treasury Regulations provide that our common shares will not be considered to be "regularly traded" on an "established securities market" for any taxable year in which 50% or more of the outstanding common shares, by vote and value, are owned, for more than half the days of the taxable year, by persons who each own 5% or more of the vote and value of the outstanding common shares; this is also known as the "5% Override Rule". The 5% Override Rule will not apply, however, if in respect of each category of shipping income for which exemption is being claimed, we can establish that individual residents of qualified foreign countries, or "Qualified Shareholders", own sufficient common shares to preclude non-Qualified Shareholders from owning 50% or more of the total vote and value of our common shares for more than half the number of days during the taxable year; this is also known as the "5% Override Exception".
Based on our public shareholdings for 2013, we were not subject to the 5% Override Rule for 2013. Therefore, we believe that we satisfied the Publicly-Traded Requirement for 2013 and we and each of our subsidiaries are entitled to exemption from U.S. federal income tax under section 883 of the Code in respect of our U.S. source shipping income. To the extent that we become subject to the 5% Override Rule in future years (as a result of changes in the ownership of our common shares), it may be difficult for us to establish that we qualify for the 5% Override Exception.
If we were not eligible for the exemption under section 883 of the Code, our U.S. source shipping income would be subject to U.S. federal income tax as described in more detail below.
Taxation in Absence of Exemption Under Section 883 of the Code
To the extent the benefits of section 883 of the Code are unavailable with respect to any item of U.S. source shipping income earned by us or by our subsidiaries, such U.S. source shipping income would be subject to a 4% U.S. federal income tax imposed by section 887 of the Code on a gross basis, without benefit of deductions. Since under the sourcing rules described above, no more than 50% of the shipping income earned by us or our subsidiaries would be derived from U.S. sources, the maximum effective rate of U.S. federal income tax on such gross shipping income would never exceed 2%. For the calendar year 2013, we and our subsidiaries would be subject to $nil aggregated tax under section 887 of the Code.
Gain on Sale of Vessels
If we and our subsidiaries qualify for exemption from tax under section 883 of the Code in respect of our U.S. source shipping income, the gain on the sale of any vessel earning such U.S. source shipping income should likewise be exempt from U.S. federal income tax. Even if we and our subsidiaries are unable to qualify for exemption from tax under section 883 of the Code and we or any of our subsidiaries, as the seller of such vessel, is considered to be engaged in the conduct of a U.S. trade or business, gain on the sale of such vessel would not be subject to U.S. federal income tax provided the sale is considered to occur outside of the United States under U.S. federal income tax principles. In general, a sale of a vessel will be considered to occur outside of the United States for this purpose if title to the vessel, and risk of loss with respect to the vessel, pass to the buyer outside of the United States. If the sale is considered to occur within the United States, any gain on such sale may be subject to U.S. federal income tax as "effectively connected" income at a rate of up to 54.5%. To the extent circumstances permit, we intend to structure sales of our vessels in such a manner, including effecting the sale and delivery of vessels outside of the United States, so as to not give rise to "effectively connected" income.
U.S. Taxation of U.S. Holders
The term "U.S. Holder" means a beneficial owner of our common shares that is a U.S. citizen or resident, U.S. corporation or other U.S. entity taxable as a corporation, an estate, the income of which is subject to U.S. federal income tax regardless of its source, or a trust if a court within the United States is able to exercise primary jurisdiction over the administration of the trust and one or more U.S. persons have the authority to control all substantial decisions of the trust, and owns our common shares as a capital asset, generally, for investment purposes.
If a partnership holds our common shares, the tax treatment of a partner will generally depend upon the status of the partner and upon the activities of the partnership. If you are a partner in a partnership holding our common shares, you are encouraged to consult your tax advisor.
93
Distributions
Any distributions made by us with respect to our common shares to a U.S. Holder will generally constitute dividends to the extent of our current and accumulated earnings and profits, as determined under U.S. federal income tax principles. We expect that dividends paid by us to a non-corporate U.S. Holder will be eligible for preferential U.S. federal income tax rates provided that the non-corporate U.S. Holder has owned the common shares for more than 60 days in the 121-day period beginning 60 days before the date on which our common shares becomes ex-dividend and certain other conditions are satisfied. However, there is no assurance that any dividends paid by us will be eligible for these preferential tax rates in the hands of a non-corporate U.S. Holder. Any dividends paid by us, which are not eligible for these preferential tax rates will be taxed as ordinary income to a non-corporate U.S. Holder. Because we are not a U.S. corporation, U.S. Holders that are corporations will not be entitled to claim a dividends-received deduction with respect to any distributions they receive from us.
Distributions in excess of our earnings and profits will be treated first as a non-taxable return of capital to the extent of the U.S. Holder's tax basis in its common shares, and thereafter as a taxable capital gain.
Sale, Exchange or other Disposition of Our Common Shares
Subject to the discussion below under "Passive Foreign Investment Company," a U.S. Holder generally will recognize taxable gain or loss upon a sale, exchange or other disposition of our common shares in an amount equal to the difference between the amount realized by the U.S. Holder from such sale, exchange or other disposition and the U.S. Holder's tax basis in the common shares. Such gain or loss will be treated as long-term capital gain or loss if the U.S. Holder's holding period in such common shares is greater than one year at the time of the sale, exchange or other disposition. Otherwise, such gain or loss will be treated as short-term capital gain or loss. A U.S. Holder's ability to deduct capital losses is subject to certain limitations.
3.8% Tax on Net Investment Income
For taxable years beginning after December 31, 2012, a U.S. Holder that is an individual estate, or, in certain cases, a trust, will generally be subject to a 3.8% tax on the lesser of (1) the U.S. Holder's net investment income for the taxable year and (2) the excess of the U.S. Holder's modified adjusted gross income for the taxable year over a certain threshold (which in the case of individuals is between $125,000 and $250,000). A U.S. Holder's net investment income will generally include distributions made by us which constitute a dividend for U.S. federal income tax purposes and gain realized from the sale, exchange or other disposition of our common shares. This tax is in addition to any income taxes due on such investment income.
If you are a U.S. Holder that is an individual, estate or trust, you are encouraged to consult your tax advisors regarding the applicability of the 3.8% tax on net investment income to the ownership and disposition of our common shares.
Passive Foreign Investment Company
Notwithstanding the above rules regarding distributions and dispositions, special rules may apply to U.S. Holders (or, in some cases, U.S. persons who are treated as owning our common shares under constructive ownership rules) if we are treated as a "passive foreign investment company" (a "PFIC") for U.S. federal income tax purposes. We will be a PFIC if either:
|
•
|
at least 75% of our gross income in a taxable year is "passive income"; or
|
|
•
|
at least 50% of our assets in a taxable year (averaged over the year and generally determined based upon value) are held for the production of, or produce, "passive income."
|
For purposes of determining whether we are a PFIC, we will be treated as earning and owning the income and assets, respectively, of any of our subsidiary corporations in which we own 25% or more of the value of the subsidiary's stock, which includes Golar Partners. To date, our subsidiaries and we have derived most of our income from time and voyage charters, and we expect to continue to do so. This income should be treated as services income, which is not "passive income" for PFIC purposes. We believe there is substantial legal authority supporting our position consisting of case law and U.S. Internal Revenue Service, also known as the "IRS", pronouncements concerning the characterization of income derived from time charters and voyage charters as services income for other tax purposes. However, there is also authority which characterizes time charter income as rental income rather than services income for other tax purposes.
94
Based on the foregoing, we believe that we are not currently a PFIC and do not expect to be a PFIC in the foreseeable future. However, in the absence of any legal authority specifically relating to the Code provisions governing PFICs, the IRS or a court could disagree with our position. In addition, there can be no assurance that we will not become a PFIC if our operations change in the future.
If we become a PFIC (and regardless of whether we remain a PFIC), each U.S. Holder who owns or is treated as owning our common shares during any period in which we are so classified, would be subject to U.S. federal income tax, at the then highest applicable income tax rates on ordinary income, plus interest, upon certain "excess distributions" and upon dispositions of our common shares including, under certain circumstances, a disposition pursuant to an otherwise tax free reorganization, as if the distribution or gain had been recognized ratably over the U.S. Holder's entire holding period of our common shares. An "excess distribution" generally includes dividends or other distributions received from a PFIC in any taxable year of a U.S. Holder to the extent that the amount of those distributions exceeds 125% of the average distributions made by the PFIC during a specified base period. The tax at ordinary rates and interest resulting from an excess distribution would not be imposed if the U.S. Holder makes a "mark-to-market" election, as discussed below.
If we become a PFIC and, provided that, as is currently the case, our common shares are treated as "marketable stock," a U.S. Holder may make a "mark-to-market" election with respect to our common shares. Under this election, any excess of the fair market value of the common shares at the close of any tax year over the U.S. Holder's adjusted tax basis in the common shares is included in the U.S. Holder's income as ordinary income. In addition, the excess, if any, of the U.S. Holder's adjusted tax basis at the close of any taxable year over the fair market value of the common shares is deductible in an amount equal to the lesser of the amount of the excess or the net "mark-to-market" gains that the U.S. Holder included in income in previous years. If a U.S. Holder makes a "mark-to-market" election after the beginning of its holding period of our common shares, the U.S. Holder does not avoid the PFIC rules described above with respect to the inclusion of ordinary income, and the imposition of interest thereon, attributable to periods before the election.
In some circumstances, a shareholder in a PFIC may avoid the unfavorable consequences of the PFIC rules by making a "qualified electing fund" election. However, a U.S. Holder cannot make a "qualified electing fund" election with respect to us unless such U.S. Holder complies with certain reporting requirements. We do not intend to provide the information necessary to meet such reporting requirements.
In addition to the above consequences, if we were to be treated as a PFIC for any taxable year ending on or after December 31, 2013, a U.S. Holder would be required to file IRS form 8621 with the IRS for that year with respect to such U.S. Holder's common stock.
Backup Withholding and Information Reporting
In general, dividend payments, or other taxable distributions, made within the United States will be subject to information reporting requirements. Such payments will also be subject to "backup withholding" if made to a non-corporate U.S. Holder and such U.S. Holder:
|
•
|
fails to provide an accurate taxpayer identification number;
|
|
•
|
provides us with an incorrect taxpayer identification number;
|
|
•
|
is notified by the IRS that it has failed to report all interest or dividends required to be shown on its U.S. federal income tax returns; or
|
|
•
|
in certain circumstances, fails to comply with applicable certification requirements.
|
If a shareholder sells our common shares to or through a U.S. office or broker, the payment of the proceeds is subject to both U.S. information reporting and "backup withholding" unless the shareholder establishes an exemption. If the shareholder sells our common shares through a non-U.S. office of a non-U.S. broker and the sales proceeds are paid to the shareholder outside the United States, then information reporting and "backup withholding" generally will not apply to that payment. However, U.S. information reporting requirements, but not "backup withholding," will apply to a payment of sales proceeds, including a payment made to a shareholder outside the United States, if the shareholder sells the common shares through a non-U.S. office of a broker that is a U.S. person or has some other contacts with the United States.
"Backup withholding" is not an additional tax. Rather, a taxpayer generally may obtain a refund of any amounts withheld under "backup withholding" rules that exceed such taxpayer's U.S. federal income tax liability by filing a refund claim with the IRS, provided that the required information is furnished to the IRS.
95
Pursuant to Section 6038D of the Code and the proposed and temporary Treasury Regulations promulgated thereunder, individuals who are U.S. Holders (and to the extent specified in the applicable Treasury Regulations, certain individuals who are non-U.S. Holders and certain U.S. entities) who hold "specified foreign financial assets" (as defined in Section 6038D of the Code and the applicable Treasury Regulations) are required to file IRS Form 8938 (Statement of Specified Foreign Financial Assets) with information relating to each such asset for each taxable year in which the aggregate value of all such assets exceeds $75,000 at any time during the taxable year or $50,000 on the last day of the taxable year. Specified foreign financial assets would include, among other assets, our common stock, unless the common stock were held through an account maintained with a U.S. financial institution. Substantial penalties apply to any failure to timely file IRS Form 8938, unless the failure is shown to be due to reasonable cause and not due to willful neglect. Additionally, the statute of limitations on the assessment and collection of U.S. federal income tax with respect to a taxable year for which the filing of IRS Form 8938 is required may not close until three years after the date on which IRS Form 8938 is filed. U.S. Holders (including U.S. entities) and non-U.S. Holders are encouraged to consult their own tax advisors regarding their reporting obligations under Section 6038D of the Code.
Bermuda Taxation
Bermuda currently imposes no tax (including a tax in the nature of an income, estate, duty, inheritance, capital transfer or withholding tax) on profits, income, capital gains or appreciations derived by us, or dividends or other distributions paid by us to shareholders of our common shares. Bermuda has undertaken not to impose any such Bermuda taxes on shareholders of our common shares prior to the year 2035 except in so far as such tax applies to persons ordinarily resident in Bermuda.
The Minister of Finance in Bermuda has granted the Company a tax exempt status until March 31, 2035, under which no income taxes or other taxes (other than duty on goods imported into Bermuda and payroll tax in respect of any Bermuda-resident employees) are payable by the Company in Bermuda. If the Minister of Finance in Bermuda does not grant a new exemption or extend the current tax exemption, and if the Bermudian Parliament passes legislation imposing taxes on exempted companies, the Company may become subject to taxation in Bermuda after March 31, 2035.
Liberian Taxation
Under the Consolidated Tax Amendments Act of 2010, our Liberian subsidiaries should be considered non-resident Liberian corporations which are wholly exempted from Liberian taxation effective as of 1977.
F. Dividends and Paying Agents
Not Applicable.
G. Statements by Experts
Not Applicable.
H. Documents on display
Our Registration Statement became effective on November 29, 2002, and we are now subject to the informational requirements of the Securities Exchange Act of 1934, as amended. In accordance with these requirements we will file reports and other information with the SEC. These materials, including this document and the accompanying exhibits, may be inspected and copied at the public reference facilities maintained by the Commission at 100 Fifth Street, N.E., Room 1580, Washington, D.C. 20549. You may obtain information on the operation of the public reference room by calling 1 (800) SEC-0330, and you may obtain copies at prescribed rates from the Public Reference Section of the Commission at its principal office in Washington, D.C. 20549. The SEC maintains a website (http://www.sec.gov) that contains reports, proxy and information statements and other information regarding registrants that file electronically with the SEC.
Subsidiary Information
Not Applicable.
We are exposed to various market risks, including interest rate and foreign currency exchange risks. We enter into a variety of derivative instruments and contracts to maintain the desired level of exposure arising from these risks.
Our policy is to hedge our exposure to risks, when possible, within boundaries deemed appropriate by management.
A discussion of our accounting policies for derivative financial instruments is included in Note 2 to our audited consolidated financial statements. Further information on our exposure to market risk is included in Note 32 to our audited consolidated financial statements.
The following analyses provide quantitative information regarding our exposure to foreign currency exchange rate risk and interest rate risk. There are certain shortcomings inherent in the sensitivity analyses presented, primarily due to the assumption that exchange rates change in a parallel fashion and that interest rates change instantaneously.
Interest rate risk.
A significant portion of our long-term debt obligation is subject to adverse movements in interest rates. Our interest rate risk management policy permits economic hedge relationships in order to reduce the risk associated with adverse fluctuations in interest rates. We use interest rate swaps and fixed rate debt to manage the exposure to adverse movements in interest rates. Interest rate swaps are used to convert floating rate debt obligations to a fixed rate in order to achieve an overall desired position of fixed and floating rate debt. Credit exposures are monitored on a counterparty basis, with all new transactions subject to senior management approval.
As of December 31, 2013, the notional amount of the designated interest rate swaps outstanding in respect of our debt obligation was $128.0 million (2012: $180.1 million). The principal of the loans outstanding as of December 31, 2013 was $717.0 million (2012: $504.9 million). Based on our floating rate debt at December 31, 2013, a one-percentage point increase in the floating interest rate would have increased our interest expense by $2.8 million per annum (excluding the effect of our convertible bonds). For disclosure of the fair value of the derivatives and debt obligations outstanding as of December 31, 2013, see Note 32 to our audited Consolidated Financial Statements.
Foreign currency risk
. The majority of our transactions, assets and liabilities are denominated in U.S. Dollars, our functional currency. Periodically, we may be exposed to foreign currency exchange fluctuations as a result of expenses paid by certain subsidiaries in currencies other than U.S. Dollars, such as GBPs, in relation to our administrative office in the U.K. and operating expenses incurred in a variety of foreign currencies. Based on our GBP expenses for 2013, a 10% depreciation of the U.S. Dollar against GBP would have increased our expenses by approximately $1.6 million.
We operate a branch in Norway, where the majority of expenses are incurred in Norwegian Kroner. Based on our NOK administrative expenses incurred in 2013, a 10% depreciation of the U.S Dollar against NOK would have increased our expenses by $0.7 million.
The base currency of the majority of our seafaring officers' remuneration was the Euro. Based on the crew costs for the year ended December 31, 2013, a 10% depreciation of the U.S. Dollar against the Euro would have increased our crew cost for 2013 by approximately $2.1 million.
96
ITEM
12. DESCRIPTION OF SECURITIES OTHER THAN EQUITY SECURITIES
Not Applicable.
There are cross default provisions in most of our and Golar Partners loan and lease agreements. In April 2013, Golar Partners received waivers relating to the requirement under the Golar LNG Partners credit facility and the Golar Freeze facility relating to change of control over the Partnership. Following the grant of such waivers, in order to permanently resolve this issue, the loan facilities affected by the loss of control which contained the change of control provisions were amended in June 2013. As of December 31, 2013, Golar Partners was in compliance with all covenants.
None.
(a) Disclosure Controls and Procedures
Management of the Company, with the participation of the Principal Executive Officer and Principal Financial Officer, assessed the effectiveness of the design and operation of the Company's disclosure controls and procedures as defined in Rule 13a-15(e) and 15(d)-15(e) of the Securities Exchange Act of 1934, as amended, as of the end of the period covered by this annual report as of December 31, 2013. Based upon that evaluation, the Principal Executive Officer and Principal Financial Officer concluded that our disclosure controls and procedures were effective as of December 31, 2013.
(b)
Management's annual report on internal controls over financial reporting
Our management is responsible for establishing and maintaining adequate internal control over financial reporting as defined in Rules 13a-15(f) promulgated under the Securities Exchange Act of 1934.
Internal control over financial reporting is a process designed by, or under the supervision of, the Company's principal executive and principal financial officers and effected by the Company's board of directors, management and other personnel, to provide reasonable assurance regarding the reliability of financial reporting and the preparation of financial statements for external purposes in accordance with generally accepted accounting principles and includes those policies and procedures that:
|
•
|
Pertain to the maintenance of records that, in reasonable detail, accurately and fairly reflect the transactions and dispositions of the assets of the Company;
|
|
•
|
Provide reasonable assurance that transactions are recorded as necessary to permit preparation of financial statements in accordance with generally accepted accounting principles, and that our receipts and expenditures are being made only in accordance with authorizations of Company's management and directors; and
|
|
•
|
Provide reasonable assurance regarding prevention or timely detection of unauthorized acquisition, use or disposition of our assets that could have a material effect on the financial statements.
|
Because of its inherent limitations, internal control over financial reporting may not prevent or detect misstatements. Also, projections of any evaluation of effectiveness to future periods are subject to the risk that controls may become inadequate because of changes in conditions, or that the degree or compliance with the policies or procedures may deteriorate.
97
Management conducted the evaluation of the effectiveness of the internal controls over financial reporting using the control criteria framework issued by the Committee of Sponsoring Organizations of the Treadway Commission 1992 ("COSO") published in its report entitled Internal Control-Integrated Framework.
Our management with the participation of our Principal Executive Officer and Principal Financial Officer assessed the effectiveness of our internal controls over financial reporting pursuant to Rule 13a-15 of the Securities Exchange Act of 1934, as of December 31, 2013. Based upon that evaluation, the Principal Executive Officer and Principal Financial Officer concluded that the Company's internal controls over financial reporting are effective as of December 31, 2013.
The Company's independent registered public accounting firm has issued an attestation report on the Company's internal control over financial reporting.
(c) Attestation report of the registered public accounting firm
The effectiveness of the Company's internal control over financial reporting as of December 31, 2013 has been audited by PricewaterhouseCoopers LLP, an independent registered public accounting firm, as stated in their report which appears on page F-2 of our Consolidated Financial Statements.
(d) Changes in internal control over financial reporting
In 2013, we completed our planned action to remediate the material weakness in our internal control over financial reporting relating to monitoring triggering events which require the reconsideration of control and consolidation as reported in Item 15-Controls and Procedures of our annual report for the year ended December 31, 2012. We implemented an additional control whereby equity investments are reviewed quarterly to evaluate whether any trigger events have occurred and assess the impact of such triggering events.
There were no other changes in our internal controls over financial reporting that occurred during the period covered by this annual report that have materially affected, or are reasonably likely to materially affect, our internal control over financial reporting.
Our board of directors has determined that Kate Blankenship, a director, qualifies as an audit committee financial expert and is independent, in accordance with SEC Rule 10a-3 pursuant to Section 10A of the Exchange Act.
We have adopted a Code of Ethics that applies to all the employees of the company and its subsidiaries. A copy of our Code of Ethics may be found on our website
www.golarlng.com
.
|
(a)
|
Audit Fees
|
The following table sets forth, for the two most recent fiscal years, the aggregate fees billed for professional services rendered by the principal accountant for the audit of the Company's annual financial statements and services provided by the principal accountant in connection with statutory and regulatory filings or engagements for the two most recent fiscal years.
|
Fiscal year ended December 31, 2013
|
$
|
1,027,801
|
|
|
Fiscal year ended December 31, 2012
|
$
|
1,776,601
|
|
98
(b) Audit – Related Fees
The following table sets forth, for the two most recent fiscal years, the aggregate fees billed for professional services in respect of assurance and related services rendered by the principal accountant related to the performance of the audit or review of the Company's financial statements which have not been reported under Audit Fees above.
|
Fiscal year ended December 31, 2013
|
$
|
—
|
|
|
Fiscal year ended December 31, 2012
|
$
|
—
|
|
(c) Tax Fees
The following table sets forth, for the two most recent fiscal years, the aggregate fees billed for professional services rendered by the principal accountant for tax compliance, tax advice and tax planning.
|
Fiscal year ended December 31, 2013
|
$
|
9,689
|
|
|
Fiscal year ended December 31, 2012
|
$
|
22,410
|
|
(d) All Other Fees
The following table sets forth, for the two most recent fiscal years, the aggregate fees billed for professional services rendered by the principal accountant for other services.
|
Fiscal year ended December 31, 2013
|
$
|
14,842
|
|
|
Fiscal year ended December 31, 2012
|
$
|
8,489
|
|
(e) Audit Committee's Pre-Approval Policies and Procedures
The Company's board of directors has adopted pre-approval policies and procedures in compliance with paragraph (c)(7)(i) of Rule 2-01 of Regulation S-X that require our board of directors to approve the appointment of the independent auditor of the Company before such auditor is engaged and approve each of the audit and non-audit related services to be provided by such auditor under such engagement by the Company. All services provided by the principal auditor in 2013 were approved by our board of directors pursuant to the pre-approval policy.
Not Applicable.
In November 2007, we announced that the board of directors had authorized the repurchase of up to 1,000,000 shares of our common stock in the open market.
99
|
Month of repurchase
|
Total number of shares purchased
|
|
Average price paid per share
|
|
Total number of Shares purchased as part of publicly announced plans or programme
|
|
Maximum Number of shares that may be purchased under the plans or program
|
|
||||
|
November 2007
|
200,000
|
|
$
|
20.33
|
|
200,000
|
|
800,000
|
|
|||
|
December 2007
|
200,000
|
|
$
|
20.68
|
|
200,000
|
|
600,000
|
|
|||
|
November 2009
|
300,000
|
|
$
|
13.04
|
|
300,000
|
|
300,000
|
|
|||
|
As of December 31, 2013
|
700,000
|
|
$
|
17.31
|
|
700,000
|
|
300,000
|
|
|||
As of December 31, 2013, we did not hold any treasury shares. For further detail on our treasury shares, refer to note 30 of our consolidated financial statements.
Not Applicable.
Pursuant to an exception under Rule 5615 of the Nasdaq Global Select Market, or Nasdaq listing standards available to foreign private issuers, we are not required to comply with all of the corporate governance practices followed by U.S. companies under the Nasdaq's listing standards, which are available at www.nasdaq.com. As a foreign private issuer, we are permitted to follow our home country practices in lieu of certain Nasdaq corporate governance requirements. We have certified to Nasdaq that our corporate governance practices are in compliance with, and are not prohibited by, the laws of Bermuda.
We are exempt from many of the Nasdaq's corporate governance practices other than the requirements regarding the disclosure of a going concern audit opinion, submission of a listing agreement, notification of material non-compliance with Nasdaq's corporate governance practices and the establishment and composition of an audit committee and a formal written audit committee charter. The practices we follow in lieu of Nasdaq's corporate governance requirements are as follows:
Independence of directors
. In lieu of a board of directors that is comprised of a majority of independent directors, consistent with Bermuda law and our Bye-Laws, two members of the board of directors, Kate Blankenship and Hans Petter Aas, are independent according to Nasdaq's standards for independence. Our board of directors does not hold annual meetings at which only independent directors are present.
Audit Committee
. Consistent with Bermuda law and our Bye-laws, we are exempt from certain Nasdaq Global Select Market requirements regarding our audit committee. Our audit committee consists of two independent directors, Kate Blankenship and Hans Petter Aas. The Company's management is responsible for the proper and timely preparation of the Company's annual reports, which are audited by independent auditors.
Compensation Committee
. In lieu of a compensation committee comprised of independent directors, the full board of directors determines compensation.
Nomination Committee
. In lieu of a nomination committee comprised of independent directors, the full board of directors regulates nominations.
Share Issuance
. In lieu of obtaining shareholder approval prior to the issuance of securities in certain circumstances, consistent with Bermuda law and our Bye-Laws, the board of directors approves share issuances.
As a foreign private issuer, we are not required to solicit proxies or provide proxy statements to Nasdaq pursuant to Nasdaq's corporate governance rules or Bermuda law. Consistent with Bermuda law and as provided in our amended bye-laws, we will notify our shareholders of shareholder meetings at least seven days before such meeting. This notification will contain, among other things, information regarding business to be transacted at the meeting.
We believe that our established corporate governance practices satisfy the Nasdaq listing standards.
100
Not Applicable.
Not Applicable.
The following financial statements listed below and set forth on pages F-1 through F-58 are filed as part of this annual report.
Separate consolidated financial statements and notes thereto for Golar LNG Partners L.P. ("Golar Partners") for each of the years ended December 31, 2013, 2012 and 2011 are being provided as a result of Golar Partners meeting a significance test pursuant to Rule 3-09 of Regulation S-X for the year ended December 31, 2013 and, accordingly, the financial statements of Golar Partners for the year ended December 31, 2013 are required to be filed as part of this Annual Report on Form 20-F. See A-1 through A-47.
101
The following exhibits are filed as part of this Annual report:
|
Number
|
Description of Exhibit
|
|
1.1
|
Memorandum of Association of Golar LNG Limited as adopted on May 9, 2001, incorporated by reference to Exhibit 1.1 of the Company's Registration Statement on Form 20-F, filed with the SEC on November 27, 2002, File No. 00050113, or the Original Registration Statement.
|
|
1.2
|
Amended Bye-Laws of Golar LNG Limited dated September 28, 2007, incorporated by reference to Exhibit 1.2 of the Company's Annual report on Form 20-F for fiscal year ended December 31, 2007.
|
|
1.3
|
Certificate of Incorporation as adopted on May 11, 2001, incorporated by reference to Exhibit 1.3 of the Company's Original Registration Statement.
|
|
1.4
|
Articles of Amendment of Memorandum of Association of Golar LNG Limited as adopted by our shareholders on June 1, 2001 (increasing the Company's authorized capital), incorporated by reference to Exhibit 1.4 of the Company's Original Registration Statement.
|
|
2.1
|
Form of share certificate incorporated by reference to Exhibit 2.1 of the Company's Annual Report on Form 20-F for the fiscal year ended December 31, 2010.
|
|
|
|
|
4.1
|
Golar LNG Limited Stock Option Plan, incorporated by reference to Exhibit 4.6 of the Company's Original Registration Statement.
|
|
4.2
|
Omnibus Agreement dated April 13, 2011, by and among Golar LNG Ltd., Golar LNG Partners LP, Golar GP LLC and Golar Energy Limited, incorporated by reference to Exhibit 4.2* of Golar LNG Partners L.P. Annual Report on Form 20-F for the fiscal year ended December 31, 2011.
|
|
4.3
|
Amendment No. 1 to Omnibus Agreement, dated October 5, 2011 by and among Golar LNG Ltd., Golar LNG Partners LP, Golar GP LLC and Golar Energy Limited, incorporated by reference to Exhibit 4.2(a)* of Golar LNG Partners L.P. Annual Report on Form 20-F for the fiscal year ended December 31, 2011.
|
|
4.4
|
Bermuda Tax Assurance, dated May 23, 2011.
|
|
4.6
|
Bond Agreement dated March 5, 2012 between Golar LNG Ltd and Norsk Tillitsmann ASA as bond trustee.
|
|
4.7
|
First Amended and Restated Agreement of Limited Partnership of Golar LNG Partners LP, incorporated by reference to Exhibit 1.2 of Golar LNG Partners L.P. Annual Report on Form 20-F for the fiscal year ended December 31, 2011.
|
|
4.9
|
Facility Agreement between Golar Hull M2021 Corp, Golar Hull M2026 Corp, Golar Hull M2031 Corp, Golar Hull M2022 Corp, Golar Hull M2023 Corp, Golar Hull M2027 Corp, Golar Hull M2024 Corp, Golar LNG NB 12 Corporation, and a consortium of banks for a $1.125 billion facility, dated July 24, 2013.
|
|
8.1
|
Golar LNG Limited subsidiaries.
|
|
11.1
|
Golar LNG Limited Code of Ethics, incorporated by reference to Exhibit 14.1 of the Company's Annual Report on Form 20-F for the year ended December 31, 2003.
|
|
12.1
|
Certification of the Principal Executive Officer under Section 302 of the Sarbanes-Oxley Act of 2002.
|
|
12.2
|
Certification of the Principal Financial Officer under Section 302 of the Sarbanes-Oxley Act of 2002.
|
|
13.1
|
Certification under Section 906 of the Sarbanes-Oxley act of 2002 of the Principal Executive Officer.
|
|
13.2
|
Certification under Section 906 of the Sarbanes-Oxley act of 2002 of the Principal Financial Officer.
|
|
15.1
|
Consent of Independent Registered Public Accounting Firm.
|
|
15.2
|
Consent of Independent Registered Public Accounting Firm.
|
102
101. INS* XBRL Instance Document
101. SCH* XBRL Taxonomy Extension Schema
101. CAL* XBRL Taxonomy Extension Schema Calculation Linkbase
101. DEF* XBRL Taxonomy Extension Schema Definition Linkbase
101. LAB* XBRL Taxonomy Extension Schema Label Linkbase
101. PRE* XBRL Taxonomy Extension Schema Presentation Linkbase
103
SIGNATURES
Pursuant to the requirements of Section 12 of the Securities Exchange Act of 1934, the registrant certifies that it meets all of the requirements for filing on Form 20-F and has duly caused this annual report to be signed on its behalf by the undersigned, thereunto duly authorized.
|
|
Golar LNG Limited
|
||
|
|
(Registrant)
|
||
|
|
|
||
|
Date
|
April 30, 2014
|
By
|
/s/ Brian Tienzo
|
|
|
|
Brian Tienzo
|
|
|
|
|
Principal Financial and Accounting Officer
|
|
104
GOLAR LNG LIMITED
INDEX TO CONSOLIDATED FINANCIAL STATEMENTS
|
|
Page
|
F-1
Report of Independent Registered Public Accounting Firm
To the Board of Directors and shareholders of Golar LNG Limited
In our opinion, the accompanying consolidated balance sheets and the related consolidated statements of operations, comprehensive income, cash flows and of changes in equity present fairly, in all material respects, the financial position of Golar LNG Limited and its subsidiaries
at December 31, 2013
and December 31, 2012, and the results of their operations and their cash flows for each of the three years in the period ended December 31, 2013 in conformity with accounting principles generally accepted in the United States of America. Also in our opinion, the Company maintained, in all material respects, effective internal control over financial reporting as of December 31, 2013, based on criteria established in
Internal Control - Integrated Framework (1992)
issued by the Committee of Sponsoring Organizations of the Treadway Commission (COSO). The Company's management is responsible for these financial statements, for maintaining effective internal control over financial reporting and for its assessment of the effectiveness of internal control over financial reporting, included in "Management's annual report on internal controls over financial reporting" under Item 15 of this Form 20-F. Our responsibility is to express opinions on these financial statements and on the Company's internal control over financial reporting based on our integrated audits. We conducted our audits in accordance with the standards of the Public Company Accounting Oversight Board (United States). Those standards require that we plan and perform the audits to obtain reasonable assurance about whether the financial statements are free of material misstatement and whether effective internal control over financial reporting was maintained in all material respects. Our audits of the financial statements included examining, on a test basis, evidence supporting the amounts and disclosures in the financial statements, assessing the accounting principles used and significant estimates made by management, and evaluating the overall financial statement presentation. Our audit of internal control over financial reporting included obtaining an understanding of internal control over financial reporting, assessing the risk that a material weakness exists, and testing and evaluating the design and operating effectiveness of internal control based on the assessed risk. Our audits also included performing such other procedures as we considered necessary in the circumstances. We believe that our audits provide a reasonable basis for our opinions.
A company’s internal control over financial reporting is a process designed to provide reasonable assurance regarding the reliability of financial reporting and the preparation of financial statements for external purposes in accordance with generally accepted accounting principles. A company’s internal control over financial reporting includes those policies and procedures that (i) pertain to the maintenance of records that, in reasonable detail, accurately and fairly reflect the transactions and dispositions of the assets of the company; (ii) provide reasonable assurance that transactions are recorded as necessary to permit preparation of financial statements in accordance with generally accepted accounting principles, and that receipts and expenditures of the company are being made only in accordance with authorizations of management and directors of the company; and (iii) provide reasonable assurance regarding prevention or timely detection of unauthorized acquisition, use, or disposition of the company’s assets that could have a material effect on the financial statements.
Because of its inherent limitations, internal control over financial reporting may not prevent or detect misstatements. Also, projections of any evaluation of effectiveness to future periods are subject to the risk that controls may become inadequate because of changes in conditions, or that the degree of compliance with the policies or procedures may deteriorate.
/s/ PricewaterhouseCoopers LLP
PricewaterhouseCoopers LLP
London, United Kingdom
April 30, 2014
F-2
Golar LNG Limited
(in thousands of $, except per share data)
|
|
Note
|
2013
|
|
2012
|
|
2011
|
|
||||||
|
Operating revenues
|
|
|
|
|
|||||||||
|
Time charter revenues
|
|
90,558
|
|
409,593
|
|
299,848
|
|
||||||
|
Vessel and other management fees
|
9,270
|
|
752
|
|
—
|
|
|||||||
|
Total operating revenues
|
|
99,828
|
|
410,345
|
|
299,848
|
|
||||||
|
Operating expenses
|
|
|
|
|
|
|
|||||||
|
Vessel operating expenses
|
|
43,750
|
|
86,672
|
|
62,872
|
|
||||||
|
Voyage and charter-hire expenses
|
|
14,259
|
|
9,853
|
|
6,042
|
|
||||||
|
Administrative expenses
|
|
22,952
|
|
25,013
|
|
33,679
|
|
||||||
|
Depreciation and amortization
|
|
36,871
|
|
85,524
|
|
70,286
|
|
||||||
|
Impairment of long-term assets
|
9
|
500
|
|
500
|
|
500
|
|
||||||
|
Total operating expenses
|
|
118,332
|
|
207,562
|
|
173,379
|
|
||||||
|
Gain on disposal of
Golar Maria
(including amortization of deferred gain)
|
6
|
65,619
|
|
—
|
|
—
|
|
||||||
|
Other operating gains and losses
|
—
|
|
(27
|
)
|
(5,438
|
)
|
|||||||
|
Operating income
|
|
47,115
|
|
202,756
|
|
121,031
|
|
||||||
|
Other non-operating income (expense)
|
|||||||||||||
|
Gain on loss of control
|
5
|
—
|
|
853,996
|
|
—
|
|
||||||
|
Gain on business acquisition
|
7
|
—
|
|
4,084
|
|
—
|
|
||||||
|
Dividend income
|
30,960
|
|
—
|
|
—
|
|
|||||||
|
Other non-operating (expense) income
|
(3,355
|
)
|
(151
|
)
|
541
|
|
|||||||
|
Total other non-operating income
|
27,605
|
|
857,929
|
|
541
|
|
|||||||
|
Financial income (expenses)
|
|
|
|
|
|
|
|||||||
|
Interest income
|
|
3,549
|
|
2,819
|
|
1,757
|
|
||||||
|
Interest expense
|
|
—
|
|
(31,924
|
)
|
(25,773
|
)
|
||||||
|
Other financial items, net
|
10
|
38,219
|
|
(13,763
|
)
|
(29,086
|
)
|
||||||
|
Net financial income (expenses)
|
|
41,768
|
|
(42,868
|
)
|
(53,102
|
)
|
||||||
|
Income before equity in net earnings (losses) of affiliates and income taxes
|
|
116,488
|
|
1,017,817
|
|
68,470
|
|
||||||
|
Income taxes
|
11
|
3,404
|
|
(2,765
|
)
|
1,705
|
|
||||||
|
Equity in net earnings (losses) of affiliates
|
14
|
15,821
|
|
(609
|
)
|
(1,900
|
)
|
||||||
|
Net income
|
|
135,713
|
|
1,014,443
|
|
68,275
|
|
||||||
|
Net income attributable to non-controlling interests
|
|
—
|
|
(43,140
|
)
|
(21,625
|
)
|
||||||
|
Net income attributable to Golar LNG Ltd
|
135,713
|
|
971,303
|
|
46,650
|
|
|||||||
|
Earnings per share attributable to Golar LNG Ltd stockholders:
Per common share amounts:
|
|
|
|
|
|
|
|||||||
|
Earnings – Basic
|
12
|
$
|
1.69
|
|
$
|
12.09
|
|
$
|
0.62
|
|
|||
|
Earnings – Diluted
|
12
|
$
|
1.59
|
|
$
|
11.66
|
|
$
|
0.62
|
|
|||
|
Cash dividends declared and paid
|
$
|
1.35
|
|
$
|
1.93
|
|
$
|
1.13
|
|
||||
The accompanying notes are an integral part of these consolidated financial statements.
F-3
Golar LNG Limited
Consolidated Statements of Comprehensive Income for the years ended
December 31, 2013
,
2012
and
2011
(in thousands of $)
|
|
Note
|
2013
|
|
2012
|
|
2011
|
|
|||
|
COMPREHENSIVE INCOME
|
|
|
|
|
||||||
|
Net income
|
|
135,713
|
|
1,014,443
|
|
68,275
|
|
|||
|
Other comprehensive income (loss):
|
|
|
|
|
|
|
||||
|
Gains (losses) associated with pensions, net of tax
|
28
|
5,078
|
|
(2,323
|
)
|
(3,139
|
)
|
|||
|
Unrealized net gain on qualifying cash flow hedging instruments
(1)
|
32
|
5,010
|
|
1,547
|
|
1,024
|
|
|||
|
Unrealized gain on investments in available-for-sale securities
|
21
|
1,885
|
|
5,911
|
|
—
|
|
|||
|
Other comprehensive income (loss)
|
31
|
11,973
|
|
5,135
|
|
(2,115
|
)
|
|||
|
Comprehensive income
|
|
147,686
|
|
1,019,578
|
|
66,160
|
|
|||
|
Comprehensive income attributable to:
|
||||||||||
|
Stockholders of Golar LNG Limited
|
147,686
|
|
978,532
|
|
43,636
|
|
||||
|
Non-controlling interests
|
—
|
|
41,046
|
|
22,524
|
|
||||
|
|
147,686
|
|
1,019,578
|
|
66,160
|
|
||||
(1) Includes share of net gain of
$0.9 million
, $
nil
and $
nil
on qualifying cash flow hedging instruments held by an affiliate for the years ended December 31, 2013, 2012 and 2011, respectively. Refer to note 32.
The accompanying notes are an integral part of these consolidated financial statements.
F-4
Golar LNG Limited
(in thousands of $)
|
|
Note
|
2013
|
|
2012
|
|
||
|
ASSETS
|
|
|
|
||||
|
Current Assets
|
|
|
|
||||
|
Cash and cash equivalents
|
|
125,347
|
|
424,714
|
|
||
|
Restricted cash and short-term investments
|
20
|
23,432
|
|
1,551
|
|
||
|
Trade accounts receivable
|
15
|
81
|
|
385
|
|
||
|
Other receivables, prepaid expenses and accrued income
|
16
|
14,574
|
|
5,309
|
|
||
|
Amounts due from related parties
|
33
|
6,311
|
|
5,915
|
|
||
|
Inventories
|
|
11,951
|
|
2,051
|
|
||
|
Total current assets
|
|
181,696
|
|
439,925
|
|
||
|
Long-term assets
|
|
|
|
|
|||
|
Restricted cash
|
20
|
3,111
|
|
—
|
|
||
|
Investment in available-for-sale securities
|
21
|
267,352
|
|
353,034
|
|
||
|
Investments in affiliates
|
14
|
350,918
|
|
367,656
|
|
||
|
Cost method investments
|
22
|
204,172
|
|
198,524
|
|
||
|
Newbuildings
|
17
|
767,525
|
|
435,859
|
|
||
|
Vessels and equipment, net
|
18
|
811,715
|
|
573,615
|
|
||
|
Deferred charges
|
19
|
24,484
|
|
4,064
|
|
||
|
Other non-current assets
|
23
|
54,248
|
|
6,769
|
|
||
|
Amounts due from related parties
|
33
|
—
|
|
34,953
|
|
||
|
Total assets
|
|
2,665,221
|
|
2,414,399
|
|
||
|
LIABILITIES AND EQUITY
|
|
|
|
||||
|
Current liabilities
|
|
|
|
|
|
||
|
Current portion of long-term debt
|
26
|
30,784
|
|
14,400
|
|
||
|
Trade accounts payable
|
|
12,728
|
|
10,203
|
|
||
|
Accrued expenses
|
24
|
22,787
|
|
20,413
|
|
||
|
Amounts due to related parties
|
33
|
363
|
|
4,037
|
|
||
|
Other current liabilities
|
25
|
23,912
|
|
38,006
|
|
||
|
Total current liabilities
|
|
90,574
|
|
87,059
|
|
||
|
Long-term liabilities
|
|
|
|
|
|||
|
Long-term debt
|
26
|
636,244
|
|
490,506
|
|
||
|
Long-term debt due to related parties
|
26
|
50,000
|
|
—
|
|
||
|
Other long-term liabilities
|
27
|
84,266
|
|
72,515
|
|
||
|
Total liabilities
|
|
861,084
|
|
650,080
|
|
||
|
Commitments and Contingencies (see notes 34 and 35)
EQUITY
|
|
|
|
|
|
||
|
Share capital 80,579,295 common shares
of $1.00 each issued and outstanding (2012: 80,503,364) |
30
|
80,580
|
|
80,504
|
|
||
|
Additional paid-in capital
|
656,018
|
|
654,042
|
|
|||
|
Contributed surplus
|
|
200,000
|
|
200,000
|
|
||
|
Accumulated other comprehensive loss
|
|
(6,757
|
)
|
(18,730
|
)
|
||
|
Retained earnings
|
|
874,296
|
|
848,503
|
|
||
|
Total stockholders' equity
|
|
1,804,137
|
|
1,764,319
|
|
||
|
Total liabilities and equity
|
|
2,665,221
|
|
2,414,399
|
|
||
The accompanying notes are an integral part of these consolidated financial statements.
F-5
Golar LNG Limited
(in thousands of $)
|
|
Note
|
2013
|
|
2012
|
|
2011
|
|
|||
|
Operating activities
|
|
|
|
|
||||||
|
Net income
|
|
135,713
|
|
1,014,443
|
|
68,275
|
|
|||
|
Adjustments to reconcile net income to net cash
provided by operating activities:
|
|
|
|
|
|
|
||||
|
Depreciation and amortization
|
|
36,871
|
|
85,524
|
|
70,286
|
|
|||
|
Amortization of deferred charges and debt guarantee
|
|
1,120
|
|
1,900
|
|
1,484
|
|
|||
|
Equity in net (earnings) losses of affiliates
|
|
(15,821
|
)
|
609
|
|
1,900
|
|
|||
|
Gain on disposal to Golar Partners (including amortization of deferred gain)
|
6
|
(65,619
|
)
|
—
|
|
—
|
|
|||
|
Gain on loss of control
|
5
|
—
|
|
(853,996
|
)
|
—
|
|
|||
|
Gain on business acquisition
|
7
|
—
|
|
(4,084
|
)
|
—
|
|
|||
|
Loss on disposal of fixed assets
|
—
|
|
151
|
|
—
|
|
||||
|
Dividend income from available-for-sale and cost investments recognized in operating income
|
(30,960
|
)
|
—
|
|
—
|
|
||||
|
Dividends received
|
64,198
|
|
125
|
|
—
|
|
||||
|
Loss (gain) on disposal of available-for-sale securities
|
|
754
|
|
—
|
|
(541
|
)
|
|||
|
Gain on disposal of high yield bond in Golar Partners
|
(841
|
)
|
—
|
|
—
|
|
||||
|
Compensation cost related to stock options
|
|
500
|
|
1,357
|
|
1,970
|
|
|||
|
Net foreign exchange (gain) losses
|
|
(277
|
)
|
11,905
|
|
1,669
|
|
|||
|
Amortization of deferred tax benefits on intra-group transfers
|
|
(3,487
|
)
|
(7,257
|
)
|
(6,687
|
)
|
|||
|
Impairment of long-term assets
|
|
500
|
|
500
|
|
500
|
|
|||
|
Drydocking expenditure
|
|
(4,248
|
)
|
(20,939
|
)
|
(19,773
|
)
|
|||
|
Interest element included in obligations under capital leases
|
|
—
|
|
401
|
|
898
|
|
|||
|
Change in assets and liabilities, net of effects from the sale of
Golar Maria
:
|
||||||||||
|
Trade accounts receivable
|
|
304
|
|
2,256
|
|
5,245
|
|
|||
|
Inventories
|
|
(10,137
|
)
|
167
|
|
2,479
|
|
|||
|
Prepaid expenses, accrued income and other assets
|
|
(50,877
|
)
|
(7,600
|
)
|
(3,721
|
)
|
|||
|
Amounts due from/to related companies
|
|
3,497
|
|
(1,021
|
)
|
(404
|
)
|
|||
|
Trade accounts payable
|
|
2,525
|
|
(520
|
)
|
(12,804
|
)
|
|||
|
Accrued expenses
|
|
3,349
|
|
10,668
|
|
8,082
|
|
|||
|
Other current liabilities (1)
|
|
658
|
|
(779
|
)
|
(2,250
|
)
|
|||
|
Net cash provided by operating activities
|
|
67,722
|
|
233,810
|
|
116,608
|
|
|||
|
Investing activities
|
||||||||||
|
Additions to vessels and equipment
|
|
(802
|
)
|
(97,228
|
)
|
(99,082
|
)
|
|||
|
Additions to newbuildings
|
|
(733,353
|
)
|
(245,759
|
)
|
(190,100
|
)
|
|||
|
Investment in subsidiary, net of cash acquired
|
7
|
—
|
|
(19,438
|
)
|
—
|
|
|||
|
Cash effect of the deconsolidation of Golar Partners
|
—
|
|
(85,467
|
)
|
—
|
|
||||
|
Vendor refinancing - loan repayment from Golar Partners
|
—
|
|
155,000
|
|
—
|
|
||||
|
Investment in affiliates
|
|
—
|
|
—
|
|
(4,152
|
)
|
|||
(1) Includes accretion of discount on convertible bonds of
$4.7 million
,
$4.0 million
and $
nil
for the years ended December 31, 2013, 2012 and 2011, respectively.
F-6
Golar LNG Limited
Consolidated Statements of Cash Flows for the years ended
December 31, 2013
,
2012
and
2011
(Continued)
|
|
Note
|
2013
|
|
2012
|
|
2011
|
|
|||
|
Investing activities (continued)
|
||||||||||
|
Proceeds from disposal of investments in available-for-sale securities
|
|
99,210
|
|
—
|
|
901
|
|
|||
|
Additions to available-for-sale-securities
|
(12,400
|
)
|
(173
|
)
|
—
|
|
||||
|
Additions to investments
|
(5,649
|
)
|
—
|
|
—
|
|
||||
|
Short-term loan granted to third party
|
(11,960
|
)
|
—
|
|
—
|
|
||||
|
Repayment of short-term loan granted to third party
|
2,469
|
|
—
|
|
—
|
|
||||
|
Proceeds from disposal of business to Golar Partners, net of cash disposed
|
119,927
|
|
—
|
|
—
|
|
||||
|
Proceeds from disposal of high yield bond in Golar Partners
|
34,483
|
|
—
|
|
—
|
|
||||
|
Short-term loan to Golar Partners
|
(20,000
|
)
|
—
|
|
—
|
|
||||
|
Repayment of short-term loan granted to Golar Partners
|
20,000
|
|
—
|
|
—
|
|
||||
|
Proceeds from disposal of fixed assets
|
—
|
|
40
|
|
—
|
|
||||
|
Restricted cash and short-term investments
|
|
(24,992
|
)
|
2,325
|
|
(6,211
|
)
|
|||
|
Net cash used in investing activities
|
|
(533,067
|
)
|
(290,700
|
)
|
(298,644
|
)
|
|||
|
Financing activities
|
|
|
|
|
||||||
|
Proceeds from short-term debt
|
|
—
|
|
—
|
|
23,600
|
|
|||
|
Proceeds from long-term debt (including related parties)
|
26
|
306,358
|
|
642,241
|
|
80,000
|
|
|||
|
Repayments of obligations under capital leases
|
|
—
|
|
(6,288
|
)
|
(6,054
|
)
|
|||
|
Repayments of long-term debt (including related parties)
|
26
|
(9,400
|
)
|
(325,166
|
)
|
(105,750
|
)
|
|||
|
Repayments of short-term debt
|
|
—
|
|
—
|
|
(23,600
|
)
|
|||
|
Financing costs paid
|
(22,612
|
)
|
(7,842
|
)
|
—
|
|
||||
|
Cash dividends paid
|
|
(108,976
|
)
|
(175,904
|
)
|
(65,022
|
)
|
|||
|
Non-controlling interest dividends
|
33
|
—
|
|
(32,082
|
)
|
(12,532
|
)
|
|||
|
Proceeds from exercise of share options (including disposal of treasury shares)
|
|
608
|
|
2,613
|
|
13,845
|
|
|||
|
Proceeds from issuance of equity in Golar Partners to non-controlling interests
|
29
|
—
|
|
317,119
|
|
287,795
|
|
|||
|
Acquisition of non-controlling interests
|
|
—
|
|
—
|
|
(108,050
|
)
|
|||
|
Net cash provided by financing activities
|
|
165,978
|
|
414,691
|
|
84,232
|
|
|||
|
Net (decrease) increase in cash and cash equivalents
|
|
(299,367
|
)
|
357,801
|
|
(97,804
|
)
|
|||
|
Cash and cash equivalents at beginning of period
|
|
424,714
|
|
66,913
|
|
164,717
|
|
|||
|
Cash and cash equivalents at end of period
|
|
125,347
|
|
424,714
|
|
66,913
|
|
|||
|
Supplemental disclosure of cash flow information:
|
|
|
|
|
|
|
|
|||
|
Cash paid during the year for:
|
|
|
|
|
|
|
|
|||
|
Interest paid, net of capitalized interest
|
|
—
|
|
35,798
|
|
30,727
|
|
|||
|
Income taxes paid
|
|
1,322
|
|
1,671
|
|
2,426
|
|
|||
The accompanying notes are an integral part of these consolidated financial statements.
F-7
Golar LNG Limited
Consolidated Statements of Changes in Equity for the years ended
December 31, 2013
,
2012
and
2011
(in thousands of $)
|
Note
|
Share Capital
|
Treasury Shares
|
Additional Paid-in Capital
|
Contri- buted Surplus
|
Accumu-lated Other Compre- hensive Loss
|
Accumu- lated Earnings
|
Non-controll- ing Interest
|
Total
Equity
|
|||||||||||||||||
|
Balance at December 31, 2010
|
|
67,808
|
|
(2,280
|
)
|
100,285
|
|
200,000
|
|
(33,311
|
)
|
78,086
|
|
188,734
|
|
599,322
|
|
||||||||
|
Net income
|
|
—
|
|
—
|
|
—
|
|
—
|
|
—
|
|
46,650
|
|
21,625
|
|
68,275
|
|
||||||||
|
Dividends
|
—
|
|
—
|
|
—
|
|
—
|
|
—
|
|
(86,156
|
)
|
—
|
|
(86,156
|
)
|
|||||||||
|
Grant of share options
|
|
—
|
|
—
|
|
1,970
|
|
—
|
|
—
|
|
—
|
|
—
|
|
1,970
|
|
||||||||
|
Exercise of share options (including disposal of treasury shares)
|
|
825
|
|
2,280
|
|
12,493
|
|
—
|
|
—
|
|
(4,487
|
)
|
667
|
|
11,778
|
|
||||||||
|
Incorporation costs
|
|
—
|
|
—
|
|
40
|
|
—
|
|
—
|
|
—
|
|
—
|
|
40
|
|
||||||||
|
Non-controlling interest dividends
|
|
—
|
|
—
|
|
—
|
|
—
|
|
—
|
|
—
|
|
(12,532
|
)
|
(12,532
|
)
|
||||||||
|
Acquisition of shares in Golar Energy held by non-controlling interest
|
29
|
11,604
|
|
—
|
|
3,853
|
|
—
|
|
1,377
|
|
—
|
|
(129,379
|
)
|
(112,545
|
)
|
||||||||
|
Creation of non-controlling interest in Golar Partners upon its IPO
|
29
|
—
|
|
—
|
|
183,010
|
|
—
|
|
—
|
|
—
|
|
104,773
|
|
287,783
|
|
||||||||
|
Impact of transfer of
Golar Freeze
into Golar Partners
|
29
|
—
|
|
—
|
|
96,732
|
|
—
|
|
—
|
|
—
|
|
(96,732
|
)
|
—
|
|
||||||||
|
Other comprehensive (loss) income
|
—
|
|
—
|
|
—
|
|
—
|
|
(3,014
|
)
|
—
|
|
899
|
|
(2,115
|
)
|
|||||||||
|
Balance at December 31, 2011
|
|
80,237
|
|
—
|
|
398,383
|
|
200,000
|
|
(34,948
|
)
|
34,093
|
|
78,055
|
|
755,820
|
|
||||||||
|
Net income
|
|
—
|
|
—
|
|
—
|
|
—
|
|
—
|
|
971,303
|
|
43,140
|
|
1,014,443
|
|
||||||||
|
Dividends
|
|
—
|
|
—
|
|
—
|
|
—
|
|
—
|
|
(154,769
|
)
|
—
|
|
(154,769
|
)
|
||||||||
|
Grant of share options
|
|
—
|
|
—
|
|
1,357
|
|
—
|
|
—
|
|
—
|
|
—
|
|
1,357
|
|
||||||||
|
Issuance of convertible bonds, net of issue costs
|
—
|
|
—
|
|
24,979
|
|
—
|
|
—
|
|
—
|
|
—
|
|
24,979
|
|
|||||||||
|
Exercise of share options
|
|
267
|
|
—
|
|
4,470
|
|
—
|
|
—
|
|
(2,124
|
)
|
—
|
|
2,613
|
|
||||||||
|
Non-controlling interest dividends
|
|
—
|
|
—
|
|
—
|
|
—
|
|
—
|
|
—
|
|
(32,082
|
)
|
(32,082
|
)
|
||||||||
|
Golar Partners - Equity Issuance
|
29
|
—
|
|
—
|
|
50,753
|
|
—
|
|
—
|
|
—
|
|
266,366
|
|
317,119
|
|
||||||||
|
Impact of transfer of
NR Satu
into Golar Partners
|
29
|
—
|
|
—
|
|
85,781
|
|
—
|
|
—
|
|
—
|
|
(85,781
|
)
|
—
|
|
||||||||
|
Impact of transfer of
Golar Grand
into Golar Partners
|
29
|
—
|
|
—
|
|
88,319
|
|
—
|
|
—
|
|
—
|
|
(88,319
|
)
|
—
|
|
||||||||
|
Deconsolidation of Golar Partners
|
5
|
—
|
|
—
|
|
—
|
|
—
|
|
8,989
|
|
—
|
|
(179,285
|
)
|
(170,296
|
)
|
||||||||
|
Other comprehensive income (loss)
|
|
—
|
|
—
|
|
—
|
|
—
|
|
7,229
|
|
—
|
|
(2,094
|
)
|
5,135
|
|
||||||||
|
Balance at December 31, 2012
|
|
80,504
|
|
—
|
|
654,042
|
|
200,000
|
|
(18,730
|
)
|
848,503
|
|
—
|
|
1,764,319
|
|
||||||||
|
Net income
|
—
|
|
—
|
|
—
|
|
—
|
|
—
|
|
135,713
|
|
—
|
|
135,713
|
|
|||||||||
|
Dividends
|
—
|
|
—
|
|
—
|
|
—
|
|
—
|
|
(108,976
|
)
|
—
|
|
(108,976
|
)
|
|||||||||
|
Exercise of share options
|
76
|
|
—
|
|
1,476
|
|
—
|
|
—
|
|
(944
|
)
|
—
|
|
608
|
|
|||||||||
|
Grant of share options
|
—
|
|
—
|
|
500
|
|
—
|
|
—
|
|
—
|
|
—
|
|
500
|
|
|||||||||
|
Other comprehensive income
|
—
|
|
—
|
|
—
|
|
—
|
|
11,973
|
|
—
|
|
—
|
|
11,973
|
|
|||||||||
|
Balance at December 31, 2013
|
80,580
|
|
—
|
|
656,018
|
|
200,000
|
|
(6,757
|
)
|
874,296
|
|
—
|
|
1,804,137
|
|
|||||||||
The accompanying notes are an integral part of these consolidated financial statements.
F-8
Golar LNG Limited
Notes to Consolidated Financial Statements
|
1.
|
GENERAL
|
Golar LNG Limited (the "Company" or "Golar") was incorporated in Hamilton, Bermuda on May 10, 2001 for the purpose of acquiring the liquefied natural gas ("LNG") shipping interests of Osprey Maritime Limited ("Osprey"), which was owned by World Shipholding Limited ("World Shipholding"). As of
December 31, 2013
, World Shipholding owned
45.61%
(
2012
:
45.71%
) of Golar.
As of December 31, 2013, we own and operate a fleet of
seven
LNG carriers and operate Golar LNG Partner LP's ("Golar Partners" or the "Partnership") fleet of
eight
LNG carriers and Floating Storage Regasification Units ("FSRUs").
We are listed solely on the Nasdaq under the symbol: GLNG.
As used herein and unless otherwise required by the context, the terms "Golar", the "Company", "we", "our" and words of similar import refer to Golar or anyone or more of its consolidated subsidiaries, or to all such entities.
Golar LNG Partners LP ("Golar Partners" or the "Partnership")
Golar Partners is our former subsidiary, which is an owner and operator of FSRUs and LNG carriers under long-term charters (defined as
five
years or longer from the date of the dropdown). In April 2011, we completed the initial public offering ("IPO") of Golar Partners and its listing on the Nasdaq stock exchange. As a result of the offering, our ownership interest was reduced to
65.4%
(including our
2%
general partner interest). Since its IPO, Golar Partners has completed further follow-on equity offerings, such that as of December 31, 2013, our ownership interest has decreased to
41.4%
(2012:
54.1%
) (see note 29).
Under the provisions of the partnership agreement, the general partner irrevocably delegated the authority to the Partnership's board of directors to have the power to oversee and direct the operations of, manage and determine the strategies and policies of the Partnership. During the period from the IPO in April 2011 until the time of Golar Partners' first AGM on December 13, 2012, we retained the sole power to appoint, remove and replace all members of Golar Partners' board of directors. From the first Golar Partners' Annual General Meeting ("AGM"), the majority of the board members became electable by the common unitholders and accordingly, from this date, we no longer retain the power to control the board of Golar Partners. As a result, from December 13, 2012, Golar Partners has been considered as an affiliate entity and not as our controlled subsidiary (see note 5).
|
2.
|
ACCOUNTING POLICIES
|
Basis of accounting
The financial statements are prepared in accordance with accounting principles generally accepted in the United States of America.
Principles of consolidation
Investments in companies in which we directly or indirectly hold more than 50% of the voting control are consolidated in the financial statements, as well as certain variable interest entities in which the Company is deemed to be subject to a majority of the risk of loss from the variable interest entity's activities or entitled to receive a majority of the entity's residual returns, or both. All inter-company balances and transactions are eliminated. The non-controlling interests of subsidiaries were included in the Consolidated Balance Sheets and Statements of Operations as "Non-controlling interests".
F-9
A variable interest entity, or VIE, is defined by the accounting standard as a legal entity where either (a) equity interest holders as a group lack the characteristics of a controlling financial interest, including decision making ability and an interest in the entity's residual risks and rewards, or (b) the equity holders have not provided sufficient equity investment to permit the entity to finance its activities without additional subordinated financial support, or (c) the voting rights of some investors are not proportional to their obligations to absorb the expected losses of the entity, their rights to receive the expected residual returns of the entity, or both and substantially all of the entity's activities either involve or are conducted on behalf of an investor that has disproportionately few voting rights. A party that is a variable interest holder is required to consolidate a VIE if the holder has both (a) the power to direct the activities that most significantly impact the entity's economic performance and (b) the obligation to absorb losses that could potentially be significant to the VIE or the right to receive benefits from the VIE that could potentially be significant to the VIE.
Business combinations of subsidiaries are accounted for under the acquisition method. On acquisition, the identifiable assets, liabilities and contingent liabilities of a subsidiary are measured at their fair values at the date of acquisition. Any excess of the cost of acquisition over the fair values of the identifiable net assets acquired is recognized as goodwill. Any deficiency of the cost of acquisition below the fair values of the identifiable net assets acquired (i.e. bargain purchase) is credited to the statement of operations in the period of acquisition. The consideration transferred for an acquisition is measured at fair value of the consideration given. Acquisition related costs are expensed as incurred. Identifiable assets acquired and liabilities assumed in a business combination are measured initially at their fair values at the acquisition date. The results of subsidiary undertakings are included from the date of acquisition.
Investments in affiliates
Affiliates are entities over which we generally have between 20% and 50% of the voting rights, or over which we have significant influence, but over which we do not exercise control, or have the power to control the financial and operational policies. Investments in these entities are accounted for by the equity method of accounting. This also extends to entities in which we hold a majority ownership interest, but we do not control, due to the participating rights of non-controlling interests. Under this method, we record an investment in the common stock (or “in-substance common stock”) of an affiliate at cost (or fair value if a consequence of deconsolidation), and adjust the carrying amount for our share of the earnings or losses of the affiliate subsequent to the date of the investment and report the recognized earnings or losses in income. Dividends received from an affiliate in connection with their common stock interest reduce the carrying amount of the investment. The excess, if any, of the purchase price over book value of our investments in equity method affiliates is included in the consolidated balance sheet as "Investment in Affiliates". When our share of losses in an affiliate equals or exceeds its interest, we do not recognize further losses, unless the Company has incurred obligations or made payments on behalf of the affiliate. See note 14 for list of entities accounted for under the equity method.
We recognize gains and losses in earnings for the issuance of shares by our affiliates, provided that the issuance of such shares qualifies as a sale of such shares. No gains and losses are recognized upon the issuance of common units of Golar Partners to third parties as the equity method of accounting is only applied to our holding in the subordinated units of Golar Partners.
Revenue and expense recognition
Revenues include minimum lease payments under time charters, fees for repositioning vessels as well as the reimbursement of certain vessel operating and drydocking costs. Revenues generated from time charters, which we classify as operating leases, are recorded over the term of the charter as service is provided. However, we do not recognize revenue if a charter has not been contractually committed to by a customer and ourselves, even if the vessel has discharged its cargo and is sailing to the anticipated load port on its next voyage.
Reimbursement for drydocking costs is recognized evenly over the period to the next drydocking, which is generally between
two
to
five
years. Repositioning fees (which are included in time charter revenue) received in respect of time charters are recognized at the end of the charter when the fee becomes fixed and determinable. However, where there is a fixed amount specified in the charter, which is not dependent upon redelivery location, the fee will be recognized evenly over the term of the charter. Where a vessel undertakes multiple single voyage time charters, revenue is recognized, including the repositioning fee if fixed and determinable, on a discharge-to-discharge basis. Under this basis, revenue is recognized evenly over the period from departure of the vessel from its last discharge port to departure from the next discharge port. For arrangements where operating costs are borne by the charterer on a pass through basis, the pass through of operating costs is reflected in revenue and expenses.
Revenues generated from management fees are recorded rateably over the term of the contract as services are provided.
F-10
Under time charters, voyage expenses are generally paid by our customers. Voyage related expenses, principally fuel, may also be incurred when positioning or repositioning the vessel before or after the period of time charter and during periods when the vessel is not under charter or is offhire, for example when the vessel is undergoing repairs. These expenses are recognized as incurred.
Revenue includes amounts receivable from loss of hire insurance, which is recognized on an accruals basis, to the value of $
nil
,
$2.1 million
and
$0.4 million
for each of the years ended
December 31, 2013
,
2012
and
2011
, respectively.
Vessel operating expenses, which are recognized when incurred, include crewing, repairs and maintenance, insurance, stores, lube oils, communication expenses and third party management fees.
Cash and cash equivalents
We consider all demand and time deposits and highly liquid investments with original maturities of three months or less to be equivalent to cash.
Restricted cash and short-term investments
Restricted cash and short-term investments consist of bank deposits which may only be used to settle certain pre-arranged loan and bid bonds in respect of tenders for projects we have entered into. We consider all short-term investments as held to maturity. These investments are carried at amortized cost. We place our short-term investments primarily in fixed term deposits with high credit quality financial institutions.
Inventories
Inventories, which are comprised principally of fuel, lubricating oils and ship spares, are stated at the lower of cost or market value. Cost is determined on a first-in, first-out basis.
Newbuildings
Newbuilds are stated at cost. All pre-delivery costs incurred during the construction of newbuilds, including purchase installments, interest, supervision and technical costs, are capitalized. Newbuilds are not depreciated until the vessel is available for use.
Interest costs capitalized in connection with the newbuildings for the years ended
December 31, 2013
,
2012
and
2011
were
$22.5 million
,
$10.3 million
and
$3.6 million
, respectively.
Vessels and equipment
Vessels and equipment are stated at cost less accumulated depreciation. The cost of vessels and equipment less the estimated residual value is depreciated on a straight-line basis over the assets' remaining useful economic lives. Depreciation includes depreciation on all owned vessels and amortization of vessels accounted for as capital leases.
Refurbishment costs incurred during the period are capitalized as part of vessels and equipment and depreciated over the vessels' remaining useful economic lives. Refurbishment costs are costs that appreciably increase the capacity, or improve the efficiency or safety of vessels and equipment. Drydocking expenditures are capitalized when incurred and amortized over the period until the next anticipated drydocking, which is generally between
two
and
five
years. For vessels that are newly built or acquired, we have adopted the "built-in overhaul" method of accounting. The built-in overhaul method is based on the segregation of vessel costs into those that should be depreciated over the useful life of the vessel and those that require drydocking at periodic intervals to reflect the different useful lives of the components of the assets. The estimated cost of the drydocking component is amortized until the date of the first drydocking following acquisition, upon which the cost is capitalized and the process is repeated.
Vessel reactivation costs incurred on vessels leaving lay-up include both costs of a capital and expense nature. The capital costs include the addition of new equipment or modifications to the vessel which enhance or increase the operational efficiency and functionality of the vessel. These expenditures are capitalized and depreciated over the remaining useful life of the vessel. Expenditures of a routine repairs and maintenance nature, that do not improve the operating efficiency or extend the useful lives of the vessels are expensed as incurred as mobilization costs.
F-11
Useful lives applied in depreciation are as follows:
|
Vessels
|
40 to 50 years
|
|
Deferred drydocking expenditure
|
two to five years
|
|
Office equipment and fittings
|
three to six years
|
Interest costs capitalized in connection with the retrofitting of vessels into FSRUs for the years ended
December 31, 2013
,
2012
and
2011
were $
nil
,
$1.8 million
and
$1.9 million
, respectively.
Vessels under capital lease
Historically, we have leased certain vessels under agreements that were accounted for as capital leases. Obligations under capital leases were carried at the present value of future minimum lease payments. The accounting policies relating to the asset balance, such as depreciation and drydocking expenditure followed those described under "Vessels and equipment". Interest expense was calculated at a constant rate over the term of the lease. Certain of our capital leases were 'funded' via long term cash deposits which closely matched the lease liability.
As of December 31, 2013 and 2012, we did not lease any vessels under capital leases. Accordingly, following the deconsolidation of Golar Partners, the drydocking costs and accumulated amortization were $
nil
in each of the years ended December 31, 2013 and 2012.
Depreciation and amortization expense for vessels under capital leases for the years ended December 31, 2013, 2012 and 2011 was $
nil
,
$15.8 million
and
$16.6 million
, respectively.
Interest costs capitalized
Interest costs are expensed as incurred except for interest costs that are capitalized. Interest is capitalized on all qualifying assets that require a period of time to get them ready for their intended use. Qualifying assets consist of vessels under construction and includes vessels undergoing conversion into FSRUs for our own use. The interest capitalized is calculated using the rate of interest on the loan to fund the expenditure or our weighted average cost of borrowings where appropriate, over the term period from commencement of the newbuilding and conversion work until substantially all the activities necessary to prepare the assets for its intended use are complete.
Deferred credit from capital leases
Income derived from the sale of subsequently leased assets is deferred and amortized in proportion to the amortization of the leased assets. Amortization of deferred income is offset against depreciation and amortization expense in the Consolidated Statement of Operations.
Impairment of long-term assets
We continually monitor events and changes in circumstances that could indicate carrying amounts of long-term assets may not be recoverable. When such events or changes in circumstances are present, we assess the recoverability of long-term assets by determining whether the carrying value of such assets will be recovered through undiscounted expected future cash flows. If the total of the future cash flows is less than the carrying amount of those assets, we recognize an impairment loss based on the excess of the carrying amount over the fair value of the assets.
During 2013, we considered the softening in the LNG shipping market and the current operating losses of our vessels in lay-up as potential indicators of impairment of these three vessels. We assessed potential impairment of the three vessels we currently have in lay-up by comparing the expected discounted cash flows based on assumption that these vessels, in conjunction with our Front End Engineering Design study (FEED), will be converted and operated as FLNGVs. We compared these discounted cash flows to the respective carrying values and concluded there was no impairment of these vessels as of December 31, 2013.
F-12
Deferred charges
Costs associated with long-term financing, including debt arrangement fees, are deferred and amortized over the term of the relevant loan. Amortization of deferred loan costs is included in "Other financial items" in the Consolidated Statement of Operations. If a loan is repaid early, any unamortized portion of the related deferred charges is charged against income in the period in which the loan is repaid.
Trade receivables
Trade receivables are presented net of allowances for doubtful balances. At each balance sheet date, all potentially uncollectible accounts are assessed individually for purposes of determining the appropriate provision for doubtful accounts.
Investment in available-for-sale securities
We classify our existing marketable equity securities as available-for-sale. These securities are carried at fair value, with unrealized gains and losses excluded from earnings and reported directly in stockholders' equity as a component of other comprehensive income (loss) unless a gain is realized upon the sale of these units or an unrealized loss is considered "other-than-temporary," in which case it is transferred to the statement of operations. Management evaluates securities for other than temporary impairment ("OTTI") on a periodic basis. Consideration is given to (1) the length of time and the extent to which the fair value has been less than cost, (2) the financial condition and near-term prospects of the investee, and (3) the intent and ability of the Company to retain its investment in the investee for a period of time sufficient to allow for any anticipated recovery in fair value.
Cost-method investments
Cost-method investments are initially recorded at cost and reviewed for impairment whenever events or changes in circumstances indicate that the carrying amount of an asset may not be recoverable.
Derivatives
We use derivatives to reduce market risks associated with our operations. We use interest rate swaps for the management of interest rate risk exposure. The interest rate swaps effectively convert a portion of our debt from a floating to a fixed rate over the life of the transactions without an exchange of underlying principal.
We seek to reduce our exposure to fluctuations in foreign exchange rates through the use of foreign currency forward contracts.
All derivative instruments are initially recorded at cost as either assets or liabilities in the accompanying Consolidated Balance Sheet and subsequently remeasured to fair value, regardless of the purpose or intent for holding the derivative. Where the fair value of a derivative instrument is a net liability, the derivative instrument is classified in "Other current liabilities" in the Consolidated Balance Sheet. Where the fair value of a derivative instrument is a net asset, the derivative instrument is classified in "Other non-current assets" in the Consolidated Balance Sheet, except if the current portion is a liability, in which case the current portion is included in "Other current liabilities." The method of recognizing the resulting gain or loss is dependent on whether the derivative contract is designed to hedge a specific risk and also qualifies for hedge accounting. The Company hedge accounts for certain of its interest rate swap arrangements designated as cash flow hedges. For derivative instruments that are not designated or do not qualify as hedges under the guidance, the changes in fair value of the derivative financial instrument are recognized each period in current earnings in "Other financial items".
When a derivative is designated as a cash flow hedge, we formally document the relationship between the derivative and the hedged item. This documentation includes the strategy risk and risk management for undertaking the hedge and the method that will be used to assess effectiveness of the hedge. If the derivative is an effective hedge, changes in the fair value are initially recorded as a component of accumulated other comprehensive income in equity. The ineffective portion of the hedge is recognized immediately in earnings, as are any gains or losses on the derivative that are excluded from the assessment of hedge effectiveness. We do not apply hedge accounting if we determine that the hedge was not effective or will no longer be effective, the derivative was sold or exercised, or the hedged item was sold or repaid.
F-13
In the periods when the hedged items affect earnings, the associated fair value changes on the hedged derivatives are transferred from equity to the corresponding earnings line item on the settlement of a derivative. The ineffective portion of the change in fair value of the derivative financial instrument is immediately recognized in earnings. If a cash flow hedge is terminated and the originally hedged item is still considered probable of occurring, the gains and losses initially recognized in equity remain there until the hedged item impacts earnings at which point they are transferred to the corresponding earnings line item (i.e. interest expense). If the hedged items are no longer probable of occurring, amounts recognized in equity are immediately reclassified to earnings.
Cash flows from derivative instruments that are accounted for as cash flow hedges are classified in the same category as the cash flows from the items being hedged. Cashflows from economic hedges are classified in the same category from the items subject to the economic hedging relationship.
LNG trading
We trade in physical cargoes, futures, swaps and options, all of which are traded on and recognized in liquid markets. Purchases and sales are recognized on the trade date. Open trading positions are stated at fair value based on closing market price on the balance sheet date. The market values of open positions are shown in debtors if positive or creditors if negative. Realized and unrealized gains and losses are recognized in current earnings in "Other operating gains and losses". The gross transaction value of energy trading contracts that were physically settled for the years ending
December 31, 2013
,
2012
and
2011
, was $
nil
, $
nil
and
$2.0 million
profit, respectively.
Contracts to buy and sell physical cargoes for future delivery settled on the bill of lading date are recognized at their fair value at the balance sheet date.
Foreign currencies
Our functional currency is the U.S. dollar as the majority of the revenues are received in U.S. dollars and a majority of our expenditures are made in U.S. dollars. Our reporting currency is U.S. dollars.
Transactions in foreign currencies during the year are translated into U.S. dollars at the rates of exchange in effect at the date of the transaction. Foreign currency monetary assets and liabilities are translated using rates of exchange at the balance sheet date. Foreign currency non-monetary assets and liabilities are translated using historical rates of exchange. Foreign currency transaction and translation gains or losses are included in the Consolidated Statements of Operations.
Provisions
In the ordinary course of business, we are subject to various claims, suits and complaints. Management, in consultation with internal and external advisers, will provide for a contingent loss in the financial statements if the contingency had occurred at the date of the financial statements and the likelihood of loss was probable and the amount can be reasonably estimated. If we determine that the reasonable estimate of the loss is a range and there is no best estimate within the range, we will provide the lower amount within the range. See note 35, "Other Commitments and Contingencies" for further discussion.
Fair value measurements
We account for fair value measurement in accordance with the Accounting Standards Codification ("ASC") guidance using fair value to measure assets and liabilities. The guidance provides a single definition of fair value, together with a framework for measuring it, and requires additional disclosure about the use of fair value to measure assets and liabilities.
Stock-based compensation
In accordance with the guidance on "Share Based Payment", we are required to expense the fair value of stock options issued to employees over the period the options vest. We amortize stock-based compensation for awards on a straight-line basis over the period during which the employee is required to provide service in exchange for the reward - the requisite service (vesting) period. No compensation cost is recognized for stock options for which employees do not render the requisite service. The fair value of employee share options is estimated using the Black-Scholes option-pricing model.
F-14
Earnings per share
Basic earnings per share ("EPS") is computed based on the income available to common stockholders and the weighted average number of shares outstanding for basic EPS. Treasury shares are not included in the calculation. Diluted EPS includes the effect of the assumed conversion of potentially dilutive instruments. Such potentially dilutive common shares are excluded when the effect would be to increase earnings per share or reduce a loss per share.
Pensions
Defined benefit pension costs, assets and liabilities requires adjustment of the significant actuarial assumptions annually to reflect current market and economic conditions. Our accounting policy states that full recognition of the funded status of defined benefit pension plans is to be included within our balance sheet. The pension benefit obligation is calculated by using a projected unit credit method.
Defined contribution pension costs represent the contributions payable to the scheme in respect of the accounting period and are recorded in the Consolidated Statement of Operations.
Operating leases
Initial direct costs (those directly related to the negotiation and consummation of the lease) are deferred and allocated to earnings over the lease term. Rental income and expense are amortized over the lease term on a straight-line basis.
Income taxes
Income taxes are based on a separate return basis. The guidance on "Accounting for Income Taxes" prescribes a recognition threshold and measurement attributes for the financial statement recognition and measurement of a tax position taken or expected to be taken in a tax return.
Deferred tax assets and liabilities are recognized principally for the expected tax consequences of temporary differences between the tax bases of assets and liabilities and their reported amounts. Deferred tax assets are reduced by a valuation allowance when, in the opinion of management, it is more likely than not that some portion or all of the deferred tax assets will not be realized. Realization of the deferred income tax asset is dependent on generating sufficient taxable income in future years.
Deferred tax assets and liabilities are measured at the tax rates that are expected to apply to the year when the asset is realized or the liability is settled, based on the tax rates and tax laws that have been enacted or substantively enacted at the balance sheet date. Income tax relating to items recognized directly in the statement of comprehensive income is recognized in the statement of changes in equity and not in the statement of operations.
Gain on issuance of shares by subsidiaries
We recognize a gain or loss when a subsidiary issues its stock to third parties at a price per share in excess or below its carrying value resulting in a reduction in our ownership interest in the subsidiary. The gain or loss is recorded in the line "Additional paid-in capital".
Gain on disposal of a subsidiary to Golar Partners
We recognize a gain upon disposal of a subsidiary to Golar Partners at the time of sale and defers an element of the gain based on our holding in the subordinated units in Golar Partners measured at the date of dropdown. The gain is deferred under "Other long-term liabilities" and released to income over the remaining useful life of the vessel or until it is sold.
Segment reporting
A segment is a distinguishable component of the business that is engaged in business activities from which we earn revenues and incur expenses whose operating results are regularly reviewed by the chief operating decision maker, and which are subject to risks and rewards that are different from those of other segments. We have identified
two
reportable industry segments: vessel operations and LNG trading.
F-15
Treasury shares
Treasury shares are recognized as a separate component of equity at cost. Upon subsequent disposal of treasury shares, any consideration is recognized directly in equity.
Convertible bonds
In accordance with ASC 470-20 "Debt with conversion and other options", we account for debt instruments with convertible features in accordance with the details and substance of the instruments at the time of their issuance. For convertible debt instruments issued at a substantial premium to equivalent instruments without conversion features, or those that may be settled in cash upon conversion, it is presumed that the premium or cash conversion option represents an equity component.
Accordingly, we determine the carrying amounts of the liability and equity components of such convertible debt instruments by first determining the carrying amount of the liability component by measuring the fair value of a similar liability that does not have an equity component. The carrying amount of the equity component representing the embedded conversion option is then determined by deducting the fair value of the liability component from the total proceeds from the issue. The resulting equity component is recorded, with a corresponding offset to debt discount which is subsequently amortized to interest cost using the effective interest method over the period the debt is expected to be outstanding as an additional non-cash interest expense. Transaction costs associated with the instrument are allocated pro-rata between the debt and equity components.
For conventional convertible bonds which do not have a cash conversion option or where no substantial premium is received on issuance, it may not be appropriate to split the bond into the liability and equity components.
Guarantees
Guarantees issued by us, excluding those that are guaranteeing our own performance, are recognized at fair value at the time that the guarantees are issued, or upon the deconsolidation of a subsidiary, as in the case of Golar Partners (see note 5) and reported in "other long-term liabilities." A liability for the fair value of the obligation undertaken in issuing the guarantee is recognized. If it becomes probable that we will have to perform under a guarantee, we will recognize an additional liability if the amount of the loss can be reasonably estimated. The recognition of fair value is not required for certain guarantees such as the parent's guarantee of a subsidiary's debt to a third party. For those guarantees excluded from the above guidance requiring the fair value recognition provision of the liability, financial statement disclosures of such items are made.
Use of estimates
The preparation of financial statements in accordance with U.S. GAAP requires that management make estimates and assumptions affecting the reported amounts of assets and liabilities and disclosure of contingent assets and liabilities at the date of the financial statements and the reported amounts of revenues and expenses during the reporting period. Actual results could differ from those estimates.
F-16
|
3.
|
SUBSIDIARIES
|
The following table lists our significant subsidiaries and their purpose as at
December 31, 2013
. Unless otherwise indicated, we own a
100%
controlling interest in each of the following subsidiaries.
|
Name
|
Jurisdiction of Incorporation
|
Purpose
|
|
Golar LNG 1460 Corporation
|
Marshall Islands
|
Owns
Golar Viking
|
|
Golar LNG 2216 Corporation
|
Marshall Islands
|
Owns
Golar Arctic
|
|
Golar Management Limited
|
United Kingdom
|
Management company
|
|
Golar GP LLC – Limited Liability Company
|
Marshall Islands
|
Holding company
|
|
Golar LNG Energy Limited
|
Bermuda
|
Holding company
|
|
Golar Gimi Limited
|
Marshall Islands
|
Owns
Gimi
|
|
Golar Hilli Limited
|
Marshall Islands
|
Owns
Hilli
|
|
Bluewater Gandria N.V.
|
Netherlands
|
Owns and Operates
Golar Gandria
|
|
Golar Hull M2021 Corporation
|
Marshall Islands
|
Owns Hull 2021 (
Golar Seal
)
|
|
Golar Hull M2022 Corporation
|
Marshall Islands
|
Owns Hull 2022 (
Golar Crystal
)
|
|
Golar Hull M2023 Corporation
|
Marshall Islands
|
Owns Hull 2023 (
Golar Penguin
)
|
|
Golar Hull M2024 Corporation
|
Marshall Islands
|
Owns Hull 2024 (
Golar Eskimo
)
|
|
Golar Hull M2026 Corporation
|
Marshall Islands
|
Owns Hull 2026 (
Golar Celsius
)
|
|
Golar Hull M2027 Corporation
|
Marshall Islands
|
Owns Hull 2027 (
Golar Bear
)
|
|
Golar Hull M2031 Corporation
|
Marshall Islands
|
Owns Hull 2031 (
Golar Igloo
)
|
|
Golar Hull M2047 Corporation
|
Marshall Islands
|
Owns Hull 2047 (
Golar Snow
)
|
|
Golar Hull M2048 Corporation
|
Marshall Islands
|
Owns Hull 2048 (
Golar Ice
)
|
|
Golar LNG NB10 Corporation
|
Marshall Islands
|
Owns Hull S658 (
Golar Glacier
)
|
|
Golar LNG NB11 Corporation
|
Marshall Islands
|
Owns Hull S659 (
Golar Kelvin
)
|
|
Golar LNG NB12 Corporation
|
Marshall Islands
|
Owns Hull 2055 (
Golar Frost
)
|
|
Golar LNG NB13 Corporation
|
Marshall Islands
|
Owns Hull 2056 (
Golar Tundra
)
|
|
4.
|
RECENTLY ISSUED ACCOUNTING STANDARDS
|
Adoption of new accounting standards
In December 2011, the Financial Accounting Standards Board ("FASB") amended guidance on disclosures about offsetting assets and liabilities. The amendments require an entity to disclose information about offsetting and related arrangements to enable users of its financial statements to understand the effect of those arrangements on its financial position. The amendments will enhance disclosures required by U.S. GAAP by requiring improved information about financial instruments and derivative instruments that are either offset or subject to an enforceable master netting arrangement or similar agreement, irrespective of whether they are offset in accordance with U.S. GAAP. This information will enable users of an entity's financial statements to evaluate the effect or potential effect of netting arrangements on an entity's financial position, including the effect or potential effect of netting arrangements on an entity's financial position, including the effect or potential effect of rights of set-off associated with certain financial instruments and derivative instruments in the scope of this update. The amendments were required for annual reporting periods beginning on or after January 1, 2013, and interim periods within those annual periods. An entity should provide the disclosures required by those amendments retrospectively for all comparative periods presented. The amendment resulted in additional disclosures in our consolidated financial statements included herein.
In July 2012, the FASB amended disclosure requirements relating to testing indefinite-lived intangible assets for impairment. The amendments no longer require entities to disclose the quantitative information about significant unobservable inputs used in fair value measurements categorized within Level 3 of the fair value hierarchy that relate to the financial accounting and reporting for an indefinite-lived intangible asset after its initial recognition. The amendment is effective for annual and interim impairment tests performed for fiscal years beginning after September 15, 2012. Early adoption is permitted. The amendment did not have a material impact on our consolidated financial statements.
F-17
In October 2012, the FASB amended several disclosure requirements of the FASB Accounting Standards Codification relating to investments, consolidation, accounting changes and error corrections, inventory, retirement benefits for defined benefit plans, financial instruments and balance sheet. The amendments are effective for fiscal periods beginning after December 15, 2012. The amendment did not have a material impact on our consolidated financial statements.
In February 2013, further guidance was provided relating to the reporting of the effects on net income of significant amounts reclassified out of each component of accumulated other comprehensive income. Under the updated guidance, the effects on net income of significant amounts reclassified out of each component of accumulated other comprehensive income shall be shown, in one location, either on the face of the statement where net income is presented or as a separate disclosure in the notes to the financial statements. The amendment resulted in additional disclosures in our consolidated financial statements included herein.
In July 2013, the FASB amended ASC Topic 815 permitting the Fed Funds Effective Swap Rate to be used as a U.S. benchmark interest rate for hedge accounting purposes, in addition to U.S. Treasury interest rates and the London Interbank Offered Rate. The amendments also remove the restriction on using different benchmark rates for similar hedges. The amendments shall be applied prospectively for qualifying new or redesignated hedging relationships entered into on or after July 17, 2013. The Company did not enter into any qualifying new or redesignated hedging relationships after July 17, 2013 up to the date of these consolidated financial statements and the adoption of this guidance did not have a material effect in our consolidated financial statements.
New accounting standards not yet adopted
In February 2013, the FASB issued guidance for the recognition, measurement and disclosure of obligations resulting from joint and several liability arrangements for which the total amount of the obligation is fixed at the reporting date, including debt arrangements, other contractual obligations and settled litigation and judicial rulings. The guidance requires an entity to measure obligations resulting from joint and several liability arrangements for which the total amount of the obligation within the scope of this guidance is fixed at the reporting date, as the sum of (a) the amount the reporting entity agreed to pay on the basis of its arrangement among its co-obligors and (b) any additional amount the reporting entity expects to pay on behalf of its co-obligors. The guidance also requires an entity to disclose the nature and amount of the obligation as well as other information about those obligations. The amendments are effective for fiscal years, and interim periods within those years, beginning after December 15, 2013. We are evaluating the impact of the adoption of this amended guidance in the financial statements.
In July 2013, the FASB issued guidance for the presentation of an unrecognized tax benefit when a net operating loss carryforward, a similar tax loss, or a tax credit carryforward exists to provide guidance on the presentation of unrecognized tax benefits. The guidance requires an entity to present an unrecognized tax benefit, or a portion of an unrecognized tax benefit, in the financial statements as a reduction to a deferred tax asset for a net operating loss carryforward, a similar tax loss, or a tax credit carryforward, to the extent a net operating loss carryforward, a similar tax loss, or a tax credit carryforward is not available at the reporting date under the tax law of the applicable jurisdiction to settle any additional income taxes that would result from the disallowance of a tax position or the tax law of the applicable jurisdiction does not require the entity to use, and the entity does not intend to use, the deferred tax asset for such purpose, the unrecognized tax benefit should be presented in the financial statements as a liability and should not be combined with deferred tax assets. The amendments are effective for fiscal years, and interim periods within those years, beginning after December 15, 2013. We are evaluating the impact of the adoption of this amended guidance in the financial statements.
|
5.
|
DECONSOLIDATION OF GOLAR PARTNERS
|
Under the provisions of the partnership agreement, the general partner irrevocably delegated the authority to the Partnership's board of directors to have the power to oversee and direct the operations of, manage and determine the strategies and policies of Golar Partners. During the period from Golar Partner's IPO in April 2011 until the time of its first AGM on December 13, 2012, Golar retained the sole power to appoint, remove and replace all members of Golar Partner's board of directors. From the first AGM, majority of the board members became electable by the common unitholders and accordingly, from this date we no longer retain the power to control the board of directors. As a result, from December 13, 2012, Golar Partners has been considered as an affiliate entity and not as our controlled subsidiary.
On December 13, 2012, based on the equity method, we recorded an investment in Golar Partners of $
362.8 million
, which represents the fair value of our subordinated units (in-substance common stock) held on the deconsolidation date. On the same date, we calculated a gain on loss of control of
$854.0 million
. The gain on loss of control is calculated as follows:
F-18
|
(in thousands of $)
|
As of deconsolidation date (December 13, 2012)
|
|
|
|
Fair value of investment in Golar Partners (a)
|
900,926
|
|
|
|
Carrying value of the non-controlling interest in Golar Partners
|
179,285
|
|
|
|
Subtotal
|
1,080,211
|
|
|
|
Less:
|
|||
|
Carrying value of Golar Partner's net assets
|
238,409
|
|
|
|
Guarantees issued to Golar Partners (c)
|
23,266
|
|
|
|
Accumulated other comprehensive loss relating to Golar Partners (d)
|
8,989
|
|
|
|
Deferred tax benefit on intra-group transfers of long-term assets (f)
|
(44,449
|
)
|
|
|
Gain on loss of control of Golar Partners
|
853,996
|
|
|
(a) Fair value of investment in Golar Partners
Our residual interest in Golar Partners as of December 13, 2012 comprised of the following:
|
(in thousands of $)
|
As of December 13, 2012
|
|
|
Common units (i)
|
346,950
|
|
|
General Partner units and Incentive Distribution Rights ("IDRs") (ii)
|
191,177
|
|
|
Subordinated units (iii)
|
362,799
|
|
|
900,926
|
|
|
As of December 31, 2013, the carrying value of our total investment in Golar Partners is
$809.0 million
(2012:
$906.1 million
).
(i) Common units (available-for-sale securities)
As of December 13, 2012, we held
11.8 million
common units representing
32.6%
of the common units in issue, as a class. Our holding in the voting common units of Golar Partners have been accounted for under the guidance for available-for-sale securities on the basis that during the subordination period the common units have preferential dividend and liquidation rights. Accordingly, these securities are carried at fair value and any unrealized gains and losses on these securities are reflected directly in equity unless a gain is realized upon sale of these units or an unrealized loss is considered "other-than-temporary", in which case it is transferred to the statement of operations. Dividends received from its common units in Golar Partners during the subordination period will be recorded in the consolidated statement of operations in the line item "Dividend income".
(ii) General Partner units and IDRs
Our
2%
general partner interest and
100%
of the incentive distribution rights (IDRs) in Golar Partners have been accounted for as cost-method investments on the basis that the general partner interests have preferential liquidation and dividend rights during the subordination period.
Our interest in the general partner units have been recorded at their fair value as of December 13, 2012, based on the share price of the publicly traded common units of Golar Partners but adjusted for restrictions over their transferability and reduction in voting rights. The fair value of the IDRs as of December 13, 2012 was determined using a Monte Carlo simulation method. This simulation was performed within the Black Scholes option pricing model then solved via an iterative process by applying the Newton-Raphson method for the fair value of the IDRs, such that the price of a unit output by the Monte Carlo simulation equalled the price observed in the market. The method took into account the historical volatility, dividend yield as well as the share price of the units as of the deconsolidation date.
F-19
(iii) Subordinated units
As of December 13, 2012, we held
15.9 million
units representing
100%
of the subordinated units. Our holding in the subordinated units of Golar Partners have been accounted for under the equity method on the basis that the subordinated units are considered to be, in-substance, common stock for accounting purposes. The fair value on December 13, 2012, was determined based on the quoted market price of the listed common units as of the deconsolidation date but discounted principally for their non-tradability and subordinated dividend and liquidation rights during the subordination period. The subordination period will end on the satisfaction of various tests as prescribed in the Partnership Agreement, but will not end before March 31, 2016, except with our removal as the general partner. Upon the expiration of the subordination period, the subordinated units will convert into common units subject to passing certain conditions.
(b) Accounting for basis difference
The investment in Golar Partners recorded under the equity method included our share of the basis difference between the fair value and the underlying book value of Golar Partners' assets at the deconsolidation date.
|
(in thousands of $)
|
Book value
|
Fair value
|
Basis difference
|
Golar's share of the basis difference
|
|||||||
|
100%
|
100%
|
100%
|
24.8%*
|
||||||||
|
Vessels and equipment and vessels under capital leases (i)
|
1,192,779
|
|
1,687,162
|
|
494,383
|
|
122,591
|
|
|||
|
Charter agreements (ii)
|
—
|
|
508,631
|
|
508,631
|
|
126,124
|
|
|||
|
Goodwill (iii)
|
—
|
|
445,100
|
|
445,100
|
|
110,371
|
|
|||
|
1,192,779
|
|
2,640,893
|
|
1,448,114
|
|
359,086
|
|
||||
*Our share of the basis difference is with reference to our holding in the subordinated units only.
The basis difference has been accounted for as follows:
(i) The basis difference assigned to vessels and equipment is being depreciated over the remaining estimated useful lives of the vessels and is recorded as a component of "Equity in net earnings (losses) of affiliates".
(ii) The basis difference relating to the charter agreements is being amortized over the remaining term of the charters and is recorded as a component of "Equity in net earnings (losses) of affiliates".
(iii) For the assigned goodwill, we will recognize our share of any impairment charge recorded by Golar Partners and consider the effect, if any, of the impairment on the assigned goodwill.
(c) Guarantees
In accordance with ASC 460, the guarantees we issued in respect of Golar Partners and its subsidiaries were fair valued as of the deconsolidation date of December 13, 2012. As of December 13, 2012, the fair value of the guarantees amounted to a liability of
$23.3 million
which is recorded in "Other long-term liabilities" and comprised of the following items:
|
(in thousands of $)
|
As of December 13, 2012
|
|
|
|
Debt guarantees
|
4,548
|
|
|
|
Golar Grand Option
|
7,217
|
|
|
|
Methane Princess tax lease indemnity
|
11,500
|
|
|
|
23,265
|
|
||
F-20
The debt guarantees we issued to third party banks were in respect of certain secured debt facilities relating to Golar Partners and its subsidiaries. The liability is being amortized over the remaining term of the respective debt facilities with the credit being recognized in "Other financial items".
The Golar Grand Option was issued in connection with the disposal of the
Golar Grand
to Golar Partners in November 2012. The fair value of the Golar Grand Option was determined by discounting the difference between the guaranteed charter rate per the Option agreement less the estimated market rate at the end of the initial lease term (See note 33(d)).
The Methane Princess tax lease indemnity of
$11.5 million
is based on the termination sum as of December 13, 2012, less the associated security deposit, but factoring in the timing and likelihood of an early termination (see note 33).
The carrying value of these guarantees as of December 31, 2013 and 2012 was
$22.4 million
and
$23.3 million
, respectively (see note 27).
(d) Golar Partners' accumulated other comprehensive income
The accumulated other comprehensive loss of
$9.0 million
in relation to Golar Partners was released to the consolidated statement of operations on deconsolidation.
(e) Deconsolidation-related expenses
Deconsolidation related expenses amounting to $
0.4 million
were included in administrative expenses in the consolidated statement of operations for the year ended December 31, 2012.
(f) Deferred tax benefits on intra-group transfers of long-term assets
The deferred tax benefits on intra-group transfers of long-term assets amounting to
$44.4 million
arose from transactions between controlled entities in respect of vessels owned by Golar Partners: the
Golar Freeze
, the
Golar Spirit
and the
NR Satu.
Upon the deconsolidation of Golar Partners, the unamortized balance of
$44.4 million
was released and recognized as part of the gain on loss of control.
|
6.
|
DISPOSAL OF A SUBSIDIARY
|
In February 2013, we sold our interest in the company that owns and operates the
Golar Maria
to Golar Partners.
|
(in thousands of $)
|
Golar Maria
|
|
|
Cash consideration received (1)
|
127,900
|
|
|
Carrying value of the assets sold to Golar Partners
|
(45,630
|
)
|
|
Gain on disposal
|
82,270
|
|
|
Deferred gain on sale (note 27)
|
(17,114
|
)
|
|
Gain recognized on sale of
Golar Maria
|
65,156
|
|
The gain from the sale of the
Golar Maria
was $
82.3 million
of which
$65.2 million
had been recognized at the time of the sale in the Consolidated Statements of Operation under "Gain on disposal of
Golar Maria
(including amortization of deferred gain)". The remaining $
17.1 million
which represents profit based on our holding in the subordinated units in Golar Partners measured as of the date of the dropdown has been deferred under "Other long-term liabilities" (see note 27) and is being released to income over the remaining useful life of the vessel or until it is sold. As of December 31, 2013, the unamortized portion of the gain is $
16.7 million
.
(1) The cash consideration comprised of
$215.0 million
for the vessel less the assumed bank debt and interest rate swap liability
$89.5 million
and
$3.1 million
, respectively, plus purchase price adjustments of
$5.5 million
.
|
7.
|
BUSINESS COMBINATION
|
On January 18, 2012, we acquired the remaining
50%
equity interest in our joint venture, Bluewater Gandria, which owns the LNG carrier, the
Golar Gandria
for
$19.5 million
. Bluewater Gandria is a company pursuing opportunities to develop offshore LNG FSRU projects. Since the
Golar Gandria’s
acquisition, although it was initially reactivated, it was then subsequently placed into lay-up again in April 2013. The vessel is earmarked for conversion to a floating liquefied natural gas vessel ("FLNGV").
F-21
Details of the purchase consideration, the net assets acquired and goodwill are as follows:
|
(in thousands of $)
|
January 18, 2012
|
|
|||
|
Fair value of previously held 50% equity interest (a)
|
19,500
|
|
|||
|
Purchase consideration - cash
|
19,500
|
|
|||
|
Total assumed acquisition consideration
|
39,000
|
|
|||
|
Less: Fair value of net assets acquired:
|
|||||
|
Vessel and equipment, net
|
40,000
|
|
|||
|
Inventories
|
931
|
|
|||
|
Cash
|
62
|
|
|||
|
Prepayments
|
40
|
|
|||
|
Other liabilities
|
(100
|
)
|
|||
|
Subtotal
|
(40,933
|
)
|
|||
|
Gain on bargain purchase of Bluewater Gandria
|
(1,933
|
)
|
|||
The impact on the statement of operations of the acquisition of Bluewater Gandria is as follows:
|
(in thousands of $)
|
||||
|
Gain on remeasurement (a)
|
2,356
|
|
||
|
Gain on bargain
|
1,933
|
|
||
|
Less: Acquisition related costs
|
(205
|
)
|
||
|
Total gain on acquisition of Bluewater Gandria
|
4,084
|
|
||
As a result of acquiring the remaining
50%
equity interest, we recognized a gain on bargain purchase of the Bluewater Gandria as the cost of acquisition is less than the fair value of the net assets of the subsidiary acquired. We performed an assessment of the fair values of the assets acquired, liabilities assumed and consideration transferred. The assessment confirmed our gain on bargain purchase.
a)
Remeasurement of equity investment in Bluewater Gandria
On January 18, 2012, we remeasured our previously held
50%
equity interest in Bluewater Gandria to its fair value as set forth in the table below:
|
(in thousands of $)
|
Equity investment in Bluewater Gandria
|
|
||
|
Fair value of previously held 50% equity interest
|
19,500
|
|
||
|
Less: Carrying value at acquisition date
|
(17,144
|
)
|
||
|
Gain on remeasurement of equity interest
|
2,356
|
|
||
The fair value of our previously held investment in Bluewater Gandria was assumed to be equal to the purchase price of
$19.5 million
paid to Bluewater in respect of our
50%
share in the joint venture.
b)
Revenue and profit contributions
Since the acquisition date, the business has contributed revenues of $
nil
and a net loss of
$14.6 million
to our results for the period from January 18, 2012 to December 31, 2012. Had Bluewater Gandria been consolidated from January 1, 2012, it would have contributed revenues of $
nil
and a net loss of
$15.3 million
.
Bluewater Gandria’s statement of operations presented a net loss of
$0.7 million
for the year ended December 31, 2011. This comprised mainly of general and administrative expenses and other minimal operating expenses. This was principally due to the vessel being in lay-up throughout 2011. As a result, we have evaluated that had the business combination been consummated as of January 1, 2011, Bluewater Gandria's pro forma revenue and net income effect for the year ended December 31, 2011 would be immaterial and thus has not been presented here.
|
8.
|
SEGMENTAL INFORMATION
|
We own and operate LNG carriers and operate FSRUs and provide these services under time charters under varying periods, and trades in physical and future LNG contracts. Our reportable segments consist of the primary services it provides. Although our segments are generally influenced by the same economic factors, each represents a distinct product in the LNG industry. There have not been any intersegment sales during the periods presented. Segment results are evaluated based on net income. The accounting principles for the segments are the same as for our consolidated financial statements. Indirect general and administrative expenses are allocated to each segment based on estimated use.
The split of the organization of the business into two segments was based on differences in management structure and reporting, economic characteristics, customer base, asset class and contract structure. As of
December 31, 2013
, we operate in the following two segments:
|
•
|
Vessel Operations – We own and subsequently charter out LNG carriers on fixed terms to customers.
|
|
•
|
LNG Trading – Provides physical and financial risk management in LNG and gas markets for its customers around the world. Activities include structured services to outside customers, arbitrage service as well as proprietary trading.
|
The LNG trading operations meets the definition of an operating segment as the business is a financial trading business and its financial results are reported directly to the chief operating decision maker. The LNG trading segment is a distinguishable component of the business from which we earn revenues and incur expenses and whose operating results are regularly reviewed by the chief operating decision maker, and which is subject to risks and rewards different from the vessel operations segment.
|
(in thousands of $)
|
2013
|
2012
|
2011
|
|||||||||||||||
|
|
Vessel operations
|
|
LNG
Trading
|
|
Total
|
|
Vessel
operations
|
|
LNG
Trading
|
|
Total
|
|
Vessel
operations |
|
LNG
Trading |
|
Total
|
|
|
Time charter revenues
|
90,558
|
|
—
|
|
90,558
|
|
409,593
|
|
—
|
|
409,593
|
|
299,848
|
|
—
|
|
299,848
|
|
|
Vessel and other management fees
|
9,270
|
|
—
|
|
9,270
|
|
752
|
|
—
|
|
752
|
|
—
|
|
—
|
|
—
|
|
|
Vessel and voyage operating expenses
|
(58,009
|
)
|
—
|
|
(58,009
|
)
|
(96,525
|
)
|
—
|
|
(96,525
|
)
|
(68,914
|
)
|
—
|
|
(68,914
|
)
|
|
Administrative expenses
|
(22,816
|
)
|
(136
|
)
|
(22,952
|
)
|
(23,973
|
)
|
(1,040
|
)
|
(25,013
|
)
|
(26,988
|
)
|
(6,691
|
)
|
(33,679
|
)
|
|
Impairment of long-term assets
|
(500
|
)
|
—
|
|
(500
|
)
|
(500
|
)
|
—
|
|
(500
|
)
|
(500
|
)
|
—
|
|
(500
|
)
|
|
Depreciation and amortization
|
(36,562
|
)
|
(309
|
)
|
(36,871
|
)
|
(85,187
|
)
|
(337
|
)
|
(85,524
|
)
|
(69,814
|
)
|
(472
|
)
|
(70,286
|
)
|
|
Other operating gains and losses
|
—
|
|
—
|
|
—
|
|
—
|
|
(27
|
)
|
(27
|
)
|
—
|
|
(5,438
|
)
|
(5,438
|
)
|
|
Gain on disposal of
Golar Maria
(including amortization of deferred gain)
|
65,619
|
|
—
|
|
65,619
|
|
—
|
|
—
|
|
—
|
|
—
|
|
—
|
|
—
|
|
|
Operating income (loss)
|
47,560
|
|
(445
|
)
|
47,115
|
|
204,160
|
|
(1,404
|
)
|
202,756
|
|
133,632
|
|
(12,601
|
)
|
121,031
|
|
|
Other non-operating income (loss)
|
27,605
|
|
—
|
|
27,605
|
|
858,080
|
|
(151
|
)
|
857,929
|
|
541
|
|
—
|
|
541
|
|
|
Net financial income (expenses)
|
41,768
|
|
—
|
|
41,768
|
|
(42,864
|
)
|
(4
|
)
|
(42,868
|
)
|
(52,593
|
)
|
(509
|
)
|
(53,102
|
)
|
|
Income taxes
|
3,404
|
|
—
|
|
3,404
|
|
(2,765
|
)
|
—
|
|
(2,765
|
)
|
1,705
|
|
—
|
|
1,705
|
|
|
Equity in net earnings (losses) of affiliates
|
15,821
|
|
—
|
|
15,821
|
|
(609
|
)
|
—
|
|
(609
|
)
|
(1,900
|
)
|
—
|
|
(1,900
|
)
|
|
Net income (loss)
|
136,158
|
|
(445
|
)
|
135,713
|
|
1,016,002
|
|
(1,559
|
)
|
1,014,443
|
|
81,385
|
|
(13,110
|
)
|
68,275
|
|
|
Non-controlling interests
|
—
|
|
—
|
|
—
|
|
(43,140
|
)
|
—
|
|
(43,140
|
)
|
(21,625
|
)
|
—
|
|
(21,625
|
)
|
|
Net income attributable to Golar LNG Ltd
|
136,158
|
|
(445
|
)
|
135,713
|
|
972,862
|
|
(1,559
|
)
|
971,303
|
|
59,760
|
|
(13,110
|
)
|
46,650
|
|
|
Total assets
|
2,664,953
|
|
268
|
|
2,665,221
|
|
2,413,564
|
|
835
|
|
2,414,399
|
|
2,230,006
|
|
2,628
|
|
2,232,634
|
|
|
Investment in affiliates
|
350,918
|
|
—
|
|
350,918
|
|
367,656
|
|
—
|
|
367,656
|
|
22,529
|
|
—
|
|
22,529
|
|
|
Capital Expenditures
|
734,155
|
|
—
|
|
734,155
|
|
342,987
|
|
—
|
|
342,987
|
|
289,182
|
|
—
|
|
289,182
|
|
F-22
Revenues from external customers
During
December 31, 2013
, our vessels operated under time charters with
four
main charterers: Gdf Suez, a major Japanese trading company, Eni S.p.A and the BG Group. Prior to the deconsolidation of Golar Partners in December 2012, during December 31, 2012 and 2011, the vast majority of our vessel operations operated under time charters with
seven
main charterers: Petrobras, Dubai Supply Authority, Pertamina, Qatar Gas Transport Company, BG Group plc, Shell and PT Nusantara Regas. Gdf Suez is a power, natural gas and energy services company headquartered in France. Eni S.pA is an Italian integrated energy company. Petrobras is a Brazilian energy company. Dubai Supply Authority is a government entity which is the sole supplier of natural gas to the Emirates. Pertamina is the state-owned oil and gas company of Indonesia. Qatar Gas Transport Company is a Qatari-listed shipping company established by the State of Qatar. Both BG Group Plc and Shell are headquartered in the United Kingdom. PT Nusantara Regas is a joint venture company of Pertamina and Perusahaan Gas Negara, an Indonesian company engaged in the transport and distribution of natural gas in Indonesia.
In time charters, the charterer, not the Company, controls the choice of which routes our vessel will serve. These routes can be worldwide as determined by the charterers, except for the FSRUs, which operate at specific locations where the charterers are based. Accordingly, our management, including the chief operating decision maker, do not evaluate our performance either according to customer or geographical region.
In the years ended
December 31, 2013
,
2012
and
2011
, revenues from the following customers accounted for over
10%
of our consolidated time charter revenues:
|
(in thousands of $)
|
2013
|
2012
|
2011
|
||||||||||||||
|
Gdf Suez Gas
|
10,015
|
|
11
|
%
|
22,326
|
|
5
|
%
|
4,931
|
|
2
|
%
|
|||||
|
Major Japanese trading Company
|
47,744
|
|
53
|
%
|
38,992
|
|
9
|
%
|
—
|
|
—
|
%
|
|||||
|
Eni Spa
|
8,912
|
|
10
|
%
|
2,480
|
|
1
|
%
|
—
|
|
—
|
%
|
|||||
|
Petrobras*
|
—
|
|
—
|
%
|
90,321
|
|
22
|
%
|
93,741
|
|
31
|
%
|
|||||
|
Dubai Supply Authority*
|
—
|
|
—
|
%
|
45,951
|
|
11
|
%
|
47,054
|
|
16
|
%
|
|||||
|
Pertamina*
|
—
|
|
—
|
%
|
35,455
|
|
9
|
%
|
37,829
|
|
13
|
%
|
|||||
|
Qatar Gas Transport Company*
|
—
|
|
—
|
%
|
23,006
|
|
6
|
%
|
35,461
|
|
12
|
%
|
|||||
|
BG Group plc*
|
13,114
|
|
14
|
%
|
96,179
|
|
23
|
%
|
25,101
|
|
8
|
%
|
|||||
|
PT Nusantara Regas*
|
—
|
|
—
|
%
|
38,789
|
|
9
|
%
|
—
|
|
—
|
|
|||||
Geographical segment data
The following geographical data presents our revenues with respect only to our FSRUs, operating under long-term charters, at specific locations. LNG vessels operate on a worldwide basis and are not restricted to specific locations.
|
Revenues (in thousands of $)
|
2013
|
|
2012
|
|
2011
|
|
|||
|
Brazil*
|
—
|
|
90,321
|
|
93,741
|
|
|||
|
United Arab Emirates*
|
—
|
|
45,951
|
|
47,054
|
|
|||
|
Indonesia*
|
—
|
|
38,789
|
|
—
|
|
|||
* A substantial portion of these revenues for the years ended December 31, 2012 and 2011 pertain to vessels owned by Golar Partners and its subsidiaries which were deconsolidated from December 13, 2012.
We have not presented geographical data of our fixed assets, as we did not own any FSRUs as of December 31, 2013 and 2012.
F-23
|
9.
|
IMPAIRMENT OF LONG-TERM ASSETS
|
Impairment of long-term assets as at
December 31, 2013
,
2012
and
2011
are as follows:
|
(in thousands of $)
|
2013
|
|
2012
|
|
2011
|
|
||
|
FSRU conversion parts (see note 23)
|
500
|
|
500
|
|
500
|
|
||
We continually monitor events and changes in circumstances that could indicate carrying amounts of long-term assets may not be recoverable.
The impairment charge arising on the FSRU conversion parts of
$0.5 million
for each of the years ended
December 31, 2013
,
2012
and
2011
, refers to the unutilized parts originally ordered for the
Golar Spirit
FSRU retrofitting following changes to the original project specification. These assets are classified within our Vessel Operations segment.
F-24
|
10.
|
OTHER FINANCIAL ITEMS, NET
|
|
(in thousands of $)
|
2013
|
|
2012
|
|
2011
|
|
||
|
Mark-to-market adjustment for interest rate swap derivatives (see note 32)
|
56,461
|
|
1,223
|
|
(10,057
|
)
|
||
|
Interest rate swap cash settlements (see note 32)
|
(10,626
|
)
|
(12,258
|
)
|
(14,201
|
)
|
||
|
Mark-to-market adjustment for foreign currency derivatives (see note 32)
|
719
|
|
6,485
|
|
(1,417
|
)
|
||
|
Foreign exchange (loss) gain on capital lease obligations and related restricted cash, net
|
—
|
|
(5,645
|
)
|
182
|
|
||
|
Financing arrangement fees and other costs
|
(5,632
|
)
|
(1,766
|
)
|
(930
|
)
|
||
|
Amortization of deferred financing costs and debt guarantee
|
(1,120
|
)
|
(1,900
|
)
|
(1,484
|
)
|
||
|
Foreign exchange (loss) gain on operations
|
(1,583
|
)
|
94
|
|
(945
|
)
|
||
|
Other
|
—
|
|
4
|
|
(234
|
)
|
||
|
|
38,219
|
|
(13,763
|
)
|
(29,086
|
)
|
||
Financing arrangement fees and other costs of $
5.6 million
in 2013 arose mainly from ongoing commitment fees as a result of our execution of a
$1.125 billion
financing agreement to fund eight of our newbuild vessels. The foreign exchange (loss) gain on capital leases and related restricted cash in 2012 and 2011 arose as a result of the retranslation of the capital lease obligations and related restricted cash securing those obligations. The capital leases and related restricted cash form part of Golar Partners and therefore from December 13, 2012, have been deconsolidated from our balance sheet.
|
11.
|
TAXATION
|
The components of income tax (credit) expense are as follows:
|
(in thousands of $)
|
2013
|
|
2012
|
|
2011
|
|
||
|
Current tax (credit) expense:
|
|
|
|
|||||
|
U.K.
|
(27
|
)
|
2,101
|
|
2,733
|
|
||
|
Indonesia
|
—
|
|
6,828
|
|
—
|
|
||
|
Brazil
|
—
|
|
1,002
|
|
1,363
|
|
||
|
Total current tax (credit) expense
|
(27
|
)
|
9,931
|
|
4,096
|
|
||
|
Deferred tax expense:
|
|
|
|
|
|
|||
|
U.K.
|
110
|
|
91
|
|
886
|
|
||
|
Amortization of tax benefit arising on intra-group transfers of long-term assets (see note 27)
|
(3,487
|
)
|
(7,257
|
)
|
(6,687
|
)
|
||
|
Total income tax (credit) expense
|
(3,404
|
)
|
2,765
|
|
(1,705
|
)
|
||
Bermuda
Under current Bermuda law, we are not required to pay income taxes or other taxes (other than duty on goods imported into Bermuda and payroll tax in respect of any Bermuda-resident employees). We have received written assurance from the Minister of Finance in Bermuda that, in the event of any such taxes being imposed, we will be exempted from taxation until March 31, 2035.
F-25
United States
Pursuant to the Internal Revenue Code of the United States (the "Code"), U.S. source income from the international operations of ships is generally exempt from U.S. tax if the company operating the ships meets certain requirements. Among other things, in order to qualify for this exemption, the company operating the ships must be incorporated in a country which grants an equivalent exemption from income taxes to U.S. citizens and U.S. corporations and must be more than
50%
owned by individuals who are residents, as defined, in such country or another foreign country that grants an equivalent exemption to U.S. citizens and U.S. corporations. The management of the company believes that we satisfied these requirements and therefore by virtue of the above provisions, we were not subject to tax on our U.S. source income.
Reconciliation between the income tax expense resulting from applying either the U.S. Federal or Bermudan statutory income tax rate and the reported income tax expense has not been presented herein as it would not provide additional useful information to users of the consolidated financial statements as our net income is subject to neither Bermuda nor U.S. tax.
United Kingdom
Current taxation of $
nil
,
$2.1 million
and
$2.7 million
for the years ended
December 31, 2013
,
2012
and
2011
, respectively, relates to taxation of the operations of our United Kingdom subsidiaries, which includes amounts paid by one of our U.K. subsidiary's branch offices in Oslo. Taxable revenues in the U.K. are generated by our U.K. subsidiary companies and are comprised of management fees received from Golar group companies as well as revenues from the operation of three of Golar's vessels. These vessels are sub-leased from other non-U.K Golar companies. As at
December 31, 2013
, the statutory rate in the U.K. was
23%
.
As at
December 31, 2013
, the 2013 U.K. income tax returns have not been filed. Accordingly, once filed, the tax years 2009 to 2013 remain open for examination by the U.K. tax authorities.
We record deferred income taxes to reflect the net tax effects of temporary differences between the carrying amount of assets and liabilities for financial reporting purposes and the amounts used for income tax purposes. We recorded deferred tax assets of
$0.4 million
and
$0.5 million
as of
December 31, 2013
and
2012
, respectively which have been classified as non-current and included within other long-term assets (see note 23). These assets relate to differences for depreciation and net operating losses carried forward.
Indonesia
Current taxation charge of $
nil
, $
6.8 million
and $
nil
for the years ended December 31, 2013, 2012, and 2011, respectively, refers to taxation levied on the operations of Golar Partners' Indonesian subsidiary for the periods prior to deconsolidation of Golar Partners in December 2012. The tax exposure in Indonesia was mitigated by revenue due under the charter.
Brazil
Current taxation charge of $
nil
,
$1.0 million
and
$1.4 million
for the years ended
December 31, 2013
,
2012
and
2011
, respectively, refers to taxation levied on Golar Partners' Brazilian operations.
Other jurisdictions
No
tax has been levied on income derived from our subsidiaries registered in Liberia, the Marshall Islands and the British Virgin Islands.
Deferred income tax assets are summarized as follows:
|
(in thousands of $)
|
2013
|
|
2012
|
|
|
|
Deferred tax assets, gross and net
|
421
|
|
531
|
|
|
F-26
|
12.
|
EARNINGS PER SHARE
|
Basic earnings per share ("EPS") are calculated with reference to the weighted average number of common shares outstanding during the year. Treasury shares are not included in the calculation. The computation of diluted EPS for the years ended
December 31, 2013
,
2012
and
2011
, assumes the conversion of potentially dilutive instruments.
The components of the numerator for the calculation of basic and diluted EPS are as follows:
|
(in thousands of $)
|
2013
|
|
2012
|
|
2011
|
|
||
|
Net income attributable to Golar LNG Ltd stockholders – basic
|
135,713
|
|
971,303
|
|
46,650
|
|
||
|
Add: Interest expense on convertible bonds
|
—
|
|
11,358
|
|
—
|
|
||
|
Net income attributable to Golar LNG Ltd stockholders - diluted
|
135,713
|
|
982,661
|
|
46,650
|
|
||
The components of the denominator for the calculation of basic and diluted EPS are as follows:
|
(in thousands)
|
2013
|
|
2012
|
|
2011
|
|
||
|
Basic earnings per share:
|
|
|
|
|||||
|
Weighted average number of common shares outstanding
|
80,530
|
|
80,324
|
|
74,707
|
|
||
|
Diluted earnings per share:
|
|
|
|
|
|
|
||
|
Weighted average number of common shares outstanding
|
80,530
|
|
80,324
|
|
74,707
|
|
||
|
Effect of dilutive share options
|
381
|
|
380
|
|
326
|
|
||
|
Effect of dilutive convertible bonds
|
4,545
|
|
3,539
|
|
—
|
|
||
|
Common stock and common stock equivalents
|
85,456
|
|
84,243
|
|
75,033
|
|
||
Earnings per share are as follows:
|
|
2013
|
|
2012
|
|
2011
|
|
|||||
|
Basic
|
$
|
1.69
|
|
$
|
12.09
|
|
$
|
0.62
|
|
||
|
Diluted
|
$
|
1.59
|
|
$
|
11.66
|
|
$
|
0.62
|
|
||
|
13.
|
OPERATING LEASES
|
Rental income
The minimum contractual future revenues to be received on time charters in respect of vessels owned and operated as of
December 31, 2013
, were as follows:
|
Year ending December 31,
|
Total
|
|
|
(in thousands of $)
|
|
|
|
2014
|
50,188
|
|
|
2015
|
11,413
|
|
|
Total
|
61,601
|
|
The cost and accumulated depreciation of vessels leased to third parties at
December 31, 2013
and
2012
were
$190.4 million
and
$29.3 million
, and
$620.0 million
and
$141.2 million
, respectively.
F-27
Rental expense
We are committed to making rental payments under operating leases for office premises. The future minimum rental payments under our non-cancellable operating leases are as follows:
|
Year ending December 31,
|
Total
|
|
|
(in thousands of $)
|
|
|
|
2014
|
374
|
|
|
2015
|
381
|
|
|
2016
|
381
|
|
|
2017
|
381
|
|
|
2018
|
256
|
|
|
Total minimum lease payments
|
1,773
|
|
Total rental expense for operating leases was
$0.7 million
,
$0.7 million
and
$1.0 million
for the years ended
December 31, 2013
,
2012
and
2011
, respectively.
|
14.
|
INVESTMENTS IN AFFILIATES
|
At
December 31, 2013
and 2012, we have the following participation in investments that are recorded using the equity method:
|
|
2013
|
|
2012
|
|
|
|
Golar Partners
(1) (2)
|
25.4
|
%
|
29.9
|
%
|
|
|
Egyptian Company for Gas Services S.A.E ("ECGS")
|
50
|
%
|
50
|
%
|
|
|
Golar Wilhelmsen Management AS ("Golar Wilhelmsen")
|
60
|
%
|
60
|
%
|
|
(1) Golar Partners and its subsidiaries were included in our consolidated financial statements until December 13, 2012, following its first AGM upon which the majority of directors were elected by the common unitholders, Golar Partners was deconsolidated and our interests in the subordinated units were accounted for under the equity method from that date (see note 5 for further details).
(2) We held a
41.4%
(2012:
54.1%
) ownership in Golar Partners as of December 31, 2013. However the
25.4%
(2012:
29.9%
) interest refers only to our interests in the subordinated units which are subject to the equity method accounting.
The carrying amounts of our investments in our equity method investments as at
December 31, 2013
and
2012
are as follows:
|
(in thousands of $)
|
2013
|
|
2012
|
|
|
|
Golar Partners
|
344,858
|
|
362,064
|
|
|
|
ECGS
|
5,782
|
|
5,592
|
|
|
|
Golar Wilhelmsen
|
278
|
|
—
|
|
|
|
Equity in net assets of affiliates
|
350,918
|
|
367,656
|
|
|
The components of equity in net assets of non-consolidated affiliates are as follows:
|
(in thousands of $)
|
2013
|
|
2012
|
|
|
|
Cost
|
374,729
|
|
374,729
|
|
|
|
Dividend
|
(33,363
|
)
|
(125
|
)
|
|
|
Equity in net earnings (losses) of other affiliates
|
8,698
|
|
(6,948
|
)
|
|
|
Share of other comprehensive income in affiliate
|
854
|
|
—
|
|
|
|
Equity in net assets of affiliates
|
350,918
|
|
367,656
|
|
|
F-28
Quoted market prices for ECGS and Golar Wilhelmsen are not available because these companies are not publicly traded. We hold various interests in Golar Partners (common units, subordinated units, general partner units and IDRs), however as discussed in detail in note 5, only the Company's interests in subordinated units have been accounted for under the equity method which are not listed but were initially fair valued as of the date of deconsolidation on December 13, 2012 (see note 5).
Golar Partners
Golar Partners is an owner and operator of FSRUs and LNG carriers under long-term charters. As of December 31, 2013, it had a fleet of
eight
vessels managed by the Company (2012:
seven
vessels).
In April 2011, we completed the IPO of Golar Partners and listed it on the Nasdaq Stock Exchange.
During the period from the IPO in April 2011 until the time of Golar Partner's first AGM on December 13, 2012, we retained the sole power to appoint, remove and replace all members of Golar Partners' board of directors. From the first AGM, the majority of the board members became electable by the common unitholders and, accordingly, from this date we no longer retain the power to control the board of directors. As a result, from December 13, 2012, Golar Partners has been considered as an affiliate entity and not as our controlled subsidiary (see note 5).
As of December 31, 2013, the carrying amount of the investment in Golar Partners (subordinated units) accounted for under the equity method was
$344.9 million
(2012:
$362.1 million
). Refer to note 5 for details of deconsolidation including determining the initial fair value of the investment in Golar Partners and the treatment of the basis difference.
Dividends received for the year ended December 31, 2013 in relation to our investments in Golar Partner's subordinated units amounted to
$32.7 million
.
ECGS
In December 2005, we entered into an agreement with The Egyptian Natural Gas Holding Company, or EGAS, and HK Petroleum Services to establish a jointly owned company ECGS, to develop hydrocarbon businesses in Egypt and in particular LNG related businesses. In March 2006, we acquired
0.5 million
common shares in ECGS at a subscription price of
$1
per share. This represents a
50%
interest in the voting rights of ECGS. ECGS is jointly owned and operated together with other third parties. Therefore we have adopted the equity method of accounting for our
50%
investment in ECGS, as we consider we have joint significant influence. In December 2011, ECGS called up its remaining share capital amounting to
$7.5 million
. Of this, we paid
$3.75 million
to maintain our
50%
equity interest.
Dividends received for each of the years ended December 31, 2013 and 2012 were
$0.5 million
and
$0.1 million
, respectively.
Golar Wilhelmsen
During 2010 Golar Management Ltd and Wilhelmsen Ship Management AS ("WSM") incorporated a Norwegian private limited company with the name "Golar Wilhelmsen Management AS" or Golar Wilhelmsen. The purpose is to build an organization specialized in the technical management of gas carriers. The company's focus shall be LNG carriers, FSRUs, floating LNG terminals and other gas carrying vessels which will initially include both our and Golar Partners' fleet of vessels and eventually vessels from third parties. WSM has for some time served as the technical manager for our vessels. In September 2010, we entered into new ship management agreements with Golar Wilhelmsen for our fleet, cancelling our previous arrangements.
Both we and WSM have joint control over the operational and financial policies of Golar Wilhelmsen. Accordingly, we have adopted the equity method of accounting for our interest in Golar Wilhelmsen as we consider we have joint significant influence by virtue of significant participating rights of the non-controlling interest, WSM.
F-29
Summarized financial information of the affiliated undertakings shown on a 100% basis are as follows:
|
(in thousands of $)
|
December 31, 2013
|
December 31, 2012
|
||||||||||
|
Golar Wilhelmsen
|
|
ECGS
|
|
Golar Partners
|
|
Golar Wilhelmsen
|
|
ECGS
|
|
Golar Partners
|
|
|
|
Balance Sheet
|
|
|
|
|||||||||
|
Current assets
|
4,422
|
|
38,365
|
|
136,379
|
|
7,690
|
|
31,853
|
|
107,370
|
|
|
Non-current assets
|
6
|
|
156
|
|
1,584,840
|
|
—
|
|
1,368
|
|
1,403,604
|
|
|
Current liabilities
|
3,312
|
|
25,934
|
|
241,072
|
|
7,667
|
|
20,859
|
|
169,717
|
|
|
Non-current liabilities
|
400
|
|
1,183
|
|
910,020
|
|
—
|
|
1,183
|
|
1,099,713
|
|
|
Non-controlling interest
|
—
|
|
—
|
|
70,777
|
|
—
|
|
—
|
|
71,858
|
|
|
|
|
|
||||||||||
|
Statement of Operations
|
|
|
|
|||||||||
|
Revenue
|
5,957
|
|
75,309
|
|
329,190
|
|
4,245
|
|
61,769
|
|
286,630
|
|
|
Net income (loss)
|
695
|
|
1,318
|
|
150,819
|
|
(494
|
)
|
849
|
|
127,141
|
|
|
|
|
|
||||||||||
|
15.
|
TRADE ACCOUNTS RECEIVABLE
|
Trade accounts receivable are presented net of allowances for doubtful accounts. The provision for doubtful debts was $
nil
for both the years ended
December 31, 2013
and
2012
, respectively.
F-30
|
16.
|
OTHER RECEIVABLES, PREPAID EXPENSES AND ACCRUED INCOME
|
|
(in thousands of $)
|
2013
|
|
2012
|
|
|
|
Prepaid expenses
|
1,236
|
|
1,318
|
|
|
|
Other receivables
|
12,968
|
|
3,991
|
|
|
|
Corporation tax receivable
|
370
|
|
—
|
|
|
|
|
14,574
|
|
5,309
|
|
|
As of December 31, 2013, included in other receivables is a short-term loan of
$9.1 million
provided to one of our partners in the Douglas Channel project. The loan is secured, repayable on demand and earns interest at
12%
. We believe that the carrying amount of this short-term loan is recoverable (see note 35).
|
17.
|
NEWBUILDINGS
|
|
(in thousands of $)
|
2013
|
|
2012
|
|
|
|
Purchase price installments
|
718,851
|
|
418,062
|
|
|
|
Interest costs capitalized
|
30,825
|
|
13,897
|
|
|
|
Other costs capitalized
|
17,849
|
|
3,900
|
|
|
|
|
767,525
|
|
435,859
|
|
|
As at
December 31, 2013
, we have commitments for newbuilding contracts to construct
eight
LNG carriers and
three
FSRUs at a total contract cost of $
2.4 billion
of which $
1.6 billion
remains outstanding. See note 34 for the expected timing of the remaining installments to be paid.
Other capitalized costs include site supervision and other miscellaneous construction costs.
We took delivery of
two
newbuilds in October 2013. Upon delivery of both vessels, their total cost of
$404.5 million
was transferred to vessels and equipment (note 18).
|
18.
|
VESSELS AND EQUIPMENT, NET
|
|
(in thousands of $)
|
2013
|
|
2012
|
|
|
|
Cost
|
1,043,439
|
|
771,945
|
|
|
|
Accumulated depreciation
|
(231,724
|
)
|
(198,330
|
)
|
|
|
Net book value
|
811,715
|
|
573,615
|
|
|
As at
December 31, 2013
, we owned
seven
(2012:
six
) vessels. The increase in vessels and equipment is due to the delivery of two newbuildings in October 2013, partially offset by the sale of the
Golar Maria
to Golar Partners in February 2013.
Drydocking costs of
$33.1 million
and
$34.2 million
are included in the cost amounts above as of
December 31, 2013
and
2012
, respectively. Accumulated amortization of those costs as of
December 31, 2013
and
2012
were
$18.9 million
and
$12.9 million
, respectively.
Depreciation and amortization expense for each of the years ended
December 31, 2013
,
2012
and
2011
was
$36.9 million
,
$70.3 million
and
$54.3 million
, respectively.
As at
December 31, 2013
and
2012
, included in the above amounts is office equipment with a net book value of
$1.7 million
and
$1.8 million
, respectively.
As at
December 31, 2013
and
2012
, vessels with a net book value of $
700.7 million
and
$432.9 million
, respectively, were pledged as security for certain debt facilities (see note 35).
F-31
|
19.
|
DEFERRED CHARGES
|
Deferred charges represent financing costs, principally bank fees that are capitalized and amortized to other financial items over the life of the debt instrument. If a loan is repaid early any unamortized portion of the related deferred charges is charged against income in the period in which the loan is repaid. The deferred charges are comprised of the following amounts:
|
(in thousands of $)
|
2013
|
|
2012
|
|
|
|
Debt arrangement fees and other deferred financing charges
|
27,845
|
|
6,335
|
|
|
|
Accumulated amortization
|
(3,361
|
)
|
(2,271
|
)
|
|
|
|
24,484
|
|
4,064
|
|
|
The increase in debt arrangement fees and other deferred finance charges for the year ended December 31, 2013 relate to the financing costs in respect of the
$1.125 billion
financing facility entered by the Company in July 2013 to fund eight of the newbuildings.
Amortization of deferred charges for the years ended
December 31, 2013
,
2012
and
2011
was
$2.0 million
,
$1.9 million
and
$1.5 million
, respectively.
|
20.
|
RESTRICTED CASH AND SHORT-TERM INVESTMENTS
|
Our restricted cash and short-term investment balances are as follows:
|
(in thousands of $)
|
2013
|
|
2012
|
|
|
|
Total restricted cash
|
26,543
|
|
1,551
|
|
|
|
Less: Amounts included in short-term restricted cash and short-term investments
|
23,432
|
|
1,551
|
|
|
|
Long-term restricted cash
|
3,111
|
|
—
|
|
|
As of December 31, 2013, our restricted cash relates to Performance and Delivery Bonds (the "Bonds") for our FSRU contracts in Kuwait and Jordan, respectively.
We issued the Bonds to the charterer to guarantee against our failure to meet our obligations as specified in the contract. The Bonds are usually valid for the duration of the contract or in the case of the Delivery Bond until the vessel is delivered.
The Bonds are currently all cash collateralized but we have the option to restructure these as non-cash backed although this may result in additional fees.
Restricted cash does not include minimum consolidated cash balances of
$25.0 million
(see note 26) required to be maintained as part of the financial covenants in some of our loan facilities, as these amounts are included in "Cash and cash equivalents".
|
21.
|
INVESTMENTS IN AVAILABLE-FOR-SALE SECURITIES
|
|
(in thousands of $)
|
2013
|
|
2012
|
|
|
|
Golar Partners (see note 5)
|
267,352
|
|
352,861
|
|
|
|
GasLog
|
—
|
|
173
|
|
|
|
267,352
|
|
353,034
|
|
||
The investment in Golar Partners represents its interest in the common units only, which includes an unrealized gain of
$7.8 million
as of December 31, 2013 (2012:
$5.9 million
). In December 2013, we sold part of our interest in the common units of Golar Partners for total proceeds of
$99.2 million
.
GasLog, which is listed on the New York Stock Exchange, is an owner, operator and manager of LNG carriers. We sold our interest in Gaslog in November 2013 for total proceeds of
$0.3 million
and resulting in a gain of
$0.1 million
.
Both the sale of part of our interest in the common units of Golar Partners and GasLog were sold at the fair value of these securities on the date of sale.
|
22.
|
COST METHOD INVESTMENTS
|
|
(in thousands of $)
|
2013
|
|
2012
|
|
|
|
Golar Partners
|
196,825
|
|
191,177
|
|
|
|
OLT Offshore LNG Toscana S.p.A ("OLT–O")
|
7,347
|
|
7,347
|
|
|
|
204,172
|
|
198,524
|
|
||
F-32
Our investment in Golar Partners was
$196.8 million
, which relates only to our interests in the general partner units and IDR interests which were measured initially at fair value on the deconsolidation date, December 13, 2012 (see note 5). We made further contributions of
$5.6 million
to Golar Partners in connection with Golar Partners 2013 equity offerings.
Dividends received for the year ended December 31, 2013 in relation to our investments in Golar Partners' general partner units and IDRs amounted to
$6.0 million
.
OLT-O is an Italian incorporated unlisted company, which is involved in the construction, development, operation and maintenance of an FSRU terminal to be situated off the Livorno coast of Italy. As at
December 31, 2013
, our investment in OLT-O was
$7.3 million
amounting to a
2.7%
interest in OLT–O's issued share capital.
|
23.
|
OTHER NON-CURRENT ASSETS
|
|
(in thousands of $)
|
2013
|
|
2012
|
|
|
|
Deferred tax asse
t (see note 11)
|
421
|
|
531
|
|
|
|
Mark-to-market interest rate swaps valuatio
n (see note 32)
|
46,827
|
|
—
|
|
|
|
Other long-term assets
|
7,000
|
|
6,238
|
|
|
|
|
54,248
|
|
6,769
|
|
|
Other long-term assets include unutilized parts originally ordered for the
Golar Spirit
FSRU retrofitting following changes to the original project specification. Of these parts
$8.4 million
have been used internally for both the retrofitting of the
NR Satu
and to a lesser extent the
Golar Freeze
in 2009. Since acquisition, we have recognized total impairment charges of
$4.5 million
(see
note 9).
As of
December 31, 2013
and
2012
, the carrying value of these parts was
$2.5 million
and
$3.0 million
, respectively.
|
24.
|
ACCRUED EXPENSES
|
|
(in thousands of $)
|
2013
|
|
2012
|
|
|
|
Vessel operating and drydocking expenses
|
6,890
|
|
8,248
|
|
|
|
Administrative expenses
|
6,105
|
|
8,070
|
|
|
|
Interest expense
|
9,792
|
|
3,094
|
|
|
|
Provision for taxes
|
—
|
|
1,001
|
|
|
|
|
22,787
|
|
20,413
|
|
|
Vessel operating and drydocking expense related accruals are composed of vessel operating expenses including direct vessel operating costs associated with operating a vessel, such as crew wages, vessel supplies, routine repairs, maintenance, drydocking, lubricating oils, insurances and management fees for the provision of commercial and technical management services.
Administrative expense related accruals are composed of general overhead, including personnel costs, legal and professional fees, costs associated with project development, property costs and other general expenses.
|
25.
|
OTHER CURRENT LIABILITIES
|
|
(in thousands of $)
|
2013
|
|
2012
|
|
|
|
Deferred drydocking, operating cost and charterhire revenue
|
7,724
|
|
8,040
|
|
|
|
Mark-to-market interest rate swaps valuation (see note 32)
|
11,401
|
|
26,472
|
|
|
|
Mark-to-market currency swaps valuation (see note 32)
|
729
|
|
94
|
|
|
|
Current portion of the deferred tax benefit arising on intra-group transfer of long-term assets (see note 27)
|
3,487
|
|
3,156
|
|
|
|
Other
|
571
|
|
244
|
|
|
|
|
23,912
|
|
38,006
|
|
|
F-33
|
26.
|
DEBT
|
|
(in thousands of $)
|
2013
|
|
2012
|
|
|
|
Total long-term debt due to third parties
|
667,028
|
|
504,906
|
|
|
|
Total long-term debt due to related parties
|
50,000
|
|
—
|
|
|
|
Total long-term debt (including related parties)
|
717,028
|
|
504,906
|
|
|
|
Less: current portion of long-term debt due to third parties and related parties
|
(30,784
|
)
|
(14,400
|
)
|
|
|
Long-term debt (including related parties)
|
686,244
|
|
490,506
|
|
|
The outstanding debt as of
December 31, 2013
is repayable as follows:
|
Year ending December 31,
|
|
|
|
(in thousands of $)
|
|
|
|
2014
|
30,784
|
|
|
2015
|
161,993
|
|
|
2016
|
25,763
|
|
|
2017
|
94,563
|
|
|
2018
|
284,395
|
|
|
2019 and thereafter
|
119,530
|
|
|
Total
|
717,028
|
|
Our debt is denominated in U.S. dollars and bears floating interest rates. The weighted average interest rate for the years ended
December 31, 2013
and
2012
was
3.45%
and
3.97%
, respectively.
As of
December 31, 2013
and 2012, the margins we pay under our loan agreements (excluding our convertible bonds which do not have a margin) are over and above
LIBOR
at a fixed or floating rate range from to
0.70%
to
3.0%
and
0.70%
to
0.95%
, respectively.
At
December 31, 2013
and 2012, our debt was as follows:
|
(in thousands of $)
|
2013
|
|
2012
|
|
Maturity date
|
||
|
World Shipholding revolving credit facility (a related party)
|
50,000
|
|
—
|
|
2015
|
||
|
Golar Maria facility
|
—
|
|
89,525
|
|
2014
|
||
|
Golar Arctic facility
|
91,250
|
|
96,250
|
|
2015
|
||
|
Golar Viking facility
|
86,400
|
|
90,800
|
|
2017
|
||
|
Convertible bonds
|
233,020
|
|
228,331
|
|
2017
|
||
|
$1.125 billion facility:
|
|||||||
|
- Golar Seal facility
|
127,935
|
|
—
|
|
2018/2025*
|
||
|
- Golar Celsius facility
|
128,423
|
|
—
|
|
2018/2025*
|
||
|
|
717,028
|
|
504,906
|
|
|||
*The commercial loan facility matures in 2018 and the term loan tranches mature in 2025.
F-34
World Shipholding revolving credit facility (a related party)
In April 2011, we entered into an
$80.0 million
revolving credit facility with a company related to our major shareholder, World Shipholding. In January 2012, February 2012 and May 2012, the revolving credit facility was amended to $
145.0 million
, $
250.0 million
and $
120.0 million
, respectively without any further changes to the original terms of the facility. In July 2012, the facility was repaid in full with the proceeds received from the sale of the companies that own and operate the
NR Satu
to Golar Partners. In May 2013, the margin on the facility was amended from
3.5%
to
3.0%
. As of December 31, 2013, we had $
50.0 million
of borrowings under this facility. The facility is unsecured and bears interest at
LIBOR
plus
3.0%
together with a commitment fee of
0.75%
on any undrawn portion of the credit facility. The facility is available until September 2015, when all amounts must be repaid.
Golar Maria facility
In April 2006, we entered into a
$120.0 million
secured loan facility with a bank for the purpose of financing the
Golar Maria
. The facility bears floating interest rate of
LIBOR
plus a margin of
0.95%
and is repayable in quarterly installments and had an initial term of
five
years. In March 2008, the facility was restructured to lower the margin and to extend the term of the facility to December 2014. In February 2013, in connection with the sale of our equity interest in the company that owns and operates the
Golar Maria
, Golar Partners assumed liability for this facility, the balance of which was $
89.5 million
on the transaction date (see note 6).
Golar Arctic facility
In January 2008, we entered into a secured loan facility for an amount of
$120.0 million
, for the purpose of financing the purchase of the
Golar Arctic
, which we refer to as the Golar Arctic facility. The facility bears interest at
LIBOR
plus a margin and is repayable in quarterly installments over a term of
seven
years with a final balloon payment of
$86.3 million
due in January 2015.
Golar Viking
In January 2005, we entered into a
$120.0 million
secured loan facility with a bank for the purpose of financing the newbuilding, the
Golar Viking
. This facility was refinanced in August 2007 for an amount of
$120.0 million
.
The structure of the Golar Viking facility is such that the bank loaned funds of
$120 million
to Golar, which we then re-loaned to a newly created entity of the bank, ("Investor Bank"). With the proceeds, Investor Bank then subscribed for preference shares in a Golar group company. Another Golar company issued a put option in respect of the preference shares. The effect of these transactions is that Investor Bank is required to pay fixed interest to us. The interest payments to us by Investor Bank are contingent upon receipt of these preference dividends. In the event these dividends are not paid, the preference dividends will accumulate until such time as there are sufficient cash proceeds to settle all outstanding arrearages. Applying ASC 810 to this arrangement, we have concluded that we are the primary beneficiary of Investor Bank and accordingly have consolidated it into our group. At
December 31, 2013
, the Consolidated Balance Sheet and Consolidated Statement of Operations includes Investor Bank's net assets of $
nil
and net income of $
nil
, respectively, due to elimination on consolidation, of accounts and transactions arising between us and the Investor Bank.
The Golar Viking facility accrues floating interest at a rate of
LIBOR
plus a margin of
0.70%
. The loan has a term of
10 years
and is repayable in quarterly installments with a final balloon payment of
$71.0 million
due in August 2017. The loan is secured by a mortgage on this vessel.
Convertible Bonds
In March 2012, we completed a private placement offering for convertible bonds, for gross proceeds of
$250.0 million
. Accordingly, on inception we recognized a liability of $
221.9 million
and an equity portion of $
25.0 million
. The liability component is recorded at its present value (discounted using an equivalent borrowing rate which does not include the conversion option) and the accretion from its initial discounted value to par. The equity component is valued as the residual of par less the liability value. The impact of this treatment over the life of the instrument is to increase the interest charge to a "normalized" interest rate as the discount on the liability unwinds over the period to settlement. The secured convertible bonds mature in March 2017 when the holder may convert the bonds into our common shares or redeem at
100%
of the principal amount. The convertible bonds have an annual coupon rate of
3.75%
which is payable quarterly in arrears and have a conversion price of
$55.0
. We declared dividends of
$1.35
and
$1.60
for the years ended December 31, 2013 and 2012, respectively. The conversion price was adjusted from
$52.29
to
$50.28
effective on December 4, 2013.
F-35
We have a right to redeem the bonds at par plus accrued interest, provided that
90%
or more of the bonds issued shall have been redeemed or converted to shares. Accordingly, if the bonds were converted,
4,972,155
shares would be issued if the bonds were converted at the conversion price of
$50.28
as at December 31, 2013.
The bond may be converted to our ordinary shares by the holders at any time starting on the forty-first business day of the issuance until the tenth business day prior to March 7, 2017.
$1.125 billion facility
In July 2013, we entered into a
$1.125 billion
facility to fund eight of our newbuildings. The facility bears interest at
LIBOR
plus a margin. The facility is divided into three tranches, with the following general terms:
|
Tranche
|
Amount
|
Proportion of facility
|
Term of loan from date of drawdown
|
Repayment terms
|
|
K-Sure
|
$449.0 million
|
40%
|
12 years
|
Six-monthly installments
|
|
KEXIM
|
$450.0 million
|
40%
|
12 years
|
Six-monthly installments
|
|
Commercial
|
$226.0 million
|
20%
|
5 years
|
Six-monthly installments, unpaid balance to be refinanced after 5 years
|
The K-Sure Tranche, is funded by a consortium of lenders of which
95%
is guaranteed by a Korean Trade Insurance Corporation (or K-Sure) policy; the KEXIM tranche is funded by the Export Import Bank of Korea (or KEXIM). Repayments under the K-Sure and KEXIM tranches are due semi-annually with a 12 year repayment profile. The commercial tranche is funded by a syndicate of banks and is for a term of five years from date of drawdown with a final balloon payment of
$131.0 million
depending on drawdown dates on certain vessels. In the event the commercial tranche is not refinanced prior to the end of the five years, KEXIM has an option to demand repayment of the balance outstanding under the KEXIM tranche.
The facility is further divided into vessel-specific tranches dependent upon delivery and drawdown, with each borrower being the subsidiary owning the respective vessel. Upon delivery of a newbuild, we have the ability to drawdown on the facility. On drawdown, the vessel will become secured against the facility. We drew down a total of
$256.3 million
in connection with the delivery of the
Golar Seal
and the
Golar Celsius
in October 2013. Accordingly, as of December 31, 2013, the remaining balance available to drawdown is
$868.7 million
in respect of the remaining six newbuilds yet to be delivered. A commitment fee is chargeable on any undrawn portion of this facility.
Debt restrictions
Certain of our debt are collateralized by ship mortgages and, in the case of some debt, pledges of shares by each guarantor subsidiary. The existing financing agreements impose operating and financing restrictions which may significantly limit or prohibit, among other things, our ability to incur additional indebtedness, create liens, sell capital shares of subsidiaries, make certain investments, engage in mergers and acquisitions, purchase and sell vessels, enter into time or consecutive voyage charters or pay dividends without the consent of the lenders. In addition, lenders may accelerate the maturity of indebtedness under financing agreements and foreclose upon the collateral securing the indebtedness upon the occurrence of certain events of default, including a failure to comply with any of the covenants contained in the financing agreements. Many of our debt agreements contain certain covenants, which require compliance with certain financial ratios. Such ratios include equity ratio covenants and minimum free cash restrictions. With regards to cash restrictions, we have covenanted to retain at least
$25.0 million
of cash and cash equivalents on a consolidated group basis. In addition, there are cross default provisions in most of our and Golar Partners loan and lease agreements.
In April 2013, Golar Partners received waivers relating to the requirement under the Golar LNG Partners credit facility and the Golar Freeze facility relating to change of control over the Partnership. Following the grant of such waivers, in order to permanently resolve this issue, the loan facilities affected by the loss of control which contained the change of control provisions were amended in June 2013. As of December 31, 2013, Golar Partners was in compliance with all covenants.
F-36
|
27.
|
OTHER LONG-TERM LIABILITIES
|
|
(in thousands of $)
|
2013
|
|
2012
|
|
|
|
Deferred gain on sale of
Golar Maria
(see note 6)
|
16,660
|
|
—
|
|
|
|
Tax benefits on intra-group transfers of long-term assets
|
5,204
|
|
9,022
|
|
|
|
Pension obligations (
see note 28)
|
35,645
|
|
40,097
|
|
|
|
Guarantees issued to Golar Partners
(see note 5)
|
22,369
|
|
23,265
|
|
|
|
Other
|
4,388
|
|
131
|
|
|
|
|
84,266
|
|
72,515
|
|
|
Tax benefits arising on intra-group transfers of long-term assets arose from transactions between controlled entities in respect of two vessels, the
Gimi
and
Hilli
that generated a permanent tax benefit for us. The tax benefits are being amortized through the tax line of the statement of operations over the remaining useful lives of the vessel
s (see note 11).
|
28.
|
PENSIONS
|
Defined contribution scheme
We operate a defined contribution scheme. The pension cost for the period represents contributions payable by us to the scheme. The charge to net income for the years ended
December 31, 2013
,
2012
and
2011
was
$0.5 million
,
$0.8 million
and
$0.8 million
, respectively.
In respect of our Norwegian employees of which there were
10
(2012:
10
) as of
December 31, 2013
, we are required by Norwegian law to contribute into a multi-employer early retirement plan for the private sector. Accordingly, we, as a participant in a multi-employer plan recognize as net pension cost the required contribution for the period and recognize as a liability any unpaid contributions required for the period.
The total contributions to our defined contribution scheme were as follows:
|
(in thousands of $)
|
2013
|
|
2012
|
|
2011
|
|
||
|
Employers' contributions
|
533
|
|
570
|
|
397
|
|
||
Defined benefit schemes
We have
two
defined benefit pension plans both of which are closed to new entrants but which still cover certain of our employees. Benefits are based on the employee's years of service and compensation. Net periodic pension plan costs are determined using the Projected Unit Credit Cost method. Our plans are funded by us in conformity with the funding requirements of the applicable government regulations. Plan assets consist of both fixed income and equity funds managed by professional fund managers.
We use a measurement date of December 31 for our pension plans.
The components of net periodic benefit costs are as follows:
|
(in thousands of $)
|
2013
|
|
2012
|
|
2011
|
|
||
|
Service cost
|
468
|
|
429
|
|
459
|
|
||
|
Interest cost
|
2,159
|
|
2,361
|
|
2,729
|
|
||
|
Expected return on plan assets
|
(918
|
)
|
(920
|
)
|
(1,168
|
)
|
||
|
Recognized actuarial loss
|
1,415
|
|
1,273
|
|
985
|
|
||
|
Net periodic benefit cost
|
3,124
|
|
3,143
|
|
3,005
|
|
||
The estimated net loss for the defined benefit pension plans that will be amortized from accumulated other comprehensive income into net periodic pension benefit cost during the year ended December 31, 2014 is
$1.0 million
.
The change in benefit obligation and plan assets and reconciliation of funded status as of December 31 are as follows:
|
(in thousands of $)
|
2013
|
|
2012
|
|
|
|
Reconciliation of benefit obligation:
|
|
|
|||
|
Benefit obligation at January 1
|
54,291
|
|
52,430
|
|
|
|
Service cost
|
468
|
|
429
|
|
|
|
Interest cost
|
2,159
|
|
2,361
|
|
|
|
Actuarial (gain) loss
|
(3,513
|
)
|
3,890
|
|
|
|
Foreign currency exchange rate changes
|
164
|
|
509
|
|
|
|
Benefit payments
|
(3,005
|
)
|
(5,328
|
)
|
|
|
Benefit obligation at December 31
|
50,564
|
|
54,291
|
|
|
F-37
The accumulated benefit obligation at
December 31, 2013
and
2012
was
$48.9 million
and
$52.2 million
, respectively.
|
(in thousands of $)
|
2013
|
|
2012
|
|
|
|
Reconciliation of fair value of plan assets:
|
|
|
|||
|
Fair value of plan assets at January 1
|
14,194
|
|
14,846
|
|
|
|
Actual return on plan assets
|
1,127
|
|
1,807
|
|
|
|
Employer contributions
|
2,426
|
|
2,434
|
|
|
|
Foreign currency exchange rate changes
|
177
|
|
435
|
|
|
|
Benefit payments
|
(3,005
|
)
|
(5,328
|
)
|
|
|
Fair value of plan assets at December 31
|
14,919
|
|
14,194
|
|
|
|
(in thousands of $)
|
2013
|
|
2012
|
|
|
|
Projected benefit obligation
|
(50,564
|
)
|
(54,291
|
)
|
|
|
Fair value of plan assets
|
14,919
|
|
14,194
|
|
|
|
Funded status (1)
|
(35,645
|
)
|
(40,097
|
)
|
|
Employer contributions and benefits paid under the pension plans include
$2.4 million
paid from employer assets for each of the years ended
December 31, 2013
and
2012
.
(1) Our plans are composed of two plans that are both underfunded as at
December 31, 2013
and
2012
.
The details of these plans are as follows:
|
|
December 31, 2013
|
December 31, 2012
|
|||||||||||||||
|
(in thousands of $)
|
UK Scheme
|
|
Marine Scheme
|
|
Total
|
|
UK Scheme
|
|
Marine Scheme
|
|
Total
|
|
|||||
|
Projected benefit obligation
|
(10,256
|
)
|
(40,308
|
)
|
(50,564
|
)
|
(9,718
|
)
|
(44,573
|
)
|
(54,291
|
)
|
|||||
|
Fair value of plan assets
|
9,622
|
|
5,297
|
|
14,919
|
|
8,486
|
|
5,708
|
|
14,194
|
|
|||||
|
Funded status at end of year
|
(634
|
)
|
(35,011
|
)
|
(35,645
|
)
|
(1,232
|
)
|
(38,865
|
)
|
(40,097
|
)
|
|||||
The fair value of our plan assets, by category, as of
December 31, 2013
and
2012
were as follows:
|
(in thousands of $)
|
2013
|
|
2012
|
|
|
|
Equity securities
|
9,666
|
|
9,520
|
|
|
|
Debt securities
|
3,172
|
|
3,007
|
|
|
|
Cash
|
2,081
|
|
1,667
|
|
|
|
|
14,919
|
|
14,194
|
|
|
Our plan assets are primarily invested in funds holding equity and debt securities, which are valued at quoted market price. These plan assets are classified within Level 1 of the fair value hierarchy.
The amounts recognized in accumulated other comprehensive income consist of:
|
(in thousands of $)
|
2013
|
|
2012
|
|
|
|
Net actuarial loss
|
12,731
|
|
17,809
|
|
|
The actuarial loss recognized in the other comprehensive income is net of tax of
$0.1 million
,
$0.3 million
, and
$0.4 million
for the years ended
December 31, 2013
,
2012
and
2011
.
F-38
The asset allocation for our Marine scheme at
December 31, 2013
and
2012
, and the target allocation for 2013, by asset category are as follows:
|
Marine scheme
|
Target allocation 2014 (%)
|
2013 (%)
|
2012 (%)
|
||
|
Equity
|
30-65
|
30-65
|
30-65
|
||
|
Bonds
|
10-50
|
10-50
|
10-50
|
||
|
Other
|
20-40
|
20-40
|
20-40
|
||
|
Total
|
100
|
100
|
100
|
||
The asset allocation for our UK scheme at
December 31, 2013
and
2012
, and the target allocation for 2014, by asset category are as follows:
|
UK scheme
|
Target allocation 2014 (%)
|
2013 (%)
|
2012 (%)
|
||
|
Equity
|
70.0
|
71.0
|
72.5
|
||
|
Bonds
|
30.0
|
29.0
|
22.5
|
||
|
Cash
|
—
|
—
|
5.0
|
||
|
Total
|
100
|
100
|
100
|
||
Our investment strategy is to balance risk and reward through the selection of professional investment managers and investing in pooled funds.
We are expected to make the following contributions to the schemes during the year ended December 31, 2014, as follows:
|
(in thousands of $)
|
UK scheme
|
Marine scheme
|
|
||
|
Employer contributions
|
660
|
|
1,800
|
|
|
We are expected to make the following pension disbursements as follows:
|
(in thousands of $)
|
UK scheme
|
|
Marine scheme
|
|
|
|
2014
|
330
|
|
3,000
|
|
|
|
2015
|
330
|
|
3,000
|
|
|
|
2016
|
330
|
|
3,000
|
|
|
|
2017
|
330
|
|
3,000
|
|
|
|
2018
|
330
|
|
3,000
|
|
|
|
2019 - 2023
|
1,649
|
|
15,000
|
|
|
The weighted average assumptions used to determine the benefit obligation for our plans for the years ended December 31 are as follows:
|
|
2013
|
|
2012
|
|
|
|
Discount rate
|
4.80
|
%
|
4.10
|
%
|
|
|
Rate of compensation increase
|
2.71
|
%
|
2.96
|
%
|
|
F-39
The weighted average assumptions used to determine the net periodic benefit cost for our plans for the years ended December 31 are as follows:
|
|
2013
|
|
2012
|
|
|
|
Discount rate
|
4.10
|
%
|
4.10
|
%
|
|
|
Expected return on plan assets
|
6.75
|
%
|
6.75
|
%
|
|
|
Rate of compensation increase
|
2.96
|
%
|
2.52
|
%
|
|
The overall expected long-term rate of return on assets assumption used to determine the net periodic benefit cost for our plans for the years ending
December 31, 2013
and
2012
is based on the weighted average of various returns on assets using the asset allocation as at the beginning of 2013 and 2012. For equities and other asset classes, we have applied an equity risk premium over ten year governmental bonds.
|
29.
|
EQUITY OFFERINGS/TRANSACTIONS WITH LISTED SUBSIDIARIES OR AFFILLIATES
|
Golar Partners
The following table summarizes the issuances of common units of Golar Partners:
|
Public Offering
|
|||||||||||||||||||
|
Date
|
Number of Common Units Issued
1
|
Number of Common Units Issued to the Company
|
Offering Price
|
Gross Proceeds (in thousands of $)
2
|
Net Proceeds (in thousands of $)
|
Company's Ownership in Golar Partners after the Offering
3
|
|||||||||||||
|
April 2011 (IPO)
|
13,800,000
|
|
9,327,254
|
|
$
|
22.50
|
|
310,500
|
|
287,795
|
|
65.4
|
%
|
||||||
|
July 2012
|
6,325,000
|
|
969,305
|
|
$
|
30.95
|
|
188,485
|
|
187,138
|
|
57.5
|
%
|
||||||
|
November 2012
|
4,300,000
|
|
1,524,590
|
|
$
|
30.50
|
|
131,150
|
|
129,981
|
|
54.1
|
%
|
||||||
|
January 2013
|
3,900,000
|
|
416,947
|
|
$
|
29.74
|
|
115,986
|
|
115,224
|
|
50.9
|
%
|
||||||
|
December 2013
|
5,100,000
|
|
—
|
|
$
|
29.10
|
|
148,410
|
|
147,313
|
|
41.4
|
%
|
||||||
1
Pertains to common units issued by Golar Partners to the public.
2
Gross and net proceeds from Golar Partners' public offering (excluding proceeds received from Golar's participation in the concurrent private placement).
3
Includes our general partner interest in Golar Partners.
The following table summarizes the sale of our vessel interests to Golar Partners since its IPO:
|
2013
|
2012
|
2011
|
||||||||||
|
(in millions of $)
|
Golar Maria
|
Golar Grand
|
NR Satu
|
Golar Freeze
|
||||||||
|
Sales price
|
127.9
|
|
176.8
|
|
388.0
|
|
231.3
|
|
||||
|
Less: Net assets transferred
|
(45.6
|
)
|
(43.1
|
)
|
(255.7
|
)
|
(65.5
|
)
|
||||
|
Excess of sales price over net assets transferred
|
82.3
|
|
133.7
|
|
132.3
|
|
165.8
|
|
||||
|
Additions to Golar's stockholders' equity and noncontrolling interest
|
—
|
|
88.3
|
|
85.8
|
|
96.7
|
|
||||
The transactions involving the
Golar Grand
,
NR Satu
and the
Golar Freeze
were deemed to be concluded between entities under common control, accordingly, no gain or loss was recognized by the Company.
As the Partnership is no longer considered to be our controlled entity, the transaction involving the sale of
Golar Maria
is not accounted for as a transfer of equity interest between entities under common control. Accordingly, we have recognized a gain on disposal of the
Golar Maria
(see note 6).
F-40
Golar Freeze
On October 19, 2011, we sold our
100%
ownership interest in certain subsidiaries which own and operate the
Golar Freeze
and hold the secured bank debt to Golar Partners. The purchase consideration was
$330.0 million
for the vessel and
$9.0 million
of working capital adjustments net of the assumed bank debt of
$108.0 million
, resulting in total purchase consideration of approximately
$231.3 million
of which
$222.3 million
was financed by vendor financing provided by us.
NR Satu
On July 19, 2012, we sold our equity interests in certain subsidiaries which own and operate the
NR Satu
to Golar Partners. The purchase consideration was
$385.0 million
for the vessel and working capital adjustments of
$3.0 million
, resulting in total purchase consideration of approximately
$388.0 million
of which
$230.0 million
was financed from the proceeds of the July 2012 equity offering and
$155.0 million
vendor financing provided by us.
Golar Grand
On November 8, 2012, we sold our equity interests in subsidiaries which lease and operate the
Golar Grand
. The purchase consideration was
$265.0 million
for the vessel and working capital adjustments of
$2.6 million
, net of the assumed capital lease obligation of
$90.8 million
, resulting in total purchase consideration of
$176.8 million
which was principally financed from the proceeds of the November 2012 equity offering.
Golar Maria
On February 7, 2013, we sold our equity interests in the company which owns and operates the LNG carrier
Golar Maria
. The purchase consideration was
$215.0 million
for the vessel, working capital adjustments of
$5.5 million
, the fair value of the interest rate swap liability of
$3.1 million
less the assumed bank debt of
$89.5 million
, resulting in total purchase consideration of
$127.9 million
which was financed from the proceeds of Golar Partners' January 2013 equity offering.
Golar LNG Energy Limited ("Golar Energy")
In August 2009, we completed a private placement offering of our subsidiary, Golar Energy for
59.8 million
new common shares at a price of
$2
per share, for net proceeds of
$115.4 million
. As a result of the offering our ownership in Golar Energy was reduced to
68%
.
In mid 2011, the Company in a series of piecemeal acquisitions acquired an additional
92.3 million
shares, representing a
38.9%
interest in Golar Energy, to bring its ownership interest to
100%
. Of the
92.3 million
shares acquired,
70.3 million
(
76%
), were exchanged for newly issued shares in Golar, where the seller received
one
share in Golar for every
6.06
Golar Energy shares held, thereby increasing the Company's share capital by
$11.6 million
and share premium by
$340 million
. The new Golar shares were effectively issued for
$30.30
per share. The remaining Golar Energy shares were acquired at a price of approximately
$5
per share. As a result of these transactions, non-controlling interest of
$129.4 million
was eliminated and the difference between the non-controlling interest and consideration paid was recognized as a reduction in additional paid in capital of
$336.2 million
. On July 4, 2011, Golar Energy was delisted from the Norwegian stock exchange, Oslo Axess.
In connection with the above transactions described above, in May 2011, the remaining outstanding
5.4 million
options in Golar Energy were canceled and exchanged for options in Golar.
|
30.
|
SHARE CAPITAL AND SHARE OPTIONS
|
Our ordinary shares are listed on the Nasdaq Stock Exchange. We delisted from the Oslo Stock Exchange on August 30, 2012.
As at
December 31, 2013
and
2012
, our authorized and issued share capital is as follows:
Authorized share capital:
|
(in thousands of $, except per share data)
|
2013
|
|
2012
|
|
|
|
100,000,000 common shares of $1.00 each
|
100,000
|
|
100,000
|
|
|
Issued share capital:
|
(in thousands of $, except per share data)
|
2013
|
|
2012
|
|
|
|
80,579,295 outstanding issued common shares of $1.00 each (2012: 80,503,364)
|
80,580
|
|
80,504
|
|
|
We issued
0.1 million
and
0.3 million
common shares upon the exercise of stock options in
December 31, 2013
and
2012
, respectively. In addition, a further
11.6 million
shares were issued in 2011 in relation to the acquisition of the non-controlling interest in Golar Energy.
Treasury shares
In November 2007, our board of directors approved the buyback of up to a maximum of
1.0 million
shares in the Company. As at
December 31, 2013
, a further
0.3 million
shares in the Company maybe repurchased. The holding of treasury shares was held in connection with our share options plans.
The number of treasury shares held by us is as follows:
|
(Number of shares in thousands)
|
2013
|
|
2012
|
|
2011
|
|
||
|
At January 1
|
—
|
|
—
|
|
150
|
|
||
|
Disposed of during the year
|
—
|
|
—
|
|
(150
|
)
|
||
|
At December 31
|
—
|
|
—
|
|
—
|
|
||
Share options
Golar share options
In July 2001, our board of directors approved the grant of options to eligible employees to acquire an aggregate
2.0 million
shares in the Company. In July 2001, we granted
0.4 million
share options to certain directors and officers. The options vested in July 2002, and have a
ten
year term. As of December 31, 2013, these options have all been exercised.
In February 2002, our board of directors approved the Golar LNG Limited Share Option Scheme ("Golar Scheme"). The Golar Scheme permits the board of directors, at its discretion, to grant options to acquire shares in the Company to employees and directors of the Company or its subsidiaries. Options granted under the scheme will vest at a date determined by the board at the date of the grant. The options granted under the plan to date have
five
year terms and vest equally over a period of
three
to
four
years. There is
no
maximum number of shares authorized for awards of equity share options, and either authorized unissued shares or treasury shares in the Company may be used to satisfy exercised options.
In connection with the delisting of Golar Energy, previously granted options for
5.4 million
shares in Golar Energy were cancelled in May 2011 and concurrently replaced with
0.9 million
new options in Golar. There were no changes in the terms of the options except that the exchange of shares was equal to one Golar share for every
6.06
Golar Energy share. This was accounted for as a modification of previous awards of equity instruments. However, we recorded no difference between the total incremental cost of the original and modified options as the fair value of the options modified was below the fair value of the original options granted.
F-41
As at
December 31, 2013
,
2012
and
2011
, the number of options outstanding in respect of Golar shares was
0.5 million
,
0.6 million
and
0.8 million
, respectively.
Golar Energy share options
In August 2009, the board of directors of our subsidiary, Golar Energy approved the Golar LNG Energy Share option Scheme ("Energy Scheme"). The terms of the Energy Scheme follow that of the Golar Scheme.
In June 2011, in connection with the delisting of Golar Energy, previously granted options for
5.4 million
shares in Golar Energy were cancelled and concurrently replaced with new options in Golar (as discussed above). Accordingly, as of
December 31, 2013
, 2012 and 2011, there were
nil
options outstanding under the Energy Scheme.
The fair value of each option award is estimated on the grant date or modification date using the Black-Scholes option pricing model. The weighted average assumptions used are noted in the table below:
|
|
2013
|
|
2012
|
|
2011
|
|
||
|
Risk free interest rate
|
2.0
|
%
|
2.0
|
%
|
1.8
|
%
|
||
|
Expected volatility of common stock
|
56.9
|
%
|
56.9
|
%
|
53.2
|
%
|
||
|
Expected dividend yield
|
0.0
|
%
|
0.0
|
%
|
0.0
|
%
|
||
|
Expected life of options (in years)
|
2.6 years
|
|
2.6 years
|
|
2.6 years
|
|
||
The assumption for expected future volatility is based primarily on an analysis of historical volatility of our common stock. We use the simplified method for making estimates as to the expected term of options, based on the vesting period of the award and represents the period of time that options granted are expected to be outstanding. The dividend yield has been estimated at
0.0%
as the exercise price of the options, granted in 2006 and later, are reduced by the value of dividends, declared and paid on a per share basis.
A summary of option activity (including Golar Energy options prior to cancellation in May 2011) as at
December 31, 2013
,
2012
and
2011
, and changes during the years then ended are presented below:
|
(in thousands of $, except per share data)
|
Shares
(In '000s)
|
|
Weighted average exercise price
|
|
Weighted average remaining contractual term
(years)
|
|||
|
Options outstanding at December 31, 2010
|
7,279
|
|
$
|
2.96
|
|
2.0
|
||
|
Exercised during the year
|
(1,604
|
)
|
$
|
7.46
|
|
|
||
|
Forfeited during the year
|
(285
|
)
|
$
|
5.43
|
|
|||
|
Options exchanged
|
||||||||
|
- Golar Energy options exchanged and cancelled
|
(5,438
|
)
|
$
|
1.95
|
|
|||
|
- Golar LNG options issued
|
897
|
|
$
|
11.84
|
|
|||
|
Options outstanding at December 31, 2011
|
849
|
|
$
|
10.11
|
|
1.2
|
||
|
Exercised during the year
|
(267
|
)
|
$
|
1.54
|
|
|
||
|
Forfeited during the year
|
(1
|
)
|
$
|
8.54
|
|
|
||
|
Options outstanding at December 31, 2012
|
581
|
|
$
|
7.86
|
|
0.8
|
||
|
Exercised during the year
|
(76
|
)
|
$
|
8.01
|
|
|||
|
Forfeited during the year
|
(7
|
)
|
$
|
6.58
|
|
|||
|
Options outstanding at December 31, 2013
|
498
|
|
$
|
6.36
|
|
0.3
|
||
F-42
|
Options exercisable at:
|
|
|
|
|||||
|
December 31, 2013
|
409
|
|
$
|
6.50
|
|
0.1
|
||
|
December 31, 2012
|
323
|
|
$
|
8.46
|
|
0.3
|
||
|
December 31, 2011
|
299
|
|
$
|
9.94
|
|
0.3
|
||
The exercise price of all options except for those issued in 2001, is reduced by the amount of the dividends declared and paid; the above figures for options granted, exercised and forfeited show the average of the prices at the time of granting, exercising and forfeiting of the options, and for options outstanding at the beginning and end of the year, the average of the reduced option prices is shown.
The intrinsic value of share options exercised in the years ended
December 31, 2013
,
2012
and
2011
was
$2.2 million
,
$6.3 million
and
$14.9 million
, respectively.
As at
December 31, 2013
, the intrinsic value of share options that were both outstanding and exercisable was
$14.9 million
(
2012
:
$16.8 million
).
The total fair value of share options vested in the years ended
December 31, 2013
,
2012
and
2011
was
$3.8 million
,
$4.8 million
and
$6.3 million
, respectively.
Compensation cost of
$0.5 million
,
$1.4 million
and
$2.0 million
has been recognized in the Consolidated Statement of Operations for the years ended
December 31, 2013
,
2012
and
2011
, respectively.
As of
December 31, 2013
, the total unrecognized compensation cost amounted to
$0.2 million
(
2012
:
$0.6 million
) relating to options outstanding is expected to be recognized over a weighted average period of
0.3
years.
F-43
|
31.
|
ACCUMULATED OTHER COMPREHENSIVE INCOME (LOSS)
|
Accumulated Other Comprehensive Loss
As at
December 31, 2013
and
2012
, our accumulated other comprehensive loss balances consisted of the following components:
|
(in thousands of $)
|
2013
|
|
2012
|
|
2011
|
|
||
|
Unrealized net loss on qualifying cash flow hedging instruments
|
(1,822
|
)
|
(6,832
|
)
|
(19,462
|
)
|
||
|
Unrealized gain on available-for-sale securities
|
7,796
|
|
5,911
|
|
—
|
|
||
|
Losses associated with pensions, net of tax recoveries of $0.2 million (2012: $0.3 million)
|
(12,731
|
)
|
(17,809
|
)
|
(15,486
|
)
|
||
|
Accumulated other comprehensive loss
|
(6,757
|
)
|
(18,730
|
)
|
(34,948
|
)
|
||
The components of accumulated other comprehensive income (loss) consisted of the following:
|
Gain (losses) on available-for-sale securities
|
Pension and post retirement benefit plan adjustments
|
Gains (losses) on cash flow hedges
|
Share of affiliates comprehensive income
|
Total Accumulated comprehensive Income (loss)
|
||||||
|
Balance at December 31, 2010
|
—
|
|
(12,347
|
)
|
(20,964
|
)
|
—
|
|
(33,311
|
)
|
|
Other comprehensive (loss) income before reclassification
|
—
|
|
(3,139
|
)
|
1,502
|
|
—
|
|
(1,637
|
)
|
|
Net current-period other comprehensive (loss) income
|
—
|
|
(3,139
|
)
|
1,502
|
|
—
|
|
(1,637
|
)
|
|
Balance at December 31, 2011
|
—
|
|
(15,486
|
)
|
(19,462
|
)
|
—
|
|
(34,948
|
)
|
|
Other comprehensive income (loss) before reclassification
|
5,911
|
|
(2,323
|
)
|
3,641
|
|
—
|
|
7,229
|
|
|
Amount reclassified from accumulated other comprehensive income
|
—
|
|
—
|
|
8,989
|
|
—
|
|
8,989
|
|
|
Net current-period other comprehensive income (loss)
|
5,911
|
|
(2,323
|
)
|
12,630
|
|
—
|
|
16,218
|
|
|
Balance at December 31, 2012
|
5,911
|
|
(17,809
|
)
|
(6,832
|
)
|
—
|
|
(18,730
|
)
|
|
Other comprehensive income before reclassification
|
12,680
|
|
5,078
|
|
4,148
|
|
854
|
|
22,760
|
|
|
Amount reclassified from accumulated other comprehensive (loss) income
|
(10,795
|
)
|
—
|
|
8
|
|
—
|
|
(10,787
|
)
|
|
Net current-period other comprehensive income
|
1,885
|
|
5,078
|
|
4,156
|
|
854
|
|
11,973
|
|
|
Balance at December 31, 2013
|
7,796
|
|
(12,731
|
)
|
(2,676
|
)
|
854
|
|
(6,757
|
)
|
The amounts reclassified from accumulated other comprehensive income (loss) for the years ended December 31, 2013 and 2012 consisted of the following:
F-44
|
Details of Accumulated other comprehensive income components
|
Amounts reclassified from accumulated other comprehensive income
|
Affected line item in the statement of operations
|
|||
|
2013
|
2012
|
||||
|
Gains on available-for sale securities:
|
|||||
|
Available-for-sale securities (Golar Partners)
|
(10,710
|
)
|
—
|
|
Other non-operating income
|
|
Available-for-sale securities (Gaslog)
|
(85
|
)
|
—
|
|
Other non-operating income
|
|
(10,795
|
)
|
—
|
|
||
|
(Gains) losses on cash flow hedges:
|
|||||
|
Foreign currency swap
|
(718
|
)
|
—
|
|
Other financial items
|
|
Interest rate swap
|
(1,644
|
)
|
—
|
|
Other financial items
|
|
Interest rate swap
|
2,370
|
|
—
|
|
Gain on sale of
Golar Maria
|
|
Interest rate swap
|
—
|
|
3,925
|
|
Gain on loss of control
|
|
Cross-currency swap
|
—
|
|
5,064
|
|
Gain on loss of control
|
|
8
|
|
8,989
|
|
||
|
Total reclassifications for the period
|
(10,787
|
)
|
8,989
|
|
|
There are no amounts reclassified from the accumulated other comprehensive income to our statement of operations for the year ended December 31, 2011.
|
32.
|
FINANCIAL INSTRUMENTS
|
Interest rate risk management
In certain situations, we may enter into financial instruments to reduce the risk associated with fluctuations in interest rates. We have entered into swaps that convert floating rate interest obligations to fixed rates, which from an economic perspective hedge the interest rate exposure. We do not hold or issue instruments for speculative or trading purposes. The counterparties to such contracts are major banking and financial institutions. Credit risk exists to the extent that the counterparties are unable to perform under the contracts; however we do not anticipate non-performance by any of our counterparties.
We manage our debt portfolio with interest rate swap agreements in U.S. dollars to achieve an overall desired position of fixed and floating interest rates. We hedge account for certain of our interest rate swap arrangements designated as cash flow hedges. The net gains and losses have been reported in a separate component of accumulated other comprehensive income to the extent the hedges are effective. The amount recorded in accumulated other comprehensive income will subsequently be reclassified into earnings in the same period as the hedged items affect earnings. As at December 31, 2013, we do not expect any material amounts to be reclassified from accumulated other comprehensive income to earnings during the next twelve months.
During the years ended December 31, 2013, 2012 and 2011 we recognized a net gain of $
0.5 million
, and net losses of
$0.5 million
and
$0.6 million
, respectively, in earnings relating to the ineffective portion of our interest rate swap agreements designated as hedges.
As of December 31, 2013, we have entered into the following interest rate swap transactions involving the payment of fixed rates in exchange for
LIBOR
as summarized below. The summary also includes those that are designated as cash flow hedges:
|
Instrument
(in thousands of $)
|
Notional value
|
|
Maturity Dates
|
Fixed Interest Rates
|
||
|
Interest rate swaps:
|
|
|
|
|||
|
Receiving floating, pay fixed
|
128,021
|
|
2015
|
3.57% to 4.52%
|
||
F-45
As of December 31, 2012, our interest rate swaps had a total notional amount of
$180.1 million
with maturity dates between 2014 and 2015 and fixed interest rates ranging from
3.57%
to
4.52%
.
As of December 31, 2013, the notional principal amount of the debt outstanding subject to such swap agreements was
$128.0
million (2012:
$180.1 million
).
The effect of cash flow hedging relationships relating to swap agreements on the consolidated statements of operations is as follows:
|
(in thousands of $)
|
Effective portion (Loss)/gain reclassified from Accumulated Other Comprehensive Loss
|
Ineffective Portion
|
|||||||||||||||
|
Derivatives designated as hedging instruments location
|
2013
|
|
2012
|
|
2011
|
|
2013
|
|
2012
|
|
2011
|
|
|||||
|
Interest rate swaps
Other financial items, net
|
(1,644
|
)
|
—
|
|
—
|
|
542
|
|
(535
|
)
|
(632
|
)
|
|||||
|
Interest rate swaps
Gain on sale of Maria, net
|
2,370
|
|
—
|
|
—
|
|
—
|
|
—
|
|
—
|
|
|||||
The effect of cash flow hedging relationships relating to interest rate swap agreements to the consolidated statements of changes in equity is as follows:
|
(in thousands of $)
|
Amount of gain recognized in other comprehensive income on derivative (effective portion)
|
|||||||
|
Derivatives designated as hedging instruments
|
2013
|
|
2012
|
|
2011
|
|
||
|
Interest rate swaps
|
4,147
|
|
1,547
|
|
1,024
|
|
||
As of December 31, 2013, our accumulated other comprehensive loss included
$2.7 million
of unrealized losses on interest rate swap agreements designated as cash flow hedges and
$0.9 million
of unrealized gain being our share of Golar Partners other comprehensive income on swap agreements designated as cash flow hedges.
As of December 31, 2013, we do not expect any material amounts to be reclassified from accumulated other comprehensive income to earnings during the next twelve months.
Foreign currency risk
The majority of the vessels' gross earnings are receivable in U.S. dollars. The majority of our transactions, assets and liabilities are denominated in U.S. dollars, our functional currency. However, we incur expenditure in other currencies. There is a risk that currency fluctuations will have a negative effect on the value of our cash flows.
In October 2012, Golar Partners issued NOK denominated senior unsecured bonds in which we also participated. In order to hedge our exposure, we entered into a currency swap that converted our NOK bonds to USD in a fixed rate. The swap hedged the full amount of the NOK bonds. In November 2013, we sold our participation in Golar Partner's high yield bonds, accordingly, the currency swap was also terminated in January 2014.
Fair values
We recognize our fair value estimates using a fair value hierarchy based on the inputs used to measure fair value. The fair value hierarchy has three levels based on reliability of inputs used to determine fair value as follows:
Level 1: Quoted market prices in active markets for identical assets and liabilities;
Level 2: Observable market based inputs or unobservable inputs that are corroborated by market data;
Level 3: Unobservable inputs that are not corroborated by market data.
There have been no transfers between different levels in the fair value hierarchy during the year.
F-46
|
|
Fair value
|
2013
|
|
2013
|
|
2012
|
|
2012
|
|
||||
|
(in thousands of $)
|
Hierarchy(1)
|
Carrying Value
|
|
Fair Value
|
|
Carrying Value
|
|
Fair Value
|
|
||||
|
Non-Derivatives:
|
|
|
|
|
|
||||||||
|
Cash and cash equivalents
|
Level 1
|
125,347
|
|
|
125,347
|
|
424,714
|
|
424,714
|
|
|||
|
Restricted cash and short-term investments
|
Level 1
|
26,543
|
|
|
26,543
|
|
1,551
|
|
1,551
|
|
|||
|
Investment in available-for-sale securities
|
Level 1
|
267,352
|
|
|
267,352
|
|
353,034
|
|
353,034
|
|
|||
|
Cost method investments
|
Level 3
|
204,172
|
|
|
218,647
|
|
198,524
|
|
200,747
|
|
|||
|
Amounts due from Golar Partners
|
Level 1
|
—
|
|
|
—
|
|
34,953
|
|
36,109
|
|
|||
|
Long-term debt – convertible bond (1)
|
Level 1
|
233,020
|
|
|
254,063
|
|
228,331
|
|
251,250
|
|
|||
|
Long-term debt – floating (1)
|
Level 1
|
434,008
|
|
|
434,008
|
|
276,575
|
|
276,575
|
|
|||
|
Long-term debt - due to related party (1)
|
Level 1
|
50,000
|
|
50,000
|
|
—
|
|
—
|
|
||||
|
Derivatives:
|
|
|
|
|
|
|
|
|
|||||
|
Interest rate swaps asset (2) (3)
|
Level 2
|
46,827
|
|
46,827
|
|
—
|
|
—
|
|
||||
|
Interest rate swaps liability (2)
|
Level 2
|
11,401
|
|
|
11,401
|
|
26,472
|
|
26,472
|
|
|||
|
Foreign currency swaps liability
|
Level 2
|
729
|
|
|
729
|
|
94
|
|
94
|
|
|||
(1) Our debt obligations are recorded at amortized cost in the consolidated balance sheet.
(2) Derivative liabilities are captured within other current liabilities and derivative assets are captured within long-term assets on the balance sheet.
(3) The fair value/carrying value of interest rate swap agreements that qualify and are designated as a cash flow hedge as at December 31, 2013 and 2012, was
$5.3 million
(with a notional value of
$128.0 million
) and
$12.9 million
(with a notional value of
$180.1 million
), respectively. The expected maturity of these interest rate agreements is from January 2015 to April 2015.
The following methods and assumptions were used to estimate the fair value of each class of financial instrument.
The carrying amounts of accounts receivable, accounts payable, accrued liabilities and working capital facilities approximate fair values because of the short maturity of those instruments.
The carrying value of cash and cash equivalents, which are highly liquid, is a reasonable estimate of fair value.
The estimated fair value for restricted cash and short-term investments is considered to be equal to the carrying value since restricted cash bears variable interest rates which are reset on a quarterly basis and short-term investments are placed for periods of less than six months.
The carrying amount of the investment in available-for-sale ("AFS") securities reported in the balance sheet represents unrealized gains and losses on these securities, which are recognized directly in equity unless a gain is realized upon sale of these units or an unrealized loss is considered "other than temporary" in which case it is transferred to the statement of operations. The basis of valuation of the investment in AFS securities is at market value.
The carrying value of cost method investments refers to our holdings in Golar Partners (representing the general partner units and IDRs which were measured at fair value as of the deconsolidation date December 13, 2012 (see note 5)) and OLT‑O. As at December 31, 2013, we did not identify any events or changes in circumstances that would indicate the carrying values of our investments in Golar Partners and OLT-O were not recoverable. The fair value of our general partner units was based on the share price of the publicly traded common units of Golar Partners adjusted for restrictions over the transferability and reduction in voting rights. While the fair value of the IDRs was determined using a Monte Carlo simulation method. Refer to note 5 for further details.
For our investment in OLT-O, as we have no established method of determining the fair value of this investment, we did not estimate the fair value of this investment as at December 31, 2013.
The amounts due from Golar Partners refers to our participation in the high yield bonds issued by Golar Partners in October 2012. As of December 31, 2012, we estimated the fair value of our participation in the high yield bond on its quoted price. In November 2013, we sold our participation.
F-47
The estimated fair value for the liability component of the unsecured convertible bonds is based on the quoted market price as at the balance sheet date.
The estimated fair values for both the floating long-term debt and long-term debt to a related party are considered to be equal to the carrying values since they bear variable interest rates, which are reset on a quarterly or six-monthly basis.
The estimated fair value of the financial guarantees is considered to be equal to the carrying amount. The financial guarantees were fair valued as of the deconsolidation date, December 13, 2012 (see note 5). We did not identify any material changes in the fair value of the financial guarantees as at December 31, 2013.
The fair value of our derivative instruments is the estimated amount that we would receive or pay to terminate the agreements at the reporting date, taking into account current interest rates, foreign exchange rates, closing quoted market prices and our creditworthiness and that of our counterparties. The mark-to-market gain or loss of our interest rate and foreign currency swaps that are not designated as hedges for accounting purposes is reported in the statement of operations caption "other financial items, net" (see note 10).
The fair value measurement of a liability must reflect the non-performance of the entity. Therefore, the impact of our credit worthiness has also been factored into the fair value measurement of the derivative instruments in a liability position.
The credit exposure of interest rate swap agreements is represented by the fair value of contracts with a positive value at the end of each period, reduced by the effects of master netting arrangements. It is our policy to enter into master netting agreements with counterparties to derivative financial instrument contracts, which give us the legal right to discharge all or a portion of the amounts owed to the counterparty by offsetting them against amounts that the counterparty owes to us.
The following table summarizes the fair value of derivative instruments on a gross basis recorded in our consolidated balance sheets as of December 31, 2013 and 2012:
|
Balance sheet classification
|
2013
|
|
2012
|
|
||
|
(in thousands of $)
|
||||||
|
Asset Derivatives
|
||||||
|
Interest rate swaps not designated as hedges
|
Other non-current assets
|
46,827
|
|
—
|
|
|
|
Liability Derivatives
|
||||||
|
Interest rate swaps designated as hedges
|
Other current liabilities
|
6,072
|
|
12,950
|
|
|
|
Interest rate swaps not designated as hedges
|
Other current liabilities
|
5,329
|
|
13,522
|
|
|
|
Foreign currency swap not designated as hedge
|
Other current liabilities
|
729
|
|
94
|
|
|
|
Total liability derivatives
|
12,130
|
|
26,566
|
|
||
We have elected not to offset the fair values of derivative assets and liabilities executed with the same counterparty that are generally subject to enforceable master netting arrangements. However, if we were to offset and record the asset and liability balances of derivatives on a net basis, the amounts presented in our consolidated balance sheets as of December 31, 2013 and 2012 would be adjusted as detailed in the following table:
F-48
|
2013
|
2012
|
|||||||||||
|
Gross amounts presented in the consolidated balance sheet
|
Gross amounts not offset in the consolidated balance sheet subject to netting agreements
|
Net amount
|
Gross amounts presented in the consolidated balance sheet
|
Gross amounts not offset in the consolidated balance sheet subject to netting agreements
|
Net amount
|
|||||||
|
(in thousands of $)
|
||||||||||||
|
Total asset derivatives
|
46,827
|
|
(4,327
|
)
|
42,500
|
|
—
|
|
—
|
|
—
|
|
|
Total liability derivatives
|
12,130
|
|
(4,327
|
)
|
7,803
|
|
26,566
|
|
—
|
|
26,566
|
|
Assets measured at Fair Value on a Non-recurring Basis
We recorded an impairment loss of
$0.5 million
,
$0.5 million
and
$0.5 million
in 2013, 2012 and 2011, respectively. The impairment loss refers to the unutilized parts originally ordered for the
Golar Spirit
FSRU retrofitting following changes to the original project specification. As at December 31, 2013, these parts were measured at an estimated fair value of
$2.5 million
, which was determined using level two inputs being the carrying cost of these parts less the impairment loss, which was calculated based on the estimated market value of these parts.
Concentrations of risk
There is a concentration of credit risk with respect to cash and cash equivalents to the extent that substantially all of the amounts are carried with Nordea Bank of Finland PLC, DNB Bank ASA and Citi Bank. However, we believe this risk is remote.
We have a substantial equity investment in our former subsidiary, Golar Partners, that from December 13, 2012 is considered as our affiliate and not our controlled subsidiary. As of December 31, 2013, our ownership interest was
41.4%
and the aggregate value of the investments recorded in our balance sheet as of December 31, 2013 was
$809.0 million
being the aggregate of our ownership interest (common, subordinated and general partner interests) plus IDRs. Accordingly, the value of our investment and the income generated from Golar Partners is subject to specific risks associated with its business. Golar Partners operates in the same business as us and as of December 31, 2013 had a fleet of
eight
vessels as managed by us operating under medium to long-term charters with a concentrated number of charterers; BG Group, Petrobras, Pertamina, DUSUP, Nusantara Regas and Eni.
There is a concentration of supplier risk
with respect to our remaining
eleven
newbuilds (two having been delivered in October 2013) of which
nine
are currently under construction by Samsung Heavy Industries Co Ltd ("Samsung") and
two
currently under construction by Hyundai Samho Heavy Industries Co., Ltd ("Hyundai") as at December 31, 2013. However, we believe this risk is remote as Samsung and Hyundai are global leaders in the shipbuilding sector. As is typical with newbuilding contracts, we have entered into refund guarantee agreements with several banks.
F-49
|
33.
|
RELATED PARTY TRANSACTIONS
|
a) Transactions with Golar Partners and subsidiaries:
Net revenues:
Prior to the deconsolidation of Golar Partners, the following revenues presented below were largely eliminated upon consolidation of Golar Partners for the periods through to December 13, 2012:
|
(in thousands of $)
|
2013
|
|
2012
|
|
2011
|
|
|||
|
Transactions with Golar Partners and subsidiaries:
|
|
|
|
|
|
|
|||
|
Management and administrative services fees income (i)
|
2,569
|
|
2,876
|
|
*
|
1,576
|
|
||
|
Ship management fees income (ii)
|
6,701
|
|
4,222
|
|
*
|
4,146
|
|
||
|
Interest income on vendor financing loan -
Golar Freeze
(iii)
|
—
|
|
11,921
|
|
3,085
|
|
|||
|
Interest income on vendor financing loan -
NR Satu
(iv)
|
—
|
|
4,737
|
|
*
|
—
|
|
||
|
Interest income on high-yield bonds (v)
|
1,972
|
|
575
|
|
*
|
—
|
|
||
|
Interest income on Golar Energy loan (vi)
|
—
|
|
829
|
|
—
|
|
|||
|
Total
|
11,242
|
|
25,160
|
|
8,807
|
|
|||
*The net effect to our consolidated statement of operations for the year ended December 31, 2012 was an aggregate income of
$1.5 million
.
Receivables (payables):
The balances with Golar Partners and subsidiaries as of December 31, 2013 and 2012 consisted of the following:
|
(in thousands of $)
|
2013
|
|
2012
|
|
||
|
Trading balances due to Golar and affiliates (vii)
|
5,989
|
|
2,031
|
|
||
|
Methane Princess Lease security deposit movements (viii)
|
(4,257
|
)
|
—
|
|
||
|
High-yield bonds (v)
|
—
|
|
34,953
|
|
||
|
|
1,732
|
|
36,984
|
|
||
(i)
Management and administrative services agreement -
On March 30, 2011, Golar Partners entered into a management and administrative services agreement with Golar Management, a wholly-owned subsidiary of ours, pursuant to which Golar Management will provide to Golar Partners certain management and administrative services. The services provided by Golar Management are charged at cost plus a management fee equal to
5%
of Golar Management’s costs and expenses incurred in connection with providing these services. Golar Partners may terminate the agreement by providing
120 days
written notice.
(ii)
Ship management fees
- Golar and certain of its affiliates charged ship management fees to Golar Partners for the provision of technical and commercial management of the vessels. Each of Golar Partners’ vessels is subject to management agreements pursuant to which certain commercial and technical management services are provided by certain affiliates of Golar, including Golar Management and Golar Wilhelmsen AS ("Golar Wilhelmsen"), a partnership that is jointly controlled by Golar and by Wilhelmsen Ship Management (Norway) AS.
(iii)
Vendor financing loan - Golar Freeze
- In October 2011, in connection with the sale of the
Golar Freeze
, we entered into a financing loan agreement with Golar Partners for an amount of
$222.3 million
. The facility was unsecured and bore interest at a fixed rate of
6.75%
per annum payable quarterly. The loan was non-amortizing with a final balloon payment of
$222.3 million
due in October 2014. The loan was repaid in October 2012.
(iv)
Vendor financing loan - NR Satu
- In July 2012, in connection with the sale of the
NR Satu
, we entered into a financing loan agreement with Golar Partners for an amount of
$175.0 million
. Of this amount,
$155.0 million
was drawn down in July 2012. A further
$20.0 million
was available for drawdown until July 2015. The facility was unsecured and bore interest at a fixed rate of
6.75%
per annum payable quarterly. The loan was non-amortizing with a final balloon payment for the amount drawn down due within
three
years from the date of draw down. The loan was repaid in December 2012.
(v)
High-yield bonds
- In October 2012, Golar Partners completed the issuance of NOK
1,300.0 million
in senior unsecured bonds that mature in October 2017. The aggregate principal amount of the bonds is equivalent to approximately
$227.0 million
. Of this amount, approximately
$35.0 million
, was issued to us. We sold our participation on the high yield bond in November 2013.
F-50
(vi)
Golar Energy loan
- In January 2012, Golar LNG (Singapore) Pte. Ltd. ("Golar Singapore"), the subsidiary which holds the investment in PTGI, drew down
$25.0 million
on its loan agreement entered into in December 2011 with Golar Energy. The loan was unsecured, repayable on demand and bore interest at the rate of
6.75%
per annum payable on a quarterly basis. In connection with the acquisition of the subsidiaries that own and operate the
NR Satu
, all amounts payable to Golar Energy by the subsidiaries acquired by Golar Partners, including Golar Singapore, were extinguished.
(vii)
Trading balances -
Receivables and payables with Golar Partners and its subsidiaries are comprised primarily of unpaid management fees, advisory and administrative services. In addition, certain receivables and payables arise when we pay an invoice on behalf of a related party and vice versa. Receivables and payables are generally settled quarterly in arrears. Trading balances due from Golar Partners and its subsidiaries are unsecured, interest-free and intended to be settled in the ordinary course of business. They primarily relate to recharges for trading expenses paid on behalf of Golar Partners, including ship management and administrative service fees due to us.
(viii)
Methane Princess Lease security deposit movements
- This represents net advances from Golar Partners since its IPO, which correspond with the net release of funds from the security deposits held relating to the Methane Princess Lease. This is in connection with the Methane Princess tax lease indemnity provided to Golar Partners under the Omnibus Agreement (see below). Accordingly, these amounts will be settled as part of the eventual termination of the Methane Princess Lease.
Other transactions:
a)
$20 million revolving credit facility:
On April 13, 2011, we entered into a
$20.0 million
revolving credit facility with Golar Partners. In May 2013, Golar Partners drew down
$20 million
from the facility which it subsequently repaid in December 2013. As of December 31, 2013, Golar Partners has
$20.0 million
available under this facility to draw down. This facility matures in
2015
and is unsecured and interest-free.
b)
Dividends to non-controlling interests:
|
(in thousands of $)
|
2013
|
|
2012
|
|
2011
|
|
||
|
Faraway Maritime Shipping Company
|
—
|
|
1,800
|
|
2,400
|
|
||
|
Golar Partners
|
—
|
|
30,282
|
|
10,132
|
|
||
|
|
—
|
|
32,082
|
|
12,532
|
|
||
Faraway Maritime Shipping Company owns the vessel, the
Golar Mazo
. Golar Partners held a
60%
equity interest in the company, with the remaining
40%
interest held by CPC Corporation, Taiwan.
In April 2011, following the IPO of our former subsidiary, Golar Partners, our ownership interest fell to
65.4%
. Our interest was further diluted as a result of follow-on equity offerings in 2012 and 2013, such that, our ownership interest as of December 31, 2013 stands at
41.4%
. Since December 13, 2012, Golar Partners has been considered an affiliate entity and not as our controlled subsidiary.
Since its IPO in April 2011, Golar Partners has declared and paid quarterly distributions totalling
$63.7 million
,
$47.3 million
and
$19.1 million
to us for each of the years ended December 31, 2013, 2012 and 2011, respectively.
c)
Disposals to Golar Partners:
Since Golar Partners' IPO in April 2011, we have disposed of equity interests in certain subsidiaries which own or lease and operate the
Golar Freeze
, the
NR Satu
and the
Golar Grand
to Golar Partners. These transactions were deemed to be concluded between entities under common control and, thus the gain on disposal was recorded as an equity transaction (see note 29). In February 2013, we disposed of our interest in the subsidiary which owns and operates the
Golar Maria.
Since the Partnership is no longer considered to be our controlled entity, this transaction was not accounted for as a transfer of equity interests under common control. Accordingly, we recognized a gain on disposal of
Golar Maria
(see note 6).
In December 2013, we entered into an agreement to sell our interest in the company that owns and operates the
Golar Igloo
for the price of
$310.0 million
subject to certain closing conditions. The sale was completed in March 2014 (see note 36).
F-51
d)
Golar Grand option:
In connection with the disposal of the
Golar Grand
in November 2012, we entered into an Option Agreement with Golar Partners. Under the Option Agreement, in the event BG does not extend their charter for the vessel for an additional three years, Golar Partners has an option to require us to charter-in the
Golar Grand
under a time charter expiring in October 2017.
e)
Payment under Omnibus Agreement:
During the year, Golar Partners incurred expenses of
$3.3 million
which was indemnified by the Company as part of the Omnibus Agreement. This was recognized in our statement of operations as "other non-operating expense".
Indemnifications and guarantees:
f)
Tax lease indemnifications:
Under the Omnibus Agreement, we have agreed to indemnify Golar Partners in the event of any liabilities in excess of scheduled or final settlement amounts arising from the
Methane Princess
leasing arrangement and the termination thereof.
In addition, to the extent Golar Partners incurs any liabilities as a consequence of a successful challenge by the U.K. Revenue Authorities with regard to the initial tax basis of the transactions relating to any of the U.K. tax leases or in relation to the lease restructuring terminations in 2010, we have agreed to indemnify Golar Partners.
The maximum possible amount in respect of the tax lease indemnification is unknown as the determination of this amount is dependent on our intention of terminating this lease and the various market factors present at the point of termination. As of December 31, 2013, we recognized a liability of
$11.5 million
in respect of the tax lease indemnification to Golar Partners (see note 5) representing the fair value at deconsolidation (2012:
$11.5 million
).
g)
Environmental and other indemnifications:
Under the Omnibus Agreement, we have agreed to indemnify Golar Partners until April 13, 2016, against certain environmental and toxic tort liabilities with respect to the assets that we contributed or sold to Golar Partners to the extent they arose prior to the time they were contributed or sold. However, claims are subject to a deductible of
$0.5 million
and an aggregate cap of
$5.0 million
.
In addition, pursuant to the Omnibus Agreement, we agreed to indemnify Golar Partners for any defects in title to the assets contributed or sold to Golar Partners and any failure to obtain, prior to April 13, 2011, certain consents and permits necessary to conduct Golar Partner's business, which liabilities arise within three years after the closing of its IPO on April 13, 2011.
h)
Performance guarantees:
We issued performance guarantees to third party charterers in connection with the Time Charter Party agreements entered into with the vessel operating entities who are now subsidiaries of Golar Partners. These performance guarantees relate to the
Golar Spirit
, the
Golar Freeze
, the
Methane Princess
, the
Golar Winter
and the
Golar Mazo
.
The maximum potential exposure in respect of the performance guarantees issued by the Company is unknown as these matters cannot be absolutely determined. The likelihood of triggering the performance guarantees is remote based on the past performance of both our combined fleet.
i)
Debt guarantee:
The debt guarantees were issued by us to third party banks in respect of certain secured debt facilities relating to Golar Partners and subsidiaries. The liability is being amortized over the remaining term of the respective debt facilities with the credit recognized in "Other financial items".
As of December 31, 2013, we guaranteed $
533.5 million
of Golar Partners' long-term debt and capital lease obligations, net of restricted cash. All of the facilities and lease obligations guaranteed by Golar are secured on specific vessels. As of December 31, 2013, these vessels have higher market values than the carrying amounts of the facilities and capital lease obligation to which the vessels are secured against.
j)
Legal claim:
Refer to discussion in note 35 - NR Satu related claim.
F-52
Omnibus Agreement
In connection with the IPO of Golar Partners, we entered into an Omnibus Agreement with Golar Partners governing, among other things, when we and Golar Partners may compete against each other as well as rights of first offer on certain FSRUs and LNG carriers. Under the Omnibus Agreement, Golar Partners and its subsidiaries agreed to grant a right of first offer on any proposed sale, transfer or other disposition of any vessel it may own. Likewise, we agreed to grant a similar right of first offer to Golar Partners for any vessel under a charter for
five
or more years, that it may own. These rights of first offer will not apply to a (a) sale, transfer or other disposition of vessels between any affiliated subsidiaries, or pursuant to the terms of any current or future charter or other agreement with a charter party or (b) merger with or into, or sale of substantially all of the assets to, an unaffiliated third-party. In addition, the Omnibus Agreement provides for certain indemnities to Golar Partners in connection with the assets transferred from us.
b) Net income (expenses) from (due to) other related parties (excluding Golar Partners):
|
(in thousands of $)
|
2013
|
|
2012
|
|
2011
|
|
||
|
Frontline Ltd. and subsidiaries ("Frontline") (i)
|
49
|
|
(325
|
)
|
(972
|
)
|
||
|
Seatankers Management Company Limited ("Seatankers") (i)
|
(45
|
)
|
31
|
|
(64
|
)
|
||
|
Ship Finance AS ("Ship Finance") (i)
|
207
|
|
4
|
|
190
|
|
||
|
Bluewater Gandria (ii)
|
—
|
|
—
|
|
125
|
|
||
|
Golar Wilhelmsen (iii)
|
(4,899
|
)
|
(3,169
|
)
|
(2,816
|
)
|
||
|
World Shipholding (iv)
|
(976
|
)
|
(2,961
|
)
|
(2,302
|
)
|
||
(Payables to) receivables from related parties (excluding Golar Partners):
|
(in thousands of $)
|
2013
|
|
2012
|
|
|
|
World Shipholding
|
|
|
|||
|
- Loan (iv)
|
(50,000
|
)
|
—
|
|
|
|
Frontline
|
(60
|
)
|
(143
|
)
|
|
|
Seatankers
|
91
|
|
(12
|
)
|
|
|
Ship Finance
|
2
|
|
2
|
|
|
|
Seadrill Limited ("Seadrill")
|
(74
|
)
|
—
|
|
|
|
|
(50,041
|
)
|
(153
|
)
|
|
i. We transact business with the following parties, being companies in which World Shipholding and companies associated with World Shipholding have a significant interest: Frontline, Ship Finance, Seatankers and Seadrill. Net expense/income from Frontline, Seatankers and Ship Finance comprise fees for management support, corporate and insurance administrative services, net of income from supplier rebates and income from the provision of serviced offices and facilities. Receivables and payables with related parties comprise primarily of unpaid management fees, advisory and administrative services. In addition, certain receivables and payables arise when we pay an invoice on behalf of a related party and vice versa. Receivables and payables are generally settled quarterly in arrears.
ii.
Bluewater Gandria
- In January 2012, we acquired the remaining
50%
in our joint venture, Bluewater Gandria, which owns the vessel, the
Gandria
, for a total consideration of
$19.5 million
. As a result of this transaction, Bluewater Gandria is now our wholly-owned subsidiary. Refer to note 7 for further details of the acquisition. The charges to Bluewater for the year ended December 31, 2011 related to agency fees.
iii. As of
December 31, 2013
, we held a
60%
ownership interest in Golar Wilhelmsen, which we account for using the equity method (see note 14). Golar Wilhelmsen recharges management fees in relation to provision of technical and ship management services.
F-53
iv.
World Shipholding revolving credit facility
- In April 2011, we entered into an
$80.0 million
revolving credit facility with a company related to our major shareholder, World Shipholding. In January, February and May of 2012, the revolving credit facility was amended to $
145.0 million
, $
250.0 million
and $
120.0 million
, respectively, without any further changes to the original terms of the facility. In July 2012, the facility was repaid in full with the proceeds received from the sale of the companies that own and operate the
NR Satu
to Golar Partners. In May 2013, the margin on the facility was amended from
3.5%
to
3.0%
. As of December 31, 2013, we had $
50.0 million
of borrowings under this facility. The facility is unsecured and bears interest at
LIBOR
plus
3.0%
together with a commitment fee of
0.75%
on any undrawn portion of the credit facility.
For each of the years ended
December 31, 2013
,
2012
and
2011
, included within net expenses due to World Shipholding, include loan interest and commitment fees of
$1.0 million
,
$0.8 million
, and
$1.9 million
respectively.
F-54
|
34.
|
CAPITAL COMMITMENTS
|
Newbuilding Contracts
Between 2011 and 2012, we entered into newbuilding contracts for the construction of
ten
LNG carriers and
three
FSRUs for a total cost of approximately
$2.7 billion
. As of December 31, 2013, following the delivery of
two
LNG carriers in 2013,
eleven
vessels remain to be delivered. All but one are scheduled to be delivered in 2014, with the final delivery tim
ed for 2015 subject to the outcome of negotiations with Samsung to delay delivery of certain vessels. As
of December 31, 2013,
$1.6 billion
remains to be paid in respect of these vessels.
As at
December 31, 2013
, the estimated timing of the installment payments for these newbuildings are due to be paid as follows:
|
(in thousands of $)
|
|
|
|
Payable within 12 months to December 31, 2014
|
1,495,385
|
|
|
Payable within 12 months to December 31, 2015
|
152,220
|
|
|
|
1,647,605
|
|
|
35.
|
OTHER COMMITMENTS AND CONTINGENCIES
|
Assets Pledged
|
(in thousands of $)
|
December 31, 2013
|
|
December 31, 2012
|
|
|
|
Book value of vessels secured against long-term loans and capital leases
|
700,726
|
|
432,867
|
|
|
Other Contractual Commitments and contingencies
Insurance
We insure the legal liability risks for our shipping activities with Gard and Skuld. Both are mutual protection and indemnity associations. As a member of a mutual association, we are subject to calls payable to the associations based on our claims record in addition to the claims records of all other members of the association. A contingent liability exists to the extent that the claims records of the members of the association in the aggregate show significant deterioration, which results in additional calls on the members.
Tax lease benefits
The benefits under lease financings are derived primarily from tax depreciation assumed to be available to lessors as a result of their investment in the vessels. In the event of any adverse tax changes or a successful challenge by the U.K. Revenue authorities with regard to the initial tax basis of the transactions, or in relation to the lease restructuring and subsequent terminations we have entered into in 2010 or in the event of an early termination of our remaining leases, we may be required to make additional payments to the U.K. vessel lessors or the U.K. revenue authorities which could adversely affect our earnings and financial position. We would be required to return all or a portion of, or in certain circumstances significantly more than, the upfront cash benefits that we have received or accrued over time, together with fees that were incurred in respect of our lease financing transactions including the restructuring and subsequent termination transactions or post additional security or make additional payments to the U.K. vessel lessors.
Six
U.K. tax leases we entered into during 2003 were structured so that a cash benefit was received up front (in total a gross amount before deduction of fees of approximately
£41 million
British pounds). Of these
six
leases we have since terminated
five
, with
one
lease remaining, being that of the Methane Princess lease. Pursuant to the deconsolidation of Golar Partners in 2012, Golar Partners is no longer considered a controlled entity but an affiliate and therefore the capital lease obligation relating to this remaining U.K. tax lease is not consolidated into our balance sheet as of December 31, 2013.
F-55
Under the indemnity provisions of the Omnibus Agreement or the respective share purchase agreements, we have agreed to indemnify Golar Partners in the event of any liabilities in excess of scheduled or final scheduled amounts arising from the Methane Princess leasing arrangement and the termination thereof.
In addition, to the extent Golar Partners incurs any liabilities as a consequence of a successful challenge by the U.K. Revenue Authorities with regard to the initial tax basis of the transactions relating to any of the U.K. tax leases or in relation to the lease restructuring and terminations in 2010, we have agreed to indemnify Golar Partners.
Legal proceedings and claims
We may, from time to time, be involved in legal proceedings and claims that arise in the ordinary course of business. A provision will be recognized in the financial statements only where we believe that a liability will be probable and for which the amounts are reasonably estimable, based upon the facts known prior to the issuance of the financial statements.
NR Satu related claim
PT Golar Indonesia, a subsidiary of Golar Partners that is both the owner and operator of the
NR Satu,
has been notified of a claim that may be filed against it by PT Rekayasa, a subcontractor of the charterer, PT Nusantara Regas, claiming that Golar Partners and its subcontractor caused damage to the pipeline in connection with the FSRU conversion of the
NR Satu
and the related mooring. As of the current date, no suit has been filed and both we and Golar Partners are of the view that, were the claim to be filed with the Indonesian authorities, any resolution could potentially take years. We both continue to believe we have meritorious defences against these claims, however, we are currently involved in compromise settlement discussions with the other parties. An estimate of the compromise settlement amount is between
$2 million
and
$4.8 million
. Golar Partners considers it probable that any loss suffered will be recoverable from its subcontractor who is also a party to these settlement discussions.
As part of the disposal of the
NR Satu
in July 2012 by us, we have also agreed to indemnify Golar Partners against any non-recoverable losses.
Golar Viking related claim
In January 2011, Qatar Gas Trading Company Limited ("Nakilat") chartered the
Golar Viking
from the us for a period of
15
months. In April 2012, the time charter party agreement was terminated early. On February 15, 2013, Nakilat formally commenced arbitration proceedings against Golar claiming damages of
$20.9 million
for breach of contract, including that of early termination of the charter. We believe that we have strong arguments to defend ourself against any such claims, accordingly, as of December 31, 2013, have not recorded any provision. Given the proceedings have only commenced and with the arbitration hearing timed for late 2014, it is possible that the outcome of the arbitration proceedings may result in a loss of anything up to a maximum of
$20.9 million
.
Douglas Channel LNG Assets Partnership claim
In May 2013, we provided a short-term loan of $12.0 million to Douglas Channel LNG Assets Partnership ("DCLAP") as part of the potential FLNG project in Douglas Channel, British Columbia. The General Partner of DCLAP is a company wholly owned by LNG Partner LLC ("LNGP"). The loan had a maturity date of September 30, 2013 and is secured by a general security agreement over the pipeline transportation capacity on the pipeline system that delivers natural gas to the area where the FLNG project is intended to operate. In September 2013, LNGP filed for bankruptcy. We have also since commenced legal proceedings against LNGP seeking to have a receiver appointed over the secured assets. Of the
$12.0 million
short-term loan,
$2.5 million
has been repaid to date. We believe that we have strong arguments regarding our claim and the outstanding loan is recoverable, accordingly, as of December 31, 2013, has not recorded any provision against the outstanding loan receivable.
Other
In December 2005, we signed a shareholders' agreement in connection with the setting up of a jointly owned company to be named Egyptian Company for Gas Services S.A.E ("ECGS"), which was to be established to develop hydrocarbon business and in particular LNG related business in Egypt. As at
December 31, 2013
, we had a commitment to pay
$1.0 million
to a third party, contingent upon the conclusion of a material commercial business transaction by ECGS as consideration for work performed in connection with the setting up and incorporation of ECGS.
F-56
|
36.
|
SUBSEQUENT EVENTS
|
In February 2014, we declared a dividend of
$0.45
per share in respect of the quarter ended December 31, 2013 and paid in March 2014. In addition, Golar Partners made a final cash distribution of
$0.52
per unit in February 2014 in respect of the quarter ended December 31, 2013, of which we received
$14.7 million
of dividend income in relation to our common, subordinated and general partner units and IDRs held at the record date.
In February 2014, we executed a four ship sale and leaseback transaction with ICBL Finance Leasing Co. Ltd ("ICBCL"). The financing structure will fund
90%
of the shipyard purchase price of each newbuilding.
In February 2014, we took delivery of the FSRU, the
Golar Igloo
. On March 28, 2014, we completed our sale of our equity interest in the company that owns and operates the
Golar Igloo
to Golar Partners for the price of
$310.0 million
for the vessel (including charter) less the assumed
$161.3 million
of bank debt, the fair value of the interest rate swap asset of
$3.3 million
plus other purchase price adjustments
and paid us the remaining balance in cash using the proceeds of our equity offering in December 2013.
F-57
GOLAR LNG PARTNERS
INDEX TO FINANCIAL STATEMENTS
|
|
Page
|
|
GOLAR LNG PARTNERS LP
|
|
|
AUDITED CONSOLIDATED AND COMBINED CARVE-OUT FINANCIAL STATEMENTS
|
|
A-1
Report of Independent Registered Public Accounting Firm
To the Board of Directors and Partners of Golar LNG Partners LP:
In our opinion, the accompanying consolidated and combined carve-out balance sheets and the related consolidated and combined carve-out statements of operations, comprehensive income, changes in partners' capital/owners' and dropdown predecessor equity and cash flows present fairly, in all material respects, the financial position of Golar LNG Partners LP and its subsidiaries (the “Partnership”) at December 31, 2013 and December 31, 2012, and the results of their operations and their cash flows for each of the three years in the period ended December 31, 2013
in conformity with accounting principles generally accepted in the United States of America. These financial statements are the responsibility of the Partnership's management. Our responsibility is to express an opinion on these financial statements based on our audits. We conducted our audits of these statements in accordance with the standards of the Public Company Accounting Oversight Board (United States). Those standards require that we plan and perform the audit to obtain reasonable assurance about whether the financial statements are free of material misstatement. An audit includes examining, on a test basis, evidence supporting the amounts and disclosures in the financial statements, assessing the accounting principles used and significant estimates made by management, and evaluating the overall financial statement presentation. We believe that our audits provide a reasonable basis for our opinion.
|
/s/ PricewaterhouseCoopers LLP
|
|
|
PricewaterhouseCoopers LLP
|
|
|
London, United Kingdom
|
|
|
April 30, 2014
|
|
A-2
GOLAR LNG PARTNERS LP
CONSOLIDATED AND COMBINED CARVE-OUT STATEMENTS OF OPERATIONS FOR THE YEARS ENDED DECEMBER 31, 2013, 2012 AND 2011
(in thousands of $, except per unit amounts)
|
|
Notes
|
2013
|
|
2012
|
|
2011
|
|
|||
|
Operating revenues
|
|
|
|
|
|
|
|
|||
|
Time charter revenues
|
|
329,190
|
|
286,630
|
|
225,452
|
|
|||
|
Total operating revenues
|
|
329,190
|
|
286,630
|
|
225,452
|
|
|||
|
Operating expenses
|
|
|
|
|
|
|
|
|||
|
Vessel operating expenses (1)
|
|
52,390
|
|
45,474
|
|
39,212
|
|
|||
|
Voyage and commission expenses
|
|
5,239
|
|
4,471
|
|
785
|
|
|||
|
Administrative expenses (2)
|
|
5,194
|
|
7,269
|
|
8,235
|
|
|||
|
Depreciation and amortization
|
|
66,336
|
|
51,167
|
|
45,316
|
|
|||
|
Total operating expenses
|
|
129,159
|
|
108,381
|
|
93,548
|
|
|||
|
Operating income
|
|
200,031
|
|
178,249
|
|
131,904
|
|
|||
|
Financial income (expense)
|
|
|
|
|
|
|
|
|||
|
Interest income
|
|
1,097
|
|
1,797
|
|
1,640
|
|
|||
|
Interest expense
|
|
(43,195
|
)
|
(38,090
|
)
|
(19,581
|
)
|
|||
|
Other financial items, net
|
7
|
(1,661
|
)
|
(5,389
|
)
|
(18,521
|
)
|
|||
|
Net financial expenses
|
|
(43,759
|
)
|
(41,682
|
)
|
(36,462
|
)
|
|||
|
Income before income taxes
|
|
156,272
|
|
136,567
|
|
95,442
|
|
|||
|
Income taxes
|
8
|
(5,453
|
)
|
(9,426
|
)
|
(45
|
)
|
|||
|
Net income
|
|
150,819
|
|
127,141
|
|
95,397
|
|
|||
|
Net income attributable to non-controlling interest
|
|
(9,523
|
)
|
(10,723
|
)
|
(9,863
|
)
|
|||
|
Net income attributable to Golar LNG Partners LP Owners
|
|
141,296
|
|
116,418
|
|
85,534
|
|
|||
|
Earnings per unit:
|
27
|
|
|
|
|
|
|
|||
|
Common unit (basic and diluted)
|
|
2.31
|
|
2.08
|
|
1.89
|
|
|||
|
Cash distributions declared and paid per unit in the period (see note 27)
|
|
2.05
|
|
1.78
|
|
0.73
|
|
|||
|
(1)
|
This includes related party ship management fee recharges of $6.7 million, $4.2 million and $4.1 million for the years ended December 31, 2013, 2012 and 2011, respectively. See note 24.
|
|
(2)
|
This includes related party management and administrative fee recharges of $2.6 million, $2.9 million and $1.6 million for the years ended December 31, 2013, 2012 and 2011, respectively. See note 24.
|
The accompanying notes are an integral part of these financial statements.
A-3
GOLAR LNG PARTNERS LP
CONSOLIDATED AND COMBINED CARVE-OUT STATEMENTS OF COMPREHENSIVE INCOME FOR THE YEARS ENDED DECEMBER 31, 2013, 2012 AND 2011
(in thousands of $)
|
|
2013
|
|
2012
|
|
2011
|
|
||
|
Net income
|
150,819
|
|
127,141
|
|
95,397
|
|
||
|
Unrealized net gain (loss) on qualifying cash flow hedging instruments:
|
||||||||
|
Other comprehensive income (loss) before reclassification (1)
|
7,370
|
|
(3,950
|
)
|
934
|
|
||
|
Amounts reclassified from accumulated other comprehensive (loss) income to statement of operations (2)
|
(775
|
)
|
—
|
|
—
|
|
||
|
Net other comprehensive income (loss)
|
6,595
|
|
(3,950
|
)
|
934
|
|
||
|
Comprehensive income
|
157,414
|
|
123,191
|
|
96,331
|
|
||
|
Comprehensive income attributable to:
|
|
|
|
|
|
|
||
|
Partners’, Owners’ and Dropdown Predecessor Equity
|
147,891
|
|
112,468
|
|
86,468
|
|
||
|
Non-controlling interest
|
9,523
|
|
10,723
|
|
9,863
|
|
||
|
157,414
|
|
123,191
|
|
96,331
|
|
|||
(1) There is no tax impact on any of the periods presented.
(2) Amounts reclassified from accumulated other comprehensive income (loss) to 'Other financial items, net' on the consolidated and combined carve-out statements of operations relate to gains on cash flow hedges in respect of interest rate swaps.
The accompanying notes are an integral part of these financial statements.
A-4
GOLAR LNG PARTNERS LP
CONSOLIDATED BALANCE SHEETS AS OF DECEMBER 31, 2013 AND 2012
(in thousands of $)
|
|
Notes
|
2013
|
|
2012
|
|
||
|
ASSETS
|
|
|
|
|
|
||
|
Current assets
|
|
|
|
|
|
||
|
Cash and cash equivalents
|
|
103,100
|
|
66,327
|
|
||
|
Restricted cash and short-term investments
|
16
|
24,451
|
|
30,900
|
|
||
|
Trade accounts receivable
|
11
|
717
|
|
—
|
|
||
|
Other receivables, prepaid expenses and accrued income
|
12
|
7,026
|
|
4,336
|
|
||
|
Amounts due from related parties
|
24
|
—
|
|
3,883
|
|
||
|
Inventories
|
|
1,085
|
|
1,924
|
|
||
|
Total current assets
|
|
136,379
|
|
107,370
|
|
||
|
Long-term assets
|
|
|
|
|
|
||
|
Restricted cash
|
16
|
145,725
|
|
190,523
|
|
||
|
Vessels and equipment, net
|
13
|
1,281,591
|
|
707,147
|
|
||
|
Vessels under capital leases, net
|
14
|
127,693
|
|
485,632
|
|
||
|
Deferred charges
|
15
|
14,270
|
|
15,023
|
|
||
|
Other non-current assets
|
17
|
15,561
|
|
5,279
|
|
||
|
Total assets
|
|
1,721,219
|
|
1,510,974
|
|
||
|
LIABILITIES AND EQUITY
|
|
|
|
|
|
||
|
Current liabilities
|
|
|
|
|
|
||
|
Current portion of long-term debt
|
20
|
156,363
|
|
64,822
|
|
||
|
Current portion of obligations under capital leases
|
21
|
—
|
|
5,837
|
|
||
|
Trade accounts payable
|
|
1,587
|
|
3,407
|
|
||
|
Accrued expenses
|
18
|
20,088
|
|
26,530
|
|
||
|
Amounts due to related parties
|
24
|
5,989
|
|
4,429
|
|
||
|
Other current liabilities
|
19
|
57,045
|
|
64,692
|
|
||
|
Total current liabilities
|
|
241,072
|
|
169,717
|
|
||
|
Long-term liabilities
|
|
|
|
|
|
||
|
Long-term debt
|
20
|
733,108
|
|
639,697
|
|
||
|
Long-term debt due to related parties
|
24
|
—
|
|
34,953
|
|
||
|
Obligations under capital leases
|
21
|
159,008
|
|
406,534
|
|
||
|
Other long-term liabilities
|
22
|
17,904
|
|
18,529
|
|
||
|
Total liabilities
|
|
1,151,092
|
|
1,269,430
|
|
||
|
Commitments and contingencies (See Note 25)
|
|
|
|
|
|
||
|
Equity
|
|
|
|
|
|
||
|
Partners’ capital:
|
|
||||||
|
Common unitholders: 45,663,096 units issued and outstanding at December 31, 2013 (2012: 36,246,149)
|
|
475,610
|
|
169,515
|
|
||
|
Subordinated unitholders: 15,949,831 units issued and outstanding at December 31, 2013 and 2012
|
|
6,900
|
|
3,713
|
|
||
|
General partner interest: 1,257,408 units issued and outstanding at December 31, 2013 (2012: 1,065,225)
|
|
19,234
|
|
5,447
|
|
||
|
Total partners’ capital
|
|
501,744
|
|
178,675
|
|
||
|
Accumulated other comprehensive loss
|
|
(2,394
|
)
|
(8,989
|
)
|
||
|
|
|
499,350
|
|
169,686
|
|
||
|
Non-controlling interest
|
|
70,777
|
|
71,858
|
|
||
|
Total equity
|
|
570,127
|
|
241,544
|
|
||
|
Total liabilities and equity
|
|
1,721,219
|
|
1,510,974
|
|
||
The accompanying notes are an integral part of these financial statements.
A-5
GOLAR LNG PARTNERS LP
CONSOLIDATED AND COMBINED CARVE-OUT STATEMENTS OF CASH FLOWS FOR
THE YEARS ENDED DECEMBER 31, 2013, 2012 AND 2011
(in thousands of $)
|
|
Notes
|
2013
|
|
2012
|
|
2011
|
|
|||
|
Operating activities
|
|
|
|
|
|
|
|
|||
|
Net income
|
|
150,819
|
|
127,141
|
|
95,397
|
|
|||
|
Adjustments to reconcile net income to net cash provided by operating activities:
|
|
|
|
|
|
|
|
|||
|
Depreciation and amortization
|
|
66,336
|
|
51,167
|
|
45,316
|
|
|||
|
Amortization of deferred tax benefit on intragroup transfers
|
|
—
|
|
(912
|
)
|
(2,363
|
)
|
|||
|
Amortization of deferred charges
|
|
5,828
|
|
1,123
|
|
931
|
|
|||
|
Unrealized foreign exchange (gains) losses
|
|
(7,435
|
)
|
13,893
|
|
1,040
|
|
|||
|
Drydocking expenditure
|
|
(50,979
|
)
|
(8,288
|
)
|
(10,543
|
)
|
|||
|
Interest element included in obligations under capital leases
|
|
233
|
|
401
|
|
897
|
|
|||
|
Change in assets and liabilities, net of effects from purchase of
Golar Maria:
|
||||||||||
|
Trade accounts receivable
|
|
(717
|
)
|
173
|
|
1,698
|
|
|||
|
Inventories
|
|
971
|
|
(849
|
)
|
1,440
|
|
|||
|
Prepaid expenses, accrued income and other assets
|
|
(9,747
|
)
|
(6,948
|
)
|
295
|
|
|||
|
Amounts due from/to related parties
|
|
1,581
|
|
3,781
|
|
16,240
|
|
|||
|
Trade accounts payable
|
|
(1,820
|
)
|
2,617
|
|
(1,281
|
)
|
|||
|
Accrued expenses
|
|
(6,632
|
)
|
14,015
|
|
1,134
|
|
|||
|
Other current liabilities
|
|
241
|
|
(7,971
|
)
|
6,771
|
|
|||
|
Net cash provided by operating activities
|
|
148,679
|
|
189,343
|
|
156,972
|
|
|||
|
Investing activities
|
|
|
|
|
|
|
|
|||
|
Additions to vessels and equipment
|
|
(18,152
|
)
|
(72,286
|
)
|
(100,259
|
)
|
|||
|
Acquisition of Golar Maria, net of cash acquired (1)
|
10
|
(119,927
|
)
|
—
|
|
—
|
|
|||
|
Restricted cash and short-term investments
|
|
54,027
|
|
(6,512
|
)
|
(2,622
|
)
|
|||
|
Net cash used in investing activities
|
|
(84,052
|
)
|
(78,798
|
)
|
(102,881
|
)
|
|||
|
Financing activities
|
|
|
|
|
|
|
|
|||
|
Proceeds from issuance of equity, net of issue costs
|
26
|
280,586
|
|
401,851
|
|
—
|
|
|||
|
Proceeds from short-term debt due to related parties
|
20,000
|
|
—
|
|
—
|
|
||||
|
Proceeds from long-term debt
|
20
|
230,000
|
|
537,194
|
|
222,310
|
|
|||
|
Repayment of short-term debt due to related parties
|
(20,000
|
)
|
—
|
|
—
|
|
||||
|
Repayments of long-term debt
|
|
(149,822
|
)
|
(427,217
|
)
|
(58,832
|
)
|
|||
|
Repayments of obligations under capital lease
|
|
(2,365
|
)
|
(6,287
|
)
|
(6,151
|
)
|
|||
|
Payments in connection with the lease terminations
|
21
|
(250,980
|
)
|
—
|
|
—
|
|
|||
|
Financing arrangement fees and other costs
|
|
(4,794
|
)
|
(8,400
|
)
|
(854
|
)
|
|||
|
Dividends paid to noncontrolling interests
|
|
(10,604
|
)
|
(1,799
|
)
|
(2,399
|
)
|
|||
|
Cash distributions paid
|
|
(119,875
|
)
|
(77,588
|
)
|
(29,276
|
)
|
|||
|
Distribution to Golar LNG Limited ("Golar") for acquisition of the Golar Freeze
|
24(k)
|
—
|
|
—
|
|
(231,579
|
)
|
|||
|
Dropdown Predecessor dividends
|
|
—
|
|
—
|
|
(24,336
|
)
|
|||
|
Distribution to Golar for acquisition of the NR Satu
|
24(k)
|
—
|
|
(387,993
|
)
|
—
|
|
|||
|
Distribution to Golar for acquisition of the Golar Grand
|
24(k)
|
—
|
|
(176,769
|
)
|
—
|
|
|||
|
Contributions from owner’s funding
|
|
—
|
|
53,572
|
|
72,686
|
|
|||
|
Net cash used in financing activities
|
|
(27,854
|
)
|
(93,436
|
)
|
(58,431
|
)
|
|||
|
Net increase (decrease) in cash and cash equivalents
|
|
36,773
|
|
17.109
|
|
(4,340
|
)
|
|||
|
Cash and cash equivalents at beginning of period
|
|
66,327
|
|
49,218
|
|
53,558
|
|
|||
|
Cash and cash equivalents at end of period
|
|
103,100
|
|
66,327
|
|
49,218
|
|
|||
|
Supplemental disclosure of cash flow information:
|
|
|
|
|
|
|
|
|||
|
Cash paid during the year for:
|
|
|
|
|
|
|
|
|||
|
Interest paid, net of capitalized interest
|
|
44,651
|
|
40.858
|
|
20,415
|
|
|||
|
Income taxes paid
|
|
5,575
|
|
1,444
|
|
1,685
|
|
|||
(1) In addition to the cash consideration paid for the acquisition of the
Golar Maria
, there were non-cash considerations including assumption of bank debt of $89.5 million (see note 10).
The accompanying notes are an integral part of these financial statements.
A-6
GOLAR LNG PARTNERS LP
CONSOLIDATED AND COMBINED CARVE-OUT STATEMENTS OF CHANGES IN PARTNERS' CAPITAL /OWNERS' AND DROPDOWN PREDECESSOR EQUITY FOR THE YEARS ENDED DECEMBER 31, 2013, 2012 AND 2011
(in thousands of $)
|
|
Dropdown
Predecessor Equity |
Owner's
Invested Equity |
Partners’ Capital
|
Accumulated
Other
Comprehensive
Income
(loss)
|
Total
before
Non-
controlling
interest
|
Non-
controlling
Interest
|
Total
Owner's
Equity
|
|||||||||||||||||||
|
|
Common
Units
|
Subordinated
Units
|
General
Partner
|
|||||||||||||||||||||||
|
Combined balance at December 31, 2010
|
164,882
|
|
156,588
|
|
—
|
|
—
|
|
—
|
|
—
|
|
321,470
|
|
55,470
|
|
376,940
|
|
||||||||
|
Combined carve-out net income (Jan 1, 2011 — April 12, 2011)
|
—
|
|
20,741
|
|
—
|
|
—
|
|
—
|
|
—
|
|
20,741
|
|
2,709
|
|
23,450
|
|
||||||||
|
Combined carve-out other comprehensive income
|
—
|
|
984
|
|
—
|
|
—
|
|
—
|
|
—
|
|
984
|
|
—
|
|
984
|
|
||||||||
|
Movement in invested equity (Jan 1, 2011 — April 12, 2011)
|
—
|
|
(13,999
|
)
|
—
|
|
—
|
|
—
|
|
—
|
|
(13,999
|
)
|
—
|
|
(13,999
|
)
|
||||||||
|
Non-controlling interest dividend
|
—
|
|
—
|
|
—
|
|
—
|
|
—
|
|
—
|
|
—
|
|
(1,000
|
)
|
(1,000
|
)
|
||||||||
|
Combined balance at April 12, 2011
|
164,882
|
|
164,314
|
|
—
|
|
—
|
|
—
|
|
—
|
|
329,196
|
|
57,179
|
|
386,375
|
|
||||||||
|
Dropdown predecessor dividends
|
(24,336
|
)
|
—
|
|
—
|
|
—
|
|
—
|
|
—
|
|
(24,336
|
)
|
—
|
|
(24,336
|
)
|
||||||||
|
Net income (1)
|
21,937
|
|
—
|
|
29,029
|
|
12,079
|
|
1,748
|
|
—
|
|
64,793
|
|
7,154
|
|
71,947
|
|
||||||||
|
Other comprehensive (loss) income
|
(378
|
)
|
—
|
|
—
|
|
—
|
|
—
|
|
328
|
|
(50
|
)
|
—
|
|
(50
|
)
|
||||||||
|
Elimination of equity
|
24,810
|
|
14,856
|
|
—
|
|
—
|
|
—
|
|
—
|
|
39,666
|
|
—
|
|
39,666
|
|
||||||||
|
Allocation of Partnership capital to unit holders — April 12, 2011
|
—
|
|
(179,170
|
)
|
180,475
|
|
—
|
|
3,683
|
|
(4,988
|
)
|
—
|
|
—
|
|
—
|
|
||||||||
|
Net change in Parent’s equity in Dropdown Predecessor
|
86,685
|
|
—
|
|
—
|
|
—
|
|
—
|
|
—
|
|
86,685
|
|
—
|
|
86,685
|
|
||||||||
|
Cash distributions
|
—
|
|
—
|
|
(16,980
|
)
|
(11,710
|
)
|
(586
|
)
|
—
|
|
(29,276
|
)
|
—
|
|
(29,276
|
)
|
||||||||
|
Non-controlling interest dividend
|
—
|
|
—
|
|
—
|
|
—
|
|
—
|
|
—
|
|
—
|
|
(1,399
|
)
|
(1,399
|
)
|
||||||||
|
Purchase of Golar Freeze from Golar (note 24(k))
|
(231,330
|
)
|
—
|
|
(249
|
)
|
—
|
|
—
|
|
—
|
|
(231,579
|
)
|
—
|
|
(231,579
|
)
|
||||||||
|
Allocation of Dropdown Predecessor equity (note 24(k))
|
165,799
|
|
—
|
|
(162,112
|
)
|
—
|
|
(3,308
|
)
|
(379
|
)
|
—
|
|
—
|
|
—
|
|
||||||||
|
Combined balance at December 31, 2011
|
208,069
|
|
—
|
|
30,163
|
|
369
|
|
1,537
|
|
(5,039
|
)
|
235,099
|
|
62,934
|
|
298,033
|
|
||||||||
|
Net income (2)
|
28,015
|
|
—
|
|
53,998
|
|
31,655
|
|
2,750
|
|
—
|
|
116,418
|
|
10,723
|
|
127,141
|
|
||||||||
|
Movement in invested equity
|
53,572
|
|
—
|
|
—
|
|
—
|
|
—
|
|
—
|
|
53,572
|
|
—
|
|
53,572
|
|
||||||||
|
Non-controlling interest dividends
|
—
|
|
—
|
|
—
|
|
—
|
|
—
|
|
—
|
|
—
|
|
(1,799
|
)
|
(1,799
|
)
|
||||||||
|
Other comprehensive loss
|
—
|
|
—
|
|
—
|
|
—
|
|
—
|
|
(3,950
|
)
|
(3,950
|
)
|
—
|
|
(3,950
|
)
|
||||||||
|
Cash distributions
|
—
|
|
—
|
|
(47,725
|
)
|
(28,311
|
)
|
(1,552
|
)
|
—
|
|
(77,588
|
)
|
—
|
|
(77,588
|
)
|
||||||||
|
Net proceeds from issuance of common units
|
—
|
|
—
|
|
393,814
|
|
—
|
|
8,037
|
|
—
|
|
401,851
|
|
—
|
|
401,851
|
|
||||||||
|
Elimination of equity not transferred to the Partnership
|
9,046
|
|
—
|
|
—
|
|
—
|
|
—
|
|
—
|
|
9,046
|
|
—
|
|
9,046
|
|
||||||||
|
Purchase of NR Satu from Golar (note 24(k))
|
(387,993
|
)
|
—
|
|
—
|
|
—
|
|
—
|
|
—
|
|
(387,993
|
)
|
—
|
|
(387,993
|
)
|
||||||||
|
Allocation of Dropdown Predecessor equity - NR Satu (note 24(k))
|
132,321
|
|
—
|
|
(129,671
|
)
|
—
|
|
(2,650
|
)
|
—
|
|
—
|
|
—
|
|
—
|
|
||||||||
|
Purchase of Golar Grand from Golar (note 24(k))
|
(176,769
|
)
|
—
|
|
—
|
|
—
|
|
—
|
|
—
|
|
(176,769
|
)
|
—
|
|
(176,769
|
)
|
||||||||
|
Allocation of Dropdown Predecessor equity - Golar Grand (note 24(k))
|
133,739
|
|
—
|
|
(131,064
|
)
|
—
|
|
(2,675
|
)
|
—
|
|
—
|
|
—
|
|
—
|
|
||||||||
|
Consolidated balance at December 31, 2012
|
—
|
|
—
|
|
169,515
|
|
3,713
|
|
5,447
|
|
(8,989
|
)
|
169,686
|
|
71,858
|
|
241,544
|
|
||||||||
|
Net income
|
—
|
|
—
|
|
91,576
|
|
35,924
|
|
13,796
|
|
—
|
|
141,296
|
|
9,523
|
|
150,819
|
|
||||||||
|
Cash distributions (3)
|
—
|
|
—
|
|
(81,096
|
)
|
(32,737
|
)
|
(6,042
|
)
|
—
|
|
(119,875
|
)
|
—
|
|
(119,875
|
)
|
||||||||
|
Non-controlling interest dividends
|
—
|
|
—
|
|
—
|
|
—
|
|
—
|
|
—
|
|
—
|
|
(10,604
|
)
|
(10,604
|
)
|
||||||||
|
Other comprehensive income
|
—
|
|
—
|
|
—
|
|
—
|
|
—
|
|
6,595
|
|
6,595
|
|
—
|
|
6,595
|
|
||||||||
|
Net proceeds from issuance of common units
|
—
|
|
—
|
|
274,974
|
|
—
|
|
5,612
|
|
—
|
|
280,586
|
|
—
|
|
280,586
|
|
||||||||
|
Contribution to equity (4)
|
—
|
|
—
|
|
20,641
|
|
—
|
|
421
|
|
—
|
|
21,062
|
|
—
|
|
21,062
|
|
||||||||
|
Consolidated balance at December 31, 2013
|
—
|
|
—
|
|
475,610
|
|
6,900
|
|
19,234
|
|
(2,394
|
)
|
499,350
|
|
70,777
|
|
570,127
|
|
||||||||
A-7
|
(1)
|
The post acquisition net income (from October 19, 2011 to December 31, 2011) relating to the
Golar Freeze
in 2011 included within net income was $4.8 million.
|
|
(2)
|
The post acquisition net income in 2012 relating to the
NR Satu
(from July 19, 2012 to December 31, 2012) and the
Golar Grand
(from November 8, 2012 to December 31, 2012) included within net income amounted to $11.5 million and $4.8 million, respectively.
|
|
(3)
|
This includes cash distributions to IDR holders for the year ended December 31, 2013 and 2012 of $3.7 million and $nil, respectively.
|
|
(4)
|
In June 2013, the
Golar Winter
and the
Golar Grand
were refinanced. We made a cash payment of $251.0 million to the lessors to terminate the respective lease financing arrangements (including the associated Golar Winter currency swap of $25.3 million) and to acquire the legal title of both these vessels. The transaction to acquire the legal title of the vessels was between controlled entities, thus, the vessels continue to be recorded at their historical book values and the difference between the cash payment made and the carrying value of the vessels is an equity contribution. The contribution recognised was $21.1 million.
|
The accompanying notes are an integral part of these financial statements.
A-8
GOLAR LNG PARTNERS LP
NOTES TO THE AUDITED CONSOLIDATED AND COMBINED CARVE-OUT FINANCIAL STATEMENTS
1. GENERAL
Golar LNG Partners LP (the "Partnership," "we," "our," or "us") was formed as an indirect wholly-owned subsidiary of Golar LNG Limited ("Golar") in September 2007 under the laws of the Marshall Islands for the purpose of acquiring the interests in wholly-owned and partially owned subsidiaries of Golar.
In November 2008, Golar transferred to us interests in certain of its wholly-owned and partially owned subsidiaries that owned a 60% interest in a liquefied natural gas ("LNG") carrier, the
Golar Mazo
, and which leased the LNG carrier, the
Methane Princess
, and the floating storage and regasification unit ("FSRU"), the
Golar Spirit
. During April 2011, Golar contributed to us the shares of a subsidiary which leased the FSRU, the
Golar Winter
.
During April 2011, we completed our initial public offering ("IPO"). In connection with the IPO, (i) we issued to Golar 23,127,254 common units and 15,949,831 subordinated units, representing a 98% limited partner interest in us; (ii) we issued to Golar GP LLC, a wholly-owned subsidiary of Golar and our general partner (the "General Partner"), a 2% general partner interest in us and 81% of our incentive distribution rights ("IDRs"); (iii) we issued to Golar LNG Energy Limited, a subsidiary of Golar ("Golar Energy"), 19% of the IDRs; (iv) Golar sold 13,800,000 common units to the public in the IPO and received gross proceeds of $310.5 million, all as further described in Note 3.
The transfers and contributions of the subsidiaries holding interests in the
Golar Mazo
, the
Methane Princess
and the
Golar Spirit
in November 2008, and the
Golar Winter
in April 2011 from Golar to us were deemed to be a reorganization of entities under common control. As a result, we recorded these transactions at Golar’s historical book values. Accordingly, prior to April 13, 2011 (the closing date of the IPO), Golar LNG Partners LP and its subsidiaries that have interests in four vessels, the
Golar Mazo
, the
Methane Princess
, the
Golar Spirit
and the
Golar Winter
("Initial Fleet"), are collectively referred to as the "Combined Entity".
In October 2011 and July 2012, we acquired from Golar interests in subsidiaries that own and operate the FSRUs, the
Golar Freeze
and the
Nusantara Regas Satu
("
NR Satu
"), respectively. In addition, in November 2012, we acquired from Golar interests in subsidiaries that lease and operate the LNG carrier, the
Golar Grand
. These transactions are also deemed to be a reorganization of entities under common control. As a result, our financial statements prior to the date the vessels were acquired were retroactively adjusted to include these vessels (herein collectively referred to as the "Dropdown Predecessor") during the periods they and we were under common control of Golar. The excess of the consideration paid by us over Golar’s historical costs is accounted for as an equity distribution to Golar (refer to note 24(k)).
Under the Partnership Agreement, the general partner has irrevocably delegated to our board of directors the power to oversee and direct the operations of, manage and determine the strategies and policies of Golar Partners. During the period from the IPO in April 2011 until the time of our first annual general meeting ("AGM") on December 13, 2012, Golar retained the sole power to appoint, remove and replace all members of our board of directors. From the first AGM, four of our seven board members became electable by the common unitholders and accordingly, from this date, Golar no longer retains the power to control the board of directors and, hence, the Partnership. As a result, we are no longer considered to be under common control of Golar, and from December 13, 2012, we no longer account for vessel acquisitions from Golar as transfers of equity interests between entities under common control.
In February 2013, we acquired from Golar 100% interests in the subsidiary that owns and operates the LNG carrier, the
Golar Maria
, which we accounted for as an acquisition of a business. Accordingly, the results of the
Golar Maria
are consolidated into our results from the date of its acquisition. There has been no retroactive restatement of our financial statements to reflect the historical results of the
Golar Maria
prior to its acquisition.
As of December 31, 2013, we operated a fleet of four FSRUs and four LNG carriers. Our vessels operate under long-term charter contracts with expiration dates between 2017 and 2024, except for the
Golar Grand,
which operates on a medium-term charter with an initial term that expires in 2015. However, we have an option to require Golar to enter into a new time charter with us, with Golar as charterer until October 2017 if the current charterer does not renew or extend the existing charter (see note 24).
A-9
As of December 31, 2013, our current liabilities exceeded current assets by $104.7 million. Included within current liabilities as of December 31, 2013, are mark-to-market valuations of swap derivatives of $31.9 million maturing between 2014 and 2020. We have no intention of terminating these swaps before their maturity and hence realizing these liabilities. In addition, we have a debt facility in respect of the
Golar Maria
of $84.5 million that matures in December 2014 and is, therefore, presented as current debt. We are currently in discussions with several lending banks to refinance this facility ahead of its maturity.
2. SIGNIFICANT ACCOUNTING POLICIES
Basis of accounting
These consolidated and combined financial statements are prepared in accordance with accounting principles generally accepted in the United States of America. Investments in entities in which we directly or indirectly hold more than 50% of the voting control are consolidated in the financial statements, as well as certain variable interest entities in which we are deemed to be subject to a majority of the risk of loss from the variable interest entity’s activities or entitled to receive a majority of the entity’s residual returns, or both. All intercompany balances and transactions are eliminated. The non-controlling interests of the above mentioned subsidiaries are included in the Balance Sheets and Statements of Operations as "Non-controlling interests".
A variable interest entity is defined by the accounting standard as a legal entity where either (a) equity interest holders, as a group, lack the characteristics of a controlling financial interest, including decision making ability and an interest in the entity’s residual risks and rewards, or (b) the equity holders have not provided sufficient equity investment to permit the entity to finance its activities without additional subordinated financial support, or (c) the voting rights of some investors are not proportional to their obligations to absorb the expected losses of the entity, their rights to receive the expected residual returns of the entity, or both and substantially all of the entity’s activities either involve or are conducted on behalf of an investor that has disproportionately few voting rights. A party that is a variable interest holder is required to consolidate a VIE if the holder has both (a) the power to direct the activities that most significantly impact the entity's economic performance and (b) the obligation to absorb losses that could potentially be significant to the VIE or the right to receive benefits from the VIE that could potentially be significant to the VIE.
The accompanying consolidated and combined financial statements include the financial statements of the entities listed in Note 4.
As discussed in note 1, from December 13, 2012, we are no longer considered to be under common control with Golar. Any references to consolidated and combined financial statements and allocations to historical combined carve-out financial statements pertain to periods prior to November 2012, the date of our last common control dropdown (
Golar Grand
).
The consolidated and combined financial statements reflect the results of operations, cash flows and net assets of the Combined Entity including the Dropdown Predecessor, which have been carved out of the consolidated financial statements of Golar. The historical combined financial statements include revenues, expenses and cash flows directly attributable to our interests in the four vessels in the Initial Fleet and the Dropdown Predecessor. Accordingly, the historical combined carve-out financial statements for the years ended December 31, 2012 and 2011 reflect allocations of certain expenses, including that of administrative expenses including share options and pension costs, mark-to-market of interest rate and foreign currency swap derivatives and amortization of deferred tax benefits on intragroup transfers. These allocated costs have been accounted for as an equity contribution in the combined balance sheets. Allocated costs (income) included in the accompanying consolidated and combined statements of income are as follows:
|
(in thousands of $)
|
2012
|
2011
|
||||
|
Administrative expenses
|
1,365
|
|
4,947
|
|
||
|
Pension costs
|
220
|
|
805
|
|
||
|
Net financial income
|
(149
|
)
|
(2,983
|
)
|
||
|
|
1,436
|
|
2,769
|
|
||
For the years ended December 31, 2012 and 2011 the above table includes allocated costs (income) for the combined entity for the period prior to April 13, 2011, representing the period prior to our IPO and for the Dropdown Predecessor, for the periods prior to their acquisition from Golar.
Included within the Owner’s invested and Dropdown Predecessor equity balances were net liabilities that were not transferred to us and therefore were eliminated from our equity position from either the closing date of the IPO in respect of the
Golar Spirit
, or the acquisition date of the
Golar Freeze
and the
NR Satu
. Details of the net liabilities eliminated are as follows:
A-10
|
(in thousands of $)
|
Dropdown
Predecessor
relating to
NR Satu
(1)
|
Dropdown
Predecessor relating to
Golar
Freeze
(2)
|
Combined
Entity
(“Initial
Fleet”) relating to the
Golar Spirit
(3)
|
Total
|
||||||||
|
Balance Sheet captions:
|
|
|
|
|
|
|
||||||
|
Other non-current assets
|
—
|
|
—
|
|
12,007
|
|
12,007
|
|
||||
|
Other current liabilities
|
(1,511
|
)
|
—
|
|
—
|
|
(1,511
|
)
|
||||
|
Other long-term liabilities
|
(7,535
|
)
|
(24,810
|
)
|
(26,863
|
)
|
(59,208
|
)
|
||||
|
Total
|
(9,046
|
)
|
(24,810
|
)
|
(14,856
|
)
|
(48,712
|
)
|
||||
__________________________________________
|
(1)
|
As of July 19, 2012
|
|
(2)
|
As of October 19, 2011
|
|
(3)
|
As of April 13, 2011
|
These consolidated and combined financial statements include the financial position, results of operations and cashflows of the Combined Entity and the Dropdown Predecessor. In the preparation of these consolidated and combined financial statements, the loan and related balances and interest expenses relating to the
NR Satu
and the
Golar Freeze
, the lease related expenses (including termination thereof) relating to the
NR Satu
, the
Golar Freeze
and the
Golar Spirit
, general and administrative expenses (including pension and stock-based compensation), income tax expense, and certain derivatives’ related expenses which were not directly attributable to the respective vessels have been allocated to us on the following basis:
The debt relating to the
NR Satu
was held in a subsidiary of Golar in connection with the loan facility for five of Golar’s vessels, including the
NR Satu
. The loan facility was repaid in April 2011. Accordingly, for periods prior to April 2011, the
NR Satu
’s share of the loan facility, interest expense, deferred finance fees and related balances have been carved out based on the remaining loan balance following the settlement of the
Golar Spirit
and the
Golar Freeze
related balances in November 2008 and June 2010, respectively, and based on the 2003 internal valuations performed at inception of the debt.
In contrast, the
Golar Freeze
,
Golar Spirit
and the
NR Satu
associated lease balances, termination thereof and amortization of deferred tax benefits on intragroup transfers have been reflected in these financial statements at Golar’s book value, as they were readily separable and identifiable within the books of Golar.
Vessel operating expenses includes ship management fees for the provision of technical and commercial management of vessels, which have been allocated to us based on intercompany charges invoiced by Golar.
Vessel operating expenses include an allocation of Golar’s defined benefit pension plan costs. Golar operates two defined benefit pension plans for itself and its subsidiaries: one for the crews and one for administrative personnel. The pension cost is calculated in the subsidiaries on a contribution basis and relates principally to crew whose employment cannot be tied to a specific vessel, as they were a shared resource across all vessels. Accordingly, the pension costs have been allocated based on the number of vessels in Golar’s fleet.
Administrative expenses (including stock-based compensation, which are described further below) of Golar that cannot be attributed to a specific vessel and for which we were deemed to have received benefit have been allocated based on the number of vessels in Golar’s fleet.
Administrative expenses include an allocation of Golar’s stock-based compensation costs. In respect of options awarded to certain employees and directors of Golar, whose employment or service cannot be specifically attributed to any specific vessel. Therefore, it is considered that we, as a part of Golar, received benefit from their services, and so should recognize a share of the respective cost. Accordingly, stock-based compensation costs have been allocated based on the number of vessels in Golar’s fleet.
Other financial items include an allocation of Golar’s mark-to-market adjustments for interest rate swap and foreign currency swap derivatives. In respect of mark-to-market adjustments for interest rate swap derivatives these have been allocated on the basis of our proportion of Golar’s debt including capital leases. For foreign currency derivatives and related adjustments to earnings, these have been allocated on the basis of being separately identifiable and specifically for our benefit.
Income tax expense has been determined for us on a separate returns basis.
A-11
Management has deemed the related allocation reasonable to present the financial position, results of operations, and cash flows of the Combined Entity and Dropdown Predecessor on a stand-alone basis. However, the financial position, results of operations and cash flows of the Combined Entity and Dropdown Predecessor, which are presented as part of the results for the years ended December 31, 2012 and 2011, may differ from those that would have been achieved had we operated autonomously for those years as we would have had additional administrative expenses, including legal, accounting, treasury and regulatory compliance and other costs normally incurred by a listed public entity for the periods prior to the IPO. Accordingly, the financial statements do not purport to be indicative of our future financial position, results of operations or cash flows.
Business combinations
Reorganization of entities under common control are accounted for similar to the pooling of interests method of accounting. Under this method, the carrying amount of net assets recognized in the balance sheets of each combining entity are carried forward to the balance sheet of the combined entity, and no other assets or liabilities are recognized as a result of the combination. The excess of the proceeds paid, if any, over the historical cost of the combining entity is accounted for as an equity distribution. In addition, re-organization of entities under common control are accounted for as if the transfer occurred from the date that both the combining entity and combined entity were both under the common control of Golar. Therefore, our financial statements prior to the date the interests in the combining entity were actually acquired are retroactively adjusted to include the results of the Combined Entity during the periods it was under common control of Golar.
As discussed in note 1, following the first AGM of common unitholders on December 13, 2012, Golar ceased to control the board of directors as the majority of board members became electable by the common unitholders. As a result, we are no longer considered to be under common control with Golar. As a consequence, effective from December 13, 2012, we no longer account for vessel acquisitions from Golar as a transfer of equity interest between entities under common control.
Business combinations are accounted for under the acquisition method. On acquisition, the identifiable assets, liabilities and contingent liabilities are measured at their fair values at the date of acquisition. Any excess of the cost of acquisition over the fair values of the identifiable net assets acquired is recognized as goodwill. Any deficiency of the cost of acquisition below the fair values of the identifiable net assets acquired (i.e. bargain purchase) is credited to the statement of operations in the period of acquisition. The consideration transferred for an acquisition is measured at fair value of the consideration given. Acquisition related costs are expensed as incurred. The results of subsidiary undertakings are included from the date of acquisition.
Revenue and expense recognition
Revenues include minimum lease payments under time charters, fees for repositioning vessels as well as the reimbursement of certain vessel operating and drydocking costs. Revenues generated from time charters, which we classified as operating leases, are recorded over the term of the charter as service is provided. We do not recognize revenues during days that the vessel is off-hire. Incentives for charterers to enter into lease agreements are spread evenly over the lease term.
Reimbursement for drydocking costs is recognized evenly over the period to the next drydocking, which is generally between two to five years. Repositioning fees (which are included in time charter revenue) received in respect of time charters are recognized at the end of the charter when the fee becomes fixed and determinable. However, where there is a fixed amount specified in the charter, which is not dependent upon redelivery location, the fee will be recognized evenly over the term of the charter. Where a vessel undertakes multiple single voyage time charters, revenue is recognized, including the repositioning fee if fixed and determinable, on a discharge-to-discharge basis. Under this basis, revenue is recognized evenly over the period from departure of the vessel from its last discharge port to departure from the next discharge port. For arrangements where operating costs are borne by the charterer on a pass through basis, the pass through of operating costs is reflected in revenue and expenses.
Under our time charters, the majority of voyage expenses are paid by our customers. Voyage related expenses, principally fuel, may also be incurred when positioning or repositioning the vessel before or after the period of time charter and during periods when the vessel is not under charter or is off-hire, for example when the vessel is undergoing repairs. These expenses are recognized as incurred.
Vessel operating expenses, which are recognized when incurred, include crewing, repairs and maintenance, insurance, stores, lube oils, communication expenses and third party management fees.
Operating leases
Initial direct costs (those directly related to the negotiation and consummation of the lease) are deferred and allocated to earnings over the lease term. Rental income and expense are amortized over the lease term on a straight-line basis.
A-12
Income taxes
Income taxes are based on a separate return basis. The guidance on income taxes prescribes a recognition threshold and measurement attributes for the financial statement recognition and measurement of a tax position taken or expected to be taken in a tax return.
Deferred tax assets and liabilities are recognized principally for the expected tax consequences of temporary differences between the tax bases of assets and liabilities and their reported amounts. Deferred tax assets are reduced by a valuation allowance when, in the opinion of management, it is more likely than not that some portion or all of the deferred tax assets will not be realized. Realization of the deferred income tax asset is dependent on generating sufficient taxable income in future years.
Comprehensive Income
As of December 31, 2013, 2012 and 2011, our accumulated other comprehensive loss consisted of the following components:
|
(in thousands of $)
|
2013
|
2012
|
2011
|
||||||
|
Unrealized net loss on qualifying cash flow hedging instruments
|
(2,394
|
)
|
(8,989
|
)
|
(5,039
|
)
|
|||
Cash and cash equivalents
We consider all demand and time deposits and highly liquid investments with original maturities of three months or less to be equivalent to cash.
Restricted cash and short-term investments
Restricted cash and short-term investments consist of bank deposits, which may only be used to settle certain pre-arranged loan or lease payments. We consider all short-term investments as held to maturity. These investments are carried at amortized cost. We place our short-term investments primarily in fixed term deposits with high credit quality financial institutions.
Trade receivables
Trade receivables are presented net of allowances for doubtful balances. At each balance sheet date, all potentially uncollectible accounts are assessed individually for purposes of determining the appropriate provision for doubtful accounts.
Inventories
Inventories, which are comprised principally of fuel, lubricating oils and ship spares, are stated at the lower of cost or market value. Cost is determined on a first-in, first-out basis.
Vessels and equipment
Vessels are stated at cost less accumulated depreciation. The cost of vessels less the estimated residual value is depreciated on a straight-line basis over the assets’ remaining useful economic lives.
Cost of building the mooring equipment was incurred as part of the
NR Satu
time charter agreement. The cost of the mooring equipment is capitalized and depreciated over the initial lease term of the
NR Satu
charter.
Refurbishment costs incurred during the period are capitalized as part of vessels and depreciated over the vessels’ remaining useful economic lives. Refurbishment costs are costs that appreciably increase the capacity, or improve the efficiency or safety of vessels and equipment. Drydocking expenditures are capitalized when incurred and amortized over the period until the next anticipated drydocking, which is generally between two and five years. For vessels that are newly built or acquired, we have adopted the “built-in overhaul” method of accounting. The built-in overhaul method is based on the segregation of vessel costs into those that should be depreciated over the useful life of the vessel and those that require drydocking at periodic intervals to reflect the different useful lives of the components of the assets. The estimated cost of the drydocking component is amortized until the date of the first drydocking following acquisition, upon which the cost is capitalized and the process is repeated.
A-13
Useful lives applied in depreciation are as follows:
|
Vessels
|
40 to 55 years
|
|
Deferred drydocking expenditure
|
two to five years
|
|
Mooring equipment
|
11 years
|
Interest costs capitalized in connection with the conversion of the
NR Satu
into an FSRU for the years ended December 31, 2013, 2012 and 2011 were $nil, $1.8 million and $1.9 million, respectively.
Vessels under capital lease
We lease certain vessels under agreements that have been accounted for as capital leases. Obligations under capital leases are carried at the present value of future minimum lease payments, and the asset balance is amortized on a straight-line basis over the remaining economic useful lives of the vessels. Interest expense is calculated at a constant rate over the term of the lease.
Depreciation of vessels under capital lease is included within depreciation and amortization expense in the statement of operations. Vessels under capital lease are depreciated on a straight-line basis over the vessels’ remaining useful economic lives, based on a useful life of 40 to 50 years. Refurbishment costs and drydocking expenditures incurred in respect of vessels under capital lease are accounted for consistently as that of vessels.
Certain of our capital leases are ‘funded’ via long term cash deposits which closely match the lease liability. Future changes in the lease liability arising from interest rate changes are only partially offset by changes in interest income on the cash deposits, and where differences arise, this is funded by, or released to, available working capital.
Interest costs capitalized
Interest costs are expensed as incurred except for interest costs that are capitalized. Interest is capitalized on all qualifying assets that require a period of time to get them ready for their intended use. Qualifying assets consist of vessels under construction and includes vessels undergoing retrofitting into FSRUs for our own use. The interest capitalized is calculated using the rate of interest on the loan to fund the expenditure or our weighted average cost of borrowings where appropriate, over the term period from commencement of the conversion work until substantially all the activities necessary to prepare the assets for its intended use are complete.
Deferred credit from capital leases
Income derived from the sale of subsequently leased assets is deferred and amortized in proportion to the amortization of the leased assets (see note 22). Amortization of deferred income is offset against depreciation and amortization expense in the statement of operations.
Impairment of long-lived assets
We continually monitor events and changes in circumstances that could indicate carrying amounts of long-lived assets may not be recoverable. When such events or changes in circumstances are present, we assess the recoverability of long-term assets by determining whether the carrying value of such assets will be recovered through undiscounted expected future cash flows. If the total of the future cash flows is less than the carrying amount of those assets, we recognize an impairment loss based on the excess of the carrying amount over the fair value of the assets.
Deferred charges
Costs associated with long-term financing, including debt arrangement fees, are deferred and amortized over the term of the relevant loan. Amortization of deferred loan costs is included in "Other financial items, net" in the statement of operations. If a loan is repaid early, any unamortized portion of the related deferred charges is charged against income in the period in which the loan is repaid.
Provisions
A-14
We, in the ordinary course of business, are subject to various claims, suits and complaints. Management, in consultation with internal and external advisers, will provide for a contingent loss in the financial statements if the contingency had occurred at the date of the financial statements and the likelihood of loss was probable and the amount can be reasonably estimated. If we have determined that the reasonable estimate of the loss is a range and there is no best estimate within the range, we will provide the lower amount within the range. See Note 25, "Other Commitments and Contingencies" for further discussion.
Derivatives
We use derivatives to reduce market risks associated with our operations. We use interest rate swaps for the management of interest rate risk exposure. The interest rate swaps effectively convert a portion of our debt from a floating to a fixed rate over the life of the transactions without an exchange of underlying principal.
We seek to reduce our exposure to fluctuations in foreign exchange rates through the use of foreign currency forward contracts.
All derivative instruments are initially recorded at cost as either assets or liabilities in the accompanying balance sheets and subsequently remeasured to fair value, regardless of the purpose or intent for holding the derivative.
Where the fair value of a derivative instrument is a net liability, the derivative instrument is classified in "Other current liabilities" in the balance sheet. Where the fair value of a derivative instrument is a net asset, the derivative instrument is classified in "Other non-current assets" in the balance sheet, except if the current portion is a liability, in which case the current portion is included in "Other current liabilities." The method of recognizing the resulting gain or loss is dependent on whether the derivative contract is designed to hedge a specific risk and also qualifies for hedge accounting. We have adopted hedge accounting for certain of our interest rate swap arrangements designated as cash flow hedges. For derivative instruments that are not designated or do not qualify as hedges, the changes in fair value of the derivative financial instrument are recognized in earnings and recorded each period in current earnings in "Other financial items, net".
When a derivative is designated as a cash flow hedge, we formally document the relationship between the derivative and the hedged item. This documentation includes the strategy risk and risk management for undertaking the hedge and the method that will be used to assess effectiveness of the hedge. If the derivative is an effective hedge, changes in the fair value are initially recorded as a component of accumulated other comprehensive income in equity. The ineffective portion of the hedge is recognized immediately in earnings, as are any gains or losses on the derivative that are excluded from the assessment of hedge effectiveness. We do not apply hedge accounting if it is determined that the hedge was not effective or will no longer be effective, the derivative was sold or exercised, or the hedged item was sold or repaid.
In the periods when the hedged items affect earnings, the associated fair value changes on the hedged derivatives are transferred from equity to the corresponding earnings line item on the settlement of a derivative. The ineffective portion of the change in fair value of the derivative financial instrument is immediately recognized in earnings. If a cash flow hedge is terminated and the originally hedged item is still considered probable of occurring, the gains and losses initially recognized in equity remain there until the hedged item impacts earnings at which point they are transferred to the corresponding earnings line item (i.e. interest expense). If the hedged items are no longer probable of occurring, amounts recognized in equity are immediately reclassified to earnings.
Cash flows from derivative instruments that are accounted for as cash flow hedges are classified in the same category as the cash flows from the items being hedged. Cash flows from economic hedges are classified in the same category as the items subject to the economic hedging relationship.
Foreign currencies
Our and our subsidiaries’ functional currency is the U.S. dollar as the majority of the revenues are received in U.S. dollars and a majority of our expenditures are incurred in U.S. dollars. Our reporting currency is U.S. dollars.
Transactions in foreign currencies during the year are translated into U.S. dollars at the rates of exchange in effect at the date of the transaction. Foreign currency monetary assets and liabilities are translated using rates of exchange at the balance sheet date. Foreign currency non-monetary assets and liabilities are translated using historical rates of exchange. Foreign currency transaction and translation gains or losses are included in the statements of operations.
A-15
Fair Value measurements
We account for fair value measurements in accordance with the Accounting Standards Codification ("ASC") guidance using fair value to measure assets and liabilities. The guidance provides a single definition of fair value, together with a framework for measuring it, and requires additional disclosure about the use of fair value to measure assets and liabilities.
Use of estimates
The preparation of financial statements in accordance with U.S. GAAP requires that management make estimates and assumptions affecting the reported amounts of assets and liabilities and disclosure of contingent assets and liabilities at the date of the financial statements and the reported amounts of revenues and expenses during the reporting period. Actual results could differ from those estimates.
3. FORMATION TRANSACTIONS AND INITIAL PUBLIC OFFERING
During April 2011, the following transactions in connection with the transfer of the interests in the
Golar Winter
and the subsequent IPO occurred:
Capital contribution
|
(i)
|
Golar contributed to us its 100% interest in the subsidiary which leased the
Golar Winter
. This has been accounted for as a capital contribution by Golar to us.
|
Recapitalization of the Partnership
|
(ii)
|
We issued to Golar 23,127,254 common units and 15,949,831 subordinated units, representing a 98% limited partner interest in us, in exchange for Golar’s existing 98% limited partner interest in us; and
|
|
(iii)
|
We issued 797,492 general partner units to the General Partner, representing a 2% general partner interest in us, and 81% of the IDRs. The remaining 19% of the IDRs were issued to Golar Energy. The IDRs entitle the holder to increasing percentages of the cash we distribute in excess of $0.4428 per unit per quarter.
|
Initial Public Offering
|
(iv)
|
In the IPO, Golar sold 13,800,000 of our common units to the public at a price of $22.50 per unit, raising gross proceeds of $310.5 million. 1,800,000 of our common units were sold pursuant to the exercise of the overallotment option granted to the underwriters. Expenses relating to the IPO were borne by Golar.
|
Rights and Obligations of Partnership Units
|
•
|
Common units
. These represent limited partner interests in us. During the subordination period, the common units have preferential dividend and liquidation rights over the subordinated units as described in note 27. Each outstanding common unit is entitled to one vote on matters subject to a vote of common unitholders. However, if at any time, any person or group owns beneficially more than 4.9% or more of any class of units outstanding, any such units owned by that person or group in excess of 4.9% may not be voted (except for purposes of nominating a person for election to our board). The voting rights of any such common unitholder in excess of 4.9% will effectively be redistributed pro rata among the other common unitholders holding less than 4.9% of the voting power of such class of units. The General Partner, its affiliates and persons who acquired common units with the prior approval of the board of directors will not be subject to this 4.9% limit except with respect to voting their common units in the election of the four elected directors.
|
|
•
|
Subordinated units.
These represent limited partner interests in us. Subordinated units have limited voting rights and most notably are excluded from voting in the election of the elected directors. During the subordination period, the common units have preferential dividend rights to the subordinated units (see note 27). The subordination period will end on the satisfaction of various tests as prescribed in the Partnership Agreement, but will not end before March 31, 2016, except with the removal of the General Partner as the general partner. Upon the expiration of the subordination period, the subordinated units will convert into common units and will be subject to the same rights as common units.
|
A-16
|
•
|
General Partner units.
General partner units have preferential liquidation and dividend rights over the subordinated units. There is a limitation on the transferability of the general partner interest such that the General Partner may not transfer all or any part of its general partner interest to another person (except to an affiliate of the General Partner or another entity as part of the merger or consolidation of the General Partner with or into another entity or the transfer by the General Partner of all or substantially all of its assets to another entity) prior to March 31, 2021 without the approval of the holders of at least a majority of the outstanding common units, excluding common units held by the General Partner and its affiliates. The general partner units are not entitled to vote in the election of the four elected directors. However, the General Partner in their sole discretion appoints three of the seven board directors.
|
|
•
|
IDRs.
The IDRs are non-voting and represent rights to receive an increasing percentage of quarterly distributions of available cash from operating surplus after the minimum quarterly distribution and the target distribution levels have been achieved as described in note 27. The General Partner (including Golar Energy) or its affiliates may not transfer all or any part of its IDRs to another person (except to an affiliate of the General Partner or another entity as part of the merger or consolidation of the General Partner with or into another entity or the transfer by the General Partner of all or substantially all of its assets to another entity) prior to March 31, 2016 without the approval of the holders of at least a majority of the outstanding common units, excluding common units held by the General Partner and its affiliates.
|
The Partnership Agreement provides that if the General Partner is removed as a general partner under circumstances where cause does not exist and units held by the General Partner and its affiliates are not voted in favor of that removal:
|
•
|
the subordination period will end and all outstanding subordinated units will immediately convert into common units on a one-for-one basis;
|
|
•
|
any existing arrearages in payment of the minimum quarterly distribution on the common units will be extinguished; and
|
|
•
|
the General Partner will have the right to convert its general partner interest and its IDRs (and Golar Energy will have the right to convert its IDRs) into common units or to receive cash in exchange for those interests based on the fair market value of the interests at the time.
|
Agreements
In connection with the IPO, we entered into several agreements including:
|
•
|
A management and administrative services agreement with Golar Management Limited, a subsidiary of Golar ("Golar Management"), pursuant to which Golar Management agreed to provide certain management and administrative services to us;
|
|
•
|
A $20.0 million revolving credit agreement with Golar; and
|
|
•
|
An Omnibus Agreement with Golar, the General Partner and others governing, among other things:
|
|
•
|
To what extent we and Golar may compete with each other;
|
|
•
|
Certain rights of first offer on certain FSRUs and LNG carriers operating under charters for five or more years; and
|
|
•
|
The provision of certain indemnities to us by Golar.
|
We exercised our option under the Omnibus Agreement to purchase the
Golar Freeze
from Golar in October 2011 and the
NR Satu
in July 2012.
A-17
4. SUBSIDIARIES
The following table lists our significant subsidiaries and their purpose as of December 31, 2013. Unless otherwise indicated, we own 100% of each subsidiary.
|
Name
|
Jurisdiction of
Incorporation
|
Purpose
|
||
|
Golar Partners Operating LLC
|
Marshall Islands
|
Holding Company
|
||
|
Golar LNG Holding Corporation
|
Marshall Islands
|
Holding Company
|
||
|
Golar Maritime (Asia) Inc.
|
Republic of Liberia
|
Holding Company
|
||
|
Oxbow Holdings Inc.
|
British Virgin Islands
|
Holding Company
|
||
|
Faraway Maritime Shipping Company (60% ownership)
|
Republic of Liberia
|
Owns and operates
Golar Mazo
|
||
|
Golar LNG 2215 Corporation
|
Marshall Islands
|
Leases
Methane Princess
|
||
|
Golar Spirit Corporation
|
Marshall Islands
|
Owns
Golar Spirit
|
||
|
Golar LNG 2220 Corporation
|
Marshall Islands
|
Leased
Golar Winter
(until June 25, 2013)
|
||
|
Golar Freeze Holding Corporation
|
Marshall Islands
|
Owns
Golar Freeze
|
||
|
Golar 2215 UK Ltd
|
United Kingdom
|
Operates
Methane Princess
|
||
|
Golar Spirit UK Ltd
|
United Kingdom
|
Operates
Golar Spirit
|
||
|
Golar Winter UK Ltd
|
United Kingdom
|
Operates
Golar Winter
|
||
|
Golar Freeze UK Ltd
|
United Kingdom
|
Operates
Golar Freeze
|
||
|
Golar Servicos de Operacao de Embaracaoes Limited
|
Brazil
|
Management Company
|
||
|
Golar Khannur Corporation
|
Marshall Islands
|
Holding Company
|
||
|
Golar LNG (Singapore) Pte.
|
Singapore
|
Holding Company
|
||
|
PT Golar Indonesia*
|
Indonesia
|
Owns and operates
NR Satu
|
||
|
Golar LNG 2226 Corporation
|
Marshall Islands
|
Leased
Golar Grand
(until June 25, 2013)
|
||
|
Golar 2226 UK Ltd
|
United Kingdom
|
Operates
Golar Grand
|
||
|
Golar LNG 2234 Corporation
|
Republic of Liberia
|
Owns and operates
Golar Maria
|
||
|
Golar Winter Corporation
|
Marshall Islands
|
Owns
Golar Winter
(from June 26, 2013)
|
||
|
Golar Grand Corporation
|
Marshall Islands
|
Owns
Golar Grand
(from June 26, 2013)
|
||
*
We hold all of the voting stock and control all of the economic interests in PT Golar Indonesia ("PTGI") pursuant to a Shareholder's Agreement with the other shareholder of PTGI, PT Pesona Sentra Utama ("PT Pesona"). PT Pesona holds the remaining 51% interest in the issued share capital of PTGI.
We consolidated PTGI, which owns the
NR Satu
, in our consolidated financial statements effective September 28, 2011. PTGI became a VIE and we became its primary beneficiary upon our agreement to acquire all of Golar's interests in certain subsidiaries that own and operate the
NR Satu
(see note 24(k)) on July 18, 2012. We consolidate PTGI as we hold all of the voting stock and control all of the economic interests in PTGI.
The following table summarizes the balance sheets of PTGI as of December 31, 2013 and 2012:
A-18
|
(in thousands of $)
|
2013
|
2012
|
||||
|
ASSETS
|
||||||
|
Cash
|
8,225
|
|
3,979
|
|
||
|
Restricted cash
|
9,980
|
|
5,474
|
|
||
|
Vessels and equipment
|
354,255
|
|
375,443
|
|
||
|
Other assets
|
9,056
|
|
6,335
|
|
||
|
Total assets
|
381,516
|
|
391,231
|
|
||
|
LIABILITIES AND EQUITY
|
||||||
|
Accrued liabilities
|
25,020
|
|
31,778
|
|
||
|
Current portion of long-term debt
|
14,300
|
|
14,300
|
|
||
|
Amounts due to related parties
|
189,835
|
|
199,891
|
|
||
|
Long-term debt
|
126,400
|
|
140,700
|
|
||
|
Other liabilities
|
6,283
|
|
1,335
|
|
||
|
Total liabilities
|
361,838
|
|
388,004
|
|
||
|
Total equity
|
19,678
|
|
3,227
|
|
||
|
Total liabilities and equity
|
381,516
|
|
391,231
|
|
||
Trade creditors of PTGI have no recourse to our general credit.
The long-term debt of PTGI is secured against the
NR Satu
and has been guaranteed by us.
5. RECENTLY ISSUED ACCOUNTING STANDARDS
Adoption of new accounting standards
In December 2011, the Financial Accounting Standards Board ("FASB") amended guidance on disclosures about offsetting assets and liabilities. The amendments require an entity to disclose information about offsetting and related arrangements to enable users of its financial statements to understand the effect of those arrangements on its financial position. The amendments will enhance disclosures required by US GAAP by requiring improved information about financial instruments and derivative instruments that are either offset or subject to an enforceable master netting arrangement or similar agreement, irrespective of whether they are offset in accordance with US GAAP. This information will enable users of an entity's financial statements to evaluate the effect or potential effect of netting arrangements on an entity's financial position, including the effect or potential effect of netting arrangements on an entity's financial position, including the effect or potential effect of rights of set-off associated with certain financial instruments and derivative instruments in the scope of this update. The amendments were required for annual reporting
A-19
periods beginning on or after January 1, 2013, and interim periods within those annual periods. An entity should provide the disclosures required by those amendments retrospectively for all comparative periods presented. The effect of this to our consolidated financial statements is included in note 23.
In July 2012, the FASB amended disclosure requirements relating to testing indefinite-lived intangible assets for impairment. The amendments no longer require entities to disclose the quantitative information about significant unobservable inputs used in fair value measurements categorized within Level 3 of the fair value hierarchy that relate to the financial accounting and reporting for an indefinite-lived intangible asset after its initial recognition. The amendment was effective for annual and interim impairment tests performed for fiscal years beginning after September 15, 2012. Early adoption is permitted. The amendment did not have a material impact on our consolidated financial statements.
In October 2012, the FASB amended several disclosure requirements of the FASB Accounting Standards Codification relating to investments, consolidation, accounting changes and error corrections, inventory, retirement benefits for defined benefit plans, financial instruments and balance sheet. The amendments were effective for fiscal periods beginning after December 15, 2012. The amendment did not have a material impact on our consolidated financial statements.
In February 2013, further guidance was provided relating to the reporting of the effects on net income of significant amounts reclassified out of each component of accumulated other comprehensive income. Under the updated guidance, the effects on net income of significant amounts reclassified out of each component of accumulated other comprehensive income shall be shown, in one location, either on the face of the statement where net income is presented or as a separate disclosure in the notes to the financial statements. The amendment resulted in additional disclosures in our consolidated and combined carve-out statement of comprehensive income.
In July 2013, the FASB amended Accounting Standards Codification (ASC) Topic 815 permitting the Fed Funds Effective Swap Rate to be used as a U.S. benchmark interest rate for hedge accounting purposes, in addition to U.S. Treasury interest rates and the London Interbank Offered Rate. The amendments also remove the restriction on using different benchmark rates for similar hedges. The amendments were applied prospectively for qualifying new or redesignated hedging relationships entered into on or after July 17, 2013. We have not entered into any qualifying new or redesignated hedging relationships since July 17, 2013 through to the date of these consolidated financial statements. Accordingly, the adoption of this guidance did not have a material impact on our consolidated financial statements.
New accounting standards not yet adopted
In February 2013, the FASB issued guidance for the recognition, measurement and disclosure of obligations resulting from joint and several liability arrangements for which the total amount of the obligation is fixed at the reporting date, including debt arrangements, other contractual obligations and settled litigation and judicial rulings. The guidance requires an entity to measure obligations resulting from joint and several liability arrangements for which the total amount of the obligation within the scope of this guidance is fixed at the reporting date, as the sum of (a) the amount the reporting entity agreed to pay on the basis of its arrangement among its co-obligors and (b) any additional amount the reporting entity expects to pay on behalf of its co-obligors. The guidance also requires an entity to disclose the nature and amount of the obligation as well as other information about those obligations. The amendments are effective for fiscal years, and interim periods within those years, beginning after December 15, 2013. We are evaluating the impact of the adoption of this amended guidance.
In July 2013, the FASB issued guidance on the presentation of unrecognized tax benefits. This guidance
requires an entity to present an unrecognized tax benefit, or a portion of an unrecognized tax benefit, in the financial statements as a reduction to a deferred tax asset for a net operating loss carryforward, a similar tax loss, or a tax credit carryforward, to the extent a net operating loss carryforward, a similar tax loss, or a tax credit carryforward is not available at the reporting date under the tax law of the applicable jurisdiction to settle any additional income taxes that would result from the disallowance of a tax position or the tax law of the applicable jurisdiction does not require the entity to use, and the entity does not intend to use, the deferred tax asset for such purpose, the unrecognized tax benefit should be presented in the financial statements as a liability and should not be combined with deferred tax assets. The amendments are effective for fiscal years, and interim periods within those years, beginning after December 15, 2013. We do not expect the adoption of this guidance to have a material impact on the financial statements.
6. SEGMENTAL INFORMATION
We have not presented segmental information as we consider that we operate in one reportable segment, the LNG market. During 2013, 2012 and 2011, our fleet operated under time charters and in particular with six charterers, Petrobras, Dubai Supply Authority ("DUSUP"), Pertamina, PT Nusantara Regas ("PTNR"), BG Group plc and Eni S.p.A. Petrobras is a Brazilian energy company. DUSUP is a government entity which is the sole supplier of natural gas to the Emirates. Pertamina is the state-owned oil and gas
A-20
company of Indonesia. PTNR is a joint venture company of Pertamina and Perusahaan Gas Negara, an Indonesian company engaged in the transport and distribution of natural gas in Indonesia. BG Group plc is headquartered in the United Kingdom. Eni S.p.A is an integrated energy company headquartered in Italy. In time charters, the charterer, not us, controls the choice of which routes our vessel will serve. These routes can be worldwide as determined by the charterers except for our FSRUs which operate at specific locations where the charterers are based. Accordingly, our management, including the chief operating decision maker, does not evaluate our performance either according to customer or geographical region.
In the years ended December 31, 2013, 2012 and 2011, revenues from the following customers accounted for over 10% of our consolidated and combined revenues:
|
(in thousands of $)
|
2013
|
2012
|
2011
|
|||||||||||||||
|
Petrobras
|
85,899
|
|
26
|
%
|
92,952
|
|
32
|
%
|
93,741
|
|
41
|
%
|
||||||
|
DUSUP
|
48,029
|
|
15
|
%
|
48,328
|
|
17
|
%
|
47,054
|
|
21
|
%
|
||||||
|
Pertamina
|
37,302
|
|
11
|
%
|
37,300
|
|
13
|
%
|
37,829
|
|
17
|
%
|
||||||
|
BG Group plc
|
66,341
|
|
20
|
%
|
66,148
|
|
23
|
%
|
25,101
|
|
11
|
%
|
||||||
|
PTNR
|
65,478
|
|
20
|
%
|
41,902
|
|
15
|
%
|
—
|
|
—
|
%
|
||||||
|
Gas Natural Aprovisionamientos SDG S.A.
|
—
|
|
—
|
%
|
—
|
|
—
|
%
|
21,474
|
|
10
|
%
|
||||||
Geographic segment data
The following geographical data presents our revenues and fixed assets with respect only to our FSRUs, operating under long-term charters, at specific locations. LNG vessels operate on a worldwide basis and are not restricted to specific locations. Accordingly, it is not possible to allocate the assets of these operations to specific countries.
|
Revenues
|
2013
|
2012
|
2011
|
||||||
|
Brazil
|
85,899
|
|
92,952
|
|
93,741
|
|
|||
|
United Arab Emirates
|
48,029
|
|
48,328
|
|
47,054
|
|
|||
|
Indonesia
|
65,478
|
|
41,902
|
|
—
|
|
|||
|
Fixed assets
|
2013
|
2012
|
||||
|
Brazil
|
413,967
|
|
379,061
|
|
||
|
United Arab Emirates
|
142,757
|
|
153,097
|
|
||
|
Indonesia
|
233,734
|
|
247,942
|
|
||
7. OTHER FINANCIAL ITEMS, NET
|
(in thousands of $)
|
2013
|
2012
|
2011
|
||||||
|
Amortization of deferred financing costs
|
(5,828
|
)
|
(1,123
|
)
|
(931
|
)
|
|||
|
Financing arrangement fees and other costs
|
(2,101
|
)
|
(411
|
)
|
(536
|
)
|
|||
|
Interest expense on un-designated interest rate swaps
|
(8,188
|
)
|
(6,609
|
)
|
(5,788
|
)
|
|||
|
Mark-to-market adjustment for interest rate swap derivatives (see note 23)
|
12,845
|
|
1,328
|
|
(9,427
|
)
|
|||
|
Mark-to-market adjustment for currency swap derivatives (see note 23)
|
(4,839
|
)
|
7,204
|
|
(1,417
|
)
|
|||
|
Foreign exchange gain (loss) on capital lease obligations and related restricted cash
|
7,084
|
|
(5,602
|
)
|
182
|
|
|||
|
Foreign exchange loss on operations
|
(634
|
)
|
(176
|
)
|
(604
|
)
|
|||
|
Total
|
(1,661
|
)
|
(5,389
|
)
|
(18,521
|
)
|
|||
As discussed in note 2, mark-to-market adjustments on interest rate and currency swap derivatives also include an allocation of Golar's mark-to-market adjustments on derivatives entered into by Golar. For the years ended December 31, 2012 and 2011, the amounts allocated to the Partnership was a gain of $0.1 million and loss of $2.5 million, respectively.
A-21
8. TAXATION
The components of income tax expense are as follows:
|
(in thousands of $)
|
2013
|
2012
|
2011
|
||||||
|
Current tax expense (credit):
|
|
|
|
|
|
|
|||
|
U.K.
|
(373
|
)
|
1,888
|
|
1,044
|
|
|||
|
Indonesia
|
5,047
|
|
7,395
|
|
—
|
|
|||
|
Brazil
|
779
|
|
1,055
|
|
1,364
|
|
|||
|
Total current tax expense
|
5,453
|
|
10,338
|
|
2,408
|
|
|||
|
Deferred tax income:
|
|
|
|
|
|
|
|||
|
Amortization of deferred tax benefit on intra-group transfer (Note 2)
|
—
|
|
(912
|
)
|
(2,363
|
)
|
|||
|
Total income tax expense
|
5,453
|
|
9,426
|
|
45
|
|
|||
United States
Pursuant to the Internal Revenue Code of the United States (the “Code”), U.S. source income from the international operations of ships is generally exempt from U.S. tax if the company operating the ships meets certain requirements. Among other things, in order to qualify for this exemption, the company operating the ships must be incorporated in a country which grants an equivalent exemption from income taxes to U.S. citizens and U.S. corporations and must be more than 50% owned by individuals who are residents, as defined, in such country or another foreign country that grants an equivalent exemption to U.S. citizens and U.S. corporations. Our management believes that we satisfied these requirements and therefore by virtue of the above provisions, we were not subject to tax on its U.S. source income.
A reconciliation between the income tax expense resulting from applying either the U.S. federal or Marshall Islands statutory income tax rate and the reported income tax expense has not been presented herein as it would not provide additional useful information to users of the financial statements as our net income is subject to neither Marshall Islands nor U.S. tax.
United Kingdom
Current taxation credit of $0.4 million, charge of $1.9 million and charge of $1.0 million for the years ended December 31, 2013, 2012 and 2011, respectively, relates to taxation of the operations of our United Kingdom subsidiaries. Taxable revenues in the United Kingdom are generated by our UK subsidiary companies and are comprised of revenues from the operation of five of our vessels. The statutory tax rate in the United Kingdom as of December 31, 2013 was 23%.
We record deferred income taxes to reflect the net tax effects of temporary differences between the carrying amount of assets and liabilities for financial reporting purposes and the amounts used for income tax purposes. We did not have any deferred tax assets at December 31, 2013 or 2012.
Brazil
Current taxation charges of $0.8 million, $1.1 million and $1.4 million for the years ended December 31, 2013, 2012 and 2011, respectively, refer to taxation levied on the operations of our Brazilian subsidiary.
Indonesia
Current taxation charges of $5.0 million, $7.4 million and $nil for the years ended December 31, 2013, 2012 and 2011, respectively, refer to taxation levied on the operations of our Indonesian subsidiary. However, the tax exposure in Indonesia is intended to be mitigated by revenue due under the time charter. This tax element of the time charter rate was established at the beginning of the time charter, and shall be adjusted only where there is a change in Indonesian tax laws or the invalidity of certain stipulated tax assumptions.
We record deferred income taxes to reflect the net tax effects of temporary differences between the carrying amount of assets and liabilities for financial reporting purposes and the amounts used for income tax purposes.
A-22
Other jurisdictions
No tax has been levied on income derived from our subsidiaries registered in the Marshall Islands, Liberia and the British Virgin Islands.
The following table summarizes the earliest tax year that remain subject to examination by the major taxable jurisdictions in which we operate:
|
Jurisdiction
|
Earliest
|
|
|
U.K.
|
2008
|
|
|
Brazil
|
2008
|
|
|
Indonesia
|
2012
|
|
Deferred income tax assets are summarized as follows:
|
(in thousands of $)
|
2013
|
2012
|
||||
|
Deferred tax assets, gross
|
6,070
|
|
—
|
|
||
|
Valuation allowances
|
(6,070
|
)
|
—
|
|
||
|
Deferred tax assets, net
|
—
|
|
—
|
|
||
Deferred tax assets, gross relate to net operating losses carried forward for the
NR Satu
. The deferred tax asset was fully provided for during the year as we do not consider this as realizable. Valuation allowances of 6.1 million, $nil and $1.0 million arose in the years ended December 31, 2013, 2012 and 2011, respectively, and were recognized in our consolidated and combined carve-out statements of operations.
A-23
9. OPERATING LEASES
Rental income
The minimum contractual future revenues to be received on time charters as of
December 31, 2013
, were as follows:
|
Year ending December 31,
(in thousands of $)
|
Total
|
|||
|
2014
|
351,888
|
|
||
|
2015
|
352,154
|
|
||
|
2016
|
340,567
|
|
||
|
2017
|
337,040
|
|
||
|
2018
|
212,290
|
|
||
|
2019 and later
|
789,524
|
|
||
|
Total
|
2,383,463
|
|
(1)
|
|
____________________________________
(1) This includes revenues from Golar relating to the Option Agreement entered into in connection with the acquisition of the
Golar Grand
in November 2012. In the event the current charterer does not renew or extend its charter beyond 2015, we have the option to require Golar to charter the vessel through to October 2017.
Minimum lease revenues are calculated based on certain assumptions such as those relating to expected off-hire days and, for those days on-hire, estimates of the operating component of the charter rate (where applicable) which includes assumptions as to forecast foreign currency rates, changes in the specified consumer price index, amongst others. For those charters containing provisions for reimbursement for drydocking expenditure, these revenues have not been reflected in minimum lease revenues above.
PTNR has the right to purchase the
NR Satu
at any time after the first anniversary of the commencement date of its charter at a price that must be agreed upon between us and PTNR. We have assumed that this option will not be exercised. Accordingly, the minimum lease revenues set out above include revenues arising within the option period.
The cost and accumulated depreciation of vessels leased to third parties at December 31, 2013 and 2012 were $1,858.3 million and $1,555.7 million; and $449.0 million and $362.9 million, respectively. For arrangements where operating costs are borne by the charterer on a pass through basis, the pass through of operating costs are reflected in both revenue and expenses.
A-24
10. BUSINESS COMBINATION
On February 7, 2013, we acquired Golar's 100% interest in the company that owns and operates the
Golar Maria.
The purchase consideration was $215 million for the vessel less the assumed bank debt of $89.5 million and the fair value of the interest rate swap liability of $3.1 million plus other purchase price adjustments of $5.5 million. The
Golar Maria
was delivered to its current charterer, LNG Shipping S.p.A. ("LNG Shipping"), a subsidiary of Eni S.p.A in November 2012 under a charter expiring in December 2017. The acquisition of the
Golar Maria
was deemed accretive to our distributions.
We accounted for the acquisition of the
Golar Maria
as a business combination. The purchase price of the acquisition has been allocated to the identifiable assets acquired. The allocation of the purchase price to acquired identifiable assets was based on their estimated fair values at the date of acquisition. The fair values allocated to each class of identifiable assets of
Golar Maria
and the difference between the purchase price and net assets acquired were calculated as follows:
|
(in thousands of $)
|
February 7, 2013
|
|
|||
|
Purchase consideration
|
127,910
|
|
(1)
|
||
|
Less: Fair value of net assets (liabilities) acquired:
|
|||||
|
Vessel and equipment
|
215,000
|
|
|||
|
Cash
|
7,981
|
|
|||
|
Fair value of interest rate swap
|
(3,096
|
)
|
|||
|
Long-term debt
|
(89,525
|
)
|
|||
|
Other assets and liabilities
|
(2,450
|
)
|
|||
|
Subtotal
|
(127,910
|
)
|
|||
|
Difference between the purchase price and fair value of net assets acquired
|
—
|
|
|||
__________________________________________
(1) The cash purchase consideration of $127.9 million comprises the following:
|
(in thousands of $)
|
||
|
Cash consideration paid to Golar
|
125,500
|
|
|
Adjustment for the interest rate swap liability assumed
|
(3,096
|
)
|
|
Other purchase price adjustments
|
5,506
|
|
|
127,910
|
|
|
Revenue and profit contributions
Since the acquisition date, the business has contributed revenues of $26.1 million and net income of $14.5 million to us for the period from February 7, 2013 to December 31, 2013.
The table below shows our comparative summarized consolidated pro forma financial information for the years ended December 31, 2013 and 2012, giving effect to our acquisition of the
Golar Maria
as if it had taken place on January 1, 2012.
|
Unaudited
|
Unaudited
|
|||
|
(in thousands of $, except per unit data)
|
2013
|
2012
|
||
|
Revenues
|
332,150
|
|
308,617
|
|
|
Net income
|
152,388
|
|
135,472
|
|
|
Earnings per unit (basic and diluted):
|
||||
|
Common unitholders
|
$2.33
|
$2.52
|
||
A-25
11. TRADE ACCOUNTS RECEIVABLE
Trade accounts receivable are presented net of provisions for doubtful accounts. As of December 31, 2013 and 2012, there was no provision for doubtful accounts.
12. OTHER RECEIVABLES, PREPAID EXPENSES AND ACCRUED INCOME
|
(in thousands of $)
|
2013
|
2012
|
||||
|
Other receivables
|
2,937
|
|
1,219
|
|
||
|
Prepaid expenses
|
4,089
|
|
2,874
|
|
||
|
Accrued interest income
|
—
|
|
243
|
|
||
|
|
7,026
|
|
4,336
|
|
||
As of December 31, 2013, included in other receivables is an amount for an indemnification receivable of $2 million (see note 25).
13. VESSELS AND EQUIPMENT, NET
|
(in thousands of $)
|
2013
|
2012
|
||||
|
Cost
|
1,665,039
|
|
954,992
|
|
||
|
Accumulated depreciation
|
(383,448
|
)
|
(247,845
|
)
|
||
|
Net book value
|
1,281,591
|
|
707,147
|
|
||
As of December 31, 2013 and 2012, we owned seven and four vessels, respectively.
The increase in the number of vessels in the year ended December 31, 2013 is due to the acquisition of the
Golar Maria
in February 2013 (see note 10) and the termination of the lease financing arrangements relating to the
Golar Winter
and the
Golar Grand
to acquire the legal title of both these vessels. The
Golar Winter
and the
Golar Grand
were previously included within vessels under capital leases, net, as of December 31, 2012 (see note 14).
Drydocking costs of $68.7 million and $20.9 million are included in the cost amounts for December 31, 2013 and 2012, respectively. Accumulated amortization of those costs at December 31, 2013 and 2012 was $16.6 million and $4.3 million, respectively.
Mooring equipment of $38.1 million is included in the cost for December 31, 2013 and 2012. Accumulated depreciation of the mooring equipment at December 31, 2013 and 2012 was $6.0 million and $2.4 million, respectively.
Depreciation and amortization expense for the years ended December 31, 2013, 2012 and 2011 was $55.1 million, $35.2 million and $29.3 million, respectively.
As of December 31, 2013 and 2012, vessels and equipment with a net book value of $1,281.6 million and $707.1 million, respectively, were pledged as security for certain debt facilities (see note 25).
14. VESSELS UNDER CAPITAL LEASES, NET
|
(in thousands of $)
|
2013
|
2012
|
||||
|
Cost
|
168,492
|
|
600,733
|
|
||
|
Accumulated depreciation
|
(40,799
|
)
|
(115,101
|
)
|
||
|
Net book value
|
127,693
|
|
485,632
|
|
||
As of December 31, 2013 and 2012, we operated one and three vessels under capital leases, respectively. The lease is in respect of a refinancing transaction undertaken during 2003, as described in note 21.
A-26
The decrease in vessels under capital leases is as a result of the termination of the lease financing arrangements relating to the
Golar Winter
and the
Golar Grand
and the acquisition of the legal title of these vessels (see note 21). As of December 31, 2013, these assets are now included within vessels and equipment, net (see note 13).
Drydocking costs of $8.1 million and $9.9 million are included in the cost amounts above as of December 31, 2013 and 2012, respectively. Accumulated amortization of those costs at December 31, 2013 and 2012 was $0.9 million and $6.7 million, respectively.
Depreciation and amortization expense for vessels under capital leases for the years ended December 31, 2013, 2012 and 2011 was $11.9 million, $16.6 million and $16.6 million, respectively.
15. DEFERRED CHARGES
Deferred charges represent financing costs, principally bank fees that are capitalized and amortized to other financial items over the life of the debt instrument. If a loan is repaid early, any unamortized portion of the related deferred charges is charged against income in the period in which the loan is repaid. The deferred charges are comprised of the following amounts:
|
(in thousands of $)
|
2013
|
2012
|
||||
|
Debt arrangement fees and other deferred financing charges
|
20,677
|
|
19,684
|
|
||
|
Accumulated amortization
|
(6,407
|
)
|
(4,661
|
)
|
||
|
|
14,270
|
|
15,023
|
|
||
Amortization expense of deferred charges, for the years ended December 31, 2013, 2012 and 2011 was $5.8 million, $1.1 million and $0.9 million, respectively.
The increase in debt arrangement fees and other deferred financing charges is due to costs capitalized in relation to the Golar Partners Operating Credit Facility which we entered into to refinance the
Golar Winter
and the
Golar Grand
.
A-27
16. RESTRICTED CASH AND SHORT-TERM INVESTMENTS
Our short-term restricted cash and investment balances in respect of our debt and lease obligations are as follows:
|
(in thousands of $)
|
2013
|
2012
|
||||
|
Total security lease deposits for lease obligations
|
5,639
|
|
5,398
|
|
||
|
Restricted cash relating to the Golar Freeze facility (see note 20)
|
8,832
|
|
8,994
|
|
||
|
Restricted cash relating to the Mazo facility (see note 20)
|
—
|
|
11,034
|
|
||
|
Restricted cash relating to the NR Satu facility (see note 20)
|
9,980
|
|
5,474
|
|
||
|
24,451
|
|
30,900
|
|
|||
Restricted cash does not include minimum consolidated cash balances of $25 million required to be maintained as part of the financial covenants in some of our loan facilities, as these amounts are included in "Cash and cash equivalents" (see note 20).
As of December 31, 2013 and 2012, the value of deposits used to obtain letters of credit to secure the obligations for the lease arrangements described in note 21 was $151.4 million and $195.9 million, respectively. These security deposits are referred to in these financial statements as restricted cash. The Methane Princess Lease security deposit earns interest based upon GBP LIBOR.
Our restricted cash balances in respect of our lease obligations are as follows:
|
(in thousands of $)
|
2013
|
2012
|
||||
|
Methane Princess Lease security deposits
|
151,364
|
|
150,913
|
|
||
|
Golar Grand Lease security deposits
|
—
|
|
45,008
|
|
||
|
Total security deposits for lease obligations
|
151,364
|
|
195,921
|
|
||
|
Included in short-term restricted cash and short-term investments
|
(5,639
|
)
|
(5,398
|
)
|
||
|
Long-term restricted cash
|
145,725
|
|
190,523
|
|
||
17. OTHER NON-CURRENT ASSETS
|
(in thousands of $)
|
2013
|
2012
|
||||
|
Mark-to-market cross currency interest rate swaps valuation relating to high-yield bonds (see note 23)
|
—
|
|
1,819
|
|
||
|
Mark-to-market interest rate swaps valuation (see note 23)
|
5,335
|
|
—
|
|
||
|
Methane Princess Lease security deposit movements (see note 24(h))
|
4,257
|
|
—
|
|
||
|
Other long-term assets
|
5,969
|
|
3,460
|
|
||
|
15,561
|
|
5,279
|
|
|||
Included within "Other long-term assets" are: (i) capitalized commission expenses and lease incentives incurred in connection with securing the NR Satu time charter amounting to $6.0 million and $2.3 million as of December 31, 2013 and 2012, respectively. These costs are amortized over the term of the NR Satu time charter. Amortization expense for the years ended December 31, 2013, 2012 and 2011 was $0.7 million, $0.2 million and $nil, respectively; and (ii) an amount of $1.2 million which was previously included within the total as of December 31, 2012, which related to the
Golar Winter
modification. Upon completion of the modification in 2013, the balance was transferred to vessels and equipment, net.
A-28
18. ACCRUED EXPENSES
|
(in thousands of $)
|
2013
|
2012
|
||||
|
Vessel operating and drydocking expenses
|
5,538
|
|
6,737
|
|
||
|
Administrative expenses
|
757
|
|
281
|
|
||
|
Interest expense
|
6,273
|
|
7,729
|
|
||
|
Provision for tax
|
7,520
|
|
11,783
|
|
||
|
|
20,088
|
|
26,530
|
|
||
A-29
19. OTHER CURRENT LIABILITIES
|
(in thousands of $)
|
2013
|
2012
|
||||
|
Deferred revenue
|
17,888
|
|
12,848
|
|
||
|
Mark-to-market interest rate swaps valuation (see note 23)
|
15,119
|
|
24,991
|
|
||
|
Mark-to-market cross currency interest rate swaps valuation (see note 23)
|
16,804
|
|
—
|
|
||
|
Mark-to-market foreign exchange rate swaps valuation (see note 23)
|
—
|
|
20,527
|
|
||
|
Deferred credits from capital lease transactions (see note 22)
|
625
|
|
625
|
|
||
|
Other creditors (see note 25)
|
6,609
|
|
5,701
|
|
||
|
|
57,045
|
|
64,692
|
|
||
20. DEBT
|
(in thousands of $)
|
2013
|
2012
|
||||
|
Total long-term debt due to third parties
|
889,471
|
|
704,519
|
|
||
|
Less: current portion of long-term debt due to third parties
|
(156,363
|
)
|
(64,822
|
)
|
||
|
Total long-term debt due to third parties
|
733,108
|
|
639,697
|
|
||
|
Total long-term debt due to related parties
|
—
|
|
34,953
|
|
||
|
Long-term debt
|
733,108
|
|
674,650
|
|
||
Our outstanding debt as of
December 31, 2013
is repayable as follows:
|
Year Ending December 31,
(in thousands of $)
|
|
||
|
2014
|
156,363
|
|
|
|
2015
|
99,782
|
|
|
|
2016
|
62,550
|
|
|
|
2017
|
276,651
|
|
|
|
2018
|
230,942
|
|
|
|
2019 and thereafter
|
63,183
|
|
|
|
Total
|
889,471
|
|
|
Excluding the high-yield bonds, our debt is denominated in U.S. dollars and bears interest at fixed or floating rates at a weighted average interest rate for the years ended December 31, 2013 and 2012 of 3.37% and 3.93%, respectively.
At December 31, 2013, the maturity dates for our debt were as follows:
|
(in thousands of $)
|
2013
|
2012
|
Maturity date
|
|||||
|
Mazo facility
|
—
|
|
13,521
|
|
2013
|
|||
|
Golar Maria facility
|
84,525
|
|
—
|
|
2014
|
|||
|
High-yield bonds
|
214,100
|
|
233,804
|
|
2017
|
|||
|
Golar LNG Partners credit facility
|
160,500
|
|
247,500
|
|
2018
|
|||
|
Golar Partners Operating credit facility
|
215,000
|
|
—
|
|
2018
|
|||
|
Golar Freeze facility
|
74,646
|
|
89,647
|
|
2015/2018*
|
|||
|
NR Satu facility
|
140,700
|
|
155,000
|
|
2019
|
|||
|
|
889,471
|
|
739,472
|
|
|
|||
A-30
*
The Commercial Loan facility tranche matures in 2015 and the Exportfinans Loan facility tranche matures in 2018.
Mazo Facility
In November 1997, Osprey, Golar’s predecessor, entered into a secured loan facility of $214.5 million in respect of the vessel, the
Golar Mazo
. The Mazo facility matured in June 2013 and the corresponding restricted cash balances were released to cash.
Golar Maria Facility
The Golar Maria facility is secured against the
Golar Maria
and was assumed by us upon the acquisition of the company that owns and operates the vessel from Golar in February 2013. The amount originally drawn down under the facility was $120 million, but the balance outstanding under the facility at the date of acquisition was $89.5 million. The Golar Maria facility bears interest at LIBOR plus a 0.95% margin and is repayable in quarterly installments with a final balloon payment of $80.8 million due in December 2014. As of December 31, 2013, we had $84.5 million of borrowings outstanding under the Golar Maria facility and thus, is presented under current debt. We expect to refinance this facility ahead of its expiration.
High-yield Bonds
In October 2012, we completed the issuance of NOK 1,300 million senior unsecured bonds that mature in October 2017. The aggregate principal amount of the bonds at the time of issuance is equivalent to approximately $227 million. The bonds bear interest at three months NIBOR plus a margin of 5.20% payable quarterly. All interest and principal payments on the bonds were swapped into U.S. dollars including fixing interest payments at 6.485%. The net proceeds from the bonds were used primarily to repay the $222.3 million 6.75% loan due October 2014 from Golar that was utilized to purchase the
Golar Freeze
(Golar LNG Vendor Financing Loan -
Golar Freeze
). The bonds were listed on the Oslo Bors ASA in December 2012. As of December 31, 2013, the U.S. dollar equivalent of the principal amount is $214.1 million.
Golar LNG Partners Credit Facility
In September 2008, we refinanced existing loan facilities in respect of two of our vessels, the
Methane Princess
and the
Golar Spirit,
and entered into a new $285 million revolving credit facility with a banking consortium. The loan is secured against the
Golar Spirit
and the assignment to the lending banks of a mortgage given to us by the lessors of the
Methane Princess
, with a second priority charge over the
Golar Mazo
.
The revolving credit facility accrues floating interest at a rate per annum equal to LIBOR plus a margin of 1.15%. The initial draw down amounted to $250 million in November 2008. The total amount outstanding at the time of refinancing, in respect of the two vessels’ facilities was $202.3 million. As of December 31, 2013, the revolving credit facility provided for available borrowings of up to $225.5 million, of which $160.5 million was outstanding. The revolving credit facility is a reducing facility which decreases by $2.5 million per quarter from June 30, 2009 through December 31, 2012 and by $5.5 million per quarter from March 31, 2013 through December 31, 2017. As of December 31, 2013, we had an undrawn balance of $65 million available to us under this revolving credit facility. The loan has a term of ten years and is repayable in quarterly installments commencing in May 2009 with a final balloon payment of $137.5 million due in March 2018, its maturity date.
Golar Partners Operating Credit Facility
In June 2013, we refinanced existing lease financing arrangements in respect of two vessels, the
Golar Winter
and the
Golar Grand
, and entered into a new five year, $275 million loan facility with a banking consortium. The loan facility is split into two tranches, a $225 million term loan facility and a $50 million revolving credit facility which matures in June 2018. As of December 31, 2013, we had an undrawn balance of $50 million available to us under this revolving credit facility. The loan facility is secured against the
Golar Winter
and the
Golar Grand
and is repayable in quarterly installments with a final balloon payment of $130 million payable in July 2018. The loan facility and the revolving credit facility bear interest at LIBOR plus a margin of 3% together with a commitment fee of 1.2% on any undrawn portion of the facility. As of December 31, 2013, we had $215.0 million of borrowings outstanding under the Golar Partners Operating credit facility.
A-31
Golar Freeze Facility
We assumed the Golar Freeze facility pursuant to the purchase of the
Golar Freeze
from Golar, in October 2011. The amount originally drawn down under the facility in June 2010 was $125 million. The amount outstanding under the facility at the time we assumed the debt was approximately $108.0 million. As of December 31, 2013, there was approximately $74.6 million of borrowings outstanding under the Golar Freeze facility. The Golar Freeze facility is secured against the
Golar Freeze
. The facility is with a syndicate of banks and financial institutions and bears interest at LIBOR plus a margin of 3%. The facility is split into two tranches, the Commercial Loan facility and the Exportfinans Loan facility. Repayments under the Commercial Loan facility tranche are due quarterly based on an annuity profile with a final balloon payment of $34.8 million payable in May 2015. The Exportfinans Loan facility tranche is for $50 million with a term of eight years and repayable in equal quarterly installments with the final payment due in June 2018. The Golar Freeze facility requires certain balances to be held on deposit during the period of the loan (see note 16).
NR Satu Facility
In December 2012, PTGI, the company that owns and operates the FSRU,
NR Satu
, entered into a seven year secured loan facility. The total facility amount is $175 million and is split into two tranches, a $155 million term loan facility and a $20 million revolving facility. The facility is with a syndicate of banks and bears interest at LIBOR plus a margin of 3.5% together with a commitment fee of 1.4% on any undrawn portion of the facility. PTGI drew down $155 million on the term loan facility in December 2012. The loan is payable on a quarterly basis with a final balloon payment of $52.5 million payable in March 2020. The NR Satu facility requires certain balances to be held on deposit during the period of the loan (see note 16).
As of December 31, 2013, the margins we pay under our loan agreements are above LIBOR at a fixed or floating rate ranging from 0.95% to 3.50%. The margin related to our high-yield bond is 5.20% above NIBOR.
Debt and lease restrictions
Our loan debt is collateralized by ship mortgages and, in the case of some debt, pledges of shares by each guarantor subsidiary. The existing financing agreements impose operating and financing restrictions which may limit or prohibit, among other things, our ability to incur additional indebtedness, create liens, sell capital shares of subsidiaries, make certain investments, engage in mergers and acquisitions, purchase and sell vessels, enter into time or consecutive voyage charters or pay dividends without the consent of the lenders. In addition, lenders may accelerate the maturity of indebtedness under financing agreements and foreclose upon the collateral securing the indebtedness upon the occurrence of certain events of default, including a failure to comply with any of the covenants contained in the financing agreements. Our various debt agreements contain certain covenants, which require compliance with certain financial ratios. Such ratios include equity ratio covenants, working capital ratios, net debt to EBITDA ratios and minimum free cash restrictions. With regards to cash restrictions, we have covenanted to retain at least $25 million of cash and cash equivalents on a consolidated group basis. In addition, there are cross default provisions in most of our and Golar's loan and lease agreements.
In April 2013, we received waivers relating to the requirement under the Golar LNG Partners credit facility and the Golar Freeze facility relating to change of control over the Partnership. Following the grant of such waivers, in order to permanently resolve this issue, the loan facilities affected by the loss of control which contained the change of control provisions were amended in June 2013. We are now in compliance with all covenants.
21. CAPITAL LEASES
|
(in thousands of $)
|
2013
|
2012
|
||||
|
Total obligations under capital leases
|
159,008
|
|
412,371
|
|
||
|
Less: current portion of obligations under capital leases
|
—
|
|
(5,837
|
)
|
||
|
Long-term obligations under capital leases
|
159,008
|
|
406,534
|
|
||
As of December 31, 2013 and 2012, we operated one and three vessels under capital leases, respectively. These leases were in respect of a refinancing transaction in 2003, a lease financing transaction in 2004 and another in 2005.
A-32
The leasing transaction, which occurred in August 2003, was in relation to the newbuilding, the
Methane Princess
. We novated the
Methane Princess
newbuilding contract prior to completion of construction and leased the vessel from the same financial institution in the United Kingdom (“The Methane Princess Lease”). The lessor of the
Methane Princess
has a second priority security interest in the
Methane Princess
and the
Golar Spirit.
Our obligation to the lessor under the Methane Princess Lease is secured by a letter of credit (“LC”) provided by other banks. Details of the security deposit provided by us to the bank providing the LC are given in note 16.
The leasing transactions, which occurred in April 2004 and 2005, were in relation to the newbuildings, the
Golar Winter
and the
Golar Grand
, respectively. In each case, we novated the vessels’ newbuilding contracts prior to the completion of construction and then leased the vessel from a financial institution in the UK.
The decrease in the number of vessels under capital leases is due to the termination of the Golar Winter and Golar Grand lease obligations in June 2013 (see note 14) and their refinancing with the Golar Partners Operating Credit Facility as described in note 20.
As of December 31, 2013, we are committed to make quarterly minimum capital lease payments (including interest), as follows:
|
Year ending December 31,
(in thousands of $)
|
Methane
Princess Lease
|
||
|
2014
|
7,754
|
|
|
|
2015
|
8,055
|
|
|
|
2016
|
8,361
|
|
|
|
2017
|
8,676
|
|
|
|
2018
|
9,022
|
|
|
|
2019 and thereafter
|
183,564
|
|
|
|
Total minimum lease payments
|
225,432
|
|
|
|
Less: Imputed interest
|
(66,424
|
)
|
|
|
Present value of minimum lease payments
|
159,008
|
|
|
The Methane Princess Lease liability continues to increase until 2014 and thereafter decreases over the period to 2034, which is the end of the primary term of the lease. The interest element of the lease rentals is accrued at a floating rate based upon British Pound (GBP) LIBOR.
We determined that the entities that owned the vessels were variable interest entities in which we had a variable interest and was the primary beneficiary. Upon the initial transfer of the vessels to the financial institutions, we measured the subsequently leased vessels at the same amounts as if the transfer had not occurred, which was cost less accumulated depreciation at the time of transfer.
22. OTHER LONG-TERM LIABILITIES
|
(in thousands of $)
|
2013
|
2012
|
||||
|
Deferred credits from capital lease transactions
|
17,904
|
|
18,529
|
|
||
A-33
Deferred credits from capital lease transactions
|
(in thousands of $)
|
2013
|
2012
|
||||
|
Deferred credits from capital lease transactions
|
24,691
|
|
24,691
|
|
||
|
Less: Accumulated amortization
|
(6,162
|
)
|
(5,537
|
)
|
||
|
|
18,529
|
|
19,154
|
|
||
|
Short-term (see note 19)
|
625
|
|
625
|
|
||
|
Long-term
|
17,904
|
|
18,529
|
|
||
|
|
18,529
|
|
19,154
|
|
||
In connection with the Methane Princess Lease (see note 21), we recorded an amount representing the difference between the net cash proceeds received upon sale of the vessel and the present value of the minimum lease payments. The amortization of the deferred credit for the year is offset against depreciation and amortization expense in the statement of operations. The deferred credits represent the upfront benefits derived from undertaking finance in the form of a UK lease. The deferred credits are amortized over the remaining estimated useful economic life of the
Methane Princess
on a straight-line basis.
Amortization for each of the years ended December 31, 2013, 2012 and 2011 was $0.6 million.
A-34
23. FINANCIAL INSTRUMENTS
As discussed in note 2, in respect of the Combined Entity and Dropdown Predecessor, earnings for the years ended December 31, 2012 and 2011 include an allocation of Golar’s mark-to-market adjustments for interest rate swap and foreign currency swap derivatives and related foreign exchange gains and losses, captured within "other financial items, net" (see note 7). These amounts have been accounted for as an equity contribution.
Interest rate risk management
In certain situations, we may enter into financial instruments to reduce the risk associated with fluctuations in interest rates. we have entered into swaps that convert floating rate interest obligations to fixed rates, which from an economic perspective hedge the interest rate exposure. Certain interest rate swap agreements qualify and are designated, for accounting purposes, as cash flow hedges. We do not hold or issue instruments for speculative or trading purposes. The counterparties to such contracts are major banking and financial institutions. Credit risk exists to the extent that the counterparties are unable to perform under the contracts; however, we do not anticipate non-performance by any of our counterparties.
We manage our debt and capital lease portfolio with interest rate swap agreements in U.S. dollars to achieve an overall desired position of fixed and floating interest rates. We hedge account for certain of our interest rate swap arrangements designated as cash flow hedges. Accordingly, the net gains and losses have been reported in a separate component of accumulated other comprehensive income to the extent the hedges are effective. The amount recorded in accumulated other comprehensive income will subsequently be reclassified into earnings, within interest expense, in the same period as the hedged items affect earnings.
We have entered into the following interest rate swap transactions involving the payment of fixed rates in exchange for LIBOR:
|
|
Notional Amount
|
|
|
||||||||||
|
Instrument
(in thousands of $)
|
December 31, 2013
|
Maturity
Dates
|
Fixed Interest
Rate
|
||||||||||
|
Interest rate swaps:
|
|
|
|
|
|
||||||||
|
Receiving floating, pay fixed
|
1,224,800
|
|
(1)
|
2014
|
to
|
2020
|
0.92
|
%
|
to
|
6.49%
|
|||
(1) This includes the nominal value of the cross currency interest rate swap of $227.2 million described below.
As of December 31, 2012, our interest rate swaps had a total notional amount of $759.6 million with maturity dates between 2013 and 2018, and fixed interest rates ranging from 0.92% to 6.49%.
During the year ended December 31, 2013, we entered into new interest rate swaps with a notional value of $422.5 million. In addition, in connection with the acquisition of the
Golar Maria
in February 2013, we assumed
Golar Maria
's bank debt and the related interest rate swap with a notional value of $50 million. Interest rate swaps with a notional value of $100 million expired during the year ended December 31, 2013.
As of December 31, 2013 and 2012 the notional principal amount of the debt and capital lease obligations outstanding subject to such swap agreements was $1,224.8 million and $759.6 million, respectively.
The effect of cash flow hedging relationships relating to interest rate swap agreements on the statements of operations is as follows:
|
Derivatives designated as
hedging instruments
|
|
Effective
portion gain/(loss)
reclassified from
Accumulated Other
Comprehensive Loss
|
Ineffective Portion
|
|||||||||||||||||
|
(in thousands of $)
|
Location
|
2013
|
2012
|
2011
|
2013
|
2012
|
2011
|
|||||||||||||
|
Interest rate swaps
|
Other financial items, net
|
775
|
|
—
|
|
—
|
|
1,015
|
|
(409
|
)
|
(412
|
)
|
|||||||
The effect of cash flow hedging relationships relating to interest rate swap agreements excluding the cross currency interest rate swap on the other comprehensive income is as follows:
A-35
|
Derivatives designated as hedging instruments
|
Amount of gain/
(loss) recognized in
OCI on derivative
(effective portion)
|
||||||||
|
(in thousands of $)
|
2013
|
2012
|
2011
|
||||||
|
Interest rate swaps
|
5,515
|
|
1,113
|
|
934
|
|
|||
As of December 31, 2013, our accumulated other comprehensive income included $1.6 million of unrealized gains on interest rate swap agreements excluding the cross currency interest rate swap designated as cash flow hedges.
As of December 31, 2013, we do not expect any material amounts to be reclassified from accumulated other comprehensive income to earnings during the next twelve months.
Foreign currency risk
For the periods reported, the majority of the vessels’ gross earnings were receivable in U.S. dollars and the majority of our transactions, assets and liabilities were denominated in U.S. dollars, our functional currency. However, we incur expenditures in other currencies. Our capital lease obligation and related restricted cash deposit are denominated in British Pounds. There is a risk that currency fluctuations will have a negative effect on the value of our cash flows.
A net foreign exchange gain of $2.3 million, gain of $1.6 million and loss of $1.2 million arose in the years ended December 31, 2013, 2012 and 2011, respectively. The net foreign exchange gain of $2.3 million arose in the year ended December 31, 2013 as a result of the $7.1 million gain (2012: $5.6 million loss) on the retranslation of our capital lease obligations and the cash deposits securing those obligations offset by the $4.8 million loss (2012: $7.2 million gain) on the mark-to-market valuation on the Golar Winter currency swap. This swap was terminated and cash settled in June 2013 in connection with the termination of the Golar Winter lease. Further foreign exchange gains or losses will arise over time in relation to our remaining capital lease obligation as a result of exchange rate movements. Gains or losses will only be realized to the extent that monies are, or are required to be withdrawn or paid into the deposit securing our capital lease obligation or if the remaining lease is terminated.
We entered into the Golar Winter currency swap in connection with the lease arrangement in respect of the
Golar Winter
, the obligation in respect of which was denominated in GBP. In this transaction the restricted cash deposit, which secured the letter of credit given to the lessor to secure part of Golar’s obligations to the lessor, was much less than the obligation and therefore, unlike the Methane Princess Lease, did not provide a natural hedge. In order therefore, to hedge this exposure, we entered into a currency swap with a bank, who was also the lessor, to exchange GBP payment obligations into U.S. dollar payment obligations. The swap hedged the full amount of the GBP lease obligation. In June 2013, in connection with the termination of the lease financing arrangement in respect of the
Golar Winter
, the associated Golar Winter currency swap was also terminated.
As described in note 20, in October 2012, we issued Norwegian Kroner (NOK) denominated senior unsecured bonds. In order to hedge our exposure, we entered into a currency swap to exchange NOK payment obligations into U.S. dollar payment obligations as set out in the table below. The swap hedges the full amount of the NOK obligation. We have designated the currency swap as a cash flow hedge. Accordingly, the net gain (2012: loss) has been reported in a separate component of accumulated other comprehensive income to the extent the hedge is effective. The amount recorded in accumulated other comprehensive income will subsequently be reclassified into earnings in the same period as the hedged item affects earnings. As of December 31, 2013, we do not expect any material amounts to be reclassified from accumulated other comprehensive income to earnings during the next twelve months.
As of December 31, 2013 and 2012, we have foreign currency forward contracts as summarized below:
|
|
Notional Amount
|
|
Average forward
|
||||||||
|
Instrument
(in thousands)
|
Receiving in
foreign currency
|
Pay in USD
|
Maturity
Date
|
rate USD foreign
currency
|
|||||||
|
Currency rate swaps:
|
|
|
|
|
|
|
|
||||
|
Norwegian Kroner
|
(1)
|
1,300,000
|
|
227,193
|
|
2017
|
5.722
|
|
|||
(1) This pertains to the cross currency interest rate swap described below.
A-36
As of December 31, 2012, in addition to the foreign currency forward contract above, we had a currency swap relating to the Golar Winter lease (as described above). This swap had a notional amount of GBP 58.1 million (equivalent to $106.8 million), matures in 2032 and had an average forward rate of 1.838.
Cross currency interest rate swap
As described in note 20, we issued NOK denominated senior unsecured bonds. In order to hedge our exposure, we entered into a non-amortizing cross currency interest rate swap agreement. The swap hedges both the full redemption amount of the NOK obligation and the related quarterly interest payments. We designated the cross currency interest rate swap as a cash flow hedge. Accordingly, the net loss recognized in accumulated other comprehensive income is as follows:
|
Derivatives designated as hedging instruments
|
Amount of gain/
(loss) recognized in
OCI on derivative
(effective portion)
|
||||||||
|
(in thousands of $)
|
2013
|
2012
|
2011
|
||||||
|
Cross currency interest rate swap
|
1,080
|
|
(5,063
|
)
|
—
|
|
|||
As of December 31, 2013, our accumulated other comprehensive income included $4.0 million of unrealized losses on the cross currency interest rate swap designated as a cash flow hedge. There has been no ineffectiveness in any of the years presented.
Fair values
We recognize our fair value estimates using a fair value hierarchy based on the inputs used to measure fair value. The fair value hierarchy has three levels based on reliability of inputs used to determine fair value as follows:
Level 1: Quoted market prices in active markets for identical assets and liabilities.
Level 2: Observable market based inputs or unobservable inputs that are corroborated by market data.
Level 3: Unobservable inputs that are not corroborated by market data.
There have been no transfers between different levels in the fair value hierarchy during the year.
The carrying value and estimated fair value of our financial instruments at December 31, 2013 and 2012 are as follows:
|
(in thousands of $)
|
Fair Value
Hierarchy(1)
|
2013 Carrying Value
|
2013 Fair Value
|
2012 Carrying Value
|
2012 Fair Value
|
|||||||||
|
Non-Derivatives:
|
|
|
|
|
|
|
|
|
|
|||||
|
Cash and cash equivalents
|
Level 1
|
103,100
|
|
103,100
|
|
66,327
|
|
66,327
|
|
|||||
|
Restricted cash and short-term investments
|
Level 1
|
170,176
|
|
170,176
|
|
221,423
|
|
221,423
|
|
|||||
|
High-yield bonds(1)
|
Level 1
|
214,100
|
|
221,166
|
|
233,804
|
|
234,708
|
|
|||||
|
Long-term debt—floating(2)
|
Level 2
|
675,371
|
|
675,371
|
|
505,668
|
|
505,668
|
|
|||||
|
Obligations under capital leases(2)
|
Level 2
|
159,008
|
|
159,008
|
|
412,371
|
|
412,371
|
|
|||||
|
Derivatives:
|
|
|
|
|
|
|
|
|
|
|||||
|
Interest rate swaps asset(3)(4)
|
Level 2
|
5,335
|
|
5,335
|
|
—
|
|
—
|
|
|||||
|
Cross currency interest rate swap asset(3)(5)
|
Level 2
|
—
|
|
—
|
|
1,819
|
|
1,819
|
|
|||||
|
Interest rate swaps liability(3)(4)
|
Level 2
|
15,119
|
|
15,119
|
|
24,991
|
|
24,991
|
|
|||||
|
Cross currency interest rate swap liability(3)(5)
|
Level 2
|
16,804
|
|
16,804
|
|
—
|
|
—
|
|
|||||
|
Foreign currency swaps liability(3)
|
Level 2
|
—
|
|
—
|
|
20,527
|
|
20,527
|
|
|||||
|
(1)
|
This pertains to high-yield bonds with a carrying value of $214.1 million as of December 31, 2013 which is included under long-term debt on the balance sheet. The fair value of the high-yield bonds as of December 31, 2013 was $221.2 million (2012: $234.7 million), which represents 103.3% (2012: 100.5%) of its face value.
|
A-37
|
(2)
|
Our debt and capital lease obligations are recorded at amortized cost in the consolidated balance sheets.
|
|
(3)
|
Derivative liabilities are captured within other current liabilities and derivative assets are captured within long-term assets on the balance sheet.
|
|
(4)
|
The fair value/carrying value of interest rate swap agreements (excluding the cross currency interest rate swap described in footnote 5) that qualify and are designated as cash flow hedges as of December 31, 2013 and 2012 was $3.5 million (with a notional amount of $287.1 million) and $7.7 million (with a notional amount of $239.6 million), respectively. The expected maturity of these interest rate agreements is from June 2014 to March 2018.
|
|
(5)
|
We issued NOK denominated senior unsecured bonds. In order to hedge our exposure, we entered into a non-amortizing cross currency interest rate swap agreement. The swap hedges both the full redemption amount of the NOK obligation and the related quarterly interest payments. We designated the cross currency interest rate swap as a cash flow hedge. As of December 31, 2013 and 2012, the following are the details on the cross currency interest rate swap:
|
|
Instrument
(in thousands)
|
Notional amount
|
Maturity date
|
Rate
|
Fair value asset/(liability)
|
|||||
|
In NOK
|
In USD
|
||||||||
|
Cross currency interest rate swap
|
1,300,000
|
|
227,193
|
|
Oct 2017
|
6.485
|
%
|
(16,804
|
)
|
The following methods and assumptions were used to estimate the fair value of each class of financial instrument.
Certain methods and assumptions were used to estimate the fair value of each class of financial instruments. The carrying amounts of accounts receivables, accounts payables and accrued liabilities approximate fair values because of the short maturity of those instruments.
The carrying value of cash and cash equivalents, which are highly liquid, is a reasonable estimate of fair value.
The estimated fair value for restricted cash and short-term investments is considered to be equal to the carrying value since they are placed for periods of less than six months. The estimated fair value for long-term restricted cash is considered to be equal to the carrying value since it bears variable interest rates which are reset on a quarterly basis.
The estimated fair value of our high yield bonds is based on the quoted market price as of the balance sheet date.
The estimated fair value for floating long-term debt is considered to be equal to the carrying value since it bears variable interest rates, which are reset on a quarterly basis.
The estimated fair values of long-term lease obligations under capital leases are considered to be equal to the carrying value since they bear interest at rates, which are reset on a quarterly basis.
The fair value of our derivative instruments is the estimated amount that we would receive or pay to terminate the agreements at the reporting date, taking into account current interest rates, foreign exchange rates, and our credit worthiness and of our swap counterparty. The mark-to-market gain or loss on our interest rate and foreign currency swaps that are not designated as hedges for accounting purposes for the period is reported in the statement of operations caption "other financial items, net" (see note 7).
The credit exposure of interest rate swap agreements is represented by the fair value of contracts with a positive fair value at the end of each period, reduced by the effects of master netting agreements. It is our policy to enter into master netting agreements with the counterparties to derivative financial instrument contracts, which give us the right to discharge all or a portion of amounts owed to counterparty by offsetting them against amounts that the counterparty owes to us. Despite the master netting arrangements in place, as of December 31, 2013, the interest rate swap assets cannot be offset against the interest rate swap liabilities as these are with different counterparties.
The cross currency interest rate swap has a credit support arrangement that require us to provide cash collateral in the event that the market valuation drops below a certain level. Valuations are currently above these levels and there is no cash collateral that has been provided in the period.
The fair value measurement of a liability must reflect the non-performance risk of the entity. Therefore, the impact of our credit-worthiness has also been factored into the fair value measurement of the derivative instruments in a liability position.
The cash flows from economic hedges are classified in the same category as the cash flows from the items subject to the economic hedging relationship.
A-38
Concentrations of risk
The maximum exposure to credit risk is the carrying value of cash and cash equivalents, restricted cash and short-term investments, trade accounts receivable, other receivables and amounts due from related parties. There is a concentration of credit risk with respect to cash and cash equivalents, restricted cash and short-term investments to the extent that substantially all of the amounts are carried with Nordea Bank Finland Plc, Lloyds TSB Bank plc, Citibank, DNB Bank ASA, Santander UK plc, Sumitomo Mitsui Banking Corporation and Standard Chartered PLC. However, we believe this risk is remote.
During the year ended December 31, 2013, six customers accounted for all of our revenues. These revenues and associated accounts receivable are derived from two time charters with BG Group plc, one time charter with Pertamina, one time charter with DUSUP, two time charters with Petrobras, one time charter with PTNR and one time charter with Eni S.p.A. Pertamina is a state enterprise of the Republic of Indonesia. Credit risk is mitigated by the long-term contract with Pertamina being on a ship-or-pay basis, such that, our vessel hire charges are paid by the Trustee and Paying Agent from the immediate sale proceeds of the delivered gas. The Trustee must pay us, as the ship owner, before Pertamina. Further, the gas sales contracts are with the Chinese Petroleum Corporation. We consider the credit risk of BG Group plc, Petrobras, DUSUP, PTNR, Pertamina and Eni S.p.A to be low.
During the years ended December 31, 2013, 2012 and 2011, Petrobras accounted for more than 25% of gross revenue (see note 6). Details of revenues derived from each customer for the years ended December 31, 2013, 2012 and 2011 are found in note 6.
24. RELATED PARTY TRANSACTIONS
Historically, the Combined Entity and the Dropdown Predecessor were an integrated part of Golar. As such, the Bermudan and London office locations of Golar have provided general and corporate management services for the Combined Entity and Dropdown Predecessor as well as other Golar entities and operations. Consequently, for the purpose of the combined statement of operations this includes allocations for administrative expenses and other financial items as described in note 2 which are excluded from the disclosures below:
Net expenses from related parties:
|
(in thousands of $)
|
2013
|
2012
|
2011
|
||||||
|
Transactions with Golar and affiliates:
|
|
|
|
|
|
|
|||
|
Management and administrative services fees (a)
|
2,569
|
|
2,876
|
|
1,576
|
|
|||
|
Ship management fees (b)
|
6,701
|
|
4,222
|
|
4,146
|
|
|||
|
Interest expense on high-yield bonds (c)
|
1,972
|
|
575
|
|
—
|
|
|||
|
Interest expense on Golar LNG vendor financing loan -
Golar Freeze
(d)
|
—
|
|
11,921
|
|
3,085
|
|
|||
|
Interest expense on Golar LNG vendor financing loan -
NR Satu
(e)
|
—
|
|
4,737
|
|
—
|
|
|||
|
Interest expense on Golar Energy loan (f)
|
—
|
|
829
|
|
—
|
|
|||
|
Total
|
11,242
|
|
25,160
|
|
8,807
|
|
|||
Receivables (payables) from related parties:
As of December 31, 2013 and 2012, balances with related parties consisted of the following:
|
(in thousands of $)
|
2013
|
2012
|
||||
|
Trading balances due to Golar and affiliates (g)
|
(5,989
|
)
|
(546
|
)
|
||
|
Methane Princess Lease security deposit movements (h)
|
4,257
|
|
—
|
|
||
|
High-yield bonds (c)
|
—
|
|
(34,953
|
)
|
||
|
|
(1,732
|
)
|
(35,499
|
)
|
||
A-39
(a)
Management and administrative services agreement -
On March 30, 2011, we entered into a management and administrative services agreement with Golar Management, a wholly-owned subsidiary of Golar, pursuant to which Golar Management will provide to us certain management and administrative services. The services provided by Golar Management are charged at cost plus a management fee equal to 5% of Golar Management’s costs and expenses incurred in connection with providing these services. We may terminate the agreement by providing 120 days written notice.
(b)
Ship management fees
- Golar and certain of its affiliates charged ship management fees to us for the provision of technical and commercial management of the vessels. Each of our vessels is subject to management agreements pursuant to which certain commercial and technical management services are provided by certain affiliates of Golar, including Golar Management and Golar Wilhelmsen AS ("Golar Wilhelmsen"), a partnership that is jointly controlled by Golar and by Wilhelmsen Ship Management (Norway) AS.
(c)
High-yield bonds
- In October 2012, we completed the issuance of NOK1,300 million in senior unsecured bonds that mature in October 2017. The aggregate principal amount of the bonds is equivalent to approximately $227 million at the time of issuance. Of this amount, NOK200 million (2012: approximately $35.0 million) was held by Golar until their disposal in November 2013 (see note 20).
(d)
Golar LNG vendor financing loan - Golar Freeze
- In October 2011, in connection with the purchase of the
Golar Freeze
, we entered into a financing loan agreement with Golar for an amount of $222.3 million. The facility is unsecured and bears interest at a fixed rate of 6.75% per annum payable quarterly. The loan is non-amortizing with a final balloon payment of $222.3 million due in October 2014. The loan was repaid in October 2012 using the net proceeds from the bond issuance.
(e)
Golar LNG vendor financing loan - NR Satu
- In July 2012, in connection with the purchase of the
NR Satu
, we entered into a financing loan agreement with Golar for an amount of $175 million. Of this amount, $155 million was drawn down in July 2012. A further $20 million was available for draw down until July 2015. The facility is unsecured and bears interest at a fixed rate of 6.75% per annum payable quarterly. The loan is non-amortizing with a final balloon payment for the amount drawn down due within three years from the date of draw down. The loan was repaid in December 2012 using the proceeds from the NR Satu facility.
(f)
Golar Energy loan
- In January 2012, Golar LNG (Singapore) Pte. Ltd. ("Golar Singapore"), the subsidiary which holds the investment in PTGI, drew down $25 million on its loan agreement entered into in December 2011 with Golar LNG Energy Limited ("Golar Energy"). The loan was unsecured, repayable on demand and bore interest at the rate of 6.75% per annum payable on a quarterly basis. In connection with the acquisition of the subsidiaries that own and operate the
NR Satu
, all amounts payable to Golar Energy by the subsidiaries acquired by us, including Golar Singapore, were extinguished.
(g)
Trading balances -
Receivables and payables with Golar and its affiliates are comprised primarily of unpaid management fees, advisory and administrative services. In addition, certain receivables and payables arise when we pay an invoice on behalf of a related party and vice versa. Receivables and payables are generally settled quarterly in arrears. Trading balances due to Golar and its affiliates are unsecured, interest-free and intended to be settled in the ordinary course of business. They primarily relate to recharges for trading expenses paid on our behalf including ship management and administrative service fees due to Golar.
(h)
Methane Princess Lease security deposit movements
- This represents net advances to Golar since the IPO, which correspond with the net release of funds from the security deposits held relating to the Methane Princess Lease. This is in connection with the Methane Princess tax lease indemnity provided by Golar under the Omnibus Agreement (see below). Accordingly, these amounts held with Golar will be settled as part of the eventual termination of the Methane Princess Lease.
(i)
$20 million revolving credit facility
- On April 13, 2011, we entered into a $20 million revolving credit facility with Golar. The facility matures in April 2015 and is unsecured and interest-free. In May 2013, we drew down $20 million from the facility which we subsequently repaid in December 2013. As of December 31, 2013, we have an undrawn balance of $20 million available under this facility.
(j)
Dividends to China Petroleum Corporation
- During the years ended December 31, 2013, 2012 and 2011, Faraway Maritime Shipping Co., which is 60% owned by us and 40% owned by China Petroleum Corporation ("CPC"), paid total dividends to CPC of $10.6 million, $1.8 million and $2.4 million, respectively.
(k)
Acquisitions from Golar -
We acquired from Golar equity interests in certain subsidiaries which own or lease and operate the
NR Satu,
the
Golar Grand
and the
Golar Maria
. The acquisition of the first two vessels were concluded between entities under common control and, thus, the net assets acquired were recorded at historic book value. The acquisition of the
Golar Maria
was accounted for as a business combination (see note 10).
A-40
Our Board of Directors ("the Board") and the Conflicts Committee of the Board (the "Conflicts Committee") approved the purchase price and vendor financing loan (where applicable) for each transaction. The Conflicts Committee retained a financial advisor, DnB Nor Markets, to assist with its evaluation of the transaction. The details of each transaction are as follows:
|
2012
|
2011
|
||||||||
|
(in millions of $)
|
Golar Grand
|
NR Satu
|
Golar Freeze
|
||||||
|
Purchase consideration
|
176.8
|
|
388.0
|
|
231.3
|
|
|||
|
Less: Net assets acquired
|
|
|
|
|
|||||
|
- Vessel – historic book value
|
127.5
|
|
257.6
|
|
166.0
|
|
|||
|
- Capital lease obligation assumed (net of restricted cash)
|
(90.8
|
)
|
—
|
|
—
|
|
|||
|
- Loan debt assumed
|
—
|
|
—
|
|
(108.0
|
)
|
|||
|
- Other net assets (liabilities)
|
6.4
|
|
(1.9
|
)
|
7.5
|
|
|||
|
Total net assets acquired
|
(43.1
|
)
|
(255.7
|
)
|
(65.5
|
)
|
|||
|
Deduction to equity
|
133.7
|
|
132.3
|
|
165.8
|
|
|||
Golar Freeze
On October 19, 2011, we acquired Golar’s 100% ownership interest in certain subsidiaries which own and operate the
Golar Freeze
and hold the secured bank debt. The purchase consideration was $330 million for the vessel and $9 million of working capital adjustments net of the assumed bank debt of $108.0 million, resulting in total purchase consideration of approximately $231.3 million of which $222.3 million was financed by vendor financing in the form of the Golar LNG vendor financing loan, further described in paragraph (d) above.
NR Satu
On July 19, 2012, we acquired Golar’s equity interests in certain subsidiaries which own and operate the
NR Satu
. The purchase consideration was $385 million for the vessel and working capital adjustments of $3.0 million, resulting in total purchase consideration of approximately $388 million of which $230 million was financed from the proceeds of the July 2012 equity offering and $155 million vendor financing in the form of the Golar LNG vendor financing loan, further described in paragraph (e) above.
Golar Grand
On November 8, 2012, we acquired Golar's equity interests in subsidiaries which lease and operate the
Golar Grand
. The purchase consideration was $265 million for the vessel and working capital adjustments of $2.6 million, net of the assumed capital lease obligation of $90.8 million, resulting in total purchase consideration of $176.8 million which was principally financed from the proceeds of the November 2012 equity offering.
Golar Maria
In February 2013, we acquired Golar's 100% interest in the company that owns and operates the
Golar Maria
. The details of the transaction are omitted from the table above, as this was accounted for as a business combination (see note 10).
(l)
Payment due under Omnibus Agreement
- During the year, we incurred expenses of $3.3 million, which was indemnified by Golar as part of the Omnibus agreement. A receivable has been recognized for this amount.
(m)
Dividends to Golar
- Since our IPO in April 2011, we have declared and paid quarterly distributions totaling $63.7 million, $47.3 million and $19.1 million to Golar for each of the years ended December 31, 2013, 2012 and 2011, respectively.
Golar Grand option
In connection with the acquisition of the
Golar Grand
in November 2012, we entered into an Option Agreement with Golar. Under the Option Agreement, we have an option to require Golar to enter into a new time charter with Golar as charterer until October 2017 if the current charterer does not renew or extend the existing charter after the initial term (which expires in 2015).
A-41
Indemnifications and guarantees
Tax lease indemnifications
Under the Omnibus Agreement, Golar has agreed to indemnify us in the event of any liabilities in excess of scheduled or final settlement amounts arising from the
Methane Princess
leasing arrangement and the termination thereof.
In addition, Golar has agreed to indemnify us against any liabilities incurred as a consequence of a successful challenge by the UK Revenue Authorities with regard to the initial tax basis of the transactions in respect of the
Methane Princess
and other vessels previously financed by UK tax leases or in relation to the restructuring terminations in 2010.
Environmental and other indemnifications
Under the Omnibus Agreement, Golar has agreed to indemnify us until April 13, 2016, against certain environmental and toxic tort liabilities with respect to the assets that Golar contributed or sold to us to the extent arising prior to the time they were contributed or sold. However, claims are subject to a deductible of $0.5 million and an aggregate cap of $5 million.
In addition, pursuant to the Omnibus Agreement, Golar agreed to indemnify us for any defects in title to the assets contributed or sold to us and any failure to obtain, prior to April 13, 2011, certain consents and permits necessary to conduct our business, which liabilities arise within three years after the closing of our IPO on April 13, 2011.
Acquisition of Golar Freeze and NR Satu
Under the Purchase, Sale and Contribution Agreement entered into between Golar and us on October 19, 2011 and July 19, 2012, Golar has agreed to extend the above indemnifications to include any liabilities relating to the
Golar Freeze
and the
NR Satu
.
Acquisition of the Golar Maria
Under the Purchase, Sale and Contribution Agreement entered into between Golar and us on February 7, 2013, Golar has agreed to indemnify us against certain environmental and toxic tort liabilities with respect to the assets that Golar contributed or sold to us to the extent arising prior to the time they were contributed or sold and to the extent that we notify Golar within five years of February 7, 2013.
25. OTHER COMMITMENTS AND CONTINGENCIES
Assets pledged
|
(in thousands of $)
|
2013
|
2012
|
||||
|
Book value of vessels and equipment secured against long-term loans and capital leases
|
1,409,284
|
|
1,192,779
|
|
||
Other contractual commitments and contingencies
Insurance
We insure the legal liability risks for our shipping activities with Gard and Skuld, which are mutual protection and indemnity associations. As a member of a mutual association, we are subject to calls payable to the associations based on our claims record in addition to the claims records of all other members of the association. A contingent liability exists to the extent that the claims records of the members of the association in the aggregate show significant deterioration, which results in additional calls on the members.
A-42
Tax lease benefits
The benefits under lease financings are derived primarily from tax depreciation assumed to be available to lessors as a result of their investment in the vessels. If that tax depreciation ultimately proves not to be available to the lessors, or is recovered from the lessor as a result of adverse tax rate changes or rulings, or in the event we terminate one or more of our leases, we would be required to return all or a portion of, or in certain circumstances significantly more than the upfront cash benefits that we received, together with fees that were financed in connection with our lease financing transactions, post additional security or make additional payments to our lessors. As of December 31, 2013, we have one remaining UK tax lease (relating to the
Methane Princess
). A termination of this lease would realize the accrued currency gain or loss recorded against the lease liability, net of the restricted cash. As of December 31, 2013, there was a net accrued loss of approximately $0.3 million.
Golar has agreed to indemnify us against any liabilities incurred as a consequence of a successful challenge by the UK Revenue Authorities with regard to the initial tax basis of the transactions in respect of the remaining lease (including the other vessels previously financed by UK tax leases) or in relation to the restructuring terminations in 2010.
Legal proceedings and claims
We may, from time to time, be involved in legal proceedings and claims that arise in the ordinary course of business.
PT Golar Indonesia, our subsidiary that is both the owner and operator of the
NR Satu,
has been notified of a claim that may be filed against it by PT Rekayasa, a subcontractor of the charterer, PT Nusantara Regas, claiming that Golar and its subcontractor caused damage to the pipeline in connection with the FSRU conversion of the
NR Satu
and the related mooring. As of the current date, no suit has been filed and we are of the view that, were the claim to be filed with the Indonesian authorities, any resolution could potentially take years. We continue to believe we have meritorious defences against these claims, however, we are currently involved in compromise settlement discussions with the other parties. An estimate of the compromise settlement amount is between $2 million and $4.8 million. Accordingly, we have provided for a $2 million loss contingency (recorded in current liabilities), but have also recognized an asset for the same, on the basis that we consider it probable that this loss will be recoverable from our subcontractor, who is also a party to these settlement discussions. In addition, as part of the acquisition of
NR Satu
in July 2012, Golar has also agreed to indemnify us against any such non-recoverable losses.
A-43
26. EQUITY ISSUANCES
The following table summarizes the issuances of common and general partner units since our IPO in April 2011:
|
Date
|
Number of Common Units Issued
1
|
Offering Price
|
Gross Proceeds (in thousands of $)
2
|
Net Proceeds (in thousands of $)
|
Golar's Ownership after the Offering
3
|
Use of Proceeds
|
||||||||||||
|
July 2012
|
7,294,305
|
|
$
|
30.95
|
|
230,366
|
|
221,746
|
|
57.5
|
%
|
Acquisition of the
NR Satu
|
||||||
|
November 2012
|
5,824,590
|
|
$
|
30.50
|
|
181,275
|
|
180,105
|
|
54.1
|
%
|
Acquisition of the
Golar Grand
|
||||||
|
January 2013
|
4,316,947
|
|
$
|
29.74
|
|
131,006
|
|
130,244
|
|
50.9
|
%
|
Acquisition of the
Golar Maria
|
||||||
|
December 2013
|
5,100,000
|
|
$
|
29.10
|
|
151,439
|
|
150,342
|
|
41.4
|
%
|
Acquisition of the
Golar Igloo
|
||||||
1
Includes common units issued by us to Golar in a private placement made concurrent to the public offering of 969,305 common units, 1,524,590 common units and 416,947 common units in July 2012, November 2012 and January 2013, respectively. There was no private placement of common units to Golar in the December 2013 offering, however, 3,400,000 of our common units held by Golar were sold to the public in a secondary offering.
2
Includes General Partner's 2% proportionate capital contribution.
3
Includes Golar's 2% general partner interest in the Partnership.
The following table shows the movement in the number of common units, subordinated units and general partner units during the years ended December 31, 2013 and 2012:
|
(in units)
|
Common Units
|
Subordinated Units
|
GP Units
|
||||||
|
December 31, 2011
|
23,127,254
|
|
15,949,831
|
|
797,492
|
|
|||
|
July 2012 offerings
|
7,294,305
|
|
—
|
|
148,864
|
|
|||
|
November 2012 offerings
|
5,824,590
|
|
—
|
|
118,869
|
|
|||
|
December 31, 2012
|
36,246,149
|
|
15,949,831
|
|
1,065,225
|
|
|||
|
January 2013 offerings
|
4,316,947
|
|
—
|
|
88,101
|
|
|||
|
December 2013 offerings
|
5,100,000
|
|
—
|
|
104,082
|
|
|||
|
December 31, 2013
|
45,663,096
|
|
15,949,831
|
|
1,257,408
|
|
|||
27. EARNINGS PER UNIT AND CASH DISTRIBUTIONS
Earnings per unit have been calculated in accordance with the distribution guidelines set forth in the Partnership agreement and are determined by adjusting net income for the period by distributions made or to be made in relation to the period irrespective of the declaration and payment dates. The calculations of basic and diluted earnings per unit are presented below:
A-44
|
(in thousands of $ except unit and per unit data)
|
2013
|
2012
|
2011
|
||||||
|
Net income attributable to general partner and limited partner interests
|
141,296
|
|
116,418
|
|
85,534
|
|
|||
|
Less: Dropdown Predecessor net income
|
—
|
|
(28,015
|
)
|
(21,937
|
)
|
|||
|
Less: distributions paid (1)
|
(127,260
|
)
|
(87,072
|
)
|
(46,423
|
)
|
|||
|
Under distributed earnings
|
14,036
|
|
1,331
|
|
17,174
|
|
|||
|
Under distributed earnings attributable to:
|
|
|
|
|
|
|
|||
|
Common unit holders
|
6,649
|
|
1,304
|
|
16,829
|
|
|||
|
Weighted average units outstanding (basic and diluted) (in thousands):
|
|
|
|
|
|
|
|||
|
Common units
|
40,417
|
|
27,441
|
|
23,127
|
|
|||
|
Earnings per unit (basic and diluted):
|
|
|
|
|
|
|
|||
|
Common unit holders
|
2.31
|
|
2.08
|
|
1.89
|
|
|||
|
Cash distributions declared and paid in the period per unit (2):
|
2.05
|
|
1.78
|
|
0.73
|
|
|||
|
Subsequent event
: Cash distributions declared and paid per unit relating to the period (3)
|
0.52
|
|
0.50
|
|
0.43
|
|
|||
______________________________________________
(1)
This refers to distributions made or to be made in relation to the period irrespective of the declaration and payment dates and based on the number of units outstanding at the quarter end date. This also includes cash distributions to IDR holders for the years ended December 31, 2013, 2012 and 2011 of $4.9 million, $nil and $nil, respectively.
(2) Refers to cash distributions declared and paid during the period.
(3) Refers to cash distributions declared and paid subsequent to the period end.
As of December 31, 2013, of our total number of units outstanding, 59% (2012: 46%) were held by the public and the remaining units were held by Golar (including the general partner units representing a 2% interest).
Earnings per unit is determined by adjusting net income for the period by distributions made or to be made in relation to the period. Any earnings in excess of distributions are allocated to partnership units based upon the cash distribution guidelines in our First Amended and Restated Agreement of Limited Partnership (the “Partnership Agreement”). Any distributions in excess of earnings are allocated to partnership units based upon the allocation and distribution of amounts from partners’ capital accounts. The resulting earnings figure is divided by the weighted-average number of units outstanding during the period. For the periods presented prior to April 13, 2011, such units are deemed equal to the common and subordinated units received by Golar.
The General Partner’s, common unit holders’ and subordinated unit holder’s interests in net income are calculated as if all net income was distributed according to the terms of the Partnership Agreement, regardless of whether those earnings would or could be distributed. The Partnership Agreement does not provide for the distribution of net income; rather, it provides for the distribution of available cash, which is a contractually defined term that generally means all cash on hand at the end of the quarter after establishment of cash reserves determined by our board of directors to provide for the proper conduct of our business including reserves for maintenance and replacement capital expenditure and anticipated credit needs. In addition, the General Partner and Golar Energy are entitled to incentive distributions if the amount we distribute to unit holders with respect to any quarter exceeds specified target levels. Unlike available cash, net income is affected by non-cash items, such as depreciation and amortization, unrealized gains or losses on non-designated derivative instruments and foreign currency translation gains (losses).
Under the Partnership Agreement, during the subordination period, the common units will have the right to receive distributions of available cash from operating surplus in an amount equal to the minimum quarterly distribution of $0.3850 per unit per quarter, plus any arrearages in the payment of minimum quarterly distribution on the common units from prior quarters, before any distributions of available cash from operating surplus may be made on the subordinated units.
The amount of the minimum quarterly distribution is $0.3850 per unit or $1.54 unit per unit on an annualized basis and is made in the following manner, during the subordination period:
|
•
|
First, 98% to the common unit holders, pro rata, and 2% to the General Partner until each common unit has received a minimum quarterly distribution of $0.3850;
|
|
•
|
Second, 98% to the common unit holders, pro rata, and 2% to the General Partner, until each common unit has received an amount equal to any arrearages in payment of the minimum quarterly distribution on the common units for prior quarters during the subordination period; and
|
A-45
|
•
|
Third, 98% to the holders of subordinated units, pro rata, and 2% to the General Partner until each subordinated unit has received a minimum quarterly distribution of $0.3850.
|
In addition, the General Partner and Golar Energy currently hold all of the incentive distribution rights in the Partnership. Incentive distribution rights represent the right to receive an increasing percentage of quarterly distributions of available cash from operating surplus after the minimum quarterly distribution and the target distribution levels have been achieved.
If for any quarter:
|
•
|
we have distributed available cash from operating surplus to the common and subordinated unit holders in an amount equal to the minimum quarterly distribution; and
|
|
•
|
we have distributed available cash from operating surplus on outstanding common units in an amount necessary to eliminate any cumulative arrearages in payment of the minimum quarterly distribution;
|
then, we will distribute any additional available cash from operating surplus for that quarter among the unit holders and the General Partner in the following manner:
|
•
|
first
, 98.0% to all unit holders, pro rata, and 2.0% to the General Partner, until each unit holder receives a total of $0.4428 per unit for that quarter (the “first target distribution”);
|
|
•
|
second
, 85.0% to all unit holders, pro rata, 2.0% to the General Partner and 13.0% to the holders of the incentive distribution rights, pro rata, until each unit holder receives a total of $0.4813 per unit for that quarter (the “second target distribution”);
|
|
•
|
third
, 75.0% to all unit holders, pro rata, 2.0% to the General Partner and 23.0% to the holders of the incentive distribution rights, pro rata, until each unit holder receives a total of $0.5775 per unit for that quarter (the “third target distribution”); and
|
|
•
|
thereafter
, 50.0% to all unit holders, pro rata, 2.0% to the General Partner and 48.0% to the holders of the incentive distribution rights, pro rata.
|
In each case, the amount of the target distribution set forth above is exclusive of any distributions to common unit holders to eliminate any cumulative arrearages in payment of the minimum quarterly distribution. The percentage interests set forth above assume that the General Partner maintains its 2.0% general partner interest and that we do not issue additional classes of equity securities.
28. SUBSEQUENT EVENTS
In February 2014, we paid a cash distribution of $0.5225 per unit in respect of the three months ended December 31, 2013.
In March 2014, we completed our acquisition of interests in the company that owns and operates the FSRU, the
Golar Igloo
(see note 29).
In April 2014, we declared a cash distribution of $0.5225 per unit in respect of the three months ended March 31, 2014.
29. ACQUISITION AFTER BALANCE SHEET DATE
In March 2014, we acquired Golar's 100% interest in the company that owns and operates the
Golar Igloo
pursuant to a Purchase, Sale and Contribution Agreement that we entered into with Golar on December 5, 2013
.
The purchase consideration was $310.0 million for the vessel (including charter) less the assumed bank debt of $161.3 million plus the fair value of the interest rate swap asset of $3.3 million and other purchase price adjustments. The
Golar Igloo
was delivered to its current charterer, Kuwait National Petroleum Company ("KNPC"), the national oil refining company of Kuwait in March 2014 under a charter expiring in December 2018. The acquisition of the
Golar Igloo
is expected to be accretive to our distributions.
We accounted for the acquisition of the
Golar Igloo
as a business combination. The purchase price of the acquisition has been allocated to the identifiable assets acquired. We are in the process of finalizing the accounting for the acquisition and amounts shown below are provisional. Additional business combination disclosures will be presented in our next available interim report.
The allocation of the purchase price to acquired identifiable assets was based on their estimated fair values at the date of acquisition. The provisional fair values allocated to each class of identifiable assets of
Golar Igloo
and the difference between the purchase price and net assets acquired was calculated as follows:
|
(in thousands of $)
|
March 28, 2014
|
|
|||
|
Purchase consideration
|
(1)
|
152,059
|
|
||
|
Less: Fair value of net assets (liabilities) acquired:
|
|||||
|
Vessel including allocation to charter (if applicable)
|
310,000
|
|
|||
|
Fair value of interest rate swap
|
3,329
|
|
|||
|
Long-term debt
|
(161,270
|
)
|
|||
|
Others
|
—
|
|
(2)
|
||
|
Subtotal
|
(152,059
|
)
|
|||
|
Difference between the purchase price and fair value of net assets acquired
|
—
|
|
|||
(1) This includes the purchase consideration for the vessel less the fair value of the assumed bank debt plus fair value of the interest rate swap asset but excludes any working capital adjustments which will be available upon finalization of the results of the
Golar Igloo
for the first quarter of 2014.
(2) This information will be available upon finalization of the results of the
Golar Igloo
for the first quarter of 2014.
A-46
TABLE OF CONTENTS
Part IItem 1. Identity Of Directors, Senior Management and AdvisorsItem 2. Offer Statistics and Expected TimetableItem 3. Key InformationItem 4. Information on The CompanyItem 4A. Unresolved Staff CommentsItem 5. Operating and Financial Review and ProspectsItem 6. Directors, Senior Management and EmployeesItem 7. Major Shareholders and Related Party TransactionsItem 8. Financial InformationItem 9. The Offer and ListingItem 10. Additional InformationItem 11. Quantitative and Qualitative Disclosures About Market RiskItem 12. Description Of Securities Other Than Equity SecuritiesItem 13. Defaults, Dividend Arrearages and DelinquenciesItem 14. Material Modifications To The Rights Of Security Holders and Use Of ProceedsItem 15. Controls and ProcedureItem 16A. Audit Committee Financial ExpertItem 16B. Code Of EthicsItem 16C. Principal Accountant Fees and ServicesItem 16D. Exemptions From The Listing Standards For Audit CommitteesItem 16E. Purchases Of Equity Securities By The Issuer and Affiliated PurchasersItem 16F. Change in Registrant's Certifying AccountantItem 16G. Corporate GovernanceItem 16H. Mine Safety DisclosureItem 17. Financial StatementsItem 18. Financial StatementsItem 19. Exhibits