UNITED STATES
SECURITIES AND EXCHANGE COMMISSION
Washington, D.C. 20549
FORM 20-F
(Mark One)
|
[ ]
|
REGISTRATION STATEMENT PURSUANT TO SECTION 12(b) OR (g)
OF THE SECURITIES EXCHANGE ACT OF 1934
|
|
OR
|
|
[X]
|
ANNUAL REPORT PURSUANT TO SECTION 13 OR 15(d) OF THE SECURITIES EXCHANGE ACT OF 1934
|
|
For the fiscal year ended
|
December 31, 2018
|
|
|
OR
|
|
[ ]
|
TRANSITION REPORT PURSUANT TO SECTION 13 OR 15(d) OF THE SECURITIES EXCHANGE ACT OF 1934
|
|
For the transition period from
|
|
to
|
|
|
OR
|
|
[ ]
|
SHELL COMPANY REPORT PURSUANT TO SECTION 13 OR 15(d) OF THE SECURITIES EXCHANGE ACT OF 1934
|
|
Date of event requiring this shell company report
|
|
|
Commission file number
|
000-50113
|
|
|
Golar LNG Limited
|
|
(Exact name of Registrant as specified in its charter)
|
|
|
|
(Translation of Registrant's name into English)
|
|
|
|
Bermuda
|
|
(Jurisdiction of incorporation or organization)
|
|
|
|
2nd Floor, S.E. Pearman Building, 9 Par-la-Ville Road, Hamilton HM 11, Bermuda
|
|
(Address of principal executive offices)
|
|
|
Michael Ashford, (1) 441 295 4705
2nd Floor, S.E. Pearman Building, 9 Par-la-Ville Road, Hamilton HM 11, Bermuda
|
|
||
(Name, Telephone, E-mail and/or Facsimile number and Address of Company Contact Person)
Securities registered or to be registered pursuant to section 12(b) of the Act.
|
Title of each class
|
Name of each exchange
on which registered
|
|
Common Shares, par value, $1.00 per share
|
Nasdaq Global Select Market
|
Securities registered or to be registered pursuant to section 12(g) of the Act.
|
None
|
|
(Title of class)
|
Securities for which there is a reporting obligation pursuant to Section 15(d) of the Act.
|
None
|
|
(Title of class)
|
Indicate the number of outstanding shares of each of the issuer's classes of capital or common stock as of the close of the period covered by the annual report.
|
101,302,404 Common Shares, par $1.00, per share
|
Indicate by check mark if the registrant is a well-known seasoned issuer, as defined in Rule 405 of the Securities Act.
|
Yes
|
X
|
No
|
|
If this report is an annual or transition report, indicate by check mark if the registrant is not required to file reports pursuant to Section 13 of 15(d) of the Securities Exchange Act 1934.
|
Yes
|
|
No
|
X
|
Note- Checking the box above will not relieve any registrant required to file reports pursuant to Section 13 or 15(d) of the Securities Exchange Act of 1934 from their obligations under those Sections.
Indicate by check mark whether the registrant (1) has filed all reports required to be filed by Section 13 or 15(d) of the Securities Exchange Act of 1934 during the preceding 12 months (or for such shorter period that the registrant was required to file such reports), and (2) has been subject to such filing requirements for the past 90 days.
|
Yes
|
X
|
No
|
|
Indicate by check mark whether the registrant has submitted electronically every Interactive Data File required to be submitted pursuant to Rule 405 of Regulation S-T (§232.405 of this chapter) during the preceding 12 months (or for such shorter period that the registrant was required to submit such files).
|
Yes
|
X
|
No
|
|
Indicate by check mark whether the registrant is a large accelerated filer, an accelerated filer, or a non-accelerated filer. See definition of "accelerated filer and large accelerated filer" in Rule 12b-2 of the Exchange Act. (Check one).
|
Large accelerated filer
|
X
|
Accelerated filer
|
|
Non-accelerated filer
|
Emerging growth company
|
||
If an emerging growth company that prepares its financial statements in accordance with U.S. GAAP, indicate by check mark if the registrant has elected not to use the extended transition period for complying with any new or revised financial accounting standards† provided pursuant to Section 13(a) of the Exchange Act.
† The term “new or revised financial accounting standard” refers to any update issued by the Financial Accounting Standards Board to its Accounting Standards Codification after April 5, 2012.
Indicate by check mark which basis of accounting the registrant has used to prepare the financial statements included in this filing:
|
U.S. GAAP
|
X
|
International Financial Reporting Standards as issued by the International Accounting
Standards Board
|
|
Other
|
|
If "Other" has been checked in response to the previous question, indicate by check mark which financial statement item the registrant has elected to follow.
|
Item 17
|
|
Item 18
|
|
||
If this is an annual report, indicate by check mark whether the registrant is a shell company (as defined in Rule 12b-2 of the Exchange Act).
|
Yes
|
|
|
No
|
X
|
|
(APPLICABLE ONLY TO ISSUERS INVOLVED IN BANKRUPTCY PROCEEDINGS DURING THE PAST FIVE YEARS)
Indicate by check mark whether the registrant has filed all documents and reports required to be filed by Sections 12, 13 or 15(d) of the Securities Exchange Act of 1934 subsequent to the distribution of securities under a plan confirmed by a court.
|
Yes
|
|
No
|
|
INDEX TO REPORT ON FORM 20-F
|
PART I
|
|
PAGE
|
|
|
|
|
|
ITEM 1.
|
||
|
|
|
|
|
ITEM 2.
|
||
|
|
|
|
|
ITEM 3.
|
||
|
|
|
|
|
ITEM 4.
|
||
|
|
|
|
|
ITEM 4A.
|
||
|
|
|
|
|
ITEM 5.
|
||
|
|
|
|
|
ITEM 6.
|
||
|
|
|
|
|
ITEM 7.
|
||
|
|
|
|
|
ITEM 8.
|
||
|
|
|
|
|
ITEM 9.
|
||
|
|
|
|
|
ITEM 10.
|
||
|
|
|
|
|
ITEM 11.
|
||
|
|
|
|
|
ITEM 12.
|
||
|
|
|
|
|
PART II
|
|
|
|
|
|
|
|
ITEM 13.
|
||
|
|
|
|
|
ITEM 14.
|
||
|
|
|
|
|
ITEM 15.
|
||
|
|
|
|
|
ITEM 16A.
|
||
|
|
|
|
|
ITEM 16B.
|
||
|
|
|
|
|
ITEM 16C.
|
||
|
|
|
|
|
ITEM 16D.
|
||
|
|
|
|
|
ITEM 16E.
|
||
|
|
|
|
|
ITEM 16F.
|
||
|
|
|
|
|
ITEM 16G.
|
||
|
|
|
|
|
ITEM 16H.
|
||
|
|
|
|
|
PART III
|
|
|
|
|
|
|
|
ITEM 17.
|
||
|
|
|
|
|
ITEM 18.
|
||
|
|
|
|
|
ITEM 19.
|
||
|
|
|
|
CAUTIONARY STATEMENT REGARDING FORWARD-LOOKING STATEMENTS
Matters discussed in this report may constitute forward-looking statements. The Private Securities Litigation Reform Act of 1995 provides safe harbor protections for forward-looking statements in order to encourage companies to provide prospective information about their business. Forward-looking statements include statements concerning plans, objectives, goals, strategies, future events or performance, and underlying assumptions and other statements, which are other than statements of historical facts.
We desire to take advantage of the safe harbor provisions of the Private Securities Litigation Reform Act of 1995 and are including this cautionary statement in connection with this safe harbor legislation. This report and any other written or oral statements made by us or on our behalf may include forward-looking statements, which reflect our current views with respect to future events and financial performance. When used in this report, the words "believe," "anticipate," "intend," "estimate," "forecast," "project," "plan," "potential," "will," "may," "should," "expect" and similar expressions identify forward-looking statements.
The forward-looking statements in this report are based upon various assumptions, many of which are based, in turn, upon further assumptions, including without limitation, management's examination of historical operating trends, data contained in our records and other data available from third parties. Although we believe that these assumptions were reasonable when made, because these assumptions are inherently subject to significant uncertainties and contingencies which are difficult or impossible to predict and are beyond our control, we cannot assure you that we will achieve or accomplish these expectations, beliefs or projections. As a result, you are cautioned not to rely on any forward-looking statements.
In addition to these important factors and matters discussed elsewhere herein, important factors that, in our view, could cause actual results to differ materially from those discussed in the forward-looking statements include among other things:
|
•
|
our inability and that of our counterparty to meet our respective obligations under the Lease and Operate Agreement entered into in connection with the BP Greater Tortue Ahmeyim project;
|
|
•
|
changes in liquefied natural gas, or LNG, carrier, floating storage and regasification unit, or FSRU, or floating liquefaction natural gas vessel, or FLNG, or small-scale LNG market trends, including charter rates, vessel values or technological advancements;
|
|
•
|
Golar Power Limited's ("Golar Power") ability to successfully complete and start up the Sergipe power station project and related FSRU contract;
|
|
•
|
changes in our ability to retrofit vessels as FSRUs or FLNGs and in our ability to obtain financing for such conversions on acceptable terms or at all;
|
|
•
|
our ability to close potential future sales of additional equity interests in
Golar Hilli LLC on a timely basis or at all;
|
|
•
|
changes in the supply of or demand for LNG carriers, FSRUs, FLNGs or small-scale LNG infrastructure;
|
|
•
|
a material decline or prolonged weakness in rates for LNG carriers, FSRUs, FLNGs or small-scale LNG infrastructure;
|
|
•
|
changes in the performance of the pool in which certain of our vessels operate and the performance of our joint ventures, including changes related to potential divestitures, spin-offs or new partnerships;
|
|
•
|
changes in trading patterns that affect the opportunities for the profitable operation of LNG carriers, FSRUs, FLNGs or small-scale LNG infrastructure;
|
|
•
|
changes in the supply of or demand for LNG or LNG carried by sea;
|
|
•
|
changes in commodity prices;
|
|
•
|
changes in the supply of or demand for natural gas generally or in particular regions;
|
|
•
|
failure of our contract counterparties, including our joint venture co-owners, to comply with their agreements with us;
|
|
•
|
changes in our relationships with our counterparties, including our major chartering parties;
|
|
•
|
challenges by authorities to the tax benefits we previously obtained under certain of our leasing agreements;
|
|
•
|
a decline or continuing weakness in the global financial markets;
|
|
•
|
changes in general domestic and international political conditions, particularly where we operate;
|
|
•
|
changes in the availability of vessels to purchase and in the time it takes to construct new vessels;
|
|
•
|
failures of shipyards to comply with delivery schedules or performance specifications on a timely basis or at all;
|
|
•
|
our ability to integrate and realize the benefits of our investments and acquisitions;
|
|
•
|
changes in our ability to sell vessels to Golar LNG Partners LP ("Golar Partners") or Golar Power;
|
|
•
|
changes in our relationship with Golar Partners, Golar Power or Avenir LNG Limited ("Avenir") and the sustainability of any distributions they may pay to us;
|
|
•
|
changes to rules and regulations applicable to LNG carriers, FSRUs, FLNGs or other parts of the LNG supply chain;
|
|
•
|
actions taken by regulatory authorities that may prohibit the access of LNG carriers, FSRUs, FLNGs or small-scale LNG vessels to various ports;
|
|
•
|
changes in our ability to obtain additional financing on acceptable terms or at all;
|
|
•
|
increases in costs, including, among other things, crew wages, insurance, provisions, repairs and maintenance; and
|
|
•
|
other factors listed from time to time in registration statements, reports or other materials that we have filed with or furnished to the Securities and Exchange Commission, or the Commission.
|
Please see our Risk Factors in Item 3 of this report for a more complete discussion of these and other risks and uncertainties.
We caution readers of this report not to place undue reliance on these forward-looking statements, which speak only as of their dates. These forward-looking statements are not guarantees of our future performance, and actual results and future developments may vary materially from those projected in the forward-looking statements.
We undertake no obligation to publicly update or revise any forward-looking statements, except as required by law. If one or more forward-looking statements are updated, no inference should be drawn that additional updates will be made.
Not applicable.
Not applicable.
Throughout this report, unless the context indicates otherwise, the "Company," "Golar," "Golar LNG," "we," "us," and "our" all refer to Golar LNG Limited or any one or more of its consolidated subsidiaries, including Golar Management Limited, or Golar Management, or to all such entities. References in this Annual Report to "Golar Partners" or the "Partnership" refer, depending on the context, to our affiliate Golar LNG Partners LP (Nasdaq: GMLP) and to any one or more of its subsidiaries. References to "Golar Power" refer to our affiliate Golar Power Limited and to any one or more of its subsidiaries. References to "OneLNG" refer to our joint venture OneLNG S.A. and to any one or more of its subsidiaries. References to "Avenir" refer to our affiliate Avenir LNG Limited (Norwegian OTC: AVENIR) and to any one or more of its subsidiaries. Unless otherwise indicated, all references to "USD" and "$" in this report are to U.S. dollars.
A. Selected Financial Data
The following selected consolidated financial and other data, which includes our fleet and other operating data, summarizes our historical consolidated financial information. We derived the statements of income (loss) data for each of the years in the three-year period ended
December 31, 2018
and the balance sheet data as of
December 31, 2018
and
2017
from our audited consolidated financial statements included in Item 18 of this Annual Report on Form 20-F, which were prepared in accordance with accounting principles generally accepted in the United States of America, or U.S. GAAP.
The selected statements of income (loss) data with respect to the years ended December 31, 2015 and 2014 and the selected balance sheet data as of December 31, 2016, 2015 and 2014 have been derived from our audited consolidated financial statements prepared in accordance with U.S. GAAP not included herein.
1
The following table should also be read in conjunction with the section of this Annual Report entitled "Item 5. Operating and Financial Review and Prospects" and our consolidated financial statements and notes thereto included herein.
|
|
|||||||||||||||
|
|
Years Ended December 31,
|
||||||||||||||
|
|
2018
|
2017
|
2016
|
2015
|
2014
|
||||||||||
|
|
(in thousands of U.S. $, except number of shares, per common share data, fleet data and other financial data)
|
||||||||||||||
|
Statements of Income Data:
|
|||||||||||||||
|
Total operating revenues
|
430,604
|
|
143,537
|
|
80,257
|
|
102,674
|
|
106,155
|
|
|||||
|
Vessel operating expenses
|
96,860
|
|
55,946
|
|
53,163
|
|
56,347
|
|
49,570
|
|
|||||
|
Voyage, charterhire and commission expenses (including collaborative arrangement)
|
105,826
|
|
61,292
|
|
47,563
|
|
69,042
|
|
27,340
|
|
|||||
|
Total operating expenses
|
369,607
|
|
244,094
|
|
221,364
|
|
234,604
|
|
146,488
|
|
|||||
|
Operating income (loss)
|
114,486
|
|
(85,457
|
)
|
(141,091
|
)
|
(36,380
|
)
|
(2,116
|
)
|
|||||
|
Net financial expense
|
(123,797
|
)
|
(32,788
|
)
|
(59,541
|
)
|
(174,619
|
)
|
(87,852
|
)
|
|||||
|
Equity in net (losses) earnings of affiliates
|
(157,636
|
)
|
(25,448
|
)
|
47,878
|
|
55,985
|
|
42,220
|
|
|||||
|
Net loss attributable to the stockholders of Golar LNG Limited
|
(231,428
|
)
|
(179,703
|
)
|
(186,531
|
)
|
(171,146
|
)
|
(48,017
|
)
|
|||||
|
Loss per common share
|
|||||||||||||||
|
- basic
(1)
|
(2.30
|
)
|
(1.79
|
)
|
(1.99
|
)
|
(1.83
|
)
|
(0.55
|
)
|
|||||
|
- diluted
(1)
|
(2.30
|
)
|
(1.79
|
)
|
(1.99
|
)
|
(1.83
|
)
|
(0.55
|
)
|
|||||
|
Cash dividends declared and paid per common share
|
0.28
|
|
0.20
|
|
0.60
|
|
1.35
|
|
1.80
|
|
|||||
|
|
|||||||||||||||
|
Balance Sheet Data (as of end of year):
|
|||||||||||||||
|
Cash and cash equivalents
|
217,835
|
|
214,862
|
|
224,190
|
|
105,235
|
|
191,410
|
|
|||||
|
Restricted cash and short-term deposits
(2)
|
332,033
|
|
222,265
|
|
183,693
|
|
231,821
|
|
74,162
|
|
|||||
|
Non-current restricted cash
(2)
|
154,393
|
|
175,550
|
|
232,335
|
|
180,361
|
|
425
|
|
|||||
|
Investments in affiliates
|
571,782
|
|
703,225
|
|
648,780
|
|
541,565
|
|
746,263
|
|
|||||
|
Asset under development
|
20,000
|
|
1,177,489
|
|
731,993
|
|
501,022
|
|
345,205
|
|
|||||
|
Vessels and equipment, net
|
3,271,379
|
|
2,077,059
|
|
2,153,831
|
|
2,598,771
|
|
1,648,888
|
|
|||||
|
Total assets
|
4,806,595
|
|
4,764,287
|
|
4,256,911
|
|
4,269,198
|
|
3,899,742
|
|
|||||
|
Current portion of long-term debt and short-term debt
|
730,257
|
|
1,384,933
|
|
451,454
|
|
693,123
|
|
112,853
|
|
|||||
|
Long-term debt
|
1,835,102
|
|
1,025,914
|
|
1,525,744
|
|
1,342,084
|
|
1,241,133
|
|
|||||
|
Total equity
|
1,825,791
|
|
1,796,304
|
|
1,909,826
|
|
1,916,179
|
|
2,237,422
|
|
|||||
|
Common shares outstanding
(1)
(in thousands)
|
101,303
|
|
101,119
|
|
101,081
|
|
93,547
|
|
93,415
|
|
|||||
|
Cash Flow Data:
|
|||||||||||||||
|
Net cash provided by (used in) operating activities
|
116,674
|
|
(35,089
|
)
|
(115,387
|
)
|
(92,458
|
)
|
4,922
|
|
|||||
|
Net cash (used in) provided by investing activities
|
(202,492
|
)
|
(419,895
|
)
|
3,852
|
|
(202,893
|
)
|
(1,361,275
|
)
|
|||||
|
Net cash provided by financing activities
|
177,402
|
|
427,443
|
|
234,336
|
|
546,770
|
|
1,470,460
|
|
|||||
|
Fleet Data:
|
|||||||||||||||
|
Number of vessels at end of year
|
14
|
|
14
|
|
14
|
|
17
|
|
13
|
|
|||||
|
Total operating days for fleet
(3)
|
4,202
|
|
3,885
|
|
4,034
|
|
4,481
|
|
2,059
|
|
|||||
|
Other Financial Data:
|
|||||||||||||||
|
Average daily time charter equivalent earnings, or TCE
(4)
(to the closest $100)
|
$
|
43,700
|
|
$
|
17,500
|
|
$
|
10,100
|
|
$
|
14,900
|
|
$
|
33,100
|
|
|
Average daily vessel operating costs
(5)
|
$
|
18,955
|
|
$
|
11,374
|
|
$
|
10,359
|
|
$
|
11,783
|
|
$
|
23,240
|
|
Footnotes
(1) Basic loss per share is calculated based on the income available to common shareholders and the weighted average number of our common shares outstanding. Treasury shares are not included in this calculation. The calculation of diluted loss per share assumes the conversion of potentially dilutive instruments.
2
(2) Restricted cash consists of bank deposits, which may only be used to settle certain pre-arranged loans or lease payments or deposits made in accordance with our contractual obligations under our equity swap facilities, letter of credit facilities in connection with our tolling agreement, and bid or performance bonds for projects we may enter. Short-term deposits represents highly liquid deposits placed with financial institutions, primarily from our consolidated VIEs, which are readily convertible into known amounts of cash with original maturities of less than 12 months.
(3) The total operating days for our fleet is the total number of days in a given period that our vessels were in our possession less the total number of days off-hire. We define days off-hire as days lost to, among other things, operational deficiencies, drydocking for repairs, maintenance or inspection, scheduled lay-up, vessel conversions, equipment breakdowns, special surveys and vessel upgrades, delays due to accidents, crewing strikes, certain vessel detentions or similar problems, or our failure to maintain the vessel in compliance with its specifications and contractual standards or to provide the required crew, or periods of commercial waiting time during which we do not earn charter hire.
(4)
Non-U.S. GAAP Financial Measure
: The average TCE rate of our fleet is a measure of the average daily revenue performance of a vessel. TCE is calculated only in relation to our vessel operations segment. For time charters, TCE is calculated by dividing total operating revenues (including revenue from the Cool Pool, but excluding liquefaction services revenue and vessel and other management fees), less any voyage and commission expenses, by the number of calendar days minus days for scheduled off-hire. Under a time charter, the charterer pays substantially all of the vessel voyage related expenses. However, we may incur voyage related expenses when positioning or repositioning vessels before or after the period of a time charter, during periods of commercial waiting time or while off-hire during drydocking. TCE rate is a standard shipping industry performance measure used primarily to compare period-to-period changes in an entity's performance despite changes in the mix of charter types (i.e. spot charters, time charters and bareboat charters) under which the vessels may be employed between the periods. We include average daily TCE, a non-U.S. GAAP measure, as we believe it provides additional meaningful information in conjunction with total operating revenues, the most directly comparable U.S. GAAP measure, because it assists our management in making decisions regarding the deployment and use of its vessels and in evaluating their financial performance. Our calculation of TCE may not be comparable to that reported by other entities. The following table reconciles our total operating revenues to average daily TCE:
|
|
Years Ended December 31,
|
||||||||||
|
|
2018
|
|
2017
|
|
2016
|
|
2015
|
|
2014
|
|
|
|
|
(in thousands of U.S. $, except number of shares, per common share data, fleet and other financial data)
|
||||||||||
|
Total operating revenues
|
430,604
|
|
143,537
|
|
80,257
|
|
102,674
|
|
106,155
|
|
|
|
Less: Liquefaction services revenue
|
(127,625
|
)
|
—
|
|
—
|
|
—
|
|
—
|
|
|
|
Less: Vessel and other management fees
|
(24,209
|
)
|
(26,576
|
)
|
(14,225
|
)
|
(12,547
|
)
|
(10,756
|
)
|
|
|
Net time and voyage charter revenues
|
278,770
|
|
116,961
|
|
66,032
|
|
90,127
|
|
95,399
|
|
|
|
Voyage and commission expenses
(i)
|
(104,463
|
)
|
(48,933
|
)
|
(25,291
|
)
|
(23,434
|
)
|
(27,340
|
)
|
|
|
|
174,307
|
|
68,028
|
|
40,741
|
|
66,693
|
|
68,059
|
|
|
|
Calendar days less scheduled off-hire days
(ii)
|
3,987
|
|
3,885
|
|
4,034
|
|
4,481
|
|
2,059
|
|
|
|
Average daily TCE rate (to the closest $100)
|
43,700
|
|
17,500
|
|
10,100
|
|
14,900
|
|
33,100
|
|
|
(i) "Voyage and commission expenses" is derived from the caption "Voyage, charterhire and commission expenses" and "Voyage, charterhire and commission expenses - collaborative arrangement" less (i) charterhire expenses (net of the effect of the related guarantee obligation) of $nil, $12.4 million and $22.3 million for the years ended December 31,
2018
,
2017
and
2016
, respectively, which arose on the charter-back of the
Golar Grand
from Golar Partners, and (ii) voyage and commission expenses in relation to the
Hilli Episeyo
of $1.4 million, $nil and $nil for the years ended December 31,
2018
,
2017
and
2016
, respectively.
(ii) This excludes days when vessels are in lay-up, undergoing dry dock or undergoing conversion.
(5) We calculate average daily vessel operating costs by dividing vessel operating costs by the number of calendar days. Calendar days exclude those from vessels chartered in where the vessel operating costs are borne by the legal owner, and those of vessels undergoing conversion.
Not applicable.
3
C. Reasons for the Offer and Use of Proceeds
Not applicable.
D. Risk Factors
The following risks relate principally to our business or to the industry in which we operate. Other risks relate principally to the securities market and ownership of our common shares. Any of these risks, or any additional risks not presently known to us or risks that we currently deem immaterial, could significantly and adversely affect our business, our financial condition, our operating results and the trading price of our common shares. We have categorized the risks we face based on whether they arise from our business activities or from the industry in which we operate and listed these based on management’s assessment of priority. Where relevant, we have grouped together related risks.
Risks arising from our Business Activities
Risks Related to Future FLNG projects
|
•
|
We cannot guarantee that our agreement with BP will progress favorably.
|
In February 2019, we entered into a 20-year Lease and Operate Agreement with BP Mauritania Investments Ltd (“BP”) for the charter of the FLNG unit, the
Gimi
, to service the Greater Tortue Ahmeyim field. The
Gimi’s
conversion to a FLNG is expected to commence in April 2019 and the
Gimi
is expected to commence operations under the Lease and Operate Agreement in 2022. The estimated cost of
Gimi’s
conversion is $1.3 billion, which we plan to fund through multiple financing facilities, including a $700 million long term financing facility that is currently in its final stages and that we plan to have available to us during construction. Once the
Gimi
is accepted under the contract, we anticipate annual contracted revenues less forecasted operating costs of approximately $215 million per year.
There can be no guarantee that the Lease and Operate Agreement will progress favorably or last for the anticipated term. In addition to containing conditions precedent that could prevent performance of the contract altogether, the Lease and Operate Agreement provides both parties with the right to suspend or terminate the agreement under certain circumstances after performance has begun. Should we be unable to meet our obligations under the Lease and Operate Agreement in a manner that gives rise to a right to terminate the agreement by BP, we could be obligated to pay substantial damages to BP which would have a negative impact on our earnings and cash flow and could make it difficult to induce counterparties to contract with us for FLNG conversions in the future.
|
•
|
If there is a delay or default by a shipyard or if a shipyard does not meet certain performance requirements, our earnings and financial condition could suffer.
|
We have entered into an agreement with Keppel Shipyard Limited, or Keppel, and Black & Veatch Corporation, or Black & Veatch, for the conversion of the
Gimi
into a FLNG. We have also entered into an agreement for the conversion of the
Gandria
into a FLNG. See "Item 4. Information on the Company".
In the event the shipyards do not perform under these agreements and we are unable to enforce certain refund guarantees with third party banks for any reason, in connection with the conversions of the
Gimi
or the
Gandria
, we may lose part or all of our investment, which would have a material adverse effect on our results for operations, financial condition and cash flows.
In addition, the conversions are subject to the risk of delay or default by the shipyards caused by, among other things, unforeseen quality or engineering problems, work stoppages or other labor disturbances at the shipyards, bankruptcy of or other financial crises involving the shipyards, weather interference, unanticipated cost increases, delays in receipt of necessary equipment, political, social or economic disturbances, inability to finance the construction of the vessel and inability to obtain the requisite permits or approvals. In accordance with industry practice, in the event the shipyards are unable or unwilling to deliver the vessel, we may not have substantial remedies. Failure to convert, construct or deliver the vessels by the shipyards or any significant delays could increase our expenses and diminish our net income and cash flows.
|
•
|
Due to the new and sophisticated nature of FLNG conversions, we are reliant on a small number of contractors with relevant experience.
|
4
The highly technical work related to FLNG conversions is only capable of being performed by a limited number of contractors, and due to the new nature of the technology only a very limited number of contractors have relevant experience with FLNG conversions. Accordingly, a change of contractors for any reason would likely result in higher costs and a significant delay to our delivery schedules. In addition, given the novelty of our FLNG conversion projects, the completion of retrofitting our vessels as FLNG vessels could be subject to risks of significant cost overruns. If the shipyard is unable to deliver any converted FLNG vessel on time, we might be unable to perform related charters. Any substantial delay in the conversion of any of our vessels into FLNG vessels could mean we will not be able to satisfy potential employment of the FLNG vessels.
Furthermore, if any future FLNG vessels, once converted, are not able to meet certain performance requirements or perform as intended, we may have to accept reduced charter rates. Alternatively, it may not be possible to charter the converted FLNG vessel at all. Either of these possibilities would have a negative impact, which could be significant, on our cash flows and earnings.
|
•
|
Due to the locations in which we operate, a number of our current and potential future projects are subject to higher political and security risks than operations in other areas of the world.
|
We operate in, or are pursuing projects which could lead to future operations in, areas of the world where there are heightened political and security risks. We identify higher risk countries in which we operate through our experiences, the experiences of our partners and publicly available third party information such as Transparency International, the World Bank and TRACE International, and monitor the specific risks associated with countries in which we operate.
In particular, the operations of Golar Hilli Corp ("Hilli Corp") in Cameroon under the Liquefication Tolling Agreement (“LTA") is subject to higher political and security risks than operations in other areas of the world. Recently, Cameroon has experienced instability in its socio-political environment. Any extreme levels of political instability resulting in changes of governments, internal conflict, unrest and violence, especially from terrorist organizations prevalent in the region, such as Boko Haram, could lead to economic disruptions and shutdowns in industrial activities. In addition, corruption and bribery are a serious concern in the region. The FLNG operations of Hilli Corp in Cameroon will be subject to these risks, which could materially adversely affect our revenues, our ability to perform under the LTA and our financial condition.
In addition, Hilli Corp will maintain insurance coverage for only a portion of the risks incidental to doing business in Cameroon. There also may be certain risks covered by insurance where the policy does not reimburse Hilli Corp for all of the costs related to a loss. For example, any claims covered by insurance will be subject to deductibles, which may be significant. In the event that Hilli Corp incurs business interruption losses with respect to one or more incidents, they could have a material adverse effect on our results of operations.
Risks Related to Hilli Episeyo
|
•
|
Golar Hilli LLC may not result in anticipated profitability or generate cash flow sufficient to justify our investment. In addition, our investment exposes us to risks that may harm our business, financial condition and operating results.
|
In July 2018, we, Keppel and Black & Veatch completed a sale of 50% of the common units in Golar Hilli LLC ("Hilli LLC"), the disponent owner of the FLNG
Hilli Episeyo
, to Golar Partners. However, we still hold a significant portion of the outstanding ownership interests in Hilli LLC. The retained interests expose us to risks that we may:
|
•
|
fail to obtain the benefits of the LTA if Perenco Cameroon S.A. ("Perenco") and Société Nationale de Hydrocarbures (‘‘SNH’’) (together the "Customer") exercises certain rights to terminate the charter upon the occurrence of specified events of default;
|
|
•
|
fail to obtain the benefits of the LTA if the Customer fails to make payments under the LTA because of its financial inability, disagreements with us or otherwise;
|
|
•
|
incur or assume unanticipated liabilities, losses or costs;
|
|
•
|
be required to pay damages to the Customer or suffer a reduction in the tolling fee in the event that the
Hilli Episeyo
fails to perform to certain specifications;
|
|
•
|
incur other significant charges, such as asset devaluation or restructuring charges; or
|
|
•
|
be unable to re-charter the FLNG on another long-term charter at the end of the LTA.
|
5
|
•
|
Utilization of the full capacity of Hilli Episeyo
|
The FLNG
Hilli Episeyo
commenced commercial operations in June 2018, when under the terms of the LTA by and between Perenco and SNH.
The LTA commits the capacity of two of the four liquefaction trains (Train 1 and Train 2) of the
Hilli Episeyo
. The remaining half of the
Hilli Episeyo’s
capacity is not yet contracted. This allows for significant upside in relation to revenues from the
Hilli Episeyo
however delays in contracting Train 3 and Train 4 capacity could adversely affect our financial performance. Factors which could cause delays in contracting the full capacity include delays in negotiations with potential counterparties, and also include factors outside of our control such as the growth of LNG demand and the price of LNG, affecting when counterparties seek to bring additional production to the market.
|
•
|
Due to the new and sophisticated technology utilized by the Hilli Episeyo, the operations of the Hilli Episeyo are subject to risks that could negatively affect our business and financial condition.
|
FLNG vessels are complex and their operations are technically challenging and subject to mechanical risks and problems. Unforeseen operational problems with the
Hilli Episeyo
may lead to Hilli LLC experiencing a loss of revenue or higher than anticipated operating expenses or require additional capital expenditures. Any of these results could harm our business, financial condition and ability to make cash distributions to our unitholders.
|
•
|
If the letter of credit is not extended, the earnings and financial condition of Hilli Corp could suffer.
|
Pursuant to the terms of the LTA, Golar obtained a letter of credit issued by a financial institution that guarantees certain payments Hilli Corp is required to make under the LTA. The letter of credit was set to expire on December 31, 2018, but it automatically extends for successive one year periods until the tenth anniversary of the acceptance of the
Hilli Episeyo
to perform the agreed services for the project, unless the financial institution elects to not extend the letter of credit. The financial institution may elect to not extend the letter of credit by giving notice at least ninety days prior to the current December 31, 2019 expiration date or December 31 in any subsequent year. If the letter of credit (i) ceases to be in effect or (ii) the financial institution elects to not extend it, unless replacement security for payment is provided within a certain time, then the LTA may be terminated and Hilli Corp may be liable for a termination fee of up to $300 million. Accordingly, if the financial institution elects at some point in the future to not extend the letter of credit, Hilli Corp's financial condition could be materially and adversely affected.
Risks Related to other projects
|
•
|
We cannot guarantee that the conversion of the Golar Viking and the accompanying agreement with LNG Hrvatska will progress favorably.
|
We have entered into an agreement with a Croatian project developer, LNG Hrvatska d.o.o., or LNG Hrvatska, to convert the
Golar Viking
, built in 2005, into a FSRU, sell the converted vessel, and then operate and maintain the FSRU for a minimum of ten years. The conversion will be funded by stage payments from LNG Hrvatska under the agreement. Commencement of the project is subject to certain conditions precedent, including confirmation of project funding, receipt of a Notice to Proceed from LNG Hrvatska and our ability to enter into refinancing on favorable terms for the vessel.
We cannot guarantee that this agreement will progress favorably or that the relevant conditions precedent will be satisfied. Some of the possible risks relating to this transaction include the inability of our counterparties to perform under the agreement, our inability to obtain the necessary refinancing on favorable terms or at all, our inability to deliver the converted vessel in a condition satisfactory to LNG Hrvatska and delays in the conversion of the
Golar Viking
. Should we be unable to meet our obligations under the agreement, we could be obligated to pay damages to LNG Hrvatska which could have a negative impact on our earnings and cash flow and could make it difficult to induce counterparties to contract with us for FSRU conversions in the future.
Risks associated with our investments in Joint Ventures and Affiliates
|
•
|
We have a substantial equity investment in our former subsidiary, Golar Partners, which since December 13, 2012, is no longer consolidated with our financial results, and our investment is subject to the risks related to Golar Partners’ business.
|
As of December 31, 2018, we had an ownership interest of 32.0% (including our 2% general partner interest) in Golar Partners (in addition to 100% of the incentive distribution rights, or IDRs), which we account for under the equity method of accounting.
6
The aggregate carrying value of our investments in Golar Partners as of December 31, 2018 was $271.2 million, which represents our total interests in the common and general partner units and the IDRs. The common units of Golar Partners are listed on the NASDAQ Global Market, which as of December 31, 2018, had a quoted unit price of $10.80. The estimated fair value of our investments in Golar Partners is calculated with reference to the quoted price of the common units, with adjustments made to reflect the different rights associated with each class of investment. Due to continued decline in the share price, we have impaired the value of our investment as at December 31, 2018, which had a material adverse non-cash impact on our results of operations. Future impairment charges may have a material adverse effect on our results of operations in the period that the impairment charges are recognized.
In addition to the value of our investment, we receive cash distributions from Golar Partners, which amounted to $48.4 million for the year ended December 31, 2018. Furthermore, we receive management fee income from the provision of services to Golar Partners under each of the management and administrative services agreement and the fleet management agreements, which amounted to $15.0 million for the year ended December 31, 2018.
The value of our investment, the income generated from our investment and the management fee income is subject to a variety of risks, including the risks related to Golar Partners’ business as disclosed in its respective public filings with the SEC. The occurrence of any such risks may negatively affect our financial condition. As of
March 15, 2019
Golar Partners had a fleet of 10 vessels, six of which currently operate under medium to long-term charters with a concentrated number of charterers, and an interest in the FLNG
Hilli Episeyo
which we manage under the management agreements referred to above. Accordingly, a significant risk to Golar Partners is the loss of any of these customers, charters or vessels, including re-chartering its three vessels recently coming off charter, or under certain operational circumstances, a decline in payments under any of the charters, which could have a material adverse effect on its business and its ability to make cash distributions to its unitholders if the vessel was not re-chartered to another customer for an extended period of time.
|
•
|
A decline in the market value of Golar Partners’ common unit price could result in breaches of our Margin Loan Facility.
|
During July 2018, amendments to the existing margin loan facility, secured by units in Golar Partners, were completed. Although most of the existing terms remain substantially unchanged, the facility will no longer amortize. Previously the dividend cash received from the pledged Partnership units was first used to service the interest on the loan, any excess cash was then used to prepay a portion of the principal. Under the modified agreement, any excess cash after servicing the interest will be returned to us. If certain covenants are breached, we may be required to make further principal repayments ahead of loan maturity in March 2020, which would reduce our available cash flow.
|
•
|
We have a substantial equity investment in Golar Power that is subject to the risks related to Golar Power’s business.
|
We have a substantial equity investment in Golar Power. In addition to the value of our investment, we expect to receive cash distributions from Golar Power and management fee income from the provision of services to Golar Power under a management and administrative services agreement for the vessels in Golar Power’s fleet. The value of our investment, the income generated from our investment and the management fee income are subject to a variety of risks, including the risks related to Golar Power’s business. In turn, Golar Power’s business is subject to a variety of risks, including, among others, any inability of Stonepeak Infrastructure Partners ("Stonepeak") and us to successfully work together in the shared management of Golar Power, any inability of Golar Power to identify and enter into appropriate projects, any inability of Golar Power to obtain sufficient financing for any project it identifies, any failure of upstream and downstream LNG producing projects connected with Golar Power’s activities, and other industry, regulatory, economic and political risks similar in nature to the risks faced by us.
Golar Power has a 50% interest in a Brazilian corporation, Centrais Eléctricas de Sergipe S.A. ("CELSE"), that was formed for the purpose of constructing and operating a power plant in the State of Sergipe in Brazil, which we refer to as the Sergipe Project. The Sergipe Project is subject to a variety of risks including General Electric’s completion of the Sergipe Project in accordance with the terms of the related EPC contract. Additionally, constructing and operating a power plant is subject to certain risks that include unscheduled plant outages, equipment failure, labor disputes, disruptions in fuel supply, inability to comply with regulatory or permit requirements, natural disasters or terrorist acts, cyber-attacks or other similar occurrences, and inherent risks which may occur as a result of inadequate internal processes, technological flaws, human error or actions of third parties or other external events. The control and management of these risks depend upon adequate development and training of personnel and on the existence of operational procedures, preventative maintenance plans and specific programs supported by quality control systems which reduce, but do not eliminate, the possibility of the occurrence and impact of these risks. The hazards described above, along with other safety hazards associated with our operations, can cause significant personal injury or loss of life, severe damage to and destruction of property, plant and equipment, contamination of, or damage to, the environment and suspension of operations. The occurrence of any one of these events may result in Golar Power,
7
through its ownership interest in CELSE, being named as a defendant in lawsuits asserting claims for substantial damages, environmental cleanup costs, personal injury and fines and/or penalties.
Also, exchange rate fluctuations between the U.S. Dollar and the Brazilian Real could have an adverse impact on the results of operations of Golar Power with respect to its investments in Brazil, including its investments in the Sergipe Project through CELSE. The principal currency for revenue and operating expenses is Brazilian Real for CELSE. This exposure to foreign currency could lead to fluctuations in Golar Power’s net income and net revenue due to changes in the value of the U.S. Dollar relative to the Brazilian Real.
|
•
|
We have an equity investment in Avenir that is subject to the risks related to Avenir’s business.
|
In October 2018, we invested $24.8 million in Avenir LNG Ltd, a joint venture with Stolt-Nielsen Ltd ("Stolt Nielsen") (an entity affiliated with our director Niels Stolt Nielsen)
and Höegh LNG Holdings Ltd ("Höegh"), as part of a combined $182 million commitment for the pursuit of opportunities in small-scale LNG. The value of our investment and the income generated from our investment are subject to a variety of risks, including the risks related to Avenir’s business. In turn, Avenir’s business is subject to a variety of risks, including, among others, any inability of the joint venture partners to successfully work together in the shared management of Avenir, any inability of Avenir to identify and enter into appropriate projects, any inability of Avenir to obtain sufficient financing for any project it identifies, any failure of small-scale LNG projects Avenir has invested in, and other industry, regulatory, economic and political risks similar in nature to the risks faced by us.
|
•
|
We may guarantee the indebtedness of our joint ventures and/or affiliates.
|
We may provide guarantees to certain banks with respect to commercial bank indebtedness of our joint ventures and/or affiliates. Failure by any of our joint ventures and/or affiliate to service their debt requirements and comply with any provisions contained in their commercial loan agreements, including paying scheduled instalments and complying with certain covenants, may lead to an event of default under the related loan agreement. As a result, if our joint ventures and/or affiliates are unable to obtain a waiver or do not have enough cash on hand to repay the outstanding borrowings, the relevant lenders may foreclose their liens on the vessels securing the loans or seek repayment of the loan from us, or both. Either of these possibilities could have a material adverse effect on our business. Further, by virtue of our guarantees with respect to our joint ventures and/or affiliates, this may reduce our ability to gain future credit from certain lenders.
|
•
|
Golar Partners and its affiliates may compete with us.
|
In connection with the IPO of Golar Partners, we entered into an Omnibus Agreement with Golar Partners governing, among other things, when we and Golar Partners may compete against each other as well as rights of first offer on certain FSRUs and LNG carriers. Under the Omnibus Agreement, Golar Partners and its subsidiaries agreed to grant a right of first offer on any proposed sale, transfer or other disposition of any vessel it may own. Likewise, we agreed to grant a similar right of first offer to Golar Partners for any vessel under a charter for five or more years that we may own. These rights of first offer will not apply to a (a) sale, transfer or other disposition of vessels between any affiliated subsidiaries, or pursuant to the terms of any current or future charter or other agreement with a charter party or (b) merger with or into, or sale of substantially all of the assets to, an unaffiliated third-party. In addition, the Omnibus Agreement provides for certain indemnities to Golar Partners in connection with the assets transferred from us.
Risks Related to the Financing of our Business
Our business is capital intensive, and therefore we are exposed to several key financing risks, relating both to our ability to secure sufficient financing to meet existing obligations and future projects and also the impact financing terms and covenants could have on our business.
|
•
|
We may not be able to obtain financing, to meet our obligations as they fall due or to fund our growth or our future capital expenditures, which could negatively impact our results of operations, financial condition and ability to pay dividends.
|
In order to fund future FLNG vessel and FSRU retrofitting projects, liquefaction projects, newbuilding programs, vessel acquisitions, increased working capital levels or other capital expenditures, we may be required to use cash from operations, incur additional borrowings, raise capital through the sale of debt or additional equity securities or complete sales of our interests in our vessel owning subsidiaries operating under long-term charters to Golar Partners. Our ability to do so may be limited by our financial condition at the time of such financing or offering, as well as by adverse market conditions resulting from, among other things, general economic conditions and contingencies and uncertainties that are beyond our control. In addition, our use of cash from operations may reduce the amount of cash available for dividend distributions. Our failure to
8
obtain funds for future capital expenditures could impact our results of operations, financial condition and our ability to pay dividends. Furthermore, our ability to access capital, overall economic conditions and our ability to secure charters on a timely basis could limit our ability to fund our growth and capital expenditures. If we are successful in issuing equity in order to raise capital, the issuance of additional equity securities would dilute your equity interest in us and reduce any pro rata dividend payments without a commensurate increase in cash allocated to dividends, if any. Even if we are successful in obtaining bank financing, paying debt service would limit cash available for working capital and increasing our indebtedness could have a material adverse effect on our business, results of operations, cash flows, financial condition and ability to pay dividends.
A pre-condition of the
Golar Tundra
lease financing with CMBL of $140.1million, which is secured on the vessel, is for the FSRU to be employed under an effective charter. Under the terms of our sale and lease back facility for the
Golar Tundra
, by virtue of our prior termination of the WAGL charter, we are required to find a replacement charter by June 30, 2019, or we could be required to refinance the FSRU. We are currently exploring our refinancing options, including extension of the lenders’ deadline for satisfaction of such. While we believe we will be able to refinance or extend the lenders' deadline, failure to do so could have a material adverse effect on our results of operations, cash flows, financial condition and ability to pay dividends. However, included within our debt obligation is an amount of $121.7 million relating to the Golar Tundra VIE's loan, which we are required to consolidate into our financial results.
|
•
|
We are exposed to volatility in the London Interbank Offered Rate (“LIBOR”), and the derivative contracts we have entered into to hedge our exposure to fluctuations in interest rates could result in higher than market interest rates and charges against our income.
|
LIBOR has historically been volatile, with the spread between LIBOR and the prime lending rate widening significantly at times. These conditions are the result of the disruptions in the international credit markets. Because the interest rates borne by our outstanding indebtedness fluctuate with changes in LIBOR, if this volatility were to occur, it would affect the amount of interest payable on our debt, which in turn, could have an adverse effect on our profitability, earnings and cash flow.
Furthermore, interest in most financing agreements in our industry has been based on published LIBOR rates. Recently, however, there is uncertainty relating to the LIBOR calculation process, which may result in the phasing out of LIBOR in the future. As a result, lenders have insisted on provisions that entitle the lenders, in their discretion, to replace published LIBOR as the base for the interest calculation with their cost-of-funds rate. If we are required to agree to such a provision in future financing agreements, our lending costs could increase significantly, which would have an adverse effect on our profitability, earnings and cash flow.
As of December 31, 2018, we had total outstanding debt of $2.6 billion, of which $0.8 billion was exposed to a floating interest rate based on LIBOR, which has been volatile recently and could affect the amount of interest payable on our debt. In order to manage our exposure to interest rate fluctuations, we use interest rate swaps to effectively fix a part of our floating rate debt obligations. As of December 31, 2018, we have interest rate swaps with a notional amount of $950 million representing 125.8% of our total floating rate debt. While we are economically hedged, we do not apply hedge accounting and therefore interest rate swaps mark-to-market valuations may adversely affect our results. Entering into swaps and derivative transactions is inherently risky and presents various possibilities for incurring significant expenses. The derivative strategies that we employ currently and in the future may not be successful or effective, and we could, as a result, incur substantial additional interest costs or losses.
In the future, our financial condition could be materially adversely affected to the extent we do not hedge our exposure to interest rate fluctuations under loans that have been advanced at a floating rate. Any hedging activities we engage in may not effectively manage our interest rate exposure or have the desired impact on our financial conditions or results of operations.
|
•
|
Reforms, including the potential phasing out of LIBOR after 2021, may adversely affect us.
|
We have floating rate debt, the interest rate of which is determined based on the London Interbank Offered Rate (‘‘LIBOR’’). LIBOR and other ‘‘benchmark’’ rates are subject to ongoing national and international regulatory scrutiny and reform. For example, on July 27, 2017, the U.K. Financial Conduct Authority announced that it will no longer persuade or compel banks to submit rates for the calculation of the LIBOR rates after 2021 (the ‘‘FCA Announcement’’). The Alternative Reference Rate Committee, a committee convened by the Federal Reserve that includes major market participants, has proposed an alternative rate to replace U.S. Dollar LIBOR: the Secured Overnight Financing Rate, or “SOFR.”
We are unable to predict the effect of the FCA Announcement or other reforms, whether currently enacted or enacted in the future. They may result in the phasing out of LIBOR as a reference rate. The impact of such transition away from LIBOR could be significant for us because of the number of our financing arrangements that are linked to LIBOR and our substantial
9
indebtedness. The outcome of reforms may result in increased interest expense to us, may affect our ability to incur debt on terms acceptable to us and may result in increased costs related to amending our existing debt instruments, which could adversely affect our business, results of operations and financial condition.
|
•
|
Servicing our debt agreements substantially limits our funds available for other purposes and our operational flexibility.
|
A large portion of our cash flow from operations is used to repay the principal and interest on our debt agreements. As of December 31, 2018, our net indebtedness (including loan debt, net of restricted cash and short-term deposits and net of cash and cash equivalents) was $1.9 billion and our ratio of net indebtedness to total capital (comprising net indebtedness plus shareholders' equity) was 0.52.
Our consolidated debt could increase substantially. We will likely continue to have the ability to incur additional debt. Our level of debt could have important consequences to us, including:
|
•
|
Our ability to obtain additional financing, if necessary, for working capital, capital expenditures, acquisitions or other purposes may be impaired or such financing may not be available on favorable terms;
|
|
•
|
We will need a substantial portion of our cash flow to make principal and interest payments on our debt, reducing the funds that would otherwise be available for operations, future business opportunities and dividends to stockholders;
|
|
•
|
We may be more vulnerable to competitive pressures or a downturn in our industry or the economy in general as compared to our competitors with less debt; and;
|
|
•
|
Our flexibility in obtaining additional financing, pursuing other business opportunities and responding to changing business and economic conditions may be limited.
|
Our ability to service our indebtedness will depend upon, among other things, our future financial and operating performance, which will be affected by prevailing economic conditions and financial, business, regulatory and other factors, some of which are beyond our control, as well as the interest rates applicable to our outstanding indebtedness. If our operating income is not sufficient to service our indebtedness, we will be forced to take actions, such as reducing or delaying our business activities, acquisitions, investments or capital expenditures, selling assets, restructuring or refinancing our debt or seeking additional equity capital. We may not be able to effect any of these remedies on satisfactory terms, or at all. In addition, a lack of liquidity in the debt and equity markets could hinder our ability to refinance our debt or obtain additional financing on favorable terms in the future.
|
•
|
Our consolidated lessor variable interest entities (“VIEs”), may enter into different financing arrangements, which could affect our financial results.
|
By virtue of the sale and leaseback transactions we have entered into with certain affiliates of Chinese financial institutions that are determined to be lessor VIEs, where we are deemed to be the primary beneficiary, we are required by United States generally accepted accounting principles ("GAAP") to consolidate these lessor VIEs into our financial results. Although consolidated into our results, we have no control over the funding arrangements negotiated by these lessor VIEs such as interest rates, maturity and repayment profiles. In consolidating these lessor VIEs into our financial results, we must make assumptions regarding the debt amortization profile and the interest rate to be applied against the lessor VIEs’ debt principal. Our estimates are therefore dependent upon the timeliness of receipt and accuracy of financial information provided by these lessor VIE entities. For additional detail refer to note 5 "Variable Interest Entities" of our Consolidated Financial Statements included herein. As of December 31, 2018, we consolidated lessor VIEs in connection with the lease financing transactions for eight of our vessels. For descriptions of our current financing arrangements including those of our lessor VIEs, please read "Item 5. Operating and Financial Review-B. Liquidity and Capital Resources-Borrowing Activities." The funding arrangements negotiated by these lessor VIEs could adversely affect our financial accounting results.
|
•
|
Our financing agreements are secured by our vessels and contain operating and financial restrictions and other covenants that may restrict our business, financing activities and ability to make cash distributions to our shareholders. In addition, because of the presence of cross-default provisions in certain of our and Golar Partners’ financing agreements that cover both us and Golar Partners, a default by us or Golar Partners could lead to multiple defaults in our agreements.
|
Our obligations under our financing arrangements are secured by certain of our vessels and guaranteed by our subsidiaries holding the interests in our vessels. Our loan agreements impose, and future financial obligations may impose, operating and financial restrictions on us. These restrictions may require the consent of our lenders, or may prevent or otherwise limit our ability to, among other things:
10
|
•
|
merge into, or consolidate with, any other entity or sell, or otherwise dispose of, all or substantially all of our assets;
|
|
•
|
make or pay equity distributions;
|
|
•
|
incur additional indebtedness;
|
|
•
|
incur or make any capital expenditures;
|
|
•
|
materially amend, or terminate, any of our current charter contracts or management agreements; or
|
|
•
|
charter our vessels.
|
Our loan agreements and lease financing arrangements also require us to maintain specific financial levels and ratios, including minimum amounts of available cash, minimum ratios of current assets to current liabilities (excluding current portion of long-term debt), minimum levels of stockholders’ equity and maximum loan amounts to value. If we were to fail to maintain these levels and ratios without obtaining a waiver of covenant compliance or modification to our covenants, we would be in default of our loans and lease financing agreements, which, unless waived by our lenders, could provide our lenders with the right to require us to increase the minimum value held by us under our equity and liquidity covenants, increase our interest payments, pay down our indebtedness to a level where we are in compliance with our loan covenants, sell vessels in our fleet or reclassify our indebtedness as current liabilities and could allow our lenders to accelerate our indebtedness and foreclose their liens on our vessels, which could result in the loss of our vessels. If our indebtedness is accelerated, we may not be able to refinance our debt or obtain additional financing, which would impair our ability to continue to conduct our business.
Moreover, in connection with any waivers and/or amendments to our loan and lease agreements, our lenders may impose additional operating and financial restrictions on us and/or modify the terms of our existing loan and lease agreements.
Because of the presence of cross-default provisions in certain of our and Golar Partners’ loan and lease agreements that cover both us and Golar Partners, a default by us or Golar Partners under a loan or lease agreement and the refusal of any one lender or lessor to grant or extend a waiver could result in the acceleration of our indebtedness under our other loan and lease agreements even if our or Golar Partners’ other lenders or lessors have waived covenant defaults under the respective agreements. A cross-default provision means that if we or Golar Partners default on one loan or lease, we would then default on our other loans containing a cross-default provision.
|
•
|
We previously entered into six UK tax leases, of which one lease for the Methane Princess remains. In the event of any adverse tax changes or a successful challenge by the UK Revenue authorities, or HMRC, with regard to the initial tax basis of these transactions or in relation to our 2010 lease restructurings, or in the event of an early termination of the Methane Princess lease, we may be required to make additional payments principally to the UK vessel lessor or Golar Partners, which could adversely affect our earnings and financial position.
|
As described under note 30 of our audited consolidated financial statements filed with our Annual Report on Form 20-F for the year ended December 31, 2018, during 2003 we entered into six UK tax leases. Under the terms of the leasing arrangements, the benefits are derived primarily from the tax depreciation assumed to be available to the lessors as a result of their investment in the vessels. As is typical in these leasing arrangements, as the lessee we are obligated to maintain the lessor’s after-tax margin. Accordingly, in the event of any adverse tax changes or a successful challenge by the UK Tax Authorities (''HMRC'') with regard to the initial tax basis of the transactions, or in relation to the 2010 lease restructurings, or in the event of an early termination of the Methane Princess lease, we may be required to make additional payments principally to the UK vessel lessor, which could adversely affect our earnings or financial position. We would be required to return all, or a portion of, or in certain circumstances significantly more than, the upfront cash benefits that we received in respect of our lease financing transactions, including the 2010 restructurings and subsequent termination transactions. The gross cash benefit we received upfront on these leases amounted to approximately £41 million (before deduction of fees).
Of these six leases we have since terminated five, with one lease remaining, the Methane Princess lease. Pursuant to the deconsolidation of Golar Partners in 2012, Golar Partners is no longer considered a controlled entity, but an affiliate and therefore as at December 31, 2018, the capital lease obligation relating to this remaining UK tax lease is not included on our consolidated balance sheet. However, under the indemnity provisions of the Omnibus Agreement or the respective share purchase agreements, we have agreed to indemnify Golar Partners in the event of any tax liabilities in excess of scheduled or final scheduled amounts arising from the Methane Princess leasing arrangements and termination thereof.
HMRC has been challenging the use of similar lease structures and has been engaged in litigation of a test case for some years. In August 2015, following an appeal to the Court of Appeal by the HMRC which set aside previous judgments in favor of the tax payer, the First Tier Tribunal (a UK court) ruled in favor of HMRC. The tax payer in this particular ruling has the election to appeal the court's decision, but no appeal has been filed. The judgments of the First Tier Tribunal do not create binding precedent for other UK court decisions and therefore the ruling in favor of HMRC is not binding in the context of
11
our structures. Further, we consider there to be differences in the fact pattern and structure of this case from our 2003 leasing arrangements and therefore it is not necessarily indicative of any outcome should HMRC challenge us. We remain confident that our fact pattern is sufficiently different to succeed if we are challenged by HMRC. HMRC have written to our lessor to indicate that they believe our lease may be similar to the case noted above. We have reviewed the details of the case and the basis of the judgment with our legal and tax advisers to ascertain what impact, if any, the judgment may have on us and the possible range of exposure has been estimated at approximately £nil to £115 million. We are currently in conversation with HMRC on this matter, as well as continuing to present the factual background of Golar's position, and are progressing the possibility of bringing this inquiry to a mutually satisfactory conclusion. Given the complexity of these discussions, it is impossible to quantify the reasonably possible loss, however we continue to estimate the possible range of exposures as set out above.
|
•
|
Exposure to equity price risk in our shares could adversely affect our financial results.
|
As a result of holding an equity swap, which we refer to as our Total Return Swap, in our own securities, as of
March 15, 2019
, we are exposed to the movement in our share price in respect of 3.0 million shares under the equity swap. Should the price of our shares fall materially below the level at which the shares were acquired, the equity swap mark-to-market valuations could adversely affect our results. In addition, the equity swap has a credit arrangement, whereby we are required to provide cash collateral equal to 20% of the initial acquisition price and to subsequently post additional cash collateral that corresponds to any further unrealized loss. As of December 31, 2018, cash collateral of $82.9 million has been provided and is reflected in "restricted cash" in our Consolidated Balance Sheet. In the event the share price declines, the cash collateral requirements could adversely affect our liquidity and financial position.
Risks Related to Revenue
|
•
|
The market for LNG transportation and regasification services is competitive and we, our Joint Ventures and our affiliates may not be able to compete successfully, which would adversely affect our earnings.
|
The market for LNG transportation and regasification services in which we operate is competitive, especially with respect to the negotiation of long-term charters. Competition arises primarily from other vessel owners, some of whom have substantially greater resources than we do. Furthermore, new competitors with greater resources could enter the market for LNG carriers or FSRUs and operate larger fleets through consolidations, acquisitions or the purchase of new vessels, and may be able to offer lower charter rates and more modern fleets. If we are not able to compete successfully, our earnings could be adversely affected. Competition may also prevent us from achieving our goal of profitably expanding into other areas of the LNG industry.
|
•
|
Our growth depends on our ability to expand relationships with existing customers and obtain new customers, for which we will face substantial competition.
|
One of our principal objectives is to enter into additional medium or long-term, fixed-rate time charters for our LNG carriers and FSRUs. The process of obtaining new long-term time charters is highly competitive and generally involves an intensive screening process and competitive bids, and often extends for several months. LNG carrier or FSRU time charters are awarded based upon a variety of factors relating to the vessel operator, including but not limited to:
|
•
|
LNG shipping and FSRU experience and quality of ship operations;
|
|
•
|
shipping industry relationships and reputation for customer service and safety;
|
|
•
|
technical ability and reputation for operation of highly specialized vessels, including FSRUs;
|
|
•
|
quality and experience of seafaring crew;
|
|
•
|
the ability to finance FSRUs and LNG carriers at competitive rates, and financial stability generally;
|
|
•
|
construction management experience, including, (i) relationships with shipyards and the ability to get suitable berths and (ii) the ability to obtain on-time delivery of new FSRUs and LNG carriers according to customer specifications;
|
|
•
|
willingness to accept operational risks pursuant to a charter, such as allowing termination of the charter for force majeure events; and
|
|
•
|
competitiveness of the bid in terms of overall price.
|
We expect substantial competition for providing floating storage and regasification services and marine transportation services for potential LNG projects from a number of experienced companies, including state-sponsored entities and major energy companies. Many of these competitors have significantly greater financial resources and larger and more versatile fleets than we and the Cool Pool do. We anticipate that an increasing number of marine transportation companies, including many with
12
strong reputations and extensive resources and experience, will enter the FSRU market and LNG transportation market. This increased competition may cause greater price competition for time charters. As a result of these factors, we and the Cool Pool may be unable to expand our relationships with existing customers or obtain new customers on a profitable basis, if at all, which could have a material adverse effect on our business, results of operations, financial condition and ability to make cash distributions.
|
•
|
We operate the majority of our vessels, through the Cool Pool, in the spot/short-term charter market, which is subject to volatility. Failure by the Cool Pool to find profitable employment for these vessels could adversely affect our operations.
|
As of
March 15, 2019
, we had seven LNG carriers and one FSRU operating in the spot market within the Cool Pool. Please see "Item 4. Information on the Company-B. Business Overview" for further detail. The spot market refers to charters for periods of up to twelve months. Spot/short-term charters expose the Cool Pool to the volatility in spot charter rates, which can be significant. In contrast, medium to long-term time charters generally provide reliable revenues, but they also limit the portion of our fleet available to the spot/short-term market during an upswing in the LNG industry cycle, when spot/short-term market voyages might be more profitable. The charter rates payable in the spot market are uncertain and volatile and will depend upon, among other things, economic conditions in the LNG market.
If the Cool Pool is unable to find profitable employment or re-deploy ours or any of the other Cool Pool participants' vessels, we will not receive any revenues from the Cool Pool, but we may be required to pay expenses necessary to maintain that vessel in proper operating condition. A sustained decline in charter or spot rates or a failure by the Cool Pool to successfully charter its participating vessels could have a material adverse effect on our results of operations and our ability to meet our financing obligations.
Risks Related to Our Operations
|
•
|
The operation of FSRUs, FLNGs and LNG carriers is inherently risky, and our vessels face a number of industry risks and events which could cause damage or loss of a vessel, loss of life or environmental consequences that could harm our reputation and ongoing business operations.
|
Our vessels and their cargoes are at risk of being damaged or lost because of events such as marine disasters, acts of piracy, environmental accidents, bad weather, mechanical failures, grounding, fire, explosions and collisions, human error, national emergency and war and terrorism. Incidents such as these have historically affected companies in our industry, and such an event or accident involving any of our vessels could result in any of the following:
|
•
|
death or injury to persons, loss of property or environmental damage;
|
|
•
|
delays in the delivery of cargo;
|
|
•
|
loss of revenues from or termination of charter contracts;
|
|
•
|
governmental fines, penalties or restrictions on conducting business;
|
|
•
|
a government requisitioning for title or seizing our vessels (e.g. in a time of war or national emergency)
|
|
•
|
higher insurance rates; and
|
|
•
|
damage to our reputation and customer relationships generally.
|
Any of these circumstances or events could increase our costs or lower our revenues. In particular:
|
•
|
Although we carry insurance, all risks may not be adequately insured against, and any particular claim may not be paid. Any claims covered by insurance would be subject to deductibles, and since it is possible that a large number of claims may be brought, the aggregate amount of these deductibles could be material.
|
|
•
|
If piracy attacks or military action results in regions in which our vessels are deployed being characterized as “war risk” zones by insurers or the Joint War Committee “war and strikes” listed areas, premiums payable for such coverage could increase significantly and such insurance coverage may be more difficult to obtain.
|
|
•
|
Certain of our insurance coverage is maintained through mutual protection and indemnity associations and, as a member of such associations, we may be required to make additional payments over and above budgeted premiums if member claims exceed association reserves.
|
|
•
|
If our vessels suffer damage, they may need to be repaired. The costs of vessel repairs are unpredictable and can be substantial. We may have to pay repair costs that our insurance policies do not cover. The loss of earnings while these vessels are being repaired, as well as the actual cost of these repairs, would decrease our results of operations.
|
|
•
|
If one of our vessels were involved in an accident with the potential risk of environmental contamination, the resulting media coverage could have a material adverse effect on our business, our results of operations and cash flows, weaken our financial condition and negatively affect our ability to pay distributions.
|
13
|
•
|
An increase in costs could materially and adversely affect our financial performance.
|
Our vessel operating expenses and dry-dock capital expenditures depend on a variety of factors, including crew costs, provisions, deck and engine stores and spares, lubricating oil, insurance, maintenance and repairs and shipyard costs, many of which are beyond our control and affect the entire shipping industry. Also, while we do not bear the cost of fuel (bunkers) under our time charters, fuel is a significant, if not the largest, expense in our operations when our vessels are operating under voyage charters, are idle during periods of commercial waiting time or when positioning or repositioning before or after a time charter. The price and supply of fuel is unpredictable and fluctuates based on events outside of our control, including geopolitical developments, supply and demand for oil and gas, actions by the Organization of Petroleum Exporting Countries, or OPEC, and other oil and gas producers, war and unrest in oil producing countries and regions, regional productions patterns and environmental concerns. Fuel costs may fluctuate significantly, and if costs rise, they could materially and adversely affect our results of operations.
|
•
|
A shortage of qualified officers and crew could have an adverse effect on our business and financial condition.
|
A material decrease in the supply of technically skilled officers or an inability to attract and retain such qualified officers could impair our ability to operate, or increase the cost of crewing our vessels, which would materially and adversely affect our business, financial condition and results of operations. In particular FLNGs require a technically skilled officer staff with specialized training. If we are unable to employ technically skilled staff and crew, we will not be able to adequately staff our vessels particularly as we take delivery of our converted FLNG vessels.
|
•
|
We may be unable to attract and retain key management personnel in the LNG industry, which may negatively impact the effectiveness of our management and our results of operations.
|
Significant demands are placed on our management as a result of our growth. As we expand our operations, we must manage and monitor our operations, control costs and maintain quality and control. In addition, the provision of management services to our affiliates, Golar Partners and Golar Power, including the supervision of vessel conversions to FSRUs or FLNGs, has increased the complexity of our business and placed additional demands on our management. Our success depends, to a significant extent, upon the abilities and the efforts of our senior executives. While we believe that we have an experienced management team, the loss or unavailability of one or more of our senior executives for any extended period of time could have an adverse effect on our business and results of operations.
|
•
|
Failure to comply with the U.S. Foreign Corrupt Practices Act, the UK Bribery Act and other anti-bribery legislation in other jurisdictions could result in fines, criminal penalties, contract terminations and an adverse effect on our business.
|
We may operate in a number of countries throughout the world, including countries known to have a reputation for corruption. We are committed to doing business in accordance with applicable anti-corruption laws and have adopted a code of business conduct and ethics which is consistent and in full compliance with the U.S. Foreign Corrupt Practices Act of 1977 (“FCPA”), and the Bribery Act 2010 of the United Kingdom (“UK Bribery Act”). We are subject, however, to the risk that we, our affiliated entities or our or their respective officers, directors, employees and agents may take actions determined to be in violation of such anti-corruption laws, including the FCPA and the UK Bribery Act. Any such violation could result in substantial fines, sanctions, civil and/or criminal penalties, curtailment of operations in certain jurisdictions, and might adversely affect our business, results of operations or financial condition. In addition, actual or alleged violations could damage our reputation and ability to do business. Furthermore, detecting, investigating, and resolving actual or alleged violations is expensive and can consume significant time and attention of our senior management.
In order to effectively compete in some foreign jurisdictions, we utilize local agents and/or establish entities with local operators or strategic partners. All of these activities may involve interaction by our agents with government officials. Even though some of our agents or partners may not themselves be subject to the FCPA, the UK Bribery Act, or other anti-bribery laws to which we may be subject, if our agents or partners make improper payments to government officials or other persons in connection with engagements or partnerships with us, we could be investigated and potentially found liable for violation of such anti-bribery laws and could incur civil and criminal penalties and other sanctions, which could have a material adverse effect on our business and results of operations.
14
|
•
|
A cyber-attack could materially disrupt our business.
|
We rely on information technology systems and networks, the majority of which are provided by Golar Management, in our operations and the administration of our business. Our business operations could be targeted by individuals or groups seeking to sabotage or disrupt our information technology systems and networks, or to steal data. A successful cyber-attack could materially disrupt our operations, including the safety of our operations, and the availability of our vessels and facilities or lead to unauthorized release of information or alteration of information in our systems. Any such attack or other breach of our information technology systems could have a material adverse effect on our business and results of operations.
We are subject to laws, directives, and regulations relating to the collection, use, retention, disclosure, security and transfer of personal data. These laws, directives, and regulations, and their interpretation and enforcement continue to evolve and may be inconsistent from jurisdiction to jurisdiction. For example, the General Data Protection Regulation (“GDPR”), which regulates the use of personally identifiable information, went into effect in the European Union (“EU”) on May 25, 2018, applies globally to all of our activities conducted from an establishment in the EU, to related products and services that we offer to EU customers and to non-EU customers which offer services in the EU. Complying with the GDPR and similar emerging and changing privacy and data protection requirements may cause us to incur substantial costs or require us to change our business practices. Noncompliance with our legal obligations relating to privacy and data protection could result in penalties, fines, legal proceedings by governmental entities or others, loss of reputation, legal claims by individuals and customers and significant legal and financial exposure and could affect our ability to retain and attract customers.
Changes in the nature of cyber-threats and/or changes to industry standards and regulations might require us to adopt additional procedures for monitoring cybersecurity, which could require additional expenses and/or capital expenditures. However, the impact of such regulations is hard to predict at this time.
|
•
|
Changing corporate laws and reporting requirements could have an adverse impact on our business.
|
Changing laws, regulations and standards could create greater reporting obligations and compliance requirements on companies such as ours. Whilst the regulatory environment continues to evolve, we have invested in, and intend to continue to invest in, reasonably necessary resources to comply with evolving standards and maintain high standards of corporate governance and public disclosure. Recent examples of increased regulation include the UK Modern Slavery Act 2015 and the GDPR. The GDPR, for instance, broadens the scope of personal privacy laws to protect the rights of European Union citizens and requires organizations to report on data breaches within 72 hours and be bound by more stringent rules for obtaining the consent of individuals on how their data can be used.
Non-compliance with such regulation could result in governmental or other regulatory claims or significant fines that could have an adverse effect on our business, financial condition, results of operations, cash flows, and ability to pay distributions.
|
•
|
We are subject to certain risks with respect to our contractual counterparties, and failure of such counterparties to meet their obligations could cause us to suffer losses or otherwise adversely affect our business.
|
We have entered into, and in the future may enter into, contracts, charter contracts, newbuilding contracts, vessel conversion contracts, credit facilities with banks, sale and leaseback contracts, interest rate swaps, foreign currency swaps and equity swaps. Such agreements subject us to counterparty risks. The ability of each of our counterparties to perform its obligations under a contract with us will depend on a number of factors that are beyond our control and may include, among other things, general economic conditions and the overall financial condition of the counterparty. Should a counterparty fail to honor its obligations under agreements with us, we could sustain significant losses, which could have a material adverse effect on our business, financial condition, results of operations and cash flow.
|
•
|
We may be subject to litigation that, if not resolved in our favor and not sufficiently insured against, could have a material adverse effect on us.
|
We may be, from time to time, involved in various litigation matters. These matters may include, among other things, contract disputes, personal injury claims, environmental claims or proceedings, asbestos and other toxic tort claims, employment matters, governmental claims for taxes or duties and other litigation that arises in the ordinary course of our business.
15
Although we always intend to defend such matters vigorously, we cannot predict with certainty the outcome or effect of any claim or other litigation matter, and the ultimate outcome of any litigation or the potential costs to resolve them may have a material adverse effect on us. Insurance may not be applicable or sufficient in all cases and/or insurers may not remain solvent, which may have a material adverse effect on our financial condition. Please read "Item 8 Financial Information-Legal Proceedings and Claims."
|
•
|
We will have to make additional contributions to our pension schemes because it is underfunded.
|
We provide pension plans for certain of our current and former marine employees. Members do not contribute to the plans and they are closed to any new members. As of December 31, 2018, one of the plans is underfunded by $35.4 million. We may need to increase our contributions in order to meet the schemes' liabilities as they fall due, or, to reduce the deficit. Such contributions could have a material and adverse effect on our cash flows and financial condition.
|
•
|
Vessel values may fluctuate substantially and, if these values are lower at a time when we are attempting to dispose of vessels, we may incur a loss and, if these values are higher when we are attempting to acquire vessels, we may not be able to acquire vessels at attractive prices.
|
Vessel values can fluctuate substantially over time due to a number of different factors, including:
|
•
|
prevailing economic and market conditions in the natural gas and energy markets;
|
|
•
|
a substantial or extended decline in demand for LNG;
|
|
•
|
increases in the supply of vessel capacity;
|
|
•
|
the type, size and age of a vessel; and
|
|
•
|
the cost of newbuildings or retrofitting or modifying existing vessels, as a result of technological advances in vessel design or equipment, changes in applicable environmental or other regulations or standards, customer requirements or otherwise.
|
As our vessels age, the expenses associated with maintaining and operating them are expected to increase, which could have an adverse effect on our business and operations if we do not maintain sufficient cash reserves for maintenance and replacement capital expenditures. Moreover, the cost of a replacement vessel would be significant.
During the period a vessel is subject to a charter, we will not be permitted to sell it to take advantage of increases in vessel values without the charterers’ agreement. If a charter terminates, we may be unable to re-deploy the affected vessels at attractive rates and, rather than continue to incur costs to maintain and finance them, we may seek to dispose of them. When vessel values are low, we may not be able to dispose of vessels at a reasonable price when we wish to sell vessels, and conversely, when vessel values are elevated, we may not be able to acquire additional vessels at attractive prices when we wish to acquire additional vessels, which could adversely affect our business, results of operations, cash flow, financial condition and ability to make distributions to shareholders. Please refer to "Item 5. Operating and Financial Review and Prospects-B. Liquidity and Capital Resources-Critical Accounting Policies and Estimates-Vessel Market Values" for further information.
|
•
|
We are exposed to U.S. dollar and foreign currency fluctuations and devaluations that could harm our reported revenue and results of operations.
|
Our principal currency for our operations and financing is the U.S. dollar. We generate the majority of our revenues in the U.S. dollar. Apart from the U.S. dollar, we incur a portion of capital, operating and administrative expenses in multiple currencies.
Due to a portion of our expenses being incurred in currencies other than the U.S. dollar, our expenses may, from time to time, increase relative to our revenues as a result of fluctuations in exchange rates, particularly between the U.S. dollar and the Euro, the British Pound, and the Norwegian Kroner, which could affect the amount of net income that we report in future periods. We use financial derivatives to hedge some of our currency exposure. Our use of financial derivatives involves certain risks, including the risk that losses on a hedged position could exceed the nominal amount invested in the instrument and the risk that the counterparty to the derivative transaction may be unable or unwilling to satisfy its contractual obligations, which could have an adverse effect on our results.
|
•
|
Further technological advancements and other innovations affecting LNG carriers could reduce the charter hire rates we are able to obtain when seeking new employment for our existing vessels, which could adversely impact the value of our assets and our results of operations and cash flows.
|
16
The charter rates, asset value and operational life of an LNG carrier are determined by a number of factors, including the vessel’s efficiency, operational flexibility and physical life. Efficiency is reflected in unit freight costs, which are driven by the size of the vessel, its fuel economy and the rate at which LNG in the cargo tanks naturally evaporates. Flexibility is primarily driven by the size of the vessel and includes the ability to enter harbors, utilize related docking facilities and pass through canals and straits. Physical life is related to the original design and construction, the ongoing maintenance and the impact of operational stresses on the vessel. LNG carrier designs are continually evolving. At such time, as newer designs are developed and accepted in the market, these newer vessels may be more efficient or more flexible or have longer physical lives than our vessels. Competition from these more technologically advanced LNG carriers compared to our existing vessels could adversely affect our ability to charter or re-charter our these vessels and the charter hire rates we will be able to secure when we seek to charter or re-charter these vessels, and could also reduce the resale value of these vessels. This could adversely affect our revenues and cash flows, including cash available for dividends to our shareholders, as well as our ability to obtain debt financing for LNG carriers with older technology whose market values have experienced a significant decline.
|
•
|
If we cannot meet our charterers' quality and compliance requirements, we may not be able to operate our vessels profitably, which could have an adverse effect on our future performance, results of operations, cash flows and financial position.
|
Customers, and in particular those in the LNG industry, have a high and increasing focus on quality and compliance standards with their suppliers across the entire value chain, including the shipping and transportation segment. Our continuous compliance with these standards and quality requirements is vital for our operations. Related risks could materialize in multiple ways, including a sudden and unexpected breach in quality and/or compliance concerning one or more vessels and/or a continuous decrease in the quality concerning one or more LNG carriers occurring over time. Moreover, continuously increasing requirements from LNG industry constituents can further challenge our ability to meet the standards. Any noncompliance by us, either suddenly or over a period of time, on one or more LNG carriers, or an increase in requirements by our charterers above and beyond what we deliver, may have a material adverse effect on our future performance, results of operations, cash flows and financial position.
Risks Related to Our Industry
Due to the nature of our business, our performance is subject to the development of the LNG industry, adverse changes or developments in the LNG carrier, FSRU, and FLNG, the LNG industry as a whole or in the offshore energy infrastructure business financial condition, results of operations and ability to pay dividends to shareholders. Specific industry risks include:
|
•
|
Our results of operations and financial condition depend on demand for LNG, LNG carriers, FSRUs and FLNGs.
|
Our business strategy focuses on expansion in the LNG shipping sector, the floating storage and regasification sector and the floating liquefaction sector. While global LNG demand has continued to rise, the rate of its growth has fluctuated for several reasons, including the global economic downturn and continued economic uncertainty, fluctuations in the price of natural gas and other sources of energy, the continued increase in natural gas production from unconventional sources, including hydraulic fracturing, in regions such as North America and the highly complex and capital intensive nature of new and expanded LNG projects, including liquefaction projects. Accordingly, our results of operations and financial condition depend on continued world and regional demand for LNG, LNG carriers, FSRUs and FLNGs, which could be negatively affected by a number of factors, including but not limited to:
|
•
|
price and availability of natural gas, crude oil and petroleum products;
|
|
•
|
increases in the cost of natural gas derived from LNG relative to the cost of natural gas;
|
|
•
|
decreases in the cost of, or increases in the demand for, conventional land-based regasification and liquefaction systems, which could occur if providers or users of regasification or liquefaction services seek greater economies of scale than FSRUs or FLNGs can provide, or if the economic, regulatory or political challenges associated with land-based activities improve;
|
|
•
|
further development of, or decreases in the cost of, alternative technologies for vessel-based LNG regasification or liquefaction;
|
|
•
|
increases in the production of natural gas in areas linked by pipelines to consuming areas, the extension of existing, or the development of new, pipeline systems in markets we may serve, or the conversion of existing non-natural gas pipelines to natural gas pipelines in those markets;
|
|
•
|
negative global or regional economic or political conditions, particularly in LNG-consuming regions, which could reduce energy consumption or its growth;
|
|
•
|
decreases in the consumption of natural gas due to increases in its price relative to other energy sources or other factors making consumption of natural gas less attractive;
|
17
|
•
|
any significant explosion, spill or other incident involving an LNG facility or carrier, conventional land-based regasification or liquefaction system, or FSRU or FLNG;
|
|
•
|
a significant increase in the number of LNG carriers, FSRUs or FLNGs available, whether by a reduction in the scrapping of existing vessels or the increase in construction of vessels; and
|
|
•
|
availability of new, alternative energy sources, including compressed natural gas.
|
Reduced demand for LNG or LNG liquefaction, storage, shipping or regasification, or any reduction or limitation in LNG production capacity, could have a material adverse effect on prevailing charter rates or the market value of our vessels, which could have a material adverse effect on our results of operations and financial condition.
|
•
|
Growth of the LNG market may be limited by many factors, including infrastructure constraints and community and political group resistance to new LNG infrastructure over concerns about environmental, safety and terrorism.
|
A complete LNG project includes production, liquefaction, regasification, storage and distribution facilities and LNG carriers. Existing LNG projects and infrastructure are limited, and new or expanded LNG projects are highly complex and capital intensive, with new projects often costing several billion dollars. Many factors could negatively affect continued development of LNG infrastructure and related alternatives, including floating liquefaction, storage and regasification, or disrupt the supply of LNG, including:
|
•
|
increases in interest rates or other events that may affect the availability of sufficient financing for LNG projects on commercially reasonable terms;
|
|
•
|
decreases in the price of LNG, which might decrease the expected returns relating to investments in LNG projects;
|
|
•
|
the inability of project owners or operators to obtain governmental approvals to construct or operate LNG facilities;
|
|
•
|
local community resistance to proposed or existing LNG facilities based on safety, environmental or security concerns;
|
|
•
|
any significant explosion, spill or similar incident involving an LNG production, liquefaction or regasification facility, FSRU or LNG carrier; and
|
|
•
|
labor or political unrest affecting existing or proposed areas of LNG production, liquefaction and regasification.
|
|
•
|
If the number of vessels available in the short-term or spot LNG carrier charter market continues to expand and results in reduced opportunities to secure multi-year charters for our vessels, our revenues and cash flows may become more volatile and may decline following expiration or early termination of our current charter arrangements.
|
Most shipping requirements for new LNG projects continue to be provided on a multi-year basis, though the level of spot voyages and short-term time charters of less than 12 months in duration has grown in the past few years. If the number of vessels available in the short-term or spot charter market continues to expand and results in reduced opportunities to secure multi-year charters for our vessels, we may only be able to enter into short-term time charters upon expiration or early termination of our current charters. As a result, our revenues and cash flows may become more volatile. In addition, an active short-term or spot charter market may require us to enter into charters based on changing market prices, as opposed to contracts based on fixed rates, which could result in a decrease in our revenues and cash flows, including cash available for dividends to our shareholders, especially if we enter into charters during periods when charter rates are depressed.
|
•
|
Our vessels may call on ports located in countries that are subject to restrictions imposed by the U.S. or other governments, which could adversely affect our business. In addition, certain of our charterers may be subject to sanctions that could, if expanded, have a material adverse affect on our business.
|
Although no vessels operated by us have called on ports located in countries in violation of sanctions and embargoes imposed by the U.S. government or countries identified by the U.S. government as state sponsors of terrorism, in the future our vessels may call on ports in these countries from time to time on our charterers’ instructions. The U.S. sanctions and embargo laws and regulations vary in their application, as they do not all apply to the same covered persons or proscribe the same activities, and such sanctions and embargo laws and regulations may be amended or strengthened over time.
U.S. sanctions against Russia include “sectoral sanctions,” which target specific industries. Transactions with companies designated under the Sectoral Sanctions Identifications List (“SSI List”) are not prohibited in all cases. Under the United States Office of Foreign Assets Control’s (OFAC) 50 percent rule, a company owned 50 percent or more by an SSI-Listed entity is also to be treated as an SSI-Listed entity.
One of our charter counterparties, a major oil and gas company, may be deemed to be designated an SSI by virtue of the 50 percent rule described above. Although the charter counterparty does not appear on either of OFAC’s list of U.S. Specially
18
Designated Nationals List (“SDN List”) or the SSI List, certain companies with more than 50 percent ownership in this charter counterparty may be identified as an SSI-Listed entity subject to Directive 4 of OFAC’s Ukraine/Russia-related sanctions. Such charter counterparty may thus also be subject to Directive 4.
Directive 4 prohibits U.S. persons from engaging in any activity involving the provision, exportation, or reexportation, directly or indirectly, of goods, services (except for financial services), and technology in support of exploration or production for deepwater, Arctic offshore, or shale projects that, among other things, have the potential to produce oil in the Russian federation and that involve a Directive 4 SSI-Listed entity or their property or interests in property, or that are initiated after January 29, 2018 and have the potential to produce oil in any location and a Directive 4 SSI-Listed entity or their property or interests in property has a 33 percent or greater interest or ownership of a majority of the voting interests. Although the sectoral sanctions do not directly apply to non-U.S. persons, Countering America’s Adversaries Through Sanctions Act (“CAATSA”) prohibits, among other things, non-U.S. persons from facilitating “significant transactions” for or on behalf of SDNs and SSI-Listed entities, as well as entities owned 50 percent or more by such entities.
Although we believe that we have been in compliance with all applicable sanctions and embargo laws and regulations, and intend to maintain such compliance, there can be no assurance that we will be in compliance in the future, particularly as the scope of certain laws may be unclear and may be subject to changing interpretations. Any such violation could result in fines, penalties or other sanctions that could severely impact our ability to access U.S. capital markets and conduct our business, and could result in some investors deciding, or being required, to divest their interest, or not to invest, in us. In addition, certain institutional investors may have investment policies or restrictions that prevent them from holding securities of companies that have contracts with U.S. embargoed countries or countries identified by the U.S. government as state sponsors of terrorism and certain financial institutions may have policies against lending or extending credit to companies that have contracts with U.S. embargoed countries or countries identified by the U.S. government as state sponsors of terrorism. The determination by these investors not to invest in, or to divest from, our common shares or the determination by these financial institutions not to offer financing may adversely affect the price at which our common shares trade. Moreover, our charterers may violate applicable sanctions and embargo laws and regulations as a result of actions that do not involve us or our vessels, and those violations could in turn negatively affect our reputation. In addition, our reputation and the market for our securities may be adversely affected if we engage in certain other activities, such as entering into charters with individuals or entities in countries subject to U.S. sanctions and embargo laws that are not controlled by the governments of those countries, or engaging in operations associated with those countries pursuant to contracts with third parties that are unrelated to those countries or entities controlled by their governments. Investor perception of the value of our common shares may be adversely affected by the consequences of war, the effects of terrorism, civil unrest and governmental actions in these and surrounding countries.
|
•
|
Maritime claimants could arrest our vessels, which could interrupt our cash flow.
|
If we are in default on certain kinds of obligations, such as those to our lenders, crew members, suppliers of goods and services to our vessels or shippers of cargo, these parties may be entitled to a maritime lien against one or more of our vessels. In many jurisdictions, a maritime lien holder may enforce its lien by arresting a vessel through foreclosure proceedings. In a few jurisdictions, claimants could try to assert “sister ship” liability against one vessel in our fleet for claims relating to another of our vessels. The arrest or attachment of one or more of our vessels could interrupt our cash flow and require us to pay to have the arrest lifted. Under some of our present charters, if the vessel is arrested or detained (for as few as 14 days in the case of one of our charters) as a result of a claim against us, we may be in default of our charter and the charterer may terminate the charter. This would negatively impact our revenues and reduce our cash available for distribution to unitholders.
|
•
|
An economic slowdown or changes in the economic and political environment in the Asia Pacific region could have a material adverse effect on our business, financial condition and results of operations.
|
We anticipate a significant number of the port calls made by our vessels will continue to involve the loading or discharging
of LNG in ports in the Asia Pacific region. As a result, any negative changes in economic conditions in any Asia Pacific country, particularly in China, may have a material adverse effect on our business, financial condition and results of operations, as well as our future prospects. Before the global economic financial crisis that began in 2008, China had one of the world's fastest growing economies in terms of gross domestic product, or GDP, which had a significant impact on shipping demand. The quarterly year-over-year growth rate of China's GDP was approximately 6.5% for the year ended December 31, 2018, as compared to approximately 6.9% for the year ended December 31, 2017, and continues to remain below pre-2008 levels. We cannot assure you that the Chinese economy will not experience a significant contraction in the future.
Although state-owned enterprises still account for a substantial portion of the Chinese industrial output, in general, the Chinese government is reducing the level of direct control that it exercises over the economy through state plans and other measures.
19
There is an increasing level of freedom and autonomy in areas such as allocation of resources, production, pricing and management and a gradual shift in emphasis to a "market economy" and enterprise reform. Limited price reforms were undertaken with the result that prices for certain commodities are principally determined by market forces. Many of the reforms are unprecedented or experimental and may be subject to revision, change or abolition based upon the outcome of such experiments. If the Chinese government does not continue to pursue a policy of economic reform, the level of imports to and exports from China could be adversely affected by changes to these economic reforms by the Chinese government, as well as by changes in political, economic and social conditions or other relevant policies of the Chinese government, such as changes in laws, regulations or export and import restrictions. Notwithstanding economic reform, the Chinese government may adopt policies that favor domestic companies and may hinder our ability to compete with them effectively. For example, China imposes a tax for non-resident international transportation enterprises engaged in the provision of services of passengers or cargo, among other items, in and out of China using their own, chartered or leased vessels. The regulation may subject international transportation companies to Chinese enterprise income tax on profits generated from international transportation services passing through Chinese ports. This tax or similar regulations, such as the recently promoted environmental taxes on coal, by China may result in an increase in the cost of raw materials imported to China and the risks associated with importing raw materials to China, as well as a decrease in any raw materials shipped from our charterers to China. This could have an adverse impact on our charterers’ business, operating results and financial condition and could thereby affect their ability to make timely charter hire payments to us and to renew and increase the number of their time charters with us. Moreover, an economic slowdown in the economies of the European Union and other Asian countries may further adversely affect economic growth in China and elsewhere.
In addition, concerns regarding the possibility of sovereign debt defaults by European Union member countries, including Greece, have in the past disrupted financial markets throughout the world, and may lead to weaker consumer demand in the European Union, the United States, and other parts of the world. The possibility of sovereign debt defaults by European Union member countries, including Greece, and the possibility of market reforms to float the Chinese renminbi, either of which development could weaken the Euro against the Chinese renminbi, could adversely affect consumer demand in the European Union. Moreover, the revaluation of the renminbi may negatively impact the United States' demand for imported goods, many of which are shipped from China. Future weak economic conditions could have a material adverse effect on our business, results of operations and financial condition and our ability to pay dividends to our stockholders. Our business, financial condition, results of operations, ability to pay dividends as well as our future prospects, will likely be materially and adversely affected by another economic downturn in any of the aforementioned countries and regions.
|
•
|
Political instability, terrorist attacks and international hostilities can affect the seaborne transportation industry, which could adversely affect our business.
|
We conduct most of our operations outside of the United States, and our business, results of operations, cash flows, financial condition and ability to pay dividends, if any, in the future may be adversely affected by changing economic, political and government conditions in the countries and regions where our vessels are employed or registered. Moreover, we operate in a sector of the economy that is likely to be adversely impacted by the effects of political conflicts, including the current political instability in the Middle East and the South China Sea region and other geographic countries and areas, geopolitical events such as the withdrawal of the U.K. from the European Union, or “Brexit,” terrorist or other attacks, and war (or threatened war) or international hostilities. Terrorist attacks and the continuing response of the United States and others to these attacks, as well as the threat of future terrorist attacks around the world, continues to cause uncertainty in the world’s financial markets and may impact our business, operating results and financial condition. Continuing conflict and recent developments in the Middle East, and the presence of U.S. or similar forces in Iraq, Syria, Afghanistan and various other regions, may lead to additional acts of terrorism and armed conflict around the world, which may contribute to further economic instability in the global financial markets. These uncertainties could also adversely affect our ability to obtain additional financing on terms acceptable to us or at all. Any of these occurrences could have a material adverse impact on our operating results, revenues and costs.
Further, governments may turn to trade barriers to protect their domestic industries against foreign imports, thereby depressing shipping demand. In particular, leaders in the United States have indicated that the United States may seek to implement more protective trade measures. President Trump was elected on a platform promoting trade protectionism. The results of the presidential election have thus created significant uncertainty about the future relationship between the United States, China and other exporting countries, including with respect to trade policies, treaties, government regulations and tariffs. For example, on January 23, 2017, President Trump signed an executive order withdrawing the United States from the Trans-Pacific Partnership, a global trade agreement intended to include the United States, Canada, Mexico, Peru and a number of Asian countries. In March 2018, President Trump announced tariffs on imported steel and aluminum into the United States that could have a negative impact on international trade generally. Most recently, in January 2019, the United States announced sanctions against Venezuela, which may have an effect on its oil output and in turn affect global oil supply. Protectionist
20
developments, or the perception that they may occur, may have a material adverse effect on global economic conditions, and may significantly reduce global trade. Moreover, increasing trade protectionism may cause an increase in (a) the cost of goods exported from regions globally, (b) the length of time required to transport goods and (c) the risks associated with exporting goods. Such increases may significantly affect the quantity of goods to be shipped, shipping time schedules, voyage costs and other associated costs, which could have an adverse impact on the shipping industry, and therefore, our charterers and their business, operating results and financial condition and could thereby affect their ability to make timely charter hire payments to us and to renew and increase the number of their time charters with us. This could have a material adverse effect on our business, results of operations, financial condition and our ability to pay any cash distributions to our stockholders.
|
•
|
The results of the U.K.’s referendum on withdrawal from the European Union may have a negative effect on global economic conditions, financial markets and our business.
|
In June 2016, a majority of voters in the U.K. elected to withdraw from the EU in a national referendum, and in March 2017, the government of the U.K. formally initiated the process. The referendum was advisory, and the terms of any withdrawal are subject to a negotiation period that could last at least two years after the March 2017 initiation. There is currently no agreement in place regarding the withdrawal, creating significant uncertainty about the future relationship between the U.K. and the EU, including with respect to the laws and regulations that will apply as the U.K. determines which EU‑derived laws to replace or replicate in the event of a withdrawal. The referendum has also given rise to calls for the governments of other EU member states to consider withdrawal. These developments, or the perception that any of them could occur, have had and may continue to have a material adverse effect on global economic conditions and the stability of global financial markets, and may significantly reduce global market liquidity and restrict the ability of key market participants to operate in certain financial markets. Any of these factors could depress economic activity and restrict our access to capital, which could have a material adverse effect on our business and on our consolidated financial position, results of operations and our ability to pay distributions. Additionally, Brexit, or similar events in other jurisdictions, could impact global markets, including foreign exchange and securities markets; any resulting changes in currency exchange rates, tariffs, treaties and other regulatory matters could in turn adversely impact our business and operations.
Risks Related to Industry Regulation
Our industry is subject to a number of regulations, particularly in relation to Health and Safety, environmental protection and maritime conduct. Changes to these regulations could impact our business, our financial position and our operations. In particular:
|
•
|
Regulations relating to ballast water discharge coming into effect during September 2019 may adversely affect our revenues and profitability.
|
The International Maritime Organization ("IMO") has imposed updated guidelines on ballast water management systems specifying the maximum amount of viable organisms allowed to be discharged from a vessel’s ballast water. Depending on the date of the IOPP renewal survey, existing vessels must comply with the updated D-2 standard on or after September 8, 2019. For most vessels, compliance with the D-2 standard will involve installing on-board systems to treat ballast water and eliminate unwanted organisms. The costs of compliance to the updated guidelines may be substantial and adversely affect our revenues and profitability.
Furthermore, United States regulations are currently changing. Although the 2013 Vessel General Permit (“VGP”) program and U.S. National Invasive Species Act (“NISA”) are currently in effect to regulate ballast discharge, exchange and installation, the Vessel Incidental Discharge Act (“VIDA”), which was signed into law on December 4, 2018, requires that the U.S. Coast Guard develop implementation, compliance, and enforcement regulations regarding ballast water within two years. The new regulations could require the installation of new equipment, which may cause us to incur substantial costs.
|
•
|
Our operations are subject to various international, federal, state and local environmental, climate change and greenhouse gas emissions laws and regulations. Compliance with these obligations, and any future changes to environmental legislation and regulation applicable to international and national maritime trade, may have an adverse effect on our business.
|
Our operations are affected by extensive and changing international, national and local environmental protection laws, regulations, treaties and conventions in force in international waters, the jurisdictional waters of the countries in which our vessels operate, as well as the countries of our vessels’ registration, including those governing response to and liability for oil spills, discharges to air and water, and the handling and disposal of hazardous substances and wastes. In some cases, these laws and regulations require us to obtain governmental permits and authorizations before we may conduct certain activities.
21
National laws generally provide for a LNG carrier or offshore LNG facility owner or operator to bear strict liability for pollution, subject to a right to limit liability under applicable national or international regimes for limitation of liability. The International Convention for the Prevention of Pollution from Ships of 1973, as modified by the Protocol of 1978 relating thereto, collectively referred to as MARPOL 73/78 (“MARPOL”), which regulates air emissions, oil pollution and other discharges to the environment, can affect our operations. In addition, our LNG vessels may become subject to the International Convention on Liability and Compensation for Damage in Connection with the Carriage of Hazardous and Noxious Substances by Sea, or the HNS, adopted in 1996 and subsequently amended by the April 2010 Protocol, which is discussed further below.
Laws that apply to our operations change from time to time. For example, in June 2015 the IMO formally adopted the International Code of Safety for Ships using Gases or Low flashpoint Fuels, or the IGF Code, which is designed to minimize the risks involved with ships using low flashpoint fuels, including LNG. Compliance with the IGF Code is mandatory under the International Convention for the Safety of Life at Sea of 1974 (“SOLAS”) through adopted amendments incorporating the IGF Code into SOLAS. The IGF Code and the amendments to SOLAS became effective January 1, 2017.
Further legislation, or amendments to existing legislation, applicable to international and national maritime trade are expected over the coming years in areas such as ship recycling, sewage systems, emission control (including emissions of greenhouse gases), and ballast treatment and handling. Such legislation or regulations may require additional capital expenditures or operating expenses (such as increased costs for low-sulfur fuel) in order for us to maintain our vessels’ compliance with international and/or national regulations.
In addition, due to concern over the risk of climate change, a number of countries, the United States, the EU and the IMO have adopted, or are considering the adoption of, regulatory frameworks to reduce greenhouse gas emission from vessel emissions. These regulatory measures may include, among others, adoption of cap and trade regimes, carbon taxes, increased efficiency standards, and incentives or mandates for renewable energy. These could have a negative impact on our business if such laws, regulations, treaties or international agreements reduce the worldwide demand for oil and gas.
Failure to comply with applicable laws and regulations may result in administrative and civil penalties, criminal sanctions or the suspension or termination of our operations, including, in certain instances, seizure or detention of our vessels. Such legislation or regulations may require additional capital expenditures or operating expenses. Please see "Item 4. Information on the Company-B. Business Overview-Environmental and Other Regulations" below for a more detailed discussion on these topics.
|
•
|
Climate change and greenhouse gas restrictions may adversely impact our operations and markets.
|
Due to concern over the risk of climate change, a number of countries and the IMO have adopted, or are considering the adoption of, regulatory frameworks to reduce greenhouse gas emission from vessel emissions. These regulatory measures may include, among others, adoption of cap and trade regimes, carbon taxes, increased efficiency standards, and incentives or mandates for renewable energy. Also, a treaty may be adopted in the future that requires the adoption of restrictions on shipping emissions. Compliance with changes in laws and regulations relating to climate change could increase our costs of operating and maintaining our vessels and could require us to make significant financial expenditures that we cannot predict with certainty at this time.
Adverse effects upon the oil and gas industry relating to climate change, including growing public concern about the environmental impact of climate change, may also have an effect on demand for our services. For example, increased regulation of greenhouse gases or other concerns relating to climate change may reduce the demand for oil and gas in the future or create greater incentives for use of alternative energy sources. Any long-term material adverse effect on the oil and gas industry could have a significant financial and operational adverse impact on our business that we cannot predict with certainty at this time. Please read “Item 4. Information on the Company-B. Business Overview-Environmental and Other Regulations” below for a more detailed discussion.
|
•
|
Compliance with safety and other vessel requirements imposed by classification societies may be very costly and may adversely affect our business.
|
The hull and machinery of every large, oceangoing commercial vessel must be classed by a classification society authorized by its country of registry. The classification society certifies that a vessel is safe and seaworthy in accordance with the applicable rules and regulations of the country of registry of the vessel and SOLAS. The American Bureau of Shipping and Det Norske Veritas are all members of the International Association of Classification Societies. All of our vessels have been awarded ISM certification or are in the process of being certified and are currently “in class” other than two LNG carriers, the
Gimi
and the
22
Gandria.
The
Gimi
has entered into the shipyard for her conversion into a FLNG vessel
,
whereas the
Gandria
is in lay-up and proposed to be converted into a FLNG vessel.
As part of the certification process, a vessel must undergo annual surveys, intermediate surveys and special surveys. In lieu of a special survey, a vessel’s machinery may be on a continuous survey cycle, under which the machinery would be surveyed periodically over a five-year period. Each of the vessels in our existing fleet is on a planned maintenance system approval, and as such the classification society attends on board once every year to verify that the maintenance of the equipment on board is done correctly. Each of the vessels in our existing fleet is required to be qualified within its respective classification society for dry-docking once every five years subject to an intermediate underwater survey done using an approved diving company in the presence of a surveyor from the classification society.
If any vessel does not maintain its class or fails any annual survey, intermediate survey or special survey, the vessel will be unable to trade between ports and will be unemployable. We would lose revenue while the vessel was off-hire and incur costs of compliance. This would negatively impact our revenues and reduce our cash available for distributions to our shareholders.
Risks Related to Our Common Shares
|
•
|
We are a holding company, and our ability to pay dividends will be limited by the value of investments we currently hold and by the distribution of funds from our subsidiaries and affiliates.
|
We are a holding company whose assets mainly comprise equity interests in our subsidiaries and other quoted and non-quoted companies and our interest in our affiliates. As a result, should we decide to pay dividends, we would be dependent on the performance of our operating subsidiaries and other investments. If we were not able to receive sufficient funds from our subsidiaries and other investments, including from the sale of our investment interests, we would not be able to pay dividends unless we obtain funds from other sources. We may not be able to obtain the necessary funds from other sources on terms acceptable to us.
|
•
|
If we fail to meet the expectations of analysts or investors, our stock price could decline substantially.
|
In some quarters, our results may be below analysts’ or investors’ expectations. If this occurs, the price of our common stock could decline. Important factors that could cause our revenue and operating results to fluctuate from quarter to quarter include, but are not limited to:
|
•
|
prevailing economic and market conditions in the natural gas and energy markets;
|
|
•
|
negative global or regional economic or political conditions, particularly in LNG-consuming regions, which could reduce energy consumption or its growth;
|
|
•
|
declines in demand for LNG or the services of LNG carriers, FSRUs or FLNGs;
|
|
•
|
increases in the supply of LNG carrier capacity operating in the spot market or the supply of FSRUs or FLNGs;
|
|
•
|
marine disasters; war, piracy or terrorism; environmental accidents; or inclement weather conditions;
|
|
•
|
mechanical failures or accidents involving any of our vessels; and
|
|
•
|
dry-dock scheduling and capital expenditures.
|
Most of these factors are not within our control, and the occurrence of one or more of them may cause our operating results to vary widely.
|
•
|
Our common share price may be highly volatile and future sales of our common shares could cause the market price of our common shares to decline.
|
Historically, the market prices of securities of shipping companies have experienced fluctuations that often have been unrelated or disproportionate to the operating results of those companies. Our common shares have traded on The Nasdaq Global Select Market, or Nasdaq, since December 12, 2002 under the symbol "GLNG." We cannot assure you that an active and liquid public market for our common shares will continue. The market price for our common shares has historically fluctuated over a wide range. In 2018, the closing market price of our common shares on Nasdaq ranged from a low of $21.36 on December 20, 2018 to a high of $34.74 per share on May 21, 2018. As of
March 15, 2019
, the closing market price of our common shares on Nasdaq was $21.81 per share. The market price of our common shares may continue to fluctuate significantly in response to many factors such as actual or anticipated fluctuations in our quarterly or annual results and those of other public companies in our industry, the suspension of our dividend payments, mergers and strategic alliances in the shipping industry, market conditions in the LNG shipping industry, developments in our FLNG investments, shortfalls in our operating results
23
from levels forecast by securities analysts, announcements concerning us or our competitors, the general state of the securities market, and other factors, many of which are beyond our control. The market for common shares in this industry may be equally volatile. Therefore, we cannot assure our shareholders that they will be able to sell any of our common shares that they may have purchased at a price greater than or equal to the original purchase price.
Additionally, sales of a substantial number of our common shares in the public market, or the perception that these sales could occur, may depress the market price for our common shares. These sales could also impair our ability to raise additional capital through the sale of our equity securities in the future.
|
•
|
We may issue additional common shares or other equity securities without our shareholders’ approval, which would dilute their ownership interests and may depress the market price of our common shares.
|
We may issue additional common shares or other equity securities in the future in connection with, among other things, vessel conversions, future vessel acquisitions, repayment of outstanding indebtedness or our equity incentive plan, in each case without shareholder approval in a number of circumstances.
Our issuance of additional common shares or other equity securities would have the following effects:
|
•
|
our existing shareholders’ proportionate ownership interest in us will decrease;
|
|
•
|
the amount of cash available for dividends payable on our common shares may decrease;
|
|
•
|
the relative voting strength of each previously outstanding common share may be diminished; and
|
|
•
|
the market price of our common shares may decline.
|
|
•
|
Because we are a Bermuda corporation, our shareholders may have less recourse against us or our directors than shareholders of a U.S. company have against the directors of that U.S. Company.
|
Because we are a Bermuda company, the rights of holders of our common shares will be governed by Bermuda law and our memorandum of association and bye-laws. The rights of shareholders under Bermuda law may differ from the rights of shareholders in other jurisdictions, including with respect to, among other things, rights related to interested directors, amalgamations, mergers and acquisitions, takeovers, the exculpation and indemnification of directors and shareholder lawsuits.
Among these differences is a Bermuda law provision that permits a company to exempt a director from liability for any negligence, default, or breach of a fiduciary duty except for liability resulting directly from that director’s fraud or dishonesty. Our bye-laws provide that no director or officer shall be liable to us or our shareholders unless the director’s or officer’s liability results from that person’s fraud or dishonesty. Our bye-laws also require us to indemnify a director or officer against any losses incurred by that director or officer resulting from their negligence or breach of duty, except where such losses are the result of fraud or dishonesty. Accordingly, we carry directors’ and officers’ insurance to protect against such a risk.
In addition, under Bermuda law, the directors of a Bermuda company owe their duties to that company and not to the shareholders. Bermuda law does not, generally, permit shareholders of a Bermuda company to bring an action for a wrongdoing against the company or its directors, but rather the company itself is generally the proper plaintiff in an action against the directors for a breach of their fiduciary duties. Moreover, class actions and derivative actions are generally not available to shareholders under Bermuda law. These provisions of Bermuda law and our bye-laws, as well as other provisions not discussed here, may differ from the law of jurisdictions with which shareholders may be more familiar and may substantially limit or prohibit a shareholder's ability to bring suit against our directors or in the name of the company. The Bermuda courts, however, would ordinarily be expected to permit a shareholder to commence an action in the name of a company to remedy a wrong to the company where the act complained of is alleged to be beyond the corporate power of the company or illegal, or would result in the violation of the company’s memorandum of association or bye-laws. Furthermore, consideration would be given by a Bermuda court to acts that are alleged to constitute a fraud against minority shareholders or, for instance, where an act requires the approval of a greater percentage of the company’s shareholders than that which actually approved it.
It's also worth noting that under Bermuda law, our directors and officers are required to disclose to our board any material interests they have in any contract entered into by our company or any of its subsidiaries with third parties. Our directors and officers are also required to disclose their material interests in any corporation or other entity which is party to a material contract with our company or any of its subsidiaries. A director who has disclosed his or her interests in accordance with Bermuda law may participate in any meeting of our board, and may vote on the approval of a material contract, notwithstanding that he or she has a material interest.
24
|
•
|
Because our offices and most of our assets are outside the United States, our shareholders may not be able to bring a suit against us, or enforce a judgment obtained against us in the United States.
|
We, and most of our subsidiaries, are incorporated in jurisdictions outside the U.S. and substantially all of our assets and those of our subsidiaries are located outside the U.S. In addition, most of our directors and officers are non-residents of the U.S., and all or a substantial portion of the assets of these non-residents are located outside the U.S. As a result, it may be difficult or impossible for U.S. investors to serve process within the U.S. upon us, our subsidiaries, or our directors and officers, or to enforce a judgment against us for civil liabilities in U.S. courts. In addition, you should not assume that courts in the countries in which we or our subsidiaries are incorporated or where our or our subsidiaries'’ assets are located would enforce judgments of U.S. courts obtained in actions against us or our subsidiaries based upon the civil liability provisions of applicable U.S. federal and state securities laws, or would enforce, in original actions, liabilities against us or our subsidiaries based on those laws.
Tax Risks
|
•
|
A change in tax laws in any country in which we operate could adversely affect us
|
Tax laws, treaties and regulations are highly complex and subject to interpretation. Consequently, we and our subsidiaries are subject to changing laws, treaties and regulations in and between the countries in which we operate. Our tax expense is based on our interpretation of the tax laws in effect at the time the expense was incurred. A change in tax laws, treaties or regulations, or in the interpretation thereof, could result in a materially higher tax expense or a higher effective tax rate on our earnings. Such changes may include measures enacted in response to the ongoing initiatives in relation to fiscal legislation at an international level such as the Action Plan on Base Erosion and Profit Shifting of the Organization for Economic Co-Operation and Development.
|
•
|
United States tax authorities could treat us as a “passive foreign investment company”, which could have adverse United States federal income tax consequences to U.S. shareholders.
|
A foreign corporation will be treated as a "passive foreign investment company," or PFIC, for U.S. federal income tax purposes if either (1) at least 75% of its gross income during the taxable year consists of certain types of "passive income" or (2) at least 50% of the average value of the corporation's assets during such taxable year produce or are held for the production of those types of "passive income." For purposes of these tests, "passive income" includes dividends, interest, and gains from the sale or exchange of investment property and rents and royalties other than rents and royalties which are received from unrelated parties in connection with the active conduct of a trade or business. For purposes of these tests, income derived from the performance of services does not constitute "passive income." U.S. shareholders of a PFIC are subject to a disadvantageous U.S. federal income tax regime with respect to the income derived by the PFIC, the distributions they receive from the PFIC and the gain, if any, they derive from the sale or other disposition of their shares in the PFIC.
Based on our current and expected future method of operation, we do not believe that we will be a PFIC with respect to any taxable year. In this regard, we intend to treat the gross income we derive or are deemed to derive from our time chartering activities as services income, rather than rental income. Accordingly, we believe that our income from our time chartering activities does not constitute "passive income," and the assets that we own and operate in connection with the production of that income do not constitute passive assets.
There is, however, no direct legal authority under the PFIC rules addressing our method of operation. We believe there is substantial legal authority supporting our position consisting of case law and United States Internal Revenue Service, or IRS, pronouncements concerning the characterization of income derived from time charters and voyage charters as services income for other tax purposes. However, we note that there is also authority which characterizes time charter income as rental income rather than services income for other tax purposes. Accordingly, no assurance can be given that the IRS or a court of law will accept our position, and there is a risk that the IRS or a court of law could determine that we are a PFIC. Moreover, no assurance can be given that we would not constitute a PFIC for any future taxable year if there were to be changes in the nature and extent of our operations.
If the IRS were to find that we are or have been a PFIC for any taxable year, our U.S. shareholders will face adverse U.S. tax consequences and certain information reporting requirements. Under the PFIC rules, unless those shareholders make a certain election available (which election could itself have adverse consequences for such shareholders), such shareholders would be liable to pay U.S. federal income tax at the then prevailing income tax rates on ordinary income plus interest upon excess distributions and upon any gain from the disposition of our common shares, as if the excess distribution or gain had been
25
recognized ratably over the shareholder's holding period of our common shares. Please see the section of this annual report entitled "Taxation" under "Item 10. Additional Information-E. Taxation" for a more comprehensive discussion of the U.S. federal income tax consequences if we were to be treated as a PFIC.
|
•
|
We may have to pay tax on United States source income, which would reduce our earnings.
|
Under the United States Internal Revenue Code of 1986 as amended, or the Code, 50% of the gross shipping income of a vessel owning or chartering corporation, such as ourselves and our subsidiaries, that is attributable to transportation that begins or ends, but that does not both begin and end, in the United States, may be subject to a 4% U.S. federal income tax without allowance for deduction, unless that corporation qualifies for exemption from tax under Section 883 of the Code and the applicable Treasury Regulations recently promulgated thereunder.
We expect that we and each of our subsidiaries will qualify for this statutory tax exemption and we will take this position for U.S. federal income tax return reporting purposes. However, there are factual circumstances beyond our control that could cause us to lose the benefit of this tax exemption and thereby become subject to U.S. federal income tax on our U.S. source income. Therefore, we can give no assurances that this tax exemption will apply to us or to any of our subsidiaries.
If we or our subsidiaries are not entitled to exemption under Section 883 of the Code for any taxable year, we or our subsidiaries could be subject for those years to an effective 4% U.S. federal income tax on the gross shipping income we or our subsidiaries derive during the year that are attributable to the transport of cargoes to or from the United States. The imposition of this tax would have a negative effect on our business and would result in decreased earnings available for distribution to our shareholders. Please see “Item 10. Additional Information-E. Taxation" for further information.
|
•
|
We may become subject to taxation in Bermuda which would negatively affect our results.
|
At the present time, there is no Bermuda income or profits tax, withholding tax, capital gains tax, capital transfer tax, estate duty or inheritance tax payable by us or by our shareholders in respect of our shares. We have obtained an assurance from the Minister of Finance of Bermuda under the Exempted Undertakings Tax Protection Act 1966 that, in the event that any legislation is enacted in Bermuda imposing any tax computed on profits or income, or computed on any capital asset, gain or appreciation or any tax in the nature of estate duty or inheritance tax, such tax shall not, until March 31, 2035, be applicable to us or to any of our operations or to our shares, debentures or other obligations except insofar as such tax applies to persons ordinarily resident in Bermuda or is payable by us in respect of real property owned or leased by us in Bermuda. We cannot assure you that a future Minister would honor that assurance, which is not legally binding, or that after such date we would not be subject to any such tax. If we were to become subject to taxation in Bermuda, our results of operations could be adversely affected.
|
•
|
As a Bermuda exempted company incorporated under Bermuda law with subsidiaries in another offshore jurisdiction, our operations may be subject to economic substance requirements.
|
On December 5, 2017, following an assessment of the tax policies of various countries by the Code of Conduct Group for Business Taxation of the European Union (the “COCG”), the Council of the European Union approved and published Council conclusions containing a list of non-cooperative jurisdictions for tax purposes (the “Conclusions”). Although at that time not considered “non-cooperative jurisdictions,” certain countries, including Bermuda, were listed as having “tax regimes that facilitate offshore structures which attract profits without real economic activity.” In connection with the Conclusions, and to avoid being placed on the list of “non-cooperative jurisdictions,” the government of Bermuda, among others, committed to addressing COCG proposals relating to economic substance for entities doing business in or through their respective jurisdictions and to pass legislation to implement any appropriate changes by the end of 2018. The Economic Substance Act 2018 and the Economic Substance Regulations 2018 of Bermuda (the “Economic Substance Act” and the “Economic Substance Regulations”, respectively) became operative on December 31, 2018. The Economic Substance Act applies to every registered entity in Bermuda that engages in a relevant activity and requires that every such entity shall maintain a substantial economic presence in Bermuda. A relevant activity for the purposes of the Economic Substance Act is banking business, insurance business, fund management business, financing business, leasing business, headquarters business, shipping business, distribution and service centre business, intellectual property holding business and conducting business as a holding entity, which may include a pure equity holding entity. The Economic Substance Act provides that a registered entity that carries on a relevant activity complies with economic substance requirements if (a) it is directed and managed in Bermuda, (b) its core income-generating activities (as may be prescribed) are undertaken in Bermuda with respect to the relevant activity, (c) it maintains adequate physical presence in Bermuda, (d) it has adequate full time employees in Bermuda with suitable qualifications and (e) it incurs adequate operating expenditure in Bermuda in relation to the relevant activity.
26
A registered entity that carries on a relevant activity is obliged under the Economic Substance Act to file a declaration in the prescribed form (the “Declaration”) with the Registrar of Companies (the “Registrar”) on an annual basis. The Economic Substance Regulations provide that minimum economic substance requirements shall apply in relation to an entity if the entity is a pure equity holding entity which only holds or manages equity participations, and earns passive income from dividends, distributions, capital gains and other incidental income only. The minimum economic substance requirements include a) compliance with applicable corporate governance requirements set forth in the Bermuda Companies Act 1981 including keeping records of account, books and papers and financial statements and b) submission of an annual economic substance declaration form. Additionally, the Economic Substance Regulations provide that a pure equity holding entity complies with economic substance requirements where it also has adequate employees for holding and managing equity participations, and adequate premises in Bermuda.
Certain of our subsidiaries may from time to time be organized other jurisdictions identified by the COCG based on global standards set by the Organization for Economic Co-operation and Development with the objective of preventing low-tax jurisdictions from attracting profits from certain activities. These jurisdictions, including the Marshall Islands, have also enacted economic substance laws and regulations which we may be obligated to comply with. If we fail to comply with our obligations under the Economic Substance Act or any similar law applicable to us in any other jurisdiction, we could be subject to financial penalties and spontaneous disclosure of information to foreign tax officials in related jurisdictions and may be struck from the register of companies in Bermuda or such other jurisdiction. Any of these actions could have a material adverse effect on our business, financial condition and results of operations.
|
•
|
Bermuda’s continued presence on a list of non-cooperative jurisdictions by the European Union could harm our business.
|
On March 12, 2019, Bermuda was placed by the EU on its list of non-cooperative jurisdictions for tax purposes due to an issue with Bermuda's economic substance legislation which was not resolved in time for the EU's deadline. At present, the impact of being included on the list of non-cooperative jurisdictions for tax purposes is unclear. While Bermuda has now amended its legislation which the Bermuda Government has stated has addressed this issue and expects to be removed from the list of non-cooperative jurisdictions at the EU's Economic and Financial Affairs Council's next meeting which is scheduled for May 2019, there can be no assurance that Bermuda will be removed from such list. If Bermuda is not removed from the list and sanctions or other financial, tax or regulatory measures were applied by European Member States to countries on the list or further economic substance requirements were imposed by Bermuda, our business could be harmed.
A. History and Development of the Company
We are a midstream LNG company engaged primarily in the transportation and regasification of LNG and the liquefaction of natural gas. We are engaged in the acquisition, ownership, operation and chartering of LNG carriers, FSRUs and FLNGs and the development of LNG projects through our subsidiaries, affiliates and joint venture.
As of
March 15, 2019
, we, together with our affiliates Golar Partners and Golar Power, have a combined fleet of twenty-seven vessels, comprised of eighteen LNG carriers, eight FSRUs and one FLNG. Of these vessels, six of the FSRUs and four of the LNG carriers are owned by Golar Partners and one of the FSRUs and two of the LNG carriers are owned by Golar Power. Most of the Golar Partners owned vessels are on long-term time charters. Seven of our LNG carriers, one of our FSRUs and two of Golar Power's LNG carriers are participating in the LNG carrier pool, referred to as the Cool Pool. Of the remaining vessels, two of our LNG carriers are on shorter-term time charters, the
Gandria
is being contemplated for conversion into a FLNG and the
Gimi
entered Keppel Shipyard Limited's ("Keppel") shipyard in early 2019 to commence initial work for her conversion into a FLNG to service the Greater Tortue Ahmeyim project.
We intend to leverage our relationships with existing customers and continue to develop relationships with other industry participants. Our goal is to earn higher margins through maintaining strong service-based relationships combined with flexible and innovative LNG shipping, FSRU and FLNG solutions. We believe customers place their confidence in our shipping, storage, regasification and liquefaction services based on the reliable and safe way we conduct our, our affiliates’ and our joint venture's LNG operations.
In line with our ambition to become an integrated LNG midstream asset provider and our experience of converting LNG carriers into FSRUs, we have successfully converted one of our LNG carriers, the
Hilli Episeyo
, into a FLNG and commenced conversion of another, the
Gimi
. In addition, we have entered into a definitive contract with Keppel and Black & Veatch for the conversion of another LNG carrier, the
Gandria
,
into a FLNG. Our aim is to find strong strategic partners that have an interest in utilizing one or more of our FLNGs.
27
We are listed on Nasdaq under the symbol "GLNG". We were incorporated under the name Golar LNG Limited as an exempted company under the Bermuda Companies Act of 1981 in the Islands of Bermuda on May 10, 2001 and maintain our principal executive headquarters at 2nd Floor, S.E. Pearman Building, 9 Par-la-Ville Road, Hamilton HM 11, Bermuda. Our telephone number at that address is +1 441 295 4705. Our principal administrative offices are located at The Zig Zag, 70 Victoria Street, London, SW1E 6SQ, United Kingdom and our telephone number at that address is +44 207 063 7900.
The SEC maintains an internet site that contains reports, proxy and information statements, and other information that we file electronically with the SEC, can be obtained from the SEC’s website at (http://www.sec.gov) or from “SEC fillings” tab in the “Investor Relations” section of our website (www.golarlng.com).
Investments
Since January 1, 2016, we own interests in the following companies which we account for using the equity method:
|
a.
|
Golar Partners
|
In September 2007, we formed Golar Partners under the laws of the Republic of the Marshall Islands as a wholly-owned subsidiary. Golar Partners was formed to own vessels with long-term charters, typically five years or longer, through wholly-owned subsidiaries in order to distribute the different risk profiles of the different vessel types of total fleet controlled or affiliated with Golar. Golar Operating LLC, or the General Partner, our wholly-owned subsidiary, was also formed in September 2007 to act as the general partner of Golar Partners under the limited partnership agreement of Golar Partners, and under that agreement the General Partner received a 2% general partner interest and 100% of the IDRs in Golar Partners.
In April 2011, we completed the IPO of Golar Partners. Golar Partners is listed on Nasdaq under the symbol "GMLP". In connection with this IPO, we entered into an Omnibus Agreement, governing, among other things when the Company and Golar Partners may compete against each other as well as rights of first offer on certain FSRUs and LNG carriers. Since December 2012, Golar Partners has been considered as an affiliate entity and not as our controlled subsidiary. As of
March 15, 2019
, we own 100% of the general partner units and 30.6% of the common units in Golar Partners, in addition to 100% of the IDRs.
On October 13, 2016, we entered into an equity exchange agreement with Golar Partners in which we reset our rights to receive cash distributions in respect of our interests in the incentive distribution rights, or Old IDRs, in exchange for the issuance of (i) New IDRs, (ii) an aggregate of 2,994,364 common units and 61,109 general partner units, and (iii) an aggregate of up to 748,592 additional common units and up to 15,278 additional general partner units that may be issued if target distributions are met ("the Earn-Out Units"). Based on the agreement, half of the Earn-Out Units ("first tranche") would vest if Golar Partners paid a distribution equal to, or greater than, $0.5775 per common unit in each of the quarterly periods ended December 31, 2016, March 31, 2017, June 30, 2017 and September 30, 2017. Having satisfied the minimum quarterly distribution in respect of these quarters, Golar Partners issued to Golar 374,295 common units and 7,639 general partner units on November 15, 2017. The New IDRs result in the minimum distribution level increasing from $0.3850 per common unit to $0.5775 per common unit. The fair value of the Old IDRs was not materially different to the fair value of all of the newly issued instruments. The agreement also required Golar Partners to pay Golar the distributions that it would have been entitled to receive on these units in respect of each of those four preceding quarters. Therefore, in connection with the issuance of the above Earn-Out Units, Golar also received $0.9 million in dividends in the prior period. The remaining Earn-Out Units ("second tranche") would be issued if Golar Partners paid a distribution equal to $0.5775 per common unit in the periods ending December 31, 2017, March 31, 2018, June 30, 2018 and September 30, 2018. Having not satisfied the minimum quarterly distribution over all of these quarters, the second tranche did not vest.
Since the IPO of Golar Partners, we have sold equity interests in six vessels to Golar Partners for an aggregate value of $1.9 billion. As of
March 15, 2019
, Golar Partners had a fleet of ten vessels acquired from or contributed by us to provide funding for our projects as well as our growth.
In July 2018, we and the affiliates of Keppel Shipyard Limited ("Keppel") and Black & Veatch Corporation ("B&V") (together, the "Sellers"), completed the sale ("Hilli Disposal") to Golar Partners of common units in our consolidated subsidiary Hilli LLC (the "Hilli Common Units"), which owns Golar Hilli Corp. ("Hilli Corp"), the disponent owner of the
Hilli Episeyo
. Please refer to refer to "Item 4. Information on the Company-A. History and Development of the Company-FLNG segment-The Hilli Disposal" for further information.
28
|
b.
|
Golar Power
|
In order to further develop and finance our LNG based downstream investment opportunities, in June 2016, we formed Golar Power, a 50/50 joint venture with investment vehicles affiliated with the private equity firm Stonepeak Infrastructure Partners, or Stonepeak. The joint venture company, Golar Power, offers integrated LNG based downstream solutions, through the ownership and operation of FSRUs and associated terminal and power generation infrastructure. Golar Power currently has a 50% interest in a Brazilian corporation, CELSE, that was formed for the purpose of constructing and operating a combined cycle, gas fired, power plant with installed capacity of 1,515 megawatts located in the municipality of Barra dos Coqueiros in the State of Sergipe in Brazil. The cost of constructing the power plant and related terminal, including taxes and financing costs, is estimated at $1.7 billion. In April 2018, CELSE reached financial closing of its $1.3 billion non-recourse debt facility, which fully funds the project. As of
March 15, 2019
, the construction of the Sergipe power plant remains on track for commencement of operations early 2020.
Golar Power also owns a FSRU, the
Golar Nanook
,
constructed at Samsung shipyard, delivered to Golar Power in September 2018 and has arrived in Brazil, and two modern 160,000 cbm trifuel LNG carriers, the
Golar Penguin
and the
Golar Celsius
, currently operating in the Cool Pool, suited for conversion to FSRUs. In connection with the financial close of the Sergipe Project funding, Golar Power has also executed contracts with CELSE to charter the FSRU
Golar Nanook
for a period of 25 years.
Golar Power has also entered into an Omnibus Agreement with Golar Partners, under which Golar Partners has a right of first refusal with respect to any transfers or sales of any LNG carrier or FSRU owned by Golar Power and operating under a charter for five or more years.
|
c.
|
Avenir LNG Limited (“Avenir”)
|
In October 2018, Avenir issued a private placement of 99 million shares at a par price of $1.00 per share, which was successfully completed at a subscription price of $1.00 per share. Of the 99 million shares placed, we subscribed for 24.8 million shares, representing an investment of $24.8 million, or 25%. The investment is part of a combined commitment of up to $182.0 million from Stolt-Nielsen (an entity affiliated with one of our directors, Niels Stolt-Nielsen), Höegh and Golar for the pursuit of opportunities in small-scale LNG, including the delivery of LNG to areas of stranded gas demand, the development of LNG bunkering services and supply to the transportation sector. Following the initial equity offering Stolt-Nielsen, Höegh and Golar are committed to fund $72.0 million, of which our commitment is $18.0 million.
Avenir currently has four small-scale LNG newbuildings under construction at Keppel Singmarine in Nantong, China and another two on order from Sinopacific Offshore Engineering in Nantong, China. Avenir also holds 80% ownership in an LNG terminal and distribution facility under development in the Italian port of Oristano, Sardinia. Avenir is currently listed on the Norwegian OTC market. Subsequent to the placement of additional 11 million shares with other investors in November 2018, we and Höegh each currently hold a 22.5% share in Avenir, with Stolt-Nielsen holding 45%, and the remaining 10% being held by a group of institutional and other professional investors.
|
d.
|
OneLNG
|
In July 2016, Golar and Schlumberger B.V. ("Schlumberger") entered into an agreement to form OneLNG, a joint venture, with the intention to offer an integrated upstream and midstream solution for the development of low cost gas reserves to LNG. In accordance with the joint venture and shareholders' agreement, Golar holds 51% and Schlumberger the remaining 49% of OneLNG. The delays in finalizing a debt financing package for the Fortuna FLNG project, together with other capital and resource priorities, has resulted in a decision from Schlumberger to end their participation in the project. Golar and Schlumberger, as a result of this, have commenced the winding down of OneLNG and will work on FLNG projects as required on a case-by-case basis. As a result, we have written down our investment in OneLNG to $nil as at December 31, 2018.
Disposals
Since January 1, 2016, we have entered into the following sale and purchase transactions:
|
•
|
In May 2016, we sold our equity interests in the company ("Golar LNG NB13 Corporation") that is the disponent owner of the
Golar Tundra
and the related time charter for $330 million less the net lease obligations under the related lease agreement with China Merchant Bank Financial Leasing, or CMBL, plus other purchase price adjustments. At the time of sale, the
Golar Tundra
was subject to a time charter with West Africa Gas Limited, or WAGL. Concurrent with the closing of the sale of Tundra Corp, we entered into an agreement with Golar Partners (as amended, the "Tundra Letter Agreement") which provided, among others, that in the event the
Golar Tundra
had not commenced service under the
|
29
charter with WAGL by May 23, 2017, Golar Partners had the option (the "Tundra Put Right") to require us to repurchase Tundra Corp at a price equal to the original purchase price (the "Tundra Put Sale"). The
Golar Tundra's
project made limited progress and, on May 30, 2017, Golar Partners elected to exercise the Tundra Put Right.
In connection with the exercise of the Tundra Put Right, we and Golar Partners entered into an agreement pursuant to which we agreed to purchase Tundra Corp from Golar Partners on the date of the closing of the Tundra Put Sale (the "Put Sale Closing Date") for an amount equal to $107 million (the "Deferred Purchase Price") plus an additional amount equal to 5% per annum of the Deferred Purchase Price (the "Additional Amount"). The Deferred Purchase Price and the Additional Amount were due and payable by us on the earlier of (a) the date of the closing of the Hilli Disposal and (b) March 31, 2018. Golar Partners agreed to accept the Deferred Purchase Price and the Additional Amount in lieu of a cash payment on the Put Sale Closing Date in return for an option (which Golar Partners have exercised) to purchase an interest in the
Hilli Episeyo
; and
|
•
|
On July 12, 2018 (the "Closing Date"), we and the affiliates of Keppel and Black & Veatch Corporation, completed the Hilli Disposal to Golar Partners of common units in our consolidated subsidiary Hilli LLC (the "Hilli Common Units"), which owns Hilli Corp, the disponent owner of
Hilli Episeyo
(the "
Hilli
"). The selling price for the Hilli Disposal was $658 million, less 50% of our net lease obligations under the Hilli Facility on the Closing Date and working capital adjustments. On August 15, 2017, concurrently with our entry into the purchase and sale agreement for the Hilli Disposal (the "Hilli Sale Agreement"), we received a deposit from Golar Partners, which, together with accrued interest, equaled $71.9 million on the Closing Date (the "Hilli deposit"), combined with Golar Partners’ payment for its exercise of the Tundra Put Right, which, together with accrued interest, equaled $110.1 million on the Closing Date (the "Deferred Purchase Price"). We applied the Hilli Deposit, the Deferred Purchase Price and interest accrued thereon as payment for the Hilli Disposal. Please see note 6 "Disposal of Long Lived Assets" of our consolidated financial statements included herein.
|
In addition:
|
•
|
In connection with the formation of the Golar Power joint venture, we contributed to it our former subsidiaries that: (i) owned the
Golar Penguin
and the
Golar Celsius;
(ii) held the FSRU newbuilding contract with Samsung, which was subsequently delivered and named
Golar Nanook
; and (iii) held the rights to participate in the Sergipe Project. Subsequently in July 2016, we received net proceeds of $113 million from our sale to Stonepeak of 50% of the ordinary share capital of Golar Power. Accordingly, effective from the date of the sale to Stonepeak, we deconsolidated the results and net assets of Golar Power.
|
Since January 1, 2016, we have also refinanced certain of our vessels pursuant to sale and leaseback arrangements as further described in note 5 "Variable Interest Entities" of our consolidated financial statements included herein.
B. Business Overview
Our Business Strategy
Golar’s vision is to break the mold in LNG. Our strategic intent is to become an integrated gas to power energy business. We aim to combine our marine expertise and innovative floating LNG assets with strong industry partnerships to provide the most competitive LNG solution to monetize natural gas reserves and deliver LNG, ship the LNG, regasify the LNG through our FSRUs, and ultimately generate and sell power from our gas-fired power stations.
Our four areas of strategic focus are to:
|
•
|
Operate a high-quality, first class LNG carrier fleet:
We own and operate a fleet of high quality LNG carriers with an average age of 6.4 years. Seven of our ten carriers were delivered within the last five years and utilize fuel efficient propulsion and low boil-off technology. Our vessels are compatible with most LNG loading and receiving terminals worldwide. We also manage carriers on behalf of our affiliate companies, Golar Partners and Golar Power. A potential separation or spin-off of our LNG shipping fleet is under consideration. This may reduce volatility in our future cash flows and better position our long-term contracting business for infrastructure investors.
|
|
•
|
Maintain leadership in FSRUs and embed this into future power projects through our affiliate, Golar Power:
We are one of the industry leaders in the development, delivery and operation of both newbuild and converted FSRUs based on a strong record of successful project delivery and highly reliable vessel operation. Our joint venture, Golar Power, is
|
30
currently seeking new FSRU projects and power station opportunities in addition to building an integrated gas to power project at Sergipe in Brazil.
|
•
|
Capture new FLNG opportunities using our unique skills as a developer, owner and operator of FLNG vessels:
Our FLNG investment proposition is built on a sound technical and commercial offering, derived from structurally lower unit capital costs and short lead times. FLNG allows smaller resource holders to enter the LNG business and occupy a legitimate space alongside the largest resource holders, major oil companies and world-scale LNG buyers. For established LNG industry participants, the prospect of our low-cost, low-risk, fast-track FLNG solution provides a compelling alternative to traditional land-based projects.
|
|
•
|
Leverage our affiliation with Golar Partners to monetize long-term midstream contracts:
We believe our affiliation with Golar Partners positions us to pursue a broader array of opportunities. Since the Partnership’s IPO in April 2011, we have sold six vessels to Golar Partners in exchange for consideration of $1.9 billion. In addition to this, we closed the sale of an interest in the
Hilli Episeyo
.
We invested a substantial portion of the sale proceeds in newbuild and asset conversion projects that we expect will generate attractive returns over the coming years. As of
March 15, 2019
, we have a 32.0% interest (including our 2% general partner interest) in Golar Partners and hold 100% of its IDRs.
|
However, we can provide no assurance that we will be able to implement our business strategies described above. For further discussion of the risks that we face, please read "Item 3. Key Information- D. Risk Factors".
The Liquefied Natural Gas (
“
LNG
”
) Industry
The need to transport natural gas over long distances across oceans led to the development of the international LNG trade. LNG shipping provides a cost-effective and safe means for transporting natural gas overseas. The LNG is transported overseas in specially built tanks on double-hulled ships to a receiving terminal, where it is offloaded and stored in heavily insulated tanks. In regasification facilities at the receiving terminal, the LNG is returned to its gaseous state (or regasified) and then carried by pipeline for distribution to power stations and other natural gas customers.
The following diagram displays the flow of natural gas and LNG from production to consumption.
LNG Supply Chain

The LNG supply chain involves the following components:
31
Exploring and drilling:
Natural gas is produced and transported via pipeline to natural gas liquefaction facilities located along the coast of the producing country. The advent of floating liquefaction also sees the gas being piped to offshore liquefaction facilities.
Production and liquefaction:
Natural gas is cooled to a temperature of minus 162 degrees celsius, transforming the gas into a liquid, which reduces its volume to approximately 1/600th of its volume in a gaseous state. The reduced volume facilitates economical storage and transportation by ship over long distances, enabling countries with limited natural gas reserves, and limited access to long-distance transmission pipelines or concerns over security of supply to meet their demand for natural gas.
Shipping:
LNG is loaded onto specially designed, double-hulled LNG carriers and transported overseas from the liquefaction facility to the receiving terminal.
Regasification:
At the receiving terminal (either onshore or aboard FSRUs), the LNG is returned to its gaseous state, or regasified. It may also be transferred to small scale LNG vessels that deliver LNG to users nearby.
Storage, distribution, marketing & power generation:
Once regasified, the natural gas is stored in specially designed facilities or transported to power producers and natural gas consumers via pipelines.
The basic costs of producing, liquefying, transporting and regasifying LNG are much higher than in an equivalent oil supply chain. This high unit cost of supply has, in the recent past, led to the pursuit of ever-larger land-based facilities in order to achieve improved economies of scale. To address the escalating costs, more cost competitive FLNG solutions across a spectrum of project sizes have been developed by a handful of major oil companies and also by Golar. We believe that many previously uneconomic pockets of gas can now be monetized and this will add to reserves and further underpin the long term attractiveness of gas.
Our Operations
We reported three reportable segments since 2017:
|
•
|
Vessel operations
- We operate and subsequently charter out vessels on fixed terms to customers. We also provide technical vessel management services for our fleet as well as the fleets of Golar Partners and Golar Power.
|
|
•
|
FLNG
- In 2014, we ordered our first FLNG based on the conversion of our existing LNG carrier, the
Hilli.
The
Hilli
FLNG conversion was completed and the vessel was accepted by the customer under the LTA. In February 2019 we entered into an agreement with BP for the charter of a FLNG, which will be converted from our existing LNG carrier, the
Gimi
, for a 20-year period expected to commence production in 2022. The
Gimi
was relocated from layup to Keppel Shipyard to proceed with the conversion.
|
|
•
|
Power
- In July 2016, we entered into certain agreements forming a 50/50 joint venture, Golar Power, with private equity firm Stonepeak. Golar Power offers integrated LNG based downstream solutions, through the ownership and operation of a FSRU and associated terminal and power generation infrastructure.
|
Vessel Operations
As of
March 15, 2019
, our current fleet comprises two LNG carriers undergoing or being contemplated for conversions into FLNGs, 10 LNG carriers and one FSRU.
LNG Carriers
LNG carriers are designed to transport LNG between liquefaction facilities and import terminals for regasification after the natural gas is liquefied. Our LNG carriers utilize the LNG that naturally boils off during transportation in their propulsion system.
According to Fearnleys, 33.6 metric tons of additional supply of LNG mainly from the United States will be available in 2019, much of which will be sold to the Far East. The associated increase in ton miles is expected to quickly absorb all available LNG carriers on the water. It has been estimated that the current global fleet of LNG carriers and those LNG carriers expected to be delivered in 2019 are insufficient to carry this expected new production. The market is currently expected to remain short of LNG carriers until the second half of 2021.
32
FSRUs
Floating LNG regasification projects first emerged as a solution to the difficulties and protracted process of obtaining permits to build shore-based LNG reception facilities (especially along the North American coasts). Due to their offshore location, FSRU facilities are significantly less likely than onshore facilities to be met with resistance in local communities, which is especially important in the case of a facility that is intended to serve a highly populated area where there is a high demand for natural gas. As a result, it is typically easier and faster for FSRUs to obtain necessary permits than for comparable onshore facilities. FSRU projects can typically be completed in less time (2 to 3 years compared to 4 or more years for land based projects) and at a significantly lower cost (20-50% less) than land based alternatives. In addition, FSRUs offer a more flexible solution than land based terminals. They can be used as an LNG carrier, a regasification shuttle vessel or permanently moored as a FSRU. FSRUs offer a fast track regasification solution for markets that need immediate access to LNG supply. FSRUs can also be utilized as bridging solutions until a land-based terminal is constructed. In this way, FSRUs are both a replacement for, and complement to, land-based regasification alternatives.
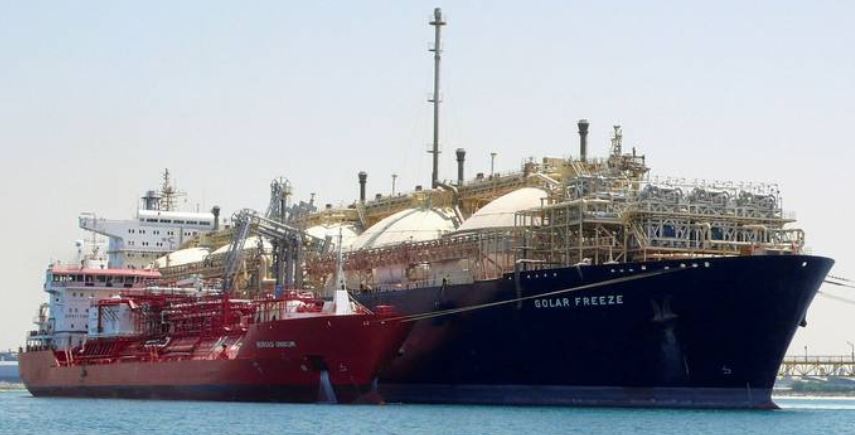
FSRU Golar Freeze undergoing drydocking prior to deployment
The following table lists our current fleet of LNG carriers and FSRU as of
March 15, 2019
:
33
|
Vessel Name
|
Year of
Delivery
|
Capacity Cubic Meters
|
Flag
|
Type
|
Charterer/ Pool Arrangement
|
Current Charter Expiration
|
Charter Extension Options
|
|||||||
|
Gimi
(1) (5)
|
1976
|
125,000
|
Marshall Islands
|
Moss
|
n/a
|
n/a
|
n/a
|
|||||||
|
Gandria
(1)
|
1977
|
126,000
|
Marshall Islands
|
Moss
|
n/a
|
n/a
|
n/a
|
|||||||
|
Golar Arctic
(2)
|
2003
|
140,000
|
Marshall Islands
|
Membrane
|
n/a
|
n/a
|
n/a
|
|||||||
|
Golar Viking
(4)
|
2005
|
140,000
|
Marshall Islands
|
Membrane
|
A major oil and gas company
|
2019
|
n/a
|
|||||||
|
Golar Seal
(3)
|
2013
|
160,000
|
Marshall Islands
|
Membrane
|
Cool Pool
|
n/a
|
n/a
|
|||||||
|
Golar Crystal
(3)
|
2014
|
160,000
|
Marshall Islands
|
Membrane
|
Cool Pool
|
n/a
|
n/a
|
|||||||
|
Golar Bear
(3)
|
2014
|
160,000
|
Marshall Islands
|
Membrane
|
Cool Pool
|
n/a
|
n/a
|
|||||||
|
Golar Glacier
|
2014
|
162,000
|
Marshall Islands
|
Membrane
|
A major Japanese trading company
|
2019
|
n/a
|
|||||||
|
Golar Frost
(3)
|
2014
|
160,000
|
Marshall Islands
|
Membrane
|
Cool Pool
|
n/a
|
n/a
|
|||||||
|
Golar Snow
(3)
|
2015
|
160,000
|
Marshall Islands
|
Membrane
|
Cool Pool
|
n/a
|
n/a
|
|||||||
|
Golar Ice
(3)
|
2015
|
160,000
|
Marshall Islands
|
Membrane
|
Cool Pool
|
n/a
|
n/a
|
|||||||
|
Golar Kelvin
(3)
|
2015
|
162,000
|
Marshall Islands
|
Membrane
|
Cool Pool
|
n/a
|
n/a
|
|||||||
|
Golar Tundra
(3)
|
2015
|
170,000
|
Marshall Islands
|
FSRU Membrane
|
Cool Pool
|
n/a
|
n/a
|
|||||||
|
(1)
|
The
Gandria
is currently in lay-up and earmarked for conversion into a FLNG vessel.
The
Gimi
entered Keppel's shipyard in Singapore in early 2019 to commence her conversion into a FLNG. The conversion agreements for the
Gimi
and the
Gandria
are both subject to certain payments and lodging of a full Notice to Proceed.
|
|
(2)
|
Golar Arctic
is currently not assigned to a charter.
|
|
(3)
|
As of
March 15, 2019
, we have eight vessels operating in the Cool Pool. See "Cool Pool" below.
|
|
(4)
|
Golar Viking
is currently serving a short-term contract, due to expire in December 2019. Golar has also entered into binding agreements with a Croatian project developer, LNG Hrvatska d.o.o., to convert the 2005 built
Golar Viking
into a FSRU, sell the converted vessel, and then operate and maintain the FSRU for a minimum of 10 years. Conversion capital expenditure will be predominantly funded by stage payments under the agreements. Commencement of this project is subject to certain conditions precedent, including confirmation of project funding and receipt of a Notice to Proceed from LNG Hrvatska d.o.o.
|
|
(5)
|
In February 2019, we entered into a 20 year Lease and Operate Agreement with BP for the charter of a FLNG unit, the
Gimi
, to service the Greater Tortue Ahmeyim project. These and other agreements are subject to certain conditions precedent which if not satisfied, or waived by the customer, may result in termination prior to or after employment commences.
|
Vessel Operations Revenue
During the year ended
December 31, 2018
, we received the majority of our vessel operations revenue from the Cool Pool.
a. Cool Pool
In October 2015, we entered into an LNG carrier pooling arrangement with GasLog Carriers Ltd ("GasLog") and Dynagas Ltd ("Dynagas") to market our vessels operating in the LNG shipping spot market. In June 2018, Dynagas exited the pooling arrangement. As of December 31, 2018, the Cool Pool comprised of 16 vessels, of which eight vessels were contributed by us, six vessels by GasLog and two vessels by Golar Power. The vessel owner continues to be fully responsible for the manning and technical management of their respective vessels. For the operation of the Cool Pool, a Marshall Islands service company ("Pool Manager") was established in September 2015. The Pool Manager is jointly owned and controlled by us and GasLog.
The Cool Pool allows the Pool Participants to optimize the operation of the pool vessels through improved scheduling ability, cost efficiencies and common marketing. The objective of the Cool Pool is to serve the transportation requirements of the LNG shipping market by providing customers with reliable, more flexible, and innovative solutions to meet their increasingly complex shipping requirements.
The Pool Agreement provides for the Cool Pool to focus exclusively on charters of 12 months' duration or less. Scheduling the employment of a vessel in excess of 12 months remains the mandate of the respective Pool Participant. If a pool vessel is chartered by a Pool Participant for a charter that exceeds 12 months in duration (or the Pool Participant has agreed to sell the vessel), such vessel may be withdrawn from the Cool Pool provided a minimum commitment period (described below) has passed, the Pool Participant provides 30 days’ notice and such vessel generally satisfies any outstanding charter commitment.
34
Under the Pool Agreement, the Pool Manager is responsible, as agent, for the marketing and chartering of the participating vessels and paying other voyage costs such as port call expenses and brokers' commissions in relation to employment contracts, but each of the Pool Participants continues to be fully responsible for the financing, insurance, manning and technical management of their respective vessels. For its services, the Pool Manager receives a fee equal to 10 percent of the costs and overhead of the Cool Pool. Pool earnings (gross earnings of the pool less costs and overhead of the Cool Pool and fees to the Pool Manager) are aggregated and then allocated to the Pool Participants in accordance with the number of days each of their vessels are entered into the pool during the period.
The Pool Participants have agreed to participate in the Cool Pool for an extended minimum commitment period to October 2019. After this date, each Pool Participant may terminate its participation in the Cool Pool, provided the Pool Manager is allowed 30 days to complete any charter negotiations and such Pool Participant’s vessels satisfy any charter commitments.
b. Management Services
Golar Management, our wholly-owned subsidiary which has its primary offices in London, Oslo, Kuala Lumpur and Split, provides commercial, operational and technical support, crew management services and supervision and accounting and treasury services to our, Golar Partners’ and Golar Power's vessels. In addition, under the management and administrative services agreements we have entered into with Golar Partners and Golar Power, certain officers and directors of Golar Management provide executive officer functions for their benefit. In addition, the administrative services provided by Golar Management include: (i) assistance in commercial management; (ii) execution of business strategies of Golar Partners and Golar Power; (iii) bookkeeping, audit and accounting services; (iv) legal and insurance services; (v) administrative and clerical services; (vi) banking and financial services; (vii) advisory services; (viii) client and investor relations; and (viii) integration of any acquired business.
Golar Management is reimbursed for reasonable costs and expenses it incurs in connection with the provision of these services. In addition, Golar Management receives a management fee equal to 5% of its costs and expenses incurred in connection with providing these services. Parties may terminate the management and administrative services agreement by providing 120 days written notice.
FLNG
Compared to onshore terminals, the FLNG regasification industry is fairly young. FLNG projects are a solution for stranded reserves (such as lean gas sourced from offshore fields) for which geographical, technical and economic limitations restrict the ability to convert these gas reserves to LNG. In addition, FLNGs offer a more viable economic solution to the traditional giant land-based projects as they are able to be re-deployed. Golar’s liquefaction solution places liquefaction technology on board an existing LNG carrier using a rapid low-cost execution model resulting in a vessel conversion time of approximately three years. Golar was also the first company to enter into an agreement for the long-term employment of a FLNG based on the conversion of an existing LNG carrier.
The following table lists our FLNG as of
March 15, 2019
:
|
Vessel Name
|
Year of
Delivery
|
Capacity
|
Flag
|
Type
|
Charterer/ Pool Arrangement
|
Current Charter Expiration
|
Charter Extension Options
|
|||||||
|
Hilli Episeyo
(1)
|
2017
|
2.4 mtpa
|
Marshall Islands
|
FLNG Moss
|
Perenco/SNH
|
2026
|
n/a
|
|||||||
|
(1)
|
The
Hilli Episeyo
was converted into a FLNG from a LNG carrier which was originally constructed in 1975. She commenced her operations under the LTA with the Customer in May 2018. The existing LTA is for two of the four liquefaction trains and provides the Customer the option to increase liquefaction production.
|
35
Hilli Episeyo
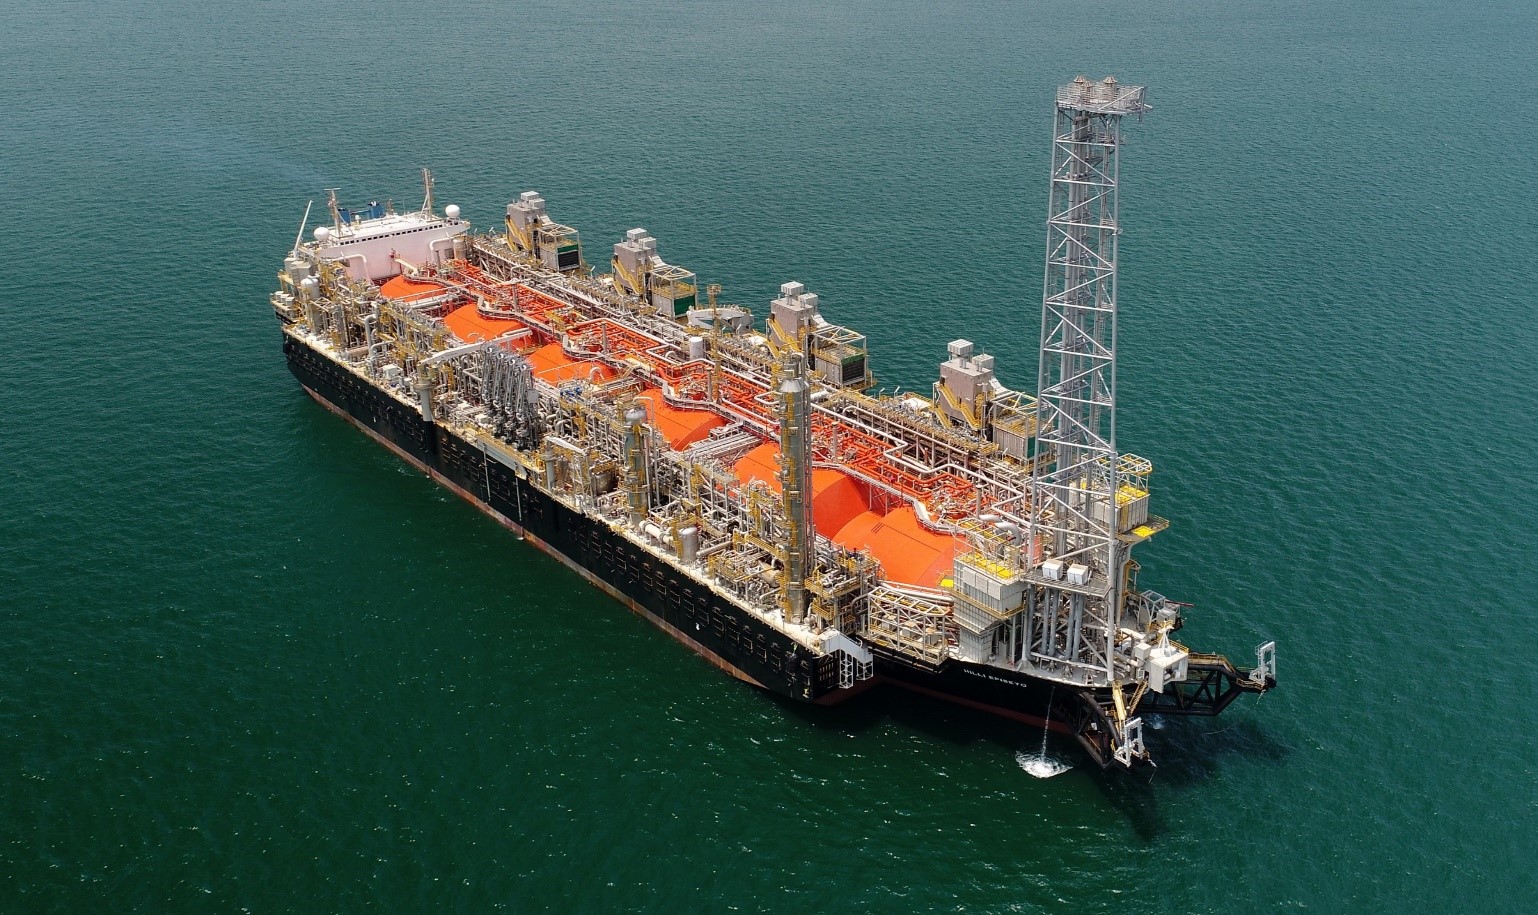
FLNG Hilli Episeyo shortly before departure from Singapore
The
Hilli Episeyo
conversion was completed in October 2017 and she arrived in Cameroon on November 20, 2017. We tendered her notice of readiness on December 3, 2017 upon completion of pre-commissioning activities, starting the commissioning period. The
Hilli Episeyo
started earning commissioning payments at a reduced rate from January 4, 2018. First LNG was produced from the
Hilli
Episeyo
in mid-March. The
Hilli
Episeyo
completed her commissioning and was accepted by the customer in May 2018 (the “Acceptance Date”).
The LTA with the Customer was executed on November 29, 2017 and considered legally effective on December 19, 2017 when all conditions precedent were met.
Under the LTA, the
Hilli Episeyo
is scheduled to provide liquefaction services until the earlier of (i) eight years from the Acceptance Date, or (ii) the time of receipt and processing by the
Hilli Episeyo
of 500 billion cubic feet of feed gas. Under the terms of the LTA, the
Hilli Episeyo
is required to make available 1.2 million tonnes of liquefaction capacity per annum, this capacity will be spread evenly over the course of each contract year. The Customer will pay Hilli Corp a monthly tolling fee, which consists of a fixed element of hire and also an element related to the price of Brent crude oil where we receive incremental tolling fees when the price rises above $60.
The Customer has an option to require us to increase production to greater than 1.2 million tonnes per annum. The LTA provides certain termination rights to the Customer and Hilli Corp. The LTA provides for the payment by Hilli Corp of termination payments of up to $400 million (which reduces gradually as LNG production increases, reducing to $100 million once 3.6 million tonnes of LNG has been produced), $300 million of which is secured by a letter of credit, in the event of termination by Customer of Hilli Corp’s underperformance or non-performance. If the LTA is terminated by Hilli Corp in respect of a breach by the Customer prior to the second anniversary of the Acceptance Date, the Customer is obligated to pay Hilli Corp $500 million, with termination payments decreasing if the LTA is terminated after the second anniversary of the Acceptance Date.
On August 15, 2017, we entered into the Hilli Sale Agreement with Golar Partners for the Hilli Disposal from Golar and affiliates of Keppel and Black and Veatch of common units (the “Disposal Interests”) in Golar Hilli LLC. As of the closing on
36
July 12, 2018, of the Hilli Disposal, Hilli LLC became indirectly (via its wholly owned subsidiary) the disponent owner of the
Hilli
Episeyo
. The sale price for the Disposal Interests was $658 million less net lease obligations under the financing facility for the
Hilli Episeyo
(the “Hilli Facility”). Concurrently with the execution of the Hilli Sale Agreement, we received a further $70 million deposit from Golar Partners, upon which we pay interest at a rate of 5% per annum. Additionally, in connection with the closing of the Hilli Disposal, Golar Partners provided a several guarantee of 50% of Hilli Corp’s indebtedness under the Hilli Facility. Upon the closing of the Hilli Disposal, we, along with Keppel and Black and Veatch, sold 50% of the Disposal Interests to Golar Partners in return for the payment by Golar Partners of the net purchase price of $199.7 million.
Future FLNGs projects
a. BP Greater Tortue Ahmeyim project
In October 2014, we entered into agreements for the conversion of the
Gimi
into a FLNG. The primary vessel conversion contract was entered into with Keppel in December 2018. The
Gimi
was delivered to Keppel shipyard in Singapore in early 2019 to undergo initial works in connection with her conversion.
In February 2018 the Inter-Governmental Cooperation Agreement between Mauritania and Senegal was signed, enabling further development of the cross-border Tortue Ahmeyim natural gas field to continue. In April 2018, we entered into a Preliminary Agreement and exchanged Heads of Terms for a Charter Agreement with BP Mauritania Investments Ltd and BP Senegal Investments Ltd (together “BP") in their capacity as block operators. The Heads of Terms committed the parties to translate the terms into an agreement and proceed with Front End Engineering Design (“FEED”¨) on the provision of a FLNG vessel to support the development of Phase 1A of the Greater Tortue/Ahmeyin field, located offshore Mauritania and Senegal. In December 2018, we received a Limited Notice to Proceed from BP in connection with this project.
In February 2019, Golar entered into a Lease and Operate Agreement ("LOA") with BP for the charter of a FLNG unit,
Gimi
, to service the Greater Tortue Ahmeyim project for a 20-year period expected to commence in 2022. The FLNG
Gimi
will liquefy gas as part of the first phase of the Greater Tortue Ahmeyim Project and will be located at an innovative near-shore hub located on the Mauritania and Senegal maritime border. FLNG
Gimi
is designed to produce an average of approximately 2.5 million tonnes of LNG per annum, using the Black & Veatch "Prico" liquefaction process, with the total gas resources in the field estimated to be around 15 trillion cubic feet. Concurrent with entering into the LOA, we entered into a Subscription Agreement (subject to closing conditions) with First FLNG Holdings Pte. Ltd., an indirect wholly-owned subsidiary of Keppel Capital, in respect of their participation in a 30% share of FLNG
Gimi
.
b. Delfin LNG
Progress continues to be made on development of the first FLNG for the US Gulf of Mexico "Delfin LNG" project. When connected to Delfin's existing pipeline infrastructure, Golar's FLNG could deliver a low cost liquefaction solution in North America giving Delfin and Golar an early mover advantage marketing a relatively small parcel of LNG into a demand driven market. Work continues to establish the right gas supply and offtake combination to enable a financing and yard commitment before the end of 2019.
Power
In June 2016, we entered into certain agreements forming a 50/50 joint venture, Golar Power, with investment vehicles affiliated with the private equity firm Stonepeak. The purpose of Golar Power is to offer integrated LNG based downstream solutions through the ownership and operation of FSRUs and associated terminal and power generation infrastructure.
In October 2016, Golar Power took its Final Investment Decision on the Porto de Sergipe Project, enabling CELSE to enter into a lump sum full turn-key EPC agreement with General Electric to build, maintain and operate the 1.5GW combined cycle power plant in Sergipe, Brazil. The power plant is scheduled to deliver power to 26 committed off-takers for 25 years from 2020.
The construction of the Sergipe power plant remains on track for commencement of operations in early 2020.
Further FSRU-power opportunities are being pursued in by Golar Power in Brazil and elsewhere. License approvals for projects are making good progress, including a recently gazetted Barcarena project. These licenses put Golar Power in a strong position to develop FSRU terminal projects, to win future power auctions, and to distribute LNG locally.
37
Competition
We operate in markets that are highly competitive and based primarily on supply and demand. As the FSRU market continues to grow and mature there are new competitors entering the market. A number of our competitors have also ordered FSRUs. Expectations of rapid growth in the FSRU market has also given owners the confidence to place orders for FSRUs before securing charters. This has led to more competition for mid- and long-term FSRU charters.
Competition for these charters is based primarily on price, operational track record, LNG storage capacity, efficiency of the regasification process, vessel availability, size, age and condition of the vessel, relationships with LNG carrier users and reputation of the operator. In addition, FSRUs may operate as LNG carriers during periods of increased FSRU competition.
The FLNG industry is in an early stage of development, and we do not currently face significant competition from other providers of FLNG services. There are currently only two operating FLNGs in the world. We anticipate that other companies, including marine transportation companies with strong reputations and extensive resources and experience, will enter the FLNG industry at some point in the future, resulting in greater competition.
Seasonality
Historically, LNG trade, and therefore charter rates, increased in the winter months and eased in the summer months as demand for LNG for heating in the Northern Hemisphere rose in colder weather and fell in warmer weather. In general, the LNG vessel industry, has become less dependent on the seasonal transport of LNG than a decade ago. The advent of FSRUs has opened up new markets and uses for LNG, spreading consumption more evenly over the year. There is a higher seasonal demand during the summer months due to energy requirements for air conditioning in some markets or reduced availability of hydro power in others and a pronounced higher seasonal demand during the winter months for heating in other markets. There is however a tendency for a weaker vessel market in the periods between winter and summer.
Vessel Maintenance
Safety is our top operational priority. Our vessels are operated in a manner intended to protect the safety and health of our employees, the general public and the environment. We actively manage the risks inherent in our business and are committed to eliminating incidents that threaten safety, such as groundings, fires and collisions. We are also committed to reducing emissions and waste generation. We have established key performance indicators to facilitate regular monitoring of our operational performance. We set targets on an annual basis to drive continuous improvement, and we review performance indicators monthly to determine if remedial action is necessary to reach our targets.
Under our charters, we are responsible for the technical management of the vessels which our subsidiaries assist us by managing our vessel operations, maintaining a technical department to monitor and audit our vessel manager operations and providing expertise in various functions critical to our operations. This affords an efficient and cost effective operation and, pursuant to administrative services agreements with certain of our subsidiaries, access to human resources, financial and other administrative functions.
These functions are supported by on board and onshore systems for maintenance, inventory, purchasing and budget management. In addition, our day-to-day focus on cost control will be applied to our operations. To some extent, the uniform design of some of our vessels and the adoption of common equipment standards should also result in operational efficiencies, including with respect to crew training and vessel management, equipment operation and repair, and spare parts ordering.
Risk of Loss, Insurance and Risk Management
The operation of any vessel, including LNG carriers and FSRUs, has inherent risks. These risks include mechanical failure, personal injury, collision, property loss, vessel or cargo loss or damage and business interruption due to political circumstances in foreign countries and/or war risk situations or hostilities. In addition, there is always an inherent possibility of marine disaster, including explosion, spills and other environmental mishaps, and the liabilities arising from owning and operating vessels in international trade. We believe that our present insurance coverage is adequate to protect us against the accident related risks involved in the conduct of our business and that we maintain appropriate levels of environmental damage and pollution insurance coverage consistent with standard industry practice. However, not all risks can be insured, and there can be no guarantee that any specific claim will be paid, or that we will always be able to obtain adequate insurance coverage at reasonable rates.
38
We have obtained hull and machinery insurance on all our vessels against marine and war risks, which include the risks of damage to our vessels, salvage or towing costs, and also insure against actual or constructive total loss of any of our vessels. However, our insurance policies contain deductible amounts for which we will be responsible. We have also arranged additional total loss coverage for each vessel. This coverage, which is called hull interest and freight interest coverage, provides us additional coverage in the event of the total loss of a vessel.
We have also obtained loss of hire insurance to protect us against loss of income in the event one of our vessels cannot be employed due to damage that is covered under the terms of our hull and machinery insurance. Under our loss of hire policies, our insurer will pay us the daily rate agreed in respect of each vessel for each day, in excess of a certain number of deductible days, for the time that the vessel is out of service as a result of damage. The maximum coverage varies from 180 days to 360 days, depending on the vessel. The number of deductible days varies from 14 days to 60 days, depending on the vessel and type of damage; machinery or hull damage.
Protection and indemnity insurance, which covers our third-party legal liabilities in connection with our shipping activities, is provided by mutual protection and indemnity associations, or P&I clubs. This includes third-party liability and other expenses related to the injury or death of crew members, passengers and other third-party persons, loss or damage to cargo, claims arising from collisions with other vessels or from contact with jetties or wharves and other damage to other third-party property, including pollution arising from oil or other substances, and other related costs, including wreck removal. Subject to the capping discussed below, our coverage, except for pollution, is unlimited.
The current protection and indemnity insurance coverage for pollution is $250 million per incident for the
Hilli Episeyo
and $1 billion per vessel per incident for all other vessels. The thirteen P&I clubs that comprise the International Group of Protection and Indemnity Clubs insure approximately 90% of the world's commercial tonnage and have entered into a pooling agreement to reinsure each association's liabilities. Each P&I club has capped its exposure in this pooling agreement so that the maximum claim covered by the pool and its reinsurance would be approximately $8.2 billion per accident or occurrence. We are a member of Gard and Skuld P&I Clubs. As a member of these P&I clubs, we are subject to a call for additional premiums based on the clubs' claims record, as well as the claims record of all other members of the P&I clubs comprising the International Group. However, our P&I clubs have reinsured the risk of additional premium calls to limit our additional exposure. This reinsurance is subject to a cap, and there is the risk that the full amount of the additional call would not be covered by this reinsurance.
The insurers providing the hull and machinery, hull and cargo interests, protection and indemnity and loss of hire insurances have confirmed that they will consider FSRUs as vessels for the purpose of providing insurance. For the FSRUs we have also arranged an additional comprehensive general liability insurance. This type of insurance is common for offshore operations and is additional to the P&I insurance.
We will use in our operations our thorough risk management program that includes, among other things, computer-aided risk analysis tools, maintenance and assessment programs, a seafarers' competence training program, seafarers' workshops and membership in emergency response organizations. We expect to benefit from our commitment to safety and environmental protection as certain of our subsidiaries assist us in managing our vessel operations. GMN, received its ISO 9001 certification in April 2011, and is certified in accordance with the IMO's International Management Code for the Safe Operation of Ships and Pollution Prevention, or ISM, on a fully integrated basis.
Classification, Inspection and Maintenance
Every large, commercial seagoing vessel must be “classed” by a classification society. A classification society certifies that a vessel is “in class,” signifying that the vessel has been built and maintained in accordance with the rules of the vessel's country of registry and the international conventions of which that country is a member. In addition, where surveys are required by international conventions and corresponding laws and ordinances of a flag state, the classification society will undertake them on application or by official order, acting on behalf of the authorities concerned.
For maintenance of the class certificate, regular and extraordinary surveys of hull, machinery, including the electrical plant and any special equipment classed, are required to be performed by the classification society, to ensure continuing compliance. Vessels are drydocked at least once during a five-year class cycle for inspection of the underwater parts and for repairs related to inspections. If any defects are found, the classification surveyor will issue a “recommendation” which must be rectified by the shipowner within prescribed time limits. The classification society also undertakes on request of the flag state other surveys and checks that are required by the regulations and requirements of that flag state. These surveys are subject to agreements made in each individual case and/or to the regulations of the country concerned.
39
Most insurance underwriters make it a condition for insurance coverage that a vessel be certified as "in class" by a classification society, which is a member of the International Association of Classification Societies.
Golar Arctic
,
Golar Frost
,
Golar Viking
and
Golar Bear
are certified by the American Bureau of Shipping. All of our other vessels are certified by Det Norske Veritas GL. All three societies are members of the International Association of Classification Societies. All of our vessels have been awarded ISM certification and are currently "in class" other than two LNG carriers, the
Gimi
and the
Gandria
, with the
Gimi
recently removed from lay-up and delivered to Keppel's shipyard in Singapore to commence generic work in readiness for her conversion into a FLNG, and the
Gandria
is currently layed up.
We carry out inspections of the vessels on a regular basis; both at sea and while the vessels are in port. The results of these inspections, which are conducted both in port and while underway, result in a report containing recommendations for improvements to the overall condition of the vessel, maintenance, safety and crew welfare. Based in part on these evaluations, we create and implement a program of continual maintenance and improvement for our vessels and their systems.
Environmental and Other Regulations
General
Our business and the operation of our vessels are subject to various international treaties and conventions and to the applicable local national and subnational laws and regulations of the countries in which our vessels operate or are registered. These local laws and regulations might require us to obtain governmental permits and authorizations before we may conduct certain activities. Failure to comply with these laws or to obtain the necessary business and technical licenses could result in sanctions including suspension and/or freezing of the business and responsibility for all damages arising from any violation.
The local governments may also periodically revise their environmental laws and regulations or adopt new ones, and the effects of new or revised laws and regulations on our operations cannot be predicted. Although we believe that we are substantially in compliance with applicable environmental laws and regulations and have all permits, licenses and certificates required for our vessels, future non-compliance or failure to maintain necessary permits or approvals could require us to incur substantial costs or temporarily suspend the operation of one or more of our vessels. There can be no assurance that additional significant costs and liabilities will not be incurred to comply with such current and future laws and regulations, or that such laws and regulations will not have a material effect on our operations.
International environmental treaties and conventions and U.S. environmental laws and regulations that apply to the operation of our vessels are described below. Other countries in which we operate or in which our vessels are registered have or may in the future have laws and regulations that are similar in nature to the U.S. laws referenced below. GMN provides technical management services for our vessels, is certified in accordance with the IMO standard for ISM and operates in compliance with the International Standards Organization (“ISO”) Environmental Management Standard for the management of significant environmental aspects associated with the ownership and operation of our fleet.
International Maritime Regulations of LNG Vessels
The IMO provides international regulations governing shipping and international maritime trade. Among other requirements, Chapter IX of SOLAS, the International Safety Management Code for the Safe Operation of Ships and for Pollution Prevention ("the ISM Code") requires the party with operational control of a vessel to develop an extensive safety management system and the adoption of a policy for safety and environmental protection setting forth instructions and procedures for operating its vessels safely and also describing procedures for responding to emergencies. Our ship manager holds a document of compliance under the ISM Code for operation of Gas Carriers.
Vessels that transport gas, including LNG carriers and FSRUs, are also subject to the International Gas Carrier Code (“IGC”) which provides a standard for the safe carriage of LNG and certain other liquid gases by prescribing the design and construction standards of vessels involved in such carriage. Each of our vessels is in compliance with the IGC Code and each of our new buildings/conversion contracts requires that the vessel receive certification that it is in compliance with applicable regulations before it is delivered.
The IMO also promulgates ongoing amendments to SOLAS which provides rules for the construction of and equipment required for commercial vessels and includes regulations for safe operation. It requires the provision of lifeboats and other life-saving appliances, requires the use of the Global Maritime Distress and Safety System which is an international radio equipment and watch keeping standard, afloat and at shore stations, and relates to the International Convention on the Standards of Training and Certification of Watchkeeping Officers (“STCW”) also promulgated by the IMO. The SOLAS and other IMO regulations concerning safety, including those relating to treaties on training of shipboard personnel, lifesaving appliances, radio equipment
40
and the global maritime distress and safety system, are applicable to our operations. Flag states that have ratified the SOLAS and STCW generally employ the classification societies, which have incorporated the SOLAS and STCW requirements into their class rules, to undertake surveys to confirm compliance.
In the wake of increased worldwide security concerns, the IMO amended SOLAS and added the International Ship and Port Facility Security Code (“ISPS Code”), which came into effect on July 1, 2004, to detect security threats and take preventive measures against security incidents affecting vessels or port facilities. GMN has developed security plans and appointed and trained ship and office security officers. In addition, all of our vessels have been certified to meet the ISPS Code and the security requirements of the SOLAS and the Maritime Transportation Security Act (“MTSA”).
The United States Coast Guard ("USCG") regulations, intended to align with international maritime security standards, exempt non-U.S. vessels from MTSA vessel security measures, provided such vessels have on board a valid International Ship Security Certificate that attests to the vessel’s compliance with the SOLAS Convention security requirements and the ISPS Code. To implement certain portions of the MTSA, the USCG issued regulations requiring the implementation of certain security requirements aboard vessels operating in waters subject to the jurisdiction of the United States and at certain ports and facilities, some of which are regulated by the United States Environmental Protection Agency (the "EPA"). Future security measures could have a significant financial impact on us. GMN has developed security plans, appointed and trained ship and office security officers and all of our vessels have been certified to meet the ISPS Code and the security requirements of the SOLAS and the MTSA.
The IMO continues to review and introduce new regulations. It is impossible to predict what additional regulations, if any, may be passed by the IMO and what effect, if any, such regulation may have on our operations. Non-compliance with the IGC Code or other applicable IMO regulations may subject a shipowner or a bareboat charterer to increased liability or penalties, may lead to decreases in available insurance coverage for affected vessels and may result in the denial of access to, or detention in, some ports.
Air Emissions
The IMO adopted MARPOL, which imposes environmental standards on the shipping industry relating to marine pollution, including oil spills, management of garbage, the handling and disposal of noxious liquids, sewage and air emissions. MARPOL is broken into six Annexes, each of which regulates a different source of pollution. Annex I relates to oil leakage or spilling and applies to various vessels delivered on or after August 1, 2010. It includes requirements for the protected location of the fuel tanks, performance standards for accidental oil fuel outflow, a tank capacity limit and certain other maintenance, inspection and engineering standards. IMO regulations also require owners and operators of vessels to adopt Shipboard Oil Pollution Emergency Plans. Periodic training and drills for response personnel and for vessels and their crews are required. Annexes II and III relate to harmful substances carried in bulk, in liquid or in packaged form, respectively, and Annexes IV and V relate to sewage and garbage management, respectively.
MARPOL Annex VI regulations for the “Prevention of Air Pollution from Ships”, adopted in September 2017, apply to all vessels, fixed and floating drilling rigs and other floating platforms. Annex VI sets limits on sulfur oxide and nitrogen oxide emissions from vessel exhausts, emissions of volatile compounds from cargo tanks, incineration of specific substances, and prohibits deliberate emissions of ozone depleting substances. Annex VI also includes a global cap on sulfur content of fuel oil and allows for special areas to be established with more stringent controls on sulfur emissions. The certification requirements for Annex VI depend on size of the vessel and time of the periodic classification survey. Ships weighing more than 400 gross tons and engaged in international voyages involving countries that have ratified the conventions, or vessels flying the flag of those countries, are required to have an International Air Pollution Certificate (“IAPP Certificate”). Annex VI came into force in the United States on January 8, 2009. All our vessels delivered or drydocked since May 19, 2005 have been issued IAPP Certificates.
Amendments to Annex VI to the MARPOL Convention that took effect in 2010 require progressively stricter limitations on sulfur emissions from vessels. As of January 1, 2012, fuel used to power vessels may contain no more than 3.5% sulfur for areas outside of designated emission control areas (“ECAs”). This cap will then decrease progressively until it reaches 0.5% on January 1, 2020. The amendments also establish new tiers of stringent nitrogen oxide emissions standards for new marine engines, depending on their date of installation. The European directive 2005/33/EC bans the use of fuel oils containing more than 0.10% sulfur by mass by any merchant vessel while at berth in any EU country. Our vessels have achieved compliance, where necessary, by being modified to burn gas only in their boilers when alongside a berth. Except for one of Golar Partners' vessels
,
we have modified the boilers on all our vessels to also allow operation on low sulfur diesel oil, or LSDO.
More stringent emission standards could apply in coastal areas designed as “Emission Control Areas” (“ECAs”), such as the United States and Canadian coastal areas designated by the IMO’s Marine Environment Protection Committee ("MEPC"), as discussed in “U.S. Clean Air Act” below. These areas include certain coastal areas of North America and the United States
41
Caribbean Sea. Annex VI Regulation 14, which came into effect on January 1, 2015, set a 0.10% sulfur limit in areas of the Baltic Sea, North Sea, North America and United States Caribbean Sea ECAs. Ocean-going vessels operating in these areas will be subject to stringent emission controls that may cause us to incur additional costs. The approval of other ECAs or other stringent requirements relating to emissions from marine diesel engines or port operations by vessels may require significant capital expenditures for compliance.
Amended Annex VI also establishes new tiers of stringent nitrogen oxide emissions standards for marine diesel engines, depending on their date of installation. At the MEPC meeting held from March to April 2014, amendments to Annex VI were adopted which address the date on which Tier III Nitrogen Oxide (NOx) standards in ECAs will go into effect. Under the amendments, Tier III NOx standards apply to ships that operate in the North American and U.S. Caribbean Sea ECAs designed for the control of NOx produced by vessels with a marine diesel engine installed and constructed on or after January 1, 2016. Tier III requirements could apply to areas that will be designated for Tier III NOx in the future. At MEPC 70 and MEPC 71, the MEPC approved the North Sea and Baltic Sea as ECAs for nitrogen oxide for ships built after January 1, 2021. The EPA promulgated equivalent (and in some senses stricter) emissions standards in late 2009. As a result of these designations or similar future designations, we may be required to incur additional operating or other costs.
As determined at the MEPC 70, the new Regulation 22A of MARPOL Annex VI became effective as of March 1, 2018 and requires ships above 5,000 gross tonnage to collect and report annual data on fuel oil consumption to an IMO database, with the first year of data collection commencing on January 1, 2019. The IMO intends to use such data as the first step in its roadmap (through 2023) for developing its strategy to reduce greenhouse gas emissions from ships, as discussed further below.
Additional or new conventions, laws and regulations may be adopted that could require the installation of expensive emission control systems. Because our vessels are largely powered by means other than fuel oil we do not anticipate that any emission limits that may be promulgated will require us to incur any material costs for the operation of our vessels, but that possibility cannot be eliminated.
Safety Management System Requirements
Under the ISM Code our operations are also subject to environmental standards and requirements. The ISM Code requires the party with operational control of a vessel to develop an extensive safety management system that includes, among other things, the adoption of a safety and environmental protection policy setting forth instructions and procedures for operating its vessels safely and describing procedures for responding to emergencies. We rely upon the safety management system that we and our technical management team have developed for compliance with the ISM Code. The failure of a vessel owner or bareboat charterer to comply with the ISM Code may subject such party to increased liability, may decrease available insurance coverage for the affected vessels and may result in a denial of access to, or detention in, certain ports.
The ISM Code requires that vessel operators obtain a safety management certificate for each vessel they operate. This certificate evidences compliance by a vessel’s management with the ISM Code requirements for a safety management system. No vessel can obtain a safety management certificate unless its manager has been awarded a document of compliance, issued by each flag state, under the ISM Code. We have obtained applicable documents of compliance for our offices and safety management certificates for all of our vessels for which the certificates are required by the IMO. The document of compliance and safety management certificate are renewed as required.
Amendments to SOLAS Chapter VII apply to vessels transporting dangerous goods and require those vessels be in compliance with the International Maritime Dangerous Goods Code (“IMDG Code”). Effective January 1, 2018, the IMDG Code includes (1) updates to the provisions for radioactive material, reflecting the latest provisions from the International Atomic Energy Agency, (2) new marking, packing and classification requirements for dangerous goods, and (3) new mandatory training requirements.
The IMO's Maritime Safety Committee and MEPC, respectively, each adopted relevant parts of the International Code for Ships Operating in Polar Water (the “Polar Code”). The Polar Code, which entered into force on January 1, 2017, covers design, construction, equipment, operational, training, search and rescue as well as environmental protection matters relevant to ships operating in the waters surrounding the two poles. It also includes mandatory measures regarding safety and pollution prevention as well as recommendatory provisions. The Polar Code applies to new ships constructed after January 1, 2017, and after January 1, 2018, ships constructed before January 1, 2017 are required to meet the relevant requirements by the earlier of their first intermediate or renewal survey.
Furthermore, recent action by the IMO’s Maritime Safety Committee and United States agencies indicate that cybersecurity regulations for the maritime industry are likely to be further developed in the near future in an attempt to combat
42
cybersecurity threats. For example, cyber-risk management systems must be incorporated by ship-owners and managers by 2021. This might cause companies to create additional procedures for monitoring cybersecurity, which could require additional expenses and/or capital expenditures. The impact of such regulations is hard to predict at this time.
Anti-Fouling Requirements
Our vessels are subject to the IMO’s International Convention on the Control of Harmful Anti-fouling Systems on Ships, or the Anti-fouling Convention, which prohibits the use of organotin compound coatings to prevent the attachment of mollusks and other sea life to the hulls of vessels. Vessels of over 400 gross tons engaged in international voyages must obtain an International Anti-fouling System Certificate and undergo a survey before the vessel is put into service or when the anti-fouling systems are altered or replaced. We have obtained Anti-fouling System Certificates for all of our vessels, and we do not believe that maintaining such certificates will have an adverse financial impact on the operation of our vessels.
Oil Pollution Act and The Comprehensive Environmental Response Compensation and Liability Act
The U.S. Oil Pollution Act of 1990 (“OPA 90”) established an extensive regulatory and liability regime for environmental protection and clean up of oil spills. OPA 90 affects all owners and operators whose vessels trade with the United States or its territories or possessions, or whose vessels operate in the waters of the United States, which include the U.S. territorial waters and the 200 nautical mile exclusive economic zone of the United States. The Comprehensive Environmental Response, Compensation, and Liability Act (“CERCLA”) applies to the release or discharge of hazardous substances whether on land or at sea. While LNG is generally excluded from the current definition of "hazardous substances" under OPA 90 and CERCLA, these regulatory frameworks may nevertheless affect us because we carry oil as fuel and lubricants for our engines, and the release or discharge of these could cause an environmental hazard. Under OPA 90, vessel operators, including vessel owners, managers and bareboat or “demise” charterers, are “responsible parties” who are all liable regardless of fault, individually and as a group, for all containment and clean-up costs and other damages arising from oil spills from their vessels. These “responsible parties” would not be liable if the spill results solely from the act or omission of a third party, an act of God or an act of war. The other damages aside from clean-up and containment costs are defined broadly to include:
|
•
|
injury to, destruction or loss of, or loss of use of, natural resource and the costs of assessment thereof;
|
|
•
|
injury to, or economic losses resulting from, the destruction of real and personal property;
|
|
•
|
net loss of taxes, royalties, rents, fees or net profit revenues resulting from injury, destruction or loss of real or personal property, or natural resources;
|
|
•
|
loss of subsistence use of natural resources that are injured, destroyed or lost;
|
|
•
|
lost profits or impairment of earning capacity due to injury, destruction or loss of real or personal property or natural resources; and
|
|
•
|
net cost of increased or additional public services necessitated by removal activities following a discharge of oil, such as protection from fire, safety or health hazards.
|
The limits of OPA liability are the greater of $2,200 per gross ton or
$18.8 million
for any tanker other than single-hull tank vessels, over 3,000 gross tons (subject to possible adjustment for inflation) (relevant to ours and Golar’s LNG carriers). These limits of liability do not apply, however, where the incident is caused by violation of applicable U.S. federal safety, construction or operating regulations, or by the responsible party's gross negligence or willful misconduct. These limits likewise do not apply if the responsible party fails or refuses to report the incident or to cooperate and assist in connection with the substance removal activities. OPA specifically permits individual states to impose their own liability regimes with regard to oil pollution incidents occurring within their boundaries, and some states have enacted legislation providing for unlimited liability for discharge of pollutants within their waters. In some cases, states, which have enacted their own legislation, have not yet issued implementing regulations defining ship owners’ responsibilities under these laws.
CERCLA, which also applies to owners and operators of vessels, contains a similar liability regime and provides liability for releases of “hazardous substances”, including for clean up, removal and remedial costs, as well as damages for injury to, or destruction or loss of, natural resources, including the reasonable costs associated with assessing the same, and health assessments or health effect studies. Liability under CERCLA is limited to the greater of $300 per gross ton or $5.0 million for vessels carrying hazardous substances as cargo or residue, and the greater of $300 per gross ton or $500,000 for any other vessel. As with OPA, these limits of liability do not apply (rendering the responsible person liable for the total cost of response and damages) if the release or threat of release of a hazardous substance resulted from willful misconduct or negligence, or the primary cause of the release was a violation of applicable safety, construction or operating standards or regulations. The limitation on liability also does
43
not apply if the responsible person fails or refused to provide all reasonable cooperation and assistance as requested in connection with response activities where the vessel is subject to OPA. We believe that we are in substantial compliance with OPA, CERCLA and all applicable state regulations in the ports where our vessels call.
OPA requires owners and operators of vessels to establish and maintain with the USCG evidence of financial responsibility sufficient to meet the limit of their potential strict liability under OPA/CERCLA. Under the regulations, evidence of financial responsibility may be demonstrated by insurance, surety bond, self-insurance or guaranty. Under OPA regulations, an owner or operator of more than one vessel is required to demonstrate evidence of financial responsibility for the entire fleet in an amount equal only to the financial responsibility requirement of the vessel having the greatest maximum liability under OPA/CERCLA. Each of our ship owning subsidiaries that has vessels trading in U.S. waters has applied for, and obtained from the U.S. Coast Guard National Pollution Funds Center three-year certificates of financial responsibility, or COFR, supported by guarantees which we purchased from an insurance based provider. We believe that we will be able to continue to obtain the requisite guarantees and that we will continue to be granted COFRs from the USCG for each of our vessels that is required to have one.
Compliance with any new requirements of OPA, or other laws or regulations, may substantially impact our cost of operations or require us to incur additional expenses to comply with any new regulatory initiatives or statutes. For example, in July 2016, the U.S. Department of the Interior’s Bureau of Safety and Environmental Enforcement ("BSEE") finalized new regulations imposing well control requirements on offshore oil and gas drilling. However, this measure and others like it are being reevaluated by promulgating agencies pursuant to Executive Orders 13783 and 13795, which promote energy exploration and production. As part of this reevaluation, in May 2018, BSEE issued a proposal to revise or eliminate certain of the requirements under the 2016 well control rule. Additional legislation or regulation applicable to the operation of our vessels that may be implemented in the future could adversely affect our business and ability to make distributions to our unitholders.
Bunker Convention/CLC State Certificate
The International Convention on Civil Liability for Bunker Oil Pollution 2001, or the Bunker Convention entered into force on November 21, 2008. The Convention provides a liability, compensation and compulsory insurance system for the victims of oil pollution damage caused by spills of bunker oil. The Convention imposes strict liability on ship owners (including the registered owner, bareboat charterer, manager or operator) for pollution damage (including the cost of preventive measures) caused in the territory, including the territorial sea of a State Party, as well as its economic zone or equivalent area. Registered owners of any sea going vessel and seaborne craft over 1,000 gross tonnage, of any type whatsoever, and registered in a State Party, or entering or leaving a port in the territory of a State Party, will be required to maintain insurance which meets the requirements of the Convention and to obtain a certificate issued by a State Party attesting that such insurance is in force. The State Party issued certificate must be carried on board at all times. P&I Clubs in the International Group issue the required Bunkers Convention “Blue Cards” to enable signatory states to issue certificates. All of our vessels have received “Blue Cards” from their P&I Club and are in possession of a Civil Liability Convention (CLC) State-issued certificate attesting that the required insurance cover is in force.
Ballast Water Management Convention, Clean Water Act and National Invasive Species Act
The IMO has negotiated international conventions that impose liability for pollution in international waters and the territorial waters of the signatories to such conventions. The EPA and USCG, have also enacted rules relating to ballast water discharge for all vessels entering or operating in United States waters. Compliance requires the installation of equipment on our vessels to treat ballast water before it is discharged or the implementation of other port facility disposal arrangements or procedures at potentially substantial cost, and/or otherwise restrict our vessels from entering United States waters.
a. Ballast Water Management Convention
In February 2004, the IMO adopted an International Convention for the Control and Management of Ships' Ballast Water and Sediments (“BWM Convention”). The BWM Convention requires ships to manage their ballast water to remove, render harmless, or avoid the uptake or discharge of new or invasive aquatic organisms and pathogens within ballast water and sediments. The implementing regulations call for a phased introduction of mandatory ballast water exchange requirements to be replaced in time with mandatory concentration limits. The BMW Convention entered into force on September 8, 2017, however IMO later decided to postpone the compliance date for existing vessels by 2 years, i.e. until the first renewal survey following September 8, 2019. Furthermore, in October 2014 the MEPC met and adopted additional resolutions concerning the BWM Convention’s implementation. Upon entry into force of the BWM Convention, mid-ocean ballast water exchange became mandatory for our vessels.
44
On December 4, 2013, the IMO Assembly passed a resolution revising the application dates of BWM Convention so that the dates are triggered by the entry into force date and not the dates originally in the BWM Convention. This, in effect, makes all vessels delivered before the entry into force date “existing vessels” and allows for the installation of ballast water management systems on such vessels at the first International Oil Pollution Prevention (“IOPP”) renewal survey following entry into force of the convention. The MEPC adopted updated guidelines for approval of ballast water management systems (G8) at MEPC 70. At MEPC 71, the schedule regarding the BWM Convention’s implementation dates was also discussed and amendments were introduced to extend the date existing vessels are subject to certain ballast water standards. At MEPC 72, the G8 guidelines were converted into a mandatory code for approval of ballast water management systems, which enters into force in October 2019. Ships over 400 gross tons generally must comply with a “D-1 standard,” requiring the exchange of ballast water only in open seas and away from coastal waters. The “D-2 standard” specifies the maximum amount of viable organisms allowed to be discharged, and compliance dates vary depending on the IOPP renewal dates. For most ships, compliance with the D-2 standard will involve installing on-board systems to treat ballast water and eliminate unwanted organisms. Ballast Water Management systems, which include systems that make use of chemical, biocides, organisms or biological mechanisms, or which alter the chemical or physical characteristics of the ballast water, must be approved in accordance with IMO Guidelines (Regulation D-3). Costs of compliance with these regulations may be substantial.
Once mid-ocean ballast exchange ballast water treatment requirements become mandatory under the BWM Convention, the cost of compliance could increase for ocean carriers and may have a material effect on our operations. However, many countries already regulate the discharge of ballast water carried by vessels from country to country to prevent the introduction of invasive and harmful species via such discharges. The U.S., for example, requires vessels entering its waters from another country to conduct mid-ocean ballast exchange, or undertake some alternate measure, and to comply with certain reporting requirements.
b. Clean Water Act
The U.S. Clean Water Act (“CWA”) prohibits the discharge of oil or hazardous substances in U.S. navigable waters unless authorized by a duly-issued permit or exemption, and imposes strict liability in the form of penalties for any unauthorized discharges. The CWA also imposes substantial liability for the costs of removal, remediation and damages and complements the remedies available under OPA and CERCLA. In addition, many U.S. states that border a navigable waterway have enacted environmental pollution laws that impose strict liability on a person for removal costs and damages resulting from a discharge of oil or a release of a hazardous substance. These laws may be more stringent than U.S. federal law.
The EPA regulates the discharge of ballast and bilge water and other substances in United States waters under the CWA. The EPA regulations require vessels 79 feet in length or longer (other than commercial fishing vessels and recreational vessels) comply with a permit that regulates ballast water discharges and other discharges incidental to the normal operation of certain vessels within United States waters - the Vessel General Permit for Discharges Incidental to the Normal Operation of Vessels, (“VGP”). In March 2013, the EPA re-issued the VGP. The 2013 VGP focuses on authorizing discharges incidental to operations of commercial vessels and contains ballast water discharge limits for most vessels to reduce the risk of invasive species in US waters, more stringent requirements for exhaust gas scrubbers and the use of environmentally acceptable lubricants. In December 2013, the EPA issued an enforcement response policy in connection with the new VGP in which the EPA indicated that it would take into account the reasons why vessels do not have the requisite technology installed, but will not grant any waivers. In December 2018, the Vessel Incidental Discharge Act (VIDA) was signed into law and restructured the EPA and the USCG programs for regulating incidental discharges from vessels. Rather than requiring CWA permits, the discharges will be regulated under a new CWA Section 312(p) establishing Uniform National Standards for Discharges Incidental to Normal Operation of Vessels. Under VIDA, VGP provisions and existing USCG regulations will be phased out over a period of approximately four years and replaced with National Standards of Performance ("NSPs") to be developed by EPA and implemented and enforced by the USCG. Although the 2013 VGP was scheduled to expire in December 2018, under VIDA the provisions of the 2013 VGP will remain in place until the new regulations are in place.
c. National Invasive Species Act
The USCG regulations adopted under the U.S. National Invasive Species Act (“NISA”) require the USCG's approval of any technology before it is placed on a vessel. As a result, the USCG has provided waivers to vessels which could not install the then as-yet unapproved technology. In May 2016, the USCG published a review of the practicability of implementing a more stringent ballast water discharge standard. The results concluded that technology to achieve a
45
significant improvement in ballast water treatment efficacy cannot be practically implemented. In February, 2016, the USCG issued a new rule amending the Coast Guard’s ballast water management record-keeping requirements. Effective February 22, 2016, vessels with ballast tanks operating exclusively on voyages between ports or places within a single Captain of the Port zone were required to submit an annual report of their ballast water management practices. However, on September 19, 2018, the USCG published a final rule eliminating the requirement. Moreover, as discussed above, under VIDA, existing USCG ballast water management regulations will be phased out over a period of approximately four years and replaced with NSPs to be developed by EPA and implemented and enforced by the USCG.
Installation of ballast water treatments systems (“BWTS”), will be needed on all our LNG Carriers. As long as our FSRUs are operating as FSRUs and kept stationary they will not need installation of a BWTS. The additional costs of complying with these rules, relating to all our vessels, are estimated to be in the range of $1.8 million and $2.1 million per vessel and will be phased in over time in connection with the renewal surveys that are required. We have therefore decided to install BWTS on all our LNG Carriers on their first drydocking after 2017. The installation of the BWTS on the
Golar Seal
was completed in 2018.
Clean Air Act
The U.S. Clean Air Act of 1970 (“CAA”) requires the EPA to promulgate standards applicable to emissions of volatile organic compounds and other air contaminants. Our vessels are subject to vapor control and recovery requirements for certain cargos when loading, unloading, ballasting, cleaning and conducting other operations in regulated port areas and emission standards for so-called “Category 3” marine diesel engines operating in U.S. waters. The marine diesel engine emission standards are currently limited to new engines beginning with the 2004 model year. On April 30, 2010, the EPA promulgated final emission standards for Category 3 marine diesel engines equivalent to those adopted in the amendments to Annex VI to MARPOL. The emission standards apply in two stages: near-term standards for newly-built engines apply from 2011, and long-term standards requiring an 80% reduction in nitrogen dioxides, or NOx, apply from 2016. Compliance with these standards may cause us to incur costs to install control equipment on our vessels in the future.
International Labour Organization
The International Labor Organization (the “ILO”) is a specialized agency of the UN that has adopted the Maritime Labor Convention 2006 (“MLC 2006”). A Maritime Labor Certificate and a Declaration of Maritime Labor Compliance is required to ensure compliance with the MLC 2006 for all ships above 500 gross tons in international trade. We believe that all our vessels are in substantial compliance with and are certified to meet MLC 2006.
Regulation of Greenhouse Gas Emissions
In February 2005, the Kyoto Protocol entered into force. Pursuant to the Kyoto Protocol, adopting countries are required to implement national programs to reduce emissions of certain gases, generally referred to as greenhouse gases, which are suspected of contributing to global warming. Currently, the emissions of greenhouse gases from international transport are not subject to the Kyoto Protocol. In December 2009, more than 27 nations, including the United States and China, signed the Copenhagen Accord, which includes a non-binding commitment to reduce greenhouse gas emissions. In addition, in December 2011, the Conference of the Parties to the United Nations Convention on Climate Change adopted the Durban Platform which calls for a process to develop binding emissions limitations on both developed and developing countries under the United Nations Framework Convention on Climate Change applicable to all Parties. The Paris Agreement, which resulted from the 2015 United Nations Climate Change Conference in Paris, does not directly limit greenhouse gas emissions from vessels (e.g., there are no mandatory initiatives affecting the shipping industry in the Paris Agreement); however the IMO has agreed on a plan to reduce carbon emissions from marine vessels, as part of the shipping industry’s contribution to the Paris Agreement, which was adopted in April 2018 (see further discussion below).
In addition to the voluntary strategies to reduce greenhouse gas emissions through the United Nations climate process, our operations may be impacted by mandatory requirements imposed by the IMO. As of January 1, 2013, all vessels, including rigs and drillships, must comply with mandatory requirements adopted in July 2011 by the MEPC relating to greenhouse gas emissions, including the Energy Efficiency Design Index ("EEDI") and the Ship Energy Efficiency Management Plan ("SEEMP"), which are technical and operational measures to improve energy efficiency and reduce greenhouse gas emissions. The regulations apply to all vessels of 400 gross tonnage and above. The IMO also adopted a mandatory requirement in October 2016 that ships of 5,000 gross tonnage and above record and report their fuel oil consumption. The requirement entered into force in March 2018. These new rules will likely affect the operations of vessels that are registered in countries that are signatories to MARPOL Annex VI or vessels that call upon ports located within such countries. The implementation of the EEDI and SEEMP standards could cause us to incur additional compliance costs. The IMO is also considering the implementation of a market-based mechanism for greenhouse gas emissions from vessels.
46
At MEPC 70 and MEPC 71, a draft outline of the structure of the initial strategy for developing a comprehensive IMO strategy on reduction of greenhouse gas emissions from ships was approved. In accordance with this roadmap, in April 2018, nations at the MEPC 72 adopted an initial strategy to reduce greenhouse gas emissions from ships. The initial strategy identifies “levels of ambition” to reducing greenhouse gas emissions, including (1) decreasing the carbon intensity from ships through implementation of further phases of the EEDI for new ships; (2) reducing carbon dioxide emissions per transport work, as an average across international shipping, by at least 40% by 2030, pursuing efforts towards 70% by 2050, compared to 2008 emission levels; and (3) reducing the total annual greenhouse emissions by at least 50% by 2050 compared to 2008 while pursuing efforts towards phasing them out entirely. The initial strategy notes that technological innovation, alternative fuels and/or energy sources for international shipping will be integral to achieve the overall ambition. These regulations could cause us to incur additional substantial expenses.The EU made a unilateral commitment to reduce overall greenhouse gas emissions from its member states from 20% of 1990 levels by 2020. The EU also committed to reduce its emissions by 20% under the Kyoto Protocol’s second period from 2013 to 2020. Starting in January 2018, large ships calling at EU ports are required to collect and publish data on carbon dioxide emissions and other information.
The European Union has indicated that it intends to propose an expansion of the existing European Union emissions trading scheme to include emissions of greenhouse gases from marine vessels and in January 2012, the European Commission launched a public consultation on possible measures to reduce greenhouse gas emissions from vessels. In April 2015, a regulation was adopted requiring that large vessels (over 5,000 gross tons) calling at European ports from January 2018 collect and publish data on carbon dioxide omissions.
Any passage of climate control legislation or other regulatory initiatives by the IMO, the EU, the U.S. or other countries where we operate, or any treaty adopted at the international level to succeed the Kyoto Protocol or Paris Agreement, that restricts emissions of greenhouse gases could require us to make significant financial expenditures that we cannot predict with certainty at this time. Even in the absence of climate control legislation, our business may be indirectly affected to the extent that climate change may result in sea level changes or certain weather events.
European Union Regulations
In October 2009, the European Union amended a directive to impose criminal sanctions for illicit ship-source discharges of polluting substances, including minor discharges, if committed with intent, recklessly or with serious negligence and the discharges individually or in the aggregate result in deterioration of the quality of water. Aiding and abetting the discharge of a polluting substance may also lead to criminal penalties. The directive applies to all types of vessels, irrespective of their flag, but certain exceptions apply to warships or where human safety or that of the ship is in danger. Criminal liability for pollution may result in substantial penalties or fines and increased civil liability claims. Regulation (EU) 2015/757 of the European Parliament and of the Council of 29 April 2015 (amending EU Directive 2009/16/EC) governs the monitoring, reporting and verification of carbon dioxide emissions from maritime transport, and, as of January 1, 2018, subject to some exclusions, requires companies with ships over 5,000 gross tonnage to monitor and report carbon dioxide emissions annually, which may cause us to incur additional expenses.
The European Union has adopted several regulations and directives requiring, among other things, more frequent inspections of high-risk ships, as determined by type, age, and flag as well as the number of times the ship has been detained. The European Union also adopted and extended a ban on substandard ships and enacted a minimum ban period and a definitive ban for repeated offenses. The regulation also provided the European Union with greater authority and control over classification societies, by imposing more requirements on classification societies and providing for fines or penalty payments for organizations that failed to comply. Furthermore, the EU has implemented regulations requiring vessels to use reduced sulfur content fuel for their main and auxiliary engines. The EU Directive 2005/33/EC (amending Directive 1999/32/EC) introduced requirements parallel to those in Annex VI relating to the sulfur content of marine fuels. In addition, the EU imposed a 0.1% maximum sulfur requirement for fuel used by ships at berth in EU ports.
Other Regulations
Our LNG vessels may also become subject to the HNS Convention. The HNS Convention introduces strict liability for the ship owner and covers pollution damage as well as the risks of fire and explosion, including loss of life or personal injury and damage to property. HNS includes, among other things, liquefied natural gas.
The April 2010 Protocol sets up a two-tier system of compensation composed of compulsory insurance taken out by ship owners and an HNS fund that comes into play when the insurance is insufficient to satisfy a claim or does not cover the
47
incident. Under the 2010 Protocol, if damage is caused by bulk HNS, claims for compensation will first be sought from the ship owner up to a maximum of 100 million Special Drawing Rights, or SDR. SDR is a potential claim on the freely usable currencies of the IMF members. If the damage is caused by packaged HNS or by both bulk and packaged HNS, the maximum liability is 115 million SDR. Once the limit is reached, compensation will be paid from the HNS Fund up to a maximum of 250 million SDR. The April 2010 Protocol has yet entered into effect as the required minimum number of consenting states has not been met. We cannot estimate the costs that may be needed to comply with any such requirements that may be adopted with any certainty at this time.
In June 2015 the IMO formally adopted the IGF Code, which is designed to minimize the risks involved with ships using low flashpoint fuels, including LNG. Compliance with the IGF Code is mandatory under SOLAS through adopted amendments. The IGF Code and the amendments to SOLAS became effective January 1, 2017.
C. Organizational Structure
For a full list of our subsidiaries, please see Exhibit 8.1 to this annual report and note 4 "Subsidiaries" of our consolidated financial statements included herein. All of our subsidiaries are, directly or indirectly, wholly-owned by us except for Hilli LLC and Hilli Corp.
D. Property, Plant and Equipment
For information on our fleet, please see the section of this item entitled "Vessel Operations".
We do not own any interest in real property. We lease approximately 10,700 square feet of office space in London, 32,000 square feet of office space in Oslo, for our ship management operations, 4,100 square feet of office space in Malaysia, 4,700 square feet of office space in Croatia and approximately 1,300 square feet of office space in Bermuda.
None.
The following discussion of our financial condition and results of operations should be read in conjunction with the sections of this Annual Report entitled "Item 4. Information on the Company" and our audited financial statements and notes thereto, included herein. Our financial statements have been prepared in accordance with U.S. GAAP. This discussion includes forward-looking statements based on assumptions about our future business. You should also review the section of this Annual Report entitled "Cautionary Statement Regarding Forward-Looking Statements" and "Item 3. Key Information-D. Risk Factors" for a discussion of important factors that could cause our actual results to differ materially from the results described in or implied by certain forward-looking statements.
Overview and Background
Please see the section of this Annual Report entitled "Item 4. Information on the Company-B. Business Overview-The Natural Gas Industry" for further discussion of the LNG market.
Factors Affecting Our Results of Operations and Future Results
Our historical results of operations and cash flows may not be indicative of results of operations and our results may be principally affected for the following reasons:
|
•
|
Conversion of our vessels to FLNG.
The
Gimi
was delivered to Keppel's shipyard in early 2019 to commence her conversion into a FLNG. FLNG conversions require highly specialized contractors and are subject to risk of delay or default by shipyards. In the event the shipyards do not perform under these agreements and we are unable to enforce certain refund guarantees with third party banks, we may lose part or all of our investment.
|
|
•
|
Utilization of the Hilli's full capacity.
The
Hilli Episeyo
is the world’s first converted FLNG vessel. FLNG vessels are complex and their operations are technically challenging and subject to mechanical risks. Accordingly, delays in contracting Train 3 and Train 4 capacity could adversely affect our financial performance.
|
48
|
•
|
We, or our consolidated entities, may enter into different financing arrangements.
Our current financing arrangements may not be representative of the arrangements we will enter into in the future. For example, we may amend our existing credit facilities or enter into other financing arrangements, which may be more expensive. In addition, by virtue of the sale and leaseback transactions we have entered into with certain lessor VIEs, where we are deemed to be the primary beneficiary of the VIEs, we are required by US GAAP to consolidate these VIEs into our results. Although consolidated into our results, we have no control over the funding arrangements negotiated by these lessor VIEs such as interest rates, maturity and repayment profiles. As of December 31, 2018, we consolidated lessor VIEs in connection with the lease financing transactions for eight of our vessels. Refer to note 5 "Variable Interest Entities" and note 22 "Debt" of our consolidated financial statements included herein.
|
|
•
|
Our results are affected by fluctuations in the fair value of our derivative instruments
. The change in fair value of our derivative instruments is included in our net income. These changes may fluctuate significantly as interest rates, the price of our common shares or the price of commodities fluctuate. This includes changes in the fair value of the oil derivative instrument. Our Total Return Swap has a credit arrangement, whereby we are required to provide cash collateral on the initial acquisition price and to subsequently post additional cash collateral that corresponds to any further unrealized loss. Refer to note 27 “Financial Instruments” in our Consolidated Financial Statements.
|
|
•
|
Our results will be dependent in part on the performance of the Cool Pool.
We, along with GasLog and Golar Power, are in a Cool Pool arrangement to market our vessels which are currently operating in the LNG shipping spot market. As of
March 15, 2019
, we had contributed eight (2017: eight) of the 16 vessels to the pool. Each of the vessel owners continues to be responsible for the manning and the technical management of its respective vessels. Our share of the net pool revenues will be dependent upon the performance of the Pool Manager in securing employment and negotiating rates for all of the pool vessels.
|
|
•
|
Our investment in joint ventures and affiliates may not result in anticipated profitability or generate cash flow sufficient to justify our investment
.
In November 2018, Golar Partners announced a distribution cut which failed to translate into an improved share price. Given the failure of the share price to recover and the sustained period of the suppressed share price, we recorded an other than temporary impairment charge of
$149.4 million
.
|
Please see the section of this Annual Report entitled “Item 3. Key Information-D. Risk Factors" for a discussion of certain risks inherent in our business.
Important Financial and Operational Terms and Concepts
We use a variety of financial and operational terms and concepts when analyzing our performance. These include the following:
Liquefaction services revenue.
Liquefaction services revenue is generated from a LTA entered into with our customer. Our provision of liquefaction services capacity includes the receipt of the customer’s gas, treatment and temporary storage on board our FLNG, and delivery of LNG to waiting carriers. We recognize revenue when obligations under the terms of our contract are satisfied.
Operating revenues (including revenue from collaborative arrangement)
.
Total operating revenues primarily refers to time and voyage charter revenues. We recognize revenues from time and voyage charters over the term of the charter as the applicable vessel operates under the charter. We do not recognize revenue during days when the vessel is off-hire, unless the charter agreement makes a specific exception. Operating revenues includes revenues from vessels engaged in collaborative arrangements, such as the Cool Pool. Specifically, for the Cool Pool, pool earnings (gross earnings of the pool less costs and overheads of the Cool Pool and fees to the Pool Manager) are aggregated and then allocated to the Pool Participants in accordance with the number of days each of their vessels are entered into the pool during the period.
Off-hire (including commercial waiting time).
Our vessels may be idle, that is, off-hire, for several reasons: scheduled drydocking or special survey or vessel upgrade or maintenance or inspection, which we refer to as scheduled off-hire; days spent waiting for a charter, which we refer to as commercial waiting time; and unscheduled repairs, maintenance, operational deficiencies, equipment breakdown, accidents, crewing strikes, certain vessel detentions or similar problems, or our failure to maintain the vessel in compliance with its specifications and contractual standards or to provide the required crew, which we refer to as unscheduled off-hire.
49
Vessel and other management fees.
As part of our operations we provide various management and administrative services to our joint ventures and affiliates.
Voyage, charterhire expenses and commission expenses (including expenses from collaborative arrangement).
Voyage expenses, which are primarily fuel costs but which also include other costs such as port charges, are paid by our charterers under our time charters. However, we may incur voyage related expenses during off-hire periods when positioning or repositioning vessels before or after the period of a time charter or before or after drydocking. While a vessel is on-hire, fuel costs are typically paid by the charterer, whereas during periods of commercial waiting time, fuel costs are paid by us. Charterhire expenses refer to the cost of chartering-in vessels to our fleet and commissions relate to brokers' commissions. Furthermore, voyage, charterhire expenses and commission expenses includes related expenses attributable to vessels engaged in collaborative arrangements, such as the Cool Pool. In relation to the vessels participating in the Cool Pool, voyage expenses and commissions include a net allocation from the pool participants' vessels less the other participants' share of the net revenues earned by our vessels included in the Cool Pool.
Time charter equivalent earnings.
In order to compare vessels trading under different types of charters, it is standard industry practice to measure the revenue performance of a vessel in terms of average daily time charter equivalent earnings, or TCE. This is calculated by dividing time and voyage charter revenues (including those from collaborative arrangements, such as the Cool Pool), less any voyage expenses, by the number of calendar days minus days for scheduled off-hire. Where we are paid a fee to position or reposition a vessel before or after a time charter, this additional revenue, less voyage expenses, is included in the calculation of TCE. TCE is a non-U.S. GAAP financial measure. Please see the section of this Annual Report entitled “Item 3. Key Information-A. Selected Financial Data" for a reconciliation of TCE to our total operating revenues.
Vessel operating expenses
. Vessel operating expenses include direct vessel operating costs associated with operating a vessel, such as crew wages, which are the most significant component, vessel supplies, routine repairs, maintenance, lubricating oils, insurance and management fees for the provision of commercial and technical management services.
Depreciation and amortization.
Depreciation and amortization expense, or the periodic cost charged to our income for the reduction in usefulness and long-term value of our vessels, is related to the number of vessels we own or operate under long-term capital leases. We depreciate the cost of our owned vessels, less their estimated residual value, and amortize the amount of our capital lease assets over their estimated economic useful lives, on a straight-line basis. We amortize our deferred drydocking costs generally over five years based on each vessel's next anticipated drydocking.
Administrative expenses.
Administrative expenses are comprised of general overhead, including personnel costs, legal and professional fees, property costs and other general administration expenses. Included within administrative expenses are pension and share option expenses. Pension expense includes costs associated with a defined benefit pension plan we maintain for some of our office-based employees (the UK Scheme and Marine Scheme). Although this scheme is now closed to new entrants the cost of this benefit will vary with the movement of actuarial variables and the value of the pension fund assets.
Project development expenses.
These include the costs associated with pursuing future contracts and developing our pipeline of activities that have not met our internal threshold for capitalization.
Realized and unrealized gain on oil derivative
instrument.
In December 2017, we recognized a derivative asset in relation to the LTA. The derivative asset represents the fair value of the estimated discounted cash flows of payments due as a result of the Brent Crude price moving above the contractual floor of $60.00 per barrel over the contract term. The derivative asset is adjusted to fair value at each balance date, the changes in fair value are recognized in each period in current earnings in "Realized and unrealized gain on oil derivative instrument", which forms part of our operating results.
Interest expense and interest income.
Interest expense depends on our and our consolidated lessor VIE entities' overall level of borrowings, including costs associated with such borrowing. By virtue of the sale and leaseback transactions we have entered into with lessor VIEs, where we are deemed to be the primary beneficiary, we are required to consolidate these VIEs into our results. Accordingly, although consolidated into our results, we have no control over the funding arrangements negotiated by these lessor VIE entities which includes the interest rates to be applied. For additional detail refer to note 5 "Variable Interest Entities" of our consolidated financial statements included herein. Furthermore, our estimation process is dependent upon the timeliness of receipt and accuracy of financial information provided by these lessor VIE entities. During construction of a newbuilding, FSRU or FLNG retrofitting period, interest expense incurred is capitalized in the cost of the newbuilding or retrofitted vessel. In addition this treatment may also apply to certain of our equity method investments, meeting specific criterion, during the period prior to commencement of their planned principal operations. Interest expense may also change with prevailing interest rates, although interest rate swaps or other derivative instruments may reduce the effect of these changes. Interest income will depend on prevailing interest rates and the level of our cash deposits and restricted cash deposits.
50
Impairment of non-current assets
.
Our vessels are reviewed for impairment whenever events or changes in circumstances indicate that the carrying amount may not be recoverable. In assessing the recoverability of our vessels' carrying amounts, we make assumptions regarding estimated future cash flows, the vessels' economic useful life and estimates in respect of residual or scrap value.
(Losses) gains on derivative instruments.
(Losses) gains on derivative instruments include market valuation adjustments for interest rate swap derivatives, realized interest income/(expense) on interest rate swaps and market valuation adjustments on Earn-Out Units. The market valuation adjustment for our derivatives may have a significant impact on our results of operations and financial position although it does not impact our liquidity. Although for certain of our derivative arrangements such as our total return equity swap cash collateral may be required to be posted. As at
December 31, 2018
cash collateral amounting to
$82.9 million
has been provided against our Total Return Swap (see note 14 "Restricted Cash and Short-term Deposits" of our consolidated financial statements included herein).
Other financial items.
Other financial items include financing fee arrangement costs such as commitment fees on credit facilities, foreign exchange gains/losses and other realized gains/(losses) on our financial instruments. Foreign exchange gains or losses arise due to the retranslation of our capital lease obligations and the cash deposits securing those obligations. Any gain or loss represents an unrealized gain or loss and will arise over time as a result of exchange rate movements. Our liquidity position will only be affected to the extent that we choose or are required to withdraw monies from or pay additional monies into the deposits securing our capital lease obligations.
Equity in net earnings or losses of affiliates.
This includes our share of the earnings or losses of our affiliates.
Affiliates are entities over which we generally have between 20% and 50% of the voting rights, or over which we have significant influence, but over which we do not exercise control or have the power to control the financial and operational policies. These are accounted for by the equity method of accounting. This also extends to entities in which we hold a majority ownership interest, but we do not control, due to the participating rights of non-controlling interests. We record our investment in the affiliate at cost (or fair value if a consequence of deconsolidation), and adjust the carrying amount for our share of the earnings or losses of the affiliate subsequent to the date of the investment and report the recognized earnings or losses in income. The excess, if any, of the purchase price over book value of our investments in equity method affiliates, or basis difference, is included in the consolidated balance sheets as "Investments in affiliates". The basis difference will then be amortized through the consolidated statements of income.
Non-Controlling Interest.
Non-controlling interest refers to the 44.6% interest in Hilli LLC. In addition, we have entered into various sale and leaseback arrangements with wholly-owned special purpose vehicles (“lessor SPVs”) of financial institutions. While we do not hold any equity investments in these lessor SPVs, we have determined that we are the primary beneficiary of these entities and accordingly, we are required to consolidate these variable interest entities (“VIEs”) into our financial results. Thus, the equity attributable to these financial institutions is included in our non-controlling interest. For additional details, see note 5 “Variable Interest Entities” to our Consolidated Financial Statements included herein.
Inflation and Cost Increases
Although inflation has had a moderate impact on operating expenses, interest costs, drydocking expenses and overhead, we do not expect inflation to have a significant impact on direct costs in the current and foreseeable economic environment other than potentially in relation to insurance costs and crew costs. LNG transportation is a business that requires specialist skills that take some time to acquire and the number of vessels is increasing. Therefore, there has been an increased demand for qualified crews, which has and will continue to the same extent to put inflationary pressure on crew costs. Only vessels on full cost pass-through charters would be fully protected from crew cost increases.
Results of Operations
Our results for the years ended December 31,
2018
,
2017
and
2016
were affected by several key factors:
|
•
|
Interest costs of $43.9 million, $72.4 million and $50.3 million were capitalized in
2018
,
2017
and
2016
, respectively, in relation to the FLNG conversion of the
Hilli,
the investment in our affiliate, Golar Power and our newbuilding under construction;
|
|
•
|
The realized and unrealized gains and losses on mark-to-market adjustments for our derivative instruments, excluding the
Hilli
embedded derivative, of $30.5 million loss, $20.7 million gain and $16.5 million gain in
2018
,
2017
and
2016
, respectively;
|
51
|
•
|
Mark-to-market loss of $16.8 million and gain of $15.1 million in
2018
and
2017
, respectively, on the embedded derivative in relation to the
Hilli
LTA.
|
|
•
|
In September 2014, the
Hilli
was delivered to Keppel, in Singapore for commencement of her FLNG conversion. The
Hilli
completed her conversion in October 2017 and subsequently underwent commissioning. In 2018, she completed commissioning and was accepted under the LTA with the Customer and is now in full commercial operation.
|
|
•
|
Other operating income for the year ended December 31,
2018
includes $50.7 million recovered from West Africa Gas Limited in relation to amounts due under the charter agreement. In addition, subsequent to the decision to wind down OneLNG, we have written off $12.7 million of the trading balance with OneLNG as we deem it to be no longer recoverable.
|
|
•
|
Other-than-temporary impairment on our investment in Golar Partners amounting to $149.4 million was recognized for the year ended December 31, 2018 in the line item Equity in net (losses) earnings of affiliates;
|
|
•
|
Charterhire expenses of $
nil
,
$17.4 million
and
$28.4 million
for the year ended December 31,
2018
,
2017
and
2016
, respectively, arising from the charter-back of the
Golar Grand
from Golar Partners, under an agreement executed at the time of the disposal to Golar Partners. On November 1, 2017, the
Golar Grand
arrangement concluded;
|
|
•
|
Our vessels were affected by commercial waiting time;
|
|
•
|
Share options expense on options granted during
2018
,
2017
and
2016
;
|
|
•
|
Project expenses such as those relating to FLNG project development;
|
|
•
|
Deconsolidation of Golar Power in July 2016, which resulted in the recognition of a loss of $8.5 million on loss of control; and
|
|
•
|
Impairment loss arising on the loan and associated interest receivables from the Douglas Channel Project consortium. Given the announcement of a negative Final Investment Decision, we reassessed the recoverability of the loan and accrued interest receivables from the Douglas Channel LNG Assets Partnership, or DCLAP, and concluded that DCLAP would not have the means to satisfy its obligations under the loan. Accordingly, we recognized an impairment charge of $7.6 million in 2016.
|
The impact of these factors is discussed in more detail below.
A. Operating Results
Year ended
December 31, 2018
, compared with the year ended
December 31, 2017
As of
December 31, 2018
, we managed our business and analyzed and reported our results of operations on the basis of three segments: Vessel operations, FLNG and Power. Although our segments are generally influenced by the same economic factors, each represents a distinct product in the LNG industry. See note 7 "Segment Information" of our consolidated financial statements included herein.
The following details our consolidated revenues and expense information for the three segments for each of the years ended
December 31, 2018
and
2017
:
Vessel operations segment
52
|
December 31,
|
||||||||
|
(in thousands of $, except average daily TCE)
|
2018
|
2017
|
Change
|
% Change
|
||||
|
Total operating revenues
|
302,979
|
|
143,537
|
|
159,442
|
|
111
|
%
|
|
Vessel operating expenses
|
(70,543
|
)
|
(55,944
|
)
|
(14,599
|
)
|
26
|
%
|
|
Voyage, charterhire and commission expenses (including expenses from collaborative arrangement)
|
(104,463
|
)
|
(61,171
|
)
|
(43,292
|
)
|
71
|
%
|
|
Administrative expenses
(2)
|
(51,716
|
)
|
(36,296
|
)
|
(15,420
|
)
|
42
|
%
|
|
Project development expenses
(2)
|
(5,165
|
)
|
(9,796
|
)
|
4,631
|
|
(47
|
)%
|
|
Depreciation and amortization
|
(65,496
|
)
|
(76,522
|
)
|
11,026
|
|
(14
|
)%
|
|
Other operating gains
|
50,740
|
|
—
|
|
50,740
|
|
100
|
%
|
|
Operating income (loss)
|
56,336
|
|
(96,192
|
)
|
152,528
|
|
(159
|
)%
|
|
Equity in net (losses) earnings of affiliates
|
(138,677
|
)
|
1,503
|
|
(140,180
|
)
|
(9,327
|
)%
|
|
Other Financial Data:
|
||||||||
|
Average Daily TCE
(1)
(to the closest $100)
|
43,700
|
|
17,500
|
|
26,200
|
|
150
|
%
|
|
Calendar days less scheduled off-hire days
|
3,987
|
|
3,885
|
|
102
|
|
3
|
%
|
(1) TCE is a non-GAAP financial measure. For a reconciliation of TCE, please see “Item 3. Key Information-A. Selected Financial Data."
(2) With effect from quarter ended June 30, 2018, we presented new line item, "Project development expenses", which includes costs associated with pursuing future contracts and developing our pipeline of activities that have not met our internal threshold for capitalization. Previously, these costs were presented within "Administrative expenses" along with our general overhead costs. This presentation change has been retrospectively adjusted in prior periods. See note 2 "Accounting Policies" of our consolidated financial statements included herein.
Total operating revenues:
Operating revenues increased by
$159.4 million
to
$303.0 million
for the year ended
December 31, 2018
compared to
$143.5 million
in 2017. This was principally due to an increase of:
|
•
|
$144.8 million as a result of improved utilization and daily hire rates, including repositioning fees, from our vessels operating within the Cool Pool during the year ended December 31, 2018 compared to the same period in 2017; and
|
|
•
|
$16.0 million as a result of the
Golar Glacier
commencing her new 12 month charter in February 2018.
|
Average daily TCE:
As a result of an overall increase in charter rates and utilization of most of our vessels within the period, we had a higher daily TCE for the year ended
December 31, 2018
of
$43,700
compared to
$17,500
for the same period in
2017
.
Vessel operating expenses:
Vessel operating expenses
increased by
$14.6 million
to
$70.5 million
for the year ended
December 31, 2018
, compared to
$55.9 million
for the same period in
2017
, primarily due to an increase of:
|
•
|
$6.2 million in operating costs in relation to our vessels operating within the Cool Pool; and
|
|
•
|
$7.8 million of reactivation and operating costs of the
Golar Viking
as she was taken out of lay-up in January 2018.
|
Voyage, charterhire and commission expenses:
Largely relate to charterhire expenses, fuel costs associated with commercial waiting time and vessel positioning costs. While a vessel is on-hire, fuel costs are typically paid by the charterer, whereas during periods of commercial waiting time, fuel costs are paid by us. The increase in voyage, charterhire and commission expenses of
$43.3 million
to
$104.5 million
for the year ended
December 31, 2018
compared to
$61.2 million
for the same period in
2017
, is principally due to an increase of:
|
•
|
$52.2 million of voyage expenses that arose from the increased utilization of our vessels participating within the Cool Pool, for which we receive credit under the Cool Pool arrangement (further described in note 28(d) "Related Parties" of our consolidated financial statements included herein); and
|
|
•
|
$3.2 million due to the
Golar Viking
being taken out of lay-up.
|
This was partially offset by the $12.7 million decrease in charterhire expense relating to the charter back of the
Golar Grand
from Golar Partners. As the charter back of the
Golar Grand
was completed in November 1, 2017, there was no comparable charterhire expense in 2018.
53
Administrative expenses:
Administrative expenses increased by
$15.4 million
to
$51.7 million
for the year ended
December 31, 2018
compared to
$36.3 million
for the same period in
2017
, principally due to an increase in salaries and employee benefits (including share options expenses).
Project development expenses:
Project development expenses decreased by
$4.6 million
to
$5.2 million
for the year ended
December 31, 2018
compared to
$9.8 million
for the same period in
2017
, principally due to a decrease in non-capitalized project-related expenses comprising of legal, professional and consultancy costs.
Depreciation and amortization:
Depreciation and amortization decreased by
$11.0 million
to
$65.5 million
for the year ended
December 31, 2018
compared to
$76.5 million
for the same period in
2017
, principally due to a decrease of:
|
•
|
$7.8 million in
Golar Tundra
depreciation as a result of a $9.7 million catch-up charge recognized upon the vessel ceasing to be classified as held-for-sale in March 2017; and
|
|
•
|
$3.3 million in the
Gandria
depreciation as she reached the end of her useful economic life at
December 31, 2017
, and accordingly, no further depreciation expense was recognized in 2018.
|
Other operating gains:
This represents initial amounts recovered in connection with the ongoing arbitration proceedings arising from the delays and the termination of the
Golar Tundra
time charter with a former charterer.
Equity in net earnings of affiliates:
|
December 31,
|
||||||||
|
(in thousands of $)
|
2018
|
2017
|
Change
|
% Change
|
||||
|
Share in net earnings in Golar Partners
|
7,001
|
|
17,702
|
|
(10,701
|
)
|
(60
|
)%
|
|
Impairment of investment in Golar Partners
|
(149,389
|
)
|
—
|
|
(149,389
|
)
|
100
|
%
|
|
Net loss on deemed disposal of investments in Golar Partners
|
—
|
|
(16,992
|
)
|
16,992
|
|
100
|
%
|
|
Share of net earnings (loss) in other affiliates
|
3,711
|
|
793
|
|
2,918
|
|
368
|
%
|
|
(138,677
|
)
|
1,503
|
|
(140,180
|
)
|
(9,327
|
)%
|
|
The decrease in the share of net earnings in Golar Partners is as a result of a decrease in the underlying performance of Golar Partners in 2018. As a result, during the year ended
December 31, 2018
, we recognized an impairment charge of $149.4 million. The year ended December 31, 2017 included a deemed loss on disposal of $17.0 million as a result of a dilution in our holding in Golar Partners due to further issuances of common units by Golar Partners in February 2017. As of
December 31, 2018
, we held a
32.0%
(
2017
:
31.8%
) ownership interest in Golar Partners (including our
2%
general partner interest) and
100%
of IDRs.
The share of net earnings in other affiliates represents our share of equity in Egyptian Company for Gas Services S.A.E ("ECGS") and Avenir LNG Limited ("Avenir"). During the year ended
December 31, 2018
we recognized negative goodwill of
$3.8 million
in equity in net earnings of affiliates to reflect our bargain purchase of Avenir. Refer to note 16 "Investment in Affiliates" of our Consolidated Financial Statements included herein for further details.
54
FLNG segment
|
December 31,
|
||||||||
|
(in thousands of $)
|
2018
|
2017
|
Change
|
% Change
|
||||
|
Total operating revenues
|
127,625
|
|
—
|
|
127,625
|
|
100
|
%
|
|
Vessel operating expenses
|
(26,317
|
)
|
(2
|
)
|
(26,315
|
)
|
1,315,750
|
%
|
|
Voyage expenses
|
(1,363
|
)
|
(121
|
)
|
(1,242
|
)
|
1,026
|
%
|
|
Administrative expenses
(1)
|
175
|
|
(1,736
|
)
|
1,911
|
|
(110
|
)%
|
|
Project development expenses
(1)
|
(16,526
|
)
|
(2,506
|
)
|
(14,020
|
)
|
559
|
%
|
|
Depreciation and amortization
|
(28,193
|
)
|
—
|
|
(28,193
|
)
|
100
|
%
|
|
Other operating gains
|
2,749
|
|
15,100
|
|
(12,351
|
)
|
(82
|
)%
|
|
Operating gain
|
58,150
|
|
10,735
|
|
47,415
|
|
442
|
%
|
|
Equity in net losses of affiliates
|
(2,047
|
)
|
(8,153
|
)
|
6,106
|
|
(75
|
)%
|
(1) With effect from quarter ended June 30, 2018, we presented new line item, "Project development expenses", which includes costs associated with pursuing future contracts and developing our pipeline of activities that have not met our internal threshold for capitalization. Previously, these costs were presented within "Administrative expenses" along with our general overhead costs. This presentation change has been retrospectively adjusted in prior periods. See note 2 "Accounting Policies" of our consolidated financial statements included herein.
Total operating revenues:
On May 31, 2018, the
Hilli
was accepted by the Customer and, accordingly, commenced operations. As a result, she generated
$127.6 million
total operating revenues in relation to her liquefaction services for the year ended
December 31, 2018
.
Vessel operating expenses:
This represents the vessel operating expenses incurred by the
Hilli
since she commenced operations.
Project development expenses:
This relates to non-capitalized project-related expenses comprising of legal, professional and consultancy costs. The increase for the twelve months ended
December 31, 2018
was primarily as a result of increased engineering consultation fees and front-end engineering and design costs in relation to the Greater Tortue Ahmeyim project.
Depreciation:
Subsequent to the Customer's acceptance of the
Hilli
, we determined her to be operational and, therefore, depreciation commenced during the second quarter of 2018 .
Other operating gains:
Includes the realized and unrealized gain on the oil derivative instrument. In 2018, we recognized a realized gain of $26.7 million, and an unrealized fair value loss of $10.0 million, relating to the LTA oil derivative instrument as a result of the increased price of Brent Crude during the year. The derivative asset was recognized upon the LTA becoming effective in December 2017. In 2017, we recognized an unrealized fair value gain of $15.1 million.
For the year ended
December 31, 2018
, this is partially offset by a $1.3 million write off of capitalized conversion costs in relation to the
Gandria
. In addition, subsequent to the decision to wind down OneLNG, we have written off $12.7 million of the trading balance with OneLNG as we deem it to be no longer recoverable.
Equity in net losses of affiliates:
Pursuant to the formation of OneLNG in July 2016, we equity account for our share of net losses in OneLNG. Given the difficulties in finalizing an attractive debt financing package along with other capital and resource priorities, in April 2018, Golar and Schlumberger decided to wind down OneLNG and work on FLNG projects as required on a case-by-case basis. As a result, activity levels have been substantially reduced for the year ended
December 31, 2018
and the carrying value of the investment was written down to $nil.
Power segment
|
December 31,
|
||||||||
|
(in thousands of $)
|
2018
|
2017
|
Change
|
% Change
|
||||
|
Equity in net (losses) of Golar Power
|
(16,913
|
)
|
(18,798
|
)
|
1,885
|
|
(10
|
)%
|
55
Pursuant to the formation of Golar Power in July 2016, we have accounted for our interest in Golar Power under the equity method.
The share of net losses of Golar Power principally relates to trading activity of the
Golar Celsius
and the
Golar Penguin
operating as LNG carriers within the Cool Pool arrangement (further described in note 28 "Related Parties" of our consolidated financial statements included herein) and the administrative cost of business development activities from Golar Power's Brazilian subsidiaries. The main Brazilian activity relates to the CELSE project, which is not yet operational as the power plant is still under construction.
Other non-operating results
The following details our other consolidated results for the years ended
December 31, 2018
and
2017
:
|
December 31,
|
||||||||
|
(in thousands of $)
|
2018
|
2017
|
Change
|
% Change
|
||||
|
Total other non-operating expense
|
—
|
|
(81
|
)
|
81
|
|
(100
|
)%
|
|
Interest income
|
10,133
|
|
5,890
|
|
4,243
|
|
72
|
%
|
|
Interest expense
|
(101,908
|
)
|
(59,305
|
)
|
(42,603
|
)
|
72
|
%
|
|
(Losses) gains on derivative instruments
|
(30,541
|
)
|
20,696
|
|
(51,237
|
)
|
(248
|
)%
|
|
Other financial items, net
|
(1,481
|
)
|
(69
|
)
|
(1,412
|
)
|
2,046
|
%
|
|
Income taxes
|
(1,267
|
)
|
(1,505
|
)
|
238
|
|
(16
|
)%
|
|
Net income attributable to non-controlling interests
|
(63,214
|
)
|
(34,424
|
)
|
(28,790
|
)
|
84
|
%
|
Interest income:
Interest income increased by
$4.2 million
to
$10.1 million
for the year ended
December 31, 2018
, compared to
$5.9 million
for the same period in
2017
due to returns on our fixed deposits that had been made in 2018, and income derived from the lending capital of our lessor VIEs, that we are required to consolidate under U.S. GAAP.
Interest expense:
Interest expense increased by
$42.6 million
to
$101.9 million
for the year ended
December 31, 2018
compared to
$59.3 million
for the same period in
2017
. In addition to higher LIBOR rates, this was primarily due to:
|
•
|
$22.7 million increase in interest expense arising on the loan facilities of our consolidated lessor VIEs (refer to note 5 "Variable Interest Entities ("VIE")" of our consolidated financial statements included herein), in particular on the
Hilli
post-delivery sale and leaseback arrangement entered into during June 2018;
|
|
•
|
$21.7 million lower capitalized interest on borrowing costs in relation to our investment in the
Hilli
FLNG conversion prior to acceptance of the vessel;
|
|
•
|
$7.0 million increase in amortization of deferred financing costs in relation to the
Hilli
facility; and
|
|
•
|
$1.4 million increase in interest expense in relation to the $402.5 million convertible bond issued in February 2017, resulting in a full year of interest incurred in 2018.
|
This was partially offset by a decrease of:
|
•
|
$5.9 million in interest expense relating to the
Hilli
disposal;
|
|
•
|
$5.0 million higher capitalized interest on borrowing costs in relation to our investment in Golar Power.
|
Losses on derivative instruments:
Losses on derivative instruments increased by
$51.2 million
to a loss of
$30.5 million
for the year ended December 31, 2018 compared to a gain of
$20.7 million
for the same period in 2017. The movement was primarily due to:
Net unrealized and realized gains on interest rate swap agreements
: As of December 31, 2018, we have an interest rate swap portfolio with a notional amount of $950 million, none of which are designated as hedges for accounting purposes. Net unrealized gains on the interest rate swaps decreased to a gain of $0.6 million for the year ended December 31, 2018 compared to a gain of $6.6 million for the same period in 2017, due to an improvement in the long-term swap rates, offset by the decreased notional value of the swap portfolio over the period. Realized gains on our interest rate swaps increased to a gain of $8.1 million for the year ended December 31, 2018, compared to a loss of $3.8 million for the same period in 2017. The increase was primarily due to higher LIBOR rates for the year ended December 31, 2018.
56
Unrealized (losses) gains on total return swap (or equity swap):
In December 2014, we established a three month facility for a Stock Indexed Total Return Swap Programme or Equity Swap Line with DNB Bank ASA in connection with a share buyback scheme. The facility has been extended to June 2019. The equity swap derivatives mark-to-market adjustment resulted in a net loss of $30.7 million recognized in the year ended December 31, 2018 compared to a gain of $16.6 million for the same period in 2017. The loss in 2018 is due to the fall in the Company's share price during 2018.
Unrealized mark-to-market losses on Earn-Out Units:
This relates to the mark-to-market movement on the Earn-Out Units issuable in connection with the IDR reset transaction in October 2016, which we recognize as a derivative asset in our consolidated financial statements. The decrease in Golar Partners' quarterly distribution to $0.4042 per common unit on October 24, 2018 resulted in the contingent Earn-Out Units arising out of the IDR reset transaction in October 2016 not crystallizing and, accordingly, we recognized a mark-to-market loss of $7.4 million for the year ended December 31, 2018, effectively reducing the derivative asset to $nil at December 31, 2018, compared to a gain of $0.4 million for the same period in 2017.
Net income attributable to non-controlling interests:
The net income attributable to non-controlling interests comprises of (i) $19.7 million and $1.5 million in relation to the non-controlling shareholders who hold interests in Hilli LLC and Hilli Corp (prior to the incorporation of Hilli LLC) for the year ended
December 31, 2018
and
2017
, respectively, and (ii) $43.5 million and $32.9 million in relation to the equity interests in our lessor VIEs for the year ended
December 31, 2018
and
2017
, respectively. We are party to sale and leaseback arrangements for eight vessels with these lessor VIEs. While we do not hold any equity investments in these lessor VIEs, we are the primary beneficiary. Accordingly, these lessor VIEs are consolidated into our financial results and thus the equity attributable to the financial institutions in their respective variable interest entities are included in non-controlling interests in our consolidated results.
Year ended
December 31, 2017
, compared with the year ended
December 31, 2016
The following details our consolidated revenues and expense information for the three segments for each of the years ended
December 31, 2017
and
2016
:
57
Vessel operations segment
|
December 31,
|
||||||||
|
(in thousands of $, except average daily TCE)
|
2017
|
2016
|
Change
|
% Change
|
||||
|
Total operating revenues
|
143,537
|
|
80,257
|
|
63,280
|
|
79
|
%
|
|
Vessel operating expenses
|
(55,944
|
)
|
(53,163
|
)
|
(2,781
|
)
|
5
|
%
|
|
Voyage, charterhire and commission expenses (including expenses from collaborative arrangement)
|
(61,171
|
)
|
(47,563
|
)
|
(13,608
|
)
|
29
|
%
|
|
Administrative expenses
(2)
|
(36,296
|
)
|
(37,302
|
)
|
1,006
|
|
(3
|
)%
|
|
Project development expenses
(2)
|
(9,796
|
)
|
(5,082
|
)
|
(4,714
|
)
|
93
|
%
|
|
Depreciation and amortization
|
(76,522
|
)
|
(72,972
|
)
|
(3,550
|
)
|
5
|
%
|
|
Impairment of non-current assets
|
—
|
|
(1,706
|
)
|
1,706
|
|
(100
|
)%
|
|
Other operating gains - LNG trading
|
—
|
|
16
|
|
(16
|
)
|
(100
|
)%
|
|
Operating loss
|
(96,192
|
)
|
(137,515
|
)
|
41,323
|
|
(30
|
)%
|
|
Equity in net earnings of affiliates
|
1,503
|
|
37,344
|
|
(35,841
|
)
|
(96
|
)%
|
|
Other Financial Data:
|
||||||||
|
Average Daily TCE
(1)
(to the closest $100)
|
17,500
|
|
10,100
|
|
7,400
|
|
73
|
%
|
|
Calendar days less scheduled off-hire days
|
3,885
|
|
4,034
|
|
(149
|
)
|
(4
|
)%
|
(1) TCE is a non-GAAP financial measure. For a reconciliation of TCE rates, please see “Item 3. Key Information-A. Selected Financial Data."
(2) With effect from quarter ended June 30, 2018, we presented new line item, "Project development expenses", which includes costs associated with pursuing future contracts and developing our pipeline of activities that have not met our internal threshold for capitalization. Previously, these costs were presented within "Administrative expenses" along with our general overhead costs. This presentation change has been retrospectively adjusted in prior periods. See note 2 "Accounting Policies" of our consolidated financial statements included herein.
Total Operating revenues:
Operating revenues increased by $63.3 million to $143.5 million for the year ended December 31, 2017 compared to $80.3 million in 2016. This was principally due to an increase in revenue of:
|
•
|
$54.7 million as a result of improved utilization and daily hire rates, including repositioning fees, from our vessels participating in the Cool Pool for the year ended December 31, 2017 compared to the same period in 2016;
|
|
•
|
$1.3 million in revenue from the
Golar Arctic
which was fully utilized for the year ended December 31, 2017 compared to the same period in 2016 when she was mostly off-hire during the first quarter in preparation for her charter on March 23, 2016 with an energy and logistics company; and
|
|
•
|
$12.4 million in management fee income, from $14.2 million in 2016 to $26.6 million in 2017, from the provision of services to Golar Partners, Golar Power and OneLNG under our management and administrative services and ship management agreements. The increase is primarily a result of the services provided to Golar Power and OneLNG throughout the year ended December 31, 2017, whereas, services were only provided to Golar Power and OneLNG for a portion of 2016, subsequent to their formation in July 2016.
|
These are partially offset by a decrease of $4.5 million in revenue in 2017 from the
Golar Penguin
and the
Golar Celsius
following the deconsolidation of Golar Power, and thus its fleet, from July 2016.
The increase of $7,400 in average daily TCE rate to $17,500 for 2017 compared to $10,100 in 2016 is primarily due to the overall increase in charter rates and utilization levels of our vessels in 2017.
Vessel operating expenses:
Vessel operating expenses increased by $2.8 million to $55.9 million for the year ended December 31, 2017, compared to $53.2 million in 2016. This was principally due to an increase of:
|
•
|
$2.3 million in relation to the
Gandria
, mainly due to the settlement of its lay-up fees;
|
|
•
|
$1.8 million in operating costs in relation to our vessels operating in the Cool Pool; and
|
|
•
|
$3.0 million related to bringing in-house our technical operations and the related change in classification of fleet management related administrative costs from administrative expenses to vessel operating costs.
|
58
These are partially offset by a decrease of $4.5 million in operating expenses in 2017, in relation to the
Golar Penguin
and the
Golar Celsius
following the deconsolidation of Golar Power, and thus its fleet, from July 2016.
Voyage, charterhire and commission expenses:
Voyage, charterhire and commission expenses largely relate to charterhire expenses, fuel costs associated with commercial waiting time and vessel positioning costs. While a vessel is on-hire, fuel costs are typically paid by the charterer, whereas during periods of commercial waiting time, fuel costs are paid by us.
The increase in
voyage, charterhire and commission expenses
of
$13.6 million to $61.2 million for the year ended December 31, 2017 compared to $47.6 million in 2016 was primarily due to an increase of $26.6 million of voyage expenses that arose from the increased utilization of our vessels participating in the Cool Pool, which are subsequently recouped from the charterer.
This has been partially offset by:
|
•
|
a decrease of $9.6 million in charterhire expense relating to the charter back of the
Golar Grand
from Golar Partners. The decrease is due to: (i)
Golar Grand’s
drydocking from February to April 2017, which resulted in no charterhire payable to Golar Partners and (ii) on November 1, 2017, the
Golar Grand
arrangement concluded;
|
|
•
|
a decrease of $2.0 million from the
Golar Penguin
and the
Golar Celsius
following the deconsolidation of Golar Power, and thus its fleet, from July 2016; and
|
|
•
|
a decrease of $0.6 million from
Golar Arctic
as she incurred significant voyage costs prior to commencement of her charter in 2016 with an energy and logistics company.
|
Administrative expenses:
Administrative expenses decreased by $1.0 million to $36.3 million for the year ended December 31, 2017 compared to $37.3 million in 2016. This was due to a general decrease following a change in the classification of fleet management related administrative costs to vessel operating expenses.
Project development expenses:
Project expenses increased by $4.7 million to $9.8 million for the year ended December 31, 2017 compared to $5.1 million in 2016. This was primarily due to an increase in salaries and benefits, mainly as a result of an increase in headcount, and an increase in travel costs of $1.4 million in connection with the various new ventures and associated projects entered into during the second half of 2016, such as Golar Power and OneLNG. This was partially offset by (i) a decrease of $1.8 million in legal and professional fees; and (ii) a decrease in administration expenses due to greater capitalization of certain costs directly associated with the conversion of the
Hilli
into a FLNG.
Depreciation and amortization:
Depreciation and amortization increased by $3.6 million to $76.5 million for the year ended December 31, 2017 compared to $73.0 million in 2016. This was primarily due to an increase of $15.5 million in depreciation expense in 2017 relating to the
Golar Tundra
. This includes a $9.7 million depreciation catch up charge recognized upon the vessel ceasing to be classified as held-for-sale in March 2017.
This was partially offset by a decrease in depreciation and amortization of:
|
•
|
$5.7 million from the
Golar Penguin
and the
Golar Celsius
following the deconsolidation of Golar Power, and thus its fleet, from July 2016; and
|
|
•
|
$5.2 million from the
Gimi
as she reached the end of her useful life at December 31, 2016.
|
Impairment of non-current assets:
In December 31, 2016, we realized an impairment charge amounting to $1.7 million related to equipment classified as "Other non-current assets" due to the uncertainty of its future usage. During the year ended December 31, 2017, there was no comparable amount.
Equity in net earnings of affiliates:
|
December 31,
|
||||||||
|
(in thousands of $)
|
2017
|
2016
|
Change
|
% Change
|
||||
|
Share of net earnings in Golar Partners
|
17,702
|
|
37,716
|
|
(20,014
|
)
|
(53
|
)%
|
|
Loss on disposal of investments in Golar Partners
|
(16,992
|
)
|
—
|
|
(16,992
|
)
|
100
|
%
|
|
Share of net earnings (loss) in other affiliates
|
793
|
|
(372
|
)
|
1,165
|
|
(313
|
)%
|
|
1,503
|
|
37,344
|
|
(35,841
|
)
|
(96
|
)%
|
|
The share of net earnings in Golar Partners represents our share of equity in Golar Partners. The decrease in the share of net earnings in Golar Partners is as a result of a decrease in the underlying performance of Golar Partners in 2017. Our share of
59
net earnings in Golar Partners is partially offset by a deemed loss on disposal of $17.0 million in 2017, as a result of dilution in our holding in Golar Partners due to further issuances of common units by Golar Partners in February 2017. As of December 31, 2017, we held a 31.8% (2016: 33.9%) ownership interest in Golar Partners (including our 2% general partner interest) and 100% of IDRs.
FLNG segment
|
December 31,
|
||||||||
|
(in thousands of $)
|
2017
|
2016
|
Change
|
% Change
|
||||
|
Total operating expenses
|
(4,365
|
)
|
(3,576
|
)
|
(789
|
)
|
22
|
%
|
|
Unrealized gain on oil derivative instrument
|
15,100
|
|
—
|
|
15,100
|
|
100
|
%
|
|
Operating gain (loss)
|
10,735
|
|
(3,576
|
)
|
14,311
|
|
(400
|
)%
|
|
|
|
|||||||
|
Equity in net loss of affiliates
|
(8,153
|
)
|
—
|
|
(8,153
|
)
|
100
|
%
|
Total operating expenses
: This relates to non-capitalized project related expenses comprising of legal, professional and consultancy costs.
Unrealized gain on oil derivative instrument:
In 2017, we recognized a $15.1 million unrealized fair value gain relating to the
Hilli
LTA embedded derivative. This represents the fair value movements from the initial value ascribed to the derivative upon effectiveness of the LTA in December 2017 and the fair value at the balance sheet date. See note 2 "Basis of Preparation and Significant Accounting Policies" of our Consolidated Financial Statements included herein for further details.
Equity in net loss of affiliates:
Pursuant to the formation of OneLNG in July 2016, we account for our share of net losses in OneLNG.
Power segment
|
December 31,
|
||||||||
|
(in thousands of $)
|
2017
|
2016
|
Change
|
% Change
|
||||
|
Equity in net (losses) earnings of affiliates
|
(18,798
|
)
|
10,534
|
|
(29,332
|
)
|
(278
|
)%
|
The share of net losses of Golar Power principally relates to trading activity of the
Golar Celsius
and the
Golar Penguin
operating as LNG carriers within the Cool Pool arrangement (further described in note 28 "Related Parties" of our Consolidated Financial Statements included herein) and the results of operations from Golar Power's Brazilian subsidiaries.
Our share of net earnings in Golar Power in 2016 of $10.5 million includes $21.9 million, being our share of the fair value remeasurement gain arising on Golar Power’s 50% retained investment in the entity which holds the investment in the Sergipe Project. The recognition of this gain was triggered by Golar Power’s step acquisition of the other 50% equity interest as held by the project developer, Genpower, in October 2016.
60
Other non-operating results
The following details our other consolidated results for the years ended December 31, 2017 and 2016:
|
December 31,
|
||||||||
|
(in thousands of $)
|
2017
|
2016
|
Change
|
% Change
|
||||
|
Total other non-operating expense
|
(81
|
)
|
(8,615
|
)
|
8,534
|
|
(99
|
)%
|
|
Interest income
|
5,890
|
|
2,969
|
|
2,921
|
|
98
|
%
|
|
Interest expense
|
(59,305
|
)
|
(71,201
|
)
|
11,896
|
|
(17
|
)%
|
|
Gains on derivative instruments
|
20,696
|
|
16,491
|
|
4,205
|
|
25
|
%
|
|
Other financial items, net
|
(69
|
)
|
(7,800
|
)
|
7,731
|
|
(99
|
)%
|
|
Income taxes
|
(1,505
|
)
|
589
|
|
(2,094
|
)
|
(356
|
)%
|
|
Net income attributable to non-controlling interests
|
(34,424
|
)
|
(25,751
|
)
|
(8,673
|
)
|
34
|
%
|
Total other non-operating expense:
On July 6, 2016, we closed the disposal of a 50% ownership interest in Golar Power, the entity that owns and operates
Golar Penguin
,
Golar Celsius
, newbuild
Golar Nanook
and LNG Power Limited, which holds the rights to participate in the Sergipe Project. This resulted in the recognition of a loss of $8.5 million in 2016. There was no comparable amount in 2017.
Interest income:
Interest income increased by $2.9 million to $5.9 million for the year ended December 31, 2017, compared to $3.0 million for the same period in 2016 due to returns on our fixed deposits that had been made in 2017, using the proceeds from our financing activities in the first quarter of 2017.
Interest expense:
Interest expense decreased by $11.9 million to $59.3 million for the year ended December 31, 2017 compared to $71.2 million for the same period in 2016 and is primarily due to higher capitalized interest on borrowing costs recognized in 2017 in respect of the
Hilli
FLNG conversion and our investment in Golar Power, as well as lower interest expense arising on the loan facilities of our lessor VIEs.
This is partially offset by an increase of:
|
•
|
$8.2 million in interest expense in relation to the $402.5 million convertible bonds issued in February 2017, which replaced the old $250 million convertible bonds that were repaid in early March 2017;
|
|
•
|
$6.0 million in interest expense from the $150.0 million margin loan that we entered into in March 2017; and
|
|
•
|
$13.1 million in interest expense from the additional $275 million drawn down on the
Hilli
pre-delivery facility during 2017.
|
Gains on derivative instruments:
Gains on derivative instruments increased by $4.2 million to a gain of $20.7 million for the year ended December 31, 2017, compared to a gain of $16.5 million for the same period in 2016. The movement was primarily due to:
Net realized and unrealized gains (losses) on interest rate swap agreements
: Net realized and unrealized gains (losses) on interest rate swaps increased to a gain of $2.8 million for the year ended December 31, 2017 from a loss of $7.3 million for the same period in 2016. As of December 31, 2017, we have an interest rate swap portfolio with a notional amount of $1.3 billion, none of which are designated as hedges for accounting purposes. The improvement in the mark-to-market position of our interest rate swaps is due to the increase in long-term swap rates for the year ended December 31, 2017 compared to prior year.
Mark-to-market adjustment for equity derivatives
(or equity swap):
In December 2014, we established a three month facility for a Stock Indexed Total Return Swap Programme or Equity Swap Line with DNB Bank ASA in connection with a share buyback scheme. The facility has been subsequently extended to June 2018. The equity swap derivatives mark-to-market adjustment resulted in a net gain of $16.6 million recognized in the year ended December 31, 2017 compared to a net gain of $24.8 million for the same period in 2016. The gain in 2017, is due to the continued improvements in the Company's share price during 2017.
Other financial item
s
, net:
Other financial items, increased by $7.7 million to a loss of $0.1 million for the year ended December 31, 2017 compared to a loss of $7.8 million for the same period in 2016. The movement was primarily due to:
Impairment of loan:
Given the announcement of a negative final investment decision from the Douglas Channel Project consortium, we reassessed the recoverability of the loan previously granted by Golar and accrued interest receivables from DCLAP, and concluded that DCLAP would not have the means to satisfy its obligations under the loan. Accordingly, during the year ended
61
December 31, 2016, we recognized an impairment charge of $7.6 million. There was no comparable amount for the year ended December 31, 2017.
Net income attributable to non-controlling interests:
We are party to sale and leaseback arrangements for seven vessels with the lessor VIEs. While we do not hold any equity investments in these lessor VIEs, we are the primary beneficiary. Accordingly, these lessor VIEs are consolidated into our financial results and thus the equity attributable to the financial institutions in their respective variable interest entities are included in non-controlling interests in our consolidated results.
B. Liquidity and Capital Resources
Liquidity and Cash Requirements
We operate in a capital intensive industry and we have historically financed the purchase of our vessels, conversion projects and other capital expenditures through a combination of borrowings from debt transactions, leasing arrangements with financial institutions, cash generated from operations, sales of vessels to Golar Partners and equity capital. Our liquidity requirements relate to servicing our debt, funding our conversion projects, funding investment in the development of our project portfolio, including our affiliates, funding working capital, payment of dividends and maintaining cash reserves to satisfy certain of our borrowing covenants (including cash collateral requirements in respect of certain of our derivatives and as security for the provision of letters of credit) and to offset fluctuations in operating cash flows.
Our funding and treasury activities are conducted within corporate policies to maximize investment returns while maintaining appropriate liquidity for our requirements. Cash and cash equivalents are held primarily in U.S. dollars with some balances held in British Pounds, Singapore Dollars, Norwegian Kroners, Euros and Central African CFA Franc. We have not made use of derivative instruments other than for interest rate and currency risk management purposes, except in the case of our equity swaps and our oil derivative instrument.
Our short-term liquidity requirements are primarily for the servicing of debt, working capital requirements, potential investments in our joint ventures and affiliates, and conversion project related commitments due within the next 12 months. Over the last 12 months the outlook in the LNG shipping market has improved. Whilst certain challenges remain, the Company's forward view of the market remains positive despite current volatility. Vessel deliveries are expected to slow, from record levels in 2018, heading into 2019. At the same time, new liquefaction capacity ramps up at close to its fastest pace in history with approximately 35mtpa of new LNG scheduled to come on line in 2019 versus 30mtpa in 2018. The market may be prone to further periods of volatility and the impact on the Company's results is unknown. Accordingly, we may require additional working capital for the continued operation of our vessels in the spot market (via the Cool Pool). The need for additional working capital is dependent upon the employment of the vessels participating in the Cool Pool and fuel costs incurred during idle time. We remain responsible for manning and technical management of our vessels in the Cool Pool. We estimate that total forecast vessel operating expenses relating to our vessels in the Cool Pool for the next 12 months is $47.9 million, based on our historical average operating costs. Additionally, we require a small amount of working capital for our vessel currently in lay-up.
As of
March 15, 2019
, we have a fleet of 14 vessels, of which three vessels are on short-term charters or operating on the spot market, eight vessels are operating on the spot market (via the Cool Pool) and one vessel is in lay-up, one vessel entered Keppel’s shipyard in early 2019 to commence her conversion into a FLNG, and one FLNG vessel, the
Hilli
, is operating on a long-term tolling agreement.
As of
December 31, 2018
, we had cash and cash equivalents (including short-term deposits) of $
704.3 million
, of which $
486.4 million
is restricted cash. Included within restricted cash is
$174.6 million
in respect of the issuance of the letter of credit by a financial institution to our project partner involved in the
Hilli
FLNG project,
$82.9 million
cash collateral on our Total Return Swap, and the balance mainly relating to the cash belonging to Lessor VIEs that we are required to consolidate under U.S. GAAP. Refer to note 14 "Restricted Cash and Short-term Deposits" of our consolidated financial statements included herein for additional details.
62
Since
December 31, 2018
, significant transactions impacting our cash flows include:
Receipts:
|
•
|
receipt of $
9.2 million
in February 2019, in respect of cash distributions for the quarter ended
December 31, 2018
, from Golar Partners in relation to our interests in its common and general partner units held at the relevant record date, albeit $1.7 million was used to satisfy interest payments on the Margin Loan Facility as a result of 21,226,586 of Golar Partners common units held by us being pledged as security for the obligations under the facility.
|
Payments:
|
•
|
payments of $15.1 million, in cash distributions to our shareholders in January 2019 in respect of the quarter ended September 30, 2018;
|
|
•
|
payment of $5.0 million in March 2019 to the non-controlling shareholders in Hilli LLC in relation to the Hilli Disposal, representing a working capital adjustment to the net purchase price received from Golar Partners;
|
|
•
|
payment of $13.0 million to an entity of CCBFL, in January 2019, for the extension of the put-option under the finance lease for the
Golar Seal
; and
|
|
•
|
payment of $19.3 million of scheduled loan and interest repayments.
|
Golar Viking
is currently serving a short-term contract, due to expire in December 2019. Golar has also entered into binding agreements with a Croatian project developer, LNG Hrvatska d.o.o., to convert the 2005 built
Golar Viking
into a FSRU, sell the converted vessel, and then operate and maintain the FSRU for a minimum of 10 years. Conversion capital expenditure will be funded by stage payments under the agreement. Commencement of this project is subject to certain conditions precedent, including confirmation of project funding and receipt of a Notice to Proceed from LNG Hrvatska d.o.o.
A pre-condition of the
Golar Tundra
lease financing with CMBL (refer to note 5 "Variable Interest Entities" of our consolidated financial statements included herein) is for the FSRU to be employed under an effective charter. Under the terms of our sale and lease back facility for the
Golar Tundra
, by virtue of our prior termination of the WAGL charter, we are required to find a replacement charter by June 30, 2019
or we could be required to refinance the FSRU. Accordingly, to address our anticipated working capital requirements over the next 12 months, in the event we are unable to secure a charter for the
Golar Tundra
, we are currently exploring our refinancing options, including extension of the lenders’ deadlines for satisfaction of such. While we believe we will be able to obtain the necessary funds from these refinancings, we cannot be certain that the proposed new credit facilities will be executed in time or at all. However, we have a track record of successfully financing and refinancing our vessels, even in the absence of term charter coverage. In addition to vessel refinancings, if market and economic conditions are favorable, we may also consider further issuances of corporate debt or equity to increase liquidity.
We have performed stress testing of our forecast cash reserves under various theoretical scenarios, which include assumptions such as extremely prudent revenue contributions from our fleet, full operating costs and maintaining our dividend payments based on our most recent pay out, and accordingly are confident of our ability to manage through the near term cash requirements.
Medium to Long-term Liquidity and Cash Requirements
Our medium and long-term liquidity requirements are primarily for funding the investments for our conversion projects including investments into our joint venture, and repayment of long-term debt balances. Sources of funding for our medium and long-term liquidity requirements include new loans, refinancing of existing financing arrangements, public and private debt or equity offerings, potential sales of our interests in our vessel owning subsidiaries operating under long-term charters (including additional sales of interests in Hilli LLC), and potential use of our investment in the common units of Golar Partners subject to adherence to certain debt covenant requirements as to the maintenance of minimum holdings.
On February 26, Golar entered into an agreement with BP for the charter of a FLNG unit,
Gimi
, for a 20-year period expected to commence in the second half of 2022. LNG carrier
Gimi
has been relocated from layup to Keppel Shipyard where a site team has been assembled. Golar also entered into a Shareholders Agreement with Keppel Capital in respect of their participation in a 30% share of the project. Total conversion works, which incorporate lessons learned from FLNG
Hilli Episeyo
including some improvements and modifications, are expected to cost approximately $1.3 billion. We anticipate annual contracted revenues less forecasted operating costs of approximately $215 million per year. Golar is in the final stages of receiving an underwritten credit
63
commitment for a $700 million long-term financing facility with a syndicate of international banks that will also be available during construction.
Cash Flows
The following table summarizes our cash flows from operating, investing and financing activities for the periods indicated.
|
|
Year ended December 31,
|
|||||||
|
|
2018
|
2017
|
2016
|
|||||
|
(in millions of $)
|
|
|||||||
|
Net cash provided by (used in) operating activities
|
116.7
|
|
(35.1
|
)
|
(115.4
|
)
|
||
|
Net cash (used in) provided by investing activities
|
(202.5
|
)
|
(419.9
|
)
|
3.9
|
|
||
|
Net cash provided by financing activities
|
177.4
|
|
427.4
|
|
234.3
|
|
||
|
Net increase (decrease) in cash, cash equivalents and restricted cash
|
91.6
|
|
(27.5
|
)
|
122.8
|
|
||
|
Cash, cash equivalents and restricted cash at beginning of year
|
612.7
|
|
640.2
|
|
517.4
|
|
||
|
Cash, cash equivalents and restricted cash at end of year
|
704.3
|
|
612.7
|
|
640.2
|
|
||
Net cash provided by (used in) operating activities
Cash provided by operating activities increased by $151.8 million to
$116.7 million
in
2018
compared to cash utilized of
$35.1 million
in
2017
. The increase in cash generated in
2018
was primarily due to:
|
•
|
higher contributions recognized from our participation in the Cool Pool as a result of improved utilization and daily hire rates from the Cool Pool vessels;
|
|
•
|
lower charterhire payments as a result of the expiry of the charter-back arrangement of the
Golar Grand
from Golar Partners in November 2017;
|
|
•
|
$50.7 million
in cash receipts in connection with arbitration proceedings with a former charterer of the
Golar Tundra
; and
|
|
•
|
the improvement on the general timing of working capital in 2018 compared to the same period in 2017.
|
Cash utilized by operating activities decreased by $80.3 million to
$35.1 million
in 2017 compared to
$115.4 million
in 2016. The decrease in cash utilized in 2017 was primarily due to:
|
•
|
the continued tightening of the LNG shipping market, which resulted in an overall increase in charter rates and higher utilization levels of our vessels trading in the Cool Pool;
|
|
•
|
lower charterhire payments relating to the charter-back of the
Golar Grand
from Golar Partners as a result of her drydocking in 2017 in addition to the charter-back arrangement ending on November 1, 2017; and
|
|
•
|
the improvement on the general timing of working capital in 2017 compared to the same period in 2016.
|
Net cash (used in) provided by investing activities
Net cash used in investing activities of
$202.5 million
in
2018
comprised mainly of:
|
•
|
the addition of
$116.7 million
to asset under development relating to payments made in respect of the conversion of the
Hilli
into a FLNG;
|
|
•
|
additions of
$95.5 million
to investments in affiliates, which relates principally to capital contributions made to Golar Power of $55.0 million and our investment in Avenir of $24.8 million; and
|
|
•
|
additions to vessels and equipment of
$33.1 million
.
|
64
This was partially offset by:
|
•
|
receipt of
$9.7 million
from Golar Partners in relation to the Hilli Disposal; and
|
|
•
|
dividends received from Golar Partners. Following the adoption of amendments in ASC 230, we have adopted the cumulative earnings approach in relation to the classification of dividends received from our equity method investees in our statements of cash flows. Accordingly, although $49.0 million in dividends was received from Golar Partners in 2018, of this,
$33.2 million
has been classified in investing activities with the balance in operating activities.
|
Net cash used in investing activities of
$419.9 million
in
2017
comprised mainly of:
|
•
|
the addition of
$390.6 million
to asset under development relating to payments made in respect of the conversion of the
Hilli
into a FLNG; and
|
|
•
|
additional capital contributions of $111.0 million in respect of our investment in Golar Power.
|
This was partially offset by:
|
•
|
a deposit received of
$70.0 million
from Golar Partners in respect of the Hilli Sale Agreement in August 2017; and
|
|
•
|
dividends received from Golar Partners. Following the adoption of amendments in ASC 230, we have adopted the cumulative earnings approach in relation to the classification of dividends received from our equity method investees in our statements of cash flows. Accordingly, although $52.7 million in dividends was received from Golar Partners in 2017, which is comparable to that which was received in the same period in 2016, of this,
$25.1 million
has been classified in investing activities with the balance in operating activities.
|
Net cash provided by financing activities
Net cash provided by financing activities is principally generated from funds from new debt, debt refinancings, debt repayments and cash dividends. Net cash provided by financing activities of
$177.4 million
in
2018
arose primarily due to proceeds of
$1.2 billion
from our debt facilities, including:
|
•
|
$115.0 million further drawdown on the pre-delivery financing in relation to the conversion of the
Hilli
into a FLNG;
|
|
•
|
$960.0 million drawdown on the post-acceptance
Hilli
sale and leaseback financing in relation to the Hilli Facility; and
|
|
•
|
$101.0 million of debt proceeds drawn down by the lessor VIE, which owns the
Golar Crystal
, upon refinancing of its debt into a long-term loan facility. See note 8 "Variable Interest Entities" of our consolidated financial statements included herein.
|
This was partially offset by:
|
•
|
loan repayments of
$994.9 million
, which includes (i) the repayment of $640.0 million on the pre-delivery financing in relation to the conversion of the
Hilli
into a FLNG, (ii) payment of $105.0 million in connection with the refinancing of the
Golar Crystal
facility mentioned above, (iii) payments of $76.9 million in connection with the
Golar Tundra
financing arrangement and (iv) scheduled repayments on our remaining debt facilities; and
|
|
•
|
payment of dividends of
$42.9 million
.
|
Net cash provided by financing activities of $
427.4 million
in
2017
arose primarily due to proceeds from our debt facilities, including:
|
•
|
$275.0 million drawn down on the FLNG Hilli facility in relation to the conversion of the
Hilli
to a FLNG;
|
|
•
|
$112.0 million of debt proceeds in connection with our refinancing of the
Golar Crystal
debt facility (see note 5 "Variable Interest Entities" of our consolidated financial statements included herein);
|
|
•
|
$150.0 million of debt proceeds from the Margin Loan Facility entered into in March 2017; and
|
|
•
|
$391.4 million of debt proceeds from the new convertible bond which closed in February 2017.
|
This was partially offset by:
|
•
|
loan repayments of
$446.6 million
, which includes the settlement of the balance outstanding on the refinanced
Golar Crystal
facility of $101.3 million in March 2017 as well as the buyback of the old convertible bond, which matured in March 2017, amounting to $219.7 million;
|
|
•
|
payment of
$31.2 million
for capped call transactions entered into in conjunction with the issuance of the new convertible bond mentioned above; and
|
65
|
•
|
payment of dividends of
$20.4 million
.
|
Borrowing Activities
As of
December 31, 2018
, we had total outstanding borrowings, gross of capitalized borrowing costs, of
$2.6 billion
, secured by, among other things, our vessels, our ownership in Golar Partners, and unsecured convertible bonds outstanding of
$353.7 million
. Please refer to note 20 "Debt" of our consolidated financial statements included herein for further detailed information on our borrowings as of
December 31, 2018
.
Derivatives
We use financial instruments to reduce the risk associated with fluctuations in interest rates and foreign currency exchange rates. We have a portfolio of interest rate swaps that exchange or swap floating rate interest to fixed rates, which from a financial perspective, hedges our obligations to make payments based on floating interest rates. We have also entered into equity derivative swaps, Total Return Swap Agreements, or TRS, in line with our share repurchase program.
Interest rate swap agreement
As of
December 31, 2018
, we have interest rate swaps with a notional amount of $950 million representing approximately 37.0% of our total debt. Our swap agreements have expiration dates between 2019 and 2021 and have fixed rates of between 1.23% and 1.94%. The total unrealized gain recognized in the consolidated statement of operations relating to our interest rate swap agreements in
2018
was
$0.6 million
.
Total Return Swap agreement
In December 2014 we entered into a TRS related to 3.0 million of our common shares, which is indexed to our own common shares. In addition, we entered into a forward contract for the acquisition of 107,000 shares in Golar Partners. The total unrealized loss recognized in the consolidated statement of operations relating to our TRS agreement in
2018
was
$30.7 million
.
The settlement amount for the TRS transaction will be (A) the market value of the shares at the date of settlement plus all dividends paid by the Company between entering into and settling the contract, less (B) the reference price of the shares agreed at the inception of the contract plus the counterparty's financing costs. Settlement will be either a payment by the counterparty to us, if (A) is greater than (B), or a payment by us to the counterparty, if (B) is greater than (A). There is no obligation for us to purchase any shares under the agreement and this arrangement has been recorded as a derivative transaction, with the fair value of the TRS recognized as an asset or liability as appropriate, and changes in fair values recognized in the consolidated statement of operations.
In addition to the above TRS transaction, we may from time to time enter into short-term TRS arrangements relating to securities in other companies. The above TRS transactions were our only TRS agreements as of
December 31, 2018
.
Hilli LTA
Following the LTA becoming effective in December 2017, and on commencement of the commissioning activities, we recognized a derivative asset ("day one gain") of $79.6 million, representing the fair value of the estimated discounted cash flows of payments due to us as a result of the Brent Crude price moving above the contractual floor of $60.00 per barrel over the contract term. The derivative asset is subsequently remeasured to fair value at each balance sheet date. The fair value as of
December 31, 2018
was $84.7 million (2017: $94.7 million) and, as a result, the total unrealized loss recognized in the consolidated statement of operations relating to this this derivative was $10.0 million.
Foreign currencies
The majority of our gross earnings are receivable in U.S. dollars. The majority of our transactions, assets and liabilities are denominated in U.S. dollars, our functional currency. However, we also incur a small portion of expenditure in other currencies. We are affected by foreign currency fluctuations primarily through expenditure in respect of our vessels' drydocking, some operating expenses including the effect of paying the majority of our seafaring officers in Euros and the administrative costs of our UK office. The currencies which impact us the most include, but are not limited to, Euros, Norwegian Kroner, Singaporean Dollars, Central African CFA Franc and, to a lesser extent, British Pounds.
66
Capital Commitments
FLNG conversion
Our FLNG conversion commitments are described in Item 18 - Financial Statements: note 29, "Capital Commitments".
Critical Accounting Policies and Estimates
The preparation of our financial statements in accordance with U.S. GAAP requires that management make estimates and assumptions affecting the reported amounts of assets and liabilities and disclosure of contingent assets and liabilities at the date of the financial statements and the reported amounts of revenues and expenses during the reporting period. The following is a discussion of the accounting policies applied by us that are considered to involve a higher degree of judgment in their application. See note 2 "Accounting Policies" of our consolidated financial statements included herein.
Revenue and related expense recognition
Revenues include minimum lease payments under time charters, fees for repositioning vessels and gross pool revenues. Revenues generated from time charters, which we classify as operating leases, are recorded over the term of the charter as service is provided. However, we do not recognize revenue if a charter has not been contractually committed to by a customer and ourselves, even if the vessel has discharged its cargo and is sailing to the anticipated load port on its next voyage.
Repositioning fees (which are included in time charter revenue) received in respect of time charters are recognized at the end of the charter when the fee becomes fixed and determinable. However, where there is a fixed amount specified in the charter, which is not dependent upon redelivery location, the fee will be recognized evenly over the term of the charter. Where a vessel undertakes multiple single voyage time charters, revenue is recognized, including the repositioning fee if fixed and determinable, on a discharge-to-discharge basis. Under this basis, revenue is recognized evenly over the period from departure of the vessel from its last discharge port to departure from the next discharge port. For arrangements where operating costs are borne by the charterer on a pass through basis, the pass through of operating costs is reflected in revenue and expenses.
Liquefaction services revenue is generated from a LTA entered into with our customer. Our provision of liquefaction services capacity includes the receipt of the customer’s gas, treatment and temporary storage on board our FLNG, and delivery of LNG to waiting carriers. The liquefaction services capacity provided to our customer is considered a single performance obligation recognized evenly over time as our services are rendered. We consider our services a series of distinct services that are substantially the same and have the same pattern of transfer to our customer. We recognize revenue when obligations under the terms of our contract are satisfied. We have applied the practical expedient to recognize liquefaction services revenue in proportion to the amount we have the right to invoice.
Revenues generated from management fees are recorded rateably over the term of the contract as services are provided.
Vessels and impairment
Description:
We review vessels and equipment for impairment whenever events or circumstances indicate the carrying value of the vessel may not be fully recoverable. When such events or circumstances are present, we assess recoverability by comparing the vessel's projected undiscounted net cash flows to its carrying value. If the total projected undiscounted net cash flows is lower than the vessel’s carrying value, we recognize an impairment loss measured as the excess of the carrying amount over the fair value of the vessel. As of
December 31, 2018
, for nine of our vessels (refer to note 9 "Impairment of Non-current Assets" of our consolidated financial statements included herein), the carrying value was higher than their estimated market values (based on third party ship broker valuations). As a result, we concluded that an impairment trigger existed and so performed a recoverability assessment for each of these vessels. However, no impairment loss was recognized as, for each of these vessels, the projected undiscounted net cash flows was significantly higher than its carrying value.
Judgments and estimates
: The cash flows on which our assessment of recoverability is based is highly dependent upon our forecasts, which are highly subjective and, although we believe the underlying assumptions supporting this assessment are reasonable and appropriate at the time they were made, it is therefore reasonably possible that a further decline in the economic environment could adversely impact our business prospects in the next year. This could represent a triggering event for a further impairment assessment.
67
Accordingly, the principal assumptions we have used in our recoverability assessment (i.e. projected undiscounted net cash flows basis) included, among others, charter rates, ship operating expenses, utilization, drydocking requirements and residual value. These assumptions are based on historical trends but adjusted for future expectations. Specifically, forecasted charter rates are based on information regarding current spot market charter rate (based on a third party valuation), option renewal rate with the existing counterparty or existing long-term charter rate, in addition to industry analyst and broker reports. Estimated outflows for operating expenses and drydockings are based on historical costs adjusted for assumed inflation.
Effect if actual results differ from assumptions
: Although we believe the underlying assumptions supporting the impairment assessment are reasonable, if charter rate trends and the length of the current market downturn vary significantly from our forecasts, management may be required to perform step two of the impairment analysis that could expose us to material impairment charges in the future. Our estimates of vessel market values may not be indicative of the current or future market value of our vessels or prices that we could achieve if we were to sell them and a material loss might be recognized upon the sale of our vessels.
Vessel market values
Description
: Under "Vessels and impairment", we discuss our policy for assessing impairment of the carrying values of our vessels. During the past few years, the market values of certain vessels in the worldwide fleet have experienced particular volatility, with substantial declines in many vessel classes. There is a future risk that the market value of certain of our vessels could decline below those vessels' carrying value, even though we would not recognize an impairment for those vessels due to our belief that projected undiscounted net cash flows expected to be earned by such vessels over their operating lives would exceed such vessels' carrying amounts.
Judgments and estimates
: Our estimates of market value assume that our vessels are all in good and seaworthy condition without need for repair and, if inspected, would be certified in class without notations of any kind. Our estimates for our LNG carriers and FSRUs are based on approximate vessel market values that have been received from third party ship brokers, which are commonly used and accepted by our lenders for determining compliance with the relevant covenants in our credit facilities. Vessel values can be highly volatile, such that our estimates may not be indicative of the current or future market value of our vessels or prices that we could achieve if we were to sell. In addition, the determination of estimated market values may involve considerable judgment given the illiquidity of the second hand market for these types of vessels.
Furthermore, in relation to the vessels, the
Gimi
and the
Gandria
, whilst they have been earmarked for conversion into FLNG vessels, for consistency with the methodology applied in our impairment review, estimated vessel market values for these vessels is on the basis they operate as LNG carriers/FSRUs.
Effect if actual results differ from assumptions
: As of
December 31, 2018
, while we intend to hold and operate our vessels, were we to hold them for sale, we have determined the fair market value of our vessels, with the exception of the seven vessels, were greater than their carrying value. With respect to these seven vessels, the carrying value of these vessels exceeded their aggregate market value. However, as discussed above, for each of these vessels, the carrying value was less than its projected undiscounted net cash flows, consequently, no impairment loss was recognized.
Consolidation of lessor VIE entities
Description
: As of
December 31, 2018
, we leased eight vessels under finance leases from wholly-owned special purpose vehicles (“lessor SPVs”) of financial institutions in connection with our sale and leaseback transactions. While we do not hold any equity investments in these lessor SPVs, we have determined that we are the primary beneficiary of these entities and accordingly, we are required to consolidate these variable interest entities (“VIEs”) into our financial results. The key line items impacted by our consolidation of these VIEs are short-term and long-term debt, restricted cash and short-term deposits and interest expense.
Judgments and estimates
: In consolidating these lessor VIEs, on a quarterly basis, we must make assumptions regarding the debt amortization profile and the interest rate to be applied against the VIEs’ debt principal. Our estimates are therefore dependent upon the timeliness of receipt and accuracy of financial information provided by these lessor VIE entities. Upon receipt of the audited annual financial statements of the lessor VIEs, we will make a true-up adjustment for any material differences.
Effect if actual results differ from assumptions
: If audited financial statements of the lessor VIE are not available upon filing of the annual financial statements, there might be differences between the numbers included in our consolidated financial statements and that reported by the VIE, which could be material.
68
Impairment of our equity investment in the Partnership
Description:
The Company’s investment in the Partnership consists of Common Units, GP Units and IDRs. We account for our investment in the Partnership as an equity method investment meaning that the asset is recorded at historical cost adjusted for our proportionate share of the Partnership's earnings and reduced by distributions received from the Partnership. The day one cost of the investment was the fair value of the units on the date of deconsolidation. We are required to review our investment for impairment whenever events or changes indicate that the carrying amount of the investment might not be recoverable. The supressed Common Unit share price throughout 2018 coupled with the Partnership’s distribution cut announced in November, led management to conclude that the decline in the value of the Partnership was “other than temporary”.
Judgments and estimates
: In calculating the fair value of the Partnership, the Company applied a Monte Carlo Simulation model to estimate the total equity value of the Partnership that then in turn determines the total distribution payment to all unit holders including Common, GP and IDR. The key inputs into the model are the valuation date share price (31 December 2018: $10.80), the long term volatility curve and the long-term dividend yield of the Partnership. The long term volatility curve takes into accounts movements in the Partnership’s share price since IPO and the long-term dividend yield was benchmarked against the Partnership’s historical dividend yield.
Effect if actual results differ from assumptions
: Although we believe that the underlying assumptions supporting the impairment are reasonable, if a different long-term dividend yield (+/- 2%) was used then this could have led to a different value of the IDR and GP units, however, the difference is not considered material in the context of the overall valuation.
Recently Issued Accounting Standards
See Item 18. Financial Statements: note 3 "Recently Issued Accounting Standards".
C. Research and Development, Patents and Licenses
Not applicable.
D. Trend Information
Please see the section of this item entitled "- Market Overview and Trends" and "Item 4. Information on the Company - B. Business Overview - The Natural Gas Industry."
E.
Off-Balance Sheet Arrangements
We are committed to make rental payments under operating leases for office premises. The future minimum rental payments under our non-cancellable operating leases for office premises are disclosed below in the tabular disclosure of contractual obligations.
F. Contractual Obligations
The following table sets forth our contractual obligations for the periods indicated as at
December 31, 2018
:
|
(in millions of $)
|
Total
Obligation
|
|
Due in 2019
|
|
Due in 2020 – 2021
|
|
Due in 2022 – 2023
|
|
Due Thereafter
|
|
||||
|
Long-term and short-term debt (1)
|
2,582.2
|
|
732.2
|
|
349.6
|
|
561.6
|
|
938.8
|
|
||||
|
Interest commitments on long-term debt and other interest rate swaps (2)
|
451.7
|
|
84.9
|
|
142.5
|
|
103.6
|
|
120.7
|
|
||||
|
Operating lease obligations (3)
|
20.4
|
|
5.4
|
|
6.4
|
|
4.5
|
|
4.1
|
|
||||
|
Purchase obligations:
|
|
|
|
|
|
|
|
|
|
|
||||
|
Egyptian Venture (4)
|
—
|
|
—
|
|
—
|
|
—
|
|
—
|
|
||||
|
FLNG conversion (5)
|
21.5
|
|
21.5
|
|
—
|
|
—
|
|
—
|
|
||||
|
Other non-current liabilities (6)
|
—
|
|
—
|
|
—
|
|
—
|
|
—
|
|
||||
|
Total
|
3,075.8
|
|
844.0
|
|
498.5
|
|
669.7
|
|
1,063.6
|
|
||||
69
|
(1)
|
The obligations under long-term and short-term debt above are presented gross of deferred finance charges and exclude interest. Included in these amounts are balances relating to certain lessor entities (for which legal ownership resides with financial institutions) that we are required to consolidate under U.S. GAAP into our financial statements as variable interest entities (see note 5 "Variable Interest Entities ("VIE")" and note 20 "Debt" of our consolidated financial statements included herein).
|
|
(2)
|
Our interest commitment on our long-term debt is calculated based on assumed LIBOR rates of between 2.41% to 2.95% and take into account our various margin rates and interest rate swaps associated with each financing arrangement.
|
|
(3)
|
We are committed to making rental payments under operating leases for leased offices, equipment and other assets.
|
|
(4)
|
As at December 31, 2018, we had a commitment to pay $1.0 million to an unrelated third party, contingent upon the conclusion of a material commercial business transaction by the Egyptian Natural Gas Holding Company, or ECGS, as consideration for work performed in connection with the setting up and incorporation of ECGS. This liability has been excluded from the above table, as the timing of any cash payment is uncertain.
|
|
(5)
|
We have a contract with Keppel and Black & Veatch for the conversion of our LNG carrier, the
Gimi
into a FLNG. The
Gimi
has recently entered the Keppel shipyard to commence its conversion to a FLNG. The conversion agreement for the
Gimi
is subject to certain payments and lodging of a full Notice to Proceed.
|
Subsequently, in February 2019, we entered into a 20 year Lease and Operate Agreement with BP for the charter of a FLNG unit,
Gimi
, to service the Greater Tortue Ahmeyim project. Subject to certain conditions precedent, the estimated conversion cost of the
Gimi
is approximately $1.3 billion.
|
(6)
|
Our consolidated balance sheet as of December 31, 2018, includes
$145.6 million
classified as "Other non-current liabilities" of which
$63.8 million
represents the FLNG deferred revenue, being the corresponding liability upon initial recognition of the LTA derivative asset,
$33.0 million
represents liabilities under our pension plans,
$14.8 million
represents other guarantees provided to Golar Partners and Golar Power and
$27.1 million
represents estimated costs to decommission the mooring to which the
Hilli
will be attached for the duration of the LTA. These liabilities have been excluded from the above table as the timing and/or the amount of any cash payment is uncertain or in the case of the derivative, this represents deferred revenue. See note 23 ''Other Non-current Liabilities'' of our consolidated financial statements included herein for additional information regarding our other non-current liabilities.
|
|
(7)
|
We have excluded any capital commitments in relation to the conversion of the
Golar
Viking
into a FSRU as commencement of this project is subject to certain conditions precedent.
|
For details of the Company's outstanding legal proceedings and claims, please see note 30 "Other Commitments and Contingencies" of our consolidated financial statements included herein.
G. Safe Harbor
Forward-looking information discussed in this Item 5 includes assumptions, expectations, projections, intentions and beliefs about future events. These statements are intended as "forward-looking statements." We caution that assumptions, expectations, projections, intentions and beliefs about future events may and often do vary from actual results and the differences can be material. Please see "Cautionary Statement Regarding Forward-Looking Statements" in this report.
A. Directors and Senior Management
70
Directors
The following provides information about each of our directors as of
March 15, 2019
.
|
Name
|
Age
|
Position
|
||
|
Tor Olav Trøim
|
56
|
Chairman of our Board of Directors and Director
|
||
|
Daniel Rabun
|
64
|
Director, Audit Committee member and Nomination Committee member
|
||
|
Thorleif Egeli
|
55
|
Director
|
||
|
Carl Steen
|
68
|
Director, Audit Committee member, Compensation Committee member and Nomination Committee member
|
||
|
Niels Stolt-Nielsen
|
54
|
Director and Compensation Committee member
|
||
|
Lori Wheeler Naess
|
48
|
Director and Audit Committee Chairperson
|
||
|
Michael Ashford
|
72
|
Director and Company Secretary
|
||
Tor Olav Trøim
has served as a director of the Company since September 2011 and appointed as the Chairman of the Board in September 2017. Mr. Trøim previously served as a director and vice-president of the Company from its incorporation in May 2001 until October 2009, after which time he served as a director and Chairman of the Company's listed subsidiary, Golar LNG Energy Limited. Mr. Trøim graduated with a M.Sc Naval Architect from the University of Trondheim, Norway in 1985. He was formerly an Equity Portfolio Manager with Storebrand ASA (1987-1990), and Chief Executive Officer for the Norwegian Oil Company DNO AS (1992-1995). Mr. Trøim was a director of Seatankers Management in Cyprus from 1995 until September 2014. Mr. Trøim also served as a director and Chairman of ITCL, a director of Seadrill Limited, Golden Ocean Group Limited, Golden State Petro (IOM I-A) Plc, Archer Limited, Golar LNG Partners LP, Seadrill Partners LLC and as an alternate director of Frontline Ltd until September 2014. He currently holds controlling interests in Magni Partners Bermuda and Magni Partners UK. He also serves as a director in Stolt-Nielsen Limited, Borr Drilling and Valerenga Football Club.
Daniel Rabun
has served as a director since February 2015 and was appointed Chairman in September 2015. Mr. Rabun resigned as Chairman in September 2017 and was appointed a non-executive director on that date. He also serves on our Audit Committee and Nomination Committee. He joined Ensco in March 2006 as President and as a member of the Board of Directors. Mr. Rabun was appointed to serve as Ensco's Chief Executive Officer from January 1, 2007 and elected Chairman of the Board of Directors in 2007. Mr. Rabun retired from Ensco in May 2014. Prior to joining Ensco, Mr. Rabun was a partner at the international law firm of Baker & McKenzie LLP where he had practiced law since 1986. In May 2015, Mr. Rabun became a non-executive director and a member of the Management Development and Compensation Committee and the Governance and Nominations Committee of Apache Corporation. In May 2018, Mr. Rabun became Chairman of the Board and a member of the Governance and Nomination Committee of Apergy Corporation. He has been a Certified Public Accountant since 1976 and a member of the Texas Bar since 1983. Mr. Rabun holds a Bachelor of Business Administration Degree in Accounting from the University of Houston and a Juris Doctorate Degree from Southern Methodist University.
Thorleif Egeli
was appointed as director in September 2018. Mr. Egeli is a member of the Board of Directors in Stimline AS and Hicor and also serves as President on the board of directors at Norwegian American Chamber of Commerce, South West Chapter in Houston, Texas. Mr. Egeli served as Vice President of Schlumberger Production Management - North America, where he managed the non-operating E&P assets for Schlumberger in the US, Canada and Argentina. Prior to this he held a number of senior positions within Schlumberger having begun his career as a Field Engineer in 1990. Between October 2009 and April 2013 Mr. Egeli held a number of positions within Archer including President Latin America, Corporate Marketing and Chief Operating Officer before re-joining Schlumberger in 2013. Mr. Egeli holds a Master of Science (M.Sc) in Mechanical Engineering and an MBA from Rotterdam School of Management, Holland.
Carl Steen
has served as a director since January 2015 and currently serves on our Audit Committee, Compensation Committee and Nomination Committee. He has also served on Golar Partners' board of directors since his appointment in August 2012. Mr. Steen graduated in 1975 from ETH Zurich Switzerland with a M.Sc in Industrial and Management Engineering. After working for a number of high profile companies, Mr. Steen joined Nordea Bank from January 2001 to February 2011 as head of the bank’s Shipping, Oil Services & International Division. Mr. Steen holds directorship positions in various Norwegian and international companies including Euronav NV, Wilh Wilhelmsen Holding ASA and Belships ASA.
Niels Stolt-Nielsen
has served as a director since September 2015 and also serves on our Compensation Committee. Mr. Stolt-Nielsen is a shareholder in Stolt-Nielsen Limited, and has served as a director of Stolt-Nielsen Limited since 1996 and as Chief Executive Officer since 2000. He served as Interim Chief Executive Officer of Stolt Offshore S.A. from September 2002
71
until March 2003. He was the President of Stolt Sea Farm from 1996 until 2001. He has served as Chairman of Avance Gas Holding Ltd. since 2010. Mr. Stolt-Nielsen graduated from Hofstra University in 1990 with a BS degree in Business and Finance. Mr. Stolt-Nielsen brings with him extensive shipping, customer relations and logistical experience.
Lori Wheeler Naess
was appointed as a director and Audit Committee Chairperson in February 2016. Ms. Naess also serves on the Board and Audit Committee of Opera Limited, a U.S.-listed company and Klaveness Combination Carriers ASA, a privately-held shipping company in Norway. Ms. Naess was most recently a director with PricewaterhouseCoopers in Oslo and was a Project Leader for the Capital Markets Group. Between 2010 and 2012 she was a Senior Advisor for the Financial Supervisory Authority in Norway and prior to this she was also with PricewaterhouseCoopers in roles in the U.S., Norway and Germany. Ms. Naess is a U.S. Certified Public Accountant.
Michael Ashford
served as Company Secretary from October, 2016 before being appointed to the Board in September, 2017. Mr. Ashford is a Chartered Secretary and is a current member and Past President of the International Council of the Institute of Chartered Secretaries and Administrators. Mr. Ashford has previously held various directorship and company secretary positions in shipping and aviation companies.
Executive Officers
The following provides information about each of our executive officers as of
March 15, 2019
.
On March 19, 2018, Graham Robjohns replaced Brian Tienzo as our Chief Financial Officer. In addition, Mr. Robjohns assumed the role of Deputy Chief Executive Officer of Golar. Previously, Mr. Robjohns served as Golar Partners' Principal Executive Officer since July 2011. Mr. Tienzo will serve as the Principal Executive Officer of Golar Partners and will continue to serve as the Principal Financial Officer and Principal Accounting Officer of Golar Partners.
|
Name
|
Age
|
Position
|
||
|
Iain Ross
|
57
|
Chief Executive Officer – Golar Management
|
||
|
Graham Robjohns
|
54
|
Chief Financial Officer and Deputy Chief Executive Officer – Golar Management
|
||
|
Øistein Dahl
|
58
|
Chief Operating Officer – Golar Management Norway
|
||
|
Morten Daviknes
|
53
|
Chief Technical Officer – Golar Management Norway
|
||
Iain Ross
has served as Chief Executive Officer since September 21, 2017. Between 2002 and joining Golar, Mr. Ross held various executive level positions with project delivery firm WorleyParsons Limited. Positions included Group Managing Director, Development, an ExCo position with responsibility for leadership of the Global Hydrocarbons, Power, Infrastructure and Mining Sectors, the development of the group Strategy, Mergers & Acquisitions (including integration of acquired companies) and, finally, as leader of their Digital Technology start-up. Mr. Ross has a bachelor's degree in Mechanical Engineering from Heriot-Watt University, is a Fellow of Engineers Australia and certified International Director from INSEAD.
Graham Robjohns
was appointed as our Deputy Chief Executive Officer and Chief Financial Officer in March 2018. Between July 2011 and March 2018, Mr. Robjohns acted as Golar Partners' Principal Executive Officer and, from April 2011 to July 2011, as their Chief Executive Officer and Chief Financial Officer. Mr. Robjohns also served as Chief Executive Officer for Seadrill Partners LLC from June 2012 to August 2015.
He has served as a director of Seadrill Partners LLC since 2012. Mr. Robjohns served as the Chief Financial Officer of Golar from November 2005 until June 2011. Mr. Robjohns also served as Chief Executive Officer of Golar from November 2009 until July 2011. Mr. Robjohns served as Group Financial Controller of Golar Management from May 2001 to November 2005 and as Chief Accounting Officer of Golar Management from June 2003 until November 2005. Mr. Robjohns is a member of the Institute of Chartered Accountants in England and Wales and has a BSc degree in Economics with Politics from Loughborough University.
Øistein Dahl
has served as Managing Director of Golar Management Norway (previously Golar Wilhelmsen) since September 2011 and as Chief Operating Officer of Golar Management since April 2012. Prior to September 2011, he worked for the Leif Höegh & Company Group (roll-on roll-off, tank, bulk, reefer general cargo and LNG vessels). He held various positions within the Höegh Group of companies within vessel management, newbuildings and projects, as well as business development before becoming President for Höegh Fleet in October 2007, a position he held for four years. Mr. Dahl has also worked within offshore engineering and with the Norwegian Class Society, DNV-GL. Mr. Dahl has a M.Sc degree from the NTNU technical university in Trondheim, Norway.
72
Morten Daviknes
joined Golar in 2010. Prior to his appointment as Chief Technical Officer in 2018, Mr. Daviknes served as Project Manager for the company’s first integrated FSRU conversion and mooring, the Nusantara Regas Satu, and more recently as Project Director for the world’s first FLNG conversion,
Hilli Episeyo
. Prior to joining Golar, Morten held various engineering and project management positions overseeing the conversion of 4 FPSO’s at Sea Production Limited and BW Offshore. Shortly after leaving university Morten also worked on the conversion of a platform for the multi-national spacecraft launch service, Sea Launch. Mr. Daviknes has a M.Sc degree from the NTNU technical university in Trondheim.
B. Compensation
For the year ended
December 31, 2018
, we paid to our directors and executive officers aggregate cash compensation (including bonus) of $4.0 million and an aggregate amount of $0.1 million for pension and retirement benefits. During the year ended
December 31, 2018
, we granted options covering
0.5 million
common shares at a weighted average exercise price of $27.57 with an expiration date of 2023. For a description of our stock option plan please refer to the section of this item entitled "E. Share Ownership - Option Plan" below.
In addition to cash compensation, during 2018 we also recognized an expense of $3.7 million relating to stock options issued to certain of our directors and executive officers. See note 25 “Share Capital and Share Options” of our consolidated financial statements included herein.
C. Board Practices
Our directors do not have service contracts with the Company and do not receive any benefits upon termination of their directorships. Our board of directors established an audit committee in July 2005, which is responsible for overseeing the quality and integrity of our financial statements and its accounting, auditing and financial reporting practices, our compliance with legal and regulatory requirements, the independent auditor's qualifications, independence and performance and our internal audit function. Our audit committee consists of three members, Lori Wheeler Naess, Daniel Rabun and Carl Steen who are all Company directors. In addition, the board of directors also has compensation and nominations committees, details of which are further described in "Item 16G. Corporate Governance".
Our board of directors is elected annually at the annual general meeting. Officers are appointed from time to time by our board of directors and hold office until a successor is elected.
As a foreign private issuer we are exempt from certain Nasdaq requirements that are applicable to U.S. listed companies. Please see the section of this Annual Report entitled “Item 16G. Corporate Governance" for a discussion of how our corporate governance practices differ from those required of U.S. companies listed on the Nasdaq.
D. Employees
As of
December 31, 2018
, we employed approximately 194 people in our offices in Bermuda, Cameroon, Croatia, London, Malaysia and Oslo. We also employ approximately 706 seagoing employees. These employees serve both Golar and Golar Partners.
E. Share Ownership
The table below shows the number and percentage of our issued and outstanding common shares beneficially owned by our directors and officers as of
March 15, 2019
. Also shown are their interests in share options awarded to them under our various share option schemes. The subscription price for options granted under the schemes will normally be reduced by the amount of all dividends declared by us in the period from the date of grant until the date the option is exercised.
73
|
Director or Officer
|
Beneficial Ownership in
Common Shares
|
Interest in Options
|
|
|||||||||||
|
|
Number of shares
|
%
|
|
Total
number of
options
|
Exercise price
|
Expiry date
|
||||||||
|
Tor Olav Trøim
|
5,233,953
(1)
|
|
5.18
|
%
|
150,000
|
|
$
|
55.48
|
|
2019
|
||||
|
5,310
|
|
$
|
21.03
|
|
2021
|
|||||||||
|
103,970
|
|
$
|
26.74
|
|
2022
|
|||||||||
|
11,840
|
|
$
|
27.20
|
|
2023
|
|||||||||
|
Daniel Rabun
|
*
|
|
*
|
|
75,000
|
|
$
|
21.03
|
|
2021
|
||||
|
11,905
|
|
$
|
26.74
|
|
2022
|
|||||||||
|
3,950
|
|
$
|
27.20
|
|
2023
|
|||||||||
|
Carl Steen
|
—
|
|
—
|
|
5,310
|
|
$
|
21.03
|
|
2021
|
||||
|
3,970
|
|
$
|
26.74
|
|
2022
|
|||||||||
|
3,950
|
|
$
|
27.20
|
|
2023
|
|||||||||
|
Niels Stolt-Nielsen
|
2,421,313
(2)
|
|
2.39
|
%
|
5,310
|
|
$
|
21.03
|
|
2021
|
||||
|
3,970
|
|
$
|
26.74
|
|
2022
|
|||||||||
|
3,950
|
|
$
|
27.20
|
|
2023
|
|||||||||
|
Lori Wheeler Naess
|
—
|
|
—
|
|
5,310
|
|
$
|
21.03
|
|
2021
|
||||
|
3,970
|
|
$
|
26.74
|
|
2022
|
|||||||||
|
3,950
|
|
$
|
27.20
|
|
2023
|
|||||||||
|
Michael Ashford
|
—
|
|
—
|
|
3,950
|
|
$
|
27.20
|
|
2023
|
||||
|
Iain Ross
|
—
|
|
—
|
|
300,000
|
|
$
|
20.81
|
|
2022
|
||||
|
Graham Robjohns
|
—
|
|
—
|
|
45,000
|
|
$
|
55.48
|
|
2019
|
||||
|
4,600
|
|
$
|
55.48
|
|
2020
|
|||||||||
|
29,250
|
|
$
|
22.88
|
|
2021
|
|||||||||
|
11,200
|
|
$
|
27.20
|
|
2023
|
|||||||||
|
Øistein Dahl
|
*
|
|
*
|
|
75,000
|
|
$
|
55.48
|
|
2019
|
||||
|
6,100
|
|
$
|
55.48
|
|
2020
|
|||||||||
|
50,000
|
|
$
|
22.88
|
|
2021
|
|||||||||
|
8,400
|
|
$
|
27.20
|
|
2023
|
|||||||||
|
Thorleif Egeli
|
*
|
|
*
|
|
—
|
|
N/A
|
|
N/A
|
|||||
|
Morten Daviknes
|
*
|
|
*
|
|
50,000
|
|
$
|
55.48
|
|
2019
|
||||
|
4,400
|
|
$
|
55.48
|
|
2020
|
|||||||||
|
33,000
|
|
$
|
22.88
|
|
2021
|
|||||||||
|
4,500
|
|
$
|
27.20
|
|
2023
|
|||||||||
* Less than 1%.
(1) Drew Holdings Limited, a company controlled by Tor Olav Trøim, is party to separate TRS agreements relating to 3,745,953 common shares, which are included within this balance.
(2) Included within this balance are 2,421,313 shares which are owned by Stolt-Nielsen Limited, a company controlled by Niels Stolt-Nielsen.
Our directors and executive officers have the same voting rights as all other holders of our common shares.
Option Plans
The Golar Long Term Incentive Plan (the "LTIP") was adopted by our board of directors, effective as of October 24, 2017. The purpose of the LTIP is primarily to provide a means through which Golar and its affiliates may attract, retain and motivate qualified persons as employees, directors and consultants. Accordingly, the LTIP provides for the grant of options and other awards as determined by the board of directors in its sole discretion.
74
As of
December 31, 2018
, 2.5 million of our authorized and unissued common shares were reserved for issue pursuant to subscription under options granted under the Company's share option plans. For further detail on share options please see note 25 "Share Capital and Share Options" of our consolidated financial statements included herein.
The exercise price of options are reduced by the value of dividends paid, on a per share basis. Accordingly, the above figures show the reduced exercise price as of
March 15, 2019
.
A. Major shareholders
The following table presents certain information as of
March 15, 2019
regarding the beneficial ownership of our common shares with respect to each shareholder that we know to beneficially own more than 5% of our issued and outstanding common shares:
|
|
Common Shares
|
||||
|
Owner
|
Number
|
Percent
|
|||
|
Orbis Investment Management Ltd
(1)
|
8,924,611
|
|
8.81
|
%
|
|
|
FMR LLC
(2)
|
7,405,457
|
|
7.31
|
%
|
|
|
Barrow, Hanley, Mewhinney and Strauss, LLC
(3)
|
5,760,565
|
|
5.69
|
%
|
|
(1) Information derived from the Schedule 13G of Orbis Investment Management Ltd filed with the Commission on February 14, 2019.
(2) Information derived from the Schedule 13G/A of FMR LLC filed with the Commission on February 13, 2019.
(3) Information derived from the Schedule 13G of Barrow, Hanley, Mewhinney and Strauss LLC filed with the Commission on February 11, 2019.
Our major shareholders have the same voting rights as all of our other common shareholders. To our knowledge, no corporation or foreign government owns more than 50% of issued and outstanding common shares. We are not aware of any arrangements the operation of which may, at a subsequent date, result in a change of control of the Company.
B. Related party transactions
There are no provisions in our Memorandum of Association or Bye-Laws regarding related party transactions. The Bermuda Companies Act of 1981 provides that a company, or one of its subsidiaries, may enter into a contract with an officer of the company, or an entity in which an officer has a material interest, if the officer notifies the directors of his or her interest in the contract or proposed contract.
The related party transactions that we were party to between January 1, 2018 and
December 31, 2018
are described in note 28 "Related Party Transactions" of our consolidated financial statements included herein.
C. Interests of Experts and Counsel
Not applicable.
A. Consolidated Financial Statements and Other Financial Information
See ''Item 18. Financial Statements''
Legal proceedings and claims
We may, from time to time, be involved in legal proceedings and claims that arise in the ordinary course of business. A provision will be recognized in the financial statements only where we believe that a liability will be probable and for which the amounts are reasonably estimable, based upon the facts known prior to the issuance of the financial statements.
75
UK tax lease benefits
During 2003 we entered into six UK tax leases. Under the terms of the leasing arrangements, the benefits are derived primarily from the tax depreciation assumed to be available to the lessors as a result of their investment in the vessels. HMRC has been challenging the use of similar lease structures and has been engaged in litigation of a test case, with an unrelated party, for some years. In August 2015, following an appeal to the Court of Appeal by the HMRC which set aside previous judgments in favor of the tax payer, the First Tier Tribunal (UK court) ruled in favor of HMRC. We have reviewed the details of the case and the basis of the judgment with our legal and tax advisers to ascertain what impact, if any, the judgment may have on us and the possible range of loss. We are currently in conversation with HMRC on this matter, presenting the factual background of our position, and are progressing the possibility of bringing this inquiry to a mutually satisfactory conclusion.
See note 30 “Other Commitments and Contingencies” of our consolidated financial statements included herein for further details.
Dividend distribution policy
Our long-term objective is to pay a regular dividend in support of our main objective to provide significant returns to shareholders. The level of our dividends will be guided by current earnings, market prospects, capital expenditure requirements and investment opportunities.
Any future dividends declared will be at the discretion of the board of directors and will depend upon our financial condition, earnings and other factors, such as any restrictions in our financing arrangements. Our ability to declare dividends is also regulated by Bermuda law, which prohibits us from paying dividends if, at the time of distribution, we will not be able to pay our liabilities as they fall due or the value of our assets is less than the sum of our liabilities, issued share capital and share premium.
In addition, since we are a holding company with no material assets other than the shares of our subsidiaries and affiliates through which we conduct our operations, our ability to pay dividends will depend on our subsidiaries and affiliates distributing to us their earnings and cash flow. Some of our loan agreements limit or prohibit our and our subsidiaries' and affiliates' ability to make distributions to us without the consent of our lenders.
For 2018, our board of directors declared quarterly dividends in May 2018, August 2018, November 2018 and February 2019 in the aggregate amount of
$48.1 million
, or
$0.475
per share.
For 2017, our board of directors declared quarterly dividends in May 2017, August 2017, November 2017 and February 2018 in the aggregate amount of
$19.7 million
, or
$0.20
per share.
For 2016, our board of directors declared quarterly dividends in June 2016, September 2016, December 2016 and March 2017 in the aggregate amount of
$19.5 million
, or
$0.20
per share.
B. Significant Changes
There have been no significant changes since the date of our consolidated financial statements included in this report, other than as described in note 31 ''Subsequent Events'' of our consolidated financial statements included herein.
C. Markets
Our common shares have traded on the Nasdaq since December 12, 2002 under the symbol "GLNG".
This section summarizes our share capital and the material provisions of our Memorandum of Association and Bye-Laws, including rights of holders of our common shares. The description is only a summary and does not describe everything that our Memorandum of Association and Bye-laws contain. The Memorandum of Association and the Bye-Laws of the Company have previously been filed as Exhibits 1.1 and 1.2, respectively to the Company's Registration Statement on Form 20-F, (File No. 000-50113) filed with the Commission on November 27, 2002, and are hereby incorporated by reference into this Annual Report.
76
At the 2013 Annual General Meeting of the Company, our shareholders voted to amend the Company's Bye-laws to ensure conformity with revisions to the Bermuda Companies Act 1981, as amended. These amended Bye-laws of the Company as adopted on September 20, 2013, were filed as Exhibit 3.1 to our report on Form 6-K filed with the Commission on July 1, 2014, and are hereby incorporated by reference into this Annual Report.
A. Share capital
Not applicable.
B. Memorandum of Association and Bye-laws
The object of our business, as stated in Section Six of our Memorandum of Association, is to engage in any lawful act or activity for which companies may be organized under the Companies Act, 1981 of Bermuda, or the Companies Act, other than to issue insurance or re-insurance, to act as a technical advisor to any other enterprise or business or to carry on the business of a mutual fund. Our Memorandum of Association and Bye-laws do not impose any limitations on the ownership rights of our shareholders.
Shareholder Meetings
. Under our Bye-laws, annual shareholder meetings will be held in accordance with the Companies Act at a time and place selected by our board of directors. The quorum at any annual or general meeting is equal to one or more shareholders, either present in person or represented by proxy, holding in the aggregate shares carrying 33 1/3% of the exercisable voting rights. Special meetings may be called at the discretion of the board of directors and at the request of shareholders holding at least one-tenth of all outstanding shares entitled to vote at a meeting. Annual shareholder meetings and special meetings must be called by not less than seven days' prior written notice specifying the place, day and time of the meeting. The board of directors may fix any date as the record date for determining those shareholders eligible to receive notice of and to vote at the meeting.
The Companies Act provides that a company must have a general meeting of its shareholders in each calendar year. The Companies Act does not impose any general requirements regarding the number of voting shares which must be present or represented at a general meeting in order for the business transacted at the general meeting to be valid. The Companies Act generally leaves the quorum for shareholder meetings to the company to determine in its Bye-laws. The Companies Act specifically imposes special quorum requirements where the shareholders are being asked to approve the modification of rights attaching to a particular class of shares (33.33%) or an amalgamation or merger transaction (33.33%) unless in either case the Bye-laws provide otherwise. The Company's Bye-laws do not provide for a quorum requirement other than 33.33%.
There are no limitations on the right of non-Bermudians or non-residents of Bermuda to hold or vote our common shares.
The key powers of our shareholders include the power to alter the terms of the Company's Memorandum of Association and to approve and thereby make effective any alterations to the Company's Bye-laws made by the directors. Dissenting shareholders holding 20% of the Company's shares may apply to the Court to annul or vary an alteration to the Company's Memorandum of Association. A majority vote against an alteration to the Company's Bye-laws made by the directors will prevent the alteration from becoming effective. Other key powers are to approve the alteration of the Company's capital including a reduction in share capital, to approve the removal of a director, to resolve that the Company be wound up or discontinued from Bermuda to another jurisdiction or to enter into an amalgamation or winding up. Under the Companies Act, all of the foregoing corporate actions require approval by an ordinary resolution (a simple majority of votes cast), except in the case of an amalgamation or merger transaction, which requires approval by 75% of the votes cast unless the Bye-Laws provide otherwise. The Company's Bye-laws only require an ordinary resolution to approve an amalgamation. In addition, the Company's Bye-laws confer express power on the board to reduce its issued share capital selectively with the authority of an ordinary resolution.
The Companies Act provides shareholders holding 10% of the Company's voting shares the ability to request that the board of directors shall convene a meeting of shareholders to consider any business which the shareholders wish to be discussed by the shareholders including (as noted below) the removal of any director. However, the shareholders are not permitted to pass any resolutions relating to the management of the Company's business affairs unless there is a pre-existing provision in the Company's Bye-laws which confers such rights on the shareholders. Subject to compliance with the time limits prescribed by the Companies Act, shareholders holding 20% of the voting shares (or alternatively, 100 shareholders) may also require the directors to circulate a written statement not exceeding 1000 words relating to any resolution or other matter proposed to be put before, or dealt with at, the annual general meeting of the Company.
Majority shareholders do not generally owe any duties to other shareholders to refrain from exercising all of the votes attached to their shares. There are no deadlines in the Companies Act relating to the time when votes must be exercised.
77
The Companies Act provides that a company shall not be bound to take notice of any trust or other interest in its shares. There is a presumption that all the rights attaching to shares are held by, and are exercisable by, the registered holder, by virtue of being registered as a member of the company. The company's relationship is with the registered holder of its shares. If the registered holder of the shares holds the shares for someone else (the beneficial owner) then if the beneficial owner is entitled to the shares, the beneficial owner may give instructions to the registered holder on how to vote the shares. The Companies Act provides that the registered holder may appoint more than one proxy to attend a shareholder meeting, and consequently where rights to shares are held in a chain, the registered holder may appoint the beneficial owner as the registered holder's proxy.
Directors.
The Companies Act provides that the directors shall be elected or appointed by the shareholders. A director may be elected by a simple majority vote of shareholders, at a meeting where shareholders holding not less than 33.33% of the voting shares are present in person or by proxy. A person holding 50% or more of the voting shares of the Company will be able to elect all of the directors, and to prevent the election of any person whom such shareholder does not wish to be elected. There are no provisions for cumulative voting in the Companies Act or the Bye-laws and the Company's Bye-laws do not contain any super-majority voting requirements. The appointment and removal of directors is covered by Bye-laws 86, 87 and 88.
There are procedures for the removal of one or more of the directors by the shareholders before the expiration of his term of office. Shareholders holding 10% or more of the voting shares of the Company may require the board of directors to convene a shareholder meeting to consider a resolution for the removal of a director. At least 14 days’ written notice of a resolution to remove a director must be given to the director affected, and that director must be permitted to speak at the shareholder meeting at which the resolution for his removal is considered by the shareholders.
The Companies Act stipulates that an undischarged bankruptcy of a director (in any country) shall prohibit that director from acting as a director, directly or indirectly, and taking part in or being concerned with the management of a company, except with leave of the court. The Company's Bye-Law 89 is more restrictive in that it stipulates that the office of a Director shall be vacated upon the happening of any of the following events (in addition to the Director's resignation or removal from office by the shareholders):
|
•
|
If he becomes of unsound mind or a patient for any purpose of any statute or applicable law relating to mental health and the Board resolves that he shall be removed from office;
|
|
•
|
If he becomes bankrupt or compounds with his creditors;
|
|
•
|
If he is prohibited by law from being a Director; or
|
|
•
|
If he ceases to be a Director by virtue of the Companies Act.
|
Under the Company's Bye-laws, the minimum number of directors comprising the board of directors at any time shall be two. The board of directors currently consists of seven directors. The quorum necessary for the transaction of business of the board may be fixed by the board and shall constitute a majority of the board. The minimum and maximum number of directors comprising the board of directors from time to time shall be determined by way of an ordinary resolution of the shareholders of the Company. The shareholders may, at the annual general meeting by ordinary resolution, determine that one or more vacancies in the board of directors be deemed casual vacancies. The board of directors, so long as a quorum remains in office, shall have the power to fill such casual vacancies. Each director will hold office until the next annual general meeting or until his successor is appointed or elected. The shareholders may call a Special General Meeting for the purpose of removing a director, provided notice is served upon the concerned director 14 days prior to the meeting and he is entitled to be heard. Any vacancy created by such a removal may be filled at the meeting by the election of another person by the shareholders or in the absence of such election, by the board of directors.
Subject to the provisions of the Companies Act, a director of a company may, notwithstanding his office, be a party to or be otherwise interested in any transaction or arrangement with that company, and may act as director, officer, or employee of any party to a transaction in which the company is interested. Under our Bye-Law 92, provided an interested director declares the nature of his or her interest immediately or thereafter at a meeting of the board of directors, or by writing to the directors as required by the Companies Act, a director shall not by reason of his office be held accountable for any benefit derived from any outside office or employment. The vote of an interested director, provided he or she has complied with the provisions of the Companies Act and our Bye-Laws with regard to disclosure of his or her interest, shall be counted for purposes of determining the existence of a quorum.
78
The Company’s Bye-law 94 provides the board of directors with the authority to exercise all of the powers of the Company to borrow money and to mortgage or charge all or any part of our property and assets as collateral security for any debt, liability or obligation. The Company’s directors are not required to retire because of their age, and the directors are not required to be holders of the Company’s common shares. Directors serve for a one year term, and shall serve until re-elected or until their successors are appointed at the next annual general meeting. The Company’s Bye-laws provide that no director, alternate director, officer or member of a committee, if any, resident representative, or his heirs, executors or administrators, whom we refer to collectively as an indemnitee, is liable for the acts, receipts, neglects or defaults of any other such person or any person involved in our formation, or for any loss or expense incurred by us through the insufficiency or deficiency of title to any property acquired by us, or for the insufficiency or deficiency of any security in or upon which any of our monies shall be invested, or for any loss or damage arising from the bankruptcy, insolvency, or tortuous act of any person with whom any monies, securities, or effects shall be deposited, or for any loss occasioned by any error of judgment, omission, default, or oversight on his part, or for any other loss, damage or misfortune whatever which shall happen in relation to the execution of his duties, or supposed duties, to us or otherwise in relation thereto. Each indemnitee will be indemnified and held harmless out of our funds to the fullest extent permitted by Bermuda law against all liabilities, loss, damage or expense (including but not limited to liabilities under contract, tort and statute or any applicable foreign law or regulation and all reasonable legal and other costs and expenses properly payable) incurred or suffered by him as such director, alternate director, officer, committee member or resident representative (or in his reasonable belief that he is acting as any of the above). In addition, each indemnitee shall be indemnified against all liabilities incurred in defending any proceedings, whether civil or criminal, in which judgment is given in such indemnitee’s favor, or in which he is acquitted or in connection with any application under the Companies Act in which relief from liability is granted to him by the court. The Company is authorized to purchase insurance to cover any liability it may incur under the indemnification provisions of its Bye-laws. The indemnity provisions are covered by Bye-laws 138 through 146.
Dividends.
Holders of common shares are entitled to receive dividend and distribution payments, pro rata based on the number of common shares held, when, as and if declared by the board of directors, in its sole discretion. Any future dividends declared will be at the discretion of the board of directors and will depend upon our financial condition, earnings and other factors.
As a Bermuda exempted company, we are subject to Bermuda law relating to the payment of dividends. We may not pay any dividends if, at the time the dividend is declared or at the time the dividend is paid, there are reasonable grounds for believing that, after giving effect to that payment;
|
•
|
we will not be able to pay our liabilities as they fall due; or
|
|
•
|
the realizable value of our assets is less than our liabilities.
|
In addition, since we are a holding company with no material assets, and conduct our operations through subsidiaries and our affiliates, our ability to pay any dividends to shareholders will depend on our subsidiaries' and affiliates distributing to us their earnings and cash flow. Some of our loan agreements currently limit or prohibit our subsidiaries' ability to make distributions to us and our ability to make distributions to our shareholders.
Share repurchases and preemptive rights
. Subject to certain balance sheet restrictions, the Companies Act permits a company to purchase its own shares if it is able to do so without becoming cash flow insolvent as a result. The restrictions are that the par value of the share must be charged against the company's issued share capital account or a company fund which is available for dividend or distribution or be paid for out of the proceeds of a fresh issue of shares. Any premium paid on the repurchase of shares must be charged to the company's current share premium account or charged to a company fund which is available for dividend or distribution. The Companies Act does not impose any requirement that the directors shall make a general offer to all shareholders to purchase their shares
pro rata
to their respective shareholdings. The Company's Bye-Laws do not contain any specific rules regarding the procedures to be followed by the Company when purchasing its own shares, and consequently the primary source of the Company's obligations to shareholders when the Company tenders for its shares will be the rules of the listing exchanges on which the Company's shares are listed. The Company’s power to purchase its own shares is covered by Bye-laws 9, 10 and 11.
The Companies Act does not confer any rights of pre-emption on shareholders when a company issues further shares, and no such rights of pre-emption are implied as a matter of common law. The Company's Bye-Laws do not confer any rights of pre-emption. Bye-Law 8 specifically provides that the issuance of more shares ranking
pari passu
with the shares in issue shall not constitute a variation of class rights, unless the rights attached to shares in issue state that the issuance of further shares shall constitute a variation of class rights. Bye-Law 12 confers on the directors the right to dispose of any number of unissued shares forming part of the authorized share capital of the Company without any requirement for shareholder approval. The Company’s power to issue shares is covered by Bye-laws 12, 13, 14, and 15.
79
Liquidation.
In the event of our liquidation, dissolution or winding up, the holders of common shares are entitled to share in our assets, if any, remaining after the payment of all of our debts and liabilities, subject to any liquidation preference on any outstanding preference shares.
C. Material contracts
The following is a list of each material contract, other than material contracts entered into in the ordinary course of business, to which we or any of our subsidiaries is a party, for the two years immediately preceding the date of this Annual Report, each of which is included in the list of exhibits in Item 19:
|
1.
|
Rules of Golar LNG Limited Bermuda Employee Share Option Scheme.
|
|
2.
|
Omnibus Agreement dated April 13, 2011, by and among Golar LNG Limited, Golar LNG Partners LP, Golar GP LLC and Golar Energy Limited.
|
|
3.
|
Amendment No. 1 to Omnibus Agreement, dated October 5, 2011 by and among Golar LNG Limited, Golar LNG Partners LP, Golar GP LLC and Golar Energy Limited.
|
|
4.
|
Bermuda Tax Assurance, dated May 23, 2011.
|
|
5.
|
Engineering, Procurement and Construction Contract, dated July 21, 2015 by and between Golar Gandria N.V. and Keppel Shipyard Limited.
|
|
6.
|
Memorandum of Agreement, dated September 9, 2015, by and between Golar Hilli Corporation and Fortune Lianjiang Shipping S.A.
|
|
7.
|
Bareboat charter by and between Golar Hilli Corp. and Fortune Lianjiang Shipping S.A., dated September 9, 2015.
|
|
8.
|
Additional Clauses to the Bareboat Charter Party dated September 9, 2015 between Golar Hilli Corp. and Fortune Lianjiang Shipping S.A.
|
|
9.
|
Common Terms Agreements, by and between Golar Hilli Corp. and Fortune Lianjiang Shipping S.A., dated September 9, 2015.
|
|
10.
|
Management and Administrative Services Agreement, effective as of April 1, 2016, between Golar LNG Partners LP and Golar Management Limited.
|
|
11.
|
Share Purchase Agreement, dated June 17, 2016, by and between Golar LNG and Stonepeak Infrastructure Fund II Cayman (G) Ltd.
|
|
12.
|
Investment and Shareholders Agreement, dated July 5, 2016, by and among Golar LNG Limited, Stonepeak Infrastructure Fund II Cayman (G) Ltd and Golar Power Limited.
|
|
13.
|
Second Amended and Restated Agreement of Limited Partnership of Golar LNG Partners LP dated October 19, 2016.
|
|
14.
|
Exchange Agreement, dated October 13, 2016, by and among Golar LNG Partners LP, Golar LNG Limited and Golar GP LLC.
|
|
15.
|
Indenture, dated February 17, 2017, between Golar LNG Limited and Deutsche Bank Trust Company Americas as a Bond Trustee.
|
|
16.
|
Loan Agreement, dated March 3, 2017, by and between Golar ML LLC and Citibank N.A.
|
|
17.
|
General Management Agreement, dated April 4, 2017, by and between Golar Management Ltd and Golar Power Limited.
|
|
18.
|
Purchase and Sale Agreement, dated August 15, 2017, by and among Golar LNG Limited, KS Investments Pte. Ltd., Black & Veatch International Company and Golar Partners Operating LLC.
|
|
19.
|
2017 Long-Term Incentive Plan.
|
|
20.
|
Liquefaction Tolling Agreement, dated November 29, 2017, between Societe Nationale de Hydrocarbures, Perenco Cameroon SA, Golar Hilli Corporation and Golar Cameroon SASU.
|
|
21.
|
Amendment Agreement, dated March 23 2018, relating to the Purchase and Sale Agreement by and between Golar LNG Partners LP, Golar LNG Limited, KS Investments Pte. Ltd. and Black & Veatch International Company.
|
|
22.
|
Amended and Restated Limited Liability Company Agreement of Golar Hilli LLC, dated July 12, 2018.
|
|
23.
|
Golar LNG Partners LP Guarantee Agreement, dated as of July 12, 2018.
|
|
24.
|
Amended and Restated Loan Agreement, dated July 20, 2018, by and between Golar ML LLC and Citibank N.A.
|
|
25.
|
Guarantee by and among Golar Power Limited, Golar LNG Limited and Compass Shipping 23 Corporation Limited dated September 25, 2018.
|
|
26.
|
Amended and Restated Engineering, Procurement and Construction Contract, dated December 13, 2018, by and between Golar Gimi Corporation and Keppel Shipyard Limited.
|
|
27.
|
Lease and Operate Agreement, dated February 26, 2019, by and between Gimi MS Corporation and BP Mauritania Investments Limited.
|
For a further discussion of these contracts and the related transactions, please refer to "Item 4. Information on the Company-A. History and Development of the Company," "Item 4. Information on the Company-B. Business Overview," “Item 5. Operating and Financial Review and Prospects-A. Operating Results,” "Item 5. Operating and Financial Review and Prospects-B. Liquidity and Capital Resources," “Item 6. Directors, Senior Management and Employees--E. Share Ownership,” "Item 7. Major
80
Shareholders and Related Party Transactions-B. Related Party Transactions" and “Item 10. Additional Information--E. Taxation.” Other than as discussed in this Annual Report, we have no material contracts, other than contracts entered into in the ordinary course of business, to which we or any of our subsidiaries are a party.
D. Exchange Controls
The Bermuda Monetary Authority, or the BMA, must give permission for all issuances and transfers of securities of a Bermuda exempted company like us, unless the proposed transaction is exempted by the BMA's written general permissions. We have received a general permission from the BMA to issue any unissued common shares, and for the free transferability of the common shares as long as our common shares are listed on the Nasdaq. Our common shares may therefore be freely transferred among persons who are residents or non-residents of Bermuda.
Although we are incorporated in Bermuda, we are classified as non-resident of Bermuda for exchange control purposes by the BMA. Other than transferring Bermuda Dollars out of Bermuda, there are no restrictions on our ability to transfer funds into or out of Bermuda to pay dividends to U.S. residents who are holders of our common shares or other non-resident holders of our common shares in currency other than Bermuda Dollars.
E. Taxation
The following is a discussion of the material U.S. federal income tax and Bermuda tax considerations relevant to a U.S. Holder, as defined below, of our common stock. This discussion does not purport to deal with the tax consequences of owning our common stock to all categories of investors, some of which, such as financial institutions, regulated investment companies, real estate investment trusts, tax-exempt organizations, insurance companies, persons holding our common stock as part of a hedging, integrated, conversion or constructive sale transaction or a straddle, traders in securities that have elected the mark-to-market method of accounting for their securities, persons liable for alternative minimum tax, persons who are investors in partnerships or other pass-through entities for U.S. federal income tax purposes, dealers in securities or currencies, U.S. Holders whose functional currency is not the U.S. dollar
,
persons required to recognize income for U.S. federal income tax purposes no later than when such income is included on an “applicable financial statement” and investors that own, actually or under applicable constructive ownership rules, 10% or more (by vote or value) of our shares of common stock, may be subject to special rules. This discussion deals only with holders who hold the shares of our common stock as a capital asset. You are encouraged to consult your own tax advisors concerning the overall tax consequences arising in your own particular situation under U.S. federal, state, local or foreign law of the ownership of our common stock.
Taxation of Operating Income
U.S. Taxation of our Company
Shipping income that is attributable to transportation that begins or ends, but that does not both begin and end, in the United States will be considered to be 50% derived from sources within the United States. Shipping income attributable to transportation that both begins and ends in the United States will be considered to be 100% derived from sources within the United States. We are not permitted by law to engage in transportation that gives rise to 100% U.S. source income.
Shipping income attributable to transportation exclusively between non-U.S. ports will be considered to be 100% derived from sources outside of the United States. Shipping income derived from sources outside of the United States will not be subject to U.S. federal income tax.
Unless exempt from U.S. federal income tax under section 883 of the Code, we will be subject to U.S. federal income tax, in the manner discussed below, to the extent our shipping income is derived from sources within the United States.
Based upon our current and anticipated shipping operations, our vessels are and will be operated in various parts of the world, including to or from U.S. ports.
Application of Section 883 of the Code
We have made special U.S. federal tax elections in respect of all our vessel-owning or vessel-operating subsidiaries that are potentially subject to U.S. federal income tax on shipping income derived from sources within the United States. The effect of such elections is to disregard the subsidiaries for which such elections have been made as separate taxable entities for U.S. federal income tax purposes.
81
Under section 883 of the Code and the Treasury Regulations promulgated thereunder, we, and each of our subsidiaries, will be exempt from U.S. federal income taxation on our respective U.S. source shipping income if the following three conditions are met:
|
•
|
we and each subsidiary are organized in a jurisdiction outside the United States that grants an equivalent exemption from tax to corporations organized in the United States with respect to the types of U.S. source international transportation income that we earn (or an equivalent exemption);
|
|
•
|
we satisfy the publicly traded test or the qualified shareholder stock ownership test as described in the Section 883 Regulations; and
|
|
•
|
we meet certain substantiation, reporting and other requirements.
|
The U.S. Treasury Department has recognized (i) Bermuda, our country of incorporation, and (ii) the countries of incorporation of each of our subsidiaries that has earned shipping income from sources within the United States as qualified foreign countries. Accordingly, we and each such subsidiary satisfy the country of organization requirement.
Due to the public nature of our shareholdings, we do not believe that we will be able to substantiate that we satisfy the ownership requirement. However, as described below, we believe that we will be able to satisfy the publicly-traded requirement.
The Treasury Regulations under section 883 of the Code provide that the stock of a foreign corporation will be considered to be "primarily traded" on an "established securities market" if the number of shares of each class of stock that are traded during any taxable year on all "established securities markets" in that country exceeds the number of shares in each such class that are traded during that year on "established securities markets" in any other single country. Our stock was "primarily traded" on the Nasdaq, an "established securities market" in the United States, during 2018.
Under the Treasury Regulations, our common stock will be considered to be "regularly traded" on an "established securities market" if one or more classes of our stock representing more than 50% of our outstanding shares, by total combined voting power of all classes of stock entitled to vote and total value, is listed on the market; this is also known as the "Listing Requirement". Since our common shares are listed on the Nasdaq, we will satisfy the Listing Requirement.
The Treasury Regulations further require that with respect to each class of stock relied upon to meet the Listing Requirement: (i) such class of stock is traded on the market, other than in minimal quantities, on at least 60 days during the taxable year or one-sixth of the days in a short taxable year; this is also known as the "Trading Frequency Test"; and (ii) the aggregate number of shares of such class of stock traded on such market is at least 10% of the average number of shares of such class of stock outstanding during such year, or as appropriately adjusted in the case of a short taxable year; this is also known as the "Trading Volume Test." We believe that our common shares satisfied the Trading Frequency Test and the Trading Volume Test in 2018. Even if this were not the case, the Treasury Regulations provide that the Trading Frequency Test and the Trading Volume Test will be deemed satisfied by a class of stock if, as we expect to be the case with our common shares, such class of stock is traded on an "established securities market" in the United States and such class of stock is regularly quoted by dealers making a market in such stock.
Notwithstanding the foregoing, the Treasury Regulations provide that our common shares will not be considered to be "regularly traded" on an "established securities market" for any taxable year in which 50% or more of the outstanding common shares, by vote and value, are owned, for more than half the days of the taxable year, by persons who each own 5% or more of the vote and value of the outstanding common shares; this is also known as the "5% Override Rule." The 5% Override Rule will not apply, however, if in respect of each category of shipping income for which exemption is being claimed, we can establish that individual residents of qualified foreign countries, or "Qualified Shareholders," own sufficient common shares to preclude non-Qualified Shareholders from owning 50% or more of the total vote and value of our common shares for more than half the number of days during the taxable year; this is also known as the "5% Override Exception."
Based on our public shareholdings for 2018, we were not subject to the 5% Override Rule for 2018. Therefore, we believe that we satisfied the Publicly-Traded Requirement for 2018 and we and each of our subsidiaries are entitled to exemption from U.S. federal income tax under section 883 of the Code in respect of our U.S. source shipping income. To the extent that we become subject to the 5% Override Rule in future years (as a result of changes in the ownership of our common shares), it may be difficult for us to establish that we qualify for the 5% Override Exception.
If we were not eligible for the exemption under section 883 of the Code, our U.S. source shipping income would be subject to U.S. federal income tax as described in more detail below.
82
Taxation in Absence of Exemption Under Section 883 of the Code
To the extent the benefits of section 883 of the Code are unavailable with respect to any item of U.S. source shipping income earned by us or by our subsidiaries and such U.S. source shipping income is not considered to be "effectively connected" with the conduct of a U.S. trade or business, such U.S. source shipping income would be subject to a 4% U.S. federal income tax imposed by section 887 of the Code on a gross basis, without benefit of deductions. Since under the sourcing rules described above, no more than 50% of the shipping income earned by us or our subsidiaries would be derived from U.S. sources, the maximum effective rate of U.S. federal income tax on such gross shipping income would never exceed 2%. For the calendar year 2018, we and our subsidiaries would be subject to $nil aggregated tax under section 887 of the Code if applicable.
In addition, our U.S. source shipping income that is considered to be “effectively connected” with the conduct of a U.S. trade or business is subject to the U.S. corporate income tax currently imposed at a rate of 21% (net of applicable deductions). In addition, we may be subject to the 30% U.S. “branch profits” tax on earnings effectively connected with the conduct of such trade or business, as determined after allowance for certain adjustments, and on certain interest paid or deemed paid attributable to the conduct of our U.S. trade or business.
Our U.S. source shipping income would be considered effectively connected with the conduct of a U.S. trade or business only if:
• we had, or were considered to have, a fixed place of business in the United States involved in the earning of our U.S. source shipping income; and
• substantially all of our U.S. source shipping income was attributable to regularly scheduled transportation, such as the operation of a ship that followed a published schedule with repeated sailings at regular intervals between the same points for voyages that begin or end in the United States.
We believe that we will not meet these conditions because we will not have, or permit circumstances that would result in
having, such a fixed place of business in the United States or any ship sailing to or from the United States on a regularly
scheduled basis.
Gain on Sale of Vessels
If we and our subsidiaries qualify for exemption from tax under section 883 of the Code in respect of our U.S. source shipping income, the gain on the sale of any vessel earning such U.S. source shipping income should likewise be exempt from U.S. federal income tax. Even if we and our subsidiaries are unable to qualify for exemption from tax under section 883 of the Code and we or any of our subsidiaries, as the seller of such vessel, is considered to be engaged in the conduct of a U.S. trade or business, gain on the sale of such vessel would not be subject to U.S. federal income tax provided the sale is considered to occur outside of the United States under U.S. federal income tax principles. In general, a sale of a vessel will be considered to occur outside of the United States for this purpose if title to the vessel, and risk of loss with respect to the vessel, pass to the buyer outside of the United States. To the extent circumstances permit, we intend to structure sales of our vessels in such a manner, including effecting the sale and delivery of vessels outside of the United States. If the sale is considered to occur within the United States, any gain on such sale may be subject to U.S. federal income tax as "effectively connected" income.
U.S. Taxation of U.S. Holders
The term "U.S. Holder" means a beneficial owner of our common shares that is a U.S. citizen or resident, U.S. corporation or other U.S. entity taxable as a corporation, an estate, the income of which is subject to U.S. federal income tax regardless of its source, or a trust if a court within the United States is able to exercise primary jurisdiction over the administration of the trust and one or more U.S. persons have the authority to control all substantial decisions of the trust, and owns our common shares as a capital asset, generally, for investment purposes.
If a partnership holds our common shares, the tax treatment of a partner will generally depend upon the status of the partner and upon the activities of the partnership. If you are a partner in a partnership holding our common shares, you are urged to consult your tax advisor.
83
Distributions
Any distributions made by us with respect to our common shares to a U.S. Holder will generally constitute dividends to the extent of our current and accumulated earnings and profits, as determined under U.S. federal income tax principles. Subject to the discussion below under "Passive Foreign Investment Company", we expect that dividends paid by us to a non-corporate U.S. Holder will be eligible for preferential U.S. federal income tax rates provided that the non-corporate U.S. Holder has owned the common shares for more than 60 days in the 121-day period beginning 60 days before the date on which our common shares becomes ex-dividend and certain other conditions are satisfied. However, there is no assurance that any dividends paid by us will be eligible for these preferential tax rates in the hands of a non-corporate U.S. Holder. Any dividends paid by us, which are not eligible for these preferential tax rates will be taxed as ordinary income to a non-corporate U.S. Holder. Because we are not a U.S. corporation, U.S. Holders that are corporations will generally not be entitled to claim a dividends-received deduction with respect to any distributions they receive from us. Dividends paid on our common shares will be income from sources outside the United States and will generally constitute "passive category income" or, in the case of certain U.S. Holders, "general category income" for U.S. foreign tax credit limitation purposes.
Distributions in excess of our earnings and profits will be treated first as a non-taxable return of capital to the extent of the U.S. Holder's tax basis in its common shares, and thereafter as a taxable capital gain.
Sale, Exchange or other Disposition of Our Common Shares
Subject to the discussion below under "Passive Foreign Investment Company," a U.S. Holder generally will recognize taxable gain or loss upon a sale, exchange or other disposition of our common shares in an amount equal to the difference between the amount realized by the U.S. Holder from such sale, exchange or other disposition and the U.S. Holder's tax basis in the common shares. Such gain or loss will be treated as long-term capital gain or loss if the U.S. Holder's holding period in such common shares is greater than one year at the time of the sale, exchange or other disposition. Otherwise, such gain or loss will be treated as short-term capital gain or loss. A U.S. Holder's ability to deduct capital losses is subject to certain limitations. A U.S. Holder's gain or loss will generally be treated (subject to certain exceptions) as gain or loss from source within the United States for U.S. foreign tax credit limitation purposes.
Passive Foreign Investment Company
Notwithstanding the above rules regarding distributions and dispositions, special rules may apply to U.S. Holders (or, in some cases, U.S. persons who are treated as owning our common shares under constructive ownership rules) if we are treated as a "passive foreign investment company, or a PFIC for U.S. federal income tax purposes. We will be a PFIC if either:
|
•
|
at least 75% of our gross income in a taxable year is "passive income"; or
|
|
•
|
at least 50% of our assets in a taxable year (averaged over the year and generally determined based upon value) are held for the production of, or produce, "passive income."
|
For purposes of determining whether we are a PFIC, we will be treated as earning and owning our proportionate share of the income and assets, respectively, of any of our subsidiary corporations in which we own 25% or more of the value of the subsidiary's stock, which includes Golar Partners. To date, our subsidiaries and we have derived most of our income from time and voyage charters, and we expect to continue to do so. This income should be treated as services income, which is not "passive income" for PFIC purposes. We believe there is substantial legal authority supporting our position consisting of case law and U.S. Internal Revenue Service, also known as the "IRS", pronouncements concerning the characterization of income derived from time charters and voyage charters as services income for other tax purposes. However, there is also authority which characterizes time charter income as rental income rather than services income for other tax purposes.
Based on the foregoing, we believe that we are not currently a PFIC and do not expect to be a PFIC in the foreseeable future. However, in the absence of any legal authority specifically relating to the Code provisions governing PFICs, the IRS or a court could disagree with our position. In addition, there can be no assurance that we will not become a PFIC if our operations change in the future.
84
If we become a PFIC (and regardless of whether we remain a PFIC), each U.S. Holder who owns or is treated as owning our common shares during any period in which we are so classified, would be subject to U.S. federal income tax, at the then highest applicable income tax rates on ordinary income, plus interest, upon certain "excess distributions" and upon dispositions of our common shares including, under certain circumstances, a disposition pursuant to an otherwise tax free reorganization, as if the distribution or gain had been recognized ratably over the U.S. Holder's entire holding period of our common shares. The amounts allocated to the taxable year of the sale or other disposition and to any year during such holding period before we became a PFIC would be taxed as ordinary income. An "excess distribution" generally includes dividends or other distributions received from a PFIC in any taxable year of a U.S. Holder to the extent that the amount of those distributions exceeds 125% of the average distributions made by the PFIC during a specified base period. The tax at ordinary rates and interest resulting from an excess distribution would not be imposed if the U.S. Holder makes a "mark-to-market" election or "qualified electing fund" election, as discussed below.
If we become a PFIC and, provided that, as is currently the case, our common shares are treated as "marketable stock," a U.S. Holder may make a "mark-to-market" election with respect to our common shares. Under this election, any excess of the fair market value of the common shares at the close of any tax year over the U.S. Holder's adjusted tax basis in the common shares is included in the U.S. Holder's income as ordinary income. In addition, the excess, if any, of the U.S. Holder's adjusted tax basis at the close of any taxable year over the fair market value of the common shares is deductible in an amount equal to the lesser of the amount of the excess or the net "mark-to-market" gains that the U.S. Holder included in income in previous years. If a U.S. Holder makes a "mark-to-market" election after the beginning of its holding period of our common shares, the U.S. Holder does not avoid the PFIC rules described above with respect to the inclusion of ordinary income, and the imposition of interest thereon, attributable to periods before the election.
In some circumstances, a shareholder in a PFIC may avoid the unfavorable consequences of the PFIC rules by making a "qualified electing fund" election. However, a U.S. Holder cannot make a "qualified electing fund" election with respect to us unless such U.S. Holder complies with certain reporting requirements. We do not intend to provide the information necessary to meet such reporting requirements.
In addition to the above consequences, if we were to be treated as a PFIC for any taxable year, a U.S. Holder would be required to file IRS form 8621 with the IRS for that year with respect to such U.S. Holder's common stock.
U.S. Federal Income Tax Consequences to Non-U.S. Holders of Our Common Shares
A beneficial owner of our common shares (other than a partnership) that is not a U.S. Holder is referred to herein as a Non-U.S. Holder. It is assumed for purposes of this section that the Non-U.S. Holder (1) is not engaged in the conduct of a United States trade or business and (2) (a) if an individual, is not treated as a U.S. resident pursuant to the substantial presence test (generally treating a non-resident individual alien as a resident if such person is present in the United States for more than a weighted sum of 183 days during a three-year period and the nonresident alien is present for at least 31 days in the current year) and is not present in the United States for 183 days or more in the taxable year of disposition of the notes or common shares or (b) if not a natural person, has not made any election to subject itself to, or is otherwise subject to, U.S. federal income taxation on a net basis.
Subject to the discussion below regarding backup withholding, a Non-U.S. Holder will generally not be subject to U.S. federal income tax upon receipt, holding, or sale or disposition of, or receipt of dividends paid in respect of, the common shares.
Backup Withholding and Information Reporting
In general, dividend payments, or other taxable distributions, made within the United States will be subject to information reporting requirements. Such payments will also be subject to "backup withholding" if made to a non-corporate U.S. Holder and such U.S. Holder:
|
•
|
fails to provide an accurate taxpayer identification number;
|
|
•
|
provides us with an incorrect taxpayer identification number;
|
|
•
|
is notified by the IRS that it has failed to report all interest or dividends required to be shown on its U.S. federal income tax returns; or
|
|
•
|
in certain circumstances, fails to comply with applicable certification requirements.
|
85
If a shareholder sells our common shares to or through a U.S. office or broker, the payment of the proceeds is subject to both U.S. information reporting and "backup withholding" unless the shareholder establishes an exemption. If the shareholder sells our common shares through a non-U.S. office of a non-U.S. broker and the sales proceeds are paid to the shareholder outside the United States, then information reporting and "backup withholding" generally will not apply to that payment. However, U.S. information reporting requirements, but not "backup withholding," will apply to a payment of sales proceeds, including a payment made to a shareholder outside the United States, if the shareholder sells the common shares through a non-U.S. office of a broker that is a U.S. person or has some other contacts with the United States.
"Backup withholding" is not an additional tax. Rather, a taxpayer generally may obtain a refund of any amounts withheld under "backup withholding" rules that exceed such taxpayer's U.S. federal income tax liability by filing a refund claim with the IRS, provided that the required information is furnished to the IRS.
Individuals who are U.S. Holders (and to the extent specified in the applicable Treasury Regulations, certain individuals who are non-U.S. Holders and certain U.S. entities) who hold "specified foreign financial assets" (as defined in Section 6038D of the Code and the applicable Treasury Regulations) are required to file IRS Form 8938 (Statement of Specified Foreign Financial Assets) with information relating to each such asset for each taxable year in which the aggregate value of all such assets exceeds $75,000 at any time during the taxable year or $50,000 on the last day of the taxable year. Specified foreign financial assets would include, among other assets, our common stock, unless the common stock were held through an account maintained with a U.S. financial institution. Substantial penalties apply to any failure to timely file IRS Form 8938, unless the failure is shown to be due to reasonable cause and not due to willful neglect. Additionally, the statute of limitations on the assessment and collection of U.S. federal income tax with respect to a taxable year for which the filing of IRS Form 8938 is required may not close until three years after the date on which IRS Form 8938 is filed. U.S. Holders (including U.S. entities) and non-U.S. Holders are encouraged to consult their own tax advisors regarding their reporting obligations under Section 6038D of the Code.
Bermuda Taxation
Bermuda currently imposes no tax (including a tax in the nature of an income, estate, duty, inheritance, capital transfer or withholding tax) on profits, income, capital gains or appreciations derived by us, or dividends or other distributions paid by us to shareholders of our common shares. Bermuda has undertaken not to impose any such Bermuda taxes on shareholders of our common shares prior to the year 2035, except in so far as such tax applies to persons ordinarily resident in Bermuda.
The Minister of Finance in Bermuda has granted the Company a tax exempt status until March 31, 2035, under which no income taxes or other taxes (other than duty on goods imported into Bermuda and payroll tax in respect of any Bermuda-resident employees) are payable by the Company in Bermuda. If the Minister of Finance in Bermuda does not grant a new exemption or extension of the current tax exemption, and if the Bermudian Parliament passes legislation imposing taxes on exempted companies, the Company may become subject to taxation in Bermuda after March 31, 2035. Furthermore, the recent passing of the Economic Substance Act 2018 in Bermuda as well being placed on the EU list of non-cooperative jurisdictions for tax purposes, highlights the increasing scrutiny the existing regime is subject to.
F. Dividends and Paying Agents
Not applicable.
G. Statements by Experts
Not applicable.
H. Documents on Display
We will file reports and other information with the U.S. Securities and Exchange Commission, or the Commission. These materials, including this document and the accompanying exhibits, may be inspected and copied, at prescribed rates, at the public reference facilities maintained by the Commission at 100 F Street, N.E., Washington, D.C. 20549. You may obtain information on the operation of the public reference room by calling 1 (800) SEC-0330. The Commission maintains a website (http://www.sec.gov) that contains reports, proxy and information statements and other information regarding registrants that file electronically with the Commission.
86
I. Subsidiary Information
Not applicable.
We are exposed to various market risks, including interest rate, commodity price and foreign currency exchange risks. We enter into a variety of derivative instruments and contracts to maintain the desired level of exposure arising from these risks.
Our policy is to hedge our exposure to risks, when possible, within boundaries deemed appropriate by management.
A discussion of our accounting policies for derivative financial instruments is included in note 2 “Accounting Policies” of our consolidated financial statements included herein. Further information on our exposure to market risk is included in note 27 “Financial Instruments” of our consolidated financial statements included herein.
The following analysis provides quantitative information regarding our exposure to foreign currency exchange rate risk and interest rate risk. There are certain shortcomings inherent in the sensitivity analysis presented, primarily due to the assumption that exchange rates change in a parallel fashion and that interest rates change instantaneously.
Interest rate risk.
A significant portion of our long-term debt obligation is subject to adverse movements in interest rates. Our interest rate risk management policy permits economic hedge relationships in order to reduce the risk associated with adverse fluctuations in interest rates. We use interest rate swaps and fixed rate debt to manage the exposure to adverse movements in interest rates. Interest rate swaps are used to convert floating rate debt obligations to a fixed rate in order to achieve an overall desired position of fixed and floating rate debt. Credit exposures are monitored on a counterparty basis, with all new transactions subject to senior management approval.
As of
December 31, 2018
, the notional amount of interest rate swaps outstanding in respect of our debt obligation was
$1.0 billion
. The principal of our floating rate loans outstanding as of
December 31, 2018
was $755.0 million. Based on our floating rate debt at
December 31, 2018
, a one-percentage point increase in the floating interest rate would increase our interest expense by $6.7 million per annum. For disclosure of the fair value of the derivatives and debt obligations outstanding as of
December 31, 2018
, see note 27 “Financial Instruments” of our consolidated financial statements included herein.
Foreign currency risk
. The majority of our transactions, assets and liabilities are denominated in U.S. Dollars, our functional currency. Periodically, we may be exposed to foreign currency exchange fluctuations as a result of expenses paid by certain subsidiaries in currencies other than U.S. Dollars, which includes British Pounds, or GBP, Norwegian Kroners, or NOK, and Euros, in relation to our administrative office in the UK, operating expenses and capital expenditure projects incurred in a variety of foreign currencies. Based on our GBP expenses for
2018
, a 10% depreciation of the U.S. Dollar against GBP would have increased our expenses by approximately $3.5 million.
We operate a branch in Norway, where the majority of expenses are incurred in NOK. Based on our NOK administrative expenses incurred in
2018
, a 10% depreciation of the U.S. Dollar against NOK would have increased our expenses by $2.8 million.
The base currency of the majority of our seafaring officers' remuneration was the Euro. Based on the crew costs incurred in
2018
, a 10% depreciation of the U.S. Dollar against the Euro would have increased our crew cost for
2018
by approximately $3.2 million.
Equity risk.
As of
December 31, 2018
, we are party to a Total Return Swap, or TRS, contract indexed to 3,000,000 of our own shares, whereby we carry the risk of fluctuations in the market price of our shares. The settlement amount for the contract will be (A) the market value of the shares at the date of settlement plus the amount of dividends paid on the shares by us between entering into and settling the contract, less (B) the reference price of the shares agreed at the inception of the contract plus the counterparty's financing costs. Settlement will be either a payment from or to the counterparty, depending on whether (A) is more or less than (B). The contract has been extended to expire in June 2019. The weighted average reference price was $45.01 per common share. As of
December 31, 2018
, we had also entered into a forward contract for the acquisition of 107,000 shares in Golar Partners at an average price of $20.53. The open position of both contracts at
December 31, 2018
, exposes us to market risk associated with our share price and the share price of Golar Partners, and it is estimated that a 10% reduction in both share prices as at
December 31, 2018
, would generate an adverse mark-to-market adjustment of approximately $6.6 million, which would be recorded in our consolidated statement of operations.
Commodity price risk.
As of
December 31, 2018
, we have a derivative asset in relation to the LTA, representing the fair value of the estimated discounted cash flows of payments due as a result of the Brent Crude price moving above the contractual floor of $60.00 per barrel over the contract term. The derivative asset is adjusted to fair value at each balance date and, on
December 31, 2018
, the value of this asset is $84.7 million. Movements in the price of Brent Crude will cause the derivative asset, and resulting fair value movements, to fluctuate. However, we bear no downside risk should the Brent Crude price move below $60.00.
ITEM
12. DESCRIPTION OF SECURITIES OTHER THAN EQUITY SECURITIES
Not applicable.
None.
87
None.
(a) Disclosure Controls and Procedures
We maintain disclosure controls and procedures that are designed to ensure that information required to be disclosed in our Exchange Act reports is recorded, processed, summarized and reported within the time periods specified in the SEC’s rules and forms, and that such information is accumulated and communicated to our management, including our Chief Executive Officer and Chief Financial Officer, as appropriate, to allow timely decisions regarding required disclosure.
Under the supervision of our Company’s Chief Executive Officer and Chief Financial Officer, we carried out an evaluation of the effectiveness of our disclosure controls and procedures, pursuant to Rule 13a-15(e) of the Exchange Act of 1934, as of
December 31, 2018
. At the time our Annual Report on Form 20-F for the year ended
December 31, 2018
was filed on
March 29, 2019
, our Chief Executive Officer and Chief Financial Officer concluded that our disclosure controls and procedures were effective as of
December 31, 2018
.
(b)
Management's annual report on internal controls over financial reporting
In accordance with the requirements of Rule 13a-15 of the Securities Exchange Act of 1934, as amended, the following report is provided by management in respect of our internal control over financial reporting. As defined in the Rule 13a-15(f) under the Securities Exchange Act of 1934, as amended, internal control over financial reporting is a process designed by, or under the supervision of, our Chief Executive Officer and Chief Financial Officer, or persons performing similar functions, and effected by our Board of Directors, management and other personnel, to provide reasonable assurance regarding the reliability of financial reporting and the preparation of the consolidated financial statements for external purposes in accordance with generally accepted accounting principles and includes those policies and procedures that:
|
•
|
pertain to the maintenance of records that, in reasonable detail, accurately and fairly reflect the transactions and dispositions of the assets of the Company;
|
|
•
|
provide reasonable assurance that transactions are recorded as necessary to permit preparation of financial statements in accordance with GAAP, and that receipts and expenditures of the Company are being made only in accordance with authorizations of management and directors of the Company; and
|
|
•
|
provide reasonable assurance regarding prevention or timely detection of unauthorized acquisition, use or disposition of the Company’s assets that could have a material effect on the financial statements.
|
Our management is responsible for establishing and maintaining adequate internal control over financial reporting as defined in Rules 13a-15(f) and 15d-15(f) under the Securities and Exchange Act of 1934, as amended. Our internal control system was designed to provide reasonable assurance regarding the reliability of financial reporting and the preparation of our published consolidated financial statements for external purposes under generally accepted accounting principles.
In connection with the preparation of our annual consolidated financial statements, management has undertaken an assessment of the effectiveness of our internal control over financial reporting as of
December 31, 2018
, based on criteria established in Internal Control - Integrated Framework (2013), issued by the Committee of Sponsoring Organizations of the Treadway Commission.
Management’s assessment included an evaluation of the design of the Company's internal control over financial reporting and testing of the operational effectiveness of those controls. Based on this assessment, management has concluded and hereby reports that as of
December 31, 2018
, the Company’s internal control over financial reporting was effective.
The Company’s independent registered public accounting firm has issued an attestation report on the effectiveness of the Company’s internal control over financial reporting.
(c) Attestation report of the registered public accounting firm
The effectiveness of the Company's internal control over financial reporting as of
December 31, 2018
has been audited by Ernst & Young LLP, an independent registered public accounting firm, as stated in their report which appears on page F-3 of our consolidated financial statements.
88
(d) Changes in internal control over financial reporting
There were no changes in our internal control over financial reporting during the period covered by this Annual Report that have materially affected, or are reasonably likely to materially affect, our internal control over financial reporting.
Our board of directors has determined that Lori Wheeler Naess, a director, qualifies as an audit committee financial expert and is independent, in accordance with SEC Rule 10a-3 pursuant to Section 10A of the Securities Exchange Act of 1934.
We have adopted a Code of Ethics that applies to all the employees of the company and its subsidiaries. A copy of our Code of Ethics may be found on our website
www.golarlng.com
. This web address is provided as an inactive textual reference only. Information contained on our website does not constitute part of this Annual Report. We will provide any person, free of charge, a copy of our Code of Ethics upon written request to our registered office.
(a)
Audit Fees
The following table sets forth, for the two most recent fiscal years, the aggregate fees billed for professional services rendered by the principal accountant for the audit of the Company's annual financial statements and services provided by the principal accountant in connection with statutory and regulatory filings or engagements for the two most recent fiscal years.
|
Fiscal year ended December 31, 2018
|
$
|
1,558,539
|
|
|
Fiscal year ended December 31, 2017
|
$
|
1,479,984
|
|
Total audit fees incurred with respect to Ernst & Young LLP were approximately $1.4 million and $1.5 million for
2018
and
2017
, respectively.
(b) Audit-Related Fees
The following table sets forth, for the two most recent fiscal years, the aggregate fees billed for assurance and related services, not included under "(a) Audit Fees", rendered by the principal accountant for the audit of the Company's annual financial statements and services provided by the principal accountant in connection with statutory and regulatory filings or engagements for the two most recent fiscal years.
|
Fiscal year ended December 31, 2018
|
$
|
106,491
|
|
|
Fiscal year ended December 31, 2017
|
$
|
608,312
|
|
(c) Tax Fees
The following table sets forth, for the two most recent fiscal years, the aggregate fees billed for professional services rendered by the principal accountant for tax compliance, tax advice and tax planning.
|
Fiscal year ended December 31, 2018
|
$
|
91,913
|
|
|
Fiscal year ended December 31, 2017
|
$
|
145,010
|
|
89
(d) All Other Fees
The following table sets forth, for the two most recent fiscal years, the aggregate fees billed for professional services rendered by the principal accountant for other services that are not included in the scope of the current year audit or tax services as mentioned above. This majority of the balance comprises of advisory services provided during the year.
|
Fiscal year ended December 31, 2018
|
$
|
30,629
|
|
|
Fiscal year ended December 31, 2017
|
$
|
223,752
|
|
(e) Audit Committee's Pre-Approval Policies and Procedures
The Company's board of directors has adopted pre-approval policies and procedures in compliance with paragraph (c)(7)(i) of Rule 2-01 of Regulation S-X that require our board of directors to approve the appointment of the independent auditor of the Company before such auditor is engaged and approve each of the audit and non-audit related services to be provided by such auditor under such engagement by the Company. All services provided by the principal auditor in
2018
and
2017
were approved by our board of directors pursuant to the pre-approval policy.
Not applicable.
In November 2014, our Board of Directors approved the purchase of up to 5% of the outstanding common stock of the Company over a two year period ended November 2016. Accordingly, at the time of close of scheme, we had repurchased 0.5 million shares for an aggregate cost of $20.5 million.
|
Total number of shares purchased
|
|
Average price paid per share
|
|
Total number of shares purchased as part of publicly announced plans or programme
|
|
Maximum number of shares that may be purchased under the plans or programme
(1)
|
|
|||||
|
October 2015
|
300,000
|
|
$
|
40.90
|
|
300,000
|
|
4,400,000
|
|
|||
|
January 2016
|
200,000
|
|
$
|
41.07
|
|
200,000
|
|
4,200,000
|
|
|||
|
As of November 30, 2016
(1)
|
500,000
|
|
$
|
40.97
|
|
500,000
|
|
—
|
|
|||
(1) The Board approval lapsed in November 2016 and therefore no further shares were purchased under the scheme.
In connection with the Board approved share repurchase scheme discussed above, this was partly financed through the use of total return swap or equity swap facilities with third party banks, indexed to our own shares. We carry the risk of fluctuations in the share price of those acquired shares. The banks are compensated at their cost of funding plus a margin. As at
December 31, 2018
, the counterparty to the equity swap transactions had acquired 3.0 million shares in the Company at an average price of
$45.01
. The effect of our Total Return Swap in our consolidated statement of operations as at
December 31, 2018
is an unrealized mark-to-market loss of
$30.7 million
. There is at present no obligation for us to purchase any shares from the counterparty.
Not applicable.
90
Pursuant to an exception under Nasdaq Rule 5615, or Nasdaq listing standards available to foreign private issuers, we are not required to comply with all of the corporate governance practices followed by U.S. companies under the Nasdaq's listing standards, which are available at www.nasdaq.com. As a foreign private issuer, we are permitted to follow our home country practices in lieu of certain Nasdaq corporate governance requirements. We have certified to Nasdaq that our corporate governance practices are in compliance with, and are not prohibited by, the laws of Bermuda.
We are exempt from many of the Nasdaq's corporate governance practices other than the requirements regarding the disclosure of a going concern audit opinion, submission of a listing agreement, notification of material non-compliance with Nasdaq's corporate governance practices and the establishment and composition of an audit committee and a formal written audit committee charter. The practices we follow in lieu of Nasdaq's corporate governance requirements are as follows:
Independence of directors
. We are exempt from certain Nasdaq requirements regarding independence of directors. Consistent with Bermuda law, our board of directors is not required to be composed of a majority of independent directors. Currently, five of the seven members of the board of directors, Daniel Rabun, Lori Wheeler Naess, Carl Steen, Niels Stolt-Nielsen and Thorleif Egeli are independent according to Nasdaq's standards for independence. Our board of directors does not hold meetings at which only independent directors are present.
Audit Committee
. We are exempt from certain Nasdaq requirements regarding our audit committee. Consistent with Bermuda law, the directors on our audit committee are not required to comply with certain of Nasdaq’s independence requirements for audit committee members, and the Company's management is responsible for the proper and timely preparation of the Company's annual reports, which are audited by independent auditors. However, the committee currently consists of three independent directors, Lori Wheeler Naess, Daniel Rabun and Carl Steen.
Compensation Committee
. We are exempt from certain Nasdaq requirements regarding our compensation committee. Consistent with Bermuda law, our compensation committee may consist of members who are not independent directors. However, the committee is currently comprised of Carl Steen and Niels Stolt-Nielsen, who are both independent. The primary responsibility of this committee is to review, approve and make recommendations to the board regarding compensation for directors and management.
Nomination Committee
. We are exempt from certain Nasdaq requirements regarding our nomination committee. Consistent with Bermuda law, our nomination committee may consist of members who are not independent directors. However, the committee is currently comprised of two independent directors, Carl Steen and Daniel Rabun. The primary responsibility of this committee is to select and recommend to the board, director and committee member candidates.
Share Issuance
. In lieu of obtaining shareholder approval prior to the issuance of securities in certain circumstances, consistent with Bermuda law and our Bye-Laws, the board of directors approves share issuances.
As a foreign private issuer, we are not required to solicit proxies or provide proxy statements to Nasdaq pursuant to Nasdaq's corporate governance rules or Bermuda law. Consistent with Bermuda law, and as provided in our amended Bye-laws, we will notify our shareholders of shareholder meetings at least seven days before such meeting. This notification will contain, among other things, information regarding business to be transacted at the meeting.
We believe that our established corporate governance practices satisfy the Nasdaq listing standards.
91
Not applicable.
Not applicable.
The following financial statements listed below and set forth on pages F-1 through to F-67 are filed as part of this Annual Report.
Separate consolidated financial statements and notes thereto for Golar Partners for each of the years ended December 31,
2018
,
2017
and
2016
are being provided as a result of Golar Partners meeting a significance test pursuant to Rule 3-09 of Regulation S-X for the three years ended
December 31, 2018
and, accordingly, the financial statements of Golar Partners for the year ended
December 31, 2018
as filed in the Annual Report on Form 20-F of Golar Partners, filed with the Commission on
March 29, 2019
, are hereby incorporated by reference and considered to be filed as part of this Annual Report on Form 20-F.
92
The following exhibits are filed as part of this Annual Report:
|
Number
|
Description of Exhibit
|
|
1.1**
|
|
|
1.2**
|
|
|
1.3**
|
|
|
1.4**
|
|
|
1.5**
|
|
|
2.1**
|
|
|
2.2**
|
|
|
4.1**
|
|
|
4.2**
|
|
|
4.3**
|
|
|
4.4**
|
|
|
4.5**
|
|
|
4.6**
|
|
|
4.7**
|
|
|
4.8**
|
|
|
4.9**
|
|
|
4.10**
|
|
|
4.11**
|
|
|
4.12**
|
|
93
|
4.13**
|
|
|
4.14**
|
|
|
4.15**
|
|
|
4.16**
|
|
|
4.17**
|
|
|
4.18**
|
|
|
4.19**
|
|
|
4.20**
|
|
|
4.21**
|
|
|
4.22**
|
|
|
4.23**
|
|
|
4.24**
|
|
|
4.25*/+
|
|
|
4.26*/+
|
|
|
8.1*
|
|
|
11.1**
|
|
|
12.1*
|
|
|
12.2*
|
|
|
13.1*
|
|
|
13.2*
|
|
|
15.1*
|
|
_________________________
*
Filed herewith.
** Incorporated by reference.
+ Certain portions have been omitted pursuant to a pending confidential treatment request. Omitted information has been separately filed with the Securities and Exchange Commission.
94
101. INS* XBRL Instance Document
101. SCH* XBRL Taxonomy Extension Schema
101. CAL* XBRL Taxonomy Extension Schema Calculation Linkbase
101. DEF* XBRL Taxonomy Extension Schema Definition Linkbase
101. LAB* XBRL Taxonomy Extension Schema Label Linkbase
101. PRE* XBRL Taxonomy Extension Schema Presentation Linkbase
95
SIGNATURES
The registrant hereby certifies that it meets all of the requirements for filing on Form 20-F and that it has duly caused and authorized the undersigned to sign this annual report on its behalf.
|
|
Golar LNG Limited
|
||
|
|
(Registrant)
|
||
|
|
|
||
|
Date
|
March 29, 2019
|
By
|
/s/ Graham Robjohns
|
|
|
|
Graham Robjohns
|
|
|
|
|
Chief Financial Officer and Deputy Chief Executive Officer
|
|
96
GOLAR LNG LIMITED
INDEX TO AUDITED CONSOLIDATED FINANCIAL STATEMENTS
|
Page
|
|
|
REPORT OF INDEPENDENT REGISTERED PUBLIC ACCOUNTING FIRM
|
|
|
CONSOLIDATED STATEMENTS OF INCOME (LOSS) FOR THE YEARS ENDED DECEMBER 31, 2018, 2017 AND 2016
|
|
|
CONSOLIDATED STATEMENTS OF COMPREHENSIVE LOSS FOR THE YEARS ENDED DECEMBER 31, 2018, 2017 AND 2016
|
|
|
CONSOLIDATED BALANCE SHEETS AS OF DECEMBER 31, 2018 AND 2017
|
|
|
CONSOLIDATED STATEMENTS OF CASH FLOWS FOR THE YEARS ENDED DECEMBER 31, 2018, 2017 AND 2016
|
|
|
CONSOLIDATED STATEMENTS OF CHANGES IN EQUITY FOR THE YEARS ENDED DECEMBER 31, 2018, 2017 AND 2016
|
|
|
NOTES TO THE AUDITED CONSOLIDATED FINANCIAL STATEMENTS
|
|
F-1
REPORT OF INDEPENDENT REGISTERED PUBLIC ACCOUNTING FIRM
To the Shareholders and the Board of Directors of Golar LNG Limited
Opinion on the Consolidated Financial Statements
We have audited the accompanying consolidated balance sheets of Golar LNG Limited (the “Company”) as of
December 31, 2018
and
2017
, the related consolidated statements of income, comprehensive loss, cash flows and changes in equity for each of the three years in the period ended
December 31, 2018
and the related notes (collectively referred to as the “consolidated financial statements”). In our opinion, the consolidated financial statements present fairly, in all material respects, the financial position of the Company at
December 31, 2018
and
2017
, and the results of its operations and its cash flows for each of the three years in the period ended
December 31, 2018
, in conformity with U.S. generally accepted accounting principles.
We also have audited, in accordance with the standards of the Public Company Accounting Oversight Board (United States) (PCAOB), the Company’s internal control over financial reporting as of
December 31, 2018
, based on criteria established in Internal Control-Integrated Framework issued by the Committee of Sponsoring Organizations of the Treadway Commission (2013 framework) and our report dated
March 29, 2019
, expressed an unqualified opinion thereon.
Basis for Opinion
These financial statements are the responsibility of the Company's management. Our responsibility is to express an opinion on the Company’s financial statements based on our audits. We are a public accounting firm registered with the PCAOB and are required to be independent with respect to the Company in accordance with the U.S. federal securities laws and the applicable rules and regulations of the Securities and Exchange Commission and the PCAOB.
We conducted our audits in accordance with the standards of the PCAOB. Those standards require that we plan and perform the audit to obtain reasonable assurance about whether the financial statements are free of material misstatement, whether due to error or fraud. Our audits included performing procedures to assess the risks of material misstatement of the financial statements, whether due to error or fraud, and performing procedures that respond to those risks. Such procedures included examining, on a test basis, evidence regarding the amounts and disclosures in the financial statements. Our audits also included evaluating the accounting principles used and significant estimates made by management, as well as evaluating the overall presentation of the financial statements. We believe that our audits provide a reasonable basis for our opinion.
|
/s/ Ernst & Young LLP
|
|
|
We have served as the Company’s auditor since 2014.
|
|
|
London, United Kingdom
|
|
|
March 29, 2019
|
|
F-2
REPORT OF INDEPENDENT REGISTERED PUBLIC ACCOUNTING FIRM
The Shareholders and Board of Directors of Golar LNG Limited
Opinion on Internal Control over Financial Reporting
We have audited Golar LNG Limited’s internal control over financial reporting as of
December 31, 2018
, based on criteria established in Internal Control-Integrated Framework issued by the Committee of Sponsoring Organizations of the Treadway Commission (2013 framework) (the COSO criteria). In our opinion, Golar LNG Limited (the “Company”) maintained, in all material respects, effective internal control over financial reporting as of
December 31, 2018
, based on the COSO criteria.
We also have audited, in accordance with the standards of the Public Company Accounting Oversight Board (United States) (PCAOB), the
2018
consolidated financial statements of the Company and our report dated
March 29, 2019
expressed an unqualified opinion thereon.
Basis for Opinion
The Company’s management is responsible for maintaining effective internal control over financial reporting, and for its assessment of the effectiveness of internal control over financial reporting included in the accompanying Management’s Annual Report on Internal Control over Financial Reporting. Our responsibility is to express an opinion on the Company’s internal control over financial reporting based on our audit. We are a public accounting firm registered with the PCAOB and are required to be independent with respect to the Company in accordance with the U.S. federal securities laws and the applicable rules and regulations of the Securities and Exchange Commission and the PCAOB.
We conducted our audit in accordance with the standards of the PCAOB. Those standards require that we plan and perform the audit to obtain reasonable assurance about whether effective internal control over financial reporting was maintained in all material respects.
Our audit included obtaining an understanding of internal control over financial reporting, assessing the risk that a material weakness exists, testing and evaluating the design and operating effectiveness of internal control based on the assessed risk, and performing such other procedures as we considered necessary in the circumstances. We believe that our audit provides a reasonable basis for our opinion.
Definition and Limitations of Internal Control Over Financial Reporting
A company’s internal control over financial reporting is a process designed to provide reasonable assurance regarding the reliability of financial reporting and the preparation of financial statements for external purposes in accordance with generally accepted accounting principles. A company’s internal control over financial reporting includes those policies and procedures that (1) pertain to the maintenance of records that, in reasonable detail, accurately and fairly reflect the transactions and dispositions of the assets of the company; (2) provide reasonable assurance that transactions are recorded as necessary to permit preparation of financial statements in accordance with generally accepted accounting principles, and that receipts and expenditures of the company are being made only in accordance with authorizations of management and directors of the company; and (3) provide reasonable assurance regarding prevention or timely detection of unauthorized acquisition, use, or disposition of the company’s assets that could have a material effect on the financial statements.
Because of its inherent limitations, internal control over financial reporting may not prevent or detect misstatements. Also, projections of any evaluation of effectiveness to future periods are subject to the risk that controls may become inadequate because of changes in conditions, or that the degree of compliance with the policies or procedures may deteriorate.
|
/s/ Ernst & Young LLP
|
|
|
London, United Kingdom
|
|
|
March 29, 2019
|
|
F-3
GOLAR LNG LIMITED
CONSOLIDATED STATEMENTS OF INCOME (LOSS) FOR THE YEARS ENDED DECEMBER 31,
2018
,
2017
AND
2016
|
(in thousands of $, except per share amounts)
|
Notes
|
2018
|
|
2017
|
|
2016
|
|
||||||
|
Time and voyage charter revenues
|
204,839
|
|
88,634
|
|
52,302
|
|
|||||||
|
Time charter revenues - collaborative arrangement
|
73,931
|
|
28,327
|
|
13,730
|
|
|||||||
|
Liquefaction services revenue
|
127,625
|
|
—
|
|
—
|
|
|||||||
|
Vessel and other management fees
|
24,209
|
|
26,576
|
|
14,225
|
|
|||||||
|
Total operating revenues
|
7, 28
|
430,604
|
|
143,537
|
|
80,257
|
|
||||||
|
|
|
|
|
|
|
||||||||
|
Vessel operating expenses
|
|
96,860
|
|
55,946
|
|
53,163
|
|
||||||
|
Voyage, charterhire and commission expenses
|
28
|
22,625
|
|
22,511
|
|
36,423
|
|
||||||
|
Voyage, charterhire and commission expenses - collaborative arrangement
|
28
|
83,201
|
|
38,781
|
|
11,140
|
|
||||||
|
Administrative expenses
|
2
|
51,542
|
|
38,031
|
|
37,302
|
|
||||||
|
Project development expenses
|
2
|
21,690
|
|
12,303
|
|
8,658
|
|
||||||
|
Depreciation and amortization
|
18
|
93,689
|
|
76,522
|
|
72,972
|
|
||||||
|
Impairment of non-current assets
|
9
|
—
|
|
—
|
|
1,706
|
|
||||||
|
Total operating expenses
|
369,607
|
|
244,094
|
|
221,364
|
|
|||||||
|
Other operating income
|
|||||||||||||
|
Other operating income
|
28, 30
|
36,722
|
|
—
|
|
—
|
|
||||||
|
Realized and unrealized gain on oil derivative instrument
|
2
|
16,767
|
|
15,100
|
|
—
|
|
||||||
|
Other operating gains - LNG trading
|
—
|
|
—
|
|
16
|
|
|||||||
|
Operating income (loss)
|
|
114,486
|
|
|
(85,457
|
)
|
|
(141,091
|
)
|
||||
|
Other non-operating expense
|
|
|
|
|
|
|
|||||||
|
Net loss on loss of control of Golar Power
|
6
|
—
|
|
—
|
|
(8,483
|
)
|
||||||
|
Other non-operating expense
|
—
|
|
(81
|
)
|
(132
|
)
|
|||||||
|
Total other non-operating expense
|
—
|
|
(81
|
)
|
(8,615
|
)
|
|||||||
|
Financial income (expense)
|
|
|
|
|
|
|
|||||||
|
Interest income
|
28
|
10,133
|
|
5,890
|
|
2,969
|
|
||||||
|
Interest expense
|
28
|
(101,908
|
)
|
(59,305
|
)
|
(71,201
|
)
|
||||||
|
(Losses) gains on derivative instruments
|
10
|
(30,541
|
)
|
20,696
|
|
16,491
|
|
||||||
|
Other financial items, net
|
10
|
(1,481
|
)
|
(69
|
)
|
(7,800
|
)
|
||||||
|
Net financial expense
|
|
(123,797
|
)
|
(32,788
|
)
|
(59,541
|
)
|
||||||
|
Loss before equity in net (losses) earnings of affiliates, income taxes and non-controlling interests
|
|
(9,311
|
)
|
(118,326
|
)
|
(209,247
|
)
|
||||||
|
Income taxes
|
11
|
(1,267
|
)
|
(1,505
|
)
|
589
|
|
||||||
|
Equity in net (losses) earnings of affiliates
|
16
|
(157,636
|
)
|
(25,448
|
)
|
47,878
|
|
||||||
|
Net loss
|
|
(168,214
|
)
|
(145,279
|
)
|
(160,780
|
)
|
||||||
|
Net income attributable to non-controlling interests
|
(63,214
|
)
|
(34,424
|
)
|
(25,751
|
)
|
|||||||
|
Net loss attributable to stockholders of Golar LNG Limited
|
(231,428
|
)
|
(179,703
|
)
|
(186,531
|
)
|
|||||||
|
Loss per share attributable to Golar LNG Ltd stockholders
Per common share amounts:
|
|
|
|
|
|
|
|||||||
|
Loss per share – basic and diluted
|
12
|
$
|
(2.30
|
)
|
$
|
(1.79
|
)
|
$
|
(1.99
|
)
|
|||
|
Cash dividends paid
|
$
|
0.28
|
|
$
|
0.20
|
|
$
|
0.60
|
|
||||
The accompanying notes are an integral part of these consolidated financial statements.
F-4
GOLAR LNG LIMITED
CONSOLIDATED STATEMENTS OF COMPREHENSIVE LOSS FOR THE YEARS ENDED DECEMBER 31, 2018,
2017
AND
2016
(in thousands of $)
|
|
Notes
|
2018
|
|
2017
|
|
2016
|
|
|||
|
COMPREHENSIVE LOSS
|
|
|
|
|||||||
|
Net loss
|
|
(168,214
|
)
|
(145,279
|
)
|
(160,780
|
)
|
|||
|
Other comprehensive income (loss):
|
|
|
|
|
|
|
||||
|
Gain (loss) associated with pensions, net of tax
|
24, 26
|
3,581
|
|
157
|
|
(556
|
)
|
|||
|
Share of affiliates comprehensive (loss) income
|
26
|
(24,324
|
)
|
1,616
|
|
3,606
|
|
|||
|
(20,743
|
)
|
1,773
|
|
3,050
|
|
|||||
|
Comprehensive loss
|
|
(188,957
|
)
|
(143,506
|
)
|
(157,730
|
)
|
|||
|
Comprehensive loss attributable to:
|
||||||||||
|
Stockholders of Golar LNG Limited
|
(252,171
|
)
|
(177,930
|
)
|
(183,481
|
)
|
||||
|
Non-controlling interests
|
63,214
|
|
34,424
|
|
25,751
|
|
||||
|
Comprehensive loss
|
(188,957
|
)
|
(143,506
|
)
|
(157,730
|
)
|
||||
(1) No tax impact for the years ended
December 31, 2018
,
2017
and
2016
.
The accompanying notes are an integral part of these consolidated financial statements.
F-5
GOLAR LNG LIMITED
(in thousands of $, except share amounts)
|
|
Notes
|
2018
|
|
2017
|
|
||
|
ASSETS
|
|
|
|||||
|
Current assets
|
|
|
|||||
|
Cash and cash equivalents
|
|
217,835
|
|
214,862
|
|
||
|
Restricted cash and short-term deposits
|
14
|
332,033
|
|
222,265
|
|
||
|
Trade accounts receivable
*
|
64,918
|
|
14,980
|
|
|||
|
Amounts due from related parties
|
28
|
9,425
|
|
7,898
|
|
||
|
Inventories
|
|
7,006
|
|
7,408
|
|
||
|
Other current assets
|
15
|
18,720
|
|
6,047
|
|
||
|
Total current assets
|
|
649,937
|
|
473,460
|
|
||
|
Non-current assets
|
|
|
|||||
|
Restricted cash
|
14
|
154,393
|
|
175,550
|
|
||
|
Investments in affiliates
|
16
|
571,782
|
|
703,225
|
|
||
|
Asset under development
|
17
|
20,000
|
|
1,177,489
|
|
||
|
Vessels and equipment, net
|
18
|
3,271,379
|
|
2,077,059
|
|
||
|
Other non-current assets
|
19
|
139,104
|
|
157,504
|
|
||
|
Total assets
|
|
4,806,595
|
|
4,764,287
|
|
||
|
LIABILITIES AND EQUITY
|
|
|
|
||||
|
Current liabilities
|
|
|
|
||||
|
Current portion of long-term debt and short-term debt
|
20
|
730,257
|
|
1,384,933
|
|
||
|
Trade accounts payable
*
|
|
9,701
|
|
70,430
|
|
||
|
Accrued expenses
*
|
21
|
133,234
|
|
105,895
|
|
||
|
Amounts due to related parties
|
28
|
5,417
|
|
8,734
|
|
||
|
Other current liabilities
|
22
|
121,529
|
|
62,282
|
|
||
|
Total current liabilities
|
|
1,000,138
|
|
1,632,274
|
|
||
|
Non-current liabilities
|
|
|
|||||
|
Long-term debt
|
20
|
1,835,102
|
|
1,025,914
|
|
||
|
Amounts due to related parties
|
28
|
—
|
|
177,247
|
|
||
|
Other non-current liabilities
|
23
|
145,564
|
|
132,548
|
|
||
|
Total liabilities
|
|
2,980,804
|
|
2,967,983
|
|
||
|
Commitments and contingencies
EQUITY
|
29, 30
|
|
|
|
|
||
|
Share capital 101,302,404 common shares of $1.00 each issued and outstanding (2017: 101,118,289)
|
25
|
101,303
|
|
101,119
|
|
||
|
Treasury shares
|
(20,483
|
)
|
(20,483
|
)
|
|||
|
Additional paid-in capital
|
1,857,196
|
|
1,538,191
|
|
|||
|
Contributed surplus
|
|
200,000
|
|
200,000
|
|
||
|
Accumulated other comprehensive loss
|
|
(28,512
|
)
|
(7,769
|
)
|
||
|
Retained losses
|
|
(364,379
|
)
|
(95,742
|
)
|
||
|
Total stockholders' equity
|
|
1,745,125
|
|
1,715,316
|
|
||
|
Non-controlling interests
|
5
|
80,666
|
|
80,988
|
|
||
|
Total equity
|
1,825,791
|
|
|
1,796,304
|
|
||
|
Total liabilities and equity
|
|
4,806,595
|
|
4,764,287
|
|
||
*
This includes amounts arising from transactions with related parties (see note 28).
The accompanying notes are an integral part of these consolidated financial statements.
F-6
GOLAR LNG LIMITED
(in thousands of $)
|
|
Notes
|
2018
|
|
2017
|
|
2016
|
|
|||
|
Operating activities
|
|
|
|
|||||||
|
Net loss
|
|
(168,214
|
)
|
(145,279
|
)
|
(160,780
|
)
|
|||
|
Adjustments to reconcile net loss to net cash provided by (used in) operating activities:
|
|
|
|
|
||||||
|
Depreciation and amortization
|
18
|
93,689
|
|
76,522
|
|
72,972
|
|
|||
|
Amortization of deferred charges and debt guarantees
|
|
7,734
|
|
(900
|
)
|
13,732
|
|
|||
|
Equity in net losses (earnings) of affiliates
|
157,636
|
|
25,448
|
|
(47,878
|
)
|
||||
|
Net loss on loss of control of Golar Power
|
6
|
—
|
|
—
|
|
8,483
|
|
|||
|
Dividends received
|
15,837
|
|
27,553
|
|
26,515
|
|
||||
|
Compensation cost related to stock options
|
|
11,481
|
|
8,991
|
|
5,816
|
|
|||
|
Net foreign exchange losses
|
|
1,997
|
|
1,620
|
|
1,429
|
|
|||
|
Change in fair value of derivative instruments
|
2
|
38,610
|
|
(24,498
|
)
|
(26,644
|
)
|
|||
|
Change in fair value of oil derivative instrument
|
2
|
9,970
|
|
(15,100
|
)
|
—
|
|
|||
|
Amortization of deferred tax benefits on intra-group transfers
|
|
—
|
|
—
|
|
(1,715
|
)
|
|||
|
Impairment of non-current assets
|
9
|
—
|
|
—
|
|
1,706
|
|
|||
|
Impairment of loan receivable
|
—
|
|
—
|
|
7,627
|
|
||||
|
Change in assets and liabilities:
|
||||||||||
|
Trade accounts receivable
|
|
(49,938
|
)
|
(11,413
|
)
|
(567
|
)
|
|||
|
Inventories
|
|
402
|
|
(151
|
)
|
987
|
|
|||
|
Other current and non-current assets
|
2
|
(13,532
|
)
|
(80,897
|
)
|
14,615
|
|
|||
|
Amounts due to related companies
|
|
(16,540
|
)
|
(27,130
|
)
|
(9,444
|
)
|
|||
|
Trade accounts payable
|
|
(24,813
|
)
|
1,593
|
|
(28,511
|
)
|
|||
|
Accrued expenses
|
|
12,191
|
|
28,666
|
|
(3,410
|
)
|
|||
|
Other current and non-current liabilities
(1)
|
2
|
40,164
|
|
99,886
|
|
9,680
|
|
|||
|
Net cash provided by (used in) operating activities
|
|
116,674
|
|
(35,089
|
)
|
(115,387
|
)
|
|||
|
Investing activities
|
||||||||||
|
Additions to vessels and equipment
|
|
(33,111
|
)
|
(1,349
|
)
|
(14,477
|
)
|
|||
|
Additions to newbuildings
|
|
—
|
|
—
|
|
(19,220
|
)
|
|||
|
Additions to asset under development
|
(116,715
|
)
|
(390,552
|
)
|
(200,821
|
)
|
||||
|
Additions to investments in affiliates
|
(95,503
|
)
|
(123,107
|
)
|
(10,200
|
)
|
||||
|
Dividends received
|
33,185
|
|
25,113
|
|
29,002
|
|
||||
|
Short-term loan granted
|
—
|
|
—
|
|
(1,000
|
)
|
||||
|
Proceeds from disposals to Golar Partners, net of cash disposed
|
6
|
9,652
|
|
70,000
|
|
107,247
|
|
|||
|
Proceeds from loss of control of Golar Power, net of cash disposed
|
6
|
—
|
|
—
|
|
113,321
|
|
|||
|
Net cash (used in) provided by investing activities
|
|
(202,492
|
)
|
(419,895
|
)
|
3,852
|
|
|||
|
Financing activities
|
|
|
|
|
||||||
|
Proceeds from short-term and long-term debt (including related parties)
|
1,177,748
|
|
928,432
|
|
405,817
|
|
||||
|
Payment for capped call in connection with bond issuance
|
—
|
|
(31,194
|
)
|
—
|
|
||||
|
Repayments of short-term and long-term debt (including related parties)
|
(994,874
|
)
|
(446,626
|
)
|
(271,858
|
)
|
||||
|
Financing costs paid
|
(1,817
|
)
|
(1,564
|
)
|
(8,372
|
)
|
||||
|
Cash dividends paid
|
(42,873
|
)
|
(20,438
|
)
|
(54,348
|
)
|
||||
|
Proceeds from exercise of share options
|
|
2,686
|
|
(1,167
|
)
|
1,435
|
|
|||
|
Purchase of treasury shares
|
—
|
|
—
|
|
(8,214
|
)
|
||||
F-7
|
Proceeds from issuance of equity
|
|
—
|
|
—
|
|
169,876
|
|
|||
|
Acquisition of non-controlling interests
|
|
36,532
|
|
—
|
|
—
|
|
|||
|
Net cash provided by financing activities
|
|
177,402
|
|
427,443
|
|
234,336
|
|
|||
|
Net increase (decrease) in cash, cash equivalents and restricted cash
|
91,584
|
|
(27,541
|
)
|
122,801
|
|
||||
|
Cash, cash equivalents and restricted cash at beginning of period
|
612,677
|
|
640,218
|
|
517,417
|
|
||||
|
Cash, cash equivalents and restricted cash at end of period
|
704,261
|
|
612,677
|
|
640,218
|
|
||||
|
Supplemental disclosure of cash flow information:
|
|
|
|
|
|
|
|
|||
|
Cash paid during the year for:
|
|
|
|
|
|
|
|
|||
|
Interest paid, net of capitalized interest
|
|
29,832
|
|
34,479
|
|
24,828
|
|
|||
|
Income taxes paid
|
|
1,469
|
|
1,240
|
|
555
|
|
|||
(1) Includes accretion of discount on convertible bonds of
$13.5 million
,
$11.8 million
and
$5.7 million
for the years ended December 31,
2018
,
2017
and
2016
, respectively.
Supplemental note to the consolidated statements of cash flows
The following table identifies the balance sheet line-items included in cash, cash equivalents and restricted cash presented in the consolidated statements of cash flows:
|
(in thousands of $)
|
2018
|
|
2017
|
|
2016
|
|
2015
|
|
|
Cash and cash equivalents
|
217,835
|
|
214,862
|
|
224,190
|
|
105,235
|
|
|
Restricted cash and short-term deposits (current portion)
|
332,033
|
|
222,265
|
|
183,693
|
|
231,821
|
|
|
Restricted cash (non-current portion)
|
154,393
|
|
175,550
|
|
232,335
|
|
180,361
|
|
|
704,261
|
|
612,677
|
|
640,218
|
|
517,417
|
|
|
F-8
GOLAR LNG LIMITED
CONSOLIDATED STATEMENTS OF CHANGES IN EQUITY FOR THE YEARS ENDED DECEMBER 31,
2018
,
2017
AND
2016
(in thousands of $)
|
Notes
|
Share Capital
|
Treasury Shares
|
Additional Paid-in Capital
|
Contributed Surplus
|
Accumulated Other Comprehensive Loss
|
Retained Earnings (Losses)
|
Non-controlling Interests
|
Total
Equity
|
|||||||||||||||||
|
Balance at December 31, 2015
|
93,547
|
|
(12,269
|
)
|
1,317,806
|
|
|
200,000
|
|
|
(12,592
|
)
|
|
308,874
|
|
|
20,813
|
|
|
1,916,179
|
|
||||
|
Net loss
|
—
|
|
—
|
|
—
|
|
—
|
|
—
|
|
(186,531
|
)
|
25,751
|
|
(160,780
|
)
|
|||||||||
|
Dividends
|
—
|
|
—
|
|
—
|
|
—
|
|
—
|
|
(18,693
|
)
|
—
|
|
(18,693
|
)
|
|||||||||
|
Exercise of share options
|
59
|
|
—
|
|
1,376
|
|
—
|
|
—
|
|
—
|
|
—
|
|
1,435
|
|
|||||||||
|
Employee stock compensation
|
—
|
|
—
|
|
7,865
|
|
—
|
|
—
|
|
—
|
|
—
|
|
7,865
|
|
|||||||||
|
Forfeiture of share options
|
—
|
|
—
|
|
(892
|
)
|
—
|
|
—
|
|
—
|
|
—
|
|
(892
|
)
|
|||||||||
|
Net proceeds from issuance of shares
|
25
|
7,475
|
|
—
|
|
162,401
|
|
—
|
|
—
|
|
—
|
|
—
|
|
169,876
|
|
||||||||
|
Other comprehensive income
|
26
|
—
|
|
—
|
|
—
|
|
—
|
|
3,050
|
|
—
|
|
—
|
|
3,050
|
|
||||||||
|
Treasury shares
|
25
|
—
|
|
(8,214
|
)
|
—
|
|
—
|
|
—
|
|
—
|
|
—
|
|
(8,214
|
)
|
||||||||
|
Balance at December 31, 2016
|
101,081
|
|
(20,483
|
)
|
1,488,556
|
|
200,000
|
|
(9,542
|
)
|
103,650
|
|
46,564
|
|
1,909,826
|
|
|||||||||
|
Net loss
|
—
|
|
—
|
|
—
|
|
—
|
|
—
|
|
(179,703
|
)
|
34,424
|
|
(145,279
|
)
|
|||||||||
|
Dividends
|
—
|
|
—
|
|
—
|
|
—
|
|
—
|
|
(19,689
|
)
|
—
|
|
(19,689
|
)
|
|||||||||
|
Exercise of share options
|
38
|
|
—
|
|
(1,204
|
)
|
—
|
|
—
|
|
—
|
|
—
|
|
(1,166
|
)
|
|||||||||
|
Employee stock compensation
|
—
|
|
—
|
|
11,098
|
|
—
|
|
—
|
|
—
|
|
—
|
|
11,098
|
|
|||||||||
|
Forfeiture of share options
|
—
|
|
—
|
|
(120
|
)
|
—
|
|
—
|
|
—
|
|
—
|
|
(120
|
)
|
|||||||||
|
Other comprehensive income
|
26
|
—
|
|
—
|
|
—
|
|
—
|
|
1,773
|
|
—
|
|
—
|
|
1,773
|
|
||||||||
|
Issuance of convertible bonds
|
20
|
—
|
|
—
|
|
39,861
|
|
—
|
|
—
|
|
—
|
|
—
|
|
39,861
|
|
||||||||
|
Balance at December 31, 2017
|
101,119
|
|
(20,483
|
)
|
1,538,191
|
|
200,000
|
|
(7,769
|
)
|
(95,742
|
)
|
80,988
|
|
1,796,304
|
|
|||||||||
|
Net loss
|
—
|
|
—
|
|
—
|
|
—
|
|
—
|
|
(231,428
|
)
|
63,214
|
|
(168,214
|
)
|
|||||||||
|
Dividends
|
—
|
|
—
|
|
—
|
|
—
|
|
—
|
|
(37,076
|
)
|
(20,882
|
)
|
(57,958
|
)
|
|||||||||
|
Exercise of share options
|
184
|
|
—
|
|
2,502
|
|
—
|
|
—
|
|
—
|
|
—
|
|
2,686
|
|
|||||||||
|
Employee stock compensation
|
—
|
|
—
|
|
14,125
|
|
—
|
|
—
|
|
(133
|
)
|
—
|
|
13,992
|
|
|||||||||
|
Forfeiture of share options
|
—
|
|
—
|
|
(2,090
|
)
|
—
|
|
—
|
|
—
|
|
—
|
|
(2,090
|
)
|
|||||||||
|
Effect of consolidating Hilli Lessor VIE
|
5
|
—
|
|
—
|
|
—
|
|
—
|
|
—
|
|
—
|
|
28,703
|
|
28,703
|
|
||||||||
|
Sale of equity interest in common units
|
6
|
—
|
|
—
|
|
304,468
|
|
—
|
|
—
|
|
—
|
|
(126,491
|
)
|
177,977
|
|
||||||||
|
Conversion of debt to equity (see note 20)
|
20
|
—
|
|
—
|
|
—
|
|
—
|
|
—
|
|
—
|
|
55,134
|
|
55,134
|
|
||||||||
|
Other comprehensive income
|
26
|
—
|
|
—
|
|
—
|
|
—
|
|
(20,743
|
)
|
—
|
|
—
|
|
(20,743
|
)
|
||||||||
|
Balance at December 31, 2018
|
101,303
|
|
(20,483
|
)
|
1,857,196
|
|
200,000
|
|
(28,512
|
)
|
(364,379
|
)
|
80,666
|
|
1,825,791
|
|
|||||||||
The accompanying notes are an integral part of these consolidated financial statements.
F-9
GOLAR LNG LIMITED
NOTES TO THE AUDITED CONSOLIDATED FINANCIAL STATEMENTS
|
1.
|
GENERAL
|
Golar LNG Limited (the "Company" or "Golar") was incorporated in Hamilton, Bermuda on May 10, 2001 for the purpose of acquiring the liquefied natural gas ("LNG") shipping interests of Osprey Maritime Limited, which was owned by World Shipholding Limited.
As of
December 31, 2018
, our fleet comprises of
12
LNG carriers,
one
Floating Storage Regasification Unit ("FSRU") and
one
Floating Liquefaction Natural Gas vessel ("FLNG"). We also operate, under management agreements, Golar LNG Partners LP's ("Golar Partners" or the "Partnership") fleet of
10
vessels and Golar Power Limited's ("Golar Power") fleet of
three
vessels. Collectively with Golar Partners and Golar Power, our combined fleet is comprised of
18
LNG carriers,
eight
FSRUs and
one
FLNG.
We are listed on the Nasdaq under the symbol: GLNG.
As used herein and unless otherwise required by the context, the terms "Golar", the "Company", "we", "our" and words of similar import refer to Golar or anyone or more of its consolidated subsidiaries, or to all such entities.
Going Concern
The financial statements have been prepared on a going concern basis.
A pre-condition of the
Golar Tundra
lease financing with CMBL (refer to note 5 "Variable Interest Entities" of our consolidated financial statements included herein) is for the FSRU to be employed under an effective charter. Under the terms of our sale and lease back facility for the
Golar Tundra
, by virtue of our prior termination of the WAGL charter, we are required to find a replacement charter by June 30, 2019
or we could be required to refinance the FSRU. Accordingly, to address our anticipated working capital requirements over the next 12 months, in the event we are unable to secure a charter for the
Golar Tundra
, we are currently exploring our refinancing options, including extension of the lenders’ deadlines for satisfaction of such. While we believe we will be able to obtain the necessary funds from these refinancings, we cannot be certain that the proposed new credit facilities will be executed in time or at all. However, we have a track record of successfully financing and refinancing our vessels, even in the absence of term charter coverage. In addition to vessel refinancings, if market and economic conditions are favorable, we may also consider further issuances of corporate debt or equity to increase liquidity.
To address our anticipated working capital requirements over the next 12 months, we remain in ongoing negotiations with financial institutions for funding the investments for our conversion projects including potential investments into our joint venture, and repayment of long-term debt balances. Sources of funding for our medium and long-term liquidity requirements include new loans, refinancing of existing financing arrangements, public and private debt or equity offerings, and potential sales of our interests in our vessel owning subsidiaries operating under long-term charters.
In February 2019, Golar entered into an agreement with BP for the charter of a FLNG unit,
Gimi
, for a
20
-year period expected to commence in the second half of 2022. LNG carrier
Gimi
has been relocated from layup to Keppel Shipyard where a site team has been assembled. Golar also entered into a Shareholders Agreement with Keppel Capital in respect of their participation in a
30%
share of the project. Total conversion works, which incorporate lessons learned from FLNG
Hilli Episeyo
including some improvements and modifications, are expected to cost approximately
$1.3 billion
. We anticipate annual contracted revenues less forecasted operating costs of approximately
$215 million
per year. Golar is in the final stages of receiving an underwritten credit commitment for a
$700 million
long-term financing facility with a syndicate of international banks that will also be available during construction.
Accordingly, we believe that, based on our plans as outlined above, we will have sufficient facilities to meet our anticipated liquidity requirements for our business for at least the next 12 months as of
March 29, 2019
and that our working capital is sufficient for our present requirements. While we cannot be certain of execution or timing of all or any of the above financings, we are confident of our ability to do so.We have performed stress testing of our forecast cash reserves under various theoretical scenarios, which include assumptions such as extremely prudent revenue contributions from our fleet, full operating costs and maintaining our dividend payments based on our most recent pay out, and accordingly are confident of our ability to manage through the near term cash requirements.
F-10
|
2.
|
BASIS OF PREPARATION AND SIGNIFICANT ACCOUNTING POLICIES
|
Basis of preparation
These consolidated financial statements are prepared in accordance with accounting principles generally accepted in the United States of America ("U.S. GAAP").
The accounting policies set out below have been applied consistently to all periods in these consolidated financial statements, unless otherwise noted.
Principles of consolidation
A variable interest entity ("VIE") is defined by the accounting standard as a legal entity where either (a) equity interest holders as a group lack the characteristics of a controlling financial interest, including decision making ability and an interest in the entity's residual risks and rewards, or (b) the equity holders have not provided sufficient equity investment to permit the entity to finance its activities without additional subordinated financial support, or (c) the voting rights of some investors are not proportional to their obligations to absorb the expected losses of the entity, their rights to receive the expected residual returns of the entity, or both and substantially all of the entity's activities either involve or are conducted on behalf of an investor that has disproportionately few voting rights. A party that is a variable interest holder is required to consolidate a VIE if the holder has both (a) the power to direct the activities that most significantly impact the entity's economic performance and (b) the obligation to absorb losses that could potentially be significant to the VIE or the right to receive benefits from the VIE that could potentially be significant to the VIE.
The accompanying consolidated financial statements include the financial statements of the entities listed in notes 4 and 5.
Investments in entities in which we directly or indirectly hold more than
50%
of the voting control are consolidated in the financial statements, as well as certain variable interest entities in which the Company is deemed to be subject to a majority of the risk of loss from the VIE's activities or entitled to receive a majority of the entity's residual returns, or both. All inter-company balances and transactions are eliminated. The non-controlling interests of the above-mentioned subsidiaries were included in the consolidated balance sheets and statements of income as "Non-controlling interests".
Changes in our ownership interest while we retain a controlling financial interest in a subsidiary are accounted for as equity transactions. The carrying amount of the non-controlling interest is adjusted to reflect our changed ownership interest, with any difference between the fair value of consideration and the amount of the adjusted non-controlling interest being recognized in equity.
We recognize a gain or loss when a subsidiary issues its stock to third parties at a price per share in excess or below its carrying value resulting in a reduction in our ownership interest in the subsidiary. The gain or loss is recorded in the line "Additional paid-in capital".
When a consolidated subsidiary issues preferred stock, they are classified as equity. Preferred stock issued by a consolidated subsidiary to non-controlling interests are recorded as non-controlling interests for the amount of the proceeds received upon issuance.
Foreign currencies
Our functional currency is the U.S. dollar as the majority of the revenues are received in U.S. dollars and a majority of our expenditures are incurred in U.S. dollars. Our reporting currency is U.S. dollars. Transactions in foreign currencies during the year are translated into U.S. dollars at the exchange rates in effect at the date of the transaction. Monetary assets and liabilities are translated using exchange rates at the balance sheet date. Non-monetary assets and liabilities are translated using historical exchange rates. Foreign currency transaction and translation gains or losses are included in the consolidated balance sheets and consolidated statements of income.
F-11
Use of estimates
The preparation of financial statements in accordance with US GAAP requires that management make estimates and assumptions affecting the reported amounts of assets and liabilities and disclosure of contingent assets and liabilities at the date of the financial statements and the reported amounts of revenues and expenses during the reporting period. Actual results could differ from those estimates.
As of
December 31, 2018
, we leased
eight
vessels from wholly-owned special purpose vehicles ("Lessor SPVs") of financial institutions in connection with our sale and leaseback transactions. While we do not hold any equity investments in these Lessor SPVs, we have determined that we are the primary beneficiary of these entities and, accordingly, we are required to consolidate these VIEs into our financial results. The key line items impacted by our consolidation of these VIEs are short-term and long-term debt, restricted cash and short-term deposits, non-controlling interests, interest income and interest expense. In consolidating these lessor VIEs, on a quarterly basis, we must make assumptions regarding (i) the debt amortization profile; (ii) the interest rate to be applied against the VIEs’ debt principal; and (iii) the VIE's application of cash receipts. Our estimates are therefore dependent upon the timeliness of receipt and accuracy of financial information provided by these lessor VIE entities. Upon receipt of the audited annual financial statements of the lessor VIEs, we will make a true-up adjustment for any material differences.
In assessing the recoverability of our vessels’ carrying amounts, we make assumptions regarding estimated future cash flows, estimates in respect of residual or scrap value, charter rates, ship operating expenses, utilization and drydocking requirements.
In relation to the oil derivative instrument (see note 27), the fair value was determined using the estimated discounted cash flows of the additional payments due to us as a result of oil prices moving above a contractual oil price floor over the term of the liquefaction tolling agreement ("LTA"). Significant inputs used in the valuation of the oil derivative instrument include management’s estimate of an appropriate discount rate and the length of time to blend the long-term and the short-term oil prices obtained from quoted prices in active markets. The changes in fair value of our oil derivative instrument is recognized in each period in current earnings in "Realized and unrealized gain on oil derivative instrument".
The realized and unrealized gain on oil derivative instrument is as follows:
|
(in thousands of $)
|
Year Ended
December 31, |
|||
|
2018
|
|
2017
|
|
|
|
Realized gain on oil derivative instrument
|
26,737
|
|
—
|
|
|
Unrealized (loss) gain on oil derivative instrument
|
(9,970
|
)
|
15,100
|
|
|
16,767
|
|
15,100
|
|
|
The unrealized gain results from movement in oil prices above a contractual floor price over term of the LTA; the realized gain results from monthly billings above the base tolling fee under the LTA.
Fair value measurements
We account for fair value measurement in accordance with the accounting standards guidance using fair value to measure assets and liabilities. The guidance provides a single definition of fair value, together with a framework for measuring it, and requires additional disclosure about the use of fair value to measure assets and liabilities.
Revenue and related expense recognition
Time charter agreements
Revenues include minimum lease payments under time charters, fees for positioning and repositioning vessels, and gross pool revenues. Revenues generated from time charters, which we generally classify as operating leases, are recorded over the term of the charter as service is provided. However, we do not recognize revenue if a charter has not been contractually committed to by a customer and ourselves, even if the vessel has discharged its cargo and is sailing to the anticipated load port on its next voyage. Initial direct costs (those directly related to the negotiation and consummation of the lease) are deferred and allocated to earnings over the lease term. Rental income and expense are amortized over the lease term on a straight-line basis.
F-12
Repositioning fees (included in time and voyage charter revenues) received in respect of time charters are recognized at the end of the charter when the fee becomes fixed and determinable. However, where there is a fixed amount specified in the charter, which is not dependent upon redelivery location, the fee will be recognized evenly over the term of the charter.
Under time charters, voyage expenses are generally paid by our customers. Voyage related expenses, principally fuel, may also be incurred when positioning or repositioning the vessel before or after the period of time charter and during periods when the vessel is not under charter or is offhire, for example when the vessel is undergoing repairs. These expenses are recognized as incurred.
Vessel operating expenses, which are recognized when incurred, include crewing, repairs and maintenance, insurance, stores, lube oils, communication expenses and third party management fees. Bunkers consumption represents mainly bunkers consumed during unemployment and off-hire.
Liquefaction services revenue
Liquefaction services revenue is generated from a LTA entered into with our customer. Our provision of liquefaction services capacity includes the receipt of the customer’s gas, treatment and temporary storage on board our FLNG, and delivery of LNG to waiting carriers.
The liquefaction services capacity provided to our customer is considered a single performance obligation recognized evenly over time as our services are rendered. We consider our services a series of distinct services that are substantially the same and have the same pattern of transfer to our customer.
Contractual payment terms for liquefaction services is monthly in arrears, after services have been provided, generally resulting in the recognition of contract assets. Contract assets are regularly assessed for impairment. Contract liabilities arise when the customer makes payments in advance of receiving services. The term between when invoicing and when payment is due is not significant.
We recognize revenue when obligations under the terms of our contract are satisfied. We have applied the practical expedient to recognize liquefaction services revenue in proportion to the amount we have the right to invoice.
Management fees
Management fees are generated from commercial and technical vessel-related services and corporate and administrative services. Commercial and technical vessel-related services include vessel maintenance, providing vessel crew, making arrangements for vessel insurance, bunkering, provisions and stores, invoicing and collecting vessel hire. Corporate and administrative services include corporate services, group accounting, treasury, legal, tax, consultancy and other administrative services.
These services are provided to our customers Golar Partners and Golar Power. Our contracts generally have an initial contract term of one year or less, after which the arrangement continues with a short notice period to end the contract, ranging from 30 days to 180 days. Our management services provided are considered a single performance obligation recognized evenly over time as our services are rendered. We consider our services a series of distinct services that are substantially the same and have the same pattern of transfer to the customer.
Contractual payment terms for management fees generally allow for billing and payment in advance of services being provided. However, contract liabilities did not arise because there was no billing in recognition for services rendered in future periods at the reporting date. Contract assets arise when we render management services in advance of receiving payment from our customers. Contract assets are regularly assessed for impairment.
The transaction price is generally considered variable consideration given the key driver of consideration is actual costs incurred in a given period, which varies each period according to activity levels. The entire amount of the transaction price is allocated to the single performance obligation identified.
We recognize revenue when obligations under the terms of our contracts with our customers are satisfied. We have applied the practical expedient to recognize management fee revenue in proportion to the amount we have the right to invoice.
F-13
Cool Pool
Pool revenues and expenses under the Cool Pool arrangement have been accounted for in accordance with the guidance for collaborative arrangements.
In relation to our vessels participating within the pool, voyage expenses and commissions from collaborative arrangements include an allocation of our net results from the pool to the other participants. Each participants' share of the net pool revenues is based on the number of pool points attributable to its vessels and the number of days such vessels participated in the pool.
We have presented our share of the net income earned under the Cool Pool arrangement across a number of line items in the income statement. For net revenues and expenses incurred relating specifically to Golar’s vessels, and for which we are deemed the principal, these will be presented gross on the face of the income statement in the line items "Time and voyage charter revenues" and "Voyage, charterhire and commission expenses". For pool net revenues generated by the other participants in the pooling arrangement, these will be presented separately in revenue and expenses from collaborative arrangements. Refer to note 28 for an analysis of the income statement effect for the pooling arrangement.
Project development expenses
With effect from the year ended December 31, 2018, we presented a new line item in operating expenses on the face of the statements of income. The new line item, "Project development expenses", includes the costs associated with pursuing future contracts and developing our pipeline of activities that have not met our internal threshold for capitalization. Previously, these costs were presented within "Administrative expenses" along with our general overhead costs. We believe that the introduction of this new line item in the statements of income provides users of our financial statements greater transparency over a key element of our business. This presentation change has been retrospectively restated in prior periods. The change in presentation for the years ended December 31, 2017 and 2016 are as follows:
|
(in thousands of $)
|
As previously reported
|
Adjustments (decrease) increase
|
As adjusted
|
|||
|
December 31, 2016
|
||||||
|
Administrative expenses
|
45,960
|
|
(8,658
|
)
|
37,302
|
|
|
Project development expenses
|
—
|
|
8,658
|
|
8,658
|
|
|
December 31, 2017
|
||||||
|
Administrative expenses
|
50,334
|
|
(12,303
|
)
|
38,031
|
|
|
Project development expenses
|
—
|
|
12,303
|
|
12,303
|
|
Cash and cash equivalents
We consider all demand and time deposits and highly liquid investments with original maturities of three months or less to be equivalent to cash.
Restricted cash and short-term deposits
Restricted cash consists of bank deposits which may only be used to settle certain pre-arranged loans, bid bonds in respect of tenders for projects we have entered into, cash collateral required for certain swaps, and other claims which require us to restrict cash.
Short-term deposits represent highly liquid deposits placed with financial institutions, primarily from our consolidated VIEs, which are readily convertible into known amounts of cash with original maturities of less than 12 months.
Trade accounts receivables
Trade receivables are presented net of allowances for doubtful balances. At each balance sheet date, all potentially uncollectible accounts are assessed individually for purposes of determining the appropriate provision for doubtful accounts.
F-14
Inventories
Inventories, which are comprised principally of fuel, lubricating oils and vessel spares, are stated at the lower of cost and net realizable value. Cost is determined on a first-in, first-out basis.
Investments in affiliates
Affiliates are entities over which we generally have between 20% and 50% of the voting rights, or over which we have significant influence, but over which we do not exercise control or have the power to control the financial and operational policies. Investments in these entities are accounted for by the equity method of accounting. This also extends to entities in which we hold a majority ownership interest, but we do not control, due to the participating rights of non-controlling interests. Under this method, we record our investment in the affiliate at cost (or fair value if a consequence of deconsolidation), and adjust the carrying amount for our share of the earnings or losses of the affiliate subsequent to the date of the investment and report the recognized earnings or losses in income. Dividends received from an affiliate reduce the carrying amount of the investment. The excess, if any, of the purchase price over book value of our investments in equity method affiliates, or basis difference, is included in the consolidated balance sheets as "Investments in affiliates". We allocate the basis difference across the assets and liabilities of the affiliate, with the residual assigned to goodwill. Any negative goodwill is recognized immediately in the income statement as a gain on bargain purchase. The basis difference will then be amortized through the consolidated statements of income as part of the equity method of accounting. When our share of losses in an affiliate equals or exceeds its interest, we do not recognize further losses, unless we have incurred obligations or made payments on behalf of the affiliate.
We recognize gains and losses in earnings for the issuance of shares by our affiliates, provided that the issuance of such shares qualifies as a sale of such shares.
Cost method investments
Cost method investments are initially recorded at cost and reviewed for impairment whenever events or changes in circumstances indicate that the carrying amount of an asset may not be recoverable. Dividends received from cost method investments are recorded in the consolidated statements of income in the line item "Dividend income".
Vessels and equipment
Vessels and equipment are stated at cost less accumulated depreciation. The cost of vessels and equipment, less the estimated residual value, is depreciated on a straight-line basis over the assets' remaining useful economic lives. Management estimates the residual values of our vessels based on a scrap value cost of steel and aluminum times the weight of the ship noted in lightweight ton. Residual values are periodically reviewed and revised to recognize changes in conditions, new regulations or other reasons.
The cost of building mooring equipment is capitalized and depreciated over the initial lease term of the related agreement.
Refurbishment costs incurred during the period are capitalized as part of vessels and equipment and depreciated over the vessels' remaining useful economic lives. Refurbishment costs are costs that appreciably increase the capacity, or improve the efficiency or safety of vessels and equipment.
Drydocking expenditures are capitalized when incurred and amortized over the period until the next anticipated drydocking, which is generally
five
years. For vessels that are newly built or acquired, we have adopted the "built-in overhaul" method of accounting. The built-in overhaul method is based on the segregation of vessel costs into those that should be depreciated over the useful life of the vessel and those that require drydocking at periodic intervals to reflect the different useful lives of the components of the assets. The estimated cost of the drydocking component is amortized until the date of the first drydocking following acquisition, upon which the cost is capitalized and the process is repeated. When a vessel is disposed, any unamortized drydocking expenditure is charged against income in the period of disposal.
Vessel reactivation costs incurred on vessels leaving lay-up include both costs of a capital and expense nature. The capital costs include the addition of new equipment or modifications to the vessel which enhance or increase the operational efficiency and functionality of the vessel. These expenditures are capitalized and depreciated over the remaining useful life of the vessel. Expenditures of a routine repairs and maintenance nature that do not improve the operating efficiency or extend the useful lives of the vessels are expensed as incurred as mobilization costs.
F-15
Useful lives applied in depreciation are as follows:
|
Vessels (excluding converted FSRUs and FLNG)
|
40 years
|
|
Vessels - converted FSRUs
|
20 years from conversion date
|
|
Vessels - FLNG
|
30 years from conversion date
|
|
Drydocking expenditure
|
5 years
|
|
Deferred drydocking expenditure - FLNG
|
20 years
|
|
Mooring equipment - FLNG
|
8 years
|
|
Office equipment and fittings
|
3 to 6 years
|
Asset under development
An asset is classified as asset under development when there is a firm commitment from us to proceed with the construction of the asset and the likelihood of conversion is virtually certain to occur. An asset under development is classified as non-current and is stated at cost. All costs incurred during the construction of the asset, including conversion installment payments, interest, supervision and technical costs are capitalized. Interest costs directly attributable to construction of the asset is added to the cost of the asset. Capitalization ceases, and depreciation commences, once the asset is completed and available for its intended use.
Interest costs capitalized
Interest is capitalized on all qualifying assets that require a period of time to get them ready for their intended use. Qualifying assets consist of vessels under construction, assets under development and vessels undergoing conversion into FSRUs or FLNGs for our own use. In addition, certain equity method investments may be considered qualifying assets prior to commencement of their planned principal operation. The interest capitalized is calculated using the rate of interest on the loan to fund the expenditure or our weighted average cost of borrowings, where appropriate, from commencement of the asset development until substantially all the activities necessary to prepare the assets for its intended use are complete.
If our financing plans associate a specific borrowing with a qualifying asset, we use the rate on that borrowing as the capitali
z
ation rate to be applied to that portion of the average accumulated expenditures for the asset provided that does not exceed the amount of that borrowing. We do not capitali
z
e amounts beyond the actual interest expense incurred in the period.
Asset retirement obligation
An asset retirement obligation, or ARO, is a liability associated with the eventual retirement of a fixed asset.
The fair value of an ARO is recorded as a liability in the period when the obligation arises. The fair value of the ARO is measured using expected future discounted cash outflows. When the liability is recognized, we also capitalize the related ARO cost by adding it to the carrying amount of the related fixed asset. Each period, the liability is increased for the change in its present value. Changes in the amount or timing of the estimated ARO are recorded as an adjustment to the related liability and asset.
Held-for-sale assets and disposal group
Individual assets or subsidiaries to be disposed of, by sale or otherwise in a single transaction, are classified as held-for-sale if all of the following criteria are met at the period end:
|
•
|
Management, having the authority to approve the action, commits to a plan to sell the assets or subsidiaries;
|
|
•
|
The asset or subsidiaries are available for immediate sale in its present condition subject only to terms that are usual and customary for such sales;
|
|
•
|
An active program to locate a buyer and other actions required to complete the plan to sell have been initiated;
|
|
•
|
The sale is probable; and
|
|
•
|
The transfer is expected to qualify for recognition as a completed sale, within one year.
|
The term probable refers to a future sale that is likely to occur, the asset or subsidiaries (disposal group) is being actively marketed for sale at a price that is reasonable in relation to its current fair value and actions required to complete the plan indicate that it is unlikely that significant changes to the plan will be made or that the plan will be withdrawn.
F-16
A disposal group is classified as discontinued operations if the following criteria are met: (1) a component of an entity or group of components that has been disposed of by sale, disposed of other than by sale or is classified as held-for-sale that represents a strategic shift that has or will have a major effect on our financial results or (2) an acquired business or non-profit activity (the entity to be sold) that is classified as held-for-sale on the date of the acquisition.
Assets or subsidiaries held-for-sale are carried at the lower of their carrying amount and fair value less costs to sell. Interest and other expenses attributable to the liabilities of a disposal group classified as held-for-sale shall continue to be accrued. On classification as held-for-sale, the assets are no longer depreciated.
If, at any time, the criteria for held-for-sale is no longer met, then the asset or disposal group will be reclassified to held and used. The asset or disposal group will be valued at the lower of the carrying amount before the asset or disposal group was classified as held-for-sale (as adjusted for any subsequent depreciation and amortization), and its fair value. Any adjustment to the value is shown in consolidated statements of income for the period in which the criterion for held-for-sale was not met.
Impairment of long-lived assets
We continually monitor events and changes in circumstances that could indicate carrying amounts of long-lived assets may not be recoverable. In assessing the recoverability of our vessels’ carrying amounts, we make assumptions regarding estimated future cash flows and estimates in respect of residual or scrap value. When such events or changes in circumstances are present, we assess the recoverability of long-lived assets by determining whether the carrying value of such assets will be recovered through undiscounted expected future cash flows. If the total of the future cash flows is less than the carrying amount of those assets, we recognize an impairment loss based on the excess of the carrying amount over the lower of the fair market value of the assets, less cost to sell, and the net present value ("NPV") of estimated future undiscounted cash flows from the employment of the asset ("value-in-use").
Other-than-temporary impairment of investments
Where there are indicators that fair value is below carrying value of our investments, we will evaluate these for other-than-temporary impairment. Consideration will be given to (1) the length of time and the extent to which fair value is below carrying value, (2) the financial condition and near-term prospects of the investee, and (3) our intent and ability to hold the investment until any anticipated recovery. Where determined to be other-than-temporary impairment, we will recognize an impairment loss in the period in the line item "Equity in net (losses) earnings of affiliates" the consolidated statements of income.
Deferred charges
Costs associated with long-term financing, including debt arrangement fees, are deferred and amortized over the term of the relevant loan under the effective interest method. Amortization of debt issuance costs is included in interest expense. These costs are presented as a deduction from the corresponding liability, consistent with debt discounts.
Derivatives
We use derivatives to reduce market risks associated with our operations. We use interest rate swaps for the management of interest rate risk exposure. The interest rate swaps effectively convert a portion of our debt from a floating to a fixed rate over the life of the transactions without an exchange of underlying principal.
We seek to reduce our exposure to fluctuations in foreign exchange rates through the use of foreign currency forward contracts.
From time to time, we enter into equity swaps. Under these facilities, we swap with our counterparty (usually a major bank) the risk of fluctuations in our share price and the benefit of any dividends, for a fixed payment of LIBOR plus margin. The counterparty may acquire shares in the Company to hedge its own position.
F-17
All derivative instruments are initially recorded at fair value as either assets or liabilities in the accompanying consolidated balance sheets and subsequently remeasured to fair value, regardless of the purpose or intent for holding the derivative. Where the fair value of a derivative instrument is a net liability, the derivative instrument is classified in "Other current liabilities" and "Other non-current liabilities", as appropriate, in the consolidated balance sheets. Where the fair value of a derivative instrument is a net asset, the derivative instrument is classified in "Other current assets" and "Other non-current assets", as appropriate, in the consolidated balance sheets. The changes in fair value of derivative financial instruments (excluding the oil derivative instrument) are recognized each period in current earnings in "(Losses) gains on derivative instruments" in the consolidated statements of income. We do not apply hedge accounting.
The fair value of the oil derivative instrument was determined using the estimated discounted cash flows of the additional payments due to us as a result of oil prices moving above a contractual oil price floor over the term of the LTA. Significant inputs used in the valuation of the oil derivative instrument include management’s estimate of an appropriate discount rate and the length of time to blend the long-term and the short-term oil prices obtained from quoted prices in active markets. The changes in fair value of our oil derivative instrument is recognized in each period in current earnings in "Realized and unrealized gain on oil derivative instrument".
Cash flows from economic hedges are classified in the same category as the items subject to the economic hedging relationship.
Changes in presentation of fair value of derivative instruments and oil derivative instrument
With effect from the year ended December 31, 2018, we presented two new line items in operating activities on the face of the statements of cashflows. Given the significance of the oil derivative instrument in current year, we believe that the introduction of this new line item in the statements of cashflows provides users of our financial statements greater transparency over a key element of our business. This presentation change has been retrospectively restated in prior periods. The change in presentation for the years ended
December 31, 2017
and 2016 are as follows:
|
(in thousands of $)
|
As previously reported
|
Adjustments (decrease) increase
|
As adjusted
|
|||
|
December 31, 2016
|
||||||
|
Change in fair value of derivative instruments
|
—
|
|
(26,644
|
)
|
(26,644
|
)
|
|
Change in assets and liabilities:
|
||||||
|
Other current and non-current assets
|
14,924
|
|
(309
|
)
|
14,615
|
|
|
Other current and non-current liabilities
|
(17,273
|
)
|
26,953
|
|
9,680
|
|
|
December 31, 2017
|
||||||
|
Change in fair value of derivative instruments
|
—
|
|
(24,498
|
)
|
(24,498
|
)
|
|
Change in assets and liabilities:
|
||||||
|
Other current and non-current assets
|
(102,453
|
)
|
21,556
|
|
(80,897
|
)
|
|
Change in fair value of oil derivative instrument
|
—
|
|
(15,100
|
)
|
(15,100
|
)
|
|
Other current and non-current liabilities
|
81,844
|
|
18,042
|
|
99,886
|
|
(Losses) gains on derivative instruments
With effect from the year ended December 31, 2018, we presented a new line item under financial income (expense) on the face of the statements of income. The new line item, "(Losses) gains on derivative instruments", includes the movement of our derivative instruments. Previously, these items were presented within "Other financial items, net" along with our general finance costs. We believe that the introduction of this new line item in the statements of income provides users of our financial statements greater transparency over a key element of our business. This presentation change has been retrospectively restated in prior periods. The change in presentation for the years ended
December 31, 2017
and 2016 are as follows:
F-18
|
(in thousands of $)
|
As previously reported
|
Adjustments decrease
|
As adjusted
|
|||
|
December 31, 2016
|
||||||
|
Gains (losses) on derivative instruments
|
—
|
|
16,491
|
|
16,491
|
|
|
Other financial items, net
|
8,691
|
|
(16,491
|
)
|
(7,800
|
)
|
|
December 31, 2017
|
||||||
|
Gains (losses) on derivative instruments
|
—
|
|
20,696
|
|
20,696
|
|
|
Other financial items, net
|
20,627
|
|
(20,696
|
)
|
(69
|
)
|
Convertible bonds
We account for debt instruments with convertible features in accordance with the details and substance of the instruments at the time of their issuance. For convertible debt instruments issued at a substantial premium to equivalent instruments without conversion features, or those that may be settled in cash upon conversion, it is presumed that the premium or cash conversion option represents an equity component.
Accordingly, we determine the carrying amounts of the liability and equity components of such convertible debt instruments by first determining the carrying amount of the liability component by measuring the fair value of a similar liability that does not have an equity component. The carrying amount of the equity component representing the embedded conversion option is then determined by deducting the fair value of the liability component from the total proceeds from the issue. The resulting equity component is recorded, with a corresponding offset to debt discount which is subsequently amortized to interest cost using the effective interest method over the period the debt is expected to be outstanding as an additional non-cash interest expense. Transaction costs associated with the instrument are allocated pro-rata between the debt and equity components.
For conventional convertible bonds which do not have a cash conversion option or where no substantial premium is received on issuance, it may not be appropriate to separate the bond into the liability and equity components.
Provisions
In the ordinary course of business, we are subject to various claims, lawsuits and complaints. Management, in consultation with internal and external advisers, will provide for a contingent loss in the financial statements if the contingency had occurred at the date of the financial statements and the likelihood of loss was probable and the amount can be reasonably estimated. If we determine that the reasonable estimate of the loss is a range and there is no best estimate within the range, we will provide the lower amount within the range.
Pensions
Defined benefit pension costs, assets and liabilities requires adjustment of the significant actuarial assumptions annually to reflect current market and economic conditions. Our accounting policy states that full recognition of the funded status of defined benefit pension plans is to be included within our consolidated balance sheets. The pension benefit obligation is calculated by using a projected unit credit method.
Defined contribution pension costs represent the contributions payable to the scheme in respect of the accounting period and are recorded in the consolidated statements of income.
Guarantees
Guarantees issued by us, excluding those that are guaranteeing our own performance, are recognized at fair value at the time that the guarantees are issued, or upon the deconsolidation of a subsidiary, and reported in "Other non-current liabilities". A liability is an amount equal to the fair value of the obligation undertaken in issuing the guarantee is recognized. If it becomes probable that we will have to perform under a guarantee, we will recognize an additional liability if the amount of the loss can be reasonably estimated. The recognition of fair value is not required for certain guarantees such as the parent's guarantee of a subsidiary's debt to a third party. For those guarantees excluded from the above guidance requiring the fair value recognition provision of the liability, financial statement disclosures of such items are made.
F-19
Treasury shares
Treasury shares are recognized as a separate component of equity at cost. Upon subsequent disposal of treasury shares, any consideration is recognized directly in equity.
Stock-based compensation
We expense the fair value of stock options issued to employees and non-employees over the period the options vest. We amortize stock-based compensation for awards on a straight-line basis over the period during which the individuals are required to provide service in exchange for the reward - the requisite service (vesting) period. No compensation cost is recognized for stock options for which the individuals do not render the requisite service. The fair value of share options is estimated using the Black-Scholes option pricing model.
Earnings per share
Basic earnings per share ("EPS") is computed based on the income available to common stockholders and the weighted average number of shares outstanding for basic EPS. Treasury shares are not included in the calculation. Diluted EPS includes the effect of the assumed conversion of potentially dilutive instruments. Such potentially dilutive common shares are excluded when the effect would be to increase earnings per share or reduce a loss per share.
Leases as lessee
Rentals under operating leases where we are the lessee are recognized as an operating expense evenly over the lease term. Contingent rentals are recognized as an operating expense when incurred. The useful life of any leasehold improvements is limited to the shorter of the lease term or economic life of the leased asset. Lease incentives, uneven payments and initial direct costs are recognized evenly over the lease term. Agreements which include renewal options are included in the lease term when considered reasonably assured.
Income taxes
Income taxes are based on a separate return basis. The guidance on "Income Taxes" prescribes a recognition threshold and measurement attributes for the financial statement recognition and measurement of a tax position taken or expected to be taken in a tax return.
Deferred tax assets and liabilities are recognized principally for the expected tax consequences of temporary differences between the tax bases of assets and liabilities and their reported amounts. Deferred tax assets are reduced by a valuation allowance when, in the opinion of management, it is more likely than not that some portion or all of the deferred tax assets will not be realized. Realization of the deferred income tax asset is dependent on generating sufficient taxable income in future years.
Deferred tax assets and liabilities are measured at the tax rates that are expected to apply to the year when the asset is realized or the liability is settled, based on the tax rates and tax laws that have been enacted or substantively enacted at the balance sheet date. Income tax relating to items recognized directly in the statement of comprehensive income is recognized in the statement of changes in equity and not in the consolidated statements of income.
Penalties and interest related to uncertain tax positions are recognized in “Income taxes” in the consolidated statements of income.
Related parties
Parties are related if one party has the ability, directly or indirectly, to control the other party or exercise significant influence over the other party in making financial and operating decisions. Parties are also related if they are subject to common control or significant influence.
Segment reporting
A segment is a distinguishable component of the business that is engaged in business activities from which we earn revenues and incur expenses whose operating results are regularly reviewed by the chief operating decision maker, and which are subject to risks and rewards that are different from those of other segments. We have identified
three
reportable industry segments: vessel operations, FLNG and Power.
F-20
|
3.
|
RECENTLY ISSUED ACCOUNTING STANDARDS
|
Adoption of new accounting standards
In May 2014, the Financial Accounting Standards Board (the “FASB”) issued ASC 606 and subsequent amendments (Topic 606). The standard provides a single, comprehensive revenue recognition model and requires an entity to recognize revenue to depict the transfer of promised goods or services to customers in an amount that reflects the consideration to which the entity expects to be entitled in exchange for those goods or services. We adopted this guidance on January 1, 2018, under a modified retrospective approach - see note 8 for further details. The adoption of this guidance impacts presentation and disclosure of our management fee revenue only, there is no impact to recognition or measurement.
In January 2016, the FASB issued ASU 2016-01
Financial Instruments-Overall (Subtopic 825-10)
:
Recognition and Measurement of Financial Assets and Financial Liabilities
, which made targeted improvements to the recognition, measurement, presentation and disclosure of financial instruments. We adopted the amendments to this ASU on January 1, 2018 under a modified retrospective approach except for equity securities without a determinable fair value, for which a prospective approach is prescribed. The adoption of this ASU did not have a material impact on the consolidated financial statements.
In August 2016, the FASB issued ASU 2016-15
Statement of Cash Flows (Topic 230)
:
Classification of Certain Cash Receipts and Cash Payments
, which provides guidance on the disclosure and classification of certain items within the statements of cash flows. We adopted this ASU on January 1, 2018 under a retrospective approach, resulting in presentational changes to our consolidated statements of cash flows. Following the adoption of the amendments to ASC 230, we have made an accounting policy election to classify distributions received from equity method investees using the "cumulative earnings approach" and, as a result, certain of the dividends received have been retrospectively reclassified, where required, as cash inflows from investing activities. We reclassified
$25.1 million
and
29.0 million
for the years ended December 31, 2017 and 2016, respectively.
In November 2016, the FASB issued ASU 2016-18
Statement of Cash Flows (Topic 230): Restricted Cash
, which requires that restricted cash be included with cash and cash equivalents when reconciling the beginning-of-period and end-of-period total amounts presented on the statements of cash flows. We adopted this ASU on January 1, 2018 under a retrospective approach, resulting in presentational changes to our consolidated statements of cash flows and related disclosures. The adoption changed how restricted cash is reported in the consolidated statements of cash flows as follows for the twelve months ended December 31, 2017 and 2016:
F-21
|
(in thousands of $)
|
Cash flow line item
|
As previously reported
|
Adjustments decrease
|
As adjusted
|
|||
|
December 31, 2016
|
|||||||
|
OPERATING ACTIVITIES
|
Restricted cash and short-term deposits
|
47,834
|
|
(47,834
|
)
|
—
|
|
|
INVESTING ACTIVITIES
|
Restricted cash and short-term deposits
|
22,928
|
|
(22,928
|
)
|
—
|
|
|
FINANCING ACTIVITIES
|
Restricted cash and short-term deposits
|
(74,608
|
)
|
74,608
|
|
—
|
|
|
As a result of the above changes, the following subtotals as retrospectively restated are as follows:
|
|||||||
|
Net (decrease) increase in cash, cash equivalents and restricted cash
|
118,955
|
|
3,846
|
|
122,801
|
|
|
|
Cash, cash equivalents and restricted cash at beginning of period
|
105,235
|
|
412,182
|
|
517,417
|
|
|
|
Cash, cash equivalents and restricted cash at end of period
|
224,190
|
|
416,028
|
|
640,218
|
|
|
|
December 31, 2017
|
|||||||
|
OPERATING ACTIVITIES
|
Restricted cash and short-term deposits
|
57,110
|
|
(57,110
|
)
|
—
|
|
|
INVESTING ACTIVITIES
|
Restricted cash and short-term deposits
|
11,239
|
|
(11,239
|
)
|
—
|
|
|
FINANCING ACTIVITIES
|
Restricted cash and short-term deposits
|
(50,136
|
)
|
50,136
|
|
—
|
|
|
As a result of the above changes, the following subtotals as retrospectively restated are as follows:
|
|||||||
|
Net (decrease) increase in cash, cash equivalents and restricted cash
|
(9,328
|
)
|
(18,213
|
)
|
(27,541
|
)
|
|
|
Cash, cash equivalents and restricted cash at beginning of period
|
224,190
|
|
416,028
|
|
640,218
|
|
|
|
Cash, cash equivalents and restricted cash at end of period
|
214,862
|
|
397,815
|
|
612,677
|
|
|
In January 2017, the FASB issued ASU 2017-01
Business Combinations (Topic 805): Clarifying the Definition of a Business
with the objective of adding guidance to assist entities with evaluating whether transactions should be accounted for as acquisitions (or disposals) of assets or businesses. We adopted this ASU prospectively from January 1, 2018. As a result, this increases the likelihood that future vessel dropdowns may be considered the sale of an asset rather than a business. However, this will be dependent upon the facts and circumstances of each prospective transaction. There was no material impact on the adoption of this ASU on our consolidated financial statements and related disclosures.
In February 2017, the FASB issued ASU 2017-05
Other Income - Gains and Losses from the Derecognition of Non-Financial Assets
. This ASU clarifies the scope of guidance applicable to sales of non-financial assets and also provides guidance on partial sales of such assets. We adopted this ASU prospectively from January 1, 2018. We expect any gain or loss on sale from future dropdowns, accounted for as a disposal, will be recognized in full on the disposal date, however this will be dependent on the facts and circumstances of each prospective transaction. There was no material impact to our consolidated financial statements and related disclosures on adoption of this standard.
Accounting pronouncements that have been issued but not adopted
In February 2016, the FASB issued ASU 2016-02
Leases (Topic 842)
and subsequent amendments. Topic 842 modifies the definition of a lease, requires periodic reassessment of the lease term and requires new disclosures. Lessors are required to classify leases as sales-type, direct financ
i
ng or operating, with classification affecting the pattern of income recognition and provides guidance for sale and leaseback transactions. Topic 842 requires a lessee to recognize leases on its balance sheet by recording a lease liability (representing the obligation to make future lease payments) and a right of use asset (representing the right to use the asset for the lease term). Leases for lessees will be classified as either financing or operating with classification affecting the pattern of expense recognition in the income statement.
Topic 842 will become effective for us on January 1, 2019. We have applied the modified retrospective transition approach. We will elect all available practical expedients which among other things allow us to carry forward prior conclusions relating to lease identification, classification and lease term. Our election of the practical expedient providing transition relief will result in our prior periods not being restated and will continue to be represented in accordance with Topic 840. Our minimum commitments relating to our existing operating leases are outlined in note 13 to the consolidated financial statements.
F-22
The most significant impact of Topic 842 relates to our accounting for our office leases which will be recorded as assets and liabilities on our Balance Sheet from adoption. We do not believe that Topic 842 will have a notable impact on our liquidity and our debt covenant compliance under our current arrangements.
For contracts where we are the lessor, the practical expedients we have elected results in no change to our Balance Sheet on adoption. Our legacy leases will continue to be classified in accordance with Topic 840, while modifications and subsequent accounting will follow the accounting under Topic 842. Leases entered into on or after January 1, 2019 will be assessed under the requirements of Topic 842. New lessor presentation and disclosure requirements are introduced and will be applied to our new and existing lease agreements in our subsequent reporting.
In June 2016, the FASB issued ASU 2016-13
Financial Instruments - Credit Losses (Topic 326): Measurement of Credit Losses on Financial Instruments
and subsequent amendment ASU 2018-19
Codification Improvements to Topic 326 ‘‘Financial Instruments-Credit Losses”
, which requires recognition and measurement of expected credit losses for financial assets and off balance sheet credit exposures. The guidance is effective on a modified retrospective basis for us on January 1, 2020 with early adoption permitted. We are evaluating the impact of this standard on our consolidated financial statements and related disclosures.
In July 2018, the FASB issued ASU 2018-09
Codification improvements
. The amendments in this ASU cover a wide range of topics covering primarily minor corrections, clarifications and codification improvements. We are evaluating the impact of these amendments on our consolidated financial statements and related disclosures, which is not expected to have material impact on our consolidated financial statements.
In August 2018, the FASB issued ASU 2018-13
Fair Value Measurement (Topic 820): Disclosure Framework-Changes to the Disclosure Requirements for Fair Value Measurement
. These amendments change the disclosures for fair value measurements - removing or modifying certain existing disclosure requirements, and adding new disclosure requirements. The guidance is effective for us commencing January 1, 2020 with early adoption permitted. We are evaluating the impact of these amendments on our consolidated financial statement disclosures.
In August 2018, the FASB issued ASU 2018-14
Compensation-Retirement Benefits-Defined Benefit Plans-General (Subtopic 715-20): Disclosure Framework-Changes to the Disclosure Requirements for Defined Benefit Plans
. These amendments change the disclosures for defined benefit plans - removing or clarifying certain existing disclosure requirements, and adding new disclosure requirements. The guidance is effective on a retrospective basis for us on January 1, 2021 with early adoption permitted. We are evaluating the impact of these amendments on our consolidated financial statement disclosures.
In August 2018, the FASB issued ASU 2018-15
Intangibles-Goodwill and Other- Internal-Use Software (Subtopic 350-40): Customer’s Accounting for Implementation Costs Incurred in a Cloud Computing Arrangement That Is a Service Contract
. These amendments change the definition of a hosting arrangement and requires the capitalization of certain implementation costs. The guidance is effective on either a retrospective or prospective basis for us on January 1, 2020 with early adoption permitted. We are evaluating the impact of these amendments on our consolidated financial statement disclosures.
In October 2018, the FASB issued ASU 2018-17
Consolidation (Topic 810) - Targeted Improvements to Related Party Guidance for Variable Interest Entities
. This amendment clarifies guidance for considering whether indirect interests held through related parties under common control are considered variable interests, increasing consistency of guidance for common control arrangements. The guidance is effective on a modified retrospective basis for us on January 1, 2020 with early adoption permitted. We are evaluating the impact of these amendments on our consolidated financial statement disclosures.
In November 2018, the FASB issued ASU 2018-18
Collaborative Arrangements (Topic 808) - Clarifying the Interaction between
Topic 808 and Topic 606
. This amendment clarifies the interaction between Topic 808 ‘Collaborative Arrangements’ and Topic 606 ‘Revenue from Contracts with Customers’. The guidance is effective on a modified retrospective basis for us on January 1, 2020 with early adoption permitted. We are evaluating the impact of these amendments on our consolidated financial statement disclosures.
F-23
|
4.
|
SUBSIDIARIES
|
The following table lists our significant subsidiaries and their purpose as at
December 31, 2018
. Unless otherwise indicated, we own a
100%
ownership interest in each of the following subsidiaries.
|
Name
|
Jurisdiction of Incorporation
|
Purpose
|
|
Golar LNG 2216 Corporation
|
Marshall Islands
|
Owns and operates
Golar Arctic
|
|
Golar Management Limited
|
United Kingdom
|
Management company
|
|
Golar Management Malaysia SDN. BDH.
|
Malaysia
|
Vessel management company
|
|
Golar Management Norway AS
|
Norway
|
Vessel management company
|
|
Golar Management D.O.O
|
Croatia
|
Vessel management company
|
|
Golar GP LLC – Limited Liability Company
|
Marshall Islands
|
Holding company
|
|
Golar LNG Energy Limited
|
Bermuda
|
Holding company
|
|
Golar Gimi Corporation
|
Marshall Islands
|
Owns
Gimi
|
|
Golar Hilli Corp. *
|
Marshall Islands
|
Owns
Hilli Episeyo
("
Hilli
")
|
|
Golar Gandria N.V.
|
Curaçao
|
Owns and operates
Golar Gandria
|
|
Golar Hull M2021 Corporation
|
Marshall Islands
|
Leases
Golar Seal**
|
|
Golar Hull M2022 Corporation
|
Marshall Islands
|
Leases
Golar Crystal**
|
|
Golar Hull M2027 Corporation
|
Marshall Islands
|
Owns and operates
Golar Bear
|
|
Golar Hull M2047 Corporation
|
Marshall Islands
|
Leases
Golar Snow**
|
|
Golar Hull M2048 Corporation
|
Marshall Islands
|
Leases
Golar Ice**
|
|
Golar LNG NB10 Corporation
|
Marshall Islands
|
Leases
Golar Glacier**
|
|
Golar LNG NB11 Corporation
|
Marshall Islands
|
Leases
Golar Kelvin**
|
|
Golar LNG NB12 Corporation
|
Marshall Islands
|
Owns and operates
Golar Frost
|
|
Golar LNG NB13 Corporation
|
Marshall Islands
|
Leases
Golar Tundra**
|
|
GVS Corporation
|
Marshall Islands
|
Owns and operates
Golar Viking
|
|
Golar Shoreline LNG Limited
|
Bermuda
|
Holding company
|
|
Golar Hilli LLC *
|
Marshall Islands
|
Holding company
|
* In February 2018, Golar Hilli LLC was incorporated with Golar as sole member. In July 2018, shares in Golar Hilli Corp. (a
89%
owned subsidiary of Golar Hilli LLC) were exchanged for Hilli Common Units, Series A Special Units and Series B Special Units. See note 6 for further details.
** The above table excludes mention of the lessor variable interest entities (''lessor VIEs'') that we have leased vessels from under finance leases. The lessor VIEs are wholly-owned, newly formed special purpose vehicles ("SPVs") of financial institutions. While we do not hold any equity investments in these SPVs, we have concluded that we are the primary beneficiary of these lessor VIEs and accordingly have consolidated these entities into our financial results. See note 5 for further details.
|
5.
|
VARIABLE INTEREST ENTITIES ("VIEs")
|
As of
December 31, 2018
, we leased
eight
vessels (December 31, 2017:
seven
vessels) from VIEs as part of sale and leaseback agreements, of which
four
were with ICBC Finance Leasing Co. Ltd, or ICBCL;
one
with a subsidiary of China Merchants Bank Co. Ltd, or CMBL;
one
with CCB Financial Leasing Corporation Limited, or CCBFL;
one
with a COSCO Shipping entity, or COSCO and
one
with a China State Shipbuilding Corporation entity, or CSSC.
F-24
ICBCL Lessor VIEs
Commencing in October 2014, we sold the
Golar Glacier
, followed by the remaining
three
newbuilds (the
Golar Kelvin
,
Golar Snow
and
Golar Ice
) to ICBCL entities in the first quarter of 2015. The vessels were simultaneously leased back on bareboat charters for a term of
ten years
. We have several options to repurchase the vessels at fixed pre-determined amounts during the charter periods with the earliest date from the fifth year anniversary of commencement of the bareboat charter, and an obligation to purchase the assets at the end of the
ten
year lease period.
CMBL Lessor VIE
In November 2015, we sold the
Golar Tundra
to a CMBL entity and subsequently leased back the vessel on a bareboat charter for a term of
ten years
. We have options to repurchase the vessel throughout the charter term at fixed pre-determined amounts, commencing from the third year anniversary of the commencement of the bareboat charter, with an obligation to repurchase the vessel at the end of the
ten
year lease period.
CCBFL Lessor VIE
In March 2016, we sold the
Golar Seal
to a CCBFL entity and subsequently leased back the vessel on a bareboat charter for a term of
ten
years. We have options to repurchase the vessel throughout the charter term at fixed pre-determined amounts, commencing from the fifth year anniversary of the commencement of the bareboat charter, with an obligation to repurchase the vessel at the end of the
ten
year lease period.
COSCO Lessor VIE
In March 2017, we sold the
Golar Crystal
to a COSCO entity and subsequently leased back the vessel on a bareboat charter for a term of
ten
years. We have options to repurchase the vessel throughout the charter term at fixed pre-determined amounts, commencing from the third year anniversary of the commencement of the bareboat charter, with an obligation to repurchase the vessel at the end of the
ten
year lease period.
CSSC Lessor VIE
In June 2018, we sold the
Hilli
to a CSSC entity and subsequently leased back the vessel on a bareboat charter for a term of
ten
years. We have options to repurchase the vessel throughout the charter term at fixed pre-determined amounts, commencing from the fifth year anniversary of the commencement of the bareboat charter, with an obligation to repurchase the vessel at the end of the
ten
year lease period.
While we do not hold any equity investments in the above SPVs, we have determined that we have a variable interest in these SPVs and that these lessor entities, that own the vessels, are VIEs. Based on our evaluation of the agreements, we have concluded that we are the primary beneficiary of these VIEs and, accordingly, these VIEs are consolidated into our financial results. We did not record any gains or losses from the sale of these vessels as they continued to be reported as vessels at their original costs in our consolidated financial statements at the time of each transaction. Similarly, the effect of the bareboat charter arrangement is eliminated upon consolidation of the SPV. The equity attributable to ICBCL, CMBL, CCBFL, COSCO and CSSC in their respective VIEs are included in non-controlling interests in our consolidated financial statements. As of
December 31, 2018
and
2017
, the respective vessels are reported under "Vessels and equipment, net" in our consolidated balance sheets.
The following table gives a summary of the sale and leaseback arrangements, including repurchase options and obligations as of
December 31, 2018
:
|
Vessel
|
Effective from
|
Sales value (in $ millions)
|
First repurchase option (in $ millions)
|
Date of first repurchase option
|
Repurchase obligation at end of lease term
(in $ millions)
|
End of lease term
|
|
Golar Glacier
|
October 2014
|
204.0
|
173.8
|
October 2019
|
135.1
|
October 2024
|
|
Golar Kelvin
|
January 2015
|
204.0
|
173.8
|
January 2020
|
135.1
|
January 2025
|
|
Golar Snow
|
January 2015
|
204.0
|
173.8
|
January 2020
|
135.1
|
January 2025
|
|
Golar Ice
|
February 2015
|
204.0
|
173.8
|
February 2020
|
135.1
|
February 2025
|
|
Golar Tundra
|
November 2015
|
254.6
|
168.7
|
November 2018
(1)
|
76.4
|
November 2025
|
|
Golar Seal
|
March 2016
|
203.0
|
132.8
|
March 2021
|
87.4
|
March 2026
|
|
Golar Crystal
|
March 2017
|
187.0
|
97.3
|
March 2020
|
50.6
|
March 2027
|
|
Hilli
|
June 2018
|
1,200.0
|
633.2
|
June 2023
|
300.0
|
June 2028
|
(1) We did not exercise the first repurchase option relating to the
Golar Tundra
.
F-25
A summary of our payment obligations (excluding repurchase options and obligations) under the bareboat charters with the lessor VIEs as of
December 31, 2018
, are shown below:
|
(in thousands of $)
|
2019
|
2020
|
2021
|
2022
|
2023
|
2024+
|
|
Golar Glacier
|
17,100
|
17,147
|
17,100
|
17,100
|
17,100
|
12,884
|
|
Golar Kelvin
|
17,100
|
17,147
|
17,100
|
17,100
|
17,100
|
15,695
|
|
Golar Snow
|
17,100
|
17,147
|
17,100
|
17,100
|
17,100
|
15,695
|
|
Golar Ice
|
17,100
|
17,147
|
17,100
|
17,100
|
17,100
|
18,599
|
|
Golar Tundra
(1)(2)
|
22,437
|
21,548
|
20,610
|
19,697
|
18,784
|
32,079
|
|
Golar Seal
(2)
|
13,754
|
13,717
|
13,717
|
13,717
|
13,754
|
27,433
|
|
Golar Crystal
(1)
|
12,441
|
12,335
|
12,175
|
12,050
|
11,907
|
37,601
|
|
Hilli
(1)
|
128,418
|
123,526
|
118,800
|
114,075
|
109,463
|
412,055
|
(1) The payment obligations relating to the
Golar Tundra
,
Golar Crystal
and
Hilli
above include variable rental payments due under the lease based on an assumed LIBOR plus a margin.
(2) The payment obligations relating to the
Golar Tundra
and the
Golar Seal
above have been prepared on the assumption that we are able to secure a replacement charter for these two vessels, to ensure continuation of these financing arrangements. Refer to note 1 for further details.
The assets and liabilities of the lessor VIEs that most significantly impact our consolidated balance sheets as of
December 31, 2018
and
2017
, are as follows:
|
(in thousands of $)
|
Golar Glacier
|
Golar Kelvin
|
Golar Snow
|
Golar Ice
|
Golar Tundra
|
Golar Seal
|
Golar Crystal
|
Hilli
|
2018
|
2017
|
||||||||||
|
Assets
|
Total
|
Total
|
||||||||||||||||||
|
Restricted cash and short-term deposits (see note 14)
|
21,170
|
|
71,924
|
|
19,294
|
|
8
|
|
—
|
|
3,405
|
|
3,186
|
|
57,441
|
|
176,428
|
|
130,063
|
|
|
Liabilities
|
||||||||||||||||||||
|
Debt:
|
||||||||||||||||||||
|
Current portion of long-term debt and short-term debt
(1)
|
39,319
|
|
182,540
|
|
30,404
|
|
117,888
|
|
121,741
|
|
—
|
|
5,741
|
|
148,880
|
|
646,513
|
|
833,664
|
|
|
Long-term interest bearing debt - non-current portion
(1)
|
114,093
|
|
—
|
|
123,267
|
|
—
|
|
—
|
|
123,524
|
|
90,790
|
|
749,100
|
|
1,200,774
|
|
252,691
|
|
|
153,412
|
|
182,540
|
|
153,671
|
|
117,888
|
|
121,741
|
|
123,524
|
|
96,531
|
|
897,980
|
|
1,847,287
|
|
1,086,355
|
|
|
(1) Where applicable, these balances are net of deferred finance charges (see note 20).
The most significant impact of the lessor VIEs operations on our consolidated statements of income is interest expense of
$61.5 million
,
$37.4 million
and
$44.1 million
for the years ended
December 31, 2018
,
2017
and
2016
, respectively. The most significant impact of the lessor VIEs cash flows on our consolidated statements of cash flows is net cash received in financing activities of
$761.2 million
,
$51.5 million
and
$154.2 million
for the years ended
December 31, 2018
,
2017
and
2016
, respectively.
Subsequent to the sale of common units in Golar Hilli LLC (see note 6 for further information), we have retained sole control over the most significant activities and the greatest exposure to variability in residual returns and expected losses from the
Hilli
. Accordingly, management have concluded Hilli LLC is a VIE and that we are the primary beneficiary. The assets and liabilities of Hilli LLC that most significantly impact our consolidated balance sheet as of December 31, 2018, are as follows:
F-26
|
(in thousands of $)
|
Hilli LLC
(2)
|
|
|
Assets
|
||
|
Cash and short-term deposits
|
85,238
|
|
|
Restricted cash and short-term deposits
|
57,441
|
|
|
Vessels and equipment, net
|
1,301,279
|
|
|
Other non-current assets
|
91,431
|
|
|
1,535,389
|
|
|
|
Liabilities
|
||
|
Current portion of long-term debt and short-term debt
(1)
|
148,880
|
|
|
Long-term interest bearing debt - non-current portion
(1)
|
749,100
|
|
|
897,980
|
|
|
(1) Where applicable, these balances are net of deferred finance charges.
(2) As Hilli LLC is the primary beneficiary of the Hilli Lessor VIE (see above) the Hilli LLC balances include the Hilli Lessor VIE.
The most significant impact of Hilli LLC VIE's operations on our consolidated statements of operations is liquefaction
services revenue of
$127.6 million
and realized and unrealized gain on oil derivative instrument of
$16.8 million
for the period July 12, 2018 to December 31, 2018. The most significant impact of lessor VIE's cash flows on our consolidated statements of cash flows is net payments of
$30.3 million
in financing activities for the period July 12, 2018 to December 31, 2018.
|
6.
|
DISPOSAL OF LONG-LIVED ASSETS
|
6.1 Partial disposal of the
Hilli
On July 12, 2018 (the "Closing Date"), we and affiliates of Keppel Shipyard Limited ("Keppel") and Black & Veatch Corporation ("B&V") (together, the "Sellers"), completed the sale ("Hilli Disposal") to Golar Partners of common units in our consolidated subsidiary Golar Hilli LLC ("Hilli LLC") (the "Hilli Common Units"), which owns Golar Hilli Corp. ("Hilli Corp"), the disponent owner of the
Hilli
. The Hilli Disposal resulted in the following changes to our ownership interest in our consolidated subsidiary Hilli LLC in our equity:
|
(in thousands of $)
|
December 31, 2018
|
|
|
Net loss attributable to stockholders of Golar LNG Limited
|
(231,428
|
)
|
|
Transfer to the non-controlling interests: increase in Golar LNG Limited’s paid-in capital for sale of 1,096 Hilli Common Units in July 2018
|
304,468
|
|
|
Changes from net income attributable to stockholders of Golar LNG Limited and transfers to non-controlling interests
|
73,040
|
|
The selling price for the Hilli Disposal was
$658 million
, less
50%
of our net lease obligations under the Hilli Facility (see note 20) on the Closing Date and working capital adjustments. On August 15, 2017, concurrently with our entry into the purchase and sale agreement for the Hilli Disposal (the "Hilli Sale Agreement"), we received a deposit from Golar Partners, which, together with accrued interest, equaled
$71.9 million
on the Closing Date (the "Hilli deposit"), combined with Golar Partners’ payment for its exercise of the Tundra Put Right, which, together with accrued interest, equaled
$110.1 million
on the Closing Date (the "Deferred Purchase Price"). We applied the Hilli Deposit, the Deferred Purchase Price and interest accrued thereon as payment for the Hilli Disposal.
We entered into the Amended and Restated Limited Liability Company Agreement of Hilli LLC (the "LLC Agreement") on July 12, 2018. The ownership interests in Hilli LLC are represented by three classes of units, the Hilli Common Units, the Series A Special Units and the Series B Special Units. After the Hilli Disposal, we own:
|
•
|
44.6%
of the Hilli Common Units, with the remaining Hilli Common Units owned by Golar Partners, Keppel and B&V (
50.0%
,
5.0%
and
0.4%
, respectively);
|
|
•
|
89.1%
of the Series A Special Units, with the remaining Series A Special Units owned by Keppel and B&V (
10.0%
and
0.9%
, respectively); and
|
F-27
|
•
|
89.1%
of the Series B Special Units, with the remaining Series B Special Units owned by Keppel and B&V (
10.0%
and
0.9%
, respectively).
|
We are the managing member of Hilli LLC and are responsible for all operational, management and administrative decisions relating to Hilli LLC’s business and, as a result, we continue to consolidate both Hilli LLC and Hilli Corp. All three classes of ownership interests in Hilli LLC have certain participating and protective rights. We reflect Keppel and B&V’s ownership in Hilli LLC’s Series A Special Units and Series B Special Units as non-controlling interests in our financial statements.
The LLC Agreement provides that within 60 days after the end of each quarter (commencing with the quarter ending September 30, 2018), we, in our capacity as the managing member of Hilli LLC, shall determine the amount of Hilli LLC’s available cash and appropriate reserves (including cash reserves for future maintenance capital expenditures, working capital and other matters), and Hilli LLC shall make a distribution to the unitholders of Hilli LLC (the "Hilli Unitholders") of the available cash, subject to such reserves. Hilli LLC shall make distributions to the Hilli Unitholders when, as and if declared by us; provided, however, that no distributions may be made on the Hilli Common Units on any distribution date unless Series A Distributions (defined below) and Series B Distributions (defined below) for the most recently ended quarter and any accumulated Series A Distributions and Series B Distributions in arrears for any past quarter have been or contemporaneously are being paid or provided for.
Series A Special Units:
The Series A Special Units rank senior to the Hilli Common Units and on par with the Series B Special Units. Upon termination of the LTA, Hilli LLC has a right to redeem the Series A Special Units from legally available funds at a redemption price of
$1
plus any unpaid distributions. There are no conversion features on the Series A Special Units. "Series A Distributions" reflect all incremental cash receipts by Hilli Corp during such quarter when Brent Crude prices rise above
$60
per barrel with contractually defined adjustments.
Series B Special Units:
The Series B Special Units rank senior to the Hilli Common Units and on par with the Series A Special Units. There are no conversion or redemption features on the Series B Special Units. Incremental returns generated from future vessel expansion capacity (currently uncontracted and excluding the exercise of additional capacity under the existing LTA) include cash receipts and contractually defined adjustments. Of such vessel expansion capacity distributions ("Series B Distributions"):
|
•
|
holders of Series B Special Units are entitled to
95%
of these distributions, and
|
|
•
|
holders of Hilli Common Units are entitled to
5%
of these distributions.
|
Hilli Common Units:
Distributions attributable to Hilli Common Unitholders are not declared until any accumulated Series A Special Units and Series B Special Units distributions have been paid. As discussed above, Hilli Common Unitholders are entitled to receive a pro rata share of
5%
of the vessel expansion capacity distributions.
Impact of partial disposal:
Hilli LLC is an entity where the economic results are allocated based on the LLC Agreement rather than relative ownership percentages. This is due to the different classes of equity within the Hilli LLC entity, as discussed above (Hilli Common Units, Series A Special Units, Series B Special Units). As the LLC Agreement is a substantive contractual arrangement that specifies the allocation of cash proceeds, management has allocated the results of the Hilli LLC entity based on this.
The main assumption made in the above exercise was to make certain assumptions about the allocation of non-cash components. Specifically, the unrealized mark-to-market movement in the oil derivative instrument is allocated to the Series A Special Unit holders only as they are the only unit holders who benefit from the oil-linked revenues, and the cost of the
Hilli
asset is allocated between the Hilli Common Unit holders and the Series B Special Unit holders. This split follows the allocation of cash revenues associated with the capacity of the asset to the Hilli Common Unit holders and the Series B Special Unit holders.
F-28
6.2 Deconsolidation of Golar Power entities
In June 2016, we entered into certain agreements forming a 50/50 joint venture, Golar Power Ltd ("Golar Power"), with investment vehicles affiliated with the private equity firm Stonepeak Infrastructure Partners ("Stonepeak"). The purpose of Golar Power is to offer integrated LNG based downstream solutions through the ownership and operation of FSRUs and associated terminal and power generation infrastructure. The transaction closed on July 6, 2016 with the receipt of net proceeds of
$113 million
from the disposal of
50%
of our holding in the ordinary share capital of Golar Power to Stonepeak. Accordingly, effective from this date, we deconsolidated the results and net assets relating to the
two
vessels; the
Golar Penguin
and the
Golar Celsius
, the newbuild
Golar Nanook
and LNG Power Limited, which holds the rights to participate in the Sergipe Project. On the same date, we commenced equity accounting for our residual interest in Golar Power and we recorded an investment in Golar Power of
$116 million
, which represents the fair value of our remaining
50%
holding in Golar Power's ordinary share capital. We calculated a loss on disposal of
$8.5 million
.
The table below illustrates how the loss on loss of control has been calculated:
|
(in thousands of $)
|
As of July 6, 2016
|
|
|
Net proceeds (a)
|
113,000
|
|
|
Fair value of 50% retained investment in Golar Power (b)
|
116,000
|
|
|
Fair value of counter guarantees from Golar Power (c)
|
3,701
|
|
|
Total fair value of Golar Power
|
232,701
|
|
|
Less:
|
||
|
Carrying value of Golar Power’s net assets (d)
|
236,713
|
|
|
Guarantees issued by Golar to Golar Power (e)
|
4,471
|
|
|
Loss on loss of control of Golar Power
|
(8,483
|
)
|
(a) Net proceeds received for the disposal of
50%
in Golar Power
The table below shows the purchase consideration we received for the disposal of a
50%
interest in the ordinary share capital in Golar Power that was acquired by Stonepeak:
|
(in thousands of $)
|
As of July 6, 2016
|
|
|
Consideration received from Stonepeak
|
116,000
|
|
|
Less: Fee paid in relation to the transaction
|
(3,000
|
)
|
|
Net proceeds
|
113,000
|
|
(b) Fair value of the retained investment in Golar Power
The fair value of our retained investment, being the
50%
interest in the ordinary share capital in Golar Power has been recorded at
$116 million
. The fair value was determined with reference to the consideration of
$116 million
we received from Stonepeak pertaining to the
50%
ordinary share capital interest they acquired. Thus given that this was negotiated between third parties, this is representative of fair value.
(c) Fair value of counter guarantees from Golar Power
A number of counter guarantees were entered into by Golar Power for the benefit of Golar LNG, specifically to reimburse Golar for the historic legacy debt guarantees discussed in (e) below. In aggregate, based on the agreed premiums the fair value of these counter guarantees were calculated as
$3.7 million
.
F-29
(d) Carrying value of Golar Power's net assets
The table below shows the underlying carrying value of Golar Power's net assets at the deconsolidation date:
|
(in thousands of $)
|
As at July 6, 2016
|
|
|
ASSETS
|
||
|
Current
|
||
|
Cash and cash equivalents
|
10,992
|
|
|
Restricted cash
|
15,463
|
|
|
Trade accounts receivable
|
1,474
|
|
|
Other receivables, prepaid expenses and accrued income
|
178
|
|
|
Short term amounts due from related parties
|
3,000
|
|
|
Inventory
|
952
|
|
|
Total current assets
|
32,059
|
|
|
Non-current
|
||
|
Newbuildings
|
50,436
|
|
|
Vessels, net
|
387,261
|
|
|
Total assets
|
469,756
|
|
|
LIABILITIES AND STOCKHOLDERS' EQUITY
|
||
|
Current
|
||
|
Current portion of long-term debt
|
20,032
|
|
|
Trade accounts payable
|
969
|
|
|
Accrued expenses
|
21,357
|
|
|
Total current liabilities
|
42,358
|
|
|
Non-current
|
||
|
Long-term debt
|
190,685
|
|
|
Total liabilities
|
233,043
|
|
|
Equity
|
||
|
Stockholders’ equity
|
236,713
|
|
|
Total liabilities and stockholders' equity
|
469,756
|
|
(e) Guarantees issued by Golar to Golar Power
The guarantees issued by us in respect of Golar Power and its subsidiaries were fair valued as of the deconsolidation date which amounted to a liability of
$4.5 million
. This comprises of the following items:
|
(in thousands of $)
|
As of July 6, 2016
|
|
|
|
Debt guarantees
|
3,283
|
|
|
|
Shipyard guarantee
|
1,188
|
|
|
|
Total guarantees
|
4,471
|
|
|
Debt guarantees -
The debt guarantees were previously issued by Golar to third party banks in respect of certain secured debt facilities relating to Golar Power and subsidiaries. The liability which is recorded in "Other non-current liabilities" is being amortized over the remaining term of the respective debt facilities with the credit being recognized in "Other financial items". See "Transactions with Golar Power and subsidiaries" in note 28.
Shipyard guarantee -
Golar has provided Samsung with a guarantee of settlement in relation to the shipbuilding contract of
Golar Nanook
, which now forms part of Golar Power's asset base. The liability which is recorded in "Other current liabilities" is being
F-30
amortized on a straight line basis until delivery of the vessel with the credit being recognized in "Other financial items". See "Transactions with Golar Power and subsidiaries" in note 28.
|
7.
|
SEGMENT INFORMATION
|
We are a marine LNG infrastructure provider and a project development company. We own and operate LNG carriers, a FLNG and FSRUs and provide these services under time charters under varying periods. As of
December 31, 2018
, we have completed the commissioning of our first FLNG vessel and have entered the power market in an effort to become a midstream LNG solution provider. Our reportable segments consist of the primary services each provides. Although our segments are generally influenced by the same economic factors, each represents a distinct product in the LNG industry. Segment results are evaluated based on operating income. The accounting principles for the segments are the same as for our consolidated financial statements. "Project development expenses" are allocated to each segment based on the nature of the project. Indirect general and administrative expenses are allocated to each segment based on estimated use.
The split of the organization of the business into
three
reportable segments is based on differences in management structure and reporting, economic characteristics, customer base, asset class and contract structure. As of
December 31, 2018
, we operate in the following
three
reportable segments:
|
•
|
Vessel operations
– We operate and subsequently charter out vessels on fixed terms to customers. We also provide technical vessel management services for our fleet as well as the fleets of Golar Partners and Golar Power.
|
|
•
|
FLNG
– In 2014, we ordered our first FLNG based on the conversion of our existing LNG carrier, the
Hilli.
The
Hilli
FLNG conversion was completed and the vessel was accepted by the customer under the LTA. In February 2019 Golar entered into an agreement with BP for the charter of a FLNG, which will be converted from our existing LNG carrier, the
Gimi
, for a 20-year period expected to commence in 2022. The
Gimi
was relocated from layup to Keppel Shipyard in early 2019 to proceed with the conversion.
|
In July 2016, we entered into an agreement with Schlumberger B.V. ("Schlumberger") to form OneLNG, a joint venture, with the intention to offer an integrated upstream and midstream solution for the development of low cost gas reserves to LNG. As a result we report the equity in net losses of OneLNG in the FLNG segment. In May 2018, it was decided that Golar and Schlumberger will wind down OneLNG and work on FLNG projects as required on a case-by-case basis.
|
•
|
Power
– In July 2016, we entered into certain agreements forming a 50/50 joint venture, Golar Power, with private equity firm Stonepeak. Golar Power offers integrated LNG based downstream solutions, through the ownership and operation of FSRUs and associated terminal and power generation infrastructure.
|
F-31
|
December 31, 2018
|
December 31, 2017
|
December 31, 2016
(3)
|
||||||||||||||||||||||||||||||||
|
(in thousands of $)
|
Vessel Operations
|
FLNG
|
Power
|
Other
(1)
|
Total
|
Vessel operations
|
FLNG
|
Power
|
Other
(1)
|
Total
|
Vessel operations
|
FLNG
|
Power
|
Other
(1)
|
Total
|
|||||||||||||||||||
|
Statement of Operations:
|
||||||||||||||||||||||||||||||||||
|
Total operating revenues
|
302,979
|
|
127,625
|
|
—
|
|
—
|
|
430,604
|
|
143,537
|
|
—
|
|
—
|
|
—
|
|
143,537
|
|
80,257
|
|
—
|
|
—
|
|
—
|
|
80,257
|
|
||||
|
Depreciation and amortization
|
(65,496
|
)
|
(28,193
|
)
|
—
|
|
—
|
|
(93,689
|
)
|
(76,522
|
)
|
—
|
|
—
|
|
—
|
|
(76,522
|
)
|
(72,972
|
)
|
—
|
|
—
|
|
—
|
|
(72,972
|
)
|
||||
|
Other operating expenses
|
(231,887
|
)
|
(44,031
|
)
|
—
|
|
—
|
|
(275,918
|
)
|
(163,207
|
)
|
(4,365
|
)
|
—
|
|
—
|
|
(167,572
|
)
|
(144,816
|
)
|
(3,576
|
)
|
—
|
|
—
|
|
(148,392
|
)
|
||||
|
Other operating gains and losses
|
50,740
|
|
2,749
|
|
—
|
|
—
|
|
53,489
|
|
—
|
|
15,100
|
|
—
|
|
—
|
|
15,100
|
|
16
|
|
—
|
|
—
|
|
—
|
|
16
|
|
||||
|
Operating income (loss)
|
56,336
|
|
58,150
|
|
—
|
|
—
|
|
114,486
|
|
(96,192
|
)
|
10,735
|
|
—
|
|
—
|
|
(85,457
|
)
|
(137,515
|
)
|
(3,576
|
)
|
—
|
|
—
|
|
(141,091
|
)
|
||||
|
Inter segment operating income
(loss)
(2)
|
335
|
|
—
|
|
—
|
|
(335
|
)
|
—
|
|
4,568
|
|
—
|
|
—
|
|
(4,568
|
)
|
—
|
|
275
|
|
—
|
|
—
|
|
(275
|
)
|
—
|
|
||||
|
Segment operating (loss) income
|
56,671
|
|
58,150
|
|
—
|
|
(335
|
)
|
114,486
|
|
(91,624
|
)
|
10,735
|
|
—
|
|
(4,568
|
)
|
(85,457
|
)
|
(137,240
|
)
|
(3,576
|
)
|
—
|
|
(275
|
)
|
(141,091
|
)
|
||||
|
Equity in net (losses) earnings of affiliates
|
(138,676
|
)
|
(2,047
|
)
|
(16,913
|
)
|
—
|
|
(157,636
|
)
|
1,503
|
|
(8,153
|
)
|
(18,798
|
)
|
—
|
|
(25,448
|
)
|
37,344
|
|
—
|
|
10,534
|
|
—
|
|
47,878
|
|
||||
|
Balance sheet:
|
||||||||||||||||||||||||||||||||||
|
Total assets
|
2,990,506
|
|
1,555,389
|
|
266,151
|
|
(5,451
|
)
|
4,806,595
|
|
3,025,244
|
|
1,515,463
|
|
228,696
|
|
(5,116
|
)
|
4,764,287
|
|
3,152,311
|
|
978,614
|
|
126,534
|
|
(548
|
)
|
4,256,911
|
|
||||
|
Investment in affiliates
|
305,631
|
|
—
|
|
266,151
|
|
—
|
|
571,782
|
|
472,482
|
|
2,047
|
|
228,696
|
|
—
|
|
703,225
|
|
512,046
|
|
10,200
|
|
126,534
|
|
—
|
|
648,780
|
|
||||
|
Capital expenditures
|
22,978
|
|
116,715
|
|
—
|
|
—
|
|
139,693
|
|
1,349
|
|
390,552
|
|
—
|
|
—
|
|
391,901
|
|
33,698
|
|
200,820
|
|
—
|
|
—
|
|
234,518
|
|
||||
(1)
Eliminations required for consolidation purposes.
(2) Inter segment operating income (loss) relates to management fee and charterhire revenues between the segments.
(3) We no longer consider LNG trading a separate reportable segment. Given the previously reported segment information was immaterial for all periods presented, we have included these amounts within the vessel operations segment.
Revenues from external customers
During the year ended
December 31, 2018
our vessels operated predominately within the Cool Pool and under our LTA with Perenco Cameroon S.A. ("Perenco") and Société Nationale des Hydrocarbures ("SNH"), (together, the "Customer").
In the years ended
December 31, 2018
,
2017
and
2016
, revenues from the following customers accounted for over
10%
of our consolidated time and voyage charter revenues:
|
(in thousands of $)
|
2018
|
2017
|
2016
|
||||||||||||||
|
The Cool Pool
(1)
|
251,070
|
|
62
|
%
|
106,302
|
|
91
|
%
|
51,075
|
|
77
|
%
|
|||||
|
Perenco and SNH (note 8)
|
127,625
|
|
31
|
%
|
—
|
|
—
|
%
|
—
|
|
—
|
%
|
|||||
|
An energy and logistics company
|
9,235
|
|
2
|
%
|
9,235
|
|
8
|
%
|
7,975
|
|
12
|
%
|
|||||
(1) The
2018
Cool Pool revenue of
$251.1 million
includes revenue of
$73.9 million
that is separately disclosed in the consolidated statements of operations as from a collaborative arrangement. The balance of
$177.2 million
was derived from Golar vessels operating within the Cool Pool, and is included within the caption "Time and voyage charter revenues" in the consolidated statements of operations. See note 28.
The above revenues exclude vessel and other management fees from Golar Partners (see note 28).
Geographic data
The following geographical data presents our revenues from customers and fixed assets with respect only to our FLNG, while operating under the LTA, in Cameroon. In time and voyage charters for LNG carriers (or our FSRU, operating as a LNG carrier), the charterer, not us, controls the routes of our vessels. These routes can be worldwide as determined by the charterers. Accordingly, our management, including the chief operating decision maker, do not evaluate our performance either according to customer or geographical region.
F-32
|
(in thousands of $)
|
2018
|
2017
|
2016
|
|||||
|
Cameroon
|
||||||||
|
Liquefaction services revenue
|
127,625
|
|
—
|
|
—
|
|
||
|
Total assets
|
1,535,389
|
|
1,515,463
|
|
—
|
|
||
|
8.
|
REVENUE
|
Contract assets arise when we render services in advance of receiving payment from our customers. Contract liabilities arise when the customer makes payments in advance of receiving the services. Changes in our contract balances during the period are as follows:
|
(in thousands of $)
|
Contract assets
(1)
|
Contract liabilities
(2)
|
||
|
Opening balance on January 1, 2018
|
17,245
|
|
—
|
|
|
Payments received for services billed
|
(14,558
|
)
|
—
|
|
|
Services provided and billed in current period
|
143,670
|
|
33,763
|
|
|
Payments received for services billed in current period
|
(120,975
|
)
|
—
|
|
|
Impairment
|
(1,006
|
)
|
—
|
|
|
Deferred commissioning period revenue
|
—
|
|
(2,467
|
)
|
|
Closing balance on December 31, 2018
|
24,376
|
|
31,296
|
|
(1) Relates to management fee revenue and liquefaction services revenue, see a) and b) below.
(2) Relates to liquefaction services revenue, see b) below.
a) Management fee revenue:
By virtue of an agreement to offset intercompany balances entered into between us and Golar Partners, of our total contract asset balances above:
|
•
|
$3.1 million
is included in balance sheet line item "Amounts due from related parties" under current assets (
$7.2 million
at
December 31, 2017), and
|
|
•
|
$4.3 million
is included in "Amounts due to related parties" under current liabilities (
$10.0 million
at December 31, 2017).
|
Refer to note 28 for further details of our management fee revenue and contract terms.
b) Liquefaction services revenue:
The
Hilli
is moored in close proximity to the Customer’s gasfields, providing liquefaction service capacity over the term of the LTA. Liquefaction services revenue recognized comprises the following amounts:
|
Year Ended
December 31, |
||||
|
(in thousands of $)
|
2018
|
|
2017
|
|
|
Base tolling fee
(1)
|
119,677
|
|
—
|
|
|
Amortization of deferred commissioning period revenue
(2)
|
2,467
|
|
—
|
|
|
Amortization of Day 1 gain
(3)
|
5,817
|
|
—
|
|
|
Other
|
(336
|
)
|
—
|
|
|
Total
|
127,625
|
|
—
|
|
(1) The LTA bills at a base rate in periods when the oil price is
$60
or less per barrel (included in "Liquefaction services revenue" in the consolidated statements of income), and at an increased rate when the oil price is greater than
$60
per barrel (recognized as a derivative and included in "Realized and unrealized gain on oil derivative instrument" in the consolidated statements of income, excluded from revenue and from the transaction price).
(2) Customer billing during the commissioning period, prior to vessel acceptance and commencement of the contract term, of
$33.8 million
is considered an upfront payment for services. These amounts billed are deferred (included in "Other current liabilities" and "Other non-current liabilities" in the consolidated balance sheets) and recognized as part of "Liquefaction services revenue" in the consolidated statements of income evenly over the contract term.
(3) The Day 1 gain was established when the oil derivative instrument was initially recognized in December 2017 for
$79.6 million
(recognized in "Other current liabilities" and "Other non-current liabilities" in the consolidated balance sheets). This amount is amortized and recognized as part of "Liquefaction services revenue" in the consolidated statements of income evenly over the contract term.
F-33
We expect to recognize liquefaction services revenue related to the partially unsatisfied performance obligation at the reporting date evenly over the remaining contract term of less than eight years, including the components of transaction price described above.
|
9.
|
IMPAIRMENT OF NON-CURRENT ASSETS
|
Vessels
The following table presents the market values and carrying values of
nine
of our vessels that we have determined to have market values that are less than their carrying values as of
December 31, 2018
. However, based on the estimated future undiscounted cash flows of these vessels, which are significantly greater than the respective carrying values,
no
impairment was recognized.
(in thousands of $)
|
Vessel
|
2018 Market value
(1)
|
2018 Carrying value
|
Deficit
|
|
Golar Arctic
|
76,750
|
134,400
|
57,650
|
|
Golar Seal
|
178,750
|
179,000
|
250
|
|
Golar Bear
|
182,000
|
183,900
|
1,900
|
|
Golar Frost
|
182,000
|
187,700
|
5,700
|
|
Golar Viking
|
78,250
|
112,300
|
34,050
|
|
Golar Glacier
|
182,500
|
183,500
|
1,000
|
|
Golar Snow
|
184,500
|
191,800
|
7,300
|
|
Golar Ice
|
184,000
|
192,000
|
8,000
|
|
Golar Kelvin
|
183,500
|
185,600
|
2,100
|
(1) Market values are determined using reference to average broker values provided by independent brokers. Broker values are considered an estimate of the market value for the purpose of determining whether an impairment trigger exists. Broker values are commonly used and accepted by our lenders in relation to determining compliance with relevant covenants in applicable credit facilities for the purpose of assessing security quality.
Since vessel values can be volatile, our estimates of market value may not be indicative of either the current or future prices we could obtain if we sold any of the vessels. In addition, the determination of estimated market values may involve considerable judgment, given the illiquidity of the second-hand markets for these types of vessels.
Long-lived assets
The following table presents the impairment charge recognized in relation to equipment included in "Other non-current assets", acquired due to uncertainty of the future usage of this equipment:
|
(in thousands of $)
|
2018
|
|
2017
|
|
2016
|
|
||
|
Impairment charge
|
—
|
|
—
|
|
1,706
|
|
||
Investment in affiliates
In November 2018, Golar Partners announced a distribution cut which failed to translate into an improved share price. Given the failure of the share price to recover and the sustained period of the suppressed share price, we believe that the difference between the carrying value and the fair value of our equity accounted investment is no longer temporary. On December 31, 2018, we recorded an impairment charge of
$149.4 million
.
The fair value of our investment in Golar Partners is categorized within level 2 of the fair value hierarchy. The methodology applied to arrive at the fair value was to apply a Monte Carlo Simulation model to estimate the total equity value of Golar Partners which determines the total distribution payment to all unitholders including Common, GP units and IDRs. The key inputs into the model are the valuation date share price, long term volatility curve and dividend yield of Golar Partners.
F-34
|
10.
|
(LOSSES) GAINS ON DERIVATIVE INSTRUMENTS AND OTHER FINANCIAL ITEMS, NET
|
(Losses) gains on derivative instruments comprise of the following:
|
(in thousands of $)
|
2018
|
|
2017
|
|
2016
|
|
||
|
Mark-to-market adjustment for interest rate swap derivatives (see note 27)
|
604
|
|
6,614
|
|
2,818
|
|
||
|
Mark-to-market adjustment for equity derivatives (see note 27)
|
(30,663
|
)
|
16,622
|
|
24,819
|
|
||
|
Mark-to-market adjustment for foreign exchange swap derivatives
|
(1,151
|
)
|
821
|
|
(993
|
)
|
||
|
Unrealized mark-to-market (losses) gains on Earn-Out Units (see note 19)
|
(7,400
|
)
|
441
|
|
—
|
|
||
|
Interest income (expense) on undesignated interest rate swaps (see note 27)
|
8,069
|
|
(3,802
|
)
|
(10,153
|
)
|
||
|
|
(30,541
|
)
|
20,696
|
|
16,491
|
|
||
Other financial items, net comprise of the following:
|
(in thousands of $)
|
2018
|
|
2017
|
|
2016
|
|
||
|
Impairment of loan
(1)
|
—
|
|
—
|
|
(7,627
|
)
|
||
|
Financing arrangement fees and other costs
|
(244
|
)
|
(677
|
)
|
(404
|
)
|
||
|
Amortization of debt guarantee
|
861
|
|
1,548
|
|
1,563
|
|
||
|
Foreign exchange loss on operations
|
(1,997
|
)
|
(888
|
)
|
(1,909
|
)
|
||
|
Other
|
(101
|
)
|
(52
|
)
|
577
|
|
||
|
|
(1,481
|
)
|
(69
|
)
|
(7,800
|
)
|
||
(1) Given the announcement of a negative Final Investment Decision from the Douglas Channel Project consortium in 2014, we reassessed the recoverability of the loan and accrued interest receivables from the Douglas Channel LNG Assets Partnership ("DCLAP") and concluded that DCLAP would not have the means to satisfy its obligations under the loan. Accordingly, we recognized an impairment charge of
$7.6 million
in 2016.
|
11.
|
INCOME TAXES
|
The components of income tax expense (benefit) are as follows:
|
Year ended December 31
|
||||||||
|
(in thousands of $)
|
2018
|
|
2017
|
|
2016
|
|
||
|
Current tax expense
|
836
|
|
1,478
|
|
1,035
|
|
||
|
Deferred tax expense
|
431
|
|
27
|
|
90
|
|
||
|
Amortization of tax benefit arising on intra-group transfers of non-current assets
|
—
|
|
—
|
|
(1,714
|
)
|
||
|
Total income tax expense (benefit)
|
1,267
|
|
1,505
|
|
(589
|
)
|
||
The income taxes for the years ended
December 31, 2018
,
2017
and
2016
differed from the amount computed by applying the Bermuda statutory income tax rate of
0%
as follows:
|
Year ended December 31
|
||||||||
|
(in thousands of $)
|
2018
|
|
2017
|
|
2016
|
|
||
|
Income taxes at statutory rate
|
—
|
|
—
|
|
—
|
|
||
|
Effect of deferred tax benefit on intra-group transfers of non-current assets
|
—
|
|
—
|
|
(1,714
|
)
|
||
|
Effect of movement in deferred tax balances
|
431
|
|
27
|
|
90
|
|
||
|
Effect of adjustments in respect of current tax in prior periods
|
(369
|
)
|
(5
|
)
|
(334
|
)
|
||
|
Effect of taxable income in various countries
|
1,205
|
|
1,483
|
|
1,369
|
|
||
|
Total tax expense (benefit)
|
1,267
|
|
1,505
|
|
(589
|
)
|
||
F-35
Jurisdictions open to examination
The earliest tax year that remains subject to examination by the major taxable jurisdictions in which we operate are: UK (2017) and Norway (2015).
|
12.
|
LOSS PER SHARE
|
Basic earnings (loss) per share ("EPS") is calculated with reference to the weighted average number of common shares outstanding during the year.
The components of the numerator for the calculation of basic and diluted EPS are as follows:
|
(in thousands of $)
|
2018
|
|
2017
|
|
2016
|
|
||
|
Net loss attributable to Golar LNG Ltd stockholders - basic and diluted
|
(231,428
|
)
|
(179,703
|
)
|
(186,531
|
)
|
||
The components of the denominator for the calculation of basic and diluted EPS are as follows:
|
(in thousands)
|
2018
|
|
2017
|
|
2016
|
|
||
|
Basic and diluted loss per share:
|
|
|
||||||
|
Weighted average number of common shares outstanding
|
100,684
|
|
100,597
|
|
93,933
|
|
||
Loss per share are as follows:
|
|
2018
|
|
2017
|
|
2016
|
|
|||||
|
Basic and diluted
|
$
|
(2.30
|
)
|
$
|
(1.79
|
)
|
$
|
(1.99
|
)
|
||
The effects of stock options and convertible bonds have been excluded from the calculation of diluted EPS for each of the years ended
December 31, 2018
,
2017
and
2016
because the effects were anti-dilutive.
|
13.
|
OPERATING LEASES
|
Rental income
The minimum contractual future revenues to be received on time charters in respect of our vessels as of
December 31, 2018
, were as follows:
|
Year ending December 31
|
||
|
(in thousands of $)
|
|
|
|
2019
|
25,851
|
|
|
Total
|
25,851
|
|
The cost and accumulated depreciation of vessels leased to third parties at
December 31, 2018
and
2017
were
$331.5 million
and
$35.6 million
; and
$191.1 million
and
$53.6 million
, respectively.
F-36
Rental expense
We are committed to making rental payments under operating leases. The future minimum rental payments under our non-cancellable operating leases are as follows:
|
Year ending December 31
|
Total
|
|
|
(in thousands of $)
|
|
|
|
2019
|
5,417
|
|
|
2020
|
3,756
|
|
|
2021
|
2,682
|
|
|
2022
|
2,425
|
|
|
2023 and thereafter
|
6,180
|
|
|
Total minimum lease payments
|
20,460
|
|
Total rental expense for operating leases was
$8.2 million
,
$19.3 million
and
$29.6 million
for the years ended
December 31, 2018
,
2017
and
2016
, respectively. In prior years, the
Golar Grand
was chartered back from Golar Partners under agreements executed at the time of its disposals to Golar Partners. The
Golar Grand
charter-back arrangement with Golar Partners ceased in October 2017.
Total rental expense for operating leases for the year ended
December 31, 2018
includes
$6.1 million
of minimum rental expense,
$2.2 million
of contingent rental expense and sublease rental income of
$0.1 million
.
|
14.
|
RESTRICTED CASH AND SHORT-TERM DEPOSITS
|
Our restricted cash and short-term deposits balances are as follows:
|
(in thousands of $)
|
2018
|
|
2017
|
|
|
|
Restricted cash relating to the total return equity swap
(1)
|
82,863
|
|
58,351
|
|
|
|
Restricted cash in relation to the
Hilli
(2)
|
174,597
|
|
174,737
|
|
|
|
Restricted cash and short-term deposits held by lessor VIEs
(3)
|
176,428
|
|
130,063
|
|
|
|
Restricted cash relating to the $1.125 billion debt facility
(4)
|
17,657
|
|
33,752
|
|
|
|
Collateral on the Margin Loan Facility
(5)
|
33,413
|
|
—
|
|
|
|
Restricted cash relating to office lease
|
777
|
|
813
|
|
|
|
Bank guarantee
|
691
|
|
99
|
|
|
|
Total restricted cash and short-term deposits
|
486,426
|
|
397,815
|
|
|
|
Less: Amounts included in current restricted cash and short-term deposits
|
(332,033
|
)
|
(222,265
|
)
|
|
|
Long-term restricted cash
|
154,393
|
|
175,550
|
|
|
(1) Restricted cash relating to the share repurchase forward swap refers to the collateral required by the bank with whom we entered into a total return equity swap. Collateral of
20%
of the total purchase price is required and this is subsequently adjusted with reference to the Company's share price (see note 27).
(2) In November 2015, in connection with the issuance of a
$400 million
letter of credit by a financial institution to our project partner involved in the
Hilli
FLNG project, we posted an initial cash collateral sum of
$305.0 million
to support the performance guarantee.
Under the provisions of the
$400 million
letter of credit, the terms allow for a stepped reduction in the value of the guarantee over time and thus, conversely, a reduction in the cash collateral requirements. Effective December 19, 2017, the
$400 million
letter of credit reduced to
$300 million
. The corresponding release of
$57.2 million
cash collateral reduced the cash collateral requirement to
$174.7 million
at December 31, 2017, with no further reduction in 2018. It is expected that the letter of credit will further reduce to
$250.0 million
during 2019.
F-37
In November 2016, after certain conditions precedent were satisfied by the Company, the letter of credit required in accordance with the signed LTA was re-issued and, with an initial expiry date of December 31, 2018, the letter of credit automatically extends, on an annual basis, until the tenth anniversary of the acceptance date of the
Hilli
by the charterer, unless the bank should exercise its option to exit from this arrangement by giving three months' notice prior to the annual renewal date.
(3) These are amounts held by lessor VIE entities that we are required to consolidate under U.S. GAAP into our financial statements as VIEs (see note 5).
(4) This refers to cash deposits required under the
$1.125 billion
debt facility (see note 20). The covenant requires that, on the second anniversary of drawdown under the facility, where we fall below a prescribed EBITDA to debt service ratio, additional cash deposits with the financial institution are required to be made or maintained.
(5) Collateral held against the Margin Loan Facility is required to satisfy one of the mandatory prepayment events within the facility, with this having been triggered when the closing price of the Golar Partners common units pledged by us as security for the obligations under the facility fell below a defined threshold. If certain requirements are met, the facility allows for the release of the collateral (see note 20).
Restricted cash does not include minimum consolidated cash balances of
$50.0 million
(see note 20) required to be maintained as part of the financial covenants for our loan facilities, as these amounts are included in "Cash and cash equivalents".
|
15.
|
OTHER CURRENT ASSETS
|
|
(in thousands of $)
|
2018
|
|
2017
|
|
|
|
Prepaid expenses
|
4,285
|
|
3,045
|
|
|
|
Other receivables
|
14,435
|
|
3,002
|
|
|
|
|
18,720
|
|
6,047
|
|
|
|
16.
|
INVESTMENTS IN AFFILIATES
|
At
December 31, 2018
and
2017
, we have the following participation in investments that are recorded using the equity method:
|
|
2018
|
|
2017
|
|
|
|
Golar Partners
(1)
|
32.0
|
%
|
31.8
|
%
|
|
|
Egyptian Company for Gas Services S.A.E ("ECGS")
|
50
|
%
|
50
|
%
|
|
|
Golar Power
|
50
|
%
|
50
|
%
|
|
|
OneLNG
|
51
|
%
|
51
|
%
|
|
|
The Cool Pool Limited ("Pool Manager")
(2)
|
50
|
%
|
33
|
%
|
|
|
Avenir LNG Limited ("Avenir")
|
22.5
|
%
|
—
|
|
|
(1) As of
December 31, 2018
, we held a
32.0%
(
2017
:
31.8%
) ownership interest in Golar Partners (including our
2%
general partner interest) and
100%
of the IDRs.
(2) The Pool Manager is a Marshall Islands service company that was established in September 2015 to facilitate the joint operations under the Cool Pool. Following the exit of one participant from the pool in June 2018, our participation increased to
50%
.
F-38
The carrying amounts of our investments in our equity method investments as at
December 31, 2018
and
2017
are as follows:
|
(in thousands of $)
|
2018
|
|
2017
|
|
|
|
Golar Partners
|
271,160
|
|
467,097
|
|
|
|
Golar Power
|
266,151
|
|
228,696
|
|
|
|
OneLNG
|
—
|
|
2,047
|
|
|
|
Avenir
|
28,710
|
|
—
|
|
|
|
Others
(1)
|
5,761
|
|
5,385
|
|
|
|
Equity in net assets of affiliates
|
571,782
|
|
703,225
|
|
|
1
Others largely relate to our investment in ECGS amounting to
$5.3 million
and
$5.4 million
as at
December 31, 2018
and
2017
, respectively.
The components of equity in net assets of non-consolidated affiliates are as follows:
|
(in thousands of $)
|
2018
|
|
2017
|
|
|
|
Cost
|
981,196
|
|
877,810
|
|
|
|
Dividends
|
(336,286
|
)
|
(287,263
|
)
|
|
|
Equity in net earnings of affiliates
|
95,458
|
|
107,553
|
|
|
|
Impairment of investment in affiliate
|
(149,389
|
)
|
—
|
|
|
|
Share of other comprehensive income of affiliates
|
(19,197
|
)
|
5,125
|
|
|
|
Equity in net assets of affiliates
|
571,782
|
|
703,225
|
|
|
Quoted market prices for ECGS, Golar Power and OneLNG are not available because these companies are not publicly traded.
Golar Partners
Golar Partners is an owner and operator of FSRUs and LNG carriers under long-term charters. Golar Partners is listed on the NASDAQ. Since the deconsolidation date of Golar Partners in December 2012, we have accounted for all our investments (Common Units, GP Units and IDRs) in Golar Partners under the equity method. The initial carrying value of our investments in Golar Partners was based on the fair value on the deconsolidation date. Subsequently the day one value was adjusted for our share of Golar Partners earnings and distributions received. On December 31, 2018, we recognized an impairment charge of
$149.4 million
. See note 9 for further details.
Exchange of Incentive Distribution Rights "IDR Reset"
On October 13, 2016, we entered into an equity exchange agreement with Golar Partners in which we reset our rights to receive cash distributions in respect of our interests in the incentive distribution rights, or Old IDRs, in exchange for the issuance of (i) New IDRs, (ii) an aggregate of
2,994,364
common units and
61,109
general partner units, and (iii) an aggregate of up to
748,592
additional common units and up to
15,278
additional general partner units that may be issued if target distributions are met ("the Earn-Out Units"). Based on the agreement, half of the Earn-Out Units ("first tranche") would vest if Golar Partners paid a distribution equal to, or greater than,
$0.5775
per common unit in each of the quarterly periods ended December 31, 2016, March 31, 2017, June 30, 2017 and September 30, 2017. Having satisfied the minimum quarterly distribution in respect of these quarters, Golar Partners issued to Golar
374,295
common units and
7,639
general partner units on November 15, 2017. The New IDRs result in the minimum distribution level increasing from
$0.3850
per common unit to
$0.5775
per common unit. The fair value of the Old IDRs was not materially different to the fair value of all of the newly issued instruments. The agreement also required Golar Partners to pay Golar the distributions that it would have been entitled to receive on these units in respect of each of those four preceding quarters. Therefore, in connection with the issuance of the above Earn-Out Units, Golar also received
$0.9 million
in dividends in the prior period. The remaining Earn-Out Units ("second tranche") would be issued if Golar Partners paid a distribution equal to
$0.5775
per common unit in the periods ending December 31, 2017, March 31, 2018, June 30, 2018 and September 30, 2018. Having not satisfied the minimum quarterly distribution over all of these quarters, the second tranche did not vest.
In relation to the IDR Reset transaction, we applied "carry over" accounting and determined that the Earn-Out Units met the definition of a derivative. Accordingly, the overall effect of the IDR Reset on the transaction date was (i) a reclassification of the initial fair value of the derivative from "Investment in affiliates" to "Other non-current assets" of
$15.0 million
, and (ii) the residual
F-39
carrying value of the Old IDRs (after reclassification of the derivative fair value) was reallocated across the new instruments on a relative fair value basis. As of December 31, 2017, following the issuance of the first tranche of the Earn-Out Units, the fair value of the derivative amounted to
$7.4 million
. The decrease in Golar Partners' quarterly distribution to
$0.4042
per common unit on October 24, 2018 resulted in the Earn-Out Units not crystallizing and, accordingly, we recognized a mark-to-market loss of
$7.4 million
for the year ended
December 31, 2018
, effectively reducing the derivative asset to $
nil
.
ECGS
In December 2005, we entered into an agreement with the Egyptian Natural Gas Holding Company and HK Petroleum Services to establish a jointly owned company, ECGS, to develop operations in Egypt, particularly in hydrocarbon and LNG related areas.
In March 2006, we acquired
0.5 million
common shares in ECGS at a subscription price of
$1
per share. This represents a
50%
interest in the voting rights of ECGS and, in December 2011, ECGS called up its remaining share capital amounting to
$7.5 million
. Of this, we paid
$3.75 million
to maintain our
50%
equity interest.
As ECGS is jointly owned and operated together with other third parties, we have adopted the equity method of accounting for our
50%
investment in ECGS, as we consider we have joint control. Dividends received for each of the years ended
December 31, 2018
and
2017
were $
0.2 million
and $
nil
, respectively.
Golar Power
In July 2016, we entered into certain agreements forming a 50/50 joint venture, Golar Power, with private equity firm Stonepeak. Under the terms of the shareholders' agreement in relation to the formation of the joint venture company, we disposed of the entities that own and operate
Golar Penguin
,
Golar Celsius
, newbuild
Golar Nanook
and LNG Power Limited to Golar Power. As a result, commencing July 6, 2016, Golar Power and its subsidiaries have been considered as our affiliates and not as controlled subsidiaries of the Company. Accordingly, with effect from July 6, 2016, our investment in Golar Power has been accounted for under the equity method of accounting.
Under the shareholders' agreement, we and Stonepeak have agreed to contribute additional funding to Golar Power on a pro rata basis. During the year ended
December 31, 2018
, we contributed a further
$55.0 million
to Golar Power as a result of this agreement. In addition, interest costs capitalized on the investment in Golar Power for the years ended
December 31, 2018
and
2017
, were $
10.5 million
and
$6.6 million
, respectively.
OneLNG
On July 25, 2016 Golar and Schlumberger B.V. ("Schlumberger") entered into an agreement to form OneLNG, a joint venture, with the intention to offer an integrated upstream and midstream solution for the development of low cost gas reserves to LNG. In accordance with the joint venture and shareholders' agreement, Golar holds
51%
and Schlumberger the remaining
49%
of OneLNG. By virtue of substantive participation rights held by Schlumberger, we account for our investment in OneLNG under the equity method of accounting. The delays in finalizing a debt financing package for the Fortuna FLNG project, together with other capital and resource priorities, has resulted in a decision from Schlumberger to end their participation in the project. Golar and Schlumberger, as a result of this, have commenced the winding down of OneLNG and will work on FLNG projects as required on a case-by-case basis. As a result, we have written down our investment in OneLNG to $
nil
as at
December 31, 2018
.
Pool Manager
In October 2015, we entered into an LNG carrier pooling arrangement with GasLog Carriers Ltd ("GasLog") and Dynagas Ltd ("Dynagas") to market our vessels which are currently operating in the LNG shipping spot market. In June 2018, Dynagas exited the pooling arrangement. As of
December 31, 2018
, the Cool Pool comprised of
16
vessels, of which
eight
vessels were contributed by us,
six
vessels by GasLog and
two
vessels by Golar Power. The vessel owner continues to be fully responsible for the manning and the technical management of their respective vessels. For the operation of the Cool Pool, a Marshall Islands service company ("Pool Manager") was established in September 2015. The Pool Manager is jointly owned and controlled by us and GasLog.
F-40
Avenir
On October 1, 2018, Avenir issued a private placement of
99 million
shares at a par price of
$1
per share, which was successfully completed at a subscription price of
$1
per share. Of the
99 million
shares placed, we subscribed for
24.8 million
shares, representing an investment of
$24.8 million
, or
25%
. The investment is part of a combined commitment of up to
$182.0 million
from Stolt-Nielsen Limited ("Stolt-Nielsen") (an entity affiliated with our director Niels Stolt Nielsen), Höegh LNG Holdings Limited ("Höegh") and Golar for the pursuit of opportunities in small-scale LNG, including the delivery of LNG to areas of stranded gas demand, the development of LNG bunkering services and supply to the transportation sector.
The consideration of
$24.8 million
, was deemed less than our proportionate share of net assets acquired in Avenir, at fair value. Therefore, during the year ended
December 31, 2018
we recognized negative goodwill of
$3.8 million
in equity in net (losses) earnings of affiliates to reflect our bargain purchase.
Avenir intends to utilize the best-in-class capabilities of its anchor investors to build a global presence as the leading provider of small-scale LNG, and it will be among the first movers in this market with a fleet of small-scale LNG carriers and terminals. The market for small-scale LNG is rapidly expanding, with great potential to be realized in the off-grid power, transportation and bunkering markets because of high-margin oil-to-gas switching, policy changes and environmental benefits of consuming LNG relative to alternative fossil fuels. The forthcoming IMO 2020 regulations are one of many driving factors for increased small-scale LNG consumption, and Avenir plans to introduce safe and efficient ship-to-ship bunkering services at key strategic ports to meet and develop demand for LNG as a marine fuel.
Avenir was originally formed by Stolt-Nielsen in 2017 to provide LNG to markets lacking access to LNG pipelines. Stolt-Nielsen will consolidate all its LNG activities into Avenir, including four small-scale LNG carriers currently under construction at Keppel Singmarine in Nantong, China, two small-scale LNG carriers on order from Sinopacific Offshore Engineering in Nantong, China and a 80% ownership in an LNG terminal and distribution facility under development in the Italian port of Oristano, Sardinia. Avenir plans to source and ship LNG to the terminal using small LNG carriers, and distribute the LNG in trucks and through regasification into the local gas grid.
On November 8, 2018, Avenir placed a further
11 million
shares, also at a subscription price of
$1
per share, with a group of institutional and other professional investors and, subsequent to this placement, Stolt-Nielsen, Höegh and Golar have a
45%
,
22.5%
and
22.5%
participation in Avenir, respectively.
Avenir's shares were listed on the N-OTC with effect from November 14, 2018.
Summarized financial information of the affiliated undertakings shown on a
100%
basis are as follows:
|
(in thousands of $)
|
December 31, 2018
|
December 31, 2017
|
|||||||||||||||||||||
|
ECGS
|
Golar Partners
|
Pool Manager
|
Golar Power
|
OneLNG
|
Avenir
|
ECGS
|
Golar Partners
|
Pool Manager
|
Golar Power
|
OneLNG
|
|||||||||||||
|
Balance Sheet
|
|
|
|||||||||||||||||||||
|
Current assets
|
22,955
|
|
164,529
|
|
98,448
|
|
79,029
|
|
4,884
|
|
78,591
|
|
37,476
|
|
311,496
|
|
40,661
|
|
61,374
|
|
14,955
|
|
|
|
Non-current assets
|
244
|
|
2,076,288
|
|
—
|
|
955,100
|
|
—
|
|
20,840
|
|
333
|
|
2,115,875
|
|
—
|
|
713,646
|
|
—
|
|
|
|
Current liabilities
|
11,510
|
|
323,508
|
|
98,448
|
|
285,447
|
|
8,741
|
|
1,760
|
|
25,836
|
|
180,087
|
|
40,661
|
|
60,033
|
|
10,941
|
|
|
|
Non-current liabilities
|
1,203
|
|
1,157,792
|
|
—
|
|
149,114
|
|
—
|
|
—
|
|
1,203
|
|
1,399,683
|
|
—
|
|
174,656
|
|
—
|
|
|
|
Non-controlling interests
|
—
|
|
79,902
|
|
—
|
|
1,541
|
|
—
|
|
—
|
|
—
|
|
76,544
|
|
—
|
|
—
|
|
—
|
|
|
|
|
|
|
|||||||||||||||||||||
|
|
|
|
|||||||||||||||||||||
|
Revenue
|
30,596
|
|
346,650
|
|
346,170
|
|
78,732
|
|
7
|
|
487
|
|
44,052
|
|
433,102
|
|
159,460
|
|
7,354
|
|
—
|
|
|
|
Net income (loss)
|
207
|
|
76,548
|
|
—
|
|
(10,202
|
)
|
(6,646
|
)
|
(975
|
)
|
1,047
|
|
144,848
|
|
—
|
|
(7,899
|
)
|
(14,883
|
)
|
|
F-41
|
17.
|
ASSET UNDER DEVELOPMENT
|
|
(in thousands of $)
|
2018
|
|
2017
|
|
|
Purchase price installments
|
—
|
|
962,709
|
|
|
Interest costs capitalized
|
—
|
|
116,416
|
|
|
Other costs capitalized
(1)
|
20,000
|
|
98,364
|
|
|
|
20,000
|
|
1,177,489
|
|
(1)
Other capitalized costs relate to the carrying value of the vessel earmarked for conversion.
In May 2014, we entered into agreements for the conversion of the
Hilli
to a FLNG. The primary vessel conversion contract was entered into with Keppel. The
Hilli
was delivered to Keppel in Singapore in September 2014 for the commencement of her conversion. On completion of the
Hilli
FLNG
conversion and commissioning, we reclassified the total balance to "Vessels and equipment, net" in our consolidated balance sheet as of
December 31, 2018
.
In October 2014, we entered into agreements for the conversion of the
Gimi
to a FLNG. The primary vessel conversion contract was entered into with Keppel in December 2018. In February 2019, Golar entered into an agreement with BP for the charter of a FLNG unit,
Gimi
, to service the Greater Tortue Ahmeyim project for a
20
-year period expected to commence in 2022. The
Gimi
was delivered to Keppel shipyard in Singapore to undergo initial works in connection with her conversion in early 2019. Accordingly, the carrying value of the
Gimi
of
$20.0 million
has been reclassified from "Vessels and equipment, net" to "Asset under development" as of the reporting date.
F-42
|
18.
|
VESSELS AND EQUIPMENT, NET
|
|
(in thousands of $)
|
2018
|
|
2017
|
|
|
Cost
|
||||
|
As of January 1
|
2,431,136
|
|
2,438,720
|
|
|
Additions
|
11,304
|
|
1,349
|
|
|
Transfer from asset under development
(1)
|
1,296,431
|
|
—
|
|
|
Transfer to asset under development
|
(90,828
|
)
|
—
|
|
|
Write-offs
|
(9,995
|
)
|
(8,933
|
)
|
|
As of December 31
|
3,638,048
|
|
2,431,136
|
|
|
Depreciation, amortization and impairment
|
||||
|
As of January 1
|
(354,077
|
)
|
(284,889
|
)
|
|
Charge for the year
(2)
|
(93,415
|
)
|
(76,522
|
)
|
|
Transfer to asset under development
|
70,828
|
|
—
|
|
|
Write-offs
|
9,995
|
|
7,334
|
|
|
As of December 31
|
(366,669
|
)
|
(354,077
|
)
|
|
—
|
|
|||
|
Net book value as at December 31
|
3,271,379
|
|
2,077,059
|
|
(1) On completion of the
Hilli
FLNG conversion and commissioning, we reclassified the total balance from "Asset under development" in our consolidated balance sheet as of
December 31, 2018
. Capitalized interest costs of
$148.1 million
are included in the cost amounts above as of
December 31, 2018
.
(2) Depreciation and amortization charge for the year ended
December 31, 2018
excludes
$0.3 million
of amortization charged to non-current assets in relation to the Cameroon License fee.
Drydocking costs of
$133.3 million
and
$37.4 million
are included in the cost amounts above as of
December 31, 2018
and
2017
, respectively. Accumulated amortization of those costs as of
December 31, 2018
and
2017
were
$26.0 million
and
$24.3 million
, respectively.
Depreciation and amortization expense for each of the years ended
December 31, 2018
,
2017
and
2016
was
$93.4 million
,
$76.5 million
and
$73.0 million
, respectively.
As at
December 31, 2018
and
2017
, vessels with a net book value of $
3,244.3 million
and
$2,032.7 million
, respectively, were pledged as security for certain debt facilities (see note 30).
As at
December 31, 2018
and
2017
, included in the above amounts is office equipment with a net book value of
$5.7 million
and
$3.9 million
, respectively.
F-43
|
19.
|
OTHER NON-CURRENT ASSETS
|
|
(in thousands of $)
|
2018
|
|
2017
|
|
|
|
Oil derivative instrument (see note 27)
|
84,730
|
|
94,700
|
|
|
|
Other non-current assets
(1)
|
40,729
|
|
37,891
|
|
|
|
Mark-to-market interest rate swaps valuation (see note 27)
|
6,298
|
|
10,166
|
|
|
|
OLT Offshore LNG Toscana S.p.A ("OLT–O")
(2)
|
7,347
|
|
7,347
|
|
|
|
Derivatives - other (see note 16)
|
—
|
|
7,400
|
|
|
|
|
139,104
|
|
157,504
|
|
|
(1) "Other non-current assets" is mainly comprised of payments made relating to long lead items ordered in preparation for the conversion of the
Gimi
into a FLNG vessel. As of
December 31, 2018
and
2017
, the aggregate carrying value was
$31.0 million
. The
Gimi
conversion contract was executed on December 13, 2018 subsequent to the receipt of a limited Notice to Proceed from BP in relation to the Greater Tortue Ahmeyim project.
(2) "Investment in OLT Offshore LNG Toscana S.p.A ("OLT-O")" refers to our investment in an Italian incorporated unlisted company which is involved in the construction, development, operation and maintenance of a FSRU terminal to be situated off the Livorno coast of Italy. In prior years, this investment was classified as a cost method investment. Following the adoption of ASU 2016-01, we have applied the measurement alternative for measuring equity investments without readily determinable fair values. As of
December 31, 2018
and 2017, our investment in OLT-O was
$7.3 million
, representing a
2.7%
interest in OLT-O’s issued share capital.
|
20.
|
DEBT
|
|
(in thousands of $)
|
2018
|
|
2017
|
|
|
|
Total long-term and short-term debt
|
2,565,359
|
|
2,410,847
|
|
|
|
Less: current portion of long-term debt and short-term debt
|
(730,257
|
)
|
(1,384,933
|
)
|
|
|
Long-term debt
|
1,835,102
|
|
1,025,914
|
|
|
The outstanding debt as of
December 31, 2018
is repayable as follows:
|
Year ending December 31
|
Golar debt
|
|
VIE debt
(1)
|
|
Total debt
|
|
||
|
(in thousands of $)
|
|
|||||||
|
2019
|
85,225
|
|
646,959
|
|
732,184
|
|
||
|
2020
|
163,383
|
|
82,260
|
|
245,643
|
|
||
|
2021
|
21,716
|
|
82,260
|
|
103,976
|
|
||
|
2022
|
375,377
|
|
82,260
|
|
457,637
|
|
||
|
2023
|
21,716
|
|
82,260
|
|
103,976
|
|
||
|
2024 and thereafter
|
65,151
|
|
873,629
|
|
938,780
|
|
||
|
Total
|
732,568
|
|
1,849,628
|
|
2,582,196
|
|
||
|
Deferred finance charges
|
(14,494
|
)
|
(2,343
|
)
|
(16,837
|
)
|
||
|
Total
|
718,074
|
|
1,847,285
|
|
2,565,359
|
|
||
(1) These amounts relate to certain lessor entities (for which legal ownership resides with financial institutions) that we are required to consolidate under U.S. GAAP into our financial statements as variable interest entities (see note 5).
F-44
At
December 31, 2018
and
2017
, our debt was as follows:
|
(in thousands of $)
|
2018
|
|
2017
|
|
Maturity date
|
||
|
Golar Arctic facility
|
58,300
|
|
65,600
|
|
2019
|
||
|
Golar Viking facility
|
46,875
|
|
52,083
|
|
2020
|
||
|
2017 Convertible bonds
|
353,661
|
|
340,173
|
|
2022
|
||
|
Margin Loan
|
100,000
|
|
119,125
|
|
2020
|
||
|
FLNG Hilli facility
|
—
|
|
525,000
|
|
2018
|
||
|
Hilli shareholder loans:
|
|||||||
|
- Keppel loan
|
—
|
|
44,066
|
|
2027
|
||
|
- B&V loan
|
—
|
|
5,000
|
|
2027
|
||
|
$1.125 billion facility:
|
|||||||
|
- Golar Bear facility
|
86,200
|
|
96,975
|
|
2024/2026*
|
||
|
- Golar Frost facility
|
87,532
|
|
98,474
|
|
2024/2026*
|
||
|
Subtotal (excluding lessor VIE loans)
|
732,568
|
|
1,346,496
|
|
|||
|
ICBCL VIE loans:
|
|||||||
|
- Golar Glacier facility
|
154,226
|
|
161,876
|
|
2018/2024**
|
||
|
- Golar Snow facility
|
154,566
|
|
162,566
|
|
2018/2025**
|
||
|
- Golar Kelvin facility
|
182,540
|
|
182,540
|
|
**
|
||
|
- Golar Ice facility
|
117,888
|
|
134,954
|
|
**
|
||
|
CMBL VIE loan:
|
|||||||
|
- Golar Tundra facility
|
121,741
|
|
198,613
|
|
2026**
|
||
|
CCBFL VIE loan:
|
|||||||
|
- Golar Seal facility
|
123,524
|
|
143,849
|
|
2026**
|
||
|
COSCO VIE loan:
|
|||||||
|
- Golar Crystal facility
|
97,163
|
|
104,006
|
|
2027**
|
||
|
CSSC VIE loan:
|
|||||||
|
- Hilli facility
|
897,980
|
|
—
|
|
2028**
|
||
|
Total debt (gross)
|
2,582,196
|
|
2,434,900
|
|
|||
|
Deferred finance charges
|
(16,837
|
)
|
(24,053
|
)
|
|||
|
Total debt
|
2,565,359
|
|
2,410,847
|
|
|||
* The commercial loan tranche matures earlier of the two dates, with the remaining balance maturing at the latter date. However, in the event that the commercial tranche is not refinanced within five years, the lenders have the option to demand repayment. In October 2018, the maturity of the commercial tranche, and consequently the option to the lenders, was extended by five years, to 2024.
** This represents the total loan facilities drawn down by subsidiaries of ICBCL, CMBL, CCBFL, COSCO and CSSC, which we consider to be VIEs. See note 5.
Golar Arctic facility
In December 2014, we entered into a secured loan facility for
$87.5 million
for the purpose of refinancing the
Golar Arctic
. The Golar Arctic facility bears interest at LIBOR plus a margin of
2.25%
and is repayable in quarterly installments over a term of
five
years with a final balloon payment of
$52.8 million
due in December 2019.
Golar Viking facility
In December 2015, we entered into a
$62.5 million
secured loan facility, with certain lenders, to finance the
Golar Viking
upon repossession of the vessel from Equinox. The facility is repayable in quarterly installments over a term of
five
years with a final balloon payment of
$37.8 million
due in December 2020. This facility bears interest at LIBOR plus a margin of
2.5%
.
F-45
2017 Convertible bonds
On February 17, 2017, we closed a new
$402.5 million
senior unsecured
five
years
2.75%
convertible bond. The conversion rate for the bonds was initially equal to
26.5308
common shares per $1,000 principal amount of the bonds. This is equivalent to an initial conversion price of
$37.69
per common share, or a
35%
premium on the February 13, 2017 closing share price of
$27.92
. The conversion price is subject to adjustment for dividends paid. To mitigate the dilution risk of conversion to common equity, we also entered into capped call transactions costing approximately
$31.2 million
. The capped call transactions cover approximately
10,678,647
common shares, have an initial strike price of
$37.69
, and an initial cap price of
$48.86
. The cap price of
$48.86
, which is a proxy for the revised conversion price, represents a
75%
premium on the February 13, 2017 closing share price of
$27.92
. Including the
$31.2 million
cost of the capped call, the all-in cost of the bond is approximately
4.3%
. Bond proceeds, net of fees and the cost of the capped call, amounted to
$360.2 million
. On inception, we recognized a liability of
$320.3 million
and an equity portion of
$39.9 million
.
During 2018, the quarterly dividends in respect of the second and third quarter results exceeded the dividend threshold and resulted in an adjustment to the initial conversion rate. The distribution of the second quarter results, of
$0.125
per share, increased the conversion rate to
26.6102
. This corresponds to a conversion price of
$37.58
. The distribution of the third quarter results, of
$0.15
per share, further increased the conversion rate to
26.6375
. This corresponds to a conversion price of
$37.54
.
Margin Loan Facility
We entered into a loan agreement, dated March 3, 2017, among one of our wholly-owned subsidiaries, as borrower, Golar LNG Limited, as guarantor, Citibank, N.A., as administrative agent, initial collateral agent and calculation agent, and Citibank, N.A., as lender. We refer to this as the Margin Loan Facility. Pursuant to the Margin Loan Facility Citibank, N.A. provided a loan in the amount of
$150 million
. The Margin Loan Facility has a term of
three years
, an interest rate of LIBOR plus a margin of
3.95%
and is secured by our Golar Partners common units and their associated distributions, and in certain cases, cash or cash equivalents. The Margin Loan Facility contains conditions, representations and warranties, covenants (including loan to value requirements), mandatory prepayment events, facility adjustment events, events of default and other provisions customary for a facility of this nature. The loan was primarily used to pay a portion of the amounts due under our
3.75%
convertible senior secured bonds due March 2017, or the Prior Convertible Bonds. Concurrently with the repayment of the Prior Convertible Bonds, the trustee for these bonds released our Golar Partners common units that had been pledged to secure them. In connection with the entry into the Margin Loan Facility, we pledged
20,852,291
Golar Partners common units as security for the obligations under the facility. This was increased to
21,226,586
as part of the amendments to the facility in 2018.
During July 2018, amendments to the existing Margin Loan Facility were completed. Although most of the existing terms remain substantially unchanged, the facility will no longer amortize, remaining at
$100 million
until maturity. Previously the dividend cash received from the pledged Partnership shares was first used to service the interest on the loan, any excess cash was then used to prepay a portion of the principal. Under the modified agreement, any excess cash after servicing the interest will be returned to Golar. Subject to the satisfaction of certain covenants, no further principal repayments will be required ahead of loan maturity in March 2020.
At December 31, 2018, collateral held against the Margin Loan Facility is required to satisfy one of the mandatory prepayment events within the facility, with this having been triggered when the closing price of the Golar Partners common units pledged by us as security for the obligations under the facility fell below a defined threshold. If certain requirements are met, the facility allows for the release of the collateral. See note 14.
FLNG Hilli facility
In September 2015, in connection with the conversion of the
Hilli
to a FLNG, we entered into agreements with a subsidiary of CSSC for a pre-delivery credit facility and post-delivery sale and leaseback financing.
Hilli pre-delivery facility
Under the pre-delivery credit facility, we entered into an agreement with a subsidiary of CSSC to lend us up to
$700 million
or
60%
of the initial project budget for the conversion of the
Hilli
to partly finance the costs of conversion. The credit facility was non-amortizing with the principal payable at the earlier of August 30, 2018 or sale of the converted
Hilli
to a subsidiary of CSSC under the sale and leaseback arrangement (described below under "Hilli post-delivery sale and leaseback financing"). The facility bore interest at a fixed rate of
6.25%
per annum. Upon acceptance of the
Hilli
in June 2018, we repaid
$640.0 million
on the pre-delivery credit facility and drew down
$960.0 million
on the post-acceptance sale and leaseback financing.
F-46
Hilli post-delivery sale and leaseback financing
On May 31, 2018, the
Hilli
completed commissioning and acceptance testing procedures, was accepted under the LTA with Perenco and SNH and is began full commercial operation. On June 24, 2018, we repaid
$640.0 million
on the pre-delivery credit facility and drew down
$960.0 million
on the post-acceptance sale and leaseback financing in relation to the FLNG Hilli facility. The proceeds of this sale and leaseback financing were used, in part, to pay off the
Hilli
pre-delivery financing described above. We subsequently leased back the vessel on a bareboat charter for a term of
ten
years. We have options to repurchase the vessel throughout the charter term at fixed pre-determined amounts, commencing from the fifth year anniversary of the commencement of the bareboat charter, with an obligation to repurchase the vessel at the end of the
ten
year lease period (see note 5).
Hilli shareholder loans
Keppel loan
In September 2014, our subsidiary, Golar GHK Lessors Limited ("GGHK"), entered into a Sale and Purchase Agreement with KSI Production Pte Ltd (''KSI''), a subsidiary of Keppel, to sell
10%
of its ownership in Hilli Corp for
$21.7 million
. In consideration, KSI paid the equity value of the shares and acquired a portion of the loans made by GGHK to Hilli Corp. The loan amounted to
$21.7 million
and is shown under "Long-term debt" in our consolidated financial statements as at
December 31, 2017
. The loan bore interest at
6%
per annum. Installment payments of
2.5%
of the value of the loan were payable on a
six
-monthly basis beginning
12
months after final acceptance of the FLNG with a balloon payment
120
months after final acceptance. Since September 2014 through to December 31, 2015, additional cash calls were issued to meet funding requirements relating to the conversion of the
Hilli
to a FLNG. However, during 2015, due to surplus cash balances it was agreed by the Hilli Corp shareholders to return an amount of surplus cash to both KSI and Golar. The amount to be returned to KSI was
$9 million
and resulted in a decrease in the Keppel loan by the same. Accordingly, as of
December 31, 2017
, the balance outstanding under the Keppel shareholder loan was
$44.1 million
. This loan was converted to equity on the Closing Date of the Hilli Disposal (see note 6).
B&V loan
In November 2014, our subsidiary, GGHK, entered into a Sale and Purchase Agreement with Black & Veatch International Company (''B&V''), a subsidiary of Black & Veatch, to sell approximately
1%
of its ownership in Hilli Corp for
$5.0 million
. In consideration B&V paid the equity value of the shares and acquired a portion of the loans made by GGHK to Hilli Corp. The loan amounted to
$5.0 million
and is shown under "Long-term debt" in our consolidated financial statements as at
December 31, 2017
. The loan bore interest at
6%
per annum. Installment payments of
2.5%
of the value of the loan were payable on a
six
-monthly basis beginning
12
months after final acceptance of the FLNG with a balloon payment
120
months after final acceptance. This loan was converted to equity on the Closing Date of the Hilli Disposal (see note 6).
$1.125 billion facility
In July 2013, we entered into a
$1.125 billion
facility to initially fund
eight
of our newbuildings. The facility bears interest at
LIBOR
plus a margin. The facility is divided into
three
tranches, with the following general terms:
|
Tranche
|
Proportion of facility
|
Term of loan from date of drawdown
|
Repayment terms
|
|
K-Sure
|
40%
|
12 years
|
Six-monthly installments
|
|
KEXIM
|
40%
|
12 years
|
Six-monthly installments
|
|
Commercial
|
20%
|
5 years
|
Six-monthly installments, unpaid balance to be refinanced after 5 years
|
The facility bears interest at
LIBOR
plus a margin of
2.10%
for the K-Sure tranche of the facility and
2.75%
for both the KEXIM and commercial tranche of the loan.
The K-Sure tranche is funded by a consortium of lenders, of which
95%
is guaranteed by a Korean Trade Insurance Corporation (or K-Sure) policy; the KEXIM tranche is funded by the Export Import Bank of Korea (or KEXIM). Repayments under the K-Sure and KEXIM tranches are due semi-annually with a 12 year repayment profile. The commercial tranche is funded by a syndicate of banks and is for a term of five years from date of drawdown with a final balloon payment depending on drawdown dates for each respective vessel. In the event the commercial tranche is not refinanced prior to the end of the five years, both K-Sure and KEXIM have an option to demand repayment of the balances outstanding under their respective tranches. In October 2018, the term of the commercial tranche, and consequently the option to K-Sure and KEXIM, was extended by 5 years. The facility is
F-47
further divided into vessel-specific tranches dependent upon delivery and drawdown, with each borrower being the subsidiary owning the respective vessel.
As of
December 31, 2018
, the aggregate balance of the facility was
$173.7 million
and relates to
two
of our vessels: the
Golar Bear
and the
Golar Frost
. However, we continue to guarantee the debt relating to the
Golar Celsius
and the
Golar Penguin
that was assumed by Golar Power in connection with the formation transaction in 2016 (see note 6).
Lessor VIE debt
The following loans relate to our lessor VIE entities, including ICBCL, CMBL, CCBFL, COSCO and CSSC, that we consolidate as variable interest entities ("VIEs"). Although we have no control over the funding arrangements of these entities, we consider ourselves the primary beneficiary of these VIEs and we are therefore required to consolidate these loan facilities into our financial results. See note 5 for additional information.
ICBCL VIE loans
Golar Glacier facility
In October 2014, the SPV, Hai Jiao 1401 Limited, which owns the
Golar Glacier
, entered into secured financing agreements for
$184.8 million
consisting of senior and junior loan facilities which are denominated in USD. The senior loan facility of
$153 million
is a
10
year non-recourse loan provided by ICBC Brussels, with first priority lien on the
Golar
Glacier
.
The senior loan facility bears interest at LIBOR plus a margin and is repayable in semi-annual installments with a balloon payment on maturity. The short-term junior loan facility of
$31.8 million
is provided by ICBCIL Finance Co., a related party of ICBCL. The junior loan facility bears interest at
6%
and is repayable on demand.
Golar Snow facility
In January 2015, the SPV, Hai Jiao 1402 Limited, which owns the
Golar Snow
, entered into secured financing agreements for
$182.6 million
consisting of senior and junior loan facilities which are denominated in USD. The senior loan facility of
$160.0 million
is a
10
year non-recourse loan provided by ICBC Brussels, with a first priority lien on the
Golar Snow
. The senior loan facility bears interest at LIBOR plus a margin and is repayable in semi-annual installments with a balloon payment on maturity. The short-term junior loan facility of
$22.6 million
is provided by ICBCIL Finance Co., a related party of ICBCL. The junior loan facility bears interest at
6%
and is repayable on demand.
Golar Kelvin facility
In January 2015, the SPV, Hai Jiao 1405 Limited, which owns the
Golar Kelvin
, entered into a secured financing agreement for
$182.5 million
. The loan facility is provided by ICBCIL Finance Co., a related party of ICBCL. The loan facility is denominated in USD, bears interest at
6%
and is repayable on demand.
Golar Ice facility
In February 2015, the SPV, Hai Jiao 1406 Limited, which owns the
Golar Ice
, entered into a secured financing agreement for
$172.0 million
. The loan facility is provided by Skysea Malta Capital Company Limited, a related party of ICBCL. The loan facility is denominated in USD, bears interest at
2.78%
and is repayable on demand.
CMBL VIE loan -
Golar Tundra facility
In November 2015, the SPV, Sea 24 Leasing Co Ltd, which owns the
Golar Tundra
, entered into a secured financing agreement. The loan facility is denominated in USD, bears interest at LIBOR plus a margin and was repayable in 2016. In April 2016, Sea 24 Leasing Co Ltd refinanced its debt facilities and entered into long-term debt facilities (the "Tundra Lessor VIE Debt facilities"). The Tundra Lessor VIE Debt facilities bear interest at LIBOR plus a margin and are repayable as balloon payments on maturity.
F-48
A pre-condition of the
Golar Tundra
lease financing with CMBL is for the FSRU to be employed under an effective charter. The termination of the WAGL charter by us means that we now have to find a replacement charter by June 30, 2019 or we could be required to refinance the FSRU. As a result, we have classified the
Golar Tundra
facility as short-term debt as of
December 31, 2018
.
CCBFL VIE loan -
Golar Seal facility
In March 2016, the SPV, Compass Shipping 1 Corporation Limited, which owns the
Golar Seal
, entered into a long-term loan facility for
$162.4 million
. The loan facility is denominated in USD, is a
10
year loan, bears interest at
3.5%
and is repayable in quarterly installments with a balloon payment on maturity.
COSCO VIE loan -
Golar Crystal facility
In March 2017, the SPV, Oriental Fleet LNG 01 Limited, which owns the
Golar Crystal
, obtained an internal loan from its parent company, COSCO Shipping, to fund the purchase of the
Golar Crystal
. The internal loan bore no interest and was repayable on demand.
In April 2018, Oriental Fleet LNG 01 Limited, entered into a long-term loan facility for
$101.0 million
. The loan facility is provided by a related party of COSCO Shipping. The loan facility is denominated in USD, is a
10
year loan, limited to the term of the bareboat charter, bears interest at LIBOR plus a margin and is repayable in monthly installments with a balloon payment on maturity.
CSSC VIE loan -
Hilli facility
In June 2018, the SPV, Fortune Lianjiang Shipping S.A., which owns the
Hilli
, entered into a secured financing agreement for
$840.0 million
. This loan facility is a
10
year non-recourse loan denominated in USD, bears interest at LIBOR plus a margin and is repayable in quarterly installments with a balloon payment on maturity. In addition to this facility, the SPV entered into an internal loan with CSSC for
$120.0 million
. This loan bears no interest and is repayable on demand.
Debt restrictions
Certain of our debts are collateralized by ship liens and, in the case of some debt, pledges of shares by each guarantor subsidiary. The existing financing agreements impose operating and financing restrictions which may significantly limit or prohibit, among other things, our ability to incur additional indebtedness, create liens, sell capital shares of subsidiaries, make certain investments, engage in mergers and acquisitions, purchase and sell vessels, enter into time or consecutive voyage charters or pay dividends without the consent of the lenders. In addition, lenders may accelerate the maturity of indebtedness under financing agreements and foreclose upon the collateral securing the indebtedness upon the occurrence of certain events of default, including a failure to comply with any of the covenants contained in the financing agreements. Many of our debt agreements contain certain covenants, which require compliance with certain financial ratios. Such ratios include current assets: liabilities and minimum net worth and minimum free cash restrictions. With regards to cash restrictions, we have covenanted to retain at least
$50.0 million
of cash and cash equivalents on a consolidated group basis. In addition, as of December 31, 2018 there are cross default provisions in certain of our and Golar Partners' and Golar Power's loan and lease agreements.
In addition to lien security, some of our debt is also collateralized through pledges of equity shares by our guarantor subsidiaries.
As of December 31, 2018, we were in compliance with all our covenants under our various loan agreements.
F-49
|
21.
|
ACCRUED EXPENSES
|
|
(in thousands of $)
|
2018
|
|
2017
|
|
|
|
Vessel operating and drydocking expenses
|
24,041
|
|
10,978
|
|
|
|
Administrative expenses
|
11,042
|
|
9,572
|
|
|
|
Interest expense
|
97,688
|
|
84,249
|
|
|
|
Current tax payable
|
463
|
|
1,096
|
|
|
|
|
133,234
|
|
105,895
|
|
|
Vessel operating and drydocking expense related accruals are composed of vessel operating expenses such as crew wages, vessel supplies, routine repairs, maintenance, drydocking, lubricating oils and insurances.
Administrative expenses related accruals are comprised of general overhead including personnel costs, legal and professional fees, costs associated with project development, property costs and other general expenses.
|
22.
|
OTHER CURRENT LIABILITIES
|
|
(in thousands of $)
|
2018
|
|
2017
|
|
|
|
Deferred operating cost and charterhire revenue
|
8,206
|
|
1,044
|
|
|
|
Mark-to-market foreign exchange swaps valuation (see note 27)
|
1,322
|
|
223
|
|
|
|
Mark-to-market equity swaps valuation (see note 27)
|
70,804
|
|
40,141
|
|
|
|
Day 1 gain deferred revenue - current portion (see note 23)
|
9,950
|
|
7,463
|
|
|
|
Dividends payable
|
16,762
|
|
5,032
|
|
|
|
Other
(1)
|
14,485
|
|
8,379
|
|
|
|
|
121,529
|
|
62,282
|
|
|
(1) This includes amounts owed to Keppel and B&V in relation to the Hilli Disposal.
|
23.
|
OTHER NON-CURRENT LIABILITIES
|
|
(in thousands of $)
|
2018
|
|
2017
|
|
|
|
Day 1 gain deferred revenue
(1)
|
63,834
|
|
72,138
|
|
|
|
Deferred commissioning period revenue
(2)
|
27,076
|
|
—
|
|
|
|
Pension obligations (see note 24)
|
32,972
|
|
37,537
|
|
|
|
Guarantees issued to Golar Partners and Golar Power (see note 28)
|
14,770
|
|
11,429
|
|
|
|
Other
(3)
|
6,912
|
|
11,444
|
|
|
|
|
145,564
|
|
132,548
|
|
|
(1) This represents the corresponding liability upon recognition of the LTA derivative asset. This deferred gain is amortized and recognized as part of "Liquefaction services revenue" in the consolidated statements of operations evenly over the LTA contract term, with this commencing on the customer's acceptance of the
Hilli
. The initial amount recognized was
$79.6 million
, of which
$63.8 million
is non-current at
December 31, 2018
. The current portion of the Day 1 gain deferred revenue is included in "Other current liabilities" (see note 22).
(2) This represents customer billing during the commissioning period, prior to vessel acceptance and commencement of the contract term, which is considered an upfront payment for services. These amounts billed are recognized as part of "Liquefaction services revenue" in the consolidated statements of operations evenly over the LTA contract term, with this commencing on the customer's
F-50
acceptance of the
Hilli
. The initial amount recognized was
$33.8 million
, of which
$27.1 million
is non-current at
December 31, 2018
. The current portion of Deferred commissioning period billing is included in "Other current liabilities" (see note 22).
(3) Included in "Other" is an asset retirement obligation of
$4.4 million
and
$9.8 million
for the years ended
December 31, 2018
and 2017, respectively. The reduction of
$5.4 million
in the current year is as a result of a change in the estimated date on which the obligation will be settled, which resulted in a decrease of
$5.6 million
in the provision, partially offset by
$0.2 million
of accretion recognized for the current year ended
December 31, 2018
. The corresponding asset of
$4.4 million
is recorded within vessels and equipment, net (see note 18).
|
24.
|
PENSIONS
|
Defined contribution scheme
We operate a defined contribution scheme. The pension cost for the period represents contributions payable by us to the scheme. The charge to net income for the years ended
December 31, 2018
,
2017
and
2016
was
$1.9 million
,
$1.7 million
and
$1.3 million
, respectively.
Defined benefit schemes
We have
two
defined benefit pension plans both of which are closed to new entrants but still cover certain of our employees. Benefits are based on the employee's years of service and compensation. Net periodic pension plan costs are determined using the Projected Unit Credit Cost method. Our plans are funded by us in conformity with the funding requirements of the applicable government regulations. Plan assets consist of both fixed income and equity funds managed by professional fund managers.
We use December 31 as a measurement date for our pension plans.
The components of net periodic benefit costs are as follows:
|
(in thousands of $)
|
2018
|
|
2017
|
|
2016
|
|
||
|
Service cost
|
250
|
|
313
|
|
302
|
|
||
|
Interest cost
|
1,687
|
|
1,901
|
|
2,051
|
|
||
|
Expected return on plan assets
|
(926
|
)
|
(843
|
)
|
(806
|
)
|
||
|
Recognized actuarial loss
|
1,392
|
|
1,182
|
|
1,060
|
|
||
|
Net periodic benefit cost
|
2,403
|
|
2,553
|
|
2,607
|
|
||
The estimated net loss for the defined benefit pension plans that will be amortized from accumulated other comprehensive income into net periodic pension benefit cost during the year ended
December 31, 2018
is
$1.4 million
(
2017
:
$1.2 million
).
The change in benefit obligation and plan assets and reconciliation of funded status as of December 31 are as follows:
|
(in thousands of $)
|
2018
|
|
2017
|
|
|
|
Reconciliation of benefit obligation:
|
|
||||
|
Benefit obligation at January 1
|
51,171
|
|
50,376
|
|
|
|
Service cost
|
250
|
|
313
|
|
|
|
Interest cost
|
1,687
|
|
1,901
|
|
|
|
Actuarial (gain)/ loss
|
(3,265
|
)
|
873
|
|
|
|
Foreign currency exchange rate changes
|
(599
|
)
|
1,008
|
|
|
|
Benefit payments
|
(3,151
|
)
|
(3,300
|
)
|
|
|
Benefit obligation at December 31
|
46,093
|
|
51,171
|
|
|
F-51
The accumulated benefit obligation at
December 31, 2018
and
2017
was
$45.3 million
and
$50.2 million
, respectively.
|
(in thousands of $)
|
2018
|
|
2017
|
|
|
|
Reconciliation of fair value of plan assets:
|
|
||||
|
Fair value of plan assets at January 1
|
13,634
|
|
12,503
|
|
|
|
Actual (loss)/ return on plan assets
|
(249
|
)
|
1,039
|
|
|
|
Employer contributions
|
3,617
|
|
2,316
|
|
|
|
Foreign currency exchange rate changes
|
(730
|
)
|
1,076
|
|
|
|
Benefit payments
|
(3,151
|
)
|
(3,300
|
)
|
|
|
Fair value of plan assets at December 31
|
13,121
|
|
13,634
|
|
|
|
(in thousands of $)
|
2018
|
|
2017
|
|
|
|
Projected benefit obligation
|
(46,093
|
)
|
(51,171
|
)
|
|
|
Fair value of plan assets
|
13,121
|
|
13,634
|
|
|
|
Unfunded status
(1)
|
(32,972
|
)
|
(37,537
|
)
|
|
Employer contributions and benefits paid under the pension plans include
$3.6 million
(2017:
$2.3 million
) paid from employer assets for the year ended
December 31, 2018
.
(1) Our plan comprises two schemes. The details of these schemes are as follows:
|
|
December 31, 2018
|
December 31, 2017
|
|||||||||||||||
|
(in thousands of $)
|
UK Scheme
|
|
Marine Scheme
|
|
Total
|
|
UK Scheme
|
|
Marine Scheme
|
|
Total
|
|
|||||
|
Projected benefit obligation
|
(9,818
|
)
|
(36,275
|
)
|
(46,093
|
)
|
(11,654
|
)
|
(39,517
|
)
|
(51,171
|
)
|
|||||
|
Fair value of plan assets
|
12,291
|
|
830
|
|
13,121
|
|
12,968
|
|
666
|
|
13,634
|
|
|||||
|
Funded (unfunded) status at end of year
|
2,473
|
|
(35,445
|
)
|
(32,972
|
)
|
1,314
|
|
(38,851
|
)
|
(37,537
|
)
|
|||||
The fair value of our plan assets, by category, as of
December 31, 2018
and
2017
were as follows:
|
(in thousands of $)
|
2018
|
|
2017
|
|
|
|
Equity securities
|
12,291
|
|
9,921
|
|
|
|
Debt securities
|
—
|
|
3,047
|
|
|
|
Cash
|
830
|
|
666
|
|
|
|
|
13,121
|
|
13,634
|
|
|
The amounts recognized in accumulated other comprehensive income consist of:
|
(in thousands of $)
|
2018
|
|
2017
|
|
|
|
Net actuarial loss (see note 26)
|
9,218
|
|
12,799
|
|
|
The actuarial loss recognized in other comprehensive income is net of tax of
$0.4 million
,
$0.3 million
, and
$0.0 million
for the years ended
December 31, 2018
,
2017
and
2016
, respectively.
The asset allocation for our Marine scheme at
December 31, 2018
and
2017
, by asset category are as follows:
|
Marine scheme
|
2018 (%)
|
2017 (%)
|
|||
|
Cash
|
100
|
10,000
|
|||
|
Total
|
100
|
100
|
|||
F-52
The asset allocation for our UK scheme at
December 31, 2018
and
2017
, by asset category are as follows:
|
UK scheme
|
2018 (%)
|
2017 (%)
|
|||
|
Equity
|
100
|
76.5
|
|||
|
Bonds
|
—
|
23.5
|
|||
|
Total
|
100
|
100
|
|||
Our investment strategy is to balance risk and reward through the selection of professional investment managers and investing in pooled funds.
We are expected to make the following contributions to the schemes during the year ended December 31, 2019, as follows:
|
(in thousands of $)
|
UK scheme
|
Marine scheme
|
|
||
|
Employer contributions
|
510
|
|
2,900
|
|
|
We are expected to make the following pension disbursements as follows:
|
(in thousands of $)
|
UK scheme
|
|
Marine scheme
|
|
|
|
2019
|
330
|
|
3,000
|
|
|
|
2020
|
410
|
|
3,000
|
|
|
|
2021
|
535
|
|
3,000
|
|
|
|
2022
|
355
|
|
3,000
|
|
|
|
2023
|
370
|
|
3,000
|
|
|
|
2024 - 2028
|
2,310
|
|
12,500
|
|
|
The weighted average assumptions used to determine the benefit obligation for our plans for the years ended December 31 are as follows:
|
|
2018
|
|
2017
|
|
|
|
Discount rate
|
3.90
|
%
|
3.40
|
%
|
|
|
Rate of compensation increase
|
2.20
|
%
|
2.32
|
%
|
|
The weighted average assumptions used to determine the net periodic benefit cost for our plans for the years ended December 31 are as follows:
|
|
2018
|
|
2017
|
|
|
|
Discount rate
|
3.40
|
%
|
3.87
|
%
|
|
|
Expected return on plan assets
|
6.75
|
%
|
6.75
|
%
|
|
|
Rate of compensation increase
|
2.32
|
%
|
2.38
|
%
|
|
The overall expected long-term rate of return on assets assumption used to determine the net periodic benefit cost for our plans for the years ended
December 31, 2018
and
2017
is based on the weighted average of various returns on assets using the asset allocation as at the beginning of
2018
and
2017
. For equities and other asset classes, we have applied an equity risk premium over ten year governmental bonds.
|
25.
|
SHARE CAPITAL AND SHARE OPTIONS
|
Our ordinary shares are listed on the Nasdaq Stock Exchange.
F-53
As at
December 31, 2018
and
2017
, our authorized and issued share capital is as follows:
Authorized share capital:
|
(in thousands of $, except per share data)
|
2018
|
|
2017
|
|
|
|
150,000,000 (2017: 150,000,000) common shares of $1.00 each
|
150,000
|
|
150,000
|
|
|
Issued share capital:
|
(in thousands of $, except per share data)
|
2018
|
|
2017
|
|
|
|
101,302,404 (2017: 101,118,289) outstanding issued common shares of $1.00 each
|
101,303
|
|
101,119
|
|
|
We issued
184,115
and
38,000
common shares upon the exercise of stock options for the years ended
December 31, 2018
and
2017
, respectively.
Contributed surplus
As at
December 31, 2018
and
2017
we had contributed surplus of
$200 million
. Contributed surplus is capital that can be returned to stockholders without the need to reduce share capital, thereby giving Golar greater flexibility when it comes to declaring dividends.
Treasury shares
In November 2014, our board of directors approved a new share repurchase program under which we may repurchase up to
5%
of Golar's outstanding stock over a
two
-year period, which is now closed. As at
December 31, 2018
and
2017
, we repurchased
0.5 million
shares for a consideration of
$20.5 million
and were party to a Total Return Swap, or TRS, indexed to
3.0 million
of Golar's shares at an average price of
$45.01
. There is at present no obligation for us to purchase any shares from the counterparty.
Share options
In February 2002, our board of directors approved the Golar LNG Limited Share Option Scheme ("Golar Scheme"). The Golar Scheme permits the board of directors, at its discretion, to grant options and to acquire shares in the Company to employees, non-employees and directors of the Company or its subsidiaries. Options granted under the scheme will vest at a date determined by the board at the date of the grant. The options granted under the plan to date have
five
year terms and vest equally over a period of
three
to
four
years. There is
no
maximum number of shares authorized for awards of equity share options, and either authorized unissued shares or treasury shares in the Company may be used to satisfy exercised options.
The Golar LNG Limited Long Term Incentive Plan ("LTIP") was adopted by our board of directors, effective as of October 24, 2017. The maximum aggregate number of common shares that may be delivered pursuant to any and all awards under the Company’s LTIP shall not exceed
3,000,000
common shares, subject to adjustment due to recapitalization or reorganization as provided under the LTIP. The LTIP allows for grants of (i) share options, (ii) share appreciation rights, (iii) restricted share awards (iv) share awards, (v) other share-based awards, (vi) cash awards, (vii) dividend equivalent rights, (viii) substitute awards and (ix) performance-based awards, or any combination of the foregoing as determined by the board of directors or nominated committee in its sole discretion. Either authorized unissued shares or treasury shares (if there are any) in the Company may be used to satisfy exercised options.
During
2018
and
2017
, the Company granted individuals
0.5 million
and
0.4 million
share options, respectively.
In 2017, the Company extended the life of
95,138
share options to September 30, 2018. The options were originally awarded from 2009 to 2011. Incremental compensation cost of
$0.6 million
was recognized in the year ended December 31,
2017
, representing the excess of the fair value of the options at modification date over the original fair value at grant date.
As at
December 31, 2018
,
2017
and
2016
, the number of options outstanding in respect of Golar shares was
3.8 million
,
4.0 million
and
3.8 million
, respectively.
F-54
The fair value of each option award is estimated on the grant date or modification date using the Black-Scholes option pricing model. The weighted average assumptions as at grant date are noted in the table below:
|
|
2018
|
|
2017
|
|
2016
|
|
||
|
Risk free interest rate
|
2.5
|
%
|
1.8
|
%
|
1.8
|
%
|
||
|
Expected volatility of common stock
|
62.5
|
%
|
54.5
|
%
|
55.0
|
%
|
||
|
Expected dividend yield
|
0.0
|
%
|
0.0
|
%
|
0.0
|
%
|
||
|
Expected term of options (in years)
|
3.6 years
|
|
3.8 years
|
|
5.0 years
|
|
||
The assumption for expected future volatility is based primarily on an analysis of historical volatility of our common stock.
Where the criteria for using the simplified method are met, we have used this method to estimate the expected term of options based on the vesting period of the award that represents the period of time options granted are expected to be outstanding. Under the simplified method, the mid-point between the vesting date and the maximum contractual expiration date is used as the expected term. Where the criteria for using the simplified method are not met, we used the contractual term of the options of five years.
The dividend yield has been estimated at
0.0%
as the exercise price of the options are reduced by the value of dividends, declared and paid on a per share basis.
A summary of option activity as at
December 31, 2018
is presented below:
|
(in thousands of $, except per share data)
|
Shares
(in '000s)
|
|
Weighted average exercise price
|
|
Weighted average remaining contractual term
(years)
|
|||
|
Options outstanding at December 31, 2017
|
4,017
|
|
|
$
|
37.92
|
|
|
3.0
|
|
Exercised during the year
|
(184
|
)
|
|
$
|
14.60
|
|
|
|
|
Forfeited during the year
|
(521
|
)
|
|
$
|
45.06
|
|
|
|
|
Lapsed during the year
|
(15
|
)
|
$
|
31.46
|
|
|||
|
Granted during the year
|
508
|
|
|
$
|
27.20
|
|
|
|
|
Options outstanding at December 31, 2018
|
3,805
|
|
|
$
|
36.16
|
|
|
2.4
|
|
Options exercisable at:
|
|
|
|
|||||
|
December 31, 2018
|
2,320
|
|
$
|
39.02
|
|
1.96
|
||
|
December 31, 2017
|
1,139
|
|
$
|
37.92
|
|
2.53
|
||
|
December 31, 2016
|
108
|
|
$
|
2.84
|
|
0.83
|
||
The exercise price of all options is reduced by the amount of dividends declared and paid; the above figures for options granted, exercised and forfeited show the average of the prices at the time of granting, exercising and forfeiting of the options, and for options outstanding at the beginning and end of the year, the average of the reduced option prices is shown.
As at
December 31, 2018
, 2017 and 2016, the aggregate intrinsic value of share options that were both outstanding and exercisable was $
nil
as the exercise price was higher than the market value of the share options at year end.
|
Year ended December 31
|
||||||||
|
In $'000
|
2018
|
|
2017
|
|
2016
|
|
||
|
Intrinsic value of share options exercised
|
2,621
|
|
286
|
|
1,326
|
|
||
|
Total fair value of share options fully vested in the year
|
16,623
|
|
13,601
|
|
113
|
|
||
|
Compensation cost recognized in the consolidated statement of operations
|
11,748
|
|
8,777
|
|
5,830
|
|
||
|
Share options cost capitalized*
|
421
|
|
1,823
|
|
822
|
|
||
F-55
*
These costs have been capitalized as part of the cost of the conversion of the
Hilli,
representing share options awarded to employees directly involved in the conversion.
As of
December 31, 2018
, the total unrecognized compensation cost amounting to
$11.3 million
relating to options outstanding is expected to be recognized over a weighted average period of
1.5 years
.
|
26.
|
ACCUMULATED OTHER COMPREHENSIVE LOSS
|
Accumulated Other Comprehensive Loss
As at
December 31, 2018
,
2017
and
2016
, our accumulated other comprehensive loss balances consisted of the following components:
|
Pension and post retirement benefit plan adjustments
|
Share of affiliates comprehensive (loss) income
|
Total accumulated comprehensive (loss) income
|
||||
|
Balance at December 31, 2015
|
(12,400
|
)
|
(192
|
)
|
(12,592
|
)
|
|
Other comprehensive (loss) income
|
(556
|
)
|
3,606
|
|
3,050
|
|
|
Balance at December 31, 2016
|
(12,956
|
)
|
3,414
|
|
(9,542
|
)
|
|
Other comprehensive income
|
157
|
|
1,616
|
|
1,773
|
|
|
Balance at December 31, 2017
|
(12,799
|
)
|
5,030
|
|
(7,769
|
)
|
|
Other comprehensive income (loss)
|
3,581
|
|
(24,324
|
)
|
(20,743
|
)
|
|
Balance at December 31, 2018
|
(9,218
|
)
|
(19,294
|
)
|
(28,512
|
)
|
|
27.
|
FINANCIAL INSTRUMENTS
|
Interest rate risk management
In certain situations, we may enter into financial instruments to reduce the risk associated with fluctuations in interest rates. We have entered into swaps that convert floating rate interest obligations to fixed rates, which from an economic perspective, hedge the interest rate exposure. We do not hold or issue instruments for speculative or trading purposes. The counterparties to such contracts are major banking and financial institutions. Credit risk exists to the extent that the counterparties are unable to perform under the contracts; however we do not anticipate non-performance by any of our counterparties.
We manage our debt portfolio with interest rate swap agreements in U.S. dollars to achieve an overall desired position of fixed and floating interest rates. Historically, we hedge accounted for certain of our interest rate swap arrangements designated as cash flow hedges. The net gains and losses had been reported in a separate component of accumulated other comprehensive income to the extent the hedges were effective. The amount recorded in accumulated other comprehensive income would have subsequently been reclassified into earnings in the same period as the hedged items affected earnings. However, since 2015, we have ceased hedge accounting for any of our derivatives.
As of
December 31, 2018
and
2017
, we were party to the following interest rate swap transactions involving the payment of fixed rates in exchange for
LIBOR
as summarized below:
|
Instrument
(in thousands of $)
|
Year end
|
Notional value
|
|
Maturity dates
|
Fixed interest rates
|
||||
|
Interest rate swaps
*
:
|
|
|
|
||||||
|
Receiving floating, pay fixed
|
2018
|
950,000
|
|
2019/ 2021
|
1.23% to 1.94%
|
||||
|
Receiving floating, pay fixed
|
2017
|
1,250,000
|
|
2018/ 2021
|
1.13% to 1.94%
|
||||
* This excludes any interest rate swap agreements designated and qualifying cash flow hedges in our equity method investments.
F-56
Foreign currency risk
The majority of the vessels' gross earnings are receivable in U.S. dollars. The majority of our transactions, assets and liabilities are denominated in U.S. dollars, our functional currency. However, we incur expenditure in other currencies. There is a risk that currency fluctuations will have a negative effect on the value of our cash flows.
Commodity price risk
A derivative asset, representing the fair value of the estimated discounted cash flows of payments due as a result of the Brent Crude price moving above the contractual floor of
$60.00
per barrel over the contract term, was recognized in December 2017 following the effectiveness of the LTA. Golar bears no downside risk should the Brent Crude price move below
$60.00
.
Equity price risk
Our Board of Directors have approved a share repurchase scheme, which is being partly financed through the use of total return swap or equity swap facilities with third party banks, indexed to our own shares. We carry the risk of fluctuations in the share price of those acquired shares. The banks are compensated at their cost of funding plus a margin. As at
December 31, 2018
, the counterparty to the equity swap transactions had acquired
3.0 million
shares in the Company at an average price of
$45.01
. In addition, we entered into a forward contract for the acquisition of
107,000
shares in Golar Partners at an average price of
$20.53
. The effect of our total return swap facilities in our consolidated statement of operations as at
December 31, 2018
is a loss of
$30.7 million
. There is, at present, no obligation for us to purchase any shares from the counterparty.
In addition to the above equity swap transactions linked to our own securities, we may, from time to time, enter into short-term equity swap arrangements relating to securities of other companies.
Fair values of financial instruments
We recognize our fair value estimates using a fair value hierarchy based on the inputs used to measure fair value. The fair value hierarchy has three levels based on reliability of inputs used to determine fair value as follows:
Level 1: Quoted market prices in active markets for identical assets and liabilities;
Level 2: Observable market-based inputs or unobservable inputs that are corroborated by market data; and
Level 3: Unobservable inputs that are not corroborated by market data.
There have been no transfers between different levels in the fair value hierarchy during the year.
The carrying value and fair value of our financial instruments at December 31, 2018 and 2017 are as follows:
F-57
|
|
2018
|
|
2018
|
|
2017
|
|
2017
|
|
|
|
(in thousands of $)
|
Fair value hierarchy
|
Carrying value
|
|
Fair value
|
|
Carrying value
|
|
Fair value
|
|
|
Non-derivatives:
|
|
|
|
|
|
|
|
|
|
|
Cash and cash equivalents
|
Level 1
|
217,835
|
|
217,835
|
|
214,862
|
|
214,862
|
|
|
Restricted cash and short-term deposits
|
Level 1
|
486,426
|
|
486,426
|
|
397,815
|
|
397,815
|
|
|
Current portion of long-term debt and short-term debt
(1)(2)
|
Level 2
|
(732,184
|
)
|
(732,184
|
)
|
(1,393,229
|
)
|
(1,393,229
|
)
|
|
Long-term debt – convertible bonds
(2)
|
Level 2
|
(353,661
|
)
|
(373,029
|
)
|
(340,173
|
)
|
(430,361
|
)
|
|
Long-term debt
(2)
|
Level 2
|
(1,496,351
|
)
|
(1,496,351
|
)
|
(701,498
|
)
|
(701,498
|
)
|
|
Derivatives:
|
|
|
|
||||||
|
Oil derivative instrument
(6)
|
Level 2
|
84,730
|
|
84,730
|
|
94,700
|
|
94,700
|
|
|
Interest rate swaps asset
(3)
|
Level 2
|
10,770
|
|
10,770
|
|
10,166
|
|
10,166
|
|
|
Foreign exchange swaps asset
(3)
|
Level 2
|
—
|
|
—
|
|
51
|
|
51
|
|
|
Foreign exchange swaps liability
(3)
|
Level 2
|
(1,322
|
)
|
(1,322
|
)
|
(223
|
)
|
(223
|
)
|
|
Total return equity swap liability
(3)(4)
|
Level 2
|
(70,804
|
)
|
(70,804
|
)
|
(40,141
|
)
|
(40,141
|
)
|
|
Earn-Out Units asset
(5)
|
Level 2
|
—
|
|
—
|
|
7,400
|
|
7,400
|
|
|
(1)
|
The carrying amounts of our short-term debts and loans receivable approximate their fair values because of the near term maturity of these instruments.
|
|
(2)
|
Our debt obligations are recorded at amortized cost in the consolidated balance sheets. The amounts presented in the table, are gross of the deferred charges amounting to $
16.8 million
and $
24.1 million
at
December 31, 2018
and
December 31, 2017
, respectively.
|
|
(3)
|
The fair value of certain derivative instruments is the estimated amount that we would receive or pay to terminate the agreements at the reporting date, taking into account current interest rates, foreign exchange rates, closing quoted market prices and our creditworthiness and that of our counterparties.
|
|
(4)
|
The fair value of total return equity swaps is calculated using the closing prices of the underlying listed shares, dividends paid since inception and the interest rate charged by the counterparty.
|
|
(5)
|
The Earn-Out Units were issued to Golar in connection with the IDR Reset transaction between Golar and Golar Partners in October 2016. In October 2018, Golar Partners reduced their quarterly distribution and, as such, the fair value of the Earn-Out Units was written down to $
nil
. See note 16.
|
|
(6)
|
The fair value of the oil derivative instrument was determined using the estimated discounted cash flows of the additional payments due to us as a result of oil prices moving above a contractual oil price floor over the term of the LTA. Significant inputs used in the valuation of the oil derivative include management’s estimate of an appropriate discount rate and the length of time to blend the long-term and the short-term oil prices obtained from quoted prices in active markets.
|
The following methods and assumptions were used to estimate the fair value of each class of financial instrument:
|
•
|
The carrying values of trade accounts receivable, trade accounts payable, accrued liabilities and working capital facilities approximate fair values because of the near term maturity of these instruments.
|
|
•
|
The carrying value of cash and cash equivalents, which are highly liquid, is a reasonable estimate of fair value.
|
|
•
|
The carrying value of restricted cash and short-term deposits is considered to be equal to the estimated fair value because of their near term maturity.
|
|
•
|
The estimated fair value for the liability component of the unsecured convertible bonds is based on the quoted market price as at the balance sheet date.
|
|
•
|
The estimated fair values for both the floating long-term debt and short-term debt to a related party are considered to be equal to the carrying value since they bear variable interest rates, which are adjusted on a quarterly or six-monthly basis.
|
|
•
|
The fair value measurement of a liability must reflect the non-performance of the entity. Therefore, the impact of our credit worthiness has also been factored into the fair value measurement of the derivative instruments in a liability position.
|
F-58
|
•
|
The fair value of the Earn-Out Units was determined using a Monte-Carlo simulation method. This simulation was performed within the Black Scholes option pricing model then solved via an iterative process by applying the Newton-Raphson method for the fair value of the Earn-Out Units, such that the price of a unit output by the Monte-Carlo simulation equaled the price observed in the market. The method took into account the historical volatility, dividend yield as well as the share price of the Golar Partners common units as of the IDR Reset date and at balance sheet date.
|
|
•
|
The fair value of the oil derivative instrument was determined using the estimated discounted cash flows of the additional payments due to us as a result of oil prices moving above a contractual oil price floor over the term of the LTA. Significant inputs used in the valuation of the oil derivative instrument include management’s estimate of an appropriate discount rate and the length of time to blend the long-term and the short-term oil prices obtained from quoted prices in active markets.
|
|
•
|
The credit exposure of interest rate swap agreements is represented by the fair value of contracts with a positive value at the end of each period, reduced by the effects of master netting arrangements. It is our policy to enter into master netting agreements with counterparties to derivative financial instrument contracts, which give us the legal right to discharge all or a portion of the amounts owed to the counterparty by offsetting them against amounts that the counterparty owes to us.
|
|
•
|
Our pension plan assets are primarily invested in funds holding equity and debt securities, which are valued at quoted market price. These plan assets are classified within Level 1 of the fair value hierarchy (see note 24).
|
The following table summarizes the fair value of our derivative instruments on a gross basis (none of which have been designated as hedges) recorded in our consolidated balance sheets as of December 31, 2018 and 2017:
|
Balance sheet classification
|
2018
|
|
2017
|
|
||
|
(in thousands of $)
|
||||||
|
Asset derivatives
|
||||||
|
Oil derivative instrument
|
Other non-current assets
|
84,730
|
|
94,700
|
|
|
|
Earn-Out Units asset
|
Other non-current assets
|
—
|
|
7,400
|
|
|
|
Interest rate swaps
|
Other current and non-current assets
|
10,770
|
|
10,166
|
|
|
|
Foreign exchange swaps
|
Other non-current assets
|
—
|
|
51
|
|
|
|
Total asset derivatives
|
95,500
|
|
112,317
|
|
||
|
Liability derivatives
|
||||||
|
Foreign exchange swaps
|
Other current liabilities
|
1,322
|
|
223
|
|
|
|
Total return equity swap
|
Other current liabilities
|
70,804
|
|
40,141
|
|
|
|
Total liability derivatives
|
72,126
|
|
40,364
|
|
||
We have elected not to offset the fair values of derivative assets and liabilities executed with the same counterparty that are generally subject to enforceable master netting arrangements. However, if we were to offset and record the asset and liability balances of derivatives on a net basis, the amounts presented in our consolidated balance sheets as of
December 31, 2018
and
2017
would be adjusted as detailed in the following table:
|
2018
|
2017
|
|||||||||||
|
Gross amounts presented in the consolidated balance sheet
|
Gross amounts not offset in the consolidated balance sheet subject to netting agreements
|
Net amount
|
Gross amounts presented in the consolidated balance sheet
|
Gross amounts not offset in the consolidated balance sheet subject to netting agreements
|
Net amount
|
|||||||
|
(in thousands of $)
|
||||||||||||
|
Total asset derivatives
|
10,770
|
|
—
|
|
10,770
|
|
10,166
|
|
—
|
|
10,166
|
|
F-59
The total return equity swap has a credit arrangement that requires us to provide cash collateral equaling
20%
of the initial purchase price and to subsequently post additional cash collateral that corresponds to any further unrealized loss. As at
December 31, 2018
cash collateral amounting to
$82.9 million
has been provided (see note 14).
Concentrations of risk
There is a concentration of credit risk with respect to cash and cash equivalents and restricted cash to the extent that substantially all of the amounts are carried with Nordea Bank of Finland PLC, DNB Bank ASA, Citibank, Standard Chartered and Danske Bank. However, we believe this risk is remote, as they are established and reputable establishments with no prior history of default.
There is a concentration of financing risk with respect to our long-term debt to the extent that a substantial amount of our long-term debt is carried with K-Sure, KEXIM and commercial lenders of our
$1.125 billion
facility, as well as with ICBCL, CMBL, CCBFL, COSCO and CSSC in regards to our sale and leaseback arrangements (see note 5). We believe these counterparties to be sound financial institutions. Therefore, we believe this risk is remote.
We have a substantial equity investment in our former subsidiary, Golar Partners, that from December 13, 2012 is considered as our affiliate and not our controlled subsidiary. As of
December 31, 2018
, our ownership interest was
32.0%
and the aggregate carrying value of the investments recorded in our balance sheet as of
December 31, 2018
was
$271.2 million
, being the total of our ownership interest (common and general partner interests) plus IDRs. Accordingly, the value of our investments and the income generated from Golar Partners is subject to specific risks associated with its business. Golar Partners operates in the same business as us and as of
December 31, 2018
had a fleet of
ten
vessels managed by us, under contract, with
five
of these vessels operating under medium to long-term charters. During the year ended
December 31, 2018
, we recognized an impairment loss of
$149.4 million
on our investment in Golar Partners. Refer to note 9.
We also have a substantial equity investment in our joint venture, Golar Power. As of December 31, 2018, our ownership interest was
50%
and the aggregate carrying value of the investment recorded in our balance sheet as of December 31, 2018 was
$266.2 million
. Accordingly, the value of our investment and the income generated from Golar Power is subject to specific risks associated with its business. Golar Power offers integrated LNG based downstream solutions through the ownership and operation of FSRUs and associated terminal and power generation infrastructure. Furthermore, in the event the decline in the fair value of this investment falls below the carrying value and it was determined to be other-than-temporary, we would be required to recognize an impairment loss.
A further concentration of supplier risk exists in relation to our vessels undergoing or pending FLNG conversion with Keppel and B&V. However, we believe this risk is remote as Keppel are global leaders in the shipbuilding and vessel conversion sectors while B&V is a global engineering, procurement and construction company.
F-60
|
28.
|
RELATED PARTY TRANSACTIONS
|
a) Transactions with Golar Partners and subsidiaries:
Income (expenses):
|
(in thousands of $)
|
2018
|
|
2017
|
|
2016
|
|
|
Management and administrative services revenue (i)
|
9,809
|
|
7,762
|
|
4,251
|
|
|
Ship management fees revenue (ii)
|
5,200
|
|
5,903
|
|
6,466
|
|
|
Charterhire expenses (iii)
|
—
|
|
(17,423
|
)
|
(28,368
|
)
|
|
Interest expense on short-term credit facility (iv)
|
—
|
|
—
|
|
(122
|
)
|
|
Share options expense recharge (vi)
|
—
|
|
228
|
|
181
|
|
|
Interest expense on deposits payable (vii)
|
(4,779
|
)
|
(4,622
|
)
|
(1,967
|
)
|
|
Total
|
10,230
|
|
(8,152
|
)
|
(19,559
|
)
|
Receivables (payables):
The balances with Golar Partners and subsidiaries as of
December 31, 2018
and
2017
consisted of the following:
|
(in thousands of $)
|
2018
|
|
2017
|
|
|
Trading balances owed from/ (to) Golar Partners and subsidiaries (iv)
|
4,091
|
|
(4,144
|
)
|
|
Methane Princess lease security deposit movements (v)
|
(2,835
|
)
|
(3,464
|
)
|
|
Deposit payable (vii)
|
—
|
|
(177,247
|
)
|
|
Total
|
1,256
|
|
(184,855
|
)
|
(i)
Management and administrative services agreement -
On March 30, 2011, Golar Partners entered into a management and administrative services agreement with Golar Management, a wholly-owned subsidiary of Golar, pursuant to which Golar Management will provide to Golar Partners certain management and administrative services. The services provided by Golar Management are charged at cost plus a management fee equal to
5%
of Golar Management’s costs and expenses incurred in connection with providing these services. Golar Partners may terminate the agreement by providing
120 days
written notice.
(ii)
Ship management fees
- Golar and certain of its affiliates charge ship management fees to Golar Partners for the provision of technical and commercial management of Golar Partners' vessels. Each of Golar Partners’ vessels is subject to management agreements pursuant to which certain commercial and technical management services are provided by Golar Management. Golar Partners may terminate these agreements by providing
30
days written notice.
(iii)
Charterhire expenses -
This consists of the charterhire expenses that we incurred for the charter back from Golar Partners of the
Golar Grand
in 2015, 2016 and 2017. On November 1, 2017, the
Golar Grand
guarantee concluded.
In connection with the sale of the
Golar Grand
to Golar Partners in November 2012, we issued an option where, in the event that the charterer did not renew or extend its charter for the
Golar Grand
beyond February 2015, the Partnership had the option to require us to charter the vessel through to October 2017. In February 2015, the option was exercised. Accordingly, we recognized charterhire costs of
$17.4 million
and
$28.4 million
for the year ended December 31, 2017 and 2016, respectively, in relation to the
Golar Grand.
The above disclosure excludes the net effect of the non-cash credit of
$5.1 million
and
$6.1 million
for the year ended December 31, 2017 and 2016, respectively. This relates to the
Golar Grand
guarantee obligation, which includes recognition of a loss on remeasurement in 2017, less amortization of the guarantee obligation. The
Golar Grand
guarantee concluded on November 2017.
(iv)
Trading balances
- Receivables and payables with Golar Partners and its subsidiaries are comprised primarily of unpaid management fees and expenses for management, advisory and administrative services and may include working capital adjustments in respect of disposals to the Partnership, as well as charterhire expenses. In addition, certain receivables and payables arise when we pay an invoice on behalf of a related party and vice versa. Receivables and payables are generally settled quarterly in arrears. Trading balances owing to or due from Golar Partners and its subsidiaries are unsecured, interest-free and intended to be settled in the ordinary course of business. They primarily relate to recharges for trading expenses paid on behalf of Golar Partners, including
F-61
ship management and administrative service fees due to us. In January 2016, we received funding from Golar Partners in the amount of
$30 million
for a fixed period of
60
days. Golar Partners charged interest on this balance at a rate of LIBOR plus
5.0%
.
(v)
Methane Princess lease security deposit movements
- This represents net advances from Golar Partners since its IPO, which correspond with the net release of funds from the security deposits held relating to a lease for the
Methane Princess
. This is in connection with the
Methane Princess
tax lease indemnity provided to Golar Partners under the Omnibus Agreement. Accordingly, these amounts will be settled as part of the eventual termination of the
Methane Princess
lease.
(vi)
Share options expense -
This relates to a recharge of share option expense to Golar Partners in relation to share options in Golar granted to certain of Golar Partners' directors, officers and employees.
(vii)
Interest expense on deposits payable
Expense under Tundra Letter Agreement
- In May 2016, we completed the Golar Tundra Sale and received a total cash consideration of
$107.2 million
. We agreed to pay Golar Partners a daily fee plus operating expenses for the right to use the
Golar Tundra
from the date the Golar Tundra Sale was closed, until the date that the vessel would commence operations under the Golar Tundra Time Charter. In return, Golar Partners agreed to remit to us any hire income received with respect to the
Golar Tundra
during that period. It was further agreed that, if for any reason the Golar Tundra Time Charter had not commenced by the
12
month anniversary of the closing of the Golar Tundra Sale, Golar Partners had the right to require that we repurchase the shares of Tundra Corp at a price equal to the purchase price. Accordingly, by virtue of the put option, we continued to consolidate the
Golar Tundra
for the periods whilst the put option remained in place, thus we have accounted for $
nil
,
$2.2 million
and
$2.0 million
as interest expense for the year ended December 31, 2018, 2017 and 2016, respectively.
Deferred purchase price
- In May 2017, the
Golar Tundra
had not commenced her charter and, accordingly, Golar Partners elected to exercise the Tundra Put Right to require us to repurchase Tundra Corp at a price equal to the original purchase price. In connection with Golar Partners exercising the Tundra Put Right, we and Golar Partners entered into an agreement pursuant to which we agreed to purchase Tundra Corp from Golar Partners on the date of the closing of the Tundra Put Sale (the "Put Sale Closing Date") in return we will be required to pay an amount equal to
$107.2 million
(the "Deferred Purchase Price") plus an additional amount equal to
5%
per annum of the Deferred Purchase Price (the "Additional Amount"). The Deferred Purchase Price and the Additional Amount shall be due and payable by us on the earlier of (a) the date of the closing of the Hilli Disposal (see below) and (b) March 31, 2018. We agreed to accept the Deferred Purchase Price and the Additional Amount in lieu of a cash receipt on the Put Sale Closing Date in return we have provided Golar Partners with an option (which Golar Partners have exercised) to purchase an interest in Hilli Corp. We have accounted for
$2.9 million
and
$1.1 million
as interest expense for the year ended
December 31, 2018
, and
2017
, respectively, in relation to the Deferred Purchase Price.
Deposit received from Golar Partners
- On August 15, 2017, we entered into a purchase and sale agreement (the "Hilli Sale Agreement") with Golar Partners for the disposal (the "Hilli Disposal") from Golar and affiliates of Keppel and Black & Veatch of common units (the "Disposal Interests") in Golar Hilli LLC. On the closing date of the Hilli Disposal, Golar Hilli LLC will indirectly (via its wholly-owned subsidiary) be the disponent owner of the
Hilli
. The Disposal Interests represent the equivalent of
50%
of the
two
liquefaction trains, out of a total of four, that are contracted to the Perenco and SNH under an
eight
-year LTA. The sale price for the Disposal Interests is
$658 million
less
50%
of the net lease obligations under the financing facility for the
Hilli
(the "Hilli Facility"), on closing date, plus post-closing purchase price adjustments. Concurrently with the execution of the Hilli Sale Agreement, we received a further
$70 million
deposit from Golar Partners, upon which we pay interest at a rate of
5%
per annum. We have accounted for
$1.9 million
and
$1.3 million
as interest expense for the year ended
December 31, 2018
, and
2017
, respectively, in relation to the
$70 million
deposit from Golar Partners.
On July 12, 2018, we concluded the Hilli Disposal with Golar Partners, accordingly we applied the Deferred Purchase Price as well as the deposit received from Golar Partners against the disposal.
Other transactions:
Golar Partners distributions to us
- Golar Partners has declared and paid quarterly distributions totaling
$48.4 million
,
$52.3 million
, and
$54.7 million
to us for each of the years ended
December 31, 2018
,
2017
and
2016
, respectively.
During the year ended
December 31, 2018
, Hilli LLC had declared quarterly distributions totaling
$5.6 million
in respect of the Hilli Common Units owned by Golar Partners. As of December 31, 2018, we have a dividend payable of
$3.6 million
to Golar Partners.
F-62
Exchange of Incentive Distribution Rights -
Pursuant to the terms of an Exchange Agreement (the “Exchange Agreement”) by and between Golar and Golar Partners we exchanged all of our incentive distribution rights in the Partnership (“Old IDRs”) in October 2016. Under the terms of an Exchange Agreement, the first target distribution was met in November 2017, accordingly, Golar Partners issued 50% of the Earn-Out Units (
374,295
common units and
7,639
general partner units) under the Exchange Agreement (see note 16).
Indemnifications and guarantees:
a)
Tax lease indemnifications:
Under the Omnibus Agreement, we have agreed to indemnify Golar Partners in the event of any tax liabilities in excess of scheduled or final settlement amounts arising from the
Methane Princess
leasing arrangement and the termination thereof.
In addition, to the extent Golar Partners incurs any liabilities as a consequence of a successful challenge by the UK Tax Authorities with regard to the initial tax basis of the transactions relating to any of the UK tax leases or in relation to the lease restructuring terminations in 2010, we have agreed to indemnify Golar Partners.
The maximum possible amount in respect of the tax lease indemnification is not known as the determination of this amount is dependent on our intention of terminating this lease and the various market factors present at the point of termination. As of
December 31, 2018
, we recognized a liability of
$11.5 million
(2017:
$11.5 million
) in respect of the tax lease indemnification to Golar Partners representing the fair value at deconsolidation in December 2012.
b)
Performance guarantees:
We issued performance guarantees to third party charterers in connection with the Time Charter Party agreements entered into with the vessel operating entities who are now subsidiaries of Golar Partners. These performance guarantees relate to the
Golar Freeze
, the
Methane Princess
and the
Golar Winter
. The maximum potential exposure in respect of the performance guarantees issued by the Company is not known as these matters cannot be absolutely determined. The likelihood of triggering the performance guarantees is remote based on the past performance of both our and Golar Partners' combined fleets.
c)
Disposal of Golar Eskimo and Golar Igloo:
Under the Purchase, Sale and Contribution Agreements entered into between Golar Partners and us on December 15, 2014 and December 5, 2013 in relation to the
Golar Eskimo
and the
Golar Igloo,
respectively, Golar has agreed to indemnify Golar Partners against certain environmental and toxic tort liabilities with respect to the assets that Golar contributed or sold to Golar Partners to the extent arising prior to the time they were sold and to the extent that Golar Partners notify us within five years of the date of the agreements.
d)
Golar Tundra financing related guarantees:
In November 2015, we sold the
Golar Tundra
to a subsidiary of CMBL (see note 5) and subsequently leased back the vessel under a bareboat charter (the “Tundra Lease”). In connection with the Tundra Lease, we are a party to a guarantee in favor of Tundra SPV, pursuant to which, in the event that Tundra Corp (our subsidiary) is in default of its obligations under the Tundra Lease, we, as the primary guarantor, will settle any liabilities due within five business days. In addition, Golar Partners has also provided a further guarantee, pursuant to which, in the event we are unable to satisfy our obligations as the primary guarantor, Tundra SPV may recover this from Golar Partners, as the deficiency guarantor. Under a separate side agreement, we have agreed to indemnify Golar Partners for any costs incurred in its capacity as the deficiency guarantor.
e)
Hilli cost indemnification:
We (as one of the Sellers) have agreed to indemnify Golar Partners for certain costs incurred in
Hilli
operations until August 14, 2025, when these costs exceed a contractual ceiling, capped at
$20 million
. Costs indemnified include vessel operating expenses, taxes, maintenance expenses, employee compensation and benefits, and capital expenditures. See note 6.
Omnibus Agreement
In connection with the IPO of Golar Partners, we entered into an Omnibus Agreement with Golar Partners governing, among other things, when we and Golar Partners may compete against each other as well as rights of first offer on certain FSRUs and LNG carriers. Under the Omnibus Agreement, Golar Partners and its subsidiaries agreed to grant a right of first offer on any proposed sale, transfer or other disposition of any vessel it may own. Likewise, we agreed to grant a similar right of first offer to Golar Partners for any vessel under a charter for
five
or more years that we may own. These rights of first offer will not apply to a (a) sale, transfer or other disposition of vessels between any affiliated subsidiaries, or pursuant to the terms of any current or future charter or other agreement with a charter party or (b) merger with or into, or sale of substantially all of the assets to, an unaffiliated third-party. In addition, the Omnibus Agreement provides for certain indemnities to Golar Partners in connection with the assets transferred from us.
F-63
b) Transactions with Golar Power and affiliates:
Net revenues:
The transactions with Golar Power and its affiliates for the twelve months ended
December 31, 2018
,
2017
and
2016
consisted of the following:
|
(in thousands of $)
|
2018
|
|
2017
|
|
2016
|
|
|
Management and administrative services revenue
|
6,167
|
|
5,711
|
|
1,965
|
|
|
Ship management fees income
|
1,400
|
|
824
|
|
335
|
|
|
Debt guarantee compensation (i)
|
861
|
|
775
|
|
488
|
|
|
Other
|
(247
|
)
|
135
|
|
—
|
|
|
Total
|
8,181
|
|
7,445
|
|
2,788
|
|
Payables:
The balances with Golar Power and its affiliates as of
December 31, 2018
and
2017
consisted of the following:
|
(in thousands of $)
|
2018
|
|
2017
|
|
|
Trading balances due to Golar Power and affiliates (ii)
|
(5,417
|
)
|
(935
|
)
|
|
Total
|
(5,417
|
)
|
(935
|
)
|
(i)
Debt guarantee compensation -
In connection with the closing of the Golar Power and Stonepeak transaction, Golar Power entered into agreements to compensate Golar in relation to certain debt guarantees (as further described under the subheading "Guarantees and other") relating to Golar Power and subsidiaries. This compensation amounted to an aggregate of
$0.9 million
and
$0.8 million
income for the year ended
December 31, 2018
and
2017
, respectively.
(ii)
Trading balances
- Receivables and payables with Golar Power and its subsidiaries are comprised primarily of unpaid management fees, advisory and administrative services. In addition, certain receivables and payables arise when we pay an invoice on behalf of a related party and vice versa. Receivables and payables are generally settled quarterly in arrears. Trading balances owing to or due from Golar Power and its subsidiaries are unsecured, interest-free and intended to be settled in the ordinary course of business.
Guarantees and other:
a)
Debt guarantees -
The debt guarantees on the
Golar Penguin
and the
Golar Celsius
were previously issued by Golar to third party banks in respect of certain secured debt facilities relating to Golar Power and subsidiaries. As described in (i) above we receive compensation from Golar Power in relation to the provision of the guarantees. In addition, a debt guarantee was provided on the newbuild
Golar Nanook.
The liability which is recorded in "Other non-current liabilities" is being amortized over the remaining term of the respective debt facilities with the credit being recognized in "Other financial items". As of
December 31, 2018
and
2017
, the Company guaranteed
$393.5 million
and
$182.3 million
, respectively of Golar Power's gross long-term debt obligations. The debt facilities are secured against specific vessels.
b)
Shipyard guarantee -
In connection with the newbuilding contract for the construction of a FSRU, we provided a guarantee to cover the remaining milestone payments due to the shipyard. Pursuant to the formation of Golar Power and closing of the Stonepeak transaction, Golar Power's subsidiary, entered into a counter guarantee with us to indemnify us in the event we are required to pay out any monies due under the shipyard guarantee. The shipyard guarantee expired on September 27, 2018 as a result of final milestone payments made by Golar Power to the yard.
c) Transactions with OneLNG and subsidiaries:
Net revenues:
The transactions with OneLNG and its subsidiaries for the year ended
December 31, 2018
and
2017
consisted of the following:
|
(in thousands of $)
|
2018
|
|
2017
|
|
2016
|
|
|
Management and administrative services revenue
|
1,399
|
|
6,463
|
|
586
|
|
Receivables:
The balances with OneLNG and its subsidiaries as of
December 31, 2018
and
2017
consisted of the following:
|
(in thousands of $)
|
2018
|
|
2017
|
|
|
Trading balances due from OneLNG (i)
|
8,169
|
|
7,898
|
|
F-64
(i)
Trading balances
- Receivables and payables with One LNG and its subsidiaries are comprised primarily of unpaid management fees, advisory and administrative services. In addition, certain receivables and payables arise when we pay an invoice on behalf of a related party and vice versa. Receivables and payables are generally settled quarterly in arrears. Trading balances owing to or due from OneLNG are unsecured, interest-free and intended to be settled in the ordinary course of business.
Subsequent to the decision to dissolve OneLNG, we have written off
$12.7 million
of the trading balance with OneLNG to 'Other operating income' in our Consolidated statements of income as we deem it to be no longer recoverable. The trade receivables of $
8.2 million
is net of this provision. In addition to the OneLNG trading balance write-off recognized in 'Other operating income', we had an additional write-off of
$1.3 million
of capitalised conversion costs in relation to the
Gandria
.
d) Transaction with other related parties:
Net revenues (expenses):
The transactions with other related parties for the years ended
December 31, 2018
,
2017
and
2016
consisted of the following:
|
(in thousands of $)
|
2018
|
|
2017
|
|
2016
|
|
||
|
The Cool Pool (i)
|
151,152
|
|
59,838
|
|
32,254
|
|
||
|
Magni Partners (ii)
|
(375
|
)
|
(260
|
)
|
(4,282
|
)
|
||
|
Total
|
150,777
|
|
|
59,578
|
|
|
27,972
|
|
Receivables (Payables):
The balances with other related parties as of
December 31, 2018
and
2017
consisted of the following:
|
(in thousands of $)
|
2018
|
|
2017
|
|
|
The Cool Pool (i)
|
43,985
|
|
14,004
|
|
|
Magni Partners (ii)
|
(8
|
)
|
6
|
|
|
Total
|
43,977
|
|
14,010
|
|
(i)
The Cool Pool -
For the year ended
December 31, 2018
we recognized net income of
$151.2 million
from our participation in the Cool Pool. Trade accounts receivable includes amounts due from the Cool Pool, amounting to
$44.0 million
as of
December 31, 2018
(December 31,
2017
:
$14.0 million
).
The table below summarizes our net earnings (impacting each line item in our consolidated statement of operations) generated from our participation in the Cool Pool:
|
(in thousands of $)
|
2018
|
|
2017
|
|
2016
|
|
|
Time and voyage charter revenues
|
177,139
|
|
77,975
|
|
37,345
|
|
|
Time charter revenues - collaborative arrangement
|
73,931
|
|
28,327
|
|
13,730
|
|
|
Voyage, charterhire expenses and commission expenses
|
(16,717
|
)
|
(7,683
|
)
|
(7,681
|
)
|
|
Voyage, charterhire and commission expenses - collaborative arrangement
|
(83,201
|
)
|
(38,781
|
)
|
(11,140
|
)
|
|
Net income from the Cool Pool
|
151,152
|
|
59,838
|
|
32,254
|
|
(ii)
Magni Partners -
Tor Olav Trøim is the founder of, and partner in, Magni Partners Limited, a privately held UK company, and is the ultimate beneficial owner of the company. Pursuant to an agreement between Magni Partners Limited and a Golar subsidiary, for the year ended December 31, 2018 and 2017, Golar was recharged
$0.4 million
and
$0.3 million
, respectively, for services provided on behalf of our affiliates. In December 31, 2016, Golar was recharged
$3.9 million
(this includes
$3.0 million
in relation to the transaction with Golar Power, which has been recorded as part of the loss on disposal of Golar Power in the income statement) for advisory services from a partner and director of Magni Partners Limited, other than Mr Trøim. In addition, for the year ended
December 31, 2018
and
2017
Golar was recharged
$0.04 million
and
$0.3 million
, respectively, for travel relating to certain board members. Furthermore, for the year ended December 31,
2017
Golar was recharged
$0.3 million
for other travel and out of pocket expenses. All charges have been recharged to Golar at cost.
F-65
|
29.
|
CAPITAL COMMITMENTS
|
Conversions
We have contracts with Keppel and Black & Veatch for the conversion of our LNG carrier, the
Gimi
into a FLNG, and we have agreed contract terms for the conversion of the
Gandria
to a FLNG. The
Gimi
has recently entered the Keppel shipyard to commence its conversion to a FLNG, whilst the
Gandria
is currently in lay-up awaiting delivery to Keppel for conversion. The conversion agreements for the
Gimi
and the
Gandria
are both subject to certain payments and lodging of a full Notice to Proceed.
As at
December 31, 2018
, the estimated timing of the outstanding payments in connection with the Limited Notice to Proceed on the
Gimi
conversion are as follows:
|
(in thousands of $)
|
||
|
Payable within 12 months to December 31, 2019
|
21,530
|
|
|
21,530
|
|
|
In February 2019, we entered into a
20 years
Lease and Operate Agreement with BP for the charter of a FLNG unit,
Gimi
, to service the Greater Tortue Ahmeyim project, subject to certain conditions precedent. The estimated conversion cost of the
Gimi
is approximately
$1.3 billion
.
As we have not lodged our final Notice to Proceed on the
Gandria
conversion contract, we have excluded the
Gandria
capital commitments in the above table. In addition we have excluded any capital commitments in relation to the conversion of the
Viking
into a FSRU as commencement of this project is subject to certain conditions precedent.
|
30.
|
OTHER COMMITMENTS AND CONTINGENCIES
|
Assets pledged
|
(in thousands of $)
|
2018
|
|
2017
|
|
|
|
Book value of vessels secured against long-term loans
|
3,244,291
|
|
2,032,747
|
|
|
As at
December 31, 2018
and
2017
, Golar Partners common units of
21,226,586
and
20,852,291
, respectively, were pledged as security for the obligations under the Margin Loan Facility (see note 20).
Other contractual commitments and contingencies
UK tax lease benefits
During 2003 we entered into
six
UK tax leases. Under the terms of the leasing arrangements, the benefits are derived primarily from the tax depreciation assumed to be available to the lessors as a result of their investment in the vessels. As is typical in these leasing arrangements, as the lessee we are obligated to maintain the lessor’s after-tax margin. Accordingly, in the event of any adverse tax changes or a successful challenge by the UK Tax Authorities (''HMRC'') with regard to the initial tax basis of the transactions, or in relation to the 2010 lease restructurings, or in the event of an early termination of the
Methane Princess
lease, we may be required to make additional payments principally to the UK vessel lessor, which could adversely affect our earnings or financial position. We would be required to return all, or a portion of, or in certain circumstances significantly more than, the upfront cash benefits that we received in respect of our lease financing transactions, including the 2010 restructurings and subsequent termination transactions. The gross cash benefit we received upfront on these leases amounted to approximately
£41 million
British Pounds (before deduction of fees).
Of these
six
leases, we have since terminated
five
, with
one
lease remaining, being that of the
Methane Princess
lease. Pursuant to the deconsolidation of Golar Partners in 2012, Golar Partners is no longer considered a controlled entity but an affiliate and therefore as at
December 31, 2018
, the capital lease obligation relating to this remaining UK tax lease is not included on our consolidated balance sheet. However, under the indemnity provisions of the Omnibus Agreement or the respective share purchase agreements, we have agreed to indemnify Golar Partners in the event of any tax liabilities in excess of scheduled or final scheduled amounts arising from the
Methane Princess
leasing arrangements and termination thereof.
F-66
HMRC has been challenging the use of similar lease structures and has been engaged in litigation of a test case for some years. In August 2015, following an appeal to the Court of Appeal by the HMRC which set aside previous judgments in favor of the tax payer, the First Tier Tribunal (UK court) ruled in favor of HMRC. The tax payer in this particular ruling has the election to appeal the courts’ decision, but no appeal has been filed. The judgments of the First Tier Tribunal do not create binding precedent for other UK court decisions and therefore the ruling in favor of HMRC is not binding in the context of our structures. Further, we consider there are differences in the fact pattern and structure between this case and our 2003 leasing arrangements and therefore is not necessarily indicative of any outcome should HMRC challenge us, and we remain confident that our fact pattern is sufficiently different to succeed if we are challenged by HMRC. HMRC have written to our lessor to indicate that they believe our lease may be similar to the case noted above. We have reviewed the details of the case and the basis of the judgment with our legal and tax advisers to ascertain what impact, if any, the judgment may have on us and the possible range of exposure has been estimated at approximately £
nil
to
£115 million
British Pounds. We are currently in conversation with HMRC on this matter and, as well as continuing to present the factual background of Golar's position, we are progressing the possibility of bringing this inquiry to a mutually satisfactory conclusion. Given the complexity of these discussions, it is impossible to quantify the reasonably possible loss, however we continue to estimate the possible range of exposures as set out above.
Legal proceedings and claims
We may, from time to time, be involved in legal proceedings and claims that arise in the ordinary course of business. A provision will be recognized in the financial statements only where we believe that a liability will be probable and for which the amounts are reasonably estimable, based upon the facts known prior to the issuance of the financial statements.
Other
In December 2005, we signed a shareholders' agreement in connection with the setting up of a jointly owned company to be named Egyptian Company for Gas Services S.A.E ("ECGS"), which was to be established to develop hydrocarbon business and in particular LNG related business in Egypt. As at
December 31, 2018
, we had a commitment to pay
$1.0 million
to a third party, contingent upon the conclusion of a material commercial business transaction by ECGS as consideration for work performed in connection with the setting up and incorporation of ECGS.
We are party to a shareholders’ agreement with a consortium of investors to fund the development of pipeline infrastructure and a FSRU which are intended to supply
two
power plants in the Ivory Coast. The project is currently in the initial design phase, with FID currently expected to be taken in the first half of 2019. Negotiations are underway with third party lenders for the financing of construction costs in the event a positive investment decision is made. During the initial phase of the project, our remaining contractual commitments for this project are estimated to be in the region of
€0.5 million
. In the event a positive FID is taken on the project, this could increase up to approximately
€15 million
. This figure is dependent upon a variety of factors such as whether third party financing is obtained for a portion of the construction costs. The timing of this range of payments is dependent on whether and when FID is made, progress of negotiations with lenders for non-investor financing, and the progress of eventual construction work. The nature of payments to the project could be made in a combination of capital contributions or interest-bearing shareholder loans.
In 2017, we commenced arbitration proceedings arising from the delays and the termination of the
Golar Tundra
time charter with a former charterer. These proceedings are expected to conclude shortly. For the year ended December 31, 2018, we recovered
$50.7 million
in charter earnings, recognized in 'Other operating income' in the consolidated statements of operations.
In relation to our investment in small-scale LNG services provider Avenir (see note 16), we are party to a combined commitment of up to
$182.0 million
from initial Avenir shareholders Stolt-Nielsen, Höegh and us. In November 2018, Avenir was capitalised with the placement of
110,000,000
new shares at a par price of US
$1.00
per share. Following the initial equity offering, the founding partners are committed to fund
$72.0 million
of which Golar is committed to approximately
$18 million
.
|
31.
|
SUBSEQUENT EVENTS
|
In January 2019, we entered into binding agreements with a Croatian project developer, LNG Hrvatska d.o.o., to convert the 2005 built
Golar Viking
into a FSRU, sell the converted vessel, and then operate and maintain the FSRU for a minimum of
10
years. Commencement of this project is subject to certain conditions precedent, including confirmation of project funding and receipt of a notice to proceed from LNG Hrvatska d.o.o.
In February 2019, we declared a dividend of $
0.15
per share in respect of the quarter ended December 31, 2018 and paid this in April 2019. In addition, Golar Partners made a final cash distribution of $
0.40
per unit in February 2019 in respect of the quarter
F-67
ended December 31, 2018, of which we received $
9.2 million
of dividend income in relation to our common and general partner units held at the record date.
In February 2019, we entered into a
20
year Lease and Operate Agreement with BP Mauritania Investments Ltd (“BP”) for the charter of the FLNG unit, the
Gimi
, to service the Greater Tortue Ahmeyim project. The
Gimi
’s conversion to a FLNG is expected to commence in April 2019 and the
Gimi
is expected to commence operations under the Lease and Operate Agreement in 2022. The estimated cost of the
Gimi’s
conversion is $
1.3 billion
, which we plan to fund through multiple financing facilities, including a
$700 million
long term financing facility that is currently in its final stages and that we plan to have available to us during construction. Once the
Gimi
is accepted under the contract, we anticipate annual contracted revenues less forecasted operating costs of approximately
$215 million
per year.
F-68
TABLE OF CONTENTS
Part IItem 1. Identity Of Directors, Senior Management and AdvisorsItem 2. Offer Statistics and Expected TimetableItem 3. Key InformationItem 4. Information on The CompanyItem 4A. Unresolved Staff CommentsItem 5. Operating and Financial Review and ProspectsItem 6. Directors, Senior Management and EmployeesItem 7. Major Shareholders and Related Party TransactionsItem 8. Financial InformationItem 9. The Offer and ListingItem 10. Additional InformationItem 11. Quantitative and Qualitative Disclosures About Market RiskItem 12. Description Of Securities Other Than Equity SecuritiesItem 13. Defaults, Dividend Arrearages and DelinquenciesItem 14. Material Modifications To The Rights Of Security Holders and Use Of ProceedsItem 15. Controls and ProcedureItem 16A. Audit Committee Financial ExpertItem 16B. Code Of EthicsItem 16C. Principal Accountant Fees and ServicesItem 16D. Exemptions From The Listing Standards For Audit CommitteesItem 16E. Purchases Of Equity Securities By The Issuer and Affiliated PurchasersItem 16F. Change in Registrant's Certifying AccountantItem 16G. Corporate GovernanceItem 16H. Mine Safety DisclosureItem 17. Financial StatementsItem 18. Financial StatementsItem 19. Exhibits