GAMESTOP CORP.
10-Ks and 10-Qs
|
|
|
|
|
|
|
|
|
|
|
|
|
|
|
|
|
|
|
|
|
|
|
|
|
|
|
|
|
|
|
|
|
|
|
|
|
|
|
|
|
|
|
|
|
|
|
|
|
|
|
|
|
UNITED STATES SECURITIES AND EXCHANGE COMMISSION
Washington, D.C. 20549
Form 10-K
þ
ANNUAL REPORT PURSUANT TO SECTION 13 OR 15(d) OF THE SECURITIES EXCHANGE ACT OF 1934
For the fiscal year ended
January 28, 2017
OR
¨
TRANSITION REPORT PURSUANT TO SECTION 13 OR 15(d) OF THE SECURITIES EXCHANGE ACT OF 1934
|
Commission File No. 1-32637
|
||
(Exact name of registrant as specified in its Charter)
|
Delaware
|
|
20-2733559
|
|
(State or other jurisdiction of
incorporation or organization)
|

|
(I.R.S. Employer
Identification No.)
|
|
625 Westport Parkway
|
76051
|
|
|
Grapevine, Texas
|
(Zip Code)
|
|
|
(Address of principal executive offices)
|
|
|
Registrant’s telephone number, including area code: (817) 424-2000
Securities registered pursuant to Section 12(b) of the Act:
|
(Title of Class)
|
|
(Name of Exchange on Which Registered)
|
|
Class A Common Stock, $.001 par value per share
|
|
New York Stock Exchange
|
Securities registered pursuant to Section 12(g) of the Act:
None
Indicate by check mark if the registrant is a well-known seasoned issuer, as defined in Rule 405 of the Securities Act. Yes
þ
No
¨
Indicate by check mark if the registrant is not required to file reports pursuant to Section 13 or 15(d) of the Act.
Yes
¨
No
þ
Indicate by check mark whether the registrant: (1) has filed all reports required to be filed by Section 13 or 15(d) of the Securities Exchange Act of 1934 during the preceding 12 months (or for such shorter period that the registrant was required to file such reports), and (2) has been subject to such filing requirements for the past 90 days. Yes
þ
No
¨
Indicate by check mark whether the registrant has submitted electronically and posted on its corporate Web site, if any, every Interactive Data File required to be submitted and posted pursuant to Rule 405 of Regulation S-T (§ 232.405 of this chapter) during the preceding 12 months (or for such shorter period that the registrant was required to submit and post such files). Yes
þ
No
¨
Indicate by check mark if disclosure of delinquent filers pursuant to Item 405 of Regulation S-K (§ 229.405 of this chapter) is not contained herein, and will not be contained, to the best of registrant’s knowledge, in definitive proxy or information statements incorporated by reference in Part III of this Form 10-K or any amendment to this Form 10-K.
þ
Indicate by check mark whether the registrant is a large accelerated filer, an accelerated filer, a non-accelerated filer, or a smaller reporting company. See the definitions of “large accelerated filer,” “accelerated filer” and “smaller reporting company” in Rule 12b-2 of the Exchange Act. (Check one):
|
Large Accelerated File
r
þ
|
Accelerated Filer
¨
|
Non-accelerated Filer
¨
|
Smaller reporting company
¨
|
|||
Indicate by check mark whether the registrant is a shell company (as defined in Rule 12b-2 of the Exchange Act). Yes
¨
No
þ
The aggregate market value of the voting and non-voting common stock held by non-affiliates of the registrant as of
July 30, 2016
was approximately
$3.16 billion
, based upon the closing market price of $30.95 per share of Class A Common Stock on the New York Stock Exchange. (For purposes of this calculation all of the registrant's directors and officers are deemed affiliates of the registrant.)
Number of shares of $.001 par value Class A Common Stock outstanding as of
March 16, 2017
:
101,210,856
DOCUMENTS INCORPORATED BY REFERENCE
Portions of the definitive proxy statement of the registrant to be filed pursuant to Regulation 14A under the Securities Exchange Act of 1934, as amended, for the 2017 Annual Meeting of Stockholders are incorporated by reference into Part III of this Annual Report on Form 10-K.
TABLE OF CONTENTS
|
|
|
Page
|
|
PART I
|
||
|
Item 1.
|
||
|
Item 1A.
|
||
|
Item 1B.
|
||
|
Item 2.
|
||
|
Item 3.
|
||
|
Item 4.
|
||
|
PART II
|
||
|
Item 5.
|
||
|
Item 6.
|
||
|
Item 7.
|
||
|
Item 7A.
|
||
|
Item 8.
|
||
|
Item 9.
|
||
|
Item 9A.
|
||
|
Item 9B.
|
||
|
PART III
|
||
|
Item 10.
|
||
|
Item 11.
|
||
|
Item 12.
|
||
|
Item 13.
|
||
|
Item 14.
|
||
|
PART IV
|
||
|
Item 15.
|
||
|
Item 16.
|
||
1
Disclosure Regarding Forward-looking Statements
This Annual Report on Form 10-K (“Form 10-K”) contains forward-looking statements within the meaning of Section 27A of the Securities Act of 1933, as amended (the “Securities Act”), and Section 21E of the Securities Exchange Act of 1934, as amended (the “Exchange Act”). In some cases, forward-looking statements can be identified by the use of terms such as “anticipates,” “believes,” “continues,” “could,” “estimates,” “expects,” “intends,” “may,” “plans,” “potential,” “predicts,” “pro forma,” “seeks,” “should,” “will” or similar expressions. These statements are only predictions based on current expectations and assumptions and involve known and unknown risks, uncertainties and other factors that may cause our or our industry’s actual results, levels of activity, performance or achievements to be materially different from any future results, levels of activity, performance or achievements expressed or implied by such forward-looking statements. All forward-looking statements included in this Form 10-K are based upon information available to us as of the filing date of this Form 10-K, and we undertake no obligation to update or revise any of these forward-looking statements for any reason, whether as a result of new information, future events or otherwise after the date of this Form 10-K, except as required by law. You should not place undue reliance on these forward-looking statements. The forward-looking statements involve a number of risks and uncertainties. Although we believe that the expectations reflected in our forward-looking statements are reasonable, we cannot guarantee future results, levels of activity, performance or achievements. A number of factors could cause our actual results, performance, achievements or industry results to be materially different from any future results, performance or achievements expressed or implied by these forward-looking statements. Factors that might cause such differences include, but are not limited to, those discussed in Part I, Item 1A of this Form 10-K under the heading “Risk Factors,” which are incorporated herein by reference. You should carefully consider the risks and uncertainties described in this Form 10-K.
|
ITEM 1.
|
BUSINESS
|
General
GameStop Corp. (“GameStop,” “we,” “us,” “our,” or the “Company”) is a global family of specialty retail brands that makes the most popular technologies affordable and simple. Within our family of brands, we are the world’s largest omnichannel video game retailer, the largest AT&T® (“AT&T”) authorized retailer, the largest Apple© (“Apple”) certified products reseller, a Cricket Wireless
TM
reseller (“Cricket,” an AT&T brand) and the owner of www.thinkgeek.com, one of the world’s largest sellers of collectible pop-culture themed products. As of January 28, 2017, GameStop's retail network and family of brands include
7,535
company-operated stores in the United States, Australia, Canada and Europe.
We are a Delaware corporation which, through a predecessor, began operations as a specialty retailer of video games in November 1996. Our corporate office is located in Grapevine, Texas.
Our fiscal year is composed of the 52 or 53 weeks ending on the Saturday closest to the last day of January. Fiscal year
2016
consisted of the
52
weeks ended on
January 28, 2017
("fiscal 2016"). Fiscal year
2015
consisted of the
52
weeks ended on
January 30, 2016
("fiscal 2015"). Fiscal year
2014
consisted of the
52
weeks ended on
January 31, 2015
("fiscal 2014").
Our Reportable Segments
We operate our business in four geographic Video Game Brands segments: United States, Canada, Australia and Europe; and a Technology Brands segment. Financial information about our segments is included in Item 7, Management's Discussion and Analysis of Financial Condition and Results of Operations, and Note 16, "Segment Information," of the notes to the consolidated financial statements, included in Item 8, "Financial Statements and Supplementary Data" of this Annual Report on Form 10-K.
Video Game Brands
The Video Game Brands segments include
6,013
stores,
3,944
of which are included in the United States segment. There are
322
,
464
, and
1,283
stores in the Canadian, Australian and European segments, respectively. The stores in our four Video Game Brands segments operate primarily under the names GameStop
TM
(“GameStop”), EB Games
TM
(“EB Games”), and Micromania. Each of the Video Game Brands segments consists primarily of retail operations, with all stores engaged in the sale of new and pre-owned video game systems, software and accessories, which we refer to as video game products. Our Video Game Brands stores sell various types of digital products, including downloadable content, network points cards, prepaid digital, prepaid subscription cards and digitally downloadable software and also sell certain mobile and consumer electronics products and collectible products. Through our omnichannel sales process, our customers can buy video game products and other merchandise online, reserve merchandise online and then pick it up in stores, or order products that may not be in-stock in stores and have it shipped to their homes. We operate e-commerce sites in eight countries, under the brand names of GameStop, EB Games, Micromania and ThinkGeek, that allow our customers to buy video game products, collectibles and other merchandise online. The network also includes: www.kongregate.com, a leading browser-based game site; Game Informer
TM
(“Game Informer”) magazine, the world's leading print and digital video game publication; and iOS and Android mobile applications. Within our Video Game Brands segments, we operate
86
pop culture themed stores selling collectibles, apparel, gadgets, electronics, toys and other retail products for technology enthusiasts and general consumers, with
62
collectibles stores in international markets operating under the Zing Pop Culture brand and
24
stores in the United States operating under the ThinkGeek brand.
2
Technology Brands
Our Technology Brands segment includes our Spring Mobile and Simply Mac businesses. Spring Mobile operates
1,403
AT&T branded wireless retail stores and
69
Cricket branded pre-paid wireless stores. The AT&T branded stores sell both pre and post-paid AT&T services, DIRECTV service and wireless products, as well as related accessories and other consumer electronics products. Pre-paid AT&T services, wireless devices and related accessories are sold through the Cricket branded stores. Simply Mac operates
50
Simply Mac© branded stores which sell Apple products, including desktop computers, laptops, tablets and smart phones and related accessories and other consumer electronics products. As an authorized Apple reseller, Simply Mac also offers certified training, warranty and repair services to its customers.
Our Strategy
During the past few years, we have transformed from the world’s largest specialty retailer of physical video game products into a family of retail brands selling many of the world’s most popular technologies and pop-culture products. Our vision is to continue to expand our business as a global family of specialty retail brands. Our mission is to continue to be the world’s largest omnichannel retailer of new and pre-owned and value video game products, to continue to grow sales of digital products, to expand the sales of collectible products through our video game stores and www.thinkgeek.com, to increase the number of our pop culture-themed stores and to strategically grow our Technology Brands segment to further diversify our revenue streams. Our goal is to have 50% or more of our operating earnings for the 52 weeks ending February 1, 2020 (“fiscal 2019”) come from sources other than "physical gaming," which we define as our traditional revenue streams including new video game hardware, new video game software, pre-owned and value video game products, video game accessories, PC entertainment software, interactive game figures, strategy guides and revenue from PowerUp Pro loyalty members receiving Game Informer magazine in print form.
We have a broad-based executive management team with substantial experience in the retail sector in merchandising, marketing, supply chain management, store operations and real estate. Following on the success of extending our core competencies into our mobile business, our strategy is to leverage our management team and core competencies to identify other retail concepts that we can acquire and rapidly expand. We believe our core competencies include the following:
|
•
|
Real estate knowledge, including extensive relationships with landlords, portfolio management, negotiating skills and risk mitigation;
|
|
•
|
Human resource management, including hiring, training, systems and processes, particularly in multi-unit management of small, limited staffing, specialty retail stores with expert staff in assisted-selling;
|
|
•
|
Knowledge of buy-sell-trade programs, including pricing algorithms, inventory balancing, refurbishment capabilities and secondhand dealer laws;
|
|
•
|
Customer retention programs, including using our loyalty programs to drive consumer awareness of new retail concepts and promote new products; and
|
|
•
|
The ability to deploy capital in ways that diversify the underlying business, manage financial risk and increase shareholder value, including finding acquisitions that have a high return on invested capital and are accretive to earnings.
|
Our competencies in real estate and human resource management stem from our experience in rapid growth retail environments.
We have anchored our strategy and growth plans upon the following pillars:
|
•
|
Maximize brick and mortar stores.
Our strategy regarding our retail stores includes growing our leading market share in video games, utilizing our stores to grow digital sales and applying our retail expertise to our Technology Brands businesses. Our growth strategy depends in part upon opening new stores and operating them profitably. We expect to open approximately
100
new stores in fiscal 2017, including approximately
35
collectibles stores and approximately
65
Technology Brands stores. Our strategy also includes closing stores which are not meeting our performance standards or stores at the end of their lease terms and transferring sales to other nearby GameStop locations. We plan to close approximately
130
Video Game Brands stores worldwide in fiscal 2017 and 55 Technology Brands stores.
|
In our video game stores, we provide a high level of customer service by hiring game enthusiasts and providing them with ongoing sales training, including training in the latest technical and functional elements of our products and services, making them the most knowledgeable associates in the video game retail market. We focus marketing efforts and store associates on driving the sale of new release video game products, both physical and digital. As the world’s largest retailer of video game products with a proven capability to capture market share immediately following new product launches, we believe we regularly receive larger allocations of popular new video game products than our competitors. To assist our customers in obtaining immediate access to new releases, we offer our customers the opportunity to pre-order products in our stores or through our websites prior to their release.
Our Technology Brands business centers around our long-term partnership with AT&T, under which we sell AT&T products and services in our Spring Mobile managed AT&T and Cricket branded stores and certain AT&T products and services in our Simply Mac stores. We also have an agreement with Apple under which we sell Apple products and services in our Simply Mac stores.
3
We acquired Spring Mobile in November 2013. Spring Mobile has grown from approximately 90 AT&T branded stores at the end of 2012 to
1,403
stores as of
January 28, 2017
, through a program with two primary focuses. The first of these is to acquire AT&T retailers. The second is opening what we refer to as “whitespace” stores, or new stores in retail locations identified by either AT&T or Spring Mobile management and agreed to by both parties. AT&T supports the opening of new whitespace stores by its authorized retailers in an effort to increase the size of its retail distribution channel. Both of these represent opportunities for continued growth in the near term for Spring Mobile.
In connection with the continued expansion of our Technology Brands business, Spring Mobile completed acquisitions of several additional AT&T authorized retailers in fiscal
2016
, adding over 500 stores.
In July 2015, we acquired ThinkGeek, an online and wholesale retailer and developer that sells pop culture themed collectibles, apparel, gadgets, electronics, toys and other retail products for technology enthusiasts and general consumers through the www.thinkgeek.com website and certain exclusive products to wholesale channel customers. The addition of ThinkGeek provides an expansion of our global omnichannel platform and enables us to broaden our product offering in the collectibles category, including standalone stores and deepen relationships with our existing customer base.
We continue to seek opportunities to extend core competencies to other products and retail categories in order to continue to grow and to help mitigate the financial impact from the cyclical nature of the video game console cycle.
|
•
|
Expand our pre-owned business.
We believe we are the largest retailer of pre-owned video game products in the world and carry the broadest selection of pre-owned and value video game products for both current and previous generation platforms, giving us a unique advantage in the video game retail industry. The opportunity to trade-in and purchase pre-owned video game products offers our customers a unique value proposition generally unavailable at most mass merchants, toy stores and consumer electronics retailers. We obtain most of our pre-owned video game products from trade-ins made in our stores by our customers. Pre-owned and value video game products generate significantly higher gross margins than new video game products. Our strategy consists of continuing to expand our product assortment to drive sales and gross profit growth, increasing consumer awareness of the benefits of trading in and buying pre-owned video game products through increased marketing activities and the use of both broad and targeted marketing to our loyalty program members. The supply of trade-ins of video game products, and the demand for resale of these products, is affected by overall demand for video game products and the introduction of new software and hardware by our suppliers. We expect the March 2017 launch of the Nintendo Switch and the continued adoption of next-generation consoles and software to drive trade-ins of video game products, thereby expanding our supply of pre-owned video game products.
|
Our Simply Mac stores also offer customers the opportunity to trade-in and purchase pre-owned Apple products.
|
•
|
Own the customer
. Sustaining and growing our existing customer base depends on our ability to increase GameStop brand awareness, to drive membership in our loyalty programs, to engage with customers online, through social media and our mobile apps, and to expand our market leadership position by offering a variety of new and pre-owned video game products and continuing to enhance our mobile and digital product and service offerings. We operate loyalty programs in each of the countries in which we operate our Video Game Brands stores. Our U.S. loyalty program, called PowerUp Rewards
TM
("PowerUp Rewards"), had over
36 million
members as of
January 28, 2017
. Our loyalty programs in our video game stores in the remaining countries had approximately 16 million members as of
January 28, 2017
. Our loyalty programs generally offer our customers the ability to sign up for a free or paid membership which gives our customers access to exclusive video game related rewards. The programs' paid memberships may also include a subscription to
Game Informer
magazine, additional discounts on pre-owned merchandise in our stores and additional credit on trade-ins of pre-owned products. Approximately 6 million of the
36 million
U.S. loyalty members were paying members. Our e-commerce sites allow our customers to buy games online, reserve or pick up merchandise in our stores, order in-store for home delivery and to learn about the latest video game products and their availability in our stores. Together, our loyalty programs, websites, mobile applications, magazine and other properties are a part of our omnichannel retail strategy designed to enhance our relationships with our customers, making it easier for our customers to transact with us and increase loyalty.
|
Our store personnel provide value-added services to each customer, such as maintaining lists of regular customers and reserving new releases for customers with a down payment to ensure product availability. In addition, our store personnel readily provide product reviews and ratings to ensure customers are making informed purchasing decisions and inform customers of available resources, including Game Informer and our e-commerce sites, to increase a customer’s enjoyment of the product upon purchase.
|
•
|
Expand our digital growth strategy
. Growth in the video game industry in recent years has been fueled by the proliferation of online game play, the sale of video games delivered in digital form and the expansion of other forms of digital gaming. The recent generations of video game consoles contain the technology to digitally download video game software content and a growing percentage of new games are being sold digitally (which the video game industry refers to as "full-game downloads"). Additionally, a growing market exists for the sale of digitally downloadable add-on content for physical games, which the video game industry refers to as “DLC.” The digital game market also consists of both immersive and casual games delivered over the internet to computers, tablets, smart phones and other devices. We sell a variety of digitally downloadable content in our video game stores and on our websites, including DLC, full-game downloads, network points cards, prepaid digital and prepaid subscription cards. We believe we are the only significant brick-and-mortar retail seller of DLC and that we are frequently the leading seller of DLC for most major game titles.
|
4
|
•
|
Maintain a disciplined capital allocation
. Our objective in recent years has been to return a significant portion of our free cash flow to our shareholders through share repurchases and dividends unless more strategic opportunities arise that we believe would create more meaningful shareholder returns. In fiscal
2016
, we paid dividends of
$1.48
per share of Class A Common Stock, totaling
$155.5 million
for the year. Additionally, on
February 28, 2017
, our Board of Directors authorized an increase in our annual cash dividend to $1.52 per share of Class A Common Stock, with the first quarterly dividend of fiscal 2017 of $0.38 per share of Class A Common Stock, payable on
March 28, 2017
to stockholders of record on
March 14, 2017
. In fiscal 2016, we repurchased
3.0 million
shares of our Class A Common Stock at an average price per share of
$24.94
for a total of
$75.1 million
.
|
In order to create more meaningful shareholder returns, as we evaluate investments in strategic opportunities, we target internal rates of return (“IRR”) in excess of 20% for whitespace store expansion and acquisitions. The total consideration of the completed acquisitions of additional AT&T authorized retailers in fiscal
2016
was
$483.5 million
net of cash acquired, which includes
$43.2 million
estimated contingent consideration.
Market Size
Video Game Products.
Based upon estimates compiled by various market research firms, including NPD Group, Inc. ("NPD") and International Development Group ("IDG"), we estimate that the market for new physical video game products was approximately $17 billion in
2016
in the countries in which we operate. This estimated market excludes sales of pre-owned video game products, which are not currently measured by any third-party research firms. Additionally, based on estimates compiled by various market research firms, we estimate that the market in North America for content in digital format (full-game and add-on content downloads for console and PC, subscriptions, mobile games and social network games) was between $13 billion and $22 billion in
2016
.
Mobile and Consumer Electronics.
The mobile and consumer electronics market, as we refer to it, consists primarily of wireless services, new and pre-owned mobile devices, such as smart phones and tablets, consumer electronics such as Apple products and services, non-gaming headsets and accessories. The market for wireless devices and services is estimated by CTIA — The Wireless Association
®
to exceed $190 billion. We expect that the market for AT&T services and products and the wireless market in general will continue to grow as more and more devices connect to the internet through wireless networks and as AT&T continues to broaden its offerings of content and services, such as DIRECTV.
Merchandise
We categorize our sale of products and services as follows:
|
•
|
New Video Game Hardware.
We offer the video game platforms of all major manufacturers, including the Sony PlayStation 4, Microsoft Xbox One and the Nintendo Switch, Wii U, and DS line. We also offer extended service agreements on video game hardware and software. Video game hardware sales are generally driven by the introduction of new platform technology and the reduction in price points as platforms mature. We are in a console cycle which began with the Nintendo Wii U launch in November 2012 and the launches of the PlayStation 4 and Xbox One in November 2013. In March 2017, Nintendo introduced the Switch. We believe that selling video game hardware increases store traffic and promotes customer loyalty, leading to increased sales of video game software and accessories, which have higher gross margins than video game hardware.
|
|
•
|
New Video Game Software.
We purchase new video game software for current and certain prior generation consoles from the leading manufacturers, including Sony, Nintendo and Microsoft, as well as all other major third-party game publishers, such as Electronic Arts and Activision. We are one of the largest customers of video game titles sold by these publishers. We generally carry approximately 570 SKUs of new video game software at any given time across a variety of genres, including sports, action, strategy, adventure/role playing and simulation.
|
|
•
|
Pre-owned and Value Video Game Products.
We provide our customers with an opportunity to trade in their pre-owned video game products in our stores in exchange for store credits which can be applied towards the purchase of other products, primarily new merchandise. We believe this process drives our higher market share, particularly at launch. We resell these pre-owned video game products and have the largest selection (approximately 3,000 SKUs) of pre-owned video game titles which have an average price of $24 as compared to an average price of $46 for new video game titles and which generate significantly higher gross margins than new video game products. Our highly-customized inventory management system allows us to actively manage the pricing and product availability of our pre-owned video game products across our store base and to reallocate our inventory as necessary. Our trade-in program also allows us to be one of the only suppliers of previous generation platforms and related video games. We also operate refurbishment centers in the U.S., Canada, Australia and Europe, where defective video game products can be tested, repaired, relabeled, repackaged and redistributed back to our stores.
|
|
•
|
Video Game Accessories.
Video game accessories consist primarily of controllers, gaming headsets, virtual reality products, memory cards and other add-ons for use with video game hardware and software.
|
|
•
|
Digital.
The proliferation of online game play through Microsoft Xbox Live, the PlayStation Network and PC gaming websites has led to consumer demand for subscription, time and points cards (“digital currency”) as well as full-game downloads and DLC, for existing console video games. We sell a wide variety of digital currency and we have developed technology to sell
|
5
DLC and full-game downloads in our stores and on our U.S. website. We believe we are the worldwide leading retailer of digital currency and DLC for Xbox Live and the PlayStation Network.
|
•
|
Technology Brands.
Technology Brands consist primarily of wireless products, services and accessories and consumer electronics offered in our Technology Brands segment through Spring Mobile managed AT&T and Cricket branded stores and Simply Mac stores. This product category also includes Apple and other consumer electronics products.
|
|
•
|
Collectibles
. Collectibles consist of licensed merchandise, primarily related to the video game, television and movie industries and pop culture themes which are sold through our video game stores, ThinkGeek stores, Zing Pop Culture stores and www.thinkgeek.com.
|
|
•
|
Other Products.
Other products primarily consist of PC entertainment software, gaming-related print media, mobile and consumer electronics sold through our Video Game Brands segments, and revenues from PowerUp Pro loyalty members receiving Game Informer magazine in print form. We offer PC entertainment software from many of the largest PC publishers, including Electronic Arts, Take Two and Activision across a variety of genres, including sports, action, strategy, adventure/role playing and simulation. We also carry strategy guides, magazines and interactive game figures, such as Amiibos from Nintendo and Skylanders from Activision.
|
The products in our Video Games Brands segments are substantially the same regardless of geographic location, with the primary differences in merchandise being the timing of release of new products in the various geographies and language translations. Our in-store video game product inventory generally consists of a constantly changing selection averaging over 5,700 SKUs. We have buying groups in each of our segments that negotiate terms, discounts and cooperative advertising allowances for the stores in their respective geographic areas. We use customer requests and feedback, pre-orders, industry magazines and product reviews to determine which new releases are expected to be hits. Pre-orders are tracked at individual stores to distribute titles and capture demand effectively. This merchandise management is essential because a significant portion of a game’s sales are usually generated in the first days and weeks following its release.
Store Operations
We design our video game stores to provide an electronic gaming atmosphere with an engaging and visually captivating layout, with an average size of 1,500 square feet. Our video game stores are typically equipped with several video game sampling areas, which provide our customers the opportunity to play games before purchase, as well as equipment to play video game clips. We use store configuration, in-store signage and product demonstrations to produce marketing opportunities both for our vendors and for us.
Our Technology Brands stores vary in size, with an average size of approximately 1,900 square feet. Our Spring Mobile managed AT&T and Cricket branded stores carry wireless products and accessories, and our Simply Mac stores carry Apple and other consumer electronics.
Our stores are generally located in high-traffic “power strip centers,” local neighborhood strip centers, high-traffic shopping malls and pedestrian areas, primarily in major metropolitan areas. These locations provide easy access and high frequency of visits and, in the case of strip centers and high-traffic pedestrian stores, high visibility. We target strip centers that are conveniently located, have a mass merchant or supermarket anchor tenant and have a high volume of customers.
Site Selection and Locations
Site Selection.
Site selections for new stores are made after an extensive review of demographic data, including data from our PowerUp Rewards loyalty program, and other information relating to market potential, competitor access and visibility, compatible nearby tenants, accessible parking, location visibility, lease terms and the location of our other stores. Spring Mobile managed AT&T and Cricket branded stores are selected after approval from AT&T. Simply Mac stores are selected with input from Apple. In each of our geographic segments, we have a dedicated staff of real estate personnel experienced in selecting store locations.
6
Domestic Locations.
The table below sets forth the number and locations of our domestic stores included in the U.S. Video Game Brands and Technology Brands segments as of
January 28, 2017
:
|
U.S. Video Game Brands
|
Technology Brands
|
U.S. Video Game Brands
|
Technology Brands
|
U.S. Video Game Brands
|
Technology Brands
|
|||||||||||
|
Alabama
|
61
|
|
6
|
|
Kentucky
|
71
|
|
24
|
|
Ohio
|
170
|
|
3
|
|
||
|
Alaska
|
7
|
|
6
|
|
Louisiana
|
66
|
|
6
|
|
Oklahoma
|
48
|
|
28
|
|
||
|
Arizona
|
76
|
|
31
|
|
Maine
|
11
|
|
1
|
|
Oregon
|
34
|
|
38
|
|
||
|
Arkansas
|
31
|
|
27
|
|
Maryland
|
91
|
|
10
|
|
Pennsylvania
|
189
|
|
37
|
|
||
|
California
|
397
|
|
224
|
|
Massachusetts
|
83
|
|
34
|
|
Rhode Island
|
13
|
|
1
|
|
||
|
Colorado
|
59
|
|
31
|
|
Michigan
|
104
|
|
3
|
|
South Carolina
|
70
|
|
31
|
|
||
|
Connecticut
|
48
|
|
30
|
|
Minnesota
|
47
|
|
37
|
|
South Dakota
|
11
|
|
—
|
|
||
|
Delaware
|
15
|
|
13
|
|
Mississippi
|
44
|
|
14
|
|
Tennessee
|
95
|
|
30
|
|
||
|
District of Columbia
|
—
|
|
2
|
|
Missouri
|
69
|
|
46
|
|
Texas
|
366
|
|
149
|
|
||
|
Florida
|
256
|
|
79
|
|
Montana
|
10
|
|
9
|
|
Utah
|
27
|
|
36
|
|
||
|
Georgia
|
129
|
|
64
|
|
Nebraska
|
21
|
|
4
|
|
Vermont
|
5
|
|
—
|
|
||
|
Guam
|
2
|
|
—
|
|
Nevada
|
39
|
|
13
|
|
Virginia
|
126
|
|
43
|
|
||
|
Hawaii
|
19
|
|
—
|
|
New Hampshire
|
25
|
|
7
|
|
Washington
|
75
|
|
60
|
|
||
|
Idaho
|
16
|
|
9
|
|
New Jersey
|
120
|
|
30
|
|
West Virginia
|
29
|
|
—
|
|
||
|
Illinois
|
154
|
|
89
|
|
New Mexico
|
25
|
|
7
|
|
Wisconsin
|
60
|
|
35
|
|
||
|
Indiana
|
89
|
|
42
|
|
New York
|
230
|
|
64
|
|
Wyoming
|
8
|
|
9
|
|
||
|
Iowa
|
31
|
|
11
|
|
North Carolina
|
132
|
|
32
|
|
|||||||
|
Kansas
|
31
|
|
17
|
|
North Dakota
|
9
|
|
—
|
|
|||||||
|
Total Domestic Stores
|
3,944
|
|
1,522
|
|
||||||||||||
International Locations.
The table below sets forth the number and locations of our international stores included in the Video Game Brands segments in Canada, Europe and Australia as of
January 28, 2017
:
|
Number
of Stores
|
||
|
Canada
|
322
|
|
|
Total Stores - Canada Video Game Brands
|
322
|
|
|
Australia
|
423
|
|
|
New Zealand
|
41
|
|
|
Total Stores - Australia Video Game Brands
|
464
|
|
|
Austria
|
29
|
|
|
Denmark
|
34
|
|
|
Finland
|
18
|
|
|
France
|
432
|
|
|
Germany
|
217
|
|
|
Ireland
|
51
|
|
|
Italy
|
386
|
|
|
Norway
|
35
|
|
|
Sweden
|
62
|
|
|
Switzerland
|
19
|
|
|
Total Stores - Europe Video Game Brands
|
1,283
|
|
|
Total International Stores
|
2,069
|
|
|
Total Stores
|
7,535
|
|
7
Game Informer
We publish
Game Informer
, the world’s largest print and digital video game publication and website featuring reviews of new title releases, game tips and news regarding current developments in the video game industry. Print and digital versions of the monthly magazine are sold through subscriptions, digitally and through displays in our domestic and international stores.
Game Informer
magazine is the fourth largest consumer publication in the U.S. and for its December
2016
issue, the magazine had approximately 6.0 million paid subscribers, including approximately 2.3 million paid digital magazine subscribers. The digital version of the magazine is the largest subscription digital magazine in the United States.
Game Informer
is a part of the PowerUp Rewards Pro loyalty program and is a key feature of each paid PowerUp Rewards membership. Operating results from the English version of
Game Informer
are included in the United States segment as this represents where the majority of subscriptions and sales are generated. Other international version results from
Game Informer
operations are included in the segment in which the sales are generated.
Omnichannel
We operate e-commerce sites in eight countries, under the brand names of GameStop, EB Games, Micromania and ThinkGeek, that allow our customers to buy video game products, collectibles and other merchandise online. Customers can reserve merchandise online and then pick it up in stores, or order products that may not be in-stock in stores and have it shipped to their homes. The sites also offer customers information and content about available games, release dates for upcoming games, and access to store information, such as location and product availability. E-commerce results are included in the geographic segment where the sales originate. Additionally, with the GameStop mobile app, smart phone users can browse our extensive product selection and experience an enhanced PowerUp Rewards dashboard. We estimate that the GameStop mobile app has been installed over 8 million times.
Kongregate
We operate Kongregate, which is a leading web and mobile gaming platform that has attracted over 5.2 billion web gameplays and over 2.5 billion mobile gameplays since its launch. Kongregate is also a publisher of mobile games and has several titles available in both the Apple and Google app stores, which have received over 110 million mobile installs. Over 34,000 developers have uploaded more than 112,000 games to www.kongregate.com. The majority of Kongregate’s revenues come from its mobile apps and in-game transactions utilizing a proprietary virtual currency called Kreds. Kongregate’s mobile publishing division has several titles available in both the Apple and Google app stores.
Advertising
Given the high foot traffic drawn past our stores, we use in-store marketing efforts such as window displays and “coming soon” signs to attract customers, as well as to promote our products. Inside our stores, we feature selected products through the use of vendor displays, “coming soon” or preview videos, signs, catalogs, point-of-purchase materials and end-cap displays. These advertising efforts are designed to increase the initial sales of new titles upon their release.
On a global basis, we receive cooperative advertising and market development funds from most of our manufacturers, distributors, software publishers and accessory suppliers to promote their respective products. Generally, vendors agree to purchase advertising space in one of our advertising vehicles. Once we run the advertising, the vendor pays us an agreed amount.
Our loyalty programs are designed to incent our customers to shop more often at our stores and to allow us to market directly to our customers based on their individual tastes and preferences. Our loyalty programs provide members with the opportunity to earn unique video game related rewards not available through any other retailer. Vendors also participate in these programs to increase the sales of their individual products.
In the last several years, as part of our brand-building efforts and targeted growth strategies, we expanded our advertising and promotional activities in certain targeted markets at key times of the year. In addition, we expanded our use of television and radio advertising in certain markets to promote brand awareness, our pre-owned business and store openings. We expect our investment in advertising to increase in certain areas to support our targeted growth strategies.
Distribution and Information Management
Our operating strategy involves providing a broad merchandise selection to our customers as quickly and as cost-effectively as possible. We use our inventory management systems to maximize the efficiency of the flow of products to our stores, enhance store efficiency and optimize store in-stock and overall investment in inventory.
Distribution.
We operate distribution facilities in various locations throughout the world, with each location strategically located to support the operations in a particular country or region. In order to enhance our first-to-market distribution network, we also utilize the services of several off-site, third-party operated distribution centers that pick up products from our suppliers, repackage the products for each of our stores and ship those products to our stores by package carriers. Inventory is shipped to each store at least twice a week, or daily, if necessary, in order to keep stores in supply of products. Our distribution facilities also typically support refurbishment of pre-owned products to be redistributed to our stores.
8
We distribute products to our U.S. stores and on-line customers through a 353,000 square foot distribution center in Grapevine, Texas and a 631,000 square foot distribution center in Shepherdsville, Kentucky. The technology used in the distribution centers allows for high-volume receiving and distributions to stores.
We distribute merchandise to our Canadian segment from two distribution centers in Brampton, Ontario. We have a distribution center near Brisbane, Australia which supports our Australian operations and a small distribution facility in New Zealand which supports the stores in New Zealand. European segment operations are supported by four regionally-located distribution centers in Milan, Italy; Memmingen, Germany; Dublin, Ireland; and Paris, France.
Digital Distribution.
We have developed proprietary technology to work in conjunction with developers, as well as Microsoft and Sony, to enable us to sell DLC and full-game downloads in our stores and on our e-commerce sites.
Management Information Systems.
Our proprietary inventory management systems and point-of-sale technology show daily sales and in-store stock by title by store. Our systems use this data to automatically generate replenishment shipments to each store from our distribution centers, enabling each store to carry a merchandise assortment uniquely tailored to its own sales mix and rate of sale. Our call lists and reservation system also provide our buying staff with information to determine order size and inventory management for store-by-store inventory allocation.
To support most of our operations, we use a large-scale, Intel-based computing environment with a state-of-the-art storage area network and a wired and wireless corporate network installed at our U.S. and regional international headquarters, and a secure, virtual private network to access and provide services to computing assets located in our stores, distribution centers and satellite offices and to our mobile workforce. This strategy has proven to minimize initial outlay of capital while allowing for flexibility and growth as operations expand. Regional communication links exist to each of our distribution centers and offices in international locations with connectivity to our U.S. data center as required by our international, distributed applications.
Our proprietary point-of-sale system has been enhanced to facilitate trade-in transactions, including automatic look-up of trade-in prices and printing of machine-readable bar codes to facilitate in-store restocking of pre-owned video games. In addition, our central database of all pre-owned and value video game products allows us to actively manage the pricing and product availability of our pre-owned video game products across our store base and reallocate our pre-owned and value video game products as necessary.
Field Management and Staff
Each of our Video Game Brands stores employs, on average, one store leader, one assistant store leader and between two and ten sales associates, many of whom are part-time employees. Each store leader is responsible for managing their personnel and the economic performance of their store. We have cultivated a work environment that attracts employees who are actively interested in video games so that they are better able to assist customers. To encourage them to sell the full range of our products and to maximize our profitability, we provide our employees with targeted incentive programs to drive overall sales and sales of higher margin products.
Our stores communicate with our corporate offices daily via e-mail. This e-mail allows for better tracking of trends in upcoming titles, competitor strategies and in-stock inventory positions and the opportunity to communicate directly with our executives. We have invested in significant management training programs for our store leaders and our district leaders to enhance their business management skills. We also sponsor our annual store leaders’ conferences at which we conduct intense educational training programs to provide our video game store employees with information about the upcoming video game products that will be released by publishers during the holiday season. All video game software publishers and vendors are invited to attend the conferences.
Our Video Game Brands store operations are managed by market vice presidents or managing directors (in the case of international markets) who directly supervise regional leaders. The regions are further divided into districts, each with a district leader covering an average of 15 stores.
Our Technology Brands segment is managed by a senior vice president who manages a vice president for each of our three store concepts. We operate the AT&T branded, Cricket branded and Simply Mac branded stores with a field management and store management structure similar to that of our Video Game Brands stores.
Vendors
We purchase substantially all of our new products worldwide from approximately 90 manufacturers, software publishers and several distributors. Purchases from the top ten vendors in our Video Game Brands segments accounted for approximately 78% of our new product purchases in fiscal
2016
. Sony, Microsoft, Nintendo, Electronic Arts and Activision accounted for
24%
,
14%
,
10%
,
7%
and
6%
, respectively, of our new product purchases in our Video Game Brands segments during fiscal
2016
. We have established price protections with our primary video game product vendors in order to reduce our risk of inventory obsolescence. In addition, we have few purchase contracts with video game trade vendors and generally conduct business on an order-by-order basis, a practice that is typical throughout the industry. We purchase substantially all of our products in our Technology Brands segment through our agreements with AT&T and Apple. We believe that maintaining and strengthening our long-term relationships with our vendors is essential to our operations and continued expansion. We believe that we have very good relationships with our vendors.
9
Competition
The video game industry is intensely competitive and subject to rapid changes in consumer preferences and frequent new product introductions. We compete with mass merchants and regional chains; computer product and consumer electronics stores; other video game and PC software specialty stores; toy retail chains; direct sales by software publishers; and online retailers and game rental companies. Video game products are also distributed through other methods such as digital delivery. We also compete with sellers of pre-owned and value video game products. Additionally, we compete with other forms of entertainment activities, including casual and mobile games, movies, television, theater, sporting events and family entertainment centers.
In the U.S., we compete with Wal-Mart Stores, Inc. (“Wal-Mart”); Target Corporation (“Target”); Amazon.com, Inc. (“Amazon.com”); and Best Buy Co., Inc. (“Best Buy”), among others. Throughout Europe we compete with major consumer electronics retailers such as Media Markt, Saturn and FNAC, major hypermarket chains like Carrefour and Auchan, and online retailer Amazon.com. Competitors in Canada include Wal-Mart and Best Buy. In Australia, competitors include K-Mart, Target and JB HiFi stores.
Our Spring Mobile AT&T branded stores compete with mass market retailers such as Wal-Mart, Best Buy and Target, among others, as well as other pre-paid and post-paid wireless carriers and their distribution channels, including Verizon, Sprint and T-Mobile. Our Simply Mac stores compete with mass-market retailers as noted above. Our Spring Mobile managed Cricket branded stores compete with the pre-paid and post-paid wireless service offerings of Verizon, T-Mobile, Sprint and other prepaid brands including Boost, GoPhone and MetroPCS.
Seasonality
Our business, like that of many retailers, is seasonal, with the major portion of our sales and operating profit realized during the fourth fiscal quarter, which includes the holiday selling season. During fiscal
2016
and
2015
, we generated approximately
35%
and
38%
, respectively, of our sales during the fourth quarter.
Trademarks
We have a number of trademarks and servicemarks, including “GameStop,” “Game Informer,” “EB Games,” “Electronics Boutique,” “ThinkGeek,” “Spring Mobile,” “Simply Mac,” “Kongregate,” “Power to the Players
TM
” and “PowerUp Rewards,” which have been registered by us with the U.S. Patent and Trademark Office. For many of our trademarks and servicemarks, including “Micromania,” we also have registered or have registrations pending with the trademark authorities throughout the world. We maintain a policy of pursuing registration of our principal marks and opposing any infringement of our marks.
Employees
We have approximately 23,000 full-time salaried and hourly employees and between 30,000 and 45,000 part-time hourly employees worldwide, depending on the time of year. Fluctuation in the number of part-time hourly employees is due to the seasonality of our business. We believe that our relationship with our employees is excellent. Some of our international employees are covered by collective bargaining agreements, while none of our U.S. employees are represented by a labor union or are members of a collective bargaining unit.
Sustainability
We are committed to sustainability and to operating our business in a manner that results in a positive impact to the environment and our communities. Through our trade-in program, we take in software (CDs), gaming consoles and consumer electronics that are otherwise destined for landfills and either refurbish them or recycle them. In 2016 alone, through our U.S. refurbishment center, the company refurbished over 8 million pieces of software (CDs) and over 3.9 million consumer electronic devices, and recycled almost 3 million pounds of e-waste. In addition, we continuously measure, and look for cost-effective ways to reduce, our carbon emissions and have seen both our total emissions and emissions by store decrease over the past five years.
See the Social Responsibility section of our corporate website (www.gamestopcorp.com) for further information on our sustainability efforts. We are not incorporating by reference into this Annual Report on Form 10-K information or materials contained on our website or that can be accessed through our website.
10
Available Information
We make available on our corporate website (www.gamestopcorp.com), under “Investor Relations — SEC Filings,” free of charge, our annual reports on Form 10-K, quarterly reports on Form 10-Q, current reports on Form 8-K, and amendments to those reports as soon as reasonably practicable after we electronically file or furnish such material to the Securities and Exchange Commission (“SEC”). You may read and copy this information or obtain copies of this information by mail from the Public Reference Room of the SEC, 100 F Street, N.E., Washington, D.C. 20549, at prescribed rates. Further information on the operation of the SEC’s Public Reference Room in Washington, D.C. can be obtained by calling the SEC at 1-800-SEC-0330. The SEC also maintains a website that contains reports, proxy statements and other information about issuers, like GameStop, who file electronically with the SEC. The address of that site is http://www.sec.gov. In addition to copies of our annual reports on Form 10-K, quarterly reports on Form 10-Q, current reports on Form 8-K, and amendments to those reports, our Code of Standards, Ethics and Conduct is available on our website under “Investor Relations — Corporate Governance” and is available to our stockholders in print, free of charge, upon written request to the Investor Relations Department at GameStop Corp., 625 Westport Parkway, Grapevine, Texas 76051. The contents of our corporate website are not part of this Annual Report on Form 10-K, or any other report we file, with, or furnish to, the SEC.
|
ITEM 1A.
|
RISK FACTORS
|
An investment in our company involves a high degree of risk. You should carefully consider the risks below, together with the other information contained in this report, before you make an investment decision with respect to our company. The risks described below are not the only ones facing us. Additional risks not presently known to us, or that we consider immaterial, may also impair our business operations. Any of the following risks could materially adversely affect our business, operating results or financial condition, and could cause a decline in the trading price of our common stock and the value of your investment.
Risks Related to Our Business
Economic conditions in the U.S. and in certain international markets could adversely affect demand for the products we sell.
Sales of our products involve discretionary spending by consumers. Consumers are typically more likely to make discretionary purchases, including purchasing video game products, when there are favorable economic conditions. Consumer spending may be affected by many economic factors outside of the Company's control. Some of these factors include consumer disposable income levels, consumer confidence in current and future economic conditions, levels of employment, consumer credit availability, consumer debt levels, inflation, political conditions and the effect of weather, natural disasters, and civil disturbances. These and other economic factors could adversely affect demand for our products, which may negatively impact our business, results of operations and financial condition.
The video game industry has historically been cyclical and is affected by the introduction of next-generation consoles, which could negatively impact the demand for existing products or our pre-owned business.
The video game industry has historically been cyclical in nature in response to the introduction and maturation of new technology. Following the introduction of new video game platforms, sales of these platforms and related software and accessories generally increase due to initial demand, while sales of older platforms and related products generally decrease as customers migrate toward the new platforms. In addition, the features of new consoles or changes to the existing generations of consoles, including any future restrictions or conditions or the ability to play prior generation video games on such consoles, may adversely affect our pre-owned business.
The current generation console cycle began when Sony and Microsoft launched the PlayStation 4 and Xbox One in November 2013. Nintendo introduced the Switch in March 2017. If the current video game platforms do not continue to be successful, our sales of video game products could decline. The introduction of next-generation consoles could negatively impact the demand for existing products or our pre-owned business, which could have a negative impact on results of operations and financial condition.
We depend upon the timely delivery of new and innovative products from our vendors.
We depend on major hardware manufacturers, primarily Microsoft, Sony and Nintendo, to deliver new and existing video game platforms and new innovations on a timely basis and in anticipated quantities. In addition, we depend on software publishers to introduce new and updated software titles. We have experienced sales declines in the past due to a reduction in the number of new software titles available for sale. Any material delay in the introduction or delivery, or limited allocations, of hardware platforms or software titles could result in reduced sales.
If we fail to keep pace with changing industry technology and consumer preferences, we will be at a competitive disadvantage.
The interactive entertainment industry is characterized by swiftly changing technology, evolving industry standards, frequent new and enhanced product introductions, rapidly changing consumer preferences and product obsolescence. Video games are now played on a wide variety of mediums, including mobile phones, tablets, social networking websites and other devices. The popularity of browser, mobile and social gaming has increased greatly and this popularity is expected to continue to grow. Browser, mobile
11
and social gaming is accessed through hardware other than the consoles and traditional hand-held video game devices we currently sell. Our business and results of operations may be negatively impacted if we are unable to respond to this growth in popularity of browser, mobile and social gaming and transition our business to take advantage of these new forms of gaming. We have been and are currently pursuing various strategies to integrate these new forms of gaming into our business model, but we can provide no assurances that these strategies will be successful or profitable.
In order to continue to compete effectively in the video game industry, we need to respond quickly to technological changes and to understand their impact on our customers’ preferences. It may take significant time and resources to respond to these technological changes and changes in consumer preferences. Our business and results of operations may be negatively impacted if we fail to keep pace with these changes.
Technological advances in the delivery and types of video games and PC entertainment software, as well as changes in consumer behavior related to these new technologies, could lower our sales.
The current consoles from Sony, Nintendo, and Microsoft have facilitated download technology. Downloading of video game content to the current generation video game systems continues to grow and take an increasing percentage of new video game sales, despite possible constraints caused by bandwidth capacity and video game file sizes. If consumers' preference for downloading video game content continues to increase or these consoles and other advances in technology continue to expand our customers’ ability to access and download the current format of video games and incremental content for their games through these and other sources, our customers may no longer choose to purchase video games in our stores or reduce their purchases in favor of other forms of game delivery. As a result, our business and results of operations may be negatively impacted.
Our ability to obtain favorable terms from our suppliers may impact our financial results.
Our financial results depend significantly upon the business terms we can obtain from our suppliers, including competitive prices, unsold product return policies, advertising and market development allowances, freight charges and payment terms. We purchase substantially all of our products directly from manufacturers, software publishers and, in some cases, distributors. Our largest vendors in our Video Game Brands segments are Sony, Microsoft, Nintendo, Electronic Arts and Activision, which accounted for
24%
,
14%
,
10%
,
7%
and
6%
, respectively, of our new product purchases in fiscal
2016
. If our suppliers do not provide us with favorable business terms, we may not be able to offer products to our customers at competitive prices.
If our vendors fail to provide marketing and merchandising support at historical levels, our sales and earnings could be negatively impacted.
The manufacturers of video game hardware and software have typically provided retailers with significant marketing and merchandising support for their products. Additionally, AT&T and Apple provide our Technology Brands stores with similar support. As part of this support, we receive cooperative advertising and market development payments from these vendors which enable us to actively promote and merchandise the products we sell and drive sales at our stores and on our websites. We cannot assure you that vendors will continue to provide this support at historical levels. If they fail to do so, our business and results of operations may be negatively impacted.
The continued growth of our Technology Brands segment is dependent in large part on our relationship with AT&T and any material adverse change to this relationship would affect our results.
We continue to grow our Technology Brands segment as a way to diversify our business in order to continue to drive growth and to help mitigate the financial impact from the cyclical nature of the video game console business. Gross margins in our Technology Brands segment are higher than in our Video Game Brands segments and as a result, a growing portion of our profits is due to the growth of our Technology Brands segment. Our Technology Brands segment is primarily conducted through Spring Mobile, an AT&T authorized retailer currently operating
1,403
AT&T branded stores selling post-paid wireless services and products, and
69
Cricket branded stores selling pre-paid wireless services and products. Therefore, we depend in large part on our relationship with AT&T for the continued growth of our Technology Brands segment. In particular, we depend on AT&T for constant innovation and the timely delivery of products and services to our stores. Any material adverse change in our relationship with AT&T, including termination of the relationship (which is permissible upon a short notice period), the lack of innovation or failure to timely supply products or competitive service plans, or changes in the manner in which AT&T compensates its authorized retailers, could materially adversely impact the continued growth of our Technology Brands segment and our financial condition and results of operations.
Our growing relationship with AT&T could have an adverse impact on our business, including as a result of restrictions on our ability to offer products and services in the United States that compete with AT&T in wireless and wireline communications and a variety of technology businesses.
We are a significant reseller of AT&T products and services through our Technology Brands segment. We also sell certain AT&T products and services through our Video Game Brands stores. Our agreements with AT&T and its affiliates impose significant restrictions on our ability to offer products and services in the United States that compete with AT&T in wireless and wireline communications and a variety of technology businesses, including several that are adjacent to markets in which we participate or are considering entering, which could materially adversely impact this component of our business.
12
We have made and may make investments and acquisitions which could negatively impact our business if we fail to successfully complete and integrate them, or if they fail to perform in accordance with our expectations.
To enhance our efforts to grow and compete, we have made and continue to make investments and acquisitions. These activities include investments in and acquisitions of digital, browser, social and mobile gaming and technology-based companies as the delivery methods for video games continue to evolve, and investments in new retail categories like wireless and consumer electronics. Our plans to pursue future transactions are subject to our ability to identify potential candidates and negotiate favorable terms for these transactions. Accordingly, we cannot assure you that future investments or acquisitions will be completed. In addition, to facilitate future transactions, we may take actions that could dilute the equity interests of our stockholders, increase our debt or cause us to assume contingent liabilities, all of which may have a detrimental effect on the price of our common stock. Also, companies that we have acquired, and that we may acquire in the future, could have products that are in development, and there is no assurance that these products will be successfully developed. Finally, if any acquisitions are not successfully integrated with our business, or fail to perform in accordance with our expectations, our ongoing operations could be adversely affected. Integration of digital, browser, social and mobile gaming and mobile phone and technology-based companies or other retailers may be particularly challenging to us as these companies are outside of our historical operating expertise.
Pressure from our competitors may force us to reduce our prices or increase spending, which could decrease our profitability.
The retail environment is intensely competitive and subject to rapid changes in consumer preferences and frequent new product introductions. We compete with mass merchants and regional chains, including Wal-Mart and Target; computer product and consumer electronics stores, including Best Buy; internet-based retailers such as Amazon.com; other U.S. and international video game and PC software specialty stores located in malls and other locations, such as Carrefour and Media Markt; toy retail chains; direct sales by software publishers; and online retailers and game rental companies. Some of our competitors have longer operating histories and may have greater financial resources than we do or other advantages. In addition, video game products and content are increasingly being digitally distributed and new competitors built to take advantage of these new capabilities are entering the marketplace, and other methods may emerge in the future. We also compete with other sellers of pre-owned video game products and other PC software distribution companies, including Steam. Certain of our mass-merchant competitors are expanding in the market for pre-owned video games through aggressive pricing which may negatively affect our margins, sales and earnings for these products. Additionally, we compete with other forms of entertainment activities, including browser, social and mobile games, movies, television, theater, sporting events and family entertainment centers. Our Technology Brands stores compete with a wide variety of other wireless carriers and retailers and consumer electronics retailers, including AT&T, which competes with our Spring Mobile managed AT&T and Cricket branded stores. If we lose customers to our competitors, or if we reduce our prices or increase our spending to maintain our customers, we may be less profitable.
We depend upon our key personnel and they would be difficult to replace.
Our success depends upon our ability to attract, motivate and retain a highly trained and engaged workforce, including key management for our stores and skilled merchandising, marketing, financial and administrative personnel. The turnover rate in the retail industry is relatively high, and there is an ongoing need to recruit and train new store employees. Factors that affect our ability to maintain sufficient numbers of qualified employees include employee morale, our reputation, unemployment rates, competition from other employers and our ability to offer appropriate compensation packages. Additionally, we depend upon the continued services of our key executive officers, including our Executive Chairman, Chief Executive Officer, Chief Operating Officer and Executive Vice Presidents. Our inability to recruit a sufficient number of qualified individuals or our failure to retain key employees in the future may have a negative impact on our business and results of operations.
Damage to our reputation could adversely affect our business and our relationships with our customers.
Our continued success depends upon customers' perception of our Company. Any negative publicity relating to our vendors, products, practices or our Company could damage our reputation. The increased use of social media platforms allows for the rapid disbursement of information, including negative feedback or other commentary, which could negatively impact our reputation and result in declines in customer loyalty and adversely affect our results of operations.
International events could delay or prevent the delivery of products to our suppliers.
Our suppliers rely on foreign sources, primarily in Asia, to manufacture a portion of the products we purchase from them. As a result, any event causing a disruption of imports, including natural disasters or the imposition of import restrictions or trade restrictions in the form of tariffs or quotas, could increase the cost and reduce the supply of products available to us, which may negatively impact our business and results of operations.
13
Our international operations expose us to numerous risks.
We have international retail operations in Australia, Canada and Europe. Because release schedules for hardware and software introduction in these markets can sometimes differ from release schedules in the United States, the timing of increases and decreases in foreign sales may differ from the timing of increases and decreases in domestic sales. We are also subject to a number of other factors that may affect our current or future international operations. These include:
|
•
|
economic downturns, specifically in the regions in which we operate;
|
|
•
|
currency exchange rate fluctuations;
|
|
•
|
international incidents;
|
|
•
|
natural disasters;
|
|
•
|
government instability; and
|
|
•
|
competitors entering our current and potential markets.
|
Our operations in Europe are also subject to risks associated with the current economic conditions and uncertainties in the European Union (“EU”). In June 2016, voters in the United Kingdom approved the exit of that country from the EU (“Brexit”), and the British government has indicated that it intends to negotiate a withdrawal of the U.K. from the EU. The Brexit vote has created significant economic uncertainty in Europe. In addition, European and global economic conditions have been negatively impacted by the inability of certain EU member states to service their sovereign debt obligations. There continues to be uncertainty over the possibility that other EU member states may experience similar financial troubles, the ultimate outcome of the EU governments’ financial support programs, the possible breakup or restructuring of the EU and the possible elimination or restructuring of the EU monetary system. These continued uncertainties could further disrupt European and global economic conditions. Unfavorable economic conditions could negatively impact consumer demand for our products. These factors could negatively impact our business, results of operations and financial condition.
We are also subject to risks that our operations outside the United States could be conducted by our employees, contractors, representatives or agents in ways that violate the Foreign Corrupt Practices Act or other similar anti-bribery laws. While we have policies and procedures intended to ensure compliance with these laws, our employees, contractors, representatives and agents may take actions that violate our policies. Moreover, it may be more difficult to oversee the conduct of any such persons who are not our employees, potentially exposing us to greater risk from their actions. Any violations of those laws by any of those persons could have a negative impact on our business.
Changes to tariff and import/export regulations may negatively impact our future financial condition and results of operations.
The United States and other countries have occasionally proposed and enacted protectionist trade policies that could increase the cost or reduce the availability of certain merchandise. In particular, the current U.S. administration has made comments supporting potential changes to import/export tariffs and international trade agreements and there is political discussion regarding the implementation of a “border adjustment tax.” Any of these measures, if implemented, could have an adverse impact on our business because a significant portion of the products we offer are purchased from foreign vendors and manufactured in foreign countries.
Unfavorable changes in our global tax rate could have a negative impact on our business, results of operations and cash flows.
As a result of our operations in many foreign countries, our global tax rate is derived from a combination of applicable tax rates in the various jurisdictions in which we operate. Depending upon the sources of our income, any agreements we may have with taxing authorities in various jurisdictions and the tax filing positions we take in various jurisdictions, our overall tax rate may be higher than other companies or higher than our tax rates have been in the past. We base our estimate of an annual effective tax rate at any given point in time on a calculated mix of the tax rates applicable to our business and to estimates of the amount of income to be derived in any given jurisdiction. A change in the mix of our business from year to year and from country to country, changes in rules related to accounting for income taxes, changes in tax laws in any of the multiple jurisdictions in which we operate or adverse outcomes from the tax audits that regularly are in process in any jurisdiction in which we operate could result in an unfavorable change in our overall tax rate, which could have a material adverse impact on our business and results of our operations.
Restrictions on our ability to take trade-ins of and sell pre-owned video game products or pre-owned mobile devices could negatively affect our financial condition and results of operations.
Our financial results depend on our ability to take trade-ins of, and sell, pre-owned video game products and pre-owned mobile devices within our stores. Actions by manufacturers or publishers of video game products or mobile devices, wireless carriers or governmental authorities to prohibit or limit our ability to take trade-ins or sell pre-owned video game products or mobile devices, or to limit the ability of consumers to play pre-owned video games or use pre-owned mobile devices, could have a negative impact on our results of operations.
14
Sales of video games containing graphic violence may decrease as a result of actual violent events or other reasons, and our financial results may be adversely affected as a result.
Many popular video games contain material with graphic violence. These games receive an “M” or “T” rating from the Entertainment Software Ratings Board. As actual violent events occur and are publicized, or for other reasons, public acceptance of graphic violence in video games may decline. Consumer advocacy groups may increase their efforts to oppose sales of graphically-violent video games and may seek legislation prohibiting their sales. As a result, our sales of those games may decrease, which could negatively impact our results of operations.
An adverse trend in sales during the holiday selling season could impact our financial results.
Our business, like that of many retailers, is seasonal, with the major portion of our sales and operating profit realized during the fourth fiscal quarter, which includes the holiday selling season. During fiscal 2016, we generated approximately
35%
of our sales during the fourth quarter. Any adverse trend in sales during the holiday selling season could lower our results of operations for the fourth quarter and the entire fiscal year.
Our results of operations may fluctuate from quarter to quarter.
Our results of operations may fluctuate from quarter to quarter depending upon several factors, some of which are beyond our control. These factors include, but are not limited to:
|
•
|
the timing and allocations of new product releases including new console launches;
|
|
•
|
the timing of new store openings or closings;
|
|
•
|
shifts in the timing or content of certain promotions or service offerings;
|
|
•
|
the effect of changes in tax rates in the jurisdictions in which we operate;
|
|
•
|
acquisition costs and the integration of companies we acquire or invest in;
|
|
•
|
the mix of earnings in the countries in which we operate;
|
|
•
|
the costs associated with the exit of unprofitable markets, businesses or stores; and
|
|
•
|
changes in foreign currency exchange rates.
|
These and other factors could affect our business, financial condition and results of operations, and this makes the prediction of our financial results on a quarterly basis difficult. Also, it is possible that our quarterly financial results may be below the expectations of public market analysts.
Failure to effectively manage our new store openings could lower our sales and profitability.
Our growth strategy depends in part upon opening new stores and operating them profitably. We opened
73
Video Game Brands stores (including
52
collectibles stores) and opened or acquired
583
Technology Brands stores in fiscal
2016
. We expect to open approximately
100
new stores in fiscal
2017
, including approximately
35
collectibles stores and approximately
65
Technology Brands stores. Our ability to open new stores and operate them profitably depends upon a number of factors, some of which may be beyond our control. These factors include:
|
•
|
the ability to identify new store locations, negotiate suitable leases and build out the stores in a timely and cost efficient manner;
|
|
•
|
the ability to hire and train skilled associates;
|
|
•
|
the ability to integrate new stores into our existing operations; and
|
|
•
|
the ability to increase sales at new store locations.
|
If we fail to manage new store openings in a timely and cost efficient manner, our growth or profits may decrease.
Failure to successfully execute our strategy to close stores and transfer customers and sales to nearby stores could adversely impact our financial results.
Our strategy includes closing stores which are not meeting our performance standards or stores at the end of their lease terms and transferring sales to other nearby GameStop locations. We closed
141
Video Game Brands stores worldwide in fiscal 2016 and plan to close approximately
130
Video Game Brands stores worldwide in fiscal
2017
. We believe that we can ultimately increase profitability by successfully transferring customers and sales to other stores by marketing directly to the PowerUp Rewards members who have shopped in the stores that we plan to close. If we are unsuccessful in marketing to customers of the stores that we plan to close or in transferring sales to nearby stores, our results of operations could be negatively impacted.
15
If we are unable to renew or enter into new leases on favorable terms, our revenue may be adversely affected.
All of our retail stores are located in leased premises. If the cost of leasing existing stores increases, we cannot assure you that we will be able to maintain our existing store locations as leases expire. In addition, we may not be able to enter into new leases on favorable terms or at all, or we may not be able to locate suitable alternative sites or additional sites for new store expansion in a timely manner. Our revenues and earnings may decline if we fail to maintain existing store locations, enter into new leases, locate alternative sites or find additional sites for new store expansion.
We rely on centralized facilities for refurbishment of our pre-owned products. Any disruption to these facilities could adversely affect our profitability.
We rely on centralized facilities for the refurbishment of all pre-owned products that we sell. If any disruption occurred at these facilities, whether due to natural disaster or severe weather, or events such as fire, accidents, power outages, systems failures, or other unforeseen causes, sales of our pre-owned products could decrease. Since we generally obtain higher margins on our pre-owned products, any adverse effect on their sales could adversely affect our profitability.
If our management information systems fail to perform or are inadequate, our ability to manage our business could be disrupted.
We rely on computerized inventory and management systems to coordinate and manage the activities in our distribution centers, as well as to communicate distribution information to the off-site, third-party operated distribution centers with which we work. The third-party distribution centers pick up products from our suppliers, repackage the products for each of our stores and ship those products to our stores by package carriers. We use inventory replenishment systems to track sales and inventory. Our ability to rapidly process incoming shipments of new release titles and deliver them to all of our stores, either that day or by the next morning, enables us to meet peak demand and replenish stores at least twice a week, to keep our stores in stock at optimum levels and to move inventory efficiently. If our inventory or management information systems fail to adequately perform these functions, our business could be adversely affected. In addition, if operations in any of our distribution centers were to shut down or be disrupted for a prolonged period of time or if these centers were unable to accommodate the continued store growth in a particular region, our business and results of operations may be negatively impacted.
Data breaches involving customer or employee data stored by us could adversely affect our reputation and revenues.
We store confidential information with respect to our customers and employees. A compromise of our data security systems or those of businesses with which we interact could result in information related to our customers or employees being obtained by unauthorized persons. Any such breach of our systems could lead to fraudulent activity resulting in claims and lawsuits against us or other operational problems or interruptions in connection with such breaches. Consequently, despite our efforts, our security measures have been breached in the past and may be breached in the future due to cyber-attack, team member error, malfeasance, fraudulent inducement or other acts; and unauthorized parties have in the past obtained, and may in the future obtain, access to our data or our customers’ data. While costs associated with past security breaches have not been significant, any breach or unauthorized access in the future could result in significant legal and financial exposure and damage to our reputation that could potentially have an adverse effect on our business. While we also seek to obtain assurances that others with whom we interact will protect confidential information, there is a risk the confidentiality of data held or accessed by others may be compromised. If a compromise of our data security or function of our computer systems or website were to occur, it could have a material adverse effect on our operating results and financial condition and, possibly, subject us to additional legal, regulatory and operating costs and damage our reputation in the marketplace.
Also, the interpretation and enforcement of data protection laws in the United States, Europe and elsewhere are uncertain and, in certain circumstances, contradictory. These laws may be interpreted and enforced in a manner that is inconsistent with our policies and practices. If we are subject to data security breaches or government-imposed fines, we may have a loss in sales or be forced to pay damages or other amounts, which could adversely affect profitability, or be subject to substantial costs related to compliance.
Litigation and the outcomes of such litigation could negatively impact our future financial condition and results of operations.
In the ordinary course of our business, we are, from time to time, subject to various litigation and legal proceedings, including matters involving wage and hour employee class actions, stockholder and consumer class actions, tax audits and unclaimed property audits by states. The outcome of litigation and other legal proceedings and the magnitude of potential losses therefrom, particularly class action lawsuits and regulatory actions, is difficult to assess or quantify. Certain of these legal proceedings, if decided adversely to us or settled by us, may require changes to our business operations that negatively impact our operating results or involve significant liability awards that impact our financial condition. The cost to defend litigation may be significant. As a result, legal proceedings may adversely affect our business, financial condition, results of operations or liquidity.
16
Legislative actions and changes in accounting rules may cause our general and administrative and compliance costs to increase and impact our future financial condition and results of operations.
In order to comply with laws adopted by the U.S. government or other U.S. or foreign regulatory bodies, we may be required to increase our expenditures and hire additional personnel and additional outside legal, accounting and advisory services, all of which may cause our general and administrative and compliance costs to increase. Significant workforce-related legislative changes could increase our expenses and adversely affect our operations. Examples of possible workforce-related legislative changes include changes to an employer's obligation to recognize collective bargaining units, the process by which collective bargaining agreements are negotiated or imposed, minimum wage requirements, and health care mandates. In addition, changes in the regulatory environment affecting Medicare reimbursements, product safety, supply chain transparency, and increased compliance costs related to enforcement of federal and state wage and hour statutes and common law related to overtime, among others, could cause our expenses to increase without an ability to pass through any increased expenses through higher prices. Environmental legislation or other regulatory changes could impose unexpected costs or impact us more directly than other companies due to our operations as a global retailer. Specifically, environmental legislation or international agreements affecting energy, carbon emissions, and water or product materials are continually being explored by governing bodies. Increasing energy and fuel costs, supply chain disruptions and other potential risks to our business, as well as any significant rule making or passage of any such legislation, could materially increase the cost to transport our goods and materially adversely affect our results of operations. Additionally, regulatory and enforcement activity focused on the retail industry has increased in recent years, increasing the risk of fines and additional operational costs associated with compliance.
As a seller of certain consumer products, we are subject to various federal, state, local and international laws, regulations, and statutes relating to product safety and consumer protection.
While we take steps to comply with these laws, there can be no assurance that we will be in compliance, and failure to comply with these laws could result in penalties which could have a negative impact on our business, financial condition and results of operations. We may also be subject to involuntary or voluntary product recalls or product liability lawsuits. Direct costs or reputational damage associated with product recalls or product liability lawsuits, individually or in the aggregate, could have a negative impact on future revenues and results of operations.
Our Board of Directors could change our dividend policy at any time.
We initiated our first cash dividend on our common stock during fiscal 2012. Notwithstanding the foregoing, there is no assurance that we will continue to pay cash dividends on our common stock in the future. Certain provisions in our credit facility and covenants under the indentures for our 5.50% Senior Notes due October 1, 2019 (the “2019 Senior Notes”) and our 6.75% Senior Notes due March 15, 2021 (the "2021 Senior Notes" and, together, the “Senior Notes”), restrict our ability to pay dividends in certain circumstances. In addition, subject to any financial covenants in current or future financing agreements that directly or indirectly restrict our ability to pay dividends, the payment of dividends is within the discretion of our Board of Directors and will depend upon our future earnings and cash flow from operations, our capital requirements, our financial condition and any other factors that the Board of Directors may consider. Unless we continue to pay cash dividends on our common stock in the future, the success of an investment in our common stock will depend entirely upon its future appreciation. Our common stock may not appreciate in value or even maintain the price at which it was purchased.
We may record future goodwill impairment charges or other asset impairment charges which could negatively impact our results of operations.
In recent periods, we have recorded non-cash charges relating to the impairment of tangible and intangible assets that had an adverse effect on our consolidated statements of operations and consolidated balance sheets. Because we have grown in part through acquisitions, goodwill and other acquired intangible assets represent a substantial portion of our assets. We also have long-lived assets consisting of property and equipment and other identifiable intangible assets which we review both on an annual basis as well as when events or circumstances indicate that the carrying amount of an asset may not be recoverable. If a determination is made that a significant impairment in value of goodwill, other intangible assets or long-lived assets has occurred, such determination could require us to impair a substantial portion of our assets. Asset impairments could have a material adverse impact on our results of operations.
Because of our floating rate credit facility, we may be adversely affected by interest rate changes.
Our financial position may be affected by fluctuations in interest rates, as our senior credit facility is subject to floating interest rates.
Interest rates are highly sensitive to many factors, including governmental monetary policies, domestic and international economic and political conditions and other factors beyond our control. If we were to borrow against our senior credit facility, a significant increase in interest rates could have a negative impact on our results of operations and financial condition.
17
The terms of our Senior Notes and senior credit facility may impose significant operating and financial restrictions on us.
The terms of our Senior Notes and our senior credit facility may impose significant operating and financial restrictions on us in certain circumstances. These restrictions, among other things, limit our ability to:
|
•
|
incur, assume or permit to exist additional indebtedness or guaranty obligations;
|
|
•
|
incur liens or agree to negative pledges in other agreements;
|
|
•
|
engage in sale and leaseback transactions;
|
|
•
|
make loans and investments;
|
|
•
|
declare dividends, make payments or redeem or repurchase capital stock;
|
|
•
|
engage in mergers, acquisitions and other business combinations;
|
|
•
|
prepay, redeem or purchase certain indebtedness;
|
|
•
|
amend or otherwise alter the terms of our organizational documents and indebtedness;
|
|
•
|
sell assets; and
|
|
•
|
engage in transactions with affiliates.
|
We cannot assure that these covenants will not adversely affect our ability to finance our future operations or capital needs or to pursue available business opportunities and may affect our ability to grow in accordance with our strategy. A breach of the covenants or restrictions under the indentures for the Senior Notes, or under our senior credit facility, could result in an event of default under the applicable indebtedness. Such a default may allow the creditors to accelerate the repayment of the related debt and may result in the acceleration of the repayment of any other debt to which a cross-acceleration or cross-default provision applied. In addition, an event of default under our senior credit facility would permit the lenders to terminate all commitments to extend further credit under that facility. Furthermore, if we were unable to repay the amounts due and payable under our senior credit facility, those lenders could proceed against the collateral granted to them to secure that indebtedness. In the event that our lenders or noteholders accelerate the repayment of our borrowings, we and our subsidiaries may not have sufficient assets to repay that indebtedness. See Note 9, "Debt," to our consolidated financial statements for a description of our Senior Notes and senior credit facility.
To service our indebtedness, we will require a significant amount of cash. We may not be able to generate sufficient cash flow to meet our debt service obligations.
Our ability to generate sufficient cash flow from operations to make scheduled payments on our indebtedness, including without limitation any payments required to be made under our senior credit facility or to holders of our Senior Notes, and to fund our operations, will depend on our ability to generate cash in the future. This, to a certain extent, is subject to general economic, financial, competitive, legislative, regulatory and other factors that are beyond our control. If we do not generate sufficient cash flow from operations to satisfy our debt obligations, including interest payments and the payment of principal at maturity, we may have to undertake alternative financing plans, such as refinancing or restructuring our debt, including the Senior Notes, selling assets, reducing or delaying capital investments or seeking to raise additional capital. We cannot provide assurance that any refinancing would be possible, that any assets could be sold, or, if sold, of the timing of the sales and the amount of proceeds realized from those sales, that additional financing could be obtained on acceptable terms, if at all, or if that additional financing would be permitted under the terms of our various debt instruments, then in effect.
Our senior credit facility and the indentures governing the Senior Notes restrict our ability to dispose of assets and use the proceeds from those sales and raise debt or equity to meet any debt service obligations then due. Our ability to refinance would also depend upon the condition of the finance and credit markets. Our inability to generate sufficient cash flow to satisfy our debt obligations, including the Senior Notes, or to refinance our obligations on commercially reasonable terms or on a timely basis, would have an negative impact on our business, results of operations and financial condition.
Despite current indebtedness levels, we and our subsidiaries may still be able to incur additional debt. This could further increase the risks associated with our leverage.
We are able to incur additional indebtedness. Although our senior credit facility and the indentures for our Senior Notes contain restrictions on the incurrence of additional indebtedness, these restrictions are subject to a number of qualifications and exceptions, and the additional indebtedness incurred in compliance with these restrictions could be substantial. These restrictions also will not prevent us from incurring obligations that do not constitute indebtedness. Such future indebtedness or obligations may have restrictions similar to, or more restrictive than, those included in the indentures for our Senior Notes or our senior credit facility. The incurrence of additional indebtedness could impact our financial condition and results of operations.
|
ITEM 1B.
|
UNRESOLVED STAFF COMMENTS
|
None.
18
|
ITEM 2.
|
PROPERTIES
|
All of our stores are leased. Store leases typically provide for an initial lease term of five to ten years, plus renewal options. This arrangement gives us the flexibility to pursue extension or relocation opportunities that arise from changing market conditions. We believe that, as current leases expire, we will be able to obtain either renewals at present locations, leases for equivalent locations in the same area, or be able to close the stores with expiring leases and transfer enough of the sales to other nearby stores to improve, if not at least maintain, profitability.
The terms of the store leases for the
7,535
leased stores open as of
January 28, 2017
expire as follows:
|
Lease Terms to Expire During (12 Months Ending on or About January 28)
|
Number
of Stores
|
||
|
2018
|
1,730
|
|
|
|
2019
|
1,741
|
|
|
|
2020
|
1,658
|
|
|
|
2021
|
1,206
|
|
|
|
2022 and later
|
1,200
|
|
|
|
Total
|
7,535
|
|
|
As of
January 28, 2017
, we owned eight and leased 13 office and distribution facilities, totaling approximately 2.2 million square feet. The lease expiration dates for the leased facilities range from 2017 to 2024, with an average remaining lease life of approximately five years. Our principal facilities are as follows:
|
Location
|
Square
Footage
|
Owned or
Leased
|
Use
|
||||
|
Grapevine, Texas, USA
|
519,000
|
|
Owned
|
Distribution and administration
|
|||
|
Grapevine, Texas, USA
|
182,000
|
|
Owned
|
Manufacturing and distribution
|
|||
|
Shepherdsville, Kentucky, USA
|
631,000
|
|
Leased
|
Distribution
|
|||
|
Brampton, Ontario, Canada
|
119,000
|
|
Owned
|
Distribution and administration
|
|||
|
Eagle Farm, Queensland, Australia
|
185,000
|
|
Owned
|
Distribution and administration
|
|||
|
Milan, Italy
|
123,000
|
|
Owned
|
Distribution and administration
|
|||
Additional information regarding our properties can be found in Item 1, “Business—Store Operations” and Item 1, “Business—Site Selection and Locations” in this Form 10-K.
|
ITEM 3.
|
LEGAL PROCEEDINGS
|
In the ordinary course of business, we are, from time to time, subject to various legal proceedings, including matters involving wage and hour employee class actions, stockholder and consumer class actions, tax audits and unclaimed property audits by states. We may enter into discussions regarding settlement of these and other types of legal proceedings, and may enter into settlement agreements, if we believe settlement is in the best interest of our stockholders. We do not believe that any such existing legal proceedings or settlements, individually or in the aggregate, will have a material effect on our financial condition, results of operations or liquidity.
Certain of our French subsidiaries have been under audit by the French Tax Administration (the "FTA") for fiscal years 2008 through 2012. We received tax reassessment notices on December 23, 2015 and April 4, 2016, pursuant to which the FTA asserted that the French subsidiaries were ineligible to claim certain tax deductions from November 4, 2008, through January 31, 2013, resulting in a potential additional tax charge of approximately
€85.5 million
. We may receive additional tax reassessments in material amounts for subsequent fiscal years. We filed a response to each reassessment and intend to vigorously contest the reassessments through administrative procedures. If we are unable to resolve this matter through administrative remedies at the FTA, we plan to pursue judicial remedies. We believe our tax positions will be sustained and have not taken a reserve for any potential adjustment based on the reassessment. If we were not to prevail, then the adjustment to our income tax provision could be material.
|
ITEM 4.
|
MINE SAFETY DISCLOSURES
|
Not applicable.
19
|
ITEM 5.
|
MARKET FOR REGISTRANT'S COMMON EQUITY, RELATED STOCKHOLDER MATTERS AND ISSUER PURCHASES OF EQUITY SECURITIES
|
Our Class A Common Stock is traded on the New York Stock Exchange (“NYSE”) under the symbol “GME.”
The following table sets forth, for the periods indicated, the high and low sales prices of the Class A Common Stock on the NYSE Composite Tape and the dividends declared during those periods:
|
Class A Common Stock Sales Prices
|
Dividends Declared
|
|||||||||||||||||||||||
|
|
Fiscal 2016
|
Fiscal 2015
|
Fiscal Year
|
|||||||||||||||||||||
|
|
High
|
Low
|
High
|
Low
|
2016
|
2015
|
||||||||||||||||||
|
Fourth Quarter
|
$
|
26.85
|
|
$
|
20.10
|
|
$
|
47.48
|
|
$
|
24.33
|
|
$
|
0.37
|
|
$
|
0.36
|
|
||||||
|
Third Quarter
|
$
|
32.67
|
|
$
|
23.69
|
|
$
|
47.83
|
|
$
|
38.66
|
|
0.37
|
|
0.36
|
|
||||||||
|
Second Quarter
|
$
|
32.86
|
|
$
|
25.18
|
|
$
|
47.76
|
|
$
|
38.47
|
|
0.37
|
|
0.36
|
|
||||||||
|
First Quarter
|
$
|
33.72
|
|
$
|
24.75
|
|
$
|
42.67
|
|
$
|
34.52
|
|
0.37
|
|
0.36
|
|
||||||||
|
$
|
1.48
|
|
$
|
1.44
|
|
|||||||||||||||||||
On
February 28, 2017
, our Board of Directors authorized an increase in our annual cash dividend from
$1.48
to
$1.52
per share of Class A Common Stock. Our payment of dividends is and will continue to be restricted by or subject to, among other limitations, applicable provisions of federal and state laws, our earnings and various business considerations, including our financial condition, results of operations, cash flow, the level of our capital expenditures, our future business prospects, our status as a holding company and such other matters that our Board of Directors deems relevant. In addition, the terms of the senior credit facility and of the indentures governing our Senior Notes restrict our ability to pay dividends under certain circumstances. See Item 7, “Management’s Discussion and Analysis of Financial Condition and Results of Operations—Liquidity and Capital Resources” herein for further information regarding restrictions on our dividend payments.
Approximate Number of Holders of Common Equity
As of
March 16, 2017
, there were approximately
1,429
record holders of our Class A Common Stock.
Issuer Purchases of Equity Securities
Our purchases of our equity securities during the fourth quarter of the fiscal year ended
January 28, 2017
were as follows:
|
Fiscal Period
|
Total
Number of
Shares
Purchased
|
Average
Price Paid per
Share
|
Total Number of
Shares Purchased
as Part of Publicly
Announced Plans or
Programs
|
Approximate Dollar
Value of Shares that
May Yet Be Purchased
Under the Plans or
Programs (1)
|
||||||||||
|
|
|
(In millions)
|
||||||||||||
|
October 30, 2016 through November 26, 2016
|
755,396
|
|
$
|
22.63
|
|
755,396
|
|
$
|
192.2
|
|
||||
|
November 27, 2016 through December 31, 2016
|
—
|
|
$
|
—
|
|
—
|
|
$
|
192.2
|
|
||||
|
January 1, 2017 through January 28, 2017
|
903,565
|
|
$
|
24.35
|
|
903,565
|
|
$
|
170.2
|
|
||||
|
Total
|
1,658,961
|
|
1,658,961
|
|
||||||||||
|
(1)
|
In November 2014, the Board of Directors authorized $500 million to be used for share repurchases, which has no expiration date.
|
20
Stock Comparative Performance Graph
The following graph compares the cumulative total stockholder return on our Class A Common Stock for the period commencing January 27, 2012 through January 28, 2017 (the last trading date of fiscal 2016) with the cumulative total return on the Standard & Poor’s 500 Stock Index (the “S&P 500”) and the Dow Jones Retailers, Other Specialty Industry Group Index (the “Dow Jones Specialty Retailers Index”) over the same period. Total return values were calculated based on cumulative total return assuming (i) the investment of $100 in our Class A Common Stock, the S&P 500 and the Dow Jones Specialty Retailers Index on January 27, 2012 and (ii) reinvestment of dividends.
The following stock performance graph and related information shall not be deemed “soliciting material” or “filed” with the SEC, nor should such information be incorporated by reference into any future filings under the Securities Act or the Exchange Act, except to the extent that we specifically incorporate it by reference in such filing.
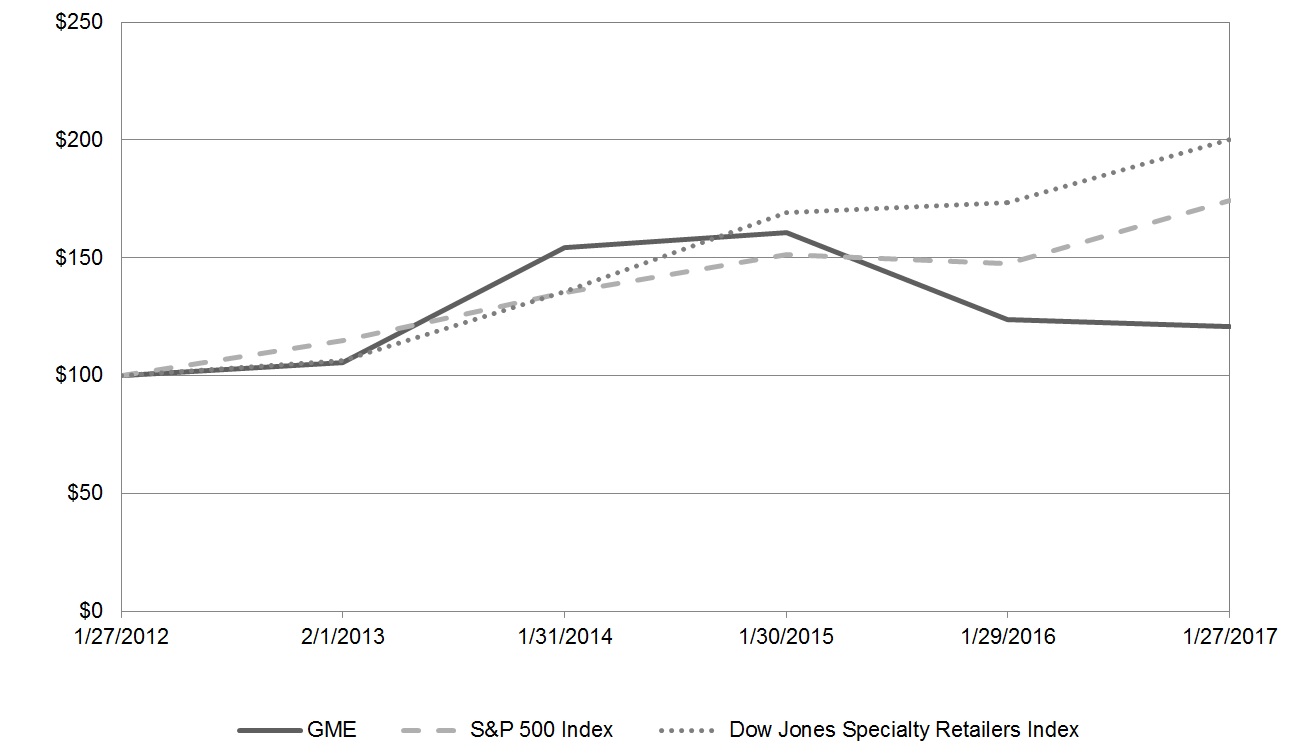
|
1/27/2012
|
2/1/2013
|
1/31/2014
|
1/30/2015
|
1/29/2016
|
1/27/2017
|
|||||||||||||||||||
|
GME
|
$
|
100.00
|
|
$
|
105.35
|
|
$
|
154.34
|
|
$
|
160.54
|
|
$
|
123.76
|
|
$
|
121.01
|
|
||||||
|
S&P 500 Index
|
100.00
|
|
114.95
|
|
135.42
|
|
151.56
|
|
147.40
|
|
174.32
|
|
||||||||||||
|
Dow Jones Specialty Retailers Index
|
100.00
|
|
106.25
|
|
135.79
|
|
169.10
|
|
173.28
|
|
199.98
|
|
||||||||||||
Securities Authorized for Issuance under Equity Compensation Plans
For information regarding securities authorized for issuance under equity compensation plans, refer to Part III, Item 12, “Security Ownership of Certain Beneficial Owners and Management and Related Stockholder Matters.”
21
|
ITEM 6.
|
SELECTED FINANCIAL DATA
|
The following table sets forth our selected consolidated financial and operating data for the periods ended and as of the dates indicated. Our fiscal year is composed of 52 or 53 weeks ending on the Saturday closest to January 31. The fiscal year ended February 2, 2013 ("fiscal 2012") consisted of 53 weeks. The fiscal years ended January 28, 2017 ("fiscal 2016"), January 30, 2016 ("fiscal 2015"), January 31, 2015 ("fiscal 2014") and February 1, 2014 ("fiscal 2013") consisted of 52 weeks. The “Statement of Operations Data” for the fiscal years ended January 28, 2017, January 30, 2016 and January 31, 2015 and the “Balance Sheet Data” as of January 28, 2017 and January 30, 2016 are derived from our audited consolidated financial statements which are included elsewhere in this Form 10-K. The “Statement of Operations Data” for fiscal years ended February 1, 2014 and February 2, 2013 and the “Balance Sheet Data” as of January 31, 2015, February 1, 2014 and February 2, 2013 are derived from our consolidated financial statements, available at sec.gov, which are not included elsewhere in this Annual Report on Form 10-K.
The selected financial data set forth below should be read in conjunction with Item 7, “Management’s Discussion and Analysis of Financial Condition and Results of Operations” and the consolidated financial statements and notes thereto included in this Annual Report on Form 10-K.
|
Fiscal Year
|
|||||||||||||||||||
|
2016
|
2015
|
2014
|
2013
|
2012
|
|||||||||||||||
|
|
(In millions, except statistical and per share data)
|
||||||||||||||||||
|
Statement of Operations Data:
|
|||||||||||||||||||
|
Net sales
|
$
|
8,607.9
|
|
$
|
9,363.8
|
|
$
|
9,296.0
|
|
$
|
9,039.5
|
|
$
|
8,886.7
|
|
||||
|
Cost of sales
|
5,598.6
|
|
6,445.5
|
|
6,520.1
|
|
6,378.4
|
|
6,235.2
|
|
|||||||||
|
Gross profit
|
3,009.3
|
|
2,918.3
|
|
2,775.9
|
|
2,661.1
|
|
2,651.5
|
|
|||||||||
|
Selling, general and administrative expenses
|
2,252.6
|
|
2,108.9
|
|
2,001.0
|
|
1,892.4
|
|
1,835.9
|
|
|||||||||
|
Depreciation and amortization
|
165.2
|
|
156.6
|
|
154.4
|
|
166.5
|
|
176.5
|
|
|||||||||
|
Goodwill impairments
(1)
|
—
|
|
—
|
|
—
|
|
10.2
|
|
627.0
|
|
|||||||||
|
Asset impairments
(2)
|
33.8
|
|
4.6
|
|
2.2
|
|
18.5
|
|
53.7
|
|
|||||||||
|
Operating earnings (loss)
|
557.7
|
|
648.2
|
|
618.3
|
|
573.5
|
|
(41.6
|
)
|
|||||||||
|
Interest expense, net
|
53.0
|
|
23.0
|
|
10.0
|
|
4.7
|
|
3.3
|
|
|||||||||
|
Earnings (loss) before income tax expense
|
504.7
|
|
625.2
|
|
608.3
|
|
568.8
|
|
(44.9
|
)
|
|||||||||
|
Income tax expense
|
151.5
|
|
222.4
|
|
215.2
|
|
214.6
|
|
224.9
|
|
|||||||||
|
Net income (loss)
|
$
|
353.2
|
|
$
|
402.8
|
|
$
|
393.1
|
|
$
|
354.2
|
|
$
|
(269.8
|
)
|
||||
|
Per Share Data:
|
|||||||||||||||||||
|
Earnings (loss) per share — Basic
|
$
|
3.42
|
|
$
|
3.80
|
|
$
|
3.50
|
|
$
|
3.02
|
|
$
|
(2.13
|
)
|
||||
|
Earnings (loss) per share — Diluted
|
$
|
3.40
|
|
$
|
3.78
|
|
$
|
3.47
|
|
$
|
2.99
|
|
$
|
(2.13
|
)
|
||||
|
Dividends per common share
|
$
|
1.48
|
|
$
|
1.44
|
|
$
|
1.32
|
|
$
|
1.10
|
|
$
|
0.80
|
|
||||
|
Weighted-average common shares outstanding:
|
|||||||||||||||||||
|
Basic
|
103.4
|
|
106.0
|
|
112.2
|
|
117.2
|
|
126.4
|
|
|||||||||
|
Diluted
|
103.8
|
|
106.7
|
|
113.2
|
|
118.4
|
|
126.4
|
|
|||||||||
|
Store Operating Data:
|
|||||||||||||||||||
|
Comparable store sales (decrease) increase
(3)
|
(11.0
|
)%
|
4.3
|
%
|
3.4
|
%
|
3.8
|
%
|
(8.0
|
)%
|
|||||||||
|
Inventory turnover
|
4.5
|
|
5.2
|
|
5.7
|
|
5.3
|
|
5.0
|
|
|||||||||
|
Number of Stores by Segment at Fiscal Year End:
|
|||||||||||||||||||
|
United States
|
3,944
|
|
4,013
|
|
4,138
|
|
4,249
|
|
4,425
|
|
|||||||||
|
Canada
|
322
|
|
325
|
|
331
|
|
335
|
|
336
|
|
|||||||||
|
Australia
|
464
|
|
444
|
|
421
|
|
418
|
|
416
|
|
|||||||||
|
Europe
|
1,283
|
|
1,299
|
|
1,316
|
|
1,455
|
|
1,425
|
|
|||||||||
|
Technology Brands
|
1,522
|
|
1,036
|
|
484
|
|
218
|
|
—
|
|
|||||||||
|
Total
|
7,535
|
|
7,117
|
|
6,690
|
|
6,675
|
|
6,602
|
|
|||||||||
|
Balance Sheet Data at Fiscal Year End:
|
|||||||||||||||||||
|
Working capital
(4)
|
$
|
379.2
|
|
$
|
143.1
|
|
$
|
421.5
|
|
$
|
223.6
|
|
$
|
295.6
|
|
||||
|
Total assets
(4)
|
4,975.9
|
|
4,330.3
|
|
4,240.4
|
|
4,091.4
|
|
3,872.2
|
|
|||||||||
|
Total debt, net
(4)(5)
|
815.0
|
|
345.4
|
|
349.8
|
|
4.0
|
|
—
|
|
|||||||||
|
Total liabilities
(4)
|
2,721.8
|
|
2,249.3
|
|
2,172.7
|
|
1,840.0
|
|
1,585.9
|
|
|||||||||
|
Total equity
|
2,254.1
|
|
2,081.0
|
|
2,067.7
|
|
2,251.4
|
|
2,286.3
|
|
|||||||||
22
___________________
|
(1)
|
Results for fiscal 2013 include a goodwill impairment charge of $10.2 million related to our decision to abandon our investment in Spawn Labs. Results for fiscal 2012 include charges related to goodwill impairments of $627.0 million resulting from our interim goodwill impairment tests performed during the third quarter of fiscal 2012.
|
|
(2)
|
Results for fiscal 2016 include impairment charges of
$33.8 million
, comprised of a
$7.4 million
impairment to our Micromania trade name, a
$7.0 million
impairment to our Simply Mac dealer agreements and
$19.4 million
of property and equipment impairments. Results for fiscal 2015 include impairment charges of
$4.6 million
, comprised of
$4.4 million
of property and equipment impairments and
$0.2 million
of intangible asset impairments. Results for fiscal 2014 include impairment charges of $2.2 million, comprised of $1.9 million of property and equipment impairments and $0.3 million of intangible asset impairments. Results for fiscal 2013 include impairments of $18.5 million, of which $7.4 million and $2.1 million were related to certain technology assets and other intangible assets, respectively, as a result of our decision to abandon our investment in Spawn Labs and the remaining $9.0 million was related to property and equipment impairments resulting from our evaluation of store property, equipment and other assets. Results for fiscal 2012 include charges related to asset impairments of $53.7 million, of which $44.9 million relates to the impairment of the Micromania trade name and $8.8 million relates to other impairment charges from the evaluations of store property, equipment and other assets.
|
|
(3)
|
Comparable store sales is a measure commonly used in the retail industry and indicates store performance by measuring the growth in sales for certain stores for a particular period over the corresponding period in the prior year. Our comparable store sales are comprised of sales from our Video Game Brands stores, including stand-alone collectible stores, operating for at least 12 full months as well as sales related to our websites and sales we earn from sales of pre-owned merchandise to wholesalers or dealers. Comparable store sales for our international operating segments exclude the effect of changes in foreign currency exchange rates. The calculation of comparable store sales for fiscal year 2016 compares the 52 weeks for the period ended January 28, 2017 to the most closely comparable weeks for the prior year period. The method of calculating comparable store sales varies across the retail industry. As a result, our method of calculating comparable store sales may not be the same as other retailers’ methods. Our Technology Brands stores are excluded from the calculation of comparable store sales. We do not consider comparable store sales to be a meaningful metric in evaluating the performance of our Technology Brands stores due to the frequently changing nature of revenue streams and commission structures associated with this segment of our business. We believe our calculation of comparable store sales best represents our strategy as an omnichannel retailer who provides its consumers several ways to access its products.
|
|
(4)
|
In the first quarter of 2016, we adopted Accounting Standard Update 2015-03, Simplifying the Presentation of Debt Issuance Costs, that requires that debt issuance costs related to a recognized debt liability be presented in the balance sheet as a direct deduction from the carrying amount of that debt liability, consistent with debt discounts. As a result, we have recast the fiscal 2015 and 2014 consolidated balance sheet to conform to the current period presentation. See Note 1, "Nature of Operations and Summary of Significant Accounting Policies," for additional information.
|
|
(5)
|
In March 2016, we issued $475 million aggregate principal of 6.75% unsecured senior notes due in March 2021. In September 2014, we issued $350.0 million aggregate principal of 5.50% unsecured senior notes due in October 2019. See Note 9, "Debt," to our consolidated financial statements for additional information.
|
23
|
ITEM 7.
|
MANAGEMENT'S DISCUSSION AND ANALYSIS OF FINANCIAL CONDITION AND RESULTS OF OPERATIONS
|
The following discussion should be read in conjunction with the information contained in our consolidated financial statements, including the notes thereto. Statements regarding future economic performance, management’s plans and objectives, and any statements concerning assumptions related to the foregoing contained in Management’s Discussion and Analysis of Financial Condition and Results of Operations constitute forward-looking statements. Certain factors, which may cause actual results to vary materially from these forward-looking statements, accompany such statements or appear elsewhere in this Form 10-K, including the factors disclosed under Part I, Item 1A, “Risk Factors.”
OVERVIEW
GameStop Corp. (“GameStop,” “we,” “us,” “our,” or the “Company”) is a global family of specialty retail brands. Through our
6,013
video game brand stores and e-commerce sites in eight countries, we are the world's largest omnichannel retailer of video game products. We also offer wireless products and services and consumer technology products through our
1,403
AT&T authorized retailer stores,
69
Cricket pre-paid wireless stores and
50
Simply Mac stores, a certified reseller of Apple consumer electronic products. In addition, we are a leading retailer of collectible pop-culture themed products.
We have five reportable segments, which are comprised of four geographic Video Game Brands segments—United States, Canada, Australia and Europe—and a Technology Brands segment. Our Technology Brands segment includes our Spring Mobile and Simply Mac businesses. Spring Mobile owns and operates our AT&T branded wireless retail stores and Cricket branded pre-paid wireless stores.
Our fiscal year is composed of the 52 or 53 weeks ending on the Saturday closest to the last day of January. Fiscal year
2016
consisted of the
52
weeks ended on
January 28, 2017
("fiscal 2016"). Fiscal year
2015
consisted of the
52
weeks ended on
January 30, 2016
("fiscal 2015"). Fiscal year
2014
consisted of the
52
weeks ended on
January 31, 2015
("fiscal 2014").
Growth in the video game industry is generally driven by the introduction of new technology. Gaming consoles are typically launched in cycles as technological developments provide significant improvements in graphics, audio quality, game play, internet connectivity and other entertainment capabilities beyond video gaming. The current generation of consoles (the Sony PlayStation 4 and the Microsoft Xbox One) was introduced in 2013. In August and November 2016, Microsoft and Sony released refreshes to the current generation of consoles. Additionally, Sony introduced its virtual reality hardware, PlayStation VR, in October 2016 and Nintendo introduced its new console, Nintendo Switch, in March 2017.
We expect that future growth in the video game industry will also be driven by the sale of video games delivered in digital form and the expansion of other forms of gaming. We currently sell various types of products that relate to the digital category, including digitally downloadable content (“DLC”), full-game downloads, Xbox LIVE, PlayStation Plus and Nintendo network points cards, as well as prepaid digital and prepaid subscription cards. We have made significant investments in e-commerce and in-store and website functionality to enable our customers to access digital content easily and facilitate the digital sales and delivery process. We plan to continue to invest in these types of processes and channels to grow our digital sales base and enhance our market leadership position in the video game industry and in the digital aggregation and distribution category.
We continue to diversify our business by seeking out opportunities to extend our core competencies to other businesses and retail categories, including mobile and consumer electronics and collectibles, to continue to grow and to help mitigate the financial impact from the cyclical nature of the video game console cycle and regularly evaluate potential acquisition opportunities, some of which could be material. From fiscal 2013 through fiscal 2016, we have grown our store count of AT&T authorized retailers by 1,239 stores, primarily through acquisitions. In 2014, we introduced stand-alone collectibles stores and expanded the selection of collectible products in our stores. To further expand our collectibles business, we acquired ThinkGeek in 2015, and we plan to continue investing in this category going forward. We continue to seek to invest in other retail concepts and product lines with the intention of further diversifying our business.
In our discussion of the results of operations, we refer to comparable store sales which is a measure commonly used in the retail industry and indicates store performance by measuring the growth in sales for certain stores for a particular period over the corresponding period in the prior year. Our comparable store sales are comprised of sales from our Video Game Brands stores, including stand-alone collectible stores, operating for at least 12 full months as well as sales related to our websites and sales we earn from sales of pre-owned merchandise to wholesalers or dealers. Comparable store sales for our international operating segments exclude the effect of changes in foreign currency exchange rates. The calculation of comparable store sales for fiscal year 2016 compares the 52 weeks for the period ended January 28, 2017 to the most closely comparable weeks for the prior year. The method of calculating comparable store sales varies across the retail industry. As a result, our method of calculating comparable store sales may not be the same as other retailers’ methods. Our Technology Brands stores are excluded from the calculation of comparable store sales. We do not consider comparable store sales to be a meaningful metric in evaluating the performance of our Technology Brands stores due to the frequently changing nature of revenue streams and commission structures associated with this segment of our business. We believe our calculation of comparable store sales best represents our strategy as an omnichannel retailer who provides its consumers several ways to access its products.
24
STORE COUNT INFORMATION
The following table presents the number of stores and the number of stores opened, acquired and closed during fiscal 2016:
|
January 30, 2016
|
Opened/Acquired
|
Closed
|
January 28, 2017
|
||||||||
|
Video Game Stores
|
6,046
|
|
21
|
|
(140
|
)
|
5,927
|
|
|||
|
Collectibles Stores
|
35
|
|
52
|
|
(1
|
)
|
86
|
|
|||
|
Total Video Game Brands
|
6,081
|
|
73
|
|
(141
|
)
|
6,013
|
|
|||
|
Spring Mobile
|
890
|
|
575
|
|
(62
|
)
|
1,403
|
|
|||
|
Cricket
|
70
|
|
8
|
|
(9
|
)
|
69
|
|
|||
|
Simply Mac
|
76
|
|
—
|
|
(26
|
)
|
50
|
|
|||
|
Total Technology Brands
|
1,036
|
|
583
|
|
(97
|
)
|
1,522
|
|
|||
|
Total Stores
|
7,117
|
|
656
|
|
(238
|
)
|
7,535
|
|
|||
SEASONALITY
Our business, like that of many retailers, is seasonal, with the major portion of sales and operating profit realized during the fourth quarter which includes the holiday selling season. Results for any quarter are not necessarily indicative of the results that may be achieved for a full fiscal year. Quarterly results may fluctuate materially depending upon, among other factors, the timing of new product introductions and new store openings, sales contributed by new stores, increases or decreases in comparable store sales, the nature and timing of acquisitions, adverse weather conditions, shifts in the timing of certain holidays or promotions and changes in our merchandise mix.
CONSOLIDATED RESULTS OF OPERATIONS
The following table sets forth certain statement of operations items (in millions) and as a percentage of net sales, for the periods indicated:
|
Fiscal Year 2016
|
Fiscal Year 2015
|
Fiscal Year 2014
|
|||||||||||||||||||
|
Amount
|
Percent of Net Sales
|
Amount
|
Percent of Net Sales
|
Amount
|
Percent of Net Sales
|
||||||||||||||||
|
Net sales
|
$
|
8,607.9
|
|
100.0
|
%
|
$
|
9,363.8
|
|
100.0
|
%
|
$
|
9,296.0
|
|
100.0
|
%
|
||||||
|
Cost of sales
|
5,598.6
|
|
65.0
|
|
6,445.5
|
|
68.8
|
|
6,520.1
|
|
70.1
|
|
|||||||||
|
Gross profit
|
3,009.3
|
|
35.0
|
|
2,918.3
|
|
31.2
|
|
2,775.9
|
|
29.9
|
|
|||||||||
|
Selling, general and administrative expenses
|
2,252.6
|
|
26.2
|
|
2,108.9
|
|
22.6
|
|
2,001.0
|
|
21.6
|
|
|||||||||
|
Depreciation and amortization
|
165.2
|
|
1.9
|
|
156.6
|
|
1.7
|
|
154.4
|
|
1.7
|
|
|||||||||
|
Asset impairments
|
33.8
|
|
0.4
|
|
4.6
|
|
—
|
|
2.2
|
|
—
|
|
|||||||||
|
Operating earnings
|
557.7
|
|
6.5
|
|
648.2
|
|
6.9
|
|
618.3
|
|
6.6
|
|
|||||||||
|
Interest expense, net
|
53.0
|
|
0.6
|
|
23.0
|
|
0.2
|
|
10.0
|
|
0.1
|
|
|||||||||
|
Earnings before income tax expense
|
504.7
|
|
5.9
|
|
625.2
|
|
6.7
|
|
608.3
|
|
6.5
|
|
|||||||||
|
Income tax expense
|
151.5
|
|
1.8
|
|
222.4
|
|
2.4
|
|
215.2
|
|
2.3
|
|
|||||||||
|
Net income
|
$
|
353.2
|
|
4.1
|
%
|
$
|
402.8
|
|
4.3
|
%
|
$
|
393.1
|
|
4.2
|
%
|
||||||
We include purchasing, receiving and distribution costs in selling, general and administrative expenses in the statement of operations. We include processing fees associated with purchases made by check and credit cards in cost of sales in the statement of operations. As a result of these classifications, our gross margins are not comparable to those retailers that include purchasing, receiving and distribution costs in cost of sales and include processing fees associated with purchases made by check and credit cards in selling, general and administrative expenses. The net effect of these classifications as a percentage of sales has not historically been material.
In fiscal 2016, we revised the classification of sales and gross profit of mobile and consumer electronics and other when presenting financial information for significant product categories. Prior to these revisions, we presented a product category labeled "mobile and consumer electronics" which was comprised of mobile and consumer electronics sold through our Video Game Brands segments and Technology Brands segment. We also included sales and gross profit of collectibles in "Other." In this Annual Report on Form 10-K, sales and gross profit of mobile and consumer electronics generated by our Technology Brands segment are separately presented as "Technology Brands" and sales and gross profit of mobile and consumer electronics generated by our Video Game Brands segments are included in "Other." In addition, sales and gross profit of collectibles are separately presented as "Collectibles."
25
We believe this presentation of our product categories is more meaningful to our investors considering (i) gross margins of mobile and consumer electronics in our Technology Brands segment differ from our Video Game Brands segments and (ii) sales of collectibles have grown significantly. Sales and gross profit data for prior periods have been recast to the current period presentation.
The following tables set forth, by significant product category, net sales and gross profit information for the periods indicated (dollars in millions):
|
|
Fiscal Year 2016
|
Fiscal Year 2015
|
Fiscal Year 2014
|
||||||||||||||||||
|
|
Net Sales
|
Percent of Total
|
Net Sales
|
Percent of Net Sales
|
Net Sales
|
Percent of Net Sales
|
|||||||||||||||
|
New video game hardware
(1)
|
$
|
1,396.7
|
|
16.2
|
%
|
$
|
1,944.7
|
|
20.8
|
%
|
$
|
2,028.7
|
|
21.8
|
%
|
||||||
|
New video game software
|
2,493.4
|
|
29.0
|
|
2,905.1
|
|
31.0
|
|
3,089.0
|
|
33.2
|
|
|||||||||
|
Pre-owned and value video game products
|
2,254.1
|
|
26.2
|
|
2,374.7
|
|
25.4
|
|
2,389.3
|
|
25.7
|
|
|||||||||
|
Video game accessories
|
676.7
|
|
7.9
|
|
703.0
|
|
7.5
|
|
653.6
|
|
7.1
|
|
|||||||||
|
Digital
|
181.0
|
|
2.1
|
|
188.3
|
|
2.0
|
|
216.3
|
|
2.3
|
|
|||||||||
|
Technology Brands
(2)
|
814.0
|
|
9.5
|
|
534.0
|
|
5.7
|
|
328.6
|
|
3.5
|
|
|||||||||
|
Collectibles
|
494.1
|
|
5.7
|
|
309.7
|
|
3.3
|
|
75.8
|
|
0.8
|
|
|||||||||
|
Other
(3)
|
297.9
|
|
3.4
|
|
404.3
|
|
4.3
|
|
514.7
|
|
5.6
|
|
|||||||||
|
Total
|
$
|
8,607.9
|
|
100.0
|
%
|
$
|
9,363.8
|
|
100.0
|
%
|
$
|
9,296.0
|
|
100.0
|
%
|
||||||
|
|
Fiscal Year 2016
|
Fiscal Year 2015
|
Fiscal Year 2014
|
||||||||||||||||||
|
|
Gross
Profit
|
Gross
Profit
Percent
|
Gross
Profit
|
Gross
Profit
Percent
|
Gross
Profit
|
Gross
Profit
Percent
|
|||||||||||||||
|
New video game hardware
(1)
|
$
|
154.2
|
|
11.0
|
%
|
$
|
175.5
|
|
9.0
|
%
|
$
|
196.6
|
|
9.7
|
%
|
||||||
|
New video game software
|
600.4
|
|
24.1
|
|
689.3
|
|
23.7
|
|
716.9
|
|
23.2
|
|
|||||||||
|
Pre-owned and value video game products
|
1,044.1
|
|
46.3
|
|
1,114.5
|
|
46.9
|
|
1,146.3
|
|
48.0
|
|
|||||||||
|
Video game accessories
|
235.2
|
|
34.8
|
|
255.5
|
|
36.3
|
|
246.1
|
|
37.7
|
|
|||||||||
|
Digital
|
155.5
|
|
85.9
|
|
149.6
|
|
79.4
|
|
152.0
|
|
70.3
|
|
|||||||||
|
Technology Brands
(2)
|
554.6
|
|
68.1
|
|
306.6
|
|
57.4
|
|
169.1
|
|
51.5
|
|
|||||||||
|
Collectibles
|
171.6
|
|
34.7
|
|
116.6
|
|
37.6
|
|
31.9
|
|
42.1
|
|
|||||||||
|
Other
(3)
|
93.7
|
|
31.5
|
|
110.7
|
|
27.4
|
|
117.0
|
|
22.7
|
|
|||||||||
|
Total
|
$
|
3,009.3
|
|
35.0
|
%
|
$
|
2,918.3
|
|
31.2
|
%
|
$
|
2,775.9
|
|
29.9
|
%
|
||||||
|
(1)
|
Includes sales of hardware bundles, in which physical hardware and digital or physical software are sold together as a single SKU.
|
|
(2)
|
Includes mobile and consumer electronics sold through our Technology Brands segment, which includes the operations of our Spring Mobile managed AT&T and Cricket Wireless branded stores and our Simply Mac business.
|
|
(3)
|
Includes sales of PC entertainment software, interactive game figures, strategy guides, mobile and consumer electronics sold through our Video Game Brands segments, and revenues from PowerUp Pro loyalty members receiving Game Informer magazine in print form.
|
26
Fiscal
2016
Compared to Fiscal
2015
|
Fiscal Year
|
Change
|
||||||||||||||
|
2016
|
2015
|
$
|
%
|
||||||||||||
|
($ in millions)
|
|||||||||||||||
|
Net sales
|
$
|
8,607.9
|
|
$
|
9,363.8
|
|
$
|
(755.9
|
)
|
(8.1
|
)%
|
||||
|
Cost of sales
|
5,598.6
|
|
6,445.5
|
|
(846.9
|
)
|
(13.1
|
)
|
|||||||
|
Gross profit
|
3,009.3
|
|
2,918.3
|
|
91.0
|
|
3.1
|
|
|||||||
|
Selling, general and administrative expenses
|
2,252.6
|
|
2,108.9
|
|
143.7
|
|
6.8
|
|
|||||||
|
Depreciation and amortization
|
165.2
|
|
156.6
|
|
8.6
|
|
5.5
|
|
|||||||
|
Asset impairments
|
33.8
|
|
4.6
|
|
29.2
|
|
634.8
|
|
|||||||
|
Operating earnings
|
557.7
|
|
648.2
|
|
(90.5
|
)
|
(14.0
|
)
|
|||||||
|
Interest expense, net
|
53.0
|
|
23.0
|
|
30.0
|
|
130.4
|
|
|||||||
|
Earnings before income tax expense
|
504.7
|
|
625.2
|
|
(120.5
|
)
|
(19.3
|
)
|
|||||||
|
Income tax expense
|
151.5
|
|
222.4
|
|
(70.9
|
)
|
(31.9
|
)
|
|||||||
|
Net income
|
$
|
353.2
|
|
$
|
402.8
|
|
$
|
(49.6
|
)
|
(12.3
|
)%
|
||||
|
|
Net Sales
|
Change
|
|||||||||||||
|
|
Fiscal Year 2016
|
Fiscal Year 2015
|
$
|
%
|
|||||||||||
|
($ in millions)
|
|||||||||||||||
|
New video game hardware
(1)
|
$
|
1,396.7
|
|
$
|
1,944.7
|
|
$
|
(548.0
|
)
|
(28.2
|
)%
|
||||
|
New video game software
|
2,493.4
|
|
2,905.1
|
|
(411.7
|
)
|
(14.2
|
)
|
|||||||
|
Pre-owned and value video game products
|
2,254.1
|
|
2,374.7
|
|
(120.6
|
)
|
(5.1
|
)
|
|||||||
|
Video game accessories
|
676.7
|
|
703.0
|
|
(26.3
|
)
|
(3.7
|
)
|
|||||||
|
Digital
|
181.0
|
|
188.3
|
|
(7.3
|
)
|
(3.9
|
)
|
|||||||
|
Technology Brands
(2)
|
814.0
|
|
534.0
|
|
280.0
|
|
52.4
|
|
|||||||
|
Collectibles
|
494.1
|
|
309.7
|
|
184.4
|
|
59.5
|
|
|||||||
|
Other
(3)
|
297.9
|
|
404.3
|
|
(106.4
|
)
|
(26.3
|
)
|
|||||||
|
Total
|
$
|
8,607.9
|
|
$
|
9,363.8
|
|
$
|
(755.9
|
)
|
(8.1
|
)%
|
||||
|
|
Gross Profit
|
Change
|
|||||||||||||
|
|
Fiscal Year 2016
|
Fiscal Year 2015
|
$
|
%
|
|||||||||||
|
($ in millions)
|
|||||||||||||||
|
New video game hardware
(1)
|
$
|
154.2
|
|
$
|
175.5
|
|
$
|
(21.3
|
)
|
(12.1
|
)%
|
||||
|
New video game software
|
600.4
|
|
689.3
|
|
(88.9
|
)
|
(12.9
|
)
|
|||||||
|
Pre-owned and value video game products
|
1,044.1
|
|
1,114.5
|
|
(70.4
|
)
|
(6.3
|
)
|
|||||||
|
Video game accessories
|
235.2
|
|
255.5
|
|
(20.3
|
)
|
(7.9
|
)
|
|||||||
|
Digital
|
155.5
|
|
149.6
|
|
5.9
|
|
3.9
|
|
|||||||
|
Technology Brands
(2)
|
554.6
|
|
306.6
|
|
248.0
|
|
80.9
|
|
|||||||
|
Collectibles
|
171.6
|
|
116.6
|
|
55.0
|
|
47.2
|
|
|||||||
|
Other
(3)
|
93.7
|
|
110.7
|
|
(17.0
|
)
|
(15.4
|
)
|
|||||||
|
Total
|
$
|
3,009.3
|
|
$
|
2,918.3
|
|
$
|
91.0
|
|
3.1
|
%
|
||||
|
(1)
|
Includes sales of hardware bundles, in which physical hardware and digital or physical software are sold together as a single SKU.
|
|
(2)
|
Includes mobile and consumer electronics sold through our Technology Brands segment, which includes the operations of our Spring Mobile managed AT&T and Cricket Wireless branded stores and our Simply Mac business.
|
|
(3)
|
Includes sales of PC entertainment software, interactive game figures, strategy guides, mobile and consumer electronics sold through our Video Game Brands segments, and revenues from PowerUp Pro loyalty members receiving Game Informer magazine in print form.
|
27
Net Sales
Net sales decreased
$755.9 million
, or
8.1%
, in fiscal 2016 compared to fiscal 2015. The decrease in net sales was primarily attributable to a decrease in comparable store sales of
11.0%
compared to the prior year. The decrease in comparable store sales was primarily the result of a decrease in sales of video game hardware and software. These decreases were partially offset by an increase in sales in Technology Brands and collectibles as a result of the Company's diversification efforts.
The decrease in net sales was due to the following:
|
•
|
New video game hardware sales decreased
$548.0 million
, or
28.2%
, for fiscal 2016 as compared to fiscal 2015, primarily due to a decline in the quantity of hardware units sold combined with a reduction in selling price of certain models as the console cycle matures.
|
|
•
|
New video game software sales decreased
$411.7 million
, or
14.2%
, for fiscal 2016 as compared to fiscal 2015, primarily due to weaker new title releases in the current year.
|
|
•
|
Pre-owned and value video game product sales decreased
$120.6 million
, or
5.1%
, for fiscal 2016 as compared to fiscal 2015, primarily due to the decrease in store traffic as a result of weaker new release titles and hardware unit sales declines in the current year.
|
|
•
|
Other sales decreased
$106.4 million
, or
26.3%
, for fiscal 2016 as compared to fiscal 2015, primarily due to the decline in sales of interactive game figures and mobile and consumer electronics sold through our Video Game Brands stores.
|
The decreases described above were partially offset by the following:
|
•
|
Technology Brands sales increased
$280.0 million
, or
52.4%
, for fiscal 2016 as compared to fiscal 2015, primarily due to the acquisition and opening of Spring Mobile managed AT&T stores within the Technology Brands segment.
|
|
•
|
Collectibles sales increased
$184.4 million
, or
59.5%
, for fiscal 2016 compared to fiscal 2015, due to the acquisition of ThinkGeek in July 2015, the growth of collectibles sales in our Video Game Brands stores and the growth in the number of stand-alone collectibles stores.
|
Cost of Sales
Cost of sales decreased
$846.9 million
, or
13.1%
, in fiscal 2016 compared to fiscal 2015, primarily as a result of the changes in gross profit discussed below.
Gross Profit
Gross profit increased
$91.0 million
, or
3.1%
, in fiscal 2016 compared to fiscal 2015, and gross profit as a percentage of net sales was
35.0%
in fiscal
2016
compared to
31.2%
in fiscal
2015
. The increase in gross profit was primarily driven by our diversification efforts through the growth of Technology Brands and collectibles. Gross profit from Technology Brands increased
$248.0 million
, mainly due to growth through acquisitions and new store openings, and gross profit from collectibles increased by
$55.0 million
. In addition, gross profit from digital increased by
$5.9 million
. These increases were partially offset by decreases primarily in new video game software of
$88.9 million
, pre-owned and value video game products of
$70.4 million
, new video game hardware of
$21.3 million
, video game accessories of
$20.3 million
and other of
$17.0 million
.
The net increase in gross profit as a percentage of net sales was due to product mix shift between categories as our Technology Brands and collectibles categories continue to grow and the following product margin rate variances:
|
•
|
Gross profit as a percentage of sales on Technology Brands sales increased to
68.1%
in fiscal 2016 from
57.4%
in fiscal 2015 due to the growth in the number of Spring Mobile stores which carry higher margins than the other businesses inside Technology Brands.
|
|
•
|
Gross profit as a percentage of sales on digital sales increased to
85.9%
in fiscal 2016 from
79.4%
in fiscal 2015 primarily due to a change in the mix of sales and the related commissions on the digital products we sold.
|
|
•
|
Gross profit as a percentage of sales of other products increased to
31.5%
in fiscal 2016 from
27.4%
in fiscal 2015 primarily driven by higher gross margin in mobile and consumer electronics sold through our Video Game Brands stores.
|
The increases described above were partially offset by the following:
|
•
|
Gross profit as a percentage of sales on collectibles decreased to
34.7%
in fiscal 2016 from
37.6%
in fiscal 2015, due to the addition of the ThinkGeek.com business in July 2015 which carries higher fulfillment costs compared to our in-store sales.
|
|
•
|
Gross profit as a percentage of sales on video game accessories decreased to
34.8%
in fiscal 2016 from
36.3%
in fiscal 2015, due to the introduction of the PlayStation VR in fiscal 2016, which carries a lower gross margin than other accessory products.
|
28
|
•
|
Gross profit as a percentage of sales on pre-owned and value video game products decreased to
46.3%
in fiscal 2016 from
46.9%
in fiscal 2015 due to a greater mix of sales of current generation products, which carry lower gross margin than previous generation products.
|
Selling, General and Administrative Expenses
Selling, general and administrative expenses ("SG&A") increased
$143.7 million
, or
6.8%
, in fiscal 2016 compared to fiscal 2015.
The growth of Technology Brands contributed $195.2 million to the increase of SG&A, primarily driven by the addition of 486 stores when compared to the prior year and a higher SG&A as a percentage of sales compared to our Video Game Brands segments. The increase in SG&A related to Technology Brands includes store closure costs totaling $19.8 million in fiscal 2016, primarily associated with consolidating the Technology Brands segment store portfolio following increased acquisition activity. These increases were partially offset by a $31.9 million decrease to incentive compensation in our Video Game Brands segments, various cost reduction efforts and $7.4 million in acquisition-related costs associated with ThinkGeek incurred in the prior year.
Depreciation and Amortization
Depreciation and amortization expense increased
$8.6 million
, or
5.5%
, in fiscal 2016 compared to fiscal
2015
. This increase was primarily due to the acquisition and opening of stores in our Technology Brands segment.
Asset Impairments
During fiscal 2016, we recognized asset impairment charges totaling
$33.8 million
. These charges consisted of
$19.4 million
in impairments to store-level property and equipment, a
$7.4 million
impairment of our Micromania trade name intangible asset, and a
$7.0 million
impairment to our Simply Mac dealer agreement intangible asset. The Micromania trade name is associated with our operations in France. The property and equipment impairments were primarily related to our Technology Brands segment. In fiscal 2015, we recognized asset impairment charges totaling
$4.6 million
, primarily related to store-level property and equipment impairments in our Video Game Brands segments.
Interest Expense, Net
Interest expense, net of
$53.0 million
for fiscal
2016
increased
$30.0 million
from
$23.0 million
in fiscal
2015
primarily due to the $475.0 million issuance of unsecured 6.75% senior notes due March 15, 2021 in March 2016, which is further discussed in Note 9, "Debt," to our consolidated financial statements.
Income Tax
Income tax expense was
$151.5 million
, representing an effective tax rate of
30.0%
in fiscal
2016
, compared to
$222.4 million
, representing an effective tax rate of
35.6%
in fiscal
2015
. The decrease in the effective income tax rate compared to the prior year was primarily driven by the recognition of tax benefits related to our adoption of a plan of reorganization specific to certain foreign operations, which resulted in our ability to recognize the benefit of foreign net operating losses that were previously unrecognized, partially offset by increases in our valuation allowance, changes in uncertain tax positions and the relative mix of earnings across the jurisdictions in which we operate. Refer to Note 7, "Income Taxes," to our consolidated financial statements for additional information regarding income taxes.
Operating Earnings and Net Income
The factors described above led to operating earnings of
$557.7 million
for fiscal
2016
, or a
14.0%
decrease from operating earnings of $
648.2 million
for fiscal
2015
. Additionally, net income was
$353.2 million
for fiscal
2016
, which represented a
12.3%
decrease from net income of
$402.8 million
for fiscal
2015
.
29
Fiscal 2015 Compared to Fiscal 2014
|
Fiscal Year
|
Change
|
||||||||||||||
|
2015
|
2014
|
$
|
%
|
||||||||||||
|
($ in millions)
|
|||||||||||||||
|
Net sales
|
$
|
9,363.8
|
|
$
|
9,296.0
|
|
$
|
67.8
|
|
0.7
|
%
|
||||
|
Cost of sales
|
6,445.5
|
|
6,520.1
|
|
(74.6
|
)
|
(1.1
|
)
|
|||||||
|
Gross profit
|
2,918.3
|
|
2,775.9
|
|
142.4
|
|
5.1
|
|
|||||||
|
Selling, general and administrative expenses
|
2,108.9
|
|
2,001.0
|
|
107.9
|
|
5.4
|
|
|||||||
|
Depreciation and amortization
|
156.6
|
|
154.4
|
|
2.2
|
|
1.4
|
|
|||||||
|
Asset impairments
|
4.6
|
|
2.2
|
|
2.4
|
|
109.1
|
|
|||||||
|
Operating earnings
|
648.2
|
|
618.3
|
|
29.9
|
|
4.8
|
|
|||||||
|
Interest expense, net
|
23.0
|
|
10.0
|
|
13.0
|
|
130.0
|
|
|||||||
|
Earnings before income tax expense
|
625.2
|
|
608.3
|
|
16.9
|
|
2.8
|
|
|||||||
|
Income tax expense
|
222.4
|
|
215.2
|
|
7.2
|
|
3.3
|
|
|||||||
|
Net income
|
$
|
402.8
|
|
$
|
393.1
|
|
$
|
9.7
|
|
2.5
|
%
|
||||
|
|
Net Sales
|
Change
|
|||||||||||||
|
|
Fiscal Year 2015
|
Fiscal Year 2014
|
$
|
%
|
|||||||||||
|
($ in millions)
|
|||||||||||||||
|
New video game hardware
(1)
|
$
|
1,944.7
|
|
$
|
2,028.7
|
|
$
|
(84.0
|
)
|
(4.1
|
)%
|
||||
|
New video game software
|
2,905.1
|
|
3,089.0
|
|
(183.9
|
)
|
(6.0
|
)
|
|||||||
|
Pre-owned and value video game products
|
2,374.7
|
|
2,389.3
|
|
(14.6
|
)
|
(0.6
|
)
|
|||||||
|
Video game accessories
|
703.0
|
|
653.6
|
|
49.4
|
|
7.6
|
|
|||||||
|
Digital
|
188.3
|
|
216.3
|
|
(28.0
|
)
|
(12.9
|
)
|
|||||||
|
Technology Brands
(2)
|
534.0
|
|
328.6
|
|
205.4
|
|
62.5
|
|
|||||||
|
Collectibles
|
309.7
|
|
75.8
|
|
233.9
|
|
308.6
|
|
|||||||
|
Other
(3)
|
404.3
|
|
514.7
|
|
(110.4
|
)
|
(21.4
|
)
|
|||||||
|
Total
|
$
|
9,363.8
|
|
$
|
9,296.0
|
|
$
|
67.8
|
|
0.7
|
%
|
||||
|
|
Gross Profit
|
Change
|
|||||||||||||
|
|
Fiscal Year 2015
|
Fiscal Year 2014
|
$
|
%
|
|||||||||||
|
($ in millions)
|
|||||||||||||||
|
New video game hardware
(1)
|
$
|
175.5
|
|
$
|
196.6
|
|
$
|
(21.1
|
)
|
(10.7
|
)%
|
||||
|
New video game software
|
689.3
|
|
716.9
|
|
(27.6
|
)
|
(3.8
|
)
|
|||||||
|
Pre-owned and value video game products
|
1,114.5
|
|
1,146.3
|
|
(31.8
|
)
|
(2.8
|
)
|
|||||||
|
Video game accessories
|
255.5
|
|
246.1
|
|
9.4
|
|
3.8
|
|
|||||||
|
Digital
|
149.6
|
|
152.0
|
|
(2.4
|
)
|
(1.6
|
)
|
|||||||
|
Technology Brands
(2)
|
306.6
|
|
169.1
|
|
137.5
|
|
81.3
|
|
|||||||
|
Collectibles
|
116.6
|
|
31.9
|
|
84.7
|
|
265.5
|
|
|||||||
|
Other
(3)
|
110.7
|
|
117.0
|
|
(6.3
|
)
|
(5.4
|
)
|
|||||||
|
Total
|
$
|
2,918.3
|
|
$
|
2,775.9
|
|
$
|
142.4
|
|
5.1
|
%
|
||||
___________________
|
(1)
|
Includes sales of hardware bundles, in which physical hardware and digital or physical software are sold together as a single SKU.
|
|
(2)
|
Includes mobile and consumer electronics sold through our Technology Brands segment, which includes the operations of our Spring Mobile managed AT&T and Cricket Wireless branded stores and our Simply Mac business.
|
|
(3)
|
Includes sales of PC entertainment software, interactive game figures, strategy guides, mobile and consumer electronics sold through our Video Game Brands segments, and revenues from PowerUp Pro loyalty members receiving Game Informer magazine in print form.
|
30
Net Sales
Net sales increased $67.8 million, or 0.7%, in fiscal 2015 compared to fiscal 2014. The increase in net sales during fiscal 2015 was primarily attributable to an increase in comparable store sales of 4.3% compared to fiscal 2014, due to strong sales performance in fiscal 2015 associated with video game accessories, interactive game figures and collectibles. Overall sales growth also benefited from the continued growth of our Technology Brands stores and our July 2015 acquisition of the ThinkGeek business. These increases were partially offset by the impact of foreign exchange rate fluctuations, which had the effect of decreasing net sales by $430.2 million in fiscal 2015 compared to fiscal 2014.
The increase in net sales was due to the following:
|
•
|
Collectibles sales increased
$233.9 million
, or
308.6%
, for fiscal 2015 as compared to fiscal 2014, due to the growth of collectibles sales in our Video Game Brands stores, the acquisition of ThinkGeek in July 2015 and the growth in the number of stand-alone collectibles stores.
|
|
•
|
Technology Brands sales increased
$205.4 million
, or
62.5%
, for fiscal 2015 as compared to fiscal 2014, due to the acquisition and opening of stores within the Technology Brands segment.
|
|
•
|
Video game accessories sales increased $49.4 million, or 7.6%, for fiscal 2015 as compared to fiscal 2014, due to sales of accessories for use with the current generation consoles.
|
The increases described above were partially offset by the following:
|
•
|
New video game software sales decreased $183.9 million, or 6.0%, for fiscal 2015 as compared to fiscal 2014, primarily due to unfavorable foreign exchange rate fluctuations, which had the effect of decreasing net sales by $157.7 million for fiscal 2015 as compared to fiscal 2014. Excluding the effects of currency, new video game software sales decreased $26.2 million due to fewer new titles that were released in fiscal 2015 as compared to fiscal 2014 and the decline in prior generation software sales. We expect the decline in prior generation software sales to continue.
|
|
•
|
Other sales decreased
$110.4 million
, or
21.4%
, primarily driven by a decrease in mobile and consumer electronics sold through our Video Game Brands segments.
|
|
•
|
New video game hardware sales decreased $84.0 million, or 4.1%, for fiscal 2015 as compared to fiscal 2014, primarily due to the reduction in price on both the PS4 and Xbox One as well as unfavorable foreign exchange rate fluctuations, which had the effect of decreasing net sales by $99.2 million for fiscal 2015 as compared to fiscal 2014.
|
|
•
|
Digital sales decreased $28.0 million, or 12.9%, for fiscal 2015 as compared to fiscal 2014, primarily due to unfavorable foreign exchange rate fluctuations, which had the effect of decreasing net sales by $11.4 million for fiscal 2015 as compared to fiscal 2014 and a larger portion of sales recognized on a net basis compared to the prior year period.
|
|
•
|
Pre-owned and value video game product sales decreased $14.6 million, or 0.6%, for fiscal 2015 as compared to fiscal 2014, primarily due to unfavorable foreign exchange rate fluctuations, which had the effect of decreasing net sales by $94.6 million for fiscal 2015 as compared to fiscal 2014. Excluding the effects of currency, sales increased $80.0 million due to stronger sell-through of the current generation video game products.
|
Cost of Sales
Cost of sales decreased $74.6 million, or 1.1%, in fiscal 2015 compared to fiscal 2014, primarily as a result of the changes in gross profit discussed below.
Gross Profit
Gross profit increased $142.4 million, or 5.1%, in fiscal 2015 compared to fiscal 2014, and gross profit as a percentage of net sales was 31.2% in fiscal 2015 compared to 29.9% in fiscal 2014. The gross profit increase was primarily driven by the growth in Technology Brands, which carries a higher margin percentage than most of our other product categories.
The net increase in gross profit as a percentage of net sales was due to product mix shift between categories as sales in our Technology Brands and collectibles categories continued to grow and the following product margin rate variances:
|
•
|
Gross profit as a percentage of sales on Technology Brands sales increased to 57.4% in fiscal 2015 from 51.5% in fiscal 2014 due to the growth in the number of Spring Mobile stores which carry higher margins than the other businesses in Technology Brands.
|
|
•
|
Gross profit as a percentage of sales on digital sales increased to 79.4% in fiscal 2015 from 70.3% in fiscal 2014 primarily due to a larger portion of sales recognized on a net basis in fiscal 2015 compared to the prior year.
|
The increases described above were partially offset by the following:
|
•
|
Gross profit as a percentage of sales on collectibles sales decreased to 37.6% in fiscal 2015 from 42.1% in fiscal 2014, due to the acquisition of ThinkGeek in July 2015 which carries lower gross margins compared to our collectible product offerings prior to the acquisition.
|
31
|
•
|
Gross profit as a percentage of sales on pre-owned and value video game products decreased to 46.9% in fiscal 2015 from 48.0% in fiscal 2014. The gross profit percentage decrease was driven by a greater mix of sales of next generation video game products, which carry lower margins early in the console cycle compared to the prior generation products.
|
|
•
|
Gross profit as a percentage of sales on video game accessories decreased to 36.3% in fiscal 2015 from 37.7% in fiscal 2014, due to the increased mix of controllers sales, which carry lower gross margins relative to the total video game accessories category.
|
Selling, General and Administrative Expenses
Selling, general and administrative expenses increased $107.9 million, or 5.4%, in fiscal 2015 compared to fiscal 2014. The increase was primarily due to the growth of the Technology Brands segment, which carries higher selling, general and administrative expenses as a percentage of sales than the other segments. Technology Brands contributed $129.0 million to the increase for fiscal 2015 compared to fiscal 2014. Additionally, United States Video Game Brands selling, general and administrative expenses increased $76.9 million in fiscal 2015 compared to the fiscal 2014, driven mainly by costs related to the acquisition of ThinkGeek. This increase was offset in part by the impact of foreign exchange rate fluctuations, which had the effect of decreasing selling, general and administrative expenses by $96.4 million for fiscal 2015 compared to the prior year period. Included in selling, general and administrative expenses are $29.9 million and $21.5 million in stock-based compensation expense for fiscal 2015 and fiscal 2014, respectively.
Depreciation and Amortization
Depreciation and amortization expense increased $2.2 million, or 1.4%, in fiscal 2015 compared to fiscal 2014. This increase was primarily due to the acquisition and opening of stores in our Technology Brands segment.
Interest Income and Expense
Interest expense of $23.4 million for fiscal 2015 increased $12.7 million from $10.7 million in fiscal 2014 primarily due to the $350.0 million issuance of 2019 Senior Notes in September 2014, which is discussed more fully in Note 9, "Debt," to our consolidated financial statements. Interest income of $0.4 million for fiscal 2015, resulting from the investment of excess cash balances, decreased $0.3 million from $0.7 million in fiscal 2014.
Income Tax
Income tax expense was $222.4 million, representing an effective tax rate of 35.6% in fiscal 2015, compared to $215.2 million, representing an effective tax rate of 35.4% in fiscal 2014. Refer to Note 7, "Income Taxes," to our consolidated financial statements for additional information.
Operating Earnings and Net Income
The factors described above led to operating earnings of $648.2 million for fiscal 2015, or a 4.8% increase from operating earnings of $618.3 million for fiscal 2014. Additionally, net income was $402.8 million for fiscal 2015, which represented a 2.5% increase from net income of $393.1 million for fiscal 2014. The increase in operating earnings is primarily attributable to the growth in gross margin in our Video Game Brands segments.
SEGMENT PERFORMANCE
We report our business in the following segments: Video Game Brands, which consists of four geographic segments in the United States, Canada, Australia and Europe, and Technology Brands. We identified these segments based on a combination of geographic areas, the methods with which we analyze performance, the way in which our sales and profits are derived and how we divide management responsibility. Our sales and profits are driven through our physical stores which are highly integrated with our e-commerce, digital and mobile businesses. Due to this integration, our physical stores are the basis for our segment reporting. Each of the Video Game Brands segments consists primarily of retail operations, with all stores engaged in the sale of new and pre-owned video game systems, software and accessories (which we refer to as video game products), new and pre-owned mobile devices and related accessories. These products are substantially the same regardless of geographic location, with the primary differences in merchandise carried being the timing of the release of new products or technologies in the various segments.
With our presence in international markets, we have operations in several foreign currencies, including the Euro, Australian dollar, New Zealand dollar, Canadian dollar, Swiss franc, Danish kroner, Swedish krona and the Norwegian kroner.
32
Operating earnings (loss) by operating segment, defined as income from operations before intercompany royalty fees, net interest expense and income taxes, and net sales by reportable segment in U.S. dollars were as follows (in millions):
|
As of and for the Fiscal Year Ended January 28, 2017
|
United
States
|
Canada
|
Australia
|
Europe
|
Technology Brands
|
Consolidated
|
|||||||||||||||||
|
Net sales
|
$
|
5,488.9
|
|
$
|
382.0
|
|
$
|
609.5
|
|
$
|
1,313.5
|
|
$
|
814.0
|
|
$
|
8,607.9
|
|
|||||
|
Segment operating earnings
|
$
|
430.2
|
|
$
|
22.4
|
|
$
|
34.9
|
|
$
|
26.0
|
|
$
|
44.2
|
|
$
|
557.7
|
|
|||||
|
Segment Operating data:
|
|||||||||||||||||||||||
|
Store count
|
3,944
|
|
322
|
|
464
|
|
1,283
|
|
1,522
|
|
7,535
|
|
|||||||||||
|
Comparable store sales
(1)
|
(13.5
|
)%
|
(12.6
|
)%
|
(2.0
|
)%
|
(2.7
|
)%
|
n/a
|
|
(11.0
|
)%
|
|||||||||||
|
As of and for the Fiscal Year Ended January 30, 2016
|
United
States
|
Canada
|
Australia
|
Europe
|
Technology Brands
|
Consolidated
|
|||||||||||||||||
|
Net sales
|
$
|
6,435.1
|
|
$
|
446.6
|
|
$
|
591.4
|
|
$
|
1,356.7
|
|
$
|
534.0
|
|
$
|
9,363.8
|
|
|||||
|
Segment operating earnings
|
$
|
504.3
|
|
$
|
29.4
|
|
$
|
38.7
|
|
$
|
48.8
|
|
$
|
27.0
|
|
$
|
648.2
|
|
|||||
|
Segment Operating data:
|
|||||||||||||||||||||||
|
Store count
|
4,013
|
|
325
|
|
444
|
|
1,299
|
|
1,036
|
|
7,117
|
|
|||||||||||
|
Comparable store sales
(1)
|
4.8
|
%
|
9.8
|
%
|
7.5
|
%
|
(0.8
|
)%
|
n/a
|
|
4.3
|
%
|
|||||||||||
|
As of and for the Fiscal Year Ended January 31, 2015
|
United
States
|
Canada
|
Australia
|
Europe
|
Technology Brands
|
Consolidated
|
|||||||||||||||||
|
Net sales
|
$
|
6,193.5
|
|
$
|
476.4
|
|
$
|
644.7
|
|
$
|
1,652.8
|
|
$
|
328.6
|
|
$
|
9,296.0
|
|
|||||
|
Segment operating earnings
|
$
|
483.2
|
|
$
|
28.3
|
|
$
|
38.0
|
|
$
|
35.9
|
|
$
|
32.9
|
|
$
|
618.3
|
|
|||||
|
Segment Operating data:
|
|||||||||||||||||||||||
|
Store count
|
4,138
|
|
331
|
|
421
|
|
1,316
|
|
484
|
|
6,690
|
|
|||||||||||
|
Comparable store sales
(1)
|
2.5
|
%
|
9.3
|
%
|
10.6
|
%
|
2.3
|
%
|
n/a
|
|
3.4
|
%
|
|||||||||||
___________________
|
(1)
|
Our Technology Brands stores are excluded from the calculation of comparable store sales as we do not consider it to be a meaningful metric in evaluating the performance of our Technology Brands stores due to the frequently changing nature of revenue streams and commission structures associated with this segment of our business.
|
Fiscal
2016
Compared to Fiscal
2015
Video Game Brands
United States
Segment results for Video Game Brands in the United States include retail GameStop operations in 50 states, the District of Columbia and Guam, the electronic commerce websites www.gamestop.com and www.thinkgeek.com,
Game Informer
magazine and Kongregate, our leading platform for web and mobile gaming. Net sales for fiscal 2016 decreased
$946.2 million
, or
14.7%
, compared to fiscal 2015, primarily due to the
13.5%
decrease in comparable store sales. This decrease in comparable store sales was primarily the result of decreases in video game hardware and software sales. These decreases were partially offset by an increase in sales of collectibles and the PlayStation VR. Operating earnings for fiscal 2016 decreased
$74.1 million
compared to fiscal 2015, primarily driven by the decrease in net sales, partially offset by improved gross margin due to a shift in the mix of sales to higher margin categories and lower SG&A expenses. The decrease in SG&A expenses is primarily due to decreases to incentive compensation, store-related expenses and acquisition-related costs related to ThinkGeek incurred in the prior year.
Canada
Segment results for Canada include retail and e-commerce in Canada. Net sales in the Canadian segment for fiscal 2016 decreased
$64.6 million
, or
14.5%
, compared to fiscal 2015, primarily due to a decrease in comparable store sales of
12.6%
, driven by declines in video game hardware and software sales.
Operating earnings for fiscal 2016 decreased
$7.0 million
, or
23.8%
primarily due to the decrease in net sales. This decrease was partially offset by the growth in collectibles sales in fiscal 2016.
33
Australia
Segment results for Australia include retail and e-commerce operations in Australia and New Zealand. Net sales in the Australian segment for fiscal 2016 increased
$18.1 million
, or
3.1%
, compared to fiscal 2015. The increase in net sales was primarily due to growth in sales of collectibles, driven by the opening of
21
new Zing branded collectible stores since the prior year, and the positive impact of foreign exchange rate fluctuations of
$7.7 million
. These increases were partially offset by a decline in comparable store sales of
2.0%
, primarily driven by decreases in video game software sales. Operating earnings for fiscal 2016 decreased
$3.8 million
compared to the prior year, primarily due to an increase in costs associated with expanding our collectible store base.
Europe
Segment results for Europe include retail operations in 10 European countries and e-commerce operations in four countries. Net sales in the European segment for fiscal 2016 decreased
$43.2 million
, or
3.2%
, compared to fiscal 2015, primarily due to the
2.7%
decrease in comparable store sales and the negative impact of foreign exchange rate fluctuations of $7.2 million. The decrease in comparable store sales was primarily driven by decreases in video game hardware and software sales, partially offset by an increase in sales of collectibles and the PlayStation VR. Operating earnings for the fiscal 2016 decreased by
$22.8 million
compared to the prior year due primarily to the decline in net sales, coupled with a
$7.4 million
impairment of our Micromania trade name.
Technology Brands
Segment results for the Technology Brands segment include our Spring Mobile managed AT&T and Cricket branded stores and our Simply Mac business. Net sales for fiscal 2016 increased
$280.0 million
, or
52.4%
, compared to fiscal 2015, as a result of the continued acquisition activity and growth in store count. Operating earnings for fiscal 2016 increased
$17.2 million
compared to the prior year, primarily due to growth in store count, operational improvements as stores opened in fiscal 2015 mature and greater profitability from stores acquired since the prior year. Operating expenses for fiscal 2016 include $43.4 million in store closure and impairment costs as we right-size our store portfolio following four years of acquisition activity. The costs include $19.8 million in store closure costs, $16.6 million in impairment charges of store-level property and equipment, and a $7.0 million impairment charge on our Simply Mac dealer agreements intangible asset.
Fiscal
2015
Compared to Fiscal
2014
Video Game Brands
United States
Segment results for Video Game Brands in the United States include retail GameStop operations in 50 states, the District of Columbia, Puerto Rico and Guam, the e-commerce websites www.gamestop.com and www.thinkgeek.com,
Game Informer
magazine and Kongregate, our leading platform for web and mobile gaming. Net sales for fiscal 2015 increased $241.6 million, or 3.9%, compared to fiscal 2014, primarily due to the increase in comparable store sales of 4.8%. This increase in comparable store sales was driven by the increase in sales of collectibles, video game accessories, pre-owned and value video game products and next generation hardware sales in fiscal 2015 as compared to fiscal 2014. Operating earnings for fiscal 2015 increased $21.1 million, or 4.4%, compared to fiscal 2014, driven primarily by the current year increase in net sales relative to the selling, general and administrative expenses.
Canada
Segment results for Canada include retail and e-commerce operations in Canada. Net sales in the Canadian segment for fiscal 2015 decreased $29.8 million, or 6.3%, compared to fiscal 2014, primarily due to the foreign exchange rate fluctuations, which had the effect of decreasing net sales by $74.6 million in fiscal 2015 compared to the prior year. Comparable store sales for fiscal 2015 increased 9.8%, driven by strong sales of next generation hardware and software as well as collectibles. Operating earnings for fiscal 2015 increased $1.1 million, or 3.9%, compared to fiscal 2014, due to the increase in comparable store sales, partially offset by the impact of foreign exchange rate fluctuations which had the effect of decreasing operating earnings by $5.3 million.
Australia
Segment results for Australia include retail and e-commerce operations in Australia and New Zealand. Net sales in the Australian segment for fiscal 2015 decreased $53.3 million, or 8.3%, compared to fiscal 2014, primarily due to the impact of foreign exchange rate fluctuations, which had the effect of decreasing net sales by $117.3 million for fiscal 2015 compared to the prior year. Comparable store sales for fiscal 2015 increased 7.5%, driven by strong sales of next generation hardware, pre-owned products, video game accessories and collectibles. Operating earnings for fiscal 2015 increased $0.7 million compared to fiscal 2014. Excluding the impact of foreign exchange rate fluctuations, operating earnings increased $7.3 million primarily due to the comparable store sales increase.
34
Europe
Segment results for Europe include retail operations in 10 European countries and e-commerce operations in five countries. Net sales in the European segment for fiscal 2015 decreased $296.1 million, or 17.9%, compared to fiscal 2014, primarily due to the impact of foreign exchange rate fluctuations, which had the effect of decreasing net sales by $238.3 million for fiscal 2015 compared to the prior year, and a decrease in comparable store sales of 0.8%. Additionally, the exit of our Spain operations contributed to a $34.8 million decrease in net sales year-over-year. Operating earnings for fiscal 2015 increased $12.9 million, or 35.9%, compared to fiscal 2014, driven primarily by the pre-tax loss of $14.8 million in fiscal 2014 related to the exit of our Spain operations. Foreign exchange rate fluctuations also had the effect of decreasing operating earnings by $3.9 million in fiscal 2015.
Technology Brands
Segment results for the Technology Brands segment include our Spring Mobile managed AT&T and Cricket Wireless branded stores and our Simply Mac business. Net sales for fiscal 2015 increased $205.4 million, or 62.5%, compared to fiscal 2014 primarily due to our continued acquisition activity and growth in our Technology Brands store count. Operating earnings for fiscal 2015 decreased $5.9 million, or 17.9%, compared to the prior year, primarily due to store openings and conversions taking longer than anticipated to open as well as our expansion and related investments in selling, general and administrative expenses to prepare for the growth of additional stores.
LIQUIDITY AND CAPITAL RESOURCES
Overview
Based on our current operating plans, we believe that available cash balances, cash generated from our operating activities and funds available under our
$400.0 million
asset-based revolving credit facility (the “Revolver”) together will provide sufficient liquidity to fund our operations, store openings and remodeling activities and corporate capital allocation programs, including acquisitions, share repurchases and the payment of dividends declared by the Board of Directors, for at least the next 12 months.
As of
January 28, 2017
, we had total cash on hand of
$669.4 million
and an additional
$354.0 million
of available borrowing capacity under the Revolver. As we continue to pursue acquisitions and other strategic transactions to expand and grow our business, while also enhancing shareholder value through share repurchases and dividend payments, we regularly monitor capital market conditions and may raise additional funds through borrowings or public or private sales of debt or equity securities. The amount, nature and timing of any borrowings or sales of debt or equity securities will depend on our operating performance and other circumstances; our then-current commitments and obligations; the amount, nature and timing of our capital requirements; any limitations imposed by our current credit arrangements; and overall market conditions.
As of
January 28, 2017
, we had total cash on hand of
$669.4 million
of which $366.2 million was attributable to our foreign operations. Although we may, from time to time, evaluate strategies and alternatives with respect to the cash attributable to our foreign operations, we currently anticipate that this cash will remain in those foreign jurisdictions and it therefore may not be available for immediate use; however, we believe that our existing sources of liquidity, as described more fully above, will enable us to meet our cash requirements in the next twelve months.
In March 2016, we issued $475.0 million aggregate principal amount of unsecured 6.75% senior notes due March 15, 2021 (the "2021 Senior Notes"). The 2021 Senior Notes bear interest at the rate of 6.75% per annum with interest payable semi-annually in arrears on March 15 and September 15 of each year beginning on September 15, 2016. The 2021 Senior Notes were sold in a private placement and will not be registered under the U.S. Securities Act of 1933. The net proceeds from the offering were used for general corporate purposes, including acquisitions and dividends.
Cash Flows
During fiscal
2016
, cash provided by operations was
$537.1 million
, compared to cash provided by operations of
$656.8 million
in fiscal
2015
. The decrease in cash provided by operations of
$119.7 million
from fiscal
2015
to fiscal
2016
was primarily due to the decrease in net income combined with a decrease in cash provided by changes in operating assets and liabilities of
$99.6 million
, due primarily to the timing of payments for income taxes and accounts payable.
During fiscal 2015, cash provided by operations was
$656.8 million
, compared to cash provided by operations of
$480.5 million
in fiscal 2014. The increase in cash provided by operations of
$176.3 million
from fiscal 2014 to fiscal 2015 was primarily due to an increase in cash provided by changes in operating assets and liabilities of
$167.7 million
, due primarily to the timing of payments for income taxes as well as accounts payable and accrued liabilities when compared to fiscal 2014.
Cash used in investing activities was
$578.0 million
in fiscal
2016
,
$444.6 million
in fiscal
2015
and
$235.9 million
in fiscal
2014
. In fiscal 2016, cash paid for acquisitions totaled
$441.2 million
, of which the significant majority was in our Technology Brands segment. In fiscal 2015, cash paid for acquisitions totaled
$267.5 million
, of which $126.0 million was used to acquire ThinkGeek and $141.5 million was used in our Technology Brands segment. Capital expenditures totaled
$142.7 million
, $173.2 million and $159.6 million in fiscal 2016, fiscal 2015 and fiscal 2014, respectively.
35
In fiscal 2016, our financing activities provided a net cash inflow of
$238.7 million
consisting primarily of $466.9 million in proceeds, net of financing costs, from the issuance of our 2021 Senior Notes, offset by dividends paid of
$155.5 million
and share repurchases of
$63.1 million
. Cash used in financing activities was $
346.2 million
in fiscal
2015
and $
131.2 million
in fiscal
2014
. The cash flows used in financing activities in fiscal 2015 were primarily for the repurchase of
$194.3 million
of common shares and the payment of dividends on our Class A Common Stock of
$154.1 million
. The cash flows used in financing activities in fiscal 2014 were primarily for the repurchase of
$331.1 million
of treasury shares and the payment of dividends on our Class A Common Stock of
$148.8 million
, offset in part by the
$350.0 million
issuance of 2019 Senior Notes in September 2014.
Sources of Liquidity
We utilize cash generated from operations and have funds available to us under our Revolver to cover seasonal fluctuations in cash flows and to support our various growth initiatives. Our cash and cash equivalents are carried at cost and consist primarily of time deposits with commercial banks.
We have an existing $400.0 million asset-backed revolving credit facility (the “Revolver”), including a $50 million letter of credit sublimit, that expires on March 25, 2019. The Revolver has an expansion feature to allow for an additional $200.0 million if certain conditions are met. Availability under the Revolver is subject to a monthly borrowing base calculation. We are required to pay a commitment fee of 0.25% for any unused portion of the total commitment under the Revolver. The per annum interest is variable and is based on the London Interbank Offered (“LIBO”) rate or the prime rate, in each case plus an applicable margin. As of
January 28, 2017
, our applicable margins were
0.25%
for prime rate loans and
1.25%
for LIBO rate loans. Total availability under the Revolver was
$354.0 million
as of
January 28, 2017
, with no outstanding borrowings and outstanding standby letters of credit of
$8.4 million
.
In March 2016, we issued
$475.0 million
aggregate principal amount of unsecured
6.75%
senior notes due March 15, 2021. Interest is payable semi-annually in arrears on March 15 and September 15 of each year. The net proceeds from the offering were used for general corporate purposes, including acquisitions and dividends.
In September 2014, we issued
$350.0 million
aggregate principal amount of unsecured
5.50%
senior notes due
October 1, 2019
(the "2019 Senior Notes," and together with the 2021 Senior Notes, the “Senior Notes”). Interest is payable semi-annually in arrears on April 1 and October 1 of each year. The net proceeds from the offering were used for general corporate purposes, including acquisitions and dividends.
The agreement governing our Revolver and the indentures governing our Senior Notes place certain restrictions on us and our subsidiaries, including, among others, limitations on asset sales, additional liens, investments, incurrence of additional debt and share repurchases. In addition, the indentures governing our Revolver and Senior Notes contain customary events of default, including, among others, payment defaults, breaches of covenants and certain events of bankruptcy, insolvency and reorganization. The Revolver is also subject to a fixed charge coverage ratio covenant if excess availability is below certain thresholds. We are currently in compliance with all covenants under our indentures governing the Senior Notes and our Revolver.
See Note 9, “Debt,” to our consolidated financial statements for additional information related to our Revolver and Senior Notes.
In September 2007, our Luxembourg subsidiary entered into a discretionary $20 million Uncommitted Line of Credit (the “Line of Credit”) with Bank of America. There is no term associated with the Line of Credit and Bank of America may withdraw the facility at any time without notice. The Line of Credit is available to our foreign subsidiaries for use primarily as a bank overdraft facility for short-term liquidity needs and for the issuance of bank guarantees and letters of credit to support operations. As of
January 28, 2017
, there were no cash overdrafts outstanding under the Line of Credit and bank guarantees outstanding totaled
$10.7 million
.
Acquisitions and Capital Expenditures
Our future capital requirements will depend upon the timing and extent of our ongoing investments in our Technology Brands businesses, our other strategic initiatives, and the number of new stores we open and the timing of those openings within a given fiscal year. We opened or acquired
583
Technology Brands stores and opened
73
Video Game Brands stores in fiscal 2016. We expect to open approximately 35 stand-alone collectibles stores and approximately 65 stores in our Technology Brands segment in fiscal 2017.
In fiscal 2016, in connection with the continued expansion of our Technology Brands segment, Spring Mobile completed the acquisition of 507 AT&T authorized retailer stores for an aggregate of $440.3 million in cash (net of cash acquired), which includes working capital adjustments, and future contingent consideration which we estimate will range from $40.0 million to $50.0 million. The majority of the store acquisitions were funded by our 2021 Senior Notes. The contingent consideration will be paid in two installments. The first installment of $20 million is contingent on the relocation of certain stores and is due the latter of August 2017 or when relocations are completed. The second installment, which we expect to range from $20.0 million to $30.0 million, is contingent on sales performance of certain stores and is due in March 2018. See Note 3, "Acquisitions and Divestitures," to our consolidated financial statements for additional information.
36
Capital expenditures for fiscal 2017 are projected to be approximately $110 million to $120 million, to be used primarily to fund continued growth of our Collectibles and Technology Brands businesses, distribution and information systems and other digital initiatives in support of our operations and new store openings and store remodels.
Share Repurchase Program
We have an ongoing share repurchase program that is executed through open market transactions made from time to time. Shares repurchased are subsequently retired. In November 2014, our Board of Directors authorized a share repurchase program allowing our management to repurchase up to $500 million of our Class A Common Stock with no expiration date, of which
$170.2 million
remained available under the program as of January 28, 2017. We generally seek Board of Directors’ approval for a new authorization before the existing program is fully utilized to ensure we maintain availability under a repurchase program. Share repurchase activity for fiscal 2016, 2015 and 2014 is as follows (in millions, except for per share data):
|
Fiscal Year
|
||||||||||||
|
2016
|
2015
|
2014
|
||||||||||
|
Total number of shares purchased
|
3.0
|
|
5.2
|
|
8.4
|
|
||||||
|
Average price per share
|
$
|
24.94
|
|
$
|
38.68
|
|
$
|
39.50
|
|
|||
|
Aggregate value of shares purchased
|
$
|
75.1
|
|
$
|
202.0
|
|
$
|
333.4
|
|
|||
Dividends
We paid cash dividends of
$155.5 million
,
$154.1 million
and
$148.8 million
in fiscal 2016, 2015 and 2014. On
February 28, 2017
, our Board of Directors authorized an increase in our annual cash dividend from
$1.48
to
$1.52
per share of Class A Common Stock, with the first quarterly dividend of fiscal 2017 payable on
March 28, 2017
to stockholders of record on
March 14, 2017
. Future dividends will be subject to approval by our Board of Directors. Our payment of dividends is and will continue to be restricted by or subject to, among other limitations, applicable provisions of federal and state laws, our earnings and various business considerations, including our financial condition, results of operations, cash flow, the level of our capital expenditures, our future business prospects, our status as a holding company and such other matters that our Board of Directors deems relevant. In addition, the terms of the senior credit facility and of the indentures governing our Senior Notes restrict our ability to pay dividends under certain circumstances as stated above. See Note 9, "Debt," to our consolidated financial statements for further information regarding our Senior Notes.
CONTRACTUAL OBLIGATIONS
The following table sets forth our contractual obligations as of
January 28, 2017
(in millions):
|
|
Payments Due by Period
|
|||||||||||||||||||
|
Total
|
Less Than
1 Year
|
1-3 Years
|
3-5 Years
|
More Than
5 Years
|
||||||||||||||||
|
Operating leases
|
$
|
1,194.6
|
|
$
|
388.6
|
|
$
|
498.2
|
|
$
|
190.1
|
|
$
|
117.7
|
|
|||||
|
Purchase obligations
(1)
|
746.0
|
|
743.8
|
|
2.0
|
|
0.2
|
|
—
|
|
||||||||||
|
2019 Senior Notes
|
350.0
|
|
—
|
|
350.0
|
|
—
|
|
—
|
|
||||||||||
|
2021 Senior Notes
|
475.0
|
|
—
|
|
—
|
|
475.0
|
|
—
|
|
||||||||||
|
Interest payments on senior notes
|
202.0
|
|
51.3
|
|
102.6
|
|
48.1
|
|
—
|
|
||||||||||
|
Contingent consideration
(2)
|
43.2
|
|
20.0
|
|
23.2
|
|
—
|
|
—
|
|
||||||||||
|
Total
(3)
|
$
|
3,010.8
|
|
$
|
1,203.7
|
|
$
|
976.0
|
|
$
|
713.4
|
|
$
|
117.7
|
|
|||||
|
(1)
|
Purchase obligations represent outstanding purchase orders for merchandise from vendors. These purchase orders are generally cancelable until shipment of the products.
|
|
(2)
|
Contingent consideration relates to our acquisition of stores from an AT&T authorized retailer in fiscal 2016. The amount in the table reflects the fair value of our best estimate of the contingent payments, which will be paid in two installments. The first installment of $20.0 million is contingent on the relocation of certain stores and is due the latter of August 2017 or when relocations are completed. The second installment, which we expect to range from $20.0 million to $30.0 million, is contingent on sales performance of certain stores and is due in March 2018.
|
|
(3)
|
As of
January 28, 2017
, we had
$42.5
million of income tax liability related to unrecognized tax benefits in other long-term liabilities in our consolidated balance sheet. At the time of this filing, the settlement period for the noncurrent portion of our income tax liability (and the timing of any related payments) cannot be reasonably determined and therefore these liabilities are excluded from the table above. In addition, certain payments related to unrecognized tax benefits would be partially offset by reductions in payments in other jurisdictions. See Note 7, "Income Taxes," to our consolidated financial statements for further information regarding our uncertain tax positions.
|
We lease retail stores, warehouse facilities, office space and equipment. These are generally leased under noncancelable agreements that expire at various dates through
2033
with various renewal options for additional periods. The agreements, which have been classified as operating leases, generally provide for minimum and, in some cases, percentage rentals and require us to pay all insurance, taxes and other maintenance costs. Percentage rentals are based on sales performance in excess of specified minimums at various stores.
37
As of
January 28, 2017
, we had standby letters of credit outstanding in the amount of
$8.4 million
and had bank guarantees outstanding in the amount of
$24.5 million
,
$8.3 million
of which are cash collateralized.
OFF-BALANCE SHEET ARRANGEMENTS
Other than operating leases entered into in the normal course of business, we had no material off-balance sheet arrangements as of
January 28, 2017
.
CRITICAL ACCOUNTING POLICIES AND USE OF ESTIMATES
The preparation of financial statements in conformity with accounting principles generally accepted in the United States of America (“GAAP”) requires us to make estimates and assumptions that affect the reported amounts of assets and liabilities, the disclosure of contingent assets and liabilities at the date of the financial statements and the reported amounts of revenues and expenses during the reporting period. In preparing these financial statements, we have made our best estimates and judgments of certain amounts included in the financial statements, giving due consideration to materiality. Changes in the estimates and assumptions used by us could have a significant impact on our financial results, and actual results could differ from those estimates. Our senior management has discussed the development and selection of these critical accounting policies, as well as the significant accounting policies disclosed in Note 1, "Nature of Operations and Summary of Significant Accounting Policies," to our consolidated financial statements, with the Audit Committee of our Board of Directors. We believe the following accounting policies are the most critical to aid in fully understanding and evaluating our reporting of transactions and events, and the estimates these policies involve require our most difficult, subjective or complex judgments.
Valuation of Merchandise Inventories
Estimate Description.
Our merchandise inventories are carried at the lower of cost or market generally using the average cost method. Under the average cost method, as new product is received from vendors, its current cost is added to the existing cost of product on-hand and this amount is re-averaged over the cumulative units. Pre-owned video game products traded in by customers are recorded as inventory at the amount of the store credit given to the customer.
Judgment and/or Uncertainty
. In valuing inventory, we are required to make assumptions regarding the necessity of reserves required to value potentially obsolete or over-valued items at the lower of cost or market. We consider quantities on hand, recent sales, potential price protections and returns to vendors, among other factors, when making these assumptions.
Potential Impact if Results Differ
. Our ability to gauge these factors is dependent upon our ability to forecast customer demand and to provide a well-balanced merchandise assortment. Any inability to forecast customer demand properly could lead to increased costs associated with write-downs of inventory to reflect volumes or pricing of inventory which we believe represents the net realizable value. A 10% change in our obsolescence reserve percentage at January 28, 2017 would have affected net earnings by approximately $2.6 million in fiscal 2016.
Cash Consideration Received from Vendors
Estimate Description.
We participate in cooperative advertising programs and other vendor marketing programs in which our vendors provide us with cash consideration in exchange for marketing and advertising the vendors’ products. The cooperative advertising programs and other vendor marketing programs generally cover a period from a few weeks up to a month and include items such as product in-store display promotions and placement, internet advertising, co-op print advertising and other programs. The allowance for each event is negotiated with the vendor and requires specific performance by us to be earned.
Judgment and/or Uncertainty
. Our accounting for cooperative advertising arrangements and other vendor marketing programs results in a significant portion of the consideration received from our vendors reducing the product costs in inventory rather than as an offset to our marketing and advertising costs. The consideration serving as a reduction in inventory is recognized in cost of sales as inventory is sold. We estimate the amount of vendor allowances to be deferred as a reduction of inventory based on the nature of the consideration received and the merchandise inventory to which the consideration relates. We apply a sell-through rate to determine the timing in which the consideration should be recognized in cost of sales. Consideration received that relates to video game products that have not yet been released to the public is deferred.
Potential Impact if Results Differ
. Although we consider our advertising and marketing programs to be effective, we do not believe that we would be able to incur the same level of advertising expenditures if the vendors decreased or discontinued their allowances. Additionally, if actual results are not consistent with our estimated deferrals and sell-through rates, we may be exposed to additional adjustments that could materially impact our gross profit rates and inventory balances. A 10% difference in our vendor allowances deferral at January 28, 2017 would have affected net earnings by approximately $1.0 million in fiscal 2016.
Customer Liabilities
Estimate Description.
Our PowerUp Rewards loyalty program allows enrolled members to earn points on purchases in our stores and on some of our websites that can be redeemed for rewards that include discounts or merchandise. We estimate the net cost of the rewards that will be issued and redeemed and record this cost and the associated liability as points are earned by our loyalty program members. Additionally, we sell gift cards to our customers in our retail stores, through our website and through selected
38
third parties. At the point of sale, a liability is established for the value of the gift card. We recognize revenue from gift cards when the card is redeemed by the customer or the likelihood of the gift card being redeemed by the customer is remote, which is a concept known in the retail industry as breakage. We determine our gift card breakage rate based on historical redemption patterns.
Judgment and/or Uncertainty
. The two primary estimates utilized to record the balance sheet liability for loyalty points earned by members are the estimated redemption rate and the estimated weighted-average cost per point redeemed. We use historical redemption rates experienced under our loyalty program as a basis for estimating the ultimate redemption rate of points earned. A weighted-average cost per point redeemed is used to estimate future redemption costs. The weighted-average cost per point redeemed is based on our most recent actual costs incurred to fulfill points that have been redeemed by our loyalty program members and is adjusted as appropriate for recent changes in redemption costs, including the mix of rewards redeemed. Our estimate of the amount and timing of gift card redemptions is based primarily on historical transaction experience.
Potential Impact if Results Differ
. We continually evaluate our methodology and assumptions based on developments in redemption patterns, cost per point redeemed and other factors. Changes in the ultimate redemption rate and weighted-average cost per point redeemed have the effect of either increasing or decreasing the liability through the current period expense by an amount estimated to cover the cost of all points previously earned but not yet redeemed by loyalty program members as of the end of the reporting period. A 10% change in our customer loyalty program redemption rate or a 10% change in our weighted-average cost per point redeemed at January 28, 2017, in each case, would have affected net earnings by approximately $1.6 million in fiscal 2016. A 10% change in our gift card breakage rate at January 28, 2017 would have affected net earnings by approximately $6.4 million in fiscal 2016.
Goodwill
Estimate Description.
Goodwill results from acquisitions and represents the excess purchase price over the net identifiable assets acquired. We are required to evaluate our goodwill for impairment at least annually or whenever indicators of impairment are present. Our annual test is completed as of the beginning of the fourth fiscal quarter, and interim tests are conducted when circumstances indicate the carrying value of the goodwill may not be recoverable. As of January 28, 2017, our goodwill totaled $
1,725.2 million
. See Note 6, "Goodwill and Intangible Assets," to our consolidated financial statements for the allocation of our goodwill balance by reporting unit.
We use a two-step process to test our goodwill for impairment. Step 1 consists of comparing the estimated fair value of the reporting unit to its carrying value, including goodwill. The estimated fair value of our reporting units is determined based on its projected discounted cash flows. If the carrying value of the reporting unit is higher than its estimated fair value, then the second step of the goodwill impairment test is needed. The second step compares the implied fair value of the reporting unit’s goodwill with its carrying amount. The implied fair value of goodwill is determined in Step 2 of the goodwill impairment test by valuing all of the tangible and intangible assets and liabilities of the reporting unit in a manner similar to the acquisition method of accounting used in a business combination. If the carrying amount of the reporting unit’s goodwill exceeds the implied fair value of its goodwill, then an impairment loss is recognized in the amount of the excess.
Judgment and/or Uncertainty
. Considerable management judgment is necessary to estimate the fair value of our reporting units. The discounted cash flows analyses utilizes a five-year cash flow projection with a terminal value which are discounted using a weighted-average cost of capital for each reporting unit. The projected cash flows include numerous assumptions such as, among others, projected sales trends, earnings margins, store count and capital expenditures, all of which are consistent with our internal operating plans. In addition, we corroborate the aggregate fair value of our reporting units with our market capitalization which may impact certain assumptions in our discounted cash flows analyses.
Potential Impact if Results Differ
. Variations in any of the assumptions used in the discounted cash flow analyses may arrive at different estimated fair values that could result in a material impairment charge. Based on the results of our annual impairment test in fiscal 2016, the fair values of our United States, Canada and Technology Brands reporting units exceeded their respective carrying values by at least 40%. The fair values of our Australia and Europe reporting units exceeded their respective carrying values by 24% and 22%, respectively. A reduction in the terminal growth rate assumption of 0.5% or an increase in the discount rate assumption of 1.0% utilized in the test for each respective reporting unit would not have resulted in impairment. Sustained declines in our stock price and related market capitalization could impact key assumptions and the estimated fair values of our reporting units that could result in material goodwill impairment charges. We can provide no assurance that we will not have impairment charges in future periods as a result of changes in our operating results, our assumptions or in our stock price.
Indefinite-lived Intangible Assets
Estimate Description.
Indefinite-lived intangible assets were recorded as a result of acquisitions and primarily consist of AT&T dealer agreements, Simply Mac dealer agreements, the Micromania trade name and the ThinkGeek trade name. As these intangible assets are expected to contribute to cash flows indefinitely, they are not subject to amortization. We assess our indefinite-lived intangible assets for impairment at least annually and whenever events or changes in circumstances indicate that the carrying value may not be recoverable. Our test is completed as of the beginning of the fourth quarter each fiscal year.
39
We value our dealer agreements using a discounted cash flow analysis known as the Greenfield Method, which assumes that a business, at its inception, owns only dealer agreements and must make capital expenditure, working capital and other investments to ramp up its operations to a level that is comparable to its current operations. We value our trade names using a relief-from-royalty approach, which assumes the value of the trade name is the discounted cash flows of the amount that would be paid by a hypothetical market participant had they not owned the trade name and instead licensed the trade name from another company. As of January 28, 2017, our indefinite-lived intangible assets totaled
$453.0 million
.
Judgment and/or Uncertainty
. In valuing our dealer agreement assets, considerable management judgment is necessary to estimate the cash flows required to build a comparable operation and the available future cash flows from these operations. Specifically, we are required to make certain assumptions about the cost of investment to build a comparable operation, projected net sales, cost of sales, operating expenses and income taxes, as well as the discount rate that is applied to the expected future cash flows to arrive at an estimated fair value. In valuing our trade names, we are required to make certain assumptions regarding future cash flow projections to ensure that such projections represent reasonable market participant assumptions, to which the royalty rate is applied. Additionally, management judgment is necessary in selecting an appropriate discount rate which is reflective of the inherent risk of holding a standalone intangible asset.
Potential Impact if Results Differ
. As a result of our annual impairment testing, we recognized impairment charges totaling
$14.4 million
associated with our indefinite-lived intangible assets. Simply Mac dealer agreements were impaired by
$7.0 million
to their estimated fair value of
$11.0 million
and the Micromania trade name was impaired by
$7.4 million
to its estimated fair value of
$35.0 million
.
Recent revenue and profitability measures associated with Simply Mac and Micromania indicated that future revenue and profitability no longer supported the carrying value of these intangible assets. The estimated fair values of our AT&T dealer agreements and ThinkGeek trade name exceeded their carrying values by a substantial margin.
Changes in the projected cash flows and the assumptions utilized in estimating the present value of the cash flows attributable to dealer agreements and trade names could materially impact the fair value estimates, which would increase or decrease the impairment charges. Regarding our Simply Mac dealer agreements, a 10% decline in projected sales would result in an increase of approximately $1.9 million in the impairment charge. Regarding our Micromania trade name, a 10% decline in sales in each forecast period, including the terminal period, would result in an increase of approximately $2.0 million in the impairment charge. We can provide no assurance that we will not have impairment charges in future periods as a result of changes in our operating results or our assumptions.
Income Taxes
Estimate Description.
We account for income taxes utilizing an asset and liability approach, and deferred taxes are determined based on the estimated future tax effect of differences between the financial reporting and tax bases of assets and liabilities using enacted tax rates. As a result of our operations in many foreign countries, our global tax rate is derived from a combination of applicable tax rates in the various jurisdictions in which we operate. We maintain accruals for uncertain tax positions until examination of the tax year is completed by the taxing authority, available review periods expire or additional facts and circumstances cause us to change our assessment of the appropriate accrual amount. Our liability for uncertain tax positions was $42.5 million as of January 28, 2017.
Additionally, a valuation allowance is recorded against a deferred tax asset if it is not more likely than not that the asset will be realized. Several factors are considered in evaluating the realizability of our deferred tax assets, including the remaining years available for carry forward, the tax laws for the applicable jurisdictions, the future profitability of the specific business units, and tax planning strategies. Our valuation allowance was $39.4 million as of January 28, 2017. See Note 7 to our consolidated financial statements for further information regarding income taxes.
Judgment and/or Uncertainty
. Considerable management judgment is necessary to assess the inherent uncertainties related to the interpretations of complex tax laws, regulations and taxing authority rulings, as well as to the expiration of statutes of limitations in the jurisdictions in which we operate. We base our estimate of an annual effective tax rate at any given point in time on a calculated mix of the tax rates applicable to our operations and to estimates of the amount of income to be derived in any given jurisdiction. We file our tax returns based on our understanding of the appropriate tax rules and regulations. However, complexities in the tax rules and our operations, as well as positions taken publicly by the taxing authorities, may lead us to conclude that accruals for uncertain tax positions are required. Additionally, several factors are considered in evaluating the realizability of our deferred tax assets, including the remaining years available for carry forward, the tax laws for the applicable jurisdictions, the future profitability of the specific business units, and tax planning strategies.
Potential Impact if Results Differ
. Our judgments and estimates concerning uncertain tax positions may change as a result of evaluation of new information, such as the outcome of tax audits or changes to or further interpretations of tax laws and regulations. Our judgments and estimates concerning realizability of deferred tax assets could change if any of the evaluation factors change. If such changes take place, there is a risk that our effective tax rate could increase or decrease in any period, impacting our net earnings.
40
RECENT ACCOUNTING STANDARDS AND PRONOUNCEMENTS
See Note 1, "Nature of Operations and Summary of Significant Accounting Policies," to our consolidated financial statements for recent accounting standards and pronouncements.
|
ITEM 7A.
|
QUANTITATIVE AND QUALITATIVE DISCLOSURES ABOUT MARKET RISK
|
We are exposed to market risk due to foreign currency and interest rate fluctuations, each as described more fully below.
Foreign Currency Risk
We use forward exchange contracts, foreign currency options and cross-currency swaps (together, the “foreign currency contracts”) to manage currency risk primarily related to intercompany loans denominated in non-functional currencies and certain foreign currency assets and liabilities. The foreign currency contracts are not designated as hedges and, therefore, changes in the fair values of these derivatives are recognized in earnings, thereby offsetting the current earnings effect of the re-measurement of related intercompany loans and foreign currency assets and liabilities. For the fiscal year ended
January 28, 2017
, we recognized a
$20.0 million
gain in selling, general and administrative expenses related to derivative instruments. The aggregate fair value of the foreign currency contracts as of
January 28, 2017
was a net asset of $
9.0 million
as measured by observable inputs obtained from market news reporting services, such as
Bloomberg
, and industry-standard models that consider various assumptions, including quoted forward prices, time value, volatility factors, and contractual prices for the underlying instruments, as well as other relevant economic measures. A hypothetical strengthening or weakening of 10% in the foreign exchange rates underlying the foreign currency contracts from the market rate as of
January 28, 2017
would result in a gain or loss in value of the forwards, options and swaps of
$9.4 million
.
We do not use derivative financial instruments for trading or speculative purposes. We are exposed to counterparty credit risk on all of our derivative financial instruments and cash equivalent investments. We manage counterparty risk according to the guidelines and controls established under comprehensive risk management and investment policies. We continuously monitor our counterparty credit risk and utilize a number of different counterparties to minimize our exposure to potential defaults. We do not require collateral under derivative or investment agreements.
Interest Rate Risk
Our Revolver’s per annum interest rate is variable and is based on one of (i) the U.S. prime rate, (ii) the LIBO rate or (iii) the U.S. federal funds rate. Our Senior Notes' per annum interest rate is fixed. We do not use derivative financial instruments to hedge interest rate exposure. We limit our interest rate risks by investing our excess cash balances in short-term, highly-liquid instruments with a maturity of one year or less. We do not expect any material losses from our invested cash balances. Additionally, a hypothetical 10% adverse movement in interest rates would not have a material impact on our financial condition, results of operations or cash flows and we therefore believe that we do not have significant interest rate exposure.
|
ITEM 8.
|
FINANCIAL STATEMENTS AND SUPPLEMENTARY DATA
|
See Item 15(a)(1) and (2) of this Form 10-K.
41
|
ITEM 9.
|
CHANGES IN AND DISAGREEMENTS WITH ACCOUNTANTS ON ACCOUNTING AND FINANCIAL DISCLOSURE
|
None.
|
ITEM 9A.
|
CONTROLS AND PROCEDURES
|
Evaluation of Disclosure Controls and Procedures
As of the end of the period covered by this report, our management conducted an evaluation, under the supervision and with the participation of our principal executive officer and principal financial officer, of our disclosure controls and procedures (as defined in Rules 13a-15(e) and 15d-15(e) under the Exchange Act) at the reasonable assurance level. Based on this evaluation, our principal executive officer and principal financial officer concluded that, as of the end of the period covered by this report, our disclosure controls and procedures are designed to provide reasonable assurance of achieving their objectives and that our disclosure controls and procedures are effective at the reasonable assurance level. Notwithstanding the foregoing, a control system, no matter how well designed and operated, can provide only reasonable, not absolute, assurance that it will detect or uncover failures to disclose material information otherwise required to be set forth in our periodic reports.
Management’s Annual Report on Internal Control Over Financial Reporting
Our management is responsible for establishing and maintaining adequate internal control over financial reporting, as such term is defined in Exchange Act Rules 13a-15(f) and 15d-15(f). Under the supervision and with the participation of our management, including our principal executive officer and principal financial officer, we conducted an evaluation of the effectiveness of our internal control over financial reporting based on the
Internal Control—Integrated Framework (2013)
issued by the Committee of Sponsoring Organizations of the Treadway Commission, known as (COSO 2013). Based on our evaluation under COSO 2013, our management concluded that our internal control over financial reporting was effective at the reasonable assurance level as of
January 28, 2017
.
The effectiveness of our internal control over financial reporting as of
January 28, 2017
has been audited by Deloitte & Touche LLP, an independent registered public accounting firm, as stated in their report which is included on the following page.
There was no change in our internal control over financial reporting (as such term is defined in Rules 13a-15(f) and 15d-15(f) under the Exchange Act) during our most recently completed fiscal quarter that has materially affected, or is reasonably likely to materially affect, our internal control over financial reporting.
42
REPORT OF INDEPENDENT REGISTERED PUBLIC ACCOUNTING FIRM
To the Board of Directors and Stockholders of
GameStop Corp.
Grapevine, Texas
We have audited the internal control over financial reporting of GameStop Corp. and subsidiaries (the "Company") as of January 28, 2017 based on criteria established in Internal Control — Integrated Framework (2013) issued by the Committee of Sponsoring Organizations of the Treadway Commission. The Company's management is responsible for maintaining effective internal control over financial reporting and for its assessment of the effectiveness of internal control over financial reporting, included in the accompanying Management’s Annual Report on Internal Control Over Financial Reporting. Our responsibility is to express an opinion on the Company's internal control over financial reporting based on our audit.
We conducted our audit in accordance with the standards of the Public Company Accounting Oversight Board (United States). Those standards require that we plan and perform the audit to obtain reasonable assurance about whether effective internal control over financial reporting was maintained in all material respects. Our audit included obtaining an understanding of internal control over financial reporting, assessing the risk that a material weakness exists, testing and evaluating the design and operating effectiveness of internal control based on the assessed risk, and performing such other procedures as we considered necessary in the circumstances. We believe that our audit provides a reasonable basis for our opinion.
A company's internal control over financial reporting is a process designed by, or under the supervision of, the company's principal executive and principal financial officers, or persons performing similar functions, and effected by the company's board of directors, management, and other personnel to provide reasonable assurance regarding the reliability of financial reporting and the preparation of financial statements for external purposes in accordance with generally accepted accounting principles. A company's internal control over financial reporting includes those policies and procedures that (1) pertain to the maintenance of records that, in reasonable detail, accurately and fairly reflect the transactions and dispositions of the assets of the company; (2) provide reasonable assurance that transactions are recorded as necessary to permit preparation of financial statements in accordance with generally accepted accounting principles, and that receipts and expenditures of the company are being made only in accordance with authorizations of management and directors of the company; and (3) provide reasonable assurance regarding prevention or timely detection of unauthorized acquisition, use, or disposition of the company's assets that could have a material effect on the financial statements.
Because of the inherent limitations of internal control over financial reporting, including the possibility of collusion or improper management override of controls, material misstatements due to error or fraud may not be prevented or detected on a timely basis. Also, projections of any evaluation of the effectiveness of the internal control over financial reporting to future periods are subject to the risk that the controls may become inadequate because of changes in conditions, or that the degree of compliance with the policies or procedures may deteriorate.
In our opinion, the Company maintained, in all material respects, effective internal control over financial reporting as of January 28, 2017, based on the criteria established in Internal Control - Integrated Framework (2013) issued by the Committee of Sponsoring Organizations of the Treadway Commission.
We have also audited, in accordance with the standards of the Public Company Accounting Oversight Board (United States), the consolidated financial statements and financial statement schedule as of and for the 52 week period ended January 28, 2017 of the Company and our report dated March 27, 2017 expressed an unqualified opinion on those consolidated financial statements and financial statement schedule.
|
/s/ DELOITTE & TOUCHE LLP
|
Dallas, Texas
March 27, 2017
43
|
ITEM 9B.
|
OTHER INFORMATION
|
None.
|
ITEM 10.
|
DIRECTORS, EXECUTIVE OFFICERS AND CORPORATE GOVERNANCE*
|
Code of Ethics
We have adopted a Code of Ethics for Senior Financial and Executive Officers that is applicable to our Executive Chairman, Chief Executive Officer, Chief Operating Officer, Chief Financial Officer, Chief Accounting Officer, any Executive Vice President and any Vice President employed in a finance or accounting role. We have also adopted a Code of Standards, Ethics and Conduct applicable to all of our management-level employees. Each of the Code of Ethics and Code of Standards, Ethics and Conduct are available on our website at www.gamestop.com.
In accordance with SEC rules, we intend to disclose any amendment (other than any technical, administrative, or other non-substantive amendment) to either of the above Codes, or any waiver of any provision thereof with respect to any of the executive officers listed in the paragraph above, on our website (www.gamestop.com) within four business days following such amendment or waiver.
|
ITEM 11.
|
EXECUTIVE COMPENSATION*
|
|
ITEM 12.
|
SECURITY OWNERSHIP OF CERTAIN BENEFICIAL OWNERS AND MANAGEMENT AND RELATED STOCKHOLDER MATTERS*
|
|
ITEM 13.
|
CERTAIN RELATIONSHIPS AND RELATED TRANSACTIONS, AND DIRECTOR INDEPENDENCE*
|
|
ITEM 14.
|
PRINCIPAL ACCOUNTANT FEES AND SERVICES*
|
* The information not otherwise provided herein that is required by Items 10, 11, 12, 13 and 14 will be set forth in the definitive proxy statement relating to our 2017 Annual Meeting of Stockholders to be held on or around June 27, 2017 which is to be filed with the SEC pursuant to Regulation 14A under the Securities Exchange Act of 1934, as amended. This definitive proxy statement relates to a meeting of stockholders involving the election of directors and the portions therefrom required to be set forth in this Form 10-K by Items 10, 11, 12, 13 and 14 are incorporated herein by reference pursuant to General Instruction G(3) to Form 10-K.
44
|
ITEM 15.
|
EXHIBITS AND FINANCIAL STATEMENT SCHEDULE
|
|
(a)
|
The following documents are filed as a part of this Form 10-K:
|
|
(1)
|
Index and Consolidated Financial Statements
|
The list of consolidated financial statements set forth in the accompanying Index to Consolidated Financial Statements at page F-1 herein is incorporated herein by reference. Such consolidated financial statements are filed as part of this Form 10-K.
|
(2)
|
Financial Statement Schedules required to be filed by Item 8 of this Form 10-K:
|
The following financial statement schedule for the
52 weeks ended January 28, 2017
,
52 weeks ended January 30, 2016
and the
52 weeks ended January 31, 2015
is filed as part of this Form 10-K and should be read in conjunction with our Consolidated Financial Statements appearing elsewhere in this Form 10-K. All other schedules are omitted because they are not applicable.
|
(b)
|
Exhibits
|
The information required by this Section (b) of Item 15 is set forth on the Exhibit Index that follows the Consolidated Financial Statements and Notes to Consolidated Financial Statements appearing elsewhere in this Form 10-K.
Schedule II — Valuation and Qualifying Accounts
For the
52 weeks ended January 28, 2017
,
52 weeks ended January 30, 2016
and the
52 weeks ended January 31, 2015
:
|
|
Balance at
Beginning
of Period
|
Charged to
Costs and
Expenses
|
Charged
to Other
Accounts-
Accounts
Payable
(1)
|
Deductions-
Write-Offs
Net of
Recoveries
|
Balance at
End of
Period
|
|||||||||||||||
|
|
(In millions)
|
|||||||||||||||||||
|
Inventory Reserve
|
||||||||||||||||||||
|
52 Weeks Ended January 28, 2017
|
$
|
61.5
|
|
$
|
47.5
|
|
$
|
49.6
|
|
$
|
(99.6
|
)
|
$
|
59.0
|
|
|||||
|
52 Weeks Ended January 30, 2016
|
69.3
|
|
36.9
|
|
58.2
|
|
(102.9
|
)
|
61.5
|
|
||||||||||
|
52 Weeks Ended January 31, 2015
|
76.5
|
|
40.9
|
|
55.8
|
|
(103.9
|
)
|
69.3
|
|
||||||||||
|
Valuation Allowance for Deferred Tax Assets
|
||||||||||||||||||||
|
52 Weeks Ended January 28, 2017
|
$
|
18.8
|
|
$
|
20.9
|
|
$
|
—
|
|
$
|
(0.3
|
)
|
$
|
39.4
|
|
|||||
|
52 Weeks Ended January 30, 2016
|
24.3
|
|
0.4
|
|
—
|
|
(5.9
|
)
|
18.8
|
|
||||||||||
|
52 Weeks Ended January 31, 2015
|
13.3
|
|
15.6
|
|
—
|
|
(4.6
|
)
|
24.3
|
|
||||||||||
(1) Consists primarily of amounts received from vendors for defective allowances.
|
ITEM 16.
|
Form 10-K Summary
|
None.
45
SIGNATURES
Pursuant to the requirements of Section 13 or 15(d) of the Securities Exchange Act of 1934, the registrant has duly caused this Form 10-K to be signed on its behalf by the undersigned, thereunto duly authorized.
|
GAMESTOP CORP.
|
||
|
By:
|
/s/ J. PAUL RAINES
|
|
|
J. Paul Raines
|
||
|
Chief Executive Officer and Director
|
||
Date:
March 27, 2017
Pursuant to the requirements of the Securities Exchange Act of 1934, this Form 10-K has been signed below by the following persons on behalf of the registrant and in the capacities and on the dates indicated.
|
Name
|
|
Capacity
|
|
Date
|
|
/s/ J. PAUL RAINES
|
|
Chief Executive Officer and Director
|
|
March 27, 2017
|
|
J. Paul Raines
|
(Principal Executive Officer)
|
|||
|
/s/ DANIEL A. DEMATTEO
|
|
Executive Chairman and Director
|
|
March 27, 2017
|
|
Daniel A. DeMatteo
|
||||
|
/s/ ROBERT A. LLOYD
|
|
Executive Vice President and Chief Financial Officer
|
|
March 27, 2017
|
|
Robert A. Lloyd
|
(Principal Financial Officer)
|
|||
|
/s/ TROY W. CRAWFORD
|
|
Senior Vice President, Chief Accounting Officer
|
|
March 27, 2017
|
|
Troy W. Crawford
|
(Principal Accounting Officer)
|
|||
|
/s/ JEROME L. DAVIS
|
|
Director
|
|
March 27, 2017
|
|
Jerome L. Davis
|
||||
|
/s/ THOMAS N. KELLY JR.
|
Director
|
March 27, 2017
|
||
|
Thomas N. Kelly Jr.
|
||||
|
/s/ SHANE S. KIM
|
|
Director
|
|
March 27, 2017
|
|
Shane S. Kim
|
||||
|
/s/ STEVEN R. KOONIN
|
|
Director
|
|
March 27, 2017
|
|
Steven R. Koonin
|
||||
|
/s/ STEPHANIE M. SHERN
|
|
Director
|
|
March 27, 2017
|
|
Stephanie M. Shern
|
||||
|
/s/ GERALD R. SZCZEPANSKI
|
|
Director
|
|
March 27, 2017
|
|
Gerald R. Szczepanski
|
||||
|
/s/ KATHY P. VRABECK
|
|
Director
|
|
March 27, 2017
|
|
Kathy P. Vrabeck
|
||||
|
/s/ LAWRENCE S. ZILAVY
|
|
Director
|
|
March 27, 2017
|
|
Lawrence S. Zilavy
|
||||
46
INDEX TO CONSOLIDATED FINANCIAL STATEMENTS
|
|
Page
|
|
GameStop Corp. Consolidated Financial Statements:
|
|
|
Consolidated Financial Statements:
|
|
|
Notes to Consolidated Financial Statements:
|
|
F-1
REPORT OF INDEPENDENT REGISTERED PUBLIC ACCOUNTING FIRM
To the Board of Directors and Stockholders of
GameStop Corp.
Grapevine, Texas
We have audited the accompanying consolidated balance sheets of GameStop Corp. and subsidiaries (the "Company") as of January 28, 2017 and January 30, 2016, and the related consolidated statements of operations, comprehensive income, stockholders' equity, and cash flows for each of the 52 week periods ended January 28, 2017, January 30, 2016 and January 31, 2015. Our audits also included the financial statement schedule listed in the Index at Item 15. These consolidated financial statements and financial statement schedule are the responsibility of the Company's management. Our responsibility is to express an opinion on the consolidated financial statements and financial statement schedule based on our audits.
We conducted our audits in accordance with the standards of the Public Company Accounting Oversight Board (United States). Those standards require that we plan and perform the audit to obtain reasonable assurance about whether the financial statements are free of material misstatement. An audit includes examining, on a test basis, evidence supporting the amounts and disclosures in the financial statements. An audit also includes assessing the accounting principles used and significant estimates made by management, as well as evaluating the overall financial statement presentation. We believe that our audits provide a reasonable basis for our opinion.
In our opinion, such consolidated financial statements present fairly, in all material respects, the financial position of GameStop Corp. and subsidiaries as of January 28, 2017 and January 30, 2016, and the results of their operations and their cash flows for each of the 52 week periods ended January 28, 2017, January 30, 2016 and January 31, 2015, in conformity with accounting principles generally accepted in the United States of America. Also, in our opinion, such financial statement schedule, when considered in relation to the basic consolidated financial statements taken as a whole, presents fairly, in all material respects, the information set forth therein.
We have also audited, in accordance with the standards of the Public Company Accounting Oversight Board (United States), the Company's internal control over financial reporting as of January 28, 2017, based on the criteria established in Internal Control — Integrated Framework (2013) issued by the Committee of Sponsoring Organizations of the Treadway Commission and our report dated March 27, 2017 expressed an unqualified opinion on the Company's internal control over financial reporting.
|
/s/ DELOITTE & TOUCHE LLP
|
Dallas, Texas
March 27, 2017
F-2
GAMESTOP CORP.
(in millions, except par value per share)
|
January 28,
2017 |
January 30,
2016 |
|||||||
|
ASSETS
|
||||||||
|
Current assets:
|
||||||||
|
Cash and cash equivalents
|
$
|
669.4
|
|
$
|
450.4
|
|
||
|
Receivables, net
|
220.9
|
|
176.5
|
|
||||
|
Merchandise inventories, net
|
1,121.5
|
|
1,163.0
|
|
||||
|
Prepaid expenses and other current assets
|
128.9
|
|
147.6
|
|
||||
|
Total current assets
|
2,140.7
|
|
1,937.5
|
|
||||
|
Property and equipment:
|
||||||||
|
Land
|
18.6
|
|
17.3
|
|
||||
|
Buildings and leasehold improvements
|
724.5
|
|
668.2
|
|
||||
|
Fixtures and equipment
|
931.4
|
|
874.6
|
|
||||
|
Total property and equipment
|
1,674.5
|
|
1,560.1
|
|
||||
|
Less accumulated depreciation
|
1,203.5
|
|
1,075.6
|
|
||||
|
Net property and equipment
|
471.0
|
|
484.5
|
|
||||
|
Deferred income taxes
|
59.0
|
|
39.0
|
|
||||
|
Goodwill
|
1,725.2
|
|
1,476.7
|
|
||||
|
Other intangible assets, net
|
507.2
|
|
330.4
|
|
||||
|
Other noncurrent assets
|
72.8
|
|
62.2
|
|
||||
|
Total noncurrent assets
|
2,835.2
|
|
2,392.8
|
|
||||
|
Total assets
|
$
|
4,975.9
|
|
$
|
4,330.3
|
|
||
|
LIABILITIES AND STOCKHOLDERS’ EQUITY
|
||||||||
|
Current liabilities:
|
||||||||
|
Accounts payable
|
$
|
616.6
|
|
$
|
631.9
|
|
||
|
Accrued liabilities
|
1,090.9
|
|
1,041.4
|
|
||||
|
Income taxes payable
|
54.0
|
|
121.1
|
|
||||
|
Total current liabilities
|
1,761.5
|
|
1,794.4
|
|
||||
|
Deferred income taxes
|
23.0
|
|
29.6
|
|
||||
|
Long-term debt, net
|
815.0
|
|
345.4
|
|
||||
|
Other long-term liabilities
|
122.3
|
|
79.9
|
|
||||
|
Total long-term liabilities
|
960.3
|
|
454.9
|
|
||||
|
Total liabilities
|
2,721.8
|
|
2,249.3
|
|
||||
|
Commitments and contingencies (Notes 7, 10 and 11)
|
|
|
||||||
|
Stockholders’ equity:
|
||||||||
|
Class A common stock — $.001 par value; authorized 300.0 shares; 101.0 and 103.3 shares issued, 101.0 and 103.3 shares outstanding, respectively
|
0.1
|
|
0.1
|
|
||||
|
Additional paid-in capital
|
—
|
|
—
|
|
||||
|
Accumulated other comprehensive loss
|
(47.3
|
)
|
(88.8
|
)
|
||||
|
Retained earnings
|
2,301.3
|
|
2,169.7
|
|
||||
|
Total stockholders' equity
|
2,254.1
|
|
2,081.0
|
|
||||
|
Total liabilities and stockholders’ equity
|
$
|
4,975.9
|
|
$
|
4,330.3
|
|
||
See accompanying notes to consolidated financial statements.
F-3
GAMESTOP CORP.
(in millions, except per share data)
|
Fiscal Year
|
||||||||||||
|
2016
|
2015
|
2014
|
||||||||||
|
Net sales
|
$
|
8,607.9
|
|
$
|
9,363.8
|
|
$
|
9,296.0
|
|
|||
|
Cost of sales
|
5,598.6
|
|
6,445.5
|
|
6,520.1
|
|
||||||
|
Gross profit
|
3,009.3
|
|
2,918.3
|
|
2,775.9
|
|
||||||
|
Selling, general and administrative expenses
|
2,252.6
|
|
2,108.9
|
|
2,001.0
|
|
||||||
|
Depreciation and amortization
|
165.2
|
|
156.6
|
|
154.4
|
|
||||||
|
Asset impairments
|
33.8
|
|
4.6
|
|
2.2
|
|
||||||
|
Operating earnings
|
557.7
|
|
648.2
|
|
618.3
|
|
||||||
|
Interest income
|
(0.8
|
)
|
(0.4
|
)
|
(0.7
|
)
|
||||||
|
Interest expense
|
53.8
|
|
23.4
|
|
10.7
|
|
||||||
|
Earnings before income tax expense
|
504.7
|
|
625.2
|
|
608.3
|
|
||||||
|
Income tax expense
|
151.5
|
|
222.4
|
|
215.2
|
|
||||||
|
Net income
|
$
|
353.2
|
|
$
|
402.8
|
|
$
|
393.1
|
|
|||
|
Earnings per share:
|
||||||||||||
|
Basic
|
$
|
3.42
|
|
$
|
3.80
|
|
$
|
3.50
|
|
|||
|
Diluted
|
$
|
3.40
|
|
$
|
3.78
|
|
$
|
3.47
|
|
|||
|
Weighted-average shares outstanding:
|
||||||||||||
|
Basic
|
103.4
|
|
106.0
|
|
112.2
|
|
||||||
|
Diluted
|
103.8
|
|
106.7
|
|
113.2
|
|
||||||
See accompanying notes to consolidated financial statements.
F-4
GAMESTOP CORP.
CONSOLIDATED STATEMENTS OF COMPREHENSIVE INCOME
(in millions)
|
Fiscal Year
|
||||||||||||
|
2016
|
2015
|
2014
|
||||||||||
|
Net income
|
$
|
353.2
|
|
$
|
402.8
|
|
$
|
393.1
|
|
|||
|
Other comprehensive income (loss):
|
||||||||||||
|
Foreign currency translation adjustments
|
41.5
|
|
(63.4
|
)
|
(107.9
|
)
|
||||||
|
Total comprehensive income
|
$
|
394.7
|
|
$
|
339.4
|
|
$
|
285.2
|
|
|||
See accompanying notes to consolidated financial statements.
F-5
GAMESTOP CORP.
CONSOLIDATED STATEMENTS OF STOCKHOLDERS' EQUITY
(in millions, except for per share data)
|
|
Class A
Common Stock
|
Additional
Paid-in
Capital
|
Accumulated
Other
Comprehensive
Income (Loss)
|
Retained
Earnings
|
Total
Stockholders' Equity
|
||||||||||||||||||
|
|
Shares
|
Amount
|
|||||||||||||||||||||
|
Balance at February 1, 2014
|
115.3
|
|
$
|
0.1
|
|
$
|
172.9
|
|
$
|
82.5
|
|
$
|
1,995.9
|
|
$
|
2,251.4
|
|
||||||
|
Net income
|
—
|
|
—
|
|
—
|
|
—
|
|
393.1
|
|
393.1
|
|
|||||||||||
|
Foreign currency translation
|
—
|
|
—
|
|
—
|
|
(107.9
|
)
|
—
|
|
(107.9
|
)
|
|||||||||||
|
Dividends declared, $1.32 per common share
|
—
|
|
—
|
|
—
|
|
—
|
|
(151.6
|
)
|
(151.6
|
)
|
|||||||||||
|
Stock-based compensation
|
—
|
|
—
|
|
21.5
|
|
—
|
|
—
|
|
21.5
|
|
|||||||||||
|
Repurchases of common stock
|
(8.4
|
)
|
—
|
|
(189.0
|
)
|
—
|
|
(144.4
|
)
|
(333.4
|
)
|
|||||||||||
|
Settlement of stock-based awards, net of excess tax benefits of $5.3
|
0.8
|
|
—
|
|
(5.4
|
)
|
—
|
|
—
|
|
(5.4
|
)
|
|||||||||||
|
Balance at January 31, 2015
|
107.7
|
|
0.1
|
|
—
|
|
(25.4
|
)
|
2,093.0
|
|
2,067.7
|
|
|||||||||||
|
Net income
|
—
|
|
—
|
|
—
|
|
—
|
|
402.8
|
|
402.8
|
|
|||||||||||
|
Foreign currency translation
|
—
|
|
—
|
|
—
|
|
(63.4
|
)
|
—
|
|
(63.4
|
)
|
|||||||||||
|
Dividends declared, $1.44 per common share
|
—
|
|
—
|
|
—
|
|
—
|
|
(153.5
|
)
|
(153.5
|
)
|
|||||||||||
|
Stock-based compensation
|
—
|
|
—
|
|
29.9
|
|
—
|
|
—
|
|
29.9
|
|
|||||||||||
|
Repurchases of common stock
|
(5.2
|
)
|
—
|
|
(29.4
|
)
|
—
|
|
(172.6
|
)
|
(202.0
|
)
|
|||||||||||
|
Settlement of stock-based awards, net of excess tax benefits of $4.4
|
0.8
|
|
—
|
|
(0.5
|
)
|
—
|
|
—
|
|
(0.5
|
)
|
|||||||||||
|
Balance at January 30, 2016
|
103.3
|
|
0.1
|
|
—
|
|
(88.8
|
)
|
2,169.7
|
|
2,081.0
|
|
|||||||||||
|
Net income
|
—
|
|
—
|
|
—
|
|
—
|
|
353.2
|
|
353.2
|
|
|||||||||||
|
Foreign currency translation
|
—
|
|
—
|
|
—
|
|
41.5
|
|
—
|
|
41.5
|
|
|||||||||||
|
Dividends declared, $1.48 per common share
|
—
|
|
—
|
|
—
|
|
—
|
|
(155.1
|
)
|
(155.1
|
)
|
|||||||||||
|
Stock-based compensation
|
—
|
|
—
|
|
17.8
|
|
—
|
|
—
|
|
17.8
|
|
|||||||||||
|
Repurchases of common stock
|
(3.0
|
)
|
—
|
|
(8.6
|
)
|
—
|
|
(66.5
|
)
|
(75.1
|
)
|
|||||||||||
|
Settlement of stock-based awards, net of tax deficiency of $0.8
|
0.7
|
|
—
|
|
(9.2
|
)
|
—
|
|
—
|
|
(9.2
|
)
|
|||||||||||
|
Balance at January 28, 2017
|
101.0
|
|
$
|
0.1
|
|
$
|
—
|
|
$
|
(47.3
|
)
|
$
|
2,301.3
|
|
$
|
2,254.1
|
|
||||||
See accompanying notes to consolidated financial statements.
F-6
GAMESTOP CORP.
(in millions)
|
Fiscal Year
|
||||||||||||
|
2016
|
2015
|
2014
|
||||||||||
|
Cash flows from operating activities:
|
||||||||||||
|
Net income
|
$
|
353.2
|
|
$
|
402.8
|
|
$
|
393.1
|
|
|||
|
Adjustments to reconcile net income to net cash flows provided by operating activities:
|
||||||||||||
|
Depreciation and amortization (including amounts in cost of sales)
|
166.7
|
|
158.2
|
|
156.5
|
|
||||||
|
Asset impairments
|
33.8
|
|
4.6
|
|
2.2
|
|
||||||
|
Stock-based compensation expense
|
17.8
|
|
29.9
|
|
21.5
|
|
||||||
|
Deferred income taxes
|
(37.2
|
)
|
(1.5
|
)
|
9.2
|
|
||||||
|
Excess tax benefits related to stock-based awards
|
0.8
|
|
(4.4
|
)
|
(5.7
|
)
|
||||||
|
Loss on disposal of property and equipment
|
10.4
|
|
3.6
|
|
4.7
|
|
||||||
|
Other
|
15.5
|
|
(4.6
|
)
|
(16.1
|
)
|
||||||
|
Changes in operating assets and liabilities:
|
||||||||||||
|
Receivables, net
|
(43.9
|
)
|
(58.1
|
)
|
(44.3
|
)
|
||||||
|
Merchandise inventories
|
14.7
|
|
(49.2
|
)
|
(24.8
|
)
|
||||||
|
Prepaid expenses and other current assets
|
(11.4
|
)
|
(6.0
|
)
|
(1.7
|
)
|
||||||
|
Prepaid income taxes and income taxes payable
|
(49.1
|
)
|
95.9
|
|
(82.3
|
)
|
||||||
|
Accounts payable and accrued liabilities
|
64.1
|
|
91.4
|
|
59.4
|
|
||||||
|
Changes in other long-term liabilities
|
1.7
|
|
(5.8
|
)
|
8.8
|
|
||||||
|
Net cash flows provided by operating activities
|
537.1
|
|
656.8
|
|
480.5
|
|
||||||
|
Cash flows from investing activities:
|
||||||||||||
|
Purchase of property and equipment
|
(142.7
|
)
|
(173.2
|
)
|
(159.6
|
)
|
||||||
|
Acquisitions, net of cash acquired of $0.1, $13.9 and $3.6, respectively
|
(441.2
|
)
|
(267.5
|
)
|
(89.7
|
)
|
||||||
|
Proceeds from divestiture
|
—
|
|
—
|
|
12.4
|
|
||||||
|
Other
|
5.9
|
|
(3.9
|
)
|
1.0
|
|
||||||
|
Net cash flows used in investing activities
|
(578.0
|
)
|
(444.6
|
)
|
(235.9
|
)
|
||||||
|
Cash flows from financing activities:
|
||||||||||||
|
Repayment of acquisition-related debt
|
(0.4
|
)
|
(2.2
|
)
|
—
|
|
||||||
|
Repurchase of common shares
|
(63.1
|
)
|
(194.3
|
)
|
(331.1
|
)
|
||||||
|
Dividends paid
|
(155.5
|
)
|
(154.1
|
)
|
(148.8
|
)
|
||||||
|
Proceeds from senior notes
|
475.0
|
|
—
|
|
350.0
|
|
||||||
|
Borrowings from the revolver
|
545.0
|
|
463.0
|
|
626.0
|
|
||||||
|
Repayments of revolver borrowings
|
(545.0
|
)
|
(463.0
|
)
|
(626.0
|
)
|
||||||
|
Payments of financing costs
|
(8.1
|
)
|
—
|
|
(7.7
|
)
|
||||||
|
Issuance of common stock, net of share repurchases for withholding taxes
|
(8.4
|
)
|
—
|
|
0.7
|
|
||||||
|
Excess tax benefits related to stock-based awards
|
(0.8
|
)
|
4.4
|
|
5.7
|
|
||||||
|
Net cash flows provided by (used in) financing activities
|
238.7
|
|
(346.2
|
)
|
(131.2
|
)
|
||||||
|
Exchange rate effect on cash and cash equivalents
|
21.2
|
|
(25.7
|
)
|
(39.5
|
)
|
||||||
|
Increase (decrease) in cash and cash equivalents
|
219.0
|
|
(159.7
|
)
|
73.9
|
|
||||||
|
Cash and cash equivalents at beginning of period
|
450.4
|
|
610.1
|
|
536.2
|
|
||||||
|
Cash and cash equivalents at end of period
|
$
|
669.4
|
|
$
|
450.4
|
|
$
|
610.1
|
|
|||
|
SUPPLEMENTAL CASH FLOW INFORMATION:
|
||||||||||||
|
Interest paid
|
$
|
23.3
|
|
$
|
21.8
|
|
$
|
2.7
|
|
|||
|
Income taxes paid
|
$
|
230.1
|
|
$
|
122.2
|
|
$
|
265.9
|
|
|||
See accompanying notes to consolidated financial statements.
F-7
GAMESTOP CORP.
NOTES TO CONSOLIDATED FINANCIAL STATEMENTS
|
1.
|
Nature of Operations and Summary of Significant Accounting Policies
|
The Company
GameStop Corp. (“GameStop,” “we,” “us,” “our,” or the “Company”) is a global family of specialty retail brands. Through our
6,013
video game brand stores and e-commerce sites in eight countries, we are the world's largest omnichannel retailer of video game products. We also offer mobile and consumer technology products through our
1,403
AT&T authorized retailer stores,
69
Cricket pre-paid wireless stores and
50
Simply Mac stores, a certified reseller of Apple consumer electronic products. In addition, we are a leading retailer of collectible pop-culture themed products.
We have
five
reportable segments, which are comprised of
four
geographic Video Game Brands segments—United States, Canada, Australia and Europe—and a Technology Brands segment. Our Technology Brands segment includes our Spring Mobile and Simply Mac businesses. Spring Mobile owns and operates our AT&T branded wireless retail stores and Cricket branded pre-paid wireless stores.
Our largest vendors in our Video Game Brands segments are Sony, Microsoft, Nintendo, Electronic Arts and Activision, which accounted for
24%
,
14%
,
10%
,
7%
and
6%
, respectively, of our new product purchases in fiscal year 2016;
27%
,
19%
,
11%
,
10%
and
9%
, respectively, in fiscal year
2015
; and
24%
,
17%
,
11%
,
8%
and
10%
, respectively, in fiscal year
2014
.
Basis of Presentation and Consolidation
Our consolidated financial statements include our accounts and the accounts of our wholly-owned subsidiaries. All intercompany accounts and transactions have been eliminated in consolidation. All dollar and share amounts (other than dollar amounts per share) in the consolidated financial statements are stated in millions unless otherwise indicated.
Our fiscal year is composed of the 52 or 53 weeks ending on the Saturday closest to the last day of January. Fiscal year
2016
consisted of the
52
weeks ended on
January 28, 2017
("fiscal 2016"). Fiscal year
2015
consisted of the
52
weeks ended on
January 30, 2016
("fiscal 2015"). Fiscal year
2014
consisted of the
52
weeks ended on
January 31, 2015
("fiscal 2014").
Use of Estimates
The preparation of financial statements in conformity with accounting principles generally accepted in the United States of America (“GAAP”) requires us to make estimates and assumptions that affect the reported amounts of assets and liabilities, the disclosure of contingent assets and liabilities at the date of the financial statements and the reported amounts of revenues and expenses during the reporting period. In preparing these financial statements, we have made our best estimates and judgments of certain amounts included in the financial statements, giving due consideration to materiality. Changes in the estimates and assumptions used by us could have a significant impact on our financial results. Actual results could differ from those estimates.
Cash and Cash Equivalents
We consider all short-term, highly-liquid instruments purchased with an original maturity of
three months
or less to be cash equivalents. Our cash and cash equivalents are carried at cost, which approximates market value, and consist primarily of time deposits with highly rated commercial banks. From time to time depending upon interest rates, credit worthiness and other factors, we invest in money market investment funds holding direct U.S. Treasury obligations.
Restricted Cash
We consider bank deposits serving as collateral for bank guarantees issued on behalf of our foreign subsidiaries as restricted cash, which is included in other noncurrent assets in our consolidated balance sheets. Our restricted cash was
$10.2 million
and
$9.7 million
as of
January 28, 2017
and
January 30, 2016
, respectively.
Merchandise Inventories
Our merchandise inventories are carried at the lower of cost or market generally using the average cost method. Under the average cost method, as new product is received from vendors, its current cost is added to the existing cost of product on-hand and this amount is re-averaged over the cumulative units. Pre-owned video game products traded in by customers are recorded as inventory at the amount of the store credit given to the customer. We are required to make adjustments to inventory to reflect potential obsolescence or over-valuation as a result of cost exceeding market. In valuing inventory, we consider quantities on hand, recent sales, potential price protections, returns to vendors and other factors.
Our ability to assess these factors is dependent upon our ability to forecast customer demand and to provide a well-balanced merchandise assortment. Inventory is adjusted based on anticipated physical inventory losses or shrinkage and actual losses resulting from periodic physical inventory counts. Inventory reserves as of
January 28, 2017
and
January 30, 2016
were
$59.0 million
and
$61.5 million
, respectively.
F-8
Property and Equipment
Property and equipment are carried at cost less accumulated depreciation and amortization. Depreciation on furniture, fixtures and equipment is computed using the straight-line method over their estimated useful lives ranging from
two
to
ten
years. Maintenance and repairs are expensed as incurred, while betterments and major remodeling costs are capitalized. Leasehold improvements are capitalized and amortized over the shorter of their estimated useful lives or the terms of the respective leases, including option periods in which the exercise of the option is reasonably assured (generally ranging from
three
to
ten
years). Costs incurred in purchasing management information systems are capitalized and included in property and equipment. These costs are amortized over their estimated useful lives from the date the technology becomes operational. Our total depreciation expense was
$151.7 million
,
$144.9 million
and
$144.5 million
for fiscal
2016
,
2015
and
2014
, respectively.
We periodically review our property and equipment when events or changes in circumstances indicate that its carrying amounts may not be recoverable or its depreciation or amortization periods should be accelerated. We assess recoverability based on several factors, including our intention with respect to our stores and those stores’ projected undiscounted cash flows. An impairment loss is recognized for the amount by which the carrying amount of the assets exceeds its fair value, determined based on an estimate of discounted future cash flows. We recorded impairment losses of
$19.4 million
,
$4.4 million
and
$1.9 million
in fiscal
2016
,
2015
and
2014
, respectively. See Note 2, "Asset Impairments," for further information regarding our asset impairment charges.
Business Combinations
Business combinations are accounted for under the acquisition method of accounting. Under this method, the assets acquired and liabilities assumed are recognized at their respective fair values as of the date of acquisition. The excess, if any, of the acquisition price over the fair values of the assets acquired and liabilities assumed is recorded as goodwill. For significant acquisitions, we utilize third-party appraisal firms to assist us in determining the fair values for certain assets acquired and liabilities assumed. Adjustments to the fair values of assets acquired and liabilities assumed are made until we obtain all relevant information regarding the facts and circumstances that existed as of the acquisition date, not to exceed one year from the date of the acquisition (the "measurement period"). Upon the conclusion of the measurement period, any subsequent adjustments are recorded to earnings. Costs associated with business acquisitions are expensed as incurred. Over the past several years, we have acquired certain AT&T authorized retailers and in 2015, we acquired Geeknet, Inc. an online and wholesale retailer of collectibles and other products. See Note 3, "Acquisitions and Divestitures" for additional information.
Goodwill and Intangible Assets
Goodwill represents the excess purchase price over tangible net assets and identifiable intangible assets acquired. Intangible assets are recorded apart from goodwill if they arise from a contractual right and are capable of being separated from the entity and sold, transferred, licensed, rented or exchanged individually. We are required to evaluate goodwill and other intangible assets not subject to amortization for impairment at least annually. This annual test is completed at the beginning of the fourth quarter of each fiscal year or when circumstances indicate the carrying value of the goodwill or other intangible assets might be impaired. Goodwill has been assigned to reporting units for the purpose of impairment testing. We have
five
operating segments, including Video Game Brands in the United States, Australia, Canada and Europe, and Technology Brands in the United States, which also define our reporting units based upon the similar economic characteristics of operations within each segment, including the nature of products, product distribution and the type of customer and separate management within these businesses.
We use a two-step process to test our goodwill for impairment. Step 1 consists of comparing the estimated fair value of the reporting unit to its carrying value, including goodwill. The estimated fair value of our reporting units is determined based on its discounted cash flows. If the carrying value of the reporting unit is higher than its estimated fair value, then the second step of the goodwill impairment test is needed. The second step compares the implied fair value of the reporting unit’s goodwill with its carrying amount. The implied fair value of goodwill is determined in Step 2 of the goodwill impairment test by valuing all of the tangible and intangible assets and liabilities of the reporting unit in a manner similar to the acquisition method of accounting used in a business combination. If the carrying amount of the reporting unit’s goodwill exceeds the implied fair value of its goodwill, then an impairment loss is recognized in the amount of the excess.
No
goodwill impairment charges were recognized in fiscal
2016
,
2015
and
2014
.
Our indefinite-lived intangible assets consist of dealer agreements and trade names. Intangible assets that are determined to have an indefinite life are not amortized, but are required to be evaluated at least annually for impairment. If the carrying value of an individual indefinite-lived intangible asset exceeds its fair value, such individual indefinite-lived intangible asset is impaired by the amount of the excess. The fair value of our dealer agreements are estimated using a discounted cash flow analysis known as the Greenfield Method, which assumes that a business, at its inception, owns only dealer agreements and must make capital expenditure, working capital and other investments to ramp up its operations to a level that is comparable to its current operations. The fair value of our trade names are estimated by using a relief-from-royalty approach, which assumes the value of the trade name is the discounted cash flows of the amount that would be paid by a hypothetical market participant had they not owned the trade name and instead licensed the trade name from another company. As a result of our fiscal 2016 annual impairment testing, we recognized impairment charges totaling
$14.4 million
associated with our trade names and dealer agreements. See Note 6, "Goodwill and Intangible Assets" for additional information. No impairment charges associated with our indefinite-lived intangible assets were recognized in fiscal 2015 and 2014.
F-9
Our definite-lived intangible assets consist primarily of customer relationships, leasehold rights, advertising relationships and amounts attributed to favorable leasehold interests recorded as a result of business acquisitions. The estimated useful life and amortization methodology of intangible assets are determined based on the period in which they are expected to contribute directly to cash flows. Intangible assets that are determined to have a definite life are amortized over that period.
Revenue Recognition
We recognize revenue when the sales price is fixed or determinable, collection is reasonably assured and the customer takes possession of the merchandise, or in the case of commissions, when the commission-generating activity has been performed. Revenues do not include sales taxes or other taxes collected from customers.
Revenue from the sales of our products is recognized at the time of sale, net of sales discounts and net of an estimated sales return reserve, based on historical return rates, with a corresponding reduction in cost of sales. Our sales return policy is generally limited to 30 days or less and as such our sales returns are, and historically have been, immaterial.
The sales of pre-owned video game products are recorded at the retail price charged to the customer. Advertising revenues for
Game Informer
are recorded upon release of magazines for sale to consumers. Subscription revenues for our PowerUp Rewards loyalty program and magazines are recognized on a straight-line basis over the subscription period. Revenue from the sales of product replacement plans is recognized on a straight-line basis over the coverage period. Customer liabilities and other deferred revenues for our PowerUp Rewards loyalty program, gift cards, customer credits, magazines and product replacement plans are included in accrued liabilities (see Note 8, "Accrued Liabilities").
We also sell a variety of digital products which generally allow consumers to download software or play games on the internet. Certain of these products do not require us to purchase inventory or take physical possession of, or take title to, inventory. When purchasing these products from us, consumers pay a retail price and we earn a commission based on a percentage of the retail sale as negotiated with the product publisher. We recognize these commissions as revenue at the time of sale of these digital products.
Our Spring Mobile business earns commission revenue as an AT&T authorized retailer related to the activation of new wireless customers, the activation of enhanced or upgraded features on existing wireless customer plans and certain other commission incentive opportunities that may be offered to us by AT&T. We have determined that we are not deemed the obligor on the underlying wireless services contracts that give rise to this commission revenue; therefore, commission revenue is recognized at the point at which the commission-generating activity has been performed, which is generally driven by customer activation. Commissions are recognized net of an allowance for chargebacks from AT&T for estimated customer cancellations, which is periodically assessed and adjusted to reflect historical cancellation experience.
In May 2014, the Financial Accounting Standards Board issued a comprehensive update to current revenue accounting standards; see "—Recent Accounting Pronouncements" for additional information.
Customer Liabilities
We establish a liability upon the issuance of merchandise credits and the sale of gift cards. Revenue is subsequently recognized when the credits and gift cards are redeemed. In addition, breakage is recognized quarterly on unused customer liabilities older than two years to the extent that our management believes the likelihood of redemption by the customer is remote, based on historical redemption patterns. To the extent that future redemption patterns differ from those historically experienced, there will be variations in the recorded breakage. Breakage is recorded in cost of sales in our consolidated statements of operations.
Vendor Arrangements
We and most of our largest vendors participate in cooperative advertising programs and other vendor marketing programs in which the vendors provide us with cash consideration in exchange for marketing and advertising the vendors’ products. Our accounting for cooperative advertising arrangements and other vendor marketing programs results in a significant portion of the consideration received from our vendors reducing the product costs in inventory rather than as an offset to our marketing and advertising costs. The consideration serving as a reduction in inventory is recognized in cost of sales as inventory is sold. The amount of vendor allowances to be recorded as a reduction of inventory is determined based on the nature of the consideration received and the merchandise inventory to which the consideration relates. We apply a sell-through rate to determine the timing in which the consideration should be recognized in cost of sales. Consideration received that relates to video game products that have not yet been released to the public is deferred as a reduction of inventory.
F-10
The cooperative advertising programs and other vendor marketing programs generally cover a period from a few days up to a few weeks and include items such as product catalog advertising, in-store display promotions, internet advertising, co-op print advertising and other programs. The allowance for each event is negotiated with the vendor and requires specific performance by us to be earned. Vendor allowances of
$184.3 million
,
$208.2 million
and
$202.4 million
were recorded as a reduction of cost of sales for fiscal
2016
,
2015
and
2014
, respectively.
Loyalty Expenses
Our PowerUp Rewards loyalty program allows enrolled members to earn points on purchases that can be redeemed for rewards that include discounts or merchandise. We estimate the net cost of the rewards that will be issued and redeemed and record this cost and the associated balance sheet liability as points are accumulated by loyalty program members. The two primary estimates utilized to record the balance sheet liability for loyalty points earned by members are the estimated redemption rate and the estimated weighted-average cost per point redeemed. We use historical redemption rates experienced under the loyalty program as a basis to estimate the ultimate redemption rate of points earned. The estimated weighted-average cost per point redeemed, used to estimate future redemption costs, is based on our most recent actual costs incurred to fulfill points that have been redeemed by our loyalty program members and is adjusted for recent changes in redemption costs, including the mix of rewards redeemed. We continually evaluate our methodology and assumptions based on developments in redemption patterns, cost per point redeemed and other factors. Changes in the ultimate redemption rate and weighted-average cost per point redeemed have the effect of either increasing or decreasing the liability through the current period provision by an amount estimated to cover the cost of all points previously earned but not yet redeemed by loyalty program members as of the end of the reporting period.
The cost of free or discounted product is recognized in cost of sales and the associated liability is included in accrued liabilities. The reserve is released when loyalty program members redeem their respective points and the corresponding rewards are recorded to cost of goods sold in the period of redemption. The cost of administering the loyalty program, including program administration fees, program communications and cost of loyalty cards, is recognized in selling, general and administrative expenses.
Cost of Sales and Selling, General and Administrative Expenses Classification
The classification of cost of sales and selling, general and administrative expenses varies across the retail industry. We include purchasing, receiving and distribution costs in selling, general and administrative expenses in the consolidated statements of operations. We include processing fees associated with purchases made by check and credit cards in cost of sales in the consolidated statements of operations.
Advertising Expenses
We expense advertising costs for television, newspapers and other media when the advertising takes place. Advertising expenses for fiscal
2016
,
2015
and
2014
totaled
$76.6 million
,
$66.6 million
and
$64.1 million
, respectively.
Income Taxes
Income tax expense includes federal, state, local and international income taxes. Income taxes are accounted for utilizing an asset and liability approach and deferred tax assets and liabilities are recognized for the tax consequences of temporary differences between the financial reporting basis and the tax basis of existing assets and liabilities using enacted tax rates. Deferred tax assets and liabilities are measured using the enacted tax rates expected to apply to taxable income in the years in which those temporary differences are expected to be recovered or settled. The effect on deferred tax assets and liabilities of a change in tax rates is recognized in the period that includes the enactment date. Valuation allowances are recorded to reduce deferred tax assets to the amount that will more likely than not be realized. We maintain liabilities for uncertain tax positions until examination of the tax year is completed by the applicable taxing authority, available review periods expire or additional facts and circumstances cause us to change our assessment of the appropriate accrual amount. See Note 7, "Income Taxes," for additional information.
We plan on permanently reinvesting our undistributed foreign earnings outside the United States. Where foreign earnings are permanently reinvested, no provision for federal income or foreign withholding taxes is made. Should we have undistributed foreign earnings that are not permanently reinvested, United States income tax expense and foreign withholding taxes will be provided for at the time the earnings are generated.
F-11
Leases
We lease retail stores, warehouse facilities, office space and equipment. These assets and properties are generally leased under noncancelable agreements that expire at various dates through
2033
with various renewal options for additional periods. The agreements, which are classified as operating leases, generally provide for minimum and, in some cases, percentage rentals and require us to pay all insurance, taxes and other maintenance costs. Leases with step rent provisions, escalation clauses or other lease concessions are accounted for on a straight-line basis over the lease term, which includes renewal option periods when we are reasonably assured of exercising the renewal options and includes “rent holidays” (periods in which we are not obligated to pay rent). Cash or lease incentives received upon entering into certain store leases (“tenant improvement allowances”) are recognized on a straight-line basis as a reduction to rent expense over the lease term, which includes renewal option periods when we are reasonably assured of exercising the renewal options. We record the unamortized portion of tenant improvement allowances as a part of deferred rent. We do not have leases with capital improvement funding. Percentage rentals are based on sales performance in excess of specified minimums at various stores and are accounted for in the period in which the amount of percentage rentals can be accurately estimated.
Foreign Currency
Generally, we have determined that the functional currencies of our foreign subsidiaries are the subsidiaries’ local currencies. The assets and liabilities of the subsidiaries are translated at the applicable exchange rate as of the end of the balance sheet date and revenue and expenses are translated at an average rate over the period. Currency translation adjustments are recorded as a component of other comprehensive income.
Net gains (losses) from foreign currency transactions and derivatives are included in selling, general and administrative expenses and were
$4.5 million
,
$1.6 million
and
$2.5 million
in fiscal
2016
,
2015
and
2014
, respectively. The foreign currency transaction gains and losses are primarily due to the decrease or increase in the value of the U.S. dollar compared to the functional currencies of the countries in which we operate internationally.
We use forward exchange contracts, foreign currency options and cross-currency swaps (together, the “foreign currency contracts”) to manage currency risk primarily related to foreign-currency denominated intercompany assets and liabilities and certain other foreign currency assets and liabilities. These foreign currency contracts are not designated as hedges and, therefore, changes in the fair values of these derivatives are recognized in earnings, thereby offsetting the current earnings effect of the re-measurement of related intercompany loans and foreign currency assets and liabilities. See Note 4, "Fair Value Measurements and Financial Instruments," for additional information regarding our foreign currency contracts.
Recently Adopted Accounting Pronouncements
In April 2015, the Financial Accounting Standards Board ("FASB") issued Accounting Standard Update ("ASU") 2015-03, Simplifying the Presentation of Debt Issuance Costs. This standard requires that debt issuance costs related to a recognized debt liability be presented in the balance sheet as a direct deduction from the carrying amount of that debt liability, consistent with debt discounts. ASU 2015-03 became effective for interim and annual reporting periods beginning after December 15, 2015. We adopted this guidance as of January 31, 2016, and as a result have recast the January 30, 2016 consolidated balance sheet and information disclosed in Note 9 and Note 16 to conform to the current period presentation. The adoption of this standard reduced previously presented prepaid expenses and other current assets by
$1.3 million
, other noncurrent assets by
$3.3 million
and long-term debt by
$4.6 million
, for the period ended January 30, 2016 based upon the balance of unamortized debt financing costs relating to our senior notes due in 2019.
Recent Accounting Pronouncements
In January 2017, the FASB issued ASU 2017-04, Intangibles—Goodwill and Other, Simplifying the Test for Goodwill Impairment. The update simplifies how an entity is required to test goodwill for impairment by eliminating Step 2 from the goodwill impairment test. Step 2 measures a goodwill impairment loss by comparing the implied fair value of a reporting unit’s goodwill and the carrying amount. Instead, entities will record an impairment charge based on the excess of a reporting unit's carrying amount over its estimated fair value. The updated standard is effective for fiscal years beginning after December 15, 2019, including interim periods within those years, with early adoption permitted. We intend to early adopt this standard in the first quarter of fiscal year 2017 and do not anticipate that it will have a material impact to our consolidated financial statements.
In August 2016, the FASB issued ASU 2016-15, Statement of Cash Flows, Classification of Certain Cash Receipts and Cash Payments, which provides guidance on eight specific cash flow issues in regard to how cash receipts and cash payments are presented and classified in the statement of cash flows. The updated standard is effective for fiscal years beginning after December 15, 2017, including interim periods within those years, with early adoption permitted. The amendments in the ASU should be adopted on a retrospective basis unless it is impracticable to apply, in which case the amendments should be applied prospectively as of the earliest date practicable. We are currently evaluating the impact that this standard will have on our consolidated financial statements and disclosures.
F-12
In March 2016, the FASB issued ASU 2016-09, Improvements to Employee Share-Based Payment Accounting. The update simplifies several aspects of accounting for employee share-based payment transactions for both public and nonpublic entities, including the accounting for income taxes, forfeitures, and statutory tax withholding requirements, as well as classification in the statement of cash flows. The updated standard is effective for fiscal years beginning after December 15, 2016, including interim periods within those years. We do not anticipate that adoption of this standard will have a material impact to our consolidated financial statements.
In May 2014, the FASB issued Accounting Standards Update 2014-09, Revenue from Contracts with Customers, which sets forth a new five-step revenue recognition model that replaces the prior revenue recognition guidance in its entirety. The underlying principle of the new standard is that an entity will recognize revenue to depict the transfer of promised goods or services to customers in an amount that reflects what it expects in exchange for the goods or services. The updated standard also required additional disclosures on the nature, timing, and uncertainty of revenue and related cash flows. The following subsequent ASUs either clarified or revised guidance set forth in ASU 2014-09:
|
•
|
In August 2015, the FASB issued ASU 2015-14, Revenue from Contracts with Customers: Deferral of the Effective Date, which delays the effective date of ASU 2014-09 by one year, with the option to adopt the standard as of the original effective date.
|
|
•
|
In March 2016, the FASB issued ASU 2016-08, Revenue from Contracts with Customers, which clarifies how an entity should identify the unit of accounting (i.e. the specified good or service) for the principal versus agent evaluation and how it should apply the control principle to certain types of arrangements.
|
The updated revenue recognition standards are effective for annual reporting periods beginning on or after December 15, 2017, with the option to early adopt for annual periods beginning after December 15, 2016. Entities may use either a full retrospective or modified retrospective transition approach in applying these ASUs. We currently anticipate adopting these standards in the first quarter of fiscal 2018 and applying the modified retrospective approach. We anticipate that the standards will affect the way that we recognize liabilities associated with our loyalty program, customer incentives and gift cards. We continue to evaluate the impact that this standard will have on our consolidated financial statements and footnote disclosures.
In March 2016, the FASB issued ASU 2016-04, Recognition of Breakage for Certain Prepaid Stored-Value Products. The standard specifies how prepaid stored-value product liabilities should be derecognized, thereby eliminating the current and potential future diversity in practice. Consistent with ASU 2014-09 related to revenue recognition, the standard requires derecognition in proportion with the rights expected to be exercised by the holder. Entities may adopt this standard using either a modified retrospective transition approach with a cumulative-effect adjustment to retained earnings or a full retrospective transition approach. The ASU is effective for fiscal years, and interim periods within those years, beginning after December 15, 2017, with early adoption permitted. We do not anticipate that adoption of this standard will have a material impact to our consolidated financial statements.
In February 2016, the FASB issued ASU 2016-02, Leases. The standard requires a lessee to recognize a liability related to lease payments and an offsetting right-of-use asset representing a right to use the underlying asset for the lease term on the balance sheet. Entities are required to use a modified retrospective transition approach for leases that exist or are entered into after the beginning of the earliest comparative period presented in the financial statements, with certain reliefs available. The ASU is effective for fiscal years, and interim periods within those years, beginning after December 15, 2018, with early adoption permitted. We are currently evaluating the overall impact to our consolidated financial statements, though we expect the adoption to result in a material increase in the assets and liabilities reflected in our consolidated balance sheets.
F-13
|
2.
|
Asset Impairments
|
Fiscal
2016
We recognized impairment charges of
$33.8 million
in fiscal 2016 related to our evaluation of store property, equipment and other assets as well as certain intangible assets in situations where the asset’s carrying value was not expected to be recovered by its future cash flows over its remaining useful life.
A summary of our asset impairment charges, by reportable segment, for fiscal
2016
is as follows (in millions):
|
United States
|
Canada
|
Europe
|
Technology Brands
|
Total
|
||||||||||||||||
|
Impairments of intangible assets
|
$
|
—
|
|
$
|
—
|
|
$
|
7.4
|
|
$
|
7.0
|
|
$
|
14.4
|
|
|||||
|
Impairments of property, equipment and other assets - store impairments
|
0.3
|
|
0.2
|
|
2.3
|
|
16.6
|
|
19.4
|
|
||||||||||
|
Total
|
$
|
0.3
|
|
$
|
0.2
|
|
$
|
9.7
|
|
$
|
23.6
|
|
$
|
33.8
|
|
|||||
There were
no
asset impairment charges in our Australia Video Game Brands segment during fiscal
2016
.
Fiscal
2015
We recognized impairment charges of
$4.6 million
in fiscal 2015 related to our evaluation of store property, equipment and other assets as well as certain intangible assets in situations where the asset’s carrying value was not expected to be recovered by its future cash flows over its remaining useful life.
A summary of our asset impairment charges, by reportable segment, for fiscal
2015
is as follows (in millions):
|
United States
|
Europe
|
Technology Brands
|
Total
|
|||||||||||||
|
Impairments of intangible assets
|
$
|
—
|
|
$
|
0.2
|
|
$
|
—
|
|
$
|
0.2
|
|
||||
|
Impairments of property, equipment and other assets - store impairments
|
2.8
|
|
0.6
|
|
1.0
|
|
4.4
|
|
||||||||
|
Total
|
$
|
2.8
|
|
$
|
0.8
|
|
$
|
1.0
|
|
$
|
4.6
|
|
||||
There were
no
asset impairment charges in our Canada or Australia Video Game Brands segments during fiscal
2015
.
Fiscal
2014
We recognized impairment charges of
$2.2 million
in fiscal 2014 related to our evaluation of intangible assets and store property, equipment and other assets in situations where the asset’s carrying value was not expected to be recovered by its future cash flows over its remaining useful life.
A summary of our asset impairment charges, by reportable segment, for fiscal
2014
is as follows (in millions):
|
United States
|
Canada
|
Europe
|
Total
|
|||||||||||||
|
Impairments of intangible assets
|
$
|
—
|
|
$
|
—
|
|
$
|
0.3
|
|
$
|
0.3
|
|
||||
|
Impairments of property, equipment and other assets - store impairments
|
0.6
|
|
0.4
|
|
0.9
|
|
1.9
|
|
||||||||
|
Total
|
$
|
0.6
|
|
$
|
0.4
|
|
$
|
1.2
|
|
$
|
2.2
|
|
||||
There were
no
asset impairment charges in our Australia Video Game Brands or Technology Brands segments during fiscal
2014
.
F-14
|
3.
|
Acquisitions and Divestitures
|
Fiscal 2016
Acquisition of Cellular World & Red Skye Wireless
On August 2, 2016, in connection with the continued expansion of our Technology Brands segment, Spring Mobile completed the acquisition of certain assets comprised of
436
stores from two authorized AT&T retailers, Cellular World and Red Skye Wireless. The purchase price consisted of
$393.3 million
in cash (net of
$0.1 million
of cash acquired), which includes the effect of working capital adjustments, and future contingent consideration that we estimate will range from
$40.0 million
to
$50.0 million
. The cash portion of the purchase price was funded with proceeds from our $475.0 million unsecured senior notes due in March 2021 combined with a draw on our revolving credit facility.
The contingent consideration includes two potential payments: (i) a
$20.0 million
payment contingent on the relocation of certain acquired stores to be completed by Cellular World, due the latter of August 2017 or when relocations are completed and (ii) an earn-out payment due in March 2018, contingent on the sales performance of certain acquired stores during calendar year 2017. We estimate that the second payment will range from
$20.0 million
to
$30.0 million
. We recognized an acquisition-date liability of
$43.2 million
representing the total estimated fair value of the contingent consideration; see Note 4, "Fair Value Measurements and Financial Instruments," for additional information.
The estimated purchase price of the acquisition totaled
$436.5 million
, which includes the cash payment of
$393.3 million
plus the fair value of the contingent consideration of
$43.2 million
. The following table summarizes the estimated fair values of the assets acquired and liabilities assumed as of the acquisition date (in millions):
|
Assets acquired
|
|||
|
Merchandise inventories
|
$
|
13.1
|
|
|
Prepaid expenses and other current assets
|
0.2
|
|
|
|
Property and equipment
|
23.9
|
|
|
|
Goodwill
|
239.1
|
|
|
|
Other intangible asset — dealer agreements
|
163.0
|
|
|
|
Other noncurrent assets
|
6.9
|
|
|
|
Total assets acquired
|
446.2
|
|
|
|
Liabilities assumed
|
|||
|
Accounts payable
|
9.5
|
|
|
|
Accrued liabilities
|
0.2
|
|
|
|
Total liabilities assumed
|
9.7
|
|
|
|
Total estimated purchase price
|
$
|
436.5
|
|
The goodwill recognized reflects the acquired assembled workforce and Spring Mobile's entrance into new domestic regional markets.
The goodwill recognized is assigned to the Technology Brands segment and is deductible for tax purposes. The intangible asset recognized for dealer agreements represents the value associated with the exclusive agreements with AT&T to operate the acquired stores. The intangible asset for dealer agreements is indefinite lived and not subject to amortization, but is subject to annual impairment testing.
Subsequent to the acquisition date, the stores acquired from Cellular World and Red Skye Wireless contributed
$136.6 million
in net sales in fiscal 2016. Pro forma information cannot be presented due to the impracticability of obtaining separately identifiable historical financial data for the acquired stores.
Acquisition of Midwest Cellular
On May 31, 2016, in connection with the continued expansion of our Technology Brands segment, Spring Mobile completed the acquisition of certain assets of an AT&T authorized retailer, Midwest Cellular, comprised of
71
stores for cash consideration of
$47.0 million
. The acquisition was funded with proceeds from our
$475.0 million
unsecured senior notes due in March 2021. We recorded
$42.7 million
of indefinite-lived intangible assets related to this acquisition. The pro forma effect of this acquisition is not material to our consolidated financial statements.
F-15
Fiscal 2015
Acquisition of Geeknet, Inc.
On July 17, 2015, we purchased Geeknet, Inc. ("Geeknet") an online and wholesale retailer that sells collectibles, apparel, gadgets, electronics, toys and other retail products for technology enthusiasts and general consumers under the name ThinkGeek through the www.thinkgeek.com website and certain exclusive products to wholesale channel customers. The addition of Geeknet provides an expansion of our global omnichannel platform and enables us to broaden our product offering in the collectibles category and deepen relationships with our existing customer base.
Total consideration was
$126.0 million
, net of
$13.9 million
of cash acquired. The following table summarizes the estimated fair values of the assets acquired and liabilities assumed as of the acquisition date (in millions):
|
Assets acquired
|
||||
|
Receivables
|
$
|
6.9
|
|
|
|
Merchandise inventories
|
25.6
|
|
||
|
Prepaid expenses and other current assets
|
12.5
|
|
||
|
Property and equipment
|
0.9
|
|
||
|
Deferred income taxes
|
2.8
|
|
||
|
Other non-current assets
|
0.1
|
|
||
|
Goodwill
|
52.2
|
|
||
|
Other intangible assets
|
33.4
|
|
||
|
Total assets acquired
|
134.4
|
|
||
|
Liabilities assumed
|
||||
|
Accounts payable
|
3.6
|
|
||
|
Accrued liabilities
|
17.3
|
|
||
|
Deferred income taxes
|
(12.6
|
)
|
||
|
Other long-term liabilities
|
0.1
|
|
||
|
Total liabilities assumed
|
8.4
|
|
||
|
Total purchase price
|
$
|
126.0
|
|
|
The goodwill of
$52.2 million
resulting from the acquisition is not deductible for tax purposes and
represents the value we paid for the knowledge and expertise of, and established presence in, the collectibles market
. The operating results of Geeknet have been included in our consolidated financial statements beginning on the closing date of July 17, 2015 and are reported in our United States Video Game Brands segment. The pro forma effect assuming this acquisition was made at the beginning of the earliest period presented herein is not material to our consolidated financial statements.
Acquisitions in Technology Brands
In fiscal 2015, in connection with the continued expansion of our Technology Brands segment, Spring Mobile completed acquisitions of certain AT&T authorized retailers and Simply Mac completed an acquisition of an authorized Apple retailer for a total combined consideration of
$141.5 million
(net of cash acquired). We recorded
$46.3 million
of goodwill and
$76.6 million
of other intangible assets related to these acquisitions. The operating results of these acquisitions are included in our consolidated financial statements beginning on the respective closing dates of each acquisition and are reported in our Technology Brands segment. The pro forma effect assuming these acquisitions were made at the beginning of the earliest period presented herein is not material to our consolidated financial statements.
Fiscal 2014
Acquisitions in Technology Brands
In fiscal 2014, in connection with the continued expansion of our Technology Brands business, Spring Mobile completed acquisitions of certain AT&T authorized retailers and Simply Mac completed acquisitions of certain authorized Apple retailers for total consideration of
$93.3 million
(
$89.7 million
net of cash acquired). We recorded indefinite-lived intangible assets of
$76.8 million
and goodwill of
$4.5 million
related to these acquisitions. The operating results of these acquisitions are included in our consolidated financial statements beginning on the respective closing dates of each acquisition and are reported in our Technology Brands segment. The pro forma effect assuming these acquisitions were made at the beginning of each fiscal year presented herein is not material to our consolidated financial statements.
F-16
Divestiture of GameStope Iberia
In October 2014, we entered into a sale and purchase agreement to transfer certain retail locations and most of the inventory owned by our Spain subsidiary, GameStop Iberia, to a local video game specialty retailer. We made the decision to exit these operations, which were part of our Europe segment, due to continued operating losses and limited market share. These operations were considered immaterial for discontinued operations accounting treatment.
As a result of the divestiture, we recorded a pre-tax loss in continuing operations of
$14.8 million
during fiscal 2014, primarily related to inventory write-downs, involuntary termination benefits and lease obligations, of which
$7.1 million
was recorded in cost of sales and
$7.7 million
was recorded in selling, general and administrative expenses in our consolidated statements of operations. As of November 1, 2014, we had transferred or otherwise ceased daily operations in all of our stores in Spain.
|
4.
|
Fair Value Measurements and Financial Instruments
|
Fair value is defined as the price that would be received from selling an asset or paid to transfer a liability in an orderly transaction between market participants at the measurement date. Applicable accounting standards require disclosures that categorize assets and liabilities measured at fair value into one of three different levels depending on the observability of the inputs employed in the measurement. Level 1 inputs are quoted prices in active markets for identical assets or liabilities. Level 2 inputs are observable inputs other than quoted prices included within Level 1 for the asset or liability, either directly or indirectly through market-corroborated inputs. Level 3 inputs are unobservable inputs for the asset or liability reflecting our assumptions about pricing by market participants.
Assets and Liabilities that are Measured at Fair Value on a Recurring Basis
Assets and liabilities that are measured at fair value on a recurring basis include our foreign currency contracts, life insurance policies we own that have a cash surrender value, contingent consideration payable associated with acquisitions, and certain nonqualified deferred compensation liabilities.
We value our foreign currency contracts, our life insurance policies with cash surrender values and certain nonqualified deferred compensation liabilities based on Level 2 inputs using quotations provided by major market news services, such as
Bloomberg
, and industry-standard models that consider various assumptions, including quoted forward prices, time value, volatility factors, and contractual prices for the underlying instruments, as well as other relevant economic measures, all of which are observable in active markets. When appropriate, valuations are adjusted to reflect credit considerations, generally based on available market evidence.
In connection with our acquisition of certain assets from Cellular World and Red Skye Wireless, we recognized an acquisition-date liability of
$43.2 million
representing the total estimated fair value of the contingent consideration (see Note 3, "Acquisitions and Divestitures"). The fair value was estimated based on Level 3 inputs which include future sales projections derived from our historical experience with comparable acquired stores and a discount rate commensurate with the risks and inherent uncertainty in the business. There was
no
material change in the fair value of the contingent consideration from the date of acquisition through January 28, 2017.
The following table provides the fair value of our assets and liabilities measured on a recurring basis and recorded on our consolidated balance sheets (in millions):
|
January 28, 2017
|
January 30, 2016
|
|||||||||||||||
|
Level 2
|
Level 3
|
Level 2
|
Level 3
|
|||||||||||||
|
Assets:
|
||||||||||||||||
|
Foreign currency contracts
|
||||||||||||||||
|
Other current assets
|
$
|
13.3
|
|
$
|
—
|
|
$
|
40.6
|
|
$
|
—
|
|
||||
|
Other noncurrent assets
|
0.1
|
|
—
|
|
0.1
|
|
—
|
|
||||||||
|
Company-owned life insurance
(1)
|
12.4
|
|
—
|
|
10.1
|
|
—
|
|
||||||||
|
Total assets
|
$
|
25.8
|
|
$
|
—
|
|
$
|
50.8
|
|
$
|
—
|
|
||||
|
Liabilities:
|
||||||||||||||||
|
Foreign currency contracts
|
||||||||||||||||
|
Accrued liabilities
|
$
|
4.3
|
|
$
|
—
|
|
$
|
32.3
|
|
$
|
—
|
|
||||
|
Other long-term liabilities
|
0.1
|
|
—
|
|
0.5
|
|
—
|
|
||||||||
|
Nonqualified deferred compensation
(2)
|
1.0
|
|
—
|
|
1.1
|
|
—
|
|
||||||||
|
Contingent consideration
(3)
|
—
|
|
43.2
|
|
—
|
|
—
|
|
||||||||
|
Total liabilities
|
$
|
5.4
|
|
$
|
43.2
|
|
$
|
33.9
|
|
$
|
—
|
|
||||
F-17
___________________
(1) Recognized in other non-current assets in our consolidated balance sheets.
(2) Recognized in accrued liabilities in our consolidated balance sheets.
|
(3)
|
Current portion of
$20.0 million
recognized in accrued liabilities and noncurrent portion of
$23.2 million
recognized in other long-term liabilities in our consolidated balance sheet.
|
We use forward exchange contracts, foreign currency options and cross-currency swaps (together, the “foreign currency contracts”) to manage currency
ri
sk primarily related to intercompany loans denominated in non-functional currencies and certain foreign currency assets and liabilities. These foreign currency contracts are not designated as hedges and, therefore, changes in the fair values of these derivatives are recognized in earnings, thereby offsetting the current earnings effect of the re-measurement of related intercompany loans and foreign currency assets and liabilities. The total gross notional value of derivatives related to our foreign currency contracts was
$586.0 million
and
$925.3 million
as of
January 28, 2017
and
January 30, 2016
, respectively.
Activity related to the trading of derivative instruments and the offsetting impact of related intercompany and foreign currency assets and liabilities recognized in selling, general and administrative expense is as follows (in millions):
|
Fiscal Year
|
||||||||||||
|
2016
|
2015
|
2014
|
||||||||||
|
Gains (losses) on the changes in fair value of derivative instruments
|
$
|
20.0
|
|
$
|
(5.2
|
)
|
$
|
28.9
|
|
|||
|
Gains (losses) on the re-measurement of related intercompany loans and foreign currency assets and liabilities
|
(15.5
|
)
|
6.8
|
|
(26.4
|
)
|
||||||
|
Total
|
$
|
4.5
|
|
$
|
1.6
|
|
$
|
2.5
|
|
|||
We do not use derivative financial instruments for trading or speculative purposes. We are exposed to counterparty credit risk on all of our derivative financial instruments and cash equivalent investments. We manage counterparty risk according to the guidelines and controls established under comprehensive risk management and investment policies. We continuously monitor our counterparty credit risk and utilize a number of different counterparties to minimize our exposure to potential defaults. We do not require collateral under derivative or investment agreements.
Assets that are Measured at Fair Value on a Nonrecurring Basis
Assets that are measured at fair value on a nonrecurring basis relate primarily to property and equipment, goodwill and other intangible assets, which are remeasured when the estimated fair value is below its carrying value. For these assets, we do not periodically adjust carrying value to fair value; rather, when we determine that impairment has occurred, the carrying value of the asset is reduced to its fair value.
In fiscal 2016, we recognized impairment charges associated with our Simply Mac dealer agreements and Micromania trade name of
$7.0 million
and
$7.4 million
, respectively, to reflect their estimated fair values of
$11.0 million
and
$35.0 million
, respectively. Also, in fiscal 2016, we recognized impairment charges associated with store property and equipment totaling
$19.4 million
to reflect its estimated fair value of
zero
. In fiscal 2015, we recognized impairment charges associated with store property and equipment and other intangible assets of
$4.4 million
and
$0.2 million
, respectively, to reflect their estimated fair values of
zero
.
The fair value measurements included in the goodwill, trade name and property and equipment impairment tests are primarily based on significant unobservable inputs (Level 3) developed using company-specific information. These assets were valued using variations of the discounted cash flow method, which require assumptions associated with, among others, revenue and cost estimates, discount rates, terminal values, royalty rates, and remaining useful lives. See Note 1, "Nature of Operations and Summary of Significant Accounting Policies," for further information related to our valuation methods.
Other Fair Value Disclosures
The carrying values of our cash equivalents, receivables, net, accounts payable and notes payable approximate the fair value due to their short-term maturities.
As of January 28, 2017, our unsecured
5.50%
senior notes due in 2019 had a carrying value of
$346.6 million
and a fair value of
$358.7 million
, and our unsecured 6.75% senior notes due in 2021 had a net carrying value of
$468.4 million
and a fair value of
$487.4 million
. The fair values of our senior notes were determined based on quoted market prices obtained through an external pricing source which derives its price valuations from daily marketplace transactions, with adjustments to reflect the spreads of benchmark bonds, credit risk and certain other variables. We have determined this to be a Level 2 measurement as all significant inputs into the quote provided by our pricing source are observable in active markets.
F-18
|
5.
|
Receivables, Net
|
Receivables consist primarily of bankcard receivables and other receivables. Other receivables include receivables from vendors, primarily related to commissions receivable associated with our Technology Brands businesses,
Game Informer
magazine advertising customers, receivables from landlords for tenant allowances and receivables from vendors for merchandise returns, vendor marketing allowances and various other programs. An allowance for doubtful accounts has been recorded to reduce receivables to an amount expected to be collectible. Receivables consisted of the following (in millions):
|
January 28, 2017
|
January 30, 2016
|
|||||||
|
Bankcard receivables
|
$
|
39.5
|
|
$
|
37.7
|
|
||
|
Vendor receivables
|
143.3
|
|
119.3
|
|
||||
|
Technology brands carrier receivables
|
41.0
|
|
24.1
|
|
||||
|
Other receivables
|
2.8
|
|
0.8
|
|
||||
|
Allowance for doubtful accounts
|
(5.7
|
)
|
(5.4
|
)
|
||||
|
Total receivables, net
|
$
|
220.9
|
|
$
|
176.5
|
|
||
|
6.
|
Goodwill and Intangible Assets
|
Goodwill
The changes in the carrying amount of goodwill, by reportable segment, for fiscal
2015
and
2016
were as follows (in millions):
|
United States
|
Canada
|
Australia
|
Europe
|
Technology Brands
|
Total
|
|||||||||||||||||||
|
Balance at January 31, 2015
|
$
|
1,143.3
|
|
$
|
29.5
|
|
$
|
72.1
|
|
$
|
78.9
|
|
$
|
66.6
|
|
$
|
1,390.4
|
|
||||||
|
Acquisitions (Note 3)
|
52.2
|
|
—
|
|
—
|
|
—
|
|
46.3
|
|
98.5
|
|
||||||||||||
|
Foreign currency translation adjustment
|
—
|
|
(2.6
|
)
|
(6.4
|
)
|
(3.2
|
)
|
—
|
|
(12.2
|
)
|
||||||||||||
|
Balance at January 30, 2016
|
1,195.5
|
|
26.9
|
|
65.7
|
|
75.7
|
|
112.9
|
|
1,476.7
|
|
||||||||||||
|
Acquisitions (Note 3)
|
4.2
|
|
—
|
|
—
|
|
—
|
|
239.1
|
|
243.3
|
|
||||||||||||
|
Foreign currency translation adjustment
|
—
|
|
1.7
|
|
4.4
|
|
(0.9
|
)
|
—
|
|
5.2
|
|
||||||||||||
|
Balance at January 28, 2017
|
$
|
1,199.7
|
|
$
|
28.6
|
|
$
|
70.1
|
|
$
|
74.8
|
|
$
|
352.0
|
|
$
|
1,725.2
|
|
||||||
We perform an annual impairment test on the carrying value of our Goodwill as further described in Note 1, "Nature of Operations and Summary of Significant Accounting Policies."
No
goodwill impairment charges were recognized in fiscal
2016
,
2015
and
2014
. Cumulative goodwill impairment losses were
$640.5 million
as of January 28, 2017, of which
$13.5 million
,
$100.3 million
,
$107.1 million
and
$419.6 million
were attributable to our United States, Canada, Australia and Europe reporting units, respectively.
Intangible Assets
The gross carrying amount and accumulated amortization of our intangible assets other than goodwill as of
January 28, 2017
and
January 30, 2016
were as follows (in millions):
|
January 28, 2017
|
January 30, 2016
|
|||||||||||||||||||||||
|
Gross Carrying Amount
(1)
|
Accumulated Amortization
|
Net Carrying Amount
|
Gross Carrying Amount
|
Accumulated Amortization
|
Net Carrying Amount
|
|||||||||||||||||||
|
Intangible assets with indefinite lives:
|
||||||||||||||||||||||||
|
Trade names
|
$
|
43.7
|
|
$
|
—
|
|
$
|
43.7
|
|
$
|
51.7
|
|
$
|
—
|
|
$
|
51.7
|
|
||||||
|
Dealer agreements
|
409.3
|
|
—
|
|
409.3
|
|
210.6
|
|
—
|
|
210.6
|
|
||||||||||||
|
Intangible assets with finite lives:
|
||||||||||||||||||||||||
|
Leasehold rights
|
86.4
|
|
(51.4
|
)
|
35.0
|
|
87.5
|
|
(46.2
|
)
|
41.3
|
|
||||||||||||
|
Customer relationships
|
14.5
|
|
(4.1
|
)
|
10.4
|
|
14.5
|
|
(1.5
|
)
|
13.0
|
|
||||||||||||
|
Other
|
39.5
|
|
(30.7
|
)
|
8.8
|
|
39.1
|
|
(25.3
|
)
|
13.8
|
|
||||||||||||
|
Total
|
$
|
593.4
|
|
$
|
(86.2
|
)
|
$
|
507.2
|
|
$
|
403.4
|
|
$
|
(73.0
|
)
|
$
|
330.4
|
|
||||||
|
(1)
|
The change in the gross carrying amount of intangible assets from January 30, 2016 to January 28, 2017 is due to acquisitions (Note 3), impairments (Note 2), and the impact of exchange rate fluctuations.
|
F-19
Indefinite-lived Intangible Assets
Trade names which were recorded as a result of acquisitions, primarily Micromania, are considered indefinite-lived intangible assets as they are expected to contribute to cash flows indefinitely and are not subject to amortization, but are subject to annual impairment testing.
Dealer agreements represent acquired intangible assets which are associated with our Spring Mobile and Simply Mac businesses. These dealer agreements represent Spring Mobile's exclusive agreements with AT&T to operate AT&T stores as an “AT&T Authorized Retailer” and sell AT&T wireless contracts in its stores and Simply Mac’s exclusive agreements with Apple to operate Apple stores under the name “Simply Mac” and sell Apple products in its stores. The dealer agreement value recorded on our consolidated balance sheets represents a value associated with the rights and privileges afforded to us under these agreements. Our dealer agreements are considered indefinite-lived intangible assets as they are expected to contribute to cash flows indefinitely and are not subject to amortization, but are subject to annual impairment testing.
As a result of our annual impairment test of indefinite-lived intangible assets (see Note 1), we recognized impairments of
$7.0 million
related to our Simply Mac dealer agreements and
$7.4 million
related to our Micromania trade name. Recent revenue and profitability measures associated with Simply Mac and Micromania indicated that future revenue and profitability no longer supported the carrying value of these intangible assets.
Finite-lived Intangible Assets
Leasehold rights, the majority of which were recorded as a result of the purchase of SFMI Micromania SAS (“Micromania”) in 2008, represent the value of rights of tenancy under commercial property leases for properties located in France. Rights pertaining to individual leases can be sold by us to a new tenant or recovered by us from the landlord if the exercise of the automatic right of renewal is refused. Leasehold rights are amortized on a straight-line basis over the expected lease term, not to exceed
20 years
, with no residual value.
Customer relationships, which were recorded as a result of the ThinkGeek acquisition, represent the value of the relationships related to both wholesale and website customers within the United States. ThinkGeek sells its products directly to large wholesale retailers and also sells its products directly to customers on its ThinkGeek website. Wholesale customer relationships are amortized on a straight-line basis over seven years, and website customer relationships are amortized on a straight-line basis over five years.
Other intangible assets include advertising relationships and favorable leasehold interests. Advertising relationships, which were recorded as a result of digital acquisitions, are relationships with advertisers who pay to place ads on our digital websites and are amortized on a straight-line basis over
10 years
. Favorable leasehold interests represent the value of the contractual monthly rental payments that are less than the current market rent at stores acquired as part of the Micromania acquisition. Favorable leasehold interests are amortized on a straight-line basis over their remaining lease term with no expected residual value.
As of January 28, 2017, the total weighted-average amortization period for the remaining intangible assets, excluding goodwill, was approximately
9.3
years. The intangible assets are being amortized based upon the pattern in which the economic benefits of the intangible assets are being utilized, with no expected residual value.
Intangible asset amortization expense during fiscal
2016
,
2015
and
2014
was
$15.0 million
,
$13.4 million
and
$12.0 million
, respectively. The estimated aggregate intangible asset amortization expense for the next five fiscal years is as follows (in millions):
|
Fiscal Year Ending on or around January 31,
|
Projected Amortization Expense
|
|||
|
2018
|
$
|
13.5
|
|
|
|
2019
|
11.3
|
|
||
|
2020
|
8.6
|
|
||
|
2021
|
6.0
|
|
||
|
2022
|
4.0
|
|
||
|
$
|
43.4
|
|
||
F-20
|
7.
|
Income Taxes
|
The provision for income taxes consisted of the following (in millions):
|
Fiscal Year
|
||||||||||||
|
2016
|
2015
|
2014
|
||||||||||
|
Current tax expense:
|
||||||||||||
|
Federal
|
$
|
143.8
|
|
$
|
178.7
|
|
$
|
158.4
|
|
|||
|
State
|
13.5
|
|
16.3
|
|
18.0
|
|
||||||
|
Foreign
|
29.2
|
|
28.9
|
|
29.6
|
|
||||||
|
186.5
|
|
223.9
|
|
206.0
|
|
|||||||
|
Deferred tax expense (benefit):
|
||||||||||||
|
Federal
|
(1.2
|
)
|
0.2
|
|
29.3
|
|
||||||
|
State
|
(0.2
|
)
|
3.6
|
|
(3.3
|
)
|
||||||
|
Foreign
|
(33.6
|
)
|
(5.3
|
)
|
(16.8
|
)
|
||||||
|
(35.0
|
)
|
(1.5
|
)
|
9.2
|
|
|||||||
|
Total income tax expense
|
$
|
151.5
|
|
$
|
222.4
|
|
$
|
215.2
|
|
|||
The components of earnings before income tax expense consisted of the following (in millions):
|
Fiscal Year
|
||||||||||||
|
2016
|
2015
|
2014
|
||||||||||
|
United States
|
$
|
446.8
|
|
$
|
553.5
|
|
$
|
558.8
|
|
|||
|
International
|
57.9
|
|
71.7
|
|
49.5
|
|
||||||
|
Total
|
$
|
504.7
|
|
$
|
625.2
|
|
$
|
608.3
|
|
|||
The following is a reconciliation of income tax expense (benefit) computed at the U.S. Federal statutory tax rate to income tax expense (benefit) reported in our consolidated statements of operations:
|
Fiscal Year
|
|||||||||
|
2016
|
2015
|
2014
|
|||||||
|
Federal statutory tax rate
|
35.0
|
%
|
35.0
|
%
|
35.0
|
%
|
|||
|
State income taxes, net of federal effect
|
1.7
|
|
2.1
|
|
2.0
|
|
|||
|
Foreign income tax rate differential
|
(0.9
|
)
|
(1.0
|
)
|
(0.4
|
)
|
|||
|
Change in valuation allowance
|
4.1
|
|
(0.9
|
)
|
1.8
|
|
|||
|
Change in unrecognized tax benefits
|
2.3
|
|
0.9
|
|
(0.2
|
)
|
|||
|
Subpart F income
|
1.3
|
|
0.9
|
|
2.7
|
|
|||
|
Interest income from hybrid securities
|
(0.6
|
)
|
(1.6
|
)
|
(5.2
|
)
|
|||
|
Realization of losses in foreign operations not previously benefited
(1)
|
(8.3
|
)
|
—
|
|
(2.2
|
)
|
|||
|
Loss on investment in foreign subsidiary
|
(3.2
|
)
|
—
|
|
—
|
|
|||
|
Other (including permanent differences)
(2)
|
(1.4
|
)
|
0.2
|
|
1.9
|
|
|||
|
30.0
|
%
|
35.6
|
%
|
35.4
|
%
|
||||
|
(1)
|
In fiscal 2016, we adopted a plan of reorganization specific to certain foreign operations which resulted in our ability to recognize the benefit of foreign net operating loss carryforwards that were previously unrecognized in affected jurisdictions. As a result, we recognized a tax benefit of
$42.1 million
in the fourth quarter of fiscal 2016, which is subject to a partial valuation allowance of
$14.8 million
. The valuation allowance established for this tax benefit is reflected in the line item “Change in valuation allowance.”
|
|
(2)
|
Other is comprised of numerous items, none of which is greater than
1.75%
of earnings before income taxes.
|
F-21
Differences between financial accounting principles and tax laws cause differences between the bases of certain assets and liabilities for financial reporting purposes and tax purposes. The tax effects of these differences, to the extent they are temporary, are recorded as deferred tax assets and liabilities which are presented in the table below (in millions). Certain prior year balances have been reclassified to conform to current year presentation.
|
January 28, 2017
|
January 30, 2016
|
|||||||
|
Deferred tax asset:
|
||||||||
|
Inventory
|
$
|
26.7
|
|
$
|
26.5
|
|
||
|
Deferred rents
|
8.3
|
|
8.9
|
|
||||
|
Stock-based compensation
|
12.0
|
|
16.5
|
|
||||
|
Net operating losses
|
89.6
|
|
52.2
|
|
||||
|
Customer liabilities
|
19.5
|
|
26.1
|
|
||||
|
Property and equipment
|
3.4
|
|
—
|
|
||||
|
Foreign tax credit carryover
|
4.1
|
|
3.9
|
|
||||
|
Accrued compensation
|
26.3
|
|
25.9
|
|
||||
|
Other
|
22.1
|
|
6.6
|
|
||||
|
Total deferred tax assets
|
212.0
|
|
166.6
|
|
||||
|
Valuation allowance
|
(39.4
|
)
|
(18.8
|
)
|
||||
|
Total deferred tax assets, net
|
172.6
|
|
147.8
|
|
||||
|
Deferred tax liabilities:
|
||||||||
|
Property and equipment
|
—
|
|
(11.6
|
)
|
||||
|
Goodwill
|
(75.5
|
)
|
(89.0
|
)
|
||||
|
Prepaid expenses
|
(5.3
|
)
|
(6.6
|
)
|
||||
|
Intangible assets
|
(47.9
|
)
|
(30.3
|
)
|
||||
|
Other
|
(7.9
|
)
|
(0.9
|
)
|
||||
|
Total deferred tax liabilities
|
(136.6
|
)
|
(138.4
|
)
|
||||
|
Net deferred tax assets
|
$
|
36.0
|
|
$
|
9.4
|
|
||
|
The above amounts are reflected in the consolidated financial statements as:
|
||||||||
|
Deferred income taxes - assets
|
$
|
59.0
|
|
$
|
39.0
|
|
||
|
Deferred income taxes - liabilities
|
$
|
(23.0
|
)
|
$
|
(29.6
|
)
|
||
We file income tax returns in the U.S. federal jurisdiction and various states and foreign jurisdictions. The Internal Revenue Service (“IRS”) is currently examining our U.S. income tax returns for the fiscal years 2010 through 2015. We do not anticipate any adjustments that would result in a material impact on our consolidated financial statements as a result of these audits. We are no longer subject to U.S. federal income tax examination for years before and including the fiscal year ended January 30, 2010.
With respect to state and local jurisdictions and countries outside of the United States, we and our subsidiaries are typically subject to examination for
three
to
six
years after the income tax returns have been filed. Although the outcome of tax audits is always uncertain, we believe that adequate amounts of tax, interest and penalties have been provided for in the accompanying consolidated financial statements for any adjustments that might be incurred due to state, local or foreign audits.
As of January 28, 2017, we have
$25.4 million
of net operating loss ("NOL") carryforwards in various foreign jurisdictions that expire in years
2017
through
2035
, as well as
$229.1 million
of foreign NOL carryforwards that have no expiration date. In addition, we have
$4.1 million
of foreign tax credit carryforwards that expire in years
2022
through
2026
. We also have
$64.0 million
of Federal NOL carryovers acquired through the ThinkGeek acquisition that will expire in years
2020
through
2035
.
F-22
As of
January 28, 2017
, the gross amount of unrecognized tax benefits was approximately
$42.1 million
. If we were to prevail on all uncertain tax positions, the net effect would be a benefit to our effective tax rate of
$36.5 million
, exclusive of any benefits related to interest and penalties. A reconciliation of the changes in the gross balances of unrecognized tax benefits follows (in millions):
|
Fiscal Year
|
||||||||||||
|
2016
|
2015
|
2014
|
||||||||||
|
Beginning balance of unrecognized tax benefits
|
$
|
31.9
|
|
$
|
21.4
|
|
$
|
20.6
|
|
|||
|
Increases related to current period tax positions
|
3.5
|
|
4.0
|
|
1.0
|
|
||||||
|
Increases related to prior period tax positions
|
7.9
|
|
9.0
|
|
6.1
|
|
||||||
|
Reductions as a result of a lapse of the applicable statute of limitations
|
(0.2
|
)
|
(1.0
|
)
|
(0.5
|
)
|
||||||
|
Reductions as a result of settlements with taxing authorities
|
(1.0
|
)
|
(1.5
|
)
|
(5.8
|
)
|
||||||
|
Ending balance of unrecognized tax benefits
|
$
|
42.1
|
|
$
|
31.9
|
|
$
|
21.4
|
|
|||
We recognize accrued interest and penalties related to unrecognized tax benefits in income tax expense. As of
January 28, 2017
,
January 30, 2016
and
January 31, 2015
, we had approximately
$7.2 million
,
$4.9 million
and
$4.6 million
, respectively, in interest and penalties related to unrecognized tax benefits accrued, of which approximately
$2.3 million
,
$0.4 million
and
$0.6 million
of expense were recognized through income tax expense in fiscal
2016
,
2015
and
2014
. If we were to prevail on all uncertain tax positions, the reversal of these accruals related to interest would also be a benefit to our effective tax rate.
It is reasonably possible that the amount of the unrecognized benefit with respect to certain of our unrecognized tax positions could significantly increase or decrease within the next 12 months as a result of settling ongoing audits. However, as audit outcomes and the timing of audit resolutions are subject to significant uncertainty, and given the nature and complexity of the issues involved, we are unable to reasonably estimate the possible amount of change in the unrecognized tax benefits, if any, that may occur within the next 12 months as a result of ongoing examinations. Nevertheless, we believe we are adequately reserved for our uncertain tax positions as of January 28, 2017.
Deferred income taxes have not been provided for on the approximately
$671.1 million
of undistributed earnings generated by certain foreign subsidiaries as of
January 28, 2017
because we intend to permanently reinvest such earnings outside the United States. We do not currently require, nor do we have plans for, the repatriation of retained earnings from these subsidiaries. However, in the future, if we determine it is necessary to repatriate these funds, or we sell or liquidate any of these subsidiaries, we may be required to provide for income taxes on the repatriation. We may also be required to withhold foreign taxes depending on the foreign jurisdiction from which the funds are repatriated. The effective rate of tax on such repatriations may materially differ from the federal statutory tax rate, thereby having a material impact on tax expense in the year of repatriation; however, we cannot reasonably estimate the amount of such a tax event.
|
8.
|
Accrued Liabilities
|
Accrued liabilities consisted of the following (in millions):
|
January 28, 2017
|
January 30, 2016
|
|||||||
|
Customer liabilities
|
$
|
342.5
|
|
$
|
341.6
|
|
||
|
Deferred revenue
|
131.5
|
|
112.8
|
|
||||
|
Employee benefits, compensation and related taxes
|
147.7
|
|
156.4
|
|
||||
|
Checks and transfers yet to be presented for payment from zero balance cash accounts
|
268.4
|
|
264.9
|
|
||||
|
Other taxes
|
52.0
|
|
52.9
|
|
||||
|
Other accrued liabilities
(1)
|
148.8
|
|
112.8
|
|
||||
|
Total accrued liabilities
|
$
|
1,090.9
|
|
$
|
1,041.4
|
|
||
|
(1)
|
Includes the current portion of acquisition-related contingent consideration of
$20.0 million
. See Note 3, "Acquisitions and Divestitures" for additional information.
|
F-23
|
9.
|
Debt
|
Senior Notes
The carrying value of our long-term debt is comprised as follows (in millions):
|
January 28, 2017
|
January 30, 2016
|
||||||
|
2019 Senior Notes principal amount
|
$
|
350.0
|
|
$
|
350.0
|
|
|
|
2021 Senior Notes principal amount
|
475.0
|
|
—
|
|
|||
|
Less: Unamortized debt financing costs
(1)
|
(10.0
|
)
|
(4.6
|
)
|
|||
|
Long-term debt, net
|
$
|
815.0
|
|
$
|
345.4
|
|
|
(1) Includes the reclassification of debt financing costs as of January 30, 2016 from "Prepaid expenses and other current assets" and “Other noncurrent assets” as a result of the Company adopting ASU 2015-03. See Note 1.
2019 Senior Notes.
In September 2014, we issued
$350.0 million
aggregate principal amount of unsecured
5.50%
senior notes due
October 1, 2019
(the "2019 Senior Notes"). The 2019 Senior Notes bear interest at the rate of
5.50%
per annum with interest payable semi-annually in arrears on April 1 and October 1 of each year beginning on April 1, 2015. We incurred fees and expenses related to the 2019 Senior Notes offering of
$6.3 million
, which were capitalized during the third quarter of fiscal 2014 and are being amortized as interest expense over the term of the notes. The 2019 Senior Notes were sold in a private placement and are not registered under the U.S. Securities Act of 1933, as amended (the "Securities Act"). The 2019 Senior Notes were offered in the U.S. to “qualified institutional buyers” pursuant to the exemption from registration under Rule 144A of the Securities Act and in exempted offshore transactions pursuant to Regulation S under the Securities Act.
2021 Senior Notes.
In
March 2016
, we issued
$475.0 million
aggregate principal amount of unsecured
6.75%
senior notes due March 15, 2021 (the "2021 Senior Notes"). The 2021 Senior Notes bear interest at the rate of
6.75%
per annum with interest payable semi-annually in arrears on March 15 and September 15 of each year beginning on September 15, 2016. The net proceeds from the offering were used for general corporate purposes, including acquisitions and dividends. We incurred fees and expenses related to the 2021 Senior Notes offering of
$8.1 million
, which were capitalized during the first quarter of fiscal 2016 and is being amortized as interest expense over the term of the notes. The 2021 Senior Notes were sold in a private placement and will not be registered under the Securities Act. The 2021 Senior Notes were offered in the U.S. to "qualified institutional buyers" pursuant to the exemption from registration under Rule 144A of the Securities Act and in exempted offshore transactions pursuant to Regulation S under the Securities Act.
The indentures governing the 2019 Senior Notes and the 2021 Senior Notes (together, the "Senior Notes") do not contain financial covenants but do contain covenants which place certain restrictions on us and our subsidiaries, including limitations on asset sales, additional liens, investments, stock repurchases, the incurrence of additional debt and the repurchase of debt that is junior to the Senior Notes. In addition, the indentures restrict payments of dividends to stockholders (other than dividends payable in shares of capital stock) if one of the following conditions exist: (i) an event of default has occurred, (ii) we could not incur additional debt under the general debt covenant of the indentures or (iii) the sum of the proposed dividend and all other dividends and other restricted payments made under the indentures from the date of the indentures governing the Senior Notes exceeds the sum of
50%
of consolidated net income plus
100%
of net proceeds from capital stock sales and other amounts set forth in and determined as provided in the indentures. These restrictions are subject to exceptions and qualifications, including that we can pay up to
$175 million
in dividends to stockholders in each fiscal year and we can pay dividends and make other restricted payments in an unlimited amount if our leverage ratio on a pro forma basis after giving effect to the dividend payment and other restricted payments would be less than or equal to
1.0
:1.0.
The indentures contain customary events of default, including payment defaults, breaches of covenants, failure to pay certain judgments and certain events of bankruptcy, insolvency and reorganization. If an event of default occurs and is continuing, the principal amount of the Senior Notes, plus accrued and unpaid interest, if any, may be declared immediately due and payable. These amounts automatically become due and payable if an event of default relating to certain events of bankruptcy, insolvency or reorganization occurs.
Revolving Credit Facility
In January 2011, we entered into a
$400 million
credit agreement, which we amended and restated on March 25, 2014 and further amended on September 15, 2014 (the "Revolver"). The Revolver is a
five
-year, asset-based facility that is secured by substantially all of our assets and the assets of our domestic subsidiaries. Availability under the Revolver is subject to a monthly borrowing base calculation. The Revolver includes a
$50 million
letter of credit sublimit. The amendments extended the maturity date to March 25, 2019; increased the expansion feature under the Revolver from
$150 million
to
$200 million
, subject to certain conditions; and revised certain other terms, including a reduction of the fee we are required to pay on the unused portion of the total commitment amount.
F-24
Borrowing availability under the Revolver is limited to a borrowing base which allows us to borrow up to
90%
of the appraisal value of the inventory, in each case plus
90%
of eligible credit card receivables, net of certain reserves. The borrowing base provides for borrowing of up to
92.5%
of the appraisal value during the fiscal months of August through October. Letters of credit reduce the amount available to borrow under the Revolver by an amount equal to the face value of the letters of credit. Our ability to pay cash dividends, redeem options and repurchase shares is generally permitted, except under certain circumstances, including if either 1) excess availability under the Revolver is less than
30%
, or is projected to be within 12 months after such payment or 2) excess availability under the Revolver is less than
15%
, or is projected to be within 12 months after such payment, and the fixed charge coverage ratio, as calculated on a pro-forma basis for the prior 12 months, is
1.1
:1.0 or less. In the event that excess availability under the Revolver is at any time less than the greater of (1)
$30 million
or (2)
10%
of the lesser of the total commitment or the borrowing base, we will be subject to a fixed charge coverage ratio covenant of
1.0
:1.0.
The Revolver places certain restrictions on us and our subsidiaries, including limitations on asset sales, additional liens, investments, loans, guarantees, acquisitions and the incurrence of additional indebtedness. Absent consent from our lenders, we may not incur more than
$1 billion
of senior secured debt and
$750 million
of additional unsecured indebtedness to be limited to
$250 million
in general unsecured obligations and
$500 million
in unsecured obligations to finance acquisitions valued at
$500 million
or more.
The per annum interest rate under the Revolver is variable and is calculated by applying a margin (1) for prime rate loans of
0.25%
to
0.75%
above the highest of (a) the prime rate of the administrative agent, (b) the federal funds effective rate plus
0.50%
or (c) the London Interbank Offered (“LIBO”) rate for a 30-day interest period as determined on such day plus
1.00%
, and (2) for LIBO rate loans of
1.25%
to
1.75%
above the LIBO rate. The applicable margin is determined quarterly as a function of our average daily excess availability under the facility. In addition, we are required to pay a commitment fee of
0.25%
for any unused portion of the total commitment under the Revolver. As of
January 28, 2017
, the applicable margin was
0.25%
for prime rate loans and
1.25%
for LIBO rate loans.
The Revolver provides for customary events of default with corresponding grace periods, including failure to pay any principal or interest when due, failure to comply with covenants, any material representation or warranty made by us or the borrowers proving to be false in any material respect, certain bankruptcy, insolvency or receivership events affecting us or our subsidiaries, defaults relating to certain other indebtedness, imposition of certain judgments and mergers or the liquidation of the Company or certain of its subsidiaries. During fiscal 2016, we cumulatively borrowed
$545.0 million
and repaid
$545.0 million
under the Revolver. Average borrowings under the Revolver for fiscal 2016 were
$42.8 million
and our average interest rate on those borrowings was
2.5%
. As of January 28, 2017, total availability under the Revolver was
$354.0 million
, with
no
outstanding borrowings and outstanding standby letters of credit of
$8.4 million
. We are currently in compliance with the financial requirements of the Revolver.
Luxembourg Line of Credit
In September 2007, our Luxembourg subsidiary entered into a discretionary
$20.0 million
Uncommitted Line of Credit (the “Line of Credit”) with Bank of America. There is no term associated with the Line of Credit and Bank of America may withdraw the facility at any time without notice. The Line of Credit is available to our foreign subsidiaries for use primarily as a bank overdraft facility for short-term liquidity needs and for the issuance of bank guarantees and letters of credit to support operations. As of
January 28, 2017
, there were
no
cash overdrafts outstanding under the Line of Credit and bank guarantees outstanding totaled
$10.7 million
.
|
10.
|
Leases
|
We lease retail stores, warehouse facilities, office space and equipment. These are generally leased under noncancelable agreements that expire at various dates through
2033
with various renewal options for additional periods. The agreements, which have been classified as operating leases, generally provide for minimum and, in some cases, percentage rentals and require us to pay all insurance, taxes and other maintenance costs. Leases with step rent provisions, escalation clauses or other lease concessions are accounted for on a straight-line basis over the lease term, which includes renewal option periods when we are reasonably assured of exercising the renewal options and includes “rent holidays” (periods in which we are not obligated to pay rent). Cash or lease incentives received upon entering into certain store leases (“tenant improvement allowances”) are recognized on a straight-line basis as a reduction to rent expense over the lease term, which includes renewal option periods when we are reasonably assured of exercising the renewal options. We record the unamortized portion of tenant improvement allowances as a part of deferred rent. We do not have leases with capital improvement funding. Percentage rentals are based on sales performance in excess of specified minimums at various stores and are accounted for in the period in which the amount of percentage rentals can be accurately estimated.
F-25
Rent expense under operating leases was as follows (in millions):
|
Fiscal Year
|
||||||||||||
|
|
|
2016
|
2015
|
2014
|
||||||||
|
Minimum
|
|
$
|
437.4
|
|
|
$
|
394.5
|
|
|
$
|
391.4
|
|
|
Percentage rentals
|
|
6.9
|
|
|
7.8
|
|
|
8.2
|
|
|||
|
Total rent expense
|
|
$
|
444.3
|
|
|
$
|
402.3
|
|
|
$
|
399.6
|
|
Future minimum annual rentals, excluding percentage rentals, required under leases that had initial, noncancelable lease terms greater than one year, as of
January 28, 2017
, are as follows (in millions):
|
Fiscal Year Ending on or around January 31,
|
||||
|
2018
|
$
|
388.6
|
|
|
|
2019
|
295.9
|
|
||
|
2020
|
202.3
|
|
||
|
2021
|
121.5
|
|
||
|
2022
|
68.6
|
|
||
|
Thereafter
|
117.7
|
|
||
|
$
|
1,194.6
|
|
||
|
11.
|
Commitments and Contingencies
|
Commitments
We had bank guarantees relating primarily to international store leases and other commercial commitments totaling
$24.5 million
as of
January 28, 2017
and
$15.7 million
as of
January 30, 2016
.
See Note 10, "Leases," for information regarding commitments related to our noncancelable operating leases.
Contingencies
Acquisitions
In connection with our acquisition of certain assets from Cellular World and Red Skye Wireless, we recognized an acquisition-date liability of
$43.2 million
representing the fair value of future contingent consideration that we estimate will range from
$40.0 million
to
$50.0 million
. See Note 3, "Acquisitions and Divestitures" for additional information.
Legal Proceedings
In the ordinary course of business, we are, from time to time, subject to various legal proceedings, including matters involving wage and hour employee class actions, stockholder actions and consumer class actions. We may enter into discussions regarding settlement of these and other types of lawsuits, and may enter into settlement agreements, if we believe settlement is in the best interest of our stockholders. We do not believe that any such existing legal proceedings or settlements, individually or in the aggregate, will have a material effect on our financial condition, results of operations or liquidity.
Certain of our French subsidiaries have been under audit by the French Tax Administration (the "FTA") for fiscal years 2008 through 2012. We received tax reassessment notices on December 23, 2015 and April 4, 2016, pursuant to which the FTA asserted that the French subsidiaries were ineligible to claim certain tax deductions from November 4, 2008, through January 31, 2013, resulting in a potential additional tax charge of approximately
€85.5 million
. We may receive additional tax reassessments in material amounts for subsequent fiscal years. We filed a response to each reassessment and intend to vigorously contest the reassessments through administrative procedures. If we are unable to resolve this matter through administrative remedies at the FTA, we plan to pursue judicial remedies. We believe our tax positions will be sustained and have not taken a reserve for any potential adjustment based on the reassessment. If we were not to prevail, then the adjustment to our income tax provision could be material.
F-26
|
12.
|
Common Stock and Share-Based Compensation
|
Common Stock
The holders of Class A Common Stock are entitled to
one vote per share
on all matters to be voted on by stockholders. Holders of Class A Common Stock will share in any dividend declared by the Board of Directors. In the event of our liquidation, dissolution or winding up, all holders of common stock are entitled to share ratably in any assets available for distribution to holders of shares of common stock.
Share Repurchase Activity.
Since January 2010, our Board of Directors has authorized several share repurchase programs authorizing our management to repurchase our Class A Common Stock. Since the beginning of fiscal 2011, each individual authorization has been
$500 million
. We generally seek Board of Directors’ approval for a new authorization before the existing program is fully utilized to ensure we maintain availability under a repurchase program. Repurchased shares are subsequently retired. Share repurchases are generally recorded as a reduction to additional paid-in capital; however, in the event that share repurchases would cause additional-paid in capital to be reduced below zero, any excess is recorded as a reduction to retained earnings.
The following table summarizes our share repurchase activity during
fiscal 2016
,
2015
and
2014
(in millions, except average price paid per share):
|
Fiscal Year
|
||||||||||||
|
2016
|
2015
|
2014
|
||||||||||
|
Total number of shares purchased
|
3.0
|
|
5.2
|
|
8.4
|
|
||||||
|
Average price per share
|
$
|
24.94
|
|
$
|
38.68
|
|
$
|
39.50
|
|
|||
|
Aggregate value of shares purchased
|
$
|
75.1
|
|
$
|
202.0
|
|
$
|
333.4
|
|
|||
As of
January 28, 2017
, we have
$170.2 million
remaining under our latest authorization from November 2014.
Dividends.
In February 2012, our Board of Directors approved the initiation of a quarterly cash dividend to our stockholders of Class A Common Stock. We paid a total of
$1.32
per share in dividends in fiscal 2014 and a total of
$1.44
per share fiscal 2015. In fiscal 2016, we paid dividends of
$1.48
per share of Class A Common Stock, totaling approximately
$155.5 million
. On
February 28, 2017
, our Board of Directors authorized an increase in our annual cash dividend from
$1.48
to
$1.52
per share of Class A Common Stock. Future dividends will be subject to approval by our Board of Directors.
Share-Based Compensation
Effective June 2013, our stockholders voted to adopt the Amended and Restated 2011 Incentive Plan (the “Amended 2011 Incentive Plan”) to provide for issuance under the 2011 Incentive Plan of our Class A Common Stock. The Amended 2011 Incentive Plan provides a maximum aggregate amount of
9.25 million
shares of Class A Common Stock with respect to which options may be granted and provides for a grant of cash, granting of incentive stock options, non-qualified stock options, stock appreciation rights, performance awards, restricted stock and other share-based awards, which may include, without limitation, restrictions on the right to vote such shares and restrictions on the right to receive dividends on such shares. The options to purchase Class A common shares are issued at fair market value of the underlying shares on the date of grant. In general, the options vest and become exercisable in equal annual installments over a
three
-year period, commencing one year after the grant date, and expire
ten
years from the grant date. Shares issued upon exercise of options and vesting of restricted stock awards are newly issued shares. Options and restricted shares granted after June 21, 2011 are issued under the 2011 Incentive Plan.
Effective June 2009, our stockholders voted to amend the Third Amended and Restated 2001 Incentive Plan (the “2001 Incentive Plan”) to provide for issuance under the 2001 Incentive Plan of our Class A Common Stock. The 2001 Incentive Plan provided a maximum aggregate amount of
46.5 million
shares of Class A Common Stock with respect to which options may have been granted and provided for the granting of incentive stock options, non-qualified stock options, and restricted stock, which may have included, without limitation, restrictions on the right to vote such shares and restrictions on the right to receive dividends on such shares. The options to purchase Class A common shares were issued at fair market value of the underlying shares on the date of grant. In general, the options vested and became exercisable in equal annual installments over a
three
-year period, commencing one year after the grant date, and expired
ten
years from the grant date. Options and restricted shares granted on or before June 21, 2011 were issued under the 2001 Incentive Plan.
F-27
Stock Options
We record stock-based compensation expense in earnings based on the grant-date fair value of options granted. The fair value of each option grant is estimated on the date of grant using the Black-Scholes option pricing model. This valuation model requires the use of subjective assumptions, including expected option life and expected volatility. We use historical data to estimate the option life and the employee forfeiture rate, and use historical volatility when estimating the stock price volatility. We have not historically experienced material forfeitures with respect to the employees who currently receive stock option grants. There were
no
options granted during
fiscal 2016
and 2015.
In addition to recognizing the estimated fair value of stock-based compensation in earnings over the required service period, we are also required to present tax benefits received in excess of amounts determined based on the compensation expense recognized on the statements of cash flows. Such tax benefits are presented as a use of cash in the operating section and a source of cash in the financing section of the consolidated statements of cash flows.
A summary of our stock option activity during
fiscal 2016
is presented below:
|
Shares
(Millions)
|
Weighted-
Average
Exercise
Price
|
||||||
|
Balance, January 30, 2016
|
1.4
|
|
$
|
35.88
|
|
||
|
Exercised
|
—
|
|
22.58
|
|
|||
|
Expired
|
(0.1
|
)
|
47.40
|
|
|||
|
Balance, January 28, 2017
|
1.3
|
|
35.43
|
|
|||
The following table summarizes information as of
January 28, 2017
concerning outstanding and exercisable options:
|
|
Options Outstanding
|
Options Exercisable
|
||||||||||||||
|
Range of Exercise Prices
|
Number
Outstanding
(Millions)
|
Weighted-
Average
Remaining
Life (Years)
|
Weighted-
Average
Exercise
Price
|
Number
Exercisable
(Millions)
|
Weighted-
Average
Exercise
Price
|
|||||||||||
|
$20.32 - $38.52
|
0.9
|
|
5.26
|
$
|
28.97
|
|
0.8
|
|
$
|
27.88
|
|
|||||
|
$49.95
|
0.4
|
|
1.02
|
49.95
|
|
0.4
|
|
49.95
|
|
|||||||
|
$20.32 - $49.95
|
1.3
|
|
3.96
|
$
|
35.43
|
|
1.2
|
|
$
|
35.19
|
|
|||||
The total intrinsic value of options exercised during
fiscal 2016
,
2015
and
2014
was
$0.1 million
,
$6.7 million
, and
$10.7 million
, respectively. The intrinsic value of both options exercisable and options outstanding was
$0.3 million
, as of
January 28, 2017
.
The fair value of each option is recognized as compensation expense on a straight-line basis between the grant date and the date the options become fully vested. During
fiscal 2016
,
2015
and
2014
, we included compensation expense relating to the grant of these options in the amount of
$0.9 million
,
$2.6 million
and
$2.1 million
, respectively, in selling, general and administrative expenses. As of
January 28, 2017
, there was
$0.1 million
of unrecognized compensation expense related to the nonvested portion of our stock options that is expected to be recognized over a period of less than
one
year.
Restricted Stock Awards
The fair value of each restricted stock award is recognized as compensation expense on a straight-line basis between the grant date and the date the restricted stock awards become fully vested. We grant restricted stock awards to certain of our employees, officers and non-employee directors. Restricted stock awards generally vest over a three-year period on the anniversary of the date of issuance, subject to continued service to the Company and, in some cases, subject to the attainment of certain performance measures.
F-28
The following table presents a summary of our restricted stock awards activity during
fiscal 2016
:
|
Shares
(Millions)
|
Weighted-
Average
Grant Date
Fair Value
|
||||||
|
Nonvested shares at January 30, 2016
|
1.5
|
|
$
|
33.77
|
|
||
|
Granted
|
0.8
|
|
30.27
|
|
|||
|
Vested
|
(0.9
|
)
|
30.02
|
|
|||
|
Forfeited
|
(0.1
|
)
|
33.14
|
|
|||
|
Nonvested shares at January 28, 2017
|
1.3
|
|
$
|
34.31
|
|
||
In fiscal
2016
, we granted
602 thousand
shares of restricted stock most of which vest in equal annual installments over
three
years. At the same time, we granted an additional
206 thousand
shares of restricted stock that are subject to performance targets which will be measured following the completion of fiscal 2017. These grants will vest
one
year after measurement to the extent earned. Shares subject to performance measures may generally be earned in greater or lesser percentages if targets are exceeded or not achieved by specified amounts.
In
fiscal 2015
, we granted
646 thousand
shares of restricted stock with a weighted-average grant date fair value of
$40.34
per common share with fair value being determined by the quoted market price of our common stock on the date of grant. Included in this grant are
429 thousand
shares of restricted stock that vest in equal annual installments over
three
years and
28 thousand
shares of restricted stock that vest in a single installment over one year. Also included in this grant are
189 thousand
shares of restricted stock that were subject to performance targets measured upon the completion of fiscal 2016, which were partially met. These grants will vest one year after measurement. Shares subject to performance measures may generally be earned in greater or lesser percentages if targets are exceeded or not achieved by specified amounts.
During fiscal
2016
,
2015
and
2014
, we included compensation expense relating to the grants of restricted shares in the amounts of
$16.9 million
,
$27.3 million
and
$19.4 million
, respectively, in selling, general and administrative expenses in the accompanying consolidated statements of operations. The fiscal 2016 compensation expense associated with the restricted shares is net of adjustments totaling
$5.9 million
relating to performance measures that were not fully met. As of
January 28, 2017
, there was
$21.1 million
of unrecognized compensation expense related to nonvested restricted shares that is expected to be recognized over a weighted-average period of
1.7
years.
|
13.
|
Earnings Per Share
|
Basic net income per common share is computed by dividing the net income available to common stockholders by the weighted-average number of common shares outstanding during the period. Diluted net income per common share is computed by dividing the net income available to common stockholders by the weighted-average number of common shares outstanding and potentially dilutive securities outstanding during the period. Potentially dilutive securities include stock options and unvested restricted stock outstanding during the period, using the treasury stock method. Potentially dilutive securities are excluded from the computations of diluted earnings per share if their effect would be antidilutive. A reconciliation of shares used in calculating basic and diluted net income per common share is as follows (in millions, except per share data):
|
Fiscal Year
|
||||||||||||
|
2016
|
2015
|
2014
|
||||||||||
|
Net income
|
$
|
353.2
|
|
$
|
402.8
|
|
$
|
393.1
|
|
|||
|
Weighted-average common shares outstanding
|
103.4
|
|
106.0
|
|
112.2
|
|
||||||
|
Dilutive effect of stock options and restricted stock awards
|
0.4
|
|
0.7
|
|
1.0
|
|
||||||
|
Weighted-average diluted common shares
|
103.8
|
|
106.7
|
|
113.2
|
|
||||||
|
|
||||||||||||
|
Basic earnings per share
|
$
|
3.42
|
|
$
|
3.80
|
|
$
|
3.50
|
|
|||
|
Diluted earnings per share
|
$
|
3.40
|
|
$
|
3.78
|
|
$
|
3.47
|
|
|||
|
Anti-dilutive stock options and restricted stock awards
|
1.4
|
|
1.0
|
|
1.6
|
|
||||||
F-29
|
14.
|
Employees’ Defined Contribution Plan
|
We sponsor a defined contribution plan (the “Savings Plan”) for the benefit of substantially all of our U.S. employees who meet certain eligibility requirements, primarily age and length of service. The Savings Plan allows employees to invest up to
60%
, for a maximum of
$18 thousand
a year for
2016
, of their eligible gross cash compensation invested on a pre-tax basis. Our optional contributions to the Savings Plan are generally in amounts based upon a certain percentage of the employees’ contributions. Our contributions to the Savings Plan during fiscal
2016
,
2015
and
2014
, were
$7.8 million
,
$6.3 million
and
$5.2 million
, respectively.
|
15.
|
Significant Products
|
The tables below set forth net sales, percentages of total net sales, gross profit and gross profit percentages by significant product category for the periods indicated (dollars in millions). We have revised the classification of sales and gross profit of mobile and consumer electronics and other when presenting financial information for significant product categories in this Annual Report on Form 10-K ("Report"). Prior to this Report, we presented a product category labeled "mobile and consumer electronics" which was comprised of mobile and consumer electronics sold through our Video Game Brands segments and Technology Brands segment. We also included sales and gross profit of collectibles in "Other." In this Report, sales and gross profit of mobile and consumer electronics generated by our Technology Brands segment are separately presented as "Technology Brands" and sales and gross profit of mobile and consumer electronics generated by our Video Game Brands segments are included in "Other." In addition, sales and gross profit of collectibles are separately presented as "Collectibles." We believe this presentation of our product categories is more meaningful to our investors considering (i) gross margins of mobile and consumer electronics in our Technology Brands segment differ from our Video Game Brands segments and (ii) sales of collectibles have grown significantly. Sales and gross profit data for prior periods have been recast to the current period presentation.
|
|
Fiscal Year 2016
|
Fiscal Year 2015
|
Fiscal Year 2014
|
||||||||||||||||||
|
|
Net Sales
|
Percent
of Total
|
Net Sales
|
Percent
of Total
|
Net Sales
|
Percent
of Total
|
|||||||||||||||
|
New video game hardware
(1)
|
$
|
1,396.7
|
|
16.2
|
%
|
$
|
1,944.7
|
|
20.8
|
%
|
$
|
2,028.7
|
|
21.8
|
%
|
||||||
|
New video game software
|
2,493.4
|
|
29.0
|
|
2,905.1
|
|
31.0
|
|
3,089.0
|
|
33.2
|
|
|||||||||
|
Pre-owned and value video game products
|
2,254.1
|
|
26.2
|
|
2,374.7
|
|
25.4
|
|
2,389.3
|
|
25.7
|
|
|||||||||
|
Video game accessories
|
676.7
|
|
7.9
|
|
703.0
|
|
7.5
|
|
653.6
|
|
7.1
|
|
|||||||||
|
Digital
|
181.0
|
|
2.1
|
|
188.3
|
|
2.0
|
|
216.3
|
|
2.3
|
|
|||||||||
|
Technology Brands
(2)
|
814.0
|
|
9.5
|
|
534.0
|
|
5.7
|
|
328.6
|
|
3.5
|
|
|||||||||
|
Collectibles
|
494.1
|
|
5.7
|
|
309.7
|
|
3.3
|
|
75.8
|
|
0.8
|
|
|||||||||
|
Other
(3)
|
297.9
|
|
3.4
|
|
404.3
|
|
4.3
|
|
514.7
|
|
5.6
|
|
|||||||||
|
Total
|
$
|
8,607.9
|
|
100.0
|
%
|
$
|
9,363.8
|
|
100.0
|
%
|
$
|
9,296.0
|
|
100.0
|
%
|
||||||
|
|
Fiscal Year 2016
|
Fiscal Year 2015
|
Fiscal Year 2014
|
||||||||||||||||||
|
|
Gross
Profit
|
Gross
Profit
Percent
|
Gross
Profit
|
Gross
Profit
Percent
|
Gross
Profit
|
Gross
Profit
Percent
|
|||||||||||||||
|
New video game hardware
(1)
|
$
|
154.2
|
|
11.0
|
%
|
$
|
175.5
|
|
9.0
|
%
|
$
|
196.6
|
|
9.7
|
%
|
||||||
|
New video game software
|
600.4
|
|
24.1
|
|
689.3
|
|
23.7
|
|
716.9
|
|
23.2
|
|
|||||||||
|
Pre-owned and value video game products
|
1,044.1
|
|
46.3
|
|
1,114.5
|
|
46.9
|
|
1,146.3
|
|
48.0
|
|
|||||||||
|
Video game accessories
|
235.2
|
|
34.8
|
|
255.5
|
|
36.3
|
|
246.1
|
|
37.7
|
|
|||||||||
|
Digital
|
155.5
|
|
85.9
|
|
149.6
|
|
79.4
|
|
152.0
|
|
70.3
|
|
|||||||||
|
Technology Brands
(2)
|
554.6
|
|
68.1
|
|
306.6
|
|
57.4
|
|
169.1
|
|
51.5
|
|
|||||||||
|
Collectibles
|
171.6
|
|
34.7
|
|
116.6
|
|
37.6
|
|
31.9
|
|
42.1
|
|
|||||||||
|
Other
(3)
|
93.7
|
|
31.5
|
|
110.7
|
|
27.4
|
|
117.0
|
|
22.7
|
|
|||||||||
|
Total
|
$
|
3,009.3
|
|
35.0
|
%
|
$
|
2,918.3
|
|
31.2
|
%
|
$
|
2,775.9
|
|
29.9
|
%
|
||||||
|
(1)
|
Includes sales of hardware bundles, in which physical hardware and digital or physical software are sold together as a single SKU.
|
|
(2)
|
Includes mobile and consumer electronics sold through our Technology Brands segment, which includes the operations of our Spring Mobile managed AT&T and Cricket Wireless branded stores and our Simply Mac business.
|
|
(3)
|
Includes sales of PC entertainment software, interactive game figures, strategy guides, mobile and consumer electronics sold through our Video Game Brands segments, and revenues from PowerUp Pro loyalty members receiving Game Informer magazine in print form.
|
F-30
|
16.
|
Segment Information
|
We report our business in
four
geographic Video Game Brands segments: United States, Canada, Australia and Europe; and a Technology Brands segment, which includes the operations of our Spring Mobile managed AT&T and Cricket Wireless branded stores and our Simply Mac business. We identify segments based on a combination of geographic areas and management responsibility. Each of the segments includes significant retail operations with all Video Game Brands stores engaged in the sale of new and pre-owned video game systems, software, accessories and collectibles, and Technology Brands stores engaged in the sale of wireless products and services and other consumer electronics. Our Video Game Brands segments also include stand-alone collectibles stores. Segment results for the United States include retail operations in
50
states, the District of Columbia and Guam; our e-commerce websites www.gamestop.com and www.thinkgeek.com;
Game Informer
magazine; and Kongregate, our leading web and mobile gaming platform. Segment results for Canada include retail and e-commerce operations in Canada and segment results for Australia include retail and e-commerce operations in Australia and New Zealand. Segment results for Europe include retail operations in
10
European countries and e-commerce operations in
four
countries. The Technology Brands segment includes retail operations in the United States. We measure segment profit using operating earnings, which is defined as income from continuing operations before intercompany royalty fees, net interest expense and income taxes. Transactions between reportable segments consist primarily of royalties, management fees, intersegment loans and related interest. There were no material intersegment sales during fiscal
2016
,
2015
and
2014
.
Information on segments and the reconciliation of segment profit to earnings (loss) before income taxes are as follows (in millions):
|
As of and for the Fiscal Year Ended January 28, 2017
|
United
States
|
Canada
|
Australia
|
Europe
|
Technology Brands
|
Consolidated
|
||||||||||||||||||
|
Net sales
|
$
|
5,488.9
|
|
$
|
382.0
|
|
$
|
609.5
|
|
$
|
1,313.5
|
|
$
|
814.0
|
|
$
|
8,607.9
|
|
||||||
|
Segment operating earnings
|
430.2
|
|
22.4
|
|
34.9
|
|
26.0
|
|
44.2
|
|
557.7
|
|
||||||||||||
|
Interest income
|
0.8
|
|
||||||||||||||||||||||
|
Interest expense
|
(53.8
|
)
|
||||||||||||||||||||||
|
Earnings before income taxes
|
$
|
504.7
|
|
|||||||||||||||||||||
|
Other Information:
|
||||||||||||||||||||||||
|
Goodwill
|
$
|
1,199.7
|
|
$
|
28.6
|
|
$
|
70.1
|
|
$
|
74.8
|
|
$
|
352.0
|
|
$
|
1,725.2
|
|
||||||
|
Other long-lived assets
|
285.5
|
|
23.0
|
|
56.5
|
|
214.6
|
|
530.4
|
|
1,110.0
|
|
||||||||||||
|
Total assets
|
2,583.3
|
|
271.6
|
|
434.6
|
|
567.9
|
|
1,118.5
|
|
4,975.9
|
|
||||||||||||
|
Income tax expense (benefit)
|
140.6
|
|
6.0
|
|
7.7
|
|
(15.1
|
)
|
12.3
|
|
151.5
|
|
||||||||||||
|
Depreciation and amortization
|
92.9
|
|
3.8
|
|
9.4
|
|
25.0
|
|
34.1
|
|
165.2
|
|
||||||||||||
|
Capital expenditures
|
$
|
61.8
|
|
$
|
1.3
|
|
$
|
15.1
|
|
$
|
25.8
|
|
$
|
38.7
|
|
$
|
142.7
|
|
||||||
|
As of and for the Fiscal Year Ended January 30, 2016
|
United
States
|
Canada
|
Australia
|
Europe
|
Technology Brands
|
Consolidated
|
||||||||||||||||||
|
Net sales
|
$
|
6,435.1
|
|
$
|
446.6
|
|
$
|
591.4
|
|
$
|
1,356.7
|
|
$
|
534.0
|
|
$
|
9,363.8
|
|
||||||
|
Segment operating earnings
|
504.3
|
|
29.4
|
|
38.7
|
|
48.8
|
|
27.0
|
|
648.2
|
|
||||||||||||
|
Interest income
|
0.4
|
|
||||||||||||||||||||||
|
Interest expense
|
(23.4
|
)
|
||||||||||||||||||||||
|
Earnings before income taxes
|
$
|
625.2
|
|
|||||||||||||||||||||
|
Other Information:
|
||||||||||||||||||||||||
|
Goodwill
|
$
|
1,195.5
|
|
$
|
26.9
|
|
$
|
65.7
|
|
$
|
75.7
|
|
$
|
112.9
|
|
$
|
1,476.7
|
|
||||||
|
Other long-lived assets
|
329.9
|
|
17.6
|
|
47.0
|
|
200.3
|
|
321.3
|
|
916.1
|
|
||||||||||||
|
Total assets
|
2,698.5
|
|
259.2
|
|
382.2
|
|
401.7
|
|
588.7
|
|
4,330.3
|
|
||||||||||||
|
Income tax expense
|
195.0
|
|
6.1
|
|
8.3
|
|
4.1
|
|
8.9
|
|
222.4
|
|
||||||||||||
|
Depreciation and amortization
|
98.8
|
|
3.5
|
|
8.8
|
|
24.3
|
|
21.2
|
|
156.6
|
|
||||||||||||
|
Capital expenditures
|
$
|
76.9
|
|
$
|
4.4
|
|
$
|
12.8
|
|
$
|
20.2
|
|
$
|
58.9
|
|
$
|
173.2
|
|
||||||
F-31
|
As of and for the Fiscal Year Ended January 31, 2015
|
United
States
|
Canada
|
Australia
|
Europe
|
Technology Brands
|
Consolidated
|
||||||||||||||||||
|
Net sales
|
$
|
6,193.5
|
|
$
|
476.4
|
|
$
|
644.7
|
|
$
|
1,652.8
|
|
$
|
328.6
|
|
$
|
9,296.0
|
|
||||||
|
Segment operating earnings
|
483.2
|
|
28.3
|
|
38.0
|
|
35.9
|
|
32.9
|
|
618.3
|
|
||||||||||||
|
Interest income
|
0.7
|
|
||||||||||||||||||||||
|
Interest expense
|
(10.7
|
)
|
||||||||||||||||||||||
|
Earnings before income taxes
|
$
|
608.3
|
|
|||||||||||||||||||||
|
Other Information:
|
||||||||||||||||||||||||
|
Goodwill
|
$
|
1,143.3
|
|
$
|
29.5
|
|
$
|
72.1
|
|
$
|
78.9
|
|
$
|
66.6
|
|
$
|
1,390.4
|
|
||||||
|
Other long-lived assets
|
324.0
|
|
18.4
|
|
46.4
|
|
214.1
|
|
185.9
|
|
788.8
|
|
||||||||||||
|
Total assets
|
2,734.4
|
|
252.1
|
|
382.5
|
|
527.2
|
|
344.2
|
|
4,240.4
|
|
||||||||||||
|
Income tax expense (benefit)
|
198.1
|
|
4.2
|
|
8.4
|
|
(6.7
|
)
|
11.2
|
|
215.2
|
|
||||||||||||
|
Depreciation and amortization
|
102.5
|
|
3.8
|
|
9.6
|
|
30.8
|
|
7.7
|
|
154.4
|
|
||||||||||||
|
Capital expenditures
|
$
|
92.3
|
|
$
|
5.1
|
|
$
|
11.2
|
|
$
|
19.9
|
|
$
|
31.1
|
|
$
|
159.6
|
|
||||||
|
17.
|
Unaudited Quarterly Financial Information
|
The following table sets forth certain unaudited quarterly consolidated statement of operations information for the fiscal years ended
January 28, 2017
and
January 30, 2016
(in millions, except per share amounts). The unaudited quarterly information includes all normal recurring adjustments that our management considers necessary for a fair presentation of the information shown.
|
|
Fiscal Year 2016
|
Fiscal Year 2015
|
||||||||||||||||||||||||||||||
|
|
1st
Quarter
|
2nd
Quarter
|
3rd
Quarter
|
4th
Quarter (1) |
1st
Quarter
|
2nd
Quarter
|
3rd
Quarter
|
4th
Quarter
(1)
|
||||||||||||||||||||||||
|
Net sales
|
$
|
1,971.5
|
|
$
|
1,631.8
|
|
$
|
1,959.2
|
|
$
|
3,045.4
|
|
$
|
2,060.6
|
|
$
|
1,761.9
|
|
$
|
2,016.3
|
|
$
|
3,525.0
|
|
||||||||
|
Gross profit
|
675.5
|
|
617.7
|
|
708.2
|
|
1,007.9
|
|
639.0
|
|
580.5
|
|
655.6
|
|
1,043.2
|
|
||||||||||||||||
|
Operating earnings
|
114.0
|
|
58.3
|
|
98.8
|
|
286.6
|
|
123.9
|
|
51.7
|
|
90.7
|
|
381.9
|
|
||||||||||||||||
|
Net income
|
65.8
|
|
27.9
|
|
50.8
|
|
208.7
|
|
73.8
|
|
25.3
|
|
55.9
|
|
247.8
|
|
||||||||||||||||
|
Earnings per share:
|
||||||||||||||||||||||||||||||||
|
Basic
(2)
|
$
|
0.63
|
|
$
|
0.27
|
|
$
|
0.49
|
|
$
|
2.04
|
|
$
|
0.68
|
|
$
|
0.24
|
|
$
|
0.53
|
|
$
|
2.38
|
|
||||||||
|
Diluted
(2)
|
0.63
|
|
0.27
|
|
0.49
|
|
2.04
|
|
0.68
|
|
0.24
|
|
0.53
|
|
2.36
|
|
||||||||||||||||
|
Dividend declared per common share
|
$
|
0.37
|
|
$
|
0.37
|
|
$
|
0.37
|
|
$
|
0.37
|
|
$
|
0.36
|
|
$
|
0.36
|
|
$
|
0.36
|
|
$
|
0.36
|
|
||||||||
The following footnotes are discussed as pretax expenses.
|
(1)
|
The results of operations for the fourth quarter of fiscal 2016 include asset impairments of
$33.8 million
. The results of operations for the fourth quarter of fiscal 2015 include asset impairments of
$4.6 million
.
|
|
(2)
|
The sum of the quarters may not necessarily be equal to the full year net income per common share amount.
|
F-32
EXHIBIT INDEX
|
Exhibit
Number
|
Description
|
Previously Filed as an Exhibit to and
Incorporated by Reference From
|
Date Filed
|
|||
|
3.1
|
Third Amended and Restated Certificate of Incorporation.
|
Quarterly Report on Form 10-Q for the fiscal quarter ended August 3, 2013
|
September 11, 2013
|
|||
|
3.2
|
Fifth Amended and Restated Bylaws.
|
Current Report on Form 8-K
|
March 6, 2017
|
|||
|
4.2
|
Indenture, dated as of September 24, 2014, by and among GameStop Corp. as Issuer, the Subsidiary Guarantors party thereto as Subsidiary Guarantors and U.S. Bank National Association as Trustee.
|
Current Report on Form 8-K
|
September 24, 2014
|
|||
|
4.3
|
Form of 5.5% Senior Notes due 2019.
|
Current Report on Form 8-K
|
September 24, 2014
|
|||
|
4.4
|
First Supplemental Indenture to the Indenture
dated as of September 24, 2014, dated as of March
7, 2016, by and among GameStop Corp., the
guarantors named therein and U.S. Bank National
|
Current Report on Form 8-K
|
March 9, 2016
|
|||
|
4.5
|
Indenture, dated as of March 9 2016, by and
among GameStop Corp. as Issuer, the Subsidiary
Guarantors party thereto as Subsidiary
|
Current Report on Form 8-K
|
March 9, 2016
|
|||
|
4.6
|
Form of 6.75% Senior Notes due 2021.
|
Current Report on Form 8-K
|
March 9, 2016
|
|||
|
10.1*
|
Fourth Amended and Restated 2001 Incentive Plan.
|
Definitive Proxy Statement for 2009 Annual Meeting of Stockholders
|
May 22, 2009
|
|||
|
10.2*
|
Amended and Restated 2011 Incentive Plan.
|
Current Report on Form 8-K
|
June 27, 2013
|
|||
|
10.3*
|
Second Amended and Restated Supplemental Compensation Plan.
|
Definitive Proxy Statement for 2008 Annual Meeting of Stockholders
|
May 23, 2008
|
|||
|
10.4*
|
Form of Option Agreement.
|
Annual Report on Form 10-K for the fiscal year ended January 29, 2005
|
April 11, 2005
|
|||
|
10.5*
|
Form of Restricted Share Agreement.
|
Current Report on Form 8-K
|
March 9, 2015
|
|||
|
10.6*
|
Executive Employment Agreement, dated as of May 10, 2013, between GameStop Corp. and Daniel A. DeMatteo.
|
Current Report on Form 8-K
|
May 13, 2013
|
|||
|
10.7*
|
Executive Employment Agreement, dated as of May 10, 2013, between GameStop Corp. and J. Paul Raines.
|
Current Report on Form 8-K
|
May 13, 2013
|
|||
|
10.8*
|
Executive Employment Agreement between GameStop Corp. and J. Paul Raines, as amended and restated on November 13, 2013.
|
Current Report on Form 8-K
|
November 15, 2013
|
|||
|
10.9*
|
Executive Employment Agreement, dated as of May 10, 2013, between GameStop Corp. and Tony D. Bartel.
|
Current Report on Form 8-K
|
May 13, 2013
|
|||
|
10.10*
|
Executive Employment Agreement, dated as of May 10, 2013, between GameStop Corp. and Robert A. Lloyd.
|
Current Report on Form 8-K
|
May 13, 2013
|
|||
|
10.11*
|
Executive Employment Agreement, dated as of May 10, 2013, between GameStop Corp. and Michael K. Mauler.
|
Current Report on Form 8-K
|
May 13, 2013
|
|||
|
10.12*
|
Executive Employment Agreement, dated as of May 10, 2013, between GameStop Corp. and Michael P. Hogan.
|
Annual Report on Form 10-K for the fiscal year ended February 1, 2014
|
April 2, 2014
|
|||
|
10.13*
|
Retirement Policy.
|
Current Report on Form 8-K
|
March 11, 2014
|
|||
|
10.15
|
Mortgage, Security Agreement, and Assignment and Deeds of Trust, dated October 11, 2005, between GameStop of Texas, L.P. and Bank of America, N.A., as Collateral Agent.
|
Current Report on Form 8-K
|
October 12, 2005
|
|||
|
10.17
|
Second Amended and Restated Credit Agreement, dated as of March 25, 2014, by and among GameStop Corp., certain subsidiaries of GameStop Corp., Bank of America, N.A. and the other lending institutions listed therein, Bank of America, N.A., as Issuing Bank, Bank of America, N.A., as Agent, JPMorgan Chase Bank, N.A., as Syndication Agent and Wells Fargo Bank, National Association, U.S. Bank National Association, and Regions Bank as Co-Documentation Agents and Merrill Lynch, Pierce, Jenner & Smith Incorporated as sole lead arranger and bookrunner.
|
Current Report on Form 8-K
|
March 28, 2014
|
|||
|
10.18
|
Second Amended and Restated Security Agreement, dated as of March 25, 2014.
|
Current Report on Form 8-K
|
March 28, 2014
|
|||
|
10.19
|
Second Amended and Restated Patent and Trademark Security Agreement, dated as of March 25, 2014.
|
Current Report on Form 8-K
|
March 28, 2014
|
|||
|
10.20
|
Second Amended and Restated Pledge Agreement, dated as of March 25, 2014.
|
Current Report on Form 8-K
|
March 28, 2014
|
|||
|
10.21
|
First Amendment to Second Amended and Restated Credit Agreement dated as of September 15, 2014, by and among GameStop Corp., the Borrowers party thereto, the Lenders party thereto and Bank of America, N.A.
|
Current Report on Form 8-K
|
September 16, 2014
|
|||
|
10.22*
|
Executive Employment Agreement, dated as of May 10, 2013, between GameStop Corp. and Michael T. Buskey.
|
Annual Report on Form 10-K for the fiscal year ended January 30, 2015
|
March 28, 2016
|
|||
|
10.23*
|
Executive Employment Agreement, dated as of May 10, 2013, between GameStop Corp. and Troy W. Crawford.
|
Annual Report on Form 10-K for the fiscal year ended January 30, 2015
|
March 28, 2016
|
|||
|
21.1
|
Subsidiaries.
|
Filed herewith.
|
||||
|
23.1
|
Consent of Deloitte & Touche LLP.
|
Filed herewith.
|
||||
|
31.1
|
Certification of Chief Executive Officer pursuant to Rule 13a-14(a)/15d-14(a) under the Securities Exchange Act of 1934, as adopted pursuant to Section 302 of the Sarbanes-Oxley Act of 2002.
|
Filed herewith.
|
||||
|
31.2
|
Certification of Chief Financial Officer pursuant to Rule 13a-14(a)/15d-14(a) under the Securities Exchange Act of 1934, as adopted pursuant to Section 302 of the Sarbanes-Oxley Act of 2002.
|
Filed herewith.
|
||||
|
32.1
|
Certification of Chief Executive Officer pursuant to Rule 13a-14(b) under the Securities Exchange Act of 1934 and 18 U.S.C. Section 1350, as adopted pursuant to Section 906 of the Sarbanes-Oxley Act of 2002.
|
Furnished herewith.
|
||||
|
32.2
|
Certification of Chief Financial Officer pursuant to Rule 13a-14(b) under the Securities Exchange Act of 1934 and 18 U.S.C. Section 1350, as adopted pursuant to Section 906 of the Sarbanes-Oxley Act of 2002.
|
Furnished herewith.
|
||||
|
101.INS
|
XBRL Instance Document.
|
Submitted electronically herewith.
|
||||
|
101.SCH
|
XBRL Taxonomy Extension Schema.
|
Submitted electronically herewith.
|
||||
|
101.CAL
|
XBRL Taxonomy Extension Calculation Linkbase.
|
Submitted electronically herewith.
|
||||
|
101.DEF
|
XBRL Taxonomy Extension Definition Linkbase.
|
Submitted electronically herewith.
|
||||
|
101.LAB
|
XBRL Taxonomy Extension Label Linkbase.
|
Submitted electronically herewith.
|
||||
|
101.PRE
|
XBRL Taxonomy Extension Presentation Linkbase.
|
Submitted electronically herewith.
|
||||
* This exhibit is a management or compensatory contract.
TABLE OF CONTENTS
Part IItem 1. BusinessItem 1A. Risk FactorsItem 1B. Unresolved Staff CommentsItem 2. PropertiesItem 3. Legal ProceedingsItem 4. Mine Safety DisclosuresPart IIItem 5. Market For Registrant's Common Equity, Related Stockholder Matters and Issuer Purchases Of Equity SecuritiesItem 6. Selected Financial DataItem 7. Management's Discussion and Analysis Of Financial Condition and Results Of OperationsItem 7A. Quantitative and Qualitative Disclosures About Market RiskItem 8. Financial Statements and Supplementary DataItem 9. Changes in and Disagreements with Accountants on Accounting and Financial DisclosureItem 9A. Controls and ProceduresItem 9B. Other InformationPart IIIItem 10. Directors, Executive Officers and Corporate Governance*Item 11. Executive Compensation*Item 12. Security Ownership Of Certain Beneficial Owners and Management and Related Stockholder Matters*Item 13. Certain Relationships and Related Transactions, and Director Independence*Item 14. Principal Accountant Fees and Services*Part IVItem 15. Exhibits and Financial Statement ScheduleItem 16. Form 10-k Summary