GLOBUS MEDICAL INC
10-Ks and 10-Qs
|
|
|
|
|
|
|
|
|
|
|
|
|
|
|
|
|
|
|
|
|
|
|
|
|
|
|
|
|
|
|
|
|
|
|
|
|
|
|
|
|
|
|
|
UNITED STATES
SECURITIES AND EXCHANGE COMMISSION
Washington, D.C. 20549
_________________________
FORM 10-K
(Mark One)
|
x
|
ANNUAL REPORT PURSUANT TO SECTION 13 OR 15(d)
|
OF THE SECURITIES EXCHANGE ACT OF 1934
For the fiscal year ended
December 31, 2016
or
|
o
|
TRANSITION REPORT PURSUANT TO SECTION 13 OR 15(d)
|
OF THE SECURITIES EXCHANGE ACT OF 1934
For the transition period from ______________ to _______________
Commission File No. 001-35621
GLOBUS MEDICAL, INC.
(Exact name of registrant as specified in its charter)
|
DELAWARE
|
04-3744954
|
|
|
(State or other jurisdiction of incorporation or organization)
|
(I.R.S. Employer Identification No.)
|
|
|
2560 General Armistead Avenue, Audubon, PA
|
19403
|
|
|
(Address of principal executive offices)
|
(Zip Code)
|
|
|
Registrant’s telephone number, including Area Code:
|
||
|
(610) 930-1800
|
||
Securities registered pursuant to Section 12(b) of the Act:
|
Title of each class
|
Name of each exchange on which registered
|
|
Class A Common Stock, par value $.001 per share
|
New York Stock Exchange
|
Securities registered pursuant to Section 12(g) of the Act:
None
Indicate by check mark if the registrant is a well-known seasoned issuer, as defined in Rule 405 of the Securities Act:
|
Yes
o
|
No
x
|
Indicate by check mark if the registrant is not required to file reports pursuant to Section 13 or Section 15(d) of the Act:
|
Yes
o
|
No
x
|
Indicate by check mark whether the registrant (1) has filed all reports required to be filed by Section 13 or 15(d) of the Securities Exchange Act of 1934 during the preceding 12 months (or for such shorter period that the registrant was required to file such reports), and (2) has been subject to such filing requirements for the past 90 days:
|
Yes
x
|
No
o
|
Indicate by check mark whether the registrant has submitted electronically and posted on its corporate Web site, if any, every Interactive Data File required to be submitted and posted pursuant to Rule 405 of Regulation S-T (§232.405 of this chapter) during the preceding 12 months (or for such shorter period that the registrant was required to submit and post such files):
|
Yes
x
|
No
o
|
Indicate by check mark if disclosure of delinquent filers pursuant to Item 405 of Regulation S-K (§229.405) is not contained herein, and will not be contained, to the best of the registrant’s knowledge, in definitive proxy or information statements incorporated by reference in Part III of this Form 10-K or any amendment to this Form 10-K:
o
Indicate by check mark whether the registrant is a large accelerated filer, an accelerated filer, a non-accelerated filer, or a smaller reporting company. See the definitions of “large accelerated filer,” “accelerated filer” and “smaller reporting company” in Rule 12b-2 of the Exchange Act. (check one):
|
Large accelerated filer
x
|
Accelerated filer
o
|
Non-accelerated filer
o
(Do not check if a smaller reporting company)
|
Smaller reporting company
o
|
Indicate by check mark whether the registrant is a shell company (as defined in Rule 12b-2 of the Act):
Yes
¨
No
x
The aggregate market value of the voting and non-voting common equity held by non-affiliates of the registrant, computed by reference to the closing sales price for the registrant’s common stock on the last business day of the registrant’s most recently completed second quarter, June 30,
2016
, as reported on the New York Stock Exchange, was approximately
$1.7 billion
.
The number of shares outstanding of the registrant’s common stock (par value $0.001 per share) as of
February 28, 2017
was
95,972,637
shares.
DOCUMENTS INCORPORATED BY REFERENCE
Portions of our Proxy Statement for our
2017
Annual Meeting of Stockholders, to be filed within 120 days of
December 31, 2016
, are incorporated by reference in Part III, Items 10, 11, 12, 13 and 14 herein of this Annual Report. Such Proxy Statement, except for the parts therein which have been specifically incorporated by reference, shall not be deemed “filed” for the purposes of this Annual Report on Form 10-K.
GLOBUS MEDICAL, INC. AND SUBSIDIARIES
TABLE OF CONTENTS
|
Page
|
||
|
PART I
|
||
|
Item 1.
|
Business
|
|
|
Item 1A.
|
Risk Factors
|
|
|
Item 1B.
|
Unresolved Staff Comments
|
|
|
Item 2.
|
Properties
|
|
|
Item 3.
|
Legal Proceedings
|
|
|
Item 4.
|
Mine Safety Disclosures
|
|
|
PART II
|
||
|
Item 5.
|
Market for Registrant’s Common Equity, Related Stockholder Matters and Issuer Purchases of Equity Securities
|
|
|
Item 6.
|
Selected Financial Data
|
|
|
Item 7.
|
Management’s Discussion and Analysis of Financial Condition and Results of Operations
|
|
|
Item 7A.
|
Quantitative and Qualitative Disclosures About Market Risk
|
|
|
Item 8.
|
Financial Statements and Supplementary Data
|
|
|
Item 9.
|
Changes in and Disagreements With Accountants on Accounting and Financial Disclosure
|
|
|
Item 9A.
|
Controls and Procedures
|
|
|
Item 9B.
|
Other Information
|
|
|
PART III
|
||
|
Item 10.
|
Directors, Executive Officers and Corporate Governance
|
|
|
Item 11.
|
Executive Compensation
|
|
|
Item 12.
|
Security Ownership of Certain Beneficial Owners and Management and Related Stockholder Matters
|
|
|
Item 13.
|
Certain Relationships and Related Transactions, and Director Independence
|
|
|
Item 14.
|
Principal Accountant Fees and Services
|
|
|
PART IV
|
||
|
Item 15
|
Exhibits and Financial Statement Schedules
|
|
|
SIGNATURES
|
||
3
CAUTIONARY NOTE CONCERNING FORWARD-LOOKING STATEMENTS
This Annual Report on Form 10-K contains forward-looking statements within the meaning of the Private Securities Litigation Reform Act of 1995, Section 27A of the Securities Act of 1933, as amended (the “Securities Act”), and Section 21E of the Securities Exchange Act of 1934, as amended (the “Exchange Act”). All statements other than statements of historical fact are forward-looking statements. We have tried to identify forward-looking statements by using words such as “believe,” “may,” “might,” “could,” “will,” “aim,” “estimate,” “continue,” “anticipate,” “intend,” “expect,” “plan” and similar words. These forward-looking statements are based on our current assumptions, expectations and estimates of future events and trends. Forward-looking statements are only predictions and are subject to many risks, uncertainties and other factors that may affect our businesses and operations and could cause actual results to differ materially from those predicted. These risks and uncertainties include, but are not limited to, factors affecting our quarterly results, our ability to manage our growth, our ability to sustain our profitability, demand for our products, our ability to compete successfully (including without limitation our ability to convince surgeons to use our products and our ability to attract and retain sales and other personnel), our ability to rapidly develop and introduce new products, our ability to develop and execute on successful business strategies, our ability to comply with changes and applicable laws and regulations that are applicable to our businesses, our ability to safeguard our intellectual property, our success in defending legal proceedings brought against us, trends in the medical device industry, general economic conditions, and other risks set forth throughout this Annual Report, including under
“Item 1, Business,” “Item 1A, Risk Factors,”
and
“Item 7, Management’s Discussion and Analysis of Financial Condition and Results of Operations,”
and those discussed in other documents we file with the Securities and Exchange Commission (the “SEC”). Moreover, we operate in an evolving environment. New risk factors and uncertainties emerge from time to time and it is not possible for us to predict all risk factors and uncertainties, nor can we assess the impact of all factors on our business or the extent to which any factor, or combination of factors, may cause actual results to differ materially from those contained in any forward-looking statements.
Given these risks and uncertainties, readers are cautioned not to place undue reliance on any forward-looking statements. Forward-looking statements contained in this Annual Report speak only as of the date of this Annual Report. We undertake no obligation to update any forward-looking statements as a result of new information, events or circumstances or other factors arising or coming to our attention after the date hereof.
Overview
Globus Medical, Inc. (“Globus,” “we,” “us” or “our”) is a medical device company focused on developing products that promote healing in patients with musculoskeletal disorders. We are currently focused on products to treat patients with spine disorders. We have also developed a robotic surgical navigation device as well as products to treat patients who have experienced orthopedic trauma and expect to begin selling these products in 2017, but development efforts for these products are still ongoing and we currently have no robotic or orthopedic trauma products cleared for sale by the U.S. Food and Drug Administration (“FDA”).
We are an engineering-driven company with a history of rapidly developing and commercializing innovative products and procedures to assist surgeons in effectively treating their patients. Since our inception in 2003, we have launched over
170
products and offer a comprehensive portfolio of innovative and differentiated products addressing a broad array of spinal pathologies, anatomies and surgical approaches.
4
We continue to devote significant efforts to the development of new and innovative technologies for the treatment of patients with spine disorders. In
2016
, those efforts resulted in the launch of
seventeen
new products.
All of our current products fall into one of two categories: Innovative Fusion or Disruptive Technologies. Our Innovative Fusion products comprise fusion products designed to treat a wide variety of spinal disorders for the entire spine and can be used in a variety of surgical approaches. We believe our Innovative Fusion products have features and characteristics that provide advantages for surgeons and potentially contribute to better outcomes for patients as compared to competing traditional fusion products.
We define Disruptive Technologies as those that represent a significant shift in the treatment of spinal disorders by allowing for novel surgical procedures, improvements to existing surgical procedures and/or the treatment of spinal disorders earlier in the continuum of care. We believe the use of Disruptive Technologies may improve patient outcomes and reduce costs given the expected lower morbidity rates, shorter patient recovery times and shorter hospital stays associated with these procedures. Additionally, Disruptive Technologies may help patients avoid progression of spinal disc disease sometimes caused by traditional surgical options such as spinal fusion. Our current portfolio of approved and pipeline Disruptive Technology products includes products that allow for minimally invasive surgical (“MIS”) techniques, as well as new treatment alternatives, including motion preservation technologies, such as dynamic stabilization, total disc replacement and interspinous process spacer products; regenerative biologics technologies; and interventional pain management solutions, including treatments for vertebral compression fractures.
While we group our products into two categories, our products are not limited to a particular technology, platform or surgical approach. Instead, our goal is to offer spine surgeons a complete suite of products they can use to most effectively treat their patients, based on the patient’s specific anatomy and condition and the surgeon’s particular training and surgical preference.
On September 1, 2016, we acquired the international operations and distribution channels of Alphatec Holdings, Inc. (“Alphatec”), a publicly traded medical devices company, for $80.1 million in cash, subject to certain closing adjustments (the “Alphatec International Transaction”).
This acquisition provides us immediate access to Japan and increased presence and penetration in other key geographies, roughly doubling our international sales. We also acquired a talent pool of international sales professionals as well as an extensive network of international distributors.
We also agreed to extend a 5-year senior secured credit facility of up to $30.0 million to Alphatec to support their working capital needs. Globus intends to offer its own products through the sales channels acquired from Alphatec, but for some period of time we will continue to sell Alphatec products. The Alphatec International transaction included a supply agreement through which Alphatec will supply its products to Globus Medical for up to five years
as we seek to transition those customers to Globus products
.
Strategy
Our goal is to become the leader in providing innovative solutions to promote healing in patients with musculoskeletal disorders. To achieve this goal, we are employing the following business strategies:
|
•
|
Leverage our integrated product development engine
. We plan to continue developing new spine products as well as additional robotic and trauma products using our product development engine. We believe our team-oriented approach, active surgeon input and demonstrated product development capabilities position us to maintain a rapid rate of new product launches. We launched
seventeen
new products in
2016
, have over
30
potential new products in various stages
|
5
of development, and expect to launch approximately five to ten new products in each of the next three years.
|
•
|
Increase the size, scope and productivity of our exclusive U.S. sales force
. We believe there is significant opportunity for us to further penetrate existing markets and to enter new markets by increasing the size and geographic scope of our exclusive U.S. sales force. We expect to continue to increase the number of our direct and distributor sales representatives in the United States to expand into new geographic territories and to deepen our penetration in existing territories. We will also continue to provide our sales representatives with specialized development programs designed to improve their productivity. In addition, we have begun to build exclusive sales forces in the U.S. and internationally to support the anticipated launch of our robotics and trauma products.
|
|
•
|
Continue to expand into international markets
. In 2016, we significantly increased our international presence through the acquisition of the international operations and distribution channels of Alphatec Holdings, Inc. As of
December 31, 2016
, we had an existing direct or distributor sales presence in
49
countries outside the United States. We expect to continue to increase our international presence through the commercialization of additional products, including our robotics and trauma products, and through the expansion of our international sales force.
|
|
•
|
Pursue strategic acquisitions and alliances
. We intend to selectively pursue acquisitions and alliances in the future that will provide us with new or complementary technologies, personnel with significant relevant experience, or increased market penetration. We are currently evaluating a number of possible acquisitions or strategic relationships and believe that our resources and experience make us an attractive acquirer or partner.
|
The Spine Market
Spine disorders are a leading driver of healthcare costs worldwide. Spine disorders range in severity from mild pain and loss of feeling to extreme pain and paralysis. These disorders are primarily caused by degenerative conditions in the spine, deformity, tumors and trauma.
Treatment alternatives for spine disorders range from non-operative conservative therapies to surgical interventions. Conservative therapies include bed rest, medication and physical therapy. When conservative therapies fail to provide adequate quality of life improvements, surgical interventions may be used to address pain. Surgical treatments for spine disorders can be instrumented, which include the use of implants, or non-instrumented, which forego the use of any such implants.
We believe the spine market will continue to experience growth as a result of the following market influences:
|
•
|
Favorable patient demographics.
The number of people between 40 to 80 years old is large and growing. Improvements in healthcare have led to increasing life expectancies worldwide and the opportunity to lead more active lifestyles at advanced ages. These trends are expected to generate increased demand for spine surgeries.
|
|
•
|
Improving technologies leading to increased use in fusion procedures.
Due to the longevity of its practice and acceptable clinical outcomes, fusion has become a standard treatment option for patients presenting more advanced stages of spine disease. We expect that the development of
|
6
improved fusion products will continue to contribute to spinal fusion as a leading treatment for advanced stages of spine disease.
|
•
|
Disruptive Technologies driving earlier interventions and creating an expanded patient base.
Newer technology products and procedures are gaining increasing acceptance among patients and surgeons because they allow for novel surgical procedures, improvements to existing surgical procedures, the treatment of spine disorders by new physician specialties, and surgical intervention earlier in the continuum of care, all of which may result in better outcomes for patients. As a result, we expect Disruptive Technologies to drive accelerated growth and increase the size of the addressable patient population for spine surgery.
|
|
•
|
Continued growth of spine procedures worldwide.
While the United States comprises approximately
4%
of the worldwide population, we believe that approximately one-half of all spine surgeries occur in the United States. We believe that improvements to the standard of care outside of the United States will increase the international demand for spine products.
|
The Globus Solution
We currently offer over
170
products for the treatment of spine disorders.
Innovative Fusion Products
Our Innovative Fusion products include a range of implant and surgical approach options to treat degenerative, deformity, tumor, and trauma conditions along the entire spine, from the occiput to the sacrum. We believe our products provide advantages over traditional fusion products that may help improve surgical techniques, and may contribute to better outcomes for patients.
For example, in 2016 we launched
QUARTEX
®
, our Occipito-Cervico-Thoracic (“OCT”) stabilization system. QUARTEX
®
was designed to address a number of challenges associated with posterior OCT fusion to aid in easier construct assembly. QUARTEX
®
features a threading locking cap to enable quick and efficient low-torque single step locking and high angle screw heads that accommodate rods of different diameters. The QUARTEX
®
system also includes a comprehensive range of instruments, including threaded drivers and streamlined reduction tools. Our Innovative Fusion products also include the Alphatec products we began distributing following the Alphatec International Transaction.
We also launched new additions to the CREO
®
platform in 2016, including the CREO
®
4.75 System, designed to address deformity correction via a minimally invasive thoracoscopic or mini-open anterior approach. The CREO
®
4.75 System features streamlined instruments, a unique non-threaded locking cap designed specifically for deformity correction, and an extensive selection of hydroxyapatite coated screws to aid in obtaining bicortical purchase and enhanced fixation.
Disruptive Technologies Products
We believe we are well positioned to capitalize on this higher-growth segment of the spine market given our multiple existing commercialized products and several products in various stages of development. We have a broad, comprehensive product portfolio and pipeline of Disruptive Technologies, including our expandable cages, MIS, motion preservation, and regenerative biologics technologies, as well as interventional pain management solutions.
Globus markets an innovative line of expandable interbody fusion devices designed to be inserted at a minimized height and then expanded during surgery to obtain optimal fit between vertebral bodies. This
7
expandability feature allows for restoration of height following disc removal while easing insertion into the disc space, helping to reduce trauma to the vertebral endplates as well as the surrounding tissue.
Our MIS products enable a surgeon to perform a procedure less invasively to minimize tissue disruption and maximize native anatomy, which may lead to better patient recovery and fewer approach-related complications. For example, COALITION MIS
™
, a 2016 addition to our COALITION
®
line of cervical interbody fusion devices, is an integrated plate-spacer designed to deliver fixation in fewer procedural steps through a less invasive surgical corridor than traditional integrated spacers. COALITION MIS
™
is compatible with both anchors and screws, providing multiple intraoperative options for securing the spacer to the vertebral bodies. In addition, the innovative instrumentation for COALITION MIS
™
allows the introduction of both the spacer and the screws or anchors into the disc space through an access window approximately the same size as the spacer itself. INDEPENDENCE MIS
™
, also introduced in 2016, is an integrated plate-spacer similar to COALITION MIS
™
but designed for the lumbar spine. We offer a variety of additional innovative fixation options including plates and pedicle screw systems designed for minimally invasive insertion.
Similarly, other Disruptive Technology products include our motion preservation offerings, such as SECURE
®
-C, SECURE
®
-CR and SECURE
®
-C3, which are next-generation cervical arthroplasty devices that allow segmental motion, are semi-constrained, and provide alternatives to fusion in the treatment of degenerative conditions.
Regenerative biologics products, including bioactive glass-based KINEX
®
and SIGNIFY
™
bone void fillers and CONDUCT
®
ceramic-collagen, are well suited for pelvic/extremity and posterolateral spinal fusion procedures. ViaSorb
™
Cubes and Strips, launched in 2016, are demineralized cancellous sponges that provide a natural osteoconductive scaffold with unique compressive capabilities that facilitate packing into bony voids and within allograft spacers. The porous structure of ViaSorb
™
Sponges allows for adsorption of osteogenic cells from autologous bone marrow aspirate.
Emerging Technologies Products
In January 2017 we announced our European Conformity mark (“CE mark”) of Excelsius GPS
™
, a system providing robotic trajectory guidance and navigation. The Excelsius GPS
™
technology supports both minimally invasive and open orthopedic and neurosurgical procedures, with applications ranging from the cervical spine to the sacroilium, long bones and cranium. Excelsius GPS
™
integrates with Globus implants and instruments and is compatible with pre-operative CT, intra-operative CT and fluoroscopic imaging modalities. The system is designed to minimize radiation exposure, streamline workflow, and reproducibly assist in implant placement. Excelsius GPS
™
is currently not cleared for sale in the United States.
We have also developed products to treat patients who have experienced orthopedic trauma and expect to begin selling these products in 2017, although development efforts for these products are still ongoing and we currently have no orthopedic trauma products with CE marking or cleared for sale by the FDA.
Product Development and Research
Globus was founded with a goal of leveraging our team’s extensive experience in the spine industry to use a distinctive product development process that significantly reduces the length of time between a product’s conception and commercialization. Our product development engine is the name we give to our particular approach to product development, which we believe is unique and highly efficient. We employ an integrated team approach to product development that involves collaboration among surgeons, our engineers, our dedicated researchers, our highly-skilled machinists, and our regulatory personnel. We believe
8
that utilizing these integrated teams, as well as our extensive in-house facilities, allows us to design, test, and obtain timely regulatory clearance and approvals of our products. We also believe that our product development engine enables us to develop products that provide advantages for surgeons and contribute to better outcome for patients.
Our product development efforts are supported by our in-house research capabilities. We believe that centralizing and consolidating the critical elements of the product development and commercialization process in one facility allows us to bring products from the concept stage to the market rapidly in order to respond to surgeon and patient needs. Research resources include a clinical research group, a mechanical testing laboratory, a spinal kinematics laboratory, a tribology laboratory, a cadaveric laboratory, a materials characterization laboratory, and a computational laboratory.
The markets in which we operate are subject to rapid technological advancements. We must constantly improve existing products and introduce new products in order to continue to succeed. Accordingly, we have made significant investments in our product development and research capabilities. For the years ended
December 31, 2016
,
2015
and
2014
, we spent
$44.5 million
,
$36.3 million
and
$31.2 million
, respectively, including costs from our Emerging Technologies group, on research and development.
Sales and Marketing
We market and sell our products through our exclusive global sales force. As of
December 31, 2016
, we had a direct or distributor sales presence in the United States and in
49
countries outside the United States. We expect to continue to increase the number of our direct and distributor sales representatives, both in the U.S. and internationally, to expand into new geographic territories and to deepen our penetration in existing territories. We believe the expansion of our U.S. and international sales forces provides us with significant opportunities for future growth as we continue to penetrate existing geographic markets and enter new ones.
Our sales representatives are present in the operating room during most surgeries in the United States and in many, but not all, of the other countries in which our products are sold. These representatives have the responsibility to confirm that all of the items needed in the surgery are available and are provided sterile or are capable of being sterilized at the hospital. Various sizes and quantities of implants are made available to be able to satisfy varying surgical requirements and patient anatomy, along with numerous surgical instruments and cases needed to safely perform the surgery and implantation. As products are used in surgeries, replacement items are shipped to our sales representatives and hospitals to replenish their supply.
All of our independent distributors are compensated solely on commission. Most of our new direct sales representatives start with a compensation arrangement that is largely based on salary. Our goal is to have members of our direct sales force move toward a compensation model based solely on commission as they become familiar with our products and drive higher sales.
We are in the process of building exclusive sales forces for our robotic surgical navigation and orthopedic trauma businesses and expect to expand those teams in the U.S. and internationally in 2017 as we grow closer to commercializing products in these areas.
9
Advancement of Spine Care
We are committed to the advancement of spine care through our support of numerous educational and research programs geared towards spine surgeons, such as:
|
•
|
national and regional educational courses;
|
|
•
|
intensive hands-on cadaveric training on new products and new techniques;
|
|
•
|
research collaboration and support;
|
|
•
|
educational support; and
|
|
•
|
fellowship support.
|
Globus devotes significant resources to training and educating surgeons in the safe and effective use of our products and techniques. To that end, we have made significant investments in the creation, staffing and program offerings of our Musculoskeletal Education and Research Center (“MERC”). Through MERC, educational and training programs are offered at our modern bioskills laboratory and 100 person lecture facility, and through regionally-based didactic education and cadaveric bioskills training programs at off-site facilities.
We are highly focused on training through programs such as our Skin-to-Skin
®
Series programs that feature intensive two day MIS training programs on thoracolumbar interbody fusion procedures and our lateral lumbar interbody fusion labs. To complement these intensive cadaveric bioskills training programs, we also conduct product-based programs providing surgeons with informative didactic sessions coupled with hands-on-lab segments to allow surgeons to learn and experience new instrumentation and techniques. For more complex procedures and techniques, surgeon preceptorships are offered which provide surgeons with one-on-one intraoperative training followed in some instances by focused bioskills labs.
Globus has a strong commitment to research performed in conjunction with surgeons from around the world as well as research opportunities in collaboration with leading academic institutions. Supported by a large, focused research team, these efforts range from basic biomechanical testing conducted internally with our six degrees of freedom machine to support of major clinical outcomes studies. We are committed to providing the spine surgeon community with high quality research to support the new surgical techniques and novel product designs that we develop.
Competition
We believe that our significant competitors are Medtronic, the DePuy Synthes Companies (a division of Johnson & Johnson), Stryker and NuVasive. Alphatec Spine, Orthofix International, Zimmer Biomet, K2M and other smaller public and private companies are also competitors of ours. At any time, these or other market participants may develop alternative treatments, products or procedures for the treatment of spine disorders that compete directly or indirectly with our products. They may also develop and patent processes or products earlier than we can, or obtain regulatory clearance or approvals for competing products more rapidly than we can.
We compete in the marketplace to recruit and retain qualified scientific, management and sales personnel, as well as in acquiring technologies and technology licenses complementary to our products or advantageous to our business.
10
Our currently marketed products are, and any future products we commercialize will be, subject to intense competition. Many of our current and potential competitors are major medical device companies that have substantially greater financial, technical and marketing resources than we do, and they may succeed in developing products that would render our products obsolete or noncompetitive. In addition, many of these competitors have significantly longer operating history and more established reputations than we do. The markets we compete in are intensely competitive, subject to rapid change and highly sensitive to the introduction of new products or other market activities of industry participants. Our ability to compete successfully depends on our ability to develop proprietary products that reach the market in a timely manner, receive adequate coverage and reimbursement, and are safer, less invasive and more effective than alternatives available for similar purposes. Because of the size of the potential market, we anticipate that companies will dedicate significant resources to developing competing products.
Manufacturing and Supply
We have greatly expanded our dedicated in-house implant manufacturing capabilities. A significant portion of our implant products is manufactured in our facilities in Eagleville, Pennsylvania. Most of our regenerative biologics products are processed in our facilities in San Antonio, Texas, and in Audubon, Pennsylvania.
However, most of our products are generally manufactured through a network of over 100 third-party suppliers. Our suppliers utilize high precision, computer-aided manufacturing equipment to manufacture our products. We have focused on developing a strong supplier base as part of our manufacturing strategy. Our relationship with our suppliers enables significant interaction between our design engineers and project managers and the suppliers’ engineers and schedulers to work through issues arising during the entire product development cycle. Many of our suppliers are domestic, which affords our engineers and other members of our product development team the opportunity to work closely with them to commercialize our products.
We select our suppliers carefully and generally use a small number of suppliers for each of our key products for added reliability. Our internal quality assurance group evaluates the potential vendor through a formal vendor approval process before we enter into a relationship with the vendor. Suppliers that meet our internal quality assurance standards are added to our approved supplier list. All of our suppliers that provide us with implants or human tissue are ISO-13485 certified, meaning they meet the International Organization for Standardization (“ISO”) requirements for the manufacture of medical devices, and/or are accredited by the American Association of Tissue Banks. Our quality assurance group conducts periodic audits to ensure continued compliance with our standards. With every shipment of inventory that we receive, our suppliers provide a certificate of compliance with our quality control standards. Our receiving group also performs inspections, packaging and labeling onsite at our headquarters facility.
We work closely with our suppliers to ensure that our inventory needs are met while maintaining high quality and reliability. To date, we have not experienced significant difficulty in locating and obtaining the materials necessary to fulfill our production requirements, and we have not experienced a meaningful backlog of sales orders. We believe our supplier relationships and facilities will support our potential capacity needs for the foreseeable future.
A majority of our product inventory is held primarily with our sales representatives and at hospitals throughout the United States. We stock inventory in our warehouse facilities and retain title to consigned inventory which is maintained with our field representatives and hospitals in sufficient quantities so that products are available when needed for surgical procedures. Safety stock levels are determined based on a number of factors, including demand, manufacturing lead times and quantities required to maintain service levels.
11
Intellectual Property
We protect our proprietary rights through a variety of methods. In particular, we rely on patent, trademark, copyright, trade secret and other intellectual property laws and also utilize nondisclosure agreements and other measures to protect our rights.
As of
December 31, 2016
,
we owned 548 issued U.S. patents (533 utility patents; 15 design patents) and had applications pending for 443 U.S. patents (442 utility patents; 1 design patent), and we owned 140 issued foreign patents and had applications pending for 220 foreign patents. Our issued patents expire between November 2019 and July 2035.
Our trademark portfolio contains 180 registered trademarks and 53 pending trademarks. Our portfolio includes domestic and foreign trademarks with associated logos and tag lines.
Third-Party Coverage and Reimbursement
We expect that, in the future, sales volumes and prices of our spinal implant and orthopedic trauma products may grow to be more dependent on the availability of coverage and reimbursement from third-party payors, such as state and federal programs including Medicare, Medicaid and Worker’s Compensation as well as private insurance plans including Blue Cross Blue Shield plans and commercial insurers. Reimbursement is dynamic and is contingent on coding for given services or procedures, coverage by third-party payors, and adequate payment for the services or procedures.
Physicians use Current Procedural Terminology (“CPT
®
”) codes to bill for services and procedures, which are established by the American Medical Association (“AMA”). Specialty societies such as the North American Spine Society, the American Association of Neurological Surgeons, and the American Academy of Orthopaedic Surgeons provide advice to the AMA CPT
®
Editorial Panel for developing codes. The availability of existing codes to bill for services and procedures may impact the adoption of technology. For example, the deletion of the CPT
®
code to report spine cages and subsequent addition of three new CPT
®
codes, two of which include integral anterior instrumentation, may impact the type of devices used by physicians to perform spine procedures.
The Centers for Medicare and Medicaid Services (“CMS”) and the National Center for Health Statistics are jointly responsible for overseeing changes and modifications to International Classification of Diseases, Clinical Modification/Procedure Coding System (“ICD-10-CM/PCS”) procedure codes used by physicians for reporting diagnosis(es) and hospitals for reporting inpatient procedures. ICD-10-CM/PCS was implemented in the U.S. on October 1, 2015. This represents the first major coding change for ICD coding in over 30 years. The granularity and specificity of the new ICD-10-CM/PCS coding system may impact reimbursement in the future, particularly hospital inpatient reimbursement. Physician and hospital coding is subject to change, which could impact coverage and reimbursement and thus potentially impact physician practice behavior.
Independent of coding status, third-party payors may deny coverage based on their own criteria. Payor medical policies continue to become more restrictive. Payors may deem the clinical efficacy of a device or procedure to be experimental or investigational, not the most cost-effective treatment available, or used for an unapproved indication. For example, Aetna’s Clinical Policy Bulletin for invasive back pain procedures includes an Appendix which lists covered and non-covered spine devices by brand name and manufacturer. Aetna continues to revise its policy to include devices as covered and non-covered. Aetna considers “expandable” cages to be covered for only limited indications (e.g., L5-S1 fusions). Additionally, many private payors use coverage decisions and payment amounts established by CMS for the Medicare
12
program as guidelines in setting their coverage and reimbursement policies. As the portion of the U.S. population over the age of 65 and eligible for Medicare continues to grow, we may be more vulnerable to coverage and reimbursement limitations imposed by CMS. National and local coverage policy decisions are subject to unforeseeable change and have the potential to impact physician behavior. We will continue to provide the appropriate resources to patients, physicians, hospitals, and insurers in order to promote the best patient care, provide clarity regarding coverage and reimbursement policies, and work to reverse any non-coverage policies.
For federal/state programs, such as Medicaid, coverage and reimbursement differ from state to state. Some state Medicaid programs may not reimburse an adequate amount for the procedures performed with our products, if any payment is made at all. In addition, state-level worker’s compensation coverage and reimbursement vary from state to state. Payment by Medicare and other third-party payors may not be adequate to cover the cost of medical devices used in spine procedures. Additionally, more spine procedures are being performed in the hospital outpatient and ambulatory surgery center settings, in part due to innovation. Reimbursement levels in these settings are typically lower than for the hospital inpatient setting and may not be adequate to cover the cost of innovative and novel medical devices.
In international markets, reimbursement and healthcare payment systems vary significantly by country and some countries have instituted price ceilings on specific product lines. There can be no assurance that our products will be accepted by third-party payors, that coverage and reimbursement will be available or, if available, that the third-party payors’ coverage and reimbursement policies will not adversely affect our ability to sell our products profitably.
We believe that the overall escalating cost of medical products and services has led to, and will continue to lead to, increased pressures on the healthcare industry to reduce the costs of products and services. There can be no assurance that third-party coverage and reimbursement will be available or adequate, or that future legislation, regulation, coding or coverage and reimbursement policies of third-party payors will not adversely affect the demand for our products or our ability to sell these products on a profitable basis.
Government Regulation
Our business is subject to extensive federal, state, local and foreign regulations. Some of the pertinent laws have not been definitively interpreted by the regulatory authorities or the courts, and their provisions are open to a variety of subjective interpretations. In addition, these laws and their interpretations are subject to change.
Both federal and state governmental agencies continue to subject the healthcare industry to intense regulatory scrutiny, including heightened civil and criminal enforcement efforts. We believe that we have structured our business operations and relationships with our customers to comply with all applicable legal requirements. However, it is possible that governmental entities or other third parties could interpret these laws differently and assert otherwise. We discuss below the statutes and regulations that are most relevant to our business.
U.S. Food and Drug Administration Regulation
Our products are medical devices and human tissue products subject to extensive regulation by the FDA and other federal, state, local and foreign regulatory bodies. FDA regulations govern, among other things, the following activities that we or our partners perform and will continue to perform:
13
|
•
|
product design and development;
|
|
•
|
product testing, manufacturing and safety;
|
|
•
|
post-market surveillance and reporting;
|
|
•
|
product labeling;
|
|
•
|
complaint handling;
|
|
•
|
post-market approval studies; and
|
|
•
|
product advertising, marketing and promotion.
|
FDA’s Pre-Market Clearance and Approval Requirements
Unless an exemption applies, each medical device we wish to commercially distribute in the United States requires either 510(k) clearance, clearance of a
de novo
classification petition, or a pre-market approval (“PMA”) from the FDA. The FDA classifies medical devices into one of three classes. Devices deemed to pose low or moderate risk are placed in either Class I or II. Unless classified as exempt from pre-market notification, Class I and II devices generally require the manufacturer to submit to the FDA a pre-market notification requesting permission for commercial distribution. This process is known as 510(k) clearance. Some low risk devices are exempt from this requirement. Devices deemed by the FDA to pose the greatest risk, such as life-sustaining, life-supporting or implantable devices, or devices deemed not substantially equivalent to a previously cleared 510(k) device are placed in Class III, which typically requires approval of a PMA application. For certain Class III devices that present low to moderate risk, a risk-based classification determination can be requested in accordance with the
de novo
petition process, under which the FDA may determine that the product can be appropriately regulated as a Class I or II device. Both 510(k) pre-market notification and PMAs are subject to the payment of user fees, paid at the time of submission for FDA review. Future legislation may impose user fees for the submission of
de novo
classification petitions. The FDA can also impose restrictions on the sale, distribution or use of devices at the time of their clearance or approval, or subsequent to marketing.
Human Cell, Tissue and Cellular and Tissue Based Products
We currently distribute a number of products processed from human tissue, some of which are manufactured by third-party suppliers. FDA regulates human tissue products as Human Cells and Cellular and Tissue Based Products (“HCT/Ps”). Certain HCT/Ps are regulated solely under Section 361 of the Public Health Service Act and are referred to as “Section 361 HCT/Ps,” while other HCT/Ps are subject to FDA’s regulatory requirements for medical devices or biologics. Section 361 HCT/Ps do not require 510(k) clearance, PMA approval, or other premarket approvals from FDA before marketing. Tissue banks that handle HCT/Ps must register their establishments with FDA, list their HCT/P products with FDA, and comply with FDA donor eligibility and screening, current Good Tissue Practice (“CGTP”), product labeling, and postmarket reporting requirements for HCT/Ps.
The FDA periodically inspects tissue processors to determine compliance with these requirements. Entities that provide us with allograft bone tissue are responsible for performing donor recovery, donor screening and donor testing and our compliance with those aspects of the CGTP regulations that regulate those functions are dependent upon the actions of these independent entities.
14
The procurement and transplantation of allograft bone tissue is subject to U.S. federal law pursuant to the National Organ Transplant Act (“NOTA”), a criminal statute which prohibits the purchase and sale of human organs used in human transplantation, including bone and related tissue, for “valuable consideration.” NOTA permits reasonable payments associated with the removal, transportation, processing, preservation, quality control, implantation and storage of human bone tissue. With the exception of removal and implantation, we provide services in all of these areas.
The procurement of human tissue is also subject to state anatomical gift acts and some states have statutes similar to NOTA. In addition, some states require that tissue processors be licensed by that state.
FDA Enforcement
The FDA enforces these requirements by inspection and market surveillance. Failure to comply with applicable regulatory requirements can result in enforcement action by the FDA, which may include any of the following sanctions:
|
•
|
untitled letters or warning letters;
|
|
•
|
fines, injunctions and civil penalties;
|
|
•
|
recall or seizure of our products;
|
|
•
|
operating restrictions, partial suspension or total shutdown of production;
|
|
•
|
refusing our request for 510(k) or
de novo
clearance or PMA of new products;
|
|
•
|
withdrawing 510(k) clearance or PMAs that are already granted;
|
|
•
|
refusal to grant export approval of our products; and
|
|
•
|
criminal prosecution.
|
We are subject to unannounced device inspections by the FDA, the Office of Compliance, the Center for Devices and Radiological Health, and the Center for Biologics Evaluation and Research, as well as other regulatory agencies overseeing the implementation and adherence of applicable state and federal tissue licensing regulations. These inspections may include our suppliers’ facilities.
International
International sales of medical devices are subject to foreign government regulations, which vary substantially from country to country. In order to market our products in other countries, we must obtain regulatory approvals and comply with extensive safety and quality regulations in other countries. The time required to obtain approval by a foreign country may be longer or shorter than that required for FDA clearance or approval, and the requirements may differ. The European Union/European Economic Area (“EEA”) requires a CE mark in order to market medical devices. Many other countries, such as Australia, India, New Zealand, Pakistan and Sri Lanka, accept CE or FDA clearance or approval. Other countries, such as Brazil, Canada and Japan, require separate regulatory filings.
In the EEA, our devices are required to comply with the essential requirements of the EU Medical Device Directive (Council Directive 93/42/EEC). Compliance with these requirements entitles us to affix the CE conformity mark to our medical devices, without which they cannot be commercialized in the EEA.
15
To demonstrate compliance with the essential requirements and obtain the right to affix the CE conformity mark we must undergo a conformity assessment procedure, which varies according to the type of medical device and its classification.
Additionally in the EEA, the procurement, testing, processing, preservation, storage and distribution of human tissues and cells is subject to the requirements of the laws of individual EEA Member States implementing Directive 2004/23/EC, Directive 2006/17/EC and Directive 2006/86/EC.
Further, the advertising and promotion of our products in the EEA is subject to the laws of individual EEA Member States implementing the EU Medical Device Directive, Directive 2006/114/EC concerning misleading and comparative advertising, and Directive 2005/29/EC on unfair commercial practices, as well as other EEA Member State laws governing the advertising and promotion of medical devices. These laws may limit or restrict the advertising and promotion of our products to the general public and may impose limitations on our promotional activities with healthcare professionals.
We are subject to unannounced device inspections by the Notified Body (an organization accredited by a Member State of the EEA to conduct conformity assessments), as well as other regulatory agencies overseeing the implementation and adherence of applicable regulations. These inspections may include our suppliers’ facilities.
Sales and Marketing Commercial Compliance
Federal anti-kickback laws and regulations prohibit, among other things, persons from knowingly and willfully soliciting, receiving, offering or paying remuneration, directly or indirectly, in exchange for, or to induce either the referral of an individual, or the purchase, order or recommendation of, any good or service paid for under federal healthcare programs such as the Medicare and Medicaid programs.
In addition, federal false claims laws prohibit any person from knowingly presenting, or causing to be presented, a false claim for payment to the federal government, or knowingly making, or causing to be made, a false statement to get a false claim paid. Off-label promotion has been pursued as a violation of the federal false claims laws. Pursuant to FDA regulations, we can only market our products for cleared or approved uses. Although surgeons are permitted to use medical devices for indications other than those cleared or approved by the FDA based on their medical judgment, we are prohibited from promoting products for such off-label uses. Additionally, the majority of states in which we market our products have similar anti-kickback, false claims, anti-fee splitting and self-referral laws, which may apply to items or services reimbursed by any third-party payor, including commercial insurers, and violations may result in substantial civil and criminal penalties.
The United States and foreign government regulators have increased regulation, enforcement, inspections and governmental investigations of the medical device industry, including under the United Kingdom’s Bribery Act and increased U.S. government oversight and enforcement of the U.S. Foreign Corrupt Practices Act (“FCPA”).
Additionally, the commercial compliance environment is continually evolving in the healthcare industry as some states, including California, Massachusetts and Vermont, mandate implementation of corporate compliance programs, along with the tracking and reporting of gifts, compensation and other remuneration to physicians. The Patient Protection and Affordable Care Act, as amended by the Health Care and Education Affordability Reconciliation Act (collectively “PPACA”) also imposes new reporting and disclosure requirements on device manufacturers for any “transfer of value” made or distributed to prescribers and other healthcare providers. The shifting compliance environment and the need to build and maintain
16
robust and expandable systems to comply in multiple jurisdictions with different compliance and/or reporting requirements increases the possibility that a healthcare company may run afoul of one or more of the requirements.
Environmental Matters
The manufacture of certain of our products, including our allograft implants and products, and the handling of materials used in the product testing process, including in our cadaveric laboratory, involve the controlled use of biological, hazardous and/or radioactive materials and wastes. Our business and facilities and those of our suppliers are subject to foreign, federal, state and local laws and regulations relating to the protection of human health and the environment, including those governing the use, manufacture, storage, handling and disposal of, and exposure to, such materials and wastes. In addition, under some environmental laws and regulations, we could be held responsible for costs relating to any contamination at our past or present facilities and at third-party waste disposal sites even if such contamination was not caused by us.
We are not currently aware of any material costs or liabilities relating to environmental matters, including any claims or actions under environmental laws or obligations to perform any cleanups at any of our facilities or any third-party waste disposal sites, that we expect to have a material adverse effect on our business, financial condition or operating results. However, it is possible that material environmental costs or liabilities may arise in the future.
Seasonality and Backlog
Our business is generally not seasonal in nature. However, our sales may be influenced by summer vacation and winter holiday periods during which we have experienced fewer spine surgeries taking place. Our sales generally consist of products that are in stock in our warehouse facilities or maintained at hospitals or with our sales representatives. Accordingly, we do not have a backlog of sales orders.
Employees
As of
December 31, 2016
, we had over
1,400
employees, including sales and marketing, product development, general administrative and accounting, both domestically and internationally. Our employees are not subject to a collective bargaining agreement except in a single market outside the U.S., and we consider our relationship with our employees to be good.
Properties
Our corporate headquarters are located in Audubon, Pennsylvania and owned by us. We own research and manufacturing facilities in Massachusetts, Pennsylvania and Texas, lease additional research and manufacturing facilities in Texas and also own a distribution center in Heerlen, Netherlands to support our international operations. We maintain sales and administrative offices in
twenty-five
additional countries, all of which are leased.
Financial Information
For financial information about our business segment and the geographic areas in which we derive revenues, see
“Part II; Item 8. Financial Statements and Supplementary Data; Notes to Consolidated Financial Statements; Note 18. Segment and Geographic Information”
below.
17
Corporate and Available Information
We were incorporated in Delaware in March 2003. Our principal executive offices are located at 2560 General Armistead Avenue, Audubon, Pennsylvania 19403, and our telephone number at that location is (610) 930-1800. Our corporate website address is
http://www.globusmedical.com
. The information contained in or accessible through our website or contained on other websites is not deemed to be part of this Annual Report on Form 10-K.
We are subject to the filing requirements of the Exchange Act. Therefore, we file annual reports, periodic reports, proxy statements and other information with the SEC. Such reports, proxy statements and other information may be obtained by visiting the Public Reference Room of the Securities and Exchange Commission at 100 F Street, NE, Washington, D.C. 20549. You may obtain information regarding the operation of the Public Reference Room by calling the SEC at 1-800-SEC-0330. In addition, the SEC maintains a website (www.sec.gov) that contains reports, proxy and information statements, and other information regarding issuers that file electronically.
We make our annual reports on Form 10-K, quarterly reports on Form 10-Q, current reports on Form 8-K and all amendments to such reports filed or furnished pursuant to Section 13(a) or 15(d) of the Exchange Act available free of charge through a link on the Investors section of our website located at
http://www.globusmedical.com
(under “SEC Filings”) as soon as reasonably practicable after they are filed with or furnished to the SEC.
Item 1A.
Risk Factors
Risk factors that could cause our actual results to differ from our expectations and that could negatively impact our business, results of operations and financial condition are discussed below and elsewhere in this Annual Report on Form 10-K. If any of these risks actually occurs, our business, results of operations, financial condition and future growth prospects could be materially and adversely affected. You should carefully read and consider each of these risks, together with all of the other information set forth in this Annual Report on Form 10-K. The risks and uncertainties described below are not the only ones we face. Additional risks and uncertainties not presently known to us or that we currently believe are immaterial may also materially adversely affect our business, results of operations, financial condition and future growth prospects, and our stock price.
Risks Related to Our Business and Our Industry
To be commercially successful, we must convince spine surgeons and hospitals that our products are an attractive alternative to our competitors’ products and that our Disruptive Technologies are an attractive alternative to existing surgical treatments of spine disorders.
Spine surgeons play a significant role in determining the course of treatment and, ultimately, the type of product that will be used to treat a patient, so we rely on effectively marketing to them. Hospitals, however, are increasingly involved in the evaluation of products and product purchasing decisions. In order for us to sell our products, we must convince spine surgeons and hospitals that our products are attractive alternatives to competing products for use in spine procedures. Acceptance of our products depends on educating spine surgeons and hospitals as to the distinctive characteristics, perceived benefits, safety and cost-effectiveness of our products as compared to our competitors’ products and on training spine surgeons in the proper application of our products. If we are not successful in convincing spine surgeons and hospitals of the merit of our products or educating them on the use of our products, they may not use our products and we will be unable to increase our sales and sustain growth or profitability.
18
Furthermore, we believe spine surgeons will not widely adopt our Disruptive Technology products unless they determine, based on experience, clinical data and published peer-reviewed journal articles, that MIS techniques and our motion preservation and regenerative biologics technologies provide benefits or are an attractive alternative to conventional treatments of spine disorders and incorporate improved technologies that permit novel surgical procedures.
Surgeons, and in certain instances, hospitals, may be hesitant to change their medical treatment practices or the products available for use to treat patients for the following reasons, among others:
|
•
|
lack of experience with MIS or our motion preservation or regenerative biologics technologies;
|
|
•
|
lack or perceived lack of evidence supporting additional patient benefits;
|
|
•
|
perceived liability risks generally associated with the use of new products and procedures;
|
|
•
|
limited or lack of availability of coverage and reimbursement within healthcare payment systems;
|
|
•
|
costs associated with the purchase of new products and equipment; and
|
|
•
|
the time commitment that may be required for training.
|
If we are unable to convince surgeons and hospitals to use our products, we will not achieve expected sales or sustain our growth, and our financial condition and results of operation may be adversely affected.
In addition, we believe recommendations and support of our products by influential spine surgeons are essential for market acceptance and adoption. If we do not receive support from such surgeons or long-term data does not show the benefits of using our products, surgeons may not use our products. In such circumstances, we may not achieve expected sales or sustain our growth and may be unable to maintain profitability.
Pricing pressure from our competitors and our customers may impact our ability to sell our products at prices necessary to support our current business strategies.
The spine industry is characterized by intense competition, and the spine market continues to attract numerous new companies and technologies, which has encouraged more established companies to intensify competitive pricing pressure. As a result of this increased competition, as well as the challenges of third-party coverage and reimbursement practices, we believe there will be continued pricing pressure in the future. If competitive forces drive down the prices we are able to charge for our products, our profit margins will shrink, which will adversely affect our ability to maintain our profitability and to invest in and grow our business.
If our hospital and other healthcare provider customers are unable to obtain adequate coverage and reimbursement for their purchases of our products, we may not be able to sell our products at prices necessary to maintain our profitability or at all.
Maintaining and growing sales of our products depends on the availability of adequate coverage and reimbursement from third party payors, including government programs such as Medicare and Medicaid, private insurance plans and managed care programs. Hospitals and other healthcare providers that purchase our products generally rely on third party payors to cover all or part of the costs associated with the procedures performed with these products, including the cost to purchase the product. Our customers’ access to adequate coverage and reimbursement for the procedures performed with our products by government and private insurance plans is central to the acceptance of our current and future products. We may be unable to sell our products on a profitable basis, or at all, if third party payors deny coverage or reduce their current levels of payment. If our cost of production increases faster than increases in reimbursement levels for the products, our profitability may be negatively impacted.
19
Future action by CMS (which administers the Medicare program), other government agencies or private payors, may diminish payments to physicians, outpatient surgery centers and/or hospitals, which could harm our ability to market and sell our products. Private payors may adopt coverage decisions and payment amounts determined by CMS as guidelines in setting their coverage and reimbursement policies. Private payors that do not follow the Medicare guidelines may adopt different coverage and reimbursement policies for procedures performed with our products. In addition, for some governmental programs, such as Medicaid, coverage and reimbursement differs from state to state. Medicaid payments to physicians and facilities are often lower than payments by other third party payors and some state Medicaid programs may not pay an adequate amount for the procedures performed with our products, if any payment is made at all. Furthermore, the healthcare industry in the United States has experienced a trend toward cost containment as government and private insurers seek to control rising healthcare costs by imposing lower payment rates and negotiating reduced contract rates with service providers.
Third party payors, including public and private payors, may develop negative coverage policies impacting our products. For example, Aetna recently changed its medical policy from coverage in all or most cases to coverage only for limited indications for biomechanical devices (e.g., spine cages) for cervical fusion procedures, stating that they have not been proven more effective than bone graft for cervical fusions, which may limit demand for our products. In addition, some payors have changed their coverage policies to be more restrictive as to the criteria under which they will cover and reimburse for vertebral fusions in the lumbar spine to treat multilevel
degenerative disc disease (“
DDD”), initial primary laminectomy/discectomy for nerve root decompression, or spinal stenosis. Although these coverage policy changes have not had a material impact on our business, other insurers may adopt similar coverage decisions in the future. Patients covered by these insurers may be unwilling or unable to afford lumbar fusion surgeries to treat these conditions, which could materially harm or limit our ability to sell our products designed for lumbar fusion procedures. Our business would be negatively impacted if the trend by governmental agencies or third party payors continues to reduce coverage of and/or reimbursement for procedures using our products.
We cannot be certain that under current and future payment systems, such as those utilized by Medicare and in many private managed care systems, the cost of our products will be adequately incorporated into the overall cost of the procedure. Therefore, we cannot be certain that the procedures performed with our products will be reimbursed at a sufficiently profitable level, or at all.
To the extent we sell our products internationally, market acceptance may depend, in part, upon the availability of coverage and reimbursement within prevailing healthcare payment systems. Reimbursement and healthcare payment systems in international markets vary significantly by country, and include both government-sponsored healthcare and private insurance. Our products may not obtain international coverage and reimbursement approvals in a timely manner, if at all. Our failure to receive such approvals would negatively impact market acceptance of our products in the international markets in which those approvals are sought.
If we are unable to maintain and expand our network of direct sales representatives and independent distributors, we may not be able to generate anticipated sales.
Our operating results are directly dependent upon the sales and marketing efforts of not only our employees, but also our independent distributors. We expect our direct sales representatives and independent distributors to develop long-lasting relationships with the surgeons they serve. If our direct sales representatives or independent distributors fail to adequately promote, market and sell our products, our sales could significantly decrease.
20
We face significant challenges and risks in managing our geographically dispersed distribution network and retaining the individuals who make up that network. If any of our direct sales representatives were to leave us, or if any of our independent distributors were to cease to do business with us, our sales could be adversely affected. Some of our independent distributors account for a significant portion of our sales volume, and if any such independent distributor were to cease to distribute our products, our sales could be adversely affected. In such a situation, we may need to seek alternative independent distributors or increase our reliance on our direct sales representatives, which may not prevent our sales from being adversely affected. If a direct sales representative or independent distributor were to depart and be retained by one of our competitors, we may be unable to prevent them from helping competitors solicit business from our existing customers, which could further adversely affect our sales. Because of the intense competition for their services, we may be unable to recruit or retain additional qualified independent distributors or to hire additional direct sales representatives to work with us. We may not be able to enter into agreements with them on favorable or commercially reasonable terms, if at all. Failure to hire or retain qualified direct sales representatives or independent distributors would prevent us from maintaining or expanding our business and generating sales.
As we launch new products and increase our marketing efforts with respect to existing products, we will need to expand the reach of our marketing and sales networks. Our future success will depend largely on our ability to continue to hire, train, retain and motivate skilled direct sales representatives and independent distributors with significant technical knowledge in various areas, such as spinal care practices, spine injuries and disease and spinal health. New hires require training and take time to achieve full productivity. If we fail to train new hires adequately, or if we experience high turnover in our sales force in the future, we cannot be certain that new hires will become as productive as may be necessary to maintain or increase our sales.
If we are unable to expand our sales and marketing capabilities domestically and internationally, we may not be able to effectively commercialize our products, which would adversely affect our business, results of operations and financial condition.
We operate in a very competitive business environment and if we are unable to compete successfully against our existing or potential competitors, our sales and operating results may be negatively affected and we may not grow.
The spine industry is intensely competitive, subject to rapid change and highly sensitive to the introduction of new products or other market activities of industry participants.
We believe that our significant competitors are Medtronic, the DePuy Synthes Companies (a division of Johnson & Johnson), Stryker and NuVasive. Alphatec Spine, Orthofix International, Zimmer Biomet, K2M and other smaller public and private companies are also competitors of ours.
At any time, these or other industry participants may develop alternative treatments, products or procedures for the treatment of spine disorders that compete directly or indirectly with our products. They may also develop and patent processes or products earlier than we can or obtain regulatory clearance or approvals for competing products more rapidly than we can, which could impair our ability to develop and commercialize similar processes or products. If alternative treatments are, or are perceived to be, superior to our spine surgery products, sales of our products could be negatively affected and our results of operations could suffer.
Many of our current and potential competitors are major medical device companies that have substantially greater financial, technical and marketing resources than we do, and they may succeed in developing products that would render our products obsolete or noncompetitive.
21
Many of our larger competitors enjoy several competitive advantages over us, including:
|
•
|
greater financial, human and other resources for product research and development, sales and marketing and litigation;
|
|
•
|
significantly greater name recognition;
|
|
•
|
established relationships with spine surgeons, hospitals and other healthcare providers;
|
|
•
|
large and established sales and marketing and distribution networks;
|
|
•
|
products supported by long-term clinical data;
|
|
•
|
greater experience in obtaining and maintaining regulatory clearances or approvals for products and product enhancements;
|
|
•
|
more expansive portfolios of intellectual property rights; and
|
|
•
|
greater ability to cross-sell their products or to incentivize hospitals or surgeons to use their products.
|
The frequent introduction by competitors of products that compete with our existing or planned products may also make it difficult to market or sell our products. In addition, the entry of multiple new products and competitors, including physician-owned distributorships (“PODs”), may lead some of our competitors to employ pricing strategies that could adversely affect the pricing of our products and pricing in the spine market generally.
As a result, our ability to compete successfully will depend on our ability to develop proprietary products that reach the market in a timely manner, receive adequate coverage and reimbursement from third-party payors, and are safer, less invasive and more effective than alternatives available for similar purposes. If we are unable to do so, our sales or margins could decrease, thereby harming our business.
We are dependent on a limited number of third-party suppliers for most of our products and components, and the loss of any of these suppliers, or their inability to provide us with an adequate supply of materials, could harm our business.
We rely on third-party suppliers to supply most of our products. For us to be successful, our suppliers must be able to provide us with products and components in substantial quantities, in compliance with regulatory requirements, in accordance with agreed upon specifications, at acceptable costs and on a timely basis. Our anticipated growth could strain the ability of our suppliers to deliver an increasingly large supply of products, materials and components. Other issues, including shortages of raw materials or components, problems with production yields and quality control and assurance, especially with products such as allograft, which is processed human tissue, could impair a supplier’s ability to supply us with product quantities necessary to support our sales. Furthermore, under our supplier agreements, our suppliers generally have no obligation to manufacture for us or sell to us any specific quantity of products. If we are unable to obtain sufficient quantities of high quality components to meet demand on a timely basis, we could lose customers, our reputation may be harmed and our business could suffer.
We generally use a small number of suppliers for each of our products. Our dependence on such a limited number of suppliers exposes us to risks, including limited control over pricing, availability, quality and delivery schedules. If any one or more of our suppliers cease to provide us with sufficient quantities of manufactured products in a timely manner or on terms acceptable to us, or cease to manufacture components of acceptable quality, we would have to seek alternative sources of supply. Because of the nature of our internal quality control requirements, regulatory requirements and the custom and proprietary nature of the parts, we cannot quickly engage additional or replacement suppliers for many of our critical components. Failure of any of our third-party suppliers to deliver products at the level our business requires would limit our ability to meet our sales commitments to our customers and could have a material adverse effect on our
22
business. We may also have difficulty obtaining similar components from other suppliers that are acceptable to the FDA or other foreign regulatory authorities. We could incur delays while we locate and engage qualified alternative suppliers, and we may be unable to engage alternative suppliers on favorable terms or at all. Any such disruption or increased expenses could harm our commercialization efforts and adversely affect our ability to generate sales.
If we do not successfully implement our business strategy, our business and results of operations will be adversely affected.
Our business strategy was formed based on assumptions about the spine market that might prove wrong. We believe that various demographics and industry-specific trends, including the aging of the general population, increasingly active lifestyles, improving fusion technologies and increasing acceptance of Disruptive Technologies leading to earlier interventions, will help drive growth in the spine market and our business, but these demographics and trends are uncertain. Actual demand for our products could differ materially from projected demand if our assumptions regarding these factors prove to be incorrect or do not materialize, or if alternative treatments to those offered by our products gain widespread acceptance.
We may not be able to successfully implement our business strategy. To implement our business strategy we need to, among other things, strengthen our brand, develop and introduce new spine surgery products, find new applications for and improve our existing products, obtain regulatory clearance or approval for new products and applications and educate spine surgeons about the clinical and cost benefits of our products, all of which we believe could increase acceptance of our products by spine surgeons. Our strategy of focusing exclusively on the spine market may limit our ability to grow. In addition, we are seeking to increase our sales and, in order to do so, will need to commercialize additional products and expand our direct and distributor sales forces in existing and new territories, all of which could result in our becoming subject to additional or different foreign and domestic regulatory requirements, with which we may not be able to comply. Moreover, even if we successfully implement our business strategy, our operating results may not improve or may decline. We may decide to alter or discontinue aspects of our business strategy and may adopt different strategies due to business or competitive factors not currently foreseen, such as new medical technologies that would make our products obsolete. Any failure to implement our business strategy may adversely affect our business, results of operations and financial condition.
The proliferation of PODs could result in increased pricing pressure on our products or harm our ability to sell our products to physicians who own or are affiliated with those distributorships.
PODs are medical device distributors that are owned, directly or indirectly, by physicians. These physicians derive a proportion of their revenue from selling or arranging for the sale of medical devices for use in procedures they perform on their own patients at hospitals that agree to purchase from or through the POD, or that otherwise furnish ordering physicians with income that is based directly or indirectly on those orders of medical devices.
We do not sell or distribute any of our products through PODs. The number of PODs in the spine industry may continue to grow as economic pressures increase throughout the industry, as hospitals, insurers and physicians search for ways to reduce costs, and, in the case of the physicians, search for ways to increase their incomes. These companies and the physicians who own, or partially own, them have significant market knowledge and access to the surgeons who use our products and the hospitals that purchase our products, and growth in this area may reduce our ability to compete effectively for business from surgeons who own such distributorships.
23
Our business could suffer if we lose the services of key members of our senior management, key advisors or personnel.
We are dependent upon the continued services of key members of our senior management and a limited number of key advisors and personnel. In particular, we are highly dependent on the skills and leadership of our Chief Executive Officer (“CEO”), David C. Paul. The loss of any one of these individuals could disrupt our operations or our strategic plans. Additionally, our future success will depend on, among other things, our ability to continue to hire and retain the necessary qualified scientific, technical and managerial personnel, for whom we compete with numerous other companies, academic institutions and organizations. The loss of members of our management team, key advisors or personnel, or our inability to attract or retain other qualified personnel or advisors, could have a material adverse effect on our business, results of operations and financial condition. Though members of our sales force generally enter into noncompetition agreements that restrict their ability to compete with us, most of the members of our executive management team are not subject to such agreements. Accordingly, the adverse effect resulting from the loss of certain executives could be compounded by our inability to prevent them from competing with us.
The safety and efficacy of our products is not yet supported by long-term clinical data, which could limit sales, and our products might therefore prove to be less safe and effective than initially thought.
All of the products we currently market in the United States, other than our SECURE
®
-C cervical disc, have either received pre-market clearance under Section 510(k) of the Federal Food, Drug, and Cosmetic Act (“FDCA”) or are exempt from pre-market review. The FDA's 510(k) clearance process requires us to show that our proposed product is “substantially equivalent” to another 510(k)-cleared product. This process is shorter and typically requires the submission of less supporting documentation than other FDA approval processes and does not always require long-term clinical studies. We also continue to gather long term follow-up data in our SECURE
®
-C clinical trial. Additionally, to date, we have not been required to complete long-term clinical studies in connection with the sale of our products outside the United States. As a result, we currently lack the breadth of published long-term clinical data supporting the safety and efficacy of virtually all of our products and the benefits they offer that might have been generated in connection with other approval processes. For these reasons, spine surgeons may be slow to adopt our products, we may not have comparative data that our competitors have or are generating, and we may be subject to greater regulatory and product liability risks. Further, future patient studies or clinical experience may indicate that treatment with our products does not improve patient outcomes. Such results would slow the adoption of our products by spine surgeons, significantly reduce our ability to achieve expected sales, and could prevent us from sustaining our profitability.
Moreover, if future results and experience indicate that our products cause unexpected or serious complications or other unforeseen negative effects, we could be subject to mandatory product recalls, product seizures, suspension or withdrawal of FDA clearance or approval, and significant legal liability or harm to our business reputation.
If we do not enhance our product offerings through our research and development efforts, we may be unable to effectively compete.
In order to increase our market share in the spine market, we must enhance and broaden our product offerings in response to changing customer demands and competitive pressures and technologies. The success of any new product offering or enhancement to an existing product will depend on numerous factors, including our ability to:
24
|
•
|
properly identify and anticipate surgeon and patient needs;
|
|
•
|
develop and introduce new products or product enhancements in a timely manner;
|
|
•
|
adequately protect our intellectual property and avoid infringing upon the intellectual property rights of third parties;
|
|
•
|
demonstrate the safety and efficacy of new products; and
|
|
•
|
obtain the necessary regulatory clearances or approvals for new products or product enhancements.
|
If we do not develop and obtain regulatory clearance or approval for new products or product enhancements in time to meet market demand, or if there is insufficient demand for these products or enhancements, our results of operations will suffer. Our research and development efforts may require a substantial investment of time and resources before we are adequately able to determine the commercial viability of a new product, technology, material or other innovation. In addition, even if we are able to successfully develop enhancements or new generations of our products, these enhancements or new generations of products may not produce sales in excess of the costs of development and they may be quickly rendered obsolete by changing customer preferences or the introduction by our competitors of products embodying new technologies or features.
In the near future we expect to introduce a robotic surgical navigation device as well as products to treat patients who have experienced orthopedic traumas. We have no prior experience marketing these new products, and we will need to convince a new audience of surgeons and hospital personnel that these products are attractive alternatives to competing products for use in applicable procedures. If we are unable to launch these new products, either in a timely fashion or at all, or we are not successful in convincing surgeons and hospitals of the merit of these products or educating them on their use, our sales and operating results may be negatively affected and we may not grow as quickly as we anticipate.
If we fail to properly manage our anticipated growth, our business could suffer.
Our rapid growth has placed, and will continue to place, a significant strain on our management and on our operational and financial resources and systems. Failure to manage our growth effectively could cause us to over-invest or under-invest in infrastructure, and result in losses or weaknesses in our infrastructure, which could materially adversely affect us. Additionally, our anticipated growth will increase the demands placed on our suppliers, resulting in an increased need for us to carefully monitor for quality assurance. Any failure by us to manage our growth effectively could have an adverse effect on our ability to achieve our development and commercialization goals.
Our results of operations could suffer if we are unable to manage our planned international expansion effectively.
Expansion into international markets is an element of our business strategy and involves risk. The sale and shipment of our products across international borders, as well as the purchase of components and products from international sources, subject us to extensive U.S. and foreign governmental trade, import and export and customs regulations and laws. Compliance with these regulations and laws is costly and exposes us to penalties for non-compliance. Other laws and regulations that can significantly affect us include various anti-bribery laws, including the FCPA and anti-boycott laws. Any failure to comply with applicable legal and regulatory obligations in the United States or abroad could adversely affect us in a variety of ways that include, but are not limited to, significant criminal, civil and administrative penalties, including imprisonment of individuals, fines and penalties, denial of export privileges, seizure of shipments and restrictions on certain business activities. Also, the failure to comply with applicable legal and regulatory obligations could result in the disruption of our distribution and sales activities.
25
Our international operations expose us and our independent distributors to risks inherent in operating in foreign jurisdictions, including:
|
•
|
exposure to different legal and regulatory standards;
|
|
•
|
lack of stringent protection of intellectual property;
|
|
•
|
obstacles to obtaining domestic and foreign export, import and other governmental approvals, permits and licenses and compliance with foreign laws;
|
|
•
|
potentially adverse tax consequences and the complexities of foreign value-added tax systems;
|
|
•
|
adverse changes in tariffs and trade restrictions;
|
|
•
|
foreign exchange rate risk;
|
|
•
|
limitations on the repatriation of earnings;
|
|
•
|
difficulties in staffing and managing foreign operations;
|
|
•
|
transportation delays and difficulties of managing international distribution channels;
|
|
•
|
longer collection periods and difficulties in collecting receivables from foreign entities;
|
|
•
|
increased financing costs; and
|
|
•
|
political, social and economic instability and increased security concerns.
|
These risks may limit or disrupt our expansion, restrict the movement of funds or result in the deprivation of contractual rights or the taking of property by nationalization or expropriation without fair compensation.
Our goal of succeeding as an international company depends, in part, on our ability to develop and implement policies and strategies that are effective in anticipating and managing these and other risks in the countries in which we do business. Failure to manage these and other risks may have a material adverse effect on our operations in any particular country and on our business as a whole.
We are subject to risks arising from currency exchange rate fluctuations on our international transactions and translation of local currency results into United States dollars, which could adversely affect our profitability.
Our international sales account for approximately
11%
of our total net sales, and we intend to continue to expand our international presence. A significant portion of our foreign revenues and expenses are generated in the Euro zone, United Kingdom, Switzerland and Australia. As our reporting currency is the U.S. dollar, significant changes in currency exchange rates can result in increased exposure to foreign exchange effects on our consolidated results of operations. We cannot predict changes in currency exchange rates, the impact of exchange rate changes, nor the degree to which we will be able to manage the impact of currency exchange rate changes.
We may seek to grow our business through acquisitions of or investments in new or complementary businesses, products or technologies, and the failure to manage acquisitions or investments, or the failure to integrate them with our existing business, could have a material adverse effect on us.
From time to time we expect to consider opportunities to acquire or make investments in other technologies, products and businesses that may enhance our capabilities, complement our current products or expand the breadth of our markets or customer base. Potential and completed acquisitions and strategic investments involve numerous risks, including:
|
•
|
problems assimilating the purchased technologies, products or business operations;
|
|
•
|
issues maintaining uniform standards, procedures, controls and policies;
|
|
•
|
unanticipated costs associated with acquisitions;
|
26
|
•
|
diversion of management’s attention from our core business;
|
|
•
|
adverse effects on existing business relationships with suppliers and customers;
|
|
•
|
risks associated with entering new markets in which we have limited or no experience;
|
|
•
|
potential loss of key employees of acquired businesses; and
|
|
•
|
increased legal and accounting compliance costs.
|
We do not know if we will be able to identify acquisitions we deem suitable, whether we will be able to successfully complete any such acquisitions on favorable terms or at all, or whether we will be able to successfully integrate any acquired business, product or technology into our business or retain any key personnel, suppliers or distributors. Our ability to successfully grow through acquisitions depends upon our ability to identify, negotiate, complete and integrate suitable target businesses and to obtain any necessary financing. These efforts could be expensive and time-consuming, and may disrupt our ongoing business and prevent management from focusing on our operations. If we are unable to integrate any acquired businesses, products or technologies effectively, our business, results of operations and financial condition will be materially adversely affected.
We are required to maintain high levels of inventory, which could consume a significant amount of our resources and reduce our cash flows.
As a result of the need to maintain substantial levels of inventory, we are subject to the risk of inventory obsolescence. Many of our products come in sets, which feature components in a variety of sizes to satisfy the particular patient’s anatomical needs. In order to market our products effectively, we often must maintain implant sets consisting of the full range of product sizes. For each surgery, fewer than all of the components of the set are used, and therefore certain portions of the set, like uncommon sizes, may become obsolete before they can be used. In the event that a substantial portion of our inventory becomes obsolete, it could have a material adverse effect on our earnings and cash flows due to the resulting costs associated with the inventory impairment charges and costs required to replace such inventory.
If we experience significant disruptions in our information technology systems, our business, results of operations and financial condition could be adversely affected.
The efficient operation of our business depends on our information technology systems. We rely on our information technology systems to effectively manage:
|
•
|
sales and marketing, accounting and financial functions;
|
|
•
|
inventory management;
|
|
•
|
engineering and product development tasks; and
|
|
•
|
our research and development data.
|
Our information technology systems are vulnerable to damage or interruption from:
|
•
|
earthquakes, fires, floods and other natural disasters;
|
|
•
|
terrorist attacks and attacks by computer viruses or hackers;
|
|
•
|
power losses; and
|
|
•
|
computer systems, or Internet, telecommunications or data network failures.
|
The failure of our information technology systems to perform as we anticipate or our failure to effectively implement new systems could disrupt our entire operation and could result in decreased sales, increased overhead costs, excess inventory and product shortages, all of which could have a material adverse effect on our reputation, business, results of operations and financial condition.
27
Consolidation in the healthcare industry could lead to demands for price concessions or to the exclusion of some suppliers from certain of our markets, which could have an adverse effect on our business, results of operations or financial condition.
Because healthcare costs have risen significantly over the past decade, numerous initiatives and reforms initiated by legislators, regulators and third-party payors to curb these costs have resulted in a consolidation trend in the healthcare industry to aggregate purchasing power. As the healthcare industry consolidates, competition to provide products and services to industry participants has become and will continue to become more intense. This in turn has resulted and will likely continue to result in greater pricing pressures and the exclusion of certain suppliers from important market segments as group purchasing organizations, independent delivery networks and large single accounts continue to use their market power to consolidate purchasing decisions for hospitals. We expect that market demand, government regulation, third-party coverage and reimbursement policies and societal pressures will continue to change the worldwide healthcare industry, resulting in further business consolidations and alliances among our customers, which may reduce competition, exert further downward pressure on the prices of our products and may adversely impact our business, results of operations or financial condition.
Fluctuations in insurance cost and availability could adversely affect our profitability or our risk management profile.
We hold a number of insurance policies, including product liability insurance, directors’ and officers’ liability insurance, property insurance, health insurance and workers’ compensation insurance. If the costs of maintaining adequate insurance coverage increase significantly in the future, our operating results could be materially adversely affected. Likewise, if any of our current insurance coverage should become unavailable to us or become economically impractical, we would be required to operate our business without indemnity from commercial insurance providers. If we operate our business without insurance, we could be responsible for paying claims or judgments against us that would have otherwise been covered by insurance, which could adversely affect our results of operations or financial condition.
Risks Related to our Legal and Regulatory Environment
Our medical device products and operations are subject to extensive governmental regulation both in the United States and abroad, and our failure to comply with applicable requirements could cause our business to suffer.
The medical device industry is regulated extensively by governmental authorities, principally the FDA and corresponding state and foreign regulatory agencies. The FDA and other U.S. and foreign governmental agencies regulate, among other things, with respect to medical devices:
|
•
|
design, development and manufacturing;
|
|
•
|
testing, labeling, content and language of instructions for use and storage;
|
|
•
|
clinical trials;
|
|
•
|
product safety;
|
|
•
|
marketing, sales and distribution;
|
|
•
|
pre-market clearance and approval;
|
|
•
|
record keeping procedures;
|
|
•
|
advertising and promotion;
|
|
•
|
recalls and field safety corrective actions;
|
|
•
|
post-market surveillance, including reporting of deaths or serious injuries and malfunctions that, if they were to recur, could lead to death or serious injury;
|
28
|
•
|
post-market approval studies; and
|
|
•
|
product import and export.
|
The regulations to which we are subject are complex and have tended to become more stringent over time; see
“Item 1. Business; Government Regulation”
above for a summary of certain regulations to which we are subject. Regulatory changes could result in restrictions on our ability to carry on or expand our operations, higher than anticipated costs or lower than anticipated sales.
The processes by which 510(k) clearance, grant of a
de novo
classification request, or PMA approval is obtained can be expensive and lengthy and require the payment of significant fees. The FDA’s 510(k) clearance process usually takes from three to 12 months, but may last longer. The FDA’s goal is to review
de novo
classification requests within 120 to 150 days, but presently, less than 50 percent of the requests are reviewed in this time period and it often takes much longer. The process of obtaining a PMA is much more costly and uncertain than the 510(k) clearance process and generally takes one to three years, or even longer, from the time the application is submitted to the FDA until an approval is obtained. The process of obtaining regulatory clearances through the 510(k) process,
de novo
classification, or approvals through the PMA process to market a medical device in the United States or internationally can be costly and time-consuming, and we may not be able to obtain these clearances, grants of
de novo
classification, or approvals on a timely basis, if at all.
In the United States, all of our currently commercialized medical device products, other than SECURE
®
-C have either received pre-market clearance under Section 510(k) of the FDCA or are exempt from pre-market review. If the FDA requires us to go through a lengthier, more rigorous examination for future products or modifications to existing products than we had expected, our product introductions or modifications could be delayed or canceled, which could cause our sales to decline and potentially harm our ability to compete. In addition, if the FDA disagrees with our determination that a product we currently market is subject to an exemption from pre-market review, the FDA may require us to submit a 510(k),
de novo
, or PMA and may require us to cease distribution of the product and/or recall the product unless and until we obtain 510(k) or
de novo
clearance or PMA. Further, even with respect to those future products where a PMA is not required, we cannot assure you that we will be able to obtain the 510(k) or
de novo
clearances with respect to those products. The FDA may also reclassify devices currently on the market from Class II to Class III, which could result in additional regulatory burden requiring submission and approval of a PMA prior to marketing, or could result in FDA rescinding a 510(k) for a previously cleared device.
The FDA can delay, limit or deny clearance or approval of a device for many reasons, including:
|
•
|
we may not be able to demonstrate to the FDA’s satisfaction that our products are safe and effective for their intended uses;
|
|
•
|
the data from our pre-clinical studies and clinical trials may be insufficient to support clearance or approval, where required; and
|
|
•
|
the manufacturing process or facilities we use may not meet applicable requirements.
|
In addition, the FDA may change its clearance and approval policies, adopt additional regulations or revise existing regulations, or take other actions which may prevent or delay approval or clearance of our products under development or impact our ability to modify our currently approved or cleared products on a timely basis. It is also possible that, if we obtain new FDA regulatory clearances or approvals, the clearances or approvals may contain limitations on the indicated uses or may prohibit certain uses which may impact the marketability of the product.
29
Any delay in, or failure to receive or maintain, clearance or approval for our medical device products under development could prevent us from generating revenue from these products or achieving profitability. Additionally, the FDA and other regulatory authorities have broad enforcement powers. Regulatory enforcement or inquiries, or other increased scrutiny on us, could dissuade some surgeons from using our products and adversely affect our reputation and the perceived safety and efficacy of our products.
In addition, even after we have obtained the proper regulatory approval to market a product, the FDA has the power to require us to conduct postmarketing studies. For example, the FDA issued a Section 522 Order in October 2009 requiring companies that market dynamic stabilization systems, such as our TRANSITION
®
system, to conduct postmarketing studies on those systems. These studies can be very expensive and time-consuming to conduct. Failure to comply with those studies in a timely manner could result in the revocation of the 510(k) clearance for the product that is subject to such a Section 522 Order and the recall or withdrawal of the product, which could prevent us from generating sales from that product in the United States.
Similarly, we must comply with numerous international laws and regulations in order to market our products outside of the United States; see
“Item 1. Business; Government Regulation; International”
above for a summary of certain international laws and regulations to which we are subject. As is the case in the United States, the applicable regulatory body may change its clearance and approval policies, adopt additional regulations or revise existing regulations, or take other actions which may prevent or delay approval or clearance of our products under development or impact our ability to modify our currently approved or cleared products on a timely basis. Any delay in, or failure to receive or maintain, clearance or approval for our products under development could prevent us from generating revenue from these products or achieving profitability. Conducting clinical studies to obtain clinical data that might be required as part of the clinical evaluation process can be expensive and time-consuming. Additionally, the regulatory authorities have broad enforcement powers. Regulatory enforcement or inquiries, or other increased scrutiny on us, could dissuade some surgeons from using our products and adversely affect the perceived safety and efficacy of our products and our reputation.
Failure to comply with applicable regulations could jeopardize our ability to sell our products and result in enforcement actions such as:
|
•
|
warning letters;
|
|
•
|
fines;
|
|
•
|
injunctions;
|
|
•
|
civil penalties;
|
|
•
|
termination of distribution;
|
|
•
|
recalls or seizures of products;
|
|
•
|
delays in the introduction of products into the market;
|
|
•
|
total or partial suspension of production;
|
|
•
|
refusal of the FDA or other regulator to grant future clearances or approvals;
|
|
•
|
withdrawals or suspensions of current clearances or approvals, resulting in prohibitions on sales of our products;
|
|
•
|
refusal to grant export approvals; and/or
|
|
•
|
in the most serious cases, criminal penalties.
|
Any of these sanctions could result in higher than anticipated costs or lower than anticipated sales and have a material adverse effect on our reputation, business, results of operations and financial condition. For example, in February 2012 we executed a settlement agreement with the FDA in which we and our CEO, David C. Paul, agreed to pay a total of $1.0 million in exchange for the FDA’s release of claims related solely
30
to the FDA’s determination that we failed to obtain the 510(k) clearance required for the sale of our NUBONE
®
product, which we ceased selling in the United States in December 2010.
Modifications to our products may require new 510(k) or de novo clearances, PMAs or PMA supplements, or may require us to cease marketing or recall the modified products until clearances or approvals are obtained.
Any modification to a 510(k)-cleared device that could significantly affect its safety or effectiveness or that would constitute a major change in its intended use, requires a new 510(k) clearance or, possibly, a
de novo
petition or approval of a PMA. The FDA requires every manufacturer to make this determination in the first instance, but the FDA may review any manufacturer’s decision. The FDA may not agree with our decisions regarding whether new clearances or approvals are necessary. We have modified some of our 510(k)-cleared products, and have determined based on our review of the applicable FDA guidance that in certain instances new 510(k) clearances or PMAs are not required. If the FDA disagrees with our determination and requires us to submit new 510(k) notifications,
de novo
petitions, PMAs or PMA supplements for modifications to our previously cleared products for which we have concluded that new clearances or approvals are unnecessary, we may be required to cease marketing or to recall the modified product until we obtain clearance or approval, and we may be subject to significant regulatory fines or penalties.
Our HCT/P products are subject to extensive government regulation and our failure to comply with these requirements could cause our business to suffer.
In the United States, we are marketing our human tissue products as Section 361 HCT/Ps, which are not subject to FDA premarket clearance or approval requirements. The FDA could disagree with our determination that our human tissue products are Section 361 HCT/Ps and could determine that these products are biologics requiring a biological license application approval or medical devices requiring 510(k) or
de novo
clearance or PMA approval. FDA may then require that we cease marketing our human tissue products and/or recall the products unless and until we receive the appropriate clearance or approval from FDA.
HCT/Ps also are subject to donor eligibility and screening, CGTP, product labeling, and postmarket reporting requirements. If we or our suppliers fail to comply with these requirements, we could be subject to FDA enforcement action, including, for example, warning letters, fines, injunctions, product recalls or seizures, and, in the most serious cases, criminal penalties.
We may fail to obtain or maintain foreign regulatory approvals to market our products in other countries.
We currently market our products internationally and intend to expand our international marketing. International jurisdictions require separate regulatory approvals and compliance with numerous and varying regulatory requirements. For example, we intend to continue to seek regulatory clearance to market our primary products in the EEA, Brazil, Canada and other key markets. The approval procedures vary among countries and may involve requirements for additional testing, and the time required to obtain approval may differ from country to country and from that required to obtain FDA clearance or approval.
Clearance or approval by the FDA does not ensure approval or certification by regulatory authorities in other countries or jurisdictions, and approval or certification by one foreign regulatory authority does not ensure approval or certification by regulatory authorities in other foreign countries or by the FDA. The foreign regulatory approval or certification process may include all of the risks associated with obtaining FDA clearance or approval. We may not obtain foreign regulatory approvals on a timely basis, if at all. We may not be able to file for regulatory approvals or certifications and may not receive necessary approvals to
31
commercialize our products in any market. If we fail to receive necessary approvals or certifications to commercialize our products in foreign jurisdictions on a timely basis, or at all, our business, results of operations and financial condition could be adversely affected.
Additionally, in the EEA, we must inform the Notified Body that carried out the conformity assessment of the medical devices we market or sell in the EEA of any planned substantial changes to our quality system or changes to our devices which could affect compliance with the essential requirements or the devices’ intended use. The Notified Body will then assess the changes and verify whether they affect the products’ conformity. If the assessment is not favorable, it could prevent us from selling that product in the EEA, which could adversely impact our business and results of operations.
We are subject to risks associated with our non-U.S. operations.
The FCPA and similar worldwide anti-bribery laws in non-U.S. jurisdictions generally prohibit companies and their intermediaries from making improper payments for the purpose of obtaining or retaining business. The FCPA also imposes accounting standards and requirements on publicly traded U.S. corporations and their foreign affiliates, which are intended to prevent the diversion of corporate funds to the payment of bribes and other improper payments, and to prevent the establishment of “off books” slush funds from which such improper payments can be made. Because of the predominance of government-sponsored healthcare systems around the world, many of our customer relationships outside of the United States are with governmental entities and are therefore subject to such anti-bribery laws. Our internal control policies and procedures may not always protect us from reckless or criminal acts committed by our employees or agents. Violations of these laws, or allegations of such violations, could disrupt our operations, involve significant management distraction and result in a material adverse effect on our business, results of operations and financial condition. We also could suffer severe penalties, including criminal and civil penalties, disgorgement and other remedial measures, including further changes or enhancements to our procedures, policies and controls, as well as potential personnel changes and disciplinary actions.
Furthermore, we are subject to the export controls and economic embargo rules and regulations of the United States, including, but not limited to, the Export Administration Regulations and trade sanctions against embargoed countries, which are administered by the Office of Foreign Assets Control within the Department of the Treasury, as well as the laws and regulations administered by the Department of Commerce. These regulations limit our ability to market, sell, distribute or otherwise transfer our products or technology to prohibited countries or persons. A determination that we have failed to comply, whether knowingly or inadvertently, may result in substantial penalties, including fines and enforcement actions and civil and/or criminal sanctions, the disgorgement of profits and the imposition of a court-appointed monitor, as well as the denial of export privileges, and may have an adverse effect on our reputation.
These and other factors may have a material adverse effect on our international operations or on our business, results of operations and financial condition generally.
If we or our suppliers fail to comply with the FDA’s good manufacturing practice regulations and similar international regulations, this could impair our ability to market our products in a cost-effective and timely manner.
We and our third-party suppliers are required to comply with the
FDA’s Quality System Regulation (“QSR”)
, which covers the methods and documentation of the design, testing, production, control, quality assurance, labeling, packaging, sterilization, storage and shipping of our products. In addition, suppliers and processors of allograft must comply with the CGTP, which govern the methods used in and the facilities and
32
controls used for the manufacture of human cell tissue and cellular and tissue-based products, record-keeping and the establishment of a quality program.
The FDA audits compliance with the QSR and CGTP requirements through periodic announced and unannounced inspections of manufacturing and other facilities. The FDA may conduct inspections or audits at any time. If we or our suppliers have significant non-compliance issues or if any corrective action plan that we or our suppliers propose in response to observed deficiencies is not sufficient, the FDA could take enforcement action, including any of the following sanctions:
|
•
|
untitled letters, warning letters, fines, injunctions, consent decrees and civil penalties;
|
|
•
|
customer notifications or repair, replacement, refunds, recall, detention or seizure of our products;
|
|
•
|
operating restrictions or partial suspension or total shutdown of production;
|
|
•
|
refusing or delaying our requests for 510(k) or
de novo
clearance or PMA of new products or modified products;
|
|
•
|
withdrawing 510(k) or
de novo
clearances or PMAs that have already been granted;
|
|
•
|
refusal to grant export approval for our products; or
|
|
•
|
criminal prosecution.
|
Any of these sanctions could have a material adverse effect on our reputation, business, results of operations and financial condition.
Outside the United States, our products and operations are also often required to comply with standards set by industrial standards bodies, such as the ISO. Foreign regulatory bodies may evaluate our products or the testing that our products undergo against these standards. The specific standards, types of evaluation and scope of review differ among foreign regulatory bodies. We intend to comply with the standards enforced by such foreign regulatory bodies as needed to commercialize our products. If we fail to adequately comply with any of these standards, a foreign regulatory body may take adverse actions similar to those within the power of the FDA. Any such action may harm our reputation and business, and could have an adverse effect on our business, results of operations and financial condition.
A recall of our products, either voluntarily or at the direction of the FDA or another governmental authority, or the discovery of serious safety issues with our products, could have a significant adverse impact on us.
The FDA and similar foreign governmental authorities have the authority to require the recall of commercialized products in the event of material deficiencies or defects in design or manufacture or in the event that a product poses an unacceptable risk to health. Manufacturers may, under their own initiative, recall a product if any material deficiency in a device is found. Even if voluntary, the FDA requires that a medical device manufacturer report to the FDA any corrective action or removal of a device initiated to reduce a risk to health posed by the device. A government-mandated or voluntary recall by us or one of our distributors could occur as a result of risk to health, component failures, manufacturing errors, design or labeling defects or other deficiencies and issues. Recalls of any of our products would divert managerial and financial resources and have an adverse effect on our reputation, results of operations and financial condition, which could impair our ability to produce our products in a cost-effective and timely manner in order to meet our customers’ demands. We may also be required to bear other costs or take other actions that may have a negative impact on our future sales and our ability to generate profits.
In the EEA, we must comply with the EU Medical Device Vigilance System. Under this system, manufacturers are required to take Field Safety Corrective Actions (“FSCAs”) to reduce a risk of death or serious deterioration in the state of health associated with the use of a medical device that is already placed
33
on the market. A FSCA may include the recall, modification, exchange, destruction or retrofitting of the device.
Any adverse event involving our products, whether in the United States or abroad, could result in future voluntary corrective actions, such as recalls or customer notifications, or agency action, such as inspection, mandatory recall or other enforcement action. Any corrective action, whether voluntary or involuntary, as well as defending ourselves in a lawsuit, will require the dedication of our time and capital, distract management from operating our business and may harm our reputation and financial results.
We may be subject to enforcement action if we engage in the off-label promotion of our products.
Our promotional materials and training methods must comply with FDA and other applicable laws and regulations, including the prohibition of the promotion of off-label use. Physicians may use our products off-label, as the FDA does not restrict or regulate a physician’s choice of treatment within the practice of medicine. However, if the FDA determines that our promotional efforts constitutes promotion of an off-label use, it could request that we modify our training or promotional efforts or subject us to regulatory or enforcement actions, including the issuance of an untitled letter, a warning letter, injunction, seizure, civil fine and criminal penalties. It is also possible that other federal, state or foreign enforcement authorities, such as the Department of Justice (“DOJ”), might take action if they consider our promotional or training materials to constitute promotion of an unapproved/off-label use, which could result in significant criminal and/or civil fines or penalties under other statutory authorities, such as laws prohibiting false claims for reimbursement (e.g., the False Claims Act). In that event, our reputation could be damaged and adoption of the products would be impaired. Although our policy is to refrain from statements that could be considered off-label promotion of our products, the FDA or another regulatory agency could disagree and conclude that we have engaged in off-label promotion. In addition, the off-label use of our products may increase the risk of injury to patients, and, in turn, the risk of product liability claims. Product liability claims are expensive to defend and could divert our management’s attention, result in substantial damage awards against us and harm our reputation.
Governmental regulation and limited sources and suppliers could restrict our procurement and use of tissue.
In the United States, the procurement and transplantation of allograft bone tissue is subject to federal law pursuant to the NOTA, a criminal statute which prohibits the purchase and sale of human organs used in human transplantation, including bone and related tissue, for “valuable consideration.” NOTA permits reasonable payments associated with the removal, transportation, processing, preservation, quality control, implantation and storage of human bone tissue. We provide services in all of these areas in the United States, with the exception of removal and implantation, and receive payments for all such services. We make payments to tissue banks for their services related to recovering allograft bone tissue on our behalf. If NOTA is interpreted or enforced in a manner that prevents us from receiving payment for services we render or that prevents us from paying tissue banks or certain of our clients for the services they render for us, our business could be materially adversely affected.
We depend on a limited number of sources of human tissue for use in some of our regenerative biologics products and a limited number of entities to process the human tissue for use in those regenerative biologics products, and any failure to obtain tissue from these sources or to have the tissue processed by these entities for us in a timely manner will interfere with our ability to effectively meet demand for our regenerative biologics products incorporating human tissue. Less than five third-party suppliers currently supply all of our needs for allograft implants and products, other than those implants and products that we process ourselves. The processing of human tissue into our regenerative biologics products is very labor-
34
intensive and it is therefore difficult to maintain a steady supply stream. In addition, due to seasonal changes in mortality rates, some scarce tissues used in our regenerative biologics products are at times in particularly short supply. We cannot be certain that our current supply of human tissue and allograft implants, plus any additional source that we identify in the future, will be sufficient to meet our needs. Our dependence on a small number of third-party suppliers and the challenges we may face in obtaining adequate supplies of human tissue involve several risks, including limited control over pricing, availability, quality and delivery schedules. In addition, any interruption in the supply of any human tissue component could materially harm our and our third-party suppliers’ ability to manufacture our regenerative biologics products until a new source of supply, if any, could be found. We may be unable to find a sufficient alternative supply channel in a reasonable time period or on commercially reasonable terms, if at all, which would have a material adverse effect on our business, results of operations and financial condition.
Negative publicity concerning methods of tissue recovery and screening of donor tissue in our industry could reduce demand for our regenerative biologics products and impact the supply of available donor tissue.
Media reports or other negative publicity concerning both alleged improper methods of tissue recovery from donors and disease transmission from donated tissue could limit widespread acceptance of some of our regenerative biologics products. Unfavorable reports of improper or illegal tissue recovery practices, both in the United States and internationally, as well as incidents of improperly processed tissue leading to the transmission of disease, may broadly affect the rate of future tissue donation and market acceptance of technologies incorporating human tissue. In addition, such negative publicity could cause the families of potential donors to become reluctant to agree to donate tissue to for-profit tissue processors. For example, the media has reported examples of alleged illegal harvesting of body parts from cadavers and resulting recalls conducted by certain companies selling human tissue based products affected by the alleged illegal harvesting. These reports and others could have a negative effect on our tissue regeneration business.
We are subject to environmental laws and regulations that can impose significant costs and expose us to potential financial liabilities.
The manufacture of certain of our products, including our allograft implants and products, and the handling of materials used in the product testing process, including in our cadaveric laboratory, involve the controlled use of biological, hazardous and/or radioactive materials and wastes. Our business and facilities and those of our suppliers are subject to foreign, federal, state and local laws and regulations relating to the protection of human health and the environment, including those governing the use, manufacture, storage, handling and disposal of, and exposure to, such materials and wastes. In addition, under some environmental laws and regulations, we could be held responsible for costs relating to any contamination at our past or present facilities and at third-party waste disposal sites even if such contamination was not caused by us. A failure to comply with current or future environmental laws and regulations could result in severe fines or penalties. Any such expenses or liability could have a significant negative impact on our business, results of operations and financial condition.
We or our suppliers may be the subject of claims for non-compliance with FDA regulations in connection with the processing, manufacturing or distribution of our proposed allograft or other regenerative biologics implants and products.
Allegations may be made against us or against donor recovery groups or tissue banks, including those with which we have a contractual supplier relationship, claiming that the acquisition or processing of tissue for allograft implants and products or other regenerative biologics products does not comply with applicable FDA regulations or other relevant statutes and regulations. Allegations like these could cause regulators or
35
other authorities to take investigative or other action against us or our suppliers, or could cause negative publicity for us or our industry generally. These actions or any negative publicity could cause us to incur substantial costs, divert the attention of our management from our business and harm our reputation.
We and our distributor sales representatives might be subject to claims for failing to comply with U.S. federal, state and foreign fraud and abuse laws, including anti-kickback laws and other anti-referral laws.
There are numerous U.S. federal and state laws pertaining to healthcare fraud and abuse, including anti-kickback laws and physician self-referral laws. Our relationships with surgeons, hospitals and our independent distributors are subject to scrutiny under these laws. Violations of these laws are punishable by criminal and civil sanctions, including, in some instances, imprisonment and exclusion from participation in federal and state healthcare programs, including the Medicare, Medicaid and Veterans Administration health programs. Because of the broad and far-reaching nature of these laws, we may be required to alter or discontinue one or more of our business practices to be in compliance with these laws.
Healthcare fraud and abuse regulations are complex, and even minor irregularities can potentially give rise to claims that a statute or prohibition has been violated. Examples of laws that may affect our ability to operate include:
|
•
|
the Federal Anti-Kickback Statute, which prohibits, among other things, persons from knowingly and willfully soliciting, receiving, offering or paying remuneration, directly or indirectly, in exchange for or to induce either the referral of an individual for, or the purchase, order or recommendation of, any good or service for which payment may be made under federal healthcare programs such as the Medicare and Medicaid programs;
|
|
•
|
federal false claims laws which prohibit, among other things, individuals or entities from knowingly presenting, or causing to be presented, claims for payment from Medicare, Medicaid, or other third-party payors that are false or fraudulent;
|
|
•
|
the federal Health Insurance Portability and Accountability Act of 1996, which created federal criminal laws that prohibit executing a scheme to defraud any healthcare benefit program or making false statements relating to healthcare matters;
|
|
•
|
the Federal Trade Commission Act and similar laws regulating advertisement and consumer protections;
|
|
•
|
the FCPA, which prohibits corrupt payments, gifts or transfers of value to foreign officials;
|
|
•
|
foreign and U.S. state law equivalents of each of the above federal laws, such as anti-kickback and false claims laws which may apply to items or services reimbursed by any third-party payor, including commercial insurers; and
|
|
•
|
the Physician Payment Sunshine Act, which requires medical device companies to report all compensation, gifts and benefits they have provided to certain healthcare professionals.
|
Possible sanctions for violation of these laws include monetary fines, civil and criminal penalties, exclusion from Medicare and Medicaid programs and forfeiture of amounts collected in violation of such prohibitions. Any violations of these laws, or any action against us for violation of these laws, even if we successfully defend against it, could result in a material adverse effect on our reputation, business, results of operations and financial condition.
We have entered into consulting, royalty and other agreements with surgeons, including some who make referrals to us. In addition, some of our referring surgeons own our stock, which they either purchased in an arm’s length transaction on terms identical to those offered to non-referral sources or received from us as fair market value consideration for consulting services performed. While these transactions were structured with the intention of complying with all applicable laws, including the federal ban on physician self-referrals,
36
commonly known as the “Stark Law,” state anti-referral laws and other applicable anti-kickback laws, it is possible that regulatory agencies may view these transactions as prohibited arrangements that must be restructured, or discontinued, or for which we could be subject to other significant penalties. Regulators also could prohibit us from accepting payment for referrals from these surgeons. We would be materially and adversely affected if regulatory agencies interpret our financial relationships with spine surgeons who order our products to be in violation of applicable laws and we were unable to comply with applicable laws. This could subject us to monetary penalties for non-compliance, the cost of which could be substantial, or we may be unable to accept referrals from such surgeons.
To enforce compliance with the federal laws, the DOJ has increased its scrutiny of interactions between healthcare companies and healthcare providers, which has led to a number of investigations, prosecutions, convictions and settlements in the healthcare industry. Dealing with investigations can be time- and resource-consuming and can divert management’s attention from the business. Additionally, if an investigation were initiated involving us and we decided to settle that investigation with the DOJ or other law enforcement agencies, we may be forced to agree to additional onerous compliance and reporting requirements as part of a consent decree or corporate integrity agreement. Any such investigation or settlement could increase our costs or otherwise have an adverse effect on our business, financial condition and results of operations.
In addition, there has been a recent trend of increased federal and state regulation of payments made to physicians for marketing. Some states, such as California, Massachusetts and Vermont, mandate implementation of commercial compliance programs, along with the tracking and reporting of gifts, compensation and other remuneration to physicians. The shifting commercial compliance environment and the need to build and maintain robust and expandable systems to comply with different compliance and/or reporting requirements in multiple jurisdictions increase the possibility that a healthcare company may run afoul of one or more of the requirements.
The scope and enforcement of these laws is uncertain and subject to rapid change in the current environment of healthcare reform, especially in light of the lack of applicable precedent and regulations. Federal or state regulatory authorities might challenge our current or future activities under these laws. Any such challenge could have a material adverse effect on our reputation, business, results of operations and financial condition. In addition to the penalties described above, any state or federal regulatory review of us, regardless of the outcome, would be costly and time-consuming and could have a material adverse effect on our business, financial condition and results of operations.
Risks Related to our Financial Results and Need for Financing
We will need to generate significant sales to remain profitable.
We intend to increase our operating expenses substantially as we add sales representatives and distributors to increase our geographic sales coverage, submit additional
investigational device exemption (“IDE”)
applications to the FDA, increase our marketing capabilities, conduct clinical trials and increase our general and administrative functions to support our growing operations. We will need to generate significant sales to maintain profitability and we might not be able to do so. Even if we do generate significant sales, we might not be able to sustain or increase profitability on a quarterly or annual basis in the future. If our sales grow more slowly than we anticipate or if our operating expenses exceed our expectations, our business, financial condition and results of operations will likely be adversely affected.
37
We may be unable to grow our revenue or earnings as anticipated, which may have a material adverse effect on our results of operations.
We have experienced rapid growth since our inception and have increased our revenues to
$564.0 million
in
2016
. Our ability to achieve future growth will depend upon, among other things, the success of our growth strategies, which we cannot assure will be successful. In addition, we may have more difficulty maintaining our historical or prior rate of growth of revenues, profitability or cash flows. Our future success will depend upon numerous factors, including the strength of our brand, the market success of our current and future products, competitive conditions, our ability to attract and retain our employees and our ability to manage our business and implement our growth strategy. If we are unable to achieve future growth, our business, financial condition and results of operations could be adversely affected. In addition, we anticipate significantly expanding our infrastructure and adding personnel in connection with our anticipated growth, which we expect will cause our selling, general and administrative expenses to increase, which could adversely impact our results of operations.
Our quarterly and annual operating results may fluctuate significantly.
Our operating results are difficult to predict and may be subject to periodic fluctuations. Our sales and results of operations will be affected by numerous factors, including:
|
•
|
our ability to drive increased sales of our products;
|
|
•
|
our ability to establish and maintain an effective and dedicated sales force;
|
|
•
|
pricing pressure applicable to our products, including adverse third-party coverage and reimbursement outcomes;
|
|
•
|
results of clinical research and trials on our existing products and products in development;
|
|
•
|
the mix of our products sold because profit margins differ amongst our products;
|
|
•
|
timing of new product offerings, acquisitions, licenses or other significant events by us or our competitors;
|
|
•
|
the ability of our suppliers to timely provide us with an adequate supply of materials and components;
|
|
•
|
the evolving product offerings of our competitors;
|
|
•
|
regulatory approvals and legislative changes affecting the products we may offer or those of our competitors;
|
|
•
|
interruption in the manufacturing or distribution of our products;
|
|
•
|
the effect of competing technological, industry and market developments;
|
|
•
|
changes in our ability to obtain regulatory clearance or approval for our products; and
|
|
•
|
our ability to expand the geographic reach of our sales and marketing efforts.
|
Many of the products we may seek to develop and introduce in the future will require FDA approval or clearance before commercialization in the United States, and commercialization of such products outside of the United States would likely require additional regulatory approvals and import licenses. As a result, it will be difficult for us to forecast demand for these products with any degree of certainty. In addition, we will be increasing our operating expenses as we expand our commercial capabilities. Accordingly, we may experience significant, unanticipated quarterly or annual losses. If our quarterly or annual operating results fall below the expectations of investors or securities analysts, the price of our Class A common stock could decline substantially. Furthermore, any quarterly or annual fluctuations in our operating results may, in turn, cause the price of our Class A common stock to fluctuate substantially. We believe that quarterly comparisons of our financial results are not necessarily meaningful and should not be relied upon as an indication of our future performance.
38
The availability of funding under existing credit arrangements might be limited, and our cash and cash equivalents are subject to volatility.
Any lender that is obligated to provide funding to us under any now existing or future credit agreement with us may not be able to provide funding in a timely manner, or at all, when we require it. The cost of, or lack of, available credit or equity financing could impact our ability to develop sufficient liquidity to maintain or grow our company, which in turn may adversely affect our business, results of operations or financial condition. We also manage cash and cash equivalents and short-term investments through various institutions. There may be a risk of loss on investments based on the volatility of the underlying instruments that will prevent us from recovering the full principal of our investments. Negative changes in domestic and global economic conditions or disruptions of either or both of the financial and credit markets may also affect third-party payors and may have a material adverse effect on our stock price, business, results of operations, financial condition and liquidity.
Our future capital needs are uncertain and we may need to raise funds in the future, and such funds may not be available on acceptable terms or at all.
Continued expansion of our business will be expensive and we may seek funds from public and private stock offerings, borrowings under our existing or future credit facilities or other sources. Our capital requirements will depend on many factors, including:
|
•
|
the revenues generated by sales of our products;
|
|
•
|
the costs associated with expanding our sales and marketing efforts;
|
|
•
|
the expenses we incur in manufacturing and selling our products;
|
|
•
|
the costs of developing and commercializing new products or technologies;
|
|
•
|
the cost of obtaining and maintaining regulatory approval or clearance of our products and products in development;
|
|
•
|
the number and timing of acquisitions and other strategic transactions;
|
|
•
|
the costs associated with our planned international expansion;
|
|
•
|
the costs associated with increased capital expenditures, including fixed asset purchases of instrument sets which we loan to hospitals to support surgeries; and
|
|
•
|
unanticipated general and administrative expenses.
|
As a result of these factors, we may seek to raise capital, and such capital may not be available on favorable terms, or at all. Furthermore, if we issue equity or debt securities to raise capital, our existing stockholders may experience dilution, and the new equity or debt securities may have rights, preferences and privileges senior to those of our existing stockholders. In addition, if we raise capital through collaboration, licensing or other similar arrangements, it may be necessary to relinquish valuable rights to our products, potential products or proprietary technologies, or grant licenses on terms that are not favorable to us. If we cannot raise capital on acceptable terms, we may not be able to develop or enhance our products, execute our business plan, take advantage of future opportunities, or respond to competitive pressures, changes in our supplier relationships, or unanticipated customer requirements. Any of these events could adversely affect our ability to achieve our development and commercialization goals, which could have a material adverse effect on our business, results of operations and financial condition.
Our existing revolving credit facility contains restrictive covenants that may limit our operating flexibility.
Our existing revolving credit facility contains certain restrictive covenants that limit our ability to transfer or dispose of assets, merge with other companies or consummate certain changes of control, acquire other companies, pay dividends, incur additional indebtedness and liens, experience changes in management
39
and enter into new businesses. We therefore may not be able to engage in any of the foregoing transactions unless we obtain the consent of the lender or terminate the revolving credit facility. There is no guarantee that we will be able to generate sufficient cash flow or sales to meet the financial covenants or pay the principal and interest on any such debt. Furthermore, there is no guarantee that future working capital, borrowings or equity financing will be available to repay or refinance any such debt.
We have self-identified a material weakness in our internal controls. If we fail to maintain an effective system of internal controls over financial reporting there is a reasonable possibility that a material misstatement of our annual or interim financial statements will not be prevented or detected on a timely basis.
Our management is responsible for establishing and maintaining adequate internal controls over our financial reporting, as defined in Rule 13a-15(f) and 15d-15(f) under the Exchange Act. As disclosed in
“Part II; Item 9A. Controls and Procedures”
below, in connection with the audit of our consolidated financial statements as of and for the year ended December 31, 2016, we self-identified a material weakness in our internal control over financial reporting related to the computation of non-cash activities in depreciation and scrap expense of instruments and cases. A material weakness is defined as a deficiency, or combination of deficiencies, in internal control over financial reporting, such that there is a reasonable possibility that a material misstatement of our annual or interim financial statements will not be prevented or detected on a timely basis.
Although we have developed and are implementing a plan to remediate this material weakness and believe, based on our evaluation to date, that this material weakness will be remediated during 2017, we cannot assure you that this will occur within the contemplated timeframe. Moreover, we cannot assure you that we will not identify additional material weaknesses in our internal control over financial reporting in the future. If we are unable to remediate the material weakness, our ability to record, process and report financial information accurately, and to prepare financial statements within the time periods specified by the rules and forms of the SEC, could be adversely affected. The occurrence of or failure to remediate the material weakness may result in a reasonable possibility that a material misstatement of our annual or interim financial statements will not be prevented or detected on a timely basis and may adversely affect our reputation and business and the market price of our common stock.
Risks Related to our Intellectual Property and Potential Litigation
Our ability to protect our intellectual property and proprietary technology is uncertain.
We rely primarily on patent, copyright, trademark and trade secret laws, as well as confidentiality and non-disclosure agreements and other methods, to protect our proprietary technologies and know-how. We have applied for patent protection relating to certain existing and proposed products and processes. While we generally apply for patents in those countries where we intend to make, have made, use or sell patented products, we may not accurately predict all of the countries where patent protection will ultimately be desirable. If we fail to timely file a patent application in any such country, we may be precluded from doing so at a later date. Furthermore, we cannot assure you that any of our patent applications will be approved. The rights granted to us under our patents, including prospective rights sought in our pending patent applications, may not be meaningful or provide us with any commercial advantage and they could be opposed, contested or circumvented by our competitors or be declared invalid or unenforceable in judicial or administrative proceedings. The failure of our patents to adequately protect our technology might make it easier for our competitors to offer the same or similar products or technologies. Competitors may be able to design around our patents or develop products that provide outcomes which are comparable to ours without infringing on our intellectual property rights. We have entered into confidentiality agreements and intellectual
40
property assignment agreements with our officers, employees, consultants and advisors regarding our intellectual property and proprietary technology. In the event of unauthorized use or disclosure or other breaches of such agreements, we may not be provided with meaningful protection for our trade secrets or other proprietary information. Due to differences between foreign and U.S. patent laws, our patented intellectual property rights may not receive the same degree of protection in foreign countries as they would in the United States. Even if patents are granted outside the United States, effective enforcement in those countries may not be available. Since most of our issued patents and pending patent applications are for the United States only, we lack a corresponding scope of patent protection in other countries. In countries where we do not have significant patent protection, we may not be able to stop a competitor from marketing products in such countries that are the same as or similar to our products.
We rely on our trademarks, trade names and brand names to distinguish our products from the products of our competitors, and have registered or applied to register many of these trademarks. We cannot assure you that our trademark applications will be approved. Third parties may also oppose our trademark applications, or otherwise challenge our use of the trademarks. In the event that our trademarks are successfully challenged, we could be forced to rebrand our products, which could result in loss of brand recognition, and could require us to devote resources to advertising and marketing new brands. Further, we cannot assure you that competitors will not infringe upon our trademarks, or that we will have adequate resources to enforce our trademarks.
If a competitor infringes upon one of our patents, trademarks or other intellectual property rights, enforcing those patents, trademarks and other rights may be difficult and time consuming. Even if successful, litigation to defend our patents and trademarks against challenges or to enforce our intellectual property rights could be expensive and time consuming and could divert management’s attention from managing our business. Moreover, we may not have sufficient resources or desire to defend our patents or trademarks against challenges or to enforce our intellectual property rights.
The medical device industry is characterized by patent litigation and we could become subject to litigation that could be costly, result in the diversion of management’s time and efforts, require us to pay damages, and/or prevent us from marketing our existing or future products.
Our commercial success will depend in part on not infringing the patents or violating the other proprietary rights of third parties. Significant litigation regarding patent rights exists in our industry. Our competitors in both the United States and abroad, many of which have substantially greater resources and have made substantial investments in competing technologies, may have applied for or obtained or may in the future apply for and obtain, patents that will prevent, limit or otherwise interfere with our ability to make and sell our products. We have not conducted an independent review of patents issued to third parties. The large number of patents, the rapid rate of new patent issuances, the complexities of the technology involved and uncertainty of litigation increase the risk of business assets and management’s attention being diverted to patent litigation. We have received in the past, and expect to receive in the future, communications from various industry participants alleging our infringement of their patents, trade secrets or other intellectual property rights and/or offering licenses to such intellectual property. We are currently subject to lawsuits, and have received other written allegations, claiming that we have infringed certain patents of others in the spine industry. A summary of these cases is provided under
“Item 3. Legal Proceedings”
below. Any lawsuits resulting from such allegations could subject us to significant liability for damages, and invalidate our proprietary rights. Any potential intellectual property litigation also could force us to do one or more of the following:
41
|
•
|
stop selling products or using technology that contains the allegedly infringing intellectual property;
|
|
•
|
lose the opportunity to license our technology to others or to collect royalty payments based upon successful protection and assertion of our intellectual property rights against others;
|
|
•
|
incur significant legal expenses;
|
|
•
|
pay substantial damages to the party whose intellectual property rights we may be found to be infringing;
|
|
•
|
redesign those products that contain the allegedly infringing intellectual property, which could be costly and disruptive; or
|
|
•
|
attempt to obtain a license to the relevant intellectual property from third parties, which may not be available on reasonable terms or at all.
|
Any litigation or claim against us, even those without merit, may cause us to incur substantial costs, and could place a significant strain on our financial resources, divert the attention of management from our core business, and harm our reputation. Further, as the number of participants in the spine industry grows, the possibility of intellectual property infringement claims against us increases. If we are found to infringe the intellectual property rights of third parties, we could be required to pay substantial damages (including treble, or triple, damages if an infringement is found to be willful) and/or royalties and could be prevented from selling our products unless we obtain a license or are able to redesign our products to avoid infringement. Any such license may not be available on reasonable terms, if at all, and there can be no assurance that we would be able to redesign our products in a way that would not infringe the intellectual property rights of others. If we fail to obtain any required licenses or make any necessary changes to our products or technologies, we may have to withdraw existing products from the market or may be unable to commercialize one or more of our products, all of which could have a material adverse effect on our business, results of operations and financial condition.
Further, in the course of our regular review of pending legal matters, we determine whether it is probable that a potential loss relating to a legal proceeding may have a material impact on our business, financial performance or cash position. However, estimates of probable losses are inherently uncertain, and even if we determine that a loss is probable, in accordance with authoritative accounting guidance, if we are unable to estimate the possible loss or range of loss, we do not record an accrual related to such litigation. As a result of this accounting policy, we may experience variability in our results of operations if damages for which we are found liable exceed the amounts we have accrued. For example, on January 17, 2014, the jury in a misappropriation of trade secret suit filed against us in the Federal District Court for the Eastern District of Texas by Sabatino Bianco returned a verdict in favor of Bianco. In prior periods, we were unable to determine the probable outcome in that case or estimate the potential loss. As a result of that verdict, we incurred
$4.3 million
in damages, which reduced our 2013 U.S. GAAP diluted earnings per share by approximately
$0.03
. See further discussion under
“Part II; Item 7. Management’s Discussion and Analysis of Financial Condition and Results of Operations; Non-GAAP Financial Measures”
below.
In addition, we generally indemnify our customers and distributors with respect to infringement by our products of the proprietary rights of third parties. Third parties may assert infringement claims against our customers or distributors. These claims may require us to initiate or defend protracted and costly litigation on behalf of our customers or distributors, regardless of the merits of these claims. If any of these claims succeed, we may be forced to pay damages on behalf of our customers or distributors or may be required to obtain licenses for the products they use. If we cannot obtain all necessary licenses on commercially reasonable terms, our customers may be forced to stop using our products.
42
We may be subject to damages resulting from claims that we, our employees or our independent distributors have wrongfully used or disclosed alleged trade secrets, proprietary or confidential information of our competitors or are in breach of non-competition or non-solicitation agreements with our competitors.
Many of our employees were previously employed at other medical device companies, including our competitors or potential competitors, in some cases until recently. Many of our independent distributors sell, or in the past have sold, products of our competitors. We may be subject to claims that we, our employees, or our independent distributors have inadvertently or otherwise used or disclosed trade secrets or other proprietary information of these former employers or competitors. In addition, we have been and may in the future be subject to claims that we caused an employee to breach the terms of his or her non-competition or non-solicitation agreement. Litigation may be necessary to defend against these claims. Even if we are successful in defending against these claims, litigation could result in substantial costs and could be a distraction to management. If our defense to those claims fails, in addition to paying monetary damages, we may lose valuable personnel. There can be no assurance that this type of litigation will not continue, and any future litigation or the threat thereof may adversely affect our ability to hire additional direct sales representatives. A loss of key personnel or their work product could hamper or prevent our ability to commercialize product candidates, which could have an adverse effect on our business, results of operations and financial condition.
We may incur product liability losses and insurance coverage may be inadequate or unavailable to cover these losses.
Our business exposes us to potential product liability claims that are inherent in the testing, design, manufacture and sale of medical devices for spine surgery procedures. The development of allograft implants and technologies for human tissue repair and treatment may entail particular risk of transmitting diseases to human recipients, which could result in the assertion of substantial product liability claims against us. Spine surgery involves significant risk of serious complications, including bleeding, nerve injury, paralysis and even death. In addition, if longer-term patient results and experience indicates that our products or any component of a product cause tissue damage, motor impairment or other adverse effects, we could be subject to significant liability. Furthermore, if spine surgeons are not sufficiently trained in the use of our products, they may misuse or ineffectively use our products, which may result in unsatisfactory patient outcomes or patient injury. We could become the subject of product liability lawsuits alleging that component failures, manufacturing flaws, design defects or inadequate disclosure of product-related risks or product-related information resulted in an unsafe condition or injury to patients. The spine industry has been particularly prone to potential product liability claims that are inherent in the testing, manufacture and sale of medical devices and products for spine surgery procedures.
A product liability or other damages claim, product recall or product misuse, regardless of the outcome, could require us to spend significant time and money in litigation or to pay significant damages or costs, and could seriously harm our business. If our product liability insurance is inadequate to pay a damages award, we may have to pay the excess out of our cash reserves, which may harm our financial condition. Any product liability claim brought against us, with or without merit, could result in the increase of the costs we incur to obtain product liability insurance or our inability to secure product liability coverage in the future. If any of our products are found to cause tissue damage, motor impairment or other adverse effects, we could be subject to significant liability. Even a meritless or unsuccessful product liability claim could harm our reputation in the industry, impair our ability to sell one or more of our products in the future, result in significant legal fees and cause significant diversion of management’s attention from managing our business. A product liability or other claim, product recall, or product misuse involving any of our products, whether or not meritorious, could also materially and adversely harm our reputation and our ability to attract and retain customers.
43
In addition, any product liability claim brought against us, with or without merit, could result in an increase of our product liability insurance rates. Insurance coverage varies in cost and can be difficult to obtain, and we cannot guarantee that we will be able to obtain insurance coverage in the future on terms acceptable to us or at all.
Risks Related to the Ownership of our Class A Common Stock
Because of their significant stock ownership, our chief executive officer, our other executive officers, and our directors and principal stockholders will be able to exert control over us and our significant corporate decisions.
Because of their significant stock ownership, our chief executive officer, our other executive officers, and our directors will be able to exert substantial control over us and our significant corporate decisions. Based on an aggregate of
95,929,916
shares of our Class A and Class B common stock outstanding as of
December 31, 2016
, our executive officers and directors and their affiliates beneficially owned, in the aggregate, approximately
76.2%
of the voting power of our outstanding capital stock. In particular, as of
December 31, 2016
, David C. Paul, our CEO and his family members, controlled approximately
25.6%
of our Class A and Class B common stock, representing approximately
75.8%
of the voting power of our outstanding capital stock as of that date.
As a result, David C. Paul has, and these persons acting together have, the ability to significantly influence or determine the outcome of all matters submitted to our stockholders for approval, including the election and removal of directors and any merger, consolidation, or sale of all or substantially all of our assets. Furthermore, as of
December 31, 2016
, we had
192,602,551
shares of Class B common stock available for issuance. This amount exceeds 5% of our outstanding common stock, meaning our Board of Directors (“Board”) could issue Class B common stock without necessarily triggering the automatic conversion of that Class B common stock to Class A common stock that, pursuant to our charter, will occur when any holder’s shares of Class B common stock represents less than 5% of the aggregate number of all outstanding shares of our common stock, thereby further concentrating the voting power of our capital stock in a limited number of stockholders.
The interests of our executive officers, directors and principal stockholders might not coincide with the interests of the other holders of our capital stock. This concentration of ownership may harm the value of our Class A common stock by, among other things:
|
•
|
delaying, deferring or preventing a change in control of our company;
|
|
•
|
impeding a merger, consolidation, takeover or other business combination involving our company; or
|
|
•
|
causing us to enter into transactions or agreements that are not in the best interests of all stockholders.
|
We are a “controlled company” within the meaning of the New York Stock Exchange Rules, and we take, and intend to continue to take, advantage of exemptions from certain corporate governance requirements.
David C. Paul, alone, and our management, directors and significant stockholders, collectively, beneficially own a majority of the voting power of our outstanding common stock. Under the New York Stock Exchange Rules, a company of which more than 50% of the voting power is held by an individual, group or another company is a “controlled company” and may elect not to comply with certain corporate governance requirements, including the requirement that a majority of our directors be independent, as defined in the New York Stock Exchange Rules, and the requirement that our compensation and nominating and
44
corporate governance committees consist entirely of independent directors. We rely, and intend to continue to rely, on the “controlled company” exemption under the New York Stock Exchange Rules. As a result, a majority of the members of our Board may not be independent directors and our nominating and corporate governance and compensation committees will not consist entirely of independent directors. Accordingly, while we remain a controlled company and during any transition period following a time when we are no longer a controlled company, you will not have the same protections afforded to stockholders of companies that are subject to all of the New York Stock Exchange’s corporate governance requirements.
Our Board is authorized to issue and designate shares of our preferred stock in additional series without stockholder approval.
Our amended and restated certificate of incorporation authorizes our Board, without the approval of our stockholders, to issue 35 million shares of our preferred stock, subject to limitations prescribed by applicable law, rules and regulations and the provisions of our amended and restated certificate of incorporation, as shares of preferred stock in series, and to establish from time to time the number of shares to be included in each such series, and to fix the designation, powers, preferences and rights of the shares of each such series and the qualifications, limitations or restrictions thereof. The powers, preferences and rights of these additional series of preferred stock may be senior to or on parity with our Class A common stock, which may reduce its value.
Anti-takeover provisions in our organizational documents and Delaware law may discourage or prevent a change of control, even if an acquisition would be beneficial to our stockholders, which could depress the price of our Class A common stock and prevent attempts by our stockholders to replace or remove our current management.
Our amended and restated certificate of incorporation and amended and restated bylaws contain other provisions that could delay or prevent a change of control of our company or changes in our Board that our stockholders might consider favorable.
In addition, we are subject to the provisions of Section 203 of the Delaware General Corporation Law regulating corporate takeovers, which may restrict or prohibit certain business combination transactions with stockholders owning 15% or more of our outstanding voting stock, including discouraging takeover attempts that might result in a premium over the market price for shares of our Class A common stock.
Section 203 and other provisions in our amended and restated certificate of incorporation, amended and restated bylaws and Delaware law could make it more difficult for stockholders or potential acquirers to obtain control of our Board or initiate actions that are opposed by our then-current Board, including delay or impede a merger, tender offer, or proxy contest involving our company. The existence of these provisions could negatively affect the price of our Class A common stock and limit opportunities for you to realize value in a corporate transaction.
We do not intend to pay cash dividends.
We have never declared or paid cash dividends on our capital stock. We currently intend to retain all available funds and any future earnings for use in the operation and expansion of our business and do not anticipate paying any cash dividends in the foreseeable future. In addition, we have a revolving credit facility that, if we borrow under it, may preclude us from paying any dividends. Accordingly, you may have to sell some or all of your shares of our Class A common stock in order to generate cash flow from your investment. You may not receive a gain on your investment when you sell shares and you may lose the entire amount of the investment.
Item 1B.
Unresolved Staff Comments
None.
Our corporate headquarters are located in Audubon, Pennsylvania and owned by us. We own research and manufacturing facilities in Massachusetts, Pennsylvania and Texas, lease additional research and manufacturing facilities in Texas and also own a distribution center in Heerlen, Netherlands to support our international operations. We maintain sales and administrative offices in
twenty-five
additional countries all of which are leased.
We are involved in a number of proceedings, legal actions and claims. Such matters are subject to many uncertainties, and the outcomes of these matters are not within our control and may not be known for prolonged periods of time. In some actions, the claimants seek damages, as well as other relief, including injunctions prohibiting us from engaging in certain activities, which, if granted, could require significant expenditures and/or result in lost revenues. For further details on the material legal proceedings to which we are currently a party, please refer to
“Part II; Item 8. Financial Statements and Supplementary Data; Notes to Consolidated Financial Statements; Note 15. Commitments and Contingencies”
below.
In addition, we are subject to legal proceedings arising in the ordinary course of business.
Not applicable.
45
Class A Common Stock Market Price
Our Class A common stock trades on The New York Stock Exchange, under the symbol “GMED.” The following table sets forth the high and low sales prices per share for our Class A common stock for the periods indicated, as reported by New York Stock Exchange:
|
Year Ended December 31, 2016:
|
High
|
Low
|
||||||
|
1st Quarter
|
$
|
27.64
|
|
$
|
21.56
|
|
||
|
2nd Quarter
|
25.99
|
|
21.90
|
|
||||
|
3rd Quarter
|
26.46
|
|
22.00
|
|
||||
|
4th Quarter
|
25.00
|
|
19.25
|
|
||||
|
Year Ended December 31, 2015:
|
High
|
Low
|
||||||
|
1st Quarter
|
$
|
26.00
|
|
$
|
23.04
|
|
||
|
2nd Quarter
|
26.30
|
|
23.15
|
|
||||
|
3rd Quarter
|
28.99
|
|
20.63
|
|
||||
|
4th Quarter
|
28.60
|
|
20.48
|
|
||||
We had approximately
67
stockholders of record as of
February 28, 2017
. We believe that the number of beneficial owners is substantially greater than the number of record holders because a large portion of our Class A common stock is held of record through brokerage firms in “street name.”
R
ecent Sales of Unregistered Securities
None.
Issuer Purchases of Equity Securities
None.
Dividend Policy
We have never declared or paid any cash dividends on our capital stock. We currently intend to retain future earnings, if any, for development of our business and do not anticipate that we will declare or pay cash dividends on our capital stock in the foreseeable future.
Comparative Stock Performance Graph
The following graph illustrates a comparison of the total cumulative stockholder return on our Class A common stock from August 3, 2012 (which is the date our Class A common stock first began trading on The New York Stock Exchange) through
December 31, 2016
to two indices: the S&P 500 Index and the S&P 500 Health Care Equipment Index. The graph assumes an initial investment of $100 on August 3, 2012, in each of our Class A common stock, the stocks comprising the S&P 500 Index, and the stocks comprising the S&P 500 Health Care Equipment Index, including reinvestment of dividends, if any. Historical stockholder return is not necessarily indicative of the performance to be expected for any future periods.
46
The following graph and related information shall not be deemed “soliciting material” or to be “filed” with the SEC, nor shall such information be incorporated by reference into any future filing, except to the extent that we specifically incorporate it by reference into such filing.
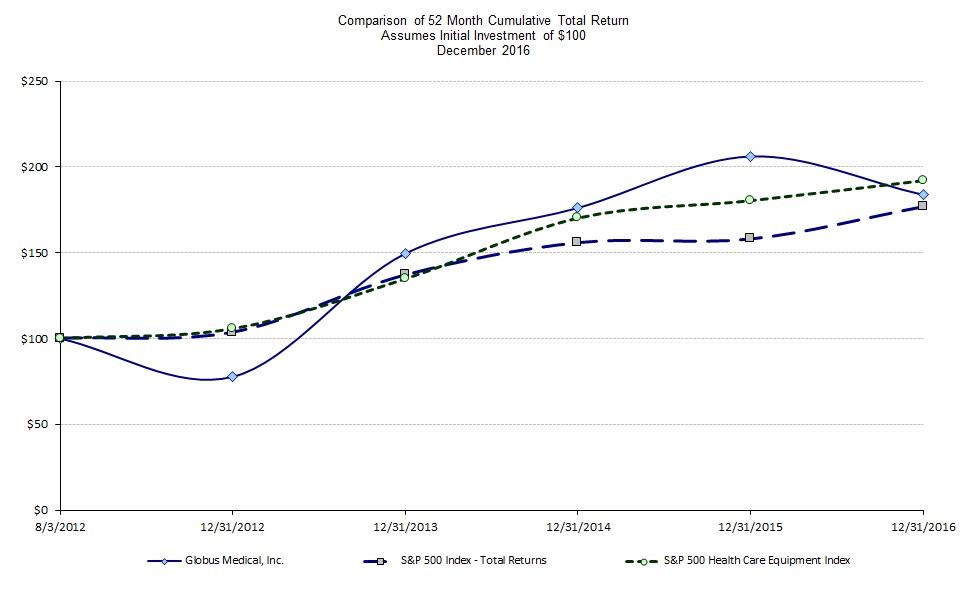
|
Company/Index
|
August 3,
2012 |
December 31,
2012 |
December 31,
2013 |
December 31,
2014 |
December 31,
2015 |
December 31,
2016 |
||||||
|
Globus Medical, Inc.
|
$100
|
$78
|
$149
|
$176
|
$206
|
$184
|
||||||
|
S&P 500 Index
|
$100
|
$104
|
$137
|
$156
|
$158
|
$177
|
||||||
|
S&P 500 Health Care Equipment
|
$100
|
$106
|
$135
|
$170
|
$181
|
$192
|
||||||
The selected consolidated financial data set forth in the table below has been derived from our audited financial statements. The data set forth below should be read in conjunction with
“Item 7. Management’s Discussion and Analysis of Financial Condition and Results of Operations”
and
“Item 8. Financial Statements and Supplementary Data”
below.
Certain reclassifications have been made to prior period statements to conform to the current period presentation.
47
|
Statement of Income Data:
|
Year Ended December 31,
|
||||||||||||||||||
|
(In thousands, except per share amounts)
|
2016
|
2015
|
2014
|
2013
|
2012
|
||||||||||||||
|
Sales
|
$
|
563,994
|
|
$
|
544,753
|
|
$
|
474,371
|
|
$
|
434,459
|
|
$
|
385,994
|
|
||||
|
Cost of goods sold
|
134,705
|
|
132,333
|
|
110,769
|
|
100,343
|
|
75,199
|
|
|||||||||
|
Gross profit
|
429,289
|
|
412,420
|
|
363,602
|
|
334,116
|
|
310,795
|
|
|||||||||
|
Operating expenses:
|
|||||||||||||||||||
|
Research and development
|
44,532
|
|
36,312
|
|
31,166
|
|
26,389
|
|
27,802
|
|
|||||||||
|
Selling, general and administrative
|
222,156
|
|
210,241
|
|
188,632
|
|
182,348
|
|
168,420
|
|
|||||||||
|
Provision for litigation
|
3,156
|
|
(11,268
|
)
|
5,667
|
|
23,055
|
|
(786
|
)
|
|||||||||
|
Amortization of intangibles
|
3,478
|
|
1,561
|
|
712
|
|
531
|
|
447
|
|
|||||||||
|
Acquisition related costs
|
1,826
|
|
3,352
|
|
(937
|
)
|
120
|
|
119
|
|
|||||||||
|
Total operating expenses
|
275,148
|
|
240,198
|
|
225,240
|
|
232,443
|
|
196,002
|
|
|||||||||
|
Operating income
|
154,141
|
|
172,222
|
|
138,362
|
|
101,673
|
|
114,793
|
|
|||||||||
|
Other income/(expense), net
|
3,138
|
|
583
|
|
280
|
|
328
|
|
(140
|
)
|
|||||||||
|
Income before income taxes
|
157,279
|
|
172,805
|
|
138,642
|
|
102,001
|
|
114,653
|
|
|||||||||
|
Income tax provision
|
52,938
|
|
60,021
|
|
46,157
|
|
33,389
|
|
40,822
|
|
|||||||||
|
Net income
|
$
|
104,341
|
|
$
|
112,784
|
|
$
|
92,485
|
|
$
|
68,612
|
|
$
|
73,831
|
|
||||
|
Net income per common share:
|
|||||||||||||||||||
|
Basic
|
$
|
1.09
|
|
$
|
1.19
|
|
$
|
0.98
|
|
$
|
0.74
|
|
$
|
0.82
|
|
||||
|
Diluted
|
$
|
1.08
|
|
$
|
1.17
|
|
$
|
0.97
|
|
$
|
0.73
|
|
$
|
0.80
|
|
||||
|
Weighted average number of common shares:
|
|||||||||||||||||||
|
Basic
|
95,647
|
|
95,046
|
|
94,227
|
|
92,647
|
|
89,608
|
|
|||||||||
|
Diluted
|
96,432
|
|
96,073
|
|
95,457
|
|
94,192
|
|
92,208
|
|
|||||||||
|
Balance Sheet Data:
|
As of December 31,
|
||||||||||||||||||
|
(In thousands)
|
2016
|
2015
|
2014
|
2013
|
2012
|
||||||||||||||
|
Cash, cash equivalents and marketable securities
|
$
|
350,756
|
|
$
|
329,791
|
|
$
|
304,051
|
|
$
|
275,452
|
|
$
|
212,400
|
|
||||
|
Working capital
|
433,874
|
|
462,108
|
|
380,613
|
|
348,866
|
|
320,602
|
|
|||||||||
|
Total assets
|
927,637
|
|
834,100
|
|
703,547
|
|
566,304
|
|
447,133
|
|
|||||||||
|
Business acquisition liabilities, including current portion
(1)
|
20,080
|
|
33,314
|
|
26,276
|
|
17,258
|
|
11,344
|
|
|||||||||
|
Stockholders’ equity
|
$
|
832,078
|
|
$
|
715,324
|
|
$
|
585,454
|
|
$
|
472,360
|
|
$
|
386,502
|
|
||||
|
(1)
|
In connection with certain acquisitions completed in 2016 through 2011, we have certain contingent consideration obligations payable to the sellers in these transactions upon the achievement of certain regulatory and sales milestones. The maximum aggregate undiscounted amounts potentially payable were
$29.1 million
,
$35.9 million
,
$38.9 million
,
$23.9 million
and
$9.9 million
as of December 31, 2016, 2015, 2014, 2013, and 2012, respectively.
|
48
The following discussion and analysis of our financial condition and results of operations should be read together with our consolidated financial statements and related notes included elsewhere in this Annual Report. This discussion and analysis contains forward-looking statements that involve risks, uncertainties and assumptions. You should review the “Risk Factors” and “Cautionary Note Concerning Forward-Looking Statements” sections of this Annual Report for a discussion of certain of the important factors that could cause actual results to differ materially from the results described in or implied by the forward-looking statements described in the following discussion and analysis. Certain amounts and percentages in this discussion and analysis have been rounded for convenience of presentation.
Overview
We are a
medical device company focused on the design, development and commercialization of musculoskeletal implants. We are currently focused on implants that promote healing in patients with spine disorders.
We are an engineering-driven company with a history of rapidly developing and commercializing advanced products and procedures that assist surgeons in effectively treating their patients, respond to evolving surgeon needs and address new treatment options.
Since our inception in 2003, we have launched over
170
products and offer a comprehensive product portfolio of innovative and differentiated products addressing a broad array of spinal pathologies, anatomies and surgical approaches.
We have also recently begun to develop a robotic surgical navigation device and products to treat patients who have experienced orthopedic traumas, although those development efforts are still ongoing and we currently have no robotic or orthopedic trauma products that are cleared by the FDA for sale.
We sell implants and related disposables to our customers, primarily hospitals, for use by surgeons to treat spine disorders. All of our current products fall into one of two categories: Innovative Fusion or Disruptive Technologies. Spinal fusion is a surgical procedure to correct problems with the individual vertebrae, the interlocking bones making up the spine, by preventing movement of the affected bones. Our Innovative Fusion products are used in cervical, thoracolumbar, sacral, and interbody/corpectomy fusion procedures to treat degenerative, deformity, tumor, and trauma conditions.
We define Disruptive Technologies as those that represent a significant shift in the treatment of spine disorders by allowing for novel surgical procedures, improvements to existing surgical procedures, the treatment of spine disorders by new physician specialties, and surgical intervention earlier in the continuum of care. Our current portfolio of approved and pipeline products includes a variety of Disruptive Technology products, which we believe offer material improvements to fusion procedures, such as minimally invasive surgical techniques, as well as new treatment alternatives including motion preservation technologies, such as dynamic stabilization, total disc replacement and interspinous process spacer products, and regenerative biologics technologies, as well as interventional pain management solutions, including treatments for vertebral compression fractures.
To date, the primary market for our products has been the United States, where we sell our products through a combination of direct sales representatives employed by us and distributor sales representatives employed by our exclusive independent distributors, who distribute our products on our behalf for a commission that is generally based on a percentage of sales. We believe there is significant opportunity to strengthen our position in the U.S. market by increasing the size of our U.S. sales force and we intend to add additional direct and distributor sales representatives in the future.
During the year ended
December 31, 2016
, (which includes the results since the acquisition date of the international operations and distribution channel of Alphatec Holdings, Inc. (“Alphatec International,”
49
see
Recent Developments
below)), our international sales accounted for approximately
11%
of our total sales. We sell our products in
49
countries outside the United States through a combination of direct sales representatives employed by us and international distributors. We believe there are significant opportunities for us to increase our presence in both existing and new international markets through the continued expansion of our direct and distributor sales forces and the commercialization of additional products.
Recent
Developments
On September 1, 2016, we acquired the international operations and distribution channel of Alphatec Holdings, Inc., a publicly traded orthopedic company (Nasdaq: ATEC) for
$80.1 million
in cash, subject to certain closing adjustments (see
“Part II; Item 8. Financial Statements and Supplementary Data; Notes to Consolidated Financial Statements; Note 2. Acquisitions”
).
On January 13, 2016, we entered into a settlement agreement providing for the settlement of four patent infringement lawsuits concerning spinal implant technologies between Globus Medical, Inc. and DePuy Synthes (the “Settlement Agreement”). Pursuant to the terms of the Settlement Agreement, we were required to make a
$7.9 million
payment to Depuy Synthes. The Settlement Agreement also provides for covenants not to sue relating to certain of the products sold by each of the parties and cross-licenses of all of the patents asserted in each of the Settled Lawsuits and each of the patents in those respective patent families. The Company does not expect the Settlement Agreement to impact its ability to conduct its business or have any impact on its future revenues.
The settlement resulted in one-time financial benefits reflecting the difference from previously established provisions and the final settlement amount through a one-time net income benefit of approximately
$7.6 million
, recognized during the fourth quarter of 2015, and a one-time transfer of approximately
$8.4 million
from restricted cash account into the cash account, which we recognized during the first quarter of 2016.
The Consolidated Appropriations Act of 2016, which was signed into law in December 2015, includes a two-year suspension on the medical device excise tax, effective January 1, 2016. The 2.3% tax on sales in the United States of certain medical devices by a manufacturer, producer or importer was enacted as part of the Affordable Care Act in 2010 and applied to device sales beginning on January 1, 2013. Without further legislative action, the tax will be automatically reinstated for certain medical device sales in the United States starting on January 1, 2018. We incurred
$8.1 million
and
$7.1 million
for this medical device excise tax for the years ended December 31, 2015 and 2014, respectively. In 2016, we redirected the medical device excise tax savings into research and development as well as expanded our in-house manufacturing capabilities.
Components of our Results of Operations
We manage our business globally within one reportable segment, which is consistent with how our management reviews our business, makes investment and resource allocation decisions and assesses operating performance.
Sales
We sell implants and related disposables, primarily to hospitals, for use by spine surgeons to treat spine disorders. We generally consign our surgical sets, which contain our implants, disposables, surgical instruments and cases to our sales representatives, and the sets are maintained with the sales representatives or at our hospital customers that purchase the implants and related disposables used in the surgeries. We recognize revenue when we are notified that consigned implants and related disposables have been implanted or used, or for sets that are sold directly and not consigned, when title to the goods and risk of loss are
50
transferred to customers with no remaining performance obligations which affect the customer’s final acceptance of the sale. We expect to expand our U.S. and international sales forces, which will provide us with significant opportunity to continue to increase our penetration in existing markets and to enter new international markets. We also expect to increase sales by commercializing new products, but expect the increase of sales from new products to be partially offset by decreased sales of earlier-generation products.
All of our current products fall into one of two categories: Innovative Fusion or Disruptive Technologies. Our Innovative Fusion products comprise fusion products to treat a wide variety of spinal disorders for the entire spine and can be used in a variety of surgical approaches. We believe our Innovative Fusion products have features and characteristics that may provide advantages for surgeons and potentially contribute to better outcomes for patients as compared to competing traditional fusion products.
We define Disruptive Technologies as those that represent a significant shift in the treatment of spinal disorders by allowing for novel surgical procedures, improvements to existing surgical procedures and the treatment of spinal disorders earlier in the continuum of care. We believe the use of Disruptive Technologies may improve patient outcomes and reduce costs given the expected lower morbidity rates, shorter patient recovery times and shorter hospital stays associated with these procedures. Additionally, Disruptive Technologies may help a patient avoid progression of spinal disc disease sometimes caused by traditional surgical options such as spinal fusion. Our current portfolio of approved and pipeline Disruptive Technology products includes products that allow for minimally invasive surgical (“MIS”) techniques, as well as new treatment alternatives, including motion preservation technologies, such as dynamic stabilization, total disc replacement and interspinous process spacer products, and regenerative biologics technologies, as well as interventional pain management solutions, including treatments for vertebral compression fractures.
As a result, we anticipate Disruptive Technology products to continue to drive our sales growth in the future.
Cost of Goods Sold
While we have increased our in-house spinal implant product manufacturing capacity, we also have products manufactured by third-party suppliers. Substantially all of our suppliers manufacture our products in the United States. Our cost of goods sold consists primarily of costs of products purchased from our third-party suppliers, excess and obsolete inventory charges, depreciation of surgical instruments and cases, royalties, shipping, inspection and related costs incurred in making our products available for sale or use. Beginning in January 2013, our cost of goods sold increased as a result of a medical device excise tax (“MDET”) of up to 2.3% on the sale of certain medical devices in the United States. On December 18, 2015, the MDET was suspended for two years effective January 1, 2016.
Research and Development Expenses
Our research and development expenses primarily consist of engineering, product development, clinical and regulatory expenses, consulting services, outside prototyping services, internal and external research activities, materials, depreciation, and other costs associated with development of our products. Research and development expenses also include related personnel and consultants’ compensation and stock-based compensation expense. We expense research and development costs as they are incurred.
We expect to incur additional research and development costs as we continue to develop new products. These costs will increase in absolute terms as we continue to expand our product pipeline and add personnel.
51
Selling, General and Administrative Expenses
Selling, general and administrative expenses primarily consist of salaries, benefits and other related costs, including stock-based compensation for personnel employed in sales, marketing, finance, legal, compliance, administrative, information technology, medical education and training, quality and human resource departments. Our selling, general and administrative expenses also include commissions, generally based on a percentage of sales, to direct sales representatives and distributors. We expect our selling, general and administrative expenses will increase in absolute terms with the continued expansion of our sales force and commercialization of our current and pipeline products. We plan to hire more personnel to support the growth of our business.
Provision for Litigation
We record a provision for litigation settlements when a loss is known or considered probable and the amount can be reasonably estimated and in the case of a favorable settlement, income when realized.
Amortization of Intangibles
We amortize finite lived intangible assets over the period of estimated benefit using the straight-line method and estimated lives ranging from one to seventeen years. Intangible assets are tested for impairment annually or whenever events or circumstances indicate that the carrying amount of the asset (asset group) may not be recoverable. If impairment is indicated, we measure the amount of the impairment loss as the amount by which the carrying amount exceeds the fair value of the asset. Fair value is generally determined using a discounted future cash flow analysis.
Acquisition Related Costs
Acquisition related costs represent: the change in fair value of business-acquisition-related contingent consideration; costs related to integrating recently acquired businesses, including but not limited to costs to exit or convert contractual obligations, severance, and information system conversion; and specific costs related to the consummation of the acquisition process such as banker fees, legal fees, and other acquisition related professional fees.
Income Tax Provision
We are taxed at the rates applicable within each jurisdiction. The composite income tax rate, tax provisions, deferred tax assets and deferred tax liabilities will vary according to the jurisdiction in which profits arise. Tax laws are complex and subject to different interpretations by management and the respective governmental taxing authorities, and require us to exercise judgment in determining our income tax provision, our deferred tax assets and liabilities, and the valuation allowance recorded against our net deferred tax assets.
Deferred tax assets and liabilities are determined using the enacted tax rates in effect for the years in which those tax assets are expected to be realized. A valuation allowance is established when it is more likely than not that the future realization of all or some of the deferred tax assets will not be achieved.
Critical Accounting Policies and Estimates
The preparation of the consolidated financial statements requires us to make assumptions, estimates and judgments that affect the reported amounts of assets and liabilities, the disclosures of contingent assets and liabilities as of the date of the consolidated financial statements, and the reported amounts of sales and expenses during the reporting periods. Certain of our more critical accounting policies require the application
52
of significant judgment by management in selecting the appropriate assumptions for calculating financial estimates. By their nature, these judgments are subject to an inherent degree of uncertainty. On an ongoing basis, we evaluate our judgments, including but not limited to those related to inventories, recoverability of long-lived assets and the fair value of our common stock. We use historical experience and other assumptions as the basis for our judgments and making these estimates. Because future events and their effects cannot be determined with precision, actual results could differ significantly from these estimates. Any changes in those estimates will be reflected in our consolidated financial statements as they occur. While our significant accounting policies are more fully described in
“Part II; Item 8. Financial Statements and Supplementary Data; Notes to Consolidated Financial Statements; Note 1. Background and Summary of Significant Accounting Policies”
below in this Annual Report, we believe that the following accounting policies and estimates are most critical to a full understanding and evaluation of our reported financial results. The critical accounting policies addressed below reflect our most significant judgments and estimates used in the preparation of our consolidated financial statements. We have reviewed these critical accounting policies with the audit committee of our Board.
Revenue Recognition
. We recognize revenue when persuasive evidence of an arrangement exists, product delivery has occurred, pricing is fixed or determinable, and collection is reasonably assured. We generate a significant portion of our revenue from consigned inventory maintained at hospitals or with sales representatives. For these products, we recognize revenue at the time we are notified the product has been used or implanted. For all other transactions, we recognize revenue when title to the goods and risk of loss transfer to customers, provided there are no remaining performance obligations that will affect the customer’s final acceptance of the sale. Our policy is to classify shipping and handling costs billed to customers as sales and the related expenses as cost of goods sold. In general, our customers do not have any rights of return or exchange.
Accounts Receivable and Allowance for Doubtful Accounts.
The majority of our accounts receivable is composed of amounts due from hospitals. Accounts receivable is carried at cost less an allowance for doubtful accounts. On a regular basis, we evaluate accounts receivable and estimate an allowance for doubtful accounts, as needed, based on various factors such as customers’ current credit conditions, length of time past due, and the general economy as a whole. Receivables are written off against the allowance when they are deemed uncollectible.
Excess and Obsolete Inventory.
We state inventories at the lower of cost or market. We determine cost on a first-in, first-out basis. The majority of our inventory is finished goods, because we primarily utilize third-party suppliers to source our products. We periodically evaluate the carrying value of our inventories in relation to the estimated forecast of product demand, which takes into consideration the estimated life cycle of product releases. When quantities on hand exceed estimated sales forecasts, we record a write-down for excess inventories, which results in a corresponding charge to cost of goods sold. Charges incurred for excess and obsolete inventory were
$12.8 million
,
$9.9 million
and
$7.0 million
for the years ended
December 31, 2016
,
2015
and
2014
, respectively.
The need to maintain substantial levels of inventory impacts the risk of carrying excess inventory. Many of our products come in sets which feature components in a variety of sizes so that the implant or device may be customized to the patient’s needs. In order to market our products effectively, we must often maintain and provide surgeons and hospitals with consignment implant sets, back-up products and products of different sizes. For each surgery, fewer than all of the components of the set are used, and therefore certain portions of the set may be considered excess inventory since they are not likely to be used. One of our primary business goals is to focus on continual product innovation. Though we believe this provides us with a competitive advantage, it also increases the risk that our products will become excess or obsolete inventory prior to sale or prior to the end of their anticipated useful lives. When we introduce new products or next-
53
generation products, we may be required to take charges for excess and obsolete inventory that have a significant impact on the value of our inventory or on our operating results.
Goodwill and Intangible Assets.
Goodwill represents the excess purchase price over the fair values of the identifiable assets acquired less the liabilities assumed.
We acquired goodwill in connection with the various acquisitions completed. Goodwill is tested for impairment at a minimum on an annual basis. The fair value is estimated using an income and discounted cash flow approach. We performed our qualitative goodwill and indefinite-lived intangible assets impairment tests in the fourth quarter of
2016
and determined that there were no material impairments.
Intangible assets consist of purchased in-process research and development (“IPR&D”), patents, customer relationships, supplier networks and non-compete agreements. Intangible assets with finite useful lives are amortized over the period of estimated benefit using the straight-line method and estimated useful lives ranging from one to seventeen years. Intangible assets are tested for impairment annually or whenever events or circumstances indicate that a carrying amount of an asset (asset group) may not be recoverable. If impairment is indicated, we measure the amount of the impairment loss as the amount by which the carrying amount exceeds the fair value of the asset. Fair value is generally determined using a discounted future cash flow analysis.
IPR&D has an indefinite life and is not amortized until completion and development of the project at which time the IPR&D becomes an amortizable asset. If the related project is not completed in a timely manner, we may have an impairment related to the IPR&D, calculated as the excess of the asset’s carrying value over its fair value. During 2016, we recorded an impairment charge of
$3.5 million
as a component of acquistion related costs.
Long-Lived Assets
. We periodically evaluate the recoverability of the carrying amount of long-lived assets, which include property and equipment, whenever events or changes in circumstances indicate that the carrying amount of an asset may not be fully recoverable. We assess impairment when the undiscounted future cash flows from the use and eventual disposition of an asset are less than its carrying value. If impairment is indicated, we measure the amount of the impairment loss as the amount by which the carrying amount exceeds the fair value of the asset. We base our fair value methodology on quoted market prices, if available. If quoted market prices are not available, we estimate fair value based on prices of similar assets or other valuation techniques including present value techniques.
Income Taxes.
We recognize deferred tax assets and liabilities for the future tax consequences attributable to differences between the financial statement carrying amounts of existing assets and liabilities and their respective tax bases. We measure deferred tax assets and liabilities using enacted tax rates expected to apply to taxable income in the year in which such items are expected to be received or settled. We recognize the effect on deferred tax assets and liabilities of a change in tax rates in the period that includes the enactment date. We establish a valuation allowance to offset any deferred tax assets if, based upon available evidence, it is more likely than not that some or all of the deferred tax assets will not be realized.
While we believe that our tax positions are fully supportable, there is a risk that certain positions could be challenged successfully. In these instances, we look to establish reserves. If we determine that a tax position is more likely than not of being sustained upon audit, based solely on the technical merits of the position, we recognize the benefit. We measure the benefit by determining the amount that has likelihood greater than 50% of being realized upon settlement. We presume that all tax positions will be examined by a taxing authority with full knowledge of all relevant information. We regularly monitor our tax positions, tax assets and tax liabilities. We reevaluate the technical merits of our tax positions and recognize an uncertain tax benefit or reverse a previously recorded tax benefit when (i) a tax audit is completed, (ii) applicable tax
54
law, including a tax case or legislative guidance, changes or (iii) the statute of limitations expires. Significant judgment is required in accounting for tax reserves.
Legal Proceedings.
We are involved in a number of legal actions involving both product liability and intellectual property disputes. The outcomes of these legal actions are not within our complete control and may not be known for prolonged periods of time. In some actions, the claimants seek damages as well as other relief, including injunctions barring the sale of products that are the subject of the lawsuit, that could require significant expenditures or result in lost sales. In accordance with authoritative guidance, we record a liability in our consolidated financial statements for these actions when a loss is known or considered probable and the amount can be reasonably estimated. If the reasonable estimate of a known or probable loss is a range, and no amount within the range is a better estimate than any other, the minimum amount of the range is accrued. If a loss is reasonably possible, but not known or probable, and can be reasonably estimated, the estimated loss or range of loss is disclosed in the notes to the consolidated financial statements. In most cases, significant judgment is required to estimate the amount and timing of a loss to be recorded. While it is not possible to predict the outcome for these matters, we believe it is possible that costs associated with them could have a material adverse impact on our consolidated earnings, financial position or cash flows.
Stock-Based Compensation Expense.
We measure the cost for employee and non-employee awards at the grant date based on the fair value of the award. For employee awards, we amortize the expense, which is the fair value of the portion of the award that is ultimately expected to vest, over the requisite service periods (generally the vesting period of the equity award). We record the awards issued to non-employees at their fair value as determined in accordance with authoritative guidance, and we periodically revalue the awards as they vest, recognizing the expense over the requisite service period. We estimate the fair value of stock options using a Black-Scholes option-pricing model. Our determination of the fair value is affected by our stock price and a number of assumptions, including expected volatility, expected term, risk-free interest rate and expected dividends.
As we became a publicly traded entity in 2012, historic volatility for our common stock is insufficient to estimate expected volatility. As a result, we estimate volatility based on a consistently defined peer group of public companies that we believe collectively provides a reasonable basis for estimating volatility. We intend to continue to use the consistently defined group of publicly traded peer companies to determine volatility in the future until sufficient information regarding volatility of the price of our shares of Class A common stock becomes available or the selected companies are no longer suitable for this purpose.
We also do not have sufficient history of stock option exercises as a public company available that is indicative of future exercise and post-vesting behavior to estimate the expected term after our initial public offering (“IPO”). As a result, we use the simplified method of estimating the expected term, under which the expected term is presumed to be the mid-point between the vesting date and the contractual end of the term. We base the risk-free interest rate on observed interest rates of U.S. Treasury securities equivalent to the expected terms of the stock options. We estimate our pre-vesting forfeiture rate based on our historical experience. Our dividend yield assumption is based on the history and expectation of no dividend payouts.
We estimate the weighted-average fair value of the options granted using a Black-Scholes option-pricing model, which requires the input of subjective assumptions, including the expected stock price volatility, the calculation of expected term and fair value of the underlying common stock on the date of grant, among other inputs.
To the extent that further evidence regarding these variables is available and provides estimates that we believe are more indicative of actual trends, we may refine or change our approach to deriving these input
55
estimates. Any such changes could materially affect the stock-based compensation expense we record in the future.
We expect to continue to grant stock options in the future, and to the extent that we do, our actual stock-based compensation expense recognized may increase.
Results of Operations
Year Ended
December 31, 2016
Compared to the Year Ended
December 31, 2015
Sales
The following table sets forth, for the periods indicated, our sales by product category and geography expressed as dollar amounts and the changes in sales between the specified periods expressed in dollar amounts and as percentages:
|
Year Ended
|
Change
|
|||||||||||||
|
(In thousands, except percentages)
|
December 31,
2016 |
December 31,
2015 |
$
|
%
|
||||||||||
|
Innovative Fusion
|
$
|
287,594
|
|
$
|
288,062
|
|
$
|
(468
|
)
|
(0.2
|
)%
|
|||
|
Disruptive Technology
|
276,400
|
|
256,691
|
|
19,709
|
|
7.7
|
%
|
||||||
|
Total sales
|
$
|
563,994
|
|
$
|
544,753
|
|
$
|
19,241
|
|
3.5
|
%
|
|||
Product launches continue to be a driving force in our sales growth, particularly from products launched during the last three years. The growth in Disruptive Technology of
$19.7 million
was due primarily to sales of regenerative biologics, expandable interbody and minimally invasive products launched during the past three years, including sales from TTOT since the acquisition in late 2014. Innovative Fusion sales decreased by
$0.5 million
due to sales declines of pedicle screw systems, which were partially offset by increases from Alphatec International sales.
|
Year Ended
|
Change
|
|||||||||||||
|
(In thousands, except percentages)
|
December 31,
2016 |
December 31,
2015 |
$
|
%
|
||||||||||
|
United States
|
$
|
500,226
|
|
$
|
498,191
|
|
$
|
2,035
|
|
0.4
|
%
|
|||
|
International
|
63,768
|
|
46,562
|
|
17,206
|
|
37.0
|
%
|
||||||
|
Total sales
|
$
|
563,994
|
|
$
|
544,753
|
|
$
|
19,241
|
|
3.5
|
%
|
|||
In the United States, the increase in sales of
$2.0 million
was due primarily to expansion into new territories and increased penetration in existing territories. The region experienced strong sales in Disruptive Technology products, led by sales of expandable interbody products and regenerative biologics, which were partially offset by declines in Innovative Fusion products, primarily pedicle screw systems.
Internationally, the increase in sales of
$17.2 million
was primarily due to incremental sales from the Alphatec International acquisition. On a constant currency basis, our international sales grew
$18.8 million
, or by
40.4%
, due to expansion into new international territories. Our worldwide sales increased
3.8%
on a constant currency basis. For additional information regarding the Alphatec International acquisition, please refer to
“Part II; Item 8. Financial Statements and Supplementary Data; Notes to Consolidated Financial Statements; Note 2. Acquisitions”
and for additional information regarding constant currency, please refer to
“Non-GAAP Financial Measures”
below.
56
Cost of Goods Sold
|
Year Ended
|
Change
|
|||||||||||||
|
(In thousands, except percentages)
|
December 31,
2016 |
December 31,
2015 |
$
|
%
|
||||||||||
|
Cost of goods sold
|
$
|
134,705
|
|
$
|
132,333
|
|
$
|
2,372
|
|
1.8
|
%
|
|||
|
Percentage of sales
|
23.9
|
%
|
24.3
|
%
|
||||||||||
The
increase
in cost of goods sold was primarily due to increases from higher volumes, product mix, inventory write offs and increases in depreciation and other operational costs. Included in these increases was a prior period adjustment of
$1.8 million
. Partially offsetting these increases was
$9.0 million
in savings related to the two year moratorium on the medical device excise tax (“MDET”), which began January 1, 2016. Savings of
$5.0 million
were realized in the year from the impact of lower manufacturing costs from Branch Medical Group (“BMG”) as well as a
$3.4 million
decrease in freight costs.
For additional information regarding the prior period adjustment, please refer to
“Part II; Item 8. Financial Statements and Supplementary Data; Notes to Consolidated Financial Statements; Note 1. Background and Summary of Significant Accounting Policies; (b) Basis of Presentation.”
Research and Development Expenses
|
Year Ended
|
Change
|
|||||||||||||
|
(In thousands, except percentages)
|
December 31,
2016 |
December 31,
2015 |
$
|
%
|
||||||||||
|
Research and development
|
$
|
44,532
|
|
$
|
36,312
|
|
$
|
8,220
|
|
22.6
|
%
|
|||
|
Percentage of sales
|
7.9
|
%
|
6.7
|
%
|
||||||||||
The
increase
in research and development expenses was due primarily to
$4.0 million
of one-time licensing costs, increases in employee-related expenses of
$3.4 million
from additional headcount related to continued investment in robotics and orthopedic trauma groups,and increases in supplies and other research costs of
$0.8 million
.
Selling, General and Administrative Expenses
|
Year Ended
|
Change
|
|||||||||||||
|
(In thousands, except percentages)
|
December 31,
2016 |
December 31,
2015 |
$
|
%
|
||||||||||
|
Selling, general and administrative
|
$
|
222,156
|
|
$
|
210,241
|
|
$
|
11,915
|
|
5.7
|
%
|
|||
|
Percentage of sales
|
39.4
|
%
|
38.6
|
%
|
||||||||||
The
increase
in selling, general and administrative expenses was due primarily to an increase of
$5.8 million
of costs to support sales volume and company growth, including the Alphatec International acquisition, and increases of
$3.3 million
in depreciation expense and
$2.8 million
in other general and administrative expenses.
57
Provision for Litigation
|
Year Ended
|
Change
|
|||||||||||||
|
(In thousands, except percentages)
|
December 31,
2016 |
December 31,
2015 |
$
|
%
|
||||||||||
|
Provision for litigation
|
$
|
3,156
|
|
$
|
(11,268
|
)
|
$
|
14,424
|
|
(128.0
|
)%
|
|||
|
Percentage of sales
|
0.6
|
%
|
(2.1
|
)%
|
||||||||||
The current year provision for litigation, which includes settlement and verdict costs, was due primarily to the settlements of the Bonutti and other litigation matters. In the prior year period, we recognized a benefit due to the recognition of the Depuy Synthes Settlement Agreement.
For additional information regarding litigation, please refer to
“Part II; Item 8. Financial Statements and Supplementary Data; Notes to Consolidated Financial Statements; Note 15. Commitments and Contingencies.”
Amortization of Intangibles
|
Year Ended
|
Change
|
|||||||||||||
|
(In thousands, except percentages)
|
December 31,
2016 |
December 31,
2015 |
$
|
%
|
||||||||||
|
Amortization of intangibles
|
$
|
3,478
|
|
$
|
1,561
|
|
$
|
1,917
|
|
122.8
|
%
|
|||
|
Percentage of sales
|
0.6
|
%
|
0.3
|
%
|
||||||||||
The increase in the amortization of intangibles is primarily due to the customer relationship intangibles acquired in connection with the Alphatec International acquisition.
Acquisition Related Costs
|
Year Ended
|
Change
|
|||||||||||||
|
(In thousands, except percentages)
|
December 31,
2016 |
December 31,
2015 |
$
|
%
|
||||||||||
|
Acquisition related costs
|
$
|
1,826
|
|
$
|
3,352
|
|
$
|
(1,526
|
)
|
(45.5
|
)%
|
|||
|
Percentage of sales
|
0.3
|
%
|
0.6
|
%
|
||||||||||
The decrease in acquisition related costs is due primarily to
$5.0 million
related to non-cash settlements of certain business acquisition liabilities during 2016, which were offset partially by a
$3.5 million
impairment of one of our IPR&D projects.
Other Income, Net
|
Year Ended
|
Change
|
|||||||||||||
|
(In thousands, except percentages)
|
December 31,
2016 |
December 31,
2015 |
$
|
%
|
||||||||||
|
Other income, net
|
$
|
3,138
|
|
$
|
583
|
|
$
|
2,555
|
|
438.3
|
%
|
|||
|
Percentage of sales
|
0.6
|
%
|
0.1
|
%
|
||||||||||
The increase in other income, net is due primarily to increases in interest income from increased average investment balances and the note receivable with Alphatec Spine Inc., coupled with decreases in foreign exchange transaction losses. For additional information regarding the note receivable with Alphatec Spine Inc., please refer to
“Part II; Item 8. Financial Statements and Supplementary Data; Notes to Consolidated Financial Statements; Note 3. Note Receivable.”
58
Income Tax Provision
|
Year Ended
|
Change
|
|||||||||||||
|
(In thousands, except percentages)
|
December 31,
2016 |
December 31,
2015 |
$
|
%
|
||||||||||
|
Income tax provision
|
$
|
52,938
|
|
$
|
60,021
|
|
$
|
(7,083
|
)
|
(11.8
|
)%
|
|||
|
Effective income tax rate
|
33.7
|
%
|
34.7
|
%
|
||||||||||
Our tax provision and effective tax rate for the year ended December 31, 2016 was lower than the prior year due primarily to ongoing benefits related to the reorganization of our domestic legal structure to better align our business operations. These benefits were partially offset by a one-time impact to deferred tax assets as it relates to the domestic reorganization.
Year Ended
December 31, 2015
Compared to the Year Ended
December 31, 2014
Sales
The following table sets forth, for the periods indicated, our sales by product category and geography expressed as dollar amounts and the changes in sales between the specified periods expressed in dollar amounts and as percentages:
|
Year Ended
|
Change
|
|||||||||||||
|
(In thousands, except percentages)
|
December 31,
2015 |
December 31, 2014
|
$
|
%
|
||||||||||
|
Innovative Fusion
|
$
|
288,062
|
|
$
|
270,852
|
|
$
|
17,210
|
|
6.4
|
%
|
|||
|
Disruptive Technology
|
256,691
|
|
203,519
|
|
53,172
|
|
26.1
|
%
|
||||||
|
Total sales
|
$
|
544,753
|
|
$
|
474,371
|
|
$
|
70,382
|
|
14.8
|
%
|
|||
Product launches continue to be a driving force in our sales growth, particularly from products launched during the last three years. The growth in Disruptive Technology of
$53.2 million
was due primarily to sales of regenerative biologics, expandable interbody and minimally invasive products launched during the past three years, including sales from TTOT since the acquisition in late 2014. Innovative Fusion sales increased by
$17.2 million
due to strong sales of pedicle screw systems.
|
Year Ended
|
Change
|
|||||||||||||
|
(In thousands, except percentages)
|
December 31,
2015 |
December 31, 2014
|
$
|
%
|
||||||||||
|
United States
|
$
|
498,191
|
|
$
|
427,091
|
|
$
|
71,100
|
|
16.6
|
%
|
|||
|
International
|
46,562
|
|
47,280
|
|
(718
|
)
|
(1.5
|
)%
|
||||||
|
Total sales
|
$
|
544,753
|
|
$
|
474,371
|
|
$
|
70,382
|
|
14.8
|
%
|
|||
In the United States, the increase in sales of
$71.1 million
was due primarily to expansion into new territories and increased penetration in existing territories. We saw strong sales in both Disruptive Technology and Innovative Fusion products, led by sales of expandable interbody products, regenerative biologics and pedicle screw systems.
Internationally, the decrease in sales of
$0.7 million
was due primarily to changes in foreign currency exchange rates. On a constant currency basis, our international sales grew
$4.8 million
, or by
10.2%
, due to increased penetration in existing international territories and strong sales in our regenerative biologics and expandable interbody products. Our worldwide sales increased
16.0%
on a constant currency basis. For
59
additional information regarding constant currency, please refer to
“Non-GAAP Financial Measures”
below.
Cost of Goods Sold
|
Year Ended
|
Change
|
|||||||||||||
|
(In thousands, except percentages)
|
December 31,
2015 |
December 31, 2014
|
$
|
%
|
||||||||||
|
Cost of goods sold
|
$
|
132,333
|
|
$
|
110,769
|
|
$
|
21,564
|
|
19.5
|
%
|
|||
|
Percentage of sales
|
24.3
|
%
|
23.4
|
%
|
||||||||||
The increase in cost of goods sold was due primarily to and increase of
$20.1 million
from increased sales volume, including impacts from pricing pressure, TTOT and foreign currency, and an increase of
$1.4 million
for inventory reserves and write-offs.
Research and Development Expenses
|
Year Ended
|
Change
|
|||||||||||||
|
(In thousands, except percentages)
|
December 31,
2015 |
December 31,
2014 |
$
|
%
|
||||||||||
|
Research and development
|
$
|
36,312
|
|
$
|
31,166
|
|
$
|
5,146
|
|
16.5
|
%
|
|||
|
Percentage of sales
|
6.7
|
%
|
6.6
|
%
|
||||||||||
The increase in research and development expenses was due primarily to an increase of
$3.7 million
in employee compensation from additional headcount for furthering research activities and developing new innovative products, an increase of
$1.5 million
in supplies and other costs, and an increase of
$1.3 million
related to our robotics initiative, offset by a decrease of
$1.3 million
of clinical trial and other consulting costs.
Selling, General and Administrative Expenses
|
Year Ended
|
Change
|
|||||||||||||
|
(In thousands, except percentages)
|
December 31,
2015 |
December 31, 2014
|
$
|
%
|
||||||||||
|
Selling, general and administrative
|
$
|
210,241
|
|
$
|
188,632
|
|
$
|
21,609
|
|
11.5
|
%
|
|||
|
Percentage of sales
|
38.6
|
%
|
39.8
|
%
|
||||||||||
The increase in selling, general and administrative expenses was due primarily to an increase of
$19.3 million
of costs to support sales volume and company growth, including TTOT and BMG, and an increase of
$2.1 million
in legal expenses, bad debt expense and other selling, general and administrative costs.
Provision for Litigation
|
Year Ended
|
Change
|
|||||||||||||
|
(In thousands, except percentages)
|
December 31,
2015 |
December 31, 2014
|
$
|
%
|
||||||||||
|
Provision for litigation
|
$
|
(11,268
|
)
|
$
|
5,667
|
|
$
|
(16,935
|
)
|
(298.8
|
)%
|
|||
|
Percentage of sales
|
(2.1
|
)%
|
1.2
|
%
|
||||||||||
60
The provision for litigation for the year ended December 31, 2015, which includes settlement and verdict costs, was due primarily to the recognition of the Depuy Synthes Settlement Agreement. In the year ended December 31, 2014, we recognized provisions for the Bianco verdict and other litigation matters.
For additional information regarding litigation, please refer to
“Item 8. Financial Statements and Supplementary Data; Notes to Consolidated Financial Statements; Note 15. Commitments and Contingencies.”
Amortization of Intangibles
|
Year Ended
|
Change
|
|||||||||||||
|
(In thousands, except percentages)
|
December 31,
2015 |
December 31,
2014 |
$
|
%
|
||||||||||
|
Amortization of intangibles
|
$
|
1,561
|
|
$
|
712
|
|
$
|
849
|
|
119.2
|
%
|
|||
|
Percentage of sales
|
0.3
|
%
|
0.2
|
%
|
||||||||||
The increase in the amortization of intangibles is due primarily to the full year of amortization of the supplier network and customer relationships acquired as part of the TTOT acquisition.
Acquisition Related Costs
|
Year Ended
|
Change
|
|||||||||||||
|
(In thousands, except percentages)
|
December 31,
2015 |
December 31,
2014 |
$
|
%
|
||||||||||
|
Acquisition related costs
|
$
|
3,352
|
|
$
|
(937
|
)
|
$
|
4,289
|
|
(457.7
|
)%
|
|||
|
Percentage of sales
|
0.6
|
%
|
(0.2
|
)%
|
||||||||||
The increase in acquisition related costs is due primarily to the achievement of a portion of the TTOT contingent consideration and the increase in the probability of achievement of the Excelsius milestone contingent consideration for the year ended December 31, 2015, while the resulting credit for the year ended December 31, 2014 was due primarily to the reductions to a contingent royalty accrual, offset partially by increases in other royalty and milestone accruals.
Other Income, Net
|
Year Ended
|
Change
|
|||||||||||||
|
(In thousands, except percentages)
|
December 31,
2015 |
December 31, 2014
|
$
|
%
|
||||||||||
|
Other income, net
|
$
|
583
|
|
$
|
280
|
|
$
|
303
|
|
108.2
|
%
|
|||
|
Percentage of sales
|
0.1
|
%
|
0.1
|
%
|
||||||||||
The increase in other income, net is due primarily to increases in interest income from increased average investment balances, partially offset by increases in foreign exchange transaction losses.
Income Tax Provision
|
Year Ended
|
Change
|
|||||||||||||
|
(In thousands, except percentages)
|
December 31,
2015 |
December 31, 2014
|
$
|
%
|
||||||||||
|
Income tax provision
|
$
|
60,021
|
|
$
|
46,157
|
|
$
|
13,864
|
|
30.0
|
%
|
|||
|
Effective income tax rate
|
34.7
|
%
|
33.3
|
%
|
||||||||||
61
Our tax provision and effective tax rate for the year ended December 31, 2015 was higher than the prior year due primarily to the 2014 reduction in uncertain tax positions related to Internal Revenue Service audits of our 2011 and 2012 tax years, resulting in no adjustments.
Non-GAAP Financial Measures
To supplement our financial statements prepared in accordance with U.S. generally accepted accounting principles (“U.S. GAAP”), management uses certain non-GAAP financial measures. For example, non-GAAP Adjusted EBITDA, which represents net income before interest income, net and other non-operating expenses, provision for income taxes, depreciation and amortization, stock-based compensation expense, provision for litigation, acquisition related costs/licensing and prior period adjustment excluding depreciation, is useful as an additional measure of operating performance, and particularly as a measure of comparative operating performance from period to period, as it is reflective of changes in pricing decisions, cost controls and other factors that affect operating performance, and it removes the effect of our capital structure, asset base, income taxes and interest income and expense. Our management also uses non-GAAP Adjusted EBITDA for planning purposes, including the preparation of our annual operating budget and financial projections. Provision for litigation represents costs incurred for litigation settlements or unfavorable verdicts when the loss is known or considered probable and the amount can be reasonably estimated, or in the case of a favorable settlement, when income is realized. Acquisition related costs/licensing represents the change in fair value of business-acquisition-related contingent consideration; costs related to integrating recently acquired businesses, including but not limited to costs to exit or convert contractual obligations, severance, and information system conversion; and specific costs related to the consummation of the acquisition process such as banker fees, legal fees, and other acquisition related professional fees, as well as one-time licensing fees. Prior period adjustment excluding depreciation represents the cumulative impact of prior year adjustments primarily related to a decrease in scrap adjustments of instruments and cases, none of which were individually material to the related year’s financial position or results of operations.
For additional information regarding the prior period adjustment, please refer to
“Part II; Item 8. Financial Statements and Supplementary Data; Notes to Consolidated Financial Statements; Note 1. Background and Summary of Significant Accounting Policies; (b) Basis of Presentation.”
62
The following is a reconciliation of net income to Adjusted EBITDA for the periods presented:
|
Year Ended
|
|||||||||||||
|
(In thousands, except percentages)
|
December 31,
2016 |
December 31,
2015 |
December 31,
2014 |
||||||||||
|
Net income
|
$
|
104,341
|
|
$
|
112,784
|
|
$
|
92,485
|
|
||||
|
Interest income, net
|
(3,057
|
)
|
(1,304
|
)
|
(805
|
)
|
|||||||
|
Provision for income taxes
|
52,938
|
|
60,021
|
|
46,157
|
|
|||||||
|
Depreciation and amortization
|
38,771
|
|
*
|
24,084
|
|
21,754
|
|
||||||
|
EBITDA
|
192,993
|
|
195,585
|
|
159,591
|
|
|||||||
|
Stock-based compensation expense
|
11,382
|
|
9,639
|
|
7,111
|
|
|||||||
|
Provision for litigation
|
3,156
|
|
(11,268
|
)
|
5,667
|
|
|||||||
|
Acquisition related costs/licensing
|
6,931
|
|
3,577
|
|
(937
|
)
|
|||||||
|
Prior period adjustment, excluding depreciation
|
(3,697
|
)
|
—
|
|
—
|
|
|||||||
|
Adjusted EBITDA
|
$
|
210,765
|
|
$
|
197,533
|
|
$
|
171,432
|
|
||||
|
Net income as a percentage of sales
|
18.5
|
%
|
20.7
|
%
|
19.5
|
%
|
|||||||
|
Adjusted EBITDA as a percentage of sales
|
37.4
|
%
|
36.3
|
%
|
36.1
|
%
|
|||||||
______________
|
*
|
Included in this amount for the year ended
December 31, 2016
is
$5.5 million
related to depreciation amounts recognized in the current year related to the prior period adjustment.
|
In addition, for the year ended
December 31, 2016
and for other comparative periods, we are presenting non-GAAP net income and non-GAAP Diluted Earnings Per Share, which represents net income and diluted earnings per share excluding the provision for litigation, amortization of intangibles, acquisition related costs/licensing, prior period adjustment and the tax effects of all of the foregoing adjustments. We believe these non-GAAP measures are also useful indicators of our operating performance, and particularly as additional measures of comparative operating performance from period to period as they remove the effects of litigation, amortization of intangibles, acquisition related costs/licensing, and the tax effects of all of the foregoing adjustments, which we believe are not reflective of underlying business trends.
The following is a reconciliation of net income computed in accordance with U.S. GAAP to non-GAAP net income for the periods presented.
|
Year Ended
|
||||||||||||
|
(In thousands)
|
December 31,
2016 |
December 31,
2015 |
December 31,
2014 |
|||||||||
|
Net income
|
$
|
104,341
|
|
$
|
112,784
|
|
$
|
92,485
|
|
|||
|
Provision for litigation
|
3,156
|
|
(11,268
|
)
|
5,667
|
|
||||||
|
Amortization of intangibles
|
3,478
|
|
1,561
|
|
712
|
|
||||||
|
Acquisition related costs/licensing
|
6,931
|
|
3,577
|
|
(937
|
)
|
||||||
|
Prior period adjustment
|
1,765
|
|
—
|
|
—
|
|
||||||
|
Tax effect of adjusting items
|
(5,166
|
)
|
2,127
|
|
(1,812
|
)
|
||||||
|
Non-GAAP net income
|
$
|
114,505
|
|
$
|
108,781
|
|
$
|
96,115
|
|
|||
63
The following is a reconciliation of Diluted Earnings Per Share as computed in accordance with U.S. GAAP to non-GAAP Diluted Earnings Per Share for the periods presented.
|
Year Ended
|
||||||||||||
|
(Per share amounts)
|
December 31,
2016 |
December 31,
2015 |
December 31,
2014 |
|||||||||
|
Diluted earnings per share, as reported
|
$
|
1.08
|
|
$
|
1.17
|
|
$
|
0.97
|
|
|||
|
Provision for litigation
|
0.03
|
|
(0.12
|
)
|
0.06
|
|
||||||
|
Amortization of intangibles
|
0.04
|
|
0.02
|
|
0.01
|
|
||||||
|
Acquisition related costs/licensing
|
0.07
|
|
0.04
|
|
(0.01
|
)
|
||||||
|
Prior period adjustment
|
0.02
|
|
—
|
|
—
|
|
||||||
|
Tax effect of adjusting items
|
(0.05
|
)
|
0.02
|
|
(0.02
|
)
|
||||||
|
Non-GAAP diluted earnings per share
|
$
|
1.19
|
|
$
|
1.13
|
|
$
|
1.01
|
|
|||
We also define the non-GAAP measure of Free Cash Flow as the net cash provided by operating activities, adjusted for the impact of restricted cash, less the cash impact of purchases of property and equipment. We believe that this financial measure provides meaningful information for evaluating our overall financial performance for comparative periods as it facilitates an assessment of funds available to satisfy current and future obligations and fund acquisitions.
Below is a reconciliation of net cash provided by operating activities as computed in accordance with U.S. GAAP to Free Cash Flow for the periods presented.
|
Year Ended
|
||||||||||||
|
(Per share amounts)
|
December 31,
2016 |
December 31,
2015 |
December 31,
2014 |
|||||||||
|
Net cash provided by operating activities
|
$
|
171,893
|
|
$
|
121,957
|
|
$
|
79,172
|
|
|||
|
Adjustment for impact of restricted cash
|
(25,641
|
)
|
2,749
|
|
23,370
|
|
||||||
|
Purchases of property and equipment
|
(40,909
|
)
|
(50,760
|
)
|
(24,754
|
)
|
||||||
|
Free cash flow
|
$
|
105,343
|
|
$
|
73,946
|
|
$
|
77,788
|
|
|||
The adjustment for the impact of restricted cash is primarily related to the DePuy Synthes settlement on January 13, 2016, where we paid $7.9 million and recovered approximately $8.4 million previously set aside for the DePuy Synthes litigation obligation.
Furthermore, the non-GAAP measure of constant currency sales growth is calculated by translating current year sales at the same average exchange rates in effect during the applicable prior year period. We believe constant currency sales growth provides insight to the comparative increase or decrease in period sales, in dollar and percentage terms, excluding the effects of fluctuations in foreign currency exchange rates.
Below is a reconciliation of sales growth as reported in accordance with U.S. GAAP compared to constant currency sales growth for the periods presented.
|
Year Ended
|
Reported Sales Growth
|
Currency Impact on 2016 Sales
|
Constant Currency Sales Growth
|
||||||||||||||
|
(In thousands, except percentages)
|
December 31,
2016 |
December 31,
2015 |
|||||||||||||||
|
United States
|
$
|
500,226
|
|
$
|
498,191
|
|
0.4
|
%
|
—
|
|
0.4
|
%
|
|||||
|
International
|
63,768
|
|
46,562
|
|
37.0
|
%
|
$
|
(1,594
|
)
|
40.4
|
%
|
||||||
|
Total sales
|
$
|
563,994
|
|
$
|
544,753
|
|
3.5
|
%
|
$
|
(1,594
|
)
|
3.8
|
%
|
||||
64
|
Year Ended
|
Reported Sales Growth
|
Currency Impact on 2015 Sales
|
Constant Currency Sales Growth
|
||||||||||||||
|
(In thousands, except percentages)
|
December 31,
2015 |
December 31,
2014 |
|||||||||||||||
|
United States
|
$
|
498,191
|
|
$
|
427,091
|
|
16.6
|
%
|
—
|
|
16.6
|
%
|
|||||
|
International
|
46,562
|
|
47,280
|
|
(1.5
|
%)
|
$
|
(5,544
|
)
|
10.2
|
%
|
||||||
|
Total sales
|
$
|
544,753
|
|
$
|
474,371
|
|
14.8
|
%
|
$
|
(5,544
|
)
|
16.0
|
%
|
||||
Non-GAAP Adjusted EBITDA, non-GAAP net income, non-GAAP Diluted Earnings Per Share, Free Cash Flow and constant currency sales growth are not calculated in conformity with U.S. GAAP within the meaning of Item 10(e) of Regulation S-K. Non-GAAP financial measures have limitations as analytical tools and should not be considered in isolation or as a substitute for financial measures prepared in accordance with U.S. GAAP. These measures do not include certain expenses that may be necessary to evaluate our liquidity or operating results. Our definitions of non-GAAP Adjusted EBITDA, non-GAAP net income, non-GAAP Diluted Earnings Per Share, Free Cash Flow and constant currency sales growth may differ from that of other companies and therefore may not be comparable. Additionally, we have recast prior periods for non-GAAP net income and non-GAAP Diluted Earnings Per Share to conform with current period presentation.
Cash Flows
The following table summarizes, for the periods indicated, cash flows from operating, investing and financing activities:
|
Year Ended
|
2016 - 2015 Change
|
2015 - 2014 Change
|
|||||||||||||||||
|
(In thousands)
|
December 31, 2016
|
December 31, 2015
|
December 31, 2014
|
$
|
$
|
||||||||||||||
|
Net cash provided by operating activities
|
$
|
171,893
|
|
$
|
121,957
|
|
$
|
79,172
|
|
$
|
49,936
|
|
$
|
42,785
|
|
||||
|
Net cash used in investing activities
|
(99,553
|
)
|
(150,550
|
)
|
(100,000
|
)
|
50,997
|
|
(50,550
|
)
|
|||||||||
|
Net cash provided by financing activities
|
2,041
|
|
6,327
|
|
12,946
|
|
(4,286
|
)
|
(6,619
|
)
|
|||||||||
|
Effect of foreign exchange rate changes on cash
|
(1,894
|
)
|
153
|
|
185
|
|
(2,047
|
)
|
(32
|
)
|
|||||||||
|
Increase/(decrease) in cash and cash equivalents
|
$
|
72,487
|
|
$
|
(22,113
|
)
|
$
|
(7,697
|
)
|
$
|
94,600
|
|
$
|
(14,416
|
)
|
||||
Our cash, cash equivalents and marketable securities at
December 31, 2016
and
2015
were
$350.8 million
and
$329.8 million
, respectively. We assess our liquidity in terms of our ability to generate cash to fund our operating, investing and financing activities, whereby our principal source of liquidity is operating cash flows. Excess operating cash is primarily used to fund acquisitions to advance the strategic growth of the Company, as well as continue our cash management program to generate returns on our cash and cash equivalents through investing in marketable securities, which include municipal bonds, corporate debt securities, commercial paper, securities of U.S. government-sponsored agencies and asset-backed securities. Our overall cash position reflects our strong business results and a cash management strategy that takes into account liquidity, economic factors and tax considerations . We believe our future operating cash flows will be sufficient to meet our future operating cash needs. See
“Liquidity and Capital Resources”
below for further discussion of cash flow results.
Cash Provided by Operating Activities
The increase in net cash provided by operating activities for the year ended
December 31, 2016
was due primarily to the recovery of the restricted cash related to the DePuy Synthes settlement, coupled with lower working capital and lower year-over-year income tax payments.
The increase in net cash provided by operating activities for the year ended December 31, 2015 was due primarily to the increase in net income and the decrease in the change for restricted cash, which were partially offset by the net decrease in the change in accounts payable and accounts payable to related parties and the increase in tax payments.
Cash Used in Investing Activities
The decrease in net cash used in investing activities for the year ended
December 31, 2016
was due primarily to lower investment in marketable securities and decreased purchases of property and equipment, partially offset by the issuance of a note receivable, and an increase in cash used for the acquisition of businesses.
The increase in net cash used in investing activities for the year ended December 31, 2015 was due primarily to the additional acquisitions of property and equipment to support our continued investment in regenerative biologics, robotics and in-house manufacturing, the increase in the amount of cash invested in marketable securities and the increase in cash used for acquisitions.
65
Cash Provided by Financing Activities
The increase in cash provided by financing activities for the year ended
December 31, 2016
was due primarily to to higher payments of business acquisition liabilities.
The decrease in cash provided by financing activities for the year ended December 31, 2015 was due primarily to the decrease in cash received from the issuance of common stock from the exercise of stock options along with the decrease in our excess tax benefit related to our nonqualified stock option exercises. During the year ended December 31, 2015, we experienced a decrease in the number of shares exercised, offset partially by increases in the exercise price and intrinsic value per share exercised.
Liquidity and Capital Resources
The following table highlights certain information related to our liquidity and capital resources:
|
(In thousands)
|
December 31, 2016
|
December 31,
2015 |
|||||
|
Cash and cash equivalents
|
$
|
132,639
|
|
$
|
60,152
|
|
|
|
Short-term marketable securities
|
157,673
|
|
220,877
|
|
|||
|
Long-term marketable securities
|
60,444
|
|
48,762
|
|
|||
|
Total cash, cash equivalents and marketable securities
|
$
|
350,756
|
|
$
|
329,791
|
|
|
|
Available borrowing capacity under revolving credit facility
|
50,000
|
|
50,000
|
|
|||
|
Working capital
|
$
|
433,874
|
|
$
|
462,108
|
|
|
During the year ended
December 31, 2016
, our total cash, cash equivalents and marketable securities increased
$21.0 million
, primarily as a result of our cash provided by operating activities. Our investment in marketable securities includes municipal bonds, corporate debt securities, commercial paper, securities of U.S. government-sponsored agencies and asset-backed securities, and are classified as available-for-sale as of
December 31, 2016
.
On September 1, 2016, we acquired the international operations and distribution channel of Alphatec Holdings, Inc., a publicly traded orthopedic company (Nasdaq: ATEC) for
$80.1 million
in cash, subject to certain closing adjustments (see
“Part II; Item 8. Financial Statements and Supplementary Data; Notes to Consolidated Financial Statements; Note 2. Acquisitions.”
)
In
May 2011
, we entered into a credit agreement with Wells Fargo Bank related to a revolving credit facility that provides for borrowings up to
$50.0 million
. At our request, and with the approval of the bank, the amount of borrowings available under the revolving credit facility can be increased to
$75.0 million
. The revolving credit facility includes up to a
$25.0 million
sub-limit for letters of credit. As amended to date, the revolving credit facility extends to
May 2017
. Cash advances bear interest at our option either at a fluctuating rate per annum equal to the daily
LIBOR
in effect for a
one
-month period plus
0.75%
or a fixed rate for a
one
- or
three
-month period equal to
LIBOR
plus
0.75%
. The credit agreement governing the revolving credit facility also subjects us to various restrictive covenants, including the requirement to maintain maximum consolidated leverage. The covenants also include limitations on our ability to repurchase shares, to pay cash dividends or to enter into a sale transaction. As of
December 31, 2016
, we were in compliance with all financial covenants under the credit agreement, there were no outstanding borrowings under the revolving credit facility and available borrowings were
$50.0 million
. We may terminate the credit agreement at any time on ten days’ notice without premium or penalty.
66
In addition to our existing cash and marketable securities balances, our principal sources of liquidity are cash flow from operating activities and our revolving credit facility, which was fully available as of
December 31, 2016
. We believe these sources will provide sufficient liquidity for us to meet our liquidity requirements for the foreseeable future. Our principal liquidity requirements are to meet our working capital, research and development, including clinical trials, and capital expenditure needs, principally for our surgical sets required to maintain and expand our business and potential future business or intellectual property acquisitions. We expect to continue to make investments in surgical sets as we launch new products, increase the size of our U.S. sales force, and expand into international markets. We may, however, require additional liquidity as we continue to execute our business strategy. Our liquidity may be negatively impacted as a result of a decline in sales of our products, including declines due to changes in our customers’ ability to obtain third-party coverage and reimbursement for procedures that use our products, increased pricing pressures resulting from intensifying competition, cost increases and slower product development cycles resulting from a changing regulatory environment; and unfavorable results from litigation which will affect our cash flow. We anticipate that to the extent that we require additional liquidity, it will be funded through the incurrence of other indebtedness, additional equity financings or a combination of these potential sources of liquidity. The sale of additional equity may result in dilution to our stockholders. There is no assurance that we will be able to secure such additional funding on terms acceptable to us, or at all.
Contractual Obligations and Commitments
The following table summarizes our outstanding contractual obligations as of
December 31, 2016
. There have been no material changes in our remaining contractual obligations since that time.
|
Payments Due by Period
|
||||||||||||||||||||
|
(In thousands)
|
Total
|
Less than 1 Year
|
1-3 Years
|
3-5 Years
|
More than 5 Years
|
|||||||||||||||
|
Operating leases
|
$
|
3,396
|
|
$
|
1,412
|
|
$
|
1,903
|
|
$
|
81
|
|
$
|
—
|
|
|||||
|
Purchase obligations
(1)
|
14,234
|
|
4,078
|
|
2,556
|
|
2,400
|
|
5,200
|
|
||||||||||
|
Total
(2)
|
$
|
17,630
|
|
$
|
5,490
|
|
$
|
4,459
|
|
$
|
2,481
|
|
$
|
5,200
|
|
|||||
______________
|
(1)
|
Reflects minimum annual volume commitments to purchase inventory under certain of our supplier contracts as well as costs related to service agreements.
|
|
(2)
|
In connection with certain acquisitions completed in 2011 through 2014, we have certain contingent consideration obligations payable to the sellers in these transactions upon the achievement of certain regulatory and sales milestones. The maximum aggregate undiscounted amounts potentially payable not included in the table above total
$29.1 million
.
|
Off-Balance Sheet Arrangements
We do not have any off-balance sheet arrangements.
Related-Party Transactions
Prior to
March 11, 2015
, and as previously disclosed in our definitive proxy statement, BMG had been a related-party supplier since 2005. As of February 24, 2015, David C. Paul's wife, David D. Davidar's wife, and David M. Demski collectively owned approximately
49%
of the outstanding stock of BMG. In addition, since February 2010, Mr. Paul's wife and Mr. Davidar's wife had served as directors of BMG. Prior to the acquisition, we purchased products and services from BMG pursuant to a standard Supplier Quality Agreement entered into in September 2010.
67
On
March 11, 2015
, we acquired BMG, and therefore, as of the acquisition date, there were no further purchases from nor amounts due to BMG. The amount payable to BMG on the date of acquisition of
$5.2 million
was settled in connection with the acquisition.
For further description of our related-party transactions, see
“Part II; Item 8. Financial Statements and Supplementary Data; Notes to Consolidated Financial Statements; Note 17. Related-Party Transactions”
and
“Part III; Item 13. Certain Relationships and Related Transactions, and Director Independence; Related Person Transactions.”
Recently Issued Accounting Pronouncements
For further details on recently issued accounting pronouncements, please refer to
“Part II; Item 8. Financial Statements and Supplementary Data; Notes to Consolidated Financial Statements; Note 1. Background and Summary of Significant Accounting Policies; (x) Recently Issued Accounting Pronouncements.”
Market risk is the potential loss arising from adverse changes in the financial markets. We are exposed to various market risks, which may result in potential losses arising from adverse changes in market rates, such as interest rates and foreign exchange rates. We do not enter into derivatives or other financial instruments for trading or speculative purposes and do not believe we are exposed to material market risk with respect to our cash, cash equivalents and marketable debt securities. Except for the foreign exchange risk described below, we believe that there has been no material quantitative changes in our market risk exposure between
December 31, 2016
and
December 31, 2015
.
Interest Rate Risk
Our exposure to interest rate risk relates primarily to our revolving credit facility and our investments in cash equivalents and marketable debt securities portfolio. At
December 31, 2016
, we had no debt outstanding under our revolving credit facility and therefore were not exposed to interest rate risk with respect to interest payable under that facility.
In general, our investments in cash equivalents and marketable debt securities are governed by our investment policy, which has been approved by our Board of Directors. Our investment policy seeks to preserve the value of capital, consistent with maximizing return on our investments while maintaining adequate liquidity. To achieve our investment objectives, we maintain a portfolio of various holdings, types and maturities and invest in securities that meet or exceed our investment policy standards, such as high credit quality debt securities.
We continue to be exposed to interest rate risk related to our cash equivalents and marketable securities. Generally, our interest rate risk with respect to these investments is limited due to yields earned. Changes in the overall level of interest rates affect the interest income generated by our cash, cash equivalents and marketable securities. Our investment policy limits the amount of credit exposure to any one issue, issuer or type of security. Our securities all have maturity dates within three years of the date of purchase and are designated as available for sale. As of
December 31, 2016
, we believe that a hypothetical 10% change in interest rates would not materially affect the underlying valuation of our marketable securities.
68
Foreign Exchange Risk
We operate in countries other than the United States and, therefore, we are exposed to foreign currency risks. Most of our direct sales outside of the United States are billed in local currencies. We expect that the percentage of our sales and certain operating expenses denominated in foreign currencies will increase in the foreseeable future as we continue to expand into international markets. When our sales or expenses are not denominated in U.S. dollars, a fluctuation in exchange rates could affect our net income. We do not currently hold derivatives to hedge our exposure to foreign currency exchange rate fluctuations; however, we may choose to hedge our exposure in the future.
69
GLOBUS MEDICAL, INC.
INDEX TO CONSOLIDATED FINANCIAL STATEMENTS
|
Reports of Independent Registered Public Accounting Firms
|
|
|
Consolidated Balance Sheets
|
|
|
Consolidated Statements of Income
|
|
|
Consolidated Statements of Comprehensive Income
|
|
|
Consolidated Statements of Equity
|
|
|
Consolidated Statements of Cash Flows
|
|
|
Notes to Consolidated Financial Statements
|
|
70
Report of Independent Registered Public Accounting Firm
The Board of Directors and Stockholders
Globus Medical, Inc.:
We have audited the accompanying consolidated balance sheets of Globus Medical, Inc. (a Delaware corporation) and subsidiaries (the “Company”) as of December 31, 2016 and 2015 and the related consolidated statements of income, comprehensive income, equity and cash flows for each of the two years ended December 31, 2016. Our audits of the basic consolidated financial statements included the related financial statement schedule listed in the index appearing under Item 15(a)(2). These financial statements and financial statement schedule are the responsibility of the Company’s management. Our responsibility is to express an opinion on these financial statements and financial statement schedule based on our audit.
We conducted our audits in accordance with the standards of the Public Company Accounting Oversight Board (United States). Those standards require that we plan and perform the audit to obtain reasonable assurance about whether the financial statements are free of material misstatement. An audit includes examining, on a test basis, evidence supporting the amounts and disclosures in the financial statements. An audit also includes assessing the accounting principles used and significant estimates made by management, as well as evaluating the overall financial statement presentation. We believe that our audits provide a reasonable basis for our opinion.
In our opinion, the consolidated financial statements referred to above present fairly, in all material respects, the financial position of Globus Medical, Inc. and subsidiaries as of December 31, 2016 and 2015, and the results of their operations and their cash flows for the two years ended December 31, 2016 in conformity with accounting principles generally accepted in the United States of America. Also in our opinion, the related financial statement schedule, when considered in relation to these basic consolidated financial statements taken as a whole, presents fairly, in all material respects, the information set forth therein.
We also have audited, in accordance with the standards of the Public Company Accounting Oversight Board (United States), the Company’s internal control over financial reporting as of December 31, 2016, based on criteria established in the 2013 Internal Control - Integrated Framework issued by the Committee of Sponsoring Organizations of the Treadway Commission (COSO), and our report dated March 16, 2017 expressed an adverse opinion.
/s/ GRANT THORNTON LLP
Philadelphia, Pennsylvania
March 16, 2017
71
Report of Independent Registered Public Accounting Firm
Board of Directors and Stockholders
Globus Medical, Inc.:
We have audited the internal control over financial reporting of Globus Medical, Inc. (a Delaware corporation) and subsidiaries (the “Company”) as of December 31, 2016, based on criteria established in the 2013 Internal Control-Integrated Framework issued by the Committee of Sponsoring Organizations of the Treadway Commission (COSO). The Company’s management is responsible for maintaining effective internal control over financial reporting and for its assessment of the effectiveness of internal control over financial reporting, included in the accompanying Management’s Report on Internal Control over Financial Reporting. Our responsibility is to express an opinion on the Company’s internal control over financial reporting based on our audit.
We conducted our audit in accordance with the standards of the Public Company Accounting Oversight Board (United States). Those standards require that we plan and perform the audit to obtain reasonable assurance about whether effective internal control over financial reporting was maintained in all material respects. Our audit included obtaining an understanding of internal control over financial reporting, assessing the risk that a material weakness exists, testing and evaluating the design and operating effectiveness of internal control based on the assessed risk, and performing such other procedures as we considered necessary in the circumstances. We believe that our audit provides a reasonable basis for our opinion.
A company’s internal control over financial reporting is a process designed to provide reasonable assurance regarding the reliability of financial reporting and the preparation of financial statements for external purposes in accordance with generally accepted accounting principles. A company’s internal control over financial reporting includes those policies and procedures that (1) pertain to the maintenance of records that, in reasonable detail, accurately and fairly reflect the transactions and dispositions of the assets of the company; (2) provide reasonable assurance that transactions are recorded as necessary to permit preparation of financial statements in accordance with generally accepted accounting principles, and that receipts and expenditures of the company are being made only in accordance with authorizations of management and directors of the company; and (3) provide reasonable assurance regarding prevention or timely detection of unauthorized acquisition, use, or disposition of the company’s assets that could have a material effect on the financial statements.
Because of its inherent limitations, internal control over financial reporting may not prevent or detect misstatements. Also, projections of any evaluation of effectiveness to future periods are subject to the risk that controls may become inadequate because of changes in conditions, or that the degree of compliance with the policies or procedures may deteriorate.
A material weakness is a deficiency, or combination of control deficiencies, in internal control over financial reporting, such that there is a reasonable possibility that a material misstatement of the company’s annual or interim financial statements will not be prevented or detected on a timely basis.
A material weakness has been identified and included in management’s assessment relating to inadequate policies and procedures for recording depreciation and scrap expenses for instruments and cases.
In our opinion, because of the effect of the material weakness described above on the achievement of the objectives of the control criteria, the Company has not maintained effective internal control over financial reporting as of December 31, 2016, based on criteria established in the 2013 Internal Control-Integrated Framework issued by COSO.
72
We also have audited, in accordance with the standards of the Public Company Accounting Oversight Board (United States), the consolidated financial statements of the Company as of and for the year ended December 31, 2016. The material weakness identified above was considered in determining the nature, timing, and extent of audit tests applied in our audit of the 2016 consolidated financial statements, and this report does not affect our report dated March 16, 2017, which expressed an unqualified opinion on those financial statements.
/s/ GRANT THORNTON LLP
Philadelphia, Pennsylvania
March 16, 2017
73
Report of Independent Registered Public Accounting Firm
The Board of Directors and Stockholders
Globus Medical, Inc.:
We have audited the accompanying consolidated statements of income, comprehensive income, equity and cash flows of Globus Medical, Inc. and subsidiaries for the year ended December 31, 2014. In connection with our audit of the consolidated financial statements, we also have audited financial statement schedule II for the year ended December 31, 2014 in Item 15 (a) (2). These consolidated financial statements and financial statement schedule are the responsibility of the Company’s management. Our responsibility is to express an opinion on these consolidated financial statements and financial statement schedule based on our audit.
We conducted our audit in accordance with the standards of the Public Company Accounting Oversight Board (United States). Those standards require that we plan and perform the audit to obtain reasonable assurance about whether the financial statements are free of material misstatement. An audit includes examining, on a test basis, evidence supporting the amounts and disclosures in the financial statements. An audit also includes assessing the accounting principles used and significant estimates made by management, and evaluating the overall financial statement presentation. We believe that our audit provides a reasonable basis for our opinion.
In our opinion, the consolidated financial statements referred to above present fairly, in all material respects, the results of operations and the cash flows of Globus Medical, Inc. and subsidiaries for the year ended December 31, 2014, in conformity with U.S. generally accepted accounting principles. Also in our opinion, the related financial statement schedule, when considered in relation to the basic consolidated financial statements taken as a whole, presents fairly, in all material respects, the information set forth therein.
/s/ KPMG LLP
Philadelphia, Pennsylvania
February 26, 2015
74
GLOBUS MEDICAL, INC. AND SUBSIDIARIES
|
(In thousands, except par value)
|
December 31,
2016 |
December 31,
2015 |
|||||
|
ASSETS
|
|||||||
|
Current assets:
|
|||||||
|
Cash and cash equivalents
|
$
|
132,639
|
|
$
|
60,152
|
|
|
|
Restricted cash
|
477
|
|
26,119
|
|
|||
|
Short-term marketable securities
|
157,673
|
|
220,877
|
|
|||
|
Accounts receivable, net of allowances of $2,771 and $2,513, respectively
|
91,983
|
|
77,681
|
|
|||
|
Inventories
|
112,692
|
|
105,260
|
|
|||
|
Prepaid expenses and other current assets
|
14,502
|
|
7,351
|
|
|||
|
Income taxes receivable
|
3,800
|
|
8,672
|
|
|||
|
Deferred income taxes
|
—
|
|
38,687
|
|
|||
|
Total current assets
|
513,766
|
|
544,799
|
|
|||
|
Property and equipment, net of accumulated depreciation of $166,711 and $139,114, respectively
|
124,229
|
|
114,743
|
|
|||
|
Long-term marketable securities
|
60,444
|
|
48,762
|
|
|||
|
Note receivable
|
30,000
|
|
—
|
|
|||
|
Intangible assets, net
|
61,706
|
|
33,242
|
|
|||
|
Goodwill
|
105,926
|
|
91,964
|
|
|||
|
Other assets
|
928
|
|
590
|
|
|||
|
Deferred income taxes
|
30,638
|
|
—
|
|
|||
|
Total assets
|
$
|
927,637
|
|
$
|
834,100
|
|
|
|
LIABILITIES AND EQUITY
|
|||||||
|
Current liabilities:
|
|||||||
|
Accounts payable
|
$
|
17,472
|
|
$
|
15,971
|
|
|
|
Accrued expenses
|
46,401
|
|
53,769
|
|
|||
|
Income taxes payable
|
1,911
|
|
763
|
|
|||
|
Business acquisition liabilities, current
|
14,108
|
|
12,188
|
|
|||
|
Total current liabilities
|
79,892
|
|
82,691
|
|
|||
|
Business acquisition liabilities, net of current portion
|
5,972
|
|
21,126
|
|
|||
|
Deferred income taxes
|
7,876
|
|
13,260
|
|
|||
|
Other liabilities
|
1,819
|
|
1,699
|
|
|||
|
Total liabilities
|
95,559
|
|
118,776
|
|
|||
|
Commitments and contingencies (Note 15)
|
|
|
|
|
|||
|
Equity:
|
|||||||
|
Class A common stock; $0.001 par value. Authorized 500,000 shares; issued and outstanding 72,052 and 71,442 shares at December 31, 2016 and 2015, respectively
|
72
|
|
71
|
|
|||
|
Class B common stock; $0.001 par value. Authorized 275,000 shares; issued and outstanding 23,878 shares at December 31, 2016 and 2015, respectively
|
24
|
|
24
|
|
|||
|
Additional paid-in capital
|
211,725
|
|
192,629
|
|
|||
|
Accumulated other comprehensive loss
|
(8,642
|
)
|
(1,958
|
)
|
|||
|
Retained earnings
|
628,899
|
|
524,558
|
|
|||
|
Total equity
|
832,078
|
|
715,324
|
|
|||
|
Total liabilities and equity
|
$
|
927,637
|
|
$
|
834,100
|
|
|
See accompanying notes to consolidated financial statements.
75
GLOBUS MEDICAL, INC. AND SUBSIDIARIES
|
Year Ended
|
||||||||||||
|
(In thousands, except per share amounts)
|
December 31,
2016 |
December 31,
2015 |
December 31,
2014 |
|||||||||
|
Sales
|
$
|
563,994
|
|
$
|
544,753
|
|
$
|
474,371
|
|
|||
|
Cost of goods sold
|
134,705
|
|
132,333
|
|
110,769
|
|
||||||
|
Gross profit
|
429,289
|
|
412,420
|
|
363,602
|
|
||||||
|
Operating expenses:
|
||||||||||||
|
Research and development
|
44,532
|
|
36,312
|
|
31,166
|
|
||||||
|
Selling, general and administrative
|
222,156
|
|
210,241
|
|
188,632
|
|
||||||
|
Provision for litigation
|
3,156
|
|
(11,268
|
)
|
5,667
|
|
||||||
|
Amortization of intangibles
|
3,478
|
|
1,561
|
|
712
|
|
||||||
|
Acquisition related costs
|
1,826
|
|
3,352
|
|
(937
|
)
|
||||||
|
Total operating expenses
|
275,148
|
|
240,198
|
|
225,240
|
|
||||||
|
Operating income
|
154,141
|
|
172,222
|
|
138,362
|
|
||||||
|
Other income, net:
|
||||||||||||
|
Interest income, net
|
3,057
|
|
1,304
|
|
805
|
|
||||||
|
Foreign currency transaction loss
|
(482
|
)
|
(1,159
|
)
|
(899
|
)
|
||||||
|
Other income
|
563
|
|
438
|
|
374
|
|
||||||
|
Total other income, net
|
3,138
|
|
583
|
|
280
|
|
||||||
|
Income before income taxes
|
157,279
|
|
172,805
|
|
138,642
|
|
||||||
|
Income tax provision
|
52,938
|
|
60,021
|
|
46,157
|
|
||||||
|
Net income
|
$
|
104,341
|
|
$
|
112,784
|
|
$
|
92,485
|
|
|||
|
Earnings per share:
|
||||||||||||
|
Basic
|
$
|
1.09
|
|
$
|
1.19
|
|
$
|
0.98
|
|
|||
|
Diluted
|
$
|
1.08
|
|
$
|
1.17
|
|
$
|
0.97
|
|
|||
|
Weighted average shares outstanding:
|
||||||||||||
|
Basic
|
95,647
|
|
95,046
|
|
94,227
|
|
||||||
|
Dilutive stock options
|
785
|
|
1,027
|
|
1,230
|
|
||||||
|
Diluted
|
96,432
|
|
96,073
|
|
95,457
|
|
||||||
|
Anti-dilutive stock options excluded from weighted average calculation
|
5,481
|
|
3,348
|
|
1,666
|
|
||||||
See accompanying notes to consolidated financial statements.
76
GLOBUS MEDICAL, INC. AND SUBSIDIARIES
CONSOLIDATED STATEMENTS OF COMPREHENSIVE INCOME
|
Year Ended
|
||||||||||||
|
(In thousands)
|
December 31,
2016 |
December 31,
2015 |
December 31,
2014 |
|||||||||
|
Net income
|
$
|
104,341
|
|
$
|
112,784
|
|
$
|
92,485
|
|
|||
|
Other comprehensive loss:
|
||||||||||||
|
Unrealized loss on marketable securities, net of tax
|
(48
|
)
|
(55
|
)
|
(96
|
)
|
||||||
|
Foreign currency translation loss
|
(6,636
|
)
|
(246
|
)
|
(552
|
)
|
||||||
|
Total other comprehensive loss
|
(6,684
|
)
|
(301
|
)
|
(648
|
)
|
||||||
|
Comprehensive income
|
$
|
97,657
|
|
$
|
112,483
|
|
$
|
91,837
|
|
|||
See accompanying notes to consolidated financial statements.
77
GLOBUS MEDICAL, INC. AND SUBSIDIARIES
CONSOLIDATED STATEMENTS OF EQUITY
|
Class A Common stock
|
Class B Common Stock
|
Additional paid-in capital
|
Accumulated other comprehensive income
|
Retained earnings
|
||||||||||||||||||||||||||
|
(In thousands)
|
Shares
|
$
|
Shares
|
$
|
Total
|
|||||||||||||||||||||||||
|
Balance at December 31, 2013
|
66,065
|
|
$
|
66
|
|
27,378
|
|
$
|
27
|
|
$
|
153,987
|
|
$
|
(1,009
|
)
|
$
|
319,289
|
|
$
|
472,360
|
|
||||||||
|
Conversion to Class A
|
3,500
|
|
3
|
|
(3,500
|
)
|
(3
|
)
|
—
|
|
—
|
|
—
|
|
—
|
|
||||||||||||||
|
Stock-based compensation
|
—
|
|
—
|
|
—
|
|
—
|
|
7,111
|
|
—
|
|
—
|
|
7,111
|
|
||||||||||||||
|
Exercise of stock options
|
1,263
|
|
2
|
|
—
|
|
—
|
|
9,736
|
|
—
|
|
—
|
|
9,738
|
|
||||||||||||||
|
Tax benefit related to nonqualified stock options exercised
|
—
|
|
—
|
|
—
|
|
—
|
|
4,408
|
|
—
|
|
—
|
|
4,408
|
|
||||||||||||||
|
Comprehensive income
|
—
|
|
—
|
|
—
|
|
—
|
|
—
|
|
(648
|
)
|
92,485
|
|
91,837
|
|
||||||||||||||
|
Balance at December 31, 2014
|
70,828
|
|
71
|
|
23,878
|
|
24
|
|
175,242
|
|
(1,657
|
)
|
411,774
|
|
585,454
|
|
||||||||||||||
|
Stock-based compensation
|
—
|
|
—
|
|
—
|
|
—
|
|
9,860
|
|
—
|
|
—
|
|
9,860
|
|
||||||||||||||
|
Exercise of stock options
|
614
|
|
—
|
|
—
|
|
—
|
|
5,477
|
|
—
|
|
—
|
|
5,477
|
|
||||||||||||||
|
Tax benefit related to nonqualified stock options exercised
|
—
|
|
—
|
|
—
|
|
—
|
|
2,050
|
|
—
|
|
—
|
|
2,050
|
|
||||||||||||||
|
Comprehensive income
|
—
|
|
—
|
|
—
|
|
—
|
|
—
|
|
(301
|
)
|
112,784
|
|
112,483
|
|
||||||||||||||
|
Balance at December 31, 2015
|
71,442
|
|
71
|
|
23,878
|
|
24
|
|
192,629
|
|
(1,958
|
)
|
524,558
|
|
715,324
|
|
||||||||||||||
|
Stock-based compensation
|
—
|
|
—
|
|
—
|
|
—
|
|
11,652
|
|
—
|
|
—
|
|
11,652
|
|
||||||||||||||
|
Exercise of stock options
|
610
|
|
1
|
|
—
|
|
—
|
|
5,873
|
|
—
|
|
—
|
|
5,874
|
|
||||||||||||||
|
Tax benefit related to nonqualified stock options exercised
|
—
|
|
—
|
|
—
|
|
—
|
|
1,571
|
|
—
|
|
—
|
|
1,571
|
|
||||||||||||||
|
Comprehensive income
|
—
|
|
—
|
|
—
|
|
—
|
|
—
|
|
(6,684
|
)
|
104,341
|
|
97,657
|
|
||||||||||||||
|
Balance at December 31, 2016
|
72,052
|
|
$
|
72
|
|
23,878
|
|
$
|
24
|
|
$
|
211,725
|
|
$
|
(8,642
|
)
|
$
|
628,899
|
|
$
|
832,078
|
|
||||||||
See accompanying notes to consolidated financial statements.
78
GLOBUS MEDICAL, INC. AND SUBSIDIARIES
|
Year Ended
|
|||||||||||
|
(In thousands)
|
December 31,
2016 |
December 31,
2015 |
December 31,
2014 |
||||||||
|
Cash flows from operating activities:
|
|||||||||||
|
Net income
|
$
|
104,341
|
|
$
|
112,784
|
|
$
|
92,485
|
|
||
|
Adjustments to reconcile net income to net cash provided by operating activities:
|
|||||||||||
|
Depreciation and amortization
|
38,771
|
|
24,084
|
|
21,754
|
|
|||||
|
Amortization of premium on marketable securities
|
4,068
|
|
3,354
|
|
2,680
|
|
|||||
|
Write-down for excess and obsolete inventories
|
12,836
|
|
9,924
|
|
6,962
|
|
|||||
|
Stock-based compensation expense
|
11,382
|
|
9,639
|
|
7,111
|
|
|||||
|
Excess tax benefit related to nonqualified stock options
|
(1,571
|
)
|
(2,050
|
)
|
(4,408
|
)
|
|||||
|
Allowance for doubtful accounts
|
685
|
|
1,465
|
|
318
|
|
|||||
|
Change in fair value of contingent consideration
|
2,866
|
|
3,118
|
|
(1,131
|
)
|
|||||
|
Non-cash settlement of accrued expenses
|
(4,632
|
)
|
(8,405
|
)
|
—
|
|
|||||
|
Impairment of intangible assets
|
3,472
|
|
—
|
|
—
|
|
|||||
|
Change in deferred income taxes
|
(3,810
|
)
|
6,235
|
|
(4,379
|
)
|
|||||
|
(Increase)/decrease in:
|
|||||||||||
|
Restricted cash
|
25,641
|
|
(2,749
|
)
|
(23,370
|
)
|
|||||
|
Accounts receivable
|
(4,668
|
)
|
(4,193
|
)
|
(12,667
|
)
|
|||||
|
Inventories
|
(10,503
|
)
|
(19,327
|
)
|
(18,001
|
)
|
|||||
|
Prepaid expenses and other assets
|
4,568
|
|
(1,203
|
)
|
(249
|
)
|
|||||
|
Increase/(decrease) in:
|
|||||||||||
|
Accounts payable
|
(23
|
)
|
(3,825
|
)
|
4,628
|
|
|||||
|
Accounts payable to related party
|
—
|
|
(5,359
|
)
|
2,703
|
|
|||||
|
Accrued expenses and other liabilities
|
(18,164
|
)
|
(878
|
)
|
5,149
|
|
|||||
|
Income taxes payable/receivable
|
6,634
|
|
(657
|
)
|
(413
|
)
|
|||||
|
Net cash provided by operating activities
|
171,893
|
|
121,957
|
|
79,172
|
|
|||||
|
Cash flows from investing activities:
|
|||||||||||
|
Purchases of marketable securities
|
(287,263
|
)
|
(297,707
|
)
|
(251,422
|
)
|
|||||
|
Maturities of marketable securities
|
281,885
|
|
188,702
|
|
184,567
|
|
|||||
|
Sales of marketable securities
|
52,802
|
|
57,728
|
|
27,737
|
|
|||||
|
Purchases of property and equipment
|
(40,909
|
)
|
(50,760
|
)
|
(24,754
|
)
|
|||||
|
Issuance of note receivable
|
(30,000
|
)
|
—
|
|
—
|
|
|||||
|
Acquisition of businesses, net of cash acquired
|
(76,068
|
)
|
(48,513
|
)
|
(36,128
|
)
|
|||||
|
Net cash used in investing activities
|
(99,553
|
)
|
(150,550
|
)
|
(100,000
|
)
|
|||||
|
Cash flows from financing activities:
|
|||||||||||
|
Payment of business acquisition liabilities
|
(5,404
|
)
|
(1,200
|
)
|
(1,200
|
)
|
|||||
|
Proceeds from exercise of stock options
|
5,874
|
|
5,477
|
|
9,738
|
|
|||||
|
Excess tax benefit related to nonqualified stock options
|
1,571
|
|
2,050
|
|
4,408
|
|
|||||
|
Net cash provided by financing activities
|
2,041
|
|
6,327
|
|
12,946
|
|
|||||
|
Effect of foreign exchange rate on cash
|
(1,894
|
)
|
153
|
|
185
|
|
|||||
|
Net increase/(decrease) in cash and cash equivalents
|
72,487
|
|
(22,113
|
)
|
(7,697
|
)
|
|||||
|
Cash and cash equivalents, beginning of period
|
60,152
|
|
82,265
|
|
89,962
|
|
|||||
|
Cash and cash equivalents, end of period
|
$
|
132,639
|
|
$
|
60,152
|
|
$
|
82,265
|
|
||
|
Supplemental disclosures of cash flow information:
|
|||||||||||
|
Interest paid
|
35
|
|
9
|
|
32
|
|
|||||
|
Income taxes paid
|
$
|
50,087
|
|
$
|
57,100
|
|
$
|
51,096
|
|
||
See accompanying notes to consolidated financial statements.
79
GLOBUS MEDICAL, INC. AND SUBSIDIARIES
NOTES TO CONSOLIDATED FINANCIAL STATEMENTS
(a) The Company
Globus Medical, Inc., together with its subsidiaries, is a
medical device company focused on the design, development and commercialization of musculoskeletal implants. We are currently focused on implants that promote healing in patients with spine disorders.
We have also recently begun to develop a robotic surgical navigation device and products to treat patients who have experienced orthopedic traumas, although those development efforts are still ongoing and we currently have no robotic or orthopedic trauma products that are cleared by the U.S. Food and Drug Administration for sale. We are an engineering-driven company with a history of rapidly developing and commercializing advanced products and procedures that assist surgeons in effectively treating their patients, respond to evolving surgeon needs and address new treatment options.
Since our inception in 2003, we have launched over
170
products and offer a product portfolio addressing a broad array of spinal pathologies.
We are headquartered in Audubon, Pennsylvania, and market and sell our products through our exclusive sales force in the United States, as well as within North, Central and South America, Europe, Asia, Africa and Australia. The sales force consists of direct sales representatives and distributor sales representatives employed by exclusive independent distributors.
The terms the “Company,” “Globus,” “we,” “us” and “our” refer to Globus Medical, Inc. and, where applicable, our consolidated subsidiaries.
(b) Basis of Presentation
The accompanying consolidated financial statements have been prepared in conformity with U.S. generally accepted accounting principles (“U.S. GAAP”).
Certain reclassifications have been made to prior period statements to conform to the current period presentation.
During the fourth quarter of 2016, we self-identified and recorded non-cash prior period adjustments primarily related to depreciation and scrap expense for our instruments and cases. This
$1.8 million
net cumulative adjustment related to the period beginning in 2013 and through 2015 and resulted in a
$5.5 million
pre-tax increase in depreciation and a
$3.7 million
pre-tax decrease in scrap and provision for excess and obsolete inventory, both of which are components of our cost of goods sold on our consolidated statement of income. We performed the analysis required by Staff Accounting Bulletin No. 99,
Materiality
, and Staff Accounting Bulletin No. 108,
Considering the Effects of Prior Year Misstatements When Quantifying Misstatements in Current Year Financial Statements
, and determined that the effect of the adjustments was not material to the financial position, results of operations or cash flows of any prior fiscal year from both a quantitative and qualitative perspective and is not material to the full fiscal year 2016.
(c) Principles of Consolidation
The accompanying consolidated financial statements include the accounts of Globus and its wholly owned subsidiaries. All intercompany balances and transactions are eliminated in consolidation.
80
GLOBUS MEDICAL, INC. AND SUBSIDIARIES
NOTES TO CONSOLIDATED FINANCIAL STATEMENTS (Continued)
(d) Use of Estimates
The preparation of the consolidated financial statements in conformity with U.S. GAAP requires management to make estimates and assumptions that affect the reported amounts of assets and liabilities and disclosures of contingent assets and liabilities at the date of the consolidated financial statements and the reported amounts of revenues and expenses during the reporting period. We base our estimates, in part, on historical experience that management believes to be reasonable under the circumstances. Actual results could differ from those estimates. Estimates and assumptions are periodically reviewed and the effects of revisions are reflected in the consolidated financial statements in the period they are determined to be necessary.
Significant areas that require management’s estimates include intangible assets, contingent payment liabilities, allowance for doubtful accounts, stock-based compensation, write-down for excess and obsolete inventory, useful lives of assets, the outcome of litigation, recoverability of intangible assets and income taxes. We are subject to risks and uncertainties due to changes in the healthcare environment, regulatory oversight, competition, and legislation that may cause actual results to differ from estimated results.
(e) Foreign Currency Translation
The functional currency of our foreign subsidiaries is generally their local currency. Assets and liabilities of the foreign subsidiaries are translated at the period end currency exchange rate and revenues and expenses are translated at an average currency exchange rate for the period. The resulting foreign currency translation gains and losses are included as a component of accumulated other comprehensive income. Gains and losses arising from intercompany foreign transactions are included in other income, net on the consolidated statement of income.
(f) Cash and Cash Equivalents
Cash and cash equivalents include cash on hand and all highly liquid investments with a maturity of three months or less when purchased.
(g) Restricted Cash
In December 2014, we set aside cash for the payment of a portion of the DePuy Synthes and Bianco litigation. We classified this cash as restricted, as the amount was placed in escrow to be used for payment of the litigation obligations, should we not be successful with our appeals. On January 13, 2016, we settled our litigation with DePuy Synthes and made a payment of
$7.9 million
and recovered approximately
$8.4 million
related to that settlement shortly thereafter. As of
December 31, 2016
, we have
$0.5 million
of restricted cash remaining related to the Bianco matter. See
“Note 15. Commitments and Contingencies”
below for more details regarding these litigations.
(h) Accounts Receivable and Allowance for Doubtful Accounts
The majority of our accounts receivable is composed of amounts due from hospitals. We carry our accounts receivable at cost less an allowance for doubtful accounts. On a regular basis, we evaluate our accounts receivable and estimate an allowance for doubtful accounts, as needed, based on various factors such as our customers’ current credit conditions, length of time past due, and the general economy as a whole.
81
GLOBUS MEDICAL, INC. AND SUBSIDIARIES
NOTES TO CONSOLIDATED FINANCIAL STATEMENTS (Continued)
Receivables are written off against the allowance when they are deemed uncollectible and have historically been immaterial.
(i) Concentrations of Credit Risk
Financial instruments, which potentially subject us to concentrations of credit risk, are primarily cash and cash equivalents and accounts receivable. Concentrations of credit risk with respect to accounts receivable are limited due to the large number of entities comprising our customer base. We perform ongoing credit evaluations of our customers and generally do not require collateral.
There was no customer that accounted for 10% or more of sales for the years ended
December 31, 2016
,
2015
, and
2014
, respectively.
(j) Marketable Securities
Our marketable securities include municipal bonds, corporate debt securities, commercial paper,
securities of U.S. government-sponsored agencies
and asset-backed securities, and are classified as available-for-sale as of
December 31, 2016
. Available-for-sale securities are recorded at fair value in both short-term and long-term marketable securities on our consolidated balance sheets. The change in fair value for available-for-sale securities is recorded, net of taxes, as a component of accumulated other comprehensive income on our consolidated balance sheets. Premiums and discounts are recognized over the life of the related security as an adjustment to yield using the straight-line method. Realized gains or losses from the sale of our marketable securities are determined on a specific identification basis. Realized gains and losses, along with interest income and the amortization/accretion of premiums/discounts are included as a component of other income, net, on our consolidated statements of income. Interest receivable is recorded as a component of prepaid expenses and other current assets on our consolidated balance sheets.
We maintain a portfolio of various holdings, types and maturities, though most of the securities in our portfolio could be liquidated at minimal cost at any time. We invest in securities that meet or exceed standards as defined in our investment policy. Our policy also limits the amount of credit exposure to any one issue, issuer or type of security. We review our securities for other-than-temporary impairment at each reporting period. If an unrealized loss for any security is considered to be other-than-temporary, the loss will be recognized in our consolidated statement of income in the period the determination is made.
(k) Inventories
I
nventories are stated at the lower of cost or market. Cost is determined on a first-in, first-out basis. The majority of our inventories are finished goods as we mainly utilize third-party suppliers to source our products. We periodically evaluate the carrying value of our inventories in relation to our estimated forecast of product demand, which takes into consideration the estimated life cycle of product releases. When quantities on hand exceed estimated sales forecasts, we record a write-down for such excess inventories.
(l) Property and Equipment
Property and equipment are recorded at cost less accumulated depreciation. Additions or improvements are capitalized, while repairs and maintenance are expensed as incurred. Depreciation and amortization are provided using the straight-line method over the related useful lives of the assets.
82
GLOBUS MEDICAL, INC. AND SUBSIDIARIES
NOTES TO CONSOLIDATED FINANCIAL STATEMENTS (Continued)
When assets are sold or otherwise disposed of, the related property, equipment, and accumulated depreciation amounts are relieved from the accounts, and any gain or loss is recorded in the consolidated statements of income.
(m) Goodwill and Intangible Assets
Goodwill represents the excess purchase price over the fair values of the identifiable assets acquired less the liabilities assumed. Goodwill is tested for impairment at a minimum on an annual basis. Goodwill is tested for impairment at the reporting unit level by comparing the reporting unit’s carrying amount, to the fair value of the reporting unit. The fair values are estimated using an income and discounted cash flow approach. We annually perform a qualitative test for impairment as permitted under Financial Accounting Standards Board (“FASB”) authoritative guidance. During the years ended
December 31, 2016
,
2015
and
2014
, we did not record any impairment charges related to goodwill.
Intangible assets consist of purchased in-process research and development (“IPR&D”), supplier network, patents, customer relationships and non-compete agreements. Intangible assets with finite useful lives are amortized over the period of estimated benefit using the straight-line method and estimated useful lives ranging from
one
to
seventeen
years. Intangible assets are tested for impairment annually or whenever events or circumstances indicate that a carrying amount of an asset (asset group) may not be recoverable. If impairment is indicated, we measure the amount of the impairment loss as the amount by which the carrying amount exceeds the fair value of the asset. Fair value is generally determined using a discounted future cash flow analysis. During the years ended
December 31, 2016
,
2015
and
2014
, we did not record any impairment charges related to our finite-lived intangible assets.
IPR&D has an indefinite life and is not amortized until completion of the project at which time the IPR&D becomes an amortizable asset. If the related project is not completed in a timely manner, we may have an impairment related to the IPR&D, calculated as the excess of the asset’s carrying value over its fair value. During 2016, we recorded an impairment charge of
$3.5 million
related to
one
of our IPR&D projects as a component of acquisition related costs. There were no impairments of IPR&D during the years ended
December 31, 2015
or
2014
.
(n) Impairment of Long-Lived Assets
We periodically evaluate the recoverability of the carrying amount of long-lived assets, which include property and equipment, as well as whenever events or changes in circumstances indicate that the carrying amount of an asset group may not be fully recoverable. An impairment is assessed when the undiscounted future cash flows from the use and eventual disposition of an asset group are less than its carrying value. If impairment is indicated, we measure the amount of the impairment loss as the amount by which the carrying amount exceeds the fair value of the asset group. Our fair value methodology is based on quoted market prices, if available. If quoted market prices are not available, an estimate of fair value is made based on prices of similar assets or other valuation techniques including present value techniques. During the years ended
December 31, 2016
,
2015
and
2014
, we did not record any impairment charges related to long-lived assets.
(o) Revenue Recognition
Revenue is recognized when persuasive evidence of an arrangement exists, product delivery has occurred, pricing is fixed or determinable, and collection is reasonably assured. A significant portion of our
83
GLOBUS MEDICAL, INC. AND SUBSIDIARIES
NOTES TO CONSOLIDATED FINANCIAL STATEMENTS (Continued)
revenue is generated from consigned inventory maintained at hospitals or with sales representatives. For these products, revenue is recognized at the time the product is used or implanted. For all other transactions, we recognize revenue when title to the goods and risk of loss transfer to customers, provided there are no remaining performance obligations that will affect the customer’s final acceptance of the sale. Our policy is to classify shipping and handling costs billed to customers as sales and the related expenses as cost of goods sold.
(p) Research and Development
Research and development costs are expensed as incurred. Research and development costs include salaries, employee benefits, supplies, consulting services, clinical services and clinical trial costs, and facilities costs. Costs incurred in obtaining technology licenses and patents are charged immediately to research and development expense if the technology licensed has not reached technological feasibility and has no alternative future use.
(q) Stock-Based Compensation
The cost for employee and non-employee director awards is measured at the grant date based on the fair value of the award. The fair value of the portion of the award that is ultimately expected to vest is recognized as expense over the requisite service period (generally the vesting period of the equity award). Awards issued to non-employees are recorded at their fair value as determined in accordance with authoritative guidance, and are periodically revalued as the awards vest and are recognized as expense over the requisite service period.
The determination of the fair value of stock options is made utilizing the Black-Scholes option-pricing model which is affected by our stock price and a number of assumptions, including expected volatility, expected term, risk-free interest rate and expected dividends.
As we became a publicly traded entity in 2012, historic volatility for our common stock is insufficient to estimate expected volatility. As a result, we estimate volatility based on a consistently defined peer group of public companies that we believe collectively provides a reasonable basis for estimating volatility. We intend to continue to use the consistently defined group of publicly traded peer companies to determine volatility in the future until sufficient information regarding volatility of the price of our shares of Class A common stock becomes available or the selected companies are no longer suitable for this purpose.
The expected term of the stock options is determined utilizing the simplified method given the limited extent of our historical data. The risk-free interest rate assumption is based on observed interest rates of U.S. Treasury securities appropriate for the expected terms of the stock options. The dividend yield assumption is based on the history and expectation of no dividend payouts.
(r) Income Taxes
Deferred tax assets and liabilities are recognized for the future tax consequences attributable to differences between the financial statement carrying amounts of existing assets and liabilities and their respective tax bases. Deferred tax assets and liabilities are measured using enacted tax rates expected to apply to taxable income in the year in which such items are expected to be recovered or settled. The effect on deferred tax assets and liabilities of a change in tax rates is recognized in the period that includes the enactment date. A valuation allowance is established to offset any deferred tax assets if, based upon available evidence, it is more likely than not that some or all of the deferred tax assets will not be realized.
84
GLOBUS MEDICAL, INC. AND SUBSIDIARIES
NOTES TO CONSOLIDATED FINANCIAL STATEMENTS (Continued)
Significant judgment is required in determining income tax provisions and in evaluating tax positions. We will establish additional provisions for income taxes when, despite the belief that tax positions are fully supportable, there remain certain positions that do not meet the minimum probability threshold that a tax position is more likely than not to be sustained upon examination by the taxing authority. In the normal course of business, we and our subsidiaries are examined by various federal, state, and foreign tax authorities. We regularly assess the potential outcomes of these examinations and any future examinations for the current or prior years in determining the adequacy of the provision for income taxes. We periodically assess the likelihood and amount of potential adjustments and adjust the income tax provision, the current tax liability, and deferred taxes in the period in which the facts that give rise to a revision become known.
(s) Fair Value of Financial Instruments
As of
December 31, 2016
, the carrying values of cash and cash equivalents, short-term investments, accounts receivable, accounts payable and accrued expenses approximate their respective fair values based on their short-term nature. We classify our financial assets and liabilities that are measured at fair value into one of the three categories based upon inputs used to determine fair value. See
“Note 6. Fair Value Measurements”
below for more details regarding inputs and classifications.
(t) Advertising Expense
We expense advertising costs as they are incurred. Advertising expense was
$0.9 million
,
$0.4 million
and
$0.5 million
, for the years ended
December 31, 2016
,
2015
, and
2014
, respectively.
(u) Legal Costs
We expense legal costs related to loss contingencies as incurred.
(v) Acquisition Related Costs
Acquisition related costs represents the change in fair value of business acquisition related contingent consideration; costs related to integrating recently acquired businesses including but not limited to costs to exit or convert contractual obligations, severance, and information system conversion; and specific costs related to the consummation of the acquisition process such as banker fees, legal fees, and other acquisition related professional fees.
(w) Medical Device Excise Tax
Effective as of January 1, 2013, the Patient Protection and Affordable Care Act, as amended by the Health Care and Education Affordability Reconciliation Act (collectively “PPACA”) imposed a medical device excise tax (“MDET”) of
2.3%
on any entity that manufactures or imports certain medical devices offered for sale in the United States. We account for the MDET as a component of our cost of goods sold. For the years ended
December 31, 2015
and
2014
, we recognized expenses of
$8.1 million
and
$7.1 million
, respectively.
The Consolidated Appropriations Act of 2016, which was signed into law in December 2015, includes a two-year suspension on the medical device excise tax, effective January 1, 2016. Without further legislative action, the tax will automatically be reinstated for certain medical device sales in the United States starting on January 1, 2018.
85
GLOBUS MEDICAL, INC. AND SUBSIDIARIES
NOTES TO CONSOLIDATED FINANCIAL STATEMENTS (Continued)
(x) Recently Issued Accounting Pronouncements
In May 2014, the FASB issued Accounting Standards Update 2014-09,
Revenue from Contracts with Customers (Topic 606)
(“ASU 2014-09”)
.
ASU 2014-09 amends the guidance in former Topic 605,
Revenue Recognition
, and most other existing revenue guidances in US GAAP. Under the new standard, an entity will recognize revenue to depict the transfer of goods or services to customers in amounts that reflect the payment to which the entity expects to be entitled in exchange for those goods or services and provide additional disclosures. As amended, the effective date for public entities is annual reporting periods beginning after December 15, 2017 and interim periods therein. Early adoption is not permitted prior to the first quarter of 2017. We will adopt ASU 2014-09 effective January 1, 2018 using the modified retrospective method (retrospective application with the cumulative effect of initially applying the guidance recognized at the date of initial application). This update will not have a material impact on our financial position, results of operations, and disclosures.
In July 2015, the FASB released ASU 2015-11,
Simplifying the Measurement of Inventory (Topic 330)
(“ASU 2015-11”) as part of the FASB’s Simplification Initiative. This update is intended to more closely align the measurement of inventory under GAAP with the measurement of inventory under International Financial Reporting Standards. Within the scope of the update, an entity is required to measure inventory at the lower of cost or net realizable value. Net realizable value is defined as the estimated selling price in the ordinary course of business, less reasonable and predictable costs of completion, disposal and transportation. ASU 2015-11 is effective for all public entities for fiscal years beginning after December 15, 2016, including interim reporting periods within that period, and is required to be applied prospectively, with early adoption permitted. We adopted ASU 2015-11 on January 1, 2017. This update will not have a material impact on our financial position, results of operations, and disclosures.
In September 2015, the FASB released ASU 2015-16,
Business Combinations (Topic 805): Simplifying the Accounting for Measurement-Period Adjustments
(“ASU 2015-16”). ASU 2015-16 requires that an acquirer recognize adjustments to provisional amounts that are identified during the measurement period in the reporting period in which the adjustment amounts are determined. Prior to the issuance of the standard, entities were required to retrospectively apply adjustments made to provisional amounts recognized in a business combination. The amendments in ASU 2015-16 require an entity to present separately on the face of the income statement, or disclose in the notes, the portion of the amount recorded in current-period earnings by line item that would have been recorded in previous reporting periods if the adjustment to the provisional amounts had been recognized as of the acquisition date. ASU 2015-16 is effective for fiscal years, and interim periods within those years, beginning after December 15, 2015. We adopted ASU 2015-16 on January 1, 2016. This update did not have a material impact on our financial position, results of operations, and disclosures.
In November 2015, the FASB released ASU 2015-17,
Income Taxes (Topic 740): Balance Sheet Classification of Deferred Taxes
(“ASU 2015-17”). ASU 2015-17 simplifies the presentation of deferred income taxes by requiring that all deferred income taxes are classified as noncurrent in a classified statement of financial position. The amendments in ASU 2015-17 also aligns the presentation of deferred taxes with that of International Financial Reporting Standards. This update is effective for financial statements issued for annual periods beginning after December 15, 2016, and interim periods within those annual periods, with earlier application permitted for all entities as of the beginning of an interim or annual reporting period. We adopted ASU 2015-17 prospectively effective March 31, 2016, therefore prior periods were not adjusted.
86
GLOBUS MEDICAL, INC. AND SUBSIDIARIES
NOTES TO CONSOLIDATED FINANCIAL STATEMENTS (Continued)
In February 2016, the FASB released ASU 2016-02,
Leases (Topic 842)
(“ASU 2016-02”). Under ASU 2016-02, a right-of-use asset and lease obligation will be recorded for all leases with terms greater than 12 months, whether operating or financing, while the income statement will reflect lease expense for operating leases and amortization/interest expense for financing leases. ASU 2016-02 is effective for fiscal years beginning after December 15, 2018, with early adoption permitted, and requires the use of the modified retrospective method, which will require adjustment to all comparative periods presented in the consolidated financial statements. We are currently evaluating the impact of this new accounting standard on our financial position, results of operations, and disclosures.
In March 2016, the FASB released ASU 2016-09,
Compensation - Stock Compensation (Topic 718): Improvements to Employee Share-Based Payment Accounting
(“ASU 2016-09”), which will simplify the income tax consequences, accounting for forfeitures, and classification on the statements of cash flows. ASU 2016-09 is effective for fiscal years, and interim periods within those fiscal years, beginning after December 15, 2016, with early adoption permitted, and will be applied either prospectively, retrospectively or using a modified retrospective transition method, depending on the area covered in this update. We believe that the impact of this update will not have a material impact on our financial position, results of operations, and disclosures. We adopted ASU 2016-09 on January 1, 2017.
In August 2016, the FASB released ASU 2016-15,
Statement of Cash Flows (Topic 230): Classification of Certain Cash Receipts and Cash Payments
(“ASU 2016-15”), which addresses whether to present certain specific cash flow items as operating, investing or financing activities. ASU 2016-15 is effective for public entities for fiscal years, and interim periods within those fiscal years, beginning after December 15, 2017. Early adoption is permitted, including adoption in an interim period. We will adopt ASU 2016-15 on January 1, 2018. We believe that the impact of this update will not have a material impact on our consolidated statements of cash flows.
In October 2016, the FASB released ASU 2016-16,
Income Taxes (Topic 740): Intra-Entity Transfers of Assets Other Than Inventory
(“ASU 2016-16”). ASU 2016-16 removes the current exception in US GAAP prohibiting entities from recognizing current and deferred income tax expenses or benefits related to transfer of assets, other than inventory, within the consolidated entity. The current exception to defer the recognition of any tax impact on the transfer of inventory within the consolidated entity until it is sold to a third party remains unaffected. This update is effective for public entities for annual reporting periods beginning after December 15, 2017. Early adoption is permitted and should be in the first interim period if an entity issues interim financial statements. We are currently evaluating the impact of this new accounting standard on our financial position, results of operations, and disclosures.
Alphatec International
On September 1, 2016 (the “Closing Date”), Globus Medical Ireland, Ltd. (“Globus Ireland”), a private limited company existing under the laws of Ireland and an indirect wholly-owned subsidiary of Globus, acquired from Alphatec Holdings, Inc., a Delaware corporation (“Alphatec”) and a publicly traded medical devices company, (i) substantially all of the assets and certain liabilities of Alphatec’s subsidiaries in the United Kingdom, Italy, the Netherlands, Germany and Hong Kong and (ii) all of the outstanding equity interests of Alphatec’s subsidiaries in Japan, Brazil, China, Singapore and Australia (“Alphatec International”) pursuant to a Purchase and Sale Agreement entered into on July 25, 2016 (the “Purchase Agreement” and the “Acquisition”). The aggregate consideration for the transaction was approximately
$77.8 million
, subject to customary adjustment after closing for certain working capital items as provided in the Purchase Agreement. The Acquisition provides us immediate access to Japan and increased presence and penetration in other key geographies, roughly doubling our international sales. We also acquired a talent pool of international sales professionals as well as an extensive network of international distributors.
87
GLOBUS MEDICAL, INC. AND SUBSIDIARIES
NOTES TO CONSOLIDATED FINANCIAL STATEMENTS (Continued)
In addition, in connection with the Acquisition, Globus Ireland entered into a supply agreement with Alphatec, pursuant to which Alphatec will supply products to Globus Ireland and its newly-acquired subsidiaries for up to
five
years after the Closing Date as we seek to transition those customers to Globus products.
We accounted for the acquisition under the purchase method of accounting, and as a result, recorded preliminary goodwill of approximately
$14.8 million
. Amounts recognized for assets acquired and liabilities assumed are based on preliminary purchase price allocations and on certain management judgments. These preliminary allocations are based on an analysis of the estimated fair values of assets acquired and liabilities assumed, including identifiable tangible assets, and estimates of the useful lives of tangible assets. The final purchase price allocations will be completed after we finalize our third-party appraisal, review all available data, and complete our own internal assessments. We expect to complete our final purchase price allocations in mid-2017. Any additional adjustments resulting from finalization of the purchase price allocations for Alphatec International will affect the amount assigned to goodwill. Based on our preliminary purchase price allocations, we estimate that
$9.1 million
of the goodwill from this acquisition is deductible for tax purposes.
The results of operations of Alphatec International have been included in our results of operations from the date of acquisition. Net sales contributed by Alphatec International from the acquisition date through
December 31, 2016
were
$18.6 million
while earnings were break-even, and the earnings reflect amortization of acquired intangible assets and acquisition related costs of
$2.6 million
and amortization of inventory step up of
$1.1 million
.
As of
December 31, 2016
, we recorded the following preliminary purchase price allocation for the identifiable tangible and intangible assets and liabilities of Alphatec International:
|
(In thousands)
|
|||
|
Consideration:
|
|||
|
Cash paid at closing
|
$
|
80,000
|
|
|
Net working capital adjustment due
|
(2,217
|
)
|
|
|
Fair value of consideration
|
$
|
77,783
|
|
|
Identifiable assets acquired and liabilities assumed:
|
|||
|
Cash acquired
|
$
|
4,010
|
|
|
Accounts receivable
|
12,402
|
|
|
|
Inventory
|
10,579
|
|
|
|
Customer relationships
|
38,800
|
|
|
|
Property and equipment
|
4,800
|
|
|
|
Deferred tax assets
|
1,436
|
|
|
|
Other assets
|
8,092
|
|
|
|
Accounts payable and accrued expenses
|
(8,119
|
)
|
|
|
Deferred tax liabilities
|
(9,002
|
)
|
|
|
Total identifiable net assets
|
62,998
|
|
|
|
Goodwill
|
14,785
|
|
|
|
Total allocated purchase price
|
$
|
77,783
|
|
88
GLOBUS MEDICAL, INC. AND SUBSIDIARIES
NOTES TO CONSOLIDATED FINANCIAL STATEMENTS (Continued)
The following unaudited pro forma information is based on our historical data and our assumptions for consolidated results of operations, and gives effect to our acquisition of Alphatec International as if the acquisition had occurred on January 1, 2015. These unaudited pro forma results include adjustments having a continuing impact on our consolidated statements of income. These adjustments primarily consist of: adjustments to the fair value of inventory, adjustments to depreciation for the fair value and depreciable lives of property and equipment, amortization of intangibles, interest income and adjustments to tax expense based on consolidated pro forma results. These results have been prepared using assumptions our management believes are reasonable, are not necessarily indicative of the actual results that would have occurred if the acquisition had occurred on January 1, 2015, and are not necessarily indicative of the results that may be achieved in the future, including but not limited to operating synergies that we may realize as a result of the acquisition.
|
Year Ended
|
|||||||
|
(pro forma, unaudited, in thousands, except per share amounts)
|
December 31,
2016 |
December 31,
2015 |
|||||
|
Net sales
|
$
|
595,698
|
|
$
|
598,386
|
|
|
|
Net income
|
110,611
|
|
115,181
|
|
|||
|
Earnings per share:
|
|||||||
|
Basic
|
$
|
1.16
|
|
$
|
1.21
|
|
|
|
Diluted
|
$
|
1.15
|
|
$
|
1.20
|
|
|
Branch Medical Group, Inc.
On February 25, 2015, we entered into an agreement to acquire Branch Medical Group, Inc. (“BMG”), a related-party manufacturer of high precision medical devices located in Audubon, PA. We closed this acquisition on March 11, 2015, for
$57.0 million
in cash,
$5.3 million
in deferred consideration, and
$0.9 million
of closing working capital adjustments. The amount payable to BMG on the date of acquisition of
$5.2 million
was also settled in connection with the acquisition. The deferred consideration was a holdback of a portion of the sale price, to allow time to properly account for all working capital adjustments in the event of an unfavorable adjustment to the sellers. The full holdback amount of
$5.3 million
was paid in cash in July 2016.
As previously disclosed in our definitive proxy statement, BMG had been a related-party supplier since 2005. As of February 24, 2015, David C. Paul's wife, David D. Davidar's wife, and David M. Demski collectively owned approximately
49%
of the outstanding stock of BMG. In addition, since February 2010, Mr. Paul's wife and Mr. Davidar's wife had served as directors of BMG. Prior to the acquisition, we purchased products and services from BMG pursuant to a standard Supplier Quality Agreement entered into in September 2010.
We accounted for the acquisition under the purchase method of accounting, and as a result, recorded goodwill of
$39.0 million
. The results of operations of BMG have been included in our results of operations from the date of acquisition. Amounts recognized for assets acquired and liabilities assumed are based on purchase price allocations and on certain management judgments. These allocations are based on an analysis of the estimated fair values of assets acquired and liabilities assumed, including identifiable tangible assets, and estimates of the useful lives of tangible assets. We completed our final purchase price allocations during
89
GLOBUS MEDICAL, INC. AND SUBSIDIARIES
NOTES TO CONSOLIDATED FINANCIAL STATEMENTS (Continued)
September 2015 and the final purchase price adjustments were not material. The goodwill from this acquisition is not deductible for tax purposes.
The table below represents the final purchase price allocation for the identifiable tangible and intangible assets and liabilities of BMG:
|
(In thousands)
|
|||
|
Consideration:
|
|||
|
Cash paid at closing
|
$
|
57,042
|
|
|
Deferred consideration
|
5,290
|
|
|
|
Closing adjustments payable
|
944
|
|
|
|
Fair value of consideration
|
$
|
63,276
|
|
|
Identifiable assets acquired and liabilities assumed:
|
|||
|
Cash acquired
|
$
|
9,026
|
|
|
Accounts receivable
|
88
|
|
|
|
Inventory
|
4,753
|
|
|
|
Other assets
|
444
|
|
|
|
Property and equipment
|
14,862
|
|
|
|
Accounts payable and accrued expenses
|
(1,585
|
)
|
|
|
Deferred tax liability, net
|
(3,280
|
)
|
|
|
Total identifiable net assets
|
24,308
|
|
|
|
Goodwill
|
38,968
|
|
|
|
Total allocated purchase price
|
$
|
63,276
|
|
We believe the vertical integration opportunity afforded by BMG will strengthen Globus, both operationally and financially. We expect this acquisition, together with other investments in our in-house manufacturing capabilities, to enable us to achieve our goal of in-house production of approximately one-half of our spinal implant product purchases by 2018.
The following updated unaudited pro forma information is based on historical data, and gives effect to our acquisition of BMG as if the acquisition had occurred on January 1, 2014. These unaudited pro forma results include adjustments having a continuing impact on our consolidated statements of income. These adjustments consist of: elimination of intercompany sales/purchase transactions and the related profit, adjustments to depreciation for the fair value and depreciable lives of property and equipment, adjustments in the capitalization of overhead costs and adjustments to tax expense based on consolidated pro forma results. These results have been prepared using assumptions our management believes are reasonable, but not necessarily indicative of the actual results that would have occurred if the acquisition had occurred on January 1, 2014, and are not necessarily indicative of the results that may be achieved in the future, including but not limited to operating synergies that we may realize as a result of the acquisition.
90
GLOBUS MEDICAL, INC. AND SUBSIDIARIES
NOTES TO CONSOLIDATED FINANCIAL STATEMENTS (Continued)
|
Year Ended
|
|||||||
|
(pro forma, unaudited, in thousands, except per share amounts)
|
December 31,
2015 |
December 31,
2014 |
|||||
|
Net sales
|
$
|
544,578
|
|
$
|
474,544
|
|
|
|
Net income
|
115,915
|
|
92,945
|
|
|||
|
Earnings per share:
|
|||||||
|
Basic
|
$
|
1.22
|
|
$
|
0.99
|
|
|
|
Diluted
|
$
|
1.21
|
|
$
|
0.97
|
|
|
Transplant Technologies of Texas, Ltd.
On October 23, 2014, we entered into an equity interest purchase agreement with Transplant Technologies of Texas, Ltd. (“TTOT”), an allograft tissue processor located in San Antonio, Texas, pursuant to which we acquired
100%
of the equity interests for
$36.1 million
. In addition to the initial purchase price, we may be obligated to make milestone payments of up to
$15.0 million
over
three
years based primarily on sales thresholds from the product lines we acquired.
TTOT was privately held and provides human tissue products including bone allografts, biomaterials, and soft tissue products for spine, orthopedics, sports medicine, dental, and wound care markets and represents a key step in fulfilling our strategy of building a broad business in regenerative biologics.
While we continue to partner with third party suppliers for some of our existing allograft products, the acquisition of TTOT expanded our suite of regenerative biologics products. We believe this acquisition will also improve our capabilities for the development of new and innovative human allograft tissue products in the future.
We accounted for the acquisition under the purchase method of accounting, and as a result, recorded goodwill of
$34.6 million
. The results of operations of TTOT have been included in our results of operations from the date of acquisition. Amounts recognized for assets acquired and liabilities assumed are based on purchase price allocations and on certain management judgments. These allocations are based on an analysis of the estimated fair values of assets acquired and liabilities assumed, including identifiable tangible and intangible assets, and estimates of the useful lives of tangible and amortizable intangible assets. We completed our final purchase price allocations during March 2015 and the final purchase price adjustments subsequent to December 31, 2014 were not material. The goodwill from this acquisition is deductible for tax purposes.
91
GLOBUS MEDICAL, INC. AND SUBSIDIARIES
NOTES TO CONSOLIDATED FINANCIAL STATEMENTS (Continued)
The table below represents the final purchase price allocation for the identifiable tangible and intangible assets of TTOT:
|
(In thousands)
|
||||
|
Consideration:
|
||||
|
Cash paid at closing
|
$
|
36,128
|
|
|
|
Contingent consideration
|
11,300
|
|
(1)
|
|
|
Fair value of consideration
|
$
|
47,428
|
|
|
|
Identifiable assets acquired and liabilities assumed:
|
||||
|
Inventory
|
$
|
9,599
|
|
|
|
Supplier network
|
4,000
|
|
||
|
Customer relationships
|
1,600
|
|
||
|
Accounts receivable
|
1,529
|
|
||
|
Equipment
|
518
|
|
||
|
Trade names
|
300
|
|
||
|
Other assets
|
292
|
|
||
|
Accounts payable and accrued expenses
|
(5,034
|
)
|
||
|
Total identifiable net assets
|
12,804
|
|
||
|
|
||||
|
Goodwill
|
34,624
|
|
||
|
Total allocated purchase price
|
$
|
47,428
|
|
|
|
(1)
|
The contingent consideration relates to the achievement of certain sales milestones. As of December 31, 2014, the aggregate, undiscounted amount of contingent consideration that we could pay related to the acquisitions ranges from zero to
$15.0 million
(see
“Note 6. Fair Value Measurements”
below).
|
On September 1, 2016, in connection with the Alphatec International Acquisition, we entered into a Credit, Security and Guaranty Agreement (the “Credit Agreement”) with Alphatec and Alphatec Spine, Inc. (“Alphatec Spine” and together with Alphatec, the “Alphatec Borrowers”), pursuant to which we made available to the Alphatec Borrowers a senior secured term loan facility in an amount not to exceed
$30.0 million
. On the Closing Date, we made an initial loan of
$25.0 million
and the Alphatec Borrowers issued a note for such amount to us. On December 20, 2016, the remaining
$5.0 million
was drawn by the Alphatec Borrowers and added to the note.
The Credit Agreement contains customary operational and financial covenants, including a fixed charge coverage ratio to be maintained by the Alphatec Borrowers, and provides us with a security interest in all of the assets of the Alphatec Borrowers. The Credit Agreement has a scheduled maturity date
five
years from the Closing Date. The term loan interest rate for the first two years following the Closing Date will be priced at the London Interbank Offered Rate (“
LIBOR
”) plus
8.0%
, subject to a
9.5%
floor. The term loan interest rate thereafter will be LIBOR plus
13.0%
.
Interest accrues on the note receivable based on the contractual terms of the note. We consider a note to be impaired when, based on current information or factors (such as payment history, value of collateral and assessment of the borrower’s current creditworthiness), it is probable that the principal and interest
92
GLOBUS MEDICAL, INC. AND SUBSIDIARIES
NOTES TO CONSOLIDATED FINANCIAL STATEMENTS (Continued)
payments will not be collected according to the note agreement. As of
December 31, 2016
, we do not consider this note to be impaired. We believe that the note’s carrying value approximates its fair value.
A summary of intangible assets is presented below:
|
December 31, 2016
|
|||||||||||||
|
(In thousands)
|
Weighted-
Average Amortization Period (in years) |
Gross
Carrying Amount |
Accumulated Amortization
|
Intangible
Assets, net |
|||||||||
|
In-process research & development
|
—
|
$
|
20,460
|
|
$
|
—
|
|
$
|
20,460
|
|
|||
|
Supplier network
|
10.0
|
4,000
|
|
(867
|
)
|
3,133
|
|
||||||
|
Customer relationships & other intangibles
|
6.8
|
40,936
|
|
(5,201
|
)
|
35,735
|
|
||||||
|
Patents
|
16.1
|
3,035
|
|
(657
|
)
|
2,378
|
|
||||||
|
Total intangible assets
|
$
|
68,431
|
|
$
|
(6,725
|
)
|
$
|
61,706
|
|
||||
|
December 31, 2015
|
|||||||||||||
|
(In thousands)
|
Weighted-
Average Amortization Period (in years) |
Gross
Carrying Amount |
Accumulated Amortization
|
Intangible
Assets, net |
|||||||||
|
In-process research & development
|
—
|
$
|
24,560
|
|
$
|
—
|
|
$
|
24,560
|
|
|||
|
Supplier network
|
10.0
|
4,000
|
|
(467
|
)
|
3,533
|
|
||||||
|
Customer relationships & other intangibles
|
7.3
|
5,525
|
|
(2,384
|
)
|
3,141
|
|
||||||
|
Patents
|
17.0
|
2,495
|
|
(487
|
)
|
2,008
|
|
||||||
|
Total intangible assets
|
$
|
36,580
|
|
$
|
(3,338
|
)
|
$
|
33,242
|
|
||||
During 2016, we recorded an impairment charge of
$3.5 million
related to
one
of our IPR&D projects as a component of acquisition related costs. We used
a discounted future cash flow analysis to determine the
f
air value used to determine the impairment charge.
93
GLOBUS MEDICAL, INC. AND SUBSIDIARIES
NOTES TO CONSOLIDATED FINANCIAL STATEMENTS (Continued)
For intangible assets subject to amortization as of
December 31, 2016
, the following is the expected future amortization:
|
(In thousands)
|
Annual Amortization
|
|||
|
Year ending December 31:
|
||||
|
2017
|
$
|
6,889
|
|
|
|
2018
|
6,338
|
|
||
|
2019
|
6,200
|
|
||
|
2020
|
5,934
|
|
||
|
2021
|
5,698
|
|
||
|
Thereafter
|
10,187
|
|
||
|
Total
|
$
|
41,246
|
|
|
The composition of our short-term and long-term marketable securities is as follows:
|
December 31, 2016
|
|||||||||||||||||
|
(In thousands)
|
Contractual Maturity
(in years)
|
Amortized Cost
|
Gross Unrealized Gains
|
Gross Unrealized Losses
|
Fair Value
|
||||||||||||
|
Short-term:
|
|||||||||||||||||
|
Municipal bonds
|
Less than 1
|
$
|
114,826
|
|
$
|
2
|
|
$
|
(88
|
)
|
$
|
114,740
|
|
||||
|
Corporate debt securities
|
Less than 1
|
36,020
|
|
21
|
|
(4
|
)
|
36,037
|
|
||||||||
|
Commercial paper
|
Less than 1
|
6,898
|
|
—
|
|
(2
|
)
|
6,896
|
|
||||||||
|
Total short-term marketable securities
|
$
|
157,744
|
|
$
|
23
|
|
$
|
(94
|
)
|
$
|
157,673
|
|
|||||
|
Long-term:
|
|||||||||||||||||
|
Municipal bonds
|
1-2
|
$
|
30,207
|
|
$
|
—
|
|
$
|
(137
|
)
|
$
|
30,070
|
|
||||
|
Corporate debt securities
|
1-2
|
15,278
|
|
9
|
|
(40
|
)
|
15,247
|
|
||||||||
|
Asset backed securities
|
1-2
|
10,146
|
|
6
|
|
(1
|
)
|
10,151
|
|
||||||||
|
Securities of U.S. government-sponsored agencies
|
1-2
|
5,002
|
|
—
|
|
(26
|
)
|
4,976
|
|
||||||||
|
Total long-term marketable securities
|
$
|
60,633
|
|
$
|
15
|
|
$
|
(204
|
)
|
$
|
60,444
|
|
|||||
94
GLOBUS MEDICAL, INC. AND SUBSIDIARIES
NOTES TO CONSOLIDATED FINANCIAL STATEMENTS (Continued)
|
December 31, 2015
|
|||||||||||||||||
|
(In thousands)
|
Contractual Maturity
(in years)
|
Amortized Cost
|
Gross Unrealized Gains
|
Gross Unrealized Losses
|
Fair Value
|
||||||||||||
|
Short-term:
|
|||||||||||||||||
|
Municipal bonds
|
Less than 1
|
$
|
108,402
|
|
$
|
15
|
|
$
|
(81
|
)
|
$
|
108,336
|
|
||||
|
Corporate debt securities
|
Less than 1
|
53,759
|
|
2
|
|
(57
|
)
|
53,704
|
|
||||||||
|
Commercial paper
|
Less than 1
|
42,149
|
|
3
|
|
(1
|
)
|
42,151
|
|
||||||||
|
Securities of U.S. government-sponsored agencies
|
Less than 1
|
14,511
|
|
4
|
|
(4
|
)
|
14,511
|
|
||||||||
|
Asset backed securities
|
Less than 1
|
2,175
|
|
—
|
|
—
|
|
2,175
|
|
||||||||
|
Total short-term marketable securities
|
$
|
220,996
|
|
$
|
24
|
|
$
|
(143
|
)
|
$
|
220,877
|
|
|||||
|
Long-term:
|
|||||||||||||||||
|
Municipal bonds
|
1-2
|
$
|
18,508
|
|
$
|
—
|
|
$
|
(25
|
)
|
$
|
18,483
|
|
||||
|
Corporate debt securities
|
1-2
|
12,033
|
|
—
|
|
(25
|
)
|
12,008
|
|
||||||||
|
Asset backed securities
|
1-2
|
18,294
|
|
—
|
|
(23
|
)
|
18,271
|
|
||||||||
|
Total long-term marketable securities
|
$
|
48,835
|
|
$
|
—
|
|
$
|
(73
|
)
|
$
|
48,762
|
|
|||||
Under the accounting for fair value measurements and disclosures, fair value is defined as the price that would be received for an asset or paid to transfer a liability (an exit price) in the principal or most advantageous market for the asset or the liability in an orderly transaction between market participants on the measurement date. Additionally, a fair value hierarchy was established that prioritizes the inputs to valuation techniques used to measure fair value. The hierarchy gives the highest priority to unadjusted quoted prices in active markets for identical assets and liabilities and the lowest priority to unobservable inputs. The level within the fair value hierarchy is based on the lowest level of any input that is significant to the fair value measurement.
Our assets and liabilities measured at fair value on a recurring basis are classified and disclosed in one of the following three categories:
Level 1—quoted prices (unadjusted) in active markets for identical assets and liabilities;
Level 2—observable inputs other than quoted prices in active markets for identical assets and liabilities; and
Level 3—unobservable inputs in which there is little or no market data available, which require the reporting entity to use significant unobservable inputs or valuation techniques.
95
GLOBUS MEDICAL, INC. AND SUBSIDIARIES
NOTES TO CONSOLIDATED FINANCIAL STATEMENTS (Continued)
The fair value of our assets and liabilities measured at fair value on a recurring basis was as follows:
|
Balance at
|
|||||||||||||||
|
(In thousands)
|
December 31,
2016 |
Level 1
|
Level 2
|
Level 3
|
|||||||||||
|
Assets
|
|||||||||||||||
|
Cash equivalents
|
$
|
76,157
|
|
$
|
957
|
|
$
|
75,200
|
|
$
|
—
|
|
|||
|
Municipal bonds
|
144,810
|
|
—
|
|
144,810
|
|
—
|
|
|||||||
|
Corporate debt securities
|
51,284
|
|
—
|
|
51,284
|
|
—
|
|
|||||||
|
Commercial paper
|
6,896
|
|
—
|
|
6,896
|
|
—
|
|
|||||||
|
Asset-backed securities
|
10,151
|
|
—
|
|
10,151
|
|
—
|
|
|||||||
|
Securities of U.S. government-sponsored agencies
|
4,976
|
|
—
|
|
4,976
|
|
—
|
|
|||||||
|
Liabilities
|
|||||||||||||||
|
Contingent consideration
|
19,849
|
|
—
|
|
—
|
|
19,849
|
|
|||||||
|
Balance at
|
|||||||||||||||
|
(In thousands)
|
December 31,
2015 |
Level 1
|
Level 2
|
Level 3
|
|||||||||||
|
Assets
|
|||||||||||||||
|
Cash equivalents
|
$
|
12,700
|
|
$
|
1,701
|
|
$
|
10,999
|
|
$
|
—
|
|
|||
|
Municipal bonds
|
126,819
|
|
—
|
|
126,819
|
|
—
|
|
|||||||
|
Corporate debt securities
|
65,712
|
|
—
|
|
65,712
|
|
—
|
|
|||||||
|
Commercial paper
|
42,151
|
|
—
|
|
42,151
|
|
—
|
|
|||||||
|
Asset-backed securities
|
20,446
|
|
—
|
|
20,446
|
|
—
|
|
|||||||
|
Securities of U.S. government-sponsored agencies
|
14,511
|
|
—
|
|
14,511
|
|
—
|
|
|||||||
|
Liabilities
|
|||||||||||||||
|
Contingent consideration
|
26,617
|
|
—
|
|
—
|
|
26,617
|
|
|||||||
Our marketable securities are classified as Level 2 within the fair value hierarchy, as we measure their fair value using market prices for similar instruments and inputs such as actual trade data, benchmark yields, broker/dealer quotes and other similar data obtained from quoted market prices or independent pricing vendors.
Assets and Liabilities That Are Measured at Fair Value on a Nonrecurring Basis
The purchase price of business acquisitions is primarily allocated to the tangible and identifiable intangible assets acquired and liabilities assumed based on their estimated fair values on the acquisition dates, with the excess recorded as goodwill. We utilize Level 3 inputs in the determination of the initial fair value. Non-financial assets such as goodwill, intangible assets, and property, plant, and equipment are subsequently measured at fair value when there is an indicator of impairment and recorded at fair value only when an impairment is recognized. We assess the impairment of intangible assets annually or whenever events or changes in circumstances indicate that the carrying amount of an intangible asset may not be recoverable. The fair value of our goodwill and intangible assets is not estimated if there is no change in events or circumstances that indicate the carrying amount of an intangible asset may not be recoverable.
96
GLOBUS MEDICAL, INC. AND SUBSIDIARIES
NOTES TO CONSOLIDATED FINANCIAL STATEMENTS (Continued)
Contingent consideration represents our contingent milestone, performance and revenue-sharing payment obligations related to our acquisitions and is measured at fair value, based on significant inputs not observable in the market, which represents a Level 3 measurement within the fair value hierarchy. The valuation of contingent consideration uses assumptions we believe would be made by a market participant. We assess these estimates on an ongoing basis as additional data impacting the assumptions is obtained. The balances of the fair value of contingent consideration are recognized within business acquisition liabilities on our consolidated balance sheets, and the changes in the fair value of contingent consideration are recognized within acquisition related costs in the consolidated statements of income.
The recurring Level 3 fair value measurements of our contingent consideration liabilities include the following significant unobservable inputs:
|
Fair Value at
|
||||||||||||||
|
(In thousands)
|
December 31,
2016 |
Valuation technique
|
Unobservable input
|
Range
|
||||||||||
|
Discount rate
|
3.1
|
%
|
-
|
8.5
|
%
|
|||||||||
|
Revenue-based payments
|
$
|
15,218
|
|
Discounted cash flow
|
Probability of payment
|
87.0
|
%
|
-
|
97.5
|
%
|
||||
|
Projected year of payment
|
2017
|
|
-
|
2029
|
|
|||||||||
|
Discount rate
|
5.3
|
%
|
-
|
13.5
|
%
|
|||||||||
|
Milestone-based payments
|
$
|
4,631
|
|
Discounted cash flow
|
Probability of payment
|
80.0
|
%
|
-
|
100.0
|
%
|
||||
|
Projected year of payment
|
2016
|
|
-
|
2020
|
|
|||||||||
The following table provides a reconciliation of the beginning and ending balances of contingent payments associated with acquisitions during the years ended
December 31, 2016
and
December 31, 2015
:
|
Year Ended
|
||||||||
|
(In thousands)
|
December 31,
2016 |
December 31,
2015 |
||||||
|
Beginning balance
|
$
|
26,617
|
|
$
|
24,335
|
|
||
|
Purchase price contingent consideration
|
—
|
|
—
|
|
||||
|
Contingent payments
|
(5,002
|
)
|
(836
|
)
|
||||
|
Non-cash settlement of certain contingent consideration
|
(4,632
|
)
|
—
|
|
||||
|
Changes in fair value of contingent consideration
|
2,866
|
|
3,118
|
|
||||
|
Ending balance
|
$
|
19,849
|
|
$
|
26,617
|
|
||
During 2016, we recorded non-cash settlements of certain business acquisition liabilities of
$4.6 million
related to
two
of our previous acquisitions as a component of acquisition related costs.
97
GLOBUS MEDICAL, INC. AND SUBSIDIARIES
NOTES TO CONSOLIDATED FINANCIAL STATEMENTS (Continued)
|
(In thousands)
|
December 31, 2016
|
December 31, 2015
|
|||||
|
Raw materials
|
$
|
13,257
|
|
$
|
12,308
|
|
|
|
Work in process
|
10,747
|
|
7,091
|
|
|||
|
Finished goods
|
88,688
|
|
85,861
|
|
|||
|
Total
|
$
|
112,692
|
|
$
|
105,260
|
|
|
|
(In thousands)
|
Useful Life
|
December 31, 2016
|
December 31, 2015
|
|||||||
|
Land
|
—
|
$
|
8,271
|
|
$
|
8,254
|
|
|||
|
Buildings and improvements
|
30
|
22,225
|
|
19,809
|
|
|||||
|
Equipment
|
5-7
|
49,919
|
|
40,998
|
|
|||||
|
Instruments
|
3
|
173,668
|
|
147,961
|
|
|||||
|
Modules and cases
|
3
|
21,692
|
|
28,519
|
|
|||||
|
Other property and equipment
|
3-5
|
15,165
|
|
8,316
|
|
|||||
|
290,940
|
|
253,857
|
|
|||||||
|
Less: accumulated depreciation
|
(166,711
|
)
|
(139,114
|
)
|
||||||
|
Total
|
$
|
124,229
|
|
$
|
114,743
|
|
||||
Instruments are hand-held devices used by surgeons to install implants during surgery. Modules and cases are used to store and transport the instruments and implants.
Depreciation expense related to property and equipment was as follows:
|
Year Ended
|
||||||||||||
|
(In thousands)
|
December 31, 2016
|
December 31, 2015
|
December 31, 2014
|
|||||||||
|
Depreciation
|
$
|
35,293
|
|
$
|
22,522
|
|
$
|
21,044
|
|
|||
Included in the 2016 amount is
$5.5 million
related to amounts recognized in the current year related to the prior period adjustment. In addition, there was a
$2.1 million
impact to the current year activity due to the adjustment. For additional information regarding the prior period adjustment, please see
“Note 1. Background and Summary of Significant Accounting Policies; (b) Basis of Presentation”
above.
|
(In thousands)
|
December 31,
2016 |
December 31,
2015 |
|||||
|
Compensation and other employee-related costs
|
$
|
23,214
|
|
$
|
21,151
|
|
|
|
Legal and other settlements and expenses
|
734
|
|
13,617
|
|
|||
|
Accrued non-income taxes
|
6,946
|
|
6,808
|
|
|||
|
Royalties
|
4,671
|
|
6,787
|
|
|||
|
Other
|
10,836
|
|
5,406
|
|
|||
|
Total accrued expenses
|
$
|
46,401
|
|
$
|
53,769
|
|
|
The current year accrual for legal and other settlements and expenses, which includes accruals for settlement and verdict costs, decreased due primarily to the recognition of the Depuy Synthes Settlement
98
GLOBUS MEDICAL, INC. AND SUBSIDIARIES
NOTES TO CONSOLIDATED FINANCIAL STATEMENTS (Continued)
Agreement. For additional information regarding litigation, please refer to
“Note 15. Commitments and Contingencies”
below.
Line of Credit
In
May 2011
, we entered into a credit agreement with Wells Fargo Bank related to a revolving credit facility that provides for borrowings up to
$50.0 million
. At our request, and with the approval of the bank, the amount of borrowings available under the revolving credit facility can be increased to
$75.0 million
. The revolving credit facility includes up to a
$25.0 million
sub-limit for letters of credit. As amended to date, the revolving credit facility extends to
May 2017
. Cash advances bear interest at our option either at a fluctuating rate per annum equal to the daily
LIBOR
in effect for a
one
-month period plus
0.75%
, or a fixed rate for a
one
- or
three
-month period equal to
LIBOR
plus
0.75%
. The credit agreement governing the revolving credit facility also subjects us to various restrictive covenants, including the requirement to maintain maximum consolidated leverage. The covenants also include limitations on our ability to repurchase shares, to pay cash dividends or to enter into a sale transaction. As of
December 31, 2016
, we were in compliance with all financial covenants under the credit agreement, there were
no
outstanding borrowings under the revolving credit facility and available borrowings were
$50.0 million
. We may terminate the credit agreement at any time on
ten
days’ notice without premium or penalty.
Our amended and restated Certificate of Incorporation provides for a total of
785,000,000
authorized shares of common stock. Of the authorized number of shares of common stock,
500,000,000
shares are designated as Class A common stock (“Class A Common”),
275,000,000
shares are designated as Class B common stock (“Class B Common”) and
10,000,000
shares are designated as Class C common stock (“Class C Common”).
The holders of Class A Common are entitled to
one
vote for each share of Class A Common held. The holders of Class B Common are entitled to
10
votes for each share of Class B Common held. The holders of Class A Common and Class B Common vote together as one class of common stock. The Class C Common is nonvoting. Except for voting rights, the Class A Common, Class B Common and Class C Common have the same rights and privileges.
Our issued and outstanding common shares by Class were as follows:
|
(Shares)
|
Class A Common
|
Class B
Common
|
Total
|
|||||
|
December 31, 2016
|
72,052,360
|
|
23,877,556
|
|
95,929,916
|
|
||
|
December 31, 2015
|
71,442,166
|
|
23,877,556
|
|
95,319,722
|
|
||
The tables below present the changes in each component of accumulated other comprehensive loss, including current period other comprehensive loss and reclassifications out of accumulated other comprehensive loss:
99
GLOBUS MEDICAL, INC. AND SUBSIDIARIES
NOTES TO CONSOLIDATED FINANCIAL STATEMENTS (Continued)
|
(In thousands)
|
Unrealized loss on marketable securities, net of tax
|
Foreign currency translation adjustments
|
Accumulated other comprehensive loss
|
||||||||||
|
Accumulated other comprehensive loss, net of tax, at December 31, 2014
|
$
|
(64
|
)
|
$
|
(1,593
|
)
|
$
|
(1,657
|
)
|
||||
|
Other comprehensive loss before reclassifications
|
(67
|
)
|
(246
|
)
|
(313
|
)
|
|||||||
|
Amounts reclassified from accumulated other comprehensive loss, net of tax
|
12
|
|
—
|
|
12
|
|
|||||||
|
Other comprehensive loss, net of tax
|
(55
|
)
|
(246
|
)
|
(301
|
)
|
|||||||
|
Accumulated other comprehensive loss, net of tax, at December 31, 2015
|
(119
|
)
|
(1,839
|
)
|
(1,958
|
)
|
|||||||
|
Other comprehensive loss before reclassifications
|
(74
|
)
|
(6,636
|
)
|
(6,710
|
)
|
|||||||
|
Amounts reclassified from accumulated other comprehensive loss, net of tax
|
26
|
|
—
|
|
26
|
|
|||||||
|
Other comprehensive loss, net of tax
|
(48
|
)
|
(6,636
|
)
|
(6,684
|
)
|
|||||||
|
Accumulated other comprehensive loss, net of tax, at December 31, 2016
|
$
|
(167
|
)
|
$
|
(8,475
|
)
|
$
|
(8,642
|
)
|
||||
Amounts reclassified from accumulated other comprehensive loss, net of tax, related to unrealized gains/losses on marketable securities were released to other income, net in our consolidated statements of income.
The increase in foreign currency translation loss during the year ended December 31, 2016 is primarily due to the translation, since the acquisition date, of the net assets acquired in the Alphatec International acquisition for those entities whose functional currency and net assets are not denominated in U.S. dollars.
We have
three
stock plans: our Amended and Restated 2003 Stock Plan, our 2008 Stock Plan, and our 2012 Equity Incentive Plan (the “2012 Plan”). The 2012 Plan is the only remaining active stock plan. The purpose of these stock plans was, and the 2012 Plan is, to provide incentive to employees, directors, and consultants of Globus. The Plans are administered by the Board of Directors of Globus (the “Board”) or its delegates. The number, type of option, exercise price, and vesting terms are determined by the Board or its delegates in accordance with the terms of the Plans. The options granted expire on a date specified by the Board, but generally not more than
ten
years from the grant date. Option grants to employees generally vest in varying installments over a
four
-year period.
The 2012 Plan was approved by our Board in March 2012, and by our stockholders in June 2012. Under the 2012 Plan, the aggregate number of shares of Class A Common stock that may be issued subject to options and other awards is equal to the sum of (i)
3,076,923
shares, (ii) any shares available for issuance under the 2008 Plan as of March 13, 2012, (iii) any shares underlying awards outstanding under the 2008 Plan as of March 13, 2012 that, on or after that date, are forfeited, terminated, expired or lapse for any reason, or are settled for cash without delivery of shares and (iv) starting January 1, 2013, an annual increase in the number of shares available under the 2012 Plan equal to up to
3%
of the number of shares of our common and preferred stock outstanding at the end of the previous year, as determined by our Board. The number of shares that may be issued or transferred pursuant to incentive stock options under the 2012 Plan is limited to
10,769,230
shares. The shares of Class A Common stock covered by the 2012 Plan include authorized but unissued shares, treasury shares or shares of common stock purchased on the open market.
As of
December 31, 2016
, pursuant to the 2012 Plan, there were
12,009,496
shares of Class A Common stock reserved and
4,721,737
shares of Class A Common stock available for future grants.
100
GLOBUS MEDICAL, INC. AND SUBSIDIARIES
NOTES TO CONSOLIDATED FINANCIAL STATEMENTS (Continued)
The weighted average grant date per share fair values of the options awarded to employees were as follows:
|
Year Ended
|
||||||||||||
|
December 31,
2016 |
December 31,
2015 |
December 31,
2014 |
||||||||||
|
Weighted average grant date per share fair value
|
$
|
7.62
|
|
$
|
8.63
|
|
$
|
9.63
|
|
|||
The fair value of the options was estimated on the date of the grant using a Black-Scholes option pricing model with the following assumptions:
|
Year Ended
|
|||||||||||||||||
|
December 31,
2016 |
December 31,
2015 |
December 31,
2014 |
|||||||||||||||
|
Risk-free interest rate
|
1.03
|
%
|
-
|
2.01
|
%
|
1.39
|
%
|
-
|
2.11
|
%
|
1.51
|
%
|
-
|
1.95
|
%
|
||
|
Expected term (years)
|
5.8
|
-
|
6.5
|
5.1
|
-
|
9.9
|
5.3
|
-
|
6.4
|
||||||||
|
Expected volatility
|
28.0
|
%
|
-
|
29.0
|
%
|
29.0
|
%
|
-
|
38.0
|
%
|
35.0
|
%
|
-
|
41.0
|
%
|
||
|
Expected dividend yield
|
—%
|
—%
|
—%
|
||||||||||||||
Stock option activity during the years ended
December 31, 2016
,
2015
and
2014
is summarized as follows:
|
Option Shares (thousands)
|
Weighted average exercise price
|
Weighted average remaining contractual life (years)
|
Aggregate intrinsic value (thousands)
|
|||||||||
|
Outstanding at December 31, 2013
|
4,886
|
|
$
|
10.04
|
|
|||||||
|
Granted
|
1,495
|
|
23.45
|
|
||||||||
|
Exercised
|
(1,263
|
)
|
7.71
|
|
||||||||
|
Forfeited
|
(264
|
)
|
15.33
|
|
||||||||
|
Outstanding at December 31, 2014
|
4,854
|
|
14.50
|
|
||||||||
|
Granted
|
2,828
|
|
24.69
|
|
||||||||
|
Exercised
|
(614
|
)
|
8.92
|
|
||||||||
|
Forfeited
|
(391
|
)
|
17.84
|
|
||||||||
|
Outstanding at December 31, 2015
|
6,677
|
|
19.14
|
|
||||||||
|
Granted
|
2,309
|
|
24.22
|
|
||||||||
|
Exercised
|
(610
|
)
|
9.63
|
|
||||||||
|
Forfeited
|
(635
|
)
|
23.10
|
|
||||||||
|
Outstanding at December 31, 2016
|
7,741
|
|
21.08
|
|
7.6
|
$
|
30,608
|
|
||||
|
Exercisable at December 31, 2016
|
3,512
|
|
17.38
|
|
6.2
|
26,533
|
|
|||||
|
Expected to vest at December 31, 2016
|
4,229
|
|
$
|
24.15
|
|
8.7
|
$
|
4,074
|
|
|||
We use the Black Scholes pricing model to determine the fair value of our stock options (see
“Note 1. Background and Summary of Significant Accounting Policies, (q) Stock-Based Compensation”
above).
Compensation expense related to stock options granted to employees and non-employees under the Plans and the intrinsic value of stock options exercised was as follows:
101
GLOBUS MEDICAL, INC. AND SUBSIDIARIES
NOTES TO CONSOLIDATED FINANCIAL STATEMENTS (Continued)
|
Year Ended
|
||||||||||||
|
(In thousands)
|
December 31,
2016 |
December 31,
2015 |
December 31,
2014 |
|||||||||
|
Intrinsic value of stock options exercised
|
$
|
8,824
|
|
$
|
9,984
|
|
$
|
20,216
|
|
|||
|
Stock-based compensation expense
|
$
|
11,382
|
|
$
|
9,639
|
|
$
|
7,111
|
|
|||
|
Net stock-based compensation capitalized into inventory
|
270
|
|
221
|
|
—
|
|
||||||
|
Total stock-based compensation cost
|
$
|
11,652
|
|
$
|
9,860
|
|
$
|
7,111
|
|
|||
As of
December 31, 2016
, there was
$28.4 million
of unrecognized compensation expense related to unvested employee stock options that vest over a weighted average period of
three
years.
The components of income before income taxes are as follows:
|
Year ended
|
||||||||||||
|
(In thousands)
|
December 31, 2016
|
December 31, 2015
|
December 31, 2014
|
|||||||||
|
Domestic
|
$
|
154,377
|
|
$
|
171,278
|
|
$
|
137,643
|
|
|||
|
Foreign
|
2,902
|
|
1,527
|
|
999
|
|
||||||
|
Total
|
$
|
157,279
|
|
$
|
172,805
|
|
$
|
138,642
|
|
|||
The components of the provision for income taxes are as follows:
|
Year ended
|
||||||||||||
|
(In thousands)
|
December 31, 2016
|
December 31, 2015
|
December 31, 2014
|
|||||||||
|
Current:
|
||||||||||||
|
Federal
|
$
|
51,785
|
|
$
|
45,813
|
|
$
|
43,561
|
|
|||
|
State
|
4,533
|
|
7,193
|
|
6,097
|
|
||||||
|
Foreign
|
748
|
|
673
|
|
519
|
|
||||||
|
57,066
|
|
53,679
|
|
50,177
|
|
|||||||
|
Deferred:
|
||||||||||||
|
Federal
|
(4,527
|
)
|
5,926
|
|
(3,630
|
)
|
||||||
|
State
|
204
|
|
480
|
|
(357
|
)
|
||||||
|
Foreign
|
195
|
|
(64
|
)
|
(33
|
)
|
||||||
|
(4,128
|
)
|
6,342
|
|
(4,020
|
)
|
|||||||
|
Total
|
$
|
52,938
|
|
$
|
60,021
|
|
$
|
46,157
|
|
|||
102
GLOBUS MEDICAL, INC. AND SUBSIDIARIES
NOTES TO CONSOLIDATED FINANCIAL STATEMENTS (Continued)
A reconciliation of the statutory U.S. federal tax rate to our effective rate is as follows:
|
Year ended
|
|||||||||
|
December 31, 2016
|
December 31, 2015
|
December 31, 2014
|
|||||||
|
Statutory U.S. federal tax rate
|
35.0
|
%
|
35.0
|
%
|
35.0
|
%
|
|||
|
State income taxes, net of federal benefit
|
2.2
|
|
3.0
|
|
2.6
|
|
|||
|
Domestic production activities deduction
|
(2.7
|
)
|
(2.6
|
)
|
(2.7
|
)
|
|||
|
Tax credits
|
(1.3
|
)
|
(0.9
|
)
|
(1.2
|
)
|
|||
|
Nondeductible expenses
|
0.5
|
|
0.3
|
|
0.7
|
|
|||
|
Other
|
—
|
|
(0.1
|
)
|
(1.1
|
)
|
|||
|
Effective tax rate
|
33.7
|
%
|
34.7
|
%
|
33.3
|
%
|
|||
Deferred income taxes reflect the tax effects of temporary differences between the basis of assets and liabilities recognized for financial reporting purposes and tax purposes. Significant components of our deferred income taxes are as follows:
|
(In thousands)
|
December 31, 2016
|
December 31, 2015
|
||||||
|
Deferred tax assets:
|
||||||||
|
Inventory reserve
|
$
|
31,202
|
|
$
|
26,741
|
|
||
|
Accruals, reserves, and other currently not deductible
|
13,269
|
|
13,333
|
|
||||
|
Stock-based compensation
|
10,595
|
|
8,014
|
|
||||
|
Foreign net operating loss carryforwards
|
227
|
|
329
|
|
||||
|
Total deferred tax assets
|
55,293
|
|
48,417
|
|
||||
|
Valuation allowance
|
(83
|
)
|
(43
|
)
|
||||
|
Total deferred tax assets, net of valuation allowance
|
55,210
|
|
48,374
|
|
||||
|
Deferred tax liabilities:
|
||||||||
|
Depreciation and amortization
|
(32,448
|
)
|
(22,666
|
)
|
||||
|
Total deferred tax liabilities
|
(32,448
|
)
|
(22,666
|
)
|
||||
|
Net deferred tax assets
|
$
|
22,762
|
|
$
|
25,708
|
|
||
In assessing the realizability of deferred tax assets, management considers whether it is more likely than not that some portion or all of the deferred tax assets will not be realized. The ultimate realization of deferred tax assets is dependent upon the generation of future taxable income during the periods in which those temporary differences become deductible. Based upon the level of historical taxable income and projections for future taxable income over the periods in which the deferred tax assets are deductible, management believes it is more likely than not that we will realize the benefits of these deductible differences at
December 31, 2016
. The amount of the deferred tax asset considered realizable, however, could be reduced in the near term if estimates of future taxable income during the carryforward period are reduced. Of the amounts presented above
,
$0.3 million
of long-term deferred tax assets is included as a component of other assets on our consolidated balance sheet as of
December 31, 2015
.
103
GLOBUS MEDICAL, INC. AND SUBSIDIARIES
NOTES TO CONSOLIDATED FINANCIAL STATEMENTS (Continued)
A reconciliation of the beginning and ending amount of unrecognized tax benefits is as follows:
|
Year ended
|
||||||||||||
|
(In thousands)
|
December 31, 2016
|
December 31, 2015
|
December 31, 2014
|
|||||||||
|
Unrecognized tax benefits at the beginning of the year
|
$
|
1,575
|
|
$
|
3,228
|
|
$
|
3,978
|
|
|||
|
Additions related to current year tax positions
|
—
|
|
316
|
|
—
|
|
||||||
|
Additions related to prior year tax positions
|
287
|
|
261
|
|
614
|
|
||||||
|
Reductions related to prior year tax positions
|
—
|
|
(2,230
|
)
|
(209
|
)
|
||||||
|
Lapse of statute of limitations
|
—
|
|
—
|
|
(202
|
)
|
||||||
|
Settlements
|
—
|
|
—
|
|
(953
|
)
|
||||||
|
Unrecognized tax benefits at the end of the year
|
$
|
1,862
|
|
$
|
1,575
|
|
$
|
3,228
|
|
|||
The impact of our unrecognized tax benefits to the effective income tax rate is as follows:
|
(In thousands)
|
December 31, 2016
|
December 31, 2015
|
December 31, 2014
|
|||||||||
|
Portion of total unrecognized tax benefits that, if recognized, would affect the effective income tax rate
|
$
|
1,542
|
|
$
|
1,335
|
|
$
|
838
|
|
|||
We have not recorded income taxes on the undistributed earnings of our foreign subsidiaries based upon our intention to indefinitely reinvest undistributed earnings to ensure sufficient working capital and further expansion of existing operations outside the United States. The undistributed earnings of our foreign subsidiaries as of December 31, 2016 are immaterial. In the event we are required to repatriate funds from outside of the United States, such repatriation may be subject to local laws, customs, and tax consequences.
Interest and penalties are recorded in the statement of income as provision for income taxes. The total interest and penalties recorded in the statement of income was nominal for the years ended
December 31, 2016
,
2015
and
2014
. Our uncertain tax benefits could increase in the next twelve months as we continue our current transfer pricing policies. We do not expect a significant change in our uncertain tax benefits in the next twelve months. In 2014, we settled the IRS audits of 2011 and 2012 tax years, resulting in no adjustments. We are subject to federal income tax as well as income tax of multiple state and foreign jurisdictions. With few exceptions, we are no longer subject to income tax examination by tax authorities in major jurisdictions for years prior to 2011 as of
December 31, 2016
.
On December 18, 2015 the Protecting Americans from Tax Hikes Act of 2015 (the “PATH”) was signed into law. One of the provisions of PATH was the permanent extension of Internal Revenue Code section 41 research and development tax credit. As of December 31, 2015 a benefit was recognized for this tax credit and is included in the 2015 tax provision.
On December 19, 2014, the Tax Increase Prevention Act of 2014 (the “TIPA”) was signed into law. One of the provisions of the TIPA was the reinstatement of the research and experimentation tax credit from January 1, 2014 through December 31, 2014. As of December 31, 2014 a benefit was recognized for this tax credit and is included in the 2014 tax provision.
104
GLOBUS MEDICAL, INC. AND SUBSIDIARIES
NOTES TO CONSOLIDATED FINANCIAL STATEMENTS (Continued)
The Company leases certain equipment and facilities under operating leases. As of
December 31, 2016
, minimum future rental payments under operating leases for each of the next five years are as follows:
|
(In thousands)
|
||||
|
Year ending December 31:
|
||||
|
2017
|
$
|
1,412
|
|
|
|
2018
|
795
|
|
||
|
2019
|
1,108
|
|
||
|
2020
|
74
|
|
||
|
2021
|
7
|
|
||
|
Thereafter
|
—
|
|
||
|
Total
|
$
|
3,396
|
|
|
Rent expense related to all operating leases recognized as a component of selling, general and administrative expenses was as follows:
|
Year ended
|
||||||||||||
|
(In thousands)
|
December 31, 2016
|
December 31, 2015
|
December 31, 2014
|
|||||||||
|
Rent expense
|
$
|
1,500
|
|
$
|
1,113
|
|
$
|
676
|
|
|||
We are involved in a number of proceedings, legal actions, and claims. Such matters are subject to many uncertainties, and the outcomes of these matters are not within our control and may not be known for prolonged periods of time. In some actions, the claimants seek damages, as well as other relief, including injunctions prohibiting us from engaging in certain activities, which, if granted, could require significant expenditures and/or result in lost revenues. We record a liability in the consolidated financial statements for these actions when a loss is known or considered probable and the amount can be reasonably estimated. If the reasonable estimate of a known or probable loss is a range, and no amount within the range is a better estimate than any other, the minimum amount of the range is accrued. If a loss is possible but not known or probable, and can be reasonably estimated, the estimated loss or range of loss is disclosed. In most cases, significant judgment is required to estimate the amount and timing of a loss to be recorded. While it is not possible to predict the outcome for most of the matters discussed, we believe it is possible that costs associated with them could have a material adverse impact on our consolidated earnings, financial position or cash flows.
N-Spine, Synthes and Depuy Synthes Litigation
In April 2010, N-Spine, Inc. and Synthes USA Sales, LLC filed suit against us in the U.S. District Court for the District of Delaware for patent infringement. N-Spine, the patent owner, and Synthes USA, a licensee of the subject patent, allege that we infringe
one
or more claims of the patent by making, using, offering for sale or selling our TRANSITION
®
stabilization system product. N-Spine and Synthes USA sought injunctive relief and an unspecified amount in damages. This matter was one of the
four
patent
105
GLOBUS MEDICAL, INC. AND SUBSIDIARIES
NOTES TO CONSOLIDATED FINANCIAL STATEMENTS (Continued)
infringement lawsuits concerning spinal implant technologies between Globus Medical, Inc. and DePuy Synthes settled on January 13, 2016 for
$7.9 million
.
In a related matter, on January 8, 2014, Depuy Synthes Products, LLC (“Depuy Synthes”) filed suit against us in the U.S. District Court for the District of Delaware for patent infringement. Depuy Synthes alleges that we infringe one or more claims of the asserted patent by making, using, offering for sale or selling our TRANSITION
®
stabilization system product. Depuy Synthes seeks injunctive relief and an unspecified amount in damages. This matter was one of the four patent infringement lawsuits concerning spinal implant technologies between Globus Medical, Inc. and DePuy Synthes settled on January 13, 2016 for
$7.9 million
.
Synthes USA, LLC, Synthes USA Products, LLC and Synthes USA Sales, LLC Litigation
In July 2011, Synthes USA, LLC, Synthes USA Products, LLC and Synthes USA Sales, LLC filed suit against us in the U.S. District Court for the District of Delaware for patent infringement. Synthes USA LLC, the patent owner, Synthes USA Products, LLC, a licensee to manufacture products of the subject patents, and Synthes USA Sales LLC, a licensee to sell products of the subject patents, allege that we infringe
one
or more claims of
three
patents by making, using, offering for sale or selling our COALITION
®
, INDEPENDENCE
®
and INTERCONTINENTAL
®
products. This matter was one of the four patent infringement lawsuits concerning spinal implant technologies between Globus Medical, Inc. and DePuy Synthes settled on January 13, 2016 for
$7.9 million
.
L5 Litigation
In December 2009, we filed suit in the Court of Common Pleas of Montgomery County, Pennsylvania against our former exclusive independent distributor L5 Surgical, LLC and its principals, seeking an injunction and declaratory judgment concerning certain restrictive covenants made to L5 by its sales representatives. L5 brought counterclaims against us alleging tortious interference, unfair competition and conspiracy. The injunction phase was resolved in September 2010, and this matter is now in the discovery phase of litigation on the underlying damages claims. We intend to defend our rights vigorously. The probable outcome of this litigation cannot be determined, nor can we estimate a range of potential loss. Therefore, in accordance with authoritative guidance on the evaluation of loss contingencies, we have not recorded an accrual related to this litigation.
Bianco Litigation
On March 21, 2012, Sabatino Bianco filed suit against us in the Federal District Court for the Eastern District of Texas claiming that we misappropriated his trade secret and confidential information and improperly utilized it in developing our CALIBER
®
product. Bianco alleges that we engaged in misappropriation of trade secrets, breach of contract, unfair competition, fraud and theft and seeks correction of inventorship, injunctive relief and exemplary damages. On April 20, 2012, Bianco filed a motion for a preliminary injunction, seeking to enjoin us from making, using, selling, importing or offering for sale our CALIBER
®
product. On November 15, 2012, the court denied Bianco’s motion for preliminary injunction. On October 1, 2013, Bianco amended his complaint to claim that his trade secrets and confidential information were also used improperly in developing our RISE
®
and CALIBER-L
®
products.
On January 17, 2014, the jury in this case returned a verdict in favor of Bianco on a claim of misappropriation of trade secret. We accrued the verdict amount of
$4.3 million
as of December 31, 2013. The jury found against Bianco on the claims of breach of contract and disgorgement of profits. The court
106
GLOBUS MEDICAL, INC. AND SUBSIDIARIES
NOTES TO CONSOLIDATED FINANCIAL STATEMENTS (Continued)
granted our motion for judgment as a matter of law and dismissed Bianco’s claims for unfair competition, fraud, and exemplary damages, and Bianco abandoned the claim of misappropriation of confidential information. Bianco’s claims of correction of inventorship, unjust enrichment, and permanent injunctive relief were not submitted to the jury. On March 7, 2014, the court denied Bianco’s claim for correction of inventorship and ruled he is not entitled to be named as a co-inventor on any of the patents at issue, and also denied his claim for unjust enrichment. On March 17, 2014, the court denied Bianco’s claim for permanent injunctive relief. On July 2, 2014, the court awarded Bianco an ongoing royalty of
5%
of the net sales of the CALIBER
®
, CALIBER
®
-L, and RISE
®
products, or products that are not colorably different from those products, for a
fifteen
year period on sales starting on January 18, 2014. The court entered final judgment on the jury verdict on July 17, 2014. On October 19, 2015, the United States Federal Circuit Court of Appeals affirmed the judgment without opinion. On March 22, 2016, we filed a Petition for a Writ of Certiorari with the United States Supreme Court and on June 20, 2016 the Writ was denied.
We do not expect the judgment to impact our ability to conduct our business or to have any material impact on our future revenues.
Bonutti Skeletal Innovations, LLC Litigation
On November 19, 2014, Bonutti Skeletal Innovations, LLC (“Bonutti Skeletal”) filed suit against us in the U.S. District Court for the Eastern District of Pennsylvania for patent infringement. Bonutti Skeletal, a non-practicing entity, alleges that Globus willfully infringes
one
or more claims of
six
patents by making, using, offering for sale or selling the CALIBER
®
, CALIBER
®
-L, COALITION
®
, CONTINENTAL
®
, FORGE
®
, FORTIFY
®
, INDEPENDENCE
®
, INTERCONTINENTAL
®
, MONUMENT
®
, NIKO
®
, RISE
®
, SIGNATURE
®
, SUSTAIN
®
, and TRANSCONTINENTAL
®
products. Bonutti Skeletal sought an unspecified amount in damages and injunctive relief. This matter was stayed on June 26, 2015 pending the resolution of
inter partes
reviews on the asserted patents by the USPTO. Globus Medical, Inc. and Bonutti Skeletal settled this matter on June 9, 2016.
Flexuspine, Inc. Litigation
On March 11, 2015, Flexuspine, Inc. filed suit against us in the U.S. District Court for the Eastern District of Texas for patent infringement. Flexuspine, Inc. alleged that Globus willfully infringed
one
or more claims of
five
patents by making, using, offering for sale or selling the CALIBER
®
, CALIBER
®
-L, and ALTERA
®
products. Flexuspine sought an unspecified amount in damages and injunctive relief. On August 19, 2016, the jury returned a verdict in our favor finding no infringement of the asserted patents by the CALIBER
®
, CALIBER
®
-L, and ALTERA
®
products. On November 1, 2016, plaintiff filed a notice of appeal to the United States Court of Appeals for the Federal Circuit. The probable outcome of this litigation cannot be determined, nor can we estimate a range of potential loss. Therefore, in accordance with authoritative guidance on the evaluation of loss contingencies, we have not recorded an accrual related to this litigation.
Stern Litigation
On February 17, 2016, Joseph D. Stern filed suit against us in the U.S. District Court for the District of Delaware for patent infringement. Stern alleges that Globus willfully infringes
one
or more claims of
three
patents by making, using, offering for sale or selling the XTEND
®
products. On October 10, 2016, Stern amended the accused products to further include our PROVIDENCE
®
, VIP
®
, UNIFY
®
, and ASSURE
®
107
GLOBUS MEDICAL, INC. AND SUBSIDIARIES
NOTES TO CONSOLIDATED FINANCIAL STATEMENTS (Continued)
products. Stern seeks an unspecified amount in damages and injunctive relief. The probable outcome of this litigation cannot be determined, nor can we estimate a range of potential loss. Therefore, in accordance with authoritative guidance on the evaluation of loss contingencies, we have not recorded an accrual related to this litigation.
Silverstein Litigation
On September 28, 2015, a putative securities class action lawsuit was filed against us and certain of our officers in the U.S. District Court for the Eastern District of Pennsylvania. Plaintiff in the lawsuit purported to represent a class of our stockholders who purchased shares between February 26, 2014 and August 5, 2014. The complaint purported to assert claims under Sections 10(b) and 20(a) of the Securities Exchange Act of 1934, as amended, and sought damages in an unspecified amount, attorney’s fees and other relief. This matter was dismissed with prejudice on August 26, 2016. On September 9, 2016, plaintiff’s motion for reconsideration was denied, and on September 13, 2016 plaintiff filed an appeal in the United States Court of Appeals for the Third Circuit.
In addition, we are subject to legal proceedings arising in the ordinary course of business.
We sponsor a 401(k) Plan covering all eligible U.S. employees. Under the 401(k) Plan, we make nondiscretionary matching contributions at the rate of
100%
of employee’s contributions up to a maximum annual contribution of
$6,000
per eligible employee, limited to
3%
of the employee’s compensation for the period.
Additionally, we contribute to various foreign retirement benefit plans required by local law or coordinated with government sponsored plans which cover many of our international employees.
The benefits offered under these plans are reflective of local customs and practices in the countries concerned.
Company contributions to these retirement plans were as follows:
|
Year ended
|
||||||||||||
|
(In thousands)
|
December 31, 2016
|
December 31, 2015
|
December 31, 2014
|
|||||||||
|
401(k) and other retirement plan contributions
|
$
|
2,772
|
|
$
|
2,303
|
|
$
|
2,185
|
|
|||
Prior to March 11, 2015, we had contracted with BMG, which at the time was a third-party manufacturer in which certain of our senior management and significant stockholders had ownership interests and leadership positions. On March 11, 2015, BMG was acquired by Globus, and therefore, as of the acquisition date, there were no further purchases from nor amounts due to BMG. For the periods ended March 11, 2015 and December 31, 2014, we purchased
$5.3 million
and
$21.9 million
, respectively, from the related-party supplier. The amount payable to BMG on the date of acquisition of
$5.2 million
was settled in connection with the acquisition.
108
GLOBUS MEDICAL, INC. AND SUBSIDIARIES
NOTES TO CONSOLIDATED FINANCIAL STATEMENTS (Continued)
Operating segments are defined as components of an enterprise for which separate financial information is available and evaluated regularly by the chief operating decision maker, or decision-making group, in deciding how to allocate resources and in assessing performance. We globally manage the business within
one
reportable segment. Segment information is consistent with how management reviews the business, makes investing and resource allocation decisions and assesses operating performance. Products are sold principally in the United States.
The following table represents total sales by geographic area, based on the location of the customer:
|
Year Ended
|
||||||||||||
|
(In thousands)
|
December 31,
2016 |
December 31,
2015 |
December 31,
2014 |
|||||||||
|
United States
|
$
|
500,226
|
|
$
|
498,191
|
|
$
|
427,091
|
|
|||
|
International
|
63,768
|
|
46,562
|
|
47,280
|
|
||||||
|
Total sales
|
$
|
563,994
|
|
$
|
544,753
|
|
$
|
474,371
|
|
|||
We classify our products into
two
categories: Innovative Fusion products and Disruptive Technology products. The following table represents total sales by product category:
|
Year Ended
|
||||||||||||
|
(In thousands)
|
December 31,
2016 |
December 31,
2015 |
December 31,
2014 |
|||||||||
|
Innovative Fusion
|
$
|
287,594
|
|
$
|
288,062
|
|
$
|
270,852
|
|
|||
|
Disruptive Technology
|
276,400
|
|
256,691
|
|
203,519
|
|
||||||
|
Total sales
|
$
|
563,994
|
|
$
|
544,753
|
|
$
|
474,371
|
|
|||
Reclassifications have been made to prior period reported gross profit amounts to conform to the current period presentation.
|
(unaudited)
|
||||||||||||||||
|
(In thousands, except per share amounts)
|
March 31,
2016 |
June 30,
2016 |
September 30,
2016 |
December 31,
2016 |
||||||||||||
|
Sales
|
$
|
139,264
|
|
$
|
137,489
|
|
$
|
135,651
|
|
$
|
151,590
|
|
||||
|
Gross profit
|
107,745
|
|
104,758
|
|
104,198
|
|
112,588
|
|
||||||||
|
Net income
|
28,010
|
|
25,806
|
|
26,227
|
|
24,298
|
|
||||||||
|
Net earnings per common share - basic
|
0.29
|
|
0.27
|
|
0.27
|
|
0.25
|
|
||||||||
|
Net earnings per common share - diluted
|
0.29
|
|
0.27
|
|
0.27
|
|
0.25
|
|
||||||||
|
(unaudited)
|
||||||||||||||||
|
(In thousands, except per share amounts)
|
March 31,
2015 |
June 30,
2015 |
September 30,
2015 |
December 31,
2015 |
||||||||||||
|
Sales
|
$
|
131,604
|
|
$
|
133,570
|
|
$
|
136,992
|
|
$
|
142,587
|
|
||||
|
Gross profit
|
99,592
|
|
101,116
|
|
104,065
|
|
107,647
|
|
||||||||
|
Net income
|
24,648
|
|
24,054
|
|
26,481
|
|
37,601
|
|
||||||||
|
Net earnings per common share - basic
|
0.26
|
|
0.25
|
|
0.28
|
|
0.39
|
|
||||||||
|
Net earnings per common share - diluted
|
0.26
|
|
0.25
|
|
0.28
|
|
0.39
|
|
||||||||
None.
Evaluation of Disclosure Controls and Procedures
Our disclosure controls and procedures (as defined in Rules 13a-15(e) and 15d-15(e) under the Securities Exchange Act of 1934, as amended) are designed to ensure that information required to be disclosed in the reports that we file or submit under the Exchange Act is recorded, processed, summarized and reported within the time periods specified in the rules and forms of the Securities and Exchange Commission and to ensure that information required to be disclosed is accumulated and communicated to management, including our principal executive officer and principal financial officer, to allow timely decisions regarding disclosure. The Chief Executive Officer (“CEO”) and the Chief Financial Officer (“CFO”) have reviewed the design
109
and effectiveness of our disclosure controls and procedures as of December 31, 2016 and, based on their evaluation, have concluded that the disclosure controls and procedures were not effective as of such date, due to a self-identified material weakness in our internal control over financial reporting related to the computation of non-cash activities in depreciation and scrap expense of instruments and cases.
Management’s Report on Internal Control over Financial Reporting
Management of Globus Medical, Inc. (“Globus”) is responsible for establishing and maintaining adequate internal control over financial reporting, as defined in Rule 13a-15(f) and Rule 15d-15(f) under the Exchange Act. Internal control over financial reporting is a process designed to provide reasonable, but not absolute, assurance regarding the reliability of financial reporting and the preparation of financial statements for external purposes in accordance with accounting principles generally accepted in the United States of America. A company’s internal control over financial reporting includes those policies and procedures that pertain to the maintenance of records that, in reasonable detail, accurately and fairly reflect the transactions and dispositions of the assets of the company; provide reasonable assurance that transactions are recorded as necessary to permit preparation of financial statements in accordance with accounting principles generally accepted in the United States of America, and that receipts and expenditures of the company are being made only in accordance with authorizations of management and directors of the company; and provide reasonable assurance regarding prevention or timely detection of unauthorized acquisition, use, or disposition of the company’s assets that could have a material effect on the financial statements.
Because of its inherent limitations, internal control over financial reporting may not prevent or detect misstatements. Also, projections of any evaluation of effectiveness to future periods are subject to the risk that controls may become inadequate because of changes in conditions, or that the degree of compliance with the policies or procedures may deteriorate.
Management evaluated the internal control over financial reporting of Globus as of December 31, 2016. In making this assessment, management used the criteria set forth by the Committee of Sponsoring Organizations of the Treadway Commission in Internal Control-Integrated Framework (2013) (“COSO”).
During our evaluation for the year ended December 31, 2016, we self-identified a material weakness in the computation of non-cash activities in depreciation and scrap expenses of instruments and cases. Rule 12b-2 of the Exchange Act defines a material weakness as “
a deficiency, or a combination of deficiencies, in internal control over financial reporting, such that there is a reasonable possibility that a material misstatement of the company's annual or interim financial statements will not be prevented or detected on a timely basis.
”
As a result of this assessment and based on the criteria in the COSO framework, management has concluded that, as of December 31, 2016, our internal controls over financial reporting were not effective. Notwithstanding the material weakness described above, and after performing additional procedures, management has concluded that no material errors in the financial results or balances identified resulted from the material weakness, and no restatements of prior period financial statements or adjustments in previously released financial results were required as a result of this material weakness.
110
Remediation Efforts to Address Material Weakness
Management has implemented remediation efforts to address this material weakness. These remediation efforts, summarized below, which are either implemented or in process, are intended to both address the identified material weakness and to enhance our overall control environment. Our plan includes the following steps:
|
•
|
recorded an updated depreciation and scrap methodology for instruments and cases included in December 31, 2016 financial statements
|
|
•
|
reviewed results using the updated methodology to validate the prior period adjustment
|
|
•
|
implementation of the new methodology within the fixed asset sub-ledger
|
|
•
|
additional account detail within the general ledger to provide added visibility to monitor amounts scrapped.
|
The material weakness will not be considered remediated until the applicable remedial controls operate for a sufficient period of time and management has concluded, through testing, that these controls are operating effectively. We expect that the remediation of this material weakness will be completed prior to December 31, 2017.
Report of Independent Registered Public Accounting Firm
Grant Thornton LLP, our independent registered public accounting firm, has audited the effectiveness of our internal control over financial reporting as of
December 31, 2016
as stated in its report that is included in Item 8 of this Form 10-K.
Changes in Internal Control over Financial Reporting
Other than with respect to the remediation efforts described above, there was no change in our internal control over financial reporting identified in connection with the evaluation required by Rule 13a-15(d) and 15d-15(d) of the Exchange Act that occurred during our most recent fiscal quarter that has materially affected, or is reasonably likely to materially affect, our internal control over financial reporting.
None.
111
Certain information required by Part III is omitted from this Annual Report and will be included in the definitive proxy statement for our
2017
annual meeting of stockholders, which will be filed within 120 days after the end of our fiscal year.
Code of Ethics
We have adopted a Code of Ethics for all employees, officers, directors, as well as a Code of Ethics specifically for our principal executive officer and senior financial officers, both of which are available on our website,
www.globusmedical.com
. We intend to disclose future amendments to, or waivers from, provisions of our Code of Ethics that apply to our Principal Executive Officer, Principal Financial Officer, Principal Accounting Officer, or Controller, or persons performing similar functions, within four business days of such amendment or waiver.
The other information required by this Item 10 will be set forth in the Company's proxy statement for its
2017
annual meeting of stockholders, which information is incorporated herein by reference.
The information required by this Item 11 will be set forth in the Company's proxy statement for its
2017
annual meeting of stockholders, which information is incorporated herein by reference.
The information required by this Item 12 will be set forth in the Company's proxy statement for its
2017
annual meeting of stockholders, which information is incorporated herein by reference.
The information required by this Item 13 will be set forth in the Company's proxy statement for its
2017
annual meeting of stockholders, which information is incorporated herein by reference.
The information required by this Item 14 will be set forth in the Company's proxy statement for its
2017
annual meeting of stockholders, which information is incorporated herein by reference.
112
(a) (1) Financial Statements
|
Page
|
|
|
Report of Independent Registered Public Accounting Firm
|
|
|
Consolidated Balance Sheets
|
|
|
Consolidated Statements of Income
|
|
|
Consolidated Statements of Comprehensive Income
|
|
|
Consolidated Statements of Equity
|
|
|
Consolidated Statements of Cash Flows
|
|
|
Notes to Consolidated Financial Statements
|
|
(a) (2) Financial Statement Schedules
SCHEDULE II. VALUATION ACCOUNTS AND QUALIFYING ACCOUNTS
Allowance for doubtful accounts:
|
(In thousands)
|
Beginning of period
|
Additions
|
Write-offs
|
End of period
|
|||||||||||
|
Year ended December 31, 2014
|
$
|
1,581
|
|
$
|
318
|
|
$
|
(252
|
)
|
$
|
1,647
|
|
|||
|
Year ended December 31, 2015
|
1,647
|
|
1,465
|
|
(599
|
)
|
2,513
|
|
|||||||
|
Year ended December 31, 2016
|
$
|
2,513
|
|
$
|
865
|
|
$
|
(607
|
)
|
$
|
2,771
|
|
|||
Deferred tax valuation allowance:
|
(In thousands)
|
Beginning of period
|
Additions
|
Write-offs
|
End of period
|
|||||||||||
|
Year ended December 31, 2014
|
$
|
327
|
|
$
|
—
|
|
$
|
(282
|
)
|
$
|
45
|
|
|||
|
Year ended December 31, 2015
|
45
|
|
—
|
|
(2
|
)
|
43
|
|
|||||||
|
Year ended December 31, 2016
|
$
|
43
|
|
$
|
40
|
|
$
|
—
|
|
$
|
83
|
|
|||
113
(b) Exhibits, including those incorporated by reference
|
Exhibit No.
|
Item
|
|
|
2.1
|
Purchase and Sale Agreement, dated as of July 25, 2016, by and among Globus Medical Ireland, Ltd., and Alphatec Holdings, Inc. (incorporated by reference to Exhibit 2.1 of Globus Medical Inc.’s Current Report on Form 8-K filed on July 27, 2016).
|
|
|
2.2
|
First Amendment to Purchase and Sale Agreement, dated as of September 1, 2016, by and among Globus Medical Ireland, Ltd. and Alphatec Holdings, Inc. (incorporated by reference to Exhibit 2.1 of Globus Medical Inc.’s Current Report on Form 8-K filed on September 2, 2016).
|
|
|
3.1
|
Amended and Restated Certificate of Incorporation of Globus Medical, Inc. (incorporated by reference to Exhibit 3.1 of the Registrant’s Amendment No. 5 to the Registration Statement on Form S-1 filed on August 2, 2012).
|
|
|
3.2
|
Certificate of Amendment of the Amended and Restated Certificate of Incorporation, dated July 31, 2012 (incorporated by reference to Exhibit 3.2 of the Registrant’s Amendment No. 5 to the Registration Statement on Form S-1 filed on August 2, 2012).
|
|
|
3.3
|
Certificate of Amendment of the Amended and Restated Certificate of Incorporation, dated August 20, 2012 (incorporated by reference to Exhibit 3.1 of the Registrant’s Form 10-Q/A filed on September 19, 2012).
|
|
|
3.4
|
Amended and Restated Bylaws of Globus Medical, Inc. (incorporated by reference to Exhibit 3.4 of the Registrant’s Form 10-K filed on February 29, 2016).
|
|
|
4.1
|
Specimen Certificate for Class A Common Stock (incorporated by reference to Exhibit 4.1 of the Registrant’s Amendment No. 3 to the Registration Statement on Form S-1 filed on July 16, 2012).
|
|
|
10.1
|
Globus Medical, Inc. Amended and Restated 2003 Stock Plan (incorporated by reference to Exhibit 10.4 of the Registrant’s Amendment No. 1 to the Registration Statement on Form S-1 filed on May 8, 2012).
|
|
|
10.2
|
First Amendment to the Globus Medical, Inc. Amended and Restated 2003 Stock Plan (incorporated by reference to Exhibit 10.5 of the Registrant’s Amendment No. 1 to the Registration Statement on Form S-1 filed on May 8, 2012).
|
|
|
10.3
|
Globus Medical, Inc. 2008 Stock Plan (incorporated by reference to Exhibit 10.6 of the Registrant’s Amendment No. 1 to the Registration Statement on Form S-1 filed on May 8, 2012).
|
|
|
10.4
|
Globus Medical, Inc. 2012 Equity Incentive Plan (incorporated by reference to Exhibit 10.7 of the Registrant’s Amendment No. 1 to the Registration Statement on Form S-1 filed on May 8, 2012).
|
|
|
10.5
|
Form of Grant Notice and Stock Option Agreement under 2003 Stock Plan (incorporated by reference to Exhibit 10.8 of the Registrant’s Amendment No. 1 to the Registration Statement on Form S-1 filed on May 8, 2012).
|
|
|
10.6
|
Form of Grant Notice and Stock Option Agreement under 2008 Stock Plan (incorporated by reference to Exhibit 10.9 of the Registrant’s Amendment No. 1 to the Registration Statement on Form S-1 filed on May 8, 2012).
|
|
|
10.7
|
Form of Incentive Stock Option Grant Notice and Incentive Stock Option Agreement under 2012 Equity Incentive Plan (incorporated by reference to Exhibit 10.10 of the Registrant’s Amendment No. 1 to the Registration Statement on Form S-1 filed on May 8, 2012).
|
|
|
10.8
|
Form of Nonqualified Stock Option Grant Notice and Nonqualified Stock Option Agreement under 2012 Equity Incentive Plan (incorporated by reference to Exhibit 10.11 of the Registrant’s Amendment No. 1 to the Registration Statement on Form S-1 filed on May 8, 2012).
|
|
|
10.9
|
Vice President Employment Agreement, dated June 1, 2005, by and between Globus Medical, Inc. and Brett Murphy (incorporated by reference to Exhibit 10.13 of the Registrant’s Amendment No. 1 to the Registration Statement on Form S-1 filed on May 8, 2012).
|
|
114
|
10.10
|
First Amendment to Vice President Employment Agreement, dated November 1, 2006, by and between Globus Medical, Inc. and Brett Murphy (incorporated by reference to Exhibit 10.14 of the Registrant’s Amendment No. 1 to the Registration Statement on Form S-1 filed on May 8, 2012).
|
|
|
10.11
|
Second Amendment to Vice President Employment Agreement, dated February 8, 2011, by and between Globus Medical, Inc. and Brett Murphy (incorporated by reference to Exhibit 10.15 of the Registrant’s Amendment No. 1 to the Registration Statement on Form S-1 filed on May 8, 2012).
|
|
|
10.12
|
Form of Indemnification Agreement (incorporated by reference to Exhibit 10.18 of the Registrant’s Amendment No. 1 to the Registration Statement on Form S-1 filed on May 8, 2012).
|
|
|
10.13
|
Form of No Competition and Non-Disclosure Agreement (incorporated by reference to Exhibit 10.19 of the Registrant’s Amendment No. 1 to the Registration Statement on Form S-1 filed on May 8, 2012).
|
|
|
10.14
|
Agreement and Plan of Merger, dated as of February 24, 2015, by and among Branch Medical Group, Inc., Globus Medical, Inc., BM Acquisition, Inc. and Spine Therapy Technologies, Inc. (incorporated by reference to Exhibit 2.1 to our Current Report on Form 8-K filed on March 2, 2015).
|
|
|
10.15
|
Executive Employment Agreement, dated June 26, 2014, by and between Globus Medical, Inc. and Anthony L. Williams (incorporated by reference to Exhibit 10.1 to our Form 10-Q filed on May 5, 2015).
|
|
|
10.16
|
Employment Agreement, dated September 14, 2015, by and between Globus Medical, Inc. and David M. Demski (incorporated by reference to Exhibit 10.1 to our Current Report on Form 8-K filed on September 17, 2015).
|
|
|
10.17
|
Executive Employment Agreement, dated May 3, 2016 by and between Globus Medical, Inc. and Daniel T. Scavilla (incorporated by reference to Exhibit 10.1 to our Form 10-Q filed on May 4, 2016).
|
|
|
10.18
|
Credit Agreement, dated May 3, 2016, by and between Globus Medical, Inc. and Globus Medical North America, Inc., and Wells Fargo Bank, National Association (incorporated by reference to Exhibit 10.1 to our Form 10-Q filed on July 27, 2016).
|
|
|
21.1*
|
Subsidiaries of Globus Medical, Inc.
|
|
|
23.1*
|
Consent of independent registered public accounting firm - Grant Thornton LLP.
|
|
|
23.2*
|
Consent of independent registered public accounting firm - KPMG LLP.
|
|
|
31.1*
|
Certification by Principal Executive Officer pursuant to Section 302 of the Sarbanes-Oxley Act of 2002.
|
|
|
31.2*
|
Certification by Principal Financial Officer pursuant to Section 302 of the Sarbanes-Oxley Act of 2002.
|
|
|
32**
|
Certifications pursuant to 18 U.S.C. Section 1350, as adopted pursuant to Section 906 of the Sarbanes-Oxley Act of 2002.
|
|
|
101.INS*
|
XBRL Instance Document
|
|
|
101.SCH*
|
XBRL Taxonomy Extension Schema Document
|
|
|
101.CAL*
|
XBRL Taxonomy Extension Calculation Linkbase Document
|
|
|
101.LAB*
|
XBRL Taxonomy Extension Label Linkbase Document
|
|
|
101.PRE*
|
XBRL Taxonomy Extension Presentation Linkbase Document
|
|
|
101.DEF*
|
XBRL Taxonomy Extension Definition Linkbase Document
|
|
|
*
|
Filed herewith.
|
|
|
**
|
Furnished herewith.
|
|
115
SIGNATURES
Pursuant to the requirements of Section 13 or 15(d) of the Securities Exchange Act of 1934, the Registrant has duly caused this report to be signed on its behalf by the undersigned, thereunto duly authorized.
|
GLOBUS MEDICAL, INC.
|
||
|
Dated:
|
March 16, 2017
|
/s/ DAVID C. PAUL
|
|
David C. Paul
|
||
|
Chairman
|
||
|
Chief Executive Officer
|
||
|
(Principal Executive Officer)
|
||
|
Dated:
|
March 16, 2017
|
/s/ DANIEL T. SCAVILLA
|
|
Daniel T. Scavilla
|
||
|
Senior Vice President
|
||
|
Chief Financial Officer
|
||
|
(Principal Financial Officer)
|
||
|
Dated:
|
March 16, 2017
|
/s/ STEVEN M. PAYNE
|
|
Steven M. Payne
|
||
|
Chief Accounting Officer
|
||
|
(Principal Accounting Officer)
|
||
116
Pursuant to the requirements of the Securities Exchange Act of 1934, this report has been signed by the following persons on behalf of the Registrant and in the capacities and on the dates indicated.
|
SIGNATURE
|
TITLE
|
DATE
|
|
|
/s/ David C. Paul
|
Chief Executive Officer and Director
|
March 16, 2017
|
|
|
David C. Paul
|
(Principal Executive Officer)
|
||
|
/s/ Daniel T. Scavilla
|
Senior Vice President
|
March 16, 2017
|
|
|
Daniel T. Scavilla
|
and Chief Financial Officer
|
||
|
(Principal Financial Officer)
|
|||
|
/s/ Steven M. Payne
|
Chief Accounting Officer
|
March 16, 2017
|
|
|
Steven M. Payne
|
(Principal Accounting Officer)
|
||
|
/s/ David M. Demski
|
President, Emerging Technologies
|
March 16, 2017
|
|
|
David M. Demski
|
and Director
|
||
|
/s/ David D. Davidar
|
Director
|
March 16, 2017
|
|
|
David D. Davidar
|
|||
|
/s/ Kurt C. Wheeler
|
Director
|
March 16, 2017
|
|
|
Kurt C. Wheeler
|
|||
|
/s/ Robert W. Liptak
|
Director
|
March 16, 2017
|
|
|
Robert W. Liptak
|
|||
|
/s/ Daniel T. Lemaitre
|
Director
|
March 16, 2017
|
|
|
Daniel T. Lemaitre
|
|||
|
/s/ Ann D. Rhoads
|
Director
|
March 16, 2017
|
|
|
Ann D. Rhoads
|
|||
|
/s/ James R. Tobin
|
Director
|
March 16, 2017
|
|
|
James R. Tobin
|
|||
117
EXHIBIT INDEX
|
Exhibit No.
|
Item
|
|
|
2.1
|
Purchase and Sale Agreement, dated as of July 25, 2016, by and among Globus Medical Ireland, Ltd., and Alphatec Holdings, Inc. (incorporated by reference to Exhibit 2.1 of Globus Medical Inc.’s Current Report on Form 8-K filed on July 27, 2016).
|
|
|
2.2
|
First Amendment to Purchase and Sale Agreement, dated as of September 1, 2016, by and among Globus Medical Ireland, Ltd. and Alphatec Holdings, Inc. (incorporated by reference to Exhibit 2.1 of Globus Medical Inc.’s Current Report on Form 8-K filed on September 2, 2016).
|
|
|
3.1
|
Amended and Restated Certificate of Incorporation of Globus Medical, Inc. (incorporated by reference to Exhibit 3.1 of the Registrant’s Amendment No. 5 to the Registration Statement on Form S-1 filed on August 2, 2012).
|
|
|
3.2
|
Certificate of Amendment of the Amended and Restated Certificate of Incorporation, dated July 31, 2012 (incorporated by reference to Exhibit 3.2 of the Registrant’s Amendment No. 5 to the Registration Statement on Form S-1 filed on August 2, 2012).
|
|
|
3.3
|
Certificate of Amendment of the Amended and Restated Certificate of Incorporation, dated August 20, 2012 (incorporated by reference to Exhibit 3.1 of the Registrant’s Form 10-Q/A filed on September 19, 2012).
|
|
|
3.4
|
Amended and Restated Bylaws of Globus Medical, Inc. (incorporated by reference to Exhibit 3.4 of the Registrant’s Form 10-K filed on February 29, 2016).
|
|
|
4.1
|
Specimen Certificate for Class A Common Stock (incorporated by reference to Exhibit 4.1 of the Registrant’s Amendment No. 3 to the Registration Statement on Form S-1 filed on July 16, 2012).
|
|
|
10.1
|
Globus Medical, Inc. Amended and Restated 2003 Stock Plan (incorporated by reference to Exhibit 10.4 of the Registrant’s Amendment No. 1 to the Registration Statement on Form S-1 filed on May 8, 2012).
|
|
|
10.2
|
First Amendment to the Globus Medical, Inc. Amended and Restated 2003 Stock Plan (incorporated by reference to Exhibit 10.5 of the Registrant’s Amendment No. 1 to the Registration Statement on Form S-1 filed on May 8, 2012).
|
|
|
10.3
|
Globus Medical, Inc. 2008 Stock Plan (incorporated by reference to Exhibit 10.6 of the Registrant’s Amendment No. 1 to the Registration Statement on Form S-1 filed on May 8, 2012).
|
|
|
10.4
|
Globus Medical, Inc. 2012 Equity Incentive Plan (incorporated by reference to Exhibit 10.7 of the Registrant’s Amendment No. 1 to the Registration Statement on Form S-1 filed on May 8, 2012).
|
|
|
10.5
|
Form of Grant Notice and Stock Option Agreement under 2003 Stock Plan (incorporated by reference to Exhibit 10.8 of the Registrant’s Amendment No. 1 to the Registration Statement on Form S-1 filed on May 8, 2012).
|
|
|
10.6
|
Form of Grant Notice and Stock Option Agreement under 2008 Stock Plan (incorporated by reference to Exhibit 10.9 of the Registrant’s Amendment No. 1 to the Registration Statement on Form S-1 filed on May 8, 2012).
|
|
|
10.7
|
Form of Incentive Stock Option Grant Notice and Incentive Stock Option Agreement under 2012 Equity Incentive Plan (incorporated by reference to Exhibit 10.10 of the Registrant’s Amendment No. 1 to the Registration Statement on Form S-1 filed on May 8, 2012).
|
|
|
10.8
|
Form of Nonqualified Stock Option Grant Notice and Nonqualified Stock Option Agreement under 2012 Equity Incentive Plan (incorporated by reference to Exhibit 10.11 of the Registrant’s Amendment No. 1 to the Registration Statement on Form S-1 filed on May 8, 2012).
|
|
|
10.9
|
Vice President Employment Agreement, dated June 1, 2005, by and between Globus Medical, Inc. and Brett Murphy (incorporated by reference to Exhibit 10.13 of the Registrant’s Amendment No. 1 to the Registration Statement on Form S-1 filed on May 8, 2012).
|
|
118
|
10.10
|
First Amendment to Vice President Employment Agreement, dated November 1, 2006, by and between Globus Medical, Inc. and Brett Murphy (incorporated by reference to Exhibit 10.14 of the Registrant’s Amendment No. 1 to the Registration Statement on Form S-1 filed on May 8, 2012).
|
|
|
10.11
|
Second Amendment to Vice President Employment Agreement, dated February 8, 2011, by and between Globus Medical, Inc. and Brett Murphy (incorporated by reference to Exhibit 10.15 of the Registrant’s Amendment No. 1 to the Registration Statement on Form S-1 filed on May 8, 2012).
|
|
|
10.12
|
Form of Indemnification Agreement (incorporated by reference to Exhibit 10.18 of the Registrant’s Amendment No. 1 to the Registration Statement on Form S-1 filed on May 8, 2012).
|
|
|
10.13
|
Form of No Competition and Non-Disclosure Agreement (incorporated by reference to Exhibit 10.19 of the Registrant’s Amendment No. 1 to the Registration Statement on Form S-1 filed on May 8, 2012).
|
|
|
10.14
|
Agreement and Plan of Merger, dated as of February 24, 2015, by and among Branch Medical Group, Inc., Globus Medical, Inc., BM Acquisition, Inc. and Spine Therapy Technologies, Inc. (incorporated by reference to Exhibit 2.1 to our Current Report on Form 8-K filed on March 2, 2015).
|
|
|
10.15
|
Executive Employment Agreement, dated June 26, 2014, by and between Globus Medical, Inc. and Anthony L. Williams (incorporated by reference to Exhibit 10.1 to our Form 10-Q filed on May 5, 2015).
|
|
|
10.16
|
Employment Agreement, dated September 14, 2015, by and between Globus Medical, Inc. and David M. Demski (incorporated by reference to Exhibit 10.1 to our Current Report on Form 8-K filed on September 17, 2015).
|
|
|
10.17
|
Executive Employment Agreement, dated May 3, 2016 by and between Globus Medical, Inc. and Daniel T. Scavilla (incorporated by reference to Exhibit 10.1 to our Form 10-Q filed on May 4, 2016).
|
|
|
10.18
|
Credit Agreement, dated May 3, 2016, by and between Globus Medical, Inc. and Globus Medical North America, Inc., and Wells Fargo Bank, National Association (incorporated by reference to Exhibit 10.1 to our Form 10-Q filed on July 27, 2016).
|
|
|
21.1*
|
Subsidiaries of Globus Medical, Inc.
|
|
|
23.1*
|
Consent of independent registered public accounting firm - Grant Thornton LLP.
|
|
|
23.2*
|
Consent of independent registered public accounting firm - KPMG LLP.
|
|
|
31.1*
|
Certification by Principal Executive Officer pursuant to Section 302 of the Sarbanes-Oxley Act of 2002.
|
|
|
31.2*
|
Certification by Principal Financial Officer pursuant to Section 302 of the Sarbanes-Oxley Act of 2002.
|
|
|
32**
|
Certifications pursuant to 18 U.S.C. Section 1350, as adopted pursuant to Section 906 of the Sarbanes-Oxley Act of 2002.
|
|
|
101.INS*
|
XBRL Instance Document
|
|
|
101.SCH*
|
XBRL Taxonomy Extension Schema Document
|
|
|
101.CAL*
|
XBRL Taxonomy Extension Calculation Linkbase Document
|
|
|
101.LAB*
|
XBRL Taxonomy Extension Label Linkbase Document
|
|
|
101.PRE*
|
XBRL Taxonomy Extension Presentation Linkbase Document
|
|
|
101.DEF*
|
XBRL Taxonomy Extension Definition Linkbase Document
|
|
|
*
|
Filed herewith.
|
|
|
**
|
Furnished herewith.
|
|
119
TABLE OF CONTENTS
Part IItem 1. BusinessItem 1A. Risk FactorsItem 1B. Unresolved Staff CommentsItem 2. PropertiesItem 3. Legal ProceedingsItem 4. Mine Safety DisclosuresPart IIItem 5. Market For The Registrant S Common Equity, Related Stockholder Matters and Issuer Purchases Of Equity SecuritiesItem 6. Selected Financial DataItem 7. Management S Discussion and Analysis Of Financial Condition and Results Of OperationsItem 7A. Quantitative and Qualitative Disclosure About Market RiskItem 8. Financial Statements and Supplementary DataNote 1. Background and Summary Of Significant Accounting PoliciesNote 2. AcquisitionsNote 3. Note ReceivableNote 4. Intangible AssetsNote 5. Marketable SecuritiesNote 6. Fair Value MeasurementsNote 7. InventoriesNote 8. Property and EquipmentNote 9. Accrued ExpensesNote 10. DebtNote 11. EquityNote 12. Stock-based CompensationNote 13. Income TaxesNote 14. LeasesNote 15. Commitments and ContingenciesNote 16. Retirement Benefit PlansNote 17. Related-party TransactionsNote 18. Segment and Geographic InformationNote 19. Quarterly Financial Data (unaudited)Item 9. Changes in and Disagreements with Accountants on Accounting and Financial DisclosureItem 9A. Controls and ProceduresItem 9B. Other InformationPart IIIItem 10. Directors, Executive Officers and Corporate GovernanceItem 11. Executive CompensationItem 12. Security Ownership Of Certain Beneficial Owners and Management and Related Stockholder MattersItem 13. Certain Relationships and Related Transactions, and Director IndependenceItem 14. Principal Accountant Fees and ServicesPart IVItem 15. Exhibits and Financial Statement Schedules