GENIE ENERGY LTD.
10-Ks and 10-Qs
|
|
|
|
|
|
|
|
|
|
|
|
|
|
|
|
|
|
|
|
|
|
|
|
|
|
|
|
|
|
|
|
|
|
|
|
|
|
|
|
|
|
|
|
|
|
|
|
|
|
|
|
|
UNITED STATES SECURITIES AND EXCHANGE COMMISSION
Washington, D.C. 20549
FORM 10-K
x
Annual report pursuant to section 13 or 15(d) of the Securities Exchange Act of 1934 for the fiscal year ended December 31, 2013, or
o
Transition report pursuant to section 13 or 15(d) of the Securities Exchange Act of 1934.
Commission File Number: 1-35327
Genie Energy Ltd.
(Exact name of registrant as specified in its charter)
|
Delaware
|
45-2069276
|
|
|
(State or other jurisdiction of incorporation
or organization)
|
(I.R.S. Employer Identification No.)
|
550 Broad Street, Newark, New Jersey 07102
(Address of principal executive offices, zip code)
(973) 438-3500
(Registrant’s telephone number, including area code)
Securities registered pursuant to Section 12(b) of the Act:
|
Title of each class
|
Name of each exchange on which registered
|
|
|
Class B common stock, par value $.01 per share
Series 2012-A Preferred stock, par value $.01 per share
|
New York Stock Exchange
New York Stock Exchange
|
Securities registered pursuant to section 12(g) of the Act: None
Indicate by check mark if the registrant is a well-known seasoned issuer, as defined in Rule 405 of the Securities Act. Yes
o
No
x
Indicate by check mark if the registrant is not required to file reports pursuant to Section 13 or Section 15(d) of the Act. Yes
o
No
x
Indicate by check mark whether the registrant (1) has filed all reports required to be filed by Section 13 or 15(d) of the Securities Exchange Act of 1934 during the preceding 12 months (or for such shorter period that the registrant was required to file such reports), and (2) has been subject to such filing requirements for the past 90 days. Yes
x
No
o
Indicate by check mark whether the registrant has submitted electronically and posted on its corporate Web site, if any, every Interactive Data File required to be submitted and posted pursuant to Rule 405 of Regulation S-T (§ 232.405 of this chapter) during the preceding 12 months (or for such shorter period that the registrant was required to submit and post such files). Yes
x
No
o
Indicate by check mark if disclosure of delinquent filers pursuant to Item 405 of Regulation S-K (§229.405 of this chapter) is not contained herein, and will not be contained, to the best of registrant’s knowledge, in definitive proxy or information statements incorporated by reference in Part III of this Form 10-K or any amendment to this Form 10-K.
x
Indicate by check mark whether the registrant is a large accelerated filer, an accelerated filer, a non-accelerated filer, or a smaller reporting company. See definitions of “large accelerated filer,” “accelerated filer” and “smaller reporting company” in Rule 12b-2 of the Exchange Act.
|
Large accelerated filer
o
|
Accelerated filer
x
|
|
Non-accelerated filer
o
|
Smaller reporting company
o
|
Indicate by check mark whether the registrant is a shell company (as defined in Rule 12b-2 of the Act). Yes
o
No
x
The aggregate market value of the voting and non-voting stock held by non-affiliates of the registrant, based on the closing price on June 28, 2013 (the last business day of the registrant’s most recently completed second fiscal quarter) of the Class B common stock of $9.15 per share, as reported on the New York Stock Exchange, was approximately $145 million.
As of March 10, 2014, the registrant had outstanding 19,765,182 shares of Class B common stock and 1,574,326 shares of Class A common stock. Excluded from these numbers are 58,978 shares of Class B common stock held in treasury by Genie Energy Ltd.
DOCUMENTS INCORPORATED BY REFERENCE
The definitive proxy statement relating to the registrant’s Annual Meeting of Stockholders, to be held May 7, 2014, is incorporated by reference into Part III of this Form 10-K to the extent described therein.
Index
Genie Energy Ltd.
Annual Report on Form 10-K
|
Part I
|
|
1 | |||
| 1 | |||||
| 11 | |||||
| 17 | |||||
| 17 | |||||
| 18 | |||||
| 18 | |||||
|
Part II
|
|
18 | |||
| 18 | |||||
| 20 | |||||
| 20 | |||||
| 42 | |||||
| 43 | |||||
| 43 | |||||
| 43 | |||||
| 45 | |||||
|
Part III
|
45 | ||||
| 45 | |||||
| 45 | |||||
| 45 | |||||
| 45 | |||||
| 45 | |||||
|
Part IV
|
|
46 | |||
| 46 | |||||
|
|
48 |
As used in this Annual Report, unless the context otherwise requires, the terms “the Company,” “Genie,” “we,” “us,” and “our” refer to Genie Energy Ltd., a Delaware corporation, and its subsidiaries, collectively.
OVERVIEW
Genie Energy, Ltd., a Delaware corporation, owns 99.3% of its subsidiary, Genie Energy International Corporation, or GEIC, which owns 100% of IDT Energy and 92% of Genie Oil and Gas, Inc., or GOGAS. IDT Energy has outstanding deferred stock units granted to directors and employees that represent an interest of 2.5% of the equity of IDT Energy. Our principal businesses consist of:
|
•
|
IDT Energy, a retail energy provider, or REP, supplying electricity and natural gas to residential and small business customers in the Northeastern United States; and
|
|
•
|
Genie Oil and Gas, which is pioneering technologies to produce clean and affordable transportation fuels from the world's abundant oil shale and other fuel resources, which consists of: (1) American Shale Oil Corporation, or AMSO, which holds and manages a 48.2% interest in American Shale Oil, L.L.C., or AMSO, LLC, our oil shale project in Colorado; (2) an 87.7% interest in Israel Energy Initiatives, Ltd., or IEI, our oil shale project in Israel; (3) an 87.1% interest in Afek Oil & Gas Ltd., or Afek, our conventional oil and gas exploration project in the southern portion of the Golan Heights in Northern Israel; and (4) an 89.1% interest in Genie Mongolia, Inc., our oil shale exploration project in Central Mongolia.
|
We have two reportable business segments: IDT Energy and Genie Oil and Gas. Our reportable segments are distinguished by types of service, customers and methods used to provide their services. Financial information by segment and geographic areas is presented under the heading “Business Segment Information” in the Notes to our Consolidated Financial Statements in this Annual Report.
Our main offices are located at 550 Broad Street, Newark, New Jersey 07102. The telephone number at our headquarters is (973) 438-3500 and our web site is www.genie.com.
We make available free of charge through the investor relations page of our web site (http://genie.com/investors/sec-filings/) our annual reports on Form 10-K, quarterly reports on Form 10-Q, current reports on Form 8-K and all amendments to these reports, and all beneficial ownership reports on Forms 3, 4 and 5 filed by directors, officers and beneficial owners of more than 10% of our equity as soon as reasonably practicable after such material is electronically filed with the Securities and Exchange Commission. We have adopted a Code of Business Conduct and Ethics for all of our employees, including our principal executive officer and principal financial officer. Copies of our Code of Business Conduct and Ethics are available on our web site.
Our web site and the information contained therein or incorporated therein are not incorporated into this Annual Report on Form 10-K or our other filings with the Securities and Exchange Commission.
KEY EVENTS IN OUR HISTORY
Genie was incorporated in January 2011. References to us in the following discussion are made on a consolidated basis as if we existed and owned IDT Energy and Genie Oil and Gas in all periods discussed.
In November 2004, IDT launched IDT Energy in New York State. IDT Energy currently operates in eight utility markets in New York, six utility territories in New Jersey, eight utility territories in Pennsylvania, four utility territories in Maryland, and, more recently, in Washington D.C. and one utility market in Illinois. IDT Energy is evaluating opportunities in additional states, including Massachusetts and Connecticut.
In March 2008, we formed Israel Energy Initiatives, Ltd., which was awarded an exclusive Shale Oil Exploration and Production License in July 2008 by the Government of Israel.
In April 2008, IDT acquired E.G.L. Oil Shale, L.L.C., which was subsequently renamed American Shale Oil, LLC.
In March 2009, a subsidiary of TOTAL S.A., the world’s fifth largest integrated oil and gas company, acquired a 50% interest in AMSO, LLC in exchange for cash paid to us of $3.2 million and Total’s commitment to fund the majority of AMSO, LLC’s research, development and demonstration expenditures as well as certain other funding commitments.
In April 2013, the Government of Israel finalized the award to our subsidiary, Afek, of an exclusive three year petroleum exploration license covering 396.5 square kilometers in the southern portion of the Golan Heights in Northern Israel.
In April 2013, Genie Mongolia and the Petroleum Authority of Mongolia entered into an exclusive oil shale development agreement to explore and evaluate the commercial potential of oil shale resources in a 34,470 square kilometer area in Central Mongolia.
1
Spin-Off from IDT Corporation
We were formerly a subsidiary of IDT Corporation, or IDT. On October 28, 2011, we were spun-off by IDT and became an independent public company through a pro rata distribution of our common stock to IDT’s stockholders, which we refer to as the Spin-Off. As a result of the Spin-Off, each of IDT’s stockholders received: (i) one share of our Class A common stock for every share of IDT’s Class A common stock held of record on October 21, 2011, or the Record Date, and (ii) one share of our Class B common stock for every share of IDT’s Class B common stock held of record on the Record Date.
Prior to the Spin-Off, IDT made a capital contribution of $82.2 million to us.
Exchange Offer and Issuance of Preferred Stock
On August 2, 2012, we initiated an offer to exchange up to 8.75 million outstanding shares of our Class B common stock for the same number of shares of a new series of preferred stock. On October 17, 2012, we issued 1,604,591 shares of our newly designated Series 2012-A Preferred Stock, par value $0.01 per share, in exchange for an equal number of shares of Class B common stock tendered in the exchange offer.
On November 26, 2012, we commenced an offer to exchange up to 7,145,409 outstanding shares of our Class B Common Stock for the same number of shares of Series 2012-A Preferred Stock. This was a renewal of the prior offer described in the preceding paragraph and on March 11, 2013, we issued 313,376 shares of our Series 2012-A Preferred Stock in exchange for an equal number of shares of Class B common stock tendered in the exchange offer.
RECENT DEVELOPMENTS
Diversegy
On December 5, 2013, IDT Energy acquired Dallas-based Diversegy, LLC, or Diversegy, a retail energy advisory and brokerage company that serves commercial and industrial customers, and its network marketing channel, Epiq Energy, LLC, or Epiq, that provides independent representatives with the opportunity to build sales organizations and to profit from both residential and commercial energy. Diversegy connects large commercial and industrial customers with its portfolio of competitive energy products provided by some of the industry’s leading energy suppliers. Diversegy evaluates alternative supply sources based on its customers’ usage patterns and risk profiles in order provide options that benefit their bottom lines. Epiq Energy offers its direct marketing representatives the opportunity to earn commissions on energy supply based on the consumption of the customers they bring into the program.
Dividends
The aggregate dividends declared in the year ended December 31, 2012 on our common stock were $3.1 million. No dividends were declared or paid on our common stock in the year ended December 31, 2013. The aggregate dividends paid in the year ended December 31, 2013 on our Series 2012-A Preferred Stock (“Preferred Stock”) was $1.1 million, as follows:
|
•
|
On February 15, 2013, we paid a pro-rated Base Dividend of $0.1317 per share on our Preferred Stock for the fourth quarter of 2012 to stockholders of record at the close of business on February 5, 2013 of our Preferred Stock.
|
|
•
|
On May 15, 2013, we paid a quarterly Base Dividend of $0.1594 per share on the Preferred Stock for the first a quarter of 2013 to stockholders of record at the close of business on May 8, 2013 of our Preferred Stock.
|
|
•
|
On August 15, 2013, we paid a quarterly Base Dividend of $0.1594 per share on the Preferred Stock for the second quarter of 2013 to stockholders of record at the close of business on August 7, 2013 of our Preferred Stock.
|
|
•
|
On November 15, 2013, we paid a quarterly Base Dividend of $0.1594 per share on the Preferred Stock for the third quarter of 2013 to stockholders of record at the close of business on November 4, 2013 of our Preferred Stock.
|
On February 14, 2014, we paid a Base Dividend of $0.1594 per share on the Preferred Stock for the fourth quarter of 2013. The aggregate amount paid was $0.3 million. In connection with the completion of the exchange offer and issuance of the Series 2012-A Preferred Stock, we have suspended payment of dividends on our Class A and Class B common stock for the foreseeable future.
IDT Energy
In November 2004, IDT launched a REP business, IDT Energy, which has since experienced significant growth. IDT Energy resells natural gas and electricity to residential and small business customers in eight utility markets in New York, six utility territories in New Jersey, eight utility territories in Pennsylvania, four utility territories in Maryland and, more recently, in Washington D.C. and one utility market in Illinois.
2
IDT Energy’s business, particularly its sales of natural gas, is a seasonal business. Approximately 49% of IDT Energy’s natural gas revenues in the year ended December 31, 2013 was generated during the three months ended March 31, 2013, when the demand for heating was highest as compared to 47% in the same period in the year ended December 31, 2012. The demand for electricity is not as seasonal as natural gas, but is higher during IDT Energy’s third quarter when air conditioning usage peaks. Revenues from sales of electricity in the three months ended September 30, 2013 represented approximately 31% of total revenues from electricity sales in the year ended December 31, 2013 as compared to 34% of total revenues from electricity sales in the same period in the year ended December 31, 2012.
In the year ended December 31, 2013, IDT Energy generated revenues of $279 million comprised of $217 million from sales of electricity and $62 million from sales of natural gas, as compared with revenues of $229.5 million in the year ended December 31, 2012. IDT Energy’s revenues represent 100% of our total consolidated revenues since our inception. In addition in the year ended December 31, 2013, IDT Energy had operating income of $26 million, as compared with operating income of $25.0 million in the year ended December 31, 2012.
Customers
IDT Energy’s services are made available to customers under its standard terms and conditions, offering primarily a variable rate via automatically renewing or month-to-month agreements, which enable it to recover its costs for electricity and natural gas through adjustments to the rates charged to its customers. The frequency and degree of these adjustments are determined by IDT Energy, and are not restricted by regulation. While IDT Energy’s contract rates are not regulated, they are governed by its terms and conditions, which are accepted by all customers. IDT Energy is required to comply with various reporting requirements in order to maintain eligibility to operate as a REP. Certain jurisdictions require IDT Energy to publish its customer offers with the applicable regulatory commission, and, or in the public domain, generally a website established for such purpose. The electricity and natural gas IDT Energy sells are metered and delivered to IDT Energy customers by the local utilities. As such, IDT Energy does not have a maintenance or service staff for customer locations. These utilities also provide billing and collection services for the majority of IDT Energy’s customers on its behalf. For a small number of direct bill customers, IDT Energy performs its own billing and collection. Additionally, IDT Energy’s receivables are generally purchased by the utilities in whose areas IDT Energy operates for a percentage of their face value (as of December 31, 2013, approximately 98.5%) in exchange for the utility receiving a first priority lien in the customer receivable without recourse against IDT Energy.
IDT Energy markets its energy services primarily through direct marketing methods, including door-to-door sales, outbound telemarketing, direct mail and internet signup. As of December 31, 2013, IDT Energy serviced 427,000 meters (282,000 electric and 145,000 natural gas), as compared to 502,000 meters (331,000 electric and 171,000 natural gas) as of December 31, 2012. In the territories that IDT Energy has operated for at least a year, IDT Energy has captured between 4% and 11% of the migrated share.
IDT Energy’s strategy is to acquire profitable customers in low-risk markets, specifically where the utilities have adopted a portfolio of REP-friendly, regulatory-driven programs. Key among these programs is purchase of receivables, or POR programs where utilities are contractually obligated to purchase customer receivables at a pre-determined fixed discount. Under POR programs, utilities offer consolidated billing, where the utilities have the responsibility of billing the individual customer and the subsequent collections of the remittances. Additionally, we target markets in which we can procure energy in an efficient and transparent manner. We seek to purchase wholesale energy where there is a real time market that reflects a fair price for the commodity for all participants. This, coupled with IDT Energy’s strategy to primarily sell a variable-rate product, allows IDT Energy to reflect a true market cost base and opportunistically vary its rates to its customers taking into account its competitors who are purchasing their commodity at longer intervals.
Utilities in New York, Pennsylvania, Illinois, Washington, D.C. and Maryland offer POR programs without recourse that permit customers with past-due balances to remain in the POR and consolidated bill programs. However, utilities in New Jersey generally do not permit customers with past-due balances beyond 120 days, to enroll in their POR programs, or remain in their POR programs, which means that after a certain amount of time (determined based on the specific commodity), IDT Energy becomes responsible for the billing and collection of the commodity portion of the future invoices for its delinquent customers. IDT Energy may switch the customer back to the utility at its choosing; the process can typically be accomplished before IDT Energy needs to send an invoice, however it can take one to two billing cycles to complete.
IDT Energy also regularly monitors other deregulated or deregulating markets to determine if they are appropriate for entry, and may initiate the licensing process in a selected region should deregulated conditions develop favorably.
Acquisition and Management of Gas and Electric Supply
Since 2009, IDT Energy has been party to a Preferred Supplier Agreement with BP Energy Company, or BP, pursuant to which BP is IDT Energy’s preferred provider of electricity and natural gas. The agreement allows for purchases of electricity and natural gas for customers in areas where the utilities have POR programs. Under the arrangement, IDT Energy purchases electricity and natural gas at market rate plus a fee. IDT Energy’s obligations to BP are secured by a first security interest in deposits or receivables from utilities in connection with their purchase of IDT Energy’s customer’s receivables under the applicable POR program, and in any cash deposits or letters of credit posted in connection with any collateral accounts with BP. The agreement with BP has been amended to cover the territories in which we operate. The agreement will terminate on June 30, 2015 unless extended by the parties. IDT Energy’s ability to purchase electricity and natural gas under this agreement is subject to satisfaction of certain conditions including the maintenance of certain covenants.
3
IDT Energy is required to meet certain minimum green energy supply criteria in some of the markets in which it operates. IDT Energy has met those thresholds by acquiring renewable energy certificates (REC’s). In addition, IDT Energy offers green or other renewable energy products to its customers in several territories. IDT Energy acquires green renewable energy conversion rights or attributes and REC’s to satisfy the load requirements for these customers.
As a REP, IDT Energy does not own electrical power generation, transmission, or distribution facilities, or natural gas production, pipeline or distribution facilities. Besides BP, IDT Energy currently contracts with Dominion Transmission, Inc., National Fuel Supply, Williams Gas Pipeline and Texas Eastern Transmission and others for natural gas pipeline, storage and transportation services, and utilizes the New York Independent System Operator, Inc., or NYISO, and PJM Interconnection, LLC, or PJM, for electric transmission and distribution. NYISO operates the high-voltage electric transmission network in New York State, and administers and monitors New York’s wholesale electricity markets. PJM is a regional transmission organization that coordinates the movement of wholesale electricity in all or parts of thirteen states (including New Jersey, Pennsylvania and Maryland) and the District of Columbia.
For risk management purposes, IDT Energy utilizes forward physical delivery contracts for a portion of its purchases of electricity and natural gas, which are defined as commodity derivative contracts. In addition, IDT Energy enters into put and call options as hedges against unfavorable fluctuations in market prices of electricity and natural gas.
The NYISO and PJM perform real-time load balancing for each of the electrical power grids in which IDT Energy operates. Similarly, load balancing is performed by the utilities or local distribution company, or LDC, for each of the natural gas markets in which IDT Energy operates. Load balancing ensures that the amount of electricity and natural gas that IDT Energy purchases is equal to the amount necessary to service its customers’ demands at any specific point in time. IDT Energy is charged or credited for balancing the electricity and natural gas purchased and sold for its account by its suppliers and the LDCs. IDT Energy manages the differences between the actual electricity and natural gas demands of its customers and its bulk or block purchases by buying and selling in the spot market, and through monthly cash settlements and/or adjustments to future deliveries in accordance with the load balancing performed by utilities, LDCs, NYISO and PJM.
Diversegy
Diversegy, which we acquired in December 2013, operates as an energy broker and advisor to industrial, commercial and municipal customers across deregulated energy markets throughout the United States. Commercial and industrial end-use customers of all types and size have the ability to leverage Diversegy’s expertise and purchasing power as they evaluate their electricity and natural gas procurement plans.
Epiq, which we also acquired in December 2013, has built and operates a network marketing platform that sells services for many REPs in several states. Epiq offers an innovative direct sales opportunity to individuals who are seeking to profit from the deregulation of energy in the United Sates, focusing on residential and small to medium-sized businesses. Epiq’s sales channel has the potential to reach customers our traditional sales channels of door-door marketing and outbound telemarketing has difficulty in reaching. Over the course of Fiscal 2014, we expect Epiq to have active independent representatives in most states where we operate, with an early focus on Illinois.
Our Diversegy and Epiq operations will allow us to enter more markets around the country as we are not limited to only the markets we operate as a REP, and therefore not responsible for assuming the risk associated with procuring and managing the commodity.
Competition
IDT Energy competes with the local utility companies in the areas where it provides service, including certain retail subsidiaries of the utilities. Some utilities have affiliated companies that are REPs, and compete in the same markets that IDT Energy operates. IDT Energy also competes with several large vertically integrated energy companies as well as many independent REPs. Some of these competitors or potential competitors are larger and better capitalized than IDT Energy. The competition with the utilities and REPs exposes IDT Energy to the risk of losing customers, especially since IDTE’s residential customers generally do not sign term contracts. Additionally, as our experience has shown, utilities don’t change their sell rates offered to customers immediately. There is a time lag before utilities increase prices to reflect their increased costs and market prices for commodities. In times of high commodity prices, REPs like IDT Energy that offer a variable rate product, and reflect real-time commodity costs, can suffer from being compared to the utilities rate, which is not wholly reflective of real-time market conditions. Conversely, in a downward moving commodity cost environment, REPs like IDTE benefit from the lag that utilities experience in reducing their sell rate to reflect the lower cost base in the commodity markets, as their customers will benefit from the falling costs closer to real time.
As the provider of a fully variable rate product, the amount we charge to our customers changes with our costs for the underlying commodity. During times of rising costs, the number of complaints made to our call center or to the state regulators may increase. We proactively seek to address customer concerns through rebates, other programs and by providing accurate information, as well as communications with regulators.
4
There are many licensed REPs in each of the markets in which we operate. In each major utility service territory there are several REPs serving residential natural gas customers and residential electric customers. While it is unclear whether there will be new entrants in these markets, IDT Energy believes REP competition in the residential market (which represents the principal market focus for IDT Energy) is not as intense as in the commercial and industrial markets because the majority of REPs, unlike IDT Energy, have focused their activities on the commercial and industrial markets, which are comprised of larger customers who prefer to enter into longer term contracts with fixed rates.
Increasing our market share depends in part on our ability to persuade customers to switch to IDT Energy’s service. Local utilities have certain advantages such as name recognition, financial strength and long-standing relationships with customers. Persuading potential customers to switch to a new supplier of such an important service is challenging. If IDT Energy is not successful in convincing customers to switch, our REP business, results of operations and financial condition will be adversely affected.
Regulation
IDT Energy currently operates in eight utility territories in New York, six utility territories in New Jersey, eight utility territories in Pennsylvania, four utility territories in Maryland, one in Washington D.C. and one in Illinois. IDT Energy recently received regulatory approvals to enter nine new utility territories in Pennsylvania and one new territory covering Maryland and Washington D.C. The State of New York, the Commonwealth of Pennsylvania, the State of New Jersey, the State of Maryland, the State of Illinois, the District of Columbia, the federal government, and related public service/utility commissions, among others, establish the rules and regulations for our REP operations. Like all REPs, IDT Energy is affected by the actions of governmental agencies, mostly on the state level by the respective state Public Service/Utility Commissions, and other organizations (such as NYISO and PJM) and indirectly the Federal Energy Regulatory Commission, or FERC. Regulations applicable to electricity and natural gas have undergone substantial change over the past several years as a result of restructuring initiatives at both the state and federal levels. IDT Energy may be subject to new laws, orders or regulations or the revision or interpretation of existing laws, orders or regulations. Further, if IDT Energy enters territories outside of the utility regions within which it currently operates in New York, New Jersey, Pennsylvania, Maryland, Illinois and Washington DC, or territories outside of these states, it would need to be licensed and would be subject to the rules and regulations of such states or municipalities and respective utilities.
Diversegy is licensed to serve as a broker of electricity in New Jersey, Pennsylvania, Maryland, District of Columbia, Illinois and Ohio and as a gas broker in New Jersey, Maryland and Ohio. Epiq is licensed as an electricity broker in Illinois and Ohio and a gas broker in Ohio. Epiq has license applications currently pending in several additional states. Both Diversegy and Epiq serve as brokers in other states that do not require licenses.
Employees
As of March 1, 2014, IDT Energy employed 103 full time employees, 58 of whom are located in the Jamestown, New York office, of which approximately 80% are affiliated with the customer care center and 26 of whom are located in our Texas office.
Genie Oil and Gas, Inc.
Genie Oil and Gas, which is pioneering technologies to produce clean and affordable transportation fuels from the world’s abundant oil shale and other fuel resources, consists of (1) AMSO, which holds and manages a 48.2% interest in AMSO, LLC, our oil shale project in Colorado, and (2) an 87.7% interest in IEI, our oil shale project in Israel, (3) an 87.1% interest in Afek, our conventional oil and gas exploration project in the southern portion of the Golan Heights IN Northern Israel, and (4) a 89.1% interest in Genie Mongolia, Inc., our oil shale exploration project in Central Mongolia.
Oil shale is an organic-rich, fine-grained sedimentary rock that contains significant amounts of kerogen (a solid mixture of organic chemical compounds) from which liquid hydrocarbons can be extracted. However, extracting oil and gas from oil shale is more complex than conventional oil and gas recovery and is more expensive. Rather than pumping it directly out of the ground in the form of liquid oil, the oil shale can be mined and then heated to a high temperature through a process called surface retorting, with the resultant liquid separated and collected. An alternative which AMSO, LLC and others are researching and developing is in-situ retorting, which involves heating the oil shale to a temperature of approximately 660°F while it is still underground, and then pumping the resulting liquid and/or gases to the surface. In-situ retorting is considered to be less environmentally invasive than surface retorting and can offer significant economic advantages.
American Shale Oil Corporation
American Shale Oil Corporation, or AMSO, was formed as a subsidiary of ours in February 2008. AMSO’s initial entry into the oil shale business occurred in April 2008, when AMSO acquired a 75% equity interest in E.G.L. Oil Shale, L.L.C. (which was subsequently renamed American Shale Oil, LLC) in exchange for cash of $2.5 million and certain commitments for future funding of AMSO, LLC’s operations. In a separate transaction in April 2008, IDT acquired an additional 14.9% equity interest in AMSO, LLC in exchange for cash of $3.0 million, bringing our and IDT’s total interest in AMSO, LLC to approximately 90%. In March 2009, a subsidiary of TOTAL S.A., or Total, the world’s fifth largest integrated oil and gas company, acquired a 50% interest in AMSO, LLC in exchange for cash paid to us of $3.2 million and Total’s commitment to fund the majority of AMSO, LLC’s research, development and demonstration, or RD&D, expenditures as well as certain other funding commitments. Immediately prior to this transaction, all owners (including IDT’s 14.9% direct equity interest) other than AMSO exchanged their ownership interest for a proportionate share of a 1% override on AMSO, LLC’s future revenue. IDT assigned the cash proceeds of its override interest to the IDT U.S. Oil Shale Charitable Distribution Trust, subject to certain remainder interests retained by Genie. After the consummation of the Total transaction, AMSO owned 50% of AMSO, LLC.
5
AMSO is operating the project during the RD&D phase and Total will provide a majority of the funding during this phase of the project, and technical and financial assistance throughout the RD&D and commercial stages of the project. Total will lead the planning of the commercial development and will assume management responsibilities during the subsequent commercial phase.
AMSO agreed to fund AMSO, LLC’s expenditures as follows: 20% of the initial $50 million of expenditures, 35% of the next $50 million in approved expenditures and 50% of approved expenditures in excess of $100 million. AMSO also agreed to fund 40% of the costs of the one-time payment for conversion of AMSO, LLC’s RD&D Lease to a commercial lease, in the event AMSO, LLC’s application for conversion is approved. The remaining amounts are to be funded by Total. As of December 31, 2013, the cumulative contributions of AMSO and Total to AMSO, LLC were $69.6 million.
AMSO has the right to decide at each capital call whether or not to fund AMSO, LLC, subject to certain consequences for a failure to fund depending on the stage of the project. AMSO did not fund the capital call for the first quarter of 2014, and in January 2014, Total funded AMSO’s share, which was $0.9 million. Because of AMSO’s decision not to fund its share, AMSO’s ownership interest in AMSO, LLC was reduced to 48.16% and Total’s ownership interest increased to 51.84%. In addition, AMSO’s share of future funding of AMSO, LLC up to a cumulative $100 million was reduced to 33.7% and Total’s share increased to 66.3%. AMSO’s share of AMSO, LLC’s approved budget for the year ending December 31, 2014 was $3.2 million. AMSO is evaluating its options with respect to funding AMSO, LLC during 2014, and funding of less than its full share would result in further dilution of its interest in AMSO, LLC.
According to reports from the United States Department of Energy, or DOE, oil shale resources in the United States are estimated at over 2 trillion barrels, and based on management estimates, could potentially supply the U.S.’s demand for liquid fuel over the next 100 years. The majority of those deposits are found in the Green River Formation of Colorado (Piceance Creek Basin), Utah (Uinta Basin) and Wyoming (Green River and Washakie Basins). In March 2009, the U.S. Geological Survey, or USGS, reported that the total “in-place” oil in the Colorado’s Piceance Basin is approximately 1.525 trillion barrels. The majority of those deposits are found in the Green River Formation of Colorado (Piceance Creek Basin), Utah (Uinta Basin) and Wyoming (Green River and Washakie Basins). Colorado’s Piceance Basin, where AMSO, LLC’s RD&D Lease is located as described below, contains some of the richest oil shale resources in the world (as reported by DOE and USGS sources).
In 2005, the U.S. Bureau of Land Management, or BLM, began implementation of the Energy Policy Act passed by Congress, seeking proposals from the private sector to develop the oil shale resources in economically and environmentally responsible ways. In June 2005, nominations were solicited and twenty proposals were submitted, including the proposal of E.G.L. Resources, Inc., or EGL Resources. The proposals, which included technical operational plans, were evaluated by an inter-disciplinary team including representatives from the affected states, as well as the DOE and the Department of Defense. A central feature of EGL Resource’s proposal was the then patent pending in-situ oil shale extraction process, Conduction, Convection, Reflux, or CCR, currently AMSO, LLC’s U.S. Patent 7,743,826. Further, proposals were subjected to environmental analysis under the terms of the National Environmental Policy Act and brought before public meetings in Colorado and Utah. The BLM issued a Finding of No Significant Impact for EGL Resources’ proposed plan of operations; and effective January 1, 2007, EGL Resources received a lease for research, development and demonstration, or RD&D Lease, in western Colorado, which it assigned to its affiliate, E.G.L. Oil Shale, L.L.C. (“EGL”). Out of twenty applications for RD&D Leases submitted, three companies were awarded leases in Colorado to test in-situ technologies (Shell, Chevron and EGL), and one company in Utah (OSEC) was awarded a lease for testing above ground retorting processes. In April 2008, EGL was acquired by AMSO and IDT and subsequently renamed American Shale Oil, LLC.
The RD&D Lease awarded by the BLM to EGL Resources and acquired by AMSO, LLC covers an area of 160 acres. The lease runs for a ten-year period beginning on January 1, 2007, and is subject to an extension of up to five years if AMSO, LLC can demonstrate that a process leading to the production of commercial quantities of shale oil is diligently being pursued. If AMSO, LLC can demonstrate the economic and environmental viability of its technology, it will have the opportunity to submit a one-time payment pursuant to the applicable regulations and convert its RD&D Lease to a commercial lease on 5,120 acres which overlap and are contiguous with the 160 acres covered by its RD&D Lease. AMSO, LLC’s initial plan is to target the illite-rich mining interval where the “illite” rich oil shale is located. As technologies are developed to facilitate environmentally sound extraction processes from additional areas of the oil shale formation, we would expect to pursue the remaining reserves within our commercial lease.
6
AMSO, LLC is utilizing a team of experienced experts in various fields to conduct research, development and demonstration activities. The team has conducted considerable site characterization, which includes exploration and ground water monitoring wells, coring, logging, and other analysis to further explore, understand and characterize the oil shale resources in its RD&D Lease area. During the third quarter of fiscal 2011, AMSO, LLC continued advanced stage construction work on the surface oil and gas processing facilities while drilling pilot wells for its pilot test in Colorado. The pilot test is intended to confirm the accuracy of several of the key underlying assumptions of AMSO, LLC’s proposed in-situ heating and retorting process. In January 2012, AMSO, LLC conducted a fully integrated commissioning test of the above and below ground facilities to determine their readiness for pilot test operations. The underground electric heater did not perform to specifications during the commissioning test. As a result, the manufacturers of the heater undertook extensive modifications and improvements. There were additional problems during a second commissioning test in December 2012. AMSO, LLC conducted a thorough readiness review and additional integrated testing, as well as acquiring additional equipment spares prior to beginning steady state pilot test operations. The preparations were completed and in early March 2013 AMSO, LLC initiated start-up of the oil shale pilot test. After approximately two weeks of operation, the down-hole electric heater failed. Pilot operations were too short to allow conclusions to be drawn about the ultimate viability of AMSO, LLC’s technical approach. AMSO, LLC subsequently decided not to attempt to re-engineer the current down-hole electrical heating system. Instead, it has initiated a comprehensive review of alternative heating system solutions. AMSO, LLC intends to qualify, design, engineer, build and thoroughly test the heating solution offering the best prospects for reliable pilot test operations. A key objective of the development process is to significantly de-risk the pilot operations before heater installation. In addition, this alternative heating system qualification process may result in development of a solution applicable to subsequent phases of the research, development and demonstration project’s operations. It is expected that the heater development process will continue into, and possibly through, 2014. Additionally, during the third quarter of 2013, AMSO, LLC launched a series of diagnostic tests to analyze the status of its pilot test's down-hole heating and production well system. AMSO, LLC is seeking to ascertain how the limited pilot test operations conducted in 2012 and 2013, including down-hole heating, have impacted the well system's condition and whether modifications to the pilot test’s operational plans will be required. Equipment modifications and technical issues are common in projects of the complexity and scope of the AMSO, LLC pilot test, particularly given the extent to which new concepts and applications have been incorporated into the pilot test’s design. Upon successful completion of the pilot test, AMSO, LLC will evaluate the appropriate timing to submit an application to convert its research, development and demonstration lease into a commercial lease. AMSO, LLC also expects to design and implement a larger scale demonstration project to further test its process and operations under commercial conditions, and assess scalability to commercial production levels.
Under current regulations, in order for the RD&D Lease to be converted into a commercial lease, AMSO, LLC will have to demonstrate the production of shale oil in commercial quantities, which is defined to mean production of shale oil where there is a reasonable expectation that the expanded operation would provide a positive return after all costs of production have been met, including the amortized costs of the capital investment. The BLM must also determine, following an analysis based on the National Environmental Policy Act, that commercial scale operations can be conducted without unacceptable environmental consequences, and the BLM will have a fair amount of discretion in making this determination. In order to convert the RD&D Lease to a commercial lease AMSO, LLC will also have to (a) demonstrate that it consulted with state and local officials to develop a plan for mitigating the socioeconomic impacts of commercial development on communities and infrastructure; (b) submit a nonrecurring conversion payment, which pursuant to applicable rules and regulations, will be equivalent to the greater of $1,000 per acre or the Fair Market Value (to be determined) of the commercial lease; (c) provide adequate bonding; and (d) conduct commercial operations in accordance with all applicable laws, rules, regulations or stipulations provided for. Further, in determining whether to convert the RD&D Lease into a commercial lease, the BLM will also analyze the commercial viability of shale oil production, which will depend on the market price of competing products at such time. Environmental challenges, however, have led the BLM to indicate that it intends to issue new regulations, which could affect the commercial royalty rates and potentially the conversion criteria, thereby making conversion to a commercial lease commercially unfeasible or impracticable.
Through the development of its technology and implementation of its plan of operations, AMSO, LLC hopes to provide a significant domestic supply of liquid fuels at a competitive price and with acceptable environmental impacts. AMSO, LLC believes that its technical and operating approaches could minimize the potential for adverse environmental impacts. AMSO, LLC’s patented CCR heating process and well layout plan have been, and continue to be, designed to maximize energy efficiency and minimize the number of wells needed and the impact on the surface of the lease area. By targeting the deep illite-rich oil shale under the known aquifers, AMSO, LLC expects to maintain the geologic barriers between retorts and protected water sources, and to minimize the amount of clean water needed for its operations. AMSO, LLC is also working diligently to meet emission standards, reduce carbon dioxide generation through thermal efficiency, and develop methods to sequester carbon dioxide generated during heating operations.
AMSO, LLC’s operating office is in Rifle, Colorado. AMSO, LLC is supported by AMSO and Genie professionals based in Newark, New Jersey. AMSO, LLC rents approximately 2,450 square feet of office space and 2,000 square feet of warehouse space in Rifle under operating leases with flexible terms and conditions.
AMSO, LLC incurred $8.6 million, $8.6 million, $9.2 million and $25.4 million for research and development in the years ended December 31, 2013 and December 31, 2012, the five months ended December 31, 2011, and the year ended July 31, 2011, respectively.
7
Israel Energy Initiatives, Ltd.
Israel Energy Initiatives, Ltd., or IEI, an Israeli company formed in March 2008, holds an exclusive Shale Oil Exploration and Production License awarded in July 2008 by the Government of Israel. The license covers approximately 238 square kilometers in the south of the Shfela region in central Israel. Under the terms of the license, IEI is to conduct a geological appraisal study across the license area, characterize the resource and select a location for a pilot plant in which it will demonstrate its in-situ technology. The initial term of the license was for three years until July 2011. The license has been extended until July 2014, and it may be further extended for one year through July 2015. According to Israeli law, as long as a license holder operates in compliance with a pre-approved plan, the State of Israel must grant an extension of the initial license term. IEI has discussed with the Ministry of Energy and Water regarding securing its rights beyond July 2015 and expects a satisfactory resolution of this matter. However, there is no guarantee the license will be extended, that a new license would be granted or that the license will not be successfully challenged by environmental or other opposition groups.
Assuming IEI successfully demonstrates a commercially viable and environmentally acceptable technology, IEI intends to apply for a long-term commercial lease from the Israeli government to build and operate a commercial project. Further, under the Israeli Petroleum Law, long-term leases are typically for a term of 30 years, with a possible extension for an additional 20 years.
In June 2013, IEI submitted its application for the construction and operation of its oil shale pilot test facility to the Jerusalem District Building and Planning Committee. IEI was asked to provide supplements to the environmental impact assessment. The revised application was submitted on November 3, 2013. On March 17, 2014, IEI was advised that the initial review process of the application conducted by the Jerusalem District Building and Planning Committee was concluded, and the application process was proceeding to the next stage, a review of the environmental documents by the Ministry of Environment.
The permit evaluation process is expected to take at least nine months from acceptance of a completed proposal by the Planning Committee and potentially significantly longer. During 2013, as per the required permitting process, IEI continued laboratory work, engineering work and associated preparation of the environmental permit applications related to the planned pilot.
IEI believes that Israel presents a unique opportunity for the development of a commercial scale oil shale industry. The country is almost entirely dependent on imported oil for its transportation needs, and energy security is therefore a significant strategic issue, as well as a material burden on the Israeli economy. Compared with other oil shale resources worldwide, IEI believes that the Shfela basin resource is thick, shallow and dry. Short distances in Israel significantly reduce infrastructure and operating costs. Israel has existing complex refining capacity, as well as an existing pipeline infrastructure. IEI believes that environmental concerns are materially mitigated by the fact that the local aquifer is geologically confined and located well below the target oil shale layer and thus is highly unlikely to be contaminated in the proposed process being developed. Further, IEI believes that no direct competition currently exists in Israel for the production of oil from shale.
IEI began its resource appraisal study in the third quarter of calendar 2009, and completed the field work included in its study in late calendar 2011. The resource appraisal was comprised primarily of a drilling operation conducted in the license area. The resource appraisal plan included drilling and coring several wells to depths of approximately 600 meters, as well as well logging, analysis of core materials and other geochemical tests, water monitoring and hydrology tests, laboratory analyses of samples and other laboratory experiments. To date, the results from the appraisal process, both from field tests and laboratory experiments, confirm IEI’s expectations as to the attractiveness of the oil shale resource in the license area from the standpoint of richness, thickness and hydrology. IEI is continuing permitting and other preparatory work required prior to construction of a pilot plant and operation of a pilot test. The pilot test will provide a basis for determining the technical, environmental and economic viability of IEI’s proposed process for extracting oil from the oil shale resource. IEI expects to begin construction of the pilot test in late 2014, barring further permitting, regulatory or litigation driven delays. IEI has not yet obtained all necessary permits for the pilot test. We expect continued, significant increases in the expenses reflecting the costs of facility construction, drilling and operations of the IEI pilot test, as well as additional staffing to support engineering and scientific operations and business development activities. We expect IEI’s pilot test to require approximately $30 million of investment over three years.
IEI operates out of IDT’s offices in Jerusalem and a field office and warehouse near the city of Beit Shemesh. In addition, IEI built and operates a research laboratory located on the campus of Ben Gurion University in Be’er Sheva.
IEI incurred $3.7 million, $7.2 million, $2.4 million, and $7.8 million for research and development in the years ended December 31, 2013 and 2012, the five months ended December 31, 2011, and the year ended July 31, 2011, respectively.
Afek Oil and Gas Ltd.
In April 2013, the Government of Israel finalized the award to Afek of an exclusive three year petroleum exploration license covering 396.5 square kilometers in the southern portion of the Golan Heights. Afek has retained seasoned oil and gas exploration professionals and has contracted with internationally recognized vendors to provide the services required for its exploration project. In 2013, Afek completed preliminary geophysical work including electromagnetic and gravimetric surveys and reprocessing of the 2D seismic data to characterize the subsurface prior to drilling exploration wells. Afek subsequently began the analysis of the acquired data internally and with outside oil exploration experts. In addition, Afek submitted a permit application to conduct a ten-well exploration drilling program to further characterize the resource in its license area. The exploration drilling program is scheduled to begin as early as the beginning of the second half of 2014 pending permitting. As of March 1, Afek’s drilling permit application received approval from the Planning and Construction Committee, North District to proceed with the next phase of the permit review process, which includes a 60-day public comment stage.
8
We incurred research and development expenses of $4.2 million for Afek in the year ended December 31, 2013.
Genie Mongolia
In April 2013, Genie Mongolia and the Petroleum Authority of Mongolia entered into an exclusive oil shale development agreement to explore and evaluate the commercial potential of oil shale resources in a 34,470 square kilometer area in Central Mongolia. The five year agreement allows Genie Mongolia to explore, identify and characterize the oil shale resource in the exclusive survey area and to conduct a pilot test using in-situ technology on appropriate oil shale deposits. To date, Genie Mongolia is the only recipient of an exclusive oil shale survey contract in Mongolia. During 2013, Genie Mongolia conducted initial surface and subsurface exploration work and is currently working to continue to characterize the geology in the licensed area. In parallel, Genie Mongolia is also working with regulators in Mongolia to secure commercial rights to any appropriate deposits on the licensed area after a successful exploration work and pilot test are concluded.
We incurred research and development expenses of $3.4 million and $2.1 million for Genie Mongolia in the years ended December 31, 2013 and December 31, 2012, respectively.
Other Projects
The Company evaluates additional potential exploration and development projects for oil shale and other conventional and unconventional energy resources in other locations. The energy development prospects vary in potential size, applied technology and potential time to commercial production. The prospects we evaluate or pursue are in various stages of development and it is unclear when or if they will be developed or commercialized or prove to be profitable. However, if one or more of these prospects were to be successfully commercialized, they could be significant in terms of their potential impact on our operations and financial condition, and could materially affect our financial results, future prospects and valuation.
Financing
The Company is considering sales of equity interests in the various GOGAS projects or in GOGAS to provide the necessary financing for such activities.
Competition
If Genie Oil and Gas is successful developing and producing commercial quantities of oil and gas from oil shale and other conventional and unconventional resources in an environmentally acceptable manner and receives all the necessary regulatory approvals, then, in the commercial production phases of operations, it will likely face competition from conventional and unconventional oil producers, other fossil fuels and other alternative energy providers in marketing and selling refined products and natural gas. Many of the potential competitors, including national oil companies, are larger and have substantially greater resources to be able to withstand the volatility of the oil and gas market (i.e. price, availability, refining capacity, etc.).
Regulation
AMSO, LLC was granted an RD&D Lease by the BLM for 10 years beginning on January 1, 2007 with up to a 5-year extension upon demonstration that a process leading up to the production of commercial quantities of shale oil is diligently pursued. Throughout the term of the RD&D Lease, AMSO, LLC will execute various activities and milestones within the technical phases of its research and development plan with the aim of ultimately converting its RD&D Lease to a long term commercial lease.
In order to execute these activities and milestones, AMSO, LLC must obtain the necessary permitting and comply with the various rules, regulations, and policies spanning multiple regulatory bodies and governmental agencies at various levels. In connection with the site characterization phase (which AMSO, LLC completed) and the pilot phase (which is ongoing), AMSO, LLC has been working to ensure compliance with rules, regulations, and policies of the BLM and the Department of Environmental Protection at the federal level, with the Colorado Division of Reclamation and Mining Service and the Air Pollution Control Division and the Water Control Division of the Colorado Department of Public Health and Environment at the state level, and with Rio Blanco County at the county level. In accordance with the technical and regulatory requirements of the RD&D Lease, in May 2009, AMSO, LLC submitted its in-situ Plan of Development to the BLM. In September 2009, the BLM approved AMSO, LLC’s Plan of Development, allowing AMSO, LLC to proceed with implementation, subject to compliance with Colorado’s permitting requirements (which AMSO, LLC has satisfied). AMSO, LLC continues to refine its Plan of Development in conjunction with its ongoing operations, and the BLM has approved such modifications.
Although AMSO, LLC has diligently worked to satisfy the regulatory requirements and challenges necessary for implementing the site characterization and initial pilot phase of the project, it is difficult at this time to predict all of the compliance requirements that may be necessary throughout the life of the project.
IEI holds an exclusive Shale Oil Exploration and Production License that was extended until July 2013. While IEI expects the license to be further extended in one year increments until July 2015 (the maximum term of a license under Israeli Law is seven years), IEI has applied to the Ministry of Energy and Water in a request to secure its rights over the license period beyond the seven year limit set forth in the Petroleum Law, citing past precedents and the Force Majure doctrine in Israeli Law. Based on third party analysis and initial feedback from the Ministry, we estimate that this issue will be satisfactorily resolved. However, there is no guarantee the license will be extended as described above or that a new license would be granted. The license is subject to certain conditions and milestones and the failure to achieve those milestones may result in the termination, revocation, suspension or limitation of the license.
9
In order to execute its plan of operation, IEI must obtain and comply with a large number of permits and authorizations from various government agencies, local authorities and other regulators and interested parties in Israel, such as the District Planning Committee, the Ministry of Environmental Protection, the Israel Defense Forces and many others. IEI believes it has met all such requirements to date and will continue to do so in the future, but the regulatory process may considerably delay our operations. To date, IEI’s plans have faced considerable opposition from environmental and local groups, and two separate proceedings have been brought before the Supreme Court of Israel in unsuccessful attempts to stop the project.
In order to execute its long term commercial plan, IEI must obtain a Lease under the Petroleum Law. A lease is granted for an initial period of up to 30 years, with possible extension for an additional 20 years. Such a lease can be granted if a “Discovery” under the Law is declared by the Petroleum Commissioner during the license period. However, we are unaware of any clear guidelines, criteria or precedent of how that term applies to oil shale.
Afek holds an exclusive exploration license in the Golan Heights. Afek also submitted permit applications to conduct a ten-well exploration drilling program. In January 13, 2014, the first hearing of Afek’s application was conducted, and permission was granted to move forward to the next stage in the permitting process – the public notice and public comments period. The international community considers the Golan Heights an internationally disputed territory, and therefore political risk may affect our ability to execute our plan of operations. This may influence local decision makers, as well as service providers necessary to our operations.
According to the Mongolian constitution, all minerals and other natural resources in the ground are owned by the Mongolian state. A mining license holder does not own the minerals, but is entitled to extract and sell the minerals located within the land area covered by the license on and subject to the terms of the laws. Since commercial oil shale operations are very new in Mongolia and no specific law regulates such business, there is an ambiguity about which law should govern. With the purpose of clarifying the ambiguity related to oil shale operations, a bill is currently being discussed by the relevant parliament committees and is expecting approval during 2014.
While a comprehensive environmental regulatory regime exists in Mongolia, historical enforcement of environmental obligations has not been adequate. Nevertheless, Genie Mongolia will need to comply with the Mongolian environmental laws, as the law imposes sanctions for non-compliance with environmental obligations and legal requirements, including potential termination or suspension of activities, confiscation of any income arising from such activities, monetary fines and revocation of a mining license. The Criminal Law specifies some criminal charges (heavier monetary fines or imprisonment) for severe environmental violations that result in significant damage to human health, property or flora and fauna.
Finally, in order to engage in mining operations, mining license holders must enter into either a “land possession” or “land use” agreement with the governing authorities of local
soums
and obtain a land certificate. A standard land possession or land use contract indicates the terms of the miner's land use, amount of annual land fees (fixed per hectare as defined by the Government) and duties and entitlements of the contracting parties, namely the
soum
governor and the mining company.
Intellectual Property
We rely on a combination of patents, copyrights, trademarks, domain name registrations and trade secret laws in the United States and other jurisdictions and contractual restrictions to protect our intellectual property rights and our brand names. All of our employees sign confidentiality agreements. These agreements provide that the employee may not use or disclose our confidential information except as expressly permitted in connection with the performance of his or her duties for us, or in other limited circumstances. These agreements also state that, to the extent rights in any invention conceived of by the employee while employed by us do not vest in the Company automatically by operation of law, the employee is required to assign his or her rights to us.
In connection with its RD&D process and related technologies, some patents are registered in the name of AMSO, LLC and some patents are registered in the name of Genie IP BV., a Dutch subsidiary of the Company. AMSO, LLC owns four patents issued in the United States, seven patents issued abroad, two of which are jointly owned with Lawrence Livermore National Security, LLC (“LLNS”), as well as several pending applications, both in the United States and abroad. The issued or allowed patents include: patent No. 7,743,826 (US), which expires April 16, 2028; patent No. 7,921,907 (US), which expires January 19, 2027; patent No. 8,162,043 (US), which expires January 19, 2027, patent No. 8,464,792 (US), which expires July 27, 2031; patent registration No. 3668 (Mongolia) which expires December 25, 2032; patent registration No. 32691 (Morocco), granted jointly to AMSO, LLC and LLNS on October 1, 2011, which expires September 30, 2029; patent registration No. 3565 (Mongolia), granted jointly to AMSO, LLC and LLNS on April 13, 2012 which expires March 29, 2031; patent No. 508 (Madagascar), granted on December 2, 2011, which expires November 2, 2029; patent registration No. 3590 (Mongolia), granted on April 13, 2012, which expires April 22, 2031; patent No. 32765 (Morocco), granted on November 1, 2011, which expires November 2, 2029,;and patent registration No. 2,741,861 (Canada), granted on August 27, 2013, which expires November 2, 2029. Genie IP B.V. owns Mongolian utility models 2050, 2052, 2053, 2054, 2055, and 2067 which all expire on January 23, 2019. The patents and utility models are directed to in-situ methods and systems for the extraction of oil from shale, integral to our technical and operational plans, as well as carbon sequestration in depleted oil shale deposits and down-hole heater technologies. AMSO has also been granted three trademarks in the United States in connection with its operations.
10
Genie IP B.V. has seven published international Patent Cooperation Treaty (PCT) applications, three published Israeli patent applications and additional unpublished patent applications. Some of these patent applications relate to methods and apparatus for oil extraction from shale, some of these patent applications relate to downstream processing of oil extracted from shale, and some of these patent applications relate to techniques for locating and extracting unconventional naturally-occurring oil from a tight formation.
Employees
AMSO (including AMSO, LLC) employs 16 full-time employees, including a secondee assigned by Total, while IEI employs approximately 20 full-time employees, Afek employs 3 full-time employees and Genie Mongolia employs 14 employees. AMSO, IEI, Afek and Genie Mongolia also retain the services of a number of professional consultants, including geologists, hydrologists, drilling and completions engineers, process engineers, environmental experts, permitting consultants, energy experts, legal, and land designation and acquisition consultants.
Industry Segments and Geographic Areas
For disclosure regarding our industry segments and geographic areas, please see Note 16 to our Consolidated Financial Statements in this Annual Report.
RISK FACTORS
Our business, operating results or financial condition could be materially adversely affected by any of the following risks as well as the other risks highlighted elsewhere in this document, particularly the discussions about regulation, competition and intellectual property. The trading price of our Class B common stock and Series 2012-A Preferred Stock could decline due to any of these risks.
Risks Related to IDT Energy
The REP business is highly competitive, and we may be forced to cut prices or incur additional costs.
IDT Energy faces substantial competition both from the traditional incumbent utilities as well as from other REPs, including REP affiliates of the incumbent utilities in specific territories. As a result, we may be forced to reduce prices, incur increased costs or lose market share and cannot always pass along increases in commodity costs to customers. We compete on the basis of provision of services, customer service and price. Present or future competitors may have greater financial, technical or other resources which could put us at a disadvantage. Additionally, our experience has shown that utilities don’t change their sell rates offered to customers immediately in response to increased prices for the underlying commodities. There is a time lag before utilities increase prices to reflect their increased costs and market prices for commodities. In times of high commodity prices, REPs like IDT Energy that offer a variable rate product can suffer from being compared to utilities less variable rate.
IDT Energy’s growth depends on its ability to enter new markets.
New markets for our business are determined based on many factors, which include the regulatory environment, as well as IDT Energy’s ability to procure energy in an efficient and transparent manner. We seek to purchase wholesale energy where there is a real time market that reflects a fair price for the commodity for all participants. Once new markets are determined to be suitable for IDT Energy, we will expend substantial efforts to obtain necessary licenses and will incur significant customer acquisition costs and there can be no assurance that we will be successful in new markets. Furthermore, there are regulatory differences between the markets that we currently operate in and new markets, including, but not limited to, exposure to credit risk, additional churn caused by tariff requirements, rate-setting requirements and incremental billing costs. In 2013, we faced challenges and delays in licensing for new territories, particularly in Pennsylvania. A failure to identify, become licensed in, and enter new territories may have a material negative impact on our growth, financial condition and results of operations
Unfair business practices or other activities of REPs may adversely affect us.
Competitors in the highly competitive REP market engage in unfair business practices to sign up new customers. Competitors engaging in unfair business practices create an unfavorable impression about our industry on consumers or with regulators or political bodies. Such unfair practices by other companies can adversely affect our ability to grow or maintain our customer base. The successes, failures or other activities of various REPs within the markets that we serve may impact how we are perceived in the market.
Demand for REP services and consumption by customers are significantly related to weather conditions.
Typically, colder winters and hotter summers create higher demand and consumption for natural gas and electricity, respectively. Milder than normal winters and/or summers may reduce the demand for our energy services, thus negatively impacting our financial results.
11
Our current strategy is based on current regulatory conditions and assumptions, which could change or prove to be incorrect.
Regulation over the electricity and natural gas markets has been in flux at the state and federal levels. In particular, any changes adopted by the FERC, or changes in state or federal laws or regulations (including greenhouse gas laws) may affect the prices at which IDT Energy purchases electricity or natural gas for its customers. While we endeavor to pass along increases in energy costs to our customers pursuant to our variable rate customer offerings, we may not always be able to do so due to competitive market forces and the risk of losing our customer base. In addition, potential regulatory changes may impact our ability to use our established sales and marketing channels. Any changes in these factors, or any significant changes in industry development, could have an adverse effect on our revenues, profitability and growth or threaten the viability of our current business model.
Regulatory conditions can affect the amount of taxes and fees we need to pay and our pricing advantages.
We are subject to audits in various jurisdictions for various taxes, including income tax, utility excise tax and sales and use tax. Aggressive stances taken recently by regulators increase the likelihood of our having to pay additional taxes and fees in connection with these audits. In the future, we may seek to pass such charges along to our customers, which could have an adverse impact on our pricing advantages.
Commodity price volatility could have an adverse effect on our cost of revenues and our results of operations.
Volatility in the markets for certain commodities can have an adverse impact on our costs for the purchase of the electricity and natural gas that IDT Energy sells to its customers. We may not always choose to pass along increases in costs to our customers to protect overall customer satisfaction. This would have an adverse impact on our margins and results of operations. Alternatively, volatility in pricing for IDT Energy's electricity and natural gas related to the cost of the underlying commodities can lead to increased customer churn. In times of high commodity costs, our variable pricing model and commodity purchasing approach can lead to competitive disadvantages as we must pass along all or some portion of our increased costs to our customers.
We face risks that are beyond our control due to our reliance on third parties and our general reliance on the electrical power and transmission infrastructure within the United States.
Our ability to provide energy delivery and commodity services depends on the operations and facilities of third parties, including, among others, BP, NYISO and PJM. Our reliance on the electrical power generation and transmission infrastructure within the United States makes us vulnerable to large-scale power blackouts. The loss of use or destruction of third party facilities that are used to generate or transmit electricity due to extreme weather conditions, breakdowns, war, acts of terrorism or other occurrences could greatly reduce our potential earnings and cash flows.
The REP business, including our relationship with our suppliers, is dependent on access to capital and liquidity.
Our business involves entering into contracts to purchase large quantities of electricity and natural gas. Because of seasonal fluctuations, we are generally required to purchase electricity or natural gas in advance and finance that purchase until we can recover such amounts from revenues. IDT Energy has a Preferred Supplier Agreement with BP pursuant to which BP is our preferred provider of electricity and natural gas. In addition to other advantages of this agreement, we are no longer required to post security with most suppliers other than BP. There can be no assurance that we will be able to maintain the required covenants, that BP will be able to maintain their required credit rating, or that the agreement will be renewed upon its expiration in June 2015. In addition, the security requirements outside of the BP agreement may increase as we enter other markets. Difficulty in obtaining adequate credit and liquidity on commercially reasonable terms may adversely affect our business, prospects and financial conditions.
A revision to certain utility best practices and programs in which we participate and with which we comply could disrupt our operations and adversely affect our results and operations.
Certain retail access “best practices” and programs proposed and/or required by state regulators have been implemented by utilities in most of the service territories in which we operate. One such practice is participation in purchase of receivables, or POR, programs under which certain utilities purchase customer receivables for approximately 98.5% of their face value in exchange for a first priority lien in the customer receivables without recourse against a REP. This program is a key to our control of bad debt risk in our REP business in New York and a similar program is important to us in Pennsylvania. On February 25, 2014, the New York Public Service Commission issued an order calling for numerous modifications to the Uniform Business Practices (UBP), the set of rules that govern the retail energy industry in New York. These modifications include some changes to the POR program. The details of the changes and the manner of their implementation will be the subject of an upcoming collaborative meeting between the utilities and the REPs. We may need to adjust our current strategy regarding customer acquisition and our focus on the growth of our customer base. We would also need to adjust our current business plan to reduce our exposure to existing customers who may pose a bad debt risk. Any failure to properly respond to changing conditions could adversely affect our results of operations and profitability.
In addition, on June 23, 2008, NYPSC issued its Order Establishing Energy Efficiency Portfolio Standard, or EEPS, and Approving Programs setting a goal of gradually reducing electricity usage by 15% statewide by 2015 and requiring the utilities to file energy efficiency programs consistent with the policies and cost/benefit factors adopted by the NYPSC. Since 2009, the NYPSC has approved 90 electric and natural gas energy efficiency programs to implement the EEPS policy. We cannot predict the impact of the EEPS on the electricity usage of our customers. There could be an adverse effect on the result of operations of our REP business if the EEPS results in a reduction in the aggregate amount of customer demand.
12
In New Jersey, customers who are delinquent in paying their invoices are no longer eligible to receive a consolidated utility invoice. A consolidated utility invoice is similar to a purchase of receivables program since the utility has the responsibility to bill the customer and collect the receivable. Instead, those customers are switched to a dual bill arrangement, whereby IDT Energy is responsible to bill and collect the commodity portion of the customers’ invoices. Once we invoice these customers under a dual bill arrangement, we have bad debt risk associated with that portion of our revenues. Economic conditions, the creditworthiness of our customers in New Jersey and our ability to collect from these customers, among other things, may impact our profitability.
The REP business depends on maintaining the licenses in the states we operate and any loss of those licenses would adversely affect our business, prospects and financial conditions.
IDT Energy requires licenses from public utility commissions and other regulatory organizations to operate its business. Those agencies may impose various requirements to obtain or maintain licenses. Further, certain non-governmental organizations have been focusing on the REP industry and the treatment of customers by certain REPs. Any negative publicity regarding the REP industry in general and IDT Energy in particular or any increase in customer complaints regarding IDT Energy could negatively affect our relationship with the various commissions and regulatory agencies and could negatively impact our ability to obtain new licenses to expand operations or maintain the licenses currently held. Any loss of our REP licenses would cause a negative impact on our results of operations, financial condition and cash flow.
The REP business depends on the continuing efforts of our management team and our personnel with strong industry or operational knowledge and our efforts may be severely disrupted if we lose their services.
Our success depends on key members of our management team, the loss of whom could disrupt our business operation. Our business also requires a capable, well-trained workforce to operate effectively. There can be no assurance that we will be able to retain our qualified personnel, the loss of whom may adversely affect our business, prospects and financial conditions.
We could be harmed by network disruptions, security breaches, or other significant disruptions or failures of our IT infrastructure and related systems.
To be successful, we need to continue to have available a high capacity, reliable and secure network. We face the risk, as does any company, of a security breach, whether through cyber-attack, malware, computer viruses, sabotage, or other significant disruption of our IT infrastructure and related systems. We face a risk of a security breach or disruption from unauthorized access to our proprietary or classified information on our systems. Certain of our personnel operate in jurisdictions that could be a target for cyber-attacks. The secure maintenance and transmission of our information is a critical element of our operations. Our information technology and other systems that maintain and transmit our information, or those of service providers or business partners, may be compromised by a malicious third party penetration of our network security, or that of a third party service provider or business partner, or impacted by advertent or inadvertent actions or inactions by our employees, or those of a third party service provider or business partner. As a result, our information may be lost, disclosed, accessed or taken without our consent.
Although we make significant efforts to maintain the security and integrity of these types of information and systems, there can be no assurance that our security efforts and measures will be effective or that attempted security breaches or disruptions would not be successful or damaging, especially in light of the growing sophistication of cyber-attacks and intrusions. We may be unable to anticipate all potential types of attacks or intrusions or to implement adequate security barriers or other preventative measures.
Network disruptions, security breaches and other significant failures of the above-described systems could (i) disrupt the proper functioning of these networks and systems, and therefore, our operations; (ii) result in the unauthorized access to, and destruction, loss, theft, misappropriation or release of our proprietary, confidential, sensitive or otherwise valuable information, including trade secrets, which others could use to compete against us or for disruptive, destructive or otherwise harmful purposes and outcomes; (iii) require significant management attention or financial resources to remedy the damages that result or to change our systems; or (iv) result in a loss of business, damage our reputation or expose us to litigation. Any or all of which could have a negative impact on our results of operations, financial condition and cash flows.
Our growth strategy depends, in part, on our acquiring complementary businesses and assets and expanding our existing operations, which we may be unable to do.
Our growth strategy is based, in part, on our ability to acquire businesses and assets that are complimentary to our existing operations. We may also seek to acquire other businesses. The success of this acquisition strategy will depend, in part, on our ability to accomplish the following:
|
•
|
identify suitable businesses or assets to buy;
|
|
•
|
complete the purchase of those businesses on terms acceptable to us;
|
|
•
|
complete the acquisition in the time frame we expect;
|
|
•
|
improve the results of operations of the businesses that we buy and successfully integrate their operations into our own; and
|
|
•
|
avoid or overcome any concerns expressed by regulators, including antitrust concerns.
|
13
There can be no assurance that we will be successful in pursuing any or all of these steps. Our failure to implement our acquisition strategy could have an adverse effect on other aspects of our business strategy and our business in general. We may not be able to find appropriate acquisition candidates, acquire those candidates that we find or integrate acquired businesses effectively or profitably.
Risks Related to Genie Oil and Gas
We have no current production of oil and gas and we may never have any.
We do not have any current production of oil and gas. We cannot assure you that we will produce or market shale oil or gas at all or in commercially profitable quantities. Our ability to produce and market oil and gas may depend upon our ability to develop and operate our planned projects and facilities, which may be affected by events or conditions that impact the advancement, operation, cost or results of such projects or facilities, including:
|
•
|
Energy commodity prices relative to production costs;
|
|
•
|
The occurrence of unforeseen technical difficulties;
|
|
•
|
The outcome of negotiations with potential partners, governmental agencies, regulatory bodies, suppliers, customers or others;
|
|
•
|
Changes to existing legislation or regulation governing our current or planned operations;
|
|
•
|
Our ability to obtain all the necessary permits to operate our facilities;
|
|
•
|
Changes in operating conditions and costs, including costs of third-party equipment or services such as drilling and processing and access to power sources; and
|
|
•
|
Security concerns or acts of terrorism that threaten or disrupt the safe operation of company facilities.
|
In-situ technology for the extraction of oil and gas from oil shale is in its early stages of development and has not been deployed commercially at large scale. AMSO, LLC, Genie Mongolia and IEI may not be able to develop environmentally acceptable and economically viable technology in connection therewith.
Our strategy is substantially predicated on the production and extraction of oil and gas from unconventional resources, defined as any resource other than the traditional oil well. Our initial activity is in the in-situ production of oil and gas from oil shale, which is typically more costly and is less established technically than traditional oil and gas production and therefore, incurs a higher degree of technology risk. The greater cost increases the risk that we will not be profitable given commodity price fluctuations, assuming we enter into commercial production.
Operating hazards and uninsured risks with respect to the oil and gas operations may have material adverse effects on our operations.
Our research, exploration and, if successful, development and production operations are subject to risks similar to those normally incident to the exploration for and the development and production of oil and gas, including blowouts, subsidence, uncontrollable flows of oil, gas or well fluids, fires, pollution and other environmental and operating risks. These hazards could result in substantial losses due to injury or loss of life, severe damage to or destruction of property and equipment, pollution and other environmental damage and suspension of operations. While as a matter of practice we have insurance against some or all of these risks, such insurance may not cover the particular hazard and may not be sufficient to cover all losses. The occurrence of a significant event adversely affecting any of our operations could have a material adverse effect on us, could materially affect our continued operations and could expose us to material liability.
Genie Oil and Gas’ dependence on contractors, equipment and professional services that have limited availability could result in increased costs and possibly material delays in their respective work schedules.
Due to the lack of available technical resources with in-situ hydrocarbon production experience, the costs for our operations may be more expensive than planned or there could be delays in our operating plans. We are also more likely to incur delays in our drilling and operating schedule and we may not be able to meet our required work schedule. Similarly, some of the professional personnel we need for our planned operations are not available in the locations in which we operate or are not available on short notice for work in such location, and, therefore, we may need to use overseas contractors for various projects. Any or all of the factors specified above may result in increased costs and delays in our work schedule.
Genie Oil and Gas will require substantial funds and will need to raise additional capital in the future.
We will need substantial funds to fully execute our research and development activities, and, if those activities are successful, we will need additional substantial funds to commence our anticipated commercial operations, if any. Failure to secure adequate funding could adversely affect our ability to advance our strategic plans as currently contemplated and require us to delay, scale back, or shut down our operations.
In January 2011, Total completed funding of its committed capital contributions to AMSO, LLC, and, accordingly, Total has the option to terminate its obligations to make additional capital contributions and withdraw as a member of AMSO, LLC. In the first quarter of 2014, AMSO did not fund the capital call, and in January 2014, Total actually funded AMSO’s share, which was $0.9 million and as a result, AMSO’s ownership interest in AMSO, LLC was reduced to 48.16% and Total’s ownership interest increased to 51.84%. However, if Total exercises its option and terminates its future funding, we will need to find other sources of funding or otherwise risk shutting down AMSO, LLC’s operations.
14
Genie Oil and Gas’ success depends on the continuing efforts of key personnel and certain strategic partners, and our efforts may be severely disrupted if we lose their services.
Our future success depends, to a significant extent, on our ability to attract and retain qualified technical personnel, particularly those with expertise in the oil and gas industry and with in-situ hydrocarbon projects. There is substantial competition for qualified technical personnel, and there can be no assurance that we will be able to attract or retain our qualified technical personnel. Specifically, we heavily rely on the services of the members of the management and technical teams at AMSO, LLC and IEI, including Harold Vinegar, Ph.D. at IEI, Afek and Genie Mongolia and Alan Burnham, Ph.D. at AMSO, LLC, for their technical expertise, assistance in the development of our intellectual property and guidance on building out a pilot/commercial facility for potential commercial production. Specifically, Dr. Vinegar has a long-term employment agreement with us through 2017. In addition, AMSO, LLC is dependent on Total (as discussed more fully in Item 1 to Part I of this Annual Report) for technical expertise, financial support and guidance.
The unexpected loss of the services of one or more of these people and/or the technical expertise and support of certain partners, and the ability to find suitable replacements within a reasonable period of time thereafter, could have a material adverse effect on our operations.
There are uncertainties associated with AMSO, LLC’s lease, Genie’s IEI and Afek licenses and Genie Mongolia’s Joint Survey Agreement.
AMSO, LLC’s lease for research, development and demonstration, or RD&D Lease, runs for a 10-year period expiring at the end of 2016, with a possible extension of up to five years upon demonstration that a process leading up to the production of commercial quantities of shale oil is diligently being pursued. The terms of the RD&D Lease do not guarantee that the BLM will grant a commercial lease. Further, there is significant environmental opposition to the commercial production of shale oil. Under current regulation, there are numerous conditions and requirements, the evaluation of which is subject to considerable discretion by the BLM, that AMSO, LLC will have to satisfy in order to convert its RD&D Lease into a commercial lease prior to the expiration of the RD&D Lease term. These conditions, which are more fully discussed in Item 1to Part I of this Annual Report, require AMSO, LLC to demonstrate, among other things, an economically viable commercial production process which will likely depend upon the prices of competing products, including conventional oil. There can be no assurance that AMSO, LLC will satisfy all of these conditions and requirements. Additionally, there have been proposed changes to the regulations governing commercial leases such as the lease into which AMSO, LLC intends to convert its RD&D Lease. The BLM indicated that it intends to issue new commercial oil shale regulations, which could affect the commercial royalty rates and the conversion criteria. Although the conversion terms of AMSO, LLC’s RD&D Lease provide for applicability of the existing regulatory scheme, we cannot assure you that we will not be subjected to more restrictive or less favorable regulations.
IEI holds an exclusive Shale Oil Exploration and Production License that covers approximately 238 square kilometers in the south of the Shfela region in Israel. The license expires in July 2014. The initial term of the license was for three years until July 2011. The license has been extended, and it may be further extended in one year increments until July 2015 (the maximum term of a license under Israeli Law is seven years). Although the license may be further extended and IEI may also apply for a new license, there is no guarantee the license will be extended, that a new license would be granted or that the license will not be successfully challenged by environmental or other opposition groups. The license is subject to certain conditions and milestones and the failure to reach those milestones may result in the termination, revocation, suspension or limitation of the license. Our ability to construct the pilot plant is dependent on recently enacted permitting regulations, and there is no guarantee that we will be able to obtain the required permits under the new regulations in a timely manner or at all.
In April 2013, the Government of Israel finalized the award to Afek of an exclusive three year petroleum exploration license covering 396.5 square kilometers in the southern portion of the Golan Heights. Because of the dispute as to the status of the Golan Heights, operations under the license may initiate international criticism, sanctions and boycotts. The political uncertainties surrounding the Golan Heights may result in (i) questions regarding the validity of the license granted to Afek by the State of Israel,; (ii) disputed titles to any resources extracted; (iii) possible sanctions on Afek or Genie or restrictions on sale of any extracted resources; and (iv) possible negative publicity or other adverse public activities or perceptions of Afek and the Company. In addition, if the Golan Heights are returned to Syria by Israel, the continuation of Afek’s license would be in doubt.
In April 2013, Genie Mongolia and the Petroleum Authority of Mongolia entered into an exclusive oil shale development agreement to explore and evaluate the commercial potential of oil shale resources in a 34,470 square kilometer area in Central Mongolia. Genie Mongolia is in the process of negotiating terms with the government of Mongolia to obtain a contract to commercially produce oil and gas from oil, shale but there is no assurance that it will be successful in obtaining these on commercially reasonable terms.
15
Genie Oil and Gas is subject to regulatory, legal and political risks that may limit its operations.
Our operations and potential earnings may be affected from time to time in varying degree by regulatory, legal and political factors, including laws and regulations related to environmental or energy security matters, including those addressing alternative and renewable energy sources and the risks of global climate change. Such laws and regulations continue to increase in both number and complexity and affect our operations with respect to, among other things:
|
•
|
The discharge of pollutants into the environment;
|
|
•
|
The handling, use, storage, transportation, disposal and cleanup of hazardous materials and hazardous and nonhazardous wastes;
|
|
•
|
The dismantlement, abandonment and restoration of our properties and facilities at the end of their useful lives;
|
|
•
|
Restrictions on exploration and production;
|
|
•
|
Loss of petroleum rights, including key leases, licenses or permits;
|
|
•
|
Tax or royalty increases, including retroactive claims;
|
|
•
|
Intellectual property challenges that would limit our ability to use our planned in-situ production technologies; and
|
|
•
|
Political instability, war or other conflicts in areas where we operate.
|
For example, in March 2011, the Israeli Parliament passed a bill materially increasing the overall taxes, royalties and other fees due to the Israeli government from revenues derived by oil and natural gas producers. The Israeli Income Tax Ordinance was revised accordingly and the amount payable to the government from revenues derived by oil and natural gas producers increased from a maximum of 32% to 52%. This tax will only be imposed once a project has passed certain milestones set forth in the ordinance (when the profits derived from a certain field have reached 150% of the original investment in that field).
Emerging markets are subject to greater risks than more developed markets, including significant legal, economic and political risks.
Mongolia does not possess as sophisticated and efficient business, regulatory, power and transportation infrastructures as generally exist in more developed market economies. Particularly, the legal system of Mongolia is less developed than those of more established jurisdictions, which may result in risks such as: the lack of effective legal redress in the courts; a higher degree of discretion on the part of governmental authorities,;delays caused by the extensive bureaucracy; the lack of judicial or administrative guidance on interpreting applicable laws and regulations; inconsistencies or conflicts between and within various laws, regulations, decrees, orders and resolutions; and relative inexperience of the judiciary and courts in such matters. As a result, there may be ambiguities, inconsistencies and anomalies in the agreements, licenses and title documents through which Genie Mongolia holds its interests in Mongolia, or the underlying legislation upon which those interests are based. Many laws have been enacted, but in many instances they are neither understood nor enforced and may be applied in an inconsistent, arbitrary or unfair manner.
AMSO, LLC’s RD&D Lease is subject to other third party lease interests.
There are other mineral leases which are collocated with AMSO, LLC’s lease interests, including the territory designated for AMSO LLC’s commercial lease conversion. While some of these other leases are subject to special oil shale stipulations requiring the leaseholders to minimize potential impacts and prevent interference with oil shale development, others are not. Although AMSO, LLC works to coordinate drilling plans and operations with these collocated leaseholders to preserve the integrity of its resource and operations, we cannot guaranty that these collocated leases will not interfere with AMSO LLC’s operations.
Regulation of greenhouse gas emissions could increase Genie Oil and Gas’ operational costs, cause delays and/or restrict our operations.
The production and processing of oil shale will result in some emission of greenhouse gases. International agreements and national or regional legislation and regulatory measures to limit greenhouse emissions are currently in various phases of discussion or implementation. The Kyoto Protocol and other actual or pending federal, state and local regulations envision a reduction of greenhouse gas emissions through market-based trading schemes. As a result of these and other potential environmental regulations, if our research and development activities are successful and we eventually begin commercial production, we can expect to incur additional capital, compliance, operating, maintenance and remediation costs. To the extent these costs are not ultimately reflected in the price of the products we sell, our operating results will be adversely affected.
The oil and gas industry is subject to the general inherent industry and economic risks.
The oil and gas business is fundamentally a commodity business. This means that potential future commercial operations and earnings may be significantly affected by changes in oil and gas prices and by changes in margins on gasoline, natural gas and other refined products.
We may be exposed to infringement or misappropriation claims by third parties, which, if determined adversely to us, could cause us to lose significant rights and pay significant damage awards.
Our success also depends largely on our ability to use and develop our technology and know-how without infringing on the intellectual property rights of third parties. The validity and scope of claims relating to our technology involve complex scientific, legal and factual questions and analysis. It is therefore difficult to accurately predict whether or not a third party will assert that we are infringing on its intellectual property or whether it would prevail. Although we are not currently aware of any infringement or of any parties pursuing or intending to pursue infringement claims against us, we cannot assure you that we will not be subject to such claims in the future. Also, in many jurisdictions, patent applications remain confidential and are not published for some period after filing. Thus, we may be unaware of other parties’ pending patent applications that relate to our processes. While at present we are unaware of competing patent applications, such applications could potentially surface.
16
The defense and prosecution of intellectual property suits, patent opposition proceedings and related legal and administrative proceedings can be both costly and time consuming and may significantly divert the efforts and resources of our technical and management personnel. An adverse determination in any such litigation or proceedings to which we may become a party could subject us to significant liability to third parties, require us to seek licenses from third parties, to pay ongoing royalties, to redesign our products, or subject us to injunctions prohibiting the manufacture and sale of our products or the use of our technologies.
Risk Related to Our Financial Condition and Reporting
We hold significant cash and cash equivalents, restricted cash, certificates of deposit, and marketable securities that are subject to various market risks.
As of December 31, 2013, we had cash and cash equivalents, restricted cash, certificates of deposit, and marketable securities of $93.8 million. As a result of various market risks, the value of these holdings could be materially and adversely affected.
We have identified material weaknesses in our internal control over financial reporting, and if we fail to remediate these material weaknesses and maintain proper and effective internal control over financial reporting, our ability to produce accurate and timely financial statements could be impaired and may lead investors and other users to lose confidence in our published financial data.
Maintaining effective internal control over financial reporting is necessary for us to produce reliable financial statements. In evaluating the effectiveness of our internal control over financial reporting as of December 31, 2013, management identified material weaknesses in the Company’s internal control over financial reporting. Specifically, a material weakness regarding the effectiveness of management’s financial reporting close process controls at IDT Energy division, specifically those relating to the approval of journal entries and the adequate review of subsidiary financial statements and variance analysis has been identified and described in management’s assessment.
We are committed to taking steps to remediate the material weaknesses. We will work to continually improve our internal control process and will diligently review our financial reporting controls and procedures.
Risks Related to Our Capital Structure
Holders of our Class B common stock and Series 2012-A Preferred Stock have significantly less voting power than holders of our Class A common stock.
Holders of our Class B common stock and Series 2012-A Preferred Stock are entitled to one-tenth of a vote per share on all matters on which our stockholders are entitled to vote, while holders of our Class A common stock are entitled to three votes per share. As a result, the ability of holders of our Class B common stock and Series 2012-A Preferred Stock to influence our management is limited.
Holders of our Series 2012-A Preferred Stock are entitled to an annual dividend and such payments may have a negative impact on the Company’s cash flow.
Holders of our Series 2012-A Preferred Stock are entitled to receive an annual dividend, payable quarterly in cash. The payment of such dividend could have a negative impact on the Company’s cash flow and cash balances. If dividends on any shares of the Series 2012-A Preferred Stock are in arrears for six or more quarters, whether or not consecutive, holders of the Series 2012-A Preferred Stock shall have the right to elect two (2) additional directors to serve on our Board, and this could have a negative impact on the market price of our equity securities.
We are controlled by our principal stockholder, which limits the ability of other stockholders to affect our management.
Howard S. Jonas, our Chairman of the Board, has voting power over 4,454,502 shares of our common stock (which includes 1,574,326 shares of our Class A common stock, which are convertible into shares of our Class B common stock on a 1-for-1 basis, and 2,880,176 shares of our Class B common stock), representing approximately 73% of the combined voting power of our outstanding capital stock, as of March 17, 2014. Mr. Jonas is able to control matters requiring approval by our stockholders, including the election of all of the directors and the approval of significant corporate matters, including any merger, consolidation or sale of all or substantially all of our assets. As a result, the ability of any of our other stockholders to influence our management is limited.
None.
Our headquarters are located at 550 Broad St., Newark, New Jersey. We lease approximately 3,500 square foot space in Newark, New Jersey.
17
IDT Energy’s Jamestown, New York offices are located at 20 West Third Street where we lease approximately 10,000 square feet of space. Diversegy’s and Epiq’s offices are located in Dallas, Texas where we lease approximately 5,000 square feet of space.
AMSO, LLC’s operating office is in Rifle, Colorado. AMSO, LLC is supported by AMSO and Genie professionals based in Newark, New Jersey. AMSO, LLC rents approximately 2,450 square feet of office space and 2,000 square feet of warehouse space in Rifle under operating leases with flexible terms and conditions.
IEI and Afek operate out of IDT Corporation’s offices in Jerusalem and a field office and a warehouse in the city of Beit Shemesh. In addition, IEI built and operates a research laboratory located on the campus of Ben Gurion University in Be’er Sheva and Afek rents office space in Katzrin, a city in the northern part of Afek’s license area and a warehouse in Bnei Yehuda, in the south part of the Golan.
Genie Mongolia operates from and rents approximately 1,400 square feet of office space in Ulaanbataar, Mongolia.
On March 13, 2014, named plaintiff Anthony Ferrare commenced a putative class-action lawsuit against IDT Energy, Inc. in the Court of Common Pleas of Philadelphia County, Pennsylvania. The plaintiff filed the suit on behalf of himself and other former and current customers of IDT Energy in Pennsylvania, whom he contends were injured as a result of IDT Energy’s allegedly unlawful sales and marketing practices. IDT Energy denies that there is any basis for the suit and any alleged wrongdoing and intends to vigorously defend the claim.
In addition to the above, we may from time to time be subject to legal proceedings that have arisen in the ordinary course of business. Although there can be no assurance in this regard, we do not expect any of those legal proceedings to have a material adverse effect on our results of operations, cash flows or financial condition.
Not applicable.
PRICE RANGE OF COMMON STOCK
Our Class B common stock trades on the New York Stock Exchange under the symbol “GNE”.
The table below sets forth the high and low sales prices for our Class B Common Stock as reported by the NYSE for the fiscal periods indicated which represents the only fiscal periods our Class B Common Stock has been trading on the NYSE.
|
High
|
Low
|
|||||||
|
Fiscal year ended December 31, 2012
|
||||||||
|
First Quarter
|
$ | 11.18 | $ | 7.87 | ||||
|
Second Quarter
|
$ | 9.73 | $ | 6.47 | ||||
|
Third Quarter
|
$ | 7.89 | $ | 6.76 | ||||
|
Fourth Quarter
|
$ | 7.57 | $ | 5.75 | ||||
|
Fiscal year ended December 31, 2013
|
||||||||
|
First Quarter
|
$ | 9.31 | $ | 6.51 | ||||
|
Second Quarter
|
$ | 12.21 | $ | 8.50 | ||||
|
Third Quarter
|
$ | 11.79 | $ | 8.37 | ||||
|
Fourth Quarter
|
$ | 17.80 | $ | 8.51 | ||||
On March 12, 2014, there were 167 holders of record of our Class B common stock and 1 holder of record of our Class A common stock. All shares of Class A common stock are beneficially owned by Howard Jonas. These numbers do not include the number of persons whose shares are in nominee or in “street name” accounts through brokers. On March 14, 2014, the last sales price reported on the New York Stock Exchange for the Class B common stock was $11.12 per share.
PRICE RANGE OF PREFERRED STOCK
The Series 2012-A Preferred Stock is listed and traded on the NYSE under the symbol “GNEPRA”. Trading began on the NYSE on October 24, 2012.
The table below sets forth the high and low sales prices for our Series 2012-A Preferred Stock as reported by the NYSE for the fiscal periods indicated which represents the only fiscal periods our the Series 2012-A Preferred Stock has been trading on the NYSE.
|
High
|
Low
|
|||||||
|
Fiscal year ended December 31, 2012
|
||||||||
|
Fourth Quarter
|
$ | 8.24 | $ | 6.70 | ||||
|
Fiscal year ended December 31, 2013
|
||||||||
|
First Quarter
|
$ | 8.50 | $ | 6.60 | ||||
|
Second Quarter
|
$ | 8.49 | 7.58 | |||||
|
Third Quarter
|
$ | 8.26 | 7.57 | |||||
|
Fourth Quarter
|
$ | 8.49 | 7.90 | |||||
18
On March 12, 2014, there were 7 holders of record of our Series 2012-A Preferred Stock. These numbers do not include the number of persons whose shares are in nominee or in “street name” accounts through brokers. On March 14, 2014, the last sales price reported on the New York Stock Exchange for the Series 2012-A Preferred Stock was $8.17 per share.
Additional information regarding dividends required by this item is incorporated by reference from the Management’s Discussion and Analysis section in Item 7 to Part II and Note 9 to the Consolidated Financial Statements in Item 8 to Part II of this Annual Report.
The information required by Item 201(d) of Regulation S-K will be contained in our Proxy Statement for our Annual Stockholders Meeting, which we will file with the Securities and Exchange Commission within 120 days after December 31, 2013, and which is incorporated by reference herein.
Performance Graph of Stock
The line graph below compares the cumulative total stockholder return on our Class B common stock and our Series 2012-A Preferred Stock with the cumulative total return of the New York Stock Exchange Composite Index and the Standard & Poor’s Integrated Oil & Gas Index for the period beginning October 26, 2011 and ending December 31, 2013. The graph and table assume that $100 was invested on October 26, 2011 (the first day of trading for the Class B common stock) and on October 24, 2012 with respect to the Series 2012-A Preferred Stock (the first day of trading for the Series 2012-A Preferred stock) with the cumulative total return of the NYSE Composite Index and the S&P Integrated Oil & Gas Index, and that all dividends were reinvested. Cumulative total stockholder returns for our Class B common stock, Series 2012-A Preferred Stock, NYSE Composite Index and the S&P Integrated Oil & Gas Index are based on our fiscal year.
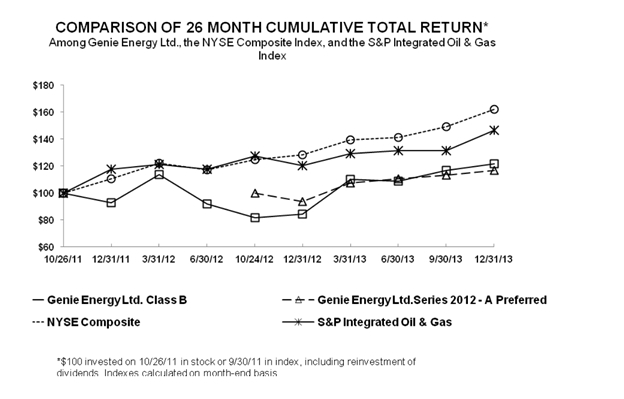
|
10/26/11
|
12/31/11
|
3/31/12
|
6/30/12
|
10/24/12
|
12/31/12
|
3/31/13
|
6/30/13
|
9/30/13
|
12/31/13
|
|||||||||||||||||||||||||||||||
|
Genie Energy Ltd. Class B
|
100.00 | 92.79 | 113.52 | 91.86 | 81.55 | 84.52 | 110.24 | 108.93 | 116.66 | 121.55 | ||||||||||||||||||||||||||||||
|
Genie Energy Ltd. Series 2012 - A Preferred
|
100.00 | 93.75 | 107.61 | 110.44 | 113.18 | 116.96 | ||||||||||||||||||||||||||||||||||
|
NYSE Composite
|
100.00 | 110.77 | 122.34 | 117.23 | 124.79 | 128.48 | 139.46 | 141.31 | 149.27 | 162.24 | ||||||||||||||||||||||||||||||
|
S&P Integrated Oil & Gas
|
100.00 | 117.94 | 121.17 | 117.65 | 127.46 | 120.54 | 129.19 | 131.33 | 131.37 | 146.49 | ||||||||||||||||||||||||||||||
19
Issuer Purchases of Equity Securities
The following table provides information with respect to purchases by us of our shares during the fourth quarter of the year ended December 31, 2013.
|
Total
Number of
Shares
Purchased
|
Average
Price per
Share
|
Total Number of
Shares Purchased
as part of Publicly
Announced Plans
or Programs
|
Maximum
Number of Shares
that May Yet
Be Purchased
Under the Plans
or Programs(1)
|
|||||||||||||
|
October 1 – 31, 2012
|
— | $ | — | — | 7,000,000 | |||||||||||
|
November 1 – 30, 2012
|
— | $ | — | — | 7,000,000 | |||||||||||
|
December 1 – 31, 2012
|
— | $ | — | — | 7,000,000 | |||||||||||
|
Total
|
— | $ | — | |||||||||||||
|
(1)
|
Under our existing stock repurchase program, approved by our Board of Directors on March 11, 2013, we were authorized to repurchase up to an aggregate of 7 million shares of our Class B common stock.
|
The selected consolidated financial data presented below as of December 31, 2013, and for the year then ended, has been derived from our Consolidated Financial Statements included elsewhere in this Form 10-K, which have been audited by BDO USA, LLP, independent registered public accounting firm. The selected consolidated financial data presented below as of December 31, 2012 and 2011, and for the year ended December 31, 2012 and the five months ended December 31, 2011 has been derived from our Consolidated Financial Statements included elsewhere in this Form 10-K, which have been audited by Grant Thornton LLP, independent registered public accounting firm. The selected consolidated financial data presented below as of July 31, 2011 and 2010, and for each of the fiscal years in the three-year period ended July 31, 2011 has been derived from our Consolidated Financial Statements, which have been audited by Zwick and Banyai, PLLC, independent registered public accounting firm. The selected consolidated financial data presented below for the five months ended December 31, 2010 is unaudited. The selected consolidated financial data should be read in conjunction with the Consolidated Financial Statements and the Notes thereto and other financial information appearing elsewhere in this Annual Report.
|
(in thousands, except per share data)
|
Year
ended
December 31,
2013
|
Year
ended
December 31,
2012
|
Five Months
ended
December 31,
2011
|
Fiscal year
ended
July 31,
2011
|
Fiscal year
ended
July 31,
2010
|
Fiscal year
ended
July 31,
2009
|
Five Months
ended
December 31,
2010
(Unaudited)
|
|||||||||||||||||||||
|
STATEMENT OF OPERATIONS DATA:
|
||||||||||||||||||||||||||||
|
Revenues
|
$ | 279,174 | $ | 229,459 | $ | 76,783 | $ | 196,018 | $ | 195,429 | $ | 261,954 | $ | 74,877 | ||||||||||||||
|
Net (loss) income
|
(5,341 | ) | (2,535 | ) | (268 | ) | (2,555 | ) | 14,081 | 22,728 | 916 | |||||||||||||||||
|
(Loss) earnings per common share—basic
|
(0.36 | ) | (0.17 | ) | 0.04 | 0.08 | 0.72 | 1.12 | 0.09 | |||||||||||||||||||
|
(Loss) earnings per common share—diluted
|
(0.36 | ) | (0.17 | ) | 0.04 | 0.07 | 0.65 | 1.02 | 0.08 | |||||||||||||||||||
|
Cash dividend declared per common share
|
— | 0.133 | 0.05 | — | — | — | — | |||||||||||||||||||||
|
(in thousands)
|
December 31,
2013
|
December 31,
2012
|
December 31,
2011
|
July 31,
2011
|
July 31,
2010
|
|||||||||||||||
|
BALANCE SHEET DATA:
|
||||||||||||||||||||
|
Total assets
|
$ | 158,843 | $ | 150,306 | $ | 150,194 | $ | 67,406 | $ | 56,998 | ||||||||||
This Annual Report contains forward-looking statements within the meaning of Section 27A of the Securities Act of 1933 and Section 21E of the Securities Exchange Act of 1934, including statements that contain the words “believes,” “anticipates,” “expects,” “plans,” “intends” and similar words and phrases. These forward-looking statements are subject to risks and uncertainties that could cause actual results to differ materially from the results projected in any forward-looking statement. In addition to the factors specifically noted in the forward-looking statements, other important factors, risks and uncertainties that could result in those differences include, but are not limited to, those discussed under Item 1A to Part I “Risk Factors” in this Annual Report. The forward-looking statements are made as of the date of this Annual Report, and we assume no obligation to update the forward-looking statements, or to update the reasons why actual results could differ from those projected in the forward-looking statements. Investors should consult all of the information set forth in this report and the other information set forth from time to time in our reports filed with the Securities and Exchange Commission pursuant to the Securities Act of 1933 and the Securities Exchange Act of 1934, including our reports on Forms 10-Q and 8-K.
20
The following discussion should be read in conjunction with the Consolidated Financial Statements and Notes thereto included in Item 8 of this Annual Report.
OVERVIEW
On January 30, 2012, our Board of Directors changed our fiscal year end from July 31 to December 31, in order to better align our financial reporting with our operational and budgeting cycle and with other industry participants.
We own 99.3% of our subsidiary, GEIC, which owns 100% of IDT Energy and 92% of GOGAS. IDT Energy has outstanding deferred stock units granted to directors and employees that represent an interest of 2.3% of the equity of IDT Energy. Our principal businesses consist of:
|
•
|
IDT Energy, an REP supplying electricity and natural gas to residential and small business customers in the Northeastern United States; and
|
|
•
|
Genie Oil and Gas, which is pioneering technologies to produce clean and affordable transportation fuels from the world's abundant oil shales and other fuel resources, which consists of (1) AMSO, which holds and manages a 48.16% interest in AMSO, LLC, our oil shale project in Colorado, (2) an 88.6% interest in IEI, our oil shale project in Israel, (3) an 89% interest in Afek, our conventional oil and gas exploration project in the southern portion of the Golan Heights, and (4) a 90% interest in Genie Mongolia, our oil shale exploration project in Central Mongolia.
|
Genie was incorporated in January 2011. References to us in the following discussion are made on a consolidated basis as if we existed and owned IDT Energy and Genie Oil and Gas and their respective subsidiaries in all periods discussed.
As part of our ongoing business development efforts, we continuously seek out new opportunities, which may include complementary operations or businesses that reflect horizontal or vertical expansion from our current operations. Some of these potential opportunities are considered briefly and others are examined in further depth. In particular, we seek out acquisitions to expand the geographic scope and size of our REP business, and additional energy exploration projects to diversify our GOGAS unit’s operations, among geographies, technologies and resources.
Spin-Off from IDT
We were formerly a subsidiary of IDT. On October 28, 2011, we were spun-off by IDT and became an independent public company through a pro rata distribution of our common stock to IDT’s stockholders. Prior to the Spin-Off, IDT made a capital contribution of $82.2 million to us. In addition, in connection with the capital contribution received from IDT, the amount due from IDT as of the date of the Spin-Off of $2.1 million was forgiven.
We entered into various agreements with IDT prior to the Spin-Off including a Separation and Distribution Agreement to effect the separation and provide a framework for our relationship with IDT after the Spin-Off, and a Transition Services Agreement, which provides for certain, services to be performed by us and IDT to facilitate our transition into a separate publicly-traded company. These agreements provide for, among other things, (1) the allocation between us and IDT of employee benefits, taxes and other liabilities and obligations attributable to periods prior to the Spin-Off, (2) transitional services to be provided by IDT relating to human resources and employee benefits administration, (3) the allocation of responsibilities relating to employee compensation and benefit plans and programs and other related matters, (4) finance, accounting, tax, internal audit, facilities, investor relations and legal services to be provided by IDT to us following the Spin-Off and (5) specified administrative services to be provided by us to certain of IDT’s foreign subsidiaries.
In addition, we entered into a Tax Separation Agreement with IDT, which sets forth the responsibilities of us and IDT with respect to, among other things, liabilities for federal, state, local and foreign taxes for periods before and including the Spin-Off, the preparation and filing of tax returns for such periods and disputes with taxing authorities regarding taxes for such periods.
IDT Energy
IDT Energy resells electricity and natural gas to residential and small business customers in New York, New Jersey, Pennsylvania and Maryland, and more recently, in Washington, D.C. and certain utility markets in Illinois. IDT Energy’s revenues represented 100% of our consolidated revenues in the years ended December 31, 2013 and 2012, the year ended July 31, 2011, and the five months ended December 31, 2011 and 2010.
IDT Energy’s direct cost of revenues consists primarily of gas and electricity purchased for resale. Since 2009, IDT Energy has been party to a Preferred Supplier Agreement with BP pursuant to which BP is IDT Energy’s preferred provider of electricity and natural gas. Under the arrangement, IDT Energy purchases electricity and natural gas at a market rate plus a fee. IDT Energy remits a monthly payment for its purchases and related fees. Any outstanding, unpaid balances accrue interest until paid. IDT Energy’s obligations to BP are secured by a first security interest in deposits or receivables from utilities in connection with their purchase of IDT Energy’s customers’ receivables, and in any cash deposits or letters of credit posted in connection with any collateral accounts with BP. The agreement’s termination date is June 30, 2015. IDT Energy’s ability to purchase electricity and natural gas under this agreement is subject to satisfaction of certain conditions including the maintenance of certain covenants.
21
As a REP, IDT Energy does not own electrical power generation, transmission, or distribution facilities, or natural gas production, pipeline or distribution facilities. Instead, IDT Energy contracts with various pipeline and distribution companies for natural gas pipeline, storage and transportation services, and utilizes NYISO and PJM for electric transmission and distribution. IDT Energy’s direct cost of revenues include scheduling costs, independent system operator (ISO) fees, pipeline costs and utility service charges for the purchase of these services. At December 31, 2013, IDT Energy was a member of ISO New England, although IDT Energy has not commenced operations in this territory yet. IDT Energy expects to commence operations in this territory in 2014.
For risk management purposes, IDT Energy utilizes forward and futures contracts, swaps as well as put and call options as hedges against unfavorable fluctuations in market prices of electricity and natural gas. The futures contracts, swaps and put and call options are recorded at fair value as a current asset or liability and any changes in fair value are recorded in direct cost of revenues. The impact of these contracts and options on direct cost of revenues is relatively small in comparison to IDT Energy’s purchases of gas and electricity for resale.
The NYISO and PJM perform real-time load balancing for each of the electrical power grids in which IDT Energy operates. Similarly, the utility or the LDC performs load balancing for each of the natural gas markets in which IDT Energy operates. Load balancing ensures that the amount of electricity and natural gas that IDT Energy purchases is equal to the amount necessary to service customers’ demands at any specific point in time. IDT Energy manages the differences between the actual electricity and natural gas demands of its customers and its bulk or block purchases by buying and selling in the spot market, and through monthly cash settlements and/or adjustments to futures deliveries in accordance with the load balancing performed by utilities, LDCs, NYISO and PJM. Suppliers and the LDC’s charge or credit IDT Energy for balancing the electricity and natural gas purchased and sold for its account.
The local utilities generally meter and deliver electricity and natural gas to IDT Energy’s customers. The local utilities provide billing and collection services on IDT Energy’s behalf for most of IDT Energy’s customers. IDT Energy receives the proceeds less the utility’s POR fees and in some cases less fees for billing and other ancillary services. The positive difference between the net sales price of electricity and natural gas sold to its customers and the sum of the cost of its electricity and natural gas supplies, transmission and ancillary services is IDT Energy’s gross profit margin.
Volatility in the electricity and natural gas markets affects the cost of the electricity and natural gas that IDT Energy sells to customers. IDT Energy may not always choose to pass along increases in costs to its customers for various reasons including competitive pressures and to protect overall customer satisfaction. This can adversely affect IDT Energy’s gross margins and results of operations. Alternatively, increases in IDT Energy's rates charged to customers may lead to increased customer churn.
IDT Energy’s selling expenses consist primarily of sales commissions paid to independent agents and marketing costs, which are the primary costs associated with the acquisition of customers. General and administrative expenses include compensation, benefits, utility fees for billing and collection, professional fees, rent and other administrative costs.
Seasonality and Weather
The weather and the seasons, among other things, affect IDT Energy’s revenues. Weather conditions can have a significant impact on the demand for natural gas and electricity used for heating and cooling. Typically, colder winters and hotter summers increase demand for natural gas and electricity, respectively. Milder winters and/or summers have the opposite effect. Natural gas revenues typically increase in the first quarter due to increased heating demands and electricity revenues typically increase in the third quarter due to increased air conditioning use. Approximately 49% and 47% of IDT Energy’s natural gas revenues were generated in the first quarter of 2013 and 2012, respectively, when demand for heating was highest. Although the demand for electricity is not as seasonal as natural gas, approximately 31% and 34% of IDT Energy’s electricity revenues were generated in the third quarter of 2013 and 2012, respectively.
Concentration of Customers and Associated Credit Risk
IDT Energy reduces its credit risk by participating in purchase of receivable programs for a majority of its receivables. In addition to providing billing and collection services, utility companies purchase IDT Energy’s receivables and assume all credit risk without recourse to IDT Energy. IDT Energy’s primary credit risk is therefore nonpayment by the utility companies. Certain of the utility companies represent significant portions of our consolidated revenues and consolidated gross trade accounts receivable balance and such concentrations increase our risk associated with nonpayment by those utility companies.
22
The following table summarizes the percentage of consolidated revenues from customers by utility company that equal or exceed 10% of consolidated revenues in the period (no other single utility company accounted for more than 10% of consolidated revenues in any of the periods):
|
Year ended
December 31,
2013
|
Year ended
December 31,
2012
|
Five Months
ended
December 31,
2011
|
Year ended
July 31,
2011
|
Five Months
ended
December 31,
2010
(Unaudited)
|
||||||||||||||||
|
Con Edison
|
25 | % | 34 | % | 52 | % | 47 | % | 55 | % | ||||||||||
|
West Penn Power
|
11 | % |
na
|
na
|
na
|
na
|
||||||||||||||
|
National Grid USA
|
10 | % |
na
|
14 | % | 17 | % | 16 | % | |||||||||||
|
Penelec
|
10 | % |
na
|
na
|
na
|
na
|
||||||||||||||
|
National Grid dba Keyspan
|
na
|
na
|
na
|
10 | % |
na
|
||||||||||||||
na-less than 10% of consolidated revenue in the period
The following table summarizes the percentage of consolidated gross trade accounts receivable by utility company that equal or exceed 10% of consolidated gross trade accounts receivable at December 31, 2013 and 2012:
|
December 31
|
2013
|
2012
|
||||||
|
Con Edison
|
23 | % | 19 | % | ||||
|
West Penn Power
|
13 | % |
na
|
|||||
|
Penelec
|
12 | % | 10 | % | ||||
na-less than 10% of consolidated gross trade accounts receivable at December 31, 2013 or 2012
Investment in American Shale Oil, LLC
AMSO, LLC holds an RD&D Lease awarded by the BLM that covers an area of 160 acres in western Colorado. The RD&D Lease runs for a ten-year period beginning on January 1, 2007, and is subject to an extension of up to five years if AMSO, LLC can demonstrate that a process leading to the production of commercial quantities of shale oil is diligently being pursued. If AMSO, LLC can demonstrate the economic and environmental viability of its technology, it will have the opportunity to submit a one-time payment pursuant to the applicable regulations and convert its RD&D Lease to a commercial lease on 5,120 acres, which overlap and are contiguous with the 160 acres covered by its RD&D Lease.
AMSO agreed to fund AMSO, LLC’s expenditures as follows: 20% of the initial $50 million of expenditures, 35% of the next $50 million in approved expenditures and 50% of approved expenditures in excess of $100 million. AMSO also agreed to fund 40% of the costs of the one-time payment for conversion of AMSO, LLC’s RD&D Lease to a commercial lease, in the event AMSO, LLC’s application for conversion is approved. The remaining amounts are to be funded by Total. As of December 31, 2013, the cumulative contributions of AMSO and Total to AMSO, LLC were $69.0 million. Through December 31, 2011, AMSO was allocated 20% of the net loss of AMSO, LLC. AMSO’s allocated share of the net loss of AMSO, LLC increased in December 2011 from 20% to 35%, per our agreement with Total. AMSO’s allocated share of the net loss of AMSO, LLC is included in “Equity in the net loss of AMSO, LLC” in the accompanying consolidated statements of operations.
AMSO has the right to decide whether or not to fund its shares of each capital call issued by AMSO, LLC. AMSO did not fund the capital call for the first quarter of 2014, and in January 2014, Total funded AMSO’s share, which was $0.9 million. Because of AMSO’s decision not to fund its share, AMSO’s ownership interest in AMSO, LLC was reduced to 48.16% and Total’s ownership interest increased to 51.84%. In addition, AMSO’s share of future funding of AMSO, LLC up to a cumulative $100 million was reduced to 33.7% and Total’s share increased to 66.3%. AMSO’s share of AMSO, LLC’s approved budget for the year ending December 31, 2014 was $3.2 million. AMSO is evaluating its options with respect to funding AMSO, LLC during 2014, and funding of less than its full share would result in further dilution of its interest in AMSO, LLC.
The agreements with Total provide for varying consequences for AMSO’s failure to fund its share at different stages of the project, including dilution of AMSO’s interest in AMSO, LLC or paying interest to Total for expenditures they fund on behalf of AMSO. Either Total or AMSO may terminate its obligations to make capital contributions and withdraw as a member of AMSO, LLC. Even if AMSO were to withdraw its interest in AMSO, LLC, it will remain liable for its share of expenditures for safety and environmental reclamation related to events occurring prior to its withdrawal.
We account for our ownership interest in AMSO, LLC using the equity method since we have the ability to exercise significant influence over its operating and financial matters, although we do not control AMSO, LLC. AMSO, LLC is a variable interest entity, however, we have determined that we are not the primary beneficiary.
Because of AMSO’s decision not to fund its share of AMSO, LLC’s expenditures, AMSO, LLC will allocate its net loss beginning January 2014 as follows. AMSO, LLC will allocate the first $2.6 million of losses to Total, then it will allocate any remaining losses proportionately such that AMSO and Total’s capital accounts as a percentage of AMSO, LLC’s total capital equals their ownership interests.
23
At December 31, 2013, our maximum exposure to additional loss because of our required investment in AMSO, LLC was $3.0 million, based on AMSO, LLC’s 2014 budget. Our maximum exposure to additional loss could increase based on the situations described above.
Israel Energy Initiatives, Ltd.
IEI holds an exclusive Shale Oil Exploration and Production License awarded in July 2008 by the Government of Israel. The license covers approximately 238 square kilometers in the south of the Shfela region in Central Israel. Under the terms of the license, IEI is to conduct a geological appraisal study across the license area, characterize the resource and select a location for a pilot plant in which it will demonstrate its in-situ technology. The initial term of the license was for three years until July 2011. The license has been extended until July 2014, and it may be further extended for one year through July 2015. IEI has discussed securing its rights beyond July 2015 with the Ministry of Energy and Water, and expects a satisfactory resolution of this matter. In June 2013, IEI submitted its application for the construction and operation of its oil shale pilot test facility to the Jerusalem District Building and Planning Committee. IEI was subsequently asked to provide supplements to the environmental impact assessment. The revised application was submitted on November 3, 2013. On March 17, 2014, IEI was advised that the initial review process of the application conducted by the Jerusalem District Building and Planning Committee was concluded, and the application process was proceeding to the next stage, a review of the environmental documents by the Ministry of Environment.
The permit evaluation process is expected to take at least nine months from acceptance of a completed proposal by the Planning Committee and potentially significantly longer. We currently expect to use internal resources to finance the pilot test construction and operations. In addition, we are considering financing IEI’s operations through partnerships and/or sales of equity interests.
Afek Oil and Gas, Ltd.
In April 2013, the Government of Israel finalized the award to Afek of an exclusive three year petroleum exploration license covering 396.5 square kilometers in the southern portion of the Golan Heights. Afek has retained seasoned oil and gas exploration professionals and has contracted with internationally recognized vendors to provide the services required for its exploration program. In 2013, Afek completed preliminary geophysical work including electromagnetic survey and the reprocessing of 2D seismic data to characterize the subsurface prior to drilling exploration wells. Afek subsequently began the analysis of the acquired data internally and with outside exploration experts. In addition, Afek submitted a permit application to conduct a ten-well exploration drilling program. In January 2014, the first hearing of Afek’s application was conducted, and permission was granted to move forward to the next stage in the permitting process, which is a public notice and public comments period.
Genie Mongolia
In April 2013, Genie Mongolia and the Petroleum Authority of Mongolia entered into an exclusive oil shale development agreement to explore and evaluate the commercial potential of oil shale resources in a 34,470 square kilometer area in Central Mongolia. The five year agreement allows Genie Mongolia to explore, identify and characterize the oil shale resource in the exclusive survey area and to conduct a pilot test using in-situ technology on appropriate oil shale deposits. To date, Genie Mongolia is the only recipient of an exclusive oil shale survey contract in Mongolia. During 2013, Genie Mongolia conducted initial surface and subsurface exploration work and is currently working to continue to characterize the geology in the licensed area. In parallel, Genie Mongolia is also working with regulators in Mongolia to secure commercial rights to any appropriate deposits on the licensed area after a successful exploration work and pilot test are concluded.
CRITICAL ACCOUNTING POLICIES
Our financial statements and accompanying notes are prepared in accordance with accounting principles generally accepted in the United States of America, or U.S. GAAP. The preparation of financial statements requires management to make estimates and assumptions that affect the reported amounts of assets, liabilities, revenue and expenses as well as the disclosure of contingent assets and liabilities. Critical accounting policies are those that require application of management’s most subjective or complex judgments, often as a result of matters that are inherently uncertain and may change in subsequent periods. Our critical accounting policies include those related to the allowance for doubtful accounts, goodwill and income taxes. Management bases its estimates and judgments on historical experience and other factors that are believed to be reasonable under the circumstances. Actual results may differ from these estimates under different assumptions or conditions. See Note 1 to the Consolidated Financial Statements in this Annual Report for a complete discussion of our significant accounting policies.
Allowance for Doubtful Accounts
We maintain an allowance for doubtful accounts for estimated losses that result from the inability or unwillingness of our customers to make required payments. The allowance for doubtful accounts was $0.9 million and $0.1 million at December 31, 2013 and 2012, respectively. Our allowance is determined based on known troubled accounts, historical experience and other currently available evidence. Our estimates of recoverability of customer accounts may change due to new developments, changes in assumptions or changes in our strategy, which may impact our allowance for doubtful accounts balance. We continually assess the likelihood of potential amounts or ranges of recoverability and adjust our allowance accordingly, however, actual collections and write-offs of trade accounts receivables may materially differ from our estimates.
24
Goodwill
Our goodwill balance of $7.3 million and $3.7 million at December 31, 2013 and 2012, respectively, was allocated to our IDT Energy segment. IDT Energy is the reporting unit for our goodwill impairment test. Goodwill is not amortized since it is deemed to have an indefinite life. It is reviewed annually (or more frequently under various conditions) for impairment using a fair value approach. The goodwill impairment assessment involves estimating the fair value of the reporting unit and comparing it to its carrying amount, which is known as Step 1. If the carrying value of the reporting unit exceeds its estimated fair value, Step 2 is performed to determine if an impairment of goodwill is required. We estimate the fair value of our reporting unit using discounted cash flow methodologies, as well as considering third party market value indicators. Goodwill impairment is measured by the excess of the carrying amount of the reporting unit’s goodwill over its implied fair value. We have the option to perform a qualitative assessment to determine whether it is necessary to perform the two-step quantitative goodwill impairment test. However, we may elect to perform the two-step quantitative goodwill impairment test even if no indications of a potential impairment exist.
IDT Energy’s estimated fair value substantially exceeded its carrying value in Step 1 of our annual impairment tests for the years ended December 31, 2013 and 2012 and the year ended July 31, 2011, therefore it was not necessary to perform Step 2 for these tests. In addition, we do not believe IDT Energy is currently at risk of failing Step 1. Calculating the fair value of the reporting unit, and allocating the estimated fair value to all of the tangible assets, intangible assets and liabilities, requires significant estimates and assumptions by management. Should our estimates or assumptions regarding the fair value of our reporting unit prove to be incorrect, we may be required to record impairments to our goodwill in future periods and such impairments could be material.
Income Taxes
Our current and deferred income taxes and associated valuation allowance are impacted by events and transactions arising in the normal course of business as well as in connection with special and non-routine items. Assessment of the appropriate amount and classification of income taxes is dependent on several factors, including estimates of the timing and realization of deferred income tax assets, the results of Internal Revenue Service audits of our federal income tax returns, and changes in tax laws or regulations.
The valuation allowance on our deferred income tax assets was $16.7 million and $11.9 million at December 31, 2013 and 2012, respectively. Subsequent to the Spin-Off, we initiated a tax strategy that enables us to deduct losses from our foreign subsidiaries against our profitable U.S. operations. Because of this strategy, the decrease in pre-tax earnings of IDT Energy in 2012, and our current projections, we concluded that we no longer met the criteria of more likely than not in order to utilize our deferred federal income tax assets in the foreseeable future. Accordingly, in 2012, we recorded a valuation allowance against our deferred federal income tax assets.
We use a two-step approach for recognizing and measuring tax benefits taken or expected to be taken in a tax return. We determine whether it is more-likely-than-not that, a tax position will be sustained upon examination, including resolution of any related appeals or litigation processes, based on the technical merits of the position. In evaluating whether a tax position has met the more-likely-than-not recognition threshold, we presume that the appropriate taxing authority that has full knowledge of all relevant information will examine the position. Tax positions that meet the more-likely-than-not recognition threshold are measured to determine the amount of tax benefit to recognize in the financial statements. The tax position is measured at the largest amount of benefit that is greater than 50 percent likely of being realized upon ultimate settlement. Differences between tax positions taken in a tax return and amounts recognized in the financial statements will generally result in one or more of the following: an increase in a liability for income taxes payable, a reduction of an income tax refund receivable, a reduction in a deferred tax asset, or an increase in a deferred tax liability. We review and adjust our liability for unrecognized tax benefits based on our best estimate and judgment given the facts, circumstances and information available at each reporting date. To the extent that the outcome of these tax positions is different from the amounts recorded, such differences may affect income tax expense and actual tax payments.
RESULTS OF OPERATIONS
We evaluate the performance of our operating business segments based primarily on income (loss) from operations. Accordingly, the income and expense line items below income (loss) from operations are only included in our discussion of the consolidated results of operations.
25
Year Ended December 31, 2013 compared to Year Ended December 31, 2012
IDT Energy Segment
|
(in millions)
|
Change
|
|||||||||||||||
|
Year ended December 31,
|
2013
|
2012
|
$
|
% | ||||||||||||
|
Revenues:
|
||||||||||||||||
|
Electric
|
$ | 216.7 | $ | 174.3 | $ | 42.4 | 24.3 | % | ||||||||
|
Natural gas
|
62.5 | 55.2 | 7.3 | 13.3 | ||||||||||||
|
Total revenues
|
279.2 | 229.5 | 49.7 | 21.7 | ||||||||||||
|
Direct cost of revenues
|
213.4 | 159.9 | 53.5 | 33.5 | ||||||||||||
|
Gross profit
|
65.8 | 69.6 | (3.8 | ) | (5.5 | ) | ||||||||||
|
Selling, general and administrative
|
39.2 | 44.6 | (5.4 | ) | (12. | ) | ||||||||||
|
Bad debt
|
0.8 | — | 0.8 |
nm
|
||||||||||||
|
Income from operations
|
$ | 25.8 | $ | 25.0 | $ | 0.8 | 2.9 | % | ||||||||
nm – not meaningful
Revenues
. IDT Energy’s electricity revenues increased in the year ended December 31, 2013 compared to the year ended December 31, 2012 as a result of an increase in consumption, as well as an increase in the average rate charged to customers reflecting the higher per unit cost incurred. Electricity consumption increased 15.7% in the year ended December 31, 2013 compared to the year ended December 31, 2012, and the average rate charged to customers for electricity increased 8.5% in the year ended December 31, 2013 compared to the year ended December 31, 2012. The increase in electricity consumption was primarily the result of an increase in average meters enrolled, which increased 8.0% in the year ended December 31, 2013 compared to the year ended December 31, 2012, coupled with an increase in average consumption per meter, which increased 7.2% in the year ended December 31, 2013 compared to the year ended December 31, 2012. The increase in the average rate charged to customers for electricity was due to an increase in the underlying commodity cost. The increase in the average consumption per meter is attributable to the acquisition of relatively higher consuming meters in Pennsylvania and Maryland, as compared to the meters in our legacy customer base.
IDT Energy's natural gas revenues increased in the year ended December 31, 2013 compared to the year ended December 31, 2012 primarily due to unusually warm weather in the three months ended March 31, 2012, which reduced the demand for natural gas for heating. As measured by heating degree days, a measure of outside air temperature designed to reflect the energy required for heating, New York State and Pennsylvania were 25% colder in the three months ended March 31, 2013 than in the same period in 2012. The colder weather resulted in an increase of 1.8% in natural gas consumption in the year ended December 31, 2013 compared to the year ended December 31, 2012, and an increase of 11.7% in consumption per meter in the year ended December 31, 2013 compared to the year ended December 31, 2012. In addition, natural gas revenues increased due to an 11.3% increase in the average rate charged to customers in the year ended December 31, 2013 compared to the year ended December 31, 2012. The increase in consumption was partially offset by an 8.9% decrease in average meters enrolled in the year ended December 31, 2013 compared to the year ended December 31, 2012.
IDT Energy’s customer base as measured by meters enrolled consisted of the following:
|
(in thousands)
|
December 31,
2013
|
September 30,
2013
|
June 30,
2013
|
March 31,
2013
|
December 31,
2012
|
|||||||||||||||
|
Meters at end of quarter:
|
||||||||||||||||||||
|
Electric customers
|
282 | 300 | 314 | 319 | 331 | |||||||||||||||
|
Natural gas customers
|
145 | 156 | 161 | 166 | 171 | |||||||||||||||
|
Total meters
|
427 | 456 | 475 | 485 | 502 | |||||||||||||||
Gross meter acquisitions in the year ended December 31, 2013 were 245,000 compared to 407,000 in the year ended December 31, 2012. The decrease in gross meter acquisitions primarily reflects a reduced rate of expansion into new territories in recent quarters. Net meters enrolled decreased by 75,000 or 14.9% in the year ended December 31, 2013 compared to an increase of 64,000 or 14.6% in the year ended December 31, 2012, as gross meter acquisitions in the year ended December 31, 2013 were more than offset by customer churn. Average monthly churn decreased from 6.6% in the year ended December 31, 2012 to 6.3% in the year ended December 31, 2013, primarily due to the lower level of customer acquisitions in 2013, as newly acquired customers have higher churn rates than longer term customers. Increased competition in some of IDT Energy’s key utility markets also contributed to the level of customer churn.
IDT Energy has license applications pending to enter into additional territories, primarily gas and dual meter territories, in Pennsylvania, Maryland and the District of Columbia. Management continues to evaluate additional, deregulation-driven opportunities in other states, including Massachusetts and Connecticut. New customer acquisitions in the Commonwealth Edison territory in Illinois, and in Pepco in Washington, D.C., which IDT Energy entered during the second and fourth quarters of 2013, respectively, were not impactful. IDT Energy continues to test and evaluate these markets.
The average rates of annualized energy consumption, as measured by residential customer equivalents, or RCEs, are presented in the chart below. An RCE represents a natural gas customer with annual consumption of 100 mmbtu or an electricity customer with annual consumption of 10 MWh. Because different customers have different rates of energy consumption, RCEs are an industry standard metric for evaluating the consumption profile of a given retail customer base.
26
|
(in thousands)
|
December 31, 2013
|
September 30, 2013
|
June 30, 2013
|
March 31, 2013
|
December 31, 2012
|
|||||||||||||||
|
RCEs at end of quarter:
|
||||||||||||||||||||
|
Electric customers
|
228 | 246 | 263 | 243 | 238 | |||||||||||||||
|
Natural gas customers
|
87 | 91 | 94 | 86 | 74 | |||||||||||||||
|
Total RCEs
|
315 | 337 | 357 | 329 | 312 | |||||||||||||||
Direct Cost of Revenues and Gross Margin Percentage
. IDT Energy’s direct cost of revenues and gross margin percentage were as follows:
|
(in millions)
|
Change
|
|||||||||||||||
|
Year ended December 31,
|
2013
|
2012
|
$
|
% | ||||||||||||
|
Direct cost of revenues:
|
||||||||||||||||
|
Electric
|
$ | 168.9 | $ | 119.0 | $ | 49.9 | 42.0 | % | ||||||||
|
Natural gas
|
44.5 | 40.9 | 3.6 | 8.8 | ||||||||||||
|
Total direct cost of revenues
|
$ | 213.4 | $ | 159.9 | $ | 53.5 | 33.5 | % | ||||||||
|
Year ended December 31,
|
2013
|
2012
|
Change
|
|||||||||
|
Gross margin percentage:
|
||||||||||||
|
Electric
|
22.1 | % | 31.8 | % | (9.7 | )% | ||||||
|
Natural gas
|
28.7 | 25.8 | 2.9 | |||||||||
|
Total gross margin percentage
|
23.6 | % | 30.3 | % | (6.8 | )% | ||||||
Direct cost of revenues for electricity increased in the year ended December 31, 2013 compared to the year ended December 31, 2012 primarily because the average unit cost of electricity increased 22.3% in the year ended December 31, 2013 compared to the year ended December 31, 2012. The cost of electricity increased in May and June 2013 compared to the same period in 2012, and the cost of electricity in New York State was unusually high in January and February 2013 compared to the same period in 2012. The 15.7% increase in electricity consumption in the year ended December 31, 2013 compared to the year ended December 31, 2012 also contributed to the increase in direct cost of revenues for electricity.
Direct cost of revenues for natural gas increased in the year ended December 31, 2013 compared to the year ended December 31, 2012 due to the 6.9% increase in the average unit cost of natural gas and a 1.8% increase in consumption.
Gross margin on electricity sales decreased in the year ended December 31, 2013 compared to the year ended December 31, 2012 primarily due to the mix of meters enrolled and market conditions. The gross margin on electricity sales was also negatively impacted in the year ended December 31, 2013 compared to the year ended December 31, 2012 by increased promotional activity implemented to mitigate churn and facilitate customer acquisition, and the effects of an internal pricing system issue during a portion of 2013 that constrained our ability to make timely adjustments to electric rates in some newer territories.
Gross margins on natural gas sales increased in the year ended December 31, 2013 compared to the year ended December 31, 2012 because increased natural gas consumption due to the colder temperatures in the three months ended March 31, 2013 compared to the same period in 2012 enabled us to recover costs more effectively in the year ended December 31, 2013 compared to the year ended December 31, 2012.
Looking ahead to the first quarter of 2014 (the quarter ending March 31, 2014), the unusually cold weather in January and February 2014 associated with this winter’s “polar vortex” drove unprecedented price spikes in both the electricity and natural gas wholesale markets where IDT Energy and other retail providers purchase their supply. In some regions, wholesale prices increased briefly by factors of more than eight. To cushion the impact of these spikes on its customers, IDT Energy absorbed a portion of the cost of these increases and, in addition, has offered rebates to customers who have been particularly hard hit. To date, the Company has committed to an aggregate of $2.0 million in rebates, and expects this total will increase. As a result, IDT Energy anticipates a significant increase in the churn rate early next year and material, substantial reductions in gross profit, income from operations and net income in the first quarter of 2014 compared to the levels achieved in the same period of 2013.
Selling, General and Administrative
. The decrease in selling, general and administrative expenses in the year ended December 31, 2013 compared to the year ended December 31, 2012 was primarily due to decreases in customer acquisition costs, payroll and bonuses, severance expense and stock-based compensation expense. Customer acquisition costs decreased an aggregate of $4.4 million primarily due to the significant decrease in the number of new customers acquired in 2013 compared to 2012. Payroll and bonuses and severance expense decreased $1.0 million and $0.4 million, respectively, in the year ended December 31, 2013 compared to the year ended December 31, 2012. The $0.2 million decrease in stock-based compensation expense was primarily due to reductions in expense from the November 2011 grants of restricted stock and stock options. The expense from these grants is recognized over the expected service period. In the year ended December 31, 2013 compared to the year ended December 31, 2012, the decrease in selling, general and administrative expenses was partially offset by a $0.5 million increase in purchase of receivable fees, primarily because of the increase in IDT Energy’s revenues. As a percentage of IDT Energy’s total revenues, selling, general and administrative expenses decreased from 19.4% in the year ended December 31, 2012 to 14.1% in the year ended December 31, 2013 primarily because of the significant decrease in costs related to customer acquisitions as well as the increase in revenues.
27
Bad debt
. IDT Energy’s bad debt expense in the year ended December 31, 2013 was $0.8 million compared to nil in the year ended December 31, 2012. Bad debt expense in 2013 related to an allowance for amounts due from a utility company that are under dispute. We will continue our efforts to collect these receivables, despite the uncertainty about the success of such collection efforts.
Genie Oil and Gas Segment
Genie Oil and Gas does not currently generate any revenues, nor does it incur any direct cost of revenues.
|
(in millions)
|
Change
|
|||||||||||||||
|
Year ended December 31
|
2013
|
2012
|
$
|
%
|
||||||||||||
|
General and administrative expenses
|
$ | 1.4 | $ | 1.4 | $ | — | (8.5 | )% | ||||||||
|
Research and development
|
11.4 | 9.4 | 2.0 | 21.6 | ||||||||||||
|
Equity in net loss of AMSO, LLC
|
3.2 | 3.2 | — | 0.6 | ||||||||||||
|
Loss from operations
|
$ | 16.0 | $ | 14.0 | $ | 2.0 | 13.6 | % | ||||||||
General and Administrative
. General and administrative expense was substantially unchanged in the year ended December 31, 2013 compared to the year ended December 31, 2012 primarily because the increases in stock-based compensation expense were offset by a decrease in the payroll and other expenses as a result of shifting more resources to handle the increased research and development activities. Stock-based compensation expense increased $0.6 million in the year ended December 31, 2013 compared to the year ended December 31, 2012 primarily due to grants in 2013 of equity in GOGAS subsidiaries to certain of our officers and employees. Payroll and other expenses shifted to handle the research and development activities were $0.7 million in the year ended December 31, 2013 compared to the year ended December 31, 2012.
Research and Development
. Research and development expense consists of the following:
|
(in millions)
|
||||||||
|
Year ended December 31,
|
2013
|
2012
|
||||||
|
IEI
|
$ | 3.7 | $ | 7.2 | ||||
|
Genie Mongolia
|
3.4 | 2.1 | ||||||
|
Afek
|
4.2 | — | ||||||
|
Other
|
0.1 | 0.1 | ||||||
|
Total research and development expenses
|
$ | 11.4 | $ | 9.4 | ||||
In June 2013, IEI submitted its permit application for the construction and operation of its oil shale pilot test facility to the Jerusalem District Building and Planning Committee. IEI was subsequently asked to provide supplements to the environmental impact assessment. The revised application was submitted on November 3, 2013. On March 17, 2014, IEI was advised that the initial review process of the application conducted by the Jerusalem District Building and Planning Committee was concluded, and the application process was proceeding to the next stage, a review of the environmental documents by the Ministry of Environment.
The permit evaluation process is expected to take at least nine months from acceptance of a completed proposal by the Planning Committee and potentially significantly longer. During the years ended December 31, 2013 and 2012, as per required permitting process, IEI continued laboratory work, engineering work and associated preparation of environmental permit applications related to the planned pilot.
The increase in Genie Mongolia’s expenses in the year ended December 31, 2013 compared to the year ended December 31, 2012 related to the joint geological survey with the Republic of Mongolia, which was executed in April 2013, to explore certain of that country’s oil shale deposits. Genie Mongolia has begun surface mapping and other geophysical evaluation work as well as drilling exploratory wells, and is working to secure permits for additional exploratory wells. The exploratory well program is intended to identify a site suitable for a pilot test and subsequent commercial operations. Subsequent commercial operations are contingent upon implementation of a regulatory framework by the government for the permitting and licensing of commercial oil shale operations.
After receiving the award of a 36-month petroleum exploration license in the Southern portion of the Golan Heights in April 2013, Afek has been preparing permit applications, contracting with international service providers to assist in exploration activities, and staffing up for operations. During 2013, Afek completed preliminary geophysical work including an electromagnetic survey and the reprocessing of 2D seismic data to characterize the subsurface prior to drilling exploration wells. Afek subsequently began the analysis of the acquired data. Partial and preliminary results are consistent with our view that there are high levels of resistivity pointing to what may be potentially attractive oil and gas resources in the license area. In addition, Afek submitted a permit application to conduct a ten-well exploration drilling program to further characterize the resource in its license area. The exploration drilling program is scheduled to begin as early as the first half of 2014 assuming the permit is received.
28
Equity in the Net Loss of AMSO, LLC
. In early March 2013, AMSO, LLC initiated start-up of its oil shale pilot test. The pilot test is intended to confirm the accuracy of several of the key underlying assumptions of AMSO, LLC’s proposed in-situ heating and retorting process. After approximately two weeks of operation, the down-hole electric heater failed. Pilot operations were too short to allow conclusions to be drawn about the ultimate viability of AMSO, LLC’s technical approach. AMSO, LLC subsequently decided not to attempt to re-engineer the current downhole electrical heating system. Instead, it has initiated a comprehensive review of alternative heating system solutions. AMSO, LLC intends to qualify, design, engineer, build and thoroughly test the heating solution offering the best prospects for reliable pilot test operations. A key objective of the development process is to significantly de-risk the pilot operations before heater installation. In addition, this alternative heating system qualification process may result in development of a solution applicable to subsequent phases of the research, development and demonstration project’s operations. In 2013, AMSO, LLC launched a series of diagnostic tests to analyze the status of its pilot test's down-hole heating and production well system. AMSO, LLC is seeking to ascertain how the passage of time and limited pilot test operations conducted in 2012 and 2013, including down-hole heating, have impacted the well system's condition and whether modifications to the pilot test’s operational plans will be required. It is expected that the heater development process will continue through 2014. Equipment modifications and technical issues are common in projects of the complexity and scope of the AMSO, LLC pilot test, particularly given the extent to which new concepts and applications have been incorporated into the pilot test’s design. Upon successful completion of the pilot test, AMSO, LLC will evaluate the appropriate timing to submit an application to convert its research, development and demonstration lease into a commercial lease. AMSO, LLC also expects to design and implement a larger scale demonstration project to further test its process and operations under commercial conditions, and assess scalability to commercial production levels.
AMSO’s equity in the net loss of AMSO, LLC was substantially unchanged in the year ended December 31, 2013 compared to the year ended December 31, 2012 because AMSO, LLC’s net loss was $9.1 million in the years ended December 31, 2013 and 2012.
AMSO has the right to decide whether or not to fund its shares of each capital call issued by AMSO, LLC. AMSO did not fund the capital call for the first quarter of 2014, and in January 2014, Total funded AMSO’s share, which was $0.9 million. Because of AMSO’s decision not to fund its share of AMSO, LLC’s expenditures, AMSO, LLC will allocate its net loss beginning January 2014 as follows. AMSO, LLC will allocate the first $2.6 million of losses to Total, then it will allocate any remaining losses proportionately such that AMSO and Total’s capital accounts as a percentage of AMSO, LLC’s total capital equals their ownership interests.
Corporate
Corporate does not generate any revenues, nor does it incur any direct cost of revenues. Corporate costs include unallocated compensation, consulting fees, legal fees, business development expenses and other corporate-related general and administrative expenses.
|
(in millions)
|
Change
|
|||||||||||||||
|
Year ended December 31,
|
2013
|
2012
|
$
|
%
|
||||||||||||
|
General and administrative expenses and loss from operations
|
$ | 9.1 | $ | 7.9 | $ | 1.2 | 15.6 | % | ||||||||
The increase in general and administrative expenses in the year ended December 31, 2013 compared to the year ended December 31, 2012 was due primarily to increases in severance, stock-based compensation and charitable contributions, partially offset by decreases in payroll and related expenses. As a percentage of our consolidated revenues, Corporate general and administrative expenses increased from 3.4% in the year ended December 31, 2012 to 3.5% in the year ended December 31, 2013.
Consolidated
Selling, General and Administrative
. Prior to the Spin-Off, IDT, our former parent company, charged us for certain transactions and allocated routine expenses based on company specific items. In addition, IDT controlled the flow of our treasury transactions. Following the Spin-off, IDT charges us for services it provides pursuant to the Transition Services Agreement. In the years ended December 31, 2013 and 2012, IDT charged us $3.3 million and $3.8 million, respectively, which was included in consolidated selling, general and administrative expense.
Stock-based compensation expense included in consolidated selling, general and administrative expenses was $4.2 million and $3.4 million in the years ended December 31, 2013 and 2012, respectively. The increase is primarily due to expense from grants of equity interests in certain of our subsidiaries and grants of stock options, partially offset by a decrease in expense from grants of restricted stock. The expense from these grants is recognized over the expected service period.
On December 12, 2013, our Compensation Committee and our Board of Directors approved, subject to the approval of our stockholders, a compensation arrangement with Mr. Howard Jonas, the Chairman of our Board of Directors, upon his appointment as our Chief Executive Officer for a five-year term that commenced on January 1, 2014. The compensation arrangement included, among other things, the grant of options to purchase 3.0 million shares of our Class B Common Stock at an exercise price of $10.30 per share. The exercise price was equal to the fair market value of the shares on the date of the grant. The options vest in five equal annual installments commencing on December 15, 2014 and expire ten years from the grant date. The estimated total value of the options was $19.3 million, which will be recognized on a straight-line basis over the vesting period. The fair value of the options was estimated using a Black-Scholes valuation model.
At December 31, 2013, aggregate unrecognized compensation cost related to non-vested stock-based compensation (including the stock options described above) was $23.5 million. The unrecognized compensation cost is expected to be recognized as follows: $6.9 million in the year ending December 31, 2014, $4.9 million in the year ending December 31, 2015, $4.1 million in the year ending December 31, 2016, $3.9 million in the year ending December 31, 2017 and $3.9 million in the year ending December 31, 2018.
29
The following is a discussion of our consolidated income and expense line items below income from operations.
|
(in millions)
|
Change
|
|||||||||||||||
|
Year ended December 31,
|
2013
|
2012
|
$
|
%
|
||||||||||||
|
Income from operations
|
$ | 0.6 | $ | 3.0 | $ | (2.4 | ) | (79.5 | )% | |||||||
|
Interest income
|
0.4 | 0.4 | — | 8.6 | ||||||||||||
|
Financing fees
|
(3.2 | ) | (2.9 | ) | (0.3 | ) | (10.5 | ) | ||||||||
|
Other expense, net
|
(0.3 | ) | (0.1 | ) | (0.2 | ) | (201.5 | ) | ||||||||
|
Provision for income taxes
|
(2.8 | ) | (2.9 | ) | 0.1 | 6.0 | ||||||||||
|
Net loss
|
(5.3 | ) | (2.5 | ) | (2.8 | ) | (110.6 | ) | ||||||||
|
Net income attributable to noncontrolling interests
|
(0.6 | ) | (0.8 | ) | 0.2 | 24.6 | ||||||||||
|
Net loss attributable to Genie
|
$ | (5.9 | ) | $ | (3.3 | ) | $ | (2.6 | ) | (79.9 | )% | |||||
Financing Fees
. Financing fees are the volumetric fees charged by BP under the Preferred Supplier Agreement between IDT Energy and BP, pursuant to which BP is IDT Energy’s preferred provider of electricity and natural gas. Financing fees increased in the year ended December 31, 2013 compared to the year ended December 31, 2012 primarily because of the higher consumption by IDT Energy’s customers.
Other Expense, net
. The increase in other expense, net in the year ended December 31, 2013 compared to the year ended December 31, 2012 was mainly due to a gain in 2012 from the sale of IDT Energy’s amount due from MF Global as well as an increase in foreign currency translation losses. On October 31, 2011, MF Global, our former clearing broker, filed for bankruptcy protection. On that date, IDT Energy held $1.65 million of cash on deposit with MF Global in support of hedging positions related to IDT Energy’s commodity supply. Assets held by MF Global were placed under the control of the court appointed bankruptcy trustee to be released as deemed appropriate. In November 2011, we transferred our hedging securities to an alternative clearing broker. In October 2011, we recognized a $0.45 million loss, relating to our cash deposit with MF Global, based on management’s best estimate of the unrecoverable amount. In November 2012, we received $0.6 million from a sale of the amount due from MF Global and recognized a gain of $0.3 million.
Provision for Income Taxes
. The slight decrease in the provision for income taxes in the year ended December 31, 2013 compared to the year ended December 31, 2012 was due to a significant decrease in our tax provision, partially offset by an increase in the tax provision of our consolidated variable interest entities. Citizen’s Choice Energy, LLC, or CCE, DAD Sales, LLC, or DAD, and Tari Corporation, or Tari are variable interest entities that are consolidated in our IDT Energy segment. We and CCE, DAD and Tari file separate tax returns since we do not have any ownership interest in CCE, DAD or Tari. The significant decrease in our tax provision was due to the establishment of a valuation allowance on our deferred income tax assets in a prior period, which was partially offset by an audit settlement. In 2013, we only recorded a state income tax expense on IDT Energy’s earnings. CCE, DAD and Tari recorded federal and state tax provisions in 2013 because their net operating losses have been utilized.
Net Income Attributable to Noncontrolling Interests
. The decrease in the net income attributable to noncontrolling interests in the year ended December 31, 2013 compared to the year ended December 31, 2012 primarily relates to changes in the net income attributable to noncontrolling interests of IDT Energy and Tari, partially offset by an increase in the net income attributable to noncontrolling interests of CCE and a decrease in the net loss attributable to noncontrolling interests of DAD. We do not have any ownership interest in CCE, DAD or Tari, therefore all net income or loss incurred by them has been attributed to noncontrolling interests. Tari’s net income in the year ended December 31, 2013 was $0.1 million compared to $0.2 million in the year ended December 31, 2012. Tari’s net income decreased primarily due to a decrease in its revenue, partially offset by a decrease in payroll expense. CCE’s net income in the year ended December 31, 2013 was $2.1 million compared to $1.9 million in the year ended December 31, 2012. CCE’s net income increased primarily due to a decrease in customer acquisition costs, partially offset by reduction in gross profit and an increase in management fees. DAD’s net loss in the year ended December 31, 2013 was $0.1 million compared to $0.3 million in the year ended December 31, 2012. DAD’s net loss decreased because DAD ceased to acquire customers for CCE in December 2012, and reduced its operations accordingly.
Year Ended December 31, 2012 compared to Year Ended December 31, 2011
The financial data for the year ended December 31, 2011 is unaudited. The financial data for the year ended December 31, 2011 is presented because it is the most appropriate period to compare with the year ended December 31, 2012 in order to discuss and analyze our operating trends and performance.
30
IDT Energy Segment
|
(in millions)
|
Change
|
|||||||||||||||
|
Year ended December 31,
|
2012
|
2011
|
$
|
%
|
||||||||||||
|
Revenues:
|
||||||||||||||||
|
Electric
|
$ | 174.3 | $ | 134.3 | $ | 40.0 | 29.7 | % | ||||||||
|
Natural gas
|
55.2 | 63.6 | (8.4 | ) | (13.2 | ) | ||||||||||
|
Total revenues
|
229.5 | 197.9 | 31.6 | 15.9 | ||||||||||||
|
Direct cost of revenues
|
159.9 | 141.2 | 18.7 | 13.2 | ||||||||||||
|
Gross profit
|
69.6 | 56.7 | 12.9 | 22.7 | ||||||||||||
|
Selling, general and administrative
|
44.6 | 37.1 | 7.5 | 20.4 | ||||||||||||
|
Income from operations
|
$ | 25.0 | $ | 19.6 | $ | 5.4 | 27.2 | % | ||||||||
Revenues
. IDT Energy’s electricity revenues increased in the year ended December 31, 2012 compared to the year ended December 31, 2011 as a result of a significant increase in consumption, partially offset by a decrease in the average rate charged to customers. Electricity consumption increased 62.7% in the year ended December 31, 2012 compared to the year ended December 31, 2011, and the average rate charged to customers for electricity decreased 20.2% in the year ended December 31, 2012 compared to the year ended December 31, 2011. The increase in electricity consumption was the result of an increase in meters enrolled, coupled with an increase in average consumption per meter. The decrease in the average rate charged to customers for electricity was primarily the result of a decrease in the underlying commodity cost. In the second quarter of 2012, IDT Energy entered an additional electric territory in Pennsylvania with an addressable market of approximately seven hundred thousand meters. In the third quarter of 2012, IDT Energy entered its fourth state, Maryland, and began marketing and enrolling customers in three electric utility territories in that state, as well as in one additional electric utility territory in Pennsylvania. In the aggregate, these new territories represent an addressable market of 1.9 million meters. In the fourth quarter of 2012, IDT Energy entered an additional Maryland electric utility territory that has an addressable market of approximately two hundred forty thousand meters.
31
IDT Energy's natural gas revenues decreased in the year ended December 31, 2012 compared to the year ended December 31, 2011 primarily due to unusually warm weather in the three months ended March 31, 2012, which reduced the demand for natural gas for heat. This decrease was partially offset by an increase in the average active meters during the year ended December 31, 2012 compared to the year ended December 31, 2011. As measured by heating degree days, a measure of outside air temperature designed to reflect the energy required for heating, New York State was 24% warmer in the three months ended March 31, 2012 compared to the same period in 2011. The unseasonably warm weather contributed to decreases in both the per unit rate charged and in consumption per meter. The per unit rate charged to customers decreased 12.9% in the year ended December 31, 2012 compared to the year ended December 31, 2011. Consumption per meter decreased 4.9% in the year ended December 31, 2012 compared to the year ended December 31, 2011. The decline in demand for heat as well as increased domestic production of natural gas and relatively high storage gas inventories caused a decrease in the underlying natural gas cost, which allowed us to decrease the average rate charged to customers for natural gas. The decline in the average rate charged to customers for natural gas was also the result of discounts and promotional rates for new customers. The 0.4% decline in consumption in the year ended December 31, 2012 compared to the year ended December 31, 2011 due to the unusually warm weather was partially offset by an increase in meters served. Although the natural gas meters enrolled at December 31, 2012 were less than the meters enrolled at December 31, 2011, the number of meters served per month was higher in the year ended December 31, 2012 compared to the year ended December 31, 2011.
IDT Energy’s customer base as measured by meters enrolled consisted of the following:
|
(in thousands)
|
December 31,
2012
|
September 30,
2012
|
June 30,
2012
|
March 31,
2012
|
December 31,
2011
|
|||||||||||||||
|
Meters at end of quarter:
|
||||||||||||||||||||
|
Electric customers
|
331 | 343 | 313 | 289 | 254 | |||||||||||||||
|
Natural gas customers
|
171 | 180 | 182 | 186 | 184 | |||||||||||||||
|
Total meters
|
502 | 523 | 495 | 475 | 438 | |||||||||||||||
Gross meter acquisitions in the year ended December 31, 2012 were 407,000 compared to 302,000 in the year ended December 31, 2011. Net meters enrolled increased by 64,000 or 14.6% in the year ended December 31, 2012 compared to an increase of 70,000 meters or 19.1% in the year ended December 31, 2011, as gross meter acquisitions were partially offset by higher rates of customer churn. Average monthly churn increased from 5.6% in the year ended December 31, 2011 to 6.6% in the year ended December 31, 2012, primarily because of the continued acceleration in customer acquisitions. Newly acquired customers have higher churn rates than longer term customers. Increased competition in some of IDT Energy’s key utility markets also contributed to higher rates of customer churn.
The average rates of annualized energy consumption, as measured by residential customer equivalents, or RCEs, are presented in the chart below. The 25.9% RCE increase at December 31, 2012 compared to December 31, 2011 reflects primarily the increase in electric meters enrolled as well as, to a lesser degree, a shift in IDT Energy’s electricity customer base to customers with higher consumption per meter. A significant portion of IDT Energy’s growth in RCEs was from recent expansion into electric-only utilities’ territories, with higher electric consumption per meter than IDT Energy’s legacy customer base. This increase was partially offset by decreases in natural gas RCEs primarily due to consumption declines associated with the warmer than normal weather over the measurement period and a decline in gas meters served.
32
|
(in thousands)
|
December 31,
2012
|
September 30,
2012
|
June 30,
2012
|
March 31,
2012
|
December 31,
2011
|
|||||||||||||||
|
RCEs at end of quarter:
|
||||||||||||||||||||
|
Electric customers
|
238 | 235 | 204 | 176 | 153 | |||||||||||||||
|
Natural gas customers
|
74 | 87 | 88 | 82 | 95 | |||||||||||||||
|
Total RCEs
|
312 | 322 | 292 | 258 | 248 | |||||||||||||||
Direct Cost of Revenues and Gross Margin Percentage
. IDT Energy’s direct cost of revenues and gross margin percentage were as follows:
|
(in millions)
|
Change
|
|||||||||||||||
|
Year ended December 31,
|
2012
|
2011
|
$
|
%
|
||||||||||||
|
Direct cost of revenues:
|
||||||||||||||||
|
Electric
|
$ | 119.0 | $ | 89.0 | $ | 30.0 | 33.6 | % | ||||||||
|
Natural gas
|
40.9 | 52.2 | (11.3 | ) | (21.6 | ) | ||||||||||
|
Total direct cost of revenues
|
$ | 159.9 | $ | 141.2 | $ | 18.7 | 13.2 | % | ||||||||
|
Year ended December 31,
|
2012
|
2011
|
Change
|
|||||||||
|
Gross margin percentage:
|
||||||||||||
|
Electric
|
31.8 | % | 33.8 | % | (2.0 | )% | ||||||
|
Natural gas
|
25.8 | 17.9 | 7.9 | |||||||||
|
Total gross margin percentage
|
30.3 | % | 28.7 | % | 1.6 | % | ||||||
Direct cost of revenues for electricity increased in the year ended December 31, 2012 compared to the year ended December 31, 2011 primarily because consumption increased 62.7% in the year ended December 31, 2012 compared to the year ended December 31, 2011. These increases were partially offset by decreases in the average unit cost of 17.8% in the year ended December 31, 2012 compared to the year ended December 31, 2011.
Direct cost of revenues for natural gas decreased in the year ended December 31, 2012 compared to the year ended December 31, 2011. The decrease was primarily due to decline in the average unit cost of 21.3% in the year ended December 31, 2012 compared to the year ended December 31, 2011. Natural gas consumption decreased 0.4% in the year ended December 31, 2012 compared to the year ended December 31, 2011.
Gross margin on electricity sales decreased in the year ended December 31, 2012 compared to the year ended December 31, 2011 primarily as a result of discounts and promotional rates we offered new customers. Gross margins on natural gas sales increased in the year ended December 31, 2012 compared to the year ended December 31, 2011 as the cost of the underlying commodity declined more sharply than we decreased the average rate charged to customers.
Selling, General and Administrative
. The increase in selling, general and administrative expense in the year ended December 31, 2012 compared to the year ended December 31, 2011, was primarily due to an increase in customer acquisition costs. These costs increased an aggregate of $7.5 million in the year ended December 31, 2012 compared to the year ended December 31, 2011. Customer acquisition costs increased primarily due to the significant increase in the number of new customers acquired as a result of the expansion into new territories. In addition, the increase in selling, general and administrative expense in the year ended December 31, 2012 compared to the year ended December 31, 2011 was the result of increases in payroll, severance and stock-based compensation expense, which increased an aggregate of $3.0 million in the year ended December 31, 2012 compared to the year ended December 31, 2011. The increase in stock-based compensation expense is primarily due to expense from the November 2011 grants of restricted stock and stock options, as well as from the March 2012 grants of equity interests in IDT Energy. The expense from these grants is recognized over the expected service period. Selling, general and administrative expense in the year ended December 31, 2011 included a $3.3 million charge for New York City gross receipts tax pertaining to liabilities incurred in prior periods, which reduced the increase in selling, general and administrative expense in the year ended December 31, 2012 compared to the year ended December 31, 2011. As a percentage of IDT Energy’s total revenues, selling, general and administrative expense increased from 18.7% in the year ended December 31, 2011 to 19.4% in the year ended December 31, 2012 primarily because of the significant increase in costs related to customer acquisitions.
33
Genie Oil and Gas Segment
Genie Oil and Gas did not generate any revenues, nor did it incur any direct cost of revenues, in the years ended December 31, 2012 and 2011.
|
(in millions)
|
Change
|
|||||||||||||||
|
Year ended December 31,
|
2012
|
2011
|
$
|
%
|
||||||||||||
|
General and administrative expense
|
$ | 1.4 | $ | 1.2 | $ | 0.2 | 22.5 | % | ||||||||
|
Research and development
|
9.4 | 7.4 | 2.0 | 25.8 | ||||||||||||
|
Equity in net loss of AMSO, LLC
|
3.2 | 5.7 | (2.5 | ) | (44.1 | ) | ||||||||||
|
Loss from operations
|
$ | 14.0 | $ | 14.3 | $ | (0.3 | ) | (2.1 | )% | |||||||
General and Administrative
. General and administrative expense increased in the year ended December 31, 2012 compared to the year ended December 31, 2011 as an increase in stock-based compensation expense was partially offset by a decrease in costs associated with our global business development efforts.
Research and Development
. Research and development expense in the year ended December 31, 2012 increased compared to the year ended December 31, 2011 primarily due to the increase in expenses in our global development efforts outside of AMSO and IEI. IEI’s research and development expense was $7.2 million in the years ended December 31, 2012 and 2011. IEI began its resource appraisal study in the third quarter of calendar 2009, and completed the field work included in its study in late calendar year 2011. During the year ended December 31, 2012, IEI continued lab work, engineering work and associated preparation of environmental permit applications related to its the pilot permitting process.
Equity in the Net Loss of AMSO, LLC
. In the year ended December 31, 2012, AMSO, LLC continued with late-stage preparations for its pilot test. AMSO’s equity in the net loss of AMSO, LLC decreased in the year ended December 31, 2012 compared to the year ended December 31, 2011 due to the decrease in AMSO, LLC’s net loss to $9.1 million in the year ended December 31, 2012 from $27.3 million in the year ended December 31, 2011, notwithstanding that, beginning in December 2011, AMSO’s share of the net loss of AMSO, LLC increased from 20% to 35%, in accordance with our agreement with Total. AMSO, LLC’s net loss decreased as the costs associated with the pilot test facility construction were substantially completed in the year ended December 31, 2011.
Corporate
Corporate does not generate any revenues, nor does it incur any direct cost of revenues. Corporate costs include unallocated compensation, consulting fees, legal fees, business development expenses and other corporate-related general and administrative expenses.
|
(in millions)
|
Change
|
|||||||||||||||
|
Year ended December 31,
|
2012
|
2011
|
$
|
%
|
||||||||||||
|
General and administrative expense and loss from operations
|
$ | 7.9 | $ | 2.1 | $ | 5.8 | 269.3 | % | ||||||||
The increase in general and administrative expense in the year ended December 31, 2012 compared to the year ended December 31, 2011 was due primarily to increases in payroll and related expense, legal and consulting fees and stock-based compensation, including costs related to being a separate public company, following our Spin-Off from IDT. The service agreements between IDT and us include services provided by IDT, such as transitional services relating to human resources and employee benefits administration, finance, accounting, tax, internal audit, facilities, investor relations and legal services, as well as specified administrative services to be provided by us to certain of IDT’s foreign subsidiaries. The costs we incurred as a separate public company and the charges for additional services provided by IDT were not included in our financial statements prior to the Spin-Off since they were not applicable for periods that we were not a separate public company.
Consolidated
Selling, General and Administrative
. Until the Spin-Off, IDT, our former parent company, charged us for certain transactions and allocated routine expenses based on company specific items. In addition, IDT controlled the flow of our treasury transactions. Following the Spin-off, IDT charges us for services it provides pursuant to the Transition Services Agreement. In the years ended December 31, 2012 and 2011, IDT charged us $3.8 million and $5.4 million, respectively, which was included in consolidated selling, general and administrative expense.
Stock-based compensation expense included in consolidated selling, general and administrative expense was $3.4 million and $0.6 million in the years ended December 31, 2012 and 2011, respectively. The increase was primarily due to expense from the November 2011 grants of restricted stock and stock options, as well as from the March 2012 grants of equity interests in certain of our subsidiaries. The expense from these grants is recognized over the expected service period.
34
The following is a discussion of our consolidated income and expense line items below income from operations.
|
(in millions)
|
Change
|
|||||||||||||||
|
Year ended December 31,
|
2012
|
2011
|
$ | % | ||||||||||||
|
Income from operations
|
$ | 3.0 | $ | 3.1 | $ | (0.1 | ) | (3.1 | )% | |||||||
|
Interest income
|
0.4 | 0.1 | 0.3 | 392.7 | ||||||||||||
|
Financing fees
|
(2.9 | ) | (2.2 | ) | (0.7 | ) | (33.7 | ) | ||||||||
|
Other expense, net
|
(0.1 | ) | (1.4 | ) | 1.3 | 89.9 | ||||||||||
|
Provision for income taxes
|
(2.9 | ) | (3.4 | ) | 0.5 | 13.3 | ||||||||||
|
Net (loss) income
|
(2.5 | ) | (3.8 | ) | 1.3 | 32.2 | ||||||||||
|
Net (income) loss attributable to noncontrolling interests
|
(0.8 | ) | 4.5 | (5.3 | ) | (116.6 | ) | |||||||||
|
Net (loss) income attributable to Genie
|
$ | (3.3 | ) | $ | 0.7 | $ | (4.0 | ) | (540.4 | )% | ||||||
Financing Fees
. Financing fees are the volumetric fees charged by BP under the Preferred Supplier Agreement between IDT Energy and BP, pursuant to which BP is IDT Energy’s preferred provider of electricity and natural gas. Financing fees increased in the year ended December 31, 2012 compared to the year ended December 31, 2011 primarily because of the higher consumption by IDT Energy’s customers.
Other Expense, net
. The decrease in other expense, net in the year ended December 31, 2012 compared to the year ended December 31, 2011 was mainly due to a decrease in foreign currency translation losses as well as a gain from the sale of IDT Energy’s amount due from MF Global. On October 31, 2011, MF Global, our former clearing broker, filed for bankruptcy protection. On that date, IDT Energy held $1.65 million of cash on deposit with MF Global in support of hedging positions related to IDT Energy’s commodity supply. Assets held by MF Global were placed under the control of the court appointed bankruptcy trustee to be released as deemed appropriate. In November 2011, we transferred our hedging securities to an alternative clearing broker. In October 2011, we recognized a $0.45 million loss, relating to our cash deposit with MF Global, based on management’s best estimate of the unrecoverable amount. In November 2012, we received $0.6 million from a sale of the amount due from MF Global and recognized a gain of $0.3 million.
Provision for Income Taxes
. The decrease in the provision for income taxes in the year ended December 31, 2012 compared to the year ended December 31, 2011 was primarily due to an increase in benefits from income tax due to the increase in GOGAS and Corporate pre-tax losses, as well as the reversal of $2.5 million of accrued New York state income taxes as a result of a settlement of prior years’ income tax audits, partially offset by income tax expense from the recording of a valuation allowance of $5.5 million against deferred tax assets. Subsequent to the Spin-Off, we initiated a tax strategy that enables us to deduct losses from our foreign subsidiaries against our profitable U.S. operations. Because of this strategy, the decrease in pre-tax earnings of IDT Energy in 2012, and our projections, we concluded that we no longer met the criteria of more likely than not in order to utilize our deferred federal income tax assets in the foreseeable future. Accordingly, we recorded a valuation allowance against our deferred federal income tax assets. Prior to the Spin-Off, we were included in the consolidated federal income tax return of IDT. Our income taxes are presented for periods prior to the Spin-Off on a separate tax return basis. In the year ended December 31, 2011, IDT charged us $4.5 million for utilizing its net operating loss, which was included in “Provision for income taxes”.
Net (Income) Loss Attributable to Noncontrolling Interests
. The change in the net (income) loss attributable to noncontrolling interests in the year ended December 31, 2012 compared to the year ended December 31, 2011, primarily relates to 100% of the net income (loss) incurred by CCE, which is a variable interest entity that is consolidated in our IDT Energy segment. We do not have any ownership interest in CCE, therefore all net income or loss incurred by CCE has been attributed to noncontrolling interests. CCE’s net income in the year ended December 31, 2012 was $1.9 million, compared to net loss of $1.8 million in the year ended December 31, 2011. CCE’s customer base and revenues had grown significantly in the year ended December 31, 2012 compared to the year ended December 31, 2011 since CCE commenced operations in the three months ended March 31, 2011.
Five Months Ended December 31, 2011 compared to Five Months Ended December 31, 2010
IDT Energy Segment
|
(in millions)
|
Change
|
|||||||||||||||
|
Five Months ended December 31,
|
2011
|
2010
|
$ | % | ||||||||||||
|
Revenues:
|
||||||||||||||||
|
Electric
|
$ | 57.1 | $ | 53.0 | $ | 4.1 | 7.8 | % | ||||||||
|
Natural gas
|
19.7 | 21.8 | (2.1 | ) | (10.1 | ) | ||||||||||
|
Total revenues
|
76.8 | 74.8 | 2.0 | 2.5 | ||||||||||||
|
Direct cost of revenues
|
52.5 | 53.4 | (0.9 | ) | (1.8 | ) | ||||||||||
|
Gross profit
|
24.3 | 21.4 | 2.9 | 13.3 | ||||||||||||
|
Selling, general and administrative
|
15.4 | 9.7 | 5.7 | 58.5 | ||||||||||||
|
Income from operations
|
$ | 8.9 | $ | 11.7 | $ | (2.8 | ) | (24.1 | )% | |||||||
Revenues
. IDT Energy’s electricity revenues increased in the five months ended December 31, 2011 compared to the same period in 2010 as a result of an increase in consumption, partially offset by decrease in the average rate charged to customers for electricity. Electric consumption increased 18.6%, and the average charged to customers for electricity decreased 9.2%. The increase in electric consumption was the result of an increase in meters served coupled with an increase in the consumption per meter. The decrease in the average rate charged to customers for electricity was primarily the result of a decrease in the underlying commodity cost.
35
IDT Energy's natural gas revenues decreased in the five months ended December 31, 2011 compared to the same period in 2010 primarily due to unusually warm weather in November and December 2011, which reduced the need for heat. As measured by heating degree days, New York State was 22% warmer in November and December 2011 than in the same period in 2010. The warm weather caused decreases in both the average rate charged to customers and in consumption, which decreased 7.1% and 3.3%, respectively. The decline in demand for heat as well as increased domestic production of natural gas caused a decrease in the underlying natural gas cost, which allowed us to decrease the average rate charged to customers for natural gas. The decline in the average rate charged to customers for natural gas was also the result of discounted promotional rates for new customers. The decline in consumption was partially offset by an increase in meters served.
IDT Energy’s customer base as measured by meters served consisted of the following:
|
(in thousands)
|
December 31,
2011
|
September 30,
2011
|
June 30,
2011
|
March 31,
2011
|
December 31,
2010
|
|||||||||||||||
|
Meters at end of quarter:
|
||||||||||||||||||||
|
Electric customers
|
254 | 247 | 224 | 210 | 208 | |||||||||||||||
|
Natural gas customers
|
184 | 183 | 172 | 167 | 160 | |||||||||||||||
|
Total meters
|
438 | 430 | 396 | 377 | 368 | |||||||||||||||
Gross meter acquisitions in the five months ended December 31, 2011 were 157,000 compared to 75,000 in the same period in 2010, which represented increases in meters served of 38.6% and 20.3% in the five months ended December 31, 2011 and 2010, respectively. The new meter acquisitions in the five months ended December 31, 2011 were partially offset by customer churn, which resulted in a net increase of 7.9% in meters served or net gains of approximately 32,000 meters since July 31, 2011. The new meter acquisitions in the five months ended December 31, 2010 were more than offset by customer churn, which resulted in a net decrease of 0.6% in meters served or a net loss of approximately 2,000 meters since July 31, 2010. Average monthly churn increased from 4.7% in the five months ended December 31, 2010 to 6.4% in the five months ended December 31, 2011 in part due to the impact of the recent acceleration in customer acquisitions as new customers tend to churn at a higher initial rate than long-term customers.
The average rates of annualized energy consumption, as measured by residential customer equivalents, or RCEs, are presented in the chart below. The 17.8% RCE increase at December 31, 2011 compared to December 31, 2010 reflects primarily the increase in meters served as well as, to a lesser degree, a shift in IDT Energy’s customer base to customers with higher consumption per meter as a result of targeted customer acquisition programs.
|
(in thousands)
|
December 31,
2011
|
September 30,
2011
|
June 30,
2011
|
March 31,
2
011
|
December 31,
2010
|
|||||||||||||||
|
RCEs at end of quarter:
|
||||||||||||||||||||
|
Electric customers
|
153 | 142 | 135 | 119 | 123 | |||||||||||||||
|
Natural gas customers
|
95 | 100 | 99 | 89 | 88 | |||||||||||||||
|
Total RCEs
|
248 | 242 | 234 | 208 | 211 | |||||||||||||||
Direct Cost of Revenues and Gross Margin Percentage
. IDT Energy’s direct cost of revenues and gross margin percentage were as follows:
|
(
in
millions)
|
Change
|
|||||||||||||||
|
Five Months ended December 31,
|
2011
|
2010
|
$ | % | ||||||||||||
|
Direct cost of revenues:
|
||||||||||||||||
|
Electric
|
$ | 35.4 | $ | 37.0 | $ | (1.6 | ) | (4.3 | )% | |||||||
|
Natural gas
|
17.1 | 16.4 | 0.7 | 3.9 | ||||||||||||
|
Total direct cost of revenues
|
$ | 52.5 | $ | 53.4 | $ | (0.9 | ) | (1.8 | )% | |||||||
|
Five Months ended December 31,
|
2011
|
2010
|
Change
|
|||||||||
|
Gross margin percentage:
|
||||||||||||
|
Electric
|
38.1 | % | 30.3 | % | 7.8 | % | ||||||
|
Natural gas
|
12.9 | 24.7 | (11.8 | ) | ||||||||
|
Total gross margin percentage
|
31.7 | % | 28.7 | % | 3.0 | % | ||||||
Direct cost of revenues for electricity decreased 4.3% in the five months ended December 31, 2011 compared to the same period in 2010 as the 19.4% decrease in the average unit cost was partially offset by an increase of 18.6% in consumption. Direct cost of revenues for natural gas increased 3.9% in the five months ended December 31, 2011 compared to the same period in 2010 primarily due to the 7.5% increase in the average unit cost. The increase in the average unit cost of natural gas was due to increases in the per unit cost of pipeline, storage and transportation services in the five months ended December 31, 2011 compared to the same period in 2010 as a result of lower natural gas consumption. We purchase these services at the beginning of the heating season based on projected consumption, so the lower than expected natural gas consumption resulted in amortization of the amount purchased over a smaller number of units.
36
Gross margins on electricity sales increased as the cost of the underlying commodity declined more sharply than the decrease in the average rate charged to customers. Gross margins on natural gas sales declined due to increased pipeline, storage and transportation costs in selected territories that were not fully recovered through rate increases during the period.
Selling, General and Administrative
. The increase in selling, general and administrative expense in the five months ended December 31, 2011 compared to the same period in 2010 was primarily due to increases in customer acquisition costs and marketing costs, which increased an aggregate of $3.5 million. Customer acquisition costs increased primarily due to the significant increase in the number of new customers acquired. Marketing costs increased as a result of the expansion into new territories. In addition, sales and use tax expense, which is included in selling, general and administrative expense, increased $0.9 million in the five months ended December 31, 2011 compared to the same period in 2010 primarily due to accruals related to ongoing tax audits. As a percentage of total IDT Energy revenues, selling, general and administrative expense increased from 13.0% in the five months ended December 31, 2010 to 20.1% in the five months ended December 31, 2011 primarily because of the significant increase in costs related to customer acquisitions mentioned above.
Genie Oil and Gas Segment
Genie Oil and Gas did not generate any revenues, nor did it incur any direct cost of revenues, in the five months ended December 31, 2011 and 2010.
|
(in millions)
|
Change
|
|||||||||||||||
|
Five Months ended December 31,
|
2011
|
2010
|
$ | % | ||||||||||||
|
General and administrative expense
|
$ | 0.8 | $ | 0.9 | $ | (0.1 | ) | (15.5 | )% | |||||||
|
Research and development
|
2.6 | 3.0 | (0.4 | ) | (13.0 | ) | ||||||||||
|
Equity in net loss of AMSO, LLC
|
2.1 | 1.7 | 0.4 | 26.4 | ||||||||||||
|
Loss from operations
|
$ | 5.5 | $ | 5.6 | $ | (0.1 | ) | (1.7 | )% | |||||||
General and Administrative
. General and administrative expense in the five months ended December 31, 2011 decreased slightly compared to the same period in 2010 as increases in costs associated with our global business development efforts in 2011 were partially offset by a decrease in stock-based compensation expense.
Research and Development
. Research and development expense in the five months ended December 31, 2011 and 2010 were primarily related to the operations of IEI in Israel. IEI completed the field work included in its resource appraisal study in late calendar year 2011.
Equity in the Net Loss of AMSO, LLC
. AMSO’s equity in the net loss of AMSO, LLC increased in the five months ended December 31, 2011 compared to the same period in 2010 as a result of the increase in AMSO, LLC’s net loss to $9.4 million in the five months ended December 31, 2011 from $8.3 million in the five months ended December 31, 2010. AMSO, LLC’s net loss increased primarily as a result of the substantial increase in the costs associated with the pilot test. AMSO’s portion of the loss of AMSO, LLC increased in December 2011 from 20% to 35%, per our agreement with Total. In the five months ended December 31, 2011, AMSO, LLC continued with late-stage preparations for its pilot test and received all permits required to begin operations including well drilling and installation of down-hole instrumentation.
Corporate
Corporate does not generate any revenues, nor does it incur any direct cost of revenues. Corporate costs include unallocated compensation, consulting fees, legal fees, business development expenses and other corporate-related general and administrative expenses.
|
(in millions)
|
Change
|
|||||||||||||||
|
Five Months ended December 31,
|
2011
|
2010
|
$ | % | ||||||||||||
|
General and administrative expense and loss from operations
|
$ | 1.7 | $ | 0.6 | $ | 1.1 | 177.9 | % | ||||||||
The increase in general and administrative expense in the five months ended December 31, 2011 compared to the same period in 2010 was due primarily to increases in compensation, consulting fees and stock-based compensation, including costs related to being a separate public company, following our Spin-Off from IDT.
Consolidated
Selling, General and Administrative
. Until the Spin-Off, IDT, our former parent company, charged us for certain transactions and allocated routine expenses based on company specific items. In addition, IDT controlled the flow of our treasury transactions. Following the Spin-off, IDT charges us for services it provides pursuant to the Transition Services Agreement. In the five months ended December 31, 2011 and 2010, IDT charged us $2.6 million and $1.8 million, respectively, which was included in selling, general and administrative expense.
37
The following is a discussion of our consolidated income and expense line items below income from operations.
|
(in millions)
|
Change
|
|||||||||||||||
|
Five Months ended December 31,
|
2011
|
2010
|
$ | % | ||||||||||||
|
Income from operations
|
$ | 1.7 | $ | 5.6 | $ | (3.9 | ) | (68.9 | )% | |||||||
|
Interest income
|
— | 0.1 | (0.1 | ) | (17.0 | ) | ||||||||||
|
Financing fees
|
(1.0 | ) | (0.9 | ) | (0.1 | ) | (13.7 | ) | ||||||||
|
Other (expense) income, net
|
(0.4 | ) | 0.3 | (0.7 | ) | (233.8 | ) | |||||||||
|
Provision for income taxes
|
(0.6 | ) | (4.2 | ) | 3.6 | 85.3 | ||||||||||
|
Net (loss) income
|
(0.3 | ) | 0.9 | (1.2 | ) | (129.2 | ) | |||||||||
|
Net loss attributable to noncontrolling interests
|
1.1 | 0.8 | 0.3 | 36.8 | ||||||||||||
|
Net income attributable to Genie
|
$ | 0.8 | $ | 1.7 | $ | (0.9 | ) | (51.1 | )% | |||||||
Financing Fees
.
Financing fees are the volumetric fees charged by BP under the Preferred Supplier Agreement between IDT Energy and BP, pursuant to which BP is IDT Energy’s preferred provider of electricity and natural gas. Financing fees increased in the five months ended December 31, 2011 compared to the five months ended December 31, 2010 primarily because of the higher consumption by IDT Energy’s electricity customers.
Other (Expense) Income, net
. Other expense, net in the five months ended December 31, 2011 consisted primarily of a $0.45 million expense related to the estimated loss resulting from the bankruptcy of MF Global and interest of $0.4 million on the sales tax expense recorded by IDT Energy related to audits of prior periods, partially offset by foreign currency translation gains. Other income, net in the five months ended December 31, 2010 was due primarily to foreign currency translation gains, partially offset by $0.3 million loss on GEIC stock option.
Provision for Income Taxes
. The provision for income taxes in the five months ended December 31, 2011 decreased compared to the similar period in 2010 due primarily to a decrease in pre-tax income. Prior to the Spin-Off, we were included in the consolidated federal income tax return of IDT. Our income taxes are presented for periods prior to the Spin-Off on a separate tax return basis.
Net Loss Attributable to Noncontrolling Interests
.
The majority of the increase in the net loss attributable to noncontrolling interests in the five months ended December 31, 2011 compared to the similar period in 2010 relates to 100% of the net loss incurred by CCE and DAD, which are variable interest entities that are consolidated in our IDT Energy segment. CCE and DAD were not consolidated in our IDT Energy segment in the five months ended December 31, 2010. We do not have any ownership interest in CCE or DAD, therefore all net losses incurred by CCE and DAD have been attributed to noncontrolling interests. The aggregate net loss incurred by CCE and DAD in the five months ended December 31, 2011 of $0.7 million related primarily to sales commissions for customer acquisitions.
The remainder of the increase in the net loss attributable to noncontrolling interests in the five months ended December 31, 2011 compared to the similar period in 2010 was mostly due to increases in the net losses of AMSO and IEI, which are included in the Genie Oil and Gas segment discussed above, and in the noncontrolling interests’ share of a portion of these net losses. The noncontrolling interests’ share of AMSO and IEI losses increased as a result of the November 2010 sales of an aggregate 5.5% interest in GOGAS.
LIQUIDITY AND CAPITAL RESOURCES
General
Historically, we have satisfied our cash requirements primarily through a combination of our existing cash and cash equivalents, IDT Energy’s cash flow from operating activities, and, prior to the Spin-Off, operational funding from IDT. We currently expect that our operations in the next twelve months and the $92.7 million balance of cash, cash equivalents, restricted cash—short-term, and certificates of deposit that we held as of December 31, 2013 will be sufficient to meet our currently anticipated cash requirements for at least the year ending December 31, 2014.
As of December 31, 2013, we had working capital (current assets less current liabilities) of $105.8 million.
|
(in millions)
|
Year ended
December 31,
2013
|
Year ended
December 31,
2012
|
Five Months
ended
December 31,
2011
|
Year ended
July 31,
2011
|
Five Months
ended
December 31,
2010
(Unaudited)
|
|||||||||||||||
|
Cash flows provided by (used in):
|
||||||||||||||||||||
|
Operating activities
|
$ | 1.2 | $ | (1.0 | ) | $ | (2.4 | ) | $ | 5.5 | $ | 0.1 | ||||||||
|
Investing activities
|
3.8 | (17.7 | ) | (2.6 | ) | (3.8 | ) | (2.6 | ) | |||||||||||
|
Financing activities
|
(0.9 | ) | (14.4 | ) | 83.3 | 9.0 | 20.1 | |||||||||||||
|
Effect of exchange rate changes on cash and cash equivalents
|
0.4 | 0.3 | — | — | — | |||||||||||||||
|
Increase (decrease) in cash and cash equivalents
|
$ | 4.5 | $ | (32.8 | ) | $ | 78.3 | $ | 10.7 | $ | 17.6 | |||||||||
38
Operating Activities
Our cash flow from operations varies significantly from quarter to quarter and from year to year, depending on our operating results and the timing of operating cash receipts and payments, specifically trade accounts receivable and trade accounts payable, including payments relating to IEI’s research and development activities.
CCE, DAD and Tari are consolidated variable interest entities. We determined that we have the power to direct the activities of CCE, DAD and Tari that most significantly impact their economic performance, and we have the obligation to absorb losses of CCE, DAD and Tari that could potentially be significant to CCE, DAD and Tari on a stand-alone basis. We therefore determined that we are the primary beneficiary of CCE, DAD and Tari, and as a result, we consolidate CCE, DAD and Tari with our IDT Energy segment. We provided CCE, DAD and Tari with all of the cash required to fund their operations. In the years ended December 31, 2013 and 2012, CCE, DAD and Tari repaid $4.1 million and $0.7 million, respectively, to us. In the five months ended December 31, 2011 and the year ended July 31, 2011, we provided CCE, DAD and Tari with net funding of $2.5 million and $3.3 million, respectively, in order to finance their operations.
Since 2009, IDT Energy has been party to a Preferred Supplier Agreement with BP, pursuant to which BP is IDT Energy’s preferred provider of electricity and natural gas. The agreement’s termination date is June 30, 2015. IDT Energy’s obligations to BP are secured by a first security interest in deposits or receivables from utilities in connection with their purchase of IDT Energy’s customer’s receivables, and in any cash deposits or letters of credit posted in connection with any collateral accounts with BP. IDT Energy’s ability to purchase electricity and natural gas under this agreement is subject to satisfaction of certain conditions including the maintenance of certain covenants. At December 31, 2013, we were in compliance with such covenants. As of December 31, 2013, restricted cash of $4.4 million and trade accounts receivable of $42.3 million were pledged to BP as collateral for the payment of IDT Energy’s trade accounts payable to BP of $18.7 million as of December 31, 2013.
In July 2013, IDT Energy negotiated a settlement of an audit of its New York State sales and use tax for the period from June 2003 through August 2009. As a result, IDT Energy paid $0.9 million in July 2013. We are subject to audits in various jurisdictions for various taxes. At December 31, 2013, we accrued $0.3 million for the estimated loss from audits for which it is probable that a liability has been incurred. Amounts asserted by taxing authorities or the amount ultimately assessed against us could be greater than the accrued amount. Accordingly, additional provisions may be recorded in the future as revised estimates are made or underlying matters are settled or resolved. Imposition of assessments as a result of tax audits could have an adverse effect on our results of operations, cash flows and financial condition.
Investing Activities
Our capital expenditures were $0.3 million, $0.1 million, $0.2 million, $0.1 million and $45,000 in the years ended December 31, 2013 and 2012, the year ended July 31, 2011, and the five months ended December 31, 2011 and 2010, respectively. Our capital expenditures in the year ended December 31, 2013 included $0.2 million for an upgrade to IDT Energy’s computer software for electricity scheduling, for which we have committed to incur an additional $0.6 million to complete the upgrade project and for software maintenance. Costs for research and development activities are charged to expense when incurred. We currently anticipate that our total capital expenditures for the year ending December 31, 2014 will be approximately $0.8 million. We did not have any other material commitments for capital expenditures at December 31, 2013.
In the years ended December 31, 2013 and 2012, the year ended July 31, 2011, and the five months ended December 31, 2011 and 2010, cash used for capital contributions to AMSO, LLC was $2.7 million, $4.1 million, $3.9 million, $2.0 million and $2.5 million, respectively. AMSO has the right to decide at each capital call whether or not to fund AMSO, LLC, and will make a determination at that time. AMSO did not fund the capital call for the first quarter of 2014, and in January 2014, Total funded AMSO’s share, which was $0.9 million. Because of AMSO’s decision not to fund its share, AMSO’s ownership interest in AMSO, LLC was reduced to 48.16% and Total’s ownership interest increased to 51.84%. In addition, AMSO’s share of future funding of AMSO, LLC up to a cumulative $100 million was reduced to 33.7% and Total’s share increased to 66.3%. AMSO’s share of AMSO, LLC’s approved budget for the year ending December 31, 2014 was $3.2 million. AMSO is evaluating its options with respect to funding AMSO, LLC during 2014, and funding of less than its full share would result in further dilution of its interest in AMSO, LLC.
In December 2013, IDT Energy acquired 100% of the outstanding membership interests of Diversegy, LLC, a retail energy advisory and brokerage company that serves commercial and industrial customers, and its network marketing channel, Epiq Energy, LLC, that provides independent representatives with the opportunity to build sales organizations and to profit from both residential and commercial energy. Cash paid for the acquisitions, net of cash acquired, was $0.8 million. In addition, IDT Energy agreed to additional cash payments of $1.2 million, which will be paid by June 2015, and contingent payments that were estimated to be $1.3 million. The contingent payments include 100% of the gross profit from each closing customer contract during the remainder of the initial term of such contract and 100% of the gross profit from each post-closing customer contract during the initial term of such contract, plus 25% of the gross profit from the first renewal term of such contracts. A closing customer contract is generally a contract in effect at closing, and a post-closing customer contract is generally a contract that became effective within 60 days following the acquisition. The acquisition date fair value of the contingent payments was estimated based on historical gross profits, customer attrition and contract renewals.
39
Restricted cash and cash equivalents increased $0.4 million and $37,000 in the five months ended December 31, 2011 and 2010, respectively. Restricted cash and cash equivalents decreased $0.3 million in the year ended July 31, 2011.
In the years ended December 31, 2013 and 2012, we entered into loans receivable for an aggregate of $0.8 million and $0.7 million, respectively.
In the years ended December 31, 2013 and 2012, we used cash of $4.3 million and $2.2 million, respectively, to purchase certificates of deposits, and $3,000 and $11.5 million, respectively, to purchase marketable securities. In the years ended December 31, 2013 and 2012, proceeds from maturities of certificates of deposit were $2.2 million and nil, respectively, and proceeds from maturities of marketable securities were $10.4 million and $1.0 million, respectively.
Financing Activities
Prior to the Spin-Off, in the five months ended December 31, 2011, IDT made a capital contribution of $82.2 million to us. In addition, in connection with the capital contribution received from IDT, the amount due from IDT as of the date of the Spin-Off of $2.1 million was forgiven.
In the year ended December 31, 2013, we paid an aggregate Base Dividend per share of $0.6099 on our Series 2012-A Preferred Stock. The aggregate dividends paid in 2013 were $1.1 million. In the year ended December 31, 2012, we paid an aggregate dividend per share of $0.183 to stockholders of our Class A common stock and Class B common stock. The aggregate dividends paid were $4.2 million. We have suspended payment of dividends on our Class A and Class B common stock for the foreseeable future.
Until the Spin-Off, IDT, our former parent company, provided us with the cash required to fund our working capital requirements and our investments in our Genie Oil and Gas segment, when necessary. We used any excess cash provided by IDT Energy’s operations to repay IDT. In the year ended July 31, 2011 and the five months ended December 31, 2011 and 2010, expenses paid by IDT on our behalf and net cash transfers received from IDT were an aggregate of $0.6 million, $1.1 million and $10.1 million, respectively.
In 2013, Tari distributed $42,000 to its shareholder, which was classified as a distribution to noncontrolling interests since Tari is one of our consolidated variable interest entities.
In 2013, certain GOGAS subsidiaries sold noncontrolling equity interests for an aggregate of $0.4 million in cash. In November 2010, GOGAS sold a 5.0% equity interest to an entity affiliated with Lord (Jacob) Rothschild for $10.0 million paid in cash. Also, in November 2010, GOGAS sold a 0.5% equity interest to Rupert Murdoch for $1.0 million paid with a promissory note. The note is secured by a pledge of the shares issued in exchange for the note. The note accrues interest at 1.58% per annum, and the principal and accrued interest is due and payable on November 15, 2015.
In June 2011, in a refinement of the terms of the initial investment and the rights associated with that investment, Michael Steinhardt, the Chairman of the Board of IEI, exchanged his interest in GEIC (including an option to purchase additional interests) for a corresponding 2.5% interest (including options) in GOGAS. In addition, Mr. Steinhardt arranged for us and IDT to receive certain consulting services from a third party. In return, the Steinhardt stockholder entity was paid $1.7 million. Repurchase of noncontrolling interests of $1.5 million in the year ended July 31, 2011 is the financing activity portion of the cash paid to the Steinhardt stockholder entity.
We received proceeds from the exercise of our stock options of $0.1 million and $5,000, respectively, in the years ended December 31, 2013 and 2012.
The increase in restricted cash of $10.0 million in the year ended December 31, 2012 was comprised of cash that was deposited in a money market account at JPMorgan Chase Bank as collateral for a line of credit (see below).
In the year ended December 31, 2013, we paid $0.3 million to repurchase 31,776 shares of our Class B common stock, and in the year ended December 31, 2012, we paid $0.2 million to repurchase 27,202 shares of our Class B common stock. These shares were tendered by employees of ours to satisfy the employees’ tax withholding obligations in connection with the lapsing of restrictions on awards of restricted stock. Such shares are repurchased by us based on their fair market value on the trading day immediately prior to the vesting date.
40
On March 11, 2013, our Board of Directors approved a stock repurchase program for the repurchase of up to an aggregate of 7 million shares of our Class B common stock. At December 31, 2013, no repurchases have been made and 7 million shares remained available for repurchase under the stock repurchase program.
Exchange Offers and Issuances of Preferred Stock
On August 2, 2012, we initiated an offer to exchange up to 8.75 million outstanding shares of our Class B common stock for the same number of shares of our Series 2012-A Preferred Stock. The offer expired on October 10, 2012. On October 17, 2012, we issued 1,604,591 shares of our Series 2012-A Preferred Stock in exchange for an equal number of shares of Class B common stock tendered in the exchange offer.
On November 26, 2012, we initiated an offer to exchange up to 7.15 million outstanding shares of our Class B common stock for the same number of shares of our Series 2012-A Preferred Stock. The offer expired on March 5, 2013. On March 11, 2013, we issued 313,376 shares of our Series 2012-A Preferred Stock in exchange for an equal number of shares of Class B common stock tendered in the exchange offer.
Each share of our Series 2012-A Preferred Stock has a liquidation preference of $8.50, and is entitled to receive an annual dividend per share equal to the sum of (i) $0.6375 (the "Base Dividend") plus (ii) seven and one-half percent (7.5%) of the quotient obtained by dividing (A) the amount by which the EBITDA for a fiscal year of our retail energy provider business exceeds $32 million by (B) 8,750,000 (the "Additional Dividend"), payable in cash. Our Series 2012-A Preferred Stock is redeemable, in whole or in part, at our option following October 11, 2016. The redemption price for the Series 2012-A Preferred Stock is 101% of the Liquidation Preference plus all accrued and unpaid dividends between October 11, 2016 and October 11, 2017, and 100% of the Liquidation Preference plus all accrued and unpaid dividends thereafter. EBITDA consists of income (loss) from operations exclusive of depreciation and amortization and other operating gains (losses).
During any period when we have failed to pay a dividend on the Series 2012-A Preferred Stock and until all unpaid dividends have been paid in full, we are prohibited from paying dividends or distributions on our Class B or Class A common stock.
The Base Dividend is payable (if declared by our Board of Directors, and accrued, if not declared) quarterly on each February 15, May 15, August 15 and November 15, and to the extent that there is any Additional Dividend payable with respect to a fiscal year, it will be paid to holders of Series 2012-A Preferred Stock with the May dividend. With respect to the payment of dividends and amounts upon liquidation, dissolution or winding up, the Series 2012-A Preferred Stock is equal in rank to all other equity securities we issue, the terms of which specifically provide that such equity securities rank on a parity with the Series 2012-A Preferred Stock with respect to dividend rights or rights upon our liquidation, dissolution or winding up; senior to our common stock; and junior to all of our existing and future indebtedness.
Each share of Series 2012-A Preferred Stock has the same voting rights as a share of Class B common stock, except on certain matters that only impact our common stock, as well as additional voting rights on specific matters or upon the occurrence of certain events.
Revolving Line of Credit
As of April 23, 2012, we and IDT Energy entered into a Loan Agreement with JPMorgan Chase Bank for a revolving line of credit for up to a maximum principal amount of $25.0 million. On April 30, 2013, the Loan Agreement was modified to extend the maturity date from April 30, 2013 to April 30, 2014. The proceeds from the line of credit may be used to provide working capital and for the issuance of letters of credit. We agreed to deposit cash in a money market account at JPMorgan Chase Bank as collateral for the line of credit equal to the greater of (a) $10.0 million or (b) the sum of the amount of letters of credit outstanding plus the outstanding principal under the revolving note. We are not permitted to withdraw funds or exercise any authority over the required balance in the collateral account. The principal outstanding will bear interest at the lesser of (a) the LIBOR rate multiplied by the statutory reserve rate established by the Board of Governors of the Federal Reserve System plus 1.0% per annum, or (b) the maximum rate per annum permitted by whichever of applicable federal or Texas laws permit the higher interest rate. Interest is payable at least every three months and all outstanding principal and any accrued and unpaid interest is due on the maturity date. We pay a quarterly unused commitment fee of 0.08% per annum on the difference between $25.0 million and the average daily outstanding principal balance of the note. In addition, as of April 23, 2012, GEIC issued a Corporate Guaranty to JPMorgan Chase Bank whereby GEIC unconditionally guarantees the full payment of all indebtedness of ours and IDT Energy under the Loan Agreement.
At December 31, 2013, there were no amounts borrowed under the line of credit, and cash collateral of $10.0 million was included in “Restricted cash—short-term” in the consolidated balance sheet. In addition, at December 31, 2013, letters of credit of $5.7 million were outstanding.
Changes in Trade Accounts Receivable and Inventory
Gross trade accounts receivable increased to $43.9 million at December 31, 2013 from $41.1 million at December 31, 2012 reflecting mainly the slight increase in our revenues in the three months ended December 31, 2013 compared to the three months ended December 31, 2012.
Inventory of natural gas increased to $3.3 million at December 31, 2013 from $2.6 million at December 31, 2012 primarily due to a 21% increase in the average unit cost and a 5% increase in quantity at December 31, 2013 compared to December 31, 2012.
41
CONTRACTUAL OBLIGATIONS
The following tables quantify our future contractual obligations and commercial commitments as of December 31, 2013:
Payments Due by Period
|
(in millions)
|
Total
|
Less than
1 year
|
1—3 years
|
4—5 years
|
After 5 years
|
|||||||||||||||
|
Commitment to invest in AMSO, LLC (1)
|
$ | 3.2 | $ | 3.2 | $ | — | $ | — | $ | — | ||||||||||
|
Purchase and other obligations
|
2.7 | 2.7 | — | — | — | |||||||||||||||
|
Operating leases
|
0.6 | 0.3 | 0.3 | — | — | |||||||||||||||
|
TOTAL CONTRACTUAL OBLIGATIONS (2)
|
$ | 6.5 | $ | 6.2 | $ | 0.3 | $ | — | $ | — | ||||||||||
|
(1)
|
The timing of AMSO’s payments to AMSO, LLC is based on the current budget and other projections and is subject to change.
|
|
(2)
|
The above table does not include our unrecognized income tax benefits for uncertain tax positions at December 31, 2013 of $0.5 million due to the uncertainty of the amount and/or timing of any such payments. Uncertain tax positions taken or expected to be taken on an income tax return may result in additional payments to tax authorities. We are not currently able to reasonably estimate the timing of any potential future payments. If a tax authority agrees with the tax position taken or expected to be taken or the applicable statute of limitations expires, then additional payments will not be necessary.
|
Payments Due by Period
|
(in millions)
|
Total
|
Less than
1 year
|
1—3 years
|
4—5 years
|
After 5 years
|
|||||||||||||||
|
Standby letter of credit (1)
|
$ | 5.7 | $ | 5.7 | $ | — | $ | — | $ | — | ||||||||||
|
(1)
|
The above table does not include an aggregate of $3.2 million in performance bonds at December 31, 2013 due to the uncertainty of the amount and/or timing of any payments.
|
OFF-BALANCE SHEET ARRANGEMENTS
We do not have any “off-balance sheet arrangements,” as defined in relevant SEC regulations that are reasonably likely to have a current or future effect on our financial condition, results of operations, liquidity, capital expenditures or capital resources, other than the following.
IDT Energy has performance bonds issued through a third party for the benefit of various states in order to comply with the states’ financial requirements for retail energy providers. At December 31, 2013, IDT Energy had aggregate performance bonds of $3.2 million outstanding.
In connection with our Spin-Off in October 2011, we and IDT entered into various agreements prior to the Spin-Off including a Separation and Distribution Agreement to effect the separation and provide a framework for our relationship with IDT after the Spin-Off, and a Tax Separation Agreement, which sets forth the responsibilities of us and IDT with respect to, among other things, liabilities for federal, state, local and foreign taxes for periods before and including the Spin-Off, the preparation and filing of tax returns for such periods and disputes with taxing authorities regarding taxes for such periods. Pursuant to the Separation and Distribution Agreement, among other things, we indemnify IDT and IDT indemnifies us for losses related to the failure of the other to pay, perform or otherwise discharge, any of the liabilities and obligations set forth in the agreement. Pursuant to the Tax Separation Agreement, among other things, IDT indemnifies us from all liability for taxes of IDT with respect to any taxable period, and we indemnify IDT from all liability for taxes of ours with respect to any taxable period, including, without limitation, the ongoing tax audits related to our business.
Our primary market risk exposure is the price applicable to our natural gas and electricity purchases and sales. The sales price of our natural gas and electricity is primarily driven by the prevailing market price. Hypothetically, if our gross profit per unit in the year ended December 31, 2013 had remained the same as in the year ended December 31, 2012, our gross profit from electricity sales would have increased by $15.9 million in the year ended December 31, 2013 and our gross profit from natural gas sales would have decreased by $3.5 million in that period.
The energy markets have historically been very volatile, and we can reasonably expect that electricity and natural gas prices will be subject to fluctuations in the future. In an effort to reduce the effects of the volatility of the cost of electricity and natural gas on our operations, we have adopted a policy of hedging electricity and natural gas prices from time to time, at relatively lower volumes, primarily through the use of futures contracts, swaps and put and call options. While the use of these hedging arrangements limits the downside risk of adverse price movements, it also limits future gains from favorable movements. We do not apply hedge accounting to these contracts and options, therefore the mark-to-market change in fair value is recognized in direct cost of revenue in our consolidated statements of operations.
42
The summarized volume of IDT Energy’s outstanding contracts and options as of December 31, 2013 was as follows (MWh – Megawatt hour; Dth – Decatherm):
|
Commodity
|
Settlement Dates
|
Volume
|
||
|
Electricity
|
January 2014
|
35,200 MWh
|
||
|
Electricity
|
February 2014
|
72,000 MWh
|
||
|
Electricity
|
July 2014
|
52,800 MWh
|
||
|
Electricity
|
August 2014
|
50,400 MWh
|
||
|
Electricity
|
September 2014
|
16,800 MWh
|
||
|
Natural gas
|
January 2014
|
625,000 Dth
|
||
|
Natural gas
|
February 2014
|
1,345,000 Dth
|
||
|
Natural gas
|
March 2014
|
225,000 Dth
|
||
|
Natural gas
|
July 2014
|
77,500 Dth
|
Our Consolidated Financial Statements and supplementary data and the reports of the independent registered public accounting firms thereon set forth starting on page F-1 herein are incorporated herein by reference.
None.
Evaluation of Disclosure Controls and Procedures
Our Chief Executive Officer and Chief Financial Officer have evaluated the effectiveness of our disclosure controls and procedures (as defined in Rules 13a-15(e) and 15d-15(e) of the Securities Exchange Act of 1934, as amended), as of the end of the period covered by this Annual Report on Form 10-K. Based on this evaluation, our Chief Executive Officer and Chief Financial Officer have concluded that our disclosure controls and procedures were not effective as of December 31, 2013 because of material weaknesses in our internal control over financial reporting as discussed below.
Report of Management on Internal Control over Financial Reporting
We, the management of Genie Energy Ltd. and subsidiaries (the “Company”), are responsible for establishing and maintaining adequate internal control over financial reporting of the Company.
The Company’s internal control over financial reporting is defined in Rule 13a-15(f) and 15d-15(f) promulgated under the Securities Exchange Act of 1934 as a process designed by, or under the supervision of, the Company’s principal executive and principal financial officers and effected by the Company’s board of directors, management and other personnel, to provide reasonable assurance regarding the reliability of financial reporting and the preparation of the Company’s financial statements for external purposes in accordance with generally accepted accounting principles in the United States and includes those policies and procedures that:
|
1.
|
Pertain to the maintenance of records that in reasonable detail accurately and fairly reflect the transactions and dispositions of assets of the Company;
|
|
2.
|
Provide reasonable assurance that transactions are recorded as necessary to permit preparation of financial statements in accordance with generally accepted accounting principles, and that receipts and expenditures of the Company are being made only in accordance with authorizations of management and directors of the Company; and
|
|
3.
|
Provide reasonable assurance regarding prevention or timely detection of unauthorized acquisition, use or disposition of the Company’s assets that could have a material effect on the financial statements.
|
Management has assessed the effectiveness of the Company’s internal control over financial reporting as of December 31, 2013. In making this assessment, the Company’s management used the criteria established in Internal Control—Integrated Framework (1992) issued by the Committee of Sponsoring Organizations of the Treadway Commission.
Under the supervision and with the participation of our management, including our principal executive officer and principal financial officer, we conducted an evaluation of our internal control over financial reporting, as prescribed above, as of December 31, 2013. Based on our evaluation, our principal executive officer and principal financial officer concluded that the Company’s internal control over financial reporting as of December 31, 2013 was not effective.
A material weakness is a deficiency, or a combination of deficiencies, in internal control over financial reporting, such that there is a reasonable possibility that a material misstatement of the company’s annual or interim financial statements will not be prevented or detected on a timely basis.
DEFICIENCIES IN OUR INTERNAL CONTROL OVER FINANCIAL REPORTING
Based on an evaluation of the effectiveness of the design and operation of its controls and procedures conducted by the Company’s management, including the Company’s Chief Executive Officer and Chief Financial Officer, the Company has concluded that due to material weaknesses in financial reporting, these controls and procedures were not effective as of December 31, 2013.
43
We have identified the following material weaknesses in our controls:
|
•
|
A proper review and approval of journal entries was not performed by the IDT Energy Controller’s group to ensure that the journal entry is appropriately supported, complete and accurate, and
|
|
•
|
We failed to identify errors while conducting quarterly financial statement variance analyses reviewed by the Company’s senior management.
|
As set forth below, the Company’s management plans to take the following steps to remediate each of the material weaknesses identified above. Notwithstanding the material weaknesses described above, we have performed additional analyses and other procedures to enable management to conclude that our financial statements included in this Form 10-K fairly present, in all material respects, our financial condition and results of operations as of and for the years ended December 31, 2012 and 2013.
REMEDIATION
Following the Audit Committee’s independent review, and in response to the material weaknesses discussed above, we plan on taking the following measures to improve internal control over financial reporting:
|
•
|
Review staffing within the IDT Energy accounting team and hire an additional senior accounting resource,
|
|
•
|
Review and amend the journal entry review process to ensure a more vigorous level of oversight of the entry and the underlying documentation, and
|
|
•
|
Develop better reporting and metrics within the variance analysis used by the Company’s senior management in their review of the financials.
|
Management and our Audit Committee will monitor these remedial measures and the effectiveness of our internal controls and procedures.
Because of its inherent limitations, internal control over financial reporting may not prevent or detect misstatements. Projections of any evaluation of effectiveness to future periods are subject to the risk that controls may become inadequate because of changes in conditions, or that the degree of compliance with the policies or procedures may deteriorate.
BDO USA, LLP has provided an attestation report on the Company’s internal control over financial reporting as of December 31, 2013.
Changes in Internal Control over Financial Reporting
Other than the material weaknesses described above, there were no changes in our internal control over financial reporting during the fourth quarter of the year ended December 31, 2013 that have materially affected, or are reasonably likely to materially affect, our internal control over financial reporting. To remediate these material weaknesses, during 2014, we will take the appropriate remediation actions to improve our internal control over financial reporting.
We also had previously carried out evaluations, under the supervision and with the participation of our management, including our principal executive officer and principal financial officer, of the effectiveness of our internal control over financial reporting, based on criteria in
Internal Control —Integrated Framework
issued by the COSO, as of December 31, 2012. Based upon that evaluation, at the time our 10-K for that year was filed, management concluded that our internal control over financial reporting was effective. Subsequent to that evaluation, in connection with the preparation of the financial statements for December 31, 2013, management concluded that our internal control over financial reporting was not effective as of December 31, 2012.
The attestation report of the registrant’s independent registered public accounting firm are included in this Annual Report on Form 10-K on page 49 and is incorporated herein by reference.
44
None.
The following is a list of our directors and executive officers along with the specific information required by Rule 14a-3 of the Securities Exchange Act of 1934:
Executive Officers
Howard S. Jonas—Chairman of the Board and Chief Executive Officer
Avi Goldin—Chief Financial Officer
Geoffrey Rochwarger—Vice Chairman
Ira Greenstein—President
Directors
Howard S. Jonas—Chairman of the Board and Chairman of the Board and Chief Executive Officer of IDT Corporation
James A. Courter—Vice Chairman of the Board
Irwin Katsof—Founder and managing partner of Katsof Energy Consultants
W. Wesley Perry—Owner and operator of S.E.S. Investments, Ltd., an oil and gas investment company
Alan B. Rosenthal—Founder and managing partner of ABR Capital Financial Group LLC, an investment fund
Allan Sass—Former President and Chief Executive Officer of Occidental Oil Shale Corporation, a subsidiary of Occidental Petroleum
The remaining information required by this Item will be contained in our Proxy Statement for our Annual Stockholders Meeting, which will be filed with the Securities and Exchange Commission within 120 days after December 31, 2013, and which is incorporated by reference herein.
Corporate Governance
We have included as exhibits to this Annual Report on Form 10-K certificates of our Chief Executive Officer and Chief Financial Officer certifying the quality of our public disclosure.
We make available free of charge through the investor relations page of our web site (
www.idt.net/ir
) our Annual Reports on Form 10-K, Quarterly Reports on Form 10-Q, Current Reports on Form 8-K and all amendments to those reports, and all beneficial ownership reports on Forms 3, 4 and 5 filed by directors, officers and beneficial owners of more than 10% of our equity, as soon as reasonably practicable after such reports are electronically filed with the Securities and Exchange Commission. We have adopted codes of business conduct and ethics for all of our employees, including our principal executive officer, principal financial officer and principal accounting officer. Copies of the codes of business conduct and ethics are available on our web site.
Our web site and the information contained therein or incorporated therein are not intended to be incorporated into this Annual Report on Form 10-K or our other filings with the SEC.
The information required by this Item will be contained in our Proxy Statement for our Annual Stockholders Meeting, which will be filed with the Securities and Exchange Commission within 120 days after December 31, 2013, and which is incorporated by reference herein.
The information required by this Item will be contained in our Proxy Statement for our Annual Stockholders Meeting, which will be filed with the Securities and Exchange Commission within 120 days after December 31, 2013, and which is incorporated by reference herein.
The information required by this Item will be contained in our Proxy Statement for our Annual Stockholders Meeting, which will be filed with the Securities and Exchange Commission within 120 days after December 31, 2013, and which is incorporated by reference herein.
The information required by this Item will be contained in our Proxy Statement for our Annual Stockholders Meeting, which will be filed with the Securities and Exchange Commission within 120 days after December 31, 2013, and which is incorporated by reference herein.
45
|
(a)
|
The following documents are filed as part of this Report:
|
|
|
1.
|
Report of Independent Registered Public Accounting Firm on Internal Control Over Financial Reporting
Reports of Independent Registered Public Accounting Firms on Consolidated Financial Statements
Consolidated Financial Statements covered by Reports of Independent Registered Public Accounting Firms
|
|
|
2.
|
Financial Statement Schedule.
All schedules have been omitted since they are either included in the Notes to Consolidated Financial Statements or not required or not applicable.
|
|
|
3.
|
The exhibits listed in paragraph (b) of this item. Exhibit Numbers 10.01 10.02, 10.03 and 10.04 are management contracts or compensatory plans or arrangements.
|
(b) Exhibits.
|
Exhibit
Number
|
Description of Exhibits
|
|
|
3.01(1)
|
Amended and Restated Certificate of Incorporation of the Registrant.
|
|
|
3.02(2)
|
Certificate of Designation of Series 2012-A Preferred Stock of the Registrant.
|
|
|
3.03(3)
|
Amended and Restated By-Laws of the Registrant.
|
|
|
10.01(4)
|
Employment Agreement, effective as of October 28, 2011, between the Registrant and Howard S. Jonas.
|
|
|
10.02(5)
|
Amended and Restated Employment Agreement, effective as of December 9, 2013, between the Registrant and Claude A. Pupkin.
|
|
|
10.03(4)
|
Employment Agreement, effective as of October 28, 2011, between the Registrant and Avi Goldin.
|
|
|
10.04(4)
|
2011 Stock Option and Incentive Plan of Genie Energy Ltd.
|
|
|
10.05(1)
|
Preferred Supplier Agreement between IDT Energy, Inc. and BP Energy Company, dated June 29, 2009, as amended.
|
|
|
21.01*
|
Subsidiaries of the Registrant.
|
|
|
23.01*
|
Consent of BDO USA, LLP
|
|
|
23.02*
|
Consent of Grant Thornton LLP.
|
|
|
23.03*
|
Consent of Zwick and Banyai, PLLC
|
|
|
23.04*
|
Consent of Zwick and Banyai, PLLC
|
|
|
31.01*
|
Certification of Chief Executive Officer pursuant to Section 302 of the Sarbanes-Oxley Act of 2002.
|
|
|
31.02*
|
Certification of Chief Financial Officer pursuant to Section 302 of the Sarbanes-Oxley Act of 2002.
|
|
|
32.01*
|
Certification of Chief Executive Officer pursuant to Section 906 of the Sarbanes-Oxley Act of 2002.
|
|
|
32.02*
|
Certification of Chief Financial Officer pursuant to Section 906 of the Sarbanes-Oxley Act of 2002.
|
|
|
99.01*
|
Significant subsidiary financial statements
|
46
|
Exhibit
Number
|
Description of Exhibits
|
|
|
101.INS*
|
XBRL Instance Document
|
|
|
101.SCH*
|
XBRL Taxonomy Extension Schema Document
|
|
|
|
|
|
|
101.CAL*
|
XBRL Taxonomy Extension Calculation Linkbase Document
|
|
|
101.DEF*
|
XBRL Taxonomy Extension Definition Linkbase Document
|
|
|
101.LAB*
|
XBRL Taxonomy Extension Label Linkbase Document
|
|
|
101.PRE*
|
XBRL Taxonomy Extension Presentation Linkbase Document
|
* filed herewith.
|
(1)
|
Incorporated by reference to Form 10-12G/A, filed October 7, 2011.
|
|
(2)
|
Incorporated by reference to Form 8-K, filed October 11, 2012.
|
|
(3)
|
Incorporated by reference to Form 8-K filed August 9, 2012.
|
|
(4)
|
Incorporated by reference to Form 10-12G/A, filed October 27, 2011.
|
|
(5)
|
Incorporated by reference to Form 8-K filed December 13, 2013.
|
47
Pursuant to the requirements of Section 13 or 15(d) of the Securities Exchange Act of 1934, the registrant has duly caused this Annual Report on Form 10-K to be signed on its behalf by the undersigned, thereunto duly authorized.
|
GENIE ENERGY LTD.
|
|
|
By:
|
/s/ Howard S. Jonas
|
|
Chief Executive Officer
|
|
Date: March 17, 2014
Pursuant to the requirements of the Securities Exchange Act of 1934, this Annual Report on Form 10-K has been signed by the following persons on behalf of the Registrant and in the capacities and on the dates indicated.
|
Signature
|
Titles
|
Date
|
||
|
/s/ Howard S. Jonas
|
Chairman of the Board and Director and Chief Executive Officer (Principal Executive Officer)
|
March 17, 2014
|
||
|
Howard S. Jonas
|
||||
|
/s/ Avi Goldin
|
Chief Financial Officer (Principal Financial Officer)
|
March 17, 2014
|
||
|
Avi Goldin
|
||||
|
/s/ James A. Courter
|
Vice Chairman of the Board and Director
|
March 17, 2014
|
||
|
James A. Courter
|
||||
|
/s/ Irwin Katsof
|
Director
|
March 17, 2014
|
||
|
Irwin Katsof
|
||||
|
/s/ W. Wesley Perry
|
Director
|
March 17, 2014
|
||
|
W. Wesley Perry
|
||||
|
/s/ Alan B. Rosenthal
|
Director
|
March 17, 2014
|
||
|
Alan B. Rosenthal
|
||||
|
/s/ Allan Sass
|
Director
|
March 17, 2014
|
||
|
Allan Sass
|
48
REPORT OF INDEPENDENT REGISTERED PUBLIC ACCOUNTING FIRM
Board of Directors and Stockholders
Genie Energy Ltd.
We have audited the internal control over financial reporting of Genie Energy Ltd. (a Delaware corporation) and subsidiaries’ (the “Company”) as of December 31, 2013, based on criteria established in
Internal Control–Integrated Framework (1992)
issued by the Committee of Sponsoring Organizations of the Treadway Commission (COSO). The Company’s management is responsible for maintaining effective internal control over financial reporting and for its assessment of the effectiveness of internal control over financial reporting, included in the Report of Management on Internal Control Over Financial Reporting under Item 9A. Our responsibility is to express an opinion on the Company’s internal control over financial reporting based on our audit.
We conducted our audit in accordance with the standards of the Public Company Accounting Oversight Board (United States). Those standards require that we plan and perform the audit to obtain reasonable assurance about whether effective internal control over financial reporting was maintained in all material respects. Our audit included obtaining an understanding of internal control over financial reporting, assessing the risk that a material weakness exists, testing and evaluating the design and operating effectiveness of internal control based on the assessed risk, and performing such other procedures as we considered necessary in the circumstances. We believe that our audit provides a reasonable basis for our opinion.
A company’s internal control over financial reporting is a process designed to provide reasonable assurance regarding the reliability of financial reporting and the preparation of financial statements for external purposes in accordance with generally accepted accounting principles. A company’s internal control over financial reporting includes those policies and procedures that (1) pertain to the maintenance of records that, in reasonable detail, accurately and fairly reflect the transactions and dispositions of the assets of the company; (2) provide reasonable assurance that transactions are recorded as necessary to permit preparation of financial statements in accordance with generally accepted accounting principles, and that receipts and expenditures of the company are being made only in accordance with authorizations of management and directors of the company; and (3) provide reasonable assurance regarding prevention or timely detection of unauthorized acquisition, use, or disposition of the company’s assets that could have a material effect on the financial statements.
Because of its inherent limitations, internal control over financial reporting may not prevent or detect misstatements. Also, projections of any evaluation of effectiveness to future periods are subject to the risk that controls may become inadequate because of changes in conditions, or that the degree of compliance with the policies or procedures may deteriorate.
A material weakness is a deficiency, or a combination of deficiencies, in internal control over financial reporting, such that there is a reasonable possibility that a material misstatement of the company’s annual or interim financial statements will not be prevented or detected on a timely basis. Material weaknesses regarding the effectiveness of management’s financial reporting close process controls, specifically those relating to the approval of journal entries and the adequate review of subsidiary financial statements and variance analysis have been identified and described in management’s assessment. These material weaknesses were considered in determining the nature, timing, and extent of audit tests applied in our audit of the 2013 financial statements, and this report does not affect our report dated March 17, 2014 on those financial statements.
In our opinion, the Company did not maintain, in all material respects, effective internal control over financial reporting as of December 31, 2013, based on COSO criteria. We do not express an opinion, or any other form of assurance, on management’s statements referring to any corrective actions to be taken by the Company after the date of management’s assessment.
We also have audited, in accordance with the standards of the Public Company Accounting Oversight Board (United States), the consolidated financial statements of the Company as of and for the year ended December 31, 2013, and our report dated March 17, 2014 expressed an unqualified opinion on those financial statements.
/s/ BDO USA, LLP
Woodbridge, New Jersey
March 17, 2014
49
GENIE ENERGY LTD.
Index to Consolidated Financial Statements
| F-2 | ||||
| F-5 | ||||
| F-6 | ||||
| F-7 | ||||
| F-8 | ||||
| F-10 | ||||
| F-11 |
F-1
Board of Directors and Stockholders
Genie Energy Ltd.
We have audited the accompanying consolidated balance sheet of Genie Energy Ltd. (a Delaware corporation) and subsidiaries (the “Company”) as of December 31, 2013, and the related consolidated statements of operations, comprehensive (loss) income, equity, and cash flows for the year then ended. These financial statements are the responsibility of the Company’s management. Our responsibility is to express an opinion on these financial statements based on our audit.
We conducted our audit in accordance with the standards of the Public Company Accounting Oversight Board (United States). Those standards require that we plan and perform the audit to obtain reasonable assurance about whether the financial statements are free of material misstatement. An audit also includes examining, on a test basis, evidence supporting the amounts and disclosures in the financial statements. An audit also includes assessing the accounting principles used and significant estimates made by management, as well as evaluating the overall financial statement presentation. We believe that our audit provides a reasonable basis for our opinion.
In our opinion, the consolidated financial statements referred to above present fairly, in all material respects, the financial position of Genie Energy Ltd. and subsidiaries as of December 31, 2013, and the results of their operations and their cash flows for the year then ended, in conformity with accounting principles generally accepted in the United States of America.
We also have audited, in accordance with the standards of the Public Company Accounting Oversight Board (United States), the Company’s internal control over financial reporting as of December 31, 2013, based on criteria established in
Internal Control–Integrated Framework (1992)
, and our report dated March 17, 2014 expressed an adverse opinion thereon.
/s/ BDO USA, LLP
Woodbridge, New Jersey
March 17, 2014
F-2
REPORT OF INDEPENDENT REGISTERED PUBLIC ACCOUNTING FIRM
Board of Directors and Stockholders
Genie Energy Ltd.
We have audited the accompanying consolidated balance sheet of Genie Energy Ltd. (a Delaware corporation) and subsidiaries (the “Company”) as of December 31, 2012, and the related consolidated statements of operations, comprehensive (loss) income, equity, and cash flows for the year ended December 31, 2012 and for the five-month transition period ended December 31, 2011. These financial statements are the responsibility of the Company’s management. Our responsibility is to express an opinion on these financial statements based on our audits. We did not audit the financial statements of American Shale Oil, LLC, an equity method investment. The Company’s investment in American Shale Oil, LLC was $0.2 million as of December 31, 2012, and the Company’s equity in the net loss of American Shale Oil, LLC was $3.2 million and $2.1 million, respectively, for the year ended December 31, 2012 and for the five months ended December 31, 2011. Those statements were audited by other auditors, whose report has been furnished to us, and our opinion, insofar as it related to the amounts included for American Shale Oil, LLC, is based solely on the report of other auditors.
We conducted our audits in accordance with the standards of the Public Company Accounting Oversight Board (United States). Those standards require that we plan and perform the audit to obtain reasonable assurance about whether the financial statements are free of material misstatement. The Company was not required to have, nor were we engaged to perform an audit of its internal control over financial reporting. Our audits included consideration of internal control over financial reporting as a basis for designing audit procedures that are appropriate in the circumstances, but not for the purpose of expressing an opinion on the effectiveness of the Company’s internal control over financial reporting. Accordingly, we express no such opinion. An audit also includes examining, on a test basis, evidence supporting the amounts and disclosures in the financial statements. An audit also includes assessing the accounting principles used and significant estimates made by management, as well as evaluating the overall financial statement presentation. We believe that our audits and the report of the other auditors provide a reasonable basis for our opinion.
In our opinion, based on our audits and the report of the other auditors, the consolidated financial statements referred to above present fairly, in all material respects, the financial position of Genie Energy Ltd. and subsidiaries as of December 31, 2012, and the results of their operations and their cash flows for the year ended December 31, 2012 and for the five-month transition period ended December 31, 2011, in conformity with accounting principles generally accepted in the United States of America.
/s/ GRANT THORNTON LLP
New York, New York
March 21, 2013
F-3
REPORT OF INDEPENDENT REGISTERED PUBLIC ACCOUNTING FIRM
Board of Directors and Stockholders
Genie Energy Ltd.
We have audited the accompanying consolidated statements of operations, comprehensive (loss) income, equity, and cash flows of Genie Energy Ltd. (a Delaware corporation) and subsidiaries (the “Company”) for the year ended July 31, 2011. These financial statements are the responsibility of the Company’s management. Our responsibility is to express an opinion on these financial statements based on our audit.
We conducted our audit in accordance with the standards of the Public Company Accounting Oversight Board (United States). Those standards require that we plan and perform the audit to obtain reasonable assurance about whether the financial statements are free of material misstatement. The Company was not required to have, nor were we engaged to perform an audit of its internal control over financial reporting. Our audit included consideration of internal control over financial reporting as a basis for designing audit procedures that were appropriate in the circumstances, but not for the purpose of expressing an opinion on the effectiveness of the Company’s internal control over financial reporting. Accordingly, we express no such opinion. An audit includes examining, on a test basis, evidence supporting the amounts and disclosures in the financial statements, assessing the accounting principles used and significant estimates made by management, as well as evaluating the overall financial statement presentation. We believe that our audit provides a reasonable basis for our opinion.
In our opinion, the consolidated financial statements referred to above present fairly, in all material respects, the results of operations and cash flows of Genie Energy Ltd. and subsidiaries for the year ended July 31, 2011, in conformity with generally accepted accounting principles in the United States of America.
/s/ Zwick & Banyai, PLLC
Southfield, Michigan
October 6, 2011
F-4
|
December 31
(in thousands)
|
2013
|
2012
|
||||||
|
ASSETS
|
||||||||
|
CURRENT ASSETS:
|
||||||||
|
Cash and cash equivalents
|
$ | 73,885 | $ | 69,409 | ||||
|
Restricted cash—short-term
|
14,429 | 10,841 | ||||||
|
Certificates of deposit
|
4,343 | 2,205 | ||||||
|
Marketable securities
|
— | 10,485 | ||||||
|
Trade accounts receivable, net of allowance for doubtful accounts of $930 at December 31, 2013 and $130 at December 31, 2012
|
42,926 | 40,932 | ||||||
|
Inventory
|
3,344 | 2,644 | ||||||
|
Prepaid expenses
|
3,408 | 3,315 | ||||||
|
Deferred income tax assets, net
|
840 | 599 | ||||||
|
Other current assets
|
2,917 | 771 | ||||||
|
TOTAL CURRENT ASSETS
|
146,092 | 141,201 | ||||||
|
Property and equipment, net
|
561 | 409 | ||||||
|
Goodwill
|
7,349 | 3,663 | ||||||
|
Restricted cash—long-term
|
1,127 | 2 | ||||||
|
Other assets
|
3,714 | 5,031 | ||||||
|
TOTAL ASSETS
|
$ | 158,843 | $ | 150,306 | ||||
|
LIABILITIES AND EQUITY
|
||||||||
|
CURRENT LIABILITIES:
|
||||||||
|
Trade accounts payable
|
$ | 25,302 | $ | 20,641 | ||||
|
Accrued expenses
|
9,856 | 7,832 | ||||||
|
Advances from customers
|
1,103 | 1,472 | ||||||
|
Income taxes payable
|
2,075 | 1,244 | ||||||
|
Dividend payable
|
— | 211 | ||||||
|
Due to IDT Corporation
|
541 | 600 | ||||||
|
Other current liabilities
|
1,457 | 209 | ||||||
|
TOTAL CURRENT LIABILITIES
|
40,334 | 32,209 | ||||||
|
Other liabilities
|
2,169 | — | ||||||
|
TOTAL LIABILITIES
|
42,503 | 32,209 | ||||||
|
Commitments and contingencies
|
||||||||
|
EQUITY:
|
||||||||
|
Genie Energy Ltd. stockholders’ equity:
|
||||||||
|
Preferred stock, $.01 par value; authorized shares—10,000:
|
||||||||
|
Series 2012-A, designated shares—8,750; at liquidation preference, consisting of 1,917 and 1,605 shares issued and outstanding at December 31, 2013 and 2012, respectively
|
16,303 | 13,639 | ||||||
|
Class A common stock, $.01 par value; authorized shares—35,000; 1,574 shares issued and outstanding at December 31, 2013 and 2012
|
16 | 16 | ||||||
|
Class B common stock, $.01 par value; authorized shares—200,000; 19,755 and 19,827 shares issued and 19,696 and 19,800 shares outstanding at December 31, 2013 and 2012, respectively
|
198 | 198 | ||||||
|
Additional paid-in capital
|
82,791 | 80,196 | ||||||
|
Treasury stock, at cost, consisting of 59 and 27 shares of Class B common at December 31, 2013 and 2012, respectively
|
(473 | ) | (204 | ) | ||||
|
Accumulated other comprehensive income
|
745 | 270 | ||||||
|
Retained earnings
|
21,552 | 28,375 | ||||||
|
Total Genie Energy Ltd. stockholders’ equity
|
121,132 | 122,490 | ||||||
|
Noncontrolling interests:
|
||||||||
|
Noncontrolling interests
|
(3,792 | ) | (3,393 | ) | ||||
|
Receivable for issuance of equity
|
(1,000 | ) | (1,000 | ) | ||||
|
Total noncontrolling interests
|
(4,792 | ) | (4,393 | ) | ||||
|
TOTAL EQUITY
|
116,340 | 118,097 | ||||||
|
TOTAL LIABILITIES AND EQUITY
|
$ | 158,843 | $ | 150,306 | ||||
See accompanying notes to consolidated financial statements.
F-5
|
(in thousands, except per share data)
|
Year ended
December 31,
2013
|
Year ended
December 31,
2012
|
Five Months
ended
December 31,
2011
|
Year ended
July 31,
2011
|
Five Months
ended
December 31,
2010
(Unaudited)
|
|||||||||||||||
|
REVENUES
|
$ | 279,174 | $ | 229,459 | $ | 76,783 | $ | 196,018 | $ | 74,877 | ||||||||||
|
Direct cost of revenues
|
213,416 | 159,872 | 52,476 | 142,171 | 53,422 | |||||||||||||||
|
GROSS PROFIT
|
65,758 | 69,587 | 24,307 | 53,847 | 21,455 | |||||||||||||||
|
OPERATING EXPENSES AND LOSSES:
|
||||||||||||||||||||
|
Selling, general and administrative (i)
|
49,749 | 54,000 | 17,836 | 33,792 | 11,196 | |||||||||||||||
|
Bad debt
|
800 | — | — | — | — | |||||||||||||||
|
Research and development
|
11,389 | 9,365 | 2,648 | 7,843 | 3,045 | |||||||||||||||
|
Equity in the net loss of AMSO, LLC
|
3,194 | 3,175 | 2,095 | 5,238 | 1,658 | |||||||||||||||
|
Income from operations
|
626 | 3,047 | 1,728 | 6,974 | 5,556 | |||||||||||||||
|
Interest income
|
449 | 404 | 44 | 92 | 53 | |||||||||||||||
|
Financing fees
|
(3,217 | ) | (2,913 | ) | (969 | ) | (2,061 | ) | (852 | ) | ||||||||||
|
Other (expense) income, net
|
(444 | ) | (143 | ) | (455 | ) | (615 | ) | 340 | |||||||||||
|
(Loss) income before income taxes
|
(2,586 | ) | 395 | 348 | 4,390 | 5,097 | ||||||||||||||
|
Provision for income taxes
|
(2,755 | ) | (2,930 | ) | (616 | ) | (6,945 | ) | (4,181 | ) | ||||||||||
|
NET (LOSS) INCOME
|
(5,341 | ) | (2,535 | ) | (268 | ) | (2,555 | ) | 916 | |||||||||||
|
Net (income) loss attributable to noncontrolling interests
|
(562 | ) | (746 | ) | 1,115 | 4,185 | 815 | |||||||||||||
|
NET (LOSS) INCOME ATTRIBUTABLE TO GENIE ENERGY LTD.
|
(5,903 | ) | (3,281 | ) | 847 | 1,630 | 1,731 | |||||||||||||
|
Dividends on preferred stock
|
(1,223 | ) | (211 | ) | — | — | — | |||||||||||||
|
NET (LOSS) INCOME ATTRIBUTABLE TO GENIE ENERGY LTD. COMMON STOCKHOLDERS
|
$ | (7,126 | ) | $ | (3,492 | ) | $ | 847 | $ | 1,630 | $ | 1,731 | ||||||||
|
(Loss) earnings per share attributable to Genie Energy Ltd. common stockholders:
|
||||||||||||||||||||
|
Basic
|
$ | (0.36 | ) | $ | (0.17 | ) | $ | 0.04 | $ | 0.08 | $ | 0.09 | ||||||||
|
Diluted
|
$ | (0.36 | ) | $ | (0.17 | ) | $ | 0.04 | $ | 0.07 | $ | 0.08 | ||||||||
|
Weighted-average number of shares used in calculation of (loss) earnings per share
|
||||||||||||||||||||
|
Basic
|
19,668 | 20,687 | 20,366 | 20,365 | 20,365 | |||||||||||||||
|
Diluted
|
19,668 | 20,687 | 22,497 | 22,342 | 22,342 | |||||||||||||||
|
(i) Stock-based compensation included in selling, general and administrative expenses
|
$ | 4,180 | $ | 3,429 | $ | 630 | $ | 751 | $ | 800 | ||||||||||
See accompanying notes to consolidated financial statements.
F-6
CONSOLIDATED STATEMENTS OF COMPREHENSIVE (LOSS) INCOME
|
(in thousands)
|
Year ended
December 31,
2013
|
Year ended
December 31,
2012
|
Five Months
ended
December 31,
2011
|
Year ended
July 31,
2011
|
Five Months
ended
December 31,
2010
(Unaudited)
|
|||||||||||||||
|
NET (LOSS) INCOME
|
$ | (5,341 | ) | $ | (2,535 | ) | $ | (268 | ) | $ | (2,555 | ) | $ | 916 | ||||||
|
Other comprehensive income (loss):
|
||||||||||||||||||||
|
Change in unrealized loss on available-for-sale securities, net of tax
|
15 | (15 | ) | — | — | — | ||||||||||||||
|
Foreign currency translation adjustments
|
441 | 386 | (613 | ) | 492 | (632 | ) | |||||||||||||
|
Other comprehensive income (loss)
|
456 | 371 | (613 | ) | 492 | (632 | ) | |||||||||||||
|
COMPREHENSIVE (LOSS) INCOME
|
(4,885 | ) | (2,164 | ) | (881 | ) | (2,063 | ) | 284 | |||||||||||
|
Comprehensive (income) loss attributable to noncontrolling interests
|
(543 | ) | (710 | ) | 1,234 | 4,074 | 836 | |||||||||||||
|
COMPREHENSIVE (LOSS) INCOME ATTRIBUTABLE TO GENIE ENERGY LTD.
|
$ | (5,428 | ) | $ | (2,874 | ) | $ | 353 | $ | 2,011 | $ | 1,120 | ||||||||
See accompanying notes to consolidated financial statements.
F-7
CONSOLIDATED STATEMENTS OF EQUITY (in thousands)
|
Genie Energy Ltd. Stockholders
|
Noncontrolling Interests
|
|||||||||||||||||||||||||||||||||||||||
|
Preferred Stock
|
Class A
Common Stock
|
Class B
Common Stock
|
Additional
Paid-In
Capital
|
Treasury
Stock
|
Accumulated
Other
Comprehensive
Income (Loss)
|
Retained earnings
|
Noncontrolling
Interests
|
Receivable for
issuance of
equity
|
Total
Equity
|
|||||||||||||||||||||||||||||||
|
Shares
|
Amount
|
Shares
|
Amount
|
Shares
|
Amount
|
|||||||||||||||||||||||||||||||||||
|
BALANCE AT JULY 31, 2010
|
— | $ | — | 1,574 | $ | 16 | 21,109 | $ | 211 | $ | — | $ | — | $ | (24 | ) | $ | 33,595 | $ | 438 | $ | — | $ | 34,236 | ||||||||||||||||
|
Stock-based compensation
|
— | — | — | — | — | — | 710 | — | — | — | — | — | 710 | |||||||||||||||||||||||||||
|
Sales of stock of subsidiary
|
— | — | — | — | — | — | 11,200 | — | — | — | (200 | ) | (1,000 | ) | 10,000 | |||||||||||||||||||||||||
|
Exchange of stock of subsidiary
|
— | — | — | — | — | — | (333 | ) | — | — | — | (969 | ) | — | (1,302 | ) | ||||||||||||||||||||||||
|
Other comprehensive income
|
— | — | — | — | — | — | — | — | 381 | — | 111 | — | 492 | |||||||||||||||||||||||||||
|
Net income (loss) for the year ended July 31, 2011
|
— | — | — | — | — | — | — | — | — | 1,630 | (4,185 | ) | — | (2,555 | ) | |||||||||||||||||||||||||
|
BALANCE AT JULY 31, 2011
|
— | — | 1,574 | 16 | 21,109 | 211 | 11,577 | — | 357 | 35,225 | (4,805 | ) | (1,000 | ) | 41,581 | |||||||||||||||||||||||||
|
Dividends declared ($0.05 per share)
|
— | — | — | — | — | — | — | — | — | (1,148 | ) | — | — | (1,148 | ) | |||||||||||||||||||||||||
|
Stock-based compensation
|
— | — | — | — | 238 | 3 | 668 | — | — | — | — | — | 671 | |||||||||||||||||||||||||||
|
Other
|
— | — | — | — | 35 | — | — | — | — | — | — | — | — | |||||||||||||||||||||||||||
|
Capital contribution from IDT Corporation in connection with the Spin-Off
|
— | — | — | — | — | — | 82,183 | — | — | — | — | — | 82,183 | |||||||||||||||||||||||||||
|
Forgiveness of the amount due from IDT Corporation in connection with the Spin-Off
|
— | — | — | — | — | — | (2,107 | ) | — | — | — | — | — | (2,107 | ) | |||||||||||||||||||||||||
|
Other comprehensive loss
|
— | — | — | — | — | — | — | — | (494 | ) | — | (119 | ) | — | (613 | ) | ||||||||||||||||||||||||
|
Net income (loss) for the five months ended December 31, 2011
|
— | — | — | — | — | — | — | — | — | 847 | (1,115 | ) | — | (268 | ) | |||||||||||||||||||||||||
|
BALANCE AT DECEMBER 31, 2011
|
— | — | 1,574 | 16 | 21,382 | 214 | 92,321 | — | (137 | ) | 34,924 | (6,039 | ) | (1,000 | ) | 120,299 | ||||||||||||||||||||||||
F-8
GENIE ENERGY LTD.
CONSOLIDATED STATEMENTS OF EQUITY (in thousands)-(Continued)
|
Genie Energy Ltd. Stockholders
|
Noncontrolling Interests
|
|||||||||||||||||||||||||||||||||||||||
|
Preferred Stock
|
Class A
Common Stock
|
Class B
Common Stock
|
Additional
Paid-In
Capital
|
Treasury
Stock
|
Accumulated
Other
Comprehensive
Income (Loss)
|
Retained earnings
|
Noncontrolling
Interests
|
Receivable for
issuance of
equity
|
Total
Equity
|
|||||||||||||||||||||||||||||||
|
Shares
|
Amount
|
Shares
|
Amount
|
Shares
|
Amount
|
|||||||||||||||||||||||||||||||||||
|
Dividends declared on common stock ($0.133 per share)
|
— | — | — | — | — | — | — | — | — | (3,057 | ) | — | — | (3,057 | ) | |||||||||||||||||||||||||
|
Dividends on preferred stock
|
— | — | — | — | — | — | — | — | — | (211 | ) | — | — | (211 | ) | |||||||||||||||||||||||||
|
Restricted Class B common stock purchased from employee
|
— | — | — | — | — | — | — | (204 | ) | — | — | — | — | (204 | ) | |||||||||||||||||||||||||
|
Stock-based compensation
|
— | — | — | — | — | — | 3,404 | — | — | — | 25 | — | 3,429 | |||||||||||||||||||||||||||
|
Restricted stock issued to employees and directors
|
— | — | — | — | 49 | — | — | — | — | — | — | — | — | |||||||||||||||||||||||||||
|
Exercise of stock options
|
— | — | — | — | 1 | — | 5 | — | — | — | — | — | 5 | |||||||||||||||||||||||||||
|
Grants of stock of subsidiary
|
— | — | — | — | — | — | (1,911 | ) | — | — | — | 1,911 | — | — | ||||||||||||||||||||||||||
|
Exchange of Class B common stock for Preferred stock
|
1,605 | 13,639 | — | — | (1,605 | ) | (16 | ) | (13,623 | ) | — | — | — | — | — | — | ||||||||||||||||||||||||
|
Other comprehensive income
|
— | — | — | — | — | — | — | — | 407 | — | (36 | ) | — | 371 | ||||||||||||||||||||||||||
|
Net (loss) income for the year ended December 31, 2012
|
— | — | — | — | — | — | — | — | — | (3,281 | ) | 746 | — | (2,535 | ) | |||||||||||||||||||||||||
|
BALANCE AT DECEMBER 31, 2012
|
1,605 | 13,639 | 1,574 | 16 | 19,827 | 198 | 80,196 | (204 | ) | 270 | 28,375 | (3,393 | ) | (1,000 | ) | 118,097 | ||||||||||||||||||||||||
|
Dividends on preferred stock
|
— | — | — | — | — | — | — | — | — | (920 | ) | — | — | (920 | ) | |||||||||||||||||||||||||
|
Restricted Class B common stock purchased from employees
|
— | — | — | — | — | — | — | (269 | ) | — | — | — | — | (269 | ) | |||||||||||||||||||||||||
|
Stock-based compensation
|
— | — | — | — | — | — | 3,841 | — | — | — | — | — | 3,841 | |||||||||||||||||||||||||||
|
Restricted stock issued to employees and directors
|
— | — | — | — | 227 | 3 | — | — | — | — | — | — | 3 | |||||||||||||||||||||||||||
|
Exercise of stock options
|
— | — | — | — | 13 | — | 93 | — | — | — | — | — | 93 | |||||||||||||||||||||||||||
|
Grants of equity of subsidiaries
|
— | — | — | — | — | — | 357 | — | — | — | (357 | ) | — | — | ||||||||||||||||||||||||||
|
Sales of equity of subsidiaries
|
— | — | — | — | — | — | 1,129 | — | — | — | (707 | ) | — | 422 | ||||||||||||||||||||||||||
|
Issuance of preferred stock of subsidiary
|
— | — | — | — | — | — | (2,000 | ) | — | — | — | 2,000 | — | — | ||||||||||||||||||||||||||
|
Issuance of Class B common stock to holders of deferred stock units of subsidiary
|
— | — | — | — | — | — | 1,836 | — | — | — | (1,836 | ) | — | — | ||||||||||||||||||||||||||
|
Distributions to noncontrolling interests
|
— | — | — | — | — | — | — | — | — | — | (42 | ) | — | (42 | ) | |||||||||||||||||||||||||
|
Exchange of Class B common stock for Preferred stock
|
312 | 2,664 | — | — | (312 | ) | (3 | ) | (2,661 | ) | — | — | — | — | — | — | ||||||||||||||||||||||||
|
Other comprehensive income
|
— | — | — | — | — | — | — | — | 475 | — | (19 | ) | — | 456 | ||||||||||||||||||||||||||
|
Net (loss) income for the year ended December 31, 2013
|
— | — | — | — | — | — | — | — | — | (5,903 | ) | 562 | — | (5,341 | ) | |||||||||||||||||||||||||
|
BALANCE AT DECEMBER 31, 2013
|
1,917 | $ | 16,303 | 1,574 | $ | 16 | 19,755 | $ | 198 | $ | 82,791 | $ | (473 | ) | $ | 745 | $ | 21,552 | $ | (3,792 | ) | $ | (1,000 | ) | $ | 116,340 | ||||||||||||||
See accompanying notes to consolidated financial statements.
F-9
|
(in thousands)
|
Year ended
December 31,
2013
|
Year ended
December 31,
2012
|
Five Months
ended
December 31,
2011
|
Year ended
July 31,
2011
|
Five Months
ended
December 31,
2010
(Unaudited)
|
|||||||||||||||
|
OPERATING ACTIVITIES
|
||||||||||||||||||||
|
Net (loss) income
|
$ | (5,341 | ) | $ | (2,535 | ) | $ | (268 | ) | $ | (2,555 | ) | $ | 916 | ||||||
|
Adjustments to reconcile net (loss) income to net cash provided by (used in) operating activities:
|
||||||||||||||||||||
|
Depreciation
|
110 | 124 | 15 | 24 | 11 | |||||||||||||||
|
Deferred income taxes
|
(241 | ) | 4,508 | (1,253 | ) | (684 | ) | (183 | ) | |||||||||||
|
Provision for doubtful accounts receivable
|
800 | — | — | 66 | 66 | |||||||||||||||
|
Stock-based compensation
|
4,180 | 3,429 | 630 | 751 | 800 | |||||||||||||||
|
Loss on disposal of property
|
37 | — | — | — | — | |||||||||||||||
|
Equity in the net loss of AMSO, LLC
|
3,194 | 3,175 | 2,095 | 5,238 | 1,658 | |||||||||||||||
|
Change in assets and liabilities, net of effect of acquisitions:
|
||||||||||||||||||||
|
Restricted cash
|
(4,713 | ) | (233 | ) | — | — | — | |||||||||||||
|
Trade accounts receivable
|
(2,679 | ) | (14,711 | ) | 1,276 | 1,007 | 676 | |||||||||||||
|
Inventory
|
(700 | ) | 1,423 | (1,311 | ) | (61 | ) | (816 | ) | |||||||||||
|
Prepaid expenses
|
(93 | ) | 638 | (1,795 | ) | (1,095 | ) | (914 | ) | |||||||||||
|
Other current assets and other assets
|
(243 | ) | (783 | ) | (2,675 | ) | 156 | (312 | ) | |||||||||||
|
Trade accounts payable, accrued expenses and other current liabilities
|
6,883 | 6,275 | (1,595 | ) | 3,953 | (1,518 | ) | |||||||||||||
|
Advances from customers
|
(746 | ) | (781 | ) | 806 | (370 | ) | 558 | ||||||||||||
|
Due to IDT Corporation
|
(59 | ) | (157 | ) | 757 | — | — | |||||||||||||
|
Income taxes payable
|
831 | (1,380 | ) | 961 | (954 | ) | (806 | ) | ||||||||||||
|
Net cash provided by (used in) operating activities
|
1,220 | (1,008 | ) | (2,357 | ) | 5,476 | 136 | |||||||||||||
|
INVESTING ACTIVITIES
|
||||||||||||||||||||
|
Capital expenditures
|
(313 | ) | (91 | ) | (134 | ) | (151 | ) | (45 | ) | ||||||||||
|
Capital contributions to AMSO, LLC
|
(2,700 | ) | (4,102 | ) | (2,040 | ) | (3,943 | ) | (2,514 | ) | ||||||||||
|
Payment for acquisitions, net of cash acquired
|
(772 | ) | — | — | — | — | ||||||||||||||
|
(Increase) decrease in restricted cash
|
— | — | (428 | ) | 309 | (37 | ) | |||||||||||||
|
Issuance of notes receivable
|
(750 | ) | (650 | ) | — | — | — | |||||||||||||
|
Purchase of licenses and security deposits
|
— | (175 | ) | — | — | — | ||||||||||||||
|
Purchases of certificates of deposit
|
(4,329 | ) | (2,205 | ) | — | — | — | |||||||||||||
|
Proceeds from maturities of certificates of deposit
|
2,205 | — | — | — | — | |||||||||||||||
|
Purchases of marketable securities
|
(3 | ) | (11,484 | ) | — | — | — | |||||||||||||
|
Proceeds from maturities of marketable securities
|
10,433 | 966 | — | — | — | |||||||||||||||
|
Net cash provided by (used in) investing activities
|
3,771 | (17,741 | ) | (2,602 | ) | (3,785 | ) | (2,596 | ) | |||||||||||
|
FINANCING ACTIVITIES
|
||||||||||||||||||||
|
Capital contribution from IDT Corporation in connection with the spin-off
|
— | — | 82,183 | — | — | |||||||||||||||
|
Dividends paid
|
(1,131 | ) | (4,205 | ) | — | — | — | |||||||||||||
|
Funding provided by IDT Corporation
|
— | — | 1,120 | 571 | 10,098 | |||||||||||||||
|
Distributions to noncontrolling interests
|
(42 | ) | — | — | — | — | ||||||||||||||
|
Proceeds from sales of equity of subsidiaries
|
422 | — | — | 10,000 | 10,000 | |||||||||||||||
|
Repurchase of noncontrolling interests
|
— | — | — | (1,528 | ) | — | ||||||||||||||
|
Proceeds from exercise of stock options
|
93 | 5 | — | — | — | |||||||||||||||
|
Increase in restricted cash
|
— | (10,017 | ) | — | — | — | ||||||||||||||
|
Repurchases of common stock and Class B common stock
|
(269 | ) | (204 | ) | — | — | — | |||||||||||||
|
Net cash (used in) provided by financing activities
|
(927 | ) | (14,421 | ) | 83,303 | 9,043 | 20,098 | |||||||||||||
|
Effect of exchange rate changes on cash and cash equivalents
|
412 | 359 | — | — | — | |||||||||||||||
|
Net increase (decrease) in cash and cash equivalents
|
4,476 | (32,811 | ) | 78,344 | 10,734 | 17,638 | ||||||||||||||
|
Cash and cash equivalents at beginning of period
|
69,409 | 102,220 | 23,876 | 13,142 | 13,142 | |||||||||||||||
|
Cash and cash equivalents at end of period
|
$ | 73,885 | $ | 69,409 | $ | 102,220 | $ | 23,876 | $ | 30,780 | ||||||||||
|
SUPPLEMENTAL DISCLOSURE OF CASH FLOW INFORMATION
|
||||||||||||||||||||
|
Cash payments made for interest
|
$ | 12 | $ | — | $ | 394 | $ | 5 | $ | 4 | ||||||||||
|
Cash payments made for income taxes
|
$ | 2,069 | $ | 387 | $ | — | $ | 3,337 | $ | 1,935 | ||||||||||
|
SUPPLEMENTAL SCHEDULE OF NON-CASH FINANCING AND INVESTING ACTIVITIES
|
||||||||||||||||||||
|
Liabilities incurred for acquisitions
|
$ | 2,475 | $ | — | $ | — | $ | — | $ | — | ||||||||||
|
Forgiveness of amount due from IDT Corporation
|
$ | — | $ | — | $ | 2,107 | $ | — | $ | — | ||||||||||
|
Receivable for issuance of equity of subsidiary
|
$ | — | $ | — | $ | — | $ | 1,000 | $ | 1,000 | ||||||||||
See accompanying notes to consolidated financial statements.
F-10
GENIE ENERGY LTD.
Description of Business
Genie Energy Ltd. (“Genie”), a Delaware corporation, was incorporated in January 2011. Genie owns 99.3% of its subsidiary, Genie Energy International Corporation (“GEIC”), which owns 100% of IDT Energy and 92% of Genie Oil and Gas, Inc. (“GOGAS”). IDT Energy has outstanding deferred stock units granted to directors and employees that represent an interest of 2.3% of the equity of IDT Energy. Genie’s principal businesses consist of the following:
|
•
|
IDT Energy, a retail energy provider (“REP”) supplying electricity and natural gas to residential and small business customers in the Northeastern United States; and
|
|
•
|
Genie Oil and Gas, which is pioneering technologies to produce clean and affordable transportation fuels from the world's abundant oil shales and other fuel resources, which consists of (1) American Shale Oil Corporation (“AMSO”), which holds and manages a 48.16% interest in American Shale Oil, L.L.C. (“AMSO, LLC”), the Company’s oil shale project in Colorado, (2) an 88.6% interest in Israel Energy Initiatives, Ltd. (“IEI”), the Company’s oil shale project in Israel, (3) an 89% interest in Afek Oil and Gas, Ltd. (formerly Genie Israel Oil and Gas, Ltd.) (“Afek”), the Company’s conventional oil and gas exploration project in the southern portion of the Golan Heights, and (4) a 90% interest in Genie Mongolia, the Company’s oil shale exploration project in Central Mongolia.
|
IEI holds an exclusive Shale Oil Exploration and Production License that was awarded by the Government of Israel in July 2008. The license covers an area in the south of the Shfela region in Israel. The license expires in July 2014. The license may be extended for one year through July 2015. In April 2013, the Government of Israel finalized the award to Afek of an exclusive three year petroleum exploration license in the southern portion of the Golan Heights. In April 2013, Genie Mongolia and the Petroleum Authority of Mongolia entered into an exclusive five year oil shale development agreement to explore and evaluate the commercial potential of oil shale resources in Central Mongolia.
The “Company” in these financial statements refers to Genie, IDT Energy and Genie Oil and Gas, and their respective subsidiaries, on a consolidated basis as if Genie existed and owned its subsidiaries in all periods presented, or from the date an entity was acquired, if later.
On January 30, 2012, the Company’s Board of Directors changed the Company’s fiscal year end from July 31 to December 31, in order to better align the Company’s financial reporting with its operational and budgeting cycle and with other industry participants.
The Company’s Spin-Off
The Company was formerly a subsidiary of IDT Corporation (“IDT”). On October 28, 2011, the Company was spun-off by IDT and became an independent public company through a pro rata distribution of the Company’s common stock to IDT’s stockholders (the “Spin-Off”). As a result of the Spin-Off, each of IDT’s stockholders received: (i) one share of the Company’s Class A common stock for every share of IDT’s Class A common stock held of record on October 21, 2011 (the “Record Date”), and (ii) one share of the Company’s Class B common stock for every share of IDT’s Class B common stock held of record on the Record Date. On October 28, 2011, 1.6 million shares of the Company’s Class A common stock, and 21.1 million shares of the Company’s Class B common stock were issued and outstanding.
Prior to the Spin-Off, IDT made a capital contribution of $82.2 million to the Company. In addition, in connection with the capital contribution received from IDT, the amount due from IDT as of the date of the Spin-Off of $2.1 million was forgiven.
The Company entered into various agreements with IDT prior to the Spin-Off including a Separation and Distribution Agreement to effect the separation and provide a framework for the Company’s relationship with IDT after the Spin-Off, and a Transition Services Agreement, which provides for certain services to be performed by the Company and IDT to facilitate the Company’s transition into a separate publicly-traded company. These agreements provide for, among other things, (1) the allocation between the Company and IDT of employee benefits, taxes and other liabilities and obligations attributable to periods prior to the Spin-Off, (2) transitional services to be provided by IDT relating to human resources and employee benefits administration, (3) the allocation of responsibilities relating to employee compensation and benefit plans and programs and other related matters, (4) finance, accounting, tax, internal audit, facilities, investor relations and legal services to be provided by IDT to the Company following the Spin-Off and (5) specified administrative services to be provided by the Company to certain of IDT’s foreign subsidiaries.
In addition, the Company entered into a Tax Separation Agreement with IDT, which sets forth the responsibilities of the Company and IDT with respect to, among other things, liabilities for federal, state, local and foreign taxes for periods before and including the Spin-Off, the preparation and filing of tax returns for such periods and disputes with taxing authorities regarding taxes for such periods. Pursuant to the Tax Separation Agreement, among other things, IDT indemnifies the Company from all liability for taxes of IDT with respect to any taxable period, and the Company indemnifies IDT from all liability for taxes of the Company with respect to any taxable period, including, without limitation, the ongoing tax audits related to the Company’s business.
F-11
GENIE ENERGY LTD.
NOTES TO CONSOLIDATED FINANCIAL STATEMENTS—(Continued)
Basis of Accounting and Consolidation
For the periods prior to the Spin-Off, direct expenses historically incurred by IDT on behalf of the Company are reflected in these financial statements. The most significant expenses are as follows: Facility costs as well as certain salaries consisting of payroll, human resources, purchasing, accounts payable, treasury, network and telephone services, legal, travel, and consulting fees were allocated to the Company based on estimates of the incremental cost incurred by IDT. Medical and dental benefits were allocated to the Company based on rates similar to COBRA health benefit provision rates charged to former IDT employees. Stock-based compensation and retirement benefits under the defined contribution plan were allocated to the Company based on specific identification. Insurance was allocated to these entities based on a combination of headcount and specific policy identification. The assets and liabilities in these financial statements are recorded at historical cost. Management believes that the assumptions and methods of allocation used are reasonable. However, the costs as allocated are not necessarily indicative of the costs that would have been incurred if the Company operated on a stand-alone basis. Therefore, for the periods prior to the Spin-Off, the consolidated financial statements included herein may not necessarily be indicative of the results of operations, changes in equity and cash flows of the Company had the Company been a separate stand-alone entity during the periods prior to the Spin-Off.
The method of accounting applied to long-term investments, whether consolidated, equity or cost, involves an evaluation of the significant terms of each investment that explicitly grant or suggest evidence of control or influence over the operations of the investee and also includes the identification of any variable interests in which the Company is the primary beneficiary. The consolidated financial statements include the Company’s controlled subsidiaries and variable interest entities where the Company is the primary beneficiary (see Note 12). All significant intercompany accounts and transactions between the consolidated entities are eliminated.
Unaudited Financial Statements
The accompanying consolidated statements of operations, comprehensive income, and cash flows for the five months ended December 31, 2010 are unaudited. These unaudited consolidated financial statements have been prepared in accordance with accounting principles generally accepted in the United States of America (“U.S. GAAP”). In management’s opinion, the unaudited consolidated financial statements have been prepared on the same basis as the audited financial statements and include all adjustments, which include only normal recurring adjustments, necessary for the fair presentation of the Company’s consolidated results of operations and cash flows for the five months ended December 31, 2010.
Accounting for Investments
Investments in businesses that the Company does not control, but in which the Company has the ability to exercise significant influence over operating and financial matters, are accounted for using the equity method. The Company’s investment in AMSO, LLC is accounted for using the equity method. The Company periodically evaluates its equity method investment for impairment due to declines considered to be other than temporary. If the Company determines that a decline in fair value is other than temporary, then a charge to earnings would be recorded, and a new basis in the investment is established.
Use of Estimates
The preparation of financial statements in conformity with U.S. GAAP requires management to make estimates and assumptions that affect the amounts reported in the financial statements and accompanying notes. Actual results may differ from those estimates.
Revenue Recognition
Revenues from IDT Energy’s sale of electricity and natural gas are recognized under the accrual method based on deliveries of electricity and natural gas to customers. Revenues from electricity and natural gas delivered but not yet billed are estimated and recorded as accounts receivable. Cash received in advance from customers under billing arrangement is reported as deferred revenue and is included in “Advances from customers” in the accompanying consolidated balance sheets. Genie Oil and Gas does not yet generate revenues.
Direct Cost of Revenues
Direct cost of revenues for IDT Energy consists primarily of the cost of natural gas and electricity sold, and also includes scheduling costs, Independent System Operator fees, pipeline costs and utility service charges. In addition, the changes in the fair value of IDT Energy’s futures contracts, swaps and put and call options are recorded in direct cost of revenues. Genie Oil and Gas does not yet incur direct cost of revenues as primarily all of its expenses are classified as research and development.
Research and Development Costs
Research and development costs are incurred primarily by IEI, Afek and Genie Mongolia. Costs for research and development are charged to expense as incurred.
F-12
GENIE ENERGY LTD.
NOTES TO CONSOLIDATED FINANCIAL STATEMENTS—(Continued)
Cash and Cash Equivalents
The Company considers all highly liquid investments with an original maturity of three months or less when purchased to be cash equivalents.
Marketable Securities
The Company classified its investments in marketable securities as “available-for-sale.” Available-for-sale securities are required to be carried at their fair value, with unrealized gains and losses (net of income taxes) that are considered temporary in nature recorded in “Accumulated other comprehensive income” in the accompanying consolidated balance sheets. The Company uses the specific identification method in computing the gross realized gains and gross realized losses on the maturities and sales of marketable securities. The Company periodically evaluated its investments in marketable securities for impairment due to declines in market value considered to be other than temporary. Such impairment evaluations included, in addition to persistent, declining market prices, general economic and Company-specific evaluations. If the Company determined that a decline in market value is other than temporary, then a charge to operations is recorded in “Other (expense) income, net” in the accompanying consolidated statements of operations and a new cost basis in the investment is established.
Inventory
Inventory consists of natural gas, which is stored at various third parties’ underground storage facilities. Inventory is valued at a weighted average cost. The cost is based on the purchase price of the natural gas and the cost to transport, plus or minus injections or withdrawals.
Property and Equipment
Computer software and development, computers and computer hardware, laboratory equipment and office equipment and other are recorded at cost and are depreciated on a straight-line basis over their estimated useful lives, which range as follows: computer software and development—2, 3 or 5 years; computers and computer hardware—5 years, laboratory equipment 7 years, and office equipment and other —5 or 7 years. Leasehold improvements included in office equipment and other are recorded at cost and are depreciated on a straight-line basis over the term of their lease or their estimated useful lives, whichever is shorter.
Long-Lived Assets
The Company tests the recoverability of its long-lived assets with finite useful lives whenever events or changes in circumstances indicate that the carrying value of the asset may not be recoverable. The Company tests the recoverability based on the projected undiscounted cash flows to be derived from such asset. If the projected undiscounted future cash flows are less than the carrying value of the asset, the Company will record an impairment loss based on the difference between the estimated fair value and the carrying value of the asset. The Company generally measures fair value by considering sale prices for similar assets or by discounting estimated future cash flows from such asset using an appropriate discount rate. Cash flow projections and fair value estimates require significant estimates and assumptions by management. Should the estimates and assumptions prove to be incorrect, the Company may be required to record impairments in future periods and such impairments could be material.
Goodwill and Indefinite Lived Intangible Assets
Goodwill is the excess of the acquisition cost of businesses over the fair value of the identifiable net assets acquired. Goodwill and other indefinite lived intangible assets are not amortized. These assets are reviewed annually (or more frequently under various conditions) for impairment using a fair value approach. The goodwill impairment assessment involves estimating the fair value of the reporting unit and comparing it to its carrying amount, which is known as Step 1. If the carrying value of the reporting unit exceeds its estimated fair value, Step 2 is performed to determine if an impairment of goodwill is required. The fair value of the reporting unit is estimated using discounted cash flow methodologies, as well as considering third party market value indicators. Goodwill impairment is measured by the excess of the carrying amount of the reporting unit’s goodwill over its implied fair value. Calculating the fair value of the reporting units, and allocating the estimated fair value to all of the tangible assets, intangible assets and liabilities, requires significant estimates and assumptions by management. Should the estimates and assumptions regarding the fair value of the reporting units prove to be incorrect, the Company may be required to record impairments to its goodwill in future periods and such impairments could be material.
The Company has the option to perform a qualitative assessment to determine whether it is necessary to perform the two-step quantitative goodwill impairment test. However, the Company may elect to perform the two-step quantitative goodwill impairment test even if no indications of a potential impairment exist.
For the impairment test of the Company’s indefinite-lived intangible assets, a quantitative impairment test is only necessary if the Company determines that it is more likely than not that an indefinite-lived intangible asset is impaired based on an assessment of certain qualitative factors.
F-13
GENIE ENERGY LTD.
NOTES TO CONSOLIDATED FINANCIAL STATEMENTS—(Continued)
Derivative Instruments and Hedging Activities
The Company records its derivatives instruments at their respective fair values. The accounting for changes in the fair value (that is, gains or losses) of a derivative instrument is dependent upon whether the derivative has been designated and qualifies as part of a hedging relationship and further, on the type of hedging relationship.
Due to the volatility of electricity and natural gas prices, IDT Energy enters into futures contracts, swaps and put and call options as hedges against unfavorable fluctuations in market prices of electricity and natural gas and to reduce exposure from price fluctuations. The futures contracts, swaps and put and call options are recorded at fair value as a current asset or liability and any changes in fair value are recorded in “Direct cost of revenues” in the consolidated statements of operations.
In addition to the above, IDT Energy utilizes forward physical delivery contracts for a portion of its purchases of electricity and natural gas, which are defined as commodity derivative contracts. Using the exemption available for qualifying contracts, IDT Energy applies the normal purchase and normal sale accounting treatment to its forward physical delivery contracts, thereby these contracts are not adjusted to fair value. Accordingly, IDT Energy recognizes revenue from customer sales, and the related direct cost of revenues at the contracted price, as electricity and natural gas is delivered to retail customers.
Repairs and Maintenance
The Company charges the cost of repairs and maintenance, including the cost of replacing minor items not constituting substantial betterment, to selling, general and administrative expenses as these costs are incurred.
Foreign Currency Translation
Assets and liabilities of foreign subsidiaries denominated in foreign currencies are translated to U.S. Dollars at end-of-period rates of exchange, and their monthly results of operations are translated to U.S. Dollars at the average rates of exchange for that month. Gains or losses resulting from such foreign currency translations are recorded in “Accumulated other comprehensive income” in the accompanying consolidated balance sheets. Foreign currency transaction gains and losses are reported in “Other (expense) income, net” in the accompanying consolidated statements of operations.
Advertising Expense
Cost of advertising and commissions for customer acquisitions are charged to selling, general and administrative expenses in the period in which it is incurred. Most of the advertisements are in print, over the radio, or direct mail. In the years ended December 31, 2013 and 2012, the year ended July 31, 2011, and the five months ended December 31, 2011 and 2010 (unaudited), advertising expense included in selling, general and administrative expense was $0.2 million, $0.8 million, $1.6 million, $0.3 million and $0.4 million, respectively.
Income Taxes
For the periods prior to the Spin-Off, the accompanying financial statements include provisions for federal, state and foreign income taxes on a separate tax return basis.
The Company recognizes deferred tax assets and liabilities for the future tax consequences attributable to temporary differences between the financial statements carrying amounts of existing assets and liabilities and their respective tax bases. A valuation allowance is provided when it is more likely than not that some portion or all of a deferred tax asset will not be realized. The ultimate realization of deferred tax assets depends on the generation of future taxable income during the period in which related temporary differences become deductible. The Company considers the scheduled reversal of deferred tax liabilities, projected future taxable income and tax planning strategies in its assessment of a valuation allowance. Deferred tax assets and liabilities are measured using the enacted tax rates expected to apply to taxable income in the years in which those temporary differences are expected to be recovered or settled. The effect on deferred tax assets and liabilities of a change in tax rates is recognized in income in the period that includes the enactment date of such change.
The Company uses a two-step approach for recognizing and measuring tax benefits taken or expected to be taken in a tax return. The Company determines whether it is more-likely-than-not that a tax position will be sustained upon examination, including resolution of any related appeals or litigation processes, based on the technical merits of the position. In evaluating whether a tax position has met the more-likely-than-not recognition threshold, the Company presumes that the position will be examined by the appropriate taxing authority that has full knowledge of all relevant information. Tax positions that meet the more-likely-than-not recognition threshold are measured to determine the amount of tax benefit to recognize in the financial statements. The tax position is measured at the largest amount of benefit that is greater than 50 percent likely of being realized upon ultimate settlement. Differences between tax positions taken in a tax return and amounts recognized in the financial statements will generally result in one or more of the following: an increase in a liability for income taxes payable, a reduction of an income tax refund receivable, a reduction in a deferred tax asset, or an increase in a deferred tax liability.
The Company classifies interest and penalties on income taxes as a component of income tax expense.
F-14
GENIE ENERGY LTD.
NOTES TO CONSOLIDATED FINANCIAL STATEMENTS—(Continued)
Contingencies
The Company accrues for loss contingencies when both (a) information available prior to issuance of the financial statements indicates that it is probable that a liability had been incurred at the date of the financial statements and (b) the amount of loss can reasonably be estimated. When the Company accrues for loss contingencies and the reasonable estimate of the loss is within a range, the Company records its best estimate within the range. When no amount within the range is a better estimate than any other amount, the Company accrues the minimum amount in the range. The Company discloses an estimated possible loss or a range of loss when it is at least reasonably possible that a loss may have been incurred.
Earnings Per Share
Basic earnings per share is computed by dividing net income attributable to all classes of common stockholders of the Company by the weighted average number of shares of all classes of common stock outstanding during the applicable period. Diluted earnings per share is determined in the same manner as basic earnings per share, except that the number of shares is increased to include restricted stock still subject to risk of forfeiture and to assume exercise of potentially dilutive stock options using the treasury stock method, unless the effect of such increase is anti-dilutive. The earnings per share for the periods prior to the Spin-Off were calculated as if the number of shares outstanding at the Spin-Off were outstanding during those periods.
The weighted-average number of shares used in the calculation of basic and diluted earnings per share attributable to the Company’s common stockholders consists of the following:
|
(in thousands)
|
Year ended
December 31,
2013
|
Year ended
December 31,
2012
|
Five Months
ended
December 31,
2011
|
Year ended
July 31,
2011
|
Five Months
ended
December 31,
2010
(Unaudited)
|
|||||||||||||||
|
Basic weighted-average number of shares
|
19,668 | 20,687 | 20,366 | 20,365 | 20,365 | |||||||||||||||
|
Effect of dilutive securities:
|
||||||||||||||||||||
|
Non-vested restricted Class B common stock
|
— | — | 2,131 | 1,977 | 1,977 | |||||||||||||||
|
Diluted weighted-average number of shares
|
19,668 | 20,687 | 22,497 | 22,342 | 22,342 | |||||||||||||||
The following shares were excluded from the diluted earnings per share computations because their inclusion would have been anti-dilutive:
|
(in thousands)
|
Year ended
December 31,
2013
|
Year ended
December 31, 2012
|
Five Months
ended
December 31,
2011
|
Year ended
July 31,
2011
|
Five Months
ended
December 31,
2010
(Unaudited)
|
|
||||||||||||||
|
Stock options
|
3,443 | 457 | — | — | — | |||||||||||||||
|
Non-vested restricted Class B common stock
|
265 | 1,896 | — | — | — | |||||||||||||||
|
Shares excluded from the calculation of diluted earnings per share
|
3,708 | 2,353 | — | — | — | |||||||||||||||
The diluted loss per share equals basic loss per share in the years ended December 31, 2013 and 2012 because the Company had a net loss and the impact of the assumed exercise of stock options and vesting of restricted stock would have been anti-dilutive.
An entity affiliated with Lord (Jacob) Rothschild has a one-time option through November 12, 2017 to exchange its GOGAS shares for shares of the Company with equal fair value as determined by the parties (see Note 10). The number of shares issuable in such an exchange is not currently determinable. If this option is exercised, the shares issued by the Company may dilute the earnings per share in future periods.
An employee of the Company, pursuant to the terms of his employment agreement, has the option to exchange his equity interests in IEI, Afek, Genie Mongolia and any equity interest that he may acquire in other entities that the Company may create, for shares of the Company. Employees and directors of the Company that were previously granted restricted stock of IEI have the right to exchange the restricted stock of IEI, upon vesting of such shares, into shares of the Company’s Class B common stock. In addition, IDT Energy has the right to exchange the deferred stock units it previously granted to employees and directors of the Company, upon vesting of such units, into shares of the Company’s Class B common stock or to redeem the units for cash. These exchanges, if elected, would be based on the relative fair value of the shares exchanged. The number of shares of the Company’s stock issuable in an exchange is not currently determinable. If shares of the Company’s stock are issued upon such exchange, the Company’s earnings per share may be diluted in future periods.
Stock-Based Compensation
The Company recognizes compensation expense for grants of stock-based awards to its employees based on the estimated fair value on the grant date. Stock based awards granted to nonemployees are marked-to-market until the vesting of the award. Compensation cost for awards is recognized using the straight-line method over the vesting period. Stock-based compensation is included in selling, general and administrative expense.
F-15
GENIE ENERGY LTD.
NOTES TO CONSOLIDATED FINANCIAL STATEMENTS—(Continued)
Vulnerability Due to Certain Concentrations
Financial instruments that potentially subject the Company to concentration of credit risk consist principally of cash, cash equivalents, restricted cash, certificates of deposit and trade accounts receivable. The Company holds cash, cash equivalents, restricted cash and certificates of deposit at several major financial institutions, which may exceed FDIC insured limits. Historically, the Company has not experienced any losses due to such concentration of credit risk. The Company’s temporary cash investments policy is to limit the dollar amount of investments with any one financial institution and monitor the credit ratings of those institutions. While the Company may be exposed to credit losses due to the nonperformance of the holders of its deposits, the Company does not expect the settlement of these transactions to have a material effect on its results of operations, cash flows or financial condition.
IDT Energy reduces its credit risk by participating in purchase of receivable programs for a majority of its receivables. In addition to providing billing and collection services, utility companies purchase IDT Energy’s receivables and assume all credit risk without recourse to IDT Energy. IDT Energy’s primary credit risk is therefore nonpayment by the utility companies. Certain of the utility companies represent significant portions of the Company’s consolidated revenues and consolidated gross trade accounts receivable balance and such concentrations increase the Company’s risk associated with nonpayment by those utility companies.
The following table summarizes the percentage of consolidated revenues from customers by utility company that equal or exceed 10% of consolidated revenues in the period (no other single utility company accounted for more than 10% of consolidated revenues in any of the periods):
|
Year ended
December 31,
2013
|
Year ended
December 31,
2012
|
Five Months
ended
December 31,
2011
|
Year ended
July 31,
2011
|
Five Months
ended
December 31,
2010
(Unaudited)
|
||||||||||||||||
|
Con Edison
|
25 | % | 34 | % | 52 | % | 47 | % | 55 | % | ||||||||||
|
West Penn Power
|
11 | % |
na
|
na
|
na
|
na
|
||||||||||||||
|
National Grid USA
|
10 | % |
na
|
14 | % | 17 | % | 16 | % | |||||||||||
|
Penelec
|
10 | % |
na
|
na
|
na
|
na
|
||||||||||||||
|
National Grid dba Keyspan
|
na
|
na
|
na
|
10 | % |
na
|
||||||||||||||
na-less than 10% of consolidated revenue in the period
The following table summarizes the percentage of consolidated gross trade accounts receivable by utility company that equal or exceed 10% of consolidated gross trade accounts receivable at December 31, 2013 and 2012:
|
December 31
|
2013
|
2012
|
||||||
|
Con Edison
|
23 | % | 19 | % | ||||
|
West Penn Power
|
13 | % |
na
|
|||||
|
Penelec
|
12 | % | 10 | % | ||||
na-less than 10% of consolidated gross trade accounts receivable at December 31, 2013 or 2012
Allowance for Doubtful Accounts
The allowance for doubtful accounts reflects the Company’s best estimate of probable losses inherent in the accounts receivable balance. The allowance is determined based on known troubled accounts, historical experience and other currently available evidence. Doubtful accounts are written-off upon final determination that the trade accounts will not be collected. The change in the allowance for doubtful accounts was as follows:
|
(in thousands)
|
Balance at
beginning of
period
|
Additions
charged to
costs and
expenses
|
Deductions(1)
|
Balance at
end of period
|
||||||||||||
|
Year ended December 31, 2013
|
||||||||||||||||
|
Reserves deducted from accounts receivable:
|
||||||||||||||||
|
Allowance for doubtful accounts
|
$ | 130 | $ | 800 | $ | — | $ | 930 | ||||||||
|
Year ended December 31, 2012
|
||||||||||||||||
|
Reserves deducted from accounts receivable:
|
||||||||||||||||
|
Allowance for doubtful accounts
|
$ | 130 | $ | — | $ | — | $ | 130 | ||||||||
|
Five months ended December 31, 2011
|
||||||||||||||||
|
Reserves deducted from accounts receivable:
|
||||||||||||||||
|
Allowance for doubtful accounts
|
$ | 130 | $ | — | $ | — | $ | 130 | ||||||||
|
Year ended July 31, 2011
|
||||||||||||||||
|
Reserves deducted from accounts receivable:
|
||||||||||||||||
|
Allowance for doubtful accounts
|
$ | 170 | $ | 66 | $ | (106 | ) | $ | 130 | |||||||
|
Five months ended December 31, 2010 (unaudited)
|
||||||||||||||||
|
Reserves deducted from accounts receivable:
|
||||||||||||||||
|
Allowance for doubtful accounts
|
$ | 170 | $ | 66 | $ | (106 | ) | $ | 130 | |||||||
(1) Uncollectible accounts written off.
F-16
GENIE ENERGY LTD.
NOTES TO CONSOLIDATED FINANCIAL STATEMENTS—(Continued)
Fair Value Measurements
Fair value of financial and non-financial assets and liabilities is defined as an exit price, which is the price that would be received to sell an asset or paid to transfer a liability in an orderly transaction between market participants at the measurement date. The three-tier hierarchy for inputs used to measure fair value, which prioritizes the inputs to valuation techniques used to measure fair value, is as follows:
|
Level 1 –
|
quoted prices (unadjusted) in active markets for identical assets or liabilities.
|
|
Level 2 –
|
quoted prices for similar assets and liabilities in active markets or inputs that are observable for the asset or liability, either directly or indirectly through market corroboration, for substantially the full term of the financial instrument.
|
|
Level 3 –
|
unobservable inputs based on the Company’s assumptions used to measure assets and liabilities at fair value.
|
A financial asset or liability’s classification within the hierarchy is determined based on the lowest level input that is significant to the fair value measurement. The assessment of the significance of a particular input to the fair value measurement requires judgment, and may affect the valuation of the assets and liabilities being measured and their placement within the fair value hierarchy.
In December 2013, IDT Energy acquired 100% of the outstanding membership interests of Diversegy, LLC (“Diversegy”), a retail energy advisory and brokerage company that serves commercial and industrial customers, and its network marketing channel subsidiary, Epiq Energy, LLC (“Epiq”), that provides independent representatives with the opportunity to build sales organizations and to profit from both residential and commercial energy. Operating results of the acquired entities from the date of acquisition, which were not significant, are included in the Company’s consolidated financial statements.
The impact of the acquisition’s purchase price allocations on the Company’s consolidated balance sheet and the acquisition date fair value of the total consideration transferred follows:
|
(in thousands)
|
||||
|
Trade accounts receivable
|
$ | 114 | ||
|
Goodwill
|
3,686 | |||
|
Trade accounts payable
|
(176 | ) | ||
|
Advances from customers
|
(377 | ) | ||
|
Net assets acquired
|
$ | 3,247 | ||
|
Supplemental information:
|
||||
|
Cash paid
|
$ | 779 | ||
|
Cash acquired
|
(7 | ) | ||
|
Cash paid, net of cash acquired
|
772 | |||
|
Deferred cash payments to be paid by June 2015
(1)
|
1,225 | |||
|
Contingent payments (1)
|
1,250 | |||
|
Total consideration, net of cash acquired
|
$ | 3,247 | ||
|
(1)
|
The deferred cash payments and the contingent payments are included in other current liabilities and other liabilities in the consolidated balance sheet as of December 31, 2013.
|
The contingent payments include 100% of the gross profit from each closing customer contract during the remainder of the initial term of such contract and 100% of the gross profit from each post-closing customer contract during the initial term of such contract, plus 25% of the gross profit from the first renewal term of such contracts. A closing customer contract is generally a contract in effect at closing, and a post-closing customer contract is generally a contract that became effective within 60 days following the acquisition. The Company estimated the acquisition date fair value of the contingent payments based on historical gross profits, customer attrition and contract renewals.
The goodwill resulting from the acquisitions is primarily attributable to the existing workforce of the acquired entities and synergies expected from the combination of IDT Energy with Diversegy’s portfolio of competitive energy products and Epiq’s network marketing platform. All of the goodwill is deductible for income tax purposes.
F-17
GENIE ENERGY LTD.
NOTES TO CONSOLIDATED FINANCIAL STATEMENTS—(Continued)
All of the Company’s goodwill at December 31, 2013 and 2012 was attributable to the IDT Energy segment. The table below reconciles the change in the carrying amount of goodwill for the period from July 31, 2011 to December 31, 2013:
|
(in thousands)
|
||||
|
Balance at July 31, 2011
|
$ | 3,663 | ||
|
Change in carrying amount
|
— | |||
|
Balance at December 31, 2011
|
3,663 | |||
|
Change in carrying amount
|
— | |||
|
Balance at December 31, 2012
|
3,663 | |||
|
Acquisitions
|
3,686 | |||
|
Balance at December 31, 2013
|
$ | 7,349 | ||
The following table presents unaudited pro forma information of the Company as if the acquisition occurred as of the beginning of the periods:
|
(in thousands)
|
Year ended
December 31,
2013
|
Year ended
December 31,
2012
|
||||||
|
Revenues
|
$ | 280,121 | $ | 229,936 | ||||
|
Net loss
|
$ | (6,015 | ) | $ | (3,282 | ) | ||
The following table presents the balance of assets and liabilities at December 31, 2013 measured at fair value on a recurring basis:
|
(in thousands)
|
Level 1 (1)
|
Level 2 (2)
|
Level 3 (3)
|
Total
|
||||||||||||
|
Assets:
|
||||||||||||||||
|
Derivative contracts
|
$ | 390 | $ | 1,230 | $ | 62 | $ | 1,682 | ||||||||
|
Liabilities:
|
||||||||||||||||
|
Derivative contracts
|
$ | 13 | $ | 372 | $ | — | $ | 385 | ||||||||
The following table presents the balance of assets and liabilities at December 31, 2012 measured at fair value on a recurring basis:
|
(in thousands)
|
Level 1 (1)
|
Level 2 (2)
|
Level 3 (3)
|
Total
|
||||||||||||
|
Assets:
|
||||||||||||||||
|
Corporate debt securities
|
$ | 925 | $ | 9,560 | $ | — | $ | 10,485 | ||||||||
|
Derivative contracts
|
— | 308 | — | 308 | ||||||||||||
|
Total
|
$ | 925 | $ | 9,868 | $ | — | $ | 10,793 | ||||||||
|
Liabilities:
|
||||||||||||||||
|
Derivative contracts
|
$ | — | $ | 152 | $ | — | $ | 152 | ||||||||
|
(1) – quoted prices in active markets for identical assets or liabilities
|
|
(2) – observable inputs other than quoted prices in active markets for identical assets and liabilities
|
|
(3) – no observable pricing inputs in the market
|
The Company’s derivative contracts consist of natural gas and electricity futures contracts and put and call options in which the underlying asset is a forward contract or swaps which are an agreement whereby a floating (or market or spot) price is exchanged for a fixed price over a specified period and are classified as either Level 1, Level 2 or Level 3. The Level 1 derivatives are valued using quoted prices in active markets for identical contracts. The Level 2 derivatives are valued using observable inputs based on quoted market prices in active markets for similar contracts. The fair value of the Level 3 derivatives was based on the value of the underlying contracts, estimated in conjunction with the counterparty and could not be corroborated by the market.
The Company’s subsidiary, GOGAS, issued a stock option and warrants. The GOGAS stock option was issued in June 2011 and is exercisable until April 9, 2015 at an exercise price of $5.0 million. The GOGAS warrants were issued in November 2010 and expired on November 12, 2011. The Company’s subsidiary, GEIC, issued a stock option in April 2010 that was exchanged in June 2011 for the GOGAS stock option. At December 31, 2013, the fair value of the GOGAS stock option was nil. The GOGAS warrants, GOGAS stock option and GEIC stock option were classified as Level 3 in the five months ended December 31, 2011 and 2010 (unaudited) and the year ended July 31, 2011.
F-18
GENIE ENERGY LTD.
NOTES TO CONSOLIDATED FINANCIAL STATEMENTS—(Continued)
The following tables summarize the change in the balance of the Company’s assets measured at fair value on a recurring basis using significant unobservable inputs (Level 3):
|
(in thousands)
|
Year ended
December 31,
2013
|
Year ended
December 31,
2012
|
Five Months
ended
December 31,
2011
|
Year ended
July 31,
2
011
|
Five Months
ended
December 31,
2010
(Unaudited)
|
|||||||||||||||
|
Balance, beginning of period
|
$ | — | $ | — | $ | — | $ | — | $ | — | ||||||||||
|
Total gains (losses) (realized or unrealized) included in earnings in “Direct cost of revenues”
|
(142 | ) | ||||||||||||||||||
|
Purchases, sales, issuances and settlements:
|
||||||||||||||||||||
|
Purchases
|
359 | — | — | — | — | |||||||||||||||
|
Settlement
|
(155 | ) | — | — | — | — | ||||||||||||||
|
Balance, end of period
|
$ | 62 | $ | — | $ | — | $ | — | $ | — | ||||||||||
|
The amount of total gains for the period included in earnings in “Direct cost of revenues” attributable to the change in unrealized gains or losses relating to assets held at the end of the period
|
$ | 62 | $ | — | $ | — | $ | — | $ | — | ||||||||||
The following tables summarize the change in the balance of the Company’s liabilities measured at fair value on a recurring basis using significant unobservable inputs (Level 3):
|
(in thousands)
|
Year ended
December 31,
2013
|
Year ended
December 31,
2012
|
Five Months
ended
December 31,
2011
|
Year ended
July 31,
2
011
|
Five Months
ended
December 31,
2010
(Unaudited)
|
|||||||||||||||
|
Balance, beginning of period
|
$ | — | $ | — | $ | (101 | ) | $ | (200 | ) | $ | (200 | ) | |||||||
|
Total gains (losses) (realized or unrealized):
|
||||||||||||||||||||
|
Included in earnings in “Direct cost of revenues”
|
— | — | — | — | — | |||||||||||||||
|
Included in earnings in “Other (expense) income, net”
|
— | — | 60 | (86 | ) | (280 | ) | |||||||||||||
|
Included in earnings in “Selling, general and administrative expense”
|
— | — | 41 | (41 | ) | (500 | ) | |||||||||||||
|
Purchases, sales, issuances and settlements:
|
||||||||||||||||||||
|
Settlement
|
— | — | — | 226 | — | |||||||||||||||
|
Balance, end of period
|
$ | — | $ | — | $ | — | $ | (101 | ) | $ | (980 | ) | ||||||||
|
The amount of total gains (losses) for the period attributable to the change in unrealized gains or losses relating to liabilities still held at the end of the period:
|
||||||||||||||||||||
|
Included in earnings in “Direct cost of revenues”
|
$ | — | $ | — | $ | — | $ | — | $ | — | ||||||||||
|
Included in earnings in “Other (expense) income, net”
|
$ | — | $ | — | $ | 60 | $ | — | $ | (280 | ) | |||||||||
|
Included in earnings in “Selling, general and administrative expense”
|
$ | — | $ | — | $ | — | $ | (41 | ) | $ | (500 | ) | ||||||||
Fair Value of Other Financial Instruments
The estimated fair value of the Company’s other financial instruments was determined using available market information or other appropriate valuation methodologies. However, considerable judgment is required in interpreting this data to develop estimates of fair value. Consequently, the estimates are not necessarily indicative of the amounts that could be realized or would be paid in a current market exchange.
Cash and cash equivalents, restricted cash—short-term, certificates of deposit, prepaid expenses, other current assets, advances from customers, dividends payable, due to IDT Corporation and other current liabilities.
At December 31, 2013 and 2012, the carrying amount of these assets and liabilities approximated fair value because of the short period to maturity. The fair value estimates for cash, cash equivalents and restricted cash—short-term were classified as Level 1 and certificates of deposit, prepaid expenses, other current assets, advances from customers, dividends payable, due to IDT Corporation and other current liabilities were classified as Level 2 of the fair value hierarchy.
Restricted cash—long-term.
At December 31, 2013 and 2012, the carrying amount of restricted cash—long-term approximated fair value. The fair value was estimated based on the anticipated cash flows once the restrictions are removed, which was classified as Level 3 of the fair value hierarchy.
Other assets and other liabilities.
At December 31, 2013 and 2012, other assets included an aggregate of $0.9 million and $0.7 million, respectively, in notes receivable from employees. The carrying amounts of the notes receivable and other liabilities approximated fair value. The fair values of the notes receivable and other liabilities were estimated based on the Company’s assumptions, and were classified as Level 3 of the fair value hierarchy.
F-19
GENIE ENERGY LTD.
NOTES TO CONSOLIDATED FINANCIAL STATEMENTS—(Continued)
The primary risk managed by the Company using derivative instruments is commodity price risk, which is
accounted for in accordance with ASC 815.
Natural gas and electricity futures contracts, swaps and put and call options are entered into
as hedges against unfavorable fluctuations in market prices of natural gas and electricity. The Company does not apply hedge accounting to these contracts and options, therefore the changes in fair value are recorded in earnings.
By using derivative instruments to mitigate exposures to changes in commodity prices, the Company exposes itself to credit risk and market risk. Credit risk is the failure of the counterparty to perform under the terms of the derivative contract. When the fair value of a derivative contract is positive, the counterparty owes the Company, which creates credit risk. The Company minimizes the credit or repayment risk in derivative instruments by entering into transactions with high-quality counterparties, primarily BP Energy Company.
At December 31, 2013 and 2012, IDT Energy’s contracts and options were traded on the New York Mercantile Exchange or were over-the-counter bilateral agreements with BP Energy Company.
The summarized volume of IDT Energy’s outstanding contracts and options as of December 31, 2013 was as follows (MWh – Megawatt hour; Dth – Decatherm):
|
Commodity
|
Settlement Dates
|
Volume
|
||
|
Electricity
|
January 2014
|
35,200 MWh
|
||
|
Electricity
|
February 2014
|
72,000 MWh
|
||
|
Electricity
|
July 2014
|
52,800 MWh
|
||
|
Electricity
|
August 2014
|
50,400 MWh
|
||
|
Electricity
|
September 2014
|
16,800 MWh
|
||
|
Natural gas
|
January 2014
|
625,000 Dth
|
||
|
Natural gas
|
February 2014
|
1,345,000 Dth
|
||
|
Natural gas
|
March 2014
|
225,000 Dth
|
||
|
Natural gas
|
July 2014
|
77,500 Dth
|
The fair value of outstanding derivative instruments recorded as assets in the accompanying consolidated balance sheets were as follows:
|
December 31
(in thousands)
|
2013
|
2012
|
|||||||
|
Asset Derivatives
|
Balance Sheet Location
|
||||||||
|
Derivatives not designated or not qualifying as hedging instruments:
|
|||||||||
|
Energy contracts and options
|
Other current assets
|
$ | 1,682 | $ | 308 | ||||
The fair value of outstanding derivative instruments recorded as liabilities in the accompanying consolidated balance sheets were as follows:
|
December 31
(in thousands)
|
2013
|
2012
|
|||||||
|
Liability Derivatives
|
Balance Sheet Location
|
||||||||
|
Derivatives not designated or not qualifying as hedging instruments:
|
|||||||||
|
Energy contracts and options
|
Other current liabilities
|
$ | 385 | $ | 152 | ||||
The effects of derivative instruments on the consolidated statements of operations were as follows:
|
Amount of Gain (Loss) Recognized on Derivatives
|
|||||||||||||||||||||
|
(in thousands)
|
Year ended December 31, 2013
|
Year ended December 31, 2012
|
Five Months
ended
December
31,
2011
|
Year ended
July 31,
2011
|
Five Months
ended
December 31,
2010
(Unaudited)
|
||||||||||||||||
|
Location of Gain (Loss) Recognized on Derivatives
|
|||||||||||||||||||||
|
Derivatives not designated or not qualifying as hedging instruments:
|
|||||||||||||||||||||
|
Energy contracts and options
|
Direct cost of revenues
|
$ | 1,177 | $ | (258 | ) | $ | (1,326 | ) | $ | 151 | $ | 104 | ||||||||
|
GOGAS warrants
|
Selling, general and administrative expense
|
— | — | 41 | (41 | ) | — | ||||||||||||||
|
GOGAS stock option
|
Other (expense) income, net
|
— | — | 60 | (86 | ) | — | ||||||||||||||
|
GEIC stock option
|
Other (expense) income, net
|
— | — | — | — | (280 | ) | ||||||||||||||
|
Total
|
$ | 1,177 | $ | (258 | ) | $ | (1,225 | ) | $ | 24 | $ | (176 | ) | ||||||||
F-20
GENIE ENERGY LTD.
NOTES TO CONSOLIDATED FINANCIAL STATEMENTS—(Continued)
On October 31, 2011, MF Global, the Company’s former
clearing broker,
filed for bankruptcy protection. On that date, IDT Energy held $1.65 million of cash on deposit with MF Global in support of hedging positions related to IDT Energy’s commodity supply. Assets held by MF Global were
placed under the control of the court appointed bankruptcy trustee to be released as deemed appropriate. In November 2011, the Company
transferred its hedging securities to an alternative clearing broker. In October 2011, the Company recognized a
$0.45 million loss, relating to its cash deposit with MF Global, based on management’s best estimate of the unrecoverable amount. In November 2012, the Company received $0.6 million from a sale of the amount due from MF Global and recognized a gain of $0.3 million.
The following is a summary of marketable securities:
|
(in thousands)
|
Amortized
Cost
|
Gross
Unrealized
Gains
|
Gross
Unrealized
Losses
|
Fair Value
|
||||||||||||
|
Available-for-sale securities:
|
||||||||||||||||
|
December 31, 2013:
|
||||||||||||||||
|
Marketable securities
|
$ | — | $ | — | $ | — | $ | — | ||||||||
|
December 31, 2012:
|
||||||||||||||||
|
Corporate debt securities
|
$ | 10,500 | $ | 35 | $ | (50 | ) | $ | 10,485 | |||||||
Proceeds from maturities of available-for-sale securities in the years ended December 31, 2013 and 2012 were $10.4 million and $1.0 million, respectively. There were no realized gains or losses from sales of available-for-sale securities in the years ended December 31, 2013 and 2012. The Company did not have any marketable securities in the five months ended December 31, 2011 and 2010 (unaudited) and the year ended July 31, 2011.
The following available-for-sale securities were in an unrealized loss position for which other-than-temporary impairments had not been recognized:
|
(in thousands)
|
Unrealized
Losses
|
Fair
Value
|
||||||
|
December 31, 2012:
|
||||||||
|
Corporate debt securities
|
$ | 50 | $ | 2,500 | ||||
At December 31, 2012, there were no securities in a continuous unrealized loss position for 12 months or longer.
AMSO, LLC holds a research, develop and demonstration lease awarded by the U.S. Bureau of Land Management that covers an area of 160 acres in western Colorado (the “RD&D Lease”). The RD&D Lease runs for a ten-year period beginning on January 1, 2007, and is subject to an extension of up to five years if AMSO, LLC can demonstrate that a process leading to the production of commercial quantities of shale oil is diligently being pursued. If AMSO, LLC can demonstrate the economic and environmental viability of its technology, it will have the opportunity to submit a one-time payment pursuant to the applicable regulations and convert its RD&D Lease to a commercial lease on 5,120 acres, which overlap and are contiguous with the 160 acres in its RD&D Lease. (The acreage numbers that appear in this paragraph are unaudited).
In March 2009, a subsidiary of TOTAL S.A. (“Total”) acquired a 50% interest in AMSO, LLC in exchange for cash paid to the Company of $3.2 million and Total’s commitment to fund the majority of AMSO, LLC’s research, development and demonstration expenditures as well as certain other funding commitments. Immediately prior to this transaction, all owners of equity interests in AMSO, LLC other than AMSO exchanged their ownership interest for a proportionate share of a 1% override on AMSO, LLC’s future revenue. Following the transaction with Total, AMSO and Total each owned a 50% interest in AMSO, LLC. While AMSO is the operator of the project during the RD&D phase, Total will provide a majority of the funding during the RD&D phase, and technical and financial assistance throughout the RD&D and commercial stages. Total will lead the planning of the commercial development and will assume management responsibilities during the subsequent commercial phase.
AMSO agreed to fund AMSO, LLC’s expenditures as follows: 20% of the initial $50 million of expenditures, 35% of the next $50 million in approved expenditures and 50% of approved expenditures in excess of $100 million. AMSO also agreed to fund 40% of the costs of the one-time payment for conversion of AMSO, LLC’s RD&D Lease to a commercial lease, in the event AMSO, LLC’s application for conversion is approved. The remaining amounts are to be funded by Total. As of December 31, 2013, the cumulative contributions of AMSO and Total to AMSO, LLC were $69.0 million. Through December 31, 2011, AMSO was allocated 20% of the net loss of AMSO, LLC. AMSO’s allocated share of the net loss of AMSO, LLC increased in December 2011 from 20% to 35%, per the agreement with Total. AMSO’s allocated share of the net loss of AMSO, LLC is included in “Equity in the net loss of AMSO, LLC” in the accompanying consolidated statements of operations.
F-21
GENIE ENERGY LTD.
NOTES TO CONSOLIDATED FINANCIAL STATEMENTS—(Continued)
AMSO has the right to decide whether or not to fund its shares of each capital call issued by AMSO, LLC. AMSO did not fund the capital call for the first quarter of 2014, and in January 2014, Total funded AMSO’s share, which was $0.9 million. Because of AMSO’s decision not to fund its share, AMSO’s ownership interest in AMSO, LLC was reduced to 48.16% and Total’s ownership interest increased to 51.84%. In addition, AMSO’s share of future funding of AMSO, LLC up to a cumulative $100 million was reduced to 33.7% and Total’s share increased to 66.3%. AMSO’s share of AMSO, LLC’s approved budget for the year ending December 31, 2014 was $3.2 million. AMSO is evaluating its options with respect to funding AMSO, LLC during 2014, and funding of less than its full share would result in further dilution of its interest in AMSO, LLC.
The agreements with Total provide for varying consequences for AMSO’s failure to fund its share at different stages of the project, including dilution of AMSO’s interest in AMSO, LLC or paying interest to Total for expenditures they fund on behalf of AMSO. Either Total or AMSO may terminate its obligations to make capital contributions and withdraw as a member of AMSO, LLC. Even if AMSO were to withdraw its interest in AMSO, LLC, it will remain liable for its share of expenditures for safety and environmental reclamation related to events occurring prior to its withdrawal.
The Company accounts for its ownership interest in AMSO, LLC using the equity method since the Company has the ability to exercise significant influence over its operating and financial matters, although it does not control AMSO, LLC. AMSO, LLC is a variable interest entity, however, the Company has determined that it is not the primary beneficiary, as the Company does not have the power to direct the activities of AMSO, LLC that most significantly impact AMSO, LLC’s economic performance.
The following table summarizes the change in the balance of the Company’s investment in AMSO, LLC:
|
(in thousands)
|
Year ended
December 31,
2013
|
Year ended
December 31,
2012
|
Five Months ended
December 31,
2011
|
Year ended
July 31,
2011
|
||||||||||||
|
Balance, beginning of period
|
$ | 242 | $ | (685 | ) | $ | (630 | ) | $ | 665 | ||||||
|
Capital contributions
|
2,700 | 4,102 | 2,040 | 3,943 | ||||||||||||
|
Equity in net loss of AMSO, LLC
|
(3,194 | ) | (3,175 | ) | (2,095 | ) | (5,238 | ) | ||||||||
|
Balance, end of period
|
$ | (252 | ) | $ | 242 | $ | (685 | ) | $ | (630 | ) | |||||
At December 31, 2013, the liability for equity loss in AMSO, LLC was included in “Accrued expenses” in the consolidated balance sheet. At December 31, 2012, the investment in AMSO, LLC was included in “Other assets” in the consolidated balance sheet.
Because of AMSO’s decision not to fund its share of AMSO, LLC’s expenditures, AMSO, LLC will allocate its net loss beginning January 2014 as follows. AMSO, LLC will allocate the first $2.6 million of losses to Total, then it will allocate any remaining losses proportionately such that AMSO and Total’s capital accounts as a percentage of AMSO, LLC’s total capital equals their ownership interests.
At December 31, 2013, the Company’s maximum exposure to additional loss because of its required investment in AMSO, LLC was $3.0 million, based on
AMSO, LLC’s
2014 budget. The Company’s maximum exposure to additional loss could increase based on the situations described above. The maximum exposure at December 31, 2013 was determined as follows:
|
(in thousands)
|
||||
|
AMSO’s committed investment in AMSO, LLC based on the 2014 budget
|
$ | 3,247 | ||
|
Less: cumulative capital contributions to AMSO, LLC
|
— | |||
|
Less: liability for equity loss in AMSO, LLC at December 31, 2013
|
(252 | ) | ||
|
Maximum exposure to additional loss
|
$ | 2,995 | ||
F-22
GENIE ENERGY LTD.
NOTES TO CONSOLIDATED FINANCIAL STATEMENTS—(Continued)
Summarized balance sheets of AMSO, LLC are as follows:
|
December 31
(in thousands)
|
2013
|
2012
|
||||||
|
ASSETS
|
||||||||
|
Cash and cash equivalents
|
$ | 883 | $ | 2,171 | ||||
|
Other current assets
|
141 | 69 | ||||||
|
Equipment, net
|
36 | 53 | ||||||
|
Other assets
|
— | 805 | ||||||
|
TOTAL ASSETS
|
$ | 1,060 | $ | 3,098 | ||||
|
LIABILITIES AND MEMBERS’ INTERESTS
|
||||||||
|
Current liabilities
|
$ | 1,024 | $ | 1,649 | ||||
|
Other liabilities
|
644 | 644 | ||||||
|
Members’ interests
|
(608 | ) | 805 | |||||
|
TOTAL LIABILITIES AND MEMBERS’ INTERESTS
|
$ | 1,060 | $ | 3,098 | ||||
Summarized statements of operations of AMSO, LLC are as follows:
|
(in thousands)
|
Year ended
December 31,
2013
|
Year ended
December 31,
2012
|
Five Months
ended
December 31,
2011
|
Year ended
July 31,
2011
|
Five Months
ended
December 31,
2010
(Unaudited)
|
|||||||||||||||
|
REVENUES
|
$ | — | $ | — | $ | — | $ | — | $ | — | ||||||||||
|
OPERATING EXPENSES:
|
||||||||||||||||||||
|
General and administrative
|
566 | 507 | 248 | 767 | 336 | |||||||||||||||
|
Research and development
|
8,601 | 8,563 | 9,156 | 25,423 | 7,955 | |||||||||||||||
|
TOTAL OPERATING EXPENSES
|
9,167 | 9,070 | 9,404 | 26,190 | 8,291 | |||||||||||||||
|
Loss from operations
|
(9,167 | ) | (9,070 | ) | (9,404 | ) | (26,190 | ) | (8,291 | ) | ||||||||||
|
Other income (expense)
|
41 | — | — | (1 | ) | — | ||||||||||||||
|
NET LOSS
|
$ | (9,126 | ) | $ | (9,070 | ) | $ | (9,404 | ) | $ | (26,191 | ) | $ | (8,291 | ) | |||||
|
December 31
(in thousands
)
|
2013
|
2012
|
||||||
|
Computer software and development
|
$ | 516 | $ | 340 | ||||
|
Computers and computer hardware
|
264 | 220 | ||||||
|
Laboratory equipment
|
411 | 383 | ||||||
|
Office equipment and other
|
228 | 237 | ||||||
| 1,419 | 1,180 | |||||||
|
Less accumulated depreciation
|
(858 | ) | (771 | ) | ||||
|
Property and equipment, net
|
$ | 561 | $ | 409 | ||||
As of April 23, 2012, the Company and IDT Energy entered into a Loan Agreement with JPMorgan Chase Bank for a revolving line of credit for up to a maximum principal amount of $25.0 million. On April 30, 2013, the Loan Agreement was modified to extend the maturity date from April 30, 2013 to April 30, 2014. The proceeds from the line of credit may be used to provide working capital and for the issuance of letters of credit. The Company agreed to deposit cash in a money market account at JPMorgan Chase Bank as collateral for the line of credit equal to the greater of (a) $10.0 million or (b) the sum of the amount of letters of credit outstanding plus the outstanding principal under the revolving note. The Company is not permitted to withdraw funds or exercise any authority over the required balance in the collateral account. The principal outstanding will bear interest at the lesser of (a) the LIBOR rate multiplied by the statutory reserve rate established by the Board of Governors of the Federal Reserve System plus 1.0% per annum, or (b) the maximum rate per annum permitted by whichever of applicable federal or Texas laws permit the higher interest rate. Interest is payable at least every three months and all outstanding principal and any accrued and unpaid interest is due on the maturity date. The Company pays a quarterly unused commitment fee of 0.08% per annum on the difference between $25.0 million and the average daily outstanding principal balance of the note. In addition, as of April 23, 2012, GEIC issued a Corporate Guaranty to JPMorgan Chase Bank whereby GEIC unconditionally guarantees the full payment of all indebtedness of the Company and IDT Energy under the Loan Agreement. At December 31, 2013 and 2012, there were no amounts borrowed under the line of credit, and cash collateral of $10.0 million was included in “Restricted cash—short-term” in the consolidated balance sheet. In addition, at December 31, 2013 and 2012, letters of credit of $5.7 million and nil, respectively, were outstanding.
F-23
GENIE ENERGY LTD.
NOTES TO CONSOLIDATED FINANCIAL STATEMENTS—(Continued)
The components of (loss) income before income taxes are as follows:
|
(in thousands)
|
Year ended
December 31,
2013
|
Year ended
December 31,
2012
|
Five Months
ended
December 31,
2011
|
Year ended
July 31,
2011
|
Five Months
ended
December 31,
2010
(Unaudited)
|
|||||||||||||||
|
Domestic
|
$ | 9,467 | $ | 10,544 | $ | 2,603 | $ | 13,310 | $ | 7,721 | ||||||||||
|
Foreign
|
(12,053 | ) | (10,149 | ) | (2,255 | ) | (8,920 | ) | (2,624 | ) | ||||||||||
|
(LOSS) INCOME BEFORE INCOME TAXES
|
$ | (2,586 | ) | $ | 395 | $ | 348 | $ | 4,390 | $ | 5,097 | |||||||||
Significant components of the Company’s deferred income tax assets consist of the following:
|
December 31
(in thousands)
|
2013
|
2012
|
||||||
|
Deferred income tax assets:
|
||||||||
|
Bad debt reserve
|
$ | 381 | $ | 54 | ||||
|
Accrued expenses
|
3,454 | 2,330 | ||||||
|
State taxes
|
56 | 359 | ||||||
|
Charitable contributions
|
219 | 71 | ||||||
|
Net operating loss
|
9,534 | 7,084 | ||||||
|
Stock options and restricted stock
|
2,793 | 1,464 | ||||||
|
Depreciation
|
1,056 | 1,098 | ||||||
|
Total deferred income tax assets
|
17,493 | 12,460 | ||||||
|
Valuation allowance
|
(16,653 | ) | (11,861 | ) | ||||
|
DEFERRED INCOME TAX ASSETS, NET
|
$ | 840 | $ | 599 | ||||
Subsequent to the Spin-Off, the Company initiated a tax strategy that enables the Company to deduct losses from its foreign subsidiaries against its profitable U.S. operations. Because of this strategy, the decrease in pre-tax earnings of IDT Energy in 2012, and the Company’s current projections, the Company concluded that it no longer met the criteria of more likely than not in order to utilize its deferred federal income tax assets in the foreseeable future. Accordingly, in 2012, the Company recorded a valuation allowance against its deferred federal income tax assets and only the state portion of IDT Energy deferred tax assets are reflected.
The provision for income taxes consists of the following:
|
(in thousands)
|
Year ended
December 31,
2013
|
Year ended
December 31,
2012
|
Five Months
ended
December 31,
2011
|
Year ended
July 31,
2011
|
Five Months
ended
December 31,
2010
(Unaudited)
|
|||||||||||||||
|
Current:
|
||||||||||||||||||||
|
Federal
|
$ | 1,112 | $ | — | $ | 392 | $ | 4,869 | $ | 3,191 | ||||||||||
|
State and local
|
1,891 | (1,312 | ) | 735 | 2,760 | 990 | ||||||||||||||
|
Foreign
|
(7 | ) | — | — | — | — | ||||||||||||||
| 2,996 | (1,312 | ) | 1,127 | 7,629 | 4,181 | |||||||||||||||
|
Deferred:
|
||||||||||||||||||||
|
Federal
|
— | 3,773 | (392 | ) | (198 | ) | — | |||||||||||||
|
State and local
|
(241 | ) | 469 | (119 | ) | (486 | ) | — | ||||||||||||
|
Foreign
|
— | — | — | — | — | |||||||||||||||
| (241 | ) | 4,242 | (511 | ) | (684 | ) | — | |||||||||||||
|
PROVISION FOR INCOME TAXES
|
$ | 2,755 | $ | 2,930 | $ | 616 | $ | 6,945 | $ | 4,181 | ||||||||||
The differences between income taxes expected at the U.S. federal statutory income tax rate and income taxes provided are as follows:
|
(in thousands)
|
Year ended
December 31,
2013
|
Year ended
December 31,
2012
|
Five Months
ended
December 31,
2011
|
Year ended
July 31,
2011
|
Five Months
ended
December 31,
2010
(Unaudited)
|
|||||||||||||||
|
U.S. federal income tax at statutory rate
|
$ | (904 | ) | $ | 138 | $ | 122 | $ | 1,537 | $ | 1,784 | |||||||||
|
Valuation allowance
|
2,447 | 4,711 | — | — | — | |||||||||||||||
|
Foreign tax rate differential
|
48 | 41 | 74 | 3,122 | 918 | |||||||||||||||
|
Other
|
66 | 4 | 20 | 804 | 835 | |||||||||||||||
|
State and local income tax, net of federal benefit
|
1,098 | (1,964 | ) | 400 | 1,482 | 644 | ||||||||||||||
|
PROVISION FOR INCOME TAXES
|
$ | 2,755 | $ | 2,930 | $ | 616 | $ | 6,945 | $ | 4,181 | ||||||||||
F-24
GENIE ENERGY LTD.
NOTES TO CONSOLIDATED FINANCIAL STATEMENTS—(Continued)
At December 31, 2013, the Company had U.S. federal and state net operating loss carry-forwards of approximately $4.9 million and $37.8 million, respectively. These carry-forward losses are available to offset future U.S. federal and state taxable income. The federal net operating loss carry-forwards will start to expire in 2032, with the year ended December 31, 2013’s loss expiring in 2034. The state net operating loss carry-forwards will start to expire in 2028, with the year ended December 31, 2013’s loss expiring in 2034.
At December 31, 2013, the Company had foreign net operating loss carry-forwards of approximately $30.1 million, of which $29.9 million will not expire. This carry-forward loss is available to offset future foreign taxable income.
The change in the valuation allowance for deferred income taxes was as follows:
|
(in thousands)
|
Balance at
beginning of
period
|
Additions
charged to
costs and
expenses
|
Deductions
|
Balance at
end of period
|
||||||||||||
|
Year ended December 31, 2013
|
||||||||||||||||
|
Reserves for valuation allowances deducted from deferred income taxes, net
|
$ | 11,861 | $ | 4,792 | $ | — | $ | 16,653 | ||||||||
|
Year ended December 31, 2012
|
||||||||||||||||
|
Reserves for valuation allowances deducted from deferred income taxes, net
|
$ | 6,523 | $ | 5,338 | $ | — | $ | 11,861 | ||||||||
|
Five months ended December 31, 2011
|
||||||||||||||||
|
Reserves for valuation allowances deducted from deferred income taxes, net
|
$ | 6,522 | $ | 1 | $ | — | $ | 6,523 | ||||||||
|
Year ended July 31, 2011
|
||||||||||||||||
|
Reserves for valuation allowances deducted from deferred income taxes, net
|
$ | 4,391 | $ | 2,131 | $ | — | $ | 6,522 | ||||||||
The table below summarizes the change in the balance of unrecognized income tax benefits:
|
(in thousands)
|
Year ended
December 31,
2013
|
Year ended
December 31,
2012
|
Five Months
ended
December 31,
2011
|
Year ended
July 31,
2011
|
Five Months
ended
December 31,
2010
(Unaudited)
|
|||||||||||||||
|
Balance at beginning of period
|
$ | 223 | $ | 2,507 | $ | 2,340 | $ | 1,050 | $ | 1,050 | ||||||||||
|
Additions based on tax positions related to the current period
|
— | 89 | 167 | 979 | 90 | |||||||||||||||
|
Additions for tax positions of prior periods
|
319 | — | — | 311 | — | |||||||||||||||
|
Reductions for tax positions of prior periods
|
— | — | — | — | — | |||||||||||||||
|
Settlements
|
— | (2,373 | ) | — | — | — | ||||||||||||||
|
Lapses of statutes of limitations
|
— | — | — | — | — | |||||||||||||||
|
Balance at end of period
|
$ | 542 | $ | 223 | $ | 2,507 | $ | 2,340 | $ | 1,140 | ||||||||||
All of the unrecognized income tax benefits at December 31, 2013 and 2012 would have affected the Company’s effective income tax rate if recognized. The Company does not expect the total amount of unrecognized tax benefits to significantly increase or decrease within the next twelve months.
In the years ended December 31, 2013 and 2012, the year ended July 31, 2011, and the five months ended December 31, 2011 and 2010 (Unaudited), the Company recorded interest on income taxes of nil, nil, $0.2 million, $0.1 million and nil, respectively. As of December 31, 2013 and 2012, accrued interest included in current income taxes payable was nil and nil, respectively.
The Company currently remains subject to examinations of its tax returns as follows: U.S. federal tax returns for fiscal 2009 to calendar 2013, state and local tax returns generally for fiscal 2008 to calendar 2013 and foreign tax returns generally for fiscal 2008 to calendar 2013.
Class A Common Stock and Class B Common Stock
The rights of holders of Class A common stock and Class B common stock are identical except for certain voting and conversion rights and restrictions on transferability. The holders of Class A common stock and Class B common stock receive identical dividends per share when and if declared by the Company’s Board of Directors. In addition, the holders of Class A common stock and Class B common stock have identical and equal priority rights per share in liquidation. The Class A common stock and Class B common stock do not have any other contractual participation rights. The holders of Class A common stock are entitled to three votes per share and the holders of Class B common stock are entitled to one-tenth of a vote per share. Each share of Class A common stock may be converted into one share of Class B common stock, at any time, at the option of the holder. Shares of Class A common stock are subject to certain limitations on transferability that do not apply to shares of Class B common stock.
F-25
GENIE ENERGY LTD.
NOTES TO CONSOLIDATED FINANCIAL STATEMENTS—(Continued)
Series 2012-A Preferred Stock
Each share of Series 2012-A Preferred Stock (the “Preferred Stock”) has a liquidation preference of $8.50 (the "Liquidation Preference"), and is entitled to receive an annual dividend per share equal to the sum of (i) $0.6375 (the "Base Dividend") plus (ii) seven and one-half percent (7.5%) of the quotient obtained by dividing (A) the amount by which the EBITDA for a fiscal year of the Company's retail energy provider business exceeds $32 million by (B) 8,750,000 (the "Additional Dividend"), payable in cash. The Preferred Stock is redeemable, in whole or in part, at the option of the Company following October 11, 2016. The redemption price for the Preferred Stock is 101% of the Liquidation Preference plus all accrued and unpaid dividends between October 11, 2016 and October 11, 2017, and 100% of the Liquidation Preference plus all accrued and unpaid dividends thereafter. EBITDA consists of income (loss) from operations exclusive of depreciation and amortization and other operating gains (losses).
During any period when the Company has failed to pay a dividend on the Preferred Stock and until all unpaid dividends have been paid in full, the Company is prohibited from paying dividends or distributions on the Company's Class B or Class A common stock.
The Base Dividend is payable (if declared by the Company's Board of Directors, and accrued, if not declared) quarterly on each February 15, May 15, August 15 and November 15, and to the extent that there is any Additional Dividend payable with respect to a fiscal year, it will be paid to holders of Preferred Stock with the May dividend. With respect to the payment of dividends and amounts upon liquidation, dissolution or winding up, the Preferred Stock is equal in rank to all other equity securities the Company issues, the terms of which specifically provide that such equity securities rank on a parity with the Preferred Stock with respect to dividend rights or rights upon the Company's liquidation, dissolution or winding up; senior to the Company's common stock; and junior to all of the Company's existing and future indebtedness.
Each share of Preferred Stock has the same voting rights as a share of Class B common stock, except on certain matters that only impact the Company's common stock, as well as additional voting rights on specific matters or upon the occurrence of certain events.
Dividend Payments
On January 5, 2012, the Company paid a cash dividend of $0.05 per share to stockholders of record at the close of business on December 22, 2011 of the Company’s Class A common stock and Class B common stock. On April 3, 2012, the Company paid a cash dividend of $0.033 per share to stockholders of record at the close of business on March 26, 2012 of the Company’s Class A common stock and Class B common stock. The dividend paid on April 3, 2012 was for the two-month period of November and December 2011 that represented the period between the end of the Company’s prior fiscal quarter and the beginning of the new fiscal quarter in connection with the change in the Company’s fiscal year to a calendar year, and represented a pro-rated dividend of 2/3rd of the normal quarterly dividend. On May 30, 2012, the Company paid a cash dividend of $0.05 per share to stockholders of record at the close of business on May 21, 2012 of the Company’s Class A and Class B common stock. On August 28, 2012, the Company paid a cash dividend of $0.05 per share to stockholders of record at the close of business on August 20, 2012 of the Company’s Class A and Class B common stock. The aggregate dividends declared in the year ended December 31, 2012 and the five months ended December 31, 2011 were $3.1 million and $1.1 million, respectively, and the aggregate dividends paid in the year ended December 31, 2012 were $4.2 million. In connection with the completion of the exchange offer and issuance of the Preferred Stock (see below), the Company has suspended payment of dividends on its Class A and Class B common stock for the foreseeable future. Accordingly, no dividends were declared or paid in 2013.
On February 15, 2013, the Company paid a pro-rated Base Dividend of $0.1317 per share on the Preferred Stock for the fourth quarter of 2012. On May 15, 2013, August 15, 2013, November 15, 2013 and on February 14, 2014, the Company paid a quarterly Base Dividend of $0.1594 per share on the Preferred Stock for the four quarters of 2013. The aggregate dividends declared and paid on the Preferred Stock in the year ended December 31, 2013 were $1.1 million.
Stock Repurchase Program
On March 11, 2013, the Board of Directors of the Company approved a stock repurchase program for the repurchase of up to an aggregate of 7 million shares of the Company’s Class B common stock. At December 31, 2013, no repurchases had been made and 7 million shares remained available for repurchase under the stock repurchase program.
Exchange Offers and Issuances of Preferred Stock
On August 2, 2012, the Company initiated an offer to exchange up to 8.75 million outstanding shares of its Class B common stock for the same number of shares of its Preferred Stock. The offer expired on October 10, 2012. On October 17, 2012, the Company issued 1,604,591 shares of its newly designated Preferred Stock in exchange for an equal number of shares of Class B common stock tendered in the exchange offer.
On November 26, 2012, the Company initiated an offer to exchange up to 7.15 million outstanding shares of its Class B common stock for the same number of shares of its Preferred Stock. The offer expired on March 5, 2013. On March 11, 2013, the Company issued 313,376 shares of its Preferred Stock in exchange for an equal number of shares of Class B common stock tendered in the exchange offer.
F-26
GENIE ENERGY LTD.
NOTES TO CONSOLIDATED FINANCIAL STATEMENTS—(Continued)
Sales of Equity of Subsidiaries
Per the terms of his employment agreement, Dr. Harold Vinegar, Chief Scientist of the Company (“Vinegar”), has an option to purchase, at fair value, up to 10% of the GOGAS ventures in which he is a key contributor:
|
•
|
In November 2008, Vinegar purchased a 10% interest in IEI.
|
|
•
|
In October 2013, the Company completed the sale of 9.5% of the equity in Afek to Vinegar as per the terms of his employment agreement.
|
|
•
|
In November 2013, the Company completed the sale of 9.8% of the equity in Genie Mongolia to Vinegar as per the terms of his employment agreement.
|
In connection with Vinegar’s November 2008 purchase of a 10% interest in IEI, the purchase agreement included certain no cost anti-dilution protection as follows. If IEI issues certain of its shares in order to raise capital until the capitalization of IEI equals $20 million, IEI shall issue to Vinegar additional shares to maintain his 10% interest in IEI. In December 2013, IEI converted its intercompany payable to GOGAS into preferred stock. Pursuant to the anti-dilution protection, IEI issued shares of its preferred stock to Vinegar equal to 10% of $20 million or $2.0 million, which the Company recorded as an increase in “Noncontrolling interests” and a corresponding decrease in “Additional paid-in capital”.
In June 2011, in a refinement of the terms of the initial investment and the rights associated with that investment, Michael Steinhardt, the Chairman of the Board of IEI, exchanged his interest in GEIC (including an option to purchase additional interests) for a corresponding 2.5% interest (including options) in GOGAS. In addition, Mr. Steinhardt arranged for the Company and IDT to receive certain consulting services from a third party. In return, the Steinhardt stockholder entity was paid $1.7 million. The GOGAS stock option was issued in June 2011 and is exercisable until April 9, 2015 at an exercise price of $5.0 million. At December 31, 2013 and 2012, the estimated fair value of the GOGAS stock option was nil. The Company accounted for the exchange of Mr. Steinhardt’s equity interest in GEIC for a corresponding equity interest in GOGAS as an equity transaction. Therefore, no gain or loss was recognized in the accompanying consolidated statement of operations.
In November 2010, GOGAS sold a 5.0% equity interest to an entity affiliated with Lord (Jacob) Rothschild for $10.0 million paid in cash. Also in November 2010, GOGAS sold a 0.5% equity interest to Rupert Murdoch for $1.0 million paid with a promissory note. The note is secured by a pledge of the shares issued in exchange for the note. The note accrues interest at 1.58% per annum, and the principal and accrued interest is due and payable on November 15, 2015. In connection with the purchase by the entity affiliated with Lord Rothschild, in November 2010, warrants were issued to purchase up to an aggregate of 1% of the common stock outstanding of GOGAS at an exercise price of up to $2 million that expired on November 12, 2011. In addition, in connection with this purchase, the entity affiliated with Lord Rothschild has a one-time option through November 12, 2017 to exchange its GOGAS shares for shares of the Company with equal fair value as determined by the parties. The number of shares issuable in such an exchange is not currently determinable.
Stock-Based Compensation Plan
The Company’s 2011 Stock Option and Incentive Plan is intended to provide incentives to executives, employees, directors and consultants of the Company. Incentives available under the 2011 Stock Option and Incentive Plan may include stock options, stock appreciation rights, limited rights, deferred stock units, and restricted stock. The plan is administered by the Compensation Committee of the Company’s Board of Directors. At December 31, 2013, the Company had 1.14 million shares of Class B common stock reserved for award under its 2011 Stock Option and Incentive Plan and 0.2 million shares were available for future grants. In addition, as a result of the Spin-Off, the Company reserved 2.5 million shares of Class B common stock for grants in connection with the equitable adjustment by IDT of certain awards previously granted by IDT.
Restricted Stock
The fair value of restricted shares of the Company’s Class B common stock is determined based on the closing price of the Company’s Class B common stock on the grant date. Share awards generally vest on a graded basis over three years of service.
F-27
GENIE ENERGY LTD.
NOTES TO CONSOLIDATED FINANCIAL STATEMENTS—(Continued)
A summary of the status of the Company’s grants of restricted shares of Class B common stock is presented below:
|
Number of
Non-vested Shares
(in thousands)
|
Weighted-
Average Grant
Date Fair
Value
|
|||||||
|
Non-vested shares at December 31, 2012
|
1,898 | $ | 2.70 | |||||
|
Granted
|
75 | 9.81 | ||||||
|
Vested
|
(1,708 | ) | 1.92 | |||||
|
Forfeited
|
— | — | ||||||
|
NON-VESTED SHARES AT DECEMBER 31, 2013
|
265 | $ | 9.74 | |||||
As of December 31, 2013, there was $1.2 million of total unrecognized compensation cost related to non-vested stock-based compensation arrangements, which is expected to be recognized over a weighted-average period of 1.2 years. The total grant date fair value of shares vested in the years ended December 31, 2013 and 2012 and the five months ended December 31, 2011 was $3.3 million, $3.0 million and $15,000, respectively. The Company recognized compensation cost related to the vesting of the restricted stock of $2.0 million and $2.1 million in the years ended December 31, 2013 and 2012, respectively, and $0.6 million in the five months ended December 31, 2011.
Effective December 12, 2013, the Company issued 63,917 restricted shares of its Class B common stock to the President of the Company. The restricted shares vest in commencing in January 2014 through January 2017. The fair value of the restricted shares on the date of the grant was $0.7 million, which will be recognized on a straight-line basis over the vesting period.
Effective January 6, 2014, the Company issued 29,126 restricted shares of its Class B common stock to Michael Stein, Senior Vice President of the Company, and son-in-law of Howard Jonas, the Chairman of the Company’s Board of Directors and Chief Executive Officer of the Company. The restricted shares vest in three equal annual installments commencing on January 5, 2015. The fair value of the restricted shares on the date of the grant was $0.3 million, which will be recognized on a straight-line basis over the vesting period.
Stock Options
Option awards are generally granted with an exercise price equal to the market price of the Company’s stock on the date of grant. Option awards generally vest on a graded basis over three years of service and have ten-year contractual terms. Expected volatility is based on historical volatility of the Company’s Class B common stock and other factors. The Company uses historical data on exercise of stock options, post vesting forfeitures and other factors to estimate the expected term of the stock-based payments granted. The risk free rate is based on the U.S. Treasury yield curve in effect at the time of grant.
On December 12, 2013, the Compensation Committee and the Board of Directors of the Company approved, subject to the approval of the Company’s stockholders, a compensation arrangement with Howard Jonas upon his appointment as the Company’s Chief Executive Officer for a five-year term that commenced on January 1, 2014. The compensation arrangement included, among other things, the grant of options to purchase 3.0 million shares of the Company’s Class B Common Stock at an exercise price of $10.30 per share. The exercise price was equal to the fair market value of the shares on the date of the grant. The options vest in five equal annual installments commencing on December 15, 2014 and expire ten years from the grant date. The estimated total value of the options on the date of the grant was $19.3 million, which will be recognized on a straight-line basis over the vesting period.
The fair value of stock options was estimated on the date of the grant using a Black-Scholes valuation model and the assumptions in the following table. No option awards were granted in the year ended December 31, 2012 or the year ended July 31, 2011.
|
Year ended
December 31,
2013
|
Five Months
ended
December 31,
2011
|
|||||||
|
ASSUMPTIONS
|
||||||||
|
Average risk-free interest rate
|
2.07% | 1.06-1.62% | ||||||
|
Expected dividend yield
|
— | — | ||||||
|
Expected volatility
|
65.6% | 67.7% | ||||||
|
Expected term
|
6.5 years
|
6.0-7.25 years
|
||||||
F-28
GENIE ENERGY LTD.
NOTES TO CONSOLIDATED FINANCIAL STATEMENTS—(Continued)
A summary of stock option activity for the Company is as follows:
|
Number of
Options
(in thousands)
|
Weighted-
Average
Exercise
Price
|
Weighted-
Average
Remaining
Contractual
Term (in years)
|
Aggregate
Intrinsic Value
(in thousands)
|
|||||||||||||
|
Outstanding at December 31, 2012
|
457 | $ | 6.85 | 8.2 | $ | 114 | ||||||||||
|
Granted
|
3,000 | 10.30 | ||||||||||||||
|
Exercised
|
(13 | ) | 6.85 | |||||||||||||
|
Cancelled / Forfeited
|
(1 | ) | 6.85 | |||||||||||||
|
OUTSTANDING AT DECEMBER 31, 2013
|
3,443 | $ | 9.86 | 7.8 | $ | 1,489 | ||||||||||
|
EXERCISABLE AT DECEMBER 31, 2013
|
126 | $ | 6.85 | 5.7 | $ | 424 | ||||||||||
The weighted-average grant date fair value of options granted by the Company during the year ended December 31, 2013 and the five months ended December 31, 2011 was $6.42 and $4.35, respectively. The total intrinsic value of options exercised during the years ended December 31, 2013 and 2012 was $29,000 and $2,000, respectively. As of December 31, 2013, there was $20.2 million of total unrecognized compensation cost related to non-vested stock options, which is expected to be recognized over a weighted-average period of 2.5 years. The Company recognized compensation cost related to the vesting of the options of $0.4 million in the years ended December 31, 2013 and 2012, and $0.1 million in the five months ended December 31, 2011.
In order to equitably adjust the value of the options to purchase IDT Class B common stock that were outstanding on the Spin-Off date, IDT proportionately reduced the exercise price of each such option based on the trading price of IDT following the Spin-Off. Further, each option holder shared ratably in a pool of 50,000 newly issued options to purchase shares of the Company’s Class B common stock with an exercise price of $6.85 equal to the market value on the issuance date and an expiration date equal to the expiration of the corresponding IDT options held by such option holder. The adjustment to the exercise price of the options to purchase IDT shares and the issuance of the 50,000 options to purchase the Company’s shares were accounted for as a modification. No incremental charge was required as a result of the modification.
Restricted Stock Granted by IDT Corporation
In the year ended July 31, 2011, stock-based compensation cost of $0.8 million was included in “Selling, general and administrative expense” in the consolidated statements of operations, relating to restricted stock granted by IDT Corporation to employees of the Company.
Grants of Equity of Subsidiaries
In the year ended July 31, 2010, GEIC granted common stock representing 0.5% of its outstanding shares at the time to a consultant for consulting services provided through April 30, 2011. The share award vested over the related service period. In the year ended July 31, 2011, the Company recorded stock-based compensation of $0.3 million.
On October 21, 2009, Mr. James A. Courter, IDT’s former Chief Executive Officer, received from IDT a grant of 0.3 million restricted shares of IDT’s Class B common stock. All of the restricted shares vested on the date of grant. Pursuant to a Warrant to Purchase Common Stock executed by IDT and Mr. Courter, Mr. Courter has the right to exchange shares of IDT’s Class B common stock for up to 1,000 shares of GEIC common stock. The exchange ratio is 225.13 shares of IDT’s Class B common stock for one share of GEIC common stock. The Warrant expires on October 21, 2014.
On March 28, 2012, the Compensation Committee of the Company’s Board of Directors approved the grant of equity interests in certain subsidiaries of the Company to Howard Jonas. The Compensation Committee approved the following grants to Mr. Jonas: (1) deferred stock units for shares of common stock of IDT Energy representing 2.5% of the equity in IDT Energy on a fully diluted basis, (2) ordinary shares of IEI representing 0.25% of the equity in IEI on a fully diluted basis, (3) ordinary shares of Afek representing 0.30% of the equity in Afek on a fully diluted basis, and (4) shares representing 0.25% of the equity in Genie Mongolia. In addition, the Compensation Committee approved grants of interests representing 1.13% of the equity in IDT Energy, 1.4% of the equity in IEI, 1.4% of the equity in Afek and 2.2% of the equity in Genie Mongolia to certain of the Company’s officers and employees. In May 2013, the Company granted 1.0% of the equity in IEI to certain employees of the Company. On November 4, 2013, the Company’s Board of Directors approved the grant of 1.0% of the equity in Genie Mongolia to Michael Jonas, Executive Vice President of GOGAS, and the executive managing the Company’s business in Mongolia. Michael Jonas is also the son of Howard Jonas. The fair value of these grants of equity interests on the date of the grant was estimated to be $5.4 million, which will be recognized over the vesting periods that ends at various dates through July 2017. The fair value of the equity interests granted was estimated based on discounted cash flows of the subsidiaries that granted the equity awards, as well as other valuation techniques, as applicable. The unrecognized compensation cost relating to these grants of equity interests at December 31, 2013 was $2.7 million, which is expected to be recognized over a weighted-average period of 1.0 year. The Company recognized compensation cost related to the vesting of these equity interests of $1.8 million and $0.9 million in the years ended December 31, 2013 and 2012, respectively.
F-29
GENIE ENERGY LTD.
NOTES TO CONSOLIDATED FINANCIAL STATEMENTS—(Continued)
The Company elected to exchange vested deferred stock units of IDT Energy previously granted to employees and directors of the Company for shares of the Company’s Class B common stock upon the vesting of the deferred stock units based on the relative fair value of the shares exchanged. Accordingly, in August 2013, the Company issued 133,758 shares of the Company’s Class B common stock in exchange for 23.6 vested deferred stock units of IDT Energy.
In 2011, an employee of IDT, until his employment was terminated effective December 30, 2011, incorporated Citizens Choice Energy, LLC (“CCE”), which is a REP that resells electricity and natural gas to residential and small business customers in the State of New York. Tari Corporation (“Tari”) is the sole owner of CCE. In addition, DAD Sales, LLC (“DAD”), which is 100% owned by Tari, used its network of door-to-door sales agents to obtain customers for CCE. In December 2012, DAD ceased to acquire customers for CCE. The Company provided CCE, DAD and Tari with substantially all of the cash required to fund their operations. The Company determined that at the present time it has the power to direct the activities of CCE, DAD and Tari that most significantly impact their economic performance and it has the obligation to absorb losses of CCE, DAD and Tari that could potentially be significant to CCE, DAD and Tari on a stand-alone basis. The Company therefore determined that it is the primary beneficiary of CCE, DAD and Tari, and as a result, the Company consolidates CCE, DAD and Tari within its IDT Energy segment. The Company does not own any interest in CCE, DAD or Tari and thus the net income or loss incurred by CCE, DAD and Tari was attributed to noncontrolling interests in the accompanying consolidated statements of operations.
Net income (loss) of CCE, DAD and Tari and aggregate net funding repaid to (provided by) the Company to CCE, DAD and Tari in order to finance their operations were as follows:
|
(in thousands)
|
Year ended
December 31,
2013
|
Year ended
December 31,
2012
|
Five Months
ended
December 31,
2011
|
Year ended
July 31,
2011
|
Five Months
ended
December 31,
2010
(Unaudited)
|
|||||||||||||||
|
Net income (loss):
|
||||||||||||||||||||
|
CCE
|
$ | 2,080 | $ | 1,857 | $ | (235 | ) | $ | (2,041 | ) | $ | — | ||||||||
|
DAD
|
(67 | ) | (327 | ) | (477 | ) | (263 | ) | — | |||||||||||
|
Tari
|
52 | 161 | — | (3 | ) | — | ||||||||||||||
|
Aggregate funding repaid to (provided by) the Company, net
|
4,118 | 738 | (2,529 | ) | (3,291 | ) | — | |||||||||||||
Summarized consolidated balance sheets of CCE, DAD and Tari are as follows:
|
December 31
(in thousands)
|
2013
|
2012
|
||||||
|
ASSETS
|
||||||||
|
Cash and cash equivalents
|
$ | 434 | $ | 1,047 | ||||
|
Restricted cash
|
537 | 39 | ||||||
|
Trade accounts receivable
|
2,459 | 4,168 | ||||||
|
Prepaid expenses
|
364 | 485 | ||||||
|
Other current assets
|
353 | 519 | ||||||
|
Fixed assets, net
|
— | 38 | ||||||
|
Other assets
|
449 | 493 | ||||||
|
TOTAL ASSETS
|
$ | 4,596 | $ | 6,789 | ||||
|
LIABILITIES AND NONCONTROLLING INTERESTS
|
||||||||
|
Current liabilities
|
$ | 2,937 | $ | 3,035 | ||||
|
Due to IDT Energy
|
964 | 5,082 | ||||||
|
Noncontrolling interests
|
695 | (1,328 | ) | |||||
|
TOTAL LIABILITIES AND NONCONTROLLING INTERESTS
|
$ | 4,596 | $ | 6,789 | ||||
The assets of CCE, DAD and Tari may only be used to settle obligations of CCE, DAD and Tari, and may not be used for other consolidated entities. The liabilities of CCE, DAD and Tari are non-recourse to the general credit of the Company’s other consolidated entities.
F-30
GENIE ENERGY LTD.
NOTES TO CONSOLIDATED FINANCIAL STATEMENTS—(Continued)
The accumulated balances for each classification of other comprehensive income (loss) were as follows:
|
(in thousands)
|
Unrealized
loss on
available-for-
sale securities
|
Foreign
currency
translation
|
Accumulated
other
comprehensive
income (loss)
|
Location of
(
Gain) Loss
R
ecognized
|
||||||||||
|
Balance at July 31, 2010
|
$ | — | $ | (24 | ) | $ | (24 | ) | ||||||
|
Other comprehensive income attributable to Genie
|
— | 381 | 381 | |||||||||||
|
Balance at July 31, 2011
|
— | 357 | 357 | |||||||||||
|
Other comprehensive loss attributable to Genie
|
— | (494 | ) | (494 | ) | |||||||||
|
Balance at December 31, 2011
|
— | (137 | ) | (137 | ) | |||||||||
|
Other comprehensive income attributable to Genie
|
(15 | ) | 422 | 407 | ||||||||||
|
Balance at December 31, 2012
|
(15 | ) | 285 | 270 | ||||||||||
|
Other comprehensive (loss) income before reclassifications
|
(55 | ) | 460 | 405 | ||||||||||
|
Amounts reclassified from accumulated other comprehensive income
|
70 | — | 70 |
Interest income
|
||||||||||
|
Net other comprehensive income
|
15 | 460 | 475 | |||||||||||
|
BALANCE AT DECEMBER 31, 2013
|
$ | — | $ | 745 | $ | 745 | ||||||||
Legal Proceedings
On March 13, 2014, named plaintiff Anthony Ferrare commenced a putative class-action lawsuit against IDT Energy in the Court of Common Pleas of Philadelphia County, Pennsylvania. The plaintiff filed the suit on behalf of himself and other former and current customers of IDT Energy in Pennsylvania, whom he contends were injured as a result of IDT Energy’s allegedly unlawful sales and marketing practices. IDT Energy denies that there is any basis for the suit and any alleged wrongdoing, and intends to vigorously defend the claim.
In addition to the above, the Company may from time to time be subject to legal proceedings that arise in the ordinary course of business. Although there can be no assurance in this regard, the Company does not expect any of those legal proceedings to have a material adverse effect on the Company’s results of operations, cash flows or financial condition.
Purchase and Other Commitments
The Company had purchase commitments of $2.2 million as of December 31, 2013.
In October 2013, the Company entered into a contract related to Afek’s exploration drilling program pursuant to which the Company’s purchase commitment at December 31, 2013 was $0.5 million.
Tax Audits
In July 2013, IDT Energy negotiated a settlement of an audit of its New York State sales and use tax for the period from June 2003 through August 2009. As a result, IDT Energy paid $0.9 million in July 2013, all of which was previously accrued.
The Company is subject to audits in various jurisdictions for various taxes. At December 31, 2013, the Company accrued $0.3 million for the estimated loss from these audits for which it is probable that a liability has been incurred. Amounts asserted by taxing authorities or the amount ultimately assessed against the Company could be greater than the accrued amount. Accordingly, additional provisions may be recorded in the future as revised estimates are made or underlying matters are settled or resolved. Imposition of assessments as a result of tax audits could have an adverse effect on the Company’s results of operations, cash flows and financial condition.
Letter of Credit
As of December 31, 2013, the Company had letters of credit outstanding totaling $5.7 million primarily for the benefit of regional transmission organizations that coordinate the movement of wholesale electricity and for certain utility companies. The letters of credit outstanding as of December 31, 2013 expire in the year ending December 31, 2014.
Performance Bonds
IDT Energy has performance bonds issued through a third party for the benefit of various states in order to comply with the states’ financial requirements for retail energy providers. At December 31, 2013, IDT Energy had aggregate performance bonds of $3.2 million outstanding.
F-31
GENIE ENERGY LTD.
NOTES TO CONSOLIDATED FINANCIAL STATEMENTS—(Continued)
Lease Commitments
The future minimum payments for operating leases as of December 31, 2013 are as follows:
|
(in thousands)
|
||||
|
Year ending December 31:
|
||||
|
2014
|
$ | 302 | ||
|
2015
|
236 | |||
|
2016
|
13 | |||
|
2017
|
— | |||
|
2018
|
— | |||
|
Thereafter
|
— | |||
|
Total payments
|
$ | 551 | ||
Rental expense under operating leases was $0.6 million, $0.8 million, $0.2 million, $0.3 million and $42,000 in the years ended December 31, 2013 and 2012, the year ended July 31, 2011, and the five months ended December 31, 2011 and 2010, respectively.
Other Contingencies
Since 2009, IDT Energy has been party to a Preferred Supplier Agreement with BP Energy Company (“BP”), pursuant to which BP is IDT Energy’s preferred provider of electricity and natural gas. The agreement’s termination date is June 30, 2015. Under the arrangement, IDT Energy purchases electricity and natural gas at market rate plus a fee. IDT Energy’s obligations to BP are secured by a first security interest in deposits or receivables from utilities in connection with their purchase of IDT Energy’s customer’s receivables, and in any cash deposits or letters of credit posted in connection with any collateral accounts with BP. IDT Energy’s ability to purchase electricity and natural gas under this agreement is subject to satisfaction of certain conditions including the maintenance of certain covenants. At December 31, 2013, the Company was in compliance with such covenants. As of December 31, 2013, restricted cash of $4.4 million and trade accounts receivable of $42.3 million were pledged to BP as collateral for the payment of IDT Energy’s trade accounts payable to BP of $18.7 million as of December 31, 2013.
Up until the Spin-Off, IDT, the Company’s former parent company, charged the Company for certain transactions and allocated routine expenses based on company specific items. The allocated amounts also included charges for utilizing the net operating loss of IDT, as the Company was included in IDT’s consolidated federal income tax return in all periods through the date of the Spin-Off. In addition, IDT controlled the flow of the Company’s treasury transactions. Following the Spin-off, IDT charges the Company for services it provides pursuant to the Transition Services Agreement.
Pursuant to the Transition Services Agreement, the Company provides specified administrative services to certain of IDT’s foreign subsidiaries. The charges for these services reduce the Company’s “Selling, general and administrative” expense.
The amounts IDT charged the Company, and the amounts the Company charged IDT, were as follows:
|
(in thousands)
|
Year ended
December 31,
2013
|
Year ended
December 31,
2012
|
Five Months ended December 31,
2011
|
Year ended
J
uly 31,
2011
|
Five Months
ended
December 31,
2010
(Unaudited)
|
|||||||||||||||
|
Amount IDT charged the Company:
|
||||||||||||||||||||
|
Included in “Selling, general and administrative expense”
|
$ | 3,348 | $ | 3,775 | $ | 2,578 | $ | 4,694 | $ | 1,837 | ||||||||||
|
Included in “Provision for income taxes”
|
— | — | 1,945 | 5,736 | 3,220 | |||||||||||||||
|
Amount the Company charged IDT
|
285 | 129 | — | — | — | |||||||||||||||
The Company had notes receivable outstanding from employees aggregating $0.9 million and $0.7 million at December 31, 2013 and 2012, respectively, which are included in “Other assets” in the accompanying consolidated balance sheet.
The Company obtains insurance policies from several insurance brokers, one of which is IGM Brokerage Corp. (“IGM”). IGM is owned by the mother of Howard Jonas, and Joyce Mason, the Company’s Corporate Secretary. Jonathan Mason, husband of Joyce Mason and brother-in-law of Howard Jonas, provides insurance brokerage services via IGM. Based on information the Company received from IGM, the Company believes that (1) IGM received commissions and fees from payments made by the Company (including payments from third party brokers) in the aggregate amounts of $11,074, $9,527 and $9,082 in the years ended December 31, 2013 and 2012 and in the five months ended December 31, 2011, respectively, which fees and commissions inured to the benefit of Mr. Mason, and (2) the total payments made by the Company to IGM for various insurance policies were $124,149, $106,812 and $101,818 in the years ended December 31, 2013 and 2012 and in the five months ended December 31, 2011, respectively. Neither Howard Jonas nor Joyce Mason has any ownership or other interest in IGM other than via the familial relationships with their mother and Jonathan Mason.
F-32
GENIE ENERGY LTD.
NOTES TO CONSOLIDATED FINANCIAL STATEMENTS—(Continued)
The Company owns 99.3% of its subsidiary, GEIC, which owns 100% of IDT Energy and 92% of GOGAS. IDT Energy has outstanding deferred stock units granted to directors and employees that represent an interest of 2.3% of the equity of IDT Energy. The Company has two reportable business segments: IDT Energy, an REP supplying electricity and natural gas to residential and small business customers in the Northeastern United States, and Genie Oil and Gas, which is pioneering technologies to produce clean and affordable transportation fuels from the world's abundant oil shales and other fuel resources. The Genie Oil and Gas segment consists of (1) a 48.16% interest in AMSO, LLC, the Company’s oil shale project in Colorado, (2) an 88.6% interest in IEI, the Company’s oil shale project in Israel, (3) an 89% interest in Afek, the Company’s conventional oil and gas exploration project in the southern portion of the Golan Heights, and (4) a 90% interest in Genie Mongolia, the Company’s oil shale exploration project in Central Mongolia. Corporate costs include unallocated compensation, consulting fees, legal fees, business development expenses and other corporate-related general and administrative expenses. Corporate does not generate any revenues, nor does it incur any direct cost of revenues.
The Company’s reportable segments are distinguished by types of service, customers and methods used to provide their services. The operating results of these business segments are regularly reviewed by the Company’s chief operating decision maker.
The accounting policies of the segments are the same as the accounting policies of the Company as a whole. The Company evaluates the performance of its business segments based primarily on income (loss) from operations. There are no significant asymmetrical allocations to segments.
Operating results for the business segments of the Company were as follows:
|
(in thousands)
|
IDT Energy
|
Genie Oil and Gas
|
Corporate
|
Total
|
||||||||||||
|
Year ended December 31, 2013
|
||||||||||||||||
|
Revenues
|
$ | 279,174 | $ | — | $ | — | $ | 279,174 | ||||||||
|
Income (loss) from operations
|
25,696 | (15,955 | ) | (9,115 | ) | 626 | ||||||||||
|
Depreciation
|
15 | 94 | 1 | 110 | ||||||||||||
|
Research and development
|
— | 11,389 | — | 11,389 | ||||||||||||
|
Equity in the net loss of AMSO, LLC
|
— | 3,194 | — | 3,194 | ||||||||||||
|
Year ended December 31, 2012
|
||||||||||||||||
|
Revenues
|
$ | 229,459 | $ | — | $ | — | $ | 229,459 | ||||||||
|
Income (loss) from operations
|
24,972 | (14,038 | ) | (7,887 | ) | 3,047 | ||||||||||
|
Depreciation
|
40 | 83 | 1 | 124 | ||||||||||||
|
Research and development
|
— | 9,365 | — | 9,365 | ||||||||||||
|
Equity in the net loss of AMSO, LLC
|
— | 3,175 | — | 3,175 | ||||||||||||
|
Five Months ended December 31, 2011
|
||||||||||||||||
|
Revenues
|
$ | 76,783 | $ | — | $ | — | $ | 76,783 | ||||||||
|
Income (loss) from operations
|
8,907 | (5,476 | ) | (1,703 | ) | 1,728 | ||||||||||
|
Depreciation
|
15 | — | — | 15 | ||||||||||||
|
Research and development
|
— | 2,648 | — | 2,648 | ||||||||||||
|
Equity in the net loss of AMSO, LLC
|
— | 2,095 | — | 2,095 | ||||||||||||
|
Year ended July 31, 2011
|
||||||||||||||||
|
Revenues
|
$ | 196,018 | $ | — | $ | — | $ | 196,018 | ||||||||
|
Income (loss) from operations
|
22,458 | (13,641 | ) | (1,843 | ) | 6,974 | ||||||||||
|
Depreciation
|
24 | — | — | 24 | ||||||||||||
|
Research and development
|
— | 7,843 | — | 7,843 | ||||||||||||
|
Equity in the net loss of AMSO, LLC
|
— | 5,238 | — | 5,238 | ||||||||||||
|
Five Months ended December 31, 2010 (unaudited)
|
||||||||||||||||
|
Revenues
|
$ | 74,877 | $ | — | $ | — | $ | 74,877 | ||||||||
|
Income (loss) from operations
|
11,739 | (5,570 | ) | (613 | ) | 5,556 | ||||||||||
|
Depreciation
|
11 | — | — | 11 | ||||||||||||
|
Research and development
|
— | 3,045 | — | 3,045 | ||||||||||||
|
Equity in the net loss of AMSO, LLC
|
— | 1,658 | — | 1,658 | ||||||||||||
There were no revenues from customers located outside of the United States in all periods presented.
Total assets for the business segments of the Company were as follows:
|
(in thousands)
|
IDT Energy
|
Genie Oil and Gas
|
Corporate
|
Total
|
||||||||||||
|
Total assets:
|
||||||||||||||||
|
December 31, 2013
|
$ | 76,691 | $ | 42,193 | $ | 39,959 | $ | 158,843 | ||||||||
|
December 31, 2012
|
65,377 | 36,561 | 48,368 | 150,306 | ||||||||||||
|
December 31, 2011
|
60,483 | 2,498 | 87,213 | 150,194 | ||||||||||||
F-33
GENIE ENERGY LTD.
NOTES TO CONSOLIDATED FINANCIAL STATEMENTS—(Continued)
Net long-lived assets and total assets held outside of the United States, which are located primarily in Israel, were as follows:
|
(in thousands)
|
United States
|
Foreign Countries
|
Total
|
|||||||||
|
December 31, 2013
|
||||||||||||
|
Long-lived assets, net
|
$ | 352 | $ | 377 | $ | 729 | ||||||
|
Total assets
|
150,315 | 8,528 | 158,843 | |||||||||
|
December 31, 2012
|
||||||||||||
|
Long-lived assets, net
|
$ | 71 | $ | 346 | $ | 417 | ||||||
|
Total assets
|
142,694 | 7,612 | 150,306 | |||||||||
|
December 31, 2011
|
||||||||||||
|
Long-lived assets, net
|
$ | 101 | $ | 351 | $ | 452 | ||||||
|
Total assets
|
148,180 | 2,014 | 150,194 | |||||||||
The table below presents selected quarterly financial data of the Company for its fiscal quarters in 2013 and 2012:
|
Quarter Ended
(in thousands
,
|
Direct cost of |
Income (loss)
from
|
Net (loss)
|
Net (loss) income
attributable
to Genie
|
(Loss) earnings per
common share
|
|||||||||||||||||||||||
|
except per share data)
|
Revenues
|
revenues |
operations
|
income | Energy Ltd. |
Basic
|
Diluted
|
|||||||||||||||||||||
|
2013:
|
||||||||||||||||||||||||||||
|
December 31
|
$ | 67,071 | $ | 50,237 | $ | (386 | ) | $ | (1,118 | ) | $ | (483 | ) | $ | (0.04 | ) | $ | (0.04 | ) | |||||||||
|
September 30
|
71,638 | 51,699 | 3,948 | 2,042 | 1,991 | 0.09 | 0.08 | |||||||||||||||||||||
|
June 30
|
55,134 | 45,168 | (5,569 | ) | (6,168 | ) | (5,901 | ) | (0.32 | ) | (0.32 | ) | ||||||||||||||||
|
March 31 (1)
|
85,331 | 66,312 | 2,633 | (97 | ) | (1,510 | ) | (0.09 | ) | (0.09 | ) | |||||||||||||||||
|
TOTAL
|
$ | 279,174 | $ | 213,416 | $ | 626 | $ | (5,341 | ) | $ | (5,903 | ) | $ | (0.36 | ) | $ | (0.36 | ) | ||||||||||
|
2012:
|
||||||||||||||||||||||||||||
|
December 31 (1)
|
$ | 65,403 | $ | 46,936 | $ | 1,891 | $ | 1,060 | $ | 2,008 | $ | 0.09 | $ | 0.08 | ||||||||||||||
|
September 30
|
63,725 | 42,285 | 3,469 | (1,084 | ) | (2,641 | ) | (0.13 | ) | (0.13 | ) | |||||||||||||||||
|
June 30
|
42,826 | 31,178 | (5,006 | ) | (3,714 | ) | (3,252 | ) | (0.15 | ) | (0.15 | ) | ||||||||||||||||
|
March 31
|
57,505 | 39,473 | 2,693 | 1,203 | 604 | 0.03 | 0.03 | |||||||||||||||||||||
|
TOTAL
|
$ | 229,459 | $ | 159,872 | $ | 3,047 | $ | (2,535 | ) | $ | (3,281 | ) | $ | (0.17 | ) | $ | (0.17 | ) | ||||||||||
|
(1)
|
In the fourth quarter of 2012, there were certain errors at IDT Energy impacting revenue recognized and the related receivable balances, sales tax refund receivable and a gross receipt tax accrual. The Company corrected these errors in the first quarter of 2013, although the corrections should have been recorded in the fourth quarter of 2012. The impact of these items would have decreased the net income in 2012 and correspondingly increased the net income in 2013, by $1.7 million. The Company’s management assessed the impact of such errors on the financial statements and determined that the errors in 2012 and the related corrections in 2013 did not have a material impact on the Company’s financial statements for 2012 and 2013 and for each of the quarters within those years. Therefore, the Company’s management determined that no restatement of prior filings is necessary.
|
F-34
TABLE OF CONTENTS
Part IItem 1. BusinessItem 1A. Risk FactorsItem 1B. Unresolved Staff CommentsItem 2. PropertiesItem 3. Legal ProceedingsItem 4. Mine Safety DisclosuresPart IIItem 5. Market For Registrant S Common Equity, Related Stockholder Matters and Issuer Purchases Of Equity SecuritiesItem 6. Selected Financial DataItem 7. Management S Discussion and Analysis Of Financial Condition and Results Of OperationsItem 7A. Quantitative and Qualitative Disclosures About Market RisksItem 8. Financial Statements and Supplementary DataItem 9. Changes in and Disagreements with Accountants on Accounting and Financial DisclosureItem 9A. Controls and ProceduresItem 9B. Other InformationPart IIIItem 10. Directors, Executive Officers and Corporate GovernanceItem 11. Executive CompensationItem 12. Security Ownership Of Certain Beneficial Owners and Management and Related Stockholder MattersItem 13. Certain Relationships and Related Transactions, and Director IndependenceItem 14. Principal Accounting Fees and ServicesPart IVItem 15. Exhibits, Financial Statement SchedulesNote 1 Description Of Business and Summary Of Significant Accounting PoliciesNote 2 AcquisitionsNote 3 Fair Value MeasurementsNote 4 Derivative InstrumentsNote 5 Marketable SecuritiesNote 6 Investment in American Shale Oil, LlcNote 7 Property and EquipmentNote 8 Revolving Line Of CreditNote 9 Income TaxesNote 10 EquityNote 11 Stock-based CompensationNote 12 Variable Interest EntitiesNote 13 Accumulated Other Comprehensive IncomeNote 14 Commitments and ContingenciesNote 15 Related Party TransactionsNote 16 Business Segment InformationNote 17 Selected Quarterly Financial Data (unaudited)