GENERAC HOLDINGS INC.
10-Ks and 10-Qs
|
|
|
|
|
|
|
|
|
|
|
|
|
|
|
|
|
|
|
|
|
|
|
|
|
|
|
|
|
|
|
|
|
|
|
|
|
|
|
|
|
|
|
|
|
|
|
|
|
|
|
|
|
|
|
|
UNITED STATES
SECURITIES AND EXCHANGE COMMISSION
WASHINGTON, D.C. 20549
FORM 10-K
|
(Mark One)
|
|
|
x
|
ANNUAL REPORT PURSUANT TO SECTION 13 OR 15(d) OF THE SECURITIES EXCHANGE ACT OF 1934
|
|
For the fiscal year ended December 31, 2013
Or
|
|
|
o
|
TRANSITION REPORT PURSUANT TO SECTION 13 OR 15(d) OF THE SECURITIES EXCHANGE ACT OF 1934
|
|
For the transition period from to
|
|
Commission File Number 001-34627
GENERAC HOLDINGS INC.
(Exact name of registrant as specified in its charter)
|
DELAWARE
(State or other jurisdiction of incorporation or organization)
|
20-5654756
(IRS Employer Identification No.)
|
|
S45 W29290 Hwy. 59, Waukesha, WI
(Address of principal executive offices)
|
53189
(Zip Code)
|
|
(262) 544-4811
(Registrant’s telephone number, including area code)
|
|
|
SECURITIES REGISTERED PURSUANT TO SECTION 12(B) OF THE ACT:
|
|
|
Common Stock, $0.01 par value
(Title of class)
|
New York Stock Exchange
(Name of exchange on which registered)
|
|
SECURITIES REGISTERED PURSUANT TO SECTION 12(G) OF THE ACT:
None
|
|
Indicate by check mark if the registrant is a well-known seasoned issuer, as defined in Rule 405 of the Securities Act. Yes
x
No
o
Indicate by check mark if the registrant is not required to file reports pursuant to Section 13 or Section 15(d) of the Act. Yes
o
No
x
Indicate by check mark whether the registrant (1) has filed all reports required to be filed by Section 13 or 15(d) of the Securities Exchange Act of 1934 during the preceding 12 months (or for such shorter period that the registrant was required to file such reports), and (2) has been subject to such filing requirements for the past 90 days. Yes
x
No
o
Indicate by check mark whether the registrant has submitted electronically and posted on its corporate Web site, if any, every Interactive Data File required to be submitted and posted pursuant to Rule 405 of Regulation S-T (§ 232.405 of this chapter) during the preceding 12 months (or for such shorter period that the registrant was required to submit and post such files). Yes
x
No
o
Indicate by check mark if disclosure of delinquent filers pursuant to Item 405 of Regulation S-K (§ 229.405 of this chapter) is not contained herein, and will not be contained, to the best of registrant’s knowledge, in definitive proxy or information statements incorporated by reference in Part III of this Form 10-K or any amendment to this Form 10-K.
o
Indicate by check mark whether the registrant is a large accelerated filer, an accelerated filer, a non-accelerated filer, or a smaller reporting company. See definitions of “large accelerated filer,” “accelerated filer,” and “smaller reporting company” in Rule 12b-2 of the Exchange Act.
|
Large accelerated filer
x
|
Accelerated filer
o
|
Non-accelerated filer
o
(Do not check if a smaller
reporting company)
|
Smaller reporting company
o
|
Indicate by check mark whether the registrant is a shell company (as defined in Rule 12b-2 of the Act). Yes
o
No
x
The aggregate market value of the voting common equity held by non-affiliates of the registrant on June 28, 2013, the last business day of the registrant’s most recently completed second fiscal quarter, was approximately $2,175,882,000 based upon the closing price reported for such date on the New York Stock Exchange.
As of February 24, 2014, 68,779,944 shares of registrant's common stock were outstanding.
DOCUMENTS INCORPORATED BY REFERENCE
Portions of the registrant’s Proxy Statement for the 2014 Annual Meeting of Stockholders (the “2014 Proxy Statement”), which will be filed by the registrant on or prior to 120 days following the end of the registrant’s fiscal year ended December 31, 2013, are incorporated by reference into Part III of this Form 10-K.
TABLE OF CONTENTS
|
Page
|
||
|
PART I
|
||
|
PART II
|
||
|
PART III
|
||
|
PART IV
|
||
Forward-Looking Statements
This annual report contains forward-looking statements that are subject to risks and uncertainties. Forward-looking statements give our current expectations and projections relating to our financial condition, results of operations, plans, objectives, future performance and business. You can identify forward-looking statements by the fact that they do not relate strictly to historical or current facts. These statements may include words such as “anticipate,” “estimate,” “expect,” “forecast,”“project,” “plan,” “intend,” “believe,” “confident,” “may,” “should,” “can have,” “likely,” “future” and other words and terms of similar meaning in connection with any discussion of the timing or nature of future operating or financial performance or other events.
The forward-looking statements contained in this annual report are based on assumptions that we have made in light of our industry experience and on our perceptions of historical trends, current conditions, expected future developments and other factors we believe are appropriate under the circumstances. As you read and consider this report, you should understand that these statements are not guarantees of performance or results. They involve risks, uncertainties (some of which are beyond our control) and assumptions. Although we believe that these forward-looking statements are based on reasonable assumptions, you should be aware that many factors could affect our actual financial results and cause them to differ materially from those anticipated in the forward-looking statements. The forward-looking statements contained in this annual report include estimates regarding:
|
·
|
our business, financial and operating results and future economic performance;
|
|
·
|
proposed new product and service offerings; and
|
|
·
|
management's goals, expectations and objectives and other similar expressions concerning matters that are not historical facts.
|
Factors that could affect our actual financial results and cause them to differ materially from those anticipated in the forward-looking statements include:
|
·
|
demand for our products;
|
|
·
|
frequency and duration of major power outages;
|
|
·
|
availability, cost and quality of raw materials and key components used in producing our products;
|
|
·
|
the impact on our results of the substantial increases in our outstanding indebtedness and related interest expense due to the dividend recapitalization transactions completed in May 2012 and 2013;
|
|
·
|
the possibility that the expected synergies, efficiencies and cost savings of our acquisitions will not be realized, or will not be realized within the expected time period;
|
|
·
|
the risk that our acquisitions will not be integrated successfully;
|
|
·
|
difficulties we may encounter as our business expands globally;
|
|
·
|
competitive factors in the industry in which we operate;
|
|
·
|
our dependence on our distribution network;
|
|
·
|
our ability to invest in, develop or adapt to changing technologies and manufacturing techniques;
|
|
·
|
loss of our key management and employees;
|
|
·
|
increase in product and other liability claims; and
|
|
·
|
changes in environmental, health and safety laws and regulations.
|
Should one or more of these risks or uncertainties materialize, or should any of these assumptions prove incorrect, our actual results may vary in material respects from those projected in any forward-looking statements. A detailed discussion of these and other factors that may affect future results is contained in Item 1A of this Annual Report on Form 10-K.
Any forward-looking statement made by us in this report speaks only as of the date on which we make it. Factors or events that could cause our actual results to differ may emerge from time to time, and it is not possible for us to predict all of them. We undertake no obligation to update any forward-looking statement, whether as a result of new information, future developments or otherwise, except as may be required by law.
1
We are a leading designer and manufacturer of a wide range of power generation equipment and other engine powered products serving the residential, light commercial, industrial and construction markets. Power generation is our main focus, which differentiates us from our primary competitors that also have broad operations outside of the generator market. As the only significant market participant focused predominantly on these products, we have one of the leading market positions in the power equipment market in North America and an expanding presence internationally. We believe we have one of the widest range of products in the marketplace, including residential, commercial and industrial standby generators, as well as portable and mobile generators used in a variety of applications. Other engine powered products that we design and manufacture include light towers which provide temporary lighting for various end markets and a broad product line of power washers for residential and commercial use.
We design, manufacture, source and modify engines, alternators, transfer switches and other components necessary for our products, which are fueled by natural gas, liquid propane, gasoline, diesel and Bi-Fuel™. Our products are available primarily across the U.S and Canada, with an expanding presence internationally in the Latin America, Europe, Middle East, Africa and Asia/Pacific regions. Products are sold into these regions through a broad network of independent dealers, retailers, wholesalers and equipment rental companies under the Generac®, Magnum™, Ottomotores and Tower Light brand names. We also sell direct to certain national and regional account customers that are the end users of our products.
We have a significant market share in the residential and light commercial generator markets, which we believe are currently under penetrated. We believe that our leading market position is largely attributable to our strategy of providing a broad product line of high-quality, innovative and affordable products through our extensive and multi-layered distribution network. In addition, through recent acquisitions, we are also a leading provider of light towers and mobile generators, as well as a supplier of industrial diesel generators ranging in sizes up to 3,250kW.
Generac Holdings Inc. is a Delaware corporation whose principal operating subsidiary is Generac Power Systems, Inc., or Generac Power Systems (collectively Generac). Generac Power Systems was founded in 1959 to market a line of affordable portable generators that offered superior performance and features. Through innovation and focus, we have grown to be a leading provider of power generation equipment to the residential, commercial, industrial, and construction markets.
Key events in our history include the following:
|
-
|
In 1980, we expanded beyond portable generators into the industrial market with the introduction of our first stationary generators that provided up to 200 kW of power output.
|
|
-
|
We introduced our first residential standby generator in 1989, and expanded our product development and global distribution system in the 1990s, forming a series of alliances that tripled our higher output generator sales.
|
|
-
|
In 1998, we sold our Generac® portable products business (which included portable generator and pressure washer product lines) to a private equity firm who eventually sold this business to another company.
|
|
-
|
Our growth accelerated in 2000 as we expanded our residential automatic standby generator product offering, implemented our multi-layered distribution philosophy, and introduced our quiet-running QT Series generators in 2005, accelerating our penetration in the commercial market.
|
|
-
|
In 2006, the founder of Generac Power Systems sold the company to affiliates of CCMP Capital Advisors, LLC or CCMP, together with certain other investors and members of our management (CCMP Transaction).
|
|
-
|
In 2008, we successfully expanded our position in the portable generator market after the expiration of our non-compete agreement that was entered into when we sold our Generac® portable products business in 1998.
|
|
-
|
In February 2010, we completed our initial public offering (IPO) of 20.7 million primary shares of our common stock (including additional share allotment).
|
|
-
|
In early 2011, we re-entered the market for gasoline-powered pressure washers (or power washers), which we previously exited in 1998 with the sale of our Generac® portable products business.
|
|
-
|
In October 2011, we purchased substantially all the assets of the Magnum Products business (Magnum or Magnum Products) which
is the number one light tower manufacturer in the U.S. and has a growing share of the mobile generator market.
|
|
-
|
In December 2012, we purchased all of the equity of Ottomotores UK Limited and its affiliates (Ottomotores) which is one of the largest manufacturers of industrial generators in Mexico.
|
|
-
|
In August 2013, we purchased all of the equity of Tower Light Srl and its wholly-owned subsidiaries (Tower Light) which is a leading developer and supplier of mobile light towers throughout Europe, the Middle East and Africa.
|
|
-
|
In August 2013, CCMP completed the last of a series of sale transactions that began in November 2012 by which it sold substantially all of the shares of common stock that it owned as of the initial public offering.
|
|
-
|
In November 2013, we purchased substantially all the assets of the generator division of Baldor Electric Company, a wholly-owned subsidiary of ABB Group (Baldor Generators), which offers a complete line of standby and prime rated products ranging from 3kW up to 2,500kW throughout the US. And Canada.
|
Today, we manufacture a full line of power products for a wide variety of applications and markets. We have demonstrated a long track record of achieving significant revenue growth through product innovation, expanded distribution and increased awareness of our products. We have experienced organic revenue growth of nearly 20% during the past 10 years on a compounded annual basis. Our success is built on engineering expertise, manufacturing & sourcing excellence and our innovative approaches to the market.
Products
We design and manufacture stationary, portable and mobile generators with single-engine outputs ranging between 800W and up to 3,250kW, with the ability to expand the power range for certain stationary generator solutions to much larger multi-megawatt systems through our Modular Power Systems, an integrated paralleling configuration. Other engine powered products that we design and manufacture include light towers, power washers and pumps. We classify our products into three classes based on similar range of power output geared for varying end customer uses: Residential power products, Commercial & Industrial power products; and Other products. The following summary outlines our portfolio of products, including their key attributes and customer applications.
Residential power products
Our residential automatic standby generators range in output from 6kW to 60kW, with manufacturer's suggested retail prices, or MSRPs, from approximately $1,900 to $16,700. These products operate on natural gas, liquid propane or diesel and are permanently installed with an automatic transfer switch, which we also manufacture. Air-cooled engine residential standby generators range in outputs from 6kW to 20kW, are available in steel and aluminum enclosures and serve as an emergency backup for small to medium-sized homes. Liquid-cooled engine generators serve as emergency backup for larger homes and small businesses and range in output from 22kW to 60kW. Liquid-cooled brands include the Guardian® Series and the premium Quietsource® Series, which have a quiet, low-speed engine and a standard aluminum enclosure.
In late 2013, we introduced a line of compact diesel generators developed specifically for residential and light-commercial users called Protector® Series, which offers the industry’s smallest and most compact footprint at price points well below those of larger, more traditional diesel generator sets in the marketplace.
Also during 2013, we introduced a new cellular remote monitoring system for home standby generators called Mobile
Link
™, which allows our customers to check the status of their generator conveniently from a desktop PC, tablet computer or mobile phone and also provides the capability to receive maintenance or service alerts.
We provide portable generators that are fueled predominantly by gasoline that range in size from 800W to 17,500W. These products serve as an emergency home backup and are also used for construction and recreational purposes. We currently have five portable product lines: the GP series, targeted at homeowners, ranging from 1,800W to 17,500W; the LP series, that runs on propane and is also targeted at homeowners, ranging from 3,250W to 5,500W; the XG series, targeted at the premium homeowner markets, ranging from 4,000 to 10,000W; the XP series, targeted at the professional contractor market, ranging from 3,600 to 10,000W; and the iX series, targeted at the recreational market, ranging from 800W to 2,000W. In addition, we offer manual transfer switches to supplement our portable generator product offering.
We also provide a broad product line of engine driven power washers, which are also fueled by gasoline, that range in PSI from 2,000 to 4,000 that are used for residential and commercial use.
Residential power products comprised 56.8%, 60.0% and 62.0%, respectively, of total net sales in 2013, 2012 and 2011.
Commercial & Industrial power products
We offer a full line of commercial & industrial generators fueled by diesel, natural gas, liquid propane and Bi-Fuel™. Ranging from 22kW up to 3,250kW, we believe we have one of the broadest product offerings in the industry.
Our light-commercial standby generators include a full range of affordable systems from 22kW to 150kW and related transfer switches, providing three-phase power sufficient for most small and mid-sized businesses including grocery stores, convenience stores, restaurants, gas stations, pharmacies, retail banks and small health care facilities. Our light-commercial generators run on natural gas and liquid propane, and in late 2013 we introduced a product line of compact, diesel-fueled generators called Protector® Series.
We also manufacture a broad line of standard and configured standby generators and related transfer switches for industrial applications. Our single-engine industrial generators range in output from 10kW up to 3,250kW with our Modular Power System (MPS) technology extending our product range up to much larger multi-megawatt systems through an integrated paralleling configuration. We offer four fuel options for our industrial generators, including diesel, natural gas, liquid propane or Bi-Fuel™. Bi-Fuel™ generators operate on a combination of both diesel and natural gas to allow our customers the advantage of multiple fuel sources and extended run times. Our industrial generators are primarily used as emergency backup for large healthcare, telecom, datacom, commercial office, municipal and manufacturing customers.
The acquisition of Baldor Generators in November 2013 enables us, for the first time, to offer single-engine industrial generators larger than 600kW within the U.S. and Canada. The Baldor Generators product offering includes stationary and containerized packages up to 2,500kW that can be used in standby applications and in certain configurations in prime power applications. The addition of these products significantly expands our industrial product offering and the addressable domestic market that our distribution partners can serve.
Our MPS technology combines the power of several smaller generators to produce the output of a larger generator, providing our customers with redundancy and scalability in a cost-effective manner. For larger industrial applications, our MPS products offer customers an efficient, affordable way to scale their standby power needs. The MPS product line also offers superior reliability given its built-in redundancy which allows individual units to be taken off-line for routine maintenance while retaining coverage for critical circuits.
Our light towers and mobile generators provide temporary lighting and power for various end markets, such as road and commercial construction, energy, mining, military and special events. We also manufacture mobile pumps which utilize wet and dry-priming pump systems for a wide variety of wastewater applications. The acquisition of Tower Light in August 2013 provides us an expanded product offering of light towers to support additional geographic markets, allowing us to participate in the growing rental market outside the U.S.
Commercial & Industrial power products comprised 38.4%, 34.9% and 31.6% respectively, of total net sales in 2013, 2012 and 2011.
Other power products
We sell aftermarket service parts to our dealers and proprietary engines to third-party original equipment manufacturers, or OEMs.
Other power products comprised 4.8%, 5.1% and 6.4%, respectively, of total net sales in 2013, 2012 and 2011.
Distribution channels and customers
We distribute our products through several channels to increase awareness of our product categories and the Generac®, Magnum®, Ottomotores
TM
and Tower Light
TM
brands, and to ensure our products reach a broad customer base. This distribution network includes independent residential and industrial dealers, national retailers, e-commerce merchants, electrical wholesalers (including certain private label arrangements), catalogs, equipment rental companies and equipment dealers. We also sell direct to certain national account customers that are the end users of our products.
We believe our distribution network is a competitive advantage that has strengthened over the last decade as a result of adding and expanding the various distribution channels through which we sell our products. Our network is well balanced with no customer providing more than 6% of our sales in 2013.
Our overall dealer network, which is located principally in the United States, Canada and Latin America, is the industry's largest network of factory direct independent generator contractors. In addition, the acquisition of Tower Light in August 2013 provides access to numerous independent distributors in over 50 countries.
Our residential/commercial dealer network sells, installs and services our residential and light-commercial products to end users. We have increased our level of investment in recent years by focusing on a variety of initiatives to more effectively market and sell our home standby products and better align our dealer network with Generac.
Our industrial dealer network provides industrial and commercial end users with ongoing sales and product support. Our industrial dealers maintain the local relationships with commercial electrical contractors, specifying engineers and national account regional buying offices. In recent years, we have been particularly focused on expanding our dealer network in Latin America and other regions of the world in order to expand our international sales opportunities.
Our retail distribution network includes thousands of locations and includes regional and national home improvement chains, retailers, clubs, buying groups and farm supply stores. These physical retail locations are supplemented by a number of catalogue and e-commerce retailers. This network primarily sells our residential standby, portable and light-commercial generators as well as our power washers.
Our wholesaler network distributes our residential and light-commercial generators and consists of selling branches of both national and local distribution houses for electrical and HVAC products.
On a selective basis, we have established private label and licensing arrangements with third party partners to provide residential, light-commercial and industrial generators. These partners include leading home equipment, electrical equipment and construction machinery companies, each of which provides access to incremental channels of distribution for our products.
The distribution for our mobile products includes international, national and regional equipment rental companies, equipment dealers and construction companies, which primarily serve non-residential building construction, road construction and energy markets.
We sell direct to certain national account customers that are the end users of our products covering a number of end market verticals, including telecommunication, retail, banking, convenience stores, and other light commercial applications.
Additionally, we sell certain engines directly to OEM manufacturers and after-market dealers for use in the lawn, garden and rental markets.
Business strategy
We believe our growth over the last several years is due in part to the development and execution of our "Powering Ahead” strategy. Since shortly after our initial public offering in 2010, this strategic plan has served as the framework for the significant investments we have made to drive the growth of Generac. As we continue to move the Powering Ahead plan into the future, we are focused on a number of initiatives that are driven by the same four key objectives:
Growing the residential standby generator market.
As the leader in the home standby generator category, it is incumbent upon us to continue to drive growth and increase the penetration rate of these products in households across the United States. Central to this strategy is to increase the awareness, availability and affordability of home standby generators. Ongoing power outage activity, combined with expanding our dealer base and overall distribution in affected regions, are key drivers in elevating the awareness of home standby generators over the long term. We intend to continue to supplement these key growth drivers with targeted sales and marketing initiatives to further extend the awareness of home standby generators. In addition, we intend to continue to focus on innovation in this emerging product category and introduce new products into the marketplace. With only approximately 3.0% penetration of the addressable market of U.S. homes (which we define as single-family detached, owner-occupied households with a home value of over $100,000, as defined by the U.S. Census Bureau's 2011 American Housing Survey for the United States), we believe there are opportunities to further penetrate the residential standby generator market.
Gaining commercial and industrial market share.
Our growth strategy for commercial and industrial power generation products is focused on incremental market share gains. Key to this objective are our efforts to develop and improve our industrial distribution, increase our addressable market with new products and increase the rate at which our products are specified in C&I power generation applications. In addition, we will attempt to garner incremental market share through our leading position in the growing market for cleaner burning, more cost effective natural gas fueled back-up power solutions. While still a much smaller portion of the overall C&I market, we believe demand for these products continues to increase at a faster rate than traditional diesel fueled generators as a result of their lower capital and operating costs. We also believe there is an opportunity to provide smaller, more cost effective generators marketed aggressively towards the underpenetrated “optional” standby market which includes smaller footprint commercial buildings. With our scale in these smaller commercial products, our distribution capabilities, and our national account customer focus, we believe we have an opportunity to penetrate these markets by using a targeted marketing approach and funneling opportunities to our distribution partners.
Diversifying end markets by expanding product offerings and services.
In recent years, we have worked hard to diversify Generac's end markets with new products and services. Much of this diversification has been achieved with our strategic acquisitions over the last three years. We now have access to several new products, new markets and new customers through the purchase of the Magnum Products business in October 2011, the Ottomotores businesses in December 2012, Tower Light in August 2013 and Baldor Generators in November 2013. As a result of these acquisitions, we now have access to a broad lineup of mobile power products, as well as products that serve the oil & gas and other infrastructure power markets. Additionally, our re-entry into the market for power washers in 2011 provides us with an opportunity to further diversify our company with the addition of this platform. As we continue to build upon our recent diversification efforts, we intend to evaluate other products and services which we believe could further diversify our end markets.
Expanding into new geographies.
During 2013, approximately 8% of our revenues were shipped to regions outside the U.S. and Canada. Given that the global market for power generation equipment is estimated to exceed $15 billion annually, we believe there are growth opportunities for Generac by expanding into new geographies. Prior to 2013, these efforts had been mostly organic with the creation of a dedicated sales team and the addition of over 100 new distribution points around the globe, with many of those in Latin America. The acquisitions of the Ottomotores and Tower Light businesses provide us with an enhanced platform and immediate scale for our international growth initiatives and accelerates our efforts to become a more global player in the markets for backup power and mobile power equipment. As we look forward, we intend to leverage these recent acquisitions while also evaluating other opportunities to expand into other regions of the world.
We believe the investments we have made to date, due in part to our Powering Ahead strategy, have helped to capitalize on the macro, secular growth drivers for our business and are an important part of our efforts to diversify and globalize our business. See “Item 7. Management’s Discussion and Analysis of Financial Condition and Results of Operations – Business drivers and trends” for additional drivers that influence demand for our products and other trends affecting the markets that we serve.
We operate several manufacturing plants located principally in Wisconsin (USA), Mexico, Italy and Brazil totaling over three million square feet. We also maintain inventory warehouses in the United States that accommodate material storage and rapid response requirements of our customers.
In recent years, we have added manufacturing capacity through investments in automation, improved utilization and the expansion of our manufacturing footprint through organic means as well as through acquisitions. We believe we have sufficient capacity to achieve our business goals for the near-to-intermediate term.
Our primary focus on generators and engine powered equipment drives technological innovation, specialized engineering and manufacturing competencies. Research and development is a core competency and includes a staff of over 250 engineers working on numerous active projects. Our sponsored research and development expense was $29.3 million, $23.5 million and $16.5 million for the years ended December 2013, 2012 and 2011, respectively. Research and development is conducted at each of our manufacturing facilities and additionally at our technical center in Suzhou, China with dedicated teams for each product line. Research and development is focused on developing new technologies and product enhancements as well as maintaining product competitiveness by improving manufacturing costs, safety characteristics, reliability and performance while ensuring compliance with regulatory standards. We have over 30 years of experience using natural gas engines and have developed specific expertise with fuel systems and emissions technology. In the residential and light commercial markets, we have developed proprietary engines, cooling packages, controls, fuel systems and emissions systems. We believe that our expertise in engine powered equipment gives us the capability to develop new products that will allow continued diversification in our end markets.
Intellectual property
We rely on a combination of patents and trademarks to establish and protect our proprietary rights. Our commitment to research and development has resulted in a portfolio of over 100 U.S. and international patents and patent applications. Our patents expire between 2016 and 2030 and protect certain features and technologies we have developed for use in our products including fuel systems, air flow, electronics and controls, noise reduction and air-cooled engines. New U.S. patents that are issued generally have a life of 20 years from the date the patent application is initially filed. U.S. and international trademark registrations generally have a perpetual duration if they are properly maintained and renewed. We believe the existence of these patents and trademarks, along with our ongoing processes to register additional patents and trademarks, protect our intellectual property rights and enhance our competitive position. We also use proprietary manufacturing processes that require customized equipment.
Suppliers of raw materials
Our primary raw material inputs are steel, copper and aluminum, all of which are purchased from third parties and, in many cases, as part of machined or manufactured components. We have developed an extensive network of reliable, low-cost suppliers in the United States and abroad. Our strategic global sourcing function continuously evaluates the cost structure of our products and assesses the capabilities of our supply chain. Components are sourced accordingly based on this evaluation. Our supplier quality engineers conduct on-site audits of major supply chain partners and help to maintain the reliability of critical sourced components. In 2013, we sourced approximately 60% of our materials and components from outside the United States.
Competition
The market for power generation equipment is competitive. We face competition from a variety of large diversified industrial companies as well as smaller generator manufacturers abroad. However, most of the traditional participants in the generator market compete on a more specialized basis, focused on specific applications within their larger diversified product mix. We are the only significant market participant focused predominantly on standby, portable and mobile generators with broad capabilities across the residential, light commercial, industrial and construction generator markets. We believe that our engineering capabilities and core focus on generators provide us with manufacturing flexibility and enable us to maintain a first-mover advantage over our competition for product innovation. We also believe our broad product offering and diverse distribution model provide for additional advantages as well.
A summary of the primary competitors across our main product classes are as follows:
Residential standby generators –
Kohler, Briggs & Stratton and Cummins (Onan division), each of which also have broad operations in other manufacturing businesses.
Portable generators
– Honda, Briggs & Stratton, Pramac and Techtronics International (TTI), along with a number of smaller domestic and foreign competitors.
Power washers
– Briggs & Stratton, TTI, FNA Group, Mi-T-M and Karcher.
Standby commercial and industrial generators
– Caterpillar, Cummins, Kohler, MTU, most of which focus on the market for diesel generators as they are also diesel engine manufacturers.
Mobile generators
– Doosan, Wacker and MultiQuip
Light towers
– Terex, Allmand, Wacker and Atlas Copco
There are a number of other standby generator manufacturers and packagers located outside North America, but most supply their products mainly to their respective regional markets. In a continuously evolving sector, we believe our scale and broad capabilities make us well positioned to remain competitive.
We compete primarily on the basis of brand reputation, quality, reliability, pricing, innovative features, breadth of product offering and product availability.
Employees
As of December 31, 2013, we had 3,380 employees (3,032 full time and 348 part-time and temporary employees). Of those, 2,094 employees were directly involved in manufacturing at our manufacturing facilities.
Domestically, we have had an “open shop” bargaining agreement for the past 48 years. The current agreement, which expires October 17, 2016, covers our Waukesha and Eagle, Wisconsin facilities. Additionally, our plants in Mexico, Italy and Brazil are operated under various local or national union groups. Our other facilities are not unionized.
Regulation, including environmental matters
As a manufacturing company, our operations are subject to a variety of foreign, federal, state and local laws and regulations covering environmental, health and safety matters. Applicable laws and regulations include those governing, among other things, emissions to air, discharges to water, noise and employee safety, as well as the generation, handling, storage, transportation, treatment and disposal of waste and other materials. In addition, our products are subject to various laws and regulations relating to, among other things, emissions and fuel requirements, as well as labeling and marketing.
Our products sold in the United States are regulated by the U.S. Environmental Protection Agency (“EPA”), California Air Resources Board (“CARB”) and various other state and local air quality management districts. These governing bodies continue to pass regulations that require us to meet more stringent emission standards, and all of our engines and engine-driven products are regulated within the United States and its territories. Other countries have various degrees of regulation depending upon product application and fuel types. New regulations could require us to redesign our products and could affect market growth for our products.
Segment information
We refer you to Note 2, “Segment Reporting,” of our consolidated financial statements included in Item 8 of this Annual Report on Form 10-K for information about our business segment and geographic areas.
Available Information
The Company’s principal executive offices are located at S45 W29290 Highway 59, Waukesha, Wisconsin, 53189 and the Company’s telephone number is (262) 544-4811. The Company’s annual report on Form 10-K, quarterly reports on Form 10-Q, current reports on Form 8-K, and amendments to those reports are available free of charge through the “Investors” portion of the Company’s web site, www.generac.com, as soon as reasonably practical after they are filed with the Securities and Exchange Commission, or the “SEC”. The SEC maintains a web site, www.sec.gov, which contains reports, proxy and information statements, and other information filed electronically with the SEC by the Company. The information provided on these websites is not part of this report and is therefore not incorporated herein by reference.
Executive officers
The following table sets forth information regarding our executive officers:
|
Name Age Position
|
||||
|
Aaron P. Jagdfeld
|
42
|
President, Chief Executive Officer and Director
|
||
|
York A. Ragen
|
42
|
Chief Financial Officer
|
||
|
Terrence J. Dolan
|
48
|
Executive Vice President, Global Commercial & Industrial Products
|
||
|
Russell S. Minick
|
53
|
Executive Vice President, Global Residential Products
|
||
|
Roger F. Pascavis
|
53
|
Executive Vice President, Strategic Global Supply
|
||
|
Allen D. Gillette
|
57
|
Executive Vice President, Global Engineering
|
||
|
Robert Stoppek
|
42
|
Senior Vice President, Global Operations
|
||
| Clement Feng | 50 | Senior Vice President, Marketing | ||
Aaron P. Jagdfeld
has served as our Chief Executive Officer since September 2008 and as a director since November 2006. Prior to becoming Chief Executive Officer, Mr. Jagdfeld worked for Generac for 15 years. He began his career in the finance department in 1994 and became our Chief Financial Officer in 2002. In 2007, he was appointed President and was responsible for sales, marketing, engineering and product development. Prior to joining Generac, Mr. Jagdfeld worked in the audit practice of the Milwaukee, Wisconsin office of Deloitte and Touche. Mr. Jagdfeld holds a Bachelor of Business Administration in Accounting from the University of Wisconsin-Whitewater.
York A. Ragen
has served as our Chief Financial Officer since September 2008. Prior to becoming Chief Financial Officer, Mr. Ragen held Director of Finance and Vice President of Finance positions at Generac. Prior to joining Generac in 2005, Mr. Ragen was Vice President, Corporate Controller at APW Ltd., a spin-off from Applied Power Inc., now known as Actuant Corporation. Mr. Ragen began his career in the Audit division of Arthur Andersen's Milwaukee office. Mr. Ragen holds a Bachelor of Business Administration in Accounting from the University of Wisconsin-Whitewater.
Terrence J. Dolan
began serving as our Executive Vice President, Industrial Products in October 2011, with this title being expanded in January 2014 to Executive Vice President, Global Commercial & Industrial Products. Prior to becoming Executive Vice President of Industrial Products, he served as our Senior Vice President of Sales from January 2010 to October 2011. Prior to joining Generac, Mr. Dolan was Senior Vice President of Business Development and Marketing at Boart Longyear from 2007 to 2008, Vice President of Sales and Marketing at Ingersoll Rand from 2002 to 2007, and Director of Strategic Accounts at Case Corporation from 1991 to 2001. Mr. Dolan holds a B.A. in Management and Communications from Concordia University.
Russell S. Minick
began serving as our Executive Vice President, Residential Products in October 2011, with this title being expanded in January 2014 to Executive Vice President, Global Residential Products. Prior to joining Generac, Mr. Minick was President & CEO of Home Care Products for Electrolux from 2006 to 2011, President of The Gunlocke Company at HNI Corporation from 2003 to 2006, Senior Vice President of Sales, Marketing and Product Development at True Temper Sports from 2002 to 2003, and General Manager of Extended Warranty Operations for Ford Motor Company from 1998 to 2002. Mr. Minick is a graduate of the University of Northern Iowa, and holds a degree in marketing.
Roger Pascavis
has served as our Executive Vice President, Strategic Global Supply since March 2013. Prior to becoming Executive Vice President of Strategic Global Supply, he served as the Senior Vice President of Operations since January 2008. Mr. Pascavis joined Generac in 1995 and has served as Director of Materials and Vice President of Operations. Prior to joining Generac, Mr. Pascavis was a Plant Manager for MTI in Waukesha, Wisconsin. Mr. Pascavis holds a B.S. in Industrial Technology from the University of Wisconsin, Stout and an M.B.A. from Lake Forest Graduate School of Management.
Allen D. Gillette
is our Executive Vice President of Global Engineering. Mr. Gillette joined Generac in 1998 and has served in numerous engineering positions involving increasing levels of responsibilities and corresponding titles. Prior to joining Generac, Mr. Gillette was Manager of Engineering at Transamerica Delaval Enterprise Division, Chief Engineer—High-Speed Engines at Ajax-Superior Division and Manager of Design & Development, Cooper-Bessemer Reciprocating Products Division. Mr. Gillette holds an M.S. in Mechanical Engineering from Purdue University and a B.S. in Mechanical Engineering from Gonzaga University.
Robert Stoppek
has served as our Senior Vice President of Global Operations since March 2013 when he joined Generac. Prior to joining Generac, Mr. Stoppek spent over 16 years at Sauer-Danfoss holding various executive level business positions both domestically and internationally and most recently as Chief Supply Chain Officer-Vice President Global Supply Chain & Procurement with IDEX Corporation. Mr. Stoppek holds an MBA from Northwestern University’s Kellogg School of Business and a Masters in Mechanical Engineering from Iowa State University.
Clement Feng
has served as our Senior Vice President of Marketing since August 2013 when he re-joined Generac after three years as Vice President – Global Marketing with the Fluke Corporation. Mr. Feng served as our Senior Vice President of Marketing from 2007 until 2010. Mr. Feng holds a B.S. in Chemical Engineering from Stanford University and an M.B.A. from the University of Chicago- Booth School of Business.
You should carefully consider the following risks. These risks could materially affect our business, results of operations or financial condition, cause the trading price of our common stock to decline materially or cause our actual results to differ materially from those expected or those expressed in any forward-looking statements made by us or on our behalf. These risks are not exclusive, and additional risks to which we are subject include, but are not limited to, the factors mentioned under “Forward-Looking Statements” and the risks of our businesses described elsewhere in this Annual Report.
Risk factors related to our business and industry
Demand for our products is significantly affected by unpredictable major power-outage events that can lead to substantial variations in, and uncertainties regarding, our financial results from period to period.
Sales of our products are subject to consumer buying patterns, and demand for our products is affected by power outage events caused by thunderstorms, hurricanes, ice storms, blackouts and other grid reliability issues. The impact of these outage events on our sales can vary depending on the location and severity of the outages. Sustained periods without major power disruptions can lead to reduced consumer awareness of the benefits of standby and portable generator products and can result in reduced sales growth rates and excess inventory. The lack of major power-outage events can affect our net sales in the years following a given storm season. Unpredictable fluctuations in demand are therefore part of managing our business, and these fluctuations could have an adverse effect on our net sales and profits. Despite their unpredictable nature, we believe major power outages create awareness and accelerate adoption for our home standby products.
Demand for our products is significantly affected by durable goods spending by consumers and businesses and other macroeconomic conditions.
Our business is affected by general economic conditions, and uncertainty or adverse changes such as the prolonged downturn in U.S. residential investment and the impact of more stringent credit standards could lead to a decline in demand for our products and pressure to reduce our prices. Our sales of light-commercial and industrial generators are affected by conditions in the non-residential construction sector and by the capital investment trends for small and large businesses and municipalities. If these businesses and municipalities cannot access credit markets or do not utilize discretionary funds to purchase our products as a result of the economy or other factors, our business could suffer and our ability to realize benefits from our strategy of increasing sales in the light-commercial and industrial sectors through, among other things, our focus on innovation and product development, including natural gas engine and modular technology, could be adversely affected. In addition, consumer confidence and home remodeling expenditures have a significant impact on sales of our residential products, and prolonged periods of weakness in consumer durable goods spending could have a material impact on our business. Typically, we do not have contracts with our customers which call for committed volume, and we cannot guarantee that our current customers will continue to purchase our products. If general economic conditions or consumer confidence were to worsen, or if the non-residential construction sector or rate of capital investments were to decline, our net sales and profits would likely be adversely affected. Additionally, timing of capital spending by our national account customers can vary from quarter-to-quarter based on capital availability and internal capital spending budgets.
Decreases in the availability and quality, or increases in the cost, of raw materials and key components we use could materially reduce our earnings.
The principal raw materials that we use to produce our products are steel, copper and aluminum. We also source a significant number of component parts from third parties that we utilize to manufacture our products. The prices of those raw materials and components are susceptible to significant fluctuations due to trends in supply and demand, transportation costs, government regulations and tariffs, price controls, economic conditions and other unforeseen circumstances beyond our control. We do not have long-term supply contracts in place to ensure the raw materials and components we use are available in necessary amounts or at fixed prices. If we are unable to mitigate raw material or component price increases through product design improvements, price increases to our customers, manufacturing productivity improvements, or hedging transactions, our profitability could be adversely affected. Also, our ability to continue to obtain quality materials and components is subject to the continued reliability and viability of our suppliers, including in some cases, suppliers who are the sole source of certain important components. If we are unable to obtain adequate, cost efficient or timely deliveries of required raw materials and components, we may be unable to manufacture sufficient quantities of products on a timely basis. This could cause us to lose sales, incur additional costs, delay new product introductions or suffer harm to our reputation.
The industry in which we compete is highly competitive, and our failure to compete successfully could adversely affect our results of operations and financial condition.
We operate in markets that are highly competitive. Some of our competitors have established brands and are larger in size or are divisions of large diversified companies and have substantially greater financial resources. Some of our competitors may be willing to reduce prices and accept lower margins in order to compete with us. In addition, we could face new competition from large international or domestic companies with established industrial brands that enter our end markets. Demand for our products may also be affected by our ability to respond to changes in design and functionality, to respond to downward pricing pressure, and to provide shorter lead times for our products than our competitors. If we are unable to respond successfully to these competitive pressures, we could lose market share, which could have an adverse impact on our results. For more information, see “Item 1—Business—Competition.”
Our industry is subject to technological change, and our failure to continue developing new and improved products and to bring these products rapidly to market could have an adverse impact on our business.
New products, or refinements and improvements of existing products, may have technical failures, their introduction may be delayed, they may have higher production costs than originally expected or they may not be accepted by our customers. If we are not able to anticipate, identify, develop and market high quality products in line with technological advancements that respond to changes in customer preferences, demand for our products could decline and our operating results could be adversely affected.
We rely on independent dealers and distribution partners, and the loss of these dealers and distribution partners, or of any of our sales arrangements with significant private label, telecommunications, retail or equipment rental customers, would adversely affect our business.
In addition to our direct sales force and manufacturer sales representatives, we depend on the services of independent distributors and dealers to sell our products and provide service and aftermarket support to our end customers. We also rely upon our distribution channels to drive awareness for our product categories and our brands. In addition, we sell our products to end users through private label arrangements with leading home equipment, electrical equipment and construction machinery companies, arrangements with top retailers and equipment rental companies, and our direct national accounts with telecommunications and industrial customers. Our distribution agreements and any contracts we have with large telecommunications, retail and other customers are typically not exclusive, and many of the distributors and customers with whom we do business offer products and services of our competitors. Impairment of our relationships with our distributors, dealers or large customers, loss of a substantial number of these distributors or dealers or of one or more large customers, or an increase in our distributors' or dealers' sales of our competitors' products to our customers or of our large customers' purchases of our competitors' products could materially reduce our sales and profits. Also, our ability to successfully realize our growth strategy is dependent in part on our ability to identify, attract and retain new distributors at all layers of our distribution platform, and we cannot be certain that we will be successful in these efforts.
Our business could be negatively impacted if we fail to adequately protect our intellectual property rights or if third parties claim that we are in violation of their intellectual property rights.
We view our intellectual property rights as very important assets. We seek to protect our intellectual property rights through a combination of patent, trademark, copyright and trade secret laws, as well as licensing and confidentiality agreements. These protections may not be adequate to prevent third parties from using our intellectual property without our authorization, breaching any confidentiality agreements with us, copying or reverse engineering our products, or developing and marketing products that are substantially equivalent to or superior to our own. The unauthorized use of our intellectual property by others could reduce our competitive advantage and harm our business. Not only are intellectual property-related proceedings burdensome and costly, but they could span years to get a conclusion and we may not prevail. We cannot guarantee that any patents, issued or pending, will provide us with any competitive advantage or will not be challenged by third parties. Moreover, the expiration of our patents may lead to increased competition with respect to certain products.
In addition, we cannot be certain that we do not or will not infringe third parties' intellectual property rights. Any such claim, even if it is without merit, may be expensive and time-consuming to defend, subject us to damages, cause us to cease making, using or selling certain products that incorporate the disputed intellectual property, require us to redesign our products, divert management time and attention and/or require us to enter into costly royalty or licensing arrangements. Furthermore, in connection with our sale of Generac Portable Products to a private equity firm in 1998, we granted the private equity firm an exclusive perpetual license for the use of the “Generac Portable Products” trademark in connection with the manufacture and sale of certain engine driven consumer products. This perpetual license was eventually transferred to another company when the private equity firm sold that business. Currently, this trademark is not being used in commerce and, as such, there is a rebuttable presumption that the trademark has been abandoned. However, in the event that this trademark is used in the future, we could suffer competitive confusion and our business could be negatively impacted.
Our operations are subject to various environmental, health and safety laws and regulations, and non-compliance with or liabilities under such laws and regulations could result in substantial costs, fines, sanctions and claims.
Our operations are subject to a variety of foreign, federal, state and local environmental, health and safety laws and regulations including those governing, among other things, emissions to air, discharges to water, noise, the generation, handling, storage, transportation, treatment and disposal of waste and other materials. In addition, under federal and state environmental laws, we could be required to investigate, remediate and/or monitor the effects of the release or disposal of materials both at sites associated with past and present operations and at third-party sites where wastes generated by our operations were disposed. This liability may be imposed retroactively and whether or not we caused, or had any knowledge of, the existence of these materials and may result in our paying more than our fair share of the related costs. Violations of or liabilities under such laws and regulations could result in substantial costs, fines and civil or criminal proceedings or personal injury and workers' compensation claims.
Our products are subject to substantial government regulation.
Our products are subject to extensive statutory and regulatory requirements governing, among other things, emissions and noise, including standards imposed by the federal Environmental Protection Agency (“EPA”), state regulatory agencies, such as California Air Resources Board (“CARB”), and other regulatory agencies around the world. These laws are constantly evolving and many are becoming increasingly stringent. Changes in applicable laws or regulations, or in the enforcement thereof, could require us to redesign our products and could adversely affect our business or financial condition in the future. Developing and marketing products to meet such new requirements could result in substantial additional costs that may be difficult to recover in some markets. In some cases, we may be required to modify our products or develop new products to comply with new regulations, particularly those relating to air emissions. For example
,
we were required to modify our spark-ignited air-cooled gaseous engines to comply with the 2011 EPA and CARB regulations, as well as the continued implementation of Tier 4 nonroad diesel engine changes associated with acquisitions serving the mobile product markets. Typically, additional costs associated with significant compliance modifications are passed on to the market. While we have been able to meet previous deadlines, failure to comply with other existing and future regulatory standards could adversely affect our position in the markets we serve.
We may incur costs and liabilities as a result of product liability claims.
We face a risk of exposure to product liability claims in the event that the use of our products is alleged to have resulted in injury or other damage. Although we currently maintain product liability insurance coverage, we may not be able to obtain such insurance on acceptable terms in the future, if at all, or obtain insurance that will provide adequate coverage against potential claims. Product liability claims can be expensive to defend and can divert the attention of management and other personnel for long periods of time, regardless of the ultimate outcome. A significant unsuccessful product liability defense could have a material adverse effect on our financial condition and results of operations. In addition, we believe our business depends on the strong brand reputation we have developed. If our reputation is damaged, we may face difficulty in maintaining our market share and pricing with respect to some of our products, which could reduce our sales and profitability.
The loss of any key members of our senior management team or key employees could disrupt our operations and harm our business.
Our success depends, in part, on the efforts of certain key individuals, including the members of our senior management team, who have significant experience in the power products industry. If, for any reason, our senior executives do not continue to be active in management, or if our key employees leave our company, our business, financial condition or results of operations could be adversely affected. Failure to continue to attract these individuals at reasonable compensation levels could have a material adverse effect on our business, liquidity and results of operations. Although we do not anticipate that we will have to replace any of these individuals in the near future, the loss of the services of any of our key employees could disrupt our operations and have a material adverse effect on our business.
Disruptions caused by labor disputes or organized labor activities could harm our business.
We may from time to time experience union organizing activities in our non-union facilities. Disputes with the current labor union or new union organizing activities could lead to work slowdowns or stoppages and make it difficult or impossible for us to meet scheduled delivery times for product shipments to our customers, which could result in loss of business. In addition, union activity could result in higher labor costs, which could harm our financial condition, results of operations and competitive position.
We may experience material disruptions to our manufacturing operations.
While we seek to operate our facilities in compliance with applicable rules and regulations and take measures to minimize the risks of disruption at our facilities, a material disruption at one of our manufacturing facilities could prevent us from meeting customer demand, reduce our sales and/or negatively impact our financial results. Any of our manufacturing facilities, or any of our equipment within an otherwise operational facility, could cease operations unexpectedly due to a number of events, including:
|
·
|
equipment or information technology infrastructure failure;
|
|
·
|
disruptions in the transportation infrastructure including roads, bridges, railroad tracks;
|
|
·
|
fires, floods, tornados, earthquakes, or other catastrophes; and
|
|
·
|
other operational problems.
|
In addition, the majority of our manufacturing and production facilities are located in Wisconsin within a 100-mile radius. We could experience prolonged periods of reduced production due to unforeseen events occurring in or around our manufacturing facilities in Wisconsin. In the event of a business interruption at our facilities, in particular our Wisconsin facilities, we may be unable to shift manufacturing capabilities to alternate locations, accept materials from suppliers or meet customer shipment needs, among other severe consequences. Such an event could have a material and adverse impact on our financial condition and results of our operations.
A significant portion of our purchased components are sourced in foreign countries, exposing us to additional risks that may not exist in the United States.
We source a significant portion of our purchased components overseas, primarily in Asia and Europe. Our international sourcing subjects us to a number of potential risks in addition to the risks associated with third-party sourcing generally. Such risks include:
|
·
|
inflation or changes in political and economic conditions;
|
|
·
|
unstable regulatory environments;
|
|
·
|
changes in import and export duties;
|
|
·
|
domestic and foreign customs and tariffs;
|
|
·
|
currency rate fluctuations;
|
|
·
|
trade restrictions;
|
|
·
|
labor unrest;
|
|
·
|
logistical and communications challenges; and
|
|
·
|
other restraints and burdensome taxes.
|
These factors may have an adverse effect on our ability to efficiently and cost effectively source our purchased components overseas. In particular, if the U.S. dollar were to depreciate significantly against the currencies in which we purchase raw materials from foreign suppliers, our cost of goods sold could increase materially, which would adversely affect our results of operations.
We are vulnerable to supply disruptions from single-sourced suppliers.
We single-sourced certain types of parts in our product designs during 2013. Any delay in our suppliers’ deliveries may impair our ability to deliver products to our customers. A wide variety of factors could cause such delays including, but not limited to, lack of capacity, economic downturns, availability of credit, weather events or natural disasters.
As a U.S. corporation that conducts business in a variety of foreign countries including, but not limited to, Mexico, Italy and Brazil, we are subject to the Foreign Corrupt Practices Act and a variety of anti-corruption laws worldwide. A determination that we violated any of these laws may affect our business and operations adversely.
As a U.S. corporation that conducts business in a variety of foreign countries including, but not limited to, Mexico, Italy and Brazil, we are subject to the regulations imposed by a variety of anti-corruption laws worldwide. The U.S. Foreign Corrupt Practices Act, or the FCPA, generally prohibits U.S. companies and their intermediaries from making improper payments to foreign officials for the purpose of obtaining or keeping business. The United Kingdom Bribery Act, or the UKBA, prohibits domestic and foreign bribery of the private sector as well as public officials. Any determination that we have violated any anti-corruption laws could have a material adverse effect on our financial position, operating results and cash flows.
Our total assets include goodwill and other indefinite-lived intangibles. If we determine these have become impaired in the future, net income could be materially adversely affected.
Goodwill represents the excess of cost over the fair market value of net assets acquired in business combinations. Indefinite-lived intangibles are comprised of certain trade names. At December 31, 2013, goodwill and other indefinite-lived intangibles totaled $891.1 million, most of which arose from the CCMP Transaction. We review goodwill and other intangibles at least annually for impairment and any excess in carrying value over the estimated fair value is charged to the statement of operations. A reduction in net income resulting from the write-down or impairment of goodwill or indefinite-lived intangibles could have a material adverse effect on our financial statements.
Goodwill and identifiable intangible assets are recorded at fair value on the date of acquisition. In accordance with FASB Accounting Standards Codification (ASC) Topic 350-20, goodwill and indefinite lived intangibles are reviewed at least annually for impairment and definite-lived intangible assets are reviewed for impairment whenever events or changes in circumstances indicate that their carrying value may not be recoverable. Future impairment may result from, among other things, deterioration in the performance of an acquired business or product line, adverse market conditions and changes in the competitive landscape, adverse changes in applicable laws or regulations, including changes that restrict the activities of an acquired business or product line, and a variety of other circumstances. The amount of any impairment is recorded as a charge to the statement of operations. We may never realize the full value of our intangible assets. Any future determination requiring the write-off of a significant portion of intangible assets would have an adverse effect on our financial condition and results of operations. See “Item 7—Management's Discussion and Analysis of Financial Condition and Results of Operations” for details.
We may need additional capital to finance our growth strategy or to refinance our existing credit facilities, and we may not be able to obtain it on acceptable terms, or at all, which may limit our ability to grow.
We may require additional financing to expand our business. Financing may not be available to us or may be available to us only on terms that are not favorable. The terms of our senior secured credit facilities limit our ability to incur additional debt. In addition, economic conditions, including a downturn in the credit markets, could impact our ability to finance our growth on acceptable terms or at all. If we are unable to raise additional funds or obtain capital on acceptable terms, we may have to delay, modify or abandon some or all of our growth strategies. On May 31, 2013, we amended and restated our term loan credit agreement, pursuant to which we incurred $1,200 million of a senior secured term loan to replace our prior $900 million term loan facility. Following the refinancing, we used the available proceeds from the new term loan and cash on hand to fund a special cash dividend to our stockholders of $5.00 per share and to pay related financing fees and expenses. In the future, if we are unable to refinance such facilities on acceptable terms, our liquidity could be adversely affected.
We are unable to determine the specific impact of changes in selling prices or changes in volumes of our products on our net sales.
Because of the wide range of products that we sell, the level of customization for many of our products, the frequent rollout of new products and the fact that we do not apply pricing changes uniformly across our entire portfolio of products, we are unable to determine with specificity the effect of volume changes or changes in selling prices on our net sales.
We may not realize all of the anticipated benefits of our acquisitions or those benefits may take longer to realize than expected. We may also encounter significant unexpected difficulties in integrating acquired businesses.
Our ability to realize the anticipated benefits of our acquisitions will depend, to a large extent, on our ability to integrate the acquired businesses with our business. The combination of independent businesses is a complex, costly and time-consuming process. Further, integrating and managing businesses with international operations may pose challenges not previously experienced by our management. As a result, we will be required to devote significant management attention and resources to integrating the business practices and operations of any acquired businesses with ours. The integration process may disrupt our business and, if implemented ineffectively, would preclude realization of the full benefits expected by us. Our failure to meet the challenges involved in integrating an acquired business into our existing operations or otherwise to realize the anticipated benefits of the transaction could cause an interruption of, or a loss of momentum in, our activities and could adversely affect our results of operations.
In addition, the overall integration of our acquired businesses may result in material unanticipated problems, expenses, liabilities, competitive responses, loss of customer relationships, and diversion of management's attention, and may cause our stock price to decline.
The difficulties of combining the operations of acquired businesses with ours include, among others:
|
·
|
managing a larger company;
|
|
·
|
maintaining employee morale and retaining key management and other employees;
|
|
·
|
integrating two business cultures, which may prove to be incompatible;
|
|
·
|
the possibility of faulty assumptions underlying expectations regarding the integration process;
|
|
·
|
retaining existing customers and attracting new customers;
|
|
·
|
consolidating corporate and administrative infrastructures and eliminating duplicative operations;
|
|
·
|
the diversion of management's attention from ongoing business concerns and performance shortfalls as a result of the diversion of management's attention to the acquisition;
|
|
·
|
unanticipated issues in integrating information technology, communications and other systems;
|
|
·
|
unanticipated changes in applicable laws and regulations;
|
|
·
|
managing tax costs or inefficiencies associated with integrating the operations of the combined company;
|
|
·
|
unforeseen expenses or delays associated with the acquisition;
|
|
·
|
difficulty comparing financial reports due to differing financial and/or internal reporting systems; and
|
|
·
|
making any necessary modifications to internal financial control standards to comply with the Sarbanes-Oxley Act of 2002 and the rules and regulations promulgated thereunder.
|
Many of these factors will be outside of our control and any one of them could result in increased costs, decreases in the amount of expected revenues and diversion of management's time and energy, which could materially impact our business, financial condition and results of operations. In addition, even if the operations of our acquired businesses are integrated successfully with our operations, we may not realize the full benefits of the transaction, including the synergies, cost savings or sales or growth opportunities that we expect. These benefits may not be achieved within the anticipated time frame, or at all. Or, additional unanticipated costs may be incurred in the integration of our businesses. All of these factors could cause dilution to our earnings per share, decrease or delay the expected accretive effect of the acquisition, and cause a decrease in the price of our common stock. As a result, we cannot assure you that the combination of our acquisitions with our business will result in the realization of the full benefits anticipated from the transaction.
Risks related to our common stock
If securities or industry analysts do not publish research or reports about our business, if they adversely change their recommendations regarding our common stock or if our results of operations do not meet their expectations, our common stock price and trading volume could decline.
The trading market for our common stock will be influenced by the research and reports that industry or securities analysts publish about us or our business. If one or more of these analysts cease coverage of our company or fail to publish reports on us regularly, we could lose visibility in the financial markets, which in turn could cause our stock price or trading volume to decline. Moreover, if one or more of the analysts who cover us downgrade recommendations regarding our stock, or if our results of operations do not meet their expectations, our stock price could decline and such decline could be material.
Anti-takeover provisions in our amended and restated certificate of incorporation and by-laws could prohibit a change of control that our stockholders may favor and could negatively affect our stock price.
Provisions in our amended and restated certificate of incorporation and by-laws may make it more difficult and expensive for a third party to acquire control of us even if a change of control would be beneficial to the interests of our stockholders. These provisions could discourage potential takeover attempts and could adversely affect the market price of our common stock. These provisions may also prevent or frustrate attempts by our stockholders to replace or remove our management. For example, our amended and restated certificate of incorporation and by-laws:
|
·
|
permit our board of directors to issue preferred stock with such terms as they determine, without stockholder approval;
|
|
·
|
provide that only one-third of the members of the board are elected at each stockholders meeting and prohibit removal without cause;
|
|
·
|
require advance notice for stockholder proposals and director nominations; and
|
|
·
|
contain limitations on convening stockholder meetings.
|
These provisions make it more difficult for stockholders or potential acquirers to acquire us without negotiation and could discourage potential takeover attempts and could adversely affect the market price of our common stock.
We do not anticipate paying dividends on our common stock in the foreseeable future.
While we declared a special dividend in both June 2012 and June 2013, we do not anticipate paying any further dividends in the foreseeable future on our common stock. We intend to retain all future earnings for the operation and expansion of our business and the repayment of outstanding debt. In addition, the terms of our senior secured credit facilities limit our ability to pay dividends on our common stock. As a result, capital appreciation, if any, of our common stock will be the sole source of gain for the foreseeable future. While we may change this policy at some point in the future, we cannot assure that we will make such a change.
Risks related to our capital structure
We have a significant amount of indebtedness which could adversely affect our cash flow and our ability to remain in compliance with debt covenants and make payments on our indebtedness.
We have a significant amount of indebtedness. As of December 31, 2013, we had total indebtedness of $1,187.8 million. Our significant level of indebtedness increases the possibility that we may be unable to generate cash sufficient to pay, when due, the principal of, interest on or other amounts due in respect of our indebtedness. Our significant indebtedness, combined with our lease and other financial obligations and contractual commitments could have other important consequences. For example, it could:
|
·
|
make it more difficult for us to satisfy our obligations with respect to our indebtedness, which could result in an event of default under the agreements governing our indebtedness;
|
|
·
|
make us more vulnerable to adverse changes in general economic, industry and competitive conditions and adverse changes in government regulation;
|
|
·
|
require us to dedicate a portion of our cash flow from operations to payments on our indebtedness, thereby reducing the availability of our cash flows to fund working capital, capital expenditures, acquisitions and other general corporate purposes;
|
|
·
|
limit our flexibility in planning for, or reacting to, changes in our business and the industry in which we operate;
|
|
·
|
place us at a competitive disadvantage compared to our competitors that have less debt; and
|
|
·
|
limit our ability to borrow additional amounts for working capital, capital expenditures, acquisitions, debt service requirements, execution of our business strategy or other purposes.
|
Any of the above-listed factors could materially adversely affect our business, financial condition, results of operations and cash flows. While we maintain interest rate swaps covering a portion of our outstanding debt, our interest expense could increase if interest rates increase because debt under our credit facilities bears interest at a variable rate once above a certain LIBOR floor. If we do not have sufficient earnings to service our debt, we may be required to refinance all or part of our existing debt, sell assets, borrow more money or sell securities, none of which we can guarantee we will be able to do.
The terms of our credit facilities restrict our current and future operations, particularly our ability to respond to changes in our business or to take certain actions.
Our credit facilities contain, and any future indebtedness of ours or our subsidiaries would likely contain, a number of restrictive covenants that impose significant operating and financial restrictions on us and our subsidiaries, including restrictions on our ability to engage in acts that may be in our best long-term interests. These restrictions include, among other things, our ability to:
|
·
|
incur liens;
|
|
·
|
incur or assume additional debt or guarantees or issue preferred stock;
|
|
·
|
pay dividends, or make redemptions and repurchases, with respect to capital stock;
|
|
·
|
prepay, or make redemptions and repurchases of, subordinated debt;
|
|
·
|
make loans and investments;
|
|
·
|
make capital expenditures;
|
|
·
|
engage in mergers, acquisitions, asset sales, sale/leaseback transactions and transactions with affiliates;
|
|
·
|
change the business conducted by us or our subsidiaries; and
|
|
·
|
amend the terms of subordinated debt.
|
The operating and financial restrictions in our credit facilities and any future financing agreements may adversely affect our ability to finance future operations or capital needs or to engage in other business activities. A breach of any of the restrictive covenants in our credit facilities would result in a default. If any such default occurs, the lenders under our credit facilities may elect to declare all outstanding borrowings, together with accrued interest and other fees, to be immediately due and payable, or enforce their security interest, any of which would result in an event of default. The lenders will also have the right in these circumstances to terminate any commitments they have to provide further borrowings. Our existing credit facilities do not contain any financial maintenance covenants.
None.
We own, operate or lease manufacturing and distribution facilities located principally in Wisconsin (USA), Mexico, Italy and Brazil totaling over 3 million square feet. We also operate a dealer training center at our Eagle, Wisconsin facility, which allows us to train new industrial and residential dealers on the service and installation of our products and provide existing dealers with training on product innovations. We also have inventory warehouses in the United States that accommodate material storage and rapid response requirements of our customers.
The following table shows the location and activities of our principal operations:
|
Location
|
Owned / Leased
|
Square Footage
|
Activities
|
|
Waukesha, WI
|
Owned
|
307,000
|
Corporate headquarters, manufacturing, storage, research and development, service parts distribution
|
|
Eagle, WI
|
Owned
|
242,000
|
Manufacturing, office, training
|
|
Whitewater, WI
|
Owned
|
491,000
|
Manufacturing, office, distribution
|
|
Oshkosh, WI
|
Owned
|
255,000
|
Manufacturing, storage, research and development
|
| Berlin, WI | Owned | 129,000 | Manufacturing, office |
|
Berlin, WI
|
Leased | 123,000 | Manufacturing, storage, research and development |
|
Fort Atkinson, WI
|
Leased
|
237,000
|
Storage
|
|
Edgerton, WI
|
Leased
|
575,000
|
Storage
|
|
Maquoketa, IA
|
Owned
|
137,000
|
Storage, rental property
|
| Jefferson, WI | Owned | 253,000 | Manufacturing, distribution |
|
Jefferson, WI
|
Leased
|
441,000
|
Recently leased, soon-to-be-storage
|
|
Mexico City, Mexico
|
Owned
|
161,000
|
Manufacturing, sales, distribution, storage, office
|
|
Curitiba, Brazil
|
Leased
|
26,000
|
Manufacturing, sales, distribution, storage, office
|
|
Milan, Italy
|
Leased
|
118,000
|
Manufacturing, sales, distribution, storage, office
|
|
Milton Keynes, England
|
Leased
|
9,000 |
Sales, distribution, storage, office
|
As of December 31, 2013, substantially all of our owned properties are subject to collateral provisions under our senior secured credit facilities.
From time to time, we are involved in legal proceedings primarily involving product liability, patent and employment matters and general commercial disputes arising in the ordinary course of our business. As of December 31, 2013, we believe that there is no litigation pending that would have a material effect on our results of operations or financial condition.
Not Applicable.
Price Range of Common Stock
Shares of our common stock are traded on the New York Stock Exchange (NYSE) under the symbol “GNRC.” The following table sets forth the high and low sales prices reported on the NYSE for our common stock by fiscal quarter during 2013 and 2012, respectively.
| 2013 | ||||||||
|
|
High
|
Low
|
||||||
|
Fourth Quarter
|
$ | 57.05 | $ | 39.01 | ||||
|
Third Quarter
|
$ | 44.30 | $ | 37.11 | ||||
|
Second Quarter
|
$ | 41.48 | $ | 32.41 | ||||
|
First Quarter
|
$ | 41.40 | $ | 32.72 | ||||
| 2012 | ||||||||
|
|
High
|
Low
|
||||||
|
Fourth Quarter
|
$ | 39.18 | $ | 24.43 | ||||
|
Third Quarter
|
$ | 25.33 | $ | 18.35 | ||||
|
Second Quarter
|
$ | 30.61 | $ | 22.40 | ||||
|
First Quarter
|
$ | 30.50 | $ | 24.27 | ||||
The following table summarizes the stock repurchase activity for the twelve months ended December 31, 2013, which consisted of the withholding of shares upon the vesting of restricted stock awards to pay withholding taxes:
|
(in thousands, except share and per share data)
|
Total Number of Shares Purchased
|
Average Price Paid
per Share
|
Total Number
Of Shares
Purchased As
Publicly
Announced
Plans Or
Programs
|
Approximate
Dollar Value
Of Shares
That May Yet
Be Purchased
Under The
Plans Or
Programs
|
||||||||||||
|
01/01/13 - 01/31/13
|
- | $ | - | N/A | N/A | |||||||||||
|
02/01/13 - 02/28/13
|
162,819 | $ | 40.18 | N/A | N/A | |||||||||||
|
03/01/13 - 03/31/13
|
- | $ | - | N/A | N/A | |||||||||||
|
04/01/13 - 04/30/13
|
- | $ | - | N/A | N/A | |||||||||||
|
05/01/13 - 05/31/13
|
- | $ | - | N/A | N/A | |||||||||||
|
06/01/13 - 06/30/13
|
- | $ | - | N/A | N/A | |||||||||||
|
07/01/13 - 07/31/13
|
- | $ | - | N/A | N/A | |||||||||||
|
08/01/13 - 08/31/13
|
227 | $ | 42.09 | N/A | N/A | |||||||||||
|
09/01/13 - 09/30/13
|
- | $ | - | N/A | N/A | |||||||||||
|
10/01/13 - 10/31/13
|
- | $ | - | N/A | N/A | |||||||||||
|
11/01/13 - 11/30/13
|
412 | $ | 46.42 | N/A | N/A | |||||||||||
|
12/01/13 - 12/31/13
|
- | $ | - | N/A | N/A | |||||||||||
|
Total
|
163,458 | $ | 40.20 | |||||||||||||
For equity compensation plan information, please refer to note 10 in Item 8 in Part II of this 10-K.
Stock Performance Graph
The line graph below compares the cumulative total stockholder return on our common stock with the cumulative total return of the Standard & Poor’s S&P 500 Index and S&P 500 Industrials Index for the year ended December 31, 2013. The graph and table assume that $100 was invested on February 11, 2010 (first day of trading) in each of our common stock, the S&P 500 Index, S&P 500 Industrials Index, and that all dividends were reinvested. Cumulative total stockholder returns for our common stock, the S&P 500 Index, and the S&P 500 Industrials Index are based on our fiscal year.
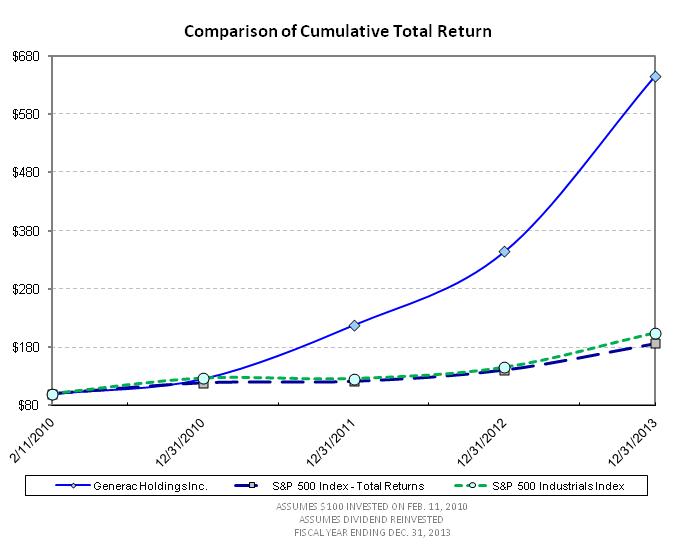
Holders
As of February 24, 2014, there were approximately 139 registered holders of record of Generac’s common stock. A substantially greater number of holders of Generac common stock are “street name” or beneficial holders, whose shares are held of record by banks, brokers, and other financial institutions.
Dividends
On June 21, 2013, the Company used a portion of the proceeds from the May 31, 2013 debt refinancing (see footnote #6 – Credit Agreements in Item 8 of this Annual Report on Form 10-K) to pay a special cash dividend of $5.00 per share on its common stock, resulting in payments totaling $340.8 million to stockholders. We currently do not have plans to pay any further dividends on our common stock in the near term. However, in the future, subject to factors such as general economic and business conditions, our financial condition and results of operations, our capital requirements, our future liquidity and capitalization and such other factors that our board of directors may deem relevant, we may change this policy and choose to pay dividends. Our ability to pay dividends on our common stock is currently restricted by the terms of our senior secured credit facilities and may be further restricted by any future indebtedness we incur. Our business is conducted through our subsidiaries, including our principal operating subsidiary, Generac Power Systems. Dividends from, and cash generated by our subsidiaries will be our principal sources of cash to repay indebtedness, fund operations and pay dividends. Accordingly, our ability to pay dividends to our stockholders is dependent on the earnings and distributions of funds from our subsidiaries, including Generac Power Systems.
Securities Authorized for Issuance Under Equity Compensation Plans
The information required by this item will be included in our 2014 Proxy Statement and is incorporated herein by reference.
Recent Sales of Unregistered Securities
None.
Use of Proceeds from Registered Securities
Not applicable.
The following table sets forth our selected historical consolidated financial data for the periods and at the dates indicated. The selected historical consolidated financial data for the years ended December 31, 2013, 2012 and 2011 are derived from our audited consolidated financial statements included elsewhere in this annual report. The selected historical consolidated financial data for the years ended December 31, 2010 and December 31, 2009 are derived from our audited historical consolidated financial statements not included in this annual report.
The results indicated below and elsewhere in this annual report are not necessarily indicative of our future performance. You should read this information together with “Item 7—Management's Discussion and Analysis of Financial Condition and Results of Operations” and our consolidated financial statements and related notes included in Item 8 of this Annual Report on Form 10-K.
|
(Dollars in thousands, except per share data)
|
Year ended December 31, 2013
|
Year ended December 31, 2012
|
Year ended December 31, 2011
|
Year ended December 31, 2010
|
Year ended December 31, 2009
|
|||||||||||||||
|
Statement of operations data:
|
||||||||||||||||||||
|
Net sales
|
$ | 1,485,765 | $ | 1,176,306 | $ | 791,976 | $ | 592,880 | $ | 588,248 | ||||||||||
|
Costs of goods sold
|
916,205 | 735,906 | 497,322 | 355,523 | 352,398 | |||||||||||||||
|
Gross profit
|
569,560 | 440,400 | 294,654 | 237,357 | 235,850 | |||||||||||||||
|
Operating expenses:
|
||||||||||||||||||||
|
Selling and service
|
107,515 | 101,448 | 77,776 | 57,954 | 59,823 | |||||||||||||||
|
Research and development
|
29,271 | 23,499 | 16,476 | 14,700 | 10,842 | |||||||||||||||
|
General and administrative
|
55,490 | 46,031 | 30,012 | 22,599 | 14,713 | |||||||||||||||
|
Amortization of intangibles (1)
|
25,819 | 45,867 | 48,020 | 51,808 | 51,960 | |||||||||||||||
|
Trade name write-down (2)
|
— | — | 9,389 | — | — | |||||||||||||||
|
Total operating expenses
|
218,095 | 216,845 | 181,673 | 147,061 | 137,338 | |||||||||||||||
|
Income from operations
|
351,465 | 223,555 | 112,981 | 90,296 | 98,512 | |||||||||||||||
|
Other income (expense):
|
||||||||||||||||||||
|
Interest expense
|
(54,435 | ) | (49,114 | ) | (23,718 | ) | (27,397 | ) | (70,862 | ) | ||||||||||
|
(Loss) gain on extinguishment of debt (3)
|
(15,336 | ) | (14,308 | ) | (377 | ) | (4,809 | ) | 14,745 | |||||||||||
|
Investment income
|
91 | 79 | 110 | 235 | 2,205 | |||||||||||||||
|
Costs related to acquisition
|
(1,086 | ) | (1,062 | ) | (875 | ) | — | — | ||||||||||||
|
Other, net
|
(1,983 | ) | (2,798 | ) | (1,155 | ) | (1,105 | ) | (1,206 | ) | ||||||||||
|
Total other expense, net
|
(72,749 | ) | (67,203 | ) | (26,015 | ) | (33,076 | ) | (55,118 | ) | ||||||||||
|
Income before provision for income taxes
|
278,716 | 156,352 | 86,966 | 57,220 | 43,394 | |||||||||||||||
|
Provision (benefit) for income taxes (4)
|
104,177 | 63,129 | (237,677 | ) | 307 | 339 | ||||||||||||||
|
Net income
|
$ | 174,539 | $ | 93,223 | $ | 324,643 | $ | 56,913 | $ | 43,055 | ||||||||||
|
Income per share - diluted:
|
||||||||||||||||||||
|
Common Stock (formerly Class A non-voting common stock) (5)
|
2.51 | 1.35 | 4.79 | (1.65 | ) | (41,111 | ) | |||||||||||||
|
Class B Common Stock (5)
|
n/a | n/a | n/a | 505 | 4,171 | |||||||||||||||
|
Statement of cash flows data:
|
||||||||||||||||||||
|
Depreciation
|
10,955 | 8,293 | 8,103 | 7,632 | 7,715 | |||||||||||||||
|
Amortization
|
25,819 | 45,867 | 48,020 | 51,808 | 51,960 | |||||||||||||||
|
Expenditures for property and equipment
|
(30,770 | ) | (22,392 | ) | (12,060 | ) | (9,631 | ) | (4,525 | ) | ||||||||||
|
Other financial data:
|
||||||||||||||||||||
|
Adjusted EBITDA (6)
|
402,613 | 289,809 | 188,476 | 156,249 | 159,087 | |||||||||||||||
|
Adjusted Net Income (7)
|
301,664 | 220,792 | 147,176 | 115,954 | 83,643 | |||||||||||||||
|
(Dollars in thousands)
|
As of December 31, 2013
|
As of December 31, 2012
|
As of December 31, 2011
|
As of December 31, 2010
|
As of December 31, 2009
|
|||||||||||||||
|
Balance sheet data:
|
||||||||||||||||||||
|
Current assets
|
$ | 654,179 | $ | 522,553 | $ | 383,265 | $ | 272,519 | $ | 345,017 | ||||||||||
|
Property, plant and equipment, net
|
146,390 | 104,718 | 84,384 | 75,287 | 73,374 | |||||||||||||||
|
Goodwill
|
608,287 | 552,943 | 547,473 | 527,148 | 525,875 | |||||||||||||||
|
Other intangibles and other assets
|
389,349 | 423,633 | 537,671 | 334,929 | 392,977 | |||||||||||||||
|
Total assets
|
$ | 1,798,205 | $ | 1,603,847 | $ | 1,552,793 | $ | 1,209,883 | $ | 1,337,243 | ||||||||||
|
Total current liabilities
|
$ | 250,845 | $ | 294,859 | $ | 165,390 | $ | 86,685 | $ | 131,971 | ||||||||||
|
Long-term borrowings, less current portion
|
1,175,349 | 799,018 | 575,000 | 657,229 | 1,052,463 | |||||||||||||||
|
Other long-term liabilities
|
54,940 | 46,342 | 43,514 | 24,902 | 17,418 | |||||||||||||||
|
Redeemable stock (8)
|
— | — | — | — | 878,205 | |||||||||||||||
|
Stockholders' equity
|
317,071 | 463,628 | 768,889 | 441,067 | (742,814 | ) | ||||||||||||||
|
Total liabilities, redeemable stock and stockholders' equity (8)
|
$ | 1,798,205 | $ | 1,603,847 | $ | 1,552,793 | $ | 1,209,883 | $ | 1,337,243 | ||||||||||
(1) Our amortization of intangibles expenses includes the straight-line amortization of customer lists, patents and other finite-lived intangibles assets.
(2) During the fourth quarter of 2011, the Company decided to strategically transition certain products to their more widely known Generac brand. Based on this decision, the Company recorded a $9.4 million non-cash charge which primarily related to the write down of the impacted trade name to net realizable value.
(3) During 2013, the Company wrote-off a portion of deferred financing costs and original issue discount as a result of accelerated debt repayments in February and May 2013. Additionally, the Company recorded a loss on extinguishment of debt during 2013 as a result of the refinancing transaction that occurred on May 31, 2013. During 2012, the Company recorded a loss on extinguishment of debt related to the refinancing transactions that occurred on February 9, 2012 and May 30, 2012. During 2011 and 2010, the Company wrote-off a portion of deferred financing costs related to accelerated repayments of debt. During 2009, affiliates of CCMP acquired $9.9 million principal amount of first lien term loans and $20.0 million principal amount of second lien term loans for approximately $14.8 million. CCMP's affiliates exchanged this debt for 1,475.4596 shares of Series A Preferred Stock. The fair value of the shares exchanged was $14.8 million. We recorded this transaction as additional Series A Preferred Stock of $14.8 million based on the fair value of the debt contributed by CCMP's affiliates, which approximated the fair value of shares exchanged. The debt was held in treasury at face value. Consequently, we recorded a gain on extinguishment of debt of $14.7 million, which includes a write-off of deferred financing fees and other closing costs, in the consolidated statement of operations for the year ended December 31, 2009.
(4) The 2011 net tax benefit of $237.7 million includes a tax benefit of $271.4 million recorded due to the reversal of valuation allowances recorded on the Company’s net deferred tax assets. See Note 8 – Income Taxes in Item 8 of this Annual Report on Form 10-K for additional details.
(5) Diluted earnings per share reflects the impact of a reverse stock split which occurred immediately prior to the initial public offering (IPO). At the time of the IPO on February 17, 2010, all shares of Class B common stock were converted into shares of Class A common stock, and the Class A common stock became the one class of outstanding common stock.
(6) Adjusted EBITDA represents net income before interest expense, taxes, depreciation and amortization, as further adjusted for the other items reflected in the reconciliation table set forth below. The computation of adjusted EBITDA is based on the definition of EBITDA contained in Generac's New Term Loan Credit Agreement and New ABL Credit Agreement (terms defined in Item 7 - Management’s Discussion and Analysis of Financial Condition and Results of Operations – Liquidity and Financial Position), dated as of May 31, 2013, which is substantially the same definition that was contained in the Company’s previous credit agreements.
We view Adjusted EBITDA as a key measure of our performance. We present Adjusted EBITDA not only due to its importance for purposes of our New Term Loan Credit Agreement and New ABL Credit Agreement but also because it assists us in comparing our performance across reporting periods on a consistent basis because it excludes items that we do not believe are indicative of our core operating performance. Our management uses Adjusted EBITDA:
•
for planning purposes, including the preparation of our annual operating budget and developing and refining our internal projections for future periods;
•
to allocate resources to enhance the financial performance of our business;
•
as a benchmark for the determination of the bonus component of compensation for our senior executives under our management incentive plan, as described further in our Proxy Statement;
•
to evaluate the effectiveness of our business strategies and as a supplemental tool in evaluating our performance against our budget for each period; and
•
in communications with our board of directors and investors concerning our financial performance.
We believe Adjusted EBITDA is used by securities analysts, investors and other interested parties in the evaluation of our company. Management believes the disclosure of Adjusted EBITDA offers an additional financial metric that, when coupled with U.S. GAAP results and the reconciliation to U.S. GAAP results, provides a more complete understanding of our results of operations and the factors and trends affecting our business. We believe Adjusted EBITDA is useful to investors for the following reasons:
•
Adjusted EBITDA and similar non-GAAP measures are widely used by investors to measure a company's operating performance without regard to items that can vary substantially from company to company depending upon financing and accounting methods, book values of assets, tax jurisdictions, capital structures and the methods by which assets were acquired;
•
investors can use Adjusted EBITDA as a supplemental measure to evaluate the overall operating performance of our company, including our ability to service our debt and other cash needs; and
•
by comparing our Adjusted EBITDA in different historical periods, our investors can evaluate our operating performance excluding the impact of items described below.
The adjustments included in the reconciliation table listed below are provided for under our New Term Loan Credit Agreement and New ABL Credit Agreement and also are presented to illustrate the operating performance of our business in a manner consistent with the presentation used by our management and board of directors. These adjustments eliminate the impact of a number of items that:
•
we do not consider indicative of our ongoing operating performance, such as non-cash write-down and other charges, non-cash gains and write-offs relating to the retirement of debt, severance costs and other restructuring-related business optimization expenses;
•
we believe to be akin to, or associated with, interest expense, such as administrative agent fees, revolving credit facility commitment fees and letter of credit fees;
• are non-cash in nature, such as share-based compensation; or
•
were eliminated following the consummation of our initial public offering.
We explain in more detail in footnotes (a) through (d) below why we believe these adjustments are useful in calculating Adjusted EBITDA as a measure of our operating performance.
Adjusted EBITDA does not represent, and should not be a substitute for, net income or cash flows from operations as determined in accordance with U.S. GAAP. Adjusted EBITDA has limitations as an analytical tool, and you should not consider it in isolation, or as a substitute for analysis of our results as reported under U.S. GAAP. Some of the limitations are:
•
Adjusted EBITDA does not reflect our cash expenditures, or future requirements for capital expenditures or contractual commitments;
•
Adjusted EBITDA does not reflect changes in, or cash requirements for, our working capital needs;
•
Adjusted EBITDA does not reflect the significant interest expense, or the cash requirements necessary to service interest or principal payments, on our debt;
•
although depreciation and amortization are non-cash charges, the assets being depreciated and amortized will often have to be replaced in the future, and Adjusted EBITDA does not reflect any cash requirements for such replacements;
•
several of the adjustments that we use in calculating Adjusted EBITDA, such as non-cash write-downs and other charges, while not involving cash expense, do have a negative impact on the value our assets as reflected in our consolidated balance sheet prepared in accordance with U.S. GAAP;
•
other companies may calculate Adjusted EBITDA differently than we do, limiting its usefulness as a comparative measure.
Furthermore, as noted above, one of our uses of Adjusted EBITDA is as a benchmark for determining elements of compensation for our senior executives. At the same time, some or all of these senior executives have responsibility for monitoring our financial results generally, including the items that are included as adjustments in calculating Adjusted EBITDA (subject ultimately to review by our board of directors in the context of the board's review of our financial statements). While many of the adjustments (for example, transaction costs and credit facility fees), involve mathematical application of items reflected in our financial statements, others involve a degree of judgment and discretion. While we believe that all of these adjustments are appropriate, and while the calculations are subject to review by our board of directors in the context of the board's review of our financial statements and certification by our chief financial officer in a compliance certificate provided to the lenders under our New Term Loan Credit Agreement and New ABL Credit Agreement, this discretion may be viewed as an additional limitation on the use of Adjusted EBITDA as an analytical tool.
Because of these limitations, Adjusted EBITDA should not be considered as a measure of discretionary cash available to us to invest in the growth of our business. We compensate for these limitations by relying primarily on our U.S. GAAP results and using Adjusted EBITDA only supplementally.
The following table presents a reconciliation of net income to Adjusted EBITDA:
|
(Dollars in thousands)
|
Year ended December 31, 2013
|
Year ended December 31, 2012
|
Year ended December 31, 2011
|
Year ended December 31, 2010
|
Year ended December 31, 2009
|
|||||||||||||||
|
Net income
|
$ | 174,539 | $ | 93,223 | $ | 324,643 | $ | 56,913 | $ | 43,055 | ||||||||||
|
Interest expense
|
54,435 | 49,114 | 23,718 | 27,397 | 70,862 | |||||||||||||||
|
Depreciation and amortization
|
36,774 | 54,160 | 56,123 | 59,440 | 59,675 | |||||||||||||||
|
Income taxes provision (benefit)
|
104,177 | 63,129 | (237,677 | ) | 307 | 339 | ||||||||||||||
|
Non-cash write-down and other charges (income) (a)
|
78 | 247 | 10,400 | (361 | ) | (1,592 | ) | |||||||||||||
|
Non-cash share-based compensation expense (b)
|
12,368 | 10,780 | 8,646 | 6,363 | — | |||||||||||||||
|
Loss (gain) on extinguishment of debt (c)
|
15,336 | 14,308 | 377 | 4,809 | (14,745 | ) | ||||||||||||||
|
Transaction costs and credit facility fees (d)
|
3,863 | 4,117 | 1,719 | 1,019 | 1,188 | |||||||||||||||
|
Other
|
1,043 | 731 | 527 | 362 | 305 | |||||||||||||||
|
Adjusted EBITDA
|
$ | 402,613 | $ | 289,809 | $ | 188,476 | $ | 156,249 | $ | 159,087 | ||||||||||
(a) Represents the following non-cash charges:
•
for the years ended December 31, 2013 and 2012, includes loss on disposals of assets, unrealized mark-to-market adjustments on commodity contracts and adjustments to an earn-out obligation in connection with a permitted business acquisition, as defined in our credit agreement;
•
for the year ended December 31, 2011, primarily $9.4 million trade name write-down relating to the Comopany’s descision to strategically transition certain products to their more widely know Generac brand as further described in "Item 7 - Management's Discussion and Analysis of Financial Condition and Results of Operations—Critical accounting policies—Goodwill and other intangible assets." Also includes unrealized mark-to-market adjustments on copper forward contracts and loss on disposal of assets;
•
for the years ended December 31, 2010 and 2009, primarily unrealized mark-to-market adjustments on copper and Euro forward contracts and loss on disposal of assets;
We believe that adjusting net income for these non-cash charges is useful for the following reasons:
•
The loss on disposals of assets in several periods described above result from the sale of assets that are no longer useful in our business and therefore represent losses that are not from our core operations;
•
The adjustments for unrealized mark-to-market gains and losses on commodity and Euro forward contracts represent non-cash items to reflect changes in the fair value of forward contracts that have not been settled or terminated. We believe it is useful to adjust net income for these items because the charges do not represent a cash outlay in the period in which the charge is incurred,
although Adjusted EBITDA must always be used together with our U.S. GAAP statements of income and cash flows to capture the full effect of these contracts on our operating performance;
•
The trade name write-down recorded in the year ended December 31, 2011 is a one-time charge that we believe does not reflect our ongoing operations;
(b) Represents share-based compensation expense to account for stock options, restricted stock and other stock awards over their vesting period.
(c) Represents the loss (gain) on extinguishment of debt from:
•
for the year ended December 31, 2013, represents the write-off of a portion of deferred financing costs and original issue discount related to accelerated repayments of debt in February and May 2013, as well as the loss on extinguishment of debt related to the refinancing transaction that occurred on May 31, 2013.
•
for the year ended December 31, 2012, represents the loss on extinguishment of debt related to the refinancing transactions that occurred on February 9, 2012 and May 30, 2012;
•
for the years ended December 31, 2011 and 2010, represents the write-off of a portion of deferred financing costs related to accelerated repayments of debt;
•
for the year ended December 31, 2009, represents non-cash gains on the extinguishment of debt repurchased by affiliates of CCMP, as described in note (3) above, which we do not expect to recur;
(d) Represents transaction costs incurred directly in connection with any investment, as defined in our credit agreement, equity issuance or debt issuance or refinancing, together with certain fees relating to our New Term Loan Credit Agreement and New ABL Credit Agreement, such as:
•
administrative agent fees and revolving credit facility commitment fees under our New Term Loan Credit Agreement and New ABL Credit Agreement, which we believe to be akin to, or associated with, interest expense and whose inclusion in Adjusted EBITDA is therefore similar to the inclusion of interest expense in that calculation;
•
transaction costs relating to the acquisition of a business;
•
other financing costs incurred relating to the dividend recapitalization transactions completed in May 2012 and 2013;
•
before 2011, transaction costs relating to repurchases of debt under our first and second lien credit facilities by affiliates of CCMP, which CCMP's affiliates contributed to our company in exchange for the issuances of securities, which repurchases we do not expect to recur;
(7) Adjusted Net Income is defined as net income before provision (benefit) for income taxes adjusted for the following items: cash income tax expense, amortization of intangible assets, amortization of deferred financing costs and original issue discount related to the Company’s debt, losses (gains) on extinguishment of the Company’s debt, intangible asset impairment charges, transaction costs and other purchase accounting adjustments, and certain non-cash gains and losses as reflected in the reconciliation table set forth below.
We believe Adjusted Net Income is used by securities analysts, investors and other interested parties in the evaluation of our company operations. Management believes the disclosure of Adjusted Net Income offers an additional financial metric that, when used in conjunction with U.S. GAAP results and the reconciliation to U.S. GAAP results, provides a more complete understanding of our results of operations, our cash flows, and the factors and trends affecting our business.
The adjustments included in the reconciliation table listed below are presented to illustrate the operating performance of our business in a manner consistent with the presentation used by investors and securities analysts. Similar to the Adjusted EBITDA reconciliation, these adjustments eliminate the impact of a number of items we do not consider indicative of our ongoing operating performance or cash flows, such as amortization costs, transaction costs and write-offs relating to the retirement of debt. We also make adjustments to present cash taxes paid as a result of our favorable tax attributes.
Similar to Adjusted EBITDA, Adjusted Net Income does not represent, and should not be a substitute for, net income or cash flows from operations as determined in accordance with U.S. GAAP. Adjusted Net Income has limitations as an analytical tool, and you should not consider it in isolation, or as a substitute for analysis of our results as reported under U.S. GAAP. Some of the limitations are:
• Adjusted Net Income does not reflect changes in, or cash requirements for, our working capital needs;
• although amortization is a non-cash charge, the assets being amortized may have to be replaced in the future, and Adjusted Net Income does not reflect any cash requirements for such replacements;
• other companies may calculate Adjusted Net Income differently than we do, limiting its usefulness as a comparative measure.
The following table presents a reconciliation of net income to Adjusted Net Income:
|
(Dollars in thousands)
|
Year ended December 31, 2013
|
Year ended December 31, 2012
|
Year ended December 31, 2011
|
Year ended December 31, 2010
|
Year ended December 31, 2009
|
|||||||||||||||
|
Net income
|
$ | 174,539 | $ | 93,223 | $ | 324,643 | $ | 56,913 | $ | 43,055 | ||||||||||
|
Provision (benefit) for income taxes
|
104,177 | 63,129 | (237,677 | ) | 307 | 339 | ||||||||||||||
|
Income before provision (benefit) for income taxes
|
278,716 | 156,352 | 86,966 | 57,220 | 43,394 | |||||||||||||||
|
Amortization of intangible assets
|
25,819 | 45,867 | 48,020 | 51,808 | 51,960 | |||||||||||||||
|
Amortization of deferred finance costs and original issue discount
|
4,772 | 3,759 | 1,986 | 2,439 | 3,417 | |||||||||||||||
|
Loss (gain) on extinguishment of debt
|
15,336 | 14,308 | 377 | 4,809 | (14,745 | ) | ||||||||||||||
|
Trade name write-down
|
— | — | 9,389 | — | — | |||||||||||||||
|
Transaction costs and other purchase accounting adjustments
|
2,842 | 3,317 | 875 | — | — | |||||||||||||||
|
Adjusted net income before provision for income taxes
|
327,485 | 223,603 | 147,613 | 116,276 | 84,026 | |||||||||||||||
|
Cash income tax expense
|
(25,821 | ) | (2,811 | ) | (437 | ) | (322 | ) | (383 | ) | ||||||||||
|
Adjusted net income
|
$ | 301,664 | $ | 220,792 | $ | 147,176 | $ | 115,954 | $ | 83,643 | ||||||||||
(8) Includes our Series A Preferred Stock and Class B Common Stock.
The following discussion and analysis of our financial condition and results of operations should be read together with “Item 6 - Selected Financial Data” and the consolidated financial statements and the related notes included in Item 8 of this Annual Report on Form 10-K. This discussion contains forward-looking statements, based on current expectations and related to future events and our future financial performance, that involve risks and uncertainties. Our actual results may differ materially from those anticipated in these forward-looking statements as a result of many factors, including those set forth under “Item 1A - Risk Factors.”
Overview
We are a leading designer and manufacturer of a wide range of power generation equipment and other engine powered products serving the residential, light commercial, industrial and construction markets. Unlike our primary competitors in the generator market, power generation is our main focus. As the only significant market participant focused predominantly on these products, we have one of the leading market positions in the power equipment market in North America and an expanding presence internationally. We believe we have one of the widest range of products in the marketplace, including residential, commercial and industrial standby generators, as well as portable and mobile generators used in a variety of applications. Other engine powered products that we design and manufacture include light towers which provide temporary lighting for various end markets and a broad product line of power washers for residential and commercial use.
Business drivers and operational factors
In operating our business and monitoring its performance, we pay attention to a number of business drivers and trends as well as operational factors. The statements in this section are based on our current expectations.
Business drivers and trends
Our performance is affected by the demand for reliable power solutions by our customer base. This demand is influenced by several important drivers and trends affecting our industry, including the following:
Increasing penetration opportunity.
Many potential customers are not aware of the costs and benefits of automatic backup power solutions. We estimate that penetration rates for home standby generators are only approximately 3.0% of U.S. single-family detached, owner-occupied households with a home value of over $100,000, as defined by the U.S. Census Bureau's 2011 American Housing Survey for the United States. The decision to purchase backup power for many light-commercial buildings such as convenience stores, restaurants and gas stations are more return-on-investment (ROI) driven and as a result these applications have relatively lower penetration rates as compared to buildings used in more code-driven or mission critical applications such as hospitals, wastewater treatment facilities, 911 call centers, data centers and certain industrial locations. In addition, the emergence of lower cost, cleaner burning natural gas fueled generators has helped to accelerate the penetration of standby generators in the light-commercial market. Also, the importance of backup power for telecommunications infrastructure is increasing due to the growing importance for uninterrupted voice and data services. We believe by expanding our distribution network, continuing to develop our product line, and targeting our marketing efforts, we can continue to build awareness and increase penetration for our standby generators.
Effect of large scale power disruptions.
Power disruptions are an important driver of customer awareness and have historically influenced demand for generators. Increased frequency and duration of major power outage events caused by the aging U.S. power grid increases product awareness and may drive consumers to accelerate their purchase of a standby or portable generator during the immediate and subsequent period, which we believe may last for six to twelve months for standby generators. For example, the multiple major outage events that occurred during the second half of both 2011 and 2012 drove strong demand for portable and home standby generators, and the increased awareness of these products contributed to substantial organic revenue growth in 2012 with strong growth continuing during 2013. While there are localized power outages that occur practically every day across the U.S., major outage activity is unpredictable by nature and, as a result, our sales levels and profitability may fluctuate from period to period.
Impact of residential investment cycle.
The market for residential generators is also affected by the residential investment cycle and overall consumer confidence and sentiment. When homeowners are confident of their household income, the value of their home and overall net worth, they are more likely to invest in their home. These trends can have an impact on demand for residential generators. Trends in the new housing market highlighted by residential housing starts can also impact demand for our residential products.
Impact of business capital investment cycle.
The market for our commercial and industrial products is affected by the overall capital investment cycle, including non-residential building construction, durable goods and infrastructure spending as well as investments in the exploration and production of oil & gas, as businesses or organizations either add new locations or make investments to upgrade existing locations or equipment. These trends can have a material impact on demand for these products. The capital investment cycle may differ for the various commercial and industrial end markets that we serve including light commercial, retail, telecommunications, industrial, data centers, healthcare, construction, oil & gas and municipal infrastructure, among others. The market for these products is also affected by general economic conditions and credit availability in the geographic regions that we serve. In addition, we believe demand for our mobile power products will continue to benefit from a secular shift towards renting versus buying this type of equipment.
We are subject to various factors that can affect our results of operations, which we attempt to mitigate through factors we can control, including continued product development, expanded distribution, pricing and cost control. Certain operational and other factors that affect our business include the following:
Effect of commodity, currency and component price fluctuations.
Industry-wide price fluctuations of key commodities, such as steel, copper and aluminum and other components we use in our products, together with foreign currency fluctuations, can have a material impact on our results of operations. We have historically attempted to mitigate the impact of rising commodity, currency and component prices through improved product design and sourcing, manufacturing efficiencies, price increases and select hedging transactions. Our results are also influenced by changes in fuel prices in the form of freight rates, which in some cases are borne by our customers and in other cases are paid by us.
Seasonality.
Although there is demand for our products throughout the year, in each of the past three years approximately 16% to 27% of our net sales occurred in the first quarter, 20% to 23% in the second quarter, 24% to 30% in the third quarter and 25% to 34% in the fourth quarter, with different seasonality depending on the presence, timing and severity of major power outage activity in each year. Major outage activity is unpredictable by nature and, as a result, our sales levels and profitability may fluctuate from period to period. For example, there were multiple major power outage events that occurred during the second half of both 2011 and 2012, which were significant in terms of severity. As a result, the seasonality experienced during this time period varied relative to other periods where no major outage events occurred. We maintain a flexible production and supply chain infrastructure in order to respond to outage-driven peak demand, but assuming no major outage events, typically increase production levels in the second and third quarters of each year.
Factors influencing interest expense.
Interest expense can be impacted by a variety of factors, including market fluctuations in LIBOR, interest rate election periods, interest rate swap agreements and repayments of indebtedness. Interest expense increased during 2013 compared to 2012, primarily due to an increase in outstanding debt and the full-year weighted-average cost of debt associated with our credit agreement refinancings. See Note 6 – Credit Agreements in Item 8 of this Annual Report on Form 10-K for additional details.
Factors influencing provision for income taxes and cash income taxes paid.
We had approximately $960 million of tax-deductible goodwill and intangible asset amortization remaining as of December 31, 2013 related to our acquisition by CCMP in 2006 that we expect to generate cash tax savings of approximately $374 million through 2021, assuming continued profitability and a 39% tax rate. The recognition of the tax benefit associated with these assets for tax purposes is expected to be $122 million annually through 2020 and $102 million in 2021, which generates annual cash tax savings of $48 million through 2020 and $40 million in 2021, assuming profitability and a 39% tax rate. As a result of the asset acquisition of the Magnum Products business in the fourth quarter of 2011, we had approximately $48.3 million of incremental tax deductible goodwill and intangible assets remaining as of December 31, 2013. We expect these assets to generate cash tax savings of $18.9 million through 2026 assuming continued profitability and a 39% tax rate. The amortization of these assets for tax purposes is expected to be $3.8 million annually through 2025 and $2.8 million in 2026, which generates an additional annual cash tax savings of $1.5 million through 2025 and $1.1 million in 2026, assuming profitability and a 39% tax rate. Based on current business plans, we believe that our cash tax obligations through 2026 will be significantly reduced by these tax attributes. Other domestic acquisitions have resulted in additional tax deductible goodwill and intangible assets that will generate tax savings, but are not material to the Company’s consolidated financial statements.
In the second quarter of 2013, the dividend recapitalization discussed under “Liquidity and financial position” was completed. After considering the increased debt and related interest expense, the Company believes it will still generate sufficient taxable income to fully utilize the tax attributes discussed above.
Transactions with CCMP
In November 2006, affiliates of CCMP, together with certain other investors and members of our management, purchased an aggregate of $689 million of our equity capital. In addition, on November 10, 2006, Generac Power Systems borrowed an aggregate of $1.38 billion, consisting of an initial drawdown of $950 million under a $1.1 billion first lien secured credit facility and $430 million under a $430 million second lien secured credit facility. With the proceeds from these equity and debt financings, together with cash on hand at Generac Power Systems, we (1) acquired all of the capital stock of Generac Power Systems and repaid certain pre-transaction indebtedness of Generac Power Systems for $2.0 billion, (2) paid $66 million in transaction costs related to the transaction and (3) retained $3 million for general corporate purposes. Subsequently, during 2007, 2008 and 2009, affiliates of CCMP acquired approximately $249.2 million of second lien term loans and $9.9 million of first lien term loans for approximately $155.9 million. CCMP’s affiliates then exchanged this debt for additional shares of then-existing Class B Common Stock and Series A Preferred Stock, which were subsequently converted into the same class of our common stock through a corporate reorganization in conjunction with the initial public offering in February 2010.
In August 2013, CCMP completed the last of a series of sale transactions that began in November 2012 by which it sold substantially all of the shares of common stock that it owned as of the initial public offering.
Initial public offering
On February 17, 2010, the Company completed its initial public offering of 18,750,000 shares of its common stock at a price of $13.00 per share. In addition, the underwriters exercised their option and purchased an additional 1,950,500 shares of the Company’s common stock from the Company on March 18, 2010. We received a total of approximately $247.9 million in net proceeds from the initial public offering and underwriters’ option exercise, after deducting the underwriting discounts and expenses. All shares sold in this offering were primary shares. Immediately following the IPO and underwriters’ option exercise, we had 67,529,290 total shares of common stock outstanding.
Components of net sales and expenses
Net sales
Substantially all of our net sales are generated through the sale of our generators and other engine powered products for the residential, light commercial, industrial and construction markets. We also sell engines to certain customers and service parts to our dealer network. Net sales, which include shipping and handling charges billed to customers, are recognized upon shipment of products to our customers. Related freight costs are included in cost of sales. Our generators and other products are fueled by natural gas, liquid propane, gasoline, diesel or Bi-Fuel™ systems with power output from 800W to several megawatts (mW) using our multi-generator systems. Our products are primarily manufactured and assembled at our Wisconsin (USA), Mexico, Italy and Brazil facilities and distributed through thousands of outlets primarily across the U.S. and Canada, with an expanding presence internationally including Latin America, Europe, the Middle East, Africa and Asia/Pacific regions. Our smaller kW generators for the residential and commercial markets, as well as light towers and power washers, are primarily built to stock, while our larger kW products for the industrial markets are generally customized and built to order.
During 2013, our net sales were affected primarily by the U.S. economy as sales outside of the United States represented approximately 12% of total net sales.
We are not dependent on any one channel or customer for our net sales, with no single customer representing more than 6% of our sales for the year ended December 31, 2013 and our top ten customers representing less than 24% of our sales for the same period.
Costs of goods sold
The principal elements of costs of goods sold in our manufacturing operations are component parts, raw materials, factory overhead and labor. Component parts and raw materials comprised over 85% of costs of goods sold for the year ended December 31, 2013. The principal component parts are engines and alternators. We design and manufacture air-cooled engines for certain of our products up to 20kW. We source engines for certain of our smaller products and all of our products larger than 20kW. For natural gas engines, we’re recognized as the OEM of those engines. We design all the alternators for our units and manufacture alternators for certain of our units. We also manufacture other generator components where we believe we have a design and cost advantage. We source component parts from an extensive global network of reliable, high quality suppliers. In some cases, these relationships are proprietary.
The principal raw materials used in our manufacturing and warehousing processes and in the manufacturing of the components we source are steel, copper and aluminum. We are susceptible to fluctuations in the cost of these commodities, impacting our costs of goods sold. We seek to mitigate the impact of commodity prices on our business through a continued focus on global sourcing, product design improvements, manufacturing efficiencies, price increases and select hedging transactions. However, there is typically a lag between raw material price fluctuations and their effect on our costs of goods sold.
Other sources of costs include our manufacturing and warehousing facilities, factory overhead, labor and shipping costs. Factory overhead includes utilities, support personnel, depreciation, general supplies, support and maintenance. Although we attempt to maintain a flexible manufacturing cost structure, our margins can be impacted when we cannot timely adjust labor and manufacturing costs to match fluctuations in net sales.
Operating expenses
Our operating expenses consist of costs incurred to support our sales, marketing, distribution, service parts, engineering, information systems, human resources, finance, risk management, legal and tax functions. All of these categories include personnel costs such as salaries, bonuses, employee benefit costs and taxes. We typically classify our operating expenses into four categories: selling and service, research and development, general and administrative, and amortization of intangibles.
Selling and service.
Our selling and service expenses consist primarily of personnel expense, marketing expense, warranty expense and other sales expenses. Our personnel expense recorded in selling and services expenses includes the expense of our sales force responsible for our national accounts and other personnel involved in the marketing, sales and service of our products. Warranty expense, which is recorded at the time of sale, is estimated based on historical trends. Our marketing expenses include direct mail costs, printed material costs, product display costs, market research expenses, trade show expenses, media advertising and co-op advertising costs. Marketing expenses are generally related to the launch of new product offerings and opportunities within selected markets or associated with specific events such as awareness marketing in areas impacted by major power outages, participation in trade shows and other events.
Research and development.
Our research and development expenses support numerous projects covering all of our product lines. We currently operate engineering facilities at eight locations globally and employ over 250 personnel with focus on new product development, existing product improvement and cost containment. Our commitment to research and development has resulted in a significant portfolio of over 100 U.S. and international patents and patent applications. Our research and development costs are expensed as incurred.
General and administrative.
Our general and administrative expenses include personnel costs for general and administrative employees, accounting and legal professional services fees, information technology costs, insurance, travel and entertainment expense and other corporate expense.
Amortization of intangibles.
Our amortization of intangibles expenses include the straight-line amortization of definite-lived customer lists, patents and other intangibles assets.
Goodwill and trade name.
Goodwill primarily represents the excess of the amount paid over the fair market value of net tangible and intangible assets acquired in business combinations.
Other indefinite-lived intangible assets consist of trade names. The fair value of trade names is measured using a relief-from-royalty approach, which assumes the fair value of the trade name is the discounted cash flows of the amount that would be paid had we not owned the trade name and instead licensed the trade name from another company.
During the fourth quarter of 2011, we recorded a non-cash charge which primarily related to the write down of a certain trade name. We refer you to Note 2-Significant accounting policies-Goodwill and other indefinite-lived intangible assets in Item 8 of this Annual Report on Form 10-K for additional information about this charge.
Other income (expense)
Other income (expense) includes the interest expense on our outstanding borrowings, amortization of debt financing costs and original issue discount as well as expenses related to interest rate swap agreements. Other income (expense) also includes other financial items such as loss on extinguishment of debt and interest income earned on our cash and cash equivalents.
Costs related to acquisition.
In 2013, other expenses include one-time transaction-related expenses related to the acquisitions of Tower Light and Baldor Generators. In 2012, other expenses include one-time transaction-related expenses related to the acquisition of the Ottomotores businesses. In 2011, other expenses include one-time transaction-related expenses related to the acquisition of the Magnum business.
Results of operations
Year ended December 31, 2013 compared to year ended December 31, 2012
The following table sets forth our consolidated statement of operations data for the periods indicated:
|
(Dollars in thousands)
|
Year ended December 31, 2013
|
Year ended December 31, 2012
|
||||||
|
Net sales
|
$ | 1,485,765 | $ | 1,176,306 | ||||
|
Costs of goods sold
|
916,205 | 735,906 | ||||||
|
Gross profit
|
569,560 | 440,400 | ||||||
|
Operating expenses:
|
||||||||
|
Selling and service
|
107,515 | 101,448 | ||||||
|
Research and development
|
29,271 | 23,499 | ||||||
|
General and administrative
|
55,490 | 46,031 | ||||||
|
Amortization of intangibles
|
25,819 | 45,867 | ||||||
|
Total operating expenses
|
218,095 | 216,845 | ||||||
|
Income from operations
|
351,465 | 223,555 | ||||||
|
Total other expense, net
|
(72,749 | ) | (67,203 | ) | ||||
|
Income before provision for income taxes
|
278,716 | 156,352 | ||||||
|
Provision for income taxes
|
104,177 | 63,129 | ||||||
|
Net income
|
$ | 174,539 | $ | 93,223 | ||||
|
(Dollars in thousands)
|
Year ended December 31, 2013
|
Year ended December 31, 2012
|
||||||
|
Residential power products
|
$ | 843,727 | $ | 705,444 | ||||
|
Commercial & Industrial power products
|
569,890 | 410,341 | ||||||
|
Other
|
72,148 | 60,521 | ||||||
|
Net sales
|
$ | 1,485,765 | $ | 1,176,306 | ||||
Net sales.
Net sales increased $309.5 million, or 26.3%, to $1,485.8 million for the year ended December 31, 2013 from $1,176.3 million for the year ended December 31, 2012. Residential product sales increased 19.6% to $843.7 million from $705.4 million for the comparable period in 2012. The increase in residential product sales was primarily driven by increases in shipments for home standby generators due to a combination of factors including the additional awareness and adoption of our products created by major power outages in recent years, the Company’s expanded distribution, increased sales and marketing initiatives, overall strong operational execution and an improving environment for residential investment. The strength in home standby generators was partially offset by a decline in shipments of portable generators due to less severe power outage events relative to the prior year. In addition, increased revenue from power washer products contributed to the year-over-year sales growth in residential products. Commercial & industrial product sales increased 38.9% to $569.9 million from $410.3 million for the comparable period in 2012. The increase was driven by the acquisitions of Ottomotores, Tower Light and Baldor Generators along with strong organic growth for stationary and mobile generators. The increase in organic revenues was primarily driven by strong shipments to national account customers and increased sales of natural gas generators used in light commercial applications.
Gross profit.
Gross profit increased $129.2 million, or 29.3%, to $569.6 million for the year ended December 31, 2013 from $440.4 million for the year ended December 31, 2012. Gross profit margin for the year ended December 31, 2013 increased to 38.3% from 37.4% for the year ended December 31, 2012. Gross margin improved over the prior year due to the combination of improved product mix, improved pricing and a moderation in product costs due to lower commodity prices and execution of cost reduction initiatives. These margin improvements were partially offset by the mix impact from the Ottomotores and Baldor acquisitions.
Operating expenses.
Operating expenses increased $1.3 million to $218.1 million for the year ended December 31, 2013 from $216.8 million for the year ended December 31, 2012. Operating expenses increased as a result of the addition of the Ottomotores, Tower Light and Baldor Generator businesses, as well as increased sales, engineering and administrative infrastructure to support the strategic growth initiatives and higher sales levels of the Company. These increases were mostly offset by warranty rate improvements resulting in a $17.6 million favorable adjustment to warranty reserves driven by better claims experience, which impacted selling and service expense, as well as a decline in the amortization of intangibles.
Other expense.
Other expense increased $5.5 million, or 8.3%, to $72.7 million for the year ended December 31, 2013 from $67.2 million for the year ended December 31, 2012. These additional expenses were primarily driven by an increase in interest expense over prior year. Interest expense increased by $5.3 million, or 10.8% over the prior year due to the higher debt levels from the May 2012 and 2013 refinancing transactions, partially offset by a slight reduction in interest rate on the new credit facility.
Income tax expense.
Income tax expense increased $41.1 million to $104.2 million for the year ended December 31, 2013 from $63.1 million for the year ended December 31, 2012. The increase in income tax expense was primarily driven by the increase in pre-tax income during 2013 compared to 2012, partially offset by a lower effective tax rate. The decrease in the effective income tax rate year-over-year is primarily due to the lower tax rate of a foreign subsidiary acquired during the fourth quarter of 2012 and the reinstatement of the federal research and development tax credit in 2013.
Net income.
As a result of the factors identified above, we generated net income of $174.5 million for the year ended December 31, 2013 compared to $93.2 million for the year ended December 31, 2012. The increase in net income is due to the items previously described.
Adjusted EBITDA.
Adjusted EBITDA, as reconciled in
“Item 6 - Selected Financial Data,”
increased to $402.6 million as compared to $289.8 million in 2012 due to the factors discussed above.
Adjusted net income.
Adjusted Net Income
, as reconciled in
“Item 6 - Selected Financial Data,”
increased to $301.7 million in 2013 compared to $220.8 million in 2012 due to the factors discussed above.
Year ended December 31, 2012 compared to year ended December 31, 2011
|
(Dollars in thousands)
|
Year ended December 31, 2012
|
Year ended December 31, 2011
|
||||||
|
Net sales
|
$ | 1,176,306 | $ | 791,976 | ||||
|
Costs of goods sold
|
735,906 | 497,322 | ||||||
|
Gross profit
|
440,400 | 294,654 | ||||||
|
Operating expenses:
|
||||||||
|
Selling and service
|
101,448 | 77,776 | ||||||
|
Research and development
|
23,499 | 16,476 | ||||||
|
General and administrative
|
46,031 | 30,012 | ||||||
|
Amortization of intangibles
|
45,867 | 48,020 | ||||||
|
Trade name write-down
|
- | 9,389 | ||||||
|
Total operating expenses
|
216,845 | 181,673 | ||||||
|
Income from operations
|
223,555 | 112,981 | ||||||
|
Total other expense, net
|
(67,203 | ) | (26,015 | ) | ||||
|
Income before provision for income taxes
|
156,352 | 86,966 | ||||||
|
Provision (benefit) for income taxes
|
63,129 | (237,677 | ) | |||||
|
Net income
|
$ | 93,223 | $ | 324,643 | ||||
|
(Dollars in thousands)
|
Year ended December 31, 2012
|
Year ended December 31, 2011
|
||||||
|
Residential power products
|
705,444 | 491,016 | ||||||
|
Commercial & Industrial power products
|
410,341 | 250,270 | ||||||
|
Other
|
60,521 | 50,690 | ||||||
|
Net sales
|
1,176,306 | 791,976 | ||||||
Net sales. Net sales increased $384.3 million, or 48.5%, to $1,176.3 million for the year ended December 31, 2012 from $792.0 million for the year ended December 31, 2011. This increase was driven by a $214.4 million, or a 43.7% increase in residential product sales largely driven by increased demand created by major power outages in recent quarters along with expanded distribution and new product offerings. Commercial & industrial product sales increased $160.1million, or 64.0%, driven primarily by the additional Magnum Products revenue, and to a lesser extent, increased shipments of natural gas backup generators.
Gross profit.
Gross profit increased $145.7 million, or 49.5%, to $440.4 million for the year ended December 31, 2012 from $294.7 million for the year ended December 31, 2011. Gross profit margin for the year ended December 31, 2012 increased to 37.4% from 37.2% for the year ended December 31, 2011. Gross margin increased over the prior year primarily due to the positive impact from price increases, improved manufacturing overhead absorption and moderation in commodity costs relative to the prior year. These margin improvements were partially offset by the mix impact from the addition of Magnum Products sales.
Operating expenses.
Operating expenses increased $35.2 million to $216.8 million for the year ended December 31, 2012 from $181.7 million for the year ended December 31, 2011. These additional expenses were driven primarily by operating expenses associated with Magnum, increased sales, engineering and administrative infrastructure to support the strategic growth initiatives and higher sales levels of the Company, increased incentive compensation expenses as a result of the Company’s financial performance during the year, and increased variable expenses resulting from the increase in organic sales.
Other expense.
Other expense increased $41.2 million, or 158.3%, to $67.2 million for the year ended December 31, 2012 from $26.0 million for the year ended December 31, 2011. Interest expense increased by $25.4 million, or 107.1% as a result of the higher debt levels from the May 2012 refinancing transaction. In addition, losses on extinguishment of debt increased $13.9 million in 2012 as a result of the February 2012 and May 2012 debt refinancing transactions.
Income tax expense.
Income tax expense increased $300.8 million to a provision of $63.1 million for the year ended December 31, 2012 from a benefit of $237.7 million for the year ended December 31, 2011. The large income tax benefit in the prior year consisted primarily of the reversal of the full valuation allowance on the Company’s net deferred tax assets. We refer you to Note 9, “Income Taxes,” of our consolidated financial statements included in Item 8 of this Annual Report on Form 10-K for additional information.
Net income.
As a result of the factors identified above, we generated net income of $93.2 million for the year ended December 31, 2012 compared to net income of $324.6 million for the year ended December 31, 2011. The decrease in net income is due to the items previously described.
Adjusted EBITDA.
Adjusted EBITDA, as reconciled in
“Item 6 - Selected Financial Data,”
increased to $289.8 million as compared to $188.5 million in 2011 due to the factors discussed above.
Adjusted net income.
Adjusted Net Income
, as reconciled in
“Item 6 - Selected Financial Data,”
increased to $220.8 million in 2012 compared to $147.2 million in 2011 due to the factors discussed above.
Liquidity and financial position
Our primary cash requirements include payment for our raw material and component supplies, salaries & benefits, operating expenses, interest and principal payments on our debt and capital expenditures. We finance our operations primarily through cash flow generated from operations and, if necessary, borrowings under our revolving credit facility.
In February 2012, we paid in full our previously existing debt and entered into a new credit agreement (Credit Agreement). The Credit Agreement provided for borrowings under a $150.0 million revolving credit facility, a $325.0 million tranche A term loan facility and a $250.0 million tranche B term loan facility. Proceeds received from loans made under the Credit Agreement were used to repay in full all outstanding borrowings under the former credit agreement, dated as of November 10, 2006, as amended from time to time, and for general corporate purposes.
In May 2012, we amended and restated our then existing Credit Agreement by entering into a new credit agreement (Term Loan Credit Agreement) and a new revolving credit agreement (ABL Credit Agreement). The Term Loan Credit Agreement provided for a $900.0 million term loan B credit facility (Term Loan) and included a $125.0 million uncommitted incremental term loan facility and the ABL Credit Agreement provided for borrowings under a $150.0 million senior secured ABL revolving credit facility and an uncommitted $50.0 million incremental revolving credit facility. A portion of the proceeds from the Term Loan were used to repay the previous Credit Agreement. The remaining proceeds from the Term Loan were used, together with cash on hand, to pay a special cash dividend of $6.00 per share on our common stock (”2012 dividend recapitalization”).
On May 31, 2013, we amended and restated our then existing Term Loan Credit Agreement by entering into a new term loan credit agreement (New Term Loan Credit Agreement). The New Term Loan Credit Agreement provides for a $1.2 billion term loan B credit facility (New Term Loan) and includes a $300.0 million uncommitted incremental term loan facility. The New Term Loan Credit Agreement matures on May 31, 2020. Proceeds from the New Term Loan were used to repay the previous Term Loan Credit Agreement and to fund a special cash dividend of $5.00 per share on our common stock (“2013 dividend recapitalization”). Remaining funds from the New Term Loan were used for general corporate purposes and to pay related financing fees and expenses. The New Term Loan initially bears interest at rates based upon either a base rate plus an applicable margin of 1.75% or adjusted LIBOR rate plus an applicable margin of 2.75%, subject to a LIBOR floor of 0.75%. Beginning in the second quarter of 2014, the applicable margin related to base rate loans can be reduced to 1.50% and the applicable margin related to LIBOR rate loans can be reduced to 2.50%, in each case, if Generac Power Systems’ (Borrower) net debt leverage ratio falls below 3.00 to 1.00. Concurrent with the closing of the New Term Loan Credit Agreement, on May 31, 2013, we amended our existing ABL Credit Agreement. The amendment provides for a one year extension of the maturity date in respect of the $150.0 million senior secured ABL revolving credit facility provided under the ABL Credit Agreement (ABL Facility). The extended maturity date of the ABL Facility is May 31, 2018.
We refer you to Note 6, “Credit Agreements,” of our consolidated financial statements included in Item 8 of this Annual Report on Form 10-K for additional information.
At December 31, 2013, we had cash and cash equivalents of $150.1 million and $147.5 million of availability under our revolving credit facility, net of outstanding letters of credit and outstanding borrowings.
On August 1, 2013, we used a substantial portion of our cash on hand to acquire the equity of Tower Light SRL and its wholly-owned subsidiaries (collectively, “Tower Light”). On November 1, 2013, we used a substantial portion of our cash on hand to purchase substantially all of the assets of Baldor Electric Company’s generator division (“Baldor Generators”).
Long-term liquidity
We believe that our cash flow from operations and our availability under our revolving credit facility, combined with our relatively low ongoing capital expenditure requirements and favorable tax attributes, which result in a lower cash tax rate as compared to the U.S. statutory tax rate, provides us with sufficient capital to continue to grow our business in the future. We will use a significant portion of our cash flow to pay interest and principal on our outstanding debt, impacting the amount available for working capital, capital expenditures and other general corporate purposes. As we continue to expand our business, we may in the future require additional capital to fund working capital, capital expenditures or acquisitions.
Cash flow
Year ended December 31, 2013 compared to year ended December 31, 2012
The following table summarizes our cash flows by category for the periods presented:
|
Year ended December 31,
|
||||||||||||||||
|
(Dollars in thousands)
|
2013
|
2012
|
Change
|
% Change
|
||||||||||||
|
Net cash provided by operating activities
|
$ | 259,944 | $ | 235,594 | $ | 24,350 | 10.3 | % | ||||||||
|
Net cash used in investing activities
|
$ | (144,549 | ) | $ | (69,345 | ) | $ | (75,204 | ) | (108.5 | )% | |||||
|
Net cash used in financing activities
|
$ | (73,399 | ) | $ | (151,352 | ) | $ | 77,953 | 51.5 | % | ||||||
Net cash provided by operating activities was $259.9 million for 2013 compared to $235.6 million in 2012. This increase of $24.4 million, or 10.3%, is primarily attributable to strong operating earnings as a result of strong organic sales growth and improved operating margins partially offset by increased working capital investments, such as increases in inventory levels to support higher production rates and replenish finished good inventories.
Net cash used for investing activities for the year ended December 31, 2013 was $144.6 million. This included cash payments of $30.8 million for the purchase of property and equipment, $122.4 million for the acquisitions of the Tower Light and Baldor Generators businesses, partially offset by cash proceeds of $2.3 million from the sale of a business and $6.3 million relating to the finalization of the Ottomotores purchase price. Net cash used for investing activities for the year ended December 31, 2012 was $69.3 million. This included $22.4 million for the purchase of property and equipment and $47.0 million for the acquisition of the Ottomotores businesses.
Net cash used for financing activities was $73.4 million for the year ended December 31, 2013, primarily representing the net cash impact of debt prepayments and the dividend recapitalization transaction that occurred during the first half of 2013, including cash proceeds from long-term borrowings of $1,200.0 million offset by $901.2 million of long-term borrowing repayments. The Company paid $22.4 million for transaction fees incurred in connection with May 2013 refinancing transaction. Following the refinancing, the Company paid a special cash dividend of $5.00 per share ($340.8 million) on the Company’s common stock (incremental to the $2.6 million cash dividends paid during 2013, related to the 2012 dividend, due to the vesting of restricted stock awards). In addition, the Company paid $15.0 million in taxes related to the net share settlement of equity awards which was partially offset by approximately $11.6 million of excess tax benefits of equity awards. Finally, the Company received net cash proceeds of $16.0 million from short-term borrowings, which were more than offset by approximately $19.0 million of short-term borrowing repayments.
Net cash used for financing activities was $151.4 million for the year ended December 31, 2012, primarily representing the net cash impact of our refinancing activities and the dividend recapitalization transaction that occurred during the first half of 2012, including cash proceeds from long-term borrowings of $1,455.6 million offset by $1,175.1 million of long-term borrowing repayments. The Company made $25.7 million of cash payments for transaction fees incurred in connection with these refinancing transactions. Following the refinancing, the Company paid a special cash dividend of $6.00 per share ($404.3 million, which excludes dividends for unvested restricted stock) on the Company’s common stock during the second quarter of 2012.
Year ended December 31, 2012 compared to year ended December 31, 2011
The following table summarizes our cash flows by category for the periods presented:
|
Year ended December 31,
|
||||||||||||||||
|
(Dollars in thousands)
|
2012
|
2011
|
Change
|
% Change
|
||||||||||||
|
Net cash provided by operating activities
|
$ | 235,594 | $ | 169,712 | $ | 65,882 | 38.8 | % | ||||||||
|
Net cash used in investing activities
|
$ | (69,345 | ) | $ | (95,953 | ) | $ | 26,608 | 27.7 | % | ||||||
|
Net cash used in financing activities
|
$ | (151,352 | ) | $ | (59,216 | ) | $ | (92,136 | ) | (155.6 | )% | |||||
Net cash provided by operating activities was $235.6 million for 2012 compared to $169.7 million in 2011. This increase of $65.9 million, or 38.8%, is primarily attributable to strong operating earnings partially offset by increased working capital investments, such as increases in inventory levels to support higher production rates.
Net cash used for investing activities for the year ended December 31, 2012 was $69.3 million. This included $22.4 million for the purchase of property and equipment and $47.0 million for the acquisition of the Ottomotores businesses. Net cash used for investing activities for the year ended December 31, 2011 was $96.0 million and included $12.1 million for the purchase of property and equipment and $83.9 million for the acquisition of the Magnum Products business. The increase in purchases of property and equipment was primarily driven by the purchase of a manufacturing facility and expansion of our corporate headquarters and engineering lab facilities.
Net cash used in financing activities was $151.4 million for the year ended December 31, 2012, an increase of $92.1 million in net cash outflows from 2011 primarily representing the net cash impact of our refinancing activities and dividend recapitalization transaction during the first half of 2012, including gross proceeds from long-term borrowings of $1,455.6 million offset by $1,175.1 million of long-term borrowing repayments. The Company made $25.7 million of cash payments for transaction fees incurred in connection with these refinancing transactions. Following the refinancing, the Company paid a special cash dividend of $6.00 per share ($404.3 million, which excludes dividends for unvested restricted stock) on the Company’s common stock during the second quarter of 2012. Net cash used in financing activities was $59.2 million for the year ended December 31, 2011, primarily related to long-term borrowing repayments.
Senior secured credit facilities
On May 31, 2013, the Borrower amended and restated its then existing Term Loan Credit Agreement by entering into the New Term Loan Credit Agreement with certain commercial banks and other lenders. The New Term Loan Credit Agreement provides for a $1,200.0 million New Term Loan and includes a $300.0 million uncommitted incremental term loan facility. The New Term Loan Credit Agreement matures on May 31, 2020. Proceeds from the New Term Loan were used to repay amounts outstanding under the Company’s previous Term Loan Credit Agreement and to fund a special cash dividend of $5.00 per share on the Company’s common stock. We refer you to Note 12, “Special Cash Dividend,” of our consolidated financial statements included in Item 8 of this Annual Report on Form 10-K for additional information. Remaining funds from the New Term Loans were used for general corporate purposes and to pay related financing fees and expenses.
The New Term Loan is guaranteed by all of the Borrower’s wholly-owned domestic restricted subsidiaries, Generac Acquisition Corp. (GAC) and the Company, and is secured by associated collateral agreements which pledge a first priority lien on virtually all of the Borrower’s assets, including fixed assets and intangibles, and the assets of the guarantors (other than the Company), other than all cash, trade accounts receivable, inventory, and other current assets and proceeds thereof, which will be secured by a second priority lien.
The New Term Loan amortizes in equal installments of 0.25% of the original principal amount of the New Term Loan payable on the first day of April, July, October and January commencing on October 1, 2013 until the final maturity date of the New Term Loan on May 31, 2020. The New Term Loan initially bears interest at rates based upon either a base rate plus an applicable margin of 1.75% or adjusted LIBOR rate plus an applicable margin of 2.75%, subject to a LIBOR floor of 0.75%. Beginning in the second quarter of 2014, the applicable margin related to base rate loans can be reduced to 1.50% and the applicable margin related to LIBOR rate loans can be reduced to 2.50%, in each case, if the Borrower’s net debt leverage ratio falls below 3.00 to 1.00.
Concurrent with the closing of the New Term Loan Credit Agreement, on May 31, 2013, the Borrower amended its existing ABL Credit Agreement by entering into the New ABL Credit Agreement. The amendment provides for a one year extension of the maturity date in respect of the $150.0 million ABL Facility. The extended maturity date of the ABL Facility is May 31, 2018.
Borrowings under the ABL Facility are guaranteed by all of the Borrower’s wholly-owned domestic restricted subsidiaries and GAC, and are secured by associated collateral agreements which pledge a first priority lien on all cash, trade accounts receivable, inventory, and other current assets and proceeds thereof, and a second priority lien on all other assets, including fixed assets and intangibles of the Borrower, certain domestic subsidiaries of the Borrower and the guarantors (other than the Company).
Borrowings under the ABL Facility continue to bear interest at rates based upon either a base rate plus an applicable margin of 1.00% or adjusted LIBOR rate plus an applicable margin of 2.00%, in each case, subject to adjustments based upon average availability under the ABL Facility. The New ABL Credit Agreement requires the Borrower to maintain a minimum consolidated fixed charge coverage ratio of 1.0x, tested on a quarterly basis, when Availability plus the amount of Qualified Cash (up to $5.0 million) (as defined in the New ABL Credit Agreement) under the ABL Facility is less than the greater of (i) 10.0% of the Line Cap (as defined in the New ABL Credit Agreement) and (ii) $10.0 million. As of December 31, 2013, no amounts were outstanding under the ABL Facility. As of December 31, 2013, the Company had $150.1 million of unrestricted cash and cash equivalents and $147.5 million of availability under the ABL Facility, net of outstanding letters of credit.
On February 11, 2013, the Company made an $80.0 million voluntary prepayment of debt with available cash on hand that was applied to future principal amortizations on the previous Term Loan Credit Agreement. As a result, the Company wrote off $1.8 million of original issue discount and capitalized debt issuance costs during the first quarter of 2013. On May 2, 2013, the Company made an additional $30.0 million voluntary prepayment of existing debt with available cash on hand. As a result, the Company wrote off $0.9 million of original issue discount and capitalized debt issuance costs during the second quarter of 2013.
In connection with the May 31, 2013 refinancing and in accordance with
ASC 470-50, Debt Modifications and Extinguishments,
the Company capitalized $21.8 million of new debt issuance costs, recorded $13.8 million of fees paid to creditors as a debt discount, and expensed $7.1 million of transaction fees. The Company evaluated on a lender by lender basis if the debt related to returning lenders was significantly modified or not, resulting in the write-off of $5.5 million in unamortized debt issuance costs and original issue discount relating to the previous Term Loan Credit Agreement and ABL Credit Agreement. Amounts expensed are recorded as a loss on extinguishment of debt in the condensed consolidated statement of comprehensive income for the year ended December 31, 2013. The Company amortizes both the capitalized debt issuance costs and the original issue discount on its loans under the effective interest method.
Covenant compliance
The New Term Loan Credit Agreement contains restrictions on the Borrower’s ability to pay distributions and dividends (but which permitted the payment of the special cash dividend described in Note 12 – Special Cash Dividend of our consolidated financial statements included in Item 8 of this annual report on Form 10-K). Payments can be made by the Borrower to the Company or other parent companies for certain expenses such as operating expenses in the ordinary course, fees and expenses related to any debt or equity offering and to pay franchise or similar taxes. Dividends can be used to repurchase equity interests, subject to limitations in certain circumstances. Additionally, the New Term Loan Credit Agreement restricts the aggregate amount of dividends and distributions that can be paid and, in certain circumstances, requires pro forma compliance with certain fixed charge coverage ratios or gross leverage ratios, as applicable in order to pay certain dividends and distributions. The New Term Loan Credit Agreement also contains other affirmative and negative covenants that, among other things, limit the incurrence of additional indebtedness, liens on property, sale and leaseback transactions, investments, loans and advances, mergers or consolidations, asset sales, acquisitions, transactions with affiliates, prepayments of certain other indebtedness and modifications of our organizational documents. The New Term Loan Credit Agreement does not contain any financial maintenance covenants.
The New Term Loan Credit Agreement contains customary events of default, including, among others, nonpayment of principal, interest or other amounts, failure to perform covenants, inaccuracy of representations or warranties in any material respect, cross-defaults with other material indebtedness, certain undischarged judgments, the occurrence of certain ERISA or bankruptcy or insolvency events or the occurrence of a change in control (defined in the New Term Loan Credit Agreement). A bankruptcy or insolvency event of default will cause the obligations under the New Term Loan Credit Agreement to automatically become immediately due and payable.
The New ABL Credit Agreement also contains covenants and events of default substantially similar to those in the New Term Loan Credit Agreement, as described above.
Contractual obligations
The following table summarizes our expected payments for significant contractual obligations as of December 31, 2013:
|
(Dollars in thousands)
Payment due by period
|
||||||||||||||||||||||||
|
Contractual obligations
|
Total
|
Less than
1 year
|
2-3 years
|
4-5 years
|
After 5
years
|
|||||||||||||||||||
|
Long-term debt, including current portion(1)
|
$ | 1,198,824 | $ | 13,021 | $ | 24,803 | $ | 23,999 | $ | 1,137,001 | ||||||||||||||
|
Capital lease obligation, including current portion
|
2,529 | 185 | 389 | 418 | 1,537 | |||||||||||||||||||
|
Interest on long-term debt(2)
|
263,935 | 42,316 | 83,417 | 81,560 | 56,642 | |||||||||||||||||||
|
Operating leases
|
6,228 | 1,952 | 3,443 | 833 | - | |||||||||||||||||||
|
Total contractual cash obligations(3)
|
$ | 1,471,516 | $ | 57,474 | $ | 112,052 | $ | 106,810 | $ | 1,195,180 | ||||||||||||||
(1) On May 31, 2013, the Borrower amended and restated its then existing Credit Agreement by entering into a new credit agreement (“New Term Loan Credit Agreement”) with certain commercial banks and other lenders. The New Term Loan Credit Agreement provides for a $1,200.0 million term loan credit facility (“New Term Loan”) and a $300.0 million uncommitted incremental term loan facility. The New Term Loan Credit Agreement matures on May 31, 2020.
(2) Assumes normal debt amortization payments until maturity and using interest rates in effect for our New Term Loan Credit Agreement as of December 31, 2013.
(3) Pension obligations are excluded from this table as we are unable to estimate the timing of payment due to the inherent assumptions underlying the obligation. However, the Company estimates we will contribute $2.1 million to our pension plans in 2014.
Capital expenditures
Our operations require capital expenditures for technology, tooling, equipment, capacity expansion and upgrades. Capital expenditures were $30.8 million and $22.4 million for the years ended December 31, 2013 and 2012, respectively, and were funded through cash from operations.
Off-balance sheet arrangements
We have an arrangement with a finance company to provide floor plan financing for selected dealers. This arrangement provides liquidity for our dealers by financing dealer purchases of products with credit availability from the finance company. We receive payment from the finance company after shipment of product to the dealer and our dealers are given a longer period of time to pay the finance provider. If our dealers do not pay the finance company, we may be required to repurchase the applicable inventory held by the dealer. We do not indemnify the finance company for any credit losses they may incur.
Total inventory financed accounted for approximately 7% of net sales for the year ended December 31, 2012 and approximately 8% of net sales for the year ended December 31, 2013. The amount financed by dealers which remained outstanding was $16.6 million and $24.3 million as of December 31, 2012 and 2013, respectively.
Critical accounting policies
In preparing the financial statements in accordance with accounting principles generally accepted in the U.S., management is required to make estimates and assumptions that have an impact on the asset, liability, revenue and expense amounts reported. These estimates can also affect supplemental information disclosures of the Company, including information about contingencies, risk and financial condition. The Company believes, given current facts and circumstances, that its estimates and assumptions are reasonable, adhere to accounting principles generally accepted in the U.S., and are consistently applied. Inherent in the nature of an estimate or assumption is the fact that actual results may differ from estimates and estimates may vary as new facts and circumstances arise. The Company makes routine estimates and judgments in determining net realizable value of accounts receivable, inventories, property, plant and equipment, and prepaid expenses. Management believes the Company’s most critical accounting estimates and assumptions are in the following areas: goodwill and other indefinite-lived intangible asset impairment assessment, business combinations and purchase accounting, defined benefit pension obligations, estimates of allowance for doubtful accounts, excess and obsolete inventory reserves, product warranty, other contingencies, derivative accounting, income taxes, and share based compensation.
Goodwill and other intangible assets
Goodwill represents the excess of the purchase price over fair value of identifiable net assets acquired from business acquisitions. Goodwill is not amortized, but is reviewed for impairment on an annual basis and between annual tests if indicators of impairment are present. The Company evaluates goodwill for impairment annually on October 1 or more frequently when an event occurs or circumstances change that indicates the carrying value may not be recoverable. The Company has the option to assess goodwill for impairment by first performing a qualitative assessment to determine whether it is more likely than not that the fair value of a reporting unit is less than its carrying amount. If the Company determines that it is not more likely than not that the fair value of a reporting unit is less than its carrying amount, then further goodwill impairment testing is not required to be performed. If the Company determines that it is more likely than not that the fair value of a reporting unit is less than its carrying amount, the Company is required to perform a two-step goodwill impairment test. In the first step, the fair value of the reporting unit is compared to its book value including goodwill. If the fair value of the reporting unit is in excess of its book value, the related goodwill is not impaired and no further analysis is necessary. If the fair value of the reporting unit is less than its book value, there is an indication of potential impairment and a second step is performed. When required, the second step of testing involves calculating the implied fair value of goodwill for the reporting unit. The implied fair value of goodwill is determined in the same manner as goodwill recognized in a business combination, which is the excess of the fair value of the reporting unit determined in step one over the fair value of its net assets and identifiable intangible assets as if the reporting unit had been acquired. If the carrying value of the reporting unit's goodwill exceeds the implied fair value of that goodwill, an impairment loss is recognized in an amount equal to that excess. For reporting units with a negative book value (i.e., excess of liabilities over assets), qualitative factors are evaluated to determine whether it is necessary to perform the second step of the goodwill impairment test.
The Company performed the required annual impairment tests for fiscal years 2013, 2012 and 2011 and found no impairment of goodwill.
Other indefinite-lived intangible assets consist of trade names. The Company tests the carrying value of these trade names by comparing the assets fair value to its carrying value. Fair value was measured using a relief-from-royalty approach, which assumes the fair value of the trade name is the discounted cash flows of the amount that would be paid had the Company not owned the trade name and instead licensed the trade name from another company. The Company conducts its annual impairment test for indefinite-lived intangible assets on October 31
st
of each year.
The Company performed the required annual impairment tests for fiscal years 2013 and 2012 and found no impairment of indefinite-lived trade names. During the fourth quarter of 2011, the Company decided to strategically transition certain products to their more widely known Generac brand. Based on this decision, the Company recorded a $9.4 million non-cash trade name impairment charge as of October 31, 2011 which primarily related to the write down of the impacted trade name to net realizable value.
We can make no assurances that remaining goodwill or indefinite-lived trade names will not be impaired in the future. When preparing a discounted cash flow analysis, we make a number of key estimates and assumptions. We estimate the future cash flows of the business based on historical and forecasted revenues and operating costs. This, in turn, involves further estimates, such as estimates of future growth rates and inflation rates. In addition, we apply a discount rate to the estimated future cash flows for the purpose of the valuation. This discount rate is based on the estimated weighted average cost of capital for the business and may change from year to year. Weighted average cost of capital includes certain assumptions such as market capital structures, market betas, risk-free rate of return and estimated costs of borrowing. Changes in these key estimates and assumptions, or in other assumptions used in this process, could materially affect our impairment analysis for a given year. Additionally, since our measurement also considers a market approach, changes in comparable public company multiples can also materially impact our impairment analysis.
In the long term, our remaining goodwill and indefinite-lived trade name balances could be further impaired in future periods. A number of factors, many of which we have no ability to control, could affect our financial condition, operating results and business prospects and could cause actual results to differ from the estimates and assumptions we employed. These factors include:
|
·
|
a prolonged global economic crisis;
|
|
·
|
a significant decrease in the demand for our products;
|
|
·
|
the inability to develop new and enhanced products and services in a timely manner;
|
|
·
|
a significant adverse change in legal factors or in the business climate;
|
|
·
|
an adverse action or assessment by a regulator; and
|
|
·
|
successful efforts by our competitors to gain market share in our markets.
|
Our cash flow assumptions are based on historical and forecasted revenue, operating costs and other relevant factors. If management's estimates of future operating results change or if there are changes to other assumptions, the estimate of the fair value of our business may change significantly. Such change could result in impairment charges in future periods, which could have a significant impact on our operating results and financial condition.
Business combinations and purchase accounting
We account for business combinations using the acquisition method of accounting, and accordingly, the assets and liabilities of the acquired business are recorded at their respective fair values. The excess of the purchase price over the estimated fair value is recorded as goodwill. Assigning fair market values to the assets acquired and liabilities assumed at the date of an acquisition requires knowledge of current market values, and the values of assets in use, and often requires the application of judgment regarding estimates and assumptions. While the ultimate responsibility resides with management, for material acquisitions we retain the services of certified valuation specialists to assist with assigning estimated values to certain acquired assets and assumed liabilities, including intangible assets and tangible long-lived assets. Acquired intangible assets, excluding goodwill, are valued using certain discounted cash flow methodologies based on future cash flows specific to the type of intangible asset purchased. This methodology incorporates various estimates and assumptions, the most significant being projected revenue growth rates, earnings margins, and forecasted cash flows based on the discount rate and terminal growth rate.
Defined benefit pension obligations
The funded status of our pension plans is more fully described in Note 9 to our audited consolidated financial statements included in Item 8 of this Annual Report on Form 10-K. The Company’s pension benefit obligation and related pension expense or income are calculated in accordance with ASC 715-30,
Defined Benefit Plans—Pension
, and are impacted by certain actuarial assumptions, including the discount rate and the expected rate of return on plan assets.
Rates are evaluated on an annual basis considering such factors as market interest rates and historical asset performance. Actuarial valuations for fiscal year 2013 used a discount rate of 4.98% for the salaried pension plan and 5.01% for the hourly pension plan. Our discount rate was selected using a methodology that matches plan cash flows with a selection of “Aa” or higher rated bonds, resulting in a discount rate that better matches a bond yield curve with comparable cash flows. In estimating the expected return on plan assets, we study historical markets and preserve the long-term historical relationships between equities and fixed-income securities. We evaluate current market factors such as inflation and interest rates before we determine long-term capital market assumptions and review peer data and historical returns to check for reasonableness and appropriateness. Changes in the discount rate and return on assets can have a significant effect on the funded status of our pension plans, stockholders' equity and related expense. We cannot predict these changes in discount rates or investment returns and, therefore, cannot reasonably estimate whether the impact in subsequent years will be significant.
The funded status of our pension plans is the difference between the projected benefit obligation and the fair value of its plan assets. The projected benefit obligation is the actuarial present value of all benefits expected to be earned by the employees' service. No compensation increase is assumed in the calculation of the projected benefit obligation, as the plans were frozen effective December 31, 2008.
Our funding policy for our pension plans is to contribute amounts at least equal to the minimum annual amount required by applicable regulations. Given this policy, we expect to make $2.1 million in contributions to our pension plans in 2014.
Allowance for doubtful accounts, excess and obsolete inventory reserves, product warranty reserves and other contingencies
The reserves, if any, for customer rebates, product warranty, product liability, litigation, excess and obsolete inventory and doubtful accounts are fact-specific and take into account such factors as specific customer situations, historical experience, and current and expected economic conditions. These reserves are reflected under Notes 2, 4, 5 and 14 to our audited consolidated financial statements included in Item 8 of this Annual Report on Form 10-K.
Derivative accounting
We enter into interest rate swap contracts, or Swaps, to fix a portion of our variable rate indebtedness. Due to the incorporation of a new interest rate floor provision in the Term Loan Credit Agreement, which constituted a change in critical terms, the Company concluded that as of May 30, 2012, the Swaps outstanding at that time would no longer be highly effective in achieving offsetting changes in cash flows during the periods the hedges are designated. As a result, the Company was required to de-designate the hedges as of May 30, 2012. Beginning May 31 2012, the effective portion of the swaps prior to the change (i.e. amounts previously recorded in Accumulated Other Comprehensive Loss) were amortized into interest expense over the period of the originally designated hedged transactions which had various dates through October 2013. Subsequent changes in fair value of the related swaps were immediately recognized in the consolidated statements of comprehensive income as interest expense.
As required by ASC 815
Derivatives and Hedging,
we record the Swaps at fair value pursuant to ASC 820
Fair Value Measurements and Disclosures
, which defines fair value, establishes a consistent framework for measuring fair value and expands disclosure for each major asset and liability category measured at fair value. When determining the fair value of the Swaps, we considered our credit risk in accordance with ASC 820. The fair value of our outstanding Swaps, including the impact of credit risk, at December 31, 2013 and 2012 was an asset of $1.2 million and a liability of $3.0 million, respectively.
Income taxes
We account for income taxes in accordance with ASC 740
Income Taxes
. Our estimate of income taxes payable, deferred income taxes and the effective tax rate is based on an analysis of many factors including interpretations of federal, state and international income tax laws, the difference between tax and financial reporting bases of assets and liabilities, estimates of amounts currently due or owed in various jurisdictions, and current accounting standards. We review and update our estimates on a quarterly basis as facts and circumstances change and actual results are known.
We have generated significant deferred tax assets as a result of goodwill and intangible asset book versus tax differences. In assessing the realizability of these deferred tax assets, we consider whether it is more likely than not that some portion or all of the deferred tax assets will not be realized. The ultimate realization of deferred tax assets is dependent upon the generation of future taxable income during the years in which those temporary differences become deductible. We consider the scheduled reversal of deferred tax liabilities, projected future taxable income and tax planning strategies in making this assessment. As of September 30, 2011, we were in a three year cumulative loss position and had a full valuation allowance recorded against our net deferred tax assets. In the fourth quarter of 2011, we came out of a three-year cumulative loss position and, as part of the normal assessment of the future realization of our net deferred tax assets, determined that a valuation allowance was no longer required. As a result, the valuation allowance previously recorded was reversed in the fourth quarter of 2011 and was recorded as a component of the income tax provision.
Ottomotores Brazil, acquired in the Ottomotores acquisition in December 2012, is in a three-year cumulative net loss position and therefore we have not considered expected future taxable income in analyzing the realizability of their deferred tax assets as of December 31, 2013. As a result, a full valuation allowance was recorded against the deferred tax assets of Ottomotores Brazil.
In performing the assessment of the realization of our deferred tax assets as of December 31, 2013, excluding Ottomotores Brazil, we have determined that it is more likely than not that our deferred tax assets will be realized, and therefore no valuation allowance is required.
Share based compensation
Under the fair value recognition provisions of ASC 718
Compensation – Stock Compensation
, share based compensation cost is measured at the grant date based on the fair value of the award and is recognized as expense over the requisite service period. Determining the fair value of share based awards at the grant date requires judgment, including estimating expected dividends and market volatility of our stock. In addition, judgment is also required in estimating the amount of share based awards that are expected to be forfeited. If actual results differ significantly from these estimates, share based compensation expense and our results of operations could be impacted.
New Accounting Standards
For information with respect to new accounting pronouncements and the impact of these pronouncements on our consolidated financial statements, we refer you to Note 2, “New Accounting Pronouncements,” of our consolidated financial statements included in Item 8 of this Annual Report on Form 10-K
.
We are exposed to market risk from changes in foreign currency exchange rates, commodity prices and interest rates. To reduce the risk from changes in certain foreign currency exchange rates and commodity prices, we use financial instruments from time to time. We do not hold or issue financial instruments for trading purposes.
Foreign currency
We are exposed to foreign currency exchange risk as a result of purchasing from suppliers in other countries as well as operating businesses in foreign countries. Periodically, we utilize foreign currency forward purchase and sales contracts to manage the volatility associated with foreign currency purchases in the normal course of business. Contracts typically have maturities of one year or less. Realized and unrealized gains and losses on transactions denominated in foreign currency are recorded in earnings as a component of cost of goods sold. At December 31, 2012, we had no foreign exchange contracts outstanding. As of December 31, 2013, we had the following foreign currency contracts outstanding (in thousands):
|
Currency Denomination
|
Effective Date
|
Notional Amount
(Thousands)
|
Expiration Date
|
|||
|
Number of Contracts Outstanding
|
Contract Date
|
Exchange Rate
|
||||
|
USD
|
3
|
October 23, 2013
|
Various effective dates between 4/1/2014 and 7/14/2014
|
650
|
(EUR:USD)
1.349-1.3515
|
May 28, 2014 – October 31, 2014
|
|
GBP
|
4
|
October 23, 2013
|
Various effective dates between 2/3/2014 and 5/2/2014
|
4,000
|
(EUR:GBP)
0.8384-0.8492
|
April 30, 2014 – July 31, 2014
|
With the purchase of the Ottomotores businesses in December 2012 and the Tower Light business in August 2013, a small portion of revenues and expenses are now denominated in Euros, Mexican Pesos, Brazilian Real and British Pounds.
Commodity prices
We are a purchaser of commodities and of components manufactured from commodities, including steel, aluminum, copper and others. As a result, we are exposed to fluctuating market prices for those commodities. While such materials are typically available from numerous suppliers, commodity raw materials are subject to price fluctuations. We generally buy these commodities and components based upon market prices that are established with the supplier as part of the purchase process. Depending on the supplier, these market prices may reset on a periodic basis based on negotiated lags. To the extent that commodity prices increase and we do not have firm pricing from our suppliers, or our suppliers are not able to honor such prices, we may experience a decline in our gross margins to the extent we are not able to increase selling prices of our products or obtain manufacturing efficiencies or supply chain savings to offset increases in commodity costs.
Periodically, we engage in certain commodity risk management activities. The primary objectives of these activities are to understand and mitigate the impact of potential price fluctuations on our financial results. Generally, these risk management transactions will involve the use of commodity derivatives to protect against exposure resulting from significant price fluctuations.
We primarily utilize commodity contracts with maturities of one year or less. These are intended to offset the effect of price fluctuations on actual inventory purchases. The primary objective of the hedge is to mitigate the impact of potential price fluctuations of commodity on our financial results. As of December 31, 2013, we had the following commodity forward contracts outstanding (in thousands):
|
Hedged Item
|
Number of Contracts Outstanding
|
Effective Date
|
Aggregate Notional Amount
(Thousands)
|
Fixed Copper Price
|
|
Copper
|
1
|
October 1, 2013 to June 30, 2014
|
$2,169
|
$3.12 per LB
|
For additional information on the Company’s commodity forward contracts, including amounts charged to the statement of comprehensive income during 2013, see Note 2 to our audited consolidated financial statements included in Item 8 of this Annual Report on Form 10-K.
Interest rates
As of December 31, 2013, all of the outstanding debt under our term loans was subject to floating interest rate risk. As of this date, we had the following interest rate swap contracts outstanding (in thousands):
|
Hedged Item
|
Effective Date
|
Notional Amount
(Thousands)
|
Expiration Date
|
||
|
Contract Date
|
Fixed LIBOR Rate
|
||||
|
Interest rate
|
October 23, 2013
|
July 1, 2014
|
$100,000
|
1.742%
|
July 1, 2018
|
|
Interest rate
|
October 23, 2013
|
July 1, 2014
|
$100,000
|
1.737%
|
July 1, 2018
|
At December 31, 2013, the fair value of the swaps reduced for our credit risk and excluding any related accrued interest was an asset of $1.2 million. For additional information on the Company’s interest rate swaps, including amounts charged to the statement of comprehensive income during 2013, see Note 2 to our audited consolidated financial statements included in Item 8 of this Annual Report on Form 10-K. Even after giving effect to these swaps, we are exposed to risks due to changes in interest rates with respect to the portion of our term loans that are not covered by the swaps. A hypothetical change in the LIBOR interest rate of 100 basis points would have changed annual cash interest expense by approximately $4.9 million (or, without the swaps in place, $5.9 million). The existence of a 0.75% LIBOR floor provision in our New Term Loan Credit Agreement, effective May 31, 2013, limits the impact of a hypothetical 100 basis point change in LIBOR at current December 31, 2013 LIBOR rates.
Report of Independent Registered Public Accounting Firm
To the Board of Directors and Stockholders of Generac Holdings Inc.
We have audited Generac Holdings Inc.’s internal control over financial reporting as of December 31, 2013, based on criteria established in Internal Control—Integrated Framework issued by the Committee of Sponsoring Organizations of the Treadway Commission (1992 Framework) (the COSO criteria). Generac Holdings Inc.’s management is responsible for maintaining effective internal control over financial reporting, and for its assessment of the effectiveness of internal control over financial reporting included in the accompanying Management’s Report on Internal Control Over Financial Reporting. Our responsibility is to express an opinion on the company’s internal control over financial reporting based on our audit.
We conducted our audit in accordance with the standards of the Public Company Accounting Oversight Board (United States). Those standards require that we plan and perform the audit to obtain reasonable assurance about whether effective internal control over financial reporting was maintained in all material respects. Our audit included obtaining an understanding of internal control over financial reporting, assessing the risk that a material weakness exists, testing and evaluating the design and operating effectiveness of internal control based on the assessed risk, and performing such other procedures as we considered necessary in the circumstances. We believe that our audit provides a reasonable basis for our opinion.
A company’s internal control over financial reporting is a process designed to provide reasonable assurance regarding the reliability of financial reporting and the preparation of financial statements for external purposes in accordance with generally accepted accounting principles. A company’s internal control over financial reporting includes those policies and procedures that (1) pertain to the maintenance of records that, in reasonable detail, accurately and fairly reflect the transactions and dispositions of the assets of the company; (2) provide reasonable assurance that transactions are recorded as necessary to permit preparation of financial statements in accordance with generally accepted accounting principles, and that receipts and expenditures of the company are being made only in accordance with authorizations of management and directors of the company; and (3) provide reasonable assurance regarding prevention or timely detection of unauthorized acquisition, use, or disposition of the company’s assets that could have a material effect on the financial statements.
Because of its inherent limitations, internal control over financial reporting may not prevent or detect misstatements. Also, projections of any evaluation of effectiveness to future periods are subject to the risk that controls may become inadequate because of changes in conditions, or that the degree of compliance with the policies or procedures may deteriorate.
As indicated in the accompanying Management’s Report on Internal Control Over Financial Reporting, management’s assessment of and conclusion on the effectiveness of internal control over financial reporting did not include the internal controls of the Tower Light or Baldor Generators businesses, which are included in the December 31, 2013 consolidated financial statements of Generac Holdings Inc. and constituted 4.2% and 15.1% of total and net assets, respectively, as of December 31, 2013 and 2.8% and 1.0% of revenues and net income, respectively, for the year then ended. Our audit of internal control over financial reporting of Generac Holdings Inc. also did not include an evaluation of the internal control over financial reporting of Tower Light or Baldor Generators.
In our opinion, Generac Holdings Inc. maintained, in all material respects, effective internal control over financial reporting as of December 31, 2013, based on the COSO criteria.
We also have audited, in accordance with the standards of the Public Company Accounting Oversight Board (United States), the consolidated balance sheets as of December 31, 2013 and 2012, and related consolidated statements of comprehensive income, stockholders' equity and cash flows for each of the three years in the period ended December 31, 2013 of Generac Holdings Inc. and our report dated March 3, 2014 expressed an unqualified opinion thereon.
/s/ Ernst & Young LLP
Milwaukee, WI, USA
March 3, 2014
Report of Independent Registered Public Accounting Firm
To the Board of Directors and Stockholders of Generac Holdings Inc.
We have audited the accompanying consolidated balance sheets of Generac Holdings Inc. (the Company) as of December 31, 2013 and 2012, and the related consolidated statements of comprehensive income, stockholders’ equity and cash flows for each of the three years in the period ended December 31, 2013. These financial statements are the responsibility of the Company's management. Our responsibility is to express an opinion on these financial statements based on our audits.
We conducted our audits in accordance with the standards of the Public Company Accounting Oversight Board (United States). Those standards require that we plan and perform the audit to obtain reasonable assurance about whether the financial statements are free of material misstatement. An audit includes examining, on a test basis, evidence supporting the amounts and disclosures in the financial statements. An audit also includes assessing the accounting principles used and significant estimates made by management, as well as evaluating the overall financial statement presentation. We believe that our audits provide a reasonable basis for our opinion.
In our opinion, the financial statements referred to above present fairly, in all material respects, the consolidated financial position of Generac Holdings Inc. at December 31, 2013 and 2012, and the consolidated results of its operations and its cash flows for each of the three years in the period ended December 31, 2013, in conformity with U.S. generally accepted accounting principles.
We also have audited, in accordance with the standards of the Public Company Accounting Oversight Board (United States), Generac Holdings Inc.’s internal control over financial reporting as of December 31, 2013, based on criteria established in Internal Control-Integrated Framework issued by the Committee of Sponsoring Organizations of the Treadway Commission (1992 Framework) and our report dated March 3, 2014 expressed an unqualified opinion thereon.
/s/ Ernst & Young LLP
Milwaukee, WI, USA
March 3, 2014
|
Generac Holdings Inc.
|
||||||||
|
Consolidated Balance Sheets
|
||||||||
|
(Dollars in Thousands, Except Share and Per Share Data)
|
||||||||
|
December 31,
|
||||||||
|
2013
|
2012
|
|||||||
|
Assets
|
||||||||
|
Current assets:
|
||||||||
|
Cash and cash equivalents
|
$ | 150,147 | $ | 108,023 | ||||
|
Restricted cash
|
6,645 | – | ||||||
|
Accounts receivable, less allowance for doubtful accounts of $2,658 at
December 31, 2013 and $1,166 at December 31, 2012
|
164,907 | 134,978 | ||||||
|
Inventories
|
300,253 | 225,817 | ||||||
|
Deferred income taxes
|
26,869 | 48,687 | ||||||
|
Prepaid expenses and other assets
|
5,358 | 5,048 | ||||||
|
Total current assets
|
654,179 | 522,553 | ||||||
|
Property and equipment, net
|
146,390 | 104,718 | ||||||
|
Customer lists, net
|
42,764 | 37,823 | ||||||
|
Patents, net
|
62,418 | 70,302 | ||||||
|
Other intangible assets, net
|
4,447 | 5,783 | ||||||
|
Deferred financing costs, net
|
20,051 | 13,987 | ||||||
|
Trade names, net
|
173,196 | 158,831 | ||||||
|
Goodwill
|
608,287 | 552,943 | ||||||
|
Deferred income taxes
|
85,104 | 136,754 | ||||||
|
Other assets
|
1,369 | 153 | ||||||
|
Total assets
|
$ | 1,798,205 | $ | 1,603,847 | ||||
|
Liabilities and stockholders’ equity
|
||||||||
|
Current liabilities:
|
||||||||
|
Short-term borrowings
|
$ | 9,575 | $ | 12,550 | ||||
|
Accounts payable
|
109,238 | 94,543 | ||||||
|
Accrued wages and employee benefits
|
26,564 | 19,435 | ||||||
|
Other accrued liabilities
|
92,997 | 86,081 | ||||||
|
Current portion of long-term borrowings and capital lease obligations
|
12,471 | 82,250 | ||||||
|
Total current liabilities
|
250,845 | 294,859 | ||||||
|
Long-term borrowings and capital lease obligations
|
1,175,349 | 799,018 | ||||||
|
Other long-term liabilities
|
54,940 | 46,342 | ||||||
|
Total liabilities
|
1,481,134 | 1,140,219 | ||||||
|
Stockholders’ equity:
|
||||||||
|
Common stock, par value $0.01, 500,000,000 shares authorized, 68,767,367
and 68,295,960 shares issued at December 31, 2013 and 2012, respectively
|
688 | 683 | ||||||
|
Additional paid-in capital
|
421,672 | 743,349 | ||||||
|
Treasury stock, at cost, 163,458 and 0 shares, respectively
|
(6,571 | ) | – | |||||
|
Excess purchase price over predecessor basis
|
(202,116 | ) | (202,116 | ) | ||||
|
Retained earnings (accumulated deficit)
|
105,813 | (63,792 | ) | |||||
|
Accumulated other comprehensive loss
|
(2,415 | ) | (14,496 | ) | ||||
|
Total stockholders’ equity
|
317,071 | 463,628 | ||||||
|
Total liabilities and stockholders’ equity
|
$ | 1,798,205 | $ | 1,603,847 | ||||
|
See notes to consolidated financial statements.
|
||||||||
|
Generac Holdings Inc.
|
||||||||||||
|
Consolidated Statements of Comprehensive Income
|
||||||||||||
|
(Dollars in Thousands, Except Share and Per Share Data)
|
||||||||||||
|
Year Ended December 31,
|
||||||||||||
|
2013
|
2012
|
2011
|
||||||||||
|
Net sales
|
$ | 1,485,765 | $ | 1,176,306 | $ | 791,976 | ||||||
|
Costs of goods sold
|
916,205 | 735,906 | 497,322 | |||||||||
|
Gross profit
|
569,560 | 440,400 | 294,654 | |||||||||
|
Operating expenses:
|
||||||||||||
|
Selling and service
|
107,515 | 101,448 | 77,776 | |||||||||
|
Research and development
|
29,271 | 23,499 | 16,476 | |||||||||
|
General and administrative
|
55,490 | 46,031 | 30,012 | |||||||||
|
Amortization of intangibles
|
25,819 | 45,867 | 48,020 | |||||||||
|
Trade name write-down
|
– | – | 9,389 | |||||||||
|
Total operating expenses
|
218,095 | 216,845 | 181,673 | |||||||||
|
Income from operations
|
351,465 | 223,555 | 112,981 | |||||||||
|
Other (expense) income:
|
||||||||||||
|
Interest expense
|
(54,435 | ) | (49,114 | ) | (23,718 | ) | ||||||
|
Loss on extinguishment of debt
|
(15,336 | ) | (14,308 | ) | (377 | ) | ||||||
|
Investment income
|
91 | 79 | 110 | |||||||||
|
Costs related to acquisition
|
(1,086 | ) | (1,062 | ) | (875 | ) | ||||||
|
Other, net
|
(1,983 | ) | (2,798 | ) | (1,155 | ) | ||||||
|
Total other expense, net
|
(72,749 | ) | (67,203 | ) | (26,015 | ) | ||||||
|
Income before provision for income taxes
|
278,716 | 156,352 | 86,966 | |||||||||
|
Provision (benefit) for income taxes
|
104,177 | 63,129 | (237,677 | ) | ||||||||
|
Net income
|
174,539 | 93,223 | 324,643 | |||||||||
|
Net income per common share - basic:
|
$ | 2.56 | $ | 1.38 | $ | 4.84 | ||||||
|
Weighted average common shares outstanding - basic:
|
68,081,632 | 67,360,632 | 67,130,356 | |||||||||
|
Net income per common share - diluted:
|
$ | 2.51 | $ | 1.35 | $ | 4.79 | ||||||
|
Weighted average common shares outstanding - diluted:
|
69,667,529 | 69,193,138 | 67,797,371 | |||||||||
|
Dividends declared per share
|
$ | 5.00 | $ | 6.00 | $ | – | ||||||
|
Other comprehensive income (loss):
|
||||||||||||
|
Amortization of unrealized loss on interest rate swaps
|
$ | 2,381 | $ | 2,082 | $ | – | ||||||
|
Foreign currency translation adjustment
|
1,238 | (34 | ) | – | ||||||||
|
Net unrealized gain (loss) on derivatives
|
774 | 365 | (683 | ) | ||||||||
|
Pension liability adjustment
|
7,688 | (1,552 | ) | (4,922 | ) | |||||||
|
Other comprehensive income (loss)
|
12,081 | 861 | (5,605 | ) | ||||||||
|
Comprehensive income
|
$ | 186,620 | $ | 94,084 | $ | 319,038 | ||||||
|
See notes to consolidated financial statements.
|
||||||||||||
|
Generac Holdings Inc.
|
||||||||||||||||||||||||||||||
|
Consolidated Statements of Stockholders' Equity
|
||||||||||||||||||||||||||||||
|
(Dollars in Thousands, Except Share Data)
|
||||||||||||||||||||||||||||||
|
Excess Purchase
|
Retained
|
Accumulated
|
||||||||||||||||||||||||||||
|
Additional
|
Price Over
|
Earnings
|
Other
|
Total
|
||||||||||||||||||||||||||
|
Common Stock
|
Paid-In
|
Treasury Stock
|
Predecessor
|
(Accumulated
|
Comprehensive
|
Stockholders'
|
||||||||||||||||||||||||
|
Shares
|
Amount
|
Capital
|
Shares
|
Amount
|
Basis
|
Deficit)
|
Income (Loss)
|
Equity
|
||||||||||||||||||||||
|
Balance at December 31, 2010
|
67,524,596 | $ | 675 | $ | 1,133,918 | – | $ | – | $ | (202,116 | ) | $ | (481,658 | ) | $ | (9,752 | ) | $ | 441,067 | |||||||||||
|
Unrealized loss on interest rate swaps, net of tax of ($440)
|
– | – | – | – | – | – | – | (683 | ) | (683 | ) | |||||||||||||||||||
|
Common stock issued under equity
incentive plans, net of shares withheld f
or employee taxes and strike price
|
128,216 | 1 | (63 | ) | – | – | – | – | – | (62 | ) | |||||||||||||||||||
|
Excess tax benefits from equity awards
|
– | – | 200 | – | – | – | – | – | 200 | |||||||||||||||||||||
|
Share based compensation
|
– | – | 8,646 | – | – | – | – | – | 8,646 | |||||||||||||||||||||
|
Pension liability adjustment, net of tax of ($3,173)
|
– | – | – | – | – | – | – | (4,922 | ) | (4,922 | ) | |||||||||||||||||||
|
Net income
|
– | – | – | – | – | – | 324,643 | – | 324,643 | |||||||||||||||||||||
|
Balance at December 31, 2011
|
67,652,812 | 676 | 1,142,701 | – | – | (202,116 | ) | (157,015 | ) | (15,357 | ) | 768,889 | ||||||||||||||||||
|
Unrealized gain on interest rate swaps, net of tax of $236
|
– | – | – | – | – | – | – | 365 | 365 | |||||||||||||||||||||
|
Amortization of unrealized loss on interest rate swaps, net of tax of $95
|
– | – | – | – | – | – | – | 2,082 | 2,082 | |||||||||||||||||||||
|
Foreign currency translation adjustment
|
– | – | – | – | – | – | – | (34 | ) | (34 | ) | |||||||||||||||||||
|
Common stock issued under equity incentive plans, net of shares withheld
for employee taxes and strike price
|
643,148 | 7 | (6,431 | ) | – | – | – | – | – | (6,424 | ) | |||||||||||||||||||
|
Excess tax benefits from equity awards
|
– | – | 4,588 | – | – | – | – | – | 4,588 | |||||||||||||||||||||
|
Share-based compensation
|
– | – | 10,780 | – | – | – | – | – | 10,780 | |||||||||||||||||||||
|
Dividends declared
|
– | – | (408,289 | ) | – | – | – | – | – | (408,289 | ) | |||||||||||||||||||
|
Pension liability adjustment, net of tax of ($1,001)
|
– | – | – | – | – | – | – | (1,552 | ) | (1,552 | ) | |||||||||||||||||||
|
Net income
|
– | – | – | – | – | – | 93,223 | – | 93,223 | |||||||||||||||||||||
|
Balance at December 31, 2012
|
68,295,960 | 683 | 743,349 | – | – | (202,116 | ) | (63,792 | ) | (14,496 | ) | 463,628 | ||||||||||||||||||
|
Unrealized gain on interest rate swaps, net of tax of $462
|
– | – | – | – | – | – | – | 774 | 774 | |||||||||||||||||||||
|
Amortization of unrealized loss on interest rate swaps, net of tax of $109
|
– | – | – | – | – | – | – | 2,381 | 2,381 | |||||||||||||||||||||
|
Foreign currency translation adjustment
|
– | – | – | – | – | – | – | 1,238 | 1,238 | |||||||||||||||||||||
|
Common stock issued under equity incentive plans, net of shares withheld f
or employee taxes and strike price
|
471,407 | 5 | (8,587 | ) | – | – | – | – | – | (8,582 | ) | |||||||||||||||||||
|
Treasury stock purchases
|
– | – | – | (163,458 | ) | (6,571 | ) | – | – | – | (6,571 | ) | ||||||||||||||||||
|
Excess tax benefits from equity awards
|
– | – | 11,553 | – | – | – | – | – | 11,553 | |||||||||||||||||||||
|
Share-based compensation
|
– | – | 12,368 | – | – | – | – | – | 12,368 | |||||||||||||||||||||
|
Dividends declared
|
– | – | (337,011 | ) | – | – | – | (4,934 | ) | – | (341,945 | ) | ||||||||||||||||||
|
Pension liability adjustment, net of tax of $5,060
|
– | – | – | – | – | – | – | 7,688 | 7,688 | |||||||||||||||||||||
|
Net income
|
– | – | – | – | – | – | 174,539 | – | 174,539 | |||||||||||||||||||||
|
Balance at December 31, 2013
|
68,767,367 | $ | 688 | $ | 421,672 | (163,458 | ) | $ | (6,571 | ) | $ | (202,116 | ) | $ | 105,813 | $ | (2,415 | ) | $ | 317,071 | ||||||||||
|
See notes to condensed consolidated financial statements.
|
||||||||||||||||||||||||||||||
|
Generac Holdings Inc.
|
|||||||||||||
|
Consolidated Statements of Cash Flows
|
|||||||||||||
|
(Dollars in Thousands)
|
|||||||||||||
|
Year Ended December 31,
|
|||||||||||||
|
2013
|
2012
|
2011
|
|||||||||||
|
Operating activities
|
|||||||||||||
|
Net income
|
$ | 174,539 | $ | 93,223 | $ | 324,643 | |||||||
|
Adjustment to reconcile net income to net cash provided by operating activities:
|
|||||||||||||
|
Depreciation
|
10,955 | 8,293 | 8,103 | ||||||||||
|
Amortization of intangible assets
|
25,819 | 45,867 | 48,020 | ||||||||||
|
Trade name write-down
|
– | – | 9,389 | ||||||||||
|
Amortization of original issue discount
|
2,074 | 1,598 | – | ||||||||||
|
Amortization of deferred finance costs
|
2,698 | 2,161 | 1,986 | ||||||||||
|
Amortization of unrealized loss on interest rate swaps
|
2,381 | 2,082 | – | ||||||||||
|
Loss on extinguishment of debt
|
15,336 | 14,308 | 377 | ||||||||||
|
Provision for losses on accounts receivable
|
1,037 | 204 | (7 | ) | |||||||||
|
Deferred income taxes
|
82,675 | 62,429 | (238,170 | ) | |||||||||
|
Loss on disposal of property and equipment
|
370 | 261 | 10 | ||||||||||
|
Share-based compensation expense
|
12,368 | 10,780 | 8,646 | ||||||||||
|
Net changes in operating assets and liabilities:
|
|||||||||||||
|
Accounts receivable
|
(5,257 | ) | (137 | ) | (22,235 | ) | |||||||
|
Inventories
|
(52,488 | ) | (31,656 | ) | (11,224 | ) | |||||||
|
Other assets
|
(10,902 | ) | (8,416 | ) | (6,834 | ) | |||||||
|
Accounts payable
|
(5,847 | ) | (3,898 | ) | 18,517 | ||||||||
|
Accrued wages and employee benefits
|
6,248 | 3,168 | 6,516 | ||||||||||
|
Other accrued liabilities
|
9,491 | 39,915 | 22,175 | ||||||||||
|
Excess tax benefits from equity awards
|
(11,553 | ) | (4,588 | ) | (200 | ) | |||||||
|
Net cash provided by operating activities
|
259,944 | 235,594 | 169,712 | ||||||||||
|
Investing activities
|
|||||||||||||
|
Proceeds from sale of property and equipment
|
80 | 91 | 14 | ||||||||||
|
Expenditures for property and equipment
|
(30,770 | ) | (22,392 | ) | (12,060 | ) | |||||||
|
Proceeds from sale of business, net
|
2,254 | – | – | ||||||||||
|
Acquisition of business, net of cash acquired
|
(116,113 | ) | (47,044 | ) | (83,907 | ) | |||||||
|
Net cash used in investing activities
|
(144,549 | ) | (69,345 | ) | (95,953 | ) | |||||||
|
Financing activities
|
|||||||||||||
|
Proceeds from short-term borrowings
|
16,007 | 23,018 | – | ||||||||||
|
Proceeds from long-term borrowings
|
1,200,000 | 1,455,614 | – | ||||||||||
|
Repayments of short-term borrowings
|
(18,982 | ) | (23,000 | ) | – | ||||||||
|
Repayments of long-term borrowings and capital lease obligations
|
(901,184 | ) | (1,175,124 | ) | (59,355 | ) | |||||||
|
Payment of debt issuance costs
|
(22,376 | ) | (25,691 | ) | – | ||||||||
|
Cash dividends paid
|
(343,429 | ) | (404,332 | ) | – | ||||||||
|
Taxes paid related to the net share settlement of equity awards
|
(15,020 | ) | (6,425 | ) | (371 | ) | |||||||
|
Excess tax benefits from equity awards
|
11,553 | 4,588 | 200 | ||||||||||
|
Proceeds from exercise of stock options
|
32 | – | 310 | ||||||||||
|
Net cash used in financing activities
|
(73,399 | ) | (151,352 | ) | (59,216 | ) | |||||||
|
Effect of exchange rate changes on cash and cash equivalents
|
128 | – | – | ||||||||||
|
Net increase (decrease) in cash and cash equivalents
|
42,124 | 14,897 | 14,543 | ||||||||||
|
Cash and cash equivalents at beginning of period
|
108,023 | 93,126 | 78,583 | ||||||||||
|
Cash and cash equivalents at end of period
|
$ | 150,147 | $ | 108,023 | $ | 93,126 | |||||||
|
Supplemental disclosure of cash flow information
|
|||||||||||||
|
Cash paid during the period
|
|||||||||||||
|
Interest
|
$ | 55,828 | $ | 33,076 | $ | 24,264 | |||||||
|
Income taxes
|
25,821 | 2,811 | 437 | ||||||||||
|
See notes to consolidated financial statements
|
|||||||||||||
Generac Holdings Inc.
Notes to Consolidated Financial Statements
Years Ended December 31, 2013, 2012, and 2011
(Dollars in Thousands, Except Share and Per Share Data)
Generac Holdings Inc. (the Company) owns all of the common stock of Generac Acquisition Corp. (GAC), which in turn, owns all of the common stock of Generac Power Systems, Inc. (the Subsidiary and the Borrower). The Company is a leading designer and manufacturer of a wide range of power generation equipment and other engine powered products serving the residential, light-commercial, industrial and construction markets.
2. Significant Accounting Policies
Principles of Consolidation
The consolidated financial statements include the accounts of the Company and its wholly owned subsidiaries. All intercompany amounts and transactions have been eliminated in consolidation. Certain prior period amounts in the consolidated financial statements and notes thereto have been reclassified to conform to the current period’s presentation.
Cash Equivalents
The Company considers all highly liquid investments purchased with an original maturity of three months or less to be cash equivalents.
Restricted Cash
Restricted cash represents cash transferred to an escrow account for the future settlement of certain earn-out obligations associated with the Tower Light acquisition. See Note 3 - Acquisitions for additional details.
Concentration of Credit Risk
The Company maintains the majority of its cash in one commercial bank in multiple operating and investment accounts. Balances on deposit are insured by the Federal Deposit Insurance Corporation (FDIC) up to specified limits. Balances in excess of FDIC limits are uninsured.
One customer accounted for approximately 11% and 9% of accounts receivable at December 31, 2013 and December 31, 2012, respectively. No one customer accounted for greater than 6%, 7% and 10%, respectively, of net sales during the years ended December 31, 2013, 2012, or 2011.
Accounts Receivable
Receivables are recorded at their face value amount less an allowance for doubtful accounts. The Company estimates and records an allowance for doubtful accounts based on specific identification and historical experience. The Company writes off uncollectible accounts against the allowance for doubtful accounts after all collection efforts have been exhausted. Sales are generally made on an unsecured basis.
Inventories
Inventories are stated at the lower of cost or market, with cost determined generally using the first-in, first-out method.
Property and Equipment
Property and equipment are recorded at cost and are being depreciated using the straight-line method over the estimated useful lives of the assets, which are summarized below (in years). Costs of leasehold improvements are amortized over the lesser of the term of the lease (including renewal option periods) or the estimated useful lives of the improvements.
|
Land improvements
|
10 – 15
|
|
Buildings and improvements
|
10 – 40
|
|
Leasehold improvements
|
7 – 20
|
|
Machinery and equipment
|
5 – 20
|
|
Dies and tools
|
3 – 10
|
|
Vehicles
|
3 – 5
|
|
Office equipment
|
3 – 10
|
Customer Lists, Patents, and Other Intangible Assets
The following table summarizes intangible assets by major category as of December 31, 2013 and 2012:
|
Weighted Average
|
2013
|
2012
|
|||||
|
Amortization Years
|
Cost
|
Accumulated Impairment
|
Amortized Cost
|
Cost
|
Accumulated Impairment
|
Amortized Cost
|
|
|
Indefinite lived intangible assets
|
|||||||
|
Trade names
|
$ 182,585
|
$ (9,389)
|
$ 173,196
|
$ 168,220
|
$ (9,389)
|
$ 158,831
|
|
|
Cost
|
Accumulated Amortization
|
Amortized Cost
|
Cost
|
Accumulated Amortization
|
Amortized Cost
|
||
|
Finite lived intangible assets
|
|||||||
|
Trade names
|
0
|
$ 8,775
|
$ (8,775)
|
$ -
|
$ 8,775
|
$ (8,775)
|
$ -
|
|
Customer lists
|
7
|
294,627
|
(251,863)
|
42,764
|
273,355
|
(235,532)
|
37,823
|
|
Patents
|
15
|
118,921
|
(56,503)
|
62,418
|
118,921
|
(48,619)
|
70,302
|
|
Unpatented technology
|
12
|
13,169
|
(9,064)
|
4,105
|
13,165
|
(7,696)
|
5,469
|
|
Software
|
8
|
1,046
|
(912)
|
134
|
1,014
|
(779)
|
235
|
|
Non-compete/other
|
2
|
345
|
(137)
|
208
|
113
|
(34)
|
79
|
|
Total finite lived intangible assets
|
$ 436,883
|
$ (327,254)
|
$ 109,629
|
$ 415,343
|
$ (301,435)
|
$ 113,908
|
|
Amortization of intangible assets was $25,819, $45,867 and $48,020 in 2013, 2012 and 2011, respectively. During the fourth quarter of 2011, the Company wrote down a certain trade name indefinite-lived intangible asset. See the Goodwill and Other Indefinite-Lived Intangible Assets section for further discussion. Estimated amortization expense each year for the five years subsequent to December 31, 2013 is as follows: 2014, $21,058; 2015, $19,718; 2016, $17,892; 2017, $14,581; 2018, $10,228.
Debt Issuance Costs
Direct and incremental costs incurred in connection with the issuance of long-term debt are capitalized and amortized to interest expense over the terms of the related credit agreements. Debt discounts incurred in connection with the issuance of long-term debt are deferred and recorded as a reduction of outstanding debt and amortized to interest expense using the effective interest method over the terms of the related credit agreements. Approximately $4,772, $3,759, and $1,986 of deferred financing costs and original issue discounts were amortized to interest expense during fiscal years 2013, 2012 and 2011, respectively. Estimated amortization expense each year for the five years subsequent to December 31, 2013 is as follows: 2014, $4,919; 2015, $5,033; 2016, $5,165; 2017, $5,273; 2018, $5,143.
Long-Lived Assets
The Company periodically evaluates the carrying value of long-lived assets (excluding goodwill and trade names). Long-lived assets are reviewed for impairment whenever events or changes in circumstances indicate that the carrying amount may not be recoverable. If the sum of the expected future undiscounted cash flows is less than the carrying amount of an asset, a loss is recognized for the difference between the fair value and carrying value of the asset. Such analyses necessarily involve significant judgments.
Goodwill and Other Indefinite-Lived Intangible Assets
Goodwill represents the excess of the purchase price over fair value of identifiable net assets acquired from business acquisitions. Goodwill is not amortized, but is reviewed for impairment on an annual basis and between annual tests if indicators of impairment are present. The Company evaluates goodwill for impairment annually on October 1 or more frequently when an event occurs or circumstances change that indicates the carrying value may not be recoverable. The Company has the option to assess goodwill for impairment by first performing a qualitative assessment to determine whether it is more likely than not that the fair value of a reporting unit is less than its carrying amount. If the Company determines that it is not more likely than not that the fair value of a reporting unit is less than its carrying amount, then further goodwill impairment testing is not required to be performed. If the Company determines that it is more likely than not that the fair value of a reporting unit is less than its carrying amount, the Company is required to perform a two-step goodwill impairment test. In the first step, the fair value of the reporting unit is compared to its book value including goodwill. If the fair value of the reporting unit is in excess of its book value, the related goodwill is not impaired and no further analysis is necessary. If the fair value of the reporting unit is less than its book value, there is an indication of potential impairment and a second step is performed. When required, the second step of testing involves calculating the implied fair value of goodwill for the reporting unit. The implied fair value of goodwill is determined in the same manner as goodwill recognized in a business combination, which is the excess of the fair value of the reporting unit determined in step one over the fair value of its net assets and identifiable intangible assets as if the reporting unit had been acquired. If the carrying value of the reporting unit's goodwill exceeds the implied fair value of that goodwill, an impairment loss is recognized in an amount equal to that excess. For reporting units with a negative book value (i.e., excess of liabilities over assets), qualitative factors are evaluated to determine whether it is necessary to perform the second step of the goodwill impairment test.
The Company performed the required annual impairment tests for fiscal years 2013, 2012 and 2011 and found no impairment of goodwill. There can be no assurance that future goodwill impairment tests will not result in a charge to earnings.
The changes in the carrying amount of goodwill for the years ended December 31, 2013 and 2012 are as follows:
|
Year ended December 31, 2013
|
Year ended December 31, 2012
|
|||||||||||
|
Gross
|
Accumulated
Impairment
|
Net
Goodwill
|
Gross
|
Accumulated
Impairment
|
Net
Goodwill
|
|||||||
|
Balance at beginning of year
|
$
|
1,056,136
|
$
|
(503,193)
|
$
|
552,943
|
$
|
1,050,666
|
$
|
(503,193)
|
$
|
547,473
|
|
Acquisition of business, net
|
56,605
|
—
|
56,605
|
5,470
|
—
|
5,470
|
||||||
|
Sale of business, net
|
(1,261)
|
—
|
(1,261)
|
—
|
—
|
—
|
||||||
|
Balance at end of year
|
$
|
1,111,480
|
$
|
(503,193)
|
$
|
608,287
|
$
|
1,056,136
|
$
|
(503,193)
|
$
|
552,943
|
The Company acquired two businesses during fiscal 2013 for a combined purchase price of $122,391, net of cash acquired, which resulted in additional goodwill of $57,044. Separately, the Ottomotores purchase price allocation was finalized during the second quarter of 2013, which resulted in an adjustment to goodwill of $(439). The Company acquired two businesses during fiscal 2012 for a combined purchase price of $47,044, net of cash acquired, which resulted in additional goodwill of $5,545. Separately, the Magnum purchase price allocation was finalized during the third quarter of 2012, which resulted in an adjustment to goodwill of $(75).
Other indefinite-lived intangible assets consist of trade names. The Company tests the carrying value of these trade names by comparing the assets fair value to its carrying value. Fair value was measured using a relief-from-royalty approach, which assumes the fair value of the trade name is the discounted cash flows of the amount that would be paid had the Company not owned the trade name and instead licensed the trade name from another company. The Company conducts its annual impairment tests for indefinite-lived intangible assets on October 31
st
of each year.
The Company performed the required annual impairment tests for fiscal years 2013 and 2012 and found no impairment of indefinite-lived trade names. During the fourth quarter of 2011, the Company decided to strategically transition certain products to their more widely known Generac brand. Based on this decision, the Company recorded a $9,389 non-cash trade name impairment charge as of October 31, 2011 which primarily related to the write down of the impacted trade name to net realizable value. There can be no assurance that future impairment tests will not result in a charge to earnings.
Income Taxes
The Company is a C Corporation and, therefore, accounts for income taxes pursuant to the liability method. Accordingly, the current or deferred tax consequences of a transaction are measured by applying the provision of enacted tax laws to determine the amount of taxes payable currently or in future years. Deferred income taxes are provided for temporary differences between the income tax bases of assets and liabilities and their carrying amounts for financial reporting purposes. In assessing the realizability of deferred tax assets, the Company considers whether it is more likely than not that some portion or all of the deferred tax assets will not be realized. The ultimate realization of deferred tax assets is dependent upon the generation of future taxable income during the years in which those temporary differences become deductible. The Company considers the scheduled reversal of deferred tax liabilities, projected future taxable income, and tax planning strategies, as appropriate, in making this assessment.
Revenue Recognition
Sales, net of estimated returns and allowances, are recognized upon shipment of product to the customer, which is generally when title passes, the Company has no further obligations, and the customer is required to pay. The Company, at the request of certain customers, will warehouse inventory billed to the customer but not delivered. Unless all revenue recognition criteria have been met, the Company does not recognize revenue on these transactions until the customers take possession of the product. The funds collected on product warehoused for these customers are recorded as a customer advance until the customer takes possession of the product and the Company’s obligation to deliver the goods is completed. Customer advances are included in accrued liabilities in the accompanying consolidated balance sheets.
The Company provides for certain estimated sales promotion, discounts and incentive expenses which are recognized as a reduction of sales.
Historically, product returns, whether in the normal course of business or resulting from repurchases made under a floor plan financing program, have not been material.
Shipping and Handling Costs
Shipping and handling costs billed to customers are included in net sales, and the related costs are included in cost of goods sold in the consolidated statements of comprehensive income.
Advertising and Co-Op Advertising
Expenditures for advertising, included in selling and service expenses in the accompanying consolidated statements of comprehensive income, are expensed as incurred. Total expenditures for advertising were $19,910, $13,360, and $11,742 for the years ended December 31, 2013, 2012, and 2011, respectively.
Research and Development
The Company expenses research and development costs as incurred. Total expenditures incurred for research and development were $29,271, $23,499, and $16,476 for the years ended December 31, 2013, 2012 and 2011, respectively.
Foreign Currency Translation and Transactions
Foreign currency balance sheet accounts are translated into dollars at the rates of exchange in effect at fiscal year-end. Income and expenses incurred in a foreign currency are translated at the average rates of exchange in effect during the year. The related translation adjustments are made directly to a separate component of Stockholders’ Equity.
Gains and losses from foreign currency transactions are included in net income in the Company’s consolidated statements of comprehensive income.
Accumulated Other Comprehensive Loss
Accumulated other comprehensive loss includes foreign currency translation adjustments, pension liability adjustments and unrealized gains (losses) on certain cash flow hedges. The components of accumulated other comprehensive loss, net of tax, at December 31, 2013 and 2012 were:
|
December 31,
|
||||||||
|
2013
|
2012
|
|||||||
|
Foreign currency translation adjustments
|
$ | 1,204 | $ | (34 | ) | |||
|
Pension liability, net of tax of $886 and $(4,174)
|
(4,393 | ) | (12,081 | ) | ||||
|
Unrealized gain (loss) on cash flow hedges, net of tax of $462 and $(109)
|
774 | (2,381 | ) | |||||
|
Accumulated other comprehensive loss
|
$ | (2,415 | ) | $ | (14,496 | ) | ||
The following presents a tabular disclosure about changes in accumulated other comprehensive loss during the year ended December 31, 2013:
|
Foreign Currency Translation Adjustments
|
Defined Benefit Pension Plan
|
Unrealized gain (loss) on cash flow hedges
|
Total
|
|||||||||||||
|
Beginning Balance
|
$ | (34 | ) | $ | (12,081 | ) | $ | (2,381 | ) | $ | (14,496 | ) | ||||
|
Other comprehensive income before
reclassifications
|
1,238 | 6,994 | 774 | 9,006 | ||||||||||||
|
Amounts reclassified from accumulated other
comprehensive loss
|
- | 694 | 2,381 | 3,075 | ||||||||||||
|
Net current-period other comprehensive income
|
1,238 | 7,688 | 3,155 | 12,081 | ||||||||||||
|
Ending Balance
|
$ | 1,204 | $ | (4,393 | ) | $ | 774 | $ | (2,415 | ) | ||||||
The following presents a tabular disclosure about reclassification adjustments out of accumulated other comprehensive loss during the years ended December 31, 2013 and 2012:
|
Amounts reclassified from other accumulated comprehensive loss for the year ended
December 31,
|
|
||||||||
|
2013
|
2012
|
Affected line item in the statement where net income is presented
|
|||||||
|
Amortization of unrealized loss on interest rate swaps
|
|||||||||
|
Gross
|
$ | (2,490 | ) | $ | (2,177 | ) |
Interest expense
|
||
|
Tax benefit
|
109 | 95 | |||||||
|
Net of tax
|
(2,381 | ) | (2,082 | ) | |||||
|
Amortization of defined benefit pension actuarial losses
|
||||||||||||
|
Gross
|
(1,108 | ) | (909 | ) | (1 | ) | ||||||
|
Tax benefit
|
414 | 356 | ||||||||||
|
Net of tax
|
(694 | ) | (553 | ) | ||||||||
|
(1)
|
These actuarial losses are included in the computation of net periodic pension cost. See Note 9 – Benefit Plans for additional details.
|
Fair Value of Financial Instruments
The Company believes the carrying amount of its financial instruments (cash and cash equivalents, restricted cash, accounts receivable, accounts payable, accrued liabilities and short-term borrowings), excluding long-term borrowings, approximates the fair value of these instruments based upon their short-term nature. The fair value of long-term borrowings, including amounts classified as current, which have an aggregate carrying value of $1,197,000 was approximately $1,199,993 (level 2) at December 31, 2013, as calculated based on independent valuations whose inputs and significant value drivers are observable.
Fair Value Measurements
ASC 820-10
Fair Value Measurements and Disclosures
among other things, defines fair value, establishes a consistent framework for measuring fair value, and expands disclosure for each major asset and liability category measured at fair value on either a recurring basis or nonrecurring basis. ASC 820-10 clarifies that fair value is an exit price, representing the amount that would be received in the sale of an asset or paid to transfer a liability in an orderly transaction between market participants. As such, fair value is a market-based measurement that should be determined based on assumptions market participants would use in pricing an asset or liability. As a basis for considering such assumptions, the pronouncement establishes a three-tier fair value hierarchy, which prioritizes the inputs used in measuring fair value as follows: (Level 1) observable inputs such as quoted prices in active markets; (Level 2) inputs, other than the quoted prices in active markets, that are observable either directly or indirectly; and (Level 3) unobservable inputs in which there is little or no market data, which require the reporting entity to develop its own assumptions.
Assets and liabilities measured at fair value are based on the market approach, which are prices and other relevant information generated by market transactions involving identical or comparable assets or liabilities.
Assets and (liabilities) measured at fair value on a recurring basis are as follows:
| Fair Value Measurement Using | ||||||||||||
|
Total
December 31, 2013
|
Quoted Prices in Active Markets for Identical Contracts (Level 1)
|
Significant
Other Observable Inputs
(Level 2)
|
||||||||||
|
Interest rate swaps
|
$ | 1,236 | $ | – | $ | 1,236 | ||||||
|
Commodity contracts
|
$ | 69 | $ | – | $ | 69 | ||||||
|
Foreign currency contracts
|
$ | 56 | $ | – | $ | 56 | ||||||
| Fair Value Measurement Using | ||||||||||||
|
Total
December 31, 2012
|
Quoted Prices in Active Markets for Identical Contracts (Level 1)
|
Significant
Other Observable Inputs
(Level 2)
|
||||||||||
|
Interest rate swaps
|
$ | (2,973 | ) | $ | – | $ | (2,973 | ) | ||||
|
Commodity Contracts
|
$ | 111 | $ | – | $ | 111 | ||||||
The fair value of derivatives designated as hedging instruments is included in other assets in the consolidated balance sheet as of December 31, 2013. The fair value of derivatives not designated as hedging instruments is included in other assets and other current liabilities in the consolidated balance sheets as of December 31, 2013 and 2012, respectively.
The valuation techniques used to measure the fair value of derivative contracts classified as level 2, all of which have counterparties with high credit ratings, were valued based on quoted market prices or model driven valuations using significant inputs derived from or corroborated by observable market data. The fair value of derivative contracts above considers the Company’s credit risk in accordance with ASC 820-10. Excluding the impact of credit risk, the fair value of derivatives at December 31, 2013 and 2012 was $1,385 (asset) and $2,936 (liability), respectively, and this represents the amount the Company or other counterparty would need to pay to exit the agreements on this date.
Use of Estimates
The preparation of the consolidated financial statements in conformity with U.S. generally accepted accounting principles requires management to make estimates and assumptions that affect the reported amounts of assets and liabilities and disclosure of contingent assets and liabilities at the date of the consolidated financial statements and the reported amounts of revenues and expenses during the reporting period. Actual results could differ from those estimates.
Derivative Instruments and Hedging Activities
The Company records all derivatives in accordance with ASC 815,
Derivatives and Hedging
, which requires all derivative instruments be reported on the consolidated balance sheets at fair value and establishes criteria for designation and effectiveness of hedging relationships. The Company is exposed to market risk such as changes in commodity prices, foreign currencies, and interest rates. The Company does not hold or issue derivative financial instruments for trading purposes.
Commodities
The primary objectives of the commodity risk management activities are to understand and mitigate the impact of potential price fluctuations on the Company’s financial results and its economic well-being. While the Company’s risk management objectives and strategies will be driven from an economic perspective, the Company attempts, where possible and practical, to ensure that the hedging strategies it engages in can be treated as “hedges” from an accounting perspective or otherwise result in accounting treatment where the earnings effect of the hedging instrument provides substantial offset (in the same period) to the earnings effect of the hedged item. Generally, these risk management transactions will involve the use of commodity derivatives to protect against exposure resulting from significant price fluctuations.
The Company primarily utilizes commodity contracts with maturities of less than 12 months. These are intended to offset the effect of price fluctuations on actual inventory purchases. Outstanding commodity forward contracts in place to hedge the Company’s projected commodity purchases were as follows.
|
As of December 31, 2013:
|
||||
|
Commodity
|
Trade Date
|
Effective Date
|
Notional Amount
|
Termination Date
|
|
Copper
|
6/21/2013
|
10/1/2013
|
$2,169
|
6/30/2014
|
|
As of December 31, 2012:
|
||||
|
Commodity
|
Trade Date
|
Effective Date
|
Notional Amount
|
Termination Date
|
|
Copper
|
10/29/2012
|
1/1/2013
|
$3,472
|
9/30/2013
|
|
As of December 31, 2011:
|
||||
|
Commodity
|
Trade Date
|
Effective Date
|
Notional Amount
|
Termination Date
|
|
Copper
|
09/19/2011
|
10/1/2011
|
$4,533
|
6/30/2012
|
|
Copper
|
09/28/2011
|
10/1/2011
|
$1,935
|
6/30/2012
|
Total losses or gains recognized in the consolidated statements of operations on commodity contracts were a loss of $605, a gain of $386, and a loss of $861 for the years ended December 31, 2013, 2012, and 2011, respectively.
Foreign Currencies
The Company is exposed to foreign currency exchange risk as a result of transactions in other currencies. The Company periodically utilizes foreign currency forward purchase and sales contracts to manage the volatility associated with foreign currency purchases in the normal course of business. Contracts typically have maturities of one year or less. There were no foreign currency hedge contracts outstanding as of December 31, 2012 or 2011. As of December 31, 2013, we had the following foreign currency contracts outstanding (in thousands):
|
Currency Denomination
|
Notional Amount
|
|
United States Dollar (USD)
|
650
|
|
British Pound Sterling (GBP)
|
4,000
|
Interest Rates
The Company has two interest rate swap agreements outstanding as of December 31, 2013 with an aggregate notional amount of $200,000. The Company had two interest rate swap agreements outstanding as of December 31, 2012 with an aggregate notional amount of $300,000.
In 2010, the Company entered into two interest rate swap agreements and had formally documented all relationships between interest rate hedging instruments and hedged items, as well as its risk-management objectives and strategies for undertaking various hedge transactions. The first was entered into on January 21, 2010. The effective date of this swap was July 1, 2010 with a notional amount of $200,000, a fixed LIBOR rate of 1.73% and an expiration date of July 1, 2012. The second was entered into on June 29, 2010. The effective date of that swap was October 1, 2010 with a notional amount of $100,000, a fixed LIBOR rate of 1.025% and an expiration date of October 1, 2012. The Company entered into two interest rate swap agreements on April 1, 2011. The effective date of the first swap was July 1, 2012 with a notional amount of $200,000, a fixed LIBOR rate of 1.905% and an expiration date of July 1, 2013. The effective date of the second swap was October 1, 2012 with a notional amount of $100,000, a fixed LIBOR rate of 2.22% and an expiration date of October 1, 2013. Due to the incorporation of a new interest rate floor provision in the Term Loan Credit Agreement, which constituted a change in critical terms, the Company concluded that as of May 30, 2012, the outstanding swaps would no longer be highly effective in achieving offsetting changes in cash flows during the periods the hedges were designated. As a result, the Company was required to de-designate the hedges as of May 30, 2012. Beginning May 31 2012, the effective portion of the swaps prior to the change (i.e. amounts previously recorded in Accumulated Other Comprehensive Loss) were amortized into interest expense over the period of the originally designated hedged transactions which had various termination dates through October 2013. Future changes in fair value of these swaps were immediately recognized in the consolidated statements of comprehensive income as interest expense.
In 2013, the Company entered into two interest rate swap agreements and had formally documented all relationships between interest rate hedging instruments and hedged items, as well as its risk-management objectives and strategies for undertaking various hedge transactions. These interest rate swap agreements qualify as cash flow hedges. For derivatives that are designated and qualify as a cash flow hedge, the effective portion of the gain or loss on the derivative is reported as a component of accumulated other comprehensive income (loss). The cash flows of the swaps are recognized as adjustments to interest expense each period. The ineffective portion of the derivatives’ change in fair value, if any, is immediately recognized in earnings. The Company assesses on an ongoing basis whether derivatives used in hedging transactions are highly effective in offsetting changes in cash flows of hedged items. The swaps were both entered into on October 23, 2013. The effective dates of the swaps are July 1, 2014 with a notional amount of $100,000 each and a fixed LIBOR rate of 1.737% and 1.742% with expiration dates of July 1, 2018.
The following presents the impact of interest rate swaps, commodity contracts and currency contracts on the consolidated statement of comprehensive income for the year ended December 31, 2013, 2012 and 2011:
|
Amount of gain (loss)
recognized in AOCI for
the twelve months ended
December 31,
|
Location of gain (loss)
recognized in net income (loss) on ineffective portion of hedges
|
Amount of loss reclassified from AOCI into net income (loss) for the twelve months ended December 31,
|
Amount of gain (loss)
recognized in net income
(loss) on hedges
(ineffective portion) for
twelve months ended
December 31,
|
|||||||||||||||||||||||||||||||||||
|
2013
|
2012
|
2011
|
2013
|
2012
|
2011
|
2013
|
2012
|
2011
|
||||||||||||||||||||||||||||||
| Derivatives designated as hedging instruments | ||||||||||||||||||||||||||||||||||||||
| Interest rate swaps (1) | $ | 774 | $ | 365 | $ | (683 | ) |
Interest Expense
|
$ | - | $ | - | $ | - | $ | - | $ | - | $ | - | ||||||||||||||||||
| Derivatives not designated as hedging instruments | ||||||||||||||||||||||||||||||||||||||
| Commodity and foreign currency contracts | $ | - | $ | - | $ | - |
Cost of goods sold
|
$ | - | $ | - | $ | - | $ | (661 | ) | $ | 386 | $ | (861 | ) | |||||||||||||||||
| Interest rate swaps (2) | $ | - | $ | - | $ | - |
Interest Expense
|
$ | (2,381 | ) | $ | (2,082 | ) | $ | - | $ | 2,973 | $ | 1,695 | $ | - | |||||||||||||||||
|
(1)
|
(1)
Amounts recorded for the twelve months ended December 31, 2012 and 2011 relate to the interest rate swap agreements outstanding prior to May 30, 2012, the date the hedging relationships for these agreements were terminated.
|
|
(2)
|
Amounts recorded for the twelve months ended December 31, 2013 and 2012 relate to interest rate swap agreements outstanding as of May 30, 2012, the date the hedging relationships for these agreements were terminated.
|
Stock-Based Compensation
Stock-based compensation expense, including stock options and restricted stock awards, is generally recognized on a straight-line basis over the vesting period based on the fair value of awards which are expected to vest. The fair value of all share-based awards is estimated on the date of grant.
Segment Reporting
The Company operates in and reports as a single operating segment, which is the design and manufacture of a wide range of power products. Net sales are predominantly generated through the sale of generators and other engine powered products through various distribution channels. The Company manages and evaluates its operations as one segment primarily due to similarities in the nature of the products, production processes and methods of distribution. The Company’s sales in the United States represent approximately 88%, 93%, and 95% of total sales for the years ended December 31, 2013, 2012 and 2011, respectively. Approximately 90%, 98% and 100% of the Company’s identifiable long-lived assets are located in the United States as of December 31, 2013, 2012 and 2011, respectively.
The Company's product offerings consist primarily of power products with a range of power output geared for varying end customer uses. Residential power products and commercial & industrial power products are each a similar class of products based on similar power output and end customer usage. The breakout of net sales between residential, commercial & industrial, and other products is as follows:
|
Year ended December 31,
|
||||||||||||
|
2013
|
2012
|
2011
|
||||||||||
|
Residential power products
|
$ | 843,727 | $ | 705,444 | $ | 491,016 | ||||||
|
Commercial & industrial power products
|
569,890 | 410,341 | 250,270 | |||||||||
|
Other
|
72,148 | 60,521 | 50,690 | |||||||||
|
Total
|
$ | 1,485,765 | $ | 1,176,306 | $ | 791,976 | ||||||
New Accounting Pronouncements
In February 2013, the Financial Accounting Standards Board (“FASB”) issued Accounting Standards Update (“ASU”) No. 2013-02,
Comprehensive Income (Topic 220): Reporting of Amounts Reclassified Out of Accumulated Other Comprehensive Income
(“ASU 2013-02”). This guidance is the culmination of the FASB’s deliberation on reporting reclassification adjustments from accumulated other comprehensive income (AOCI). The amendments in ASU 2013-02 do not change the current requirements for reporting net income or other comprehensive income. However, the amendments require disclosure of amounts reclassified out of AOCI in its entirety, by component, on the face of the statement of operations or in the notes thereto. Amounts that are not required to be reclassified in their entirety to net income must be cross-referenced to other disclosures that provide additional detail. This standard is effective prospectively for annual and interim reporting periods beginning after December 15, 2012. The Company’s adoption of this standard did not have a material impact on the Company’s financial condition or results of operations.
In July 2013, the FASB issued ASU No. 2013-10,
Inclusion of the Fed Funds Effective Swap Rate (or Overnight Index Swap Rate) as a Benchmark Interest Rate for Hedge Accounting Purposes
("ASU 2013-10"). ASU 2013-10 permits the Fed Funds Effective Swap Rate to be used as a U.S. benchmark interest rate for hedge accounting purposes, in addition to the United States Treasury rate and London Interbank Offered Rate ("LIBOR"). In addition, the restriction on using different benchmark rates for similar hedges is removed. The provisions of ASU 2013-10 are effective prospectively for qualifying new or redesignated hedging relationships entered into on or after July 17, 2013. The adoption of ASU 2013-10 did not have a material impact on the Company’s financial condition or results of operations.
There are several other new accounting pronouncements issued by the FASB. Each of these pronouncements, as applicable, has been or will be adopted by the Company. Management does not believe any of these accounting pronouncements has had or will have a material impact on the Company’s consolidated financial statements.
3. Acquisitions
Acquisition of Tower Light
On August 1, 2013, a subsidiary of the Company acquired all of the shares of Tower Light SRL and its wholly-owned subsidiaries (collectively, “Tower Light”) for a purchase price, net of cash acquired and inclusive of estimated earn-out payments, of $85,812. Headquartered outside Milan, Italy, Tower Light is a leading developer and supplier of mobile light towers throughout Europe, the Middle East and Africa. Tower Light has built a leading market position in the equipment rental markets by leveraging its broad product offering and strong global distribution network in over 50 countries worldwide.
The net cash paid at closing of $80,239 included a cash deposit of $6,645 into an escrow account to fund future earn-out payments required by the purchase agreement, which is recorded as restricted cash on the Company’s consolidated balance sheet. The difference between the total escrow deposit and the Company’s estimated future earn-out payments is reflected as an addition in the purchase price. The total earn-out payment is estimated to be $12,500. Additionally, the cash paid at closing included an estimate of acquired working capital. This estimate was finalized during third quarter of 2013, resulting in a $300 decrease to the purchase price. This acquisition was funded solely by existing cash.
The Company recorded a preliminary purchase price allocation during the third quarter of 2013 based upon its estimates of the fair value of the acquired assets and assumed liabilities. As a result, the Company recorded approximately $67,900 of intangible assets, including approximately $38,400 of goodwill, as of the acquisition date. Based on revised purchase accounting estimates related to earn-out projections, an additional $9,328 of goodwill was recorded during the fourth quarter of 2013. The goodwill ascribed to this acquisition is not deductible for tax purposes. The accompanying consolidated financial statements include the results of Tower Light from August 1, 2013 through December 31, 2013. This acquisition is not material to the Company’s consolidated financial statements.
Acquisition of Ottomotores
On December 8, 2012, a subsidiary of the Company acquired all of the shares of Ottomotores UK Limited and its affiliates, including the operations of Ottomotores Mexico and Ottomotores Brazil (collectively, “Ottomotores”). Ottomotores was founded in 1950 and is located in Mexico City, Mexico and Curitiba, Brazil. Ottomotores is a leading manufacturer in the Mexican market for industrial diesel gensets ranging in size from 15kW to 3,250kW and is a significant market participant throughout all of Latin America.
The cash paid at closing of $44,769, net of cash acquired, included an estimate of acquired working capital. This estimate was finalized during the second quarter of 2013 to reflect actual working capital acquired as well as cash acquired and debt assumed, resulting in a $6,278 decrease to the purchase price. This acquisition was funded solely by existing cash.
The Company recorded a preliminary purchase price allocation during the fourth quarter of 2012 based upon its estimates of the fair value of the acquired assets and assumed liabilities. As a result, the Company recorded approximately $16,100 of intangible assets, including approximately $5,050 of goodwill, as of the acquisition date. The purchase price allocation was finalized during the second quarter of 2013, resulting in an additional $2,590 of intangible assets and a $439 decrease to goodwill. The goodwill ascribed to this acquisition is not deductible for tax purposes. This acquisition is not material to the Company’s consolidated financial statements.
Acquisition of Magnum
On October 3, 2011, a subsidiary of the Company acquired substantially all of the assets and assumed certain liabilities of Magnum Products, LLC and certain of its affiliates (collectively, Magnum) for a purchase price, net of cash acquired and inclusive of estimated earn-out payments, of approximately $85,490. Magnum is a supplier of generator powered light towers, mobile generators and combination power units for a variety of industries and specialties including construction, energy, mining, government, military, and special events. Its products are distributed through international, national and regional equipment rental companies, equipment dealers and construction companies.
The purchase price of $85,490 consisted of $83,907 paid in cash at closing and $1,583 recorded as an estimated liability to the sellers for contingent consideration based upon future performance of a particular product line currently in development. The cash paid at closing included an estimate of acquired working capital. This estimate was finalized during the third quarter of 2012 to reflect actual working capital acquired, resulting in a $75 decrease to the purchase price. This acquisition was funded solely by existing cash.
The Company recorded a purchase price allocation during the fourth quarter of 2011 based upon its estimates of the fair value of the acquired assets and assumed liabilities. As a result, the Company recorded approximately $56,107 of intangible assets, including approximately $20,337 of goodwill, as of the acquisition date. The purchase price allocation was finalized during the third quarter of 2012, resulting in a $75 decrease to goodwill. The goodwill ascribed to this acquisition is deductible for tax purposes. This acquisition is not material to the Company’s consolidated financial statements.
The Company is responsible for the estimates of the fair values of the acquired assets and assumed liabilities described in this Note 3.
4. Balance Sheet Details
Inventories consist of the following:
|
December 31,
|
||||||||
|
2013
|
2012
|
|||||||
|
Raw material
|
$ | 183,787 | $ | 168,459 | ||||
|
Work-in-process
|
9,620 | 8,580 | ||||||
|
Finished goods
|
113,404 | 55,777 | ||||||
|
Reserves for excess and obsolescence
|
(6,558 | ) | (6,999 | ) | ||||
|
Total
|
$ | 300,253 | $ | 225,817 | ||||
As of December 31, 2013 and 2012, inventories totaling $6,504 and $4,401, respectively, were on consignment at customer locations.
Property and equipment consists of the following:
|
December 31,
|
||||||||
|
2013
|
2012
|
|||||||
|
Land and improvements
|
$ | 7,416 | $ | 6,511 | ||||
|
Buildings and improvements
|
96,161 | 68,934 | ||||||
|
Machinery and equipment
|
54,847 | 42,581 | ||||||
|
Dies and tools
|
17,071 | 15,406 | ||||||
|
Vehicles
|
1,979 | 1,872 | ||||||
|
Office equipment
|
17,304 | 12,993 | ||||||
|
Leasehold improvements
|
2,229 | 1,393 | ||||||
|
Construction in progress
|
9,724 | 3,439 | ||||||
|
Gross property and equipment
|
206,731 | 153,129 | ||||||
|
Accumulated depreciation
|
(60,341 | ) | (48,411 | ) | ||||
|
Total
|
$ | 146,390 | $ | 104,718 | ||||
Other accrued liabilities consist of the following:
|
December 31,
|
||||||||
|
2013
|
2012
|
|||||||
|
Accrued commissions
|
$ | 10,254 | $ | 7,467 | ||||
|
Accrued interest
|
10,907 | 15,809 | ||||||
|
Product warranty obligations – short term
|
26,080 | 26,284 | ||||||
|
Deferred revenue related to extended warranty – short term
|
3,325 | 2,468 | ||||||
|
Accrued dividends for unvested restricted stock
|
2,472 | 3,957 | ||||||
|
Accrued volume rebates
|
9,418 | 7,991 | ||||||
|
Accrued customer prepayments
|
3,393 | 6,569 | ||||||
|
Other accrued selling expenses
|
8,659 | 7,753 | ||||||
|
Earn-out obligations
|
12,518 | - | ||||||
|
Other accrued liabilities
|
5,971 | 7,783 | ||||||
|
Total
|
$ | 92,997 | $ | 86,081 | ||||
Other long-term liabilities consist of the following:
|
December 31,
|
||||||||
|
2013
|
2012
|
|||||||
|
Accrued pension costs
|
$ | 10,385 | $ | 23,174 | ||||
|
Product warranty obligations – long term
|
7,654 | 9,827 | ||||||
|
Deferred revenue related to extended warranty – long term
|
19,767 | 11,006 | ||||||
|
Deferred tax liabilities
|
14,966 | - | ||||||
|
Other long-term liabilities
|
2,168 | 2,335 | ||||||
|
Total
|
$ | 54,940 | $ | 46,342 | ||||
5. Product Warranty Obligations
The Company records a liability for product warranty obligations at the time of sale to a customer based upon historical warranty experience. The Company also records a liability for specific warranty matters when they become known and are reasonably estimable. The Company also sells extended warranty coverage for certain product. The sales of extended warranties are recorded as deferred revenue, and we recognize the revenue from sales of extended warranties over the life of the contracts. The Company’s product warranty obligations, including deferred revenue related to extended warranty coverage, are included in other accrued liabilities and other long-term liabilities in the consolidated balance sheets.
The following is a tabular reconciliation of the product warranty liability, excluding the deferred revenue related to our extended warranty coverage:
|
For the year ended December 31,
|
||||||||||||
|
2013
|
2012
|
2011
|
||||||||||
|
Balance at beginning of year
|
$ | 36,111 | $ | 24,643 | $ | 17,835 | ||||||
|
Payments
|
(18,484 | ) | (19,801 | ) | (17,562 | ) | ||||||
|
Provision for warranties issued
|
33,707 | 34,173 | 21,356 | |||||||||
|
Changes in estimates for pre-existing warranties
|
(17,600 | ) | (2,904 | ) | 3,014 | |||||||
|
Balance at end of year
|
$ | 33,734 | $ | 36,111 | $ | 24,643 | ||||||
The following is a tabular reconciliation of the deferred revenue related to extended warranty coverage:
|
For the year ended December 31,
|
||||||||||||
|
2013
|
2012
|
2011
|
||||||||||
|
Balance at beginning of year
|
$ | 13,474 | $ | 9,737 | $ | 4,643 | ||||||
|
Deferred revenue on extended warranty contracts sold
|
11,998 | 5,547 | 6,368 | |||||||||
|
Amortization of deferred revenue on extended warranty contracts
|
(2,380 | ) | (1,810 | ) | (1,274 | ) | ||||||
|
Balance at end of year
|
$ | 23,092 | $ | 13,474 | $ | 9,737 | ||||||
Product warranty obligations and warranty related deferred revenues are included in the balance sheets as follows:
|
December 31,
|
||||||||
|
2013
|
2012
|
|||||||
|
Product warranty liability
|
||||||||
|
Current portion - other accrued liabilities
|
$ | 26,080 | $ | 26,284 | ||||
|
Long-term portion - other long-term liabilities
|
7,654 | 9,827 | ||||||
|
Total
|
$ | 33,734 | $ | 36,111 | ||||
|
Deferred revenue related to extended warranty
|
||||||||
|
Current portion - other accrued liabilities
|
$ | 3,325 | $ | 2,468 | ||||
|
Long-term portion - other long-term liabilities
|
19,767 | 11,006 | ||||||
|
Total
|
$ | 23,092 | $ | 13,474 | ||||
6. Credit Agreements
The revolving credit facilities and credit agreements discussed below were outstanding for the periods described below. The Company refinanced this debt on February 9, 2012, amended and restated its credit agreements on May 30, 2012, and further amended and restated its credit agreements on May 31, 2013.
Short-term borrowings are included in the balance sheets as follows:
|
December 31,
|
||||||||
|
2013
|
2012
|
|||||||
|
ABL facility
|
$ | - | $ | - | ||||
|
Other lines of credit, as described below
|
9,575 | 12,550 | ||||||
|
Total
|
$ | 9,575 | $ | 12,550 | ||||
Long-term borrowings are included in the balance sheets as follows:
|
December 31,
|
||||||||
|
2013
|
2012
|
|||||||
|
Term loan
|
$ | 1,197,000 | $ | 897,750 | ||||
|
Discount on debt
|
(12,735 | ) | (16,482 | ) | ||||
|
Capital lease obligation
|
2,529 | - | ||||||
|
Other
|
1,026 | - | ||||||
|
Total
|
1,187,820 | 881,268 | ||||||
|
Less current portion of debt
|
12,286 | 82,250 | ||||||
|
Less current portion of capital lease obligation
|
185 | - | ||||||
|
Total
|
$ | 1,175,349 | $ | 799,018 | ||||
Maturities of long-term borrowings outstanding at December 31, 2013, are as follows:
|
Year
|
||||
|
2014
|
$ | 12,750 | ||
|
2015
|
12,621 | |||
|
2016
|
12,229 | |||
|
2017
|
12,205 | |||
|
After 2018
|
1,150,750 | |||
|
Total
|
$ | 1,200,555 | ||
On February 9, 2012, a subsidiary of the Company (“Borrower”) entered into a credit agreement (“Credit Agreement”) with certain commercial banks and other lenders. The Credit Agreement provided for borrowings under a $150,000 revolving credit facility, a $325,000 tranche A term loan facility and a $250,000 tranche B term loan facility. The revolving credit facility and tranche A term loan facility were scheduled to mature in February 2017 and the tranche B term loan facility was scheduled to mature in February 2019. Proceeds received by the Company from loans made under the Credit Agreement were used to repay in full all outstanding borrowings under the former credit agreement, dated as of November 10, 2006, as amended from time to time, and for general corporate purposes. The Company’s former credit agreement was comprised of a revolving credit facility and a first-lien term loan which were scheduled to mature in November 2012 and November 2013, respectively.
On May 30, 2012, the Borrower amended and restated its then existing Credit Agreement by entering into a new credit agreement (“Term Loan Credit Agreement”) and a new revolving credit agreement (“ABL Credit Agreement”) with certain commercial banks and other lenders. The Term Loan Credit Agreement provided for a $900,000 term loan B credit facility and a $125,000 uncommitted incremental term loan facility (“Term Loan”). The ABL Credit Agreement provided for borrowings under a $150,000 senior secured ABL revolving credit facility. The size of the ABL revolving credit facility could be increased by $50,000 pursuant to an uncommitted incremental credit facility. The Term Loan Credit Agreement was scheduled to mature in May 2018 and the ABL Credit Agreement was scheduled to mature in May 2017. Proceeds received by the Company from loans made under the Term Loan Credit Agreement, together with cash on hand, were used to repay amounts outstanding under the Company’s previous Credit Agreement and pay a special cash dividend of $6.00 per share on the Company’s common stock.
The Term Loan Credit Agreement was scheduled to amortize in equal installments of 0.25% of the original principal amount on the first day of April, July, October and January commencing on October 1, 2012 until the maturity date of the Term Loan. The interest rate on the Term Loan was based upon either a base rate plus an applicable margin of 4.00% or adjusted LIBOR rate plus an applicable margin of 5.00%, subject to a LIBOR floor of 1.25%.
On May 31, 2013, the Borrower amended and restated its then existing “Term Loan Credit Agreement” by entering into a new term loan credit agreement (“New Term Loan Credit Agreement”) with certain commercial banks and other lenders. The New Term Loan Credit Agreement provides for a $1,200,000 term loan B credit facility (the “New Term Loan”) and includes a $300,000 uncommitted incremental term loan facility. The New Term Loan Credit Agreement matures on May 31, 2020. Proceeds from the New Term Loan were used to repay amounts outstanding under the Company’s previous Term Loan Credit Agreement and to fund a special cash dividend of $5.00 per share on the Company’s common stock (refer to Note 12 – Special Cash Dividend for additional details). Remaining funds from the New Term Loans were used for general corporate purposes and to pay related financing fees and expenses.
The New Term Loan is guaranteed by all of the Borrower’s wholly-owned domestic restricted subsidiaries, GAC and the Company, and is secured by associated collateral agreements which pledge a first priority lien on virtually all of the Borrower’s assets, including fixed assets and intangibles, and the assets of the guarantors (other than the Company), other than all cash, trade accounts receivable, inventory, and other current assets and proceeds thereof, which will be secured by a second priority lien.
The New Term Loan amortizes in equal installments of 0.25% of the original principal amount of the New Term Loan payable on the first day of April, July, October and January commencing on October 1, 2013 until the final maturity date of the New Term Loan on May 31, 2020. The New Term Loan initially bears interest at rates based upon either a base rate plus an applicable margin of 1.75% or adjusted LIBOR rate plus an applicable margin of 2.75%, subject to a LIBOR floor of 0.75%. Beginning in the second quarter of 2014, the applicable margin related to base rate loans can be reduced to 1.50% and the applicable margin related to LIBOR rate loans can be reduced to 2.50%, in each case, if the Borrower’s net debt leverage ratio falls below 3.00 to 1.00.
The New Term Loan Credit Agreement contains restrictions on the Borrower’s ability to pay distributions and dividends (but which permitted the payment of the special cash dividend described in Note 12 – Special Cash Dividend below.). Payments can be made by the Borrower to the Company or other parent companies for certain expenses such as operating expenses in the ordinary course, fees and expenses related to any debt or equity offering and to pay franchise or similar taxes. Dividends can be used to repurchase equity interests, subject to limitations in certain circumstances. Additionally, the New Term Loan Credit Agreement restricts the aggregate amount of dividends and distributions that can be paid and, in certain circumstances, requires pro forma compliance with certain fixed charge coverage ratios or gross leverage ratios, as applicable, in order to pay certain dividends and distributions. The New Term Loan Credit Agreement also contains other affirmative and negative covenants that, among other things, limit the incurrence of additional indebtedness, liens on property, sale and leaseback transactions, investments, loans and advances, mergers or consolidations, asset sales, acquisitions, transactions with affiliates, prepayments of certain other indebtedness and modifications of our organizational documents. The New Term Loan Credit Agreement does not contain any financial maintenance covenants.
The New Term Loan Credit Agreement contains customary events of default, including, among others, nonpayment of principal, interest or other amounts, failure to perform covenants, inaccuracy of representations or warranties in any material respect, cross-defaults with other material indebtedness, certain undischarged judgments, the occurrence of certain ERISA or bankruptcy or insolvency events or the occurrence of a change in control (defined in the New Term Loan Credit Agreement). A bankruptcy or insolvency event of default will cause the obligations under the New Term Loan Credit Agreement to automatically become immediately due and payable.
Concurrent with the closing of the New Term Loan Credit Agreement, on May 31, 2013, the Borrower amended its existing ABL Credit Agreement (the “New ABL Credit Agreement”). The amendment provides for a one year extension of the maturity date in respect of the $150,000 senior secured ABL revolving credit facility provided under the ABL Credit Agreement (the “ABL Facility”). The extended maturity date of the ABL Facility is May 31, 2018.
Borrowings under the ABL Facility are guaranteed by all of the Borrower’s wholly-owned domestic restricted subsidiaries and GAC, and are secured by associated collateral agreements which pledge a first priority lien on all cash, trade accounts receivable, inventory, and other current assets and proceeds thereof, and a second priority lien on all other assets, including fixed assets and intangibles of the Borrower, certain domestic subsidiaries of the Borrower and the guarantors (other than the Company).
Borrowings under the ABL Facility continue to bear interest at rates based upon either a base rate plus an applicable margin of 1.00% or adjusted LIBOR rate plus an applicable margin of 2.00%, in each case, subject to adjustments based upon average availability under the ABL Facility.
The New ABL Credit Agreement requires the Borrower to maintain a minimum consolidated fixed charge coverage ratio of 1.0x, tested on a quarterly basis, when Availability plus the amount of Qualified Cash (up to $5,000) (as defined in the New ABL Credit Agreement) under the ABL Facility is less than the greater of (i) 10.0% of the Line Cap (as defined in the New ABL Credit Agreement) and (ii) $10,000. The New ABL Credit Agreement also contains covenants and events of default substantially similar to those in the New Term Loan Credit Agreement, as described above. As of December 31, 2013, no amounts were outstanding under the ABL Facility. As of December 31, 2013, the Company had $150,147 of unrestricted cash and cash equivalents and $147,492 of availability under the ABL Facility, net of outstanding letters of credit.
On February 11, 2013, the Company made an $80,000 voluntary prepayment of debt with available cash on hand that was applied to future principal amortizations on the Term Loan Credit Agreement. As a result, the Company wrote off $1,839 of original issue discount and capitalized debt issuance costs during the first quarter of 2013. On May 2, 2013, the Company made an additional $30,000 voluntary prepayment of existing debt with available cash on hand. As a result, the Company wrote off $924 of original issue discount and capitalized debt issuance costs during the second quarter of 2013.
In connection with the February 9, 2012 refinancing and in accordance with
ASC 470-50, Debt Modifications and Extinguishments,
the Company capitalized $10,409 of new debt issuance costs, recorded $1,386 of fees paid to creditors as a debt discount, and expensed $1,407 of transaction fees. The Company evaluated on a lender by lender basis if the debt related to returning lenders was significantly modified or not, resulting in the write-off of $2,902 in unamortized debt issuance costs relating to the former credit agreement. Amounts expensed are recorded as a loss on extinguishment of debt in the consolidated statement of comprehensive income for the year ended December 31, 2012.
In connection with the May 30, 2012 refinancing and in accordance with
ASC 470-50, Debt Modifications and Extinguishments,
the Company capitalized $15,309 of new debt issuance costs, recorded $18,000 of fees paid to creditors as a debt discount, and expensed $801 of transaction fees. The Company evaluated on a lender by lender basis if the debt related to returning lenders was significantly modified or not, resulting in the write-off of $9,198 in unamortized debt issuance costs relating to the Credit Agreement. Amounts expensed are recorded as a loss on extinguishment of debt in the consolidated statement of comprehensive income for the year ended ended December 31, 2012.
In connection with the May 31, 2013 refinancing and in accordance with
ASC 470-50, Debt Modifications and Extinguishments,
the Company capitalized $21,824 of new debt issuance costs, recorded $13,797 of fees paid to creditors as a debt discount, and expensed $7,100 of transaction fees. The Company evaluated on a lender by lender basis if the debt related to returning lenders was significantly modified or not, resulting in the write-off of $5,473 in unamortized debt issuance costs and original issue discount relating to the previous Term Loan Credit Agreement and ABL Credit Agreement. Amounts expensed are recorded as a loss on extinguishment of debt in the condensed consolidated statement of comprehensive income for the year ended December 31, 2013. The Company amortizes both the capitalized debt issuance costs and the original issue discount on its loans under the effective interest method.
As of December 31, 2013 and December 31, 2012, short-term borrowings consisted primarily of borrowings by our foreign subsidiaries on local lines of credit, which totaled $9,575 and $12,550, respectively.
7. Earnings Per Share
Basic earnings per share is calculated by dividing net income by the weighted average number of common shares outstanding during the period. Except where the result would be anti-dilutive, dilutive earnings per share is calculated by assuming the vesting of unvested restricted stock and the exercise of stock options, as well as their related income tax benefits. The following table reconciles the numerator and the denominator used to calculate basic and diluted earnings per share:
|
Year ended December 31,
|
||||||||||||
|
2013
|
2012
|
2011
|
||||||||||
|
Numerator- net income
|
$ | 174,539 | $ | 93,223 | $ | 324,643 | ||||||
|
Denominator- weighted average shares
|
||||||||||||
|
Basic
|
68,081,632 | 67,360,632 | 67,130,356 | |||||||||
|
Dilutive effect of stock compensation awards (1)
|
1,585,897 | 1,832,506 | 667,015 | |||||||||
|
Diluted
|
69,667,529 | 69,193,138 | 67,797,371 | |||||||||
|
Net income per share
|
||||||||||||
|
Basic
|
$ | 2.56 | $ | 1.38 | $ | 4.84 | ||||||
|
Diluted
|
$ | 2.51 | $ | 1.35 | $ | 4.79 | ||||||
(1) Excludes approximately 10,300 and 363,000 stock options and restricted stock awards for the twelve month periods ended December 31, 2013 and December 31, 2012, respectively, as the impact of such awards was anti-dilutive. There were no anti-dilutive awards for the twelve month period ended December 31, 2011.
8. Income Taxes
The Company’s provision for income taxes consists of the following:
|
Year ended December 31,
|
||||||||||||
|
2013
|
2012
|
2011
|
||||||||||
|
Current:
|
||||||||||||
|
Federal
|
$ | 48,287 | $ | 34,170 | $ | 14,312 | ||||||
|
State
|
5,648 | 3,854 | 1,885 | |||||||||
|
Foreign
|
2,214 | 81 | – | |||||||||
| 56,149 | 38,105 | 16,197 | ||||||||||
|
Deferred:
|
||||||||||||
|
Federal
|
42,003 | 21,972 | 15,632 | |||||||||
|
State
|
5,523 | 3,048 | 1,887 | |||||||||
|
Foreign
|
167 | 25 | – | |||||||||
| 47,693 | 25,045 | 17,519 | ||||||||||
|
Change in valuation allowance
|
335 | (21 | ) | (271,393 | ) | |||||||
|
Provision for income taxes
|
$ | 104,177 | $ | 63,129 | $ | (237,677 | ) | |||||
The Company is the taxpaying entity and files a consolidated federal income tax return. Currently, the Company is not under examination by any major taxing jurisdiction to which the Company is subject. As of December 31, 2013, due to the carryforward of unutilized net operating losses and research and development credits, the Company is subject to U.S. Federal income tax examinations for the tax years 2006 through 2013, and to state income tax examinations for the tax years 2006 through 2013. In addition, the Company is subject to audit by various foreign taxing jurisdictions for the tax years 2007 through 2013.
Interest and penalties are recorded separately from income tax expense, as part of pre-tax book income. There were no interest or penalties related to income taxes that have been accrued or recognized as of and for the years ended December 31, 2013, 2012 and 2011.
The Company was in a three year cumulative net loss position, due primarily to a 2008 goodwill and tradename impairment write-off, and therefore had not considered expected future taxable income in analyzing the realizability of the deferred tax assets as of December 31, 2010, resulting in a full valuation allowance against these net deferred tax assets. In the fourth quarter of 2011, the Company was no longer in a three-year cumulative loss position and, as part of the normal assessment of the future realization of the net deferred tax assets, determined that a valuation allowance was no longer required. As a result, the valuation allowance was reversed in the fourth quarter of 2011 and the Company recorded as a tax benefit of $271,393.
Significant components of deferred tax assets and liabilities are as follows:
|
December 31,
|
||||||||
|
2013
|
2012
|
|||||||
|
Deferred tax assets:
|
||||||||
|
Goodwill and intangible assets
|
$ | 74,992 | $ | 125,457 | ||||
|
Accrued expenses
|
24,263 | 26,606 | ||||||
|
Deferred revenue
|
4,413 | 3,503 | ||||||
|
Inventories
|
4,483 | 2,544 | ||||||
|
Pension obligations
|
4,043 | 9,064 | ||||||
|
Stock-based compensation
|
6,609 | 6,408 | ||||||
|
Operating loss and credit carryforwards
|
976 | 24,915 | ||||||
|
Interest rate swaps
|
- | 1,119 | ||||||
|
Other
|
2,089 | 36 | ||||||
|
Valuation allowance
|
(1,021 | ) | (806 | ) | ||||
|
Total deferred tax assets
|
120,847 | 198,846 | ||||||
|
Deferred tax liabilities:
|
||||||||
|
Depreciation
|
15,163 | 12,274 | ||||||
|
Debt refinancing costs
|
7,494 | - | ||||||
| Prepaid expenses | 1,183 | 1,131 | ||||||
|
Total deferred tax liabilities
|
23,840 | 13,405 | ||||||
|
Net deferred tax asset
|
$ | 97,007 | $ | 185,441 | ||||
The net current and noncurrent components of deferred taxes included in the consolidated balance sheets are as follows:
|
December 31,
|
||||||||
|
2013
|
2012
|
|||||||
|
Net current deferred tax assets
|
$ | 26,869 | $ | 48,687 | ||||
|
Net long-term deferred tax assets
|
86,125 | 137,560 | ||||||
|
Net long-term deferred tax liabilities
|
(14,966 | ) | - | |||||
|
Valuation allowance
|
(1,021 | ) | (806 | ) | ||||
|
Net deferred tax assets
|
$ | 97,007 | $ | 185,441 | ||||
Acquired as part of the Ottomotores acquisition, Ottomotores Brazil generated net operating losses for multiple years. The realizability of the deferred tax assets associated with these net operating losses is uncertain so a valuation allowance has been recorded in the opening balance sheet as of December 8, 2012 as well as at December 31, 2012 and 2013.
At December 31, 2013, the Company has state net operating loss carryforwards of approximately $10, which expire between 2023 and 2025.
As a result of ownership changes, Section 382 of the Internal Revenue Code of 1986 as amended and similar state provisions can limit the annual deductions of net operating loss and tax credit carry forwards. Such annual limitations could result in the expiration of net operating loss and tax credit carry forwards before utilization. The Company has no such limitation as of December 31, 2012 and if a limitation was triggered in 2013, the Company believes any limitation would not be significant.
At December 31, 2013 and 2012, the Company has no reserves recorded for uncertain tax positions.
The Company considers the earnings of certain non-U.S. subsidiaries to be indefinitely invested outside the United States on the basis of estimates that future domestic cash generation will be sufficient to meet future domestic cash needs and the Company’s specific plans for reinvestment of those subsidiary earnings. The Company has not provided for additional U.S. income taxes on approximately $8,666 of undistributed earnings of consolidated non-U.S. subsidiaries. It is not practicable to estimate the amount of unrecognized withholding taxes and deferred tax liability on such earnings.
A reconciliation of the statutory tax rates and the effective tax rates for the years ended December 31, 2013, 2012 and 2011 are as follows:
|
Year ended December 31,
|
||||||||||||
|
2013
|
2012
|
2011
|
||||||||||
|
U.S. statutory rate
|
35.0 | % | 35.0 | % | 35.0 | % | ||||||
|
State taxes
|
3.7 | 4.1 | 4.0 | |||||||||
|
Valuation allowance
|
0.2 | - | (312.3 | ) | ||||||||
|
Other
|
-1.5 | 1.3 | - | |||||||||
|
Effective tax rate
|
37.4 | % | 40.4 | % | (273.3 | )% | ||||||
9. Benefit Plans
Medical and Dental Plan
The Company maintains medical and dental benefit plans covering full-time domestic employees of the Company and their dependents. Certain plans are partially or fully self-funded plans under which participant claims are obligations of the plan. These plans are funded through employer and employee contributions at a level sufficient to pay for the benefits provided by the plan. The Company’s contributions to the plan were $9,500, $8,741, and $6,700 for the years ended December 31, 2013, 2012, and 2011, respectively. The plan covering a majority of full-time employees maintains individual stop loss insurance policies on the medical portion with a limit of stop loss of $235 to mitigate losses. Balances for the incurred but not yet reported claims, including reported but unpaid claims at December 31, 2013, and 2012, were $1,389 and $1,185, respectively. The Company estimates claims incurred but not yet reported based on its historical experience. During 2013, the Company paid premiums of $2,700 for other standard medical benefits covering certain full-time employees.
The Company’s foreign subsidiaries participate in government sponsored medical benefit plans. In certain cases, the Company purchases supplemental medical coverage for certain employees at these foreign locations. The expenses related to these plans are not material to the Company’s consolidated financial statements.
Savings Plan
The Company maintains a defined-contribution 401(k) savings plan for virtually all domestic employees who meet certain eligibility requirements. Under the plan, employees may defer receipt of a portion of their eligible compensation.
The Company amended the 401(k) savings plans effective January 1, 2009, to add Company matching and non-elective contributions. The Company may contribute a matching contribution of 50% of the first 6% of eligible compensation of employees. No matching contribution shall be made with respect to employee catch-up contributions. The Company may contribute a non-elective contribution for each plan year after 2008. The contribution will apply to eligible employees employed on December 31, 2008. The rate of the non-elective contribution is determined based upon years of service as of December 31, 2008, and is fixed. Both Company matching contributions and non-elective contributions are subject to vesting. Forfeitures may be applied against plan expenses.
The Company recognized $3,300, $3,000 and $2,400 of expense related to this plan in 2013, 2012 and 2011, respectively.
Pension Plans
The Company has noncontributory salaried and hourly pension plans (collectively, “Pension Plans”) covering certain domestic employees. The benefits under the salaried plan are based upon years of service and the participants’ defined final average monthly compensation. The benefits under the hourly plan are based on a unit amount at the date of termination multiplied by the participant’s years of credited service. The Company’s funding policy for the Pension Plans is to contribute amounts at least equal to the minimum annual amount required by applicable regulations. The Company elected to freeze the Pension Plans effective December 31, 2008. This resulted in a cessation of all future benefit accruals for both hourly and salary pension plans.
The Company uses a December 31 measurement date for the Pension Plans. Information related to the Pension Plans is as follows:
|
Year Ended December 31,
|
|||||||
|
2013
|
2012
|
||||||
|
Accumulated benefit obligation at end of period
|
$ | 52,825 | $ | 59,744 | |||
|
Change in projected benefit obligation
|
|||||||
|
Projected benefit obligation at beginning of period
|
$ | 59,744 | $ | 53,467 | |||
|
Interest cost
|
2,423 | 2,453 | |||||
|
Net actuarial (gain) loss
|
(7,695 | ) | 5,332 | ||||
|
Benefits paid
|
(1,647 | ) | (1,508 | ) | |||
|
Projected benefit obligation at end of period
|
$ | 52,825 | $ | 59,744 | |||
|
Change in plan assets
|
|||||||
|
Fair value of plan assets at beginning of period
|
$ | 36,570 | $ | 31,423 | |||
|
Actual return on plan assets
|
6,465 | 4,268 | |||||
|
Company contributions
|
1,052 | 2,387 | |||||
|
Benefits paid
|
(1,647 | ) | (1,508 | ) | |||
|
Fair value of plan assets at end of period
|
$ | 42,440 | $ | 36,570 | |||
|
Funded status: accrued pension liability included in other long-term liabilities
|
$ | (10,385 | ) | $ | (23,174 | ) | |
|
Amounts recognized in accumulated other comprehensive income
|
|||||||
|
Net actuarial loss
|
$ | (4,393 | ) | $ | (12,081 | ) | |
The actuarial loss for the Pension Plans that was amortized from OCI into net periodic benefit cost during 2013 is $1,108. The amount in OCI as of December 31, 2013 that is expected to be recognized as a component of net periodic pension expense during the next fiscal year is $106.
Additional information related to the Pension Plans is as follows:
|
Year ended December 31,
|
||||||||||||
|
2013
|
2012
|
2011
|
||||||||||
|
Components of net periodic pension expense:
|
||||||||||||
|
Interest cost
|
$
|
2,423 | $ | 2,453 | $ | 2,369 | ||||||
|
Expected return on plan assets
|
(2,520 | ) | (2,398 | ) | (2,342 | ) | ||||||
|
Amortization of net loss
|
1,108 | 909 | 273 | |||||||||
|
Net periodic pension expense
|
$ | 1,011 | $ | 964 | $ | 300 | ||||||
Weighted-average assumptions used to determine the benefit obligations are as follows:
|
December 31,
|
||||||||
|
2013
|
2012
|
|||||||
|
Discount rate – salaried pension plan
|
4.98 | % | 4.10 | % | ||||
|
Discount rate – hourly pension plan
|
5.01 | % | 4.14 | % | ||||
|
Rate of compensation increase (1)
|
n/a | n/a | ||||||
|
(1)
|
No compensation increase was assumed as the plans were frozen effective December 31, 2008.
|
Weighted-average assumptions used to determine net periodic pension expense are as follows:
|
Year ended December 31,
|
||||||||||||
|
2013
|
2012
|
2011
|
||||||||||
|
Discount rate
|
4.14 | % | 4.65 | % | 5.23 | % | ||||||
|
Expected long-term rate of return on plan assets
|
6.95 | 7.57 | 7.62 | |||||||||
|
Rate of compensation increase (1)
|
n/a | n/a | n/a | |||||||||
|
(1)
|
No compensation increase was assumed as the plans were frozen effective December 31, 2008.
|
To determine the long-term rate of return assumption for plan assets, the Company studies historical markets and preserves the long-term historical relationships between equities and fixed-income securities consistent with the widely accepted capital market principle that assets with higher volatility generate a greater return over the long run. The Company evaluates current market factors such as inflation and interest rates before it determines long-term capital market assumptions and reviews peer data and historical returns to check for reasonableness and appropriateness.
The Pension Plan’s weighted-average asset allocation at December 31, 2013 and 2012, by asset category, is as follows:
|
December 31, 2013
|
December 31, 2012
|
|||||||||||||||||||
|
Asset Category
|
Target
|
Dollars
|
%
|
Dollars
|
%
|
|||||||||||||||
|
Fixed Income
|
24 | % | 7,307 | 17 | % | 8,736 | 24 | % | ||||||||||||
|
Domestic equity
|
49 | % | 23,903 | 56 | % | 17,926 | 49 | % | ||||||||||||
|
International equity
|
17 | % | 7,424 | 18 | % | 6,257 | 17 | % | ||||||||||||
|
Real estate
|
10 | % | 3,806 | 9 | % | 3,651 | 10 | % | ||||||||||||
|
Total
|
100 | % | $ | 42,440 | 100 | % | $ | 36,570 | 100 | % | ||||||||||
The fair values of the Pension Plan's assets at December 31, 2013 are as follows:
|
Total
|
Quoted prices in active markets for identical asset
(level 1)
|
Significant
observable inputs
(level 2)
|
Significant unobservable inputs
(level 3)
|
|||||||||||||
|
Mutual fund
|
$ | 39,759 | $ | 39,759 | $ | – | $ | – | ||||||||
|
Collective trust
|
2,681 | – | 2,681 | – | ||||||||||||
|
Total
|
$ | 42,440 | $ | 39,759 | $ | 2,681 | $ | – | ||||||||
The fair values of the Pension Plan's assets at December 31, 2012 are as follows:
|
Total
|
Quoted prices in active markets for identical asset
(level 1)
|
Significant observable inputs
(level 2)
|
Significant unobservable inputs
(level 3)
|
|||||||||||||
|
Mutual fund
|
$ | 33,683 | $ | 33,683 | $ | – | $ | – | ||||||||
|
Collective trust
|
2,887 | – | 2,887 | – | ||||||||||||
|
Total
|
$ | 36,570 | $ | 33,683 | $ | 2,887 | $ | – | ||||||||
Mutual Funds – This category includes investments in mutual funds that encompass both equity and fixed income securities that are designed to provide a diverse portfolio. The plan’s mutual funds are designed to track exchange indices, and invest in diverse industries. Some mutual funds are classified as regulated investment companies. Investment managers have the ability to shift investments from value to growth strategies, from small to large capitalization funds, and from U.S. to international investments. These investments are valued at the closing price reported on the active market on which the individual securities are traded. These investments are classified within Level 1 of the fair value hierarchy.
Collective Trusts – This category includes public investment vehicles valued using the Net Asset Value (NAV) provided by the administrator of the trust. The NAV is based on the value of the underlying assets owned by the trust, minus its liabilities, and then divided by the number of shares outstanding. The NAV of the trust is classified within Level 2 of the fair value hierarchy.
The Company’s target allocation for equity securities and real estate is generally between 65% – 85%, with the remainder allocated primarily to bonds. The Company regularly reviews its actual asset allocation and periodically rebalances its investments to the targeted allocation when considered appropriate.
The Company expects to make estimated contributions of $2,149 to the Pension Plans in 2014.
The following benefit payments are expected to be paid from the Pension Plans:
|
Year
|
||||
|
2014
|
$ | 1,776 | ||
|
2015
|
1,838 | |||
|
2016
|
1,971 | |||
|
2017
|
2,176 | |||
|
2018
|
2,279 | |||
|
Years 2019 – 2023
|
13,353 | |||
Certain of the Company’s foreign subsidiaries participate in local defined benefit or other post-employment benefit plans. These plans provide benefits that are generally based on years of credited service and a percentage of the employee’s eligible compensation earned throughout the applicable service period. Liabilities recorded under these plans are included in accrued wages and employee benefits in the Company’s consolidated balance sheets and are not material.
10. Share Plans
The Company adopted an equity incentive plan on February 10, 2010 in connection with our initial public offering. The plan, as amended, allows for granting of up to 9.1 million stock-based awards to executives, directors and employees. Awards available for grant under the Plan include stock options, stock appreciation rights, restricted stock, other stock-based awards, and performance-based compensation awards. Total share-based compensation cost related to the equity incentive plan was $12,368, $10,780 and $8,646 in 2013, 2012 and 2011, respectively, net of actual forfeitures, which is recorded in operating expenses in the consolidated statements of comprehensive income.
Stock Options
- Stock options granted in 2013 have an exercise price of between $29.81 per share and $48.36 per share, stock options granted in 2012 have an exercise price of between $15.94 per share and $32.05 per share, and the stock options granted in 2011 have an exercise price of between $6.15 per share and $13.73 per share. On June 21, 2013, the Company paid a special cash dividend of $5.00 per share on its common stock, and on June 29, 2012, the Company paid a special cash dividend of $6.00 per share on its common stock. In connection with these special dividends, and pursuant to the terms of the Company’s stock option plan, certain adjustments are required to be made to stock options outstanding under the plan in order to avoid dilution of the intended benefits which would otherwise result as a consequence of the special dividend. As such, the strike price for all outstanding stock options as of the special dividend dates, were adjusted by the $5.00 and $6.00 special dividend amounts. There was no change to compensation expense as a result of these adjustments. On June 10, 2013 and July 2, 2012, the strike price of all stock option awards outstanding prior to the special dividend dates were restated to reflect these $5.00 and $6.00 adjustments, respectively. The exercise prices noted above reflect these adjustments. Stock options issued in 2013 and 2012 vest in equal installments over four years, subject to the grantee’s continued employment or service and expire 10 years after the date of grant. Stock options issued in 2011 and 2010 vest in equal installments over five years, subject to the grantee’s continued employment or service and expire 10 years after the date of grant.
Beginning in 2011, stock option exercises are net-share settled such that the Company withholds shares with value equivalent to the exercise price of the stock option awards plus the employees’ minimum statutory obligation for the applicable income and other employment taxes. Total shares withheld were approximately 323,427, 667,041 and 55,202 in 2013, 2012 and 2011, respectively, and were based on the value of the stock on the exercise dates as determined based upon an average of the Company’s high and low stock sales price on the exercise dates. Total payments for the employees’ tax obligations to the taxing authorities were $8,449, $6,425 and $371 in 2013, 2012 and 2011, respectively, and are reflected as a financing activity within the Consolidated Statement of Cash Flows. The net-share settlements had the effect of share repurchases by the Company as they reduced the number of shares that would have otherwise been issued as a result of the option exercise and did not represent an expense to the Company.
The grant-date fair value of each option grant is estimated using the Black-Scholes-Merton option pricing model. The fair value is then amortized on a straight-line basis over the requisite service period of the awards, which is generally the vesting period. Use of a valuation model requires management to make certain assumptions with respect to selected model inputs. Since there is limited history for the Company’s stock, expected volatility is calculated based on an analysis of historic and implied volatility measures for a set of peer companies. The average expected life is based on the contractual term of the option using the simplified method. The risk-free interest rate is based on U.S. Treasury zero-coupon issues with a remaining term equal to the expected life assumed at the date of grant. The compensation expense recognized is net of estimated forfeitures. Forfeitures are estimated based on actual share option forfeiture history. The weighted-average assumptions used in the Black-Scholes-Merton option pricing model for 2013, 2012 and 2011 are as follows:
|
2013
|
2012
|
2011
|
||||||||||
|
Weighted average grant date fair value
|
$ | 16.30 | $ | 12.13 | $ | 11.10 | ||||||
|
Assumptions:
|
||||||||||||
|
Expected stock price volatility
|
47 | % | 45 | % | 50 | % | ||||||
|
Risk free interest rate
|
1.21 | % | 1.22 | % | 2.69 | % | ||||||
|
Expected annual dividend per share
|
$ | - | $ | - | $ | - | ||||||
|
Expected life of options (years)
|
6.25 | 6.25 | 6.5 | |||||||||
The Company periodically evaluates its forfeiture rates and updates the rates it uses in the determination of its stock-based compensation expense. The impact of the change to the forfeiture rates on non-cash compensation expense was immaterial for the years ended December 31, 2013, 2012 and 2011. A summary of the Company’s stock option activity and related information for the three years ended December 31, 2013 is as follows:
|
Number of Options
|
Weighted-
Average
Exercise Price
|
Weighted-
Average
Remaining
Contractual Term
(in years)
|
Aggregate
Intrinsic
Value
($ in thousands)
|
|||||
|
Outstanding as of December 31, 2010
|
4,236,259
|
13.02
|
9.1
|
$ |
13,349
|
|||
|
Granted
|
179,877
|
21.26
|
||||||
|
Exercised
|
(107,591)
|
13.00
|
||||||
|
Expired
|
-
|
-
|
||||||
|
Forfeited
|
-
|
-
|
||||||
|
Outstanding as of December 31, 2011
|
4,308,545
|
13.36
|
8.2
|
$ 63,193
|
||||
|
Granted
|
256,112
|
21.28
|
||||||
|
Exercised
|
(1,113,827)
|
13.21
|
||||||
|
Expired
|
-
|
-
|
||||||
|
Forfeited
|
(10,788)
|
20.52
|
||||||
|
Outstanding as of December 31, 2012
|
3,440,042
|
14.38
|
9.0
|
$ |
68,549
|
|||
|
Granted
|
253,857
|
35.04
|
||||||
|
Exercised
|
(703,326)
|
6.05
|
||||||
|
Expired
|
(1,625)
|
20.94
|
||||||
|
Forfeited
|
(51,647)
|
17.02
|
||||||
|
Outstanding as of December 31, 2013
|
2,937,301
|
5.74
|
9.5
|
$
|
148,369
|
|||
|
Exercisable as of December 31, 2013
|
802,034
|
2.82
|
9.5
|
$
|
42,856
|
|||
Of the 703,326 and 1,113,827 stock options exercised during the fiscal year 2013 and 2012, respectively, 323,427 and 667,041 shares underlying such exercised options were retained by the Company in a net-share settlement to cover the aggregate exercise price and the required amount of employee withholding taxes.
As of December 31, 2013, there was $11,855 of total unrecognized compensation cost, net of expected forfeitures, related to unvested options. The cost is expected to be recognized over the remaining service period, having a weighted-average period of 2.0 years. Total share-based compensation cost related to the stock options for 2013, 2012 and 2011 was $9,034, $6,835 and $6,475, respectively, which is recorded in operating expenses in the consolidated statements of comprehensive income.
Restricted Stock
– For awards issued prior to 2012, restricted stock awards vest in full on the third anniversary of the date of grant, subject to the grantee’s continued employment. Restricted stock awards issued in 2012 and after, vest in equal installments over three years, subject to the grantee’s continued employment or service. The fair market value of the award at the time of the grant is amortized to expense over the period of vesting. The fair value of restricted share awards is determined based on the market value of the Company's shares on the grant date. The compensation expense recognized for restricted share awards is net of estimated forfeitures.
Restricted stock vesting is net-share settled such that the Company withholds shares with value equivalent to the employees’ minimum statutory obligation for the applicable income and other employment taxes. In effect, the Company repurchases these shares and classifies as treasury stock, and uses the cash on behalf of the employees to satisfy the tax withholding requirements. Total shares withheld were approximately 163,458 in 2013, and zero in 2012 and 2011, and were based on the value of the stock on the vesting dates as determined based upon an average of the Company’s high and low stock sales price on the vesting dates. Total payments for the employees’ tax obligations to the taxing authorities were $6,571 in 2013, and zero in 2012 and 2011, and are reflected as a financing activity within the Consolidated Statement of Cash Flows.
A summary of the Company's restricted share awards activity for the three years ended December 31, 2013 is as follows:
|
Non-vested Stock Awards
|
Shares
|
Weighted-Average
Grant-Date
Fair Value
|
|||
|
Non-vested as of December 31, 2010
|
430,155
|
$
|
13.02
|
||
|
Granted
|
59,147
|
20.59
|
|||
|
Vested
|
-
|
-
|
|||
|
Forfeited
|
-
|
-
|
|||
|
Non-vested as of December 31, 2011
|
489,302
|
$
|
13.93
|
||
|
Granted
|
195,771
|
26.94
|
|||
|
Vested
|
-
|
-
|
|||
|
Forfeited
|
(20,002)
|
|
11.96
|
||
|
Non-vested as of December 31, 2012
|
665,071
|
$
|
17.75
|
||
|
Granted
|
112,494
|
37.82
|
|||
|
Vested
|
(450,537)
|
14.21
|
|||
|
Forfeited
|
(22,622)
|
25.36
|
|||
|
Non-vested as of December 31, 2013
|
304,406
|
$
|
29.68
|
||
As of December 31, 2013, there was $5,216 of total unrecognized compensation cost, net of expected forfeitures, related to non-vested stock awards. That cost is expected to be recognized over the remaining service period, having a weighted-average period of 1.9 years. Total share-based compensation cost related to the restricted stock for 2013, 2012 and 2011 was $3,074, $3,645 and 1,871, respectively, which is recorded in operating expenses in the consolidated statements of comprehensive income.
During 2013, 2012 and 2011, 7,291, 10,864 and 16,680 shares, respectively, of fully vested stock were granted to certain members of the Company’s board of directors as a component of their compensation for their service on the board. Total compensation cost for these share grants in 2013, 2012 and 2011 was $260, $300 and $300, respectively, which is recorded in operating expenses in the consolidated statements of comprehensive income.
11. Commitments and Contingencies
The Company leases certain computer equipment, automobiles, and warehouse space under operating leases with lease terms generally ranging between 3-5 years.
The approximate aggregate minimum rental commitments at December 31, 2013, are as follows:
|
Amount
|
||||
|
Year
|
||||
|
2014
|
$ | 1,952 | ||
|
2015
|
1,900 | |||
|
2016
|
1,543 | |||
|
2017
|
830 | |||
|
2018
|
3 | |||
|
Total
|
$ | 6,228 | ||
Total rent expense for the years ended December 31, 2013, 2012 and 2011, which includes short-term data processing equipment rentals, was approximately $2,457, $2,870, and $1,309, respectively.
The Company has an arrangement with a finance company to provide floor plan financing for selected dealers. The Company receives payment from the finance company after shipment of product to the dealer. The Company participates in the cost of dealer financing up to certain limits. The Company has agreed to repurchase products repossessed by the finance company, but does not indemnify the finance company for any credit losses they incur. The amount financed by dealers which remained outstanding under this arrangement at December 31, 2013 and 2012 was approximately $24,300 and 16,600, respectively.
In the normal course of business, the Company is named as a defendant in various lawsuits in which claims are asserted against the Company. In the opinion of management, the liabilities, if any, which may result from such lawsuits are not expected to have a material adverse effect on the financial position, results of operations, or cash flows of the Company.
12. Special Cash Dividend
2012 Special Cash Dividend
On June 29, 2012, the Company used a portion of the proceeds from the May 30, 2012 debt refinancing (see Note #6 – Credit Agreements) together with cash on its balance sheet to pay a special cash dividend of $6.00 per share on its common stock, resulting in payments totaling $404,332 to stockholders. Related dividends declared but unpaid as of December 31, 2013 of $1,172, which relate to dividends earned on unvested restricted stock awards, are included in other accrued liabilities in the consolidated balance sheet. Payment of these dividends will be made when the underlying restricted stock awards vest.
In connection with the special dividend, and pursuant to the terms of the Company’s stock option plan, certain adjustments are required to be made to stock options outstanding under the plan in order to avoid dilution of the intended benefits which would otherwise result as a consequence of the special dividend. As such, on July 2, 2012, the strike price for all outstanding stock options at that time was modified by the $6.00 special dividend amount. There was no change to compensation expense as a result of this adjustment.
The 2012 Special Cash Dividend was recorded as a reduction to additional paid-in capital as the Company had an accumulated deficit balance as of the dividend declaration date.
2013 Special Cash Dividend
On June 21, 2013, the Company used a portion of the proceeds from the May 31, 2013 debt refinancing (see Note #6 – Credit Agreements) to pay a special cash dividend of $5.00 per share on its common stock, resulting in payments totaling $340,772 to stockholders. Related dividends declared but unpaid as of December 31, 2013 of $1,300, which relate to dividends earned on unvested restricted stock awards, are included in other accrued liabilities in the consolidated balance sheet. Payment of these dividends will be made when the underlying restricted stock awards vest.
In connection with the special dividend, and pursuant to the terms of the Company’s stock option plan, certain adjustments are required to be made to stock options outstanding under the plan in order to avoid dilution of the intended benefits which would otherwise result as a consequence of the special dividend. As such, on June 21, 2013 the strike price for all outstanding stock options at that time was modified by the $5.00 special dividend amount. There was no change to compensation expense as a result of this adjustment.
The balance of retained earnings as of the 2013 Special Cash Dividend declaration date was $4,934. As such, the dividends were first charged to retained earnings and dividends in excess of retained earnings were recorded as a reduction to additional paid-in capital.
13. Quarterly Financial Information (Unaudited)
|
|
||||||||||||||||
| Quarters Ended 2013 | ||||||||||||||||
| Q1 | Q2 | Q3 | Q4 | |||||||||||||
|
Net sales
|
$ | 399,572 | $ | 346,688 | $ | 363,269 | $ | 376,236 | ||||||||
|
Gross profit
|
153,462 | 130,953 | 139,463 | 145,682 | ||||||||||||
|
Operating income
|
96,525 | 76,433 | 87,289 | 91,218 | ||||||||||||
|
Net income
|
50,674 | 28,254 | 47,093 | 48,518 | ||||||||||||
|
Net income per common share, basic:
|
$ | 0.75 | $ | 0.41 | $ | 0.69 | $ | 0.71 | ||||||||
|
Net income per common share, diluted:
|
$ | 0.73 | $ | 0.40 | $ | 0.67 | $ | 0.69 | ||||||||
|
|
||||||||||||||||
| Quarters Ended 2012 | ||||||||||||||||
| Q1 | Q2 | Q3 | Q4 | |||||||||||||
|
Net sales
|
$ | 294,561 | $ | 239,137 | $ | 300,586 | $ | 342,022 | ||||||||
|
Gross profit
|
111,005 | 87,429 | 115,813 | 126,153 | ||||||||||||
|
Operating income
|
59,493 | 37,158 | 59,124 | 67,780 | ||||||||||||
|
Net income
|
30,060 | 9,335 | 25,541 | 28,287 | ||||||||||||
|
Net income per common share, basic:
|
$ | 0.45 | $ | 0.14 | $ | 0.38 | $ | 0.42 | ||||||||
|
Net income per common share, diluted:
|
$ | 0.44 | $ | 0.14 | $ | 0.37 | $ | 0.41 | ||||||||
14. Valuation and Qualifying Accounts
For the years ended December 31, 2013, 2012 and 2011:
|
Balance at Beginning of Year
|
Reserves
Assumed in
Acquisition
|
Additions Charged to Earnings
|
Charges to Reserve, Net (1)
|
Balance at End
of Year
|
||||||||||||||||
|
Year ended December 31, 2013
|
||||||||||||||||||||
|
Allowance for doubtful accounts
|
$ | 1,166 | $ | 496 | $ | 1,037 | $ | (41 | ) | $ | 2,658 | |||||||||
|
Reserves for inventory
|
6,999 | 1,131 | 72 | (1,644 | ) | 6,558 | ||||||||||||||
|
Valuation of deferred tax assets
|
806 | (120 | ) | 335 | – | 1,021 | ||||||||||||||
|
Year ended December 31, 2012
|
||||||||||||||||||||
|
Allowance for doubtful accounts
|
$ | 789 | $ | 383 | $ | 204 | $ | (210 | ) | $ | 1,166 | |||||||||
|
Reserves for inventory
|
4,717 | 1,694 | 1,785 | (1,197 | ) | 6,999 | ||||||||||||||
|
Valuation of deferred tax assets
|
– | 827 | (21 | ) | – | 806 | ||||||||||||||
|
Year ended December 31, 2011
|
||||||||||||||||||||
|
Allowance for doubtful accounts
|
$ | 723 | $ | 171 | $ | (7 | ) | $ | (98 | ) | $ | 789 | ||||||||
|
Reserves for inventory
|
4,059 | 657 | 1,092 | (1,091 | ) | 4,717 | ||||||||||||||
|
Valuation of deferred tax assets
|
271,393 | – | (271,393 | ) | – | – | ||||||||||||||
(1) Deductions from the allowance for doubtful accounts equal accounts receivable written off, less recoveries, against the allowance. Deductions from the reserves for inventory excess and obsolete items equal inventory written off against the reserve as items were disposed of.
There were no changes in, or disagreements with, accountants reportable herein.
Evaluation of Disclosure Controls and Procedures
Disclosure controls and procedures are controls and other procedures that are designed to ensure that information required to be disclosed by us in reports we file or submit under the Securities Exchange Act of 1934, or the Exchange Act, is recorded, processed, summarized and reported within the time periods specified in the Securities and Exchange Commission rules and forms. Disclosure controls and procedures include, without limitation, controls and procedures designed to ensure that such information is accumulated and communicated to our management, including our Chief Executive Officer and Chief Financial Officer, as appropriate, to allow for timely decisions regarding required disclosure.
Our management, with the participation of our Chief Executive Officer and our Chief Financial Officer, has conducted an evaluation of the design and operation of our disclosure controls and procedures as defined in Rule 13a-15(e) and 15d-15(e) under the Exchange Act as of the end of the period covered by this report on Form 10-K. Based on that evaluation, our Chief Executive Officer and Chief Financial Officer concluded that our disclosure controls and procedures were effective in providing reasonable assurance that the information required to be disclosed in this report on Form 10-K has been recorded, processed, summarized and reported as of the end of the period covered by this report on Form 10-K.
Management’s Report on Internal Control Over Financial Reporting
Our management is responsible for establishing and maintaining adequate internal control over financial reporting, as defined in Rule 13a-15(f) and 15d-15(f) under the Exchange Act. Our internal control over financial reporting is designed under the supervision of our Chief Executive Officer and Chief Financial Officer to provide reasonable assurance regarding the reliability of financial reporting and the preparation of the consolidated financial statements in accordance with U.S. generally accepted accounting principles.
Internal control over financial reporting includes those policies and procedures that (i) pertain to the maintenance of records that, in reasonable detail, accurately and fairly reflect the transactions and dispositions of the assets of the Company; (ii) provide reasonable assurance that transactions are recorded as necessary to permit preparation of the financial statements in accordance with U.S. generally accepted accounting principles, and that receipts and expenditures of the Company are being made only in accordance with authorizations of management and directors of the Company; and (iii) provide reasonable assurance regarding prevention or timely detection of unauthorized acquisition, use, or disposition of the Company’s assets that could have a material effect on the Company’s financial statements.
There are inherent limitations to the effectiveness of any internal control over financial reporting, including the possibility of human error or the circumvention or overriding of the controls. Accordingly, even an effective internal control over financial reporting can provide only reasonable assurance of achieving its objective. Because of its inherent limitations, internal control over financial reporting may not prevent or detect misstatements. Projections of any evaluation of effectiveness to future periods are subject to the risk that controls may become inadequate, because of changes in conditions, or that the degree of compliance with the policies or procedures may deteriorate.
Under the supervision and with the participation of our Chief Executive Officer and Chief Financial Officer, our management conducted an assessment of the effectiveness of internal control over financial reporting as of December 31, 2013 based on the criteria established in the 1992
Internal Control – Integrated Framework
, issued by the Committee of Sponsoring Organizations of the Treadway Commission (COSO). Based on this assessment, our management has concluded that our internal control over financial reporting was effective as of December 31, 2013. In conducting this assessment, our management excluded the Tower Light and Baldor Generators businesses because they were acquired during 2013 and constituted 4.2% and 15.1% of total and net assets, respectively, as of December 31, 2013 and 2.8% and 1.0% of revenues and net income, respectively, for the year then ended.
Our independent registered public accounting firm has issued an attestation report on our internal control over financial reporting as of December 31, 2013. Its report appears in the consolidated financial statements included in this Annual Report on Form 10-K on page 36.
Changes in Internal Control Over Financial Reporting
There have been no changes in our internal control over financial reporting that occurred during the three months ended December 31, 2013 that have materially affected, or are reasonably likely to materially affect, our internal control over financial reporting.
None
The information required by Item 10 not already provided herein under “Item 1 – Business – Executive Officers”, will be included in our 2014 Proxy Statement, and is incorporated by reference herein.
The information required by this item will be included in our 2014 Proxy Statement and is incorporated herein by reference.
The information required by this item will be included in our 2014 Proxy Statement and is incorporated herein by reference.
The information required by this item will be included in our 2014 Proxy Statement and is incorporated herein by reference.
The information required by this item will be included in our 2014 Proxy Statement and is incorporated herein by reference.
(a)(1) Financial Statements
Included in Part II of this report:
|
Page
|
|
|
Report of Independent Registered Public Accounting Firm
|
36
|
|
Consolidated balance sheets as of December 31, 2013 and 2012
|
38
|
|
Consolidated statements of comprehensive income for years ended December 31, 2013, 2012 and 2011
|
39
|
|
Consolidated statements of stockholders’ equity for years ended December 31, 2013, 2012 and 2011
|
40
|
|
Consolidated statements of cash flows for the years ended December 31, 2013, 2012 and 2011
|
41
|
|
Notes to consolidated financial statements
|
42
|
(a)(2) Financial Statement Schedules
All financial statement schedules have been omitted, since the required information is not applicable or is not present in amounts sufficient to require submission of the schedule, or because the information required is included in the consolidated financial statements and notes thereto.
(a)(3) Exhibits
See the Exhibits Index following the signature pages for a list of the exhibits being filed or furnished with or incorporated by reference into this Annual Report on Form 10-K.
66
SIGNATURES
Pursuant to the requirements of Section 13 or 15(d) of the Securities Exchange Act of 1934, the Registrant has duly caused this report to be signed on its behalf by the undersigned, thereunto duly authorized.
|
Generac Holdings Inc.
|
||
|
By:
|
/s/
Aaron Jagdfeld
|
|
|
Aaron Jagdfeld
|
||
|
President and Chief Executive Officer
|
||
Dated: March 3, 2014
Pursuant to the requirements of the Securities Exchange Act of 1934, this report has been signed below by the following persons and on behalf of the Registrant in the capacities and on the dates indicated.
| Signature | Title | Date | ||||||||
|
/s/
Aaron Jagdfeld
Aaron Jagdfeld
|
President, Chief Executive Officer and Director
|
March 3, 2014
|
||||||||
|
/s/
York A. Ragen
York A. Ragen
|
Chief Financial Officer and
Chief Accounting Officer
|
March 3, 2014
|
||||||||
|
/s/
TODD A. ADAMS
Todd A. Adams
|
Director
|
March 3, 2014
|
||||||||
|
/s/
john d. bowlin
John D. Bowlin
|
Director
|
March 3, 2014
|
||||||||
|
/s/
robert d. dixon
Robert D. Dixon
|
Director
|
March 3, 2014
|
||||||||
|
/s/
Barry J. Goldstein
Barry J. Goldstein
|
Director
|
March 3, 2014
|
||||||||
|
/s/
bennett morgan
Bennett Morgan
|
Director
|
March 3, 2014
|
||||||||
|
/s/
stephen murray
Stephen Murray
|
Director
|
March 3, 2014
|
||||||||
|
/s/
david ramon
David Ramon
|
Director
|
March 3, 2014
|
||||||||
|
/s/
timothy walsh
Timothy Walsh
|
Director
|
March 3, 2014
|
||||||||
67
EXHIBIT INDEX
|
Exhibits
Number
|
Description
|
|
|
2.1
|
Agreement and Plan of Merger by and among Generac Power Systems, Inc., the representative named therein, GPS CCMP Acquisition Corp., and GPS CCMP Merger Corp., dated as of September 13, 2006 (incorporated by reference to Exhibit 2.1 of the Registration Statement on Form S-1 filed with the SEC on January 11, 2010).
|
|
|
2.2
|
Amendment to Agreement and Plan of Merger by and among Generac Power Systems, Inc., the representative named therein, GPS CCMP Acquisition Corp., and GPS CCMP Merger Corp (incorporated by reference to Exhibit 2.1 of the Registration Statement on Form S-1 filed with the SEC on January 11, 2010).
|
|
|
3.1
|
Third Amended and Restated Certificate of Incorporation of Generac Holdings Inc. (incorporated by reference to Exhibit 3.1 of the Company’s Annual Report on Form 10-K for the fiscal year ended December 31, 2010).
|
|
|
3.2
|
Amended and Restated Bylaws of Generac Holdings Inc. (incorporated by reference to Exhibit 3.1 of the Company’s Current Report on Form 8-K filed with the SEC on April 10, 2013).
|
|
|
4.1
|
Form of Common Stock Certificate (incorporated by reference to Exhibit 4.1 of the Registration Statement on Form S-1 filed with the SEC on January 25, 2010).
|
|
| 10.1 |
Restatement Agreement, dated as of May 31, 2013, to that certain Credit Agreement, dated as of February 9, 2012, as amended and restated as of May 31, 2012, among Generac Power Systems, Inc., Generac Acquisition Corp., the lenders party thereto, JPMorgan Chase Bank, N.A., as Administrative Agent, and Bank of America, N.A. and Goldman Sachs Bank USA, as syndication agents (incorporated by reference to Exhibit 10.1 to the Company’s Current Report on Form 8-K filed with the SEC on June 4, 2013).
|
|
| 10.2 |
Guarantee and Collateral Agreement, dated as of February 9, 2012, as amended and restated as of May 30, 2012, among Generac Holdings Inc., Generac Acquisition Corp., Generac Power Systems, Inc., certain subsidiaries of Generac Power Systems, Inc. and JPMorgan Chase Bank, N.A., as Administrative Agent (incorporated by reference to Exhibit 10.2 of the Company’s Current Report on Form 8-K filed with the SEC on May 31, 2012).
|
|
|
10.3
|
Credit Agreement, dated as of February 9, 2012, as amended and restated as of May 30, 2012, as further amended and restated as of May 31, 2013, among Generac Power Systems, Inc., Generac Acquisition Corp., the lenders party thereto, JPMorgan Chase Bank, N.A., as Administrative Agent and Bank of America, N.A. and Goldman Sachs Bank USA, as syndication agent (incorporated by reference to Exhibit 10.2 to the Company’s Current Report on Form 8-K filed with the SEC on June 4, 2013).
|
|
| 10.4 |
Guarantee and Collateral Agreement, dated as of May 30, 2012, among Generac Holdings Inc., Generac Acquisition Corp., Generac Power Systems, Inc., certain subsidiaries of Generac Power Systems, Inc. and Bank of America, N.A., as Administrative Agent (incorporated by reference to Exhibit 10.4 of the Company’s Current Report on Form 8-K filed with the SEC on May 31, 2012).
|
|
| 10.5 |
First Amendment to Guarantee and Collateral Agreement, dated as of May 31, 2013, to that certain Guarantee and Collateral Agreement, dated as of February 9, 2012, as amended and restated as of May 30, 2012, among Generac Holdings Inc., Generac Acquisition Corp., Generac Power Systems, Inc., certain subsidiaries of Generac Power Systems, Inc. and JPMorgan Chase Bank, N.A., as Administrative Agent (incorporated by reference to Exhibit 10.3 to the Company’s Current Report on Form 8-K filed with the SEC on June 4, 2013).
|
|
| 10.6 |
Credit Agreement, dated as of May 30, 2012, among Generac Power Systems, Inc., its Domestic Subsidiaries listed as Borrowers on the signature pages thereto, Generac Acquisition Corp., the lenders party thereto, Bank of America, N.A. as Administrative Agent, JPMorgan Chase Bank, N.A. and Goldman Sachs Bank USA, as syndication agents, and Wells Fargo Bank, National Association, as Documentation Agent (incorporated by reference to Exhibit 10.3 of the Company’s Current Report on Form 8-K filed with the SEC on May 31, 2012).
|
|
| 10.7 |
Amendment No. 1 dated as of May 31, 2013 to the Credit Agreement, dated as of May 30, 2012, among Generac Power Systems, Inc., its Domestic Subsidiaries listed as Borrowers on the signature pages thereto, Generac Acquisition Corp., the lenders party thereto, Bank of America, N.A. as Administrative Agent, JPMorgan Chase Bank, N.A. and Goldman Sachs Bank USA, as syndication agents, and Wells Fargo Bank, National Association, as Documentation Agent (incorporated by reference to Exhibit 10.4 to the Company’s Current Report on Form 8-K filed with the SEC on June 4, 2013).
|
|
|
10.8
|
First Amendment to the Guarantee and Collateral Agreement, dated as of May 31, 2013, to that certain Guarantee and Collateral Agreement, dated as of May 30, 2012, among Generac Holdings Inc., Generac Acquisition Corp., Generac Power Systems, Inc., certain subsidiaries of Generac Power Systems, Inc. and Bank of America, N.A., as Administrative Agent (incorporated by reference to Exhibit 10.5 to the Company’s Current Report on Form 8-K filed with the SEC on June 4, 2013).
|
|
|
10.9
+
|
2009 Executive Management Incentive Compensation Program (incorporated by reference to Exhibit 10.46 of the Registration Statement on Form S-1 filed with the SEC on December 17, 2009).
|
|
|
10.10
+
|
Generac Holdings Inc. Amended and Restated 2010 Equity Incentive Plan (incorporated by reference to Appendix A to the Definitive Proxy Statement on Schedule 14A of the Company filed with the SEC on April 27, 2012)
|
|
|
10.11
+
|
Generac Holdings Inc. Annual Performance Bonus Plan (incorporated by reference to Exhibit 10.63 of the Registration Statement on Form S-1 filed with the SEC on January 25, 2010).
|
|
|
10.12
+
|
Amended and Restated Employment Agreement, dated January 14, 2010, between Generac and Aaron Jagdfeld (incorporated by reference to Exhibit 10.65 of the Registration Statement on Form S-1 filed with the SEC on January 25, 2010).
|
|
|
10.13
+
|
Employment Letter with Terrence Dolan (incorporated by reference to Exhibit 10.62 of the Registration Statement on Form S-1 filed with the SEC on January 25, 2010).
|
|
|
10.14
+
|
Form of Change in Control Severance Agreement (incorporated by reference to Exhibit 10.64 of the Registration Statement on Form S-1 filed with the SEC on January 25, 2010).
|
|
|
10.15
|
Form of Confidentiality, Non-Competition and Intellectual Property Agreement (incorporated by reference to Exhibit 10.40 of the Registration Statement on Form S-1 filed with the SEC on November 24, 2009).
|
|
|
10.16
+
|
Form of Restricted Stock Award Agreement (incorporated by reference to Exhibit 10.44 of the Registration Statement on Form S-1 filed with the SEC on January 25, 2010).
|
|
| 10.17 + |
Form of Nonqualified Stock Option Award Agreement (incorporated by reference to Exhibit 10.45 of the Registration Statement on Form S-1 filed with the SEC on January 25, 2010).
|
|
| 10.18 + |
Amended Form of Restricted Stock Award Agreement pursuant to the 2010 Equity Incentive Plan (incorporated by reference to Exhibit 10.3 of the Quarterly Report on Form 10-Q filed with the SEC on May 8, 2012).
|
|
| 10.19 + |
Amended Form of Nonqualified Stock Option Award Agreement pursuant to the 2010 Equity Incentive Plan (incorporated by reference to Exhibit 10.4 of the Quarterly Report on Form 10-Q filed with the SEC on May 8, 2012).
|
|
|
10.20+
|
Amended Form of Restricted Stock Award Agreement with accelerated vesting pursuant to the 2010 Equity Incentive Plan (incorporated by reference to Exhibit 10.5 of the Quarterly Report on Form 10-Q filed with the SEC on May 8, 2012).
|
|
|
10.21
|
Form of Generac Holdings Inc. Director Indemnification Agreement for Stephen Murray and Timothy Walsh (incorporated by reference to Exhibit 10.50 of the Registration Statement on Form S-1 filed with the SEC on January 11, 2010).
|
|
|
10.22
|
Form of Generac Holdings Inc. Director Indemnification Agreement for Barry Goldstein, John D. Bowlin, Robert Dixon, David Ramon, Timothy W. Sullivan, Bennett Morgan and Todd A. Adams (incorporated by reference to Exhibit 10.51 of the Registration Statement on Form S-1 filed with the SEC on January 11, 2010).
|
|
|
10.23
|
Form of Generac Holdings Inc. Officer Indemnification Agreement (incorporated by reference to Exhibit 10.52 of the Registration Statement on Form S-1 filed with the SEC on January 11, 2010).
|
|
|
10.24
|
Form of Generac Power Systems, Inc. Director Indemnification Agreement for Stephen Murray and Timothy Walsh (incorporated by reference to Exhibit 10.53 of the Registration Statement on Form S-1 filed with the SEC on January 25, 2010).
|
|
| 10.25 |
Form of Generac Power Systems, Inc. Indemnification Agreement for Barry Goldstein, John D. Bowlin, Aaron Jagdfeld, David Ramon, York A. Ragen, Dawn Tabat, Allen Gillette, Roger Schaus, Jr., Roger Pascavis, Russell S. Minick, Robert Stoppek and Clement Feng (incorporated by reference to Exhibit 10.54 of the Registration Statement on Form S-1 filed with the SEC on January 25, 2010).
|
|
| 10.26+ |
Amended Form of Nonqualified Stock Option Award Agreement pursuant to the 2010 Equity Incentive Plan (incorporated by reference to Exhibit 10.1 of the Form 10-Q filed with the SEC on May 7, 2013).
|
|
| 10.27+ |
Amended Form of Restricted Stock Award Agreement with accelerated vesting pursuant to the 2010 Equity Incentive Plan (incorporated by reference to Exhibit 10.2 of the Form 10-Q filed with the SEC on May 7, 2013).
|
|
| 10.28+ |
Cash award agreement to non-executive chairman (incorporated by reference to Exhibit 10.3 of the Form 10-Q filed with the SEC on May 7, 2013).
|
|
|
10.29+
|
Cash award agreement to non-executive chairman (incorporated by reference to Exhibit 10.6 of the Form 10-Q filed with the SEC on August 7, 2013).
|
|
|
21.1*
|
List of Subsidiaries of Generac Holdings Inc.
|
|
|
23.1*
|
Consent of Ernst & Young, Independent Registered Public Accounting Firm.
|
|
|
31.1*
|
Certification of Chief Executive Officer pursuant to Securities Exchange Act Rules 13a-14(a) and 15d-14(a), pursuant to Section 302 of the Sarbanes-Oxley Act of 2002.
|
|
|
31.2*
|
Certification of Chief Financial Officer pursuant to Securities Exchange Act Rules 13a-14(a) and 15d-14(a), pursuant to Section 302 of the Sarbanes-Oxley Act of 2002.
|
|
|
32.1*
*
|
Certification of Chief Executive Officer pursuant to 18 U.S.C. Section 1350, as adopted by Section 906 of the Sarbanes-Oxley Act of 2002.
|
|
| 32.2* * | Certification of Chief Financial Officer pursuant to 18 U.S.C. Section 1350, as adopted by Section 906 of the Sarbanes-Oxley Act of 2002. | |
|
101*
|
The following financial information from the Company’s Annual Report on Form 10-K for the fiscal year ended December 31, 2013, filed with the SEC on March 3, 2014, formatted in eXtensible Business Reporting Language (XBRL): (i) Consolidated Balance Sheets at December 31, 2013 and December 31, 2012; (ii) Consolidated Statements of Comprehensive Income for the Fiscal Years Ended December 31, 2013, December 31, 2012 and December 31, 2011; (iii) Consolidated Statements of Stockholders' Equity (Deficit) for the Fiscal Years Ended December 31, 2013, December 31, 2012 and December 31, 2011; (iv) Consolidated Statements of Cash Flows for the Fiscal Years Ended December 31, 2013, December 31, 2012 and December 31, 2011; (v) Notes to Consolidated Financial Statements.
|
|
|
*
|
Filed herewith.
|
|
**
|
Furnished herewith.
|
|
+
|
Indicates management contract or compensatory plan or arrangement.
|
68
TABLE OF CONTENTS
Part IItem 1. BusinessItem 1A. Risk FactorsItem 1B. Unresolved Staff CommentsItem 2. PropertiesItem 3. Legal ProceedingsItem 4. Mine Safety DisclosuresPart IIItem 5. Market For Registrant S Common Equity, Related Stockholder Matters and Issuer Purchases Of Equity SecuritiesPart OfItem 6. Selected Financial DataItem 7. Management S Discussion and Analysis Of Financial Condition and Results Of OperationsItem 7A. Quantitative and Qualitative Disclosures About Market RiskItem 8. Financial Statements and Supplementary DataItem 9. Changes in and Disagreements with Accountants on Accounting and Financial DisclosureItem 9A. Controls and ProceduresItem 9B. Other InformationPart IIIItem 10. Directors, Executive Officers and Corporate GovernanceItem 11. Executive CompensationItem 12. Security Ownership Of Certain Beneficial Owners and Management and Related Stockholder MattersItem 13. Certain Relationships and Related Transactions, and Director IndependenceItem 14. Principal Accountant Fees and ServicesPart IVItem 15. Exhibits and Financial Statement Schedules