ALPHABET INC.
10-Ks and 10-Qs
|
|
|
|
|
|
|
|
|
|
|
|
|
|
|
|
|
|
|
|
|
|
|
|
|
|
|
|
|
|
|
|
|
|
|
|
|
|
UNITED STATES
SECURITIES AND EXCHANGE COMMISSION
Washington, D.C. 20549
___________________________________________
FORM 10-K
___________________________________________
(Mark One)
|
ý
|
ANNUAL REPORT PURSUANT TO SECTION 13 OR 15(d) OF THE SECURITIES EXCHANGE ACT OF 1934
|
For the fiscal year ended
December 31, 2018
OR
|
¨
|
TRANSITION REPORT PURSUANT TO SECTION 13 OR 15(d) OF THE SECURITIES EXCHANGE ACT OF 1934
|
For the transition period from
to
.
Commission file number:
001-37580
___________________________________________
Alphabet Inc.
(Exact name of registrant as specified in its charter)
___________________________________________
|
Delaware
|
61-1767919
|
|
(State or other jurisdiction of incorporation or organization)
|
(I.R.S. Employer Identification No.)
|
|
1600 Amphitheatre Parkway
Mountain View, CA 94043
|
|
|
(Address of principal executive offices) (Zip Code)
|
|
|
(650) 253-0000
|
|
|
(Registrant’s telephone number, including area code)
|
|
___________________________________________
Securities registered pursuant to Section 12(b) of the Act:
|
Title of each class
|
Name of each exchange on which registered
|
|
Class A Common Stock, $0.001 par value
|
Nasdaq Stock Market LLC
(Nasdaq Global Select Market)
|
|
Class C Capital Stock, $0.001 par value
|
Nasdaq Stock Market LLC
(Nasdaq Global Select Market)
|
Securities registered pursuant to Section 12(g) of the Act:
|
Title of each class
|
|
None
|
___________________________________________
Indicate by check mark if the registrant is a well-known seasoned issuer, as defined in Rule 405 of the Securities Act. Yes
ý
No
¨
Indicate by check mark if the registrant is not required to file reports pursuant to Section 13 or Section 15(d) of the Act. Yes
¨
No
ý
Indicate by check mark whether the registrant (1) has filed all reports required to be filed by Section 13 or 15(d) of the Securities Exchange Act of 1934 during the preceding 12 months (or for such shorter period that the registrant was required to file such reports), and (2) has been subject to such filing requirements for the past 90 days. Yes
ý
No
¨
Indicate by check mark whether the registrant has submitted electronically every Interactive Data File required to be submitted pursuant to Rule 405 of Regulation S-T (§232.405 of this chapter) during the preceding 12 months (or for such shorter period that the registrant was required to submit such files). Yes
ý
No
¨
Indicate by check mark if disclosure of delinquent filers pursuant to Item 405 of Regulation S-K (§229.405 of this chapter) is not contained herein, and will not be contained, to the best of the registrant’s knowledge, in definitive proxy or information statements incorporated by reference in Part III of this Form 10-K or any amendment to this Form 10-K.
¨
Indicate by check mark whether the registrant is a large accelerated filer, an accelerated filer, a non-accelerated filer, a smaller reporting company or an emerging growth company. See the definitions of “large accelerated filer,” “accelerated filer,” “smaller reporting company,” and "emerging growth company" in Rule 12b-2 of the Exchange Act.
|
Large accelerated filer
|
ý
|
|
Accelerated filer
|
¨
|
|
Non-accelerated filer
|
¨
|
Smaller reporting company
|
¨
|
|
|
Emerging growth company
|
¨
|
|||
If an emerging growth company, indicate by check mark if the registrant has elected not to use the extended transition period for complying with any new or revised financial accounting standards provided pursuant to Section 13(a) of the Exchange Act.
¨
Indicate by check mark whether the registrant is a shell company (as defined in Rule 12b-2 of the Exchange Act). Yes
¨
No
ý
As of
June 29, 2018
, the aggregate market value of shares held by non-affiliates of the registrant (based upon the closing sale prices of such shares on the Nasdaq Global Select Market on
June 29, 2018
) was approximately
$680.0 billion
. For purposes of calculating the aggregate market value of shares held by non-affiliates, we have assumed that all outstanding shares are held by non-affiliates, except for shares held by each of our executive officers, directors and 5% or greater stockholders. In the case of 5% or greater stockholders, we have not deemed such stockholders to be affiliates unless there are facts and circumstances which would indicate that such stockholders exercise any control over our company, or unless they hold 10% or more of our outstanding common stock. These assumptions should not be deemed to constitute an admission that all executive officers, directors and 5% or greater stockholders are, in fact, affiliates of our company, or that there are not other persons who may be deemed to be affiliates of our company. Further information concerning shareholdings of our officers, directors and principal stockholders is included or incorporated by reference in Part III, Item 12 of this Annual Report on Form 10-K.
As of
January 31, 2019
, there were
299,360,029
shares of the registrant’s Class A common stock outstanding,
46,535,019
shares of the registrant’s Class B common stock outstanding, and
349,291,348
shares of the registrant’s Class C capital stock outstanding.
___________________________________________
DOCUMENTS INCORPORATED BY REFERENCE
Portions of the registrant’s Proxy Statement for the
2019
Annual Meeting of Stockholders are incorporated herein by reference in Part III of this Annual Report on Form 10-K to the extent stated herein. Such proxy statement will be filed with the Securities and Exchange Commission within 120 days of the registrant’s fiscal year ended
December 31, 2018
.
|
Alphabet Inc.
|
|
Alphabet Inc.
Form 10-K
For the Fiscal Year Ended
December 31, 2018
TABLE OF CONTENTS
|
|
|
Page
|
|
PART I
|
||
|
Item 1.
|
||
|
Item 1A.
|
||
|
Item 1B.
|
||
|
Item 2.
|
||
|
Item 3.
|
||
|
Item 4.
|
||
|
PART II
|
||
|
Item 5.
|
||
|
Item 6.
|
||
|
Item 7.
|
||
|
Item 7A.
|
||
|
Item 8.
|
||
|
Item 9.
|
||
|
Item 9A.
|
||
|
Item 9B.
|
||
|
PART III
|
||
|
Item 10.
|
||
|
Item 11.
|
||
|
Item 12.
|
||
|
Item 13.
|
||
|
Item 14.
|
||
|
PART IV
|
||
|
Item 15.
|
||
|
Item 16.
|
||
i
|
Alphabet Inc.
|
|
NOTE ABOUT FORWARD-LOOKING STATEMENTS
This Annual Report on Form 10-K contains forward-looking statements within the meaning of the Private Securities Litigation Reform Act of 1995. These statements include, among other things, statements regarding:
|
•
|
the growth of our business and revenues and our expectations about the factors that influence our success and trends in our business;
|
|
•
|
our plans to continue to invest in new businesses, products, services and technologies, systems, facilities, and infrastructure, to continue to hire aggressively and provide competitive compensation programs, as well as to continue to invest in acquisitions;
|
|
•
|
seasonal fluctuations in internet usage and advertiser expenditures, underlying business trends such as traditional retail seasonality, and macroeconomic conditions, which are likely to cause fluctuations in our quarterly results;
|
|
•
|
the potential for declines in our revenue growth rate and operating margin;
|
|
•
|
our expectation that we will continue to take steps to improve the relevance of the ads we deliver and to reduce the number of accidental clicks;
|
|
•
|
fluctuations in our revenue growth, as well as the change in paid clicks and cost-per-click on Google properties and the change in impressions and cost-per-impression on Google Network Members’ properties, and various factors contributing to such fluctuations;
|
|
•
|
our expectation that our foreign exchange risk management program will not fully offset our net exposure to fluctuations in foreign currency exchange rates;
|
|
•
|
the expected variability of costs related to hedging activities under our foreign exchange risk management program;
|
|
•
|
the anticipated effect of, and our response to, new accounting pronouncements;
|
|
•
|
our expectation that our cost of revenues, research and development (R&D) expenses, sales and marketing expenses, and general and administrative expenses will increase in dollars and may increase as a percentage of revenues;
|
|
•
|
our potential exposure in connection with pending investigations, proceedings, and other contingencies;
|
|
•
|
our expectation that our monetization trends will fluctuate, which could affect our revenues and margins in the future;
|
|
•
|
our expectation that our traffic acquisition costs (TAC) and the associated TAC rates will increase in the future;
|
|
•
|
our expectation that our results will be affected by our performance in international markets as users in developing economies increasingly come online;
|
|
•
|
our expectation that the portion of our revenues that we derive from non-advertising revenues will continue to increase and may affect margins;
|
|
•
|
our expectation that our other income (expense), net, will fluctuate in the future, as it is largely driven by market dynamics;
|
|
•
|
estimates of our future compensation expenses;
|
|
•
|
fluctuations in our effective tax rate;
|
|
•
|
the sufficiency of our sources of funding;
|
|
•
|
our payment terms to certain advertisers, which may increase our working capital requirements;
|
|
•
|
fluctuations in our capital expenditures;
|
|
•
|
our expectations related to the operating structure implemented pursuant to the Alphabet holding company reorganization;
|
|
•
|
the sufficiency and timing of our proposed remedies in response to the European Commission's (EC) decisions;
|
|
•
|
the expected timing and amount of Alphabet Inc.'s share repurchases;
|
1
|
Alphabet Inc.
|
|
as well as
other statements regarding our future operations, financial condition and prospects, and business strategies. Forward-looking statements may appear throughout this report and other documents we file with the Securities and Exchange Commission (SEC), including without limitation, the following sections: Item 1 "Business," Item 1A "Risk Factors," and Item 7 "Management’s Discussion and Analysis of Financial Condition and Results of Operations." Forward-looking statements generally can be identified by words such as "anticipates," "believes," "estimates," "expects," "intends," "plans," "predicts," "projects," "will be," "will continue," "may," "could," "will likely result," and similar expressions. These forward-looking statements are based on current expectations and assumptions that are subject to risks and uncertainties, which could cause our actual results to differ materially from those reflected in the forward-looking statements. Factors that could cause or contribute to such differences include, but are not limited to, those discussed in this Annual Report on Form 10-K, and in particular, the risks discussed in Item 1A, "Risk Factors" of this report and those discussed in other documents we file with the SEC. We undertake no obligation to revise or publicly release the results of any revision to these forward-looking statements, except as required by law. Given these risks and uncertainties, readers are cautioned not to place undue reliance on such forward-looking statements.
As used herein, "Alphabet," "the company," "we," "us," "our," and similar terms include Alphabet Inc. and its subsidiaries, unless the context indicates otherwise.
"Alphabet," "Google," and other trademarks of ours appearing in this report are our property. This report contains additional trade names and trademarks of other companies. We do not intend our use or display of other companies' trade names or trademarks to imply an endorsement or sponsorship of us by such companies, or any relationship with any of these companies.
2
|
Alphabet Inc.
|
|
PART I
|
ITEM 1.
|
BUSINESS
|
Overview
As our founders Larry and Sergey wrote in the original founders' letter, "Google is not a conventional company. We do not intend to become one." That unconventional spirit has been a driving force throughout our history -- inspiring us to do things like rethink the mobile device ecosystem with Android and map the world with Google Maps. As part of that, our founders also explained that you could expect us to make "smaller bets in areas that might seem very speculative or even strange when compared to our current businesses." From the start, the company has always strived to do more, and to do important and meaningful things with the resources we have.
Alphabet is a collection of businesses -- the largest of which is Google. It also includes businesses that are generally pretty far afield of our main internet products in areas such as self-driving cars, life sciences, internet access and TV services. We report all non-Google businesses collectively as Other Bets. Our Alphabet structure is about helping each of our businesses prosper through strong leaders and independence.
Access and technology for everyone
The Internet is one of the world’s most powerful equalizers, capable of propelling new ideas and people forward. At Google, our mission is to make sure that information serves everyone, not just a few. So whether you're a child in a rural village or a professor at an elite university, you can access the same information. We are helping people get online by tailoring digital experiences to the needs of emerging markets. For instance, our digital payments app in India, now called Google Pay, helps tens of millions of people and businesses easily pay with just a few taps. We're also making sure our core Google products are fast and useful, especially for users in areas where speed and connectivity are central concerns.
Other Alphabet companies are also pursuing initiatives with similar goals. For instance, Loon announced that it will bring its balloon-powered internet to regions of central Kenya, starting in 2019.
Moonshots
Many companies get comfortable doing what they have always done, making only incremental changes. This incrementalism leads to irrelevance over time, especially in technology, where change tends to be revolutionary, not evolutionary. People thought we were crazy when we acquired YouTube and Android and when we launched Chrome, but those efforts have matured into major platforms for digital video and mobile devices and a safer, popular browser. We continue to look toward the future and continue to invest for the long-term. As we said in the original founders' letter, we will not shy away from high-risk, high-reward projects that we believe in because they are the key to our long-term success.
The power of machine learning
Across the company, machine learning and artificial intelligence (AI) are increasingly driving many of our latest innovations. Within Google, our investments in machine learning over a decade have enabled us to build products that are smarter and more useful -- it's what allows you to use your voice to ask the Google Assistant for information, to translate the web from one language to another, to see better YouTube recommendations, and to search for people and events in Google Photos. Our advertising tools also use machine learning to help marketers find the right audience, deliver the right creative, and optimize their campaigns through better auto-bidding and measurement tools. Machine learning is also showing great promise in helping us tackle big issues, like dramatically improving the energy efficiency of our data centers.
Across Other Bets, machine learning helps self-driving cars better detect and respond to others on the road, assists delivery drones in determining whether a location is safe for drop off, and can also help clinicians more accurately detect sight-threatening eye diseases.
Google
Serving our users
We have always been a company committed to building products that have the potential to improve the lives of millions of people. Our product innovations have made our services widely used, and our brand one of the most recognized in the world. Google's core products and platforms such as Android, Chrome, Gmail, Google Drive, Google Maps, Google Play, Search, and YouTube each have over one billion monthly active users. But most important, we believe we are just beginning to scratch the surface. Our vision is to remain a place of incredible creativity and innovation
3
|
Alphabet Inc.
|
|
that uses our technical expertise to tackle big problems. As the majority of Alphabet’s big bets continue to reside within Google, an important benefit of the shift to Alphabet has been the tremendous focus that we’re able to have on Google’s many extraordinary opportunities.
Google’s mission to organize the world’s information and make it universally accessible and useful has always been our North Star, and our products have come a long way since the company was founded two decades ago. Instead of just showing ten blue links in our search results, we are increasingly able to provide direct answers -- even if you're speaking your question using Voice Search -- which makes it quicker, easier and more natural to find what you're looking for. You can also type or talk with the Google Assistant in a conversational way across multiple devices like phones, speakers, headphones, televisions and more. And with Google Lens, you can use your phone’s camera to identify an unfamiliar landmark or find a trailer from a movie poster. Over time, we have also added other services that let you access information quickly and easily -- like Google Maps, which helps you navigate to a store while showing you current traffic conditions, or Google Photos, which helps you store and organize your photos.
This drive to make information more accessible has led us over the years to improve the discovery and creation of digital content, on the web and through platforms like Google Play and YouTube. And with the migration to mobile, people are consuming more digital content by watching more videos, playing more games, listening to more music, reading more books, and using more apps than ever before. Working with content creators and partners, we continue to build new ways for people around the world to find great digital content.
Fueling all of these great digital experiences are powerful platforms and hardware. That’s why we continue to invest in platforms like our Android mobile operating system, Chrome browser, Chrome operating system, and Daydream virtual reality platform, as well as growing our family of great hardware devices. We see tremendous potential for devices to be helpful, make your life easier, and get better over time, by combining the best of Google's AI, software, and hardware. This is reflected in our latest generation of hardware products like Pixel 3 phones and the Google Home Hub smart display. Creating beautiful products that people rely on every day is a journey that we are investing in for the long run.
Google was a company built in the cloud and has been investing in infrastructure, security, data management, analytics, and AI from the very beginning. We have continued to enhance these strengths with features like data migration, modern development environments and machine learning tools to provide enterprise-ready cloud services, including Google Cloud Platform and G Suite, to our customers. Google Cloud Platform enables developers to build, test, and deploy applications on Google’s highly scalable and reliable infrastructure. Our G Suite productivity tools -- which include apps like Gmail, Docs, Drive, Calendar, Hangouts, and more -- are designed with real-time collaboration and machine intelligence to help people work smarter. Because more and more of today’s great digital experiences are being built in the cloud, our Google Cloud products help businesses of all sizes take advantage of the latest technology advances to operate more efficiently.
Key to building helpful products for users is our commitment to keeping their data safe online. As the Internet evolves, we continue to invest in our industry-leading security technologies and privacy tools.
How we make money
The goal of our advertising business is to deliver relevant ads at just the right time and to give people useful commercial information, regardless of the device they’re using. We also provide advertisers with tools that help them better attribute and measure their advertising campaigns across screens. Our advertising solutions help millions of companies grow their businesses, and we offer a wide range of products across screens and formats. We generate revenues primarily by delivering both performance advertising and brand advertising.
|
•
|
Perf
ormance advertising
creates and delivers relevant ads that users will click on, leading to direct engagement with advertisers. Most of our performance advertisers pay us when a user engages in their ads. Performance advertising lets our advertisers connect with users while driving measurable results.
|
Our ads tools allow performance advertisers to create simple text-based ads that appear on Google properties and the properties of Google Network Members. In addition, Google Network Members use our platforms to display relevant ads on their properties, generating revenues when site visitors view or click on the ads. We continue to invest in our advertising programs and make significant upgrades.
|
•
|
Brand advertising
helps enhance users' awareness of and affinity with advertisers' products and services, through v
ideos, text, images, and other interactive ads that run across various devices. We help brand advertisers deliver digital videos and other types of ads to specific audiences for their brand-building marketing campaigns.
|
4
|
Alphabet Inc.
|
|
We have built a world-class ad technology platform for brand advertisers, agencies, and publishers to power their digital marketing businesses. We aim to ensure great user experiences by serving the right ads at the right time and by building deep partnerships with brands and agencies. We also seek to improve the measurability of brand advertising so advertisers know when their campaigns are effective.
We have allocated substantial resources to stopping bad advertising practices and protecting users on the web. We focus on creating the best advertising experiences for our users and advertisers in many ways, ranging from filtering out invalid traffic, removing billions of bad ads from our systems every year to closely monitoring the sites, apps, and videos where ads appear and blacklisting them when necessary to ensure that ads do not fund bad content.
Beyond our advertising business, we also generate revenues in other areas. For instance, we generate revenue when users purchase digital content like apps, movies and music through Google Play or when they purchase our Made by Google hardware devices. Businesses also pay for the use of our cloud services like Google Cloud Platform and G Suite.
Other Bets
Throughout Alphabet, we are also using technology to try and solve big problems across many industries. Alphabet’s Other Bets are emerging businesses at various stages of development, ranging from those in the research and development phase to those that are in the beginning stages of commercialization, and our goal is for them to become thriving, successful businesses in the medium to long term. To do this, we make sure we have a strong CEO to run each company while also rigorously handling capital allocation and working to make sure each business is executing well. While these early-stage businesses naturally come with considerable uncertainty, some of them are already generating revenue and making important strides in their industries.
We continue to build these businesses thoughtfully and systematically to capitalize on the opportunities ahead. We are investing for the long term while being very deliberate about the focus, scale and pace of investments. Other Bets primarily generate revenues from internet and TV services and licensing and R&D services.
Competition
Our business is characterized by rapid change as well as new and disruptive technologies. We face formidable competition in every aspect of our business, particularly from companies that seek to connect people with online information and provide them with relevant advertising. We face competition from:
|
•
|
General purpose search engines and information services, such as Baidu, Microsoft's Bing, Naver, Seznam, Verizon's Yahoo, and Yandex.
|
|
•
|
Vertical search engines and e-commerce websites, such as Amazon and eBay (e-commerce), Booking's Kayak (travel queries), Microsoft's LinkedIn (job queries), and WebMD (health queries). Some users will navigate directly to such content, websites, and apps rather than go through Google.
|
|
•
|
Social networks, such as Facebook, Snapchat, and Twitter. Some users increasingly rely on social networks for product or service referrals, rather than seeking information through traditional search engines.
|
|
•
|
Other forms of advertising, such as billboards, magazines, newspapers, radio, and television. Our advertisers typically advertise in multiple media, both online and offline.
|
|
•
|
Other online advertising platforms and networks, including Amazon, AppNexus, Criteo, and Facebook, that compete for advertisers that use Google Ads, our primary auction-based advertising platform.
|
|
•
|
Providers of digital video services, such as Amazon, Facebook, Hulu, and Netflix.
|
We compete with companies that have longer operating histories and more established relationships with customers and users in businesses that are further afield from our advertising business. We face competition from:
|
•
|
Other digital content and application platform providers, such as Apple.
|
|
•
|
Companies that design, manufacture, and market consumer electronics products, including businesses that have developed proprietary platforms.
|
|
•
|
Providers of enterprise cloud services, including Alibaba, Amazon, and Microsoft.
|
|
•
|
Digital assistant providers, such as Amazon and Apple.
|
Competing successfully depends heavily on our ability to deliver and distribute innovative products and technologies to the marketplace across our businesses. Specifically, for our advertising-related businesses, competing successfully depends on attracting and retaining:
5
|
Alphabet Inc.
|
|
|
•
|
Users, for whom other products and services are literally one click away, largely on the basis of the relevance of our advertising, as well as the general usefulness, security and availability of our products and services.
|
|
•
|
Advertisers, primarily based on our ability to generate sales leads, and ultimately customers, and to deliver their advertisements in an efficient and effective manner across a variety of distribution channels.
|
|
•
|
Content providers, primarily based on
the quality of our advertiser base, our ability to help these partners generate revenues from advertising, and the terms of our agreements with them.
|
Intellectual Property
We rely on various intellectual property laws, confidentiality procedures and contractual provisions to protect our proprietary technology and our brand. We have registered, and applied for the registration of, U.S. and international trademarks, service marks, domain names and copyrights. We have also filed patent applications in the U.S. and foreign countries covering certain of our technology, and acquired patent assets to supplement our portfolio. We have licensed in the past, and expect that we may license in the future, certain of our rights to other parties.
Culture and Employees
We take great pride in our culture. We embrace collaboration and creativity, and encourage the iteration of ideas to address complex technical challenges. Transparency and open dialogue are central to how we work, and we aim to ensure that company news reaches our employees first through internal channels.
Despite our rapid growth, we still cherish our roots as a startup and wherever possible empower employees to act on great ideas regardless of their role or function within the company. We strive to hire great employees, with backgrounds and perspectives as diverse as those of our global users. We work to provide an environment where these talented people can have fulfilling careers addressing some of the biggest challenges in technology and society.
Our employees are among our best assets and are critical for our continued success. We expect to continue investing in hiring talented employees and to provide competitive compensation programs to our employees. As of
December 31, 2018
, we had
98,771
full-time employees. Although we have work councils and statutory employee representation obligations in certain countries, our U.S. employees are not represented by a labor union. Competition for qualified personnel in our industry is intense, particularly for software engineers, computer scientists, and other technical staff.
Seasonality
Our business is affected by seasonal fluctuations in internet usage, advertising expenditures, and underlying business trends such as traditional retail seasonality.
Other Items
We believe that climate change is one of the most significant global challenges of our time. We have established a climate change strategy based on four dimensions: matching 100% of the electricity consumption of our operations with purchases of renewable energy; understanding the effect of climate change on the resiliency of our core business operations; being a vocal advocate for greening electrical grids worldwide; and empowering everyone—businesses, governments, nonprofit organizations, communities, and individuals—to use Google technology to help create a more sustainable and resource-efficient world. Google's approach to climate change and our broader sustainability efforts are provided in our annual sustainability reports.
Available Information
Our website is located at www.abc.xyz, and our investor relations website is located at www.abc.xyz/investor. Our Annual Reports on Form 10-K, Quarterly Reports on Form 10-Q, and our Proxy Statements are available through our investor relations website, free of charge, after we file them with the SEC. We also provide a link to the section of the SEC's website at www.sec.gov that has all of the reports that we file or furnish with the SEC.
We webcast via our investor relations website our earnings calls and certain events we participate in or host with members of the investment community. Our investor relations website also provides notifications of news or announcements regarding our financial performance and other items of interest to our investors, including SEC filings, investor events, press and earnings releases, and blogs. We also share Google news and product updates on Google's Keyword blog at https://www.blog.google/, which may be of interest or material to our investors. Further, corporate governance information, including our certificate of incorporation, bylaws, governance guidelines, board committee charters, and code of conduct, is also available on our investor relations website under the heading "Other." The content of our websites are not incorporated by reference into this Annual Report on Form 10-K or in any other report or document we file with the SEC, and any references to our websites are intended to be inactive textual references only.
6
|
Alphabet Inc.
|
|
|
ITEM 1A.
|
RISK FACTORS
|
Our operations and financial results are subject to various risks and uncertainties, including but not limited to those described below, which could adversely affect our business, financial condition, results of operations, cash flows, and the trading price of our common and capital stock.
Risks Related to Our Businesses and Industries
We face intense competition. If we do not continue to innovate and provide products and services that are useful to users, we may not remain competitive, and our revenues and operating results could be adversely affected.
Our businesses are rapidly evolving, intensely competitive, and subject to changing technologies, shifting user needs, and frequent introductions of new products and services. Competing successfully depends heavily on our ability to accurately anticipate technology developments and deliver innovative, relevant and useful products, services, and technologies to the marketplace in a timely manner. As our businesses evolve, the competitive pressure to innovate will encompass a wider range of products and services. As a result, we must continue to invest significant resources in research and development, including through acquisitions, in order to enhance our technology and our existing products and services, and introduce new products and services that people can easily and effectively use.
We have many competitors in different industries. Our current and potential domestic and international competitors range from large and established companies to emerging start-ups. Some companies have longer operating histories and more established relationships with customers and users. They can use their experiences and resources in ways that could affect our competitive position, including by making acquisitions, continuing to invest heavily in research and development and in hiring talent, aggressively initiating intellectual property claims (whether or not meritorious), and continuing to compete aggressively for users, advertisers, customers, and content providers. Our competitors may be able to innovate and provide products and services faster than we can or may foresee the need for products and services before us.
In addition, new products and services, including those that incorporate or utilize artificial intelligence and machine learning, can raise new or exacerbate existing ethical, technological, legal, and other challenges, which may negatively affect our brands and demand for our products and services and adversely affect our revenues and operating results. Our operating results may also suffer if our innovations are not responsive to the needs of our users, advertisers, customers, and content providers; are not appropriately timed with market opportunities; or are not effectively brought to market. As technologies continue to develop, our competitors may be able to offer our users and/or customers experiences that are, or that are seen to be, substantially similar to or better than ours. This may force us to compete in different ways and expend significant resources in order to remain competitive. If our competitors are more successful than we are in developing compelling products or in attracting and retaining users, advertisers, customers, and content providers, our revenues and operating results could be adversely affected.
We generate a significant portion of our revenues from advertising, and reduced spending by advertisers or a loss of partners could harm our advertising business.
We generated over
85%
of total revenues from advertising in
2018
. Many of our advertisers, companies that distribute our products and services, digital publishers, and content partners can terminate their contracts with us at any time. Those partners may not continue to do business with us if we do not create more value (such as increased numbers of users or customers, new sales leads, increased brand awareness, or more effective monetization) than their available alternatives. For example, changes to our data privacy practices, as well as changes to third-party advertising policies or practices may affect the type of ads and/or manner of advertising that we are able to provide which could have an adverse effect on our business. If we do not provide superior value or deliver advertisements efficiently and competitively, our reputation could be affected, we could see a decrease in revenue from advertisers and/or experience other adverse effects to our business.
In addition, expenditures by advertisers tend to be cyclical, reflecting overall economic conditions and budgeting and buying patterns. Adverse macroeconomic conditions can also have a material negative effect on user activity and the demand for advertising and cause our advertisers to reduce the amounts they spend on advertising, which could adversely affect our revenues and advertising business.
We are subject to increasing regulatory scrutiny as well as changes in public policies governing a wide range of topics that may negatively affect our business.
We and other companies in the technology industry have experienced increased regulatory scrutiny recently. For instance, various regulatory agencies are reviewing aspects of our search and other businesses. This can lead to increased scrutiny from other regulators and legislators, that may affect our reputation, brand and third-party
7
|
Alphabet Inc.
|
|
relationships. Such reviews have and may in the future also result in substantial regulatory fines, changes to our business practices and other penalties, which could negatively affect our business and results of operations. We continue to cooperate with regulatory authorities around the world in investigations they are conducting with respect to our business.
Changes in social, political, and regulatory conditions or in laws and policies governing a wide range of topics may cause us to change our business practices. Further, our expansion into a variety of new fields also raises a number of new regulatory issues. These factors could negatively affect our business and results of operations in material ways.
Our ongoing investment in new businesses and new products, services, and technologies is inherently risky, and could disrupt our current operations.
We have invested and expect to continue to invest in new businesses, products, services, and technologies. The creation of Alphabet as a holding company in 2015 and the investments that we are making across various areas in Google and Other Bets are a reflection of our ongoing efforts to innovate and provide products and services that are useful to users. Our investments in Google and Other Bets span a wide range of industries. Such endeavors may involve significant risks and uncertainties, including distraction of management from our advertising and related business, use of alternative investment, governance or compensation structures, the fact that such offerings or strategies may not be commercially viable for an indefinite amount of time or at all, or may not result in adequate return of capital on our investments; and unidentified issues may not be discovered in our due diligence of such strategies and offerings which could cause us to fail to realize the anticipated benefits of such investments and incur unanticipated liabilities. Because these new ventures are inherently risky, no assurance can be given that such strategies and offerings will be successful and will not adversely affect our reputation, financial condition, and operating results.
The Internet is accessed through a variety of platforms and form factors that continue to evolve with the advancement of technology and user preferences. If manufacturers and users do not widely adopt versions of our search technology, products, or operating systems developed for these devices and modalities, our business could be adversely affected.
The number of people who access the Internet through devices other than desktop computers, including mobile phones, smartphones, laptops and tablets, video game consoles, voice-activated speakers, wearables, automobiles, and television set-top devices, is increasing dramatically. The functionality and user experience associated with some alternative devices and modalities may make the use of our products and services or the generation of advertising revenue through such devices more difficult (or just different), and the versions of our products and services developed for these devices may not be compatible or compelling to users, manufacturers, or distributors of alternative devices. Each manufacturer or distributor may establish unique technical standards for its devices, and our products and services may not be available on these devices as a result. Some manufacturers may also elect not to include our products on their devices. In addition, search queries are increasingly being undertaken via voice-activated speakers, apps, social media or other platforms, which could affect our search and
advertising business over time. As new devices and platforms are continually being released, it is difficult to predict the challenges we may encounter in adapting our products and services and developing competitive new products and services. We expect to continue to devote significant resources to the creation, support, and maintenance of products and services across multiple platforms and devices. If we are unable to attract and retain a substantial number of alternative device manufacturers, suppliers, distributors, developers, and users to our products and services, or if we are slow to develop products and technologies that are more compatible with alternative devices and platforms, we may fail to capture the opportunities available as consumers and advertisers continue to exist in a dynamic, multi-platform environment.
Our revenue growth rate could decline over time, and we anticipate downward pressure on our operating margin in the future.
Our revenue growth rate could decline and/or vary over time as a result of a number of factors, including increasing competition and the continued expansion of our business into a variety of new fields. Within our advertising business, changes in device mix, geographic mix, ongoing product and policy changes, product mix, and property mix and an increasing competition for advertising may also affect our revenue growth rate. We may also experience a decline in our revenue growth rate as our revenues increase to higher levels or if there is a decrease in the rate of adoption of our products, services, and technologies, among other factors.
In addition to a decline in our revenue growth rate, we may also experience downward pressure on our operating margin resulting from a variety of factors, such as the continued expansion of our business into a variety of new fields, including through products and services such as Google Cloud, Google Play, and hardware products where margins have generally been lower than those we generate from advertising. We may also experience downward pressure on our operating margins from increasing competition and increased costs for many aspects of our business, including within advertising where changes such as device mix and property mix can affect margin. The margin we earn on
8
|
Alphabet Inc.
|
|
revenues generated from our Google Network Members could also decrease in the future if we pay a larger percentage of advertising fees to them. We may also pay increased TAC to our distribution partners due to a number of factors. Additionally, our spend to promote new products and services or distribute certain products or an increased investment in our innovation efforts across the Company (within Google as well as our Other Bets businesses) may affect our operating margins.
Due to these factors and the evolving nature of our business, our historical revenue growth rate and historical operating margin may not be indicative of our future performance.
Our operating results may fluctuate, which makes our results difficult to predict and could cause our results to fall short of expectations.
Our operating results may fluctuate as a result of a number of factors, many outside of our control. As a result, comparing our operating results on a period-to-period basis may not be meaningful, and you should not rely on our past results as an indication of our future performance. Our quarterly, year-to-date, and annual expenses as a percentage of our revenues may differ significantly from our historical rates. Our operating results in future quarters may fall below expectations. Any of these events could cause our stock price to fall. Each of the risk factors listed in this section in addition to the following factors may affect our operating results:
|
•
|
Our ability to continue to attract and retain users and customers to our products and services.
|
|
•
|
Our ability to attract user and/or customer adoption of and generate significant revenues from new products, services, and technologies in which we have invested considerable time and resources.
|
|
•
|
Our ability to monetize (or generate revenues from) traffic on Google properties and our Google Network Members' properties across various devices.
|
|
•
|
Revenue fluctuations in our advertising business caused by changes in device mix, geographic mix, ongoing product and policy changes, product mix, and property mix.
|
|
•
|
The amount of revenues and expenses generated and incurred in currencies other than U.S. dollars, and our ability to manage the resulting risk through our foreign exchange risk management program.
|
|
•
|
The amount and timing of operating costs and expenses and capital expenditures related to the maintenance and expansion of our businesses, operations, and infrastructure.
|
|
•
|
Our focus on long-term goals over short-term results.
|
|
•
|
The results of our acquisitions, divestitures, and our investments in risky projects, including new businesses, products, services, and technologies.
|
|
•
|
Our ability to keep our products and services operational at a reasonable cost and without service interruptions.
|
|
•
|
The seasonal fluctuations in internet usage, advertising spending, and underlying business trends such as traditional retail seasonality. Our rapid growth has tended to mask the cyclicality and seasonality of our business. As our growth rate has slowed, the cyclicality and seasonality in our business has become more pronounced and caused our operating results to fluctuate.
|
Because our businesses are changing and evolving, our historical operating results may not be useful to you in predicting our future operating results.
A variety of new and existing laws and/or interpretations could harm our business.
We are subject to numerous U.S. and foreign laws and regulations covering a wide variety of subject matters. New laws and regulations (or new interpretations of existing laws and regulations) may make our products and services less useful, require us to incur substantial costs, expose us to unanticipated civil or criminal liability, or cause us to change our business practices. For example, our products and services are closely scrutinized by competition authorities around the world, which may limit our ability to pursue certain business models or offer certain products or services. Current and new patent laws may also affect the ability of companies, including us, to protect their innovations and defend against claims of patent infringement. Similarly, the Directive on Copyright in the Digital Single Market (DSM) in Europe, if passed in its proposed form, will increase the liability of large hosted platforms with respect to content uploaded by their users. It will also create a new property right in news publications that will limit the ability of online services to interact with or present such content. In addition to the DSM, other
changes to copyright laws being considered elsewhere, will, if passed, increase costs and require companies, including us, to change or cease offering certain existing services. Additionally, as the focus on data privacy and security increases globally, we are and will
9
|
Alphabet Inc.
|
|
continue to be subject to various and evolving laws. The costs of compliance with these laws and regulations are high and are likely to increase in the future.
Furthermore, many of these laws do not contemplate or address the unique issues raised by a number of our new businesses, products, services and technologies. In addition, the applicability and scope of these laws, as interpreted by the courts, remain uncertain.
Other recently passed laws and/or certain court decisions that could harm our business include, among others:
|
•
|
We rely on statutory safe harbors, as set forth in the Digital Millennium Copyright Act in the United States and the E-Commerce Directive in Europe, against copyright liability for various linking, caching, and hosting activities. Any legislation or court rulings affecting these safe harbors may adversely affect us.
|
|
•
|
Court decisions such as the judgment of the Court of Justice of the European Union on May 13, 2014 on the ‘right to be forgotten,’ which allows individuals to demand that Google remove search results about them in certain instances, may limit the content we can show to our users and impose significant operational burdens.
|
|
•
|
Court decisions that require Google to suppress content not just in the jurisdiction of the issuing court, but for all of our users worldwide, including locations where the content at issue is lawful. The Supreme Court of Canada issued such a decision against Google in June 2017, and others could treat its decision as persuasive. For instance, with respect to the ‘right to be forgotten,’ a follow-up case is pending before the Court of Justice of the European Union, which could result in an order to apply delisting actions under the ‘right to be forgotten’ worldwide.
|
|
•
|
Various U.S. and international laws that govern the distribution of certain materials to children and regulate the ability of online services to collect information from minors.
|
|
•
|
Various laws with regard to content removal and disclosure obligations, such as the Network Enforcement Act in Germany, which may affect our businesses and operations and may subject us to significant fines if such laws are interpreted and applied in a manner inconsistent with our practices.
|
|
•
|
Data protection laws passed by many states within the U.S. and by certain countries regarding notification to data subjects and/or regulators when there is a security breach of personal data.
|
|
•
|
The California Consumer Privacy Act of 2018 that comes into effect in January of 2020, and gives new data privacy rights to California residents and regulates the security of data in connection with internet connected devices.
|
|
•
|
Data localization laws, which generally mandate that certain types of data collected in a particular country be stored and/or processed within that country.
|
|
•
|
Privacy laws, which could be interpreted broadly thereby limiting product offerings and/or increasing costs.
|
Any failure on our part to comply with laws and regulations can result in negative publicity and diversion of management time and effort and may subject us to significant liabilities and other penalties.
We are regularly subject to claims, suits, government investigations, and other proceedings that may adversely affect our business and results of operations.
We are regularly subject to claims, suits, and government investigations involving competition, intellectual property, data privacy and security, consumer protection, tax, labor and employment, commercial disputes, content generated by our users, goods and services offered by advertisers or publishers using our platforms, and other matters. Due to our manufacturing and sale of an expanded suite of products, including hardware as well as our Google Cloud offerings, we may also be subject to a variety of claims including product warranty, product liability and consumer protection claims related to product defects, among other litigation. We may also be subject to claims involving health and safety, hazardous materials usage, other environmental concerns or if users or customers experience service disruptions, failures, or other issues. In addition, our businesses face intellectual property litigation, as discussed later, that exposes us to the risk of exclusion and cease and desist orders, which could limit our ability to sell products and services.
Such claims, suits, and government investigations are inherently uncertain. Regardless of the outcome, any of these types of legal proceedings can have an adverse effect on us because of legal costs, diversion of management resources, negative publicity and other factors. Determining reserves for our pending litigation is a complex, fact-intensive process that requires significant judgment. The resolution of one or more such proceedings has resulted and may in the future result in additional substantial fines and penalties that could adversely affect our business, consolidated financial position, results of operations, or cash flows in a particular period. These proceedings could also result in
10
|
Alphabet Inc.
|
|
reputational harm, criminal sanctions, consent decrees, or orders preventing us from offering certain features, functionalities, products, or services, requiring a change in our business practices or product recalls or corrections, or requiring development of non-infringing or otherwise altered products or technologies. Any of these consequences could adversely affect our business and results of operations.
We may be subject to legal liability associated with providing online services or content.
We host and provide a wide variety of services and products that enable users to exchange information, advertise products and services, conduct business, and engage in various online activities both domestically and internationally. The law relating to the liability of providers of these online services and products for activities of their users is still somewhat unsettled both within the U.S. and internationally. Claims have been threatened and have been brought against us for defamation, negligence, breaches of contract, copyright or trademark infringement, unfair competition, unlawful activity, tort, including personal injury, fraud, or other theories based on the nature and content of information that we publish or to which we provide links or that may be posted online or generated by us or by third parties, including our users. In addition, we are and have been and may again in the future be subject to domestic or international actions alleging that certain content we have generated or third-party content that we have made available within our products and services violates U.S. and international law.
We also place advertisements which are displayed on third-party publishers and advertising networks properties, and we offer third-party products, services, or content. We may be subject to claims concerning these products, services, or content by virtue of our involvement in marketing, branding, broadcasting, or providing access to them, even if we do not ourselves host, operate, provide, or provide access to these products, services, or content. Defense of any such actions could be costly and involve significant time and attention of our management and other resources, which may result in monetary liabilities or penalties, and may require us to change our business in an adverse manner.
Data privacy and security concerns relating to our technology and our practices could damage our reputation and deter current and potential users or customers from using our products and services. Bugs or defects in our products and services have occurred and may occur in the future, or our security measures could be breached, resulting in the improper use and/or disclosure of user data, and our services and systems are subject to attacks that could degrade or deny the ability of users and customers to access, or rely on information received about, our products and services. As a consequence, our products and services may be perceived as being insecure, users and customers may curtail or stop using our products and services, and we may incur significant legal, reputational, and financial exposure.
From time to time, concerns are expressed about whether our products, services, or processes compromise the privacy of users, customers, and others. Concerns about our practices with regard to the collection, use, disclosure, or security of personal information or other data privacy related matters, even if unfounded, could damage our reputation and adversely affect our operating results. Our policies and practices may change over time as users’ and customers’ expectations regarding privacy and their data changes.
Our products and services involve the storage and transmission of users’ and customers’ proprietary information, and bugs, theft, misuse, defects, vulnerabilities in our products and services, and security breaches expose us to a risk of loss of this information, improper use and disclosure of such information, litigation, and other potential liability. Systems failures, compromises of our security, failure to abide by our privacy policies, inadvertent disclosure that results in the release of our users’ data, or in our or our users’ inability to access such data, could result in government investigations and other liability, legislation or regulation, seriously harm our reputation and brand and, therefore, our business, and impair our ability to attract and retain users. We expect to continue to expend significant resources to maintain state-of-the-art security protections that shield against bugs, theft, misuse or security vulnerabilities or breaches.
We experience cyber attacks of varying degrees and other attempts to gain unauthorized access to our systems on a regular basis. Our security measures may in the future be breached due to employee error, malfeasance, system errors or vulnerabilities, including vulnerabilities of our vendors, suppliers, their products, or otherwise. Such breach or other unauthorized access, increased government surveillance, or attempts by outside parties to fraudulently induce employees, users, or customers to disclose sensitive information in order to gain access to our data or our users’ or customers’ data could result in significant legal and financial exposure, damage to our reputation, and a loss of confidence in the security of our products and services that could potentially have an adverse effect on our business. Because the techniques used to obtain unauthorized access, disable or degrade service, or sabotage systems change frequently, become more sophisticated, and often are not recognized until launched against a target, we may be unable to anticipate or detect these techniques or to implement adequate preventative measures. Cyber attacks could also compromise trade secrets and other sensitive information and result in such information being disclosed to others and becoming less valuable, which could negatively affect our business. If an actual or perceived breach of our security
11
|
Alphabet Inc.
|
|
occurs, the market perception of the effectiveness of our security measures could be harmed and we could lose users and customers.
While we have dedicated significant resources to privacy and security incident response, including dedicated worldwide incident response teams, our response process may not be adequate, may fail to accurately assess the severity of an incident, may not respond quickly enough, or may fail to sufficiently remediate an incident, among other issues. As a result, we may suffer significant legal, reputational, or financial exposure, which could adversely affect our business and results of operations.
Our business is subject to complex and rapidly evolving U.S. and international laws and regulations regarding privacy and data protection. Many of these laws and regulations are subject to change and uncertain interpretation and could result in claims, changes to our business practices, penalties, increased cost of operations, or declines in user growth or engagement, or otherwise harm our business.
Companies are under increased regulatory scrutiny relating to data privacy and security. Authorities around the world are considering a number of legislative and regulatory proposals concerning data protection, including measures to ensure that encryption of users’ data does not hinder law enforcement agencies’ access to that data. In addition, the interpretation and application of consumer and data protection laws in the U.S., Europe and elsewhere are often uncertain and in flux. It is possible that these laws may be interpreted and applied in a manner that is inconsistent with our data practices. These legislative and regulatory proposals, if adopted, and such interpretations could, in addition to the possibility of fines, result in an order requiring that we change our data practices, which could have an adverse effect on our business and results of operations. Complying with these various laws could cause us to incur substantial costs or require us to change our business practices in a manner adverse to our business.
Recent legal developments in Europe have created compliance uncertainty regarding certain transfers of personal data from Europe to the United States. For example, the General Data Protection Regulation (GDPR), became effective in the European Union (EU) beginning on May 25, 2018, and applies to all of our activities conducted from an establishment in the EU or related to products and services that we offer to EU users or customers, or the monitoring of their behavior in the EU. The GDPR subjects us to a range of new compliance obligations.
Ensuring compliance with the GDPR is an ongoing commitment which involves substantial costs, and it is possible that despite our efforts, governmental authorities or third parties will assert that our business practices fail to comply. We have been and may in the future be, subject to lawsuits alleging violations of the GDPR. If our operations are found to be in violation of the GDPR’s requirements, we may be required to change our business practices and/or be subject to significant civil penalties, business disruption, and reputational harm, any of which could have a material adverse effect on our business. In particular, serious breaches of the GDPR can result in administrative fines of up to the higher of 4% of annual worldwide revenues or €20 million. Fines of up to the higher of 2% of annual worldwide
revenues or €10 million can be levied for other specified violations.
In addition, the European Commission in July 2016 and the Swiss Government in January 2017 approved the EU-U.S. and the Swiss-U.S. Privacy Shield frameworks, respectively, which are designed to allow U.S. companies that self-certify to the U.S. Department of Commerce and publicly commit to comply with the Privacy Shield requirements to freely import personal data from the EU and Switzerland. However, these frameworks face a number of legal challenges and their validity remains subject to legal, regulatory and political developments in both Europe and the U.S. This has resulted in some uncertainty, and compliance obligations could cause us to incur costs or require us to change our business practices in a manner adverse to our business.
We are, and may in the future be, subject to intellectual property or other claims, which are costly to defend, could result in significant damage awards, and could limit our ability to use certain technologies in the future.
Many companies, in particular those in internet, technology and media own large numbers of patents, copyrights, trademarks, and trade secrets and frequently enter into litigation based on allegations of infringement or other violations of intellectual property rights. In addition, patent holding companies may continue to seek to monetize patents they have purchased or otherwise obtained by bringing claims against us, whether such claims are meritorious or not. As we have grown, the number of intellectual property claims against us has increased and may continue to increase as we develop new products, services, and technologies.
We have had patent, copyright, trade secret, and trademark infringement lawsuits filed against us claiming that certain of our products, services, and technologies infringe the intellectual property rights of others. Third parties have also sought broad injunctive relief against us by filing claims in U.S. and international courts and the U.S. International Trade Commission (ITC) for exclusion and cease and desist orders, which could limit our ability to sell our products or services in the U.S. or elsewhere if our products or services or those of our customers or suppliers are found to
12
|
Alphabet Inc.
|
|
infringe the intellectual property subject to the claims. Adverse results in any of these lawsuits may include awards of substantial monetary damages, costly royalty or licensing agreements (if licenses are available at all), or orders preventing us from offering certain features, functionalities, products, or services, and may also cause us to change our business practices and require development of non-infringing products, services or technologies, which could result in a loss of revenues for us and otherwise harm our business.
Many of our agreements with our customers and partners, including certain suppliers, require us to defend against certain intellectual property infringement claims and/or indemnify them for certain intellectual property infringement claims against them, which could result in increased costs for defending such claims or significant damages if there were an adverse ruling in any such claims. Such customers and partners may also discontinue the use of our products, services, and technologies, as a result of injunctions or otherwise, which could result in loss of revenues and adversely affect our business. Moreover, intellectual property indemnities provided to us by our suppliers, when obtainable, may not cover all damages and losses suffered by us and our customers arising from intellectual property infringement claims brought against us. Furthermore, in connection with our divestitures, we have agreed, and may in the future agree, to provide indemnification for certain potential liabilities, including those associated with intellectual property claims.
Regardless of their merits, intellectual property claims are often time consuming, expensive to litigate or settle, and cause significant diversion of management attention. To the extent such claims are successful, they may have an adverse effect on our business, including our product and service offerings, consolidated financial position, results of operations, or cash flows.
Our intellectual property rights are valuable, and any inability to protect them could reduce the value of our products, services and brand as well as affect our ability to compete.
Our patents, trademarks, trade secrets, copyrights, and other intellectual property rights are important assets for us. Various events outside of our control pose a threat to our intellectual property rights, as well as to our products, services and technologies. For example, effective intellectual property protection may not be available in every country in which our products and services are distributed or made available through the Internet. Also, the efforts we have taken to protect our proprietary rights may not be sufficient or effective. Although we seek to obtain patent protection for our innovations, it is possible we may not be able to protect some of these innovations. Moreover, we may not have adequate patent or copyright protection for certain innovations that later turn out to be important. Furthermore, there is always the possibility, despite our efforts, that the scope of the protection gained will be insufficient or that an issued patent may be deemed invalid or unenforceable.
We also seek to maintain certain intellectual property as trade secrets. The secrecy of such trade secrets and other sensitive information could be compromised by outside parties, or by our employees, which could cause us to lose the competitive advantage resulting from these trade secrets. We also face risks associated with our trademarks. For example, there is a risk that the word “Google” could become so commonly used that it becomes synonymous with the word “search.” Some courts have ruled that "Google" is a protectable trademark, however it is possible that other courts, particularly those outside of the United States, may reach a different determination. If this happens, we could lose protection for this trademark, which could result in other people using the word “Google” to refer to their own products, thus diminishing our brand.
Any significant impairment of our intellectual property rights could harm our business and our ability to compete. Also, protecting our intellectual property rights is costly and time consuming. Any increase in the unauthorized use of our intellectual property could make it more expensive to do business and harm our operating results.
Acquisitions, joint ventures, investments, and divestitures could result in operating difficulties, dilution, and other consequences that may adversely affect our business and results of operations.
Acquisitions, joint ventures, investments and divestitures are important elements of our overall corporate strategy and use of capital, and these transactions could be material to our financial condition and results of operations. We expect to continue to evaluate and enter into discussions regarding a wide array of potential strategic transactions. Effecting these strategic transactions could create unforeseen operating difficulties and expenditures. The areas where we face risks include, among others:
|
•
|
Diversion of management time and focus from operating our business to challenges related to acquisitions and other strategic transactions.
|
|
•
|
Failure to successfully further develop the acquired business or technology.
|
|
•
|
Implementation or remediation of controls, procedures, and policies at the acquired company.
|
13
|
Alphabet Inc.
|
|
|
•
|
Integration of the acquired company's accounting, human resource, and other administrative systems, and coordination of product, engineering, and sales and marketing functions.
|
|
•
|
Transition of operations, users, and customers onto our existing platforms.
|
|
•
|
Failure to obtain required approvals on a timely basis, if at all, from governmental authorities, or conditions placed upon approval that could, among other things, delay or prevent us from completing a transaction, or otherwise restrict our ability to realize the expected financial or strategic goals of an acquisition or other strategic transaction.
|
|
•
|
In the case of foreign acquisitions, the need to integrate operations across different cultures and languages and to address the particular economic, currency, political, and regulatory risks associated with specific countries.
|
|
•
|
Cultural challenges associated with integrating employees from the acquired company into our organization, and retention of employees from the businesses we acquire.
|
|
•
|
Liability for activities of the acquired company before the acquisition, including patent and trademark infringement claims, privacy issues, violations of laws, commercial disputes, tax liabilities, and other known and unknown liabilities.
|
|
•
|
Litigation or other claims in connection with the acquired company, including claims from terminated employees, customers, former stockholders, or other third parties.
|
Our failure to address these risks or other problems encountered in connection with our past or future acquisitions and other strategic transactions could cause us to fail to realize their anticipated benefits, incur unanticipated liabilities, and harm our business generally.
Our acquisitions and other strategic transactions could also result in dilutive issuances of our equity securities, the incurrence of debt, contingent liabilities, or amortization expenses, or impairment of goodwill and/or purchased long-lived assets, and restructuring charges, any of which could harm our financial condition or results. Also, the anticipated benefits or value of our acquisitions and other strategic transactions may not materialize. In connection with our divestitures, we have agreed, and may in the future agree, to provide indemnification for certain potential liabilities, which may adversely affect our financial condition or results.
Our business depends on strong brands, and failing to maintain and enhance our brands would hurt our ability to expand our base of users, advertisers, customers, content providers, and other partners.
Our strong brands have significantly contributed to the success of our business. Maintaining and enhancing the brands within Google and Other Bets increases our ability to enter new categories and launch new and innovative products that better serve the needs of our users, advertisers, customers, content providers, and other partners. Our brands may be negatively affected by a number of factors, including, among others, reputational issues, third-party content shared on our platforms, data privacy issues and developments, and product or technical performance failures. For example, if we fail to appropriately respond to the sharing of objectionable content on our services or objectionable practices by advertisers, or to otherwise adequately address user concerns, our users may lose confidence in our brands. Our brands may also be negatively affected by the use of our products or services to disseminate information that is deemed to be false or misleading.
Furthermore, if we fail to maintain and enhance equity in our brands, our business, operating results, and financial condition may be materially and adversely affected. Our success will depend largely on our ability to remain a technology leader and continue to provide high-quality, innovative products and services that are truly useful and play a meaningful role in people’s everyday lives.
We face a number of manufacturing and supply chain risks that, if not properly managed, could adversely affect our financial results and prospects.
We face a number of risks related to manufacturing and supply chain management. These manufacturing and supply chain risks could affect our ability to supply both our products and our internet-based services.
We rely on third parties to manufacture many of our assemblies and finished products, third-party arrangements for the design of some components and parts, and third party distributors, including cellular network carriers. Our business could be negatively affected if we are not able to engage third parties with the necessary capabilities or capacity on reasonable terms, or if those we engage fail to meet their obligations (whether due to financial difficulties or other reasons), or make adverse changes in the pricing or other material terms of our arrangements with them.
14
|
Alphabet Inc.
|
|
We may experience supply shortages and price increases driven by raw material availability, manufacturing capacity, labor shortages, industry allocations, natural disasters, the effects of climate change (such as sea level rise, drought, flooding, wildfires, and increased storm severity), and significant changes in the financial or business condition of our suppliers. We may experience shortages or other supply chain disruptions in the future that could negatively affect our operations. In addition, some of the components we use in our technical infrastructure and products are available only from a single source or limited sources, and we may not be able to find replacement vendors on favorable terms or at all in the event of a supply chain disruption. In addition, a significant hardware supply interruption could delay critical data center upgrades or expansions.
We may enter into long term contracts that commit us to significant terms and conditions of supply. We may be liable for material and product that is not consumed due to market acceptance, technological change, obsolescences, quality, product recalls, and warranty issues. For instance, because many of our hardware supply contracts have volume-based pricing or minimum purchase requirements, if the volume of our hardware sales decreases or does not reach projected targets, we could face increased materials and manufacturing costs or other financial liabilities that could make our products more costly per unit to manufacture and therefore less competitive and negatively affect our financial results. Furthermore, certain of our competitors may negotiate more favorable contractual terms based on volume and other commitments that may provide them with competitive advantages and may affect our supply.
The products and services we sell or offer may have quality issues resulting from the design or manufacture of the product, or from the software used. Sometimes, these issues may be caused by components we purchase from other manufacturers or suppliers. If the quality of our products and services does not meet our users’ and/or customers’ expectations or our products or services are found to be defective, then our sales and operating earnings, and ultimately our reputation, could be negatively affected.
We also require our suppliers and business partners to comply with law and, where applicable, our company policies, such as the Google Supplier Code of Conduct, regarding workplace and employment practices, data security, environmental compliance and intellectual property licensing, but we do not control them or their practices. If any of them violates laws or implements practices regarded as unethical, we could experience supply chain disruptions, canceled orders, terminations of or damage to key relationships, and damage to our reputation. If any of them fails to procure necessary license rights to third-party intellectual property, legal action could ensue that could affect the saleability of our products and expose us to financial obligations to third parties.
Web spam, including content farms, and other violations of our guidelines could affect the quality of our services, which could damage our reputation and deter our current and potential users from using our products and services.
Web spam refers to websites that violate or attempt to violate our guidelines or that otherwise seek to inappropriately rank higher in search results than our search engine's assessment of their relevance and utility would rank them. Web spam may also affect the quality of content posted on our platforms and may manipulate them to display false, misleading or undesirable content.
Although English-language web spam in our search results has been significantly reduced, and web spam in most other languages is limited, we expect web spammers will continue to seek ways to improve their rankings inappropriately. We continuously combat web spam in our search results, including through indexing technology that makes it harder for spam-like, less useful web content to rank highly. We also continue to invest in and deploy proprietary technology to detect and prevent web spam from abusing our platforms.
We also face other challenges from web spam such as low-quality and irrelevant content websites, including content farms, which are websites that generate large quantities of low-quality content to help them improve their search rankings. We are continually launching algorithmic changes focused on low-quality websites.
We, like others in the industry, face other violations of our guidelines, including sophisticated attempts by bad actors to manipulate our advertising systems to fraudulently generate revenues for themselves or others, or to otherwise generate traffic that does not represent genuine user interest or intent. While we invest significantly in efforts to detect and prevent invalid traffic, including attempts by bad actors to generate income fraudulently, we may be unable to adequately detect and prevent such abuses in the future.
If we are subject to an increasing number of web spam, including content farms or other violations of our guidelines, this could hurt our reputation for delivering relevant information or reduce user traffic to our websites or their use of our platforms, which may adversely affect our financial condition or results.
Interruption, interference with or failure of our information technology and communications systems could hurt our ability to effectively provide our products and services, which could damage our reputation and harm our operating results.
15
|
Alphabet Inc.
|
|
The availability of our products and services depends on the continuing operation of our information technology and communications systems. Our systems are vulnerable to damage, interference or interruption from terrorist attacks, natural disasters, the effects of climate change (such as sea level rise, drought, flooding, wildfires, and increased storm severity), power loss, telecommunications failures, computer viruses, computer denial of service attacks, or other attempts to harm or access our systems. Some of our data centers are located in areas with a high risk of major earthquakes or other natural disasters. Our data centers are also subject to break-ins, sabotage, and intentional acts of vandalism, and to potential disruptions if the operators of certain of these facilities have financial difficulties. Some of our systems are not fully redundant, and our disaster recovery planning cannot account for all eventualities.
The occurrence of a natural disaster, a decision to close a facility we are using, or other unanticipated problems at our data centers could result in lengthy interruptions in our service. In addition, our products and services are highly technical and complex and may contain errors or vulnerabilities, which could result in interruptions in our services or the failure of our systems.
Our international operations expose us to additional risks that could harm our business, operating results, and financial condition.
Our international operations are significant to our revenues and net income, and we plan to continue to grow internationally. International revenues accounted for approximately
54%
of our consolidated revenues in
2018
. In addition to risks described elsewhere in this section, our international operations expose us to other risks, including the following:
|
•
|
Restrictions on foreign ownership and investments, and stringent foreign exchange controls that might prevent us from repatriating cash earned in countries outside the U.S.
|
|
•
|
Import and export requirements, tariffs, trade disputes and barriers, and customs classifications that may prevent us from offering products or providing services to a particular market and may increase our operating costs.
|
|
•
|
Longer payment cycles in some countries, increased credit risk, and higher levels of payment fraud.
|
|
•
|
Evolving foreign laws and legal systems, including those that may occur as a result of the United Kingdom's potential withdrawal from the European Union ("Brexit"). Brexit may adversely affect global economic and market conditions and could contribute to volatility in the foreign
exchange markets, which we may be unable to effectively manage through our foreign exchange risk management program. Brexit may also adversely affect our revenues and could subject us to new regulatory costs and challenges, in addition to other adverse effects that we are unable to effectively anticipate.
|
|
•
|
Uncertainty regarding liability for services and content, including uncertainty as a result of local laws and lack of legal precedent.
|
|
•
|
Different employee/employer relationships, existence of workers' councils and labor unions, and other challenges caused by distance, language, and cultural differences, making it harder to do business in certain jurisdictions.
|
Changes in international local political, economic, regulatory, tax, social, and labor conditions may also harm our business, and compliance with complex international and U.S. laws and regulations that apply to our international operations increases our cost of doing business. These numerous and sometimes conflicting laws and regulations include, among others, internal control and disclosure rules, privacy and data protection requirements, anti-corruption laws, such as the U.S. Foreign Corrupt Practices Act, and other local laws prohibiting certain payments to governmental officials, and competition regulations, among others. Violations of these laws and regulations could result in fines and penalties, criminal sanctions against us, our officers, or our employees, prohibitions on the conduct of our business and on our ability to offer our products and services in one or more countries, and could also materially affect our brand, our international growth efforts, our ability to attract and retain employees, our business, and our operating results. Although we have implemented policies and procedures designed to ensure compliance with these laws and regulations, there can be no assurance that our employees, contractors, or agents will not violate our policies.
Since we conduct business in currencies other than U.S. dollars but report our financial results in U.S. dollars, we face exposure to fluctuations in foreign currency exchange rates. Although we hedge a portion of our international currency exposure, significant fluctuations in exchange rates between the U.S. dollar and foreign currencies may adversely affect our revenues and earnings. Hedging programs are also inherently risky and could expose us to additional risks that could adversely affect our financial condition and results of operations.
If we were to lose the services of key personnel, we may not be able to execute our business strategy.
16
|
Alphabet Inc.
|
|
Our future success depends in a large part upon the continued service of key members of our senior management team. In particular, Larry Page and Sergey Brin are critical to the overall management of Alphabet and its subsidiaries, and they, along with Sundar Pichai, the Chief Executive Officer of Google, play an important role in the development of our technology. They also play a key role in maintaining our culture and setting our strategic direction. All of our executive officers and key employees are at-will employees, and we do not maintain any key-person life insurance policies. The loss of key personnel could seriously harm our business.
We rely on highly skilled personnel and, if we are unable to retain or motivate key personnel, hire qualified personnel, or maintain our corporate culture, we may not be able to grow effectively.
Our performance largely depends on the talents and efforts of highly skilled individuals. Our future success depends on our continuing ability to identify, hire, develop, motivate, and retain highly skilled personnel for all areas of our organization. Competition in our industry for qualified employees is intense, and certain of our competitors have directly targeted our employees. In addition, our compensation arrangements, such as our equity award programs, may not always be successful in attracting new employees and retaining and motivating our existing employees. Our continued ability to compete effectively depends on our ability to attract new employees and to retain and motivate our existing employees.
In addition, we believe that our corporate culture fosters innovation, creativity, and teamwork. As our organization grows, and we are required to implement more complex organizational management structures, particularly in light of our holding company structure, we may find it increasingly difficult to maintain the beneficial aspects of our corporate culture. This could negatively affect our future success.
Our business depends on continued and unimpeded access to the Internet by us and our users. Internet access providers may be able to restrict, block, degrade, or charge for access to certain of our products and services, which could lead to additional expenses and the loss of users and advertisers.
Our products and services depend on the ability of our users to access the Internet, and certain of our products require significant bandwidth to work effectively. Currently, this access is provided by companies that have significant market power in the broadband and internet access marketplace, including incumbent telephone companies, cable companies, mobile communications companies, and government-owned service providers. Some of these providers have taken, or have stated that they may take measures, including legal actions, that could degrade, disrupt, or increase the cost of user access to certain of our products by restricting or prohibiting the use of their infrastructure to support or facilitate our offerings, or by charging increased fees to us or our users to provide our offerings. Some jurisdictions have adopted regulations prohibiting certain forms of discrimination by Internet access providers; however, substantial uncertainty exists in the United States and elsewhere regarding such protections. For example, in the United States the Federal Communications Commission repealed net neutrality rules effective June 11, 2018, which could lead internet access providers to restrict, block, degrade, or charge for access to certain of our products and services. In addition, in some jurisdictions, our products and services have been subject to government-initiated restrictions or blockages. Such interference could result in a loss of existing users, customers and advertisers, goodwill, and increased costs, and could impair our ability to attract new users, customers and advertisers, thereby harming our revenues and growth.
New and existing technologies could affect our ability to customize ads and/or could block ads online, which would harm our business.
Technologies have been developed to make customizable ads more difficult or to block the display of ads altogether and some providers of online services have integrated technologies that could potentially impair the core functionality of third-party digital advertising. Most of our Google revenues are derived from fees paid to us in connection with the display of ads online. As a result, such technologies and tools could adversely affect our operating results.
We are exposed to fluctuations in the market values of our investments.
Given the global nature of our business, we have investments both domestically and internationally. Market values of these investments can be negatively affected by liquidity, credit deterioration or losses, financial results, foreign exchange rates, changes in interest rates, including changes that may result from the implementation of new benchmark rates that replace LIBOR, the effect of new or changing regulations, or other factors.
Due to the adoption of ASU 2016-01 “Financial Instruments; Overall (Subtopic 825-10): Recognition and Measurement of Financial Assets and Financial Liabilities” in January 2018, we adjust the carrying value of our non-marketable equity securities to fair value for observable transactions of identical or similar investments of the same issuer and impairment. All gains and losses on non-marketable equity securities, realized and unrealized, are recognized in other income (expense), which increases the volatility of our other income (expense).
17
|
Alphabet Inc.
|
|
As a result of these factors, the value or liquidity of our cash equivalents, as well as our marketable and non-marketable securities could decline and result in a material impairment, which could materially adversely affect our financial condition and operating results.
We could be subject to changes in tax rates, the adoption of new U.S. or international tax legislation, or exposure to additional tax liabilities.
Our future income taxes could be adversely affected by earnings being lower than anticipated in jurisdictions that have lower statutory tax rates and higher than anticipated in jurisdictions that have higher statutory tax rates, the net gains and losses recognized by legal entities on certain hedges and related hedged intercompany and other transactions under our foreign exchange risk management program, changes in the valuation of our deferred tax assets or liabilities, or changes in tax laws, regulations, or accounting principles, as well as certain discrete items.
In addition, we are subject to regular review and audit by both domestic and foreign tax authorities. As a result, we have received, and may in the future receive, assessments in multiple jurisdictions on various tax-related assertions, examples include transfer pricing adjustments or permanent establishment. Any adverse outcome of such a review or audit could have a negative effect on our operating results and financial condition. In addition, the determination of our worldwide provision for income taxes and other tax liabilities requires significant judgment, and there are many transactions and calculations where the ultimate tax determination is uncertain. Although we believe our estimates are reasonable, the ultimate tax outcome may differ from the amounts recorded in our financial statements and may materially affect our financial results in the period or periods for which such determination is made.
Furthermore, due to shifting economic and political conditions, tax policies, laws or rates in various jurisdictions may be subject to significant change, which could materially affect our financial position and results of operations.
Risks Related to Ownership of Our Stock
The trading price for our Class A common stock and non-voting Class C capital stock may continue to be volatile.
The trading price of our stock has at times experienced substantial price volatility and may continue to be volatile. For example, from January 1, 2018 through December 31, 2018, the closing price of our Class A common stock ranged from $984.66 per share to $1,285.50 per share, and the closing price of our Class C capital stock ranged from $976.21 to $1,268.32 per share.
In addition to the factors discussed in this report, the trading price of our Class A common stock and Class C capital stock may fluctuate widely in response to various factors, many of which are beyond our control, including, among others:
|
•
|
Quarterly variations in our results of operations or those of our competitors.
|
|
•
|
Announcements by us or our competitors of acquisitions, divestitures, investments, new products, significant contracts, commercial relationships, or capital commitments.
|
|
•
|
Recommendations by securities analysts or changes in earnings estimates.
|
|
•
|
Announcements about our earnings that are not in line with analyst expectations, the risk of which is enhanced because it is our policy not to give guidance on earnings.
|
|
•
|
Announcements by our competitors of their earnings that are not in line with analyst expectations.
|
|
•
|
Commentary by industry and market professionals about our products, strategies, and other matters affecting our business and results, regardless of its accuracy.
|
|
•
|
The volume of shares of Class A common stock and Class C capital stock available for public sale.
|
|
•
|
Sales of Class A common stock and Class C capital stock by us or by our stockholders (including sales by our directors, executive officers, and other employees).
|
|
•
|
Short sales, hedging, and other derivative transactions on shares of our Class A common stock and Class C capital stock.
|
|
•
|
The perceived values of Class A common stock and Class C capital stock relative to one another.
|
|
•
|
Any share repurchase program.
|
In addition, the stock market in general, which can be affected by various factors, including overall economic and political conditions, and the market for technology companies in particular, have experienced extreme price and volume fluctuations that have often been unrelated or disproportionate to the operating performance of those companies.
18
|
Alphabet Inc.
|
|
These broad market and industry factors may harm the market price of our Class A common stock and our Class C capital stock regardless of our actual operating performance.
We cannot guarantee that any share repurchase program will be fully consummated or that any share repurchase program will enhance long-term stockholder value, and share repurchases could increase the volatility of the price of our stock and could diminish our cash reserves.
In 2016 and 2018, the board of directors of Alphabet authorized the company to repurchase up to $7.0 billion and $8.6 billion of its Class C capital stock, respectively. The 2016 authorization was completed in 2018. As of
December 31, 2018
, $1.7 billion remains available for repurchase. In January 2019, our board of directors authorized the repurchase of up to an additional $12.5 billion of our Class C capital stock. Our repurchase program does not have an expiration date and does not obligate Alphabet to repurchase any specific dollar amount or to acquire any specific number of shares. Our share repurchase program could affect the price of our stock and increase volatility and may be suspended or terminated at any time, which may result in a decrease in the trading price of our stock.
The concentration of our stock ownership limits our stockholders’ ability to influence corporate matters.
Our Class B common stock has 10 votes per share, our Class A common stock has one vote per share, and our Class C capital stock has no voting rights. As of December 31, 2018, Larry Page, Sergey Brin, and Eric E. Schmidt beneficially owned approximately 92.8% of our outstanding Class B common stock, which represented approximately 56.5% of the voting power of our outstanding common stock. Larry, Sergey, and Eric therefore have significant influence over management and affairs and over all matters requiring stockholder approval, including the election of directors and significant corporate transactions, such as a merger or other sale of our company or our assets, for the foreseeable future. In addition, because our Class C capital stock carries no voting rights (except as required by applicable law), the issuance of the Class C capital stock, including in future stock-based acquisition transactions and to fund employee equity incentive programs, could prolong the duration of Larry, Sergey and Eric’s current relative ownership of our voting power and their ability to elect all of our directors and to determine the outcome of most matters submitted to a vote of our stockholders. This concentrated control limits or severely restricts our stockholders’ ability to influence corporate matters and, as a result, we may take actions that our stockholders do not view as beneficial. As a result, the market price of our Class A common stock and our Class C capital stock could be adversely affected.
Provisions in our charter documents and under Delaware law could discourage a takeover that stockholders may consider favorable.
Provisions in Alphabet’s certificate of incorporation and bylaws may have the effect of delaying or preventing a change of control or changes in our management. These provisions include the following:
|
•
|
Our certificate of incorporation provides for a tri-class capital stock structure. As a result of this structure, Larry, Sergey, and Eric have significant influence over all matters requiring stockholder approval, including the election of directors and significant corporate transactions, such as a merger or other sale of our company or our assets. This concentrated control could discourage others from initiating any potential merger, takeover, or other change of control transaction that other stockholders may view as beneficial. As noted above, the issuance of the Class C capital stock could have the effect of prolonging the influence of Larry, Sergey, and Eric.
|
|
•
|
Our board of directors has the right to elect directors to fill a vacancy created by the expansion of the board of directors or the resignation, death, or removal of a director, which prevents stockholders from being able to fill vacancies on our board of directors.
|
|
•
|
Our stockholders may not act by written consent. As a result, a holder, or holders, controlling a majority of our capital stock would not be able to take certain actions without holding a stockholders' meeting.
|
|
•
|
Our certificate of incorporation prohibits cumulative voting in the election of directors. This limits the ability of minority stockholders to elect director candidates.
|
|
•
|
Stockholders must provide advance notice to nominate individuals for election to the board of directors or to propose matters that can be acted upon at a stockholders’ meeting. These provisions may discourage or deter a potential acquirer from conducting a solicitation of proxies to elect the acquirer's own slate of directors or otherwise attempting to obtain control of our company.
|
|
•
|
Our board of directors may issue, without stockholder approval, shares of undesignated preferred stock. The ability to issue undesignated preferred stock makes it possible for our board of directors to issue preferred stock with voting or other rights or preferences that could impede the success of any attempt to acquire us.
|
19
|
Alphabet Inc.
|
|
As a Delaware corporation, we are also subject to certain Delaware anti-takeover provisions. Under Delaware law, a corporation may not engage in a business combination with any holder of 15% or more of its outstanding voting stock unless the holder has held the stock for three years or, among other things, the board of directors has approved the transaction. Our board of directors could rely on Delaware law to prevent or delay an acquisition of us.
Risk Related to Our Holding Company Reorganization
As a holding company, Alphabet is dependent on the operations and funds of its subsidiaries.
Alphabet is a holding company with no business operations of its own. Alphabet’s most significant assets are the outstanding equity interests in its subsidiaries, including Google, that are each separate and distinct legal entities. As a result of our holding company structure, we rely on cash flows from subsidiaries to meet our obligations, including to service any debt obligations of Alphabet. Our subsidiaries may be restricted in their ability to pay cash dividends or to make other distributions to Alphabet and therefore, our ability to meet our obligations may be adversely affected by such restrictions.
|
ITEM 1B.
|
UNRESOLVED STAFF COMMENTS
|
Not applicable.
|
ITEM 2.
|
PROPERTIES
|
Our headquarters are located in Mountain View, California. We also own and lease office and building space in the surrounding areas near our headquarters, which in the aggregate (including our headquarters) represent approximately
11.2 million
square feet of office/building space and approximately
fifty-nine
acres of developable land to accommodate anticipated future growth. In addition, we own and lease office/building space and research and development sites around the world, primarily in North America, Europe, South America, and Asia. We own and operate data centers in the U.S., Europe, South America, and Asia. We believe our existing facilities, both owned and leased, are in good condition and suitable for the conduct of our business.
|
ITEM 3.
|
LEGAL PROCEEDINGS
|
For a description of our material pending legal proceedings, please see
Note 9
“Commitments and Contingencies - Legal Matters” of the Notes to Consolidated Financial Statements included in Item 8 of this Annual Report on Form 10-K, which is incorporated herein by reference.
|
ITEM 4.
|
MINE SAFETY DISCLOSURES
|
Not applicable.
20
|
Alphabet Inc.
|
|
PART II
|
ITEM 5.
|
MARKET FOR REGISTRANT’S COMMON EQUITY, RELATED STOCKHOLDER MATTERS AND ISSUER PURCHASES OF EQUITY SECURITIES
|
As of October 2, 2015, Alphabet Inc. became the successor issuer of Google Inc. pursuant to Rule 12g-3(a) under the Exchange Act. Our Class A common stock has been listed on the Nasdaq Global Select Market under the symbol “GOOG” since August 19, 2004 and under the symbol "GOOGL" since April 3, 2014. Prior to August 19, 2004, there was no public market for our stock. Our Class B common stock is neither listed nor traded. Our Class C capital stock has been listed on the Nasdaq Global Select Market under the symbol “GOOG” since April 3, 2014.
Holders of Record
As of
December 31, 2018
, there were approximately
2,026
and
2,195
stockholders of record of our Class A common stock and Class C capital stock, respectively. Because many of our shares of Class A common stock and Class C capital stock are held by brokers and other institutions on behalf of stockholders, we are unable to estimate the total number of stockholders represented by these record holders. As of
December 31, 2018
, there were approximately
65
stockholders of record of our Class B common stock.
Dividend Policy
We have never declared or paid any cash dividend on our common or capital stock. We do not expect to pay any cash dividends in the foreseeable future.
Issuer Purchases of Equity Securities
The following table presents information with respect to Alphabet's repurchases of Class C capital stock during the quarter ended
December 31, 2018
:
|
Period
|
Total Number of Shares Purchased
(in thousands) (1) |
Average Price Paid per Share
(2)
|
Total Number of Shares Purchased as Part of Publicly Announced Programs
(in thousands) (1) |
Approximate Dollar Value of Shares that May Yet Be Purchased Under the Program
(in millions) |
||||||||||
|
October 1 - 31
|
830
|
|
$
|
1,115.81
|
|
830
|
|
$
|
3,412
|
|
||||
|
November 1 - 30
|
859
|
|
$
|
1,054.22
|
|
859
|
|
$
|
2,506
|
|
||||
|
December 1 - 31
|
781
|
|
$
|
1,048.23
|
|
781
|
|
$
|
1,688
|
|
||||
|
Total
|
2,470
|
|
$
|
1,073.02
|
|
2,470
|
|
|||||||
|
(1)
|
In January 2018, the board of directors of Alphabet authorized the company to repurchase up to
$8.6 billion
of its Class C capital stock.
The repurchases are being executed from time to time, subject to general business and market conditions and other investment opportunities, through open market purchases or privately negotiated transactions, including through Rule 10b5-1 plans. The repurchase program does not have an expiration date. See
Note 10
in Part II, Item 8 of this Annual Report on Form 10-K for additional information related to share repurchases.
|
|
(2)
|
Average price paid per share includes costs associated with the repurchases.
|
21
|
Alphabet Inc.
|
|
Stock Performance Graphs
The graph below matches Alphabet Inc. Class A's cumulative 5-Year total shareholder return on common stock with the cumulative total returns of the S&P 500 index, the NASDAQ Composite index, and the RDG Internet Composite index. The graph tracks the performance of a $100 investment in our common stock and in each index (with the reinvestment of all dividends) from
December 31, 2013
to
December 31, 2018
. The returns shown are based on historical results and are not intended to suggest future performance.
COMPARISON OF 5 YEAR CUMULATIVE TOTAL RETURN*
ALPHABET INC. CLASS A COMMON STOCK
Among Alphabet Inc., the S&P 500 Index, the
NASDAQ Composite Index, and the RDG Internet Composite Index
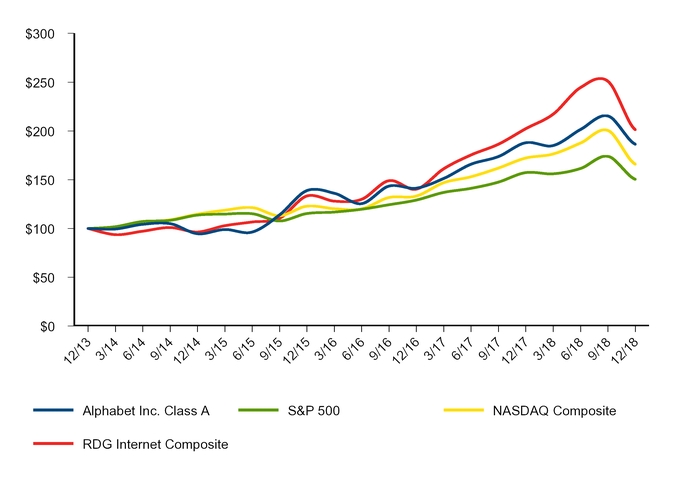
*$100 invested on
December 31, 2013
in stock or index, including reinvestment of dividends. Fiscal year ending December 31.
Copyright
©
2015 S&P, a division of The McGraw-Hill Companies Inc. All rights reserved.
22
|
Alphabet Inc.
|
|
The graph below matches Alphabet Inc. Class C's cumulative 57-Month total shareholder return on capital stock with the cumulative total returns of the S&P 500 index, the NASDAQ Composite index, and the RDG Internet Composite index. The graph tracks the performance of a $100 investment in our Class C capital stock and in each index (with the reinvestment of all dividends) from
April 3, 2014
to
December 31, 2018
. The returns shown are based on historical results and are not intended to suggest future performance.
COMPARISON OF CUMULATIVE TOTAL RETURN*
ALPHABET INC. CLASS C CAPITAL STOCK
Among Alphabet Inc., the S&P 500 Index, the
NASDAQ Composite Index, and the RDG Internet Composite Index
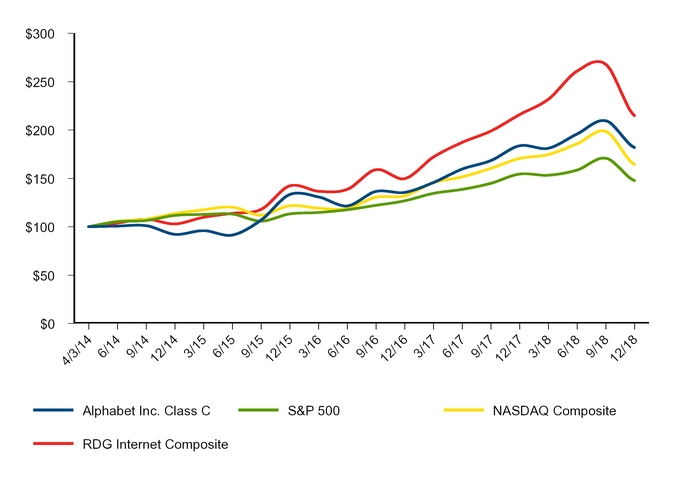
*$100 invested on
April 3, 2014
in stock or in index, including reinvestment of dividends. Fiscal year ending December 31.
Copyright
©
2015 S&P, a division of The McGraw-Hill Companies Inc. All rights reserved.
23
|
Alphabet Inc.
|
|
|
ITEM 6.
|
SELECTED FINANCIAL DATA
|
The following selected consolidated financial data should be read in conjunction with Item 7 “Management’s Discussion and Analysis of Financial Condition and Results of Operations” and our consolidated financial statements and the related notes appearing in Item 8 “Financial Statements and Supplementary Data” of this Annual Report on Form 10-K. The historical results are not necessarily indicative of the results to be expected in any future period.
|
|
Year Ended December 31,
|
||||||||||||||||||
|
|
2014
|
2015
|
2016
|
2017
|
2018
|
||||||||||||||
|
|
(in millions, except per share amounts)
|
||||||||||||||||||
|
Consolidated Statements of Income Data:
|
|||||||||||||||||||
|
Revenues
|
$
|
66,001
|
|
$
|
74,989
|
|
$
|
90,272
|
|
$
|
110,855
|
|
$
|
136,819
|
|
||||
|
Income from operations
|
$
|
16,496
|
|
$
|
19,360
|
|
$
|
23,716
|
|
$
|
26,146
|
|
$
|
26,321
|
|
||||
|
Net income from continuing operations
|
$
|
13,620
|
|
$
|
16,348
|
|
$
|
19,478
|
|
$
|
12,662
|
|
$
|
30,736
|
|
||||
|
Net income from discontinued operations
|
$
|
516
|
|
$
|
0
|
|
$
|
0
|
|
$
|
0
|
|
$
|
0
|
|
||||
|
Net income
|
$
|
14,136
|
|
$
|
16,348
|
|
$
|
19,478
|
|
$
|
12,662
|
|
$
|
30,736
|
|
||||
|
Basic net income per share of Class A and B common stock:
|
|||||||||||||||||||
|
Continuing operations
|
$
|
20.15
|
|
$
|
23.11
|
|
$
|
28.32
|
|
$
|
18.27
|
|
$
|
44.22
|
|
||||
|
Discontinued operations
|
0.76
|
|
0.00
|
|
0.00
|
|
0.00
|
|
0.00
|
|
|||||||||
|
Basic net income per share of Class A and B common stock
|
$
|
20.91
|
|
$
|
23.11
|
|
$
|
28.32
|
|
$
|
18.27
|
|
$
|
44.22
|
|
||||
|
Basic net income per share of Class C capital stock:
|
|||||||||||||||||||
|
Continuing operations
|
$
|
20.15
|
|
$
|
24.63
|
|
$
|
28.32
|
|
$
|
18.27
|
|
$
|
44.22
|
|
||||
|
Discontinued operations
|
0.76
|
|
0.00
|
|
0.00
|
|
0.00
|
|
0.00
|
|
|||||||||
|
Basic net income per share of Class C capital stock
|
$
|
20.91
|
|
$
|
24.63
|
|
$
|
28.32
|
|
$
|
18.27
|
|
$
|
44.22
|
|
||||
|
Diluted net income per share of Class A and B common stock:
|
|||||||||||||||||||
|
Continuing operations
|
$
|
19.82
|
|
$
|
22.84
|
|
$
|
27.85
|
|
$
|
18.00
|
|
$
|
43.70
|
|
||||
|
Discontinued operations
|
0.75
|
|
0.00
|
|
0.00
|
|
0.00
|
|
0.00
|
|
|||||||||
|
Diluted net income per share of Class A and B common stock
|
$
|
20.57
|
|
$
|
22.84
|
|
$
|
27.85
|
|
$
|
18.00
|
|
$
|
43.70
|
|
||||
|
Diluted net income per share of Class C capital stock:
|
|||||||||||||||||||
|
Continuing operations
|
$
|
19.82
|
|
$
|
24.34
|
|
$
|
27.85
|
|
$
|
18.00
|
|
$
|
43.70
|
|
||||
|
Discontinued operations
|
0.75
|
|
0.00
|
|
0.00
|
|
0.00
|
|
0.00
|
|
|||||||||
|
Diluted net income per share of Class C capital stock
|
$
|
20.57
|
|
$
|
24.34
|
|
$
|
27.85
|
|
$
|
18.00
|
|
$
|
43.70
|
|
||||
|
|
As of December 31,
|
||||||||||||||||||
|
|
2014
|
2015
|
2016
|
2017
|
2018
|
||||||||||||||
|
|
(in millions)
|
||||||||||||||||||
|
Consolidated Balance Sheet Data:
|
|||||||||||||||||||
|
Cash, cash equivalents, and marketable securities
|
$
|
64,395
|
|
$
|
73,066
|
|
$
|
86,333
|
|
$
|
101,871
|
|
$
|
109,140
|
|
||||
|
Total assets
|
$
|
129,187
|
|
$
|
147,461
|
|
$
|
167,497
|
|
$
|
197,295
|
|
$
|
232,792
|
|
||||
|
Total long-term liabilities
|
$
|
8,548
|
|
$
|
7,820
|
|
$
|
11,705
|
|
$
|
20,610
|
|
$
|
20,544
|
|
||||
|
Total stockholders’ equity
|
$
|
103,860
|
|
$
|
120,331
|
|
$
|
139,036
|
|
$
|
152,502
|
|
$
|
177,628
|
|
||||
24
|
Alphabet Inc.
|
|
|
ITEM 7.
|
MANAGEMENT’S DISCUSSION AND ANALYSIS OF FINANCIAL CONDITION AND RESULTS OF OPERATIONS
|
Please read the following discussion and analysis of our financial condition and results of operations together with our consolidated financial statements and related notes included under Part II, Item 8 of this Annual Report on Form 10-K.
Trends in Our Business
The following trends have contributed to the results of our consolidated operations, and we anticipate that they will continue to affect our future results:
•
Users' behaviors and advertising continue to shift online as the digital economy evolves.
The continuing shift from an offline to online world has contributed to the growth of our business since inception, contributing to revenue growth, and we expect that this online shift will continue to benefit our business.
•
As online advertising evolves, we continue to expand our product offerings which may affect our monetization.
As interactions between users and advertisers change and as online user behavior evolves, we continue to expand and evolve our product offerings to serve their changing needs. Over time, we expect our monetization trends to fluctuate. For example, we have seen an increase in YouTube engagement ads, which monetize at a lower rate than traditional desktop search ads. Additionally, we continue to see a shift to programmatic buying which presents opportunities for advertisers to connect with the right user, in the right moment, in the right context. Programmatic buying has a different monetization profile than traditional advertising buying on Google properties.
•
Users are increasingly using diverse devices and modalities to access our products and services, and our advertising revenues are increasingly coming from mobile and other new formats.
Our users are accessing the Internet via diverse devices and modalities and want to feel connected no matter where they are or what they are doing. We seek to expand our products and services to stay in front of this shift in order to maintain and grow our business.
We generate our advertising revenues increasingly from mobile and newer advertising formats, and the margins from the advertising revenues from these sources have generally been lower than those from traditional desktop search. Accordingly, we expect TAC paid to our distribution partners to increase due to changes in device mix between mobile, desktop, and tablet, partner mix, partner agreement terms, and the percentage of queries channeled through paid access points. We expect these trends to continue to put pressure on our overall margins.
•
As users in developing economies increasingly come online, our revenues from international markets continue to increase and movements in foreign exchange rates affect such revenues.
The shift to online, as well as the advent of the multi-device world, has brought opportunities outside of the U.S., including in emerging markets, and we continue to develop localized versions of our products and relevant advertising programs useful to our users in these markets. This has led to a trend of increased revenues from international markets over time and we expect that our results will continue to be affected by our performance in these markets, particularly as low-cost mobile devices become more available.
Our international revenues represent a significant portion of our revenues and are subject to fluctuations in foreign currency exchange rates relative to the U.S. dollar. While we have a foreign exchange risk management program designed to reduce our exposure to these fluctuations, this program does not fully offset their effect on our revenues and earnings.
•
The portion of our revenues that we derive from non-advertising revenues is increasing and may affect margins.
Non-advertising revenues have grown over time. We expect this trend to continue as we focus on expanding our offerings to our users through products and services like Google Cloud, Google Play, hardware products, and YouTube subscriptions. Across these initiatives, we currently derive non-advertising revenues primarily from sales of apps, in-app purchases, digital content products, and hardware; and licensing and service fees including fees received for Google Cloud offerings. The margins on these non-advertising businesses vary significantly and may be lower than the margins on our advertising business. A number of our Other Bets initiatives are in their initial development stages, and as such, the sources of revenues from these businesses could change over time and the revenues could be volatile.
25
|
Alphabet Inc.
|
|
•
As we continue to look for new ways to serve our users and expand our businesses, we will invest heavily in R&D and capital expenditures.
We continue to make significant R&D investments in areas of strategic focus such as advertising, cloud, machine learning, and search, as well as in new products and services. Our capital expenditures have grown over time. We expect this trend to continue in the long term as we invest heavily in data centers, real estate and facilities, and information technology infrastructure.
In addition, acquisitions remain an important part of our strategy and use of capital, and we expect to continue to spend cash on acquisitions and other investments. These acquisitions generally enhance the breadth and depth of our offerings, as well as expand our expertise in engineering and other functional areas.
|
•
|
Our employees are critical to our success and we expect to continue investing in them.
|
Our employees are among our best assets and are critical for our continued success. We expect to continue hiring talented employees around the globe and to provide competitive compensation programs to our employees.
Executive Overview of Results
Below are our key financial results for the fiscal year ended
December 31, 2018
(consolidated unless otherwise noted):
|
•
|
Revenues of
$136.8 billion
and revenue growth of
23%
year over year, constant currency revenue growth of
22%
year over year.
|
|
•
|
Google segment revenues of
$136.2 billion
with revenue growth of
23%
year over year and Other Bets revenues of
$595 million
with revenue growth of
25%
year over year.
|
|
•
|
Revenues from the
United States
,
EMEA
,
APAC
, and
Other Americas
were
$63.3 billion
,
$44.6 billion
,
$21.4 billion
, and
$7.6 billion
, respectively.
|
|
•
|
Cost of revenues was
$59.5 billion
, consisting of TAC of
$26.7 billion
and other cost of revenues of
$32.8 billion
. Our TAC as a percentage of advertising revenues was
23%
.
|
|
•
|
Operating expenses (excluding cost of revenues) were
$50.9 billion
.
|
|
•
|
Income from operations was
$26.3 billion
.
|
|
•
|
Other income (expense), net, was
$8.6 billion
.
|
|
•
|
Effective tax rate was
12%
.
|
|
•
|
Net income was
$30.7 billion
with diluted net income per share of
$43.70
.
|
|
•
|
Operating cash flow was
$48.0 billion
.
|
|
•
|
Capital expenditures were
$25.1 billion
.
|
|
•
|
Number of employees was
98,771
as of
December 31, 2018
.
|
Information about Segments
We operate our business in multiple operating segments. Google is our only reportable segment. None of our other segments meet the quantitative thresholds to qualify as reportable segments; therefore, the other operating segments are combined and disclosed as Other Bets.
Our reported segments are:
|
•
|
Google – Google includes our main products such as Ads, Android, Chrome, Google Cloud, Google Maps, Google Play, Hardware (including Nest), Search, and YouTube. Our technical infrastructure is also included in Google. Google generates revenues primarily from advertising; sales of apps, in-app purchases, digital content products, and hardware; and licensing and service fees, including fees received for Google Cloud offerings.
|
|
•
|
Other Bets – Other Bets is a combination of multiple operating segments that are not individually material. Other Bets includes businesses such as Access, Calico, CapitalG, GV, Verily, Waymo, and X. Revenues from the Other Bets are derived primarily through the sales of internet and TV services through Access as well as licensing and R&D services through Verily.
|
In Q1 2018, Nest joined Google’s hardware team. Consequently, the financial results of Nest are reported in the Google segment, with Nest revenues reflected in Google other revenues. Prior period segment information has been recast to conform to the current period segment presentation. Consolidated financial results are not affected.
26
|
Alphabet Inc.
|
|
Please refer to
Note 14
of the Notes to Consolidated Financial Statements included in Part II, Item 8 of this Annual Report on Form 10-K for further information.
Revenues
The following table presents our revenues, by segment and revenue source (in millions):
|
|
Year Ended December 31,
|
||||||||||
|
|
2016
|
2017
|
2018
|
||||||||
|
Google segment
|
|||||||||||
|
Google properties revenues
|
$
|
63,785
|
|
$
|
77,788
|
|
$
|
96,336
|
|
||
|
Google Network Members' properties revenues
|
15,598
|
|
17,587
|
|
19,982
|
|
|||||
|
Google advertising revenues
|
79,383
|
|
95,375
|
|
116,318
|
|
|||||
|
Google other revenues
|
10,601
|
|
15,003
|
|
19,906
|
|
|||||
|
Google segment revenues
|
$
|
89,984
|
|
$
|
110,378
|
|
$
|
136,224
|
|
||
|
Other Bets
|
|||||||||||
|
Other Bets revenues
|
$
|
288
|
|
$
|
477
|
|
$
|
595
|
|
||
|
Revenues
|
$
|
90,272
|
|
$
|
110,855
|
|
$
|
136,819
|
|
||
Google segment
The following table presents our Google segment revenues (in millions):
|
|
Year Ended December 31,
|
||||||||||
|
|
2016
|
2017
|
2018
|
||||||||
|
Google segment revenues
|
$
|
89,984
|
|
$
|
110,378
|
|
$
|
136,224
|
|
||
|
Google segment revenues as a percentage of total revenues
|
99.7
|
%
|
99.6
|
%
|
99.6
|
%
|
|||||
Use of Monetization Metrics
When assessing our advertising revenues performance, historically we presented the percentage change in the number of paid clicks and cost-per-click for both our Google properties and our Google Network Members’ properties (Network) revenues. As our impression-based revenues have become a more significant driver of Network revenues growth, the percentage change in paid clicks and cost-per-click cover less of our total Network revenues. As a result, in Q1 2018, we transitioned our Network revenue metrics from the percentage change in paid clicks and cost-per-click to the percentage change in impressions and cost-per-impression. Click-based revenues generated by our Network business are included in impression-based metrics, so that these metrics cover nearly all of our Network business. The monetization metrics for Google properties revenues remain unchanged.
Paid clicks for our Google properties represent engagement by users and include clicks on advertisements by end-users related to searches on Google.com, clicks related to advertisements on other owned and operated properties including Gmail, Google Maps, and Google Play; and viewed YouTube engagement ads. Impressions for our Google Network Members' properties include impressions displayed to users served on Google Network Members' properties participating primarily in AdMob, AdSense for Content, AdSense for Search, and Google Ad Manager (includes what was formerly DoubleClick AdExchange).
Cost-per-click is defined as click-driven revenues divided by our total number of paid clicks and represents the average amount we charge advertisers for each engagement by users.
Cost-per-impression is defined as impression-based and click-based revenues divided by our total number of impressions and represents the average amount we charge advertisers for each impression displayed to users.
As our business evolves, we periodically review, refine and update our methodologies for monitoring, gathering, and counting the number of paid clicks on our Google properties and the number of impressions on Google Network Members’ properties and for identifying the revenues generated by click activity on our Google properties and the revenues generated by impression activity on Google Network Members’ properties.
Our advertising revenue growth, as well as the change in paid clicks and cost-per-click on Google properties and the change in impressions and cost-per-impression on Google Network Members' properties and the correlation between these items, have fluctuated and may continue to fluctuate because of various factors, including:
27
|
Alphabet Inc.
|
|
|
•
|
advertiser competition for keywords;
|
|
•
|
changes in advertising quality or formats;
|
|
•
|
changes in device mix;
|
|
•
|
changes in foreign currency exchange rates;
|
|
•
|
fees advertisers are willing to pay based on how they manage their advertising costs;
|
|
•
|
general economic conditions;
|
|
•
|
growth rates of revenues within Google properties;
|
|
•
|
seasonality; and
|
|
•
|
traffic growth in emerging markets compared to more mature markets and across various advertising verticals and channels.
|
Our advertising revenue growth rate has fluctuated over time as a result of a number of factors, including challenges in maintaining our growth rate as revenues increase to higher levels, changes in our product mix, increasing competition, query growth rates, our investments in new business strategies, shifts in the geographic mix of our revenues, and the evolution of the online advertising market. We also expect that our revenue growth rate will continue to be affected by evolving user preferences, the acceptance by users of our products and services as they are delivered on diverse devices and modalities, our ability to create a seamless experience for both users and advertisers, and movements in foreign currency exchange rates.
Google properties
The following table presents our Google properties revenues (in millions), and changes in our paid clicks and cost-per-click (expressed as a percentage):
|
|
Year Ended December 31,
|
||||||||||
|
|
2016
|
2017
|
2018
|
||||||||
|
Google properties revenues
|
$
|
63,785
|
|
$
|
77,788
|
|
$
|
96,336
|
|
||
|
Google properties revenues as a percentage of Google segment revenues
|
70.9
|
%
|
70.5
|
%
|
70.7
|
%
|
|||||
|
Paid clicks change
|
54
|
%
|
62
|
%
|
|||||||
|
Cost-per-click change
|
(21
|
)%
|
(25
|
)%
|
|||||||
Google properties revenues consist primarily of advertising revenues that are generated on:
|
•
|
Google search properties which includes revenues from traffic generated by search distribution partners who use Google.com as their default search in browsers, toolbars, etc.; and
|
|
•
|
Other Google owned and operated properties like Gmail, Google Maps, Google Play, and YouTube.
|
Our Google properties revenues
increased
$18,548 million
from
2017
to
2018
and
increased
$14,003 million
from
2016
to
2017
. The growth during both periods was primarily driven by increases in mobile search resulting from ongoing growth in user adoption and usage, as well as continued growth in advertiser activity. We also experienced growth in YouTube driven primarily by video advertising, as well as growth in desktop search due to improvements in ad formats and delivery. Additionally, revenue growth from
2017
to
2018
was favorably affected by the general weakening of the U.S. dollar compared to certain foreign currencies. The growth from
2016
to
2017
was partially offset by the general strengthening of the U.S. dollar compared to certain foreign currencies.
The number of paid clicks through our advertising programs on Google properties increased from
2017
to
2018
and from
2016
to
2017
due to growth in YouTube engagement ads, increases in mobile search queries, improvements we have made in ad formats and delivery, and continued global expansion of our products, advertisers and user base. The positive effect on our revenues from an increase in paid clicks was partially offset by a decrease in the cost-per-click paid by our advertisers from
2017
to
2018
and from
2016
to
2017
. The decreases in cost-per-click were primarily driven by continued growth in YouTube engagement ads where cost-per-click remains lower than on our other advertising platforms. Cost-per-click was also affected by changes in device mix, geographic mix, ongoing product changes, product mix, property mix, and fluctuations of the U.S. dollar compared to certain foreign currencies.
28
|
Alphabet Inc.
|
|
Google Network Members' properties
The following table presents our Google Network Members' properties revenues (in millions) and changes in our impressions and cost-per-impression (expressed as a percentage):
|
|
Year Ended December 31,
|
||||||||||
|
|
2016
|
2017
|
2018
|
||||||||
|
Google Network Members' properties revenues
|
$
|
15,598
|
|
$
|
17,587
|
|
$
|
19,982
|
|
||
|
Google Network Members' properties revenues as a percentage of Google segment revenues
|
17.3
|
%
|
15.9
|
%
|
14.7
|
%
|
|||||
|
Impressions change
|
3
|
%
|
2
|
%
|
|||||||
|
Cost-per-impression change
|
8
|
%
|
12
|
%
|
|||||||
Google Network Members' properties revenues consist primarily of advertising revenues generated from advertisements served on Google Network Members' properties participating in:
|
•
|
AdMob;
|
|
•
|
AdSense (such as AdSense for Content, AdSense for Search, etc.); and
|
|
•
|
Google Ad Manager
.
|
Our Google Network Members' properties revenues
increased
$2,395 million
from
2017
to
2018
. The growth was primarily driven by strength in both AdMob and programmatic advertising buying, offset by a decline in our traditional AdSense businesses. Additionally, the growth was favorably affected by the general weakening of the U.S. dollar compared to certain foreign currencies.
The increase in impressions from
2017
to
2018
resulted primarily from growth in AdMob offset by a decrease from AdSense for Content due to ongoing product changes. The increase in cost-per-impression was primarily due to ongoing product and policy changes and improvements we have made in ad formats and delivery and was also affected by changes in device mix, geographic mix, product mix, property mix, and fluctuations of the U.S. dollar compared to certain foreign currencies.
Our Google Network Members' properties revenues
increased
$1,989 million
from
2016
to
2017
. The growth was primarily driven by strength in both programmatic advertising buying and AdMob, offset by a decline in our traditional AdSense businesses and the general strengthening of the U.S. dollar compared to certain foreign currencies.
The increase in impressions from
2016
to
2017
resulted primarily from growth in programmatic advertising and AdMob, partially offset by a decrease from AdSense for Search. The increase in cost-per-impression from
2016
to
2017
was primarily due to ongoing product and policy changes and improvements we have made in ad formats and delivery and was also affected by changes in device mix, geographic mix, product mix, property mix, and fluctuations of the U.S. dollar compared to certain foreign currencies.
Google other revenues
The following table presents our Google other revenues (in millions):
|
|
Year Ended December 31,
|
||||||||||
|
|
2016
|
2017
|
2018
|
||||||||
|
Google other revenues
|
$
|
10,601
|
|
$
|
15,003
|
|
$
|
19,906
|
|
||
|
Google other revenues as a percentage of Google segment revenues
|
11.8
|
%
|
13.6
|
%
|
14.6
|
%
|
|||||
Google other revenues consist primarily of revenues from:
|
•
|
Apps, in-app purchases, and digital content in the Google Play store;
|
|
•
|
Google Cloud offerings; and
|
|
•
|
Hardware.
|
Our Google other revenues
increased
$4,903 million
from
2017
to
2018
. The increase was primarily driven by revenues from Google Cloud offerings, revenues from Google Play, largely relating to in-app purchases (revenues which we recognize net of payout to developers), and hardware sales.
Our Google other revenues
increased
$4,402 million
from
2016
to
2017
. The increase was primarily driven by revenues from Google Cloud offerings, hardware sales, and revenues from Google Play, largely relating to in-app purchases (revenues which we recognize net of payout to developers).
29
|
Alphabet Inc.
|
|
Other Bets
The following table presents our Other Bets revenues (in millions):
|
|
Year Ended December 31,
|
||||||||||
|
|
2016
|
2017
|
2018
|
||||||||
|
Other Bets revenues
|
$
|
288
|
|
$
|
477
|
|
$
|
595
|
|
||
|
Other Bets revenues as a percentage of total revenues
|
0.3
|
%
|
0.4
|
%
|
0.4
|
%
|
|||||
Other Bets revenues consist primarily of revenues and sales from internet and TV services as well as licensing and R&D services.
Our Other Bets revenues
increased
$118 million
from
2017
to
2018
and
increased
$189 million
from
2016
to
2017
. These increases were primarily driven by revenues from sales of Access internet and TV services and revenues from Verily licensing and R&D services.
Revenues by Geography
The following table presents our revenues by geography as a percentage of revenues, determined based on the addresses of our customers:
|
|
Year Ended December 31,
|
|||||||
|
|
2016
|
2017
|
2018
|
|||||
|
United States
|
47
|
%
|
47
|
%
|
46
|
%
|
||
|
EMEA
|
34
|
%
|
33
|
%
|
33
|
%
|
||
|
APAC
|
14
|
%
|
15
|
%
|
15
|
%
|
||
|
Other Americas
|
5
|
%
|
5
|
%
|
6
|
%
|
||
For the amounts of revenues by geography, please refer to
Note 2
of the Notes to Consolidated Financial Statements included in Part II, Item 8 of this Annual Report on Form 10-K.
Use of Constant Currency Revenues and Constant Currency Revenue Growth
The effect of currency exchange rates on our business is an important factor in understanding period to period comparisons. Our international revenues are favorably affected as the U.S. dollar weakens relative to other foreign currencies, and unfavorably affected as the U.S. dollar strengthens relative to other foreign currencies. Our international revenues are also favorably affected by net hedging gains and unfavorably affected by net hedging losses.
We use non-GAAP constant currency revenues and constant currency revenue growth for financial and operational decision-making and as a means to evaluate period-to-period comparisons. We believe the presentation of results on a constant currency basis in addition to GAAP results helps improve the ability to understand our performance because they exclude the effects of foreign currency volatility that are not indicative of our core operating results.
Constant currency information compares results between periods as if exchange rates had remained constant period over period. We define constant currency revenues as total revenues excluding the effect of foreign exchange rate movements and hedging activities, and use it to determine the constant currency revenue growth on a year-on-year basis. Constant currency revenues are calculated by translating current period revenues using prior period exchange rates, as well as excluding any hedging effects realized in the current period.
Constant currency revenue growth (expressed as a percentage) is calculated by determining the increase in current period revenues over prior period revenues where current period foreign currency revenues are translated using prior period exchange rates and hedging effects are excluded from revenues of both periods.
These results should be considered in addition to, not as a substitute for, results reported in accordance with GAAP. Results on a constant currency basis, as we present them, may not be comparable to similarly titled measures used by other companies and are not a measure of performance presented in accordance with GAAP.
30
|
Alphabet Inc.
|
|
The following table presents the foreign exchange effect on our international revenues and total revenues (in millions):
|
|
Year Ended December 31,
|
||||||||||
|
2016
|
2017
|
2018
|
|||||||||
|
EMEA revenues
|
$
|
30,304
|
|
$
|
36,046
|
|
$
|
44,567
|
|
||
|
Exclude foreign exchange effect on current period revenues using prior year rates
|
1,291
|
|
(5
|
)
|
(1,325
|
)
|
|||||
|
Exclude hedging effect recognized in current period
|
(479
|
)
|
190
|
|
172
|
|
|||||
|
EMEA constant currency revenues
|
$
|
31,116
|
|
$
|
36,231
|
|
$
|
43,414
|
|
||
|
Prior period EMEA revenues, excluding hedging effect
|
$
|
25,379
|
|
$
|
29,825
|
|
$
|
36,236
|
|
||
|
EMEA revenue growth
|
19
|
%
|
24
|
%
|
|||||||
|
EMEA constant currency revenue growth
|
21
|
%
|
20
|
%
|
|||||||
|
APAC revenues
|
$
|
12,559
|
|
$
|
16,235
|
|
$
|
21,374
|
|
||
|
Exclude foreign exchange effect on current period revenues using prior year rates
|
(362
|
)
|
26
|
|
(49
|
)
|
|||||
|
Exclude hedging effect recognized in current period
|
(31
|
)
|
(43
|
)
|
(33
|
)
|
|||||
|
APAC constant currency revenues
|
$
|
12,166
|
|
$
|
16,218
|
|
$
|
21,292
|
|
||
|
Prior period APAC revenues, excluding hedging effect
|
$
|
9,564
|
|
$
|
12,528
|
|
$
|
16,192
|
|
||
|
APAC revenue growth
|
29
|
%
|
32
|
%
|
|||||||
|
APAC constant currency revenue growth
|
29
|
%
|
31
|
%
|
|||||||
|
Other Americas revenues
|
$
|
4,628
|
|
$
|
6,125
|
|
$
|
7,609
|
|
||
|
Exclude foreign exchange effect on current period revenues using prior year rates
|
344
|
|
(148
|
)
|
404
|
|
|||||
|
Exclude hedging effect recognized in current period
|
(29
|
)
|
22
|
|
(1
|
)
|
|||||
|
Other Americas constant currency revenues
|
$
|
4,943
|
|
$
|
5,999
|
|
$
|
8,012
|
|
||
|
Prior period Other Americas revenues, excluding hedging effect
|
$
|
3,836
|
|
$
|
4,599
|
|
$
|
6,147
|
|
||
|
Other Americas revenue growth
|
32
|
%
|
24
|
%
|
|||||||
|
Other Americas constant currency revenue growth
|
30
|
%
|
30
|
%
|
|||||||
|
United States revenues
|
$
|
42,781
|
|
$
|
52,449
|
|
$
|
63,269
|
|
||
|
United States revenue growth
|
23
|
%
|
21
|
%
|
|||||||
|
Total revenues
|
$
|
90,272
|
|
$
|
110,855
|
|
$
|
136,819
|
|
||
|
Total constant currency revenues
|
$
|
91,006
|
|
$
|
110,897
|
|
$
|
135,987
|
|
||
|
Total revenue growth
|
23
|
%
|
23
|
%
|
|||||||
|
Total constant currency revenue growth
|
24
|
%
|
22
|
%
|
|||||||
Our EMEA revenues and revenue growth from
2017
to
2018
were favorably affected by changes in foreign currency exchange rates, primarily due to the U.S. dollar weakening relative to the Euro and British pound.
Our EMEA revenues and revenue growth from
2016
to
2017
were unfavorably affected by hedging losses.
Our APAC revenues and revenue growth from
2017
to
2018
were favorably affected by changes in foreign currency exchange rates, as well as hedging benefits, primarily due to the U.S. dollar weakening relative to the Japanese yen, offset by the U.S. dollar strengthening relative to the Australian dollar.
Our APAC revenues and revenue growth from
2016
to
2017
were slightly affected by hedging benefits and changes in foreign currency exchange rates, primarily due to the U.S. dollar strengthening relative to the Japanese yen, offset by the U.S. dollar weakening relative to the Australian dollar, Indian rupee, South Korean won, and Taiwanese dollar.
31
|
Alphabet Inc.
|
|
Our Other Americas revenues and revenue growth from
2017
to
2018
were unfavorably affected by changes in foreign currency exchange rates, primarily due to the U.S. dollar strengthening relative to the Brazilian real and Argentine peso.
Our Other Americas revenues and revenue growth from
2016
to
2017
were favorably affected by changes in foreign currency exchange rates, primarily due to the U.S. dollar weakening relative to the Brazilian real and Canadian dollar, offset by the U.S. dollar strengthening relative to the Argentine peso.
Costs and Expenses
Cost of Revenues
Cost of revenues consists of TAC which are paid to Google Network Members primarily for ads displayed on their properties and amounts paid to our distribution partners who make available our search access points and services. Our distribution partners include browser providers, mobile carriers, original equipment manufacturers, and software developers.
The cost of revenues related to revenues generated from ads placed on Google Network Members' properties are significantly higher than the cost of revenues related to revenues generated from ads placed on Google properties because most of the advertiser revenues from ads served on Google Network Members’ properties are paid as TAC to our Google Network Members.
Additionally, other cost of revenues (which is the cost of revenues excluding TAC) includes the following:
|
•
|
Content acquisition costs primarily related to payments to content providers from whom we license video and other content for distribution on YouTube and Google Play (we pay fees to these content providers based on revenues generated or a flat fee);
|
|
•
|
Expenses associated with our data centers and other operations (including bandwidth, compensation expenses (including stock-based compensation (SBC)), depreciation, energy, and other equipment costs); and
|
|
•
|
Inventory related costs for hardware we sell.
|
The following tables present our cost of revenues, including TAC (in millions):
|
|
Year Ended December 31,
|
||||||||||
|
|
2016
|
2017
|
2018
|
||||||||
|
TAC
|
$
|
16,793
|
|
$
|
21,672
|
|
$
|
26,726
|
|
||
|
Other cost of revenues
|
18,345
|
|
23,911
|
|
32,823
|
|
|||||
|
Total cost of revenues
|
$
|
35,138
|
|
$
|
45,583
|
|
$
|
59,549
|
|
||
|
Total cost of revenues as a percentage of revenues
|
38.9
|
%
|
41.1
|
%
|
43.5
|
%
|
|||||
|
|
Year Ended December 31,
|
||||||||||
|
|
2016
|
2017
|
2018
|
||||||||
|
TAC to distribution partners
|
$
|
5,894
|
|
$
|
9,031
|
|
$
|
12,572
|
|
||
|
TAC to distribution partners as a percentage of Google properties revenues
(1)
(Google properties TAC rate)
|
9.2
|
%
|
11.6
|
%
|
13.1
|
%
|
|||||
|
TAC to Google Network Members
|
$
|
10,899
|
|
$
|
12,641
|
|
$
|
14,154
|
|
||
|
TAC to Google Network Members as a percentage of Google Network Members' properties revenues
(1)
(Network Members TAC rate)
|
69.9
|
%
|
71.9
|
%
|
70.8
|
%
|
|||||
|
TAC
|
$
|
16,793
|
|
$
|
21,672
|
|
$
|
26,726
|
|
||
|
TAC as a percentage of advertising revenues
(1)
(Aggregate TAC rate)
|
21.2
|
%
|
22.7
|
%
|
23.0
|
%
|
|||||
|
(1)
|
Revenues include hedging gains (losses) which affect TAC rates.
|
Cost of revenues
increased
$13,966 million
from
2017
to
2018
. The
increase
was due to increases in TAC and other cost of revenues of
$5,054 million
and
$8,912 million
, respectively.
The increase in TAC to distribution partners from
2017
to
2018
was a result of an increase in Google properties revenues and the associated TAC rate. The increase in the Google properties TAC rate was driven by changes in partner agreements and the ongoing shift to mobile, which carries higher TAC because more mobile searches are
32
|
Alphabet Inc.
|
|
channeled through paid access points. The increase in TAC to Google Network Members from
2017
to
2018
was a result of an increase in Google Network Members' properties revenues offset by a decrease in the associated TAC rate. The decrease in the Network Members TAC rate was primarily due to a shift to lower TAC products within programmatic advertising buying. The increase in the aggregate TAC rate from
2017
to
2018
was a result of an increase in Google properties TAC rate, partially offset by a favorable revenue mix shift from Google Network Members' properties to Google properties.
Other cost of revenues
increased
$8,912 million
from
2017
to
2018
. The
increase
was due to an increase in data center and other operations costs, which was affected by increased allocations primarily from general and administrative expenses; content acquisition costs as a result of increased activities related to YouTube; and hardware costs associated with new hardware launches.
Cost of revenues
increased
$10,445 million
from
2016
to
2017
. The
increase
was due to an
increase
in TAC of
$4,879 million
. The increase in TAC to distribution partners was a result of an increase in Google properties revenues and the associated TAC rate. The increase in TAC to Google Network Members was a result of an increase in Google Network Members' properties revenues and the associated TAC rate.
The increase in the Google properties TAC rate was driven by changes in partner agreements and the ongoing shift to mobile, which carries higher TAC because more mobile searches are channeled through paid access points. The increase in the Network Members TAC rate was driven by the continued underlying shift in advertising buying from our traditional network business to programmatic advertising buying. The increase in the aggregate TAC rate was also partially offset by a favorable revenue mix shift from Google Network Members' properties to Google properties.
Other cost of revenues
increased
$5,566 million
from 2016 to 2017. The
increase
was due to various factors, including an increase in data center and other operations costs, which include depreciation, compensation expenses (including SBC), energy, bandwidth, and other equipment costs as a result of business growth; hardware costs associated with new hardware launches; and content acquisition costs as a result of increased activities related to YouTube.
We expect cost of revenues to increase in dollar amount and as a percentage of total revenues in future periods based on a number of factors, including the following:
|
•
|
Google Network Members TAC rates, which are affected by
a combination of factors such as geographic mix, product mix, revenue share terms, and fluctuations of the U.S. dollar compared to certain foreign currencies
;
|
|
•
|
Google properties TAC rates, which are affected by changes in device mix between mobile, desktop, and tablet, partner mix, partner agreement terms such as revenue share arrangements, and the percentage of queries channeled through paid access points;
|
|
•
|
Growth rates of expenses associated with our data centers and other operations, content acquisition costs, as well as our hardware inventory and related costs;
|
|
•
|
Higher cost of revenues associated with the increased proportion of non-advertising revenues relative to our advertising revenues; and
|
|
•
|
Relative revenue growth rates of Google properties and our Google Network Members' properties.
|
Research and Development
The following table presents our R&D expenses (in millions):
|
|
Year Ended December 31,
|
||||||||||
|
|
2016
|
2017
|
2018
|
||||||||
|
Research and development expenses
|
$
|
13,948
|
|
$
|
16,625
|
|
$
|
21,419
|
|
||
|
Research and development expenses as a percentage of revenues
|
15.5
|
%
|
15.0
|
%
|
15.7
|
%
|
|||||
R&D expenses consist primarily of:
|
•
|
Compensation expenses (including SBC) and facilities-related costs for engineering and technical employees responsible for R&D of our existing and new products and services;
|
|
•
|
Depreciation expenses;
|
|
•
|
Equipment-related expenses; and
|
|
•
|
Professional services fees primarily related to consulting and outsourcing services.
|
R&D expenses
increased
$4,794 million
from
2017
to
2018
. The
increase
was primarily due to an increase in compensation expenses (including SBC) and facilities-related costs of $3,518 million, largely resulting from a 24% increase in headcount. In addition, there was an increase in depreciation and equipment-related expenses of $499
33
|
Alphabet Inc.
|
|
million and $318 million, respectively, as well as an increase in professional services fees of $305 million due to additional expenses incurred for outsourced services and consulting.
R&D expenses
increased
$2,677 million
from
2016
to
2017
. The
increase
was primarily due to an increase in compensation expenses (including SBC) and facilities-related costs of $1,886 million, largely resulting from a 16% increase in headcount. In addition, there was an increase in depreciation expenses of $323 million and equipment-related expenses of $246 million.
We expect that R&D expenses will increase in dollar amount and may fluctuate as a percentage of revenues in future periods.
Sales and Marketing
The following table presents our sales and marketing expenses (in millions):
|
|
Year Ended December 31,
|
||||||||||
|
|
2016
|
2017
|
2018
|
||||||||
|
Sales and marketing expenses
|
$
|
10,485
|
|
$
|
12,893
|
|
$
|
16,333
|
|
||
|
Sales and marketing expenses as a percentage of revenues
|
11.6
|
%
|
11.6
|
%
|
11.9
|
%
|
|||||
Sales and marketing expenses consist primarily of:
|
•
|
Advertising and promotional expenditures related to our products and services; and
|
|
•
|
Compensation expenses (including SBC) and facilities-related costs for employees engaged in sales and marketing, sales support, and certain customer service functions.
|
Sales and marketing expenses
increased
$3,440 million
from
2017
to
2018
. The
increase
was primarily due to an increase in compensation expenses (including SBC) and facilities-related costs of $1,418 million, largely resulting from a 12% increase in headcount. In addition, there was an increase in advertising and promotional expenses of $1,233 million, largely resulting from increases in marketing and promotion-related expenses for our Cloud offerings and the Google Assistant.
Sales and marketing expenses
increased
$2,408 million
from
2016
to
2017
. The
increase
was primarily due to an increase in advertising and promotional expenses of $1,266 million, largely resulting from increases in marketing and promotion-related expenses for our hardware products, Cloud offerings, and YouTube. In addition, there was an increase in compensation expenses (including SBC) and facilities-related costs of $853 million, largely resulting from a 6% increase in headcount.
We expect that sales and marketing expenses will increase in dollar amount and may fluctuate as a percentage of revenues in future periods.
General and Administrative
The following table presents our general and administrative expenses (in millions):
|
|
Year Ended December 31,
|
||||||||||
|
|
2016
|
2017
|
2018
|
||||||||
|
General and administrative expenses
|
$
|
6,985
|
|
$
|
6,872
|
|
$
|
8,126
|
|
||
|
General and administrative expenses as a percentage of revenues
|
7.7
|
%
|
6.2
|
%
|
5.9
|
%
|
|||||
General and administrative expenses consist primarily of:
|
•
|
Compensation expenses (including SBC and accrued performance fees related to gains on securities) and facilities-related costs for employees in our facilities, finance, human resources, information technology, and legal organizations;
|
|
•
|
Depreciation;
|
|
•
|
Equipment-related expenses; and
|
|
•
|
Professional services fees primarily related to audit, information technology consulting, outside legal, and outsourcing services.
|
General and administrative expenses
increased
$1,254 million
from
2017
to
2018
. The
increase
was primarily due to an increase in compensation expenses (including SBC) and facilities-related costs of $1,660 million, largely resulting from accrued performance fees primarily related to gains on equity securities. The increase was offset by reduced allocations (with a corresponding net increase primarily in cost of revenues).
34
|
Alphabet Inc.
|
|
General and administrative expenses
decreased
$113 million
from
2016
to
2017
. The
decrease
was primarily from reduced allocations to general and administrative expenses with an offsetting increase to cost of revenues and other operating expenses. The decrease was partially offset by an increase in compensation expenses (including SBC) and facilities-related costs of $271 million, largely resulting from a 9% increase in headcount. Additionally, there was an increase in professional service fees of $253 million due to additional expenses incurred for outsourced services and consulting services.
We expect general and administrative expenses will increase in dollar amount and may fluctuate as a percentage of revenues in future periods.
European Commission Fines
In June 2017, the EC announced its decision that certain actions taken by Google regarding its display and ranking of shopping search results and ads infringed European competition law. The EC decision imposed a €2.4 billion ($2.7 billion as of June 27, 2017) fine, which was accrued in the second quarter of 2017.
In July 2018, the EC announced its decision that certain provisions in Google's Android-related distribution agreements infringed European competition law. The EC decision imposed a €4.3 billion ($5.1 billion as of June 30, 2018) fine, which was accrued in the second quarter of 2018.
Please refer to
Note 9
of the Notes to Consolidated Financial Statements included in Part II, Item 8 of this Annual Report on Form 10-K for further information.
Other Income (Expense), Net
The following table presents other income (expense), net, (in millions):
|
|
Year Ended December 31,
|
||||||||||
|
|
2016
|
2017
|
2018
|
||||||||
|
Other income (expense), net
|
$
|
434
|
|
$
|
1,047
|
|
$
|
8,592
|
|
||
|
Other income (expense), net, as a percentage of revenues
|
0.5
|
%
|
0.9
|
%
|
6.3
|
%
|
|||||
Other income (expense), net,
increased
$7,545 million
from
2017
to
2018
. This
increase
was primarily driven by unrealized gains on equity securities resulting from the adoption of a new accounting standard and the modification of the terms of a non-marketable debt security resulting in a recognized unrealized gain.
Other income (expense), net,
increased
$613 million
from
2016
to
2017
. This
increase
was primarily driven by reduced costs of our foreign currency hedging activities, decreased losses on marketable securities and an increase in interest income.
We expect other income (expense), net, will fluctuate in dollar amount and percentage of revenues in future periods as it is largely driven by market dynamics. Beginning in 2018, changes in the value of marketable and non-marketable equity security investments are reflected in OI&E. Equity values generally change daily for marketable equity securities and upon the occurrence of observable price changes or upon impairment of non-marketable equity securities. In addition, volatility in the global economic climate and financial markets could result in a significant change in the value of our equity securities. Fluctuations in the value of these investments could contribute to the volatility of OI&E in future periods. For additional information about equity investments, please see
Note 1
and
Note 3
of the Notes to Consolidated Financial Statements included in Part II, Item 8 of this Annual Report on Form 10-K.
Provision for Income Taxes
The following table presents our provision for income taxes (in millions) and effective tax rate:
|
|
Year Ended December 31,
|
||||||||||
|
|
2016
|
2017
|
2018
|
||||||||
|
Provision for income taxes
|
$
|
4,672
|
|
$
|
14,531
|
|
$
|
4,177
|
|
||
|
Effective tax rate
|
19.3
|
%
|
53.4
|
%
|
12.0
|
%
|
|||||
Our provision for income taxes and our effective tax rate decreased from
2017
to
2018
, due to the U.S. Tax Cuts and Jobs Act (Tax Act) which was enacted in December 2017. Please refer to
Note 13
of the Notes to Consolidated Financial Statements included in Part II, Item 8 of this Annual Report on Form 10-K for further information.
35
|
Alphabet Inc.
|
|
Our provision for income taxes and our effective tax rate increased from
2016
to
2017
, due to the effects of the Tax Act related to the one time-transition tax on accumulated foreign subsidiary earnings not previously subject to U.S. income tax.
Effective in 2018, the Tax Act reduces the U.S. statutory tax rate from 35% to 21% and creates new taxes on certain foreign-sourced earnings and certain related-party payments, which are referred to as the global intangible low-taxed income tax and the base erosion tax, respectively.
Our future effective tax rate could be adversely affected by earnings being lower than anticipated in countries that have lower statutory rates and higher than anticipated in countries that have higher statutory rates, changes in the valuation of our deferred tax assets or liabilities, or changes in tax laws, regulations, or accounting principles, as well as certain discrete items.
Quarterly Results of Operations
The following tables presenting our quarterly results of operations should be read in conjunction with the consolidated financial statements and related notes included in Part II, Item 8 of this Annual Report on Form 10-K. We have prepared the unaudited information on the same basis as our audited consolidated financial statements. Our operating results for any quarter are not necessarily indicative of results for any future quarters or for a full year.
The following table presents our unaudited quarterly results of operations for the eight quarters ended
December 31, 2018
. This table includes all adjustments, consisting only of normal recurring adjustments, that we consider necessary for a fair presentation of our consolidated financial position and operating results for the quarters presented. Both seasonal fluctuations in internet usage, advertising expenditures and underlying business trends such as traditional retail seasonality have affected, and are likely to continue to affect, our business. Commercial queries typically increase significantly in the fourth quarter of each year. These seasonal trends have caused, and will likely continue to cause, fluctuations in our quarterly results, including fluctuations in sequential revenue growth rates.
|
|
Quarter Ended
|
||||||||||||||||||||||||||||||
|
|
Mar 31,
2017 |
|
Jun 30,
2017 |
|
Sept 30,
2017 |
|
Dec 31,
2017 |
Mar 31,
2018 |
Jun 30,
2018 |
Sept 30,
2018 |
Dec 31,
2018 |
||||||||||||||||||||
|
(In millions, except per share amounts) (unaudited)
|
|||||||||||||||||||||||||||||||
|
Consolidated Statements of Income Data:
|
|||||||||||||||||||||||||||||||
|
Revenues
|
$
|
24,750
|
|
$
|
26,010
|
|
$
|
27,772
|
|
$
|
32,323
|
|
$
|
31,146
|
|
$
|
32,657
|
|
$
|
33,740
|
|
$
|
39,276
|
|
|||||||
|
Costs and expenses:
|
|||||||||||||||||||||||||||||||
|
Cost of revenues
|
9,795
|
|
10,373
|
|
11,148
|
|
14,267
|
|
13,467
|
|
13,883
|
|
14,281
|
|
17,918
|
|
|||||||||||||||
|
Research and development
|
3,942
|
|
4,172
|
|
4,205
|
|
4,306
|
|
5,039
|
|
5,114
|
|
5,232
|
|
6,034
|
|
|||||||||||||||
|
Sales and marketing
|
2,644
|
|
2,897
|
|
3,042
|
|
4,310
|
|
3,604
|
|
3,780
|
|
3,849
|
|
5,100
|
|
|||||||||||||||
|
General and administrative
|
1,801
|
|
1,700
|
|
1,595
|
|
1,776
|
|
2,035
|
|
2,002
|
|
2,068
|
|
2,021
|
|
|||||||||||||||
|
European Commission fines
|
0
|
|
2,736
|
|
0
|
|
0
|
|
0
|
|
5,071
|
|
0
|
|
0
|
|
|||||||||||||||
|
Total costs and expenses
|
18,182
|
|
21,878
|
|
19,990
|
|
24,659
|
|
24,145
|
|
29,850
|
|
25,430
|
|
31,073
|
|
|||||||||||||||
|
Income from operations
|
6,568
|
|
4,132
|
|
7,782
|
|
7,664
|
|
7,001
|
|
2,807
|
|
8,310
|
|
8,203
|
|
|||||||||||||||
|
Other income (expense), net
|
251
|
|
245
|
|
197
|
|
354
|
|
3,542
|
|
1,408
|
|
1,773
|
|
1,869
|
|
|||||||||||||||
|
Income from continuing operations before income taxes
|
6,819
|
|
4,377
|
|
7,979
|
|
8,018
|
|
10,543
|
|
4,215
|
|
10,083
|
|
10,072
|
|
|||||||||||||||
|
Provision for income taxes
|
1,393
|
|
853
|
|
1,247
|
|
11,038
|
|
1,142
|
|
1,020
|
|
891
|
|
1,124
|
|
|||||||||||||||
|
Net income (loss)
|
$
|
5,426
|
|
$
|
3,524
|
|
$
|
6,732
|
|
$
|
(3,020
|
)
|
$
|
9,401
|
|
$
|
3,195
|
|
$
|
9,192
|
|
$
|
8,948
|
|
|||||||
|
Basic net income (loss) per share of Class A and B common stock and Class C capital stock
|
$
|
7.85
|
|
$
|
5.09
|
|
$
|
9.71
|
|
$
|
(4.35
|
)
|
$
|
13.53
|
|
$
|
4.60
|
|
$
|
13.21
|
|
$
|
12.87
|
|
|||||||
|
Diluted net income (loss) per share of Class A and B common stock and Class C capital stock
|
$
|
7.73
|
|
$
|
5.01
|
|
$
|
9.57
|
|
$
|
(4.35
|
)
|
$
|
13.33
|
|
$
|
4.54
|
|
$
|
13.06
|
|
$
|
12.77
|
|
|||||||
Capital Resources and Liquidity
As of
December 31, 2018
, we had
$109.1 billion
in cash, cash equivalents, and marketable securities. Ca
sh equivalents and marketable securities a
re comprised of time deposits, money market funds, highly liquid government bonds, corporate debt securities, mortgage-backed and asset-backed securities. From time to time, we may hold
36
|
Alphabet Inc.
|
|
marketable equity securities obtained through acquisitions or strategic investments in private companies that subsequently go public.
In December 2017, the Tax Act was enacted and resulted in a one-time transition tax on accumulated foreign subsidiary earnings. After 2017, our foreign earnings held by foreign subsidiaries are no longer subject to U.S. tax upon repatriation to the U.S. As of
December 31, 2018
, the remaining long-term tax payable related to the Tax Act of
$7.4 billion
is presented within income tax payable, non-current on our Consolidated Balance Sheets. As permitted by the Tax Act, we will pay the transition tax in annual interest-free installments through 2025.
During the years ended December 31, 2017 and 2018, the EC announced decisions that certain actions taken by Google infringed European competition law and imposed fines of €2.4 billion ($2.7 billion as of June 27, 2017) and €4.3 billion ($5.1 billion as of June 30, 2018), respectively. While under appeal, EC fines are included in accrued expenses and other current liabilities on our Consolidated Balance Sheets as we provided bank guarantees in lieu of a cash payment for the respective fines. Please refer to Note 9 of the Notes to Consolidated Financial Statements included in Part II, Item 8 of this Annual Report on Form 10-K for further information.
Our principal sources of liquidity are our cash, cash equivalents, and marketable securities, as well as the cash flow that we generate from our operations. We have a short-term debt financing program of up to
$5.0 billion
through the issuance of commercial paper. Net proceeds from this program are used for general corporate purposes. We had no commercial paper outstanding as of
December 31, 2018
. We have
$4.0 billion
of revolving credit facilities expiring in July 2023 with no amounts outstanding. The interest rate for the credit facilities is determined based on a formula using certain market rates. We believe that our sources of funding will be sufficient to satisfy our currently anticipated cash requirements including capital expenditures, working capital requirements, potential acquisitions and other liquidity requirements through at least the next 12 months.
As of
December 31, 2018
, we have senior unsecured notes outstanding due in 2021, 2024, and 2026 with a total carrying value of
$4.0 billion
.
In 2016 and 2018, the board of directors of Alphabet authorized the company to repurchase up to $7.0 billion and $8.6 billion of its Class C capital stock, respectively. The 2016 authorization was completed in 2018. As of
December 31, 2018
, $1.7 billion remains available for repurchase. In January 2019, our board of directors authorized the repurchase of up to an additional $12.5 billion of our Class C capital stock. The repurchases are being executed from time to time, subject to general business and market conditions and other investment opportunities, through open market purchases or privately negotiated transactions, including through Rule 10b5-1 plans. The repurchase program does not have an expiration date. Please refer to Note 10 of the Notes to Consolidated Financial Statements included in Part II, Item 8 of this Annual Report on Form 10-K for additional information related to stock repurchases.
The following table presents our cash flows (in millions):
|
|
Year Ended December 31,
|
||||||||||
|
|
2016
|
2017
|
2018
|
||||||||
|
Net cash provided by operating activities
|
$
|
36,036
|
|
$
|
37,091
|
|
$
|
47,971
|
|
||
|
Net cash used in investing activities
|
$
|
(31,165
|
)
|
$
|
(31,401
|
)
|
$
|
(28,504
|
)
|
||
|
Net cash used in financing activities
|
$
|
(8,332
|
)
|
$
|
(8,298
|
)
|
$
|
(13,179
|
)
|
||
Cash Provided by Operating Activities
Our largest source of cash provided by our operations are advertising revenues generated by Google properties and Google Network Members' properties. Additionally, we generate cash through sales of apps, in-app purchases, digital content products, and hardware; and licensing and service fees including fees received for Google Cloud offerings
.
Our primary uses of cash from our operating activities include payments to our Google Network Members and distribution partners, and payments for content acquisition costs. In addition, uses of cash from operating activities include compensation and related costs, hardware inventory costs, other general corporate expenditures, and income taxes.
Net cash provided by operating activities increased
from
2017
to
2018
primarily due to increases in cash received from advertising revenues and Google other revenues (net of payouts to app developers), offset by increases in cash paid for cost of revenues and operating expenses.
37
|
Alphabet Inc.
|
|
Net cash provided by operating activities increased
from
2016
to
2017
primarily due to increases in cash received from advertising revenues and Google other revenues (net of payouts to app developers), offset by increases in cash paid for cost of revenues, operating expenses, and income taxes.
Cash Used in Investing Activities
Cash provided by or used in investing activities primarily consists of purchases of property and equipment; purchases, maturities, and sales of marketable and non-marketable securities; and payments for acquisitions.
Net cash used in investing activities decreased
from
2017
to
2018
primarily due to a decrease in purchases of marketable securities. The decrease was partially offset by higher investments in land and buildings for offices and data centers, as well as, servers to provide capacity for the growth of our businesses. Generally, our investment in office facilities is driven by workforce needs; and our investment in data centers is driven by our compute and storage requirements and has a lead time of up to three years. Further, the decrease was partially offset by an increase in payments for acquisitions and a decrease in maturities and sales of marketable securities.
Net cash used in investing activities increased
slightly from
2016
to
2017
primarily due to an increase in purchases of marketable securities and an increase in purchases of property and equipment, partially offset by an increase in the maturities and sales of marketable securities, a decrease in cash collateral paid related to securities lending, and an increase in proceeds received from collections of notes receivables.
Cash Used in Financing Activities
Cash provided by or used in financing activities consists primarily of net proceeds or payments from stock-based award activities, repurchases of capital stock, and net proceeds or payments from issuance or repayments of debt.
Net cash used in financing activities increased
from
2017
to
2018
primarily due to higher cash payments for repurchases of capital stock and stock-based award activities.
Net cash used in financing activities decreased
slightly from
2016
to
2017
primarily due to lower net cash payments from repayments and issuance of debt, partially offset by higher cash payments for repurchases of capital stock.
Contractual Obligations as of
December 31, 2018
The following summarizes our contractual obligations as of
December 31, 2018
(in millions):
|
|
Payments Due By Period
|
||||||||||||||||||
|
|
Total
|
Less than
1 year
|
1-3
years
|
3-5
years
|
More than
5 years
|
||||||||||||||
|
Operating lease obligations, net of sublease income amounts
(1)
|
$
|
10,047
|
|
$
|
1,303
|
|
$
|
2,711
|
|
$
|
2,122
|
|
$
|
3,911
|
|
||||
|
Purchase obligations
(2)
|
7,433
|
|
5,132
|
|
1,407
|
|
370
|
|
524
|
|
|||||||||
|
Long-term debt obligations
(3)
|
4,689
|
|
134
|
|
1,220
|
|
154
|
|
3,181
|
|
|||||||||
|
Tax payable
(4)
|
7,440
|
|
—
|
|
2,029
|
|
5,411
|
|
—
|
|
|||||||||
|
Other long-term liabilities reflected on our balance sheet
(5)
|
2,443
|
|
341
|
|
638
|
|
416
|
|
1,048
|
|
|||||||||
|
Total contractual obligations
|
$
|
32,052
|
|
$
|
6,910
|
|
$
|
8,005
|
|
$
|
8,473
|
|
$
|
8,664
|
|
||||
|
(1)
|
For further information, refer to
Note 9
of the Notes to Consolidated Financial Statements included in Part II, Item 8 of this Annual Report on Form 10-K.
|
|
(2)
|
Represents non-cancelable contractual obligations primarily related to information technology assets and data center operation costs; purchases of inventory; and digital media content licensing arrangements. The amounts included above represent the non-cancelable portion of agreements or the minimum cancellation fee. For those agreements with variable terms, we do not estimate the non-cancelable obligation beyond any minimum quantities and/or pricing as of
December 31, 2018
. Excluded from the table above are open orders for purchases that support normal operations.
|
|
(3)
|
Represents our principal and interest payments. For further information on long-term debt, refer to
Note 5
of the Notes to Consolidated Financial Statements included in Part II, Item 8 of this Annual Report on Form 10-K.
|
|
(4)
|
Represents one-time transition tax payable incurred as a result of the Tax Act. For further information, refer to
Note 13
of the Notes to Consolidated Financial Statements included in Part II, Item 8 of this Annual Report on Form 10-K. Excluded from the table above are long-term taxes payable of
$3.9 billion
as of
December 31, 2018
primarily related to uncertain tax positions, for which we are unable to make a reasonably reliable estimate of the timing of payments in individual years beyond 12 months due to uncertainties in the timing of tax audit outcomes.
|
|
(5)
|
Represents cash obligations recorded on our Consolidated Balance Sheets, including the short-term portion of these long-term liabilities, primarily for the construction of offices and certain commercial agreements. These amounts do not include the EC fines which are classified as current liabilities on our Consolidated Balance Sheets. For further information regarding the
|
38
|
Alphabet Inc.
|
|
EC fines, refer to Note 9 of the Notes to Consolidated Financial Statements included in Part II, Item 8 of this Annual Report on Form 10-K.
Off-Balance Sheet Arrangements
As of
December 31, 2018
, we did not have any off-balance sheet arrangements, as defined in Item 303(a)(4)(ii) of Regulation S-K, that have or are reasonably likely to have a current or future effect on our financial condition, changes in our financial condition, revenues, or expenses, results of operations, liquidity, capital expenditures, or capital resources that is material to investors.
Critical Accounting Policies and Estimates
We prepare our consolidated financial statements in accordance with U.S. Generally Accepted Accounting Principles (GAAP). In doing so, we have to make estimates and assumptions that affect our reported amounts of assets, liabilities, revenues, expenses, gains and losses, as well as related disclosure of contingent assets and liabilities. In some cases, we could reasonably have used different accounting policies and estimates. In some cases, changes in the accounting estimates are reasonably likely to occur from period to period. Accordingly, actual results could differ materially from our estimates. To the extent that there are material differences between these estimates and actual results, our financial condition or results of operations will be affected. We base our estimates on past experience and other assumptions that we believe are reasonable under the circumstances, and we evaluate these estimates on an ongoing basis. We refer to accounting estimates of this type as critical accounting policies and estimates, which we discuss further below. We have reviewed our critical accounting policies and estimates with the audit committee of our board of directors.
Please see Notes to Consolidated Financial Statements included in Part II, Item 8 of this Annual Report on Form 10-K for a summary of significant accounting policies and the effect on our financial statements.
Revenues
For the sale of third-party goods and services, we evaluate whether we are the principal, and report revenues on a gross basis, or an agent, and report revenues on a net basis. In this assessment, we consider if we obtain control of the specified goods or services before they are transferred to the customer, as well as other indicators such as the party primarily responsible for fulfillment, inventory risk, and discretion in establishing price.
Income Taxes
We are subject to income taxes in the U.S. and foreign jurisdictions. Significant judgment is required in evaluating our uncertain tax positions and determining our provision for income taxes.
Although we believe we have adequately reserved for our uncertain tax positions, no assurance can be given that the final tax outcome of these matters will not be different. We adjust these reserves in light of changing facts and circumstances, such as the closing of a tax audit or the refinement of an estimate. To the extent that the final tax outcome of these matters is different than the amounts recorded, such differences will affect the provision for income taxes and the effective tax rate in the period in which such determination is made.
The provision for income taxes includes the effect of reserve provisions and changes to reserves that are considered appropriate as well as the related net interest and penalties. In addition, we are subject to the continuous examination of our income tax returns by the Internal Revenue Services (IRS) and other tax authorities which may assert assessments against us. We regularly assess the likelihood of adverse outcomes resulting from these examinations and assessments to determine the adequacy of our provision for income taxes.
Loss Contingencies
We are regularly subject to claims, suits, government investigations, and other proceedings involving competition and antitrust, intellectual property, privacy, non-income taxes, labor and employment, commercial disputes, content generated by our users, goods and services offered by advertisers or publishers using our platforms, and other matters. Certain of these matters include speculative claims for substantial or indeterminate amounts of damages. We record a liability when we believe that it is probable that a loss has been incurred and the amount can be reasonably estimated. If we determine that a loss is reasonably possible and the loss or range of loss can be estimated, we disclose the possible loss in the Notes to the Consolidated Financial Statements.
We evaluate, on a regular basis, developments in our legal matters that could affect the amount of liability that has been previously accrued, and the matters and related reasonably possible losses disclosed, and make adjustments and changes to our disclosures as appropriate. Significant judgment is required to determine both the likelihood of there being, and the estimated amount of, a loss related to such matters. Until the final resolution of such matters, there may be an exposure to loss in excess of the amount recorded, and such amounts could be material. Should any
39
|
Alphabet Inc.
|
|
of our estimates and assumptions change or prove to have been incorrect, it could have a material effect on our business, consolidated financial position, results of operations, or cash flows.
Long-lived Assets
Long-lived assets, including property and equipment, long-term prepayments, and intangible assets, excluding goodwill, are reviewed for impairment whenever events or changes in circumstances indicate that the carrying amount of an asset may not be recoverable. The evaluation is performed at the lowest level of identifiable cash flows independent of other assets. An impairment loss would be recognized when estimated undiscounted future cash flows generated from the assets are less than their carrying amount. Measurement of an impairment loss would be based on the excess of the carrying amount of the asset group over its fair value.
Valuation of Non-marketable Equity Securities
Beginning on January 1, 2018, our non-marketable equity securities not accounted for under the equity method are carried either at fair value or under the measurement alternative upon the adoption of ASU 2016-01. Under the measurement alternative, the carrying value is measured at cost, less any impairment, plus or minus changes resulting from observable price changes in orderly transactions for the identical or a similar investment of the same issuer. Determining whether an observed transaction is similar to a security within our portfolio requires judgment based on the rights and obligations of the securities. Recording upward and downward adjustments to the carrying value of our equity securities as a result of observable price changes requires quantitative assessments of the fair value of our securities using various valuation methodologies and involves the use of estimates.
Non-marketable equity securities are also subject to periodic impairment reviews. Our quarterly impairment analysis considers both qualitative and quantitative factors that may have a significant effect on the investment's fair value. Qualitative factors considered include industry and market conditions, financial performance, business prospects, and other relevant events and factors. When indicators of impairment exist, we prepare quantitative assessments of the fair value of our equity investments using both the market and income approaches which require judgment and the use of estimates, including discount rates, investee revenues and costs, and comparable market data of private and public companies, among others. When our assessment indicates that an impairment exists, we measure our non-marketable securities at fair value.
|
ITEM 7A.
|
QUANTITATIVE AND QUALITATIVE DISCLOSURES ABOUT MARKET RISK
|
We are exposed to financial market risks, including changes in foreign currency exchange rates, interest rates, and equity investment risks.
Foreign Currency Exchange Risk
We transact business globally in multiple currencies. Our international revenues, as well as costs and expenses denominated in foreign currencies, expose us to the risk of fluctuations in foreign currency exchange rates against the U.S. dollar. Principal currencies hedged included the Australian dollar, British pound, Canadian dollar, Euro and Japanese yen. For the purpose of analyzing foreign currency exchange risk, we considered the historical trends in foreign currency exchange rates and determined that it was reasonably possible that adverse changes in exchange rates of 10% could be experienced in the near term.
We use foreign exchange forward contracts to offset the foreign exchange risk on our assets and liabilities denominated in currencies other than the local currency of the subsidiary. These forward contracts reduce, but do not entirely eliminate, the effect of foreign currency exchange rate movements on our assets and liabilities. The foreign currency gains and losses on the assets and liabilities are recorded in other income (expense), net, which are offset by the gains and losses on the forward contracts.
If an adverse 10% foreign currency exchange rate change was applied to total monetary assets and liabilities denominated in currencies other than the local currencies at the balance sheet dates, it would have resulted in an adverse effect on income before income taxes of approximately $52 million and $1 million as of
December 31, 2017
and
2018
, respectively. The adverse effect as of
December 31, 2017
and
2018
is after consideration of the offsetting effect of approximately $374 million for both periods from foreign exchange contracts in place for the months ended
December 31, 2017
and
December 31, 2018
.
We use foreign currency forwards and option contracts, including collars (an option strategy comprised of a combination of purchased and written options) to protect our forecasted U.S. dollar-equivalent earnings from changes in foreign currency exchange rates. When the U.S. dollar strengthens, gains from foreign currency options and forwards reduce the foreign currency losses related to our earnings. When the U.S. dollar weakens, losses from foreign currency collars and forwards offset the foreign currency gains related to our earnings. These hedging contracts reduce, but do
40
|
Alphabet Inc.
|
|
not entirely eliminate, the effect of foreign currency exchange rate movements. We designate these contracts as cash flow hedges for accounting purposes. We reflect the gains or losses of foreign currency spot rate changes as a component of AOCI and subsequently reclassify them into revenues to offset the hedged exposures as they occur.
If the U.S. dollar weakened by 10% as of
December 31, 2017
and
December 31, 2018
, the amount recorded in AOCI related to our foreign exchange contracts before tax effect would have been approximately $950 million and $772 million lower as of
December 31, 2017
and
December 31, 2018
, respectively. The change in the value recorded in AOCI would be expected to offset a corresponding foreign currency change in forecasted hedged revenues when recognized.
During 2018, we entered into foreign exchange forward contracts designated as net investment hedges to hedge the foreign currency risks related to our investment in foreign subsidiaries. These forward contracts serve to offset the foreign currency translation risk from our foreign operations.
If the U.S. dollar weakened by 10%, the amount recorded in cumulative translation adjustment (CTA) within AOCI related to our net investment hedge would have been approximately $635 million lower as of December 31, 2018. The change in value recorded in CTA would be expected to offset a corresponding foreign currency translation gain or loss from our investment in foreign subsidiaries.
Interest Rate Risk
Our investment strategy is to achieve a return that will allow us to preserve capital and maintain liquidity requirements. We invest primarily in debt securities including those of the U.S. government and its agencies, corporate debt securities, mortgage-backed securities, money market and other funds, municipal securities, time deposits, asset backed securities, and debt instruments issued by foreign governments. By policy, we limit the amount of credit exposure to any one issuer. Our investments in both fixed rate and floating rate interest earning securities carry a degree of interest rate risk. Fixed rate securities may have their fair market value adversely affected due to a rise in interest rates, while floating rate securities may produce less income than predicted if interest rates fall. Unrealized gains or losses on our marketable debt securities are primarily due to interest rate fluctuations as a result of higher market interest rates compared to interest rates at the time of purchase. We account for both fixed and variable rate securities at fair value with gains and losses recorded in AOCI until the securities are sold.
We use value-at-risk (VaR) analysis to determine the potential effect of fluctuations in interest rates on the value of our marketable debt security portfolio. The VaR is the expected loss in fair value, for a given confidence interval, for our investment portfolio due to adverse movements in interest rates. We use a variance/covariance VaR model with 95% confidence interval. The estimated one-day loss in fair value of our marketable debt securities as of
December 31, 2017
and
2018
are shown below (in millions):
|
|
As of December 31,
|
12-Month Average
As of December 31,
|
|||||||||||||
|
|
2017
|
2018
|
2017
|
2018
|
|||||||||||
|
Risk Category - Interest Rate
|
$
|
84
|
|
$
|
58
|
|
$
|
87
|
|
$
|
66
|
|
|||
Actual future gains and losses associated with our marketable debt security portfolio may differ materially from the sensitivity analyses performed as of
December 31, 2017
and
2018
due to the inherent limitations associated with predicting the timing and amount of changes in interest rates and our actual exposures and positions. VaR analysis is not intended to represent actual losses but is used as a risk estimation.
Equity Investment Risk
Our marketable and non-marketable equity securities are subject to a wide variety of market‑related risks that could substantially reduce or increase the fair value of our holdings.
Our marketable equity securities are publicly traded stocks or funds and our non-marketable equity securities are investments in privately held companies, some of which are in the startup or development stages.
We record our marketable equity securities not accounted for under the equity method at fair value based on readily determinable market values, of which publicly traded stocks and mutual funds are subject to market price volatility, and represent
$1.2 billion
of our investments as of December 31, 2018. A hypothetical adverse price change of 10%, which could be experienced in the near term, would decrease the fair value of our marketable equity securities by
$120 million
.
Our non-marketable equity securities not accounted for under the equity method are adjusted to fair value for observable transactions for identical or similar investments of the same issuer or impairment (referred to as the
41
|
Alphabet Inc.
|
|
measurement alternative). The fair value is measured at the time of the observable transaction, which is not necessarily an indication of the current fair value as of the balance sheet date. These investments, especially those that are in the early stages, are inherently risky because the technologies or products these companies have under development are typically in the early phases and may never materialize and they may experience a decline in financial condition, which could result in a loss of a substantial part of our investment in these companies. The success of our investment in any private company is also typically dependent on the likelihood of our ability to realize value in our investments through liquidity events such as public offerings, acquisitions, private sales or other favorable market events reflecting appreciation to the cost of our initial investment. As of December 31, 2018, the carrying value of our non-marketable equity securities, which were accounted for under the measurement alternative, was
$12.3 billion
. Valuations of our equity investments in private companies are inherently more complex due to the lack of readily available market data. Volatility in the global economic climate and financial markets could result in a significant impairment charge on our non-marketable equity securities.
The carrying values of our equity method investments generally do not fluctuate based on market price changes, however these investments could be impaired if the carrying value exceeds the fair value.
For further information about our equity investments, please refer to Note 1 and Note 3 of the Notes to Consolidated Financial Statements included in Part II of this Annual Report on Form 10-K.
42
|
Alphabet Inc.
|
|
|
ITEM 8.
|
FINANCIAL STATEMENTS AND SUPPLEMENTARY DATA
|
Alphabet Inc.
INDEX TO CONSOLIDATED FINANCIAL STATEMENTS
|
|
Page
|
|
Financial Statements:
|
|
The supplementary financial information required by this Item 8 is included in Item 7 under the caption “Quarterly Results of Operations.”
43
|
Alphabet Inc.
|
|
REPORT OF ERNST & YOUNG LLP, INDEPENDENT REGISTERED PUBLIC ACCOUNTING FIRM
To the Stockholders and the Board of Directors of Alphabet Inc.
Opinion on the Financial Statements
We have audited the accompanying consolidated balance sheets of Alphabet Inc. (the Company) as of December 31, 2017 and 2018, the related consolidated statements of income, comprehensive income, stockholders' equity and cash flows for each of the three years in the period ended December 31, 2018, and the related notes and financial statement schedule listed in the Index at Item 15(a)2 (collectively referred to as the “consolidated financial statements”). In our opinion, the consolidated financial statements present fairly, in all material respects, the financial position of the Company at December 31, 2017 and 2018, and the results of its operations and its cash flows for each of the three years in the period ended December 31, 2018, in conformity with U.S. generally accepted accounting principles.
We also have audited, in accordance with the standards of the Public Company Accounting Oversight Board (United States) (PCAOB), the Company's internal control over financial reporting as of December 31, 2018, based on criteria established in Internal Control-Integrated Framework issued by the Committee of Sponsoring Organizations of the Treadway Commission (2013 framework) and our report dated February 4, 2019 expressed an unqualified opinion thereon.
Adoption of New Accounting Standard
As discussed in Note 1 to the consolidated financial statements, the Company changed its method for accounting for the recognition, measurement, presentation and disclosure of certain equity securities in the year ended December 31, 2018.
Basis for Opinion
These financial statements are the responsibility of the Company's management. Our responsibility is to express an opinion on the Company’s financial statements based on our audits. We are a public accounting firm registered with the PCAOB and are required to be independent with respect to the Company in accordance with the U.S. federal securities laws and the applicable rules and regulations of the Securities and Exchange Commission and the PCAOB.
We conducted our audits in accordance with the standards of the PCAOB. Those standards require that we plan and perform the audit to obtain reasonable assurance about whether the financial statements are free of material misstatement, whether due to error or fraud. Our audits included performing procedures to assess the risks of material misstatement of the financial statements, whether due to error or fraud, and performing procedures that respond to those risks. Such procedures included examining, on a test basis, evidence regarding the amounts and disclosures in the financial statements. Our audits also included evaluating the accounting principles used and significant estimates made by management, as well as evaluating the overall presentation of the financial statements. We believe that our audits provide a reasonable basis for our opinion.
|
/s/ Ernst & Young LLP
|
|
|
We have served as the Company's auditor since 1999.
|
|
|
San Jose, California
|
|
|
February 4, 2019
|
|
44
|
Alphabet Inc.
|
|
REPORT OF ERNST & YOUNG LLP, INDEPENDENT REGISTERED PUBLIC ACCOUNTING FIRM
To the Stockholders and the Board of Directors of Alphabet Inc.
Opinion on Internal Control over Financial Reporting
We have audited Alphabet Inc.’s internal control over financial reporting as of December 31, 2018, based on criteria established in Internal Control-Integrated Framework issued by the Committee of Sponsoring Organizations of the Treadway Commission (2013 framework) (the COSO criteria). In our opinion, Alphabet Inc. (the Company) maintained, in all material respects, effective internal control over financial reporting as of December 31, 2018, based on the COSO criteria.
We also have audited, in accordance with the standards of the Public Company Accounting Oversight Board (United States) (PCAOB), the 2018 consolidated financial statements of the Company and our report dated February 4, 2019 expressed an unqualified opinion thereon that included an explanatory paragraph regarding the Company’s adoption of a new accounting standard for the recognition, measurement, presentation and disclosure of certain equity securities in the year ended December 31, 2018.
Basis for Opinion
The Company’s management is responsible for maintaining effective internal control over financial reporting and for its assessment of the effectiveness of internal control over financial reporting included in the accompanying Management’s Report on Internal Control over Financial Reporting. Our responsibility is to express an opinion on the Company’s internal control over financial reporting based on our audit. We are a public accounting firm registered with the PCAOB and are required to be independent with respect to the Company in accordance with the U.S. federal securities laws and the applicable rules and regulations of the Securities and Exchange Commission and the PCAOB.
We conducted our audit in accordance with the standards of the PCAOB. Those standards require that we plan and perform the audit to obtain reasonable assurance about whether effective internal control over financial reporting was maintained in all material respects.
Our audit included obtaining an understanding of internal control over financial reporting, assessing the risk that a material weakness exists, testing and evaluating the design and operating effectiveness of internal control based on the assessed risk, and performing such other procedures as we considered necessary in the circumstances. We believe that our audit provides a reasonable basis for our opinion.
Definition and Limitation of Internal Control over Financial Reporting
A company’s internal control over financial reporting is a process designed to provide reasonable assurance regarding the reliability of financial reporting and the preparation of financial statements for external purposes in accordance with generally accepted accounting principles. A company’s internal control over financial reporting includes those policies and procedures that (1) pertain to the maintenance of records that, in reasonable detail, accurately and fairly reflect the transactions and dispositions of the assets of the company; (2) provide reasonable assurance that transactions are recorded as necessary to permit preparation of financial statements in accordance with generally accepted accounting principles, and that receipts and expenditures of the company are being made only in accordance with authorizations of management and directors of the company; and (3) provide reasonable assurance regarding prevention or timely detection of unauthorized acquisition, use, or disposition of the company’s assets that could have a material effect on the financial statements.
Because of its inherent limitations, internal control over financial reporting may not prevent or detect misstatements. Also, projections of any evaluation of effectiveness to future periods are subject to the risk that controls may become inadequate because of changes in conditions, or that the degree of compliance with the policies or procedures may deteriorate.
|
/s/ Ernst & Young LLP
|
|
|
San Jose, California
|
|
|
February 4, 2019
|
|
45
|
Alphabet Inc.
|
|
Alphabet Inc.
CONSOLIDATED BALANCE SHEETS
(In millions, except share amounts which are reflected in thousands, and par value per share amounts)
|
As of
December 31, 2017 |
As of
December 31, 2018 |
||||||
|
Assets
|
|||||||
|
Current assets:
|
|||||||
|
Cash and cash equivalents
|
$
|
10,715
|
|
$
|
16,701
|
|
|
|
Marketable securities
|
91,156
|
|
92,439
|
|
|||
|
Total cash, cash equivalents, and marketable securities
|
101,871
|
|
109,140
|
|
|||
|
Accounts receivable, net of allowance of $674 and $729
|
18,336
|
|
20,838
|
|
|||
|
Income taxes receivable, net
|
369
|
|
355
|
|
|||
|
Inventory
|
749
|
|
1,107
|
|
|||
|
Other current assets
|
2,983
|
|
4,236
|
|
|||
|
Total current assets
|
124,308
|
|
135,676
|
|
|||
|
Non-marketable investments
|
7,813
|
|
13,859
|
|
|||
|
Deferred income taxes
|
680
|
|
737
|
|
|||
|
Property and equipment, net
|
42,383
|
|
59,719
|
|
|||
|
Intangible assets, net
|
2,692
|
|
2,220
|
|
|||
|
Goodwill
|
16,747
|
|
17,888
|
|
|||
|
Other non-current assets
|
2,672
|
|
2,693
|
|
|||
|
Total assets
|
$
|
197,295
|
|
$
|
232,792
|
|
|
|
Liabilities and Stockholders’ Equity
|
|||||||
|
Current liabilities:
|
|||||||
|
Accounts payable
|
$
|
3,137
|
|
$
|
4,378
|
|
|
|
Accrued compensation and benefits
|
4,581
|
|
6,839
|
|
|||
|
Accrued expenses and other current liabilities
|
10,177
|
|
16,958
|
|
|||
|
Accrued revenue share
|
3,975
|
|
4,592
|
|
|||
|
Deferred revenue
|
1,432
|
|
1,784
|
|
|||
|
Income taxes payable, net
|
881
|
|
69
|
|
|||
|
Total current liabilities
|
24,183
|
|
34,620
|
|
|||
|
Long-term debt
|
3,969
|
|
4,012
|
|
|||
|
Deferred revenue, non-current
|
340
|
|
396
|
|
|||
|
Income taxes payable, non-current
|
12,812
|
|
11,327
|
|
|||
|
Deferred income taxes
|
430
|
|
1,264
|
|
|||
|
Other long-term liabilities
|
3,059
|
|
3,545
|
|
|||
|
Total liabilities
|
44,793
|
|
55,164
|
|
|||
|
Commitments and Contingencies (Note 9)
|
|
|
|
||||
|
Stockholders’ equity:
|
|||||||
|
Convertible preferred stock, $0.001 par value per share, 100,000 shares authorized; no shares issued and outstanding
|
0
|
|
0
|
|
|||
|
Class A and Class B common stock, and Class C capital stock and additional paid-in capital, $0.001 par value per share: 15,000,000 shares authorized (Class A 9,000,000, Class B 3,000,000, Class C 3,000,000); 694,783 (Class A 298,470, Class B 46,972, Class C 349,341) and 695,556 (Class A 299,242, Class B 46,636, Class C 349,678) shares issued and outstanding
|
40,247
|
|
45,049
|
|
|||
|
Accumulated other comprehensive loss
|
(992
|
)
|
(2,306
|
)
|
|||
|
Retained earnings
|
113,247
|
|
134,885
|
|
|||
|
Total stockholders’ equity
|
152,502
|
|
177,628
|
|
|||
|
Total liabilities and stockholders’ equity
|
$
|
197,295
|
|
$
|
232,792
|
|
|
See accompanying notes.
46
|
Alphabet Inc.
|
|
Alphabet Inc.
CONSOLIDATED STATEMENTS OF INCOME
(In millions, except per share amounts)
|
|
Year Ended December 31,
|
||||||||||
|
|
2016
|
2017
|
2018
|
||||||||
|
Revenues
|
$
|
90,272
|
|
$
|
110,855
|
|
$
|
136,819
|
|
||
|
Costs and expenses:
|
|||||||||||
|
Cost of revenues
|
35,138
|
|
45,583
|
|
59,549
|
|
|||||
|
Research and development
|
13,948
|
|
16,625
|
|
21,419
|
|
|||||
|
Sales and marketing
|
10,485
|
|
12,893
|
|
16,333
|
|
|||||
|
General and administrative
|
6,985
|
|
6,872
|
|
8,126
|
|
|||||
|
European Commission fines
|
0
|
|
2,736
|
|
5,071
|
|
|||||
|
Total costs and expenses
|
66,556
|
|
84,709
|
|
110,498
|
|
|||||
|
Income from operations
|
23,716
|
|
26,146
|
|
26,321
|
|
|||||
|
Other income (expense), net
|
434
|
|
1,047
|
|
8,592
|
|
|||||
|
Income before income taxes
|
24,150
|
|
27,193
|
|
34,913
|
|
|||||
|
Provision for income taxes
|
4,672
|
|
14,531
|
|
4,177
|
|
|||||
|
Net income
|
$
|
19,478
|
|
$
|
12,662
|
|
$
|
30,736
|
|
||
|
Basic net income per share of Class A and B common stock and Class C capital stock
|
$
|
28.32
|
|
$
|
18.27
|
|
$
|
44.22
|
|
||
|
Diluted net income per share of Class A and B common stock and Class C capital stock
|
$
|
27.85
|
|
$
|
18.00
|
|
$
|
43.70
|
|
||
See accompanying notes.
47
|
Alphabet Inc.
|
|
Alphabet Inc.
CONSOLIDATED STATEMENTS OF COMPREHENSIVE INCOME
(In millions)
|
|
Year Ended December 31,
|
||||||||||
|
|
2016
|
2017
|
2018
|
||||||||
|
Net income
|
$
|
19,478
|
|
$
|
12,662
|
|
$
|
30,736
|
|
||
|
Other comprehensive income (loss):
|
|||||||||||
|
Change in foreign currency translation adjustment
|
(599
|
)
|
1,543
|
|
(781
|
)
|
|||||
|
Available-for-sale investments:
|
|||||||||||
|
Change in net unrealized gains (losses)
|
(314
|
)
|
307
|
|
88
|
|
|||||
|
Less: reclassification adjustment for net (gains) losses included in net income
|
221
|
|
105
|
|
(911
|
)
|
|||||
|
Net change (net of tax effect of $0, $0, and $156)
|
(93
|
)
|
412
|
|
(823
|
)
|
|||||
|
Cash flow hedges:
|
|||||||||||
|
Change in net unrealized gains (losses)
|
515
|
|
(638
|
)
|
290
|
|
|||||
|
Less: reclassification adjustment for net (gains) losses included in net income
|
(351
|
)
|
93
|
|
98
|
|
|||||
|
Net change (net of tax effect of $64, $247, and $103)
|
164
|
|
|
(545
|
)
|
388
|
|
||||
|
Other comprehensive income (loss)
|
(528
|
)
|
1,410
|
|
(1,216
|
)
|
|||||
|
Comprehensive income
|
$
|
18,950
|
|
$
|
14,072
|
|
$
|
29,520
|
|
||
See accompanying notes.
48
|
Alphabet Inc.
|
|
Alphabet Inc.
CONSOLIDATED STATEMENTS OF STOCKHOLDERS’ EQUITY
(In millions, except share amounts which are reflected in thousands)
|
|
Class A and Class B
Common Stock, Class C Capital Stock and
Additional Paid-In Capital
|
Accumulated
Other
Comprehensive
Income (Loss)
|
Retained
Earnings
|
Total
Stockholders’
Equity
|
||||||||||||||
|
|
Shares
|
Amount
|
||||||||||||||||
|
Balance as of December 31, 2015
|
687,348
|
|
$
|
32,982
|
|
$
|
(1,874
|
)
|
$
|
89,223
|
|
$
|
120,331
|
|
||||
|
Cumulative effect of accounting change
|
0
|
|
180
|
|
0
|
|
(133
|
)
|
47
|
|
||||||||
|
Common and capital stock issued
|
9,106
|
|
298
|
|
0
|
|
0
|
|
298
|
|
||||||||
|
Stock-based compensation expense
|
0
|
|
6,700
|
|
0
|
|
0
|
|
6,700
|
|
||||||||
|
Tax withholding related to vesting of restricted stock units
|
0
|
|
(3,597
|
)
|
0
|
|
0
|
|
(3,597
|
)
|
||||||||
|
Repurchases of capital stock
|
(5,161
|
)
|
(256
|
)
|
0
|
|
(3,437
|
)
|
(3,693
|
)
|
||||||||
|
Net income
|
0
|
|
0
|
|
0
|
|
19,478
|
|
19,478
|
|
||||||||
|
Other comprehensive loss
|
0
|
|
0
|
|
(528
|
)
|
0
|
|
(528
|
)
|
||||||||
|
Balance as of December 31, 2016
|
691,293
|
|
36,307
|
|
(2,402
|
)
|
105,131
|
|
139,036
|
|
||||||||
|
Cumulative effect of accounting change
|
0
|
|
0
|
|
0
|
|
(15
|
)
|
(15
|
)
|
||||||||
|
Common and capital stock issued
|
8,652
|
|
212
|
|
0
|
|
0
|
|
212
|
|
||||||||
|
Stock-based compensation expense
|
0
|
|
7,694
|
|
0
|
|
0
|
|
7,694
|
|
||||||||
|
Tax withholding related to vesting of restricted stock units
|
0
|
|
(4,373
|
)
|
0
|
|
0
|
|
(4,373
|
)
|
||||||||
|
Repurchases of capital stock
|
(5,162
|
)
|
(315
|
)
|
0
|
|
(4,531
|
)
|
(4,846
|
)
|
||||||||
|
Sale of subsidiary shares
|
0
|
|
722
|
|
0
|
|
0
|
|
722
|
|
||||||||
|
Net income
|
0
|
|
0
|
|
0
|
|
12,662
|
|
12,662
|
|
||||||||
|
Other comprehensive income
|
0
|
|
0
|
|
1,410
|
|
0
|
|
1,410
|
|
||||||||
|
Balance as of December 31, 2017
|
694,783
|
|
40,247
|
|
(992
|
)
|
113,247
|
|
152,502
|
|
||||||||
|
Cumulative effect of accounting change
|
0
|
|
0
|
|
(98
|
)
|
(599
|
)
|
(697
|
)
|
||||||||
|
Common and capital stock issued
|
8,975
|
|
148
|
|
0
|
|
0
|
|
148
|
|
||||||||
|
Stock-based compensation expense
|
0
|
|
9,353
|
|
0
|
|
0
|
|
9,353
|
|
||||||||
|
Tax withholding related to vesting of restricted stock units and other
|
0
|
|
(4,782
|
)
|
0
|
|
0
|
|
(4,782
|
)
|
||||||||
|
Repurchases of capital stock
|
(8,202
|
)
|
(576
|
)
|
0
|
|
(8,499
|
)
|
(9,075
|
)
|
||||||||
|
Sale of subsidiary shares
|
0
|
|
659
|
|
0
|
|
0
|
|
659
|
|
||||||||
|
Net income
|
0
|
|
0
|
|
0
|
|
30,736
|
|
30,736
|
|
||||||||
|
Other comprehensive loss
|
0
|
|
0
|
|
(1,216
|
)
|
0
|
|
(1,216
|
)
|
||||||||
|
Balance as of December 31, 2018
|
695,556
|
|
$
|
45,049
|
|
$
|
(2,306
|
)
|
$
|
134,885
|
|
$
|
177,628
|
|
||||
See accompanying notes.
49
|
Alphabet Inc.
|
|
Alphabet Inc.
CONSOLIDATED STATEMENTS OF CASH FLOWS
(In millions)
|
|
Year Ended December 31,
|
||||||||||
|
|
2016
|
2017
|
2018
|
||||||||
|
Operating activities
|
|||||||||||
|
Net income
|
$
|
19,478
|
|
$
|
12,662
|
|
$
|
30,736
|
|
||
|
Adjustments:
|
|||||||||||
|
Depreciation and impairment of property and equipment
|
5,267
|
|
6,103
|
|
8,164
|
|
|||||
|
Amortization and impairment of intangible assets
|
877
|
|
812
|
|
871
|
|
|||||
|
Stock-based compensation expense
|
6,703
|
|
7,679
|
|
9,353
|
|
|||||
|
Deferred income taxes
|
(38
|
)
|
258
|
|
778
|
|
|||||
|
(Gain) loss on debt and equity securities, net
|
73
|
|
37
|
|
(6,650
|
)
|
|||||
|
Other
|
376
|
|
294
|
|
(189
|
)
|
|||||
|
Changes in assets and liabilities, net of effects of acquisitions:
|
|||||||||||
|
Accounts receivable
|
(2,578
|
)
|
(3,768
|
)
|
(2,169
|
)
|
|||||
|
Income taxes, net
|
3,125
|
|
8,211
|
|
(2,251
|
)
|
|||||
|
Other assets
|
312
|
|
(2,164
|
)
|
(1,207
|
)
|
|||||
|
Accounts payable
|
110
|
|
731
|
|
1,067
|
|
|||||
|
Accrued expenses and other liabilities
|
1,515
|
|
4,891
|
|
8,614
|
|
|||||
|
Accrued revenue share
|
593
|
|
955
|
|
483
|
|
|||||
|
Deferred revenue
|
223
|
|
390
|
|
371
|
|
|||||
|
Net cash provided by operating activities
|
36,036
|
|
37,091
|
|
47,971
|
|
|||||
|
Investing activities
|
|||||||||||
|
Purchases of property and equipment
|
(10,212
|
)
|
(13,184
|
)
|
(25,139
|
)
|
|||||
|
Proceeds from disposals of property and equipment
|
240
|
|
99
|
|
98
|
|
|||||
|
Purchases of marketable securities
|
(84,509
|
)
|
(92,195
|
)
|
(50,158
|
)
|
|||||
|
Maturities and sales of marketable securities
|
66,895
|
|
73,959
|
|
48,507
|
|
|||||
|
Purchases of non-marketable investments
|
(1,109
|
)
|
(1,745
|
)
|
(2,073
|
)
|
|||||
|
Maturities and sales of non-marketable investments
|
494
|
|
533
|
|
1,752
|
|
|||||
|
Cash collateral related to securities lending
|
(2,428
|
)
|
0
|
|
0
|
|
|||||
|
Investments in reverse repurchase agreements
|
450
|
|
0
|
|
0
|
|
|||||
|
Acquisitions, net of cash acquired, and purchases of intangible assets
|
(986
|
)
|
(287
|
)
|
(1,491
|
)
|
|||||
|
Proceeds from collection of notes receivable
|
0
|
|
1,419
|
|
0
|
|
|||||
|
Net cash used in investing activities
|
(31,165
|
)
|
|
(31,401
|
)
|
(28,504
|
)
|
||||
|
Financing activities
|
|||||||||||
|
Net payments related to stock-based award activities
|
(3,304
|
)
|
(4,166
|
)
|
(4,993
|
)
|
|||||
|
Repurchases of capital stock
|
(3,693
|
)
|
(4,846
|
)
|
(9,075
|
)
|
|||||
|
Proceeds from issuance of debt, net of costs
|
8,729
|
|
4,291
|
|
6,766
|
|
|||||
|
Repayments of debt
|
(10,064
|
)
|
(4,377
|
)
|
(6,827
|
)
|
|||||
|
Proceeds from sale of subsidiary shares
|
0
|
|
800
|
|
950
|
|
|||||
|
Net cash used in financing activities
|
(8,332
|
)
|
(8,298
|
)
|
(13,179
|
)
|
|||||
|
Effect of exchange rate changes on cash and cash equivalents
|
(170
|
)
|
405
|
|
(302
|
)
|
|||||
|
Net increase (decrease) in cash and cash equivalents
|
(3,631
|
)
|
(2,203
|
)
|
5,986
|
|
|||||
|
Cash and cash equivalents at beginning of period
|
16,549
|
|
12,918
|
|
10,715
|
|
|||||
|
Cash and cash equivalents at end of period
|
$
|
12,918
|
|
$
|
10,715
|
|
$
|
16,701
|
|
||
|
Supplemental disclosures of cash flow information
|
|||||||||||
|
Cash paid for taxes, net of refunds
|
$
|
1,643
|
|
$
|
6,191
|
|
$
|
5,671
|
|
||
|
Cash paid for interest, net of amounts capitalized
|
$
|
84
|
|
$
|
84
|
|
$
|
69
|
|
||
See accompanying notes.
50
|
Alphabet Inc.
|
|
Alphabet Inc.
NOTES TO CONSOLIDATED FINANCIAL STATEMENTS
Note 1.
Nature of Operations and Summary of Significant Accounting Policies
Nature of Operations
Google was incorporated in California in September 1998 and re-incorporated in the State of Delaware in August 2003. In 2015, we implemented a holding company reorganization, and as a result, Alphabet Inc. (Alphabet) became the successor issuer to Google.
We generate revenues primarily by delivering relevant, cost-effective online advertising.
Basis of Consolidation
The consolidated financial statements of Alphabet include the accounts of Alphabet and entities consolidated under the variable interest and voting models. Noncontrolling interests are not presented separately as the amounts are not material. All intercompany balances and transactions have been eliminated.
Use of Estimates
Preparation of consolidated financial statements in conformity with generally accepted accounting principles in the United States (GAAP) requires us to make estimates and assumptions that affect the amounts reported and disclosed in the financial statements and the accompanying notes. Actual results could differ materially from these estimates. On an ongoing basis, we evaluate our estimates, including those related to the bad debt allowance, sales allowances, fair values of financial instruments, intangible assets and goodwill, useful lives of intangible assets and property and equipment, income taxes, and contingent liabilities, among others. We base our estimates on assumptions, both historical and forward looking, that are believed to be reasonable, the results of which form the basis for making judgments about the carrying values of assets and liabilities.
Revenue Recognition
We recognize revenues when we transfer control of promised goods or services to our customers in an amount that reflects the consideration to which we expect to be entitled to in exchange for those goods or services.
See Note 2 for further discussion on Revenues.
Cost of Revenues
Cost of revenues consists of TAC and other costs of revenues.
TAC represents the amounts paid to Google Network Members primarily for ads displayed on their properties and amounts paid to our distribution partners who make available our search access points and services. Our distribution partners include browser providers, mobile carriers, original equipment manufacturers, and software developers.
Other costs of revenues (which is the cost of revenues excluding TAC) include the following:
|
•
|
Content acquisition costs primarily related to payments to content providers from whom we license video and other content for distribution on YouTube and Google Play (we pay fees to these content providers based on revenues generated or a flat fee);
|
|
•
|
Expenses associated with our data centers and other operations (including bandwidth, compensation expense (including SBC), depreciation, energy, and other equipment costs); and
|
|
•
|
Inventory related costs for hardware we sell.
|
Stock-based Compensation
Stock-based compensation primarily consists of Alphabet restricted stock units (RSUs). RSUs are equity classified and measured at the fair market value of the underlying stock at the grant date. We recognize RSU expense using the straight-line attribution method over the requisite service period and account for forfeitures as they occur.
For RSUs, shares are issued on the vesting dates net of the applicable statutory tax withholding to be paid by us on behalf of our employees. As a result, fewer shares are issued than the number of RSUs outstanding. We record a liability for the tax withholding to be paid by us as a reduction to additional paid-in capital.
Additionally, stock-based compensation includes other types of stock-based awards that may be settled in the stock of certain of our Other Bets or in cash. Awards that are liability classified are remeasured at fair value through settlement or maturity. The fair value of such awards is based on the valuation of equity of the respective Other Bet.
51
|
Alphabet Inc.
|
|
Performance Fees
We have compensation arrangements with payouts based on realized investment returns. We recognize compensation expense based on the estimated payouts.
Certain Risks and Concentrations
Our revenues are primarily derived from online advertising, the market for which is highly competitive and rapidly changing. In addition, our revenues are generated from a multitude of vertical market segments in countries around the world. Significant changes in this industry or changes in customer buying or advertiser spending behavior could adversely affect our operating results.
We are subject to concentrations of credit risk principally from cash and cash equivalents, marketable securities, foreign exchange contracts, and accounts receivable. Cash equivalents and marketable securities consist primarily of time deposits, money market and other funds, highly liquid debt instruments of the U.S. government and its agencies, debt instruments issued by foreign governments, debt instruments issued by municipalities in the U.S., corporate debt securities, mortgage-backed securities, and asset-backed securities. Foreign exchange contracts are transacted with various financial institutions with high credit standing. Accounts receivable are typically unsecured and are derived from revenues earned from customers located around the world. We perform ongoing evaluations to determine customer credit and we limit the amount of credit we extend. We generally do not require collateral from our customers. We maintain reserves for estimated credit losses and these losses have generally been within our expectations.
No
individual customer or groups of affiliated customers represented more than
10%
of our revenues in
2016
,
2017
, or
2018
. In
2016
,
2017
, and
2018
, we generated approximately
47%
,
47%
, and
46%
of our revenues, respectively, from customers based in the U.S. See
Note 2
for further details.
Fair Value of Financial Instruments
Our financial assets and liabilities that are measured at fair value on a recurring basis include cash equivalents, marketable securities, derivative contracts, and non-marketable debt securities. Our financial assets that are measured at fair value on a nonrecurring basis include non-marketable equity securities measured at fair value when observable price changes are identified or when non-marketable equity securities are impaired
.
Other financial assets and liabilities are carried at cost with fair value disclosed, if required.
Fair value is an exit price, representing the amount that would be received to sell an asset or paid to transfer a liability in an orderly transaction between market participants. As such, fair value is a market-based measurement that is determined based on assumptions that market participants would use in pricing an asset or a liability. Assets and liabilities recorded at fair value are measured and classified in accordance with a three-tier fair value hierarchy based on the observability of the inputs available in the market used to measure fair value:
Level 1 - Observable inputs that reflect quoted prices (unadjusted) for identical assets or liabilities in active markets.
Level 2 - Inputs that are based upon quoted prices for similar instruments in active markets, quoted prices for identical or similar instruments in markets that are not active, and model-based valuation techniques for which all significant inputs are observable in the market or can be derived from observable market data. Where applicable, these models project future cash flows and discount the future amounts to a present value using market-based observable inputs including interest rate curves, foreign exchange rates, and credit ratings.
Level 3 - Unobservable inputs that are supported by little or no market activities.
The fair value hierarchy requires an entity to maximize the use of observable inputs and minimize the use of unobservable inputs when measuring fair value.
Cash, Cash Equivalents, and Marketable Securities
We invest all excess cash primarily in government bonds, corporate debt securities, mortgage-backed and asset-backed securities, time deposits, and money market funds.
We classify all investments that are readily convertible to known amounts of cash and have stated maturities of three months or less from the date of purchase as cash equivalents and those with stated maturities of greater than three months as marketable securities.
We determine the appropriate classification of our investments in marketable securities at the time of purchase and reevaluate such designation at each balance sheet date. We have classified and accounted for our marketable debt securities as available-for-sale. After consideration of our risk versus reward objectives, as well as our liquidity requirements, we may sell these debt securities prior to their stated maturities. As we view these securities as available
52
|
Alphabet Inc.
|
|
to support current operations, we classify highly liquid securities with maturities beyond 12 months as current assets under the caption marketable securities on the Consolidated Balance Sheets. We carry these securities at fair value, and report the unrealized gains and losses, net of taxes, as a component of stockholders’ equity, except for unrealized losses determined to be other-than-temporary, which we record within other income (expense), net. We determine any realized gains or losses on the sale of marketable debt securities on a specific identification method, and we record such gains and losses as a component of other income (expense), net.
Non-Marketable Investments
We account for non-marketable equity investments through which we exercise significant influence but do not have control over the investee under the equity method. Beginning on January 1, 2018, our non-marketable equity securities not accounted for under the equity method are either carried at fair value or under the measurement alternative upon the adoption of ASU 2016-01. Under the measurement alternative, the carrying value is measured at cost, less any impairment, plus or minus changes resulting from observable price changes in orderly transactions for identical or similar investments of the same issuer. Adjustments are determined primarily based on a market approach as of the transaction date. We classify our non-marketable investments as non-current assets on the Consolidated Balance Sheets as those investments do not have stated contractual maturity dates.
We account for our non-marketable investments that meet the definition of a debt security as available-for-sale securities.
Impairment of Investments
We periodically review our debt and equity investments for impairment. For debt securities we consider the duration, severity and the reason for the decline in security value; whether it is more likely than not that we will be required to sell the security before recovery of its amortized cost basis; or if the amortized cost basis cannot be recovered as a result of credit losses. If any impairment is considered other-than-temporary, we will write down the security to its fair value and record the corresponding charge as other income (expense), net. For equity securities we consider impairment indicators such as negative changes in industry and market conditions, financial performance, business prospects, and other relevant events and factors. If indicators exist and the fair value of the security is below the carrying amount, we write down the security to fair value.
Variable Interest Entities
We determine at the inception of each arrangement whether an entity in which we have made an investment or in which we have other variable interests in is considered a variable interest entity (VIE). We consolidate VIEs when we are the primary beneficiary. The primary beneficiary of a VIE is the party that meets both of the following criteria: (1) has the power to make decisions that most significantly affect the economic performance of the VIE; and (2) has the obligation to absorb losses or the right to receive benefits that in either case could potentially be significant to the VIE. Periodically, we assess whether any changes in our interest or relationship with the entity affect our determination of whether the entity is still a VIE and, if so, whether we are the primary beneficiary. If we are not the primary beneficiary in a VIE, we account for the investment or other variable interests in a VIE in accordance with applicable GAAP.
Accounts Receivable
We record accounts receivable at the invoiced amount. We maintain an allowance for doubtful accounts to reserve for potentially uncollectible receivables. We review the accounts receivable by amounts due from customers that are past due to identify specific customers with known disputes or collectability issues. In determining the amount of the reserve, we make judgments about the creditworthiness of significant customers based on ongoing credit evaluations.
Property and Equipment
Property and equipment includes the following categories: land and buildings, information technology assets, construction in progress, leasehold improvements, and furniture and fixtures. Land and buildings include land, offices, data centers and related building improvements. Information technology assets include servers and network equipment. We account for property and equipment at cost less accumulated depreciation. We compute depreciation using the straight-line method over the estimated useful lives of the assets. We depreciate buildings over periods of
seven
to
25
years. We generally depreciate information technology assets over periods of
three
to
five
years (specifically,
three
years for servers and
three
to
five
years for network equipment).
We depreciate leasehold improvements over the shorter of the remaining lease term or the estimated useful lives of the assets. Construction in progress is the construction or development of property and equipment that have not yet been placed in service for our intended use. Depreciation for equipment, buildings, and leasehold improvements commences once they are ready for our intended use. Land is not depreciated.
53
|
Alphabet Inc.
|
|
Inventory
Inventory consists primarily of finished goods and is stated at the lower of cost and net realizable value. Cost is computed using the first-in, first-out method.
Software Development Costs
We expense software development costs, including costs to develop software products or the software component of products to be sold, leased, or marketed to external users, before technological feasibility is reached. Technological feasibility is typically reached shortly before the release of such products and as a result, development costs that meet the criteria for capitalization were not material for the periods presented.
Software development costs also include costs to develop software to be used solely to meet internal needs and cloud based applications used to deliver our services. We capitalize development costs related to these software applications once the preliminary project stage is complete and it is probable that the project will be completed and the software will be used to perform the function intended. Costs capitalized for developing such software applications were not material for the periods presented.
Business Combinations
We include the results of operations of the businesses that we acquire as of the acquisition date. We allocate the purchase price of the acquisitions to the assets acquired and liabilities assumed based on their estimated fair values. The excess of the purchase price over the fair values of identifiable assets and liabilities is recorded as goodwill. Acquisition-related expenses are recognized separately from the business combination and are expensed as incurred.
Long-Lived Assets, Goodwill and Other Acquired Intangible Assets
We review property and equipment, long-term prepayments and intangible assets, excluding goodwill, for impairment when events or changes in circumstances indicate the carrying amount may not be recoverable. We measure recoverability of these assets by comparing the carrying amounts to the future undiscounted cash flows that the assets or the asset group are expected to generate. If the carrying value of the assets are not recoverable, the impairment recognized is measured as the amount by which the carrying value of the asset exceeds its fair value. Impairments were not material for the periods presented.
We allocate goodwill to reporting units based on the expected benefit from the business combination. We evaluate our reporting units when changes in our operating structure occur, and if necessary, reassign goodwill using a relative fair value allocation approach. We test our goodwill for impairment at least annually, or more frequently if events or changes in circumstances indicate that the asset may be impaired. Goodwill impairments were not material for the periods presented.
Intangible assets with definite lives are amortized over their estimated useful lives. We amortize intangible assets on a straight-line basis with definite lives over periods ranging from
one
to
twelve
years.
Income Taxes
We account for income taxes using the asset and liability method, under which we recognize the amount of taxes payable or refundable for the current year and deferred tax assets and liabilities for the future tax consequences of events that have been recognized in our financial statements or tax returns. We measure current and deferred tax assets and liabilities based on provisions of enacted tax law. We evaluate the realization of our deferred tax assets based on all available evidence and establish a valuation allowance to reduce deferred tax assets when it is more likely than not that they will not be realized.
We recognize the financial statement effects of a tax position when it is more likely than not that, based on technical merits, the position will be sustained upon examination. The tax benefits of the position recognized in the financial statements are then measured based on the largest amount of benefit that is greater than 50% likely to be realized upon settlement with a taxing authority. In addition, we recognize interest and penalties related to unrecognized tax benefits as a component of the income tax provision.
Foreign Currency
Generally, the functional currency of our international subsidiaries is the local currency. We translate the financial statements of these subsidiaries to U.S. dollars using month-end exchange rates for assets and liabilities, and average rates for the annual period derived from month-end exchange rates for revenues, costs, and expenses. We record translation gains and losses in accumulated other comprehensive income (AOCI) as a component of stockholders’ equity. We reflect net foreign exchange transaction gains and losses resulting from the conversion of the transaction currency to functional currency as a component of foreign currency exchange losses in other income (expense), net.
54
|
Alphabet Inc.
|
|
Advertising and Promotional Expenses
We expense advertising and promotional costs in the period in which they are incurred. For the years ended
December 31, 2016
,
2017
and
2018
, advertising and promotional expenses totaled approximately
$3.9 billion
,
$5.1 billion
, and
$6.4 billion
, respectively.
Recent Accounting Pronouncements
Recently issued accounting pronouncements not yet adopted
In February 2016, the Financial Accounting Standards Board (FASB) issued Accounting Standards Update No. 2016-02 (Topic 842) "Leases." Topic 842 supersedes the lease requirements in Accounting Standards Codification (ASC) Topic 840, "Leases." Under Topic 842, lessees are required to recognize assets and liabilities on the balance sheet for most leases and provide enhanced disclosures. Leases will continue to be classified as either finance or operating. We will adopt Topic 842 effective January 1, 2019 using a modified retrospective method and will not restate comparative periods. As permitted under the transition guidance, we will carry forward the assessment of whether our contracts contain or are leases, classification of our leases and remaining lease terms. Based on our portfolio of leases as of December 31, 2018, approximately
$9 billion
of lease assets and liabilities will be recognized on our balance sheet upon adoption, primarily relating to real estate. We are substantially complete with our implementation efforts.
In June 2016, the FASB issued Accounting Standards Update No. 2016-13 (ASU 2016-13) "Financial Instruments-Credit Losses (Topic 326): Measurement of Credit Losses on Financial Instruments" which requires the measurement and recognition of expected credit losses for financial assets held at amortized cost. ASU 2016-13 replaces the existing incurred loss impairment model with an expected loss model which requires the use of forward-looking information to calculate credit loss estimates. It also eliminates the concept of other-than-temporary impairment and requires credit losses related to available-for-sale debt securities to be recorded through an allowance for credit losses rather than as a reduction in the amortized cost basis of the securities. These changes will result in earlier recognition of credit losses. We will adopt ASU 2016-13 effective January 1, 2020. We are currently evaluating the effect of the adoption of ASU 2016-13 on our consolidated financial statements. The effect will largely depend on the composition and credit quality of our investment portfolio and the economic conditions at the time of adoption.
Recently adopted accounting pronouncements
In January 2016, the FASB issued Accounting Standards Update No. 2016-01 (ASU 2016-01) "Financial Instruments-Overall (Subtopic 825-10): Recognition and Measurement of Financial Assets and Financial Liabilities," which amends various aspects of the recognition, measurement, presentation, and disclosure of financial instruments. We adopted ASU 2016-01 as of January 1, 2018 using the modified retrospective method for our marketable equity securities and the prospective method for our non-marketable equity securities. This resulted in a
$98 million
reclassification of net unrealized gains from AOCI to opening retained earnings. We have elected to use the measurement alternative for our non-marketable equity securities, defined as cost adjusted for changes from observable transactions for identical or similar investments of the same issuer, less impairment. The adoption of ASU 2016-01 increases the volatility of our other income (expense), net, as a result of the unrealized gain or loss from the remeasurement of our equity securities. For further information on unrealized gains from equity securities, see
Note 3
.
In October 2016, the FASB issued Accounting Standards Update No. 2016-16 (ASU 2016-16) "Income Taxes (Topic 740): Intra-Entity Transfers of Assets Other than Inventory." ASU 2016-16 generally accelerates the recognition of income tax consequences for asset transfers between entities under common control. We adopted ASU 2016-16 as of January 1, 2018 using a modified retrospective transition method, resulting in a
$701 million
reclassification of prepaid income taxes related to asset transfers that occurred prior to adoption from other current and non-current assets to opening retained earnings.
Prior Period Reclassifications
Certain amounts in prior periods have been reclassified to conform with current period presentation.
Note 2.
Revenues
Adoption of ASC Topic 606, "Revenue from Contracts with Customers"
On
January 1, 2017
, we adopted Topic 606 using the modified retrospective method applied to those contracts which were not completed as of
January 1, 2017
. Results for reporting periods beginning after
January 1, 2017
are presented under Topic 606, while prior period amounts are not adjusted and continue to be reported in accordance with our historic accounting under Topic 605. The effect from the adoption of ASC 606 was not material to our financial statements.
55
|
Alphabet Inc.
|
|
Revenue Recognition
Revenues are recognized when control of the promised goods or services is transferred to our customers, in an amount that reflects the consideration we expect to be entitled to in exchange for those goods or services.
The following table presents our revenues disaggregated by revenue source (in millions). Sales and usage-based taxes are excluded from revenues.
|
Year Ended December 31,
|
|||||||||||
|
2016
(1)
|
2017
|
2018
|
|||||||||
|
Google properties
|
$
|
63,785
|
|
$
|
77,788
|
|
$
|
96,336
|
|
||
|
Google Network Members' properties
|
15,598
|
|
17,587
|
|
19,982
|
|
|||||
|
Google advertising revenues
|
79,383
|
|
95,375
|
|
116,318
|
|
|||||
|
Google other revenues
|
10,601
|
|
15,003
|
|
19,906
|
|
|||||
|
Other Bets revenues
|
288
|
|
477
|
|
595
|
|
|||||
|
Total revenues
(2)
|
$
|
90,272
|
|
$
|
110,855
|
|
$
|
136,819
|
|
||
|
(1)
|
As noted above, prior period amounts have not been adjusted under the modified retrospective method.
|
|
(2)
|
Revenues include hedging gains (losses) of
$539 million
,
$(169) million
, and
$(138) million
for the years ended
December 31, 2016
,
2017
, and
2018
, respectively, which do not represent revenues recognized from contracts with customers.
|
The following table presents our revenues disaggregated by geography, based on the addresses of our customers (in millions):
|
Year Ended December 31,
|
||||||||||||||||||||
|
|
2016
|
2017
|
2018
|
|||||||||||||||||
|
United States
|
$
|
42,781
|
|
47
|
%
|
$
|
52,449
|
|
47
|
%
|
$
|
63,269
|
|
46
|
%
|
|||||
|
EMEA
(1)
|
30,304
|
|
34
|
|
36,046
|
|
33
|
|
44,567
|
|
33
|
|
||||||||
|
APAC
(1)
|
12,559
|
|
14
|
|
16,235
|
|
15
|
|
21,374
|
|
15
|
|
||||||||
|
Other Americas
(1)
|
4,628
|
|
5
|
|
6,125
|
|
5
|
|
7,609
|
|
6
|
|
||||||||
|
Total revenues
(2)
|
$
|
90,272
|
|
100
|
%
|
$
|
110,855
|
|
100
|
%
|
$
|
136,819
|
|
100
|
%
|
|||||
|
(1)
|
Regions represent Europe, the Middle East, and Africa (EMEA); Asia-Pacific (APAC); and Canada and Latin America (Other Americas).
|
|
(2)
|
Revenues include hedging gains (losses) for the years ended
December 31, 2016
,
2017
, and
2018
.
|
Advertising Revenues
We generate revenues primarily by delivering advertising on Google properties and Google Network Members’ properties.
Google properties revenues consist primarily of advertising revenues generated on Google.com, the Google Search app, and other Google owned and operated properties like Gmail, Google Maps, Google Play, and YouTube.
Google Network Members’ properties revenues consist primarily of advertising revenues generated on Google Network Members’ properties.
Our customers generally purchase advertising inventory through Google Ads (formerly AdWords), Google Ad Manager as part of the Authorized Buyers marketplace (formerly DoubleClick AdExchange), and Google Marketing Platform (includes what was formerly DoubleClick Bid Manager), among others.
We offer advertising on a cost-per-click basis, which means that an advertiser pays us only when a user clicks on an ad on Google properties or Google Network Members' properties or when a user views certain YouTube engagement ads. For these customers, we recognize revenue each time a user clicks on the ad or when a user views the ad for a specified period of time.
We also offer advertising on other bases such as cost-per-impression, which means an advertiser pays us based on the number of times their ads are displayed on Google properties or Google Network Members’ properties. For these customers, we recognize revenue each time an ad is displayed.
For ads placed on Google Network Members’ properties, we evaluate whether we are the principal (i.e., report revenues on a gross basis) or agent (i.e., report revenues on a net basis). Generally, we report advertising revenues for ads placed on Google Network Members’ properties on a gross basis, that is, the amounts billed to our customers
56
|
Alphabet Inc.
|
|
are recorded as revenues, and amounts paid to Google Network Members are recorded as cost of revenues. Where we are the principal, we control the advertising inventory before it is transferred to our customers. Our control is evidenced by our sole ability to monetize the advertising inventory before it is transferred to our customers, and is further supported by us being primarily responsible to our customers and having a level of discretion in establishing pricing.
Other Revenues
Google other revenues and Other Bets revenues consist primarily of revenues from:
|
•
|
Apps, in-app purchases, and digital content in the Google Play store;
|
|
•
|
Google Cloud offerings;
|
|
•
|
Hardware; and
|
|
•
|
Other miscellaneous products and services.
|
As it relates to Google other revenues, the most significant judgment is determining whether we are the principal or agent for app sales and in-app purchases through the Google Play store. We report revenues from these transactions on a net basis because our performance obligation is to facilitate a transaction between app developers and end users, for which we earn a commission. Consequently, the portion of the gross amount billed to end users that is remitted to app developers is not reflected as revenues.
Arrangements with Multiple Performance Obligations
Our contracts with customers may include multiple performance obligations. For such arrangements, we allocate revenues to each performance obligation based on its relative standalone selling price. We generally determine standalone selling prices based on the prices charged to customers or using expected cost plus margin.
Customer Incentives and Credits
Certain customers may receive cash-based incentives or credits, which are accounted for as variable consideration. We estimate these amounts based on the expected amount to be provided to customers and reduce revenues recognized. We believe that there will not be significant changes to our estimates of variable consideration.
Deferred Revenues
We record deferred revenues when cash payments are received or due in advance of our performance, including amounts which are refundable. The
increase
in the deferred revenue balance for the
twelve months ended
December 31, 2018
is primarily driven by cash payments received or due in advance of satisfying our performance obligations, offset by
$1.5 billion
of revenues recognized that were included in the deferred revenue balance as of
December 31, 2017
.
Our payment terms vary by the type and location of our customer and the products or services offered. The term between invoicing and when payment is due is not significant. For certain products or services and customer types, we require payment before the products or services are delivered to the customer.
Practical Expedients and Exemptions
We generally expense sales commissions when incurred because the amortization period would have been one year or less. These costs are recorded within sales and marketing expenses.
We do not disclose the value of unsatisfied performance obligations for (i) contracts with an original expected length of one year or less and (ii) contracts for which we recognize revenue at the amount to which we have the right to invoice for services performed.
Note 3.
Financial Instruments
Debt Securities
We classify our marketable debt securities within Level 2 in the fair value hierarchy because we use quoted market prices to the extent available or alternative pricing sources and models utilizing market observable inputs to determine fair value. In January 2018, we reclassified our U.S. government notes included in marketable debt securities from Level 1 to Level 2 within the fair value hierarchy as these securities are priced based on a combination of quoted prices for identical or similar instruments in active markets and models with significant observable market inputs. Prior period amounts have been reclassified to conform with current period presentation. The vast majority of our government bond holdings are highly liquid U.S. government notes.
We classify our non-marketable debt securities within Level 3 in the fair value hierarchy because they are preferred stock and convertible notes issued by private companies without quoted market prices. To estimate the fair value of
57
|
Alphabet Inc.
|
|
our non-marketable debt securities, we use a combination of valuation methodologies, including market and income approaches based on prior transaction prices; estimated timing, probability, and amount of cash flows; and illiquidity considerations. Financial information of private companies may not be available and consequently we estimate the fair value based on the best available information at the measurement date.
The following tables summarize our debt securities by significant investment categories as of
December 31, 2017
and
2018
(in millions):
|
|
As of December 31, 2017
|
||||||||||||||||||||||||||
|
|
Adjusted
Cost
|
Gross
Unrealized
Gains
|
Gross
Unrealized Losses |
Fair
Value |
Cash and
Cash Equivalents |
Marketable
Securities |
Non-Marketable
Securities |
||||||||||||||||||||
|
Level 2:
|
|||||||||||||||||||||||||||
|
Time deposits
(1)
|
$
|
359
|
|
$
|
0
|
|
$
|
0
|
|
$
|
359
|
|
$
|
357
|
|
$
|
2
|
|
$
|
0
|
|
||||||
|
Government bonds
(2)
|
51,548
|
|
10
|
|
(406
|
)
|
51,152
|
|
1,241
|
|
49,911
|
|
0
|
|
|||||||||||||
|
Corporate debt securities
|
24,269
|
|
21
|
|
(135
|
)
|
24,155
|
|
126
|
|
24,029
|
|
0
|
|
|||||||||||||
|
Mortgage-backed and asset-backed securities
|
16,789
|
|
13
|
|
(180
|
)
|
16,622
|
|
0
|
|
16,622
|
|
0
|
|
|||||||||||||
|
92,965
|
|
44
|
|
(721
|
)
|
92,288
|
|
1,724
|
|
90,564
|
|
0
|
|
||||||||||||||
|
Level 3:
|
|||||||||||||||||||||||||||
|
Non-marketable debt securities
|
1,083
|
|
811
|
|
0
|
|
1,894
|
|
0
|
|
0
|
|
1,894
|
|
|||||||||||||
|
Total
|
$
|
94,048
|
|
$
|
855
|
|
$
|
(721
|
)
|
$
|
94,182
|
|
$
|
1,724
|
|
$
|
90,564
|
|
$
|
1,894
|
|
||||||
|
|
As of December 31, 2018
|
||||||||||||||||||||||||||
|
|
Adjusted
Cost
|
Gross
Unrealized
Gains
|
Gross
Unrealized Losses |
Fair
Value |
Cash and
Cash
Equivalents
|
Marketable
Securities |
Non-Marketable
Securities |
||||||||||||||||||||
|
Level 2:
|
|||||||||||||||||||||||||||
|
Time deposits
(1)
|
$
|
2,202
|
|
$
|
0
|
|
$
|
0
|
|
$
|
2,202
|
|
$
|
2,202
|
|
$
|
0
|
|
$
|
0
|
|
||||||
|
Government bonds
(2)
|
53,634
|
|
71
|
|
(414
|
)
|
53,291
|
|
3,717
|
|
49,574
|
|
0
|
|
|||||||||||||
|
Corporate debt securities
|
25,383
|
|
15
|
|
(316
|
)
|
25,082
|
|
44
|
|
25,038
|
|
0
|
|
|||||||||||||
|
Mortgage-backed and asset-backed securities
|
16,918
|
|
11
|
|
(324
|
)
|
16,605
|
|
0
|
|
16,605
|
|
0
|
|
|||||||||||||
|
98,137
|
|
97
|
|
(1,054
|
)
|
97,180
|
|
5,963
|
|
91,217
|
|
0
|
|
||||||||||||||
|
Level 3:
|
|||||||||||||||||||||||||||
|
Non-marketable debt securities
|
147
|
|
116
|
|
0
|
|
263
|
|
0
|
|
0
|
|
263
|
|
|||||||||||||
|
Total
|
$
|
98,284
|
|
$
|
213
|
|
$
|
(1,054
|
)
|
$
|
97,443
|
|
$
|
5,963
|
|
$
|
91,217
|
|
$
|
263
|
|
||||||
|
(1)
|
As of December 31, 2017, the majority of our time deposits were foreign deposits. As of December 31, 2018, the majority of our time deposits are domestic deposits.
|
|
(2)
|
Government bonds are comprised primarily of U.S. government notes, and also includes U.S. government agencies, foreign government bonds, and municipal securities.
|
We determine realized gains or losses on the sale or extinguishment of debt securities on a specific identification method. We recognized gross realized gains of
$251 million
,
$185 million
, and
$1.3 billion
for the years ended
December 31, 2016
,
2017
, and
2018
, respectively. We recognized gross realized losses of
$304 million
,
$295 million
, and
$143 million
for the years ended
December 31, 2016
,
2017
, and
2018
, respectively. We reflect these gains and losses as a component of other income (expense), net, in the Consolidated Statements of Income.
The following table summarizes the estimated fair value of our investments in marketable debt securities with stated contractual maturity dates, accounted for as available-for-sale securities and classified by the contractual maturity date of the securities (in millions):
58
|
Alphabet Inc.
|
|
|
As of
December 31, 2018 |
|||
|
Due in 1 year
|
$
|
23,669
|
|
|
Due in 1 year through 5 years
|
54,504
|
|
|
|
Due in 5 years through 10 years
|
2,236
|
|
|
|
Due after 10 years
|
10,808
|
|
|
|
Total
|
$
|
91,217
|
|
The following tables present gross unrealized losses and fair values for those investments that were in an unrealized loss position as of
December 31, 2017
and
2018
, aggregated by investment category and the length of time that individual securities have been in a continuous loss position (in millions):
|
|
As of December 31, 2017
|
||||||||||||||||||||||
|
|
Less than 12 Months
|
12 Months or Greater
|
Total
|
||||||||||||||||||||
|
|
Fair Value
|
Unrealized
Loss |
Fair Value
|
Unrealized
Loss |
Fair Value
|
Unrealized
Loss |
|||||||||||||||||
|
Government bonds
(1)
|
$
|
28,836
|
|
$
|
(211
|
)
|
$
|
17,660
|
|
$
|
(195
|
)
|
$
|
46,496
|
|
$
|
(406
|
)
|
|||||
|
Corporate debt securities
|
18,300
|
|
(114
|
)
|
1,710
|
|
(21
|
)
|
20,010
|
|
(135
|
)
|
|||||||||||
|
Mortgage-backed and asset-backed securities
|
11,061
|
|
(105
|
)
|
3,449
|
|
(75
|
)
|
14,510
|
|
(180
|
)
|
|||||||||||
|
Total
|
$
|
58,197
|
|
$
|
(430
|
)
|
$
|
22,819
|
|
$
|
(291
|
)
|
$
|
81,016
|
|
$
|
(721
|
)
|
|||||
|
|
As of December 31, 2018
|
||||||||||||||||||||||
|
|
Less than 12 Months
|
12 Months or Greater
|
Total
|
||||||||||||||||||||
|
|
Fair Value
|
Unrealized
Loss
|
Fair Value
|
Unrealized
Loss
|
Fair Value
|
Unrealized
Loss |
|||||||||||||||||
|
Government bonds
(1)
|
$
|
12,019
|
|
$
|
(85
|
)
|
$
|
23,877
|
|
$
|
(329
|
)
|
$
|
35,896
|
|
$
|
(414
|
)
|
|||||
|
Corporate debt securities
|
10,171
|
|
(107
|
)
|
11,545
|
|
(209
|
)
|
21,716
|
|
(316
|
)
|
|||||||||||
|
Mortgage-backed and asset-backed securities
|
5,534
|
|
(75
|
)
|
8,519
|
|
(249
|
)
|
14,053
|
|
(324
|
)
|
|||||||||||
|
Total
|
$
|
27,724
|
|
$
|
(267
|
)
|
$
|
43,941
|
|
$
|
(787
|
)
|
$
|
71,665
|
|
$
|
(1,054
|
)
|
|||||
|
(1)
|
Government bonds are comprised primarily of U.S. government notes, and also includes U.S. government agencies, foreign government bonds, and municipal securities.
|
During the years ended December 31,
2016
,
2017
and
2018
, we did not recognize any significant other-than-temporary impairment losses. Losses on impairment are included as a component of other income (expense), net, in the Consolidated Statements of Income. See
Note 6
for further details on other income (expense), net.
The following table presents a reconciliation for our non-marketable debt securities measured and recorded at fair value on a recurring basis, using significant unobservable inputs (Level 3) (in millions):
|
Year Ended December 31,
|
|||||||
|
2017
|
2018
|
||||||
|
Beginning balance
|
$
|
1,165
|
|
$
|
1,894
|
|
|
|
Total net gains (losses)
|
|||||||
|
Included in earnings
|
(10
|
)
|
603
|
|
|||
|
Included in other comprehensive income
|
707
|
|
(1
|
)
|
|||
|
Purchases
|
88
|
|
47
|
|
|||
|
Sales
|
(2
|
)
|
(52
|
)
|
|||
|
Settlements
(1)
|
(54
|
)
|
(2,228
|
)
|
|||
|
Ending balance
|
$
|
1,894
|
|
$
|
263
|
|
|
|
(1)
|
During the year ended December 31, 2018 the terms of a non-marketable debt security were modified resulting in an unrealized
$1.3 billion
gain recognized in other income (expense), net and a reclassification of the security to non-marketable equity securities.
|
59
|
Alphabet Inc.
|
|
Equity Investments
The following discusses our marketable equity securities, non-marketable equity securities, realized and unrealized gains and losses on marketable and non-marketable equity securities, as well as our equity securities accounted for under the equity method.
Marketable equity securities
Our marketable equity securities are publicly traded stocks or funds measured at fair value and classified within Level 1 and 2 in the fair value hierarchy because we use quoted prices for identical assets in active markets or inputs that are based upon quoted prices for similar instruments in active markets.
Prior to January 1, 2018, we accounted for the majority of our marketable equity securities at fair value with unrealized gains and losses recognized in accumulated other comprehensive income on the balance sheet. Realized gains and losses on marketable equity securities sold or impaired were recognized in other income (expense), net.
Starting January 1, 2018, upon our adoption of ASU 2016-01, unrealized gains and losses during the year are recognized in other income (expense), net. Upon adoption, we reclassified
$98 million
net unrealized gains related to marketable equity securities from accumulated other comprehensive income to opening retained earnings.
The following table summarizes marketable equity securities measured at fair value by significant investment categories as of
December 31, 2017
and
2018
(in millions):
|
|
As of December 31, 2017
|
|||||||
|
|
Cash and Cash Equivalents
|
Marketable
Securities |
||||||
|
Level 1:
|
||||||||
|
Money market funds
|
$
|
1,833
|
|
$
|
0
|
|
||
|
Marketable equity securities
|
0
|
|
340
|
|
||||
|
1,833
|
|
340
|
|
|||||
|
Level 2:
|
||||||||
|
Mutual funds
(1)
|
0
|
|
252
|
|
||||
|
Total
|
$
|
1,833
|
|
$
|
592
|
|
||
(1)
The fair value option was elected for mutual funds with gains (losses) recognized in other income (expense), net.
|
|
As of December 31, 2018
|
|||||||
|
|
Cash and Cash Equivalents
|
Marketable
Securities |
||||||
|
Level 1:
|
||||||||
|
Money market funds
|
$
|
3,493
|
|
$
|
0
|
|
||
|
Marketable equity securities
|
0
|
|
994
|
|
||||
|
3,493
|
|
994
|
|
|||||
|
Level 2:
|
||||||||
|
Mutual funds
|
0
|
|
228
|
|
||||
|
Total
|
$
|
3,493
|
|
$
|
1,222
|
|
||
Non-marketable equity securities
Our non-marketable equity securities are investments in privately held companies without readily determinable market values.
Prior to January 1, 2018, we accounted for our non-marketable equity securities at cost less impairment. Realized gains and losses on non-marketable securities sold or impaired were recognized in other income (expense), net. As of December 31, 2017, non-marketable equity securities accounted for under the cost method had a carrying value of $
4.5 billion
and a fair value of approximately $
8.8 billion
.
On January 1, 2018, we adopted ASU 2016-01 which changed the way we account for non-marketable securities. The carrying value of our non-marketable equity securities is adjusted to fair value for observable transactions for identical or similar investments of the same issuer or impairment (referred to as the measurement alternative). All gains and losses on non-marketable equity securities, realized and unrealized, are recognized in other income (expense), net. Because we adopted ASU 2016-01 prospectively, we recognize unrealized gains that occurred in prior
60
|
Alphabet Inc.
|
|
periods in the first period after January 1, 2018 when there is an observable transaction for our securities. Non-marketable equity securities remeasured during the year ended
December 31, 2018
are classified within Level 3 in the fair value hierarchy because we estimate the value based on valuation methods using the observable transaction price at the transaction date and other unobservable inputs including volatility, rights, and obligations of the securities we hold.
The following is a summary of unrealized gains and losses recorded in other income (expense), net, and included as adjustments to the carrying value of non-marketable equity securities held as of
December 31, 2018
(in millions):
|
Twelve Months Ended December 31, 2018
|
|||
|
Upward adjustments
|
$
|
4,285
|
|
|
Downward adjustments (including impairment)
|
(178
|
)
|
|
|
Total unrealized gain (loss) for non-marketable equity securities
|
$
|
4,107
|
|
The following table summarizes the total carrying value of our non-marketable equity securities held as of
December 31, 2018
including cumulative unrealized upward and downward adjustments made to the initial cost basis of the securities (in millions):
|
Initial cost basis
(1)
|
$
|
8,168
|
|
|
Upward adjustments
|
4,285
|
|
|
|
Downward adjustments (including impairment)
|
(178
|
)
|
|
|
Total carrying value at the end of the period
|
$
|
12,275
|
|
|
(1)
|
Includes
$2.2 billion
for a non-marketable equity security reclassified from a non-marketable debt security during 2018.
|
During the year ended
December 31, 2018
, included in the
$12.3 billion
of non-marketable equity securities,
$6.9 billion
were measured at fair value based on observable market transactions, resulting in a net unrealized gain of
$4.1 billion
.
Gains and losses on marketable and non-marketable equity securities
Realized and unrealized gains and losses for our marketable and non-marketable equity securities for the year ended
December 31, 2018
are summarized below (in millions):
|
|
Twelve Months Ended December 31, 2018
|
||
|
Realized gain (loss) for equity securities sold during the period
|
$
|
1,458
|
|
|
Unrealized gain (loss) on equity securities held as of the end of the period
(1)
|
4,002
|
|
|
|
Total gain (loss) recognized in other income (expense), net
|
$
|
5,460
|
|
|
(1)
|
Includes
$4,107 million
related to non-marketable equity securities for the year ended
December 31, 2018
.
|
Equity securities accounted for under the Equity Method
As of
December 31, 2017
and
2018
, equity securities accounted for under the equity method had a carrying value of approximately
$1.4 billion
and
$1.3 billion
, respectively. Our share of gains and losses including impairment are included as a component of other income (expense), net, in the Consolidated Statements of Income. See
Note 6
for further details on other income (expense), net.
Derivative Financial Instruments
We classify our foreign currency and interest rate derivative contracts primarily within Level 2 in the fair value hierarchy as the valuation inputs are based on quoted prices and market observable data of similar instruments.
We recognize derivative instruments as either assets or liabilities in the Consolidated Balance Sheets at fair value. We record changes in the fair value (i.e., gains or losses) of the derivatives in the Consolidated Statements of Income as either other income (expense), net, or revenues, or in the Consolidated Balance Sheets in AOCI, as discussed below. As a result of our adoption of Accounting Standard Update No. 2017-12 (ASU 2017-12) "Derivatives and Hedging (Topic 815): Targeted Improvements to Accounting for Hedging Activities," the components excluded from the assessment of hedge effectiveness are recognized in the same income statement line as the hedged item beginning January 1, 2018.
61
|
Alphabet Inc.
|
|
We enter into foreign currency contracts with financial institutions to reduce the risk that our cash flows, earnings, and investment in foreign subsidiaries will be adversely affected by foreign currency exchange rate fluctuations. We also use interest rate derivative contracts to hedge interest rate exposures on our fixed income securities and debt issuances. Our program is not used for trading or speculative purposes.
We enter into master netting arrangements, which reduce credit risk by permitting net settlement of transactions with the same counterparty. To further reduce credit risk, we enter into collateral security arrangements under which the counterparty is required to provide collateral when the net fair value of certain financial instruments fluctuates from contractually established thresholds. We can take possession of the collateral in the event of counterparty default. As of
December 31, 2017
and
2018
, we received cash collateral related to the derivative instruments under our collateral security arrangements of
$15 million
and
$327 million
, respectively, which was included in other current assets.
Cash Flow Hedges
We use foreign currency forwards and option contracts, including collars (an option strategy comprised of a combination of purchased and written options), designated as cash flow hedges to hedge certain forecasted revenue transactions denominated in currencies other than the U.S. dollar. The notional principal of these contracts was approximately
$11.7 billion
and
$11.8 billion
as of
December 31, 2017
and
2018
, respectively. These contracts have maturities of
24 months
or less.
For forwards and option contracts, we exclude the change in the forward points and time value from our assessment of hedge effectiveness. The initial value of the excluded component is amortized on a straight-line basis over the life of the hedging instrument and recognized in revenues. The difference between fair value changes of the excluded component and the amount amortized to revenues is recorded in AOCI. We reflect the gains or losses of a cash flow hedge included in our hedge effective assessment as a component of AOCI and subsequently reclassify these gains and losses to revenues when the hedged transactions are recorded. If the hedged transactions become probable of not occurring, the corresponding amounts in AOCI are immediately reclassified to other income (expense), net.
As of
December 31, 2018
, the net gain or loss of our foreign currency cash flow hedges before tax effect was a net accumulated gain of
$247 million
, of which a net gain of
$247 million
is expected to be reclassified from AOCI into earnings within the next 12 months.
Fair Value Hedges
We use forward contracts designated as fair value hedges to hedge foreign currency risks for our investments denominated in currencies other than the U.S. dollar. We exclude changes in forward points for the forward contracts from the assessment of hedge effectiveness. We recognize changes in the excluded component in other income (expense), net. The notional principal of these contracts was
$2.9 billion
and
$2.0 billion
as of
December 31, 2017
and
2018
, respectively.
Gains and losses on these forward contracts are recognized in other income (expense), net, along with the offsetting gains and losses of the related hedged items.
Net Investment Hedges
During the year ended
December 31, 2018
, we entered into forward contracts designated as net investment hedges to hedge the foreign currency risks related to our investment in foreign subsidiaries. We exclude changes in forward points for the forward contracts from the assessment of hedge effectiveness. We recognize changes in the excluded component in other income (expense), net. The notional principal of these contracts was
$6.7 billion
as of
December 31, 2018
.
Gains and losses on these forward contracts are recognized in AOCI as part of the foreign currency translation adjustment.
Other Derivatives
Other derivatives not designated as hedging instruments consist of foreign currency forward contracts that we use to hedge intercompany transactions and other monetary assets or liabilities denominated in currencies other than the local currency of a subsidiary. We recognize gains and losses on these contracts, as well as the related costs in other income (expense), net, along with the foreign currency gains and losses on monetary assets and liabilities. The notional principal of the outstanding foreign exchange contracts was
$15.2 billion
and
$20.1 billion
as of
December 31, 2017
and
2018
, respectively.
62
|
Alphabet Inc.
|
|
The fair values of our outstanding derivative instruments were as follows (in millions):
|
|
|
As of December 31, 2017
|
||||||||||||
|
|
Balance Sheet Location
|
Fair Value of
Derivatives Designated as Hedging Instruments |
Fair Value of
Derivatives Not Designated as Hedging Instruments |
Total Fair
Value |
||||||||||
|
Derivative Assets:
|
||||||||||||||
|
Level 2:
|
||||||||||||||
|
Foreign exchange contracts
|
Other current and non-current assets
|
$
|
51
|
|
$
|
29
|
|
$
|
80
|
|
||||
|
Total
|
$
|
51
|
|
$
|
29
|
|
$
|
80
|
|
|||||
|
Derivative Liabilities:
|
||||||||||||||
|
Level 2:
|
||||||||||||||
|
Foreign exchange contracts
|
Accrued expenses and other liabilities, current and non-current
|
$
|
230
|
|
$
|
122
|
|
$
|
352
|
|
||||
|
Total
|
$
|
230
|
|
$
|
122
|
|
$
|
352
|
|
|||||
|
|
|
As of December 31, 2018
|
||||||||||||
|
|
Balance Sheet Location
|
Fair Value of
Derivatives Designated as Hedging Instruments |
Fair Value of
Derivatives Not Designated as Hedging Instruments |
Total Fair
Value |
||||||||||
|
Derivative Assets:
|
||||||||||||||
|
Level 2:
|
||||||||||||||
|
Foreign exchange contracts
|
Other current and non-current assets
|
$
|
459
|
|
$
|
54
|
|
$
|
513
|
|
||||
|
Total
|
$
|
459
|
|
$
|
54
|
|
$
|
513
|
|
|||||
|
Derivative Liabilities:
|
||||||||||||||
|
Level 2:
|
||||||||||||||
|
Foreign exchange contracts
|
Accrued expenses and other liabilities, current and non-current
|
$
|
5
|
|
$
|
228
|
|
$
|
233
|
|
||||
|
Total
|
$
|
5
|
|
$
|
228
|
|
$
|
233
|
|
|||||
The gains (losses) on derivatives in cash flow hedging and net investment hedging relationships recognized in other comprehensive income (OCI) are summarized below (in millions):
|
|
Gains (Losses) Recognized in OCI
on Derivatives Before Tax Effect
|
|||||||||||
|
|
Year Ended December 31,
|
|||||||||||
|
2016
|
2017
|
2018
|
||||||||||
|
Derivatives in Cash Flow Hedging Relationship:
|
||||||||||||
|
Foreign exchange contracts
|
||||||||||||
|
Amount included in the assessment of effectiveness
|
$
|
773
|
|
$
|
(955
|
)
|
$
|
332
|
|
|||
|
Amount excluded from the assessment of effectiveness
|
0
|
|
0
|
|
26
|
|
||||||
|
Derivatives in Net Investment Hedging Relationship:
|
||||||||||||
|
Foreign exchange contracts
|
||||||||||||
|
Amount included in the assessment of effectiveness
|
0
|
|
0
|
|
136
|
|
||||||
|
Total
|
$
|
773
|
|
$
|
(955
|
)
|
$
|
494
|
|
|||
63
|
Alphabet Inc.
|
|
The effect of derivative instruments on income is summarized below (in millions):
|
|
Gains (Losses) Recognized in Income
|
||||||||||||||||||||||
|
Year Ended December 31,
|
|||||||||||||||||||||||
|
2016
|
2017
|
2018
|
|||||||||||||||||||||
|
Revenues
|
Other income (expense), net
|
Revenues
|
Other income (expense), net
|
Revenues
|
Other income (expense), net
|
||||||||||||||||||
|
Total amounts presented in the Consolidated Statements of Income in which the effects of cash flow and fair value hedges are recorded
|
$
|
90,272
|
|
$
|
434
|
|
$
|
110,855
|
|
$
|
1,047
|
|
$
|
136,819
|
|
$
|
8,592
|
|
|||||
|
Gains (Losses) on Derivatives in Cash Flow Hedging Relationship:
|
|||||||||||||||||||||||
|
Foreign exchange contracts
|
|||||||||||||||||||||||
|
Amount of gains (losses) reclassified from AOCI to income
|
$
|
539
|
|
$
|
0
|
|
$
|
(169
|
)
|
$
|
0
|
|
$
|
(139
|
)
|
$
|
0
|
|
|||||
|
Amount excluded from the assessment of effectiveness recognized in earnings based on an amortization approach
|
0
|
|
0
|
|
0
|
|
0
|
|
1
|
|
0
|
|
|||||||||||
|
Amount excluded from the assessment of effectiveness
|
0
|
|
(381
|
)
|
0
|
|
83
|
|
0
|
|
0
|
|
|||||||||||
|
Gains (Losses) on Derivatives in Fair Value Hedging Relationship:
|
|||||||||||||||||||||||
|
Foreign exchange contracts
|
|||||||||||||||||||||||
|
Hedged items
|
0
|
|
(139
|
)
|
0
|
|
197
|
|
0
|
|
(96
|
)
|
|||||||||||
|
Derivatives designated as hedging instruments
|
0
|
|
139
|
|
0
|
|
(197
|
)
|
0
|
|
96
|
|
|||||||||||
|
Amount excluded from the assessment of effectiveness
|
0
|
|
6
|
|
0
|
|
23
|
|
0
|
|
37
|
|
|||||||||||
|
Gains (Losses) on Derivatives in Net Investment Hedging Relationship:
|
|||||||||||||||||||||||
|
Foreign exchange contracts
|
|||||||||||||||||||||||
|
Amount excluded from the assessment of effectiveness
|
0
|
|
0
|
|
0
|
|
0
|
|
0
|
|
78
|
|
|||||||||||
|
Gains (Losses) on Derivatives Not Designated as Hedging Instruments:
|
|||||||||||||||||||||||
|
Foreign exchange contracts
|
|||||||||||||||||||||||
|
Derivatives not designated as hedging instruments
|
0
|
|
130
|
|
0
|
|
(230
|
)
|
0
|
|
54
|
|
|||||||||||
|
Total gains (losses)
|
$
|
539
|
|
$
|
(245
|
)
|
$
|
(169
|
)
|
$
|
(124
|
)
|
$
|
(138
|
)
|
$
|
169
|
|
|||||
Offsetting of Derivatives
We present our forwards and purchased options at gross fair values in the Consolidated Balance Sheets. For foreign currency collars, we present at net fair values where both purchased and written options are with the same counterparty. Our master netting and other similar arrangements allow net settlements under certain conditions. As of
December 31, 2017
and
2018
, information related to these offsetting arrangements were as follows (in millions):
64
|
Alphabet Inc.
|
|
Offsetting of Assets
|
As of December 31, 2017
|
|||||||||||||||||||||||||||
|
Gross Amounts Not Offset in the Consolidated Balance Sheets, but Have Legal Rights to Offset
|
|||||||||||||||||||||||||||
|
Gross Amounts of Recognized Assets
|
Gross Amounts Offset in the Consolidated Balance Sheets
|
Net Presented in the Consolidated Balance Sheets
|
Financial Instruments
|
Cash Collateral Received
|
Non-Cash Collateral Received
|
Net Assets Exposed
|
|||||||||||||||||||||
|
Derivatives
|
$
|
102
|
|
$
|
(22
|
)
|
$
|
80
|
|
$
|
(64
|
)
|
(1)
|
$
|
(4
|
)
|
$
|
(2
|
)
|
$
|
10
|
|
|||||
|
As of December 31, 2018
|
|||||||||||||||||||||||||||
|
Gross Amounts Not Offset in the Consolidated Balance Sheets, but Have Legal Rights to Offset
|
|||||||||||||||||||||||||||
|
Gross Amounts of Recognized Assets
|
Gross Amounts Offset in the Consolidated Balance Sheets
|
Net Presented in the Consolidated Balance Sheets
|
Financial Instruments
|
Cash Collateral Received
|
Non-Cash Collateral Received
|
Net Assets Exposed
|
|||||||||||||||||||||
|
Derivatives
|
$
|
569
|
|
$
|
(56
|
)
|
$
|
513
|
|
$
|
(90
|
)
|
(1)
|
$
|
(307
|
)
|
$
|
(14
|
)
|
$
|
102
|
|
|||||
|
(1)
|
The balances as of
December 31, 2017
and
2018
were related to derivative liabilities which are allowed to be net settled against derivative assets in accordance with our master netting agreements.
|
Offsetting of Liabilities
|
As of December 31, 2017
|
|||||||||||||||||||||||||||
|
Gross Amounts Not Offset in the Consolidated Balance Sheets, but Have Legal Rights to Offset
|
|||||||||||||||||||||||||||
|
Gross Amounts of Recognized Liabilities
|
Gross Amounts Offset in the Consolidated Balance Sheets
|
Net Presented in the Consolidated Balance Sheets
|
Financial Instruments
|
Cash Collateral Pledged
|
Non-Cash Collateral Pledged
|
Net Liabilities
|
|||||||||||||||||||||
|
Derivatives
|
$
|
374
|
|
$
|
(22
|
)
|
$
|
352
|
|
$
|
(64
|
)
|
(2)
|
$
|
0
|
|
$
|
0
|
|
$
|
288
|
|
|||||
|
As of December 31, 2018
|
|||||||||||||||||||||||||||
|
Gross Amounts Not Offset in the Consolidated Balance Sheets, but Have Legal Rights to Offset
|
|||||||||||||||||||||||||||
|
Gross Amounts of Recognized Liabilities
|
Gross Amounts Offset in the Consolidated Balance Sheets
|
Net Presented in the Consolidated Balance Sheets
|
Financial Instruments
|
Cash Collateral Pledged
|
Non-Cash Collateral Pledged
|
Net Liabilities
|
|||||||||||||||||||||
|
Derivatives
|
$
|
289
|
|
$
|
(56
|
)
|
$
|
233
|
|
$
|
(90
|
)
|
(2)
|
$
|
0
|
|
$
|
0
|
|
$
|
143
|
|
|||||
|
(2)
|
The balances as of
December 31, 2017
and
2018
were related to derivative assets which are allowed to be net settled against derivative liabilities in accordance with our master netting agreements.
|
Note 4.
Variable Interest Entities (VIEs)
Consolidated VIEs
We consolidate VIEs in which we hold a variable interest and are the primary beneficiary. We are the primary beneficiary because we have the power to direct activities that most significantly affect their economic performance and have the obligation to absorb the majority of their losses or benefits. The results of operations and financial position of these VIEs are included in our consolidated financial statements.
For certain consolidated VIEs, their assets are not available to us and their creditors do not have recourse to us. As of
December 31, 2017
and
2018
, assets that can only be used to settle obligations of these VIEs were
$1.7 billion
and
$2.4 billion
, respectively, and the liabilities for which creditors only have recourse to the VIEs were
$997 million
and
$909 million
, respectively.
Calico
Calico is a life science company with a mission to harness advanced technologies to increase our understanding of the biology that controls lifespan.
65
|
Alphabet Inc.
|
|
In September 2014, AbbVie Inc. (AbbVie) and Calico entered into a research and development collaboration agreement intended to help both companies discover, develop, and bring to market new therapies for patients with age-related diseases, including neurodegeneration and cancer. In the second quarter of 2018, AbbVie and Calico amended the collaboration agreement resulting in an increase in total commitments. As of
December 31, 2018
, AbbVie has contributed
$750 million
to fund the collaboration pursuant to the agreement and is committed to an additional
$500 million
which will be paid by the fourth quarter of 2019. As of
December 31, 2018
, Calico has contributed
$500 million
and has committed up to an additional
$750 million
.
Calico has used its scientific expertise to establish a world-class research and development facility, with a focus on drug discovery and early drug development; and AbbVie provides scientific and clinical development support and its commercial expertise to bring new discoveries to market. Both companies share costs and profits for projects covered under this agreement equally. AbbVie's contribution has been recorded as a liability on Calico's financial statements, which is reduced and reflected as a reduction to research and development expense as eligible research and development costs are incurred by Calico.
As of
December 31, 2018
, we have contributed
$480 million
to Calico in exchange for Calico convertible preferred units and are committed to fund up to an additional
$750 million
on an as-needed basis and subject to certain conditions.
Verily
Verily is a life science company with a mission to make the world's health data useful so that people enjoy healthier lives.
In 2017, Temasek, a Singapore-based investment company, purchased a noncontrolling interest in Verily for an aggregate of
$800 million
in cash.
In December 2018, Verily received
$900 million
in cash from a
$1.0 billion
investment round. The remaining
$100 million
is expected to be received in the first quarter of 2019.
These transactions were accounted for as equity transactions and no gain or loss was recognized.
Unconsolidated VIEs
Certain renewable energy investments included in our non-marketable equity investments accounted for under the equity method are VIEs. These entities' activities involve power generation using renewable sources. We have determined that the governance structures of these entities do not allow us to direct the activities that would significantly affect their economic performance such as setting operating budgets. Therefore, we do not consolidate these VIEs in our consolidated financial statements. The carrying value and maximum exposure of these VIEs were
$896 million
and
$705 million
as of
December 31, 2017
and
2018
, respectively. The maximum exposure is based on current investments to date. We have determined the single source of our exposure to these VIEs is our capital investment in them.
Other unconsolidated VIEs were not material as of
December 31, 2017
and
2018
.
Note 5.
Debt
Short-Term Debt
We have a debt financing program of up to
$5.0 billion
through the issuance of commercial paper. Net proceeds from this program are used for general corporate purposes. We had
no
commercial paper outstanding as of
December 31, 2017
and
2018
.
Long-Term Debt
Google issued
$3.0 billion
of senior unsecured notes in
three
tranches (collectively, 2011 Notes) in May 2011, due in 2014, 2016, and 2021, as well as
$1.0 billion
of senior unsecured notes (2014 Notes) in February 2014 due in 2024.
In April 2016, we completed an exchange offer with eligible holders of Google’s 2011 Notes due 2021 and 2014 Notes due 2024 (collectively, the Google Notes). An aggregate principal amount of approximately
$1.7 billion
of the Google Notes was exchanged for approximately
$1.7 billion
of Alphabet notes with identical interest rate and maturity. Because the exchange was between a parent and the subsidiary company and for substantially identical notes, the change was treated as a debt modification for accounting purposes with
no
gain or loss recognized.
In August 2016, Alphabet issued
$2.0 billion
of senior unsecured notes (2016 Notes) due 2026. The net proceeds from the issuance of the 2016 Notes were used for general corporate purposes, including the repayment of outstanding
66
|
Alphabet Inc.
|
|
commercial paper. The Alphabet notes due in 2021, 2024, and 2026 rank equally with each other and are structurally subordinate to the outstanding Google Notes.
The total outstanding long-term debt is summarized below (in millions):
|
|
As of
December 31, 2017 |
As of
December 31, 2018 |
|||||
|
3.625% Notes due on May 19, 2021
|
$
|
1,000
|
|
$
|
1,000
|
|
|
|
3.375% Notes due on February 25, 2024
|
1,000
|
|
1,000
|
|
|||
|
1.998% Notes due on August 15, 2026
|
2,000
|
|
2,000
|
|
|||
|
Unamortized discount for the Notes above
|
(57
|
)
|
(50
|
)
|
|||
|
Subtotal
(1)
|
3,943
|
|
3,950
|
|
|||
|
Capital lease obligation
|
26
|
|
62
|
|
|||
|
Total long-term debt
|
$
|
3,969
|
|
$
|
4,012
|
|
|
|
(1)
|
Includes the outstanding (and unexchanged) Google Notes issued in 2011 and 2014 and the Alphabet notes exchanged in 2016.
|
The effective interest yields based on proceeds received from the outstanding notes due in 2021, 2024, and 2026 were
3.734%
,
3.377%
, and
2.231%
, respectively, with interest payable semi-annually. We may redeem these notes at any time in whole or in part at specified redemption prices. The total estimated fair value of all outstanding notes was approximately
$4.0 billion
and
$3.9 billion
as of
December 31, 2017
and
2018
, respectively. The fair value was determined based on observable market prices of identical instruments in less active markets and is categorized accordingly as Level 2 in the fair value hierarchy.
As of
December 31, 2018
, the aggregate future principal payments for long-term debt including long-term capital leases for each of the next five years and thereafter are as follows (in millions):
|
2019
|
$
|
0
|
|
|
|
2020
|
14
|
|
||
|
2021
|
1,003
|
|
||
|
2022
|
3
|
|
||
|
2023
|
3
|
|
||
|
Thereafter
|
3,039
|
|
||
|
Total
|
$
|
4,062
|
|
|
Credit Facility
As of
December 31, 2018
, we have
$4.0 billion
of revolving credit facilities which expire in July 2023. The interest rate for the credit facilities is determined based on a formula using certain market rates.
No
amounts were outstanding under the credit facilities as of
December 31, 2017
and
2018
.
Note 6.
Supplemental Financial Statement Information
Property and Equipment, Net
Property and equipment, net, consisted of the following (in millions):
|
As of
December 31, 2017 |
As of
December 31, 2018 |
||||||
|
Land and buildings
|
$
|
23,183
|
|
$
|
30,179
|
|
|
|
Information technology assets
|
21,429
|
|
30,119
|
|
|||
|
Construction in progress
|
10,491
|
|
16,838
|
|
|||
|
Leasehold improvements
|
4,496
|
|
5,310
|
|
|||
|
Furniture and fixtures
|
48
|
|
61
|
|
|||
|
Property and equipment, gross
|
59,647
|
|
82,507
|
|
|||
|
Less: accumulated depreciation
|
(17,264
|
)
|
(22,788
|
)
|
|||
|
Property and equipment, net
|
$
|
42,383
|
|
$
|
59,719
|
|
|
67
|
Alphabet Inc.
|
|
As of
December 31, 2017
and
2018
, assets under capital lease with a cost basis of
$390 million
and
$648 million
, respectively, were included in property and equipment.
Accrued Expenses and Other Current Liabilities
Accrued expenses and other current liabilities consisted of the following (in millions):
|
As of
December 31, 2017 |
As of
December 31, 2018 |
||||||
|
European Commission fines
(1)
|
$
|
2,874
|
|
$
|
7,754
|
|
|
|
Accrued customer liabilities
|
1,489
|
|
1,810
|
|
|||
|
Other accrued expenses and current liabilities
|
5,814
|
|
7,394
|
|
|||
|
Accrued expenses and other current liabilities
|
$
|
10,177
|
|
$
|
16,958
|
|
|
|
(1)
|
Includes the effects of foreign exchange and interest.
See
Note 9
for further details
|
Accumulated Other Comprehensive Income (Loss)
The components of AOCI, net of tax, were as follows (in millions):
|
Foreign Currency Translation Adjustments
|
Unrealized Gains (Losses) on Available-for-Sale Investments
|
Unrealized Gains (Losses) on Cash Flow Hedges
|
Total
|
||||||||||||
|
Balance as of December 31, 2015
|
$
|
(2,047
|
)
|
$
|
(86
|
)
|
$
|
259
|
|
$
|
(1,874
|
)
|
|||
|
Other comprehensive income (loss) before reclassifications
|
(599
|
)
|
(314
|
)
|
515
|
|
(398
|
)
|
|||||||
|
Amounts reclassified from AOCI
|
0
|
|
221
|
|
(351
|
)
|
(130
|
)
|
|||||||
|
Other comprehensive income (loss)
|
(599
|
)
|
(93
|
)
|
164
|
|
(528
|
)
|
|||||||
|
Balance as of December 31, 2016
|
$
|
(2,646
|
)
|
$
|
(179
|
)
|
$
|
423
|
|
$
|
(2,402
|
)
|
|||
|
Other comprehensive income (loss) before reclassifications
|
1,543
|
|
307
|
|
(638
|
)
|
1,212
|
|
|||||||
|
Amounts reclassified from AOCI
|
0
|
|
105
|
|
93
|
|
198
|
|
|||||||
|
Other comprehensive income (loss)
|
1,543
|
|
412
|
|
(545
|
)
|
1,410
|
|
|||||||
|
Balance as of December 31, 2017
|
$
|
(1,103
|
)
|
$
|
233
|
|
$
|
(122
|
)
|
$
|
(992
|
)
|
|||
|
Other comprehensive income (loss) before reclassifications
(1)
|
(781
|
)
|
(10
|
)
|
264
|
|
(527
|
)
|
|||||||
|
Amounts excluded from the assessment of hedge effectiveness recorded in AOCI
|
0
|
|
0
|
|
26
|
|
26
|
|
|||||||
|
Amounts reclassified from AOCI
|
0
|
|
(911
|
)
|
98
|
|
(813
|
)
|
|||||||
|
Other comprehensive income (loss)
|
(781
|
)
|
(921
|
)
|
388
|
|
(1,314
|
)
|
|||||||
|
Balance as of December 31, 2018
|
$
|
(1,884
|
)
|
$
|
(688
|
)
|
$
|
266
|
|
$
|
(2,306
|
)
|
|||
|
(1)
|
The change in unrealized gains (losses) on available-for-sale investments included a
$98 million
adjustment of net unrealized gains related to marketable equity securities from AOCI to opening retained earnings as a result of the adoption of ASU 2016-01 on January 1, 2018.
|
68
|
Alphabet Inc.
|
|
The effects on net income of amounts reclassified from AOCI were as follows (in millions):
|
|
Gains (Losses) Reclassified from AOCI to the Consolidated Statements of Income
|
|||||||||||||
|
Year Ended December 31,
|
||||||||||||||
|
AOCI Components
|
Location
|
2016
|
2017
|
2018
|
||||||||||
|
Unrealized gains (losses) on available-for-sale investments
|
||||||||||||||
|
Other income (expense), net
|
$
|
(221
|
)
|
$
|
(105
|
)
|
$
|
1,190
|
|
|||||
|
Provision for income taxes
|
0
|
|
0
|
|
(279
|
)
|
||||||||
|
Net of tax
|
$
|
(221
|
)
|
$
|
(105
|
)
|
$
|
911
|
|
|||||
|
Unrealized gains (losses) on cash flow hedges
|
||||||||||||||
|
Foreign exchange contracts
|
Revenue
|
$
|
539
|
|
$
|
(169
|
)
|
$
|
(139
|
)
|
||||
|
Interest rate contracts
|
Other income (expense), net
|
5
|
|
5
|
|
6
|
|
|||||||
|
Benefit (provision) for income taxes
|
(193
|
)
|
71
|
|
35
|
|
||||||||
|
Net of tax
|
$
|
351
|
|
$
|
(93
|
)
|
$
|
(98
|
)
|
|||||
|
Total amount reclassified, net of tax
|
$
|
130
|
|
$
|
(198
|
)
|
$
|
813
|
|
|||||
Other Income (Expense), Net
The components of other income (expense), net, were as follows (in millions):
|
|
Year Ended December 31,
|
||||||||||
|
|
2016
|
2017
|
2018
|
||||||||
|
Interest income
|
$
|
1,220
|
|
$
|
1,312
|
|
$
|
1,878
|
|
||
|
Interest expense
(1)
|
(124
|
)
|
(109
|
)
|
(114
|
)
|
|||||
|
Foreign currency exchange losses, net
(2)
|
(475
|
)
|
(121
|
)
|
(80
|
)
|
|||||
|
Gain (loss) on debt securities, net
(3)
|
(53
|
)
|
(110
|
)
|
1,190
|
|
|||||
|
Gain (loss) on equity securities, net
|
(20
|
)
|
73
|
|
5,460
|
|
|||||
|
Loss and impairment from equity method investments, net
|
(202
|
)
|
(156
|
)
|
(120
|
)
|
|||||
|
Other
|
88
|
|
158
|
|
378
|
|
|||||
|
Other income (expense), net
|
$
|
434
|
|
$
|
1,047
|
|
$
|
8,592
|
|
||
|
(1)
|
Interest expense is net of interest capitalized of
$0 million
,
$48 million
, and
$92 million
for the years ended
December 31, 2016
,
2017
, and
2018
, respectively.
|
|
(2)
|
Our foreign currency exchange losses, net, are related to the option premium costs and forwards points for our foreign currency hedging contracts, our foreign exchange transaction gains and losses from the conversion of the transaction currency to the functional currency, offset by the foreign currency hedging contract losses and gains. The net foreign currency transaction losses were
$112 million
,
$226 million
, and
$195 million
for the years ended
December 31, 2016
,
2017
, and
2018
, respectively.
|
|
(3)
|
During the year ended December 31, 2018, the terms of a non-marketable debt security were modified resulting in an unrealized
$1.3 billion
gain.
|
Note 7.
Acquisitions
2018 Acquisitions
HTC Corporation (HTC)
In January 2018, we completed the acquisition of a team of engineers and a non-exclusive license of intellectual property from HTC for
$1.1 billion
in cash. In aggregate,
$10 million
was cash acquired,
$165 million
was attributed to intangible assets,
$934 million
was attributed to goodwill, and
$9 million
was attributed to net liabilities assumed. Goodwill, which was included in the Google segment, is not deductible for tax purposes. We expect this transaction to accelerate Google’s ongoing hardware efforts. The transaction was accounted for as a business combination.
Other Acquisitions
During the year ended
December 31, 2018
, we completed
other
acquisitions and purchases of intangible assets for total consideration of approximately
$573 million
. In aggregate,
$10 million
was cash acquired,
$295 million
was attributed to intangible assets,
$293 million
was attributed to goodwill, and
$25 million
was attributed to
net liabilities
69
|
Alphabet Inc.
|
|
assumed
. These acquisitions generally enhance the breadth and depth of our offerings and expand our expertise in engineering and other functional areas. The amount of goodwill expected to be deductible for tax purposes is approximately
$81 million
.
Pro forma results of operations for these acquisitions, including HTC, have not been presented because they are not material to the consolidated results of operations, either individually or in the aggregate.
For all intangible assets acquired and purchased during the year ended
December 31, 2018
, patents and developed technology have a weighted-average useful life of
3.7
years, customer relationships have a weighted-average useful life of
2.3
years, and trade names and other have a weighted-average useful life of
3.7
years.
2017 Acquisitions
During the year ended
December 31, 2017
, we completed
various
acquisitions and purchases of intangible assets for total consideration of approximately
$322 million
. In aggregate,
$12 million
was cash acquired,
$117 million
was attributed to intangible assets,
$221 million
was attributed to goodwill, and
$28 million
was attributed to
net liabilities assumed
. These acquisitions generally enhance the breadth and depth of our offerings and expand our expertise in engineering and other functional areas. The amount of goodwill expected to be deductible for tax purposes is approximately
$60 million
.
Pro forma results of operations for these acquisitions have not been presented because they are not material to the consolidated results of operations, either individually or in aggregate.
For all intangible assets acquired and purchased during the year ended
December 31, 2017
, patents and developed technology have a weighted-average useful life of
3.7
years, customer relationships have a weighted-average useful life of
2.0
years, and trade names and other have a weighted-average useful life of
8.8
years.
Note 8.
Goodwill and Other Intangible Assets
Goodwill
Changes in the carrying amount of goodwill for the years ended
December 31, 2017
and
2018
were as follows (in millions):
|
Google
|
Other Bets
|
Total Consolidated
|
|||||||||
|
Balance as of December 31, 2016
|
$
|
16,027
|
|
$
|
441
|
|
$
|
16,468
|
|
||
|
Acquisitions
|
212
|
|
9
|
|
221
|
|
|||||
|
Foreign currency translation and other adjustments
|
56
|
|
2
|
|
58
|
|
|||||
|
Balance as of December 31, 2017
|
16,295
|
|
452
|
|
16,747
|
|
|||||
|
Acquisitions
|
1,227
|
|
0
|
|
1,227
|
|
|||||
|
Transfers
|
80
|
|
(80
|
)
|
0
|
|
|||||
|
Foreign currency translation and other adjustments
|
(81
|
)
|
(5
|
)
|
(86
|
)
|
|||||
|
Balance as of December 31, 2018
|
$
|
17,521
|
|
$
|
367
|
|
$
|
17,888
|
|
||
Other Intangible Assets
Information regarding purchased intangible assets were as follows (in millions):
|
|
As of December 31, 2017
|
||||||||||
|
|
Gross
Carrying
Amount
|
Accumulated
Amortization
|
Net
Carrying
Amount
|
||||||||
|
Patents and developed technology
|
$
|
5,260
|
|
$
|
3,040
|
|
$
|
2,220
|
|
||
|
Customer relationships
|
359
|
|
263
|
|
96
|
|
|||||
|
Trade names and other
|
544
|
|
168
|
|
376
|
|
|||||
|
Total
|
$
|
6,163
|
|
$
|
3,471
|
|
$
|
2,692
|
|
||
70
|
Alphabet Inc.
|
|
|
|
As of December 31, 2018
|
||||||||||
|
|
Gross
Carrying
Amount
|
Accumulated
Amortization
|
Net
Carrying
Value
|
||||||||
|
Patents and developed technology
|
$
|
5,125
|
|
$
|
3,394
|
|
$
|
1,731
|
|
||
|
Customer relationships
|
349
|
|
308
|
|
41
|
|
|||||
|
Trade names and other
|
703
|
|
255
|
|
448
|
|
|||||
|
Total
|
$
|
6,177
|
|
$
|
3,957
|
|
$
|
2,220
|
|
||
Patents and developed technology, customer relationships, and trade names and other have weighted-average remaining useful lives of
3.0
years,
0.5
years, and
3.8
years, respectively.
Amortization expense relating to purchased intangible assets was
$833 million
,
$796 million
, and
$865 million
for the years ended
December 31, 2016
,
2017
, and
2018
, respectively.
As of
December 31, 2018
, expected amortization expense relating to purchased intangible assets for each of the next five years and thereafter is as follows (in millions):
|
2019
|
$
|
712
|
|
|
2020
|
585
|
|
|
|
2021
|
533
|
|
|
|
2022
|
201
|
|
|
|
2023
|
7
|
|
|
|
Thereafter
|
182
|
|
|
|
$
|
2,220
|
|
|
Note 9.
Commitments and Contingencies
Operating Leases
We have entered into various non-cancelable operating lease agreements for data centers and land and offices throughout the world with lease periods expiring between
2019
and
2063
. We are committed to pay a portion of the actual operating expenses under certain of these lease agreements. These operating expenses are not included in the table below. Certain of these arrangements have free or escalating rent payment provisions. We recognize rent expense on a straight-line basis.
As of
December 31, 2018
, future minimum payments under operating leases having initial or remaining non-cancelable lease terms in excess of one year, net of sublease income amounts, were as follows (in millions):
|
Operating
Leases
(1)
|
Sub-lease
Income
|
Net Operating Leases
|
|||||||||
|
2019
|
$
|
1,319
|
|
$
|
16
|
|
$
|
1,303
|
|
||
|
2020
|
1,397
|
|
13
|
|
1,384
|
|
|||||
|
2021
|
1,337
|
|
10
|
|
1,327
|
|
|||||
|
2022
|
1,153
|
|
8
|
|
1,145
|
|
|||||
|
2023
|
980
|
|
3
|
|
977
|
|
|||||
|
Thereafter
|
3,916
|
|
5
|
|
3,911
|
|
|||||
|
Total minimum payments
|
$
|
10,102
|
|
$
|
55
|
|
|
$
|
10,047
|
|
|
|
(1)
|
Includes future minimum payments for leases which have not yet commenced.
|
We have entered into certain non-cancelable lease agreements with lease periods expiring between
2021
and
2044
where we are the deemed owner for accounting purposes of new construction projects. Excluded from the table above are future minimum lease payments under such leases totaling approximately
$3.5 billion
, for which a
$1.5 billion
liability is included on the Consolidated Balance Sheets as of
December 31, 2018
.
Rent expense under operating leases was
$897 million
,
$1.1 billion
, and
$1.3 billion
for the years ended December 31,
2016
,
2017
, and
2018
, respectively.
71
|
Alphabet Inc.
|
|
Purchase Obligations
As of
December 31, 2018
, we had
$7.4 billion
of other non-cancelable contractual obligations, primarily related to data center operations and build-outs, digital media content licensing, and purchases of inventory.
Indemnifications
In the normal course of business, to facilitate transactions in our services and products, we indemnify certain parties, including advertisers, Google Network Members, and lessors with respect to certain matters. We have agreed to hold certain parties harmless against losses arising from a breach of representations or covenants, or out of intellectual property infringement or other claims made against certain parties. Several of these agreements limit the time within which an indemnification claim can be made and the amount of the claim. In addition, we have entered into indemnification agreements with our officers and directors, and our bylaws contain similar indemnification obligations to our agents.
It is not possible to make a reasonable estimate of the maximum potential amount under these indemnification agreements due to the unique facts and circumstances involved in each particular agreement. Additionally, we have a limited history of prior indemnification claims and the payments we have made under such agreements have not had a material adverse effect on our results of operations, cash flows, or financial position. However, to the extent that valid indemnification claims arise in the future, future payments by us could be significant and could have a material adverse effect on our results of operations or cash flows in a particular period.
As of
December 31, 2018
, we did not have any material indemnification claims that were probable or reasonably possible.
Legal Matters
Antitrust Investigations
On November 30, 2010, the EC's Directorate General for Competition opened an investigation into various antitrust-related complaints against us.
On April 15, 2015, the EC issued a Statement of Objections (SO) regarding the display and ranking of shopping search results and ads, to which we responded on August 27, 2015. On July 14, 2016, the EC issued a Supplementary SO regarding shopping search results and ads. On June 27, 2017, the EC announced its decision that certain actions taken by Google regarding its display and ranking of shopping search results and ads infringed European competition law. The EC decision imposed a
€2.4 billion
(
$2.7 billion
as of June 27, 2017) fine. On September 11, 2017, we appealed the EC decision and on September 27, 2017, we implemented product changes to bring shopping ads into compliance with the EC's decision. We recognized a charge of
$2.7 billion
for the fine in the second quarter of 2017. While under appeal, the fine is included in accrued expenses and other current liabilities on our Consolidated Balance Sheets as we provided bank guarantees in lieu of a cash payment for the fine.
On April 20, 2016, the EC issued an SO regarding certain Android distribution practices. We responded to the SO and the EC's informational requests. On July 18, 2018, the EC announced its decision that certain provisions in Google’s Android-related distribution agreements infringed European competition law. The EC decision imposed a
€4.3 billion
(
$5.1 billion
as of June 30, 2018) fine and directed the termination of the conduct at issue. On October 9, 2018, we appealed the EC decision and implemented changes to certain of our Android distribution practices. We recognized a charge of
$5.1 billion
for the fine in the second quarter of 2018. While under appeal, the fine is included in accrued expenses and other current liabilities on our Consolidated Balance Sheets as we provided bank guarantees in lieu of a cash payment for the fine.
On July 14, 2016, the EC issued an SO regarding the syndication of AdSense for Search. We responded to the SO and continue to respond to the EC's informational requests. There is significant uncertainty as to the outcome of this investigation; however, an adverse decision could result in fines and directives to alter or terminate certain conduct. Given the nature of this case, we are unable to estimate the reasonably possible loss or range of loss, if any. We remain committed to working with the EC to resolve these matters.
The Comision Nacional de Defensa de la Competencia in Argentina, the Competition Commission of India (CCI), Brazil's Administrative Council for Economic Defense (CADE), and the Korean Fair Trade Commission have also opened investigations into certain of our business practices. In November 2016, we responded to the CCI Director General's report with interim findings of competition law infringements regarding search and ads. On February 8, 2018, the CCI issued its final decision, including a fine of approximately
$21 million
, finding no violation of competition law infringement on most of the issues it investigated, but finding violations, including in the display of the “flights unit” in search results, and a contractual provision in certain direct search intermediation agreements. We have appealed the CCI decision. The fine was accrued for in 2018.
72
|
Alphabet Inc.
|
|
Patent and Intellectual Property Claims
We have had patent, copyright, trade secret, and trademark infringement lawsuits filed against us claiming that certain of our products, services, and technologies infringe the intellectual property rights of others. Adverse results in these lawsuits may include awards of substantial monetary damages, costly royalty or licensing agreements, or orders preventing us from offering certain features, functionalities, products, or services, and may also cause us to change our business practices, and require development of non-infringing products or technologies, which could result in a loss of revenues for us and otherwise harm our business. In addition, the U.S. International Trade Commission (ITC) has increasingly become an important forum to litigate intellectual property disputes because an ultimate loss for a company or its suppliers in an ITC action could result in a prohibition on importing infringing products into the U.S. Because the U.S. is an important market, a prohibition on importation could have an adverse effect on us, including preventing us from importing many important products into the U.S. or necessitating workarounds that may limit certain features of our products.
Furthermore, many of our agreements with our customers and partners require us to indemnify them for certain intellectual property infringement claims against them, which would increase our costs as a result of defending such claims, and may require that we pay significant damages if there were an adverse ruling in any such claims. Our customers and partners may discontinue the use of our products, services, and technologies, as a result of injunctions or otherwise, which could result in loss of revenues and adversely affect our business.
In 2010, Oracle America, Inc. (Oracle) brought a copyright lawsuit against Google in the Northern District of California, alleging that Google's Android operating system infringes Oracle's copyrights related to certain Java application programming interfaces. After trial, final judgment was entered by the district court in favor of Google on June 8, 2016, and the court decided post-trial motions in favor of Google. Oracle appealed and on March 27, 2018, the appeals court reversed and remanded the case for a trial on damages. On May 29, 2018, we filed a petition for an en banc rehearing at the Federal Circuit, and on August 28, 2018, the Federal Circuit denied the petition. On January 24, 2019, we filed a petition to the Supreme Court of the United States to review this case. We believe this lawsuit is without merit and are defending ourselves vigorously. Given the nature of this case, we are unable to estimate the reasonably possible loss or range of loss, if any, arising from this matter.
Other
We are also regularly subject to claims, suits, regulatory and government investigations, and other proceedings involving competition (such as the pending EC investigations described above), intellectual property, privacy, tax and related compliance, labor and employment, commercial disputes, content generated by our users, goods and services offered by advertisers or publishers using our platforms, personal injury, consumer protection, and other matters. Such claims, suits, regulatory and government investigations, and other proceedings could result in fines, civil or criminal penalties, or other adverse consequences.
Certain of these outstanding matters include speculative, substantial or indeterminate monetary amounts. We record a liability when we believe that it is probable that a loss has been incurred and the amount can be reasonably estimated. If we determine that a loss is reasonably possible and the loss or range of loss can be estimated, we disclose the reasonably possible loss. We evaluate developments in our legal matters that could affect the amount of liability that has been previously accrued, and the matters and related reasonably possible losses disclosed, and make adjustments as appropriate. Significant judgment is required to determine both likelihood of there being and the estimated amount of a loss related to such matters.
With respect to our outstanding matters, based on our current knowledge, we believe that the amount or range of reasonably possible loss will not, either individually or in aggregate, have a material adverse effect on our business, consolidated financial position, results of operations, or cash flows. However, the outcome of such matters is inherently unpredictable and subject to significant uncertainties.
We expense legal fees in the period in which they are incurred.
Non-Income Taxes
We are under audit by various domestic and foreign tax authorities with regards to non-income tax matters. The subject matter of non-income tax audits primarily arises from disputes on the tax treatment and tax rate applied to the sale of our products and services in these jurisdictions and the tax treatment of certain employee benefits. We accrue non-income taxes that may result from examinations by, or any negotiated agreements with, these tax authorities when a loss is probable and reasonably estimable. If we determine that a loss is reasonably possible and the loss or range of loss can be estimated, we disclose the reasonably possible loss. We believe these matters are without merit and we are defending ourselves vigorously. Due to the inherent complexity and uncertainty of these matters and judicial process in certain jurisdictions, the final outcome may be materially different from our expectations.
73
|
Alphabet Inc.
|
|
For information regarding income tax contingencies, see
Note 13
.
Note 10.
Stockholders’ Equity
Convertible Preferred Stock
Our board of directors has authorized
100 million
shares of convertible preferred stock,
$0.001
par value, issuable in series. As of
December 31,
2017
and
2018
,
no
shares were issued or outstanding.
Class A and Class B Common Stock and Class C Capital Stock
Our board of directors has authorized
three
classes of stock, Class A and Class B common stock, and Class C capital stock. The rights of the holders of each class of our common and capital stock are identical, except with respect to voting. Each share of Class A common stock is entitled to
one
vote per share. Each share of Class B common stock is entitled to
10
votes per share. Class C capital stock has
no
voting rights, except as required by applicable law. Shares of Class B common stock may be converted at any time at the option of the stockholder and automatically convert upon sale or transfer to Class A common stock.
Share Repurchases
In October 2016, the board of directors of Alphabet authorized the company to repurchase up to
$7.0 billion
of its Class C capital stock, which was completed during 2018. In January 2018, the board of directors of Alphabet authorized the company to repurchase up to
$8.6 billion
of its Class C capital stock. The repurchases are being executed from time to time, subject to general business and market conditions and other investment opportunities, through open market purchases or privately negotiated transactions, including through Rule 10b5-1 plans. The repurchase program does not have an expiration date.
During the years ended
December 31,
2017
and
2018
, we repurchased and subsequently retired
5.2 million
shares of Alphabet Class C capital stock for an aggregate amount of
$4.8 billion
and
8.2 million
shares of Alphabet Class C capital stock for an aggregate amount of
$9.1 billion
, respectively.
Note 11.
Net Income Per Share
We compute net income per share of Class A and Class B common stock and Class C capital stock using the two-class method. Basic net income per share is computed using the weighted-average number of shares outstanding during the period. Diluted net income per share is computed using the weighted-average number of shares and the effect of potentially dilutive securities outstanding during the period. Potentially dilutive securities consist of restricted stock units and other contingently issuable shares. The dilutive effect of outstanding restricted stock units and other contingently issuable shares is reflected in diluted earnings per share by application of the treasury stock method. The computation of the diluted net income per share of Class A common stock assumes the conversion of Class B common stock, while the diluted net income per share of Class B common stock does not assume the conversion of those shares.
The rights, including the liquidation and dividend rights, of the holders of our Class A and Class B common stock and Class C capital stock are identical, except with respect to voting. Furthermore, there are a number of safeguards built into our certificate of incorporation, as well as Delaware law, which preclude our board of directors from declaring or paying unequal per share dividends on our Class A and Class B common stock and Class C capital stock. Specifically, Delaware law provides that amendments to our certificate of incorporation which would have the effect of adversely altering the rights, powers, or preferences of a given class of stock must be approved by the class of stock adversely affected by the proposed amendment. In addition, our certificate of incorporation provides that before any such amendment may be put to a stockholder vote, it must be approved by the unanimous consent of our board of directors. As a result, the undistributed earnings for each year are allocated based on the contractual participation rights of the Class A and Class B common shares and Class C capital stock as if the earnings for the year had been distributed. As the liquidation and dividend rights are identical, the undistributed earnings are allocated on a proportionate basis.
In the years ended December 31,
2016
,
2017
and
2018
, the net income per share amounts are the same for Class A and Class B common stock and Class C capital stock because the holders of each class are entitled to equal per share dividends or distributions in liquidation in accordance with the Amended and Restated Certificate of Incorporation of Alphabet Inc.
74
|
Alphabet Inc.
|
|
The following tables set forth the computation of basic and diluted net income per share of Class A and Class B common stock and Class C capital stock (in millions, except share amounts which are reflected in thousands and per share amounts):
|
|
Year Ended December 31,
|
||||||||||
|
|
2016
|
||||||||||
|
|
Class A
|
Class B
|
Class C
|
||||||||
|
Basic net income per share:
|
|||||||||||
|
Numerator
|
|||||||||||
|
Allocation of undistributed earnings
|
$
|
8,332
|
|
$
|
1,384
|
|
$
|
9,762
|
|
||
|
Denominator
|
|||||||||||
|
Number of shares used in per share computation
|
294,217
|
|
48,859
|
|
344,702
|
|
|||||
|
Basic net income per share
|
$
|
28.32
|
|
$
|
28.32
|
|
$
|
28.32
|
|
||
|
Diluted net income per share:
|
|||||||||||
|
Numerator
|
|||||||||||
|
Allocation of undistributed earnings for basic computation
|
$
|
8,332
|
|
$
|
1,384
|
|
$
|
9,762
|
|
||
|
Effect of dilutive securities in equity method investments and subsidiaries
|
(9
|
)
|
(2
|
)
|
(10
|
)
|
|||||
|
Allocation of undistributed earnings for diluted computation
|
8,323
|
|
1,382
|
|
9,752
|
|
|||||
|
Reallocation of undistributed earnings as a result of conversion of Class B to Class A shares
|
1,382
|
|
0
|
|
0
|
|
|||||
|
Reallocation of undistributed earnings
|
(94
|
)
|
(21
|
)
|
94
|
|
|||||
|
Allocation of undistributed earnings
|
$
|
9,611
|
|
$
|
1,361
|
|
$
|
9,846
|
|
||
|
Denominator
|
|||||||||||
|
Number of shares used in basic computation
|
294,217
|
|
48,859
|
|
344,702
|
|
|||||
|
Weighted-average effect of dilutive securities
|
|||||||||||
|
Add:
|
|||||||||||
|
Conversion of Class B to Class A common shares outstanding
|
48,859
|
|
0
|
|
0
|
|
|||||
|
Restricted stock units and other contingently issuable shares
|
2,055
|
|
0
|
|
8,873
|
|
|||||
|
Number of shares used in per share computation
|
345,131
|
|
48,859
|
|
353,575
|
|
|||||
|
Diluted net income per share
|
$
|
27.85
|
|
$
|
27.85
|
|
$
|
27.85
|
|
||
|
|
Year Ended December 31,
|
||||||||||
|
|
2017
|
||||||||||
|
|
Class A
|
Class B
|
Class C
|
||||||||
|
Basic net income per share:
|
|||||||||||
|
Numerator
|
|||||||||||
|
Allocation of undistributed earnings
|
$
|
5,438
|
|
$
|
862
|
|
$
|
6,362
|
|
||
|
Denominator
|
|||||||||||
|
Number of shares used in per share computation
|
297,604
|
|
47,146
|
|
348,151
|
|
|||||
|
Basic net income per share
|
$
|
18.27
|
|
$
|
18.27
|
|
$
|
18.27
|
|
||
|
Diluted net income per share:
|
|||||||||||
|
Numerator
|
|||||||||||
|
Allocation of undistributed earnings for basic computation
|
$
|
5,438
|
|
$
|
862
|
|
$
|
6,362
|
|
||
|
Reallocation of undistributed earnings as a result of conversion of Class B to Class A shares
|
862
|
|
0
|
|
0
|
|
|||||
|
Reallocation of undistributed earnings
|
(74
|
)
|
(14
|
)
|
74
|
|
|||||
|
Allocation of undistributed earnings
|
$
|
6,226
|
|
$
|
848
|
|
$
|
6,436
|
|
||
|
Denominator
|
|||||||||||
|
Number of shares used in basic computation
|
297,604
|
|
47,146
|
|
348,151
|
|
|||||
|
Weighted-average effect of dilutive securities
|
|||||||||||
|
Add:
|
|||||||||||
|
Conversion of Class B to Class A common shares outstanding
|
47,146
|
|
0
|
|
0
|
|
|||||
|
Restricted stock units and other contingently issuable shares
|
1,192
|
|
0
|
|
9,491
|
|
|||||
|
Number of shares used in per share computation
|
345,942
|
|
47,146
|
|
357,642
|
|
|||||
|
Diluted net income per share
|
$
|
18.00
|
|
$
|
18.00
|
|
$
|
18.00
|
|
||
75
|
Alphabet Inc.
|
|
|
|
Year Ended December 31,
|
||||||||||
|
|
2018
|
||||||||||
|
|
Class A
|
Class B
|
Class C
|
||||||||
|
Basic net income per share:
|
|||||||||||
|
Numerator
|
|||||||||||
|
Allocation of undistributed earnings
|
$
|
13,200
|
|
$
|
2,072
|
|
$
|
15,464
|
|
||
|
Denominator
|
|||||||||||
|
Number of shares used in per share computation
|
298,548
|
|
46,864
|
|
349,728
|
|
|||||
|
Basic net income per share
|
$
|
44.22
|
|
$
|
44.22
|
|
$
|
44.22
|
|
||
|
Diluted net income per share:
|
|||||||||||
|
Numerator
|
|||||||||||
|
Allocation of undistributed earnings for basic computation
|
$
|
13,200
|
|
$
|
2,072
|
|
$
|
15,464
|
|
||
|
Reallocation of undistributed earnings as a result of conversion of Class B to Class A shares
|
2,072
|
|
0
|
|
0
|
|
|||||
|
Reallocation of undistributed earnings
|
(146
|
)
|
(24
|
)
|
146
|
|
|||||
|
Allocation of undistributed earnings
|
$
|
15,126
|
|
$
|
2,048
|
|
$
|
15,610
|
|
||
|
Denominator
|
|||||||||||
|
Number of shares used in basic computation
|
298,548
|
|
46,864
|
|
349,728
|
|
|||||
|
Weighted-average effect of dilutive securities
|
|||||||||||
|
Add:
|
|||||||||||
|
Conversion of Class B to Class A common shares outstanding
|
46,864
|
|
0
|
|
0
|
|
|||||
|
Restricted stock units and other contingently issuable shares
|
689
|
|
0
|
|
7,456
|
|
|||||
|
Number of shares used in per share computation
|
346,101
|
|
46,864
|
|
357,184
|
|
|||||
|
Diluted net income per share
|
$
|
43.70
|
|
$
|
43.70
|
|
$
|
43.70
|
|
||
Note 12.
Compensation Plans
Stock Plans
Under our 2012 Stock Plan, RSUs or stock options may be granted. An RSU award is an agreement to issue shares of our publicly traded stock at the time the award vests. Incentive and non-qualified stock options, or rights to purchase common stock, are generally granted for a term of
10
years. RSUs granted to participants under the 2012 Stock Plan generally vest over
four
years contingent upon employment or service with us on the vesting date.
As of
December 31, 2018
, there were
31,848,134
shares of stock reserved for future issuance under our Stock Plan.
Stock-Based Compensation
For the years ended
December 31,
2016
,
2017
and
2018
, total stock-based compensation expense was
$6.9 billion
,
$7.9 billion
and
$10.0 billion
, including amounts associated with awards we expect to settle in Alphabet stock of
$6.7 billion
,
$7.7 billion
, and
$9.4 billion
, respectively.
For the years ended
December 31,
2016
,
2017
and
2018
, we recognized tax benefits on total stock-based compensation expense, which are reflected in the provision for income taxes in the Consolidated Statements of Income, of
$1.5 billion
,
$1.6 billion
, and
$1.5 billion
, respectively.
For the years ended
December 31,
2016
,
2017
and
2018
, tax benefit realized related to awards vested or exercised during the period was
$2.1 billion
,
$2.7 billion
and
$2.1 billion
, respectively. These amounts do not include the indirect effects of stock-based awards, which primarily relate to the research and development tax credit.
76
|
Alphabet Inc.
|
|
Stock-Based Award Activities
The following table summarizes the activities for our unvested RSUs for the year ended
December 31, 2018
:
|
|
Unvested Restricted Stock Units
|
|||||
|
|
Number of
Shares
|
Weighted-
Average
Grant-Date
Fair Value
|
||||
|
Unvested as of December 31, 2017
|
20,077,346
|
|
$
|
712.45
|
|
|
|
Granted
|
12,669,251
|
|
$
|
1,095.89
|
|
|
|
Vested
|
(12,847,910
|
)
|
$
|
756.45
|
|
|
|
Forfeited/canceled
|
(1,431,009
|
)
|
$
|
814.19
|
|
|
|
Unvested as of December 31, 2018
|
18,467,678
|
|
$
|
936.96
|
|
|
The weighted-average grant-date fair value of RSUs granted during the years ended
December 31,
2016
and
2017
, was
$713.89
and
$845.06
, respectively. Total fair value of RSUs, as of their respective vesting dates, during the years ended
December 31,
2016
,
2017
, and
2018
were
$9.0 billion
,
$11.3 billion
, and
$14.1 billion
, respectively.
As of
December 31, 2018
, there was
$16.2 billion
of unrecognized compensation cost related to unvested employee RSUs. This amount is expected to be recognized over a weighted-average period of
2.5 years
.
401(k) Plans
We have
two
401(k) Savings Plans that qualify as deferred salary arrangements under Section 401(k) of the Internal Revenue Code. Under these 401(k) Plans, matching contributions are based upon the amount of the employees’ contributions subject to certain limitations. We recognized expense of approximately
$385 million
,
$448 million
, and
$691 million
for the years ended
December 31, 2016
,
2017
, and
2018
, respectively.
Performance Fees
We have compensation arrangements with payouts based on realized investment returns. We recognize compensation expense based on the estimated payouts, which may result in expense recognized before investment returns are realized. For the year ended
December 31, 2018
, performance fees of
$1.2 billion
primarily related to gains on equity securities (for further information on gains on equity securities, see
Note 3
) were accrued and recorded as a component of general and administrative expenses.
Note 13.
Income Taxes
Income from continuing operations before income taxes included income from domestic operations of
$12.0 billion
,
$10.7 billion
, and
$15.8 billion
for the years ended
December 31, 2016
,
2017
, and
2018
, respectively, and income from foreign operations of
$12.1 billion
,
$16.5 billion
, and
$19.1 billion
for the years ended
December 31, 2016
,
2017
, and
2018
, respectively.
The provision for income taxes consists of the following (in millions):
|
|
Year Ended December 31,
|
||||||||||
|
|
2016
|
|
2017
|
|
2018
|
||||||
|
Current:
|
|||||||||||
|
Federal and state
|
$
|
3,826
|
|
$
|
12,608
|
|
$
|
2,153
|
|
||
|
Foreign
|
966
|
|
1,746
|
|
1,251
|
|
|||||
|
Total
|
4,792
|
|
14,354
|
|
3,404
|
|
|||||
|
Deferred:
|
|||||||||||
|
Federal and state
|
(70
|
)
|
220
|
|
907
|
|
|||||
|
Foreign
|
(50
|
)
|
(43
|
)
|
(134
|
)
|
|||||
|
Total
|
(120
|
)
|
177
|
|
773
|
|
|||||
|
Provision for income taxes
|
$
|
4,672
|
|
$
|
14,531
|
|
$
|
4,177
|
|
||
The
Tax Act
enacted on December 22, 2017 introduced significant changes to U.S. income tax law. Effective 2018, the Tax Act reduced the U.S. statutory tax rate from 35% to 21% and created new taxes on certain foreign-sourced earnings and certain related-party payments.
77
|
Alphabet Inc.
|
|
Due to the timing of the enactment and the complexity involved in applying the provisions of the Tax Act, we made reasonable estimates of the effects and recorded provisional amounts in our consolidated financial statements as of December 31, 2017. As we collected and prepared necessary data, and interpreted the additional guidance issued by the U.S. Treasury Department, the IRS, and other standard-setting bodies, we made adjustments, over the course of the year, to the provisional amounts including refinements to deferred taxes. The accounting for the tax effects of the Tax Act has been completed as of December 31, 2018.
One-time transition tax
The Tax Act required us to pay U.S. income taxes on accumulated foreign subsidiary earnings not previously subject to U.S. income tax at a rate of
15.5%
to the extent of foreign cash and certain other net current assets and
8%
on the remaining earnings. We recorded a provisional amount for our one-time transitional tax liability and income tax expense of
$10.2 billion
as of December 31, 2017.
Deferred tax effects
Due to the change in the statutory tax rate from the Tax Act, we remeasured our deferred taxes as of December 31, 2017 to reflect the reduced rate that will apply in future periods when these deferred taxes are settled or realized. We recognized a deferred tax benefit of
$376 million
to reflect the reduced U.S. tax rate and other effects of the Tax Act as of December 31, 2017.
The reconciliation of federal statutory income tax rate to our effective income tax rate is as follows:
|
Year Ended December 31,
|
||||||||
|
|
2016
|
2017
|
2018
|
|||||
|
U.S. federal statutory tax rate
|
35.0
|
%
|
35.0
|
%
|
21.0
|
%
|
||
|
Foreign income taxed at different rates
|
(11.0
|
)
|
(14.2
|
)
|
(4.9
|
)
|
||
|
Effect of the Tax Act
|
|
|
|
|
|
|
||
|
One-time transition tax
|
0.0
|
|
37.6
|
|
(0.1
|
)
|
||
|
Deferred tax effects
|
0.0
|
|
(1.4
|
)
|
(1.2
|
)
|
||
|
Federal research credit
|
(2.0
|
)
|
(1.8
|
)
|
(2.4
|
)
|
||
|
Stock-based compensation expense
|
(3.4
|
)
|
(4.5
|
)
|
(2.2
|
)
|
||
|
European Commission fine
|
0.0
|
|
3.5
|
|
3.1
|
|
||
|
Deferred tax asset valuation allowance
|
0.1
|
|
0.9
|
|
(2.0
|
)
|
||
|
Other adjustments
|
0.6
|
|
(1.7
|
)
|
0.7
|
|
||
|
Effective tax rate
|
19.3
|
%
|
53.4
|
%
|
12.0
|
%
|
||
Our effective tax rate for each of the years presented was affected by earnings realized in foreign jurisdictions with statutory tax rates lower than the federal statutory tax rate. Substantially all of the income from foreign operations was earned by an Irish subsidiary. Beginning in 2018, earnings realized in foreign jurisdictions are subject to U.S. tax in accordance with the Tax Act.
On July 27, 2015, the United States Tax Court, in an opinion in Altera Corp. v. Commissioner, invalidated the portion of the Treasury regulations issued under IRC Section 482 requiring related-party participants in a cost sharing arrangement to share stock-based compensation costs. The U.S. Tax Court issued the final decision on December 28, 2015. The IRS served a Notice of Appeal on February 22, 2016 and the case is being heard by the Ninth Circuit Court of Appeals. The Ninth Circuit Court of Appeals overturned the Tax Court’s decision in an opinion issued on July 24, 2018, but withdrew that opinion in an order issued on August 7, 2018 to allow time for a reconstituted panel to confer on the appeal. At this time, the Ninth Circuit Court of Appeals has not issued a final decision, and the U.S. Treasury has not withdrawn the requirement to include stock-based compensation from its regulations. We have evaluated the opinion and continue to record a tax benefit related to reimbursement of cost share payments for the previously shared stock-based compensation costs. In accordance with the Tax Act, the Altera tax benefit was remeasured from 35% to 21%. We also remeasured the tax benefit expected to be realized upon settlement including the expected future new taxes enacted by the Tax Act due upon resolution of the matter. The tax liability recorded as of December 31, 2016 for the U.S. tax cost of the potential repatriation associated with the contingent foreign earnings was reversed due to the Tax Act introducing a territorial tax system and providing a 100% dividend received deduction on certain qualified dividends from foreign subsidiaries. We will continue to monitor developments related to the case and the potential effect on our consolidated financial statements.
78
|
Alphabet Inc.
|
|
Deferred Income Taxes
Deferred income taxes reflect the net effects of temporary differences between the carrying amounts of assets and liabilities for financial reporting purposes and the amounts used for income tax purposes. We recorded a provisional adjustment to our U.S. deferred income taxes as of December 31, 2017 to reflect the reduction in the U.S. statutory tax rate from 35% to 21% resulting from the Tax Act. Significant components of our deferred tax assets and liabilities are as follows (in millions):
|
As of December 31,
|
|||||||
|
2017
|
2018
|
||||||
|
Deferred tax assets:
|
|||||||
|
Stock-based compensation expense
|
$
|
251
|
|
$
|
291
|
|
|
|
Accrued employee benefits
|
285
|
|
387
|
|
|||
|
Accruals and reserves not currently deductible
|
717
|
|
1,062
|
|
|||
|
Tax credits
|
1,187
|
|
1,979
|
|
|||
|
Basis difference in investment in Arris
|
849
|
|
657
|
|
|||
|
Prepaid cost sharing
|
498
|
|
597
|
|
|||
|
Net operating losses
|
320
|
|
557
|
|
|||
|
Other
|
244
|
|
251
|
|
|||
|
Total deferred tax assets
|
4,351
|
|
5,781
|
|
|||
|
Valuation allowance
|
(2,531
|
)
|
(2,817
|
)
|
|||
|
Total deferred tax assets net of valuation allowance
|
1,820
|
|
2,964
|
|
|||
|
Deferred tax liabilities:
|
|||||||
|
Property and equipment
|
(551
|
)
|
(1,382
|
)
|
|||
|
Identified intangibles
|
(419
|
)
|
(229
|
)
|
|||
|
Renewable energy investments
|
(531
|
)
|
(500
|
)
|
|||
|
Investment gains/losses
|
(22
|
)
|
(1,143
|
)
|
|||
|
Other
|
(47
|
)
|
(237
|
)
|
|||
|
Total deferred tax liabilities
|
(1,570
|
)
|
(3,491
|
)
|
|||
|
Net deferred tax assets (liabilities)
|
$
|
250
|
|
$
|
(527
|
)
|
|
As of
December 31, 2018
, our federal and state net operating loss carryforwards for income tax purposes were approximately
$1.2 billion
and
$1.4 billion
, respectively. If not utilized, the federal net operating loss carryforwards will begin to expire in 2021 and the state net operating loss carryforwards will begin to expire in 2019. It is more likely than not that certain federal net operating loss carryforwards and our state net operating loss carryforwards will not be realized; therefore, we have recorded a valuation allowance against them. The net operating loss carryforwards are subject to various annual limitations under the tax laws of the different jurisdictions. Our foreign net operating loss carryforwards for income tax purposes were
$950 million
that will begin to expire in 2021.
As of
December 31, 2018
, our California research and development credit carryforwards for income tax purposes were approximately
$2.4 billion
that can be carried over indefinitely. We believe the state tax credit is not likely to be realized.
As of
December 31, 2018
, we maintained a valuation allowance with respect to California deferred tax assets, certain federal net operating losses, and certain foreign net operating losses that we believe are not likely to be realized. Due to gains from equity securities recognized in 2018, we released the valuation allowance against the deferred tax asset for the book-to-tax basis difference in our investments in Arris shares received from the sale of the Motorola Home business to Arris in 2013. We continue to reassess the remaining valuation allowance quarterly and if future evidence allows for a partial or full release of the valuation allowance, a tax benefit will be recorded accordingly. For further information on the unrealized gains related to marketable equity securities recognized in other income (expenses), see Note 1.
79
|
Alphabet Inc.
|
|
Uncertain Tax Positions
The following table summarizes the activity related to our gross unrecognized tax benefits from January 1,
2016
to
December 31, 2018
(in millions):
|
|
2016
|
2017
|
2018
|
||||||||
|
Beginning gross unrecognized tax benefits
|
$
|
4,167
|
|
$
|
5,393
|
|
$
|
4,696
|
|
||
|
Increases related to prior year tax positions
|
899
|
|
685
|
|
321
|
|
|||||
|
Decreases related to prior year tax positions
|
(157
|
)
|
(257
|
)
|
(623
|
)
|
|||||
|
Decreases related to settlement with tax authorities
|
(196
|
)
|
(1,875
|
)
|
(191
|
)
|
|||||
|
Increases related to current year tax positions
|
680
|
|
750
|
|
449
|
|
|||||
|
Ending gross unrecognized tax benefits
|
$
|
5,393
|
|
$
|
4,696
|
|
$
|
4,652
|
|
||
The total amount of gross unrecognized tax benefits was
$5.4 billion
,
$4.7 billion
, and
$4.7 billion
as of
December 31, 2016
,
2017
, and
2018
, respectively, of which,
$4.3 billion
,
$3.0 billion
, and
$2.9 billion
, if recognized, would affect our effective tax rate, respectively. The decrease in gross unrecognized tax benefits in 2017 was primarily as a result of the resolution of a multi-year U.S. audit.
As of
December 31, 2017
and
2018
, we had accrued
$362 million
and
$490 million
in interest and penalties in provision for income taxes, respectively.
We file income tax returns in the U.S. federal jurisdiction and in many state and foreign jurisdictions, our
two
major tax jurisdictions are the U.S. federal and Ireland. We are subject to the continuous examination of our income tax returns by the IRS and other tax authorities. The IRS is currently examining our 2013 through 2015 tax returns. We have also received tax assessments in multiple foreign jurisdictions asserting transfer pricing adjustments or permanent establishment. We continue to defend any and all such claims as presented.
Our 2016 and 2017 tax years remain subject to examination by the IRS for U.S. federal tax purposes, and our 2011 through 2017 tax years remain subject to examination by the appropriate governmental agencies for Irish tax purposes. There are other ongoing audits in various other jurisdictions that are not material to our financial statements.
We regularly assess the likelihood of adverse outcomes resulting from these examinations to determine the adequacy of our provision for income taxes. We continue to monitor the progress of ongoing discussions with tax authorities and the effect, if any, of the expected expiration of the statute of limitations in various taxing jurisdictions.
We believe that an adequate provision has been made for any adjustments that may result from tax examinations. However, the outcome of tax audits cannot be predicted with certainty. If any issues addressed in our tax audits are resolved in a manner not consistent with management's expectations, we could be required to adjust our provision for income taxes in the period such resolution occurs. Although the timing of resolution, settlement, and closure of audits is not certain, it is reasonably possible that certain U.S. federal and non-U.S. tax audits may be concluded within the next 12 months, which could significantly increase or decrease the balance of our gross unrecognized tax benefits.
We estimate that our unrecognized tax benefits as of
December 31, 2018
could possibly decrease by approximately
$600 million
in the next 12 months. Positions that may be resolved include various U.S. and non-U.S. matters.
Note 14.
Information about Segments and Geographic Areas
We operate our business in multiple operating segments. Google is our only reportable segment. None of our other segments meet the quantitative thresholds to qualify as reportable segments; therefore, the other operating segments are combined and disclosed as Other Bets.
Our reported segments are:
|
•
|
Google – Google includes our main products such as Ads, Android, Chrome, Google Cloud, Google Maps, Google Play, Hardware (including Nest), Search, and YouTube. Our technical infrastructure is also included in Google. Google generates revenues primarily from advertising; sales of apps, in-app purchases, digital content products, and hardware; and licensing and service fees, including fees received for Google Cloud offerings.
|
|
•
|
Other Bets – Other Bets is a combination of multiple operating segments that are not individually material. Other Bets includes businesses such as Access, Calico, CapitalG, GV, Verily, Waymo, and X. Revenues from the Other Bets are derived primarily through the sales of internet and TV services through Access as well as licensing and R&D services through Verily.
|
80
|
Alphabet Inc.
|
|
Revenues, cost of revenues, and operating expenses are generally directly attributed to our segments. Inter-segment revenues are not presented separately, as these amounts are immaterial. Our Chief Operating Decision Maker does not evaluate operating segments using asset information.
In Q1 2018, Nest joined Google’s hardware team. Consequently, the financial results of Nest are reported in the Google segment, with Nest revenues reflected in Google other revenues. Prior period segment information has been recast to conform to the current period segment presentation. Consolidated financial results are not affected.
Information about segments during the periods presented were as follows (in millions):
|
Year Ended December 31,
|
|||||||||||
|
2016
|
2017
|
2018
|
|||||||||
|
Revenues:
|
|||||||||||
|
Google
|
$
|
89,984
|
|
$
|
110,378
|
|
$
|
136,224
|
|
||
|
Other Bets
|
288
|
|
477
|
|
595
|
|
|||||
|
Total revenues
|
$
|
90,272
|
|
$
|
110,855
|
|
$
|
136,819
|
|
||
|
Year Ended December 31,
|
|||||||||||
|
2016
|
2017
|
2018
|
|||||||||
|
Operating income (loss):
|
|||||||||||
|
Google
|
$
|
27,055
|
|
$
|
32,287
|
|
$
|
36,517
|
|
||
|
Other Bets
|
(2,741
|
)
|
(2,734
|
)
|
(3,358
|
)
|
|||||
|
Reconciling items
(1)
|
(598
|
)
|
(3,407
|
)
|
(6,838
|
)
|
|||||
|
Total income from operations
|
$
|
23,716
|
|
$
|
26,146
|
|
$
|
26,321
|
|
||
|
(1)
|
Reconciling items are primarily comprised of the European Commission fines for the years ended December 31, 2017 and 2018, and performance fees for the year ended December 31, 2018, as well as corporate administrative costs and other miscellaneous items that are not allocated to individual segments for all periods presented.
|
|
Year Ended December 31,
|
|||||||||||
|
2016
|
2017
|
2018
|
|||||||||
|
Capital expenditures:
|
|||||||||||
|
Google
|
$
|
9,437
|
|
$
|
12,619
|
|
$
|
25,460
|
|
||
|
Other Bets
|
1,365
|
|
493
|
|
181
|
|
|||||
|
Reconciling items
(2)
|
(590
|
)
|
72
|
|
(502
|
)
|
|||||
|
Total capital expenditures as presented on the Consolidated Statements of Cash Flows
|
$
|
10,212
|
|
$
|
13,184
|
|
$
|
25,139
|
|
||
|
(2)
|
Reconciling items are related to timing differences of payments as segment capital expenditures are on accrual basis while total capital expenditures shown on the Consolidated Statements of Cash Flow are on cash basis and other miscellaneous differences.
|
81
|
Alphabet Inc.
|
|
Stock-based compensation (SBC) and depreciation, amortization, and impairment are included in segment operating income (loss) as shown below (in millions):
|
Year Ended December 31,
|
|||||||||||
|
2016
|
2017
|
2018
|
|||||||||
|
Stock-based compensation:
|
|||||||||||
|
Google
|
$
|
6,201
|
|
$
|
7,168
|
|
$
|
8,755
|
|
||
|
Other Bets
|
372
|
|
363
|
|
489
|
|
|||||
|
Reconciling items
(3)
|
130
|
|
148
|
|
109
|
|
|||||
|
Total stock-based compensation
(4)
|
$
|
6,703
|
|
$
|
7,679
|
|
$
|
9,353
|
|
||
|
Depreciation, amortization, and impairment:
|
|||||||||||
|
Google
|
$
|
5,882
|
|
$
|
6,608
|
|
$
|
8,708
|
|
||
|
Other Bets
|
258
|
|
307
|
|
327
|
|
|||||
|
Reconciling items
(5)
|
4
|
|
—
|
|
—
|
|
|||||
|
Total depreciation, amortization, and impairment as presented on the Consolidated Statements of Cash Flows
|
$
|
6,144
|
|
$
|
6,915
|
|
$
|
9,035
|
|
||
|
(3)
|
Reconciling items represent corporate administrative costs that are not allocated to individual segments.
|
|
(4)
|
For purposes of segment reporting, SBC represents awards that we expect to settle in Alphabet stock.
|
|
(5)
|
Reconciling items are primarily related to corporate administrative costs and other miscellaneous items that are not allocated to individual segments.
|
The following table presents our long-lived assets by geographic area (in millions):
|
|
As of
December 31, 2017 |
As of
December 31, 2018 |
|||||
|
Long-lived assets:
|
|||||||
|
United States
|
$
|
55,113
|
|
$
|
74,882
|
|
|
|
International
|
17,874
|
|
22,234
|
|
|||
|
Total long-lived assets
|
$
|
72,987
|
|
$
|
97,116
|
|
|
For revenues by geography, see
Note 2
.
|
ITEM 9.
|
CHANGES IN AND DISAGREEMENTS WITH ACCOUNTANTS ON ACCOUNTING AND FINANCIAL DISCLOSURE
|
None.
|
ITEM 9A.
|
CONTROLS AND PROCEDURES
|
Evaluation of Disclosure Controls and Procedures
Our management, with the participation of our chief executive officer and chief financial officer, evaluated the effectiveness of our disclosure controls and procedures pursuant to Rule 13a-15 under the Exchange Act, as of the end of the period covered by this Annual Report on Form 10-K.
Based on this evaluation, our chief executive officer and chief financial officer concluded that, as of
December 31, 2018
, our disclosure controls and procedures are designed at a reasonable assurance level and are effective to provide reasonable assurance that information we are required to disclose in reports that we file or submit under the Exchange Act is recorded, processed, summarized, and reported within the time periods specified in the SEC’s rules and forms, and that such information is accumulated and communicated to our management, including our chief executive officer and chief financial officer, as appropriate, to allow timely decisions regarding required disclosure.
Changes in Internal Control over Financial Reporting
There were no changes in our internal control over financial reporting that occurred during the quarter ended
December 31, 2018
that have materially affected, or are reasonably likely to materially affect, our internal control over financial reporting.
82
|
Alphabet Inc.
|
|
Management’s Report on Internal Control over Financial Reporting
Our management is responsible for establishing and maintaining adequate internal control over financial reporting, as defined in Rule 13a-15(f) of the Exchange Act. Our management conducted an evaluation of the effectiveness of our internal control over financial reporting based on the framework in
Internal Control—Integrated Framework
issued by the Committee of Sponsoring Organizations of the Treadway Commission (2013 framework). Based on this evaluation, management concluded that our internal control over financial reporting was effective as of
December 31, 2018
. Management reviewed the results of its assessment with our Audit Committee. The effectiveness of our internal control over financial reporting as of
December 31, 2018
has been audited by Ernst & Young LLP, an independent registered public accounting firm, as stated in its report which is included in Item 8 of this Annual Report on Form 10-K.
Limitations on Effectiveness of Controls and Procedures
In designing and evaluating the disclosure controls and procedures, management recognizes that any controls and procedures, no matter how well designed and operated, can provide only reasonable assurance of achieving the desired control objectives. In addition, the design of disclosure controls and procedures must reflect the fact that there are resource constraints and that management is required to apply its judgment in evaluating the benefits of possible controls and procedures relative to their costs.
|
ITEM 9B.
|
OTHER INFORMATION
|
None.
83
|
Alphabet Inc.
|
|
PART III
|
ITEM 10.
|
DIRECTORS, EXECUTIVE OFFICERS AND CORPORATE GOVERNANCE
|
The information required by this item will be included under the caption “Directors, Executive Officers, and Corporate Governance” in our Proxy Statement for
2019
Annual Meeting of Stockholders to be filed with the SEC within 120 days of the fiscal year ended
December 31, 2018
(
2019
Proxy Statement) and is incorporated herein by reference. The information required by this item regarding delinquent filers pursuant to Item 405 of Regulation S-K will be included under the caption “Section 16(a) Beneficial Ownership Reporting Compliance” in the
2019
Proxy Statement and is incorporated herein by reference.
|
ITEM 11.
|
EXECUTIVE COMPENSATION
|
The information required by this item will be included under the captions “Director Compensation,” “Executive Compensation” and “Directors, Executive Officers, and Corporate Governance—Corporate Governance and Board Matters—Compensation Committee Interlocks and Insider Participation” in the
2019
Proxy Statement and is incorporated herein by reference.
|
ITEM 12.
|
SECURITY OWNERSHIP OF CERTAIN BENEFICIAL OWNERS AND MANAGEMENT AND RELATED STOCKHOLDER MATTERS
|
The information required by this item will be included under the captions “Common Stock Ownership of Certain Beneficial Owners and Management” and “Equity Compensation Plan Information” in the
2019
Proxy Statement and is incorporated herein by reference.
|
ITEM 13.
|
CERTAIN RELATIONSHIPS AND RELATED TRANSACTIONS, AND DIRECTOR INDEPENDENCE
|
The information required by this item will be included under the captions “Certain Relationships and Related Transactions” and “Directors, Executive Officers, and Corporate Governance—Corporate Governance and Board Matters—Director Independence” in the
2019
Proxy Statement and is incorporated herein by reference.
|
ITEM 14.
|
PRINCIPAL ACCOUNTANT FEES AND SERVICES
|
The information required by this item will be included under the caption “Independent Registered Public Accounting Firm” in the
2019
Proxy Statement and is incorporated herein by reference.
84
|
Alphabet Inc.
|
|
PART IV
|
ITEM 15.
|
EXHIBITS, FINANCIAL STATEMENT SCHEDULES
|
(a)
We have filed the following documents as part of this Annual Report on Form 10-K:
1. Consolidated Financial Statements
|
Financial Statements:
|
|
2. Financial Statement Schedules
Schedule II: Valuation and Qualifying Accounts
The table below details the activity of the allowance for doubtful accounts and sales credits for the years ended December 31,
2016
,
2017
and
2018
(in millions):
|
Balance at
Beginning of
Year
|
Additions
|
Usage
|
Balance at
End of Year
|
||||||||||||
|
Year ended December 31, 2016
|
$
|
296
|
|
$
|
942
|
|
$
|
(771
|
)
|
$
|
467
|
|
|||
|
Year ended December 31, 2017
|
$
|
467
|
|
$
|
1,131
|
|
$
|
(924
|
)
|
$
|
674
|
|
|||
|
Year ended December 31, 2018
|
$
|
674
|
|
$
|
1,115
|
|
$
|
(1,060
|
)
|
$
|
729
|
|
|||
|
Note:
|
Additions to the allowance for doubtful accounts are charged to expense. Additions to the allowance for sales credits are charged against revenues.
|
All other schedules have been omitted because they are not required, not applicable, or the required information is otherwise included.
3. Exhibits
|
Exhibit
Number
|
Description
|
Incorporated by reference herein
|
||||
|
Form
|
Date
|
|||||
|
2.01
|
Current Report on Form 8-K (File No. 001-37580)
|
October 2, 2015
|
||||
|
3.01
|
Current Report on Form 8-K (File No. 001-37580)
|
October 2, 2015
|
||||
|
3.02
|
Current Report on Form 8-K (File No. 001-37580)
|
October 2, 2015
|
||||
|
4.01
|
Current Report on Form 8-K (File No. 001-37580)
|
October 2, 2015
|
||||
|
4.02
|
Current Report on Form 8-K (File No. 001-37580)
|
October 2, 2015
|
||||
|
4.03
|
Current Report on Form 8-K (File No. 001-37580)
|
October 2, 2015
|
||||
|
4.04
|
Current Report on Form 8-K (File No. 001-37580)
|
October 2, 2015
|
||||
85
|
Alphabet Inc.
|
|
|
Exhibit
Number
|
Description
|
Incorporated by reference herein
|
||||
|
Form
|
Date
|
|||||
|
4.05
|
Current Report on Form 8-K (File No. 001-37580)
|
October 2, 2015
|
||||
|
4.06
|
Current Report on Form 8-K (File No. 001-37580)
|
October 2, 2015
|
||||
|
4.07
|
Current Report on Form 8-K (File No. 001-37580)
|
October 2, 2015
|
||||
|
4.08
|
Registration Statement on Form S-3
(File No. 333-209510)
|
February 12, 2016
|
||||
|
4.09
|
Registration Statement on Form S-3
(File No. 333-209518)
|
February 12, 2016
|
||||
|
4.10
|
Current Report on Form 8-K
(File No. 001-37580) |
April 27, 2016
|
||||
|
4.11
|
||||||
|
4.12
|
||||||
|
4.13
|
Current Report on Form 8-K (File No. 001-37580)
|
August 9, 2016
|
||||
|
10.01
|
Current Report on Form 8-K (File No. 001-37580)
|
October 2, 2015
|
||||
|
10.02
|
u
|
|
Current Report on Form 8-K (File No. 001-37580)
|
October 2, 2015
|
||
|
10.03
|
u
|
Current Report on Form 8-K (File No. 001-37580)
|
October 2, 2015
|
|||
|
10.04
|
u
|
Current Report on Form 8-K (File No. 001-37580)
|
October 2, 2015
|
|||
|
10.05
|
u
|
Current Report on Form 8-K (File No. 000-50726)
|
June 7, 2011
|
|||
|
10.05.1
|
u
|
Annual Report on Form 10-K
(File No. 000-50726)
|
March 30, 2005
|
|||
|
10.05.2
|
u
|
Annual Report on Form 10-K
(File No. 000-50726)
|
March 30, 2005
|
|||
|
10.05.3
|
u
|
Registration Statement on Form S-3
(File No. 333-142243)
|
April 20, 2007
|
|||
|
10.06
|
u
|
Current Report on Form 8-K
(File No. 001-37580)
|
June 8, 2018
|
|||
|
10.06.1
|
u
|
Quarterly Report on Form 10-Q
(File No. 001-37580)
|
November 3, 2016
|
|||
|
10.07
|
u
|
Registration Statement on Form S-8
(File No. 333-181661)
|
May 24, 2012
|
|||
|
Alphabet Inc.
|
|
|
Exhibit
Number
|
Description
|
Incorporated by reference herein
|
||||
|
Form
|
Date
|
|||||
|
10.08
|
u
|
Registration Statement on Form S-8
(File No. 333-167411)
|
June 9, 2010
|
|||
|
10.09
|
u
|
Registration Statement on Form S-8
(File No. 333-214573)
|
November 10, 2016
|
|||
|
10.09.1
|
u
|
Registration Statement on Form S-8
(File No. 333-214573)
|
November 10, 2016
|
|||
|
14.01
|
Annual Report on Form 10-K
(File No. 001-37580) |
February 6, 2018
|
||||
|
21.01
|
*
|
|||||
|
23.01
|
*
|
|||||
|
24.01
|
*
|
|||||
|
31.01
|
*
|
|||||
|
31.02
|
*
|
|||||
|
32.01
|
‡
|
|||||
|
99.01
|
Current Report on Form 8-K
(File No. 001-37580)
|
July 18, 2018
|
||||
|
101.INS
|
*
|
XBRL Instance Document
|
||||
|
101.SCH
|
*
|
XBRL Taxonomy Extension Schema Document
|
||||
|
101.CAL
|
*
|
XBRL Taxonomy Extension Calculation Linkbase Document
|
||||
|
101.DEF
|
*
|
XBRL Taxonomy Extension Definition Linkbase Document
|
||||
|
101.LAB
|
*
|
XBRL Taxonomy Extension Label Linkbase Document
|
||||
|
101.PRE
|
*
|
XBRL Taxonomy Extension Presentation Linkbase Document
|
||||
_________________
|
u
|
Indicates management compensatory plan, contract, or arrangement.
|
|
*
|
Filed herewith.
|
|
‡
|
Furnished herewith.
|
|
ITEM 16.
|
FORM 10-K SUMMARY
|
None.
|
Alphabet Inc.
|
|
SIGNATURES
Pursuant to the requirements of Section 13 or 15(d) of the Securities Exchange Act of 1934, the registrant has duly caused this Annual Report on Form 10-K to be signed on its behalf by the undersigned, thereunto duly authorized.
Date:
February 4, 2019
|
ALPHABET INC.
|
|
|
By:
|
/
S
/ L
ARRY
P
AGE
|
|
Larry Page
|
|
|
Chief Executive Officer
(Principal Executive Officer of the Registrant)
|
|
POWER OF ATTORNEY
KNOW ALL PERSONS BY THESE PRESENTS, that each person whose signature appears below constitutes and appoints Larry Page and Ruth M. Porat, jointly and severally, his or her attorney-in-fact, with the power of substitution, for him or her in any and all capacities, to sign any amendments to this Annual Report on Form 10-K and to file the same, with exhibits thereto and other documents in connection therewith, with the Securities and Exchange Commission, hereby ratifying and confirming all that each of said attorneys-in-fact, or his or her substitute or substitutes, may do or cause to be done by virtue hereof.
Pursuant to the requirements of the Securities Exchange Act of 1934, this Annual Report on Form 10-K has been signed below by the following persons on behalf of the Registrant and in the capacities and on the dates indicated.
|
Alphabet Inc.
|
|
|
Signature
|
Title
|
Date
|
|
/
S
/ L
ARRY
P
AGE
|
Chief Executive Officer, Co-Founder, and Director (Principal Executive Officer)
|
February 4, 2019
|
|
Larry Page
|
||
|
/
S
/ R
UTH
M. P
ORAT
|
Senior Vice President and Chief Financial Officer (Principal Financial Officer)
|
February 4, 2019
|
|
Ruth M. Porat
|
||
|
/
S
/ A
MIE
T
HUENER
O'
TOOLE
|
Vice President and Chief Accounting Officer
|
February 4, 2019
|
|
Amie Thuener O'Toole
|
||
|
/
S
/ S
ERGEY
B
RIN
|
President, Co-Founder, and Director
|
February 4, 2019
|
|
Sergey Brin
|
||
|
/
S
/ J
OHN
L. H
ENNESSY
|
Director, Chair
|
February 4, 2019
|
|
John L. Hennessy
|
||
|
/
S
/ E
RIC
E. S
CHMIDT
|
Director
|
February 4, 2019
|
|
Eric E. Schmidt
|
||
|
/
S
/ L. J
OHN
D
OERR
|
Director
|
February 4, 2019
|
|
L. John Doerr
|
||
|
/
S
/ R
OGER
W. F
ERGUSON,
J
R
.
|
Director
|
February 4, 2019
|
|
Roger W. Ferguson, Jr.
|
||
|
/
S
/ D
IANE
B. G
REENE
|
Director
|
February 4, 2019
|
|
Diane B. Greene
|
||
|
/
S
/ A
NN
M
ATHER
|
Director
|
February 4, 2019
|
|
Ann Mather
|
||
|
/
S
/ A
LAN
R
.
M
ULALLY
|
Director
|
February 4, 2019
|
|
Alan R. Mulally
|
||
|
/
S
/ S
UNDAR
P
ICHAI
|
Director
|
February 4, 2019
|
|
Sundar Pichai
|
||
|
/
S
/ K. R
AM
S
HRIRAM
|
Director
|
February 4, 2019
|
|
K. Ram Shriram
|
||
TABLE OF CONTENTS
Part IItem 1. BusinessItem 1A. Risk FactorsItem 1B. Unresolved Staff CommentsItem 2. PropertiesItem 3. Legal ProceedingsItem 4. Mine Safety DisclosuresPart IIItem 5. Market For Registrant S Common Equity, Related Stockholder Matters and Issuer Purchases Of Equity SecuritiesItem 6. Selected Financial DataItem 7. Management S Discussion and Analysis Of Financial Condition and Results Of OperationsItem 7A. Quantitative and Qualitative Disclosures About Market RiskItem 8. Financial Statements and Supplementary DataNote 1. Nature Of Operations and Summary Of Significant Accounting PoliciesNote 2. RevenuesNote 3. Financial InstrumentsNote 4. Variable Interest Entities (vies)Note 5. DebtNote 6. Supplemental Financial Statement InformationNote 7. AcquisitionsNote 8. Goodwill and Other Intangible AssetsNote 9. Commitments and ContingenciesNote 10. Stockholders EquityNote 11. Net Income Per ShareNote 12. Compensation PlansNote 13. Income TaxesNote 14. Information About Segments and Geographic AreasItem 9. Changes in and Disagreements with Accountants on Accounting and Financial DisclosureItem 9A. Controls and ProceduresItem 9B. Other InformationPart IIIItem 10. Directors, Executive Officers and Corporate GovernanceItem 11. Executive CompensationItem 12. Security Ownership Of Certain Beneficial Owners and Management and Related Stockholder MattersItem 13. Certain Relationships and Related Transactions, and Director IndependenceItem 14. Principal Accountant Fees and ServicesPart IVItem 15. Exhibits, Financial Statement SchedulesItem 16. Form 10-k Summary