GOLD RESOURCE CORP
10-Ks and 10-Qs
|
|
|
|
|
|
|
|
|
|
|
|
|
|
|
|
|
|
|
|
|
|
|
|
|
|
|
|
|
|
|
|
|
|
|
|
|
|
|
|
|
|
|
|
|
|
|
|
|
|
|
|
|
|
|
|
UNITED
STATES
SECURITIES
AND EXCHANGE COMMISSION
Washington,
D.C. 20549
FORM 10-K
| x |
ANNUAL
REPORT PURSUANT TO SECTION 13 OR 15(d) OF THE SECURITIES
EXCHANGE ACT OF 1934
|
|
|
For
the fiscal year ended December 31, 2009
|
||
| o |
TRANSITION
REPORT UNDER SECTION 13 OR 15(d) OF THE SECURITIES EXCHANGE ACT
OF 1934
|
|
|
For
the transition period from
to
|
||
Commission file
number 333-129321
GOLD
RESOURCE CORPORATION
(Exact
name of registrant as specified in its charter)
|
Colorado
|
84-1473173
|
|
|
(State
or other jurisdiction of
incorporation
or organization)
|
(I.R.S.
Employer
Identification
No.)
|
|
|
222
Milwaukee Street, Suite 301, Denver, CO
|
80206
|
|
|
(Address
of principal executive offices)
|
(Zip
Code)
|
(303)
320-7708
(Registrant's
telephone number, including area code)
Securities
registered pursuant to Section 12(b) of the Act:
None
Securities
registered pursuant to Section 12(g) of the Act:
None
Indicate
by check mark if the registrant is a well-known seasoned issuer, as defined in
Rule 405 of the Securities Act. Yes
o
No
x
Indicate
by check mark if the registrant is not required to file reports pursuant to
Section 13 or Section 15(d) of the Act. Yes
o
No
x
Indicate
by check mark whether the issuer (1) filed all reports required to be filed
by Sections 13 or 15(d) of the Securities Exchange Act of 1934 during the
past 12 months (or for such shorter period that the registrant was required to
file such reports), and (2) has been subject to such filing requirements
for the past 90 days.
Yes
x
No
o
Indicate
by check mark whether the registrant has submitted electronically and posted on
its corporate Web site, if any, every Interactive Data File required to be
submitted and posted pursuant to Rule 405 of Regulation S-T (§ 232.405 of this
chapter) during the preceding 12 months (or for such shorter period that the
registrant was required to submit and post such
files). Yes
o
No
o
Indicate
by checkmark if disclosure of delinquent filers pursuant to Item 405 of
Regulation S-K (§229.405 of this chapter) is not contained herein, and will not
be contained, to the best of registrant's knowledge, in definitive proxy or
information statements incorporated by reference in Part III of this
Form 10-K or any amendment to this Form 10-K.
x
Indicate
by check mark whether the registrant is a large accelerated filer, an
accelerated filer, a non-accelerated filer or a smaller reporting
company. See the definitions of "large accelerated
filer," "accelerated filer" and "smaller reporting company" in Rule
12b-2 of the Exchange Act.
Indicate
by check mark whether the registrant is a shell company (as defined in
Rule 12b-2 of the Exchange Act).
Yes
o
No
x
The
aggregate market value of the Common Stock of Gold Resource Corporation held by
non-affiliates as of the last business day of the registrant's most recently
completed second fiscal quarter was $107,919,257 based on the closing price of
the common stock of $4.18.
As of
March 15, 2010 there were 48,700,284 shares of Common Stock
outstanding.
DOCUMENTS INCORPORATED BY
REFERENCE
: None
TABLE
OF CONTENTS
|
Page
|
||
|
PART I
|
||
|
PART II
|
||
|
PART III
|
||
|
PART IV
|
||
ADDITIONAL
INFORMATION
Descriptions
of agreements or other documents contained in this report are intended as
summaries and are not necessarily complete. Please refer to the
agreements or other documents filed or incorporated herein by reference as
exhibits. Please see the exhibit index at the end of this report
for a complete list of those exhibits.
i
SPECIAL
NOTE REGARDING FORWARD-LOOKING STATEMENTS
This
report contains forward-looking statements that involve risks and
uncertainties. The statements contained in this report that are not
purely historical are forward-looking statements within the meaning of Section
27A of the Securities Act of 1933 and Section 21E of the Securities Exchange Act
of 1934. When used in this report, the words “plan,” “target,”
“anticipate,” “believe,” “estimate,” “intend” and “expect” and similar
expressions are intended to identify such forward-looking
statements. Such forward-looking statements include, without
limitation, the statements regarding Gold Resource Corporation’s strategy,
future plans for production, future expenses and costs, future liquidity and
capital resources, and estimates of mineralized material. All
forward-looking statements in this report are based upon information available
to Gold Resource Corporation on the date of this report, and the company assumes
no obligation to update any such forward-looking statements. Forward
looking statements involve a number of risks and uncertainties, and there can be
no assurance that such statements will prove to be accurate. Gold
Resource Corporation’s actual results could differ materially from those
discussed in this report. In particular, there can be no assurance
that commercial production at the
El Aguila
Project will be
achieved in the time frames estimated, at the rates and costs estimated, or even
at all. Factors that could cause or contribute to such differences
include, but are not limited to, those discussed in the “
Item 1A. Risk Factors
” section
of this Form 10-K.
In
addition to the specific factors identified under “
Item 1A. Risk Factors
” in this
report, other uncertainties that could affect the accuracy of forward-looking
statements include:
|
•
|
decisions
of foreign countries and banks within those
countries;
|
|
•
|
unexpected
changes in business and economic
conditions;
|
|
•
|
changes
in interest rates and currency exchange
rates;
|
|
•
|
timing
and amount of production, if any;
|
|
•
|
technological
changes in the mining industry;
|
|
•
|
our
costs;
|
|
•
|
changes
in exploration and overhead costs;
|
|
▪
|
access
and availability of materials, equipment, supplies, labor and supervision,
power and water;
|
|
•
|
results
of current and future feasibility
studies;
|
|
•
|
the
level of demand for our products;
|
|
•
|
changes
in our business strategy;
|
|
▪
|
interpretation
of drill hole results and the geology, grade and continuity of
mineralization;
|
|
▪
|
the
uncertainty of mineralized material estimates and timing of development
expenditures; and
|
|
•
|
commodity
price fluctuations.
|
This
list, together with the factors identified under “
Item 1A. Risk Factors
,” is not
exhaustive of the factors that may affect any of our forward-looking
statements. You should read this report completely and with the
understanding that our actual future results may be materially different from
what we expect. These forward-looking statements represent our
beliefs, expectations and opinions only as of the date of this
report. We do not intend to update these forward looking statements
except as required by law. We qualify all of our forward-looking
statements by these cautionary statements.
ii
History
and Organization
We are
engaged in the exploration for and production of gold and silver, primarily in
Mexico. We were organized under the laws of the State of Colorado in
1998. We pursue exploration of gold and silver projects that we
believe feature low operating costs and have the potential to produce a high
return on the capital invested. We hold a 100% interest in five
properties in Mexico's southern State of Oaxaca.
See
“
Item 2. Properties
” for more
information about our properties. We are constructing a mill and a
mine at our flagship property, the
El Aguila
Project, which
will be our first mine if successfully operated, which is targeted for
2010.
We
completed our IPO in August 2006 and received gross proceeds of
$4,600,000. We raised additional capital pursuant to several private
placements of our common stock since that time. We used the initial
proceeds of our IPO and a private placement conduced in 2006 to conduct
exploration activities at the
El Aguila
property. We decided to move forward with efforts to construct a mill
and a mine at the
El
Aguila
Project on April 11, 2007. We used the funds from
subsequent private placements to commence construction of a mine and mill at the
El Aguila
Project. We anticipate using the funds provided by the most recent
private placement to continue these efforts, as well as to undertake additional
exploration activities.
See
“
Item 7. Management's Discussion and
Analysis of Financial Condition and Results of Operation
” for more
information.
Our
principal executive offices are located at 222 Milwaukee Street, Suite 301,
Denver, Colorado 80206, and our telephone number is (303)
320-7708. Our operations in Mexico are conducted through our
wholly-owned Mexican subsidiaries, Don David Gold, S.A. de C.V. and Golden Trump
Resources S. A. de C.V. We maintain a website at
www.goldresourcecorp.com
and
through a link on our website you can view the periodic filings that we make
with the Securities and Exchange Commission (“SEC”).
Please
refer to page 17 of this report for a glossary of certain terms used
herein.
Developments
During 2009
Construction at El Aguila
Project.
In late 2009, we completed construction of the
flotation circuit of the mill at the
El Aguila
Project. To date, we have committed or spent approximately
$35,496,000 on construction of a mill and initial infrastructure. We
anticipate that the facility we have built with the assistance of the
engineering firm of Lyntek Inc. of Denver, Colorado, will process 850 to 1100
tonnes of ore per day, depending on ore type, through a flotation circuit and
150 to 250 tonnes of ore per day, depending on ore type, through an agitated
leach circuit. We conducted pre-stripping and stock piling of
mineralized material from the open pit, and began processing that material upon
completion of the mill. We first produced concentrate at the mill in February
2010 and we expect to achieve “commercial production” in March or April, which
we consider to be when the mill throughput and recoveries are at least 80% of
the mill design.
See
“
Item 7. Management's Discussion and
Analysis of Financial Condition and Results of Operation
” for more
information.
During
2009, we received from the Mexican government the permit allowing us to remove
the mineralized material from the open pit area at the
El Aguila
Project. Pursuant to the permit, we have stockpiled ore for
processing at the mill. We expect that mining in the first year of production
will take place at the
El
Aguila
open pit mine and have begun mining of the mineralized material at
this site. Mining in the second year of commercial production is
anticipated to come from the
La Arista
vein mineralized
material and will require development of an underground mine. We are
constructing surface facilities associated with the underground
mine. In early 2010, we contracted with a local Mexican firm to
construct the decline ramp and additional developments at the
La Arista
vein. Construction
of the decline ramp is presently underway.
1
Exploration
. Our
flagship property, the
El
Aguila
property, continued to be the primary focus of our exploration
program during 2009. Using funds obtained from our private placements
in 2009, we focused exploration drilling on three areas: the
El Aguila
near-surface
mineralized area, the
El
Aire
vein area, which is located along the same structural zone two
kilometers from the near-surface mineralized area, and a new discovery of
mineralization near
El
Aire
which we call the
La Arista
area. A
substantial amount of our business activities during 2009 were focused toward
that goal. In 2009, we completed a total of 7,242 meters (23,753
feet) in exploration drilling and spent approximately $7,800,000 on exploration
at our properties in Mexico, which was relatively the same amount we spent in
2008. However, we have not established proven or probable reserves as
defined by regulation of the SEC on our
El Aguila
Project or any of
our other properties.
Acquisition of Alta Gracia
Property
. In August 2009, we acquired claims adjacent to the
Las Margaritas
property
in the
Alta Gracia
Mining District by filing concessions under the Mexican mining
laws. These concessions are comprised of three mining claims, which
total 5,175 hectares, and the acquisition of these claims extended our land
position along what is known as the
San Jose
structural corridor
to just over 16 kilometers.
See
“
Item 2. Properties
” below for
additional information.
Strategic
Alliance & Financing Transactions
In
December 2008, we entered into a strategic alliance agreement with Hochschild
Mining Holdings Limited (“Hochschild”). Hochschild is a Peruvian
based, precious metals producer operating primarily in the
Americas. Hochschild is a private limited company organized under the
laws of England and Wales and an affiliate of publicly-traded Hochschild Mining
plc, whose shares are traded on the London Stock Exchange under the symbol
“HOC.”
Pursuant
to the terms of the strategic alliance agreement, we initially sold Hochschild
1,670,000 shares of our common stock for gross proceeds of $5,010,000 in a
private placement. We also granted Hochschild an 80-day option to
purchase 4,330,000 additional shares of our common stock for gross proceeds of
$12,990,000, which was exercised on February 25, 2009. As part of the
strategic alliance, we have agreed, among other things, to the
following:
|
•
|
To
offer Hochschild a right of first refusal to participate in future equity
financings solicited by us prior to commencement of commercial
production;
|
|
•
|
To
afford it a first right of refusal to participate in any joint ventures we
might pursue with regard to any of our
properties;
|
|
•
|
To
grant Hochschild preemptive rights to participate in certain financing
transactions; and
|
|
•
|
To
appoint one individual nominated by Hochschild to our Board of Directors
under certain conditions.
|
In
addition to the exercise of its option, Hochschild exercised its right of first
refusal to provide us with additional financing and we completed additional
private placement transactions with Hochschild in June and December of 2009 and
March 2010 for total gross proceeds of $41,172,000.
See
“
Item 7. Management's Discussion and
Analysis of Financial Condition and Results of Operation
” for more
information regarding these transactions. Certain of the rights
discussed above will be forfeited by Hochschild at such time as its percentage
ownership in our company decreases below 14.5%. Hochschild agreed to
a standstill provision prohibiting it from acquiring more than 40% of our
outstanding common stock through purchases in the market or directly from us
until February 25, 2011.
2
Competitive
Business Conditions
The
exploration for, and the acquisition of gold and silver properties, are subject
to intense competition. Due to our limited capital and personnel, we
are at a competitive disadvantage compared to many other companies with regard
to exploration and, if warranted, development of mining
properties. Our present limited funding means that our ability to
compete for properties to be explored and developed is limited. We
believe that competition for acquiring mineral prospects will continue to be
intense in the future.
The
availability of funds for exploration is sometimes limited, and we may find it
difficult to compete with larger and more well-known companies for
capital. Our inability to develop our mining properties due to lack
of funding, even if warranted, could have a material adverse effect on our
operation and financial position.
Government
Regulations and Permits
In
connection with mining, milling and exploration activities, we are subject to
extensive Mexican federal, state and local laws and regulations governing the
protection of the environment, including laws and regulations relating to
protection of air and water quality, hazardous waste management and mine
reclamation as well as the protection of endangered or threatened
species. The department responsible for environmental protection in
Mexico is SEMARNAT, which is similar to the United States Environmental
Protection Agency. SEMARNAT has broad authority to shut down and/or
levy fines against facilities that do not comply with its environmental
regulations or standards. Potential areas of environmental
consideration for mining companies, including ours if we are successful in
commencing mining operations, include, but are not limited to, acid rock
drainage, cyanide containment and handling, contamination of water courses, dust
and noise.
In
connection with our mill and mining operations at the
El Aguila
Project, we have
and will continue to secure various regulatory permits from federal, state and
local agencies. These governmental and regulatory permits generally
govern the processes being used to operate, the stipulations concerning air
quality and water issues, and the plans and obligations for reclamation of the
properties at the conclusion of operations. Regulations require that
an environmental impact statement, known in Mexico as a
Manifiestacion de Impacto
Ambiental
("MIA"), be prepared by a third-party contractor for submission
to SEMARNAT. We have
submitted our MIA to
SEMARNAT for their review and it has been approved.
Studies required to
support the MIA include a detailed analysis of these areas, among others: soil,
water, vegetation, wildlife, cultural resources and socio-economic
impacts. Although the regulatory process in Mexico has a public
review component, proof of local community support for a project is required to
gain final MIA approval. We have received the required local
community support.
We
received a federal permit granting permission to begin open pit mining at the
El Aguila
Project from
SEMARNAT in August 2009 and have commenced mining operations. In
December 2009, we also received a permit allowing us to begin developing our
underground mine. We purchased a permitted water well for the mill
site at the
El Aguila
Project. We believe the water provided by this well will be
adequate to meet the needs for any mining activity for the foreseeable
future.
3
We have
obtained, and will obtain at the appropriate time, environmental permits,
licenses or approvals required for operations. We are not aware of
any material violations of environmental permits, licenses or approvals issued
with respect to our operations.
Employees
We
currently have four full-time employees, three of which serve as our executive
officers. These individuals devote all of their business time to our
affairs. We also engage a financial consultant who provides his
services to us as necessary to assist with our administrative and financial
affairs.
Through
our wholly-owned Mexican subsidiaries, we employ approximately 107 Mexican
nationals, including one who serves as our
El Aguila
Project
Manager. We also use various independent contractors for our
exploration, mining and construction activities.
This
report, including Management's Discussion and Analysis of Financial Condition
and Results of Operation, contains forward-looking statements that may be
materially affected by several risk factors, including those summarized
below:
Risks
Relating to Our Company
Since we have no
operating history, investors have no basis to evaluate our ability to operate
profitably
. We were organized in 1998 but have had no revenue
from operations since our inception. Our activities to date have been
limited to organizational efforts, raising financing, acquiring mining
properties, conducting limited exploration and preparation for production at the
El Aguila
Project. We have never produced gold or other metals and have
received no revenue from operations to date. We face all of the risks
commonly encountered by other businesses that lack an established operating
history, including the need for additional capital and personnel, and intense
competition. There is no assurance that our business plan will be
successful. In particular, there can be no assurance that commercial
production at our
El
Aguila
Project will be achieved in the time frames estimated, at the
rates and costs estimated, if at all.
We have a history
of losses and may incur losses in the future.
We have incurred
losses since inception and may incur losses in the future. We
incurred the following losses from operations during each of the following
periods:
|
·
|
Approximately
$34,184,000 for the year ended December 31,
2009;
|
|
·
|
Approximately
$26,349,000 for the year ended December 31, 2008;
and
|
|
·
|
Approximately
$8,319,000 for the year ended December 31,
2007.
|
We had an
accumulated deficit of approximately $75,000,000 as of December 31,
2009. We expect to continue to incur losses unless and until such
time as one of our properties enters into commercial production and generates
sufficient revenues to fund continuing operations.
We have no proven
or probable reserves, and the probability of an individual prospect having
reserves is extremely remote
.
Therefore, in all
likelihood, our properties do not contain any reserves, and any funds spent by
us on exploration or development could be lost
. We have not
established the presence of any proven or probable mineral reserves, as defined
by the SEC, at any of our properties. The SEC has defined a "reserve"
as that part of a mineral deposit which could be economically and legally
extracted or produced at the time of the reserve determination. Any
mineralized material discovered by us should not be considered proven or
probable reserves.
4
In order
to demonstrate the existence of proven or probable reserves, it would be
necessary for us to continue exploration to demonstrate the existence of
sufficient mineralized material with satisfactory continuity and then obtain a
positive feasibility study. Exploration is inherently risky, with few
properties ultimately proving economically successful. We do not
intend to pursue additional exploration for the purpose of establishing proven
or probable reserves.
Establishing
reserves requires a feasibility study demonstrating with reasonable certainty
that the deposit can be economically extracted and produced. We have
not completed a feasibility study with regard to all or a portion of any of our
properties, nor do we intend to perform such feasibility study at this
time.
Since we have no
proven or probable reserves, our investment in mineral properties is not
reported as an asset in our financial statements which may have a negative
impact on the price of our stock
. We prepare our financial
statements in accordance with accounting principles generally accepted in the
United States of America and report substantially all exploration and
construction expenditures as expenses unless and until we are able to establish
proven or probable reserves. If we are able to establish proven or
probable reserves, we would report development expenditures as an asset subject
to future amortization using the units-of-production method. Since it
is uncertain when, if ever, we will establish proven or probable reserves, it is
uncertain whether we will ever report these expenditures as an
asset. Accordingly, our financial statements report fewer assets and
greater expenses than would be the case if we had proven or probable reserves,
which could have a negative impact on our stock price.
If we are unable
to achieve gold and silver production levels anticipated from our El Aguila
Project, our financial condition and results of operation will be adversely
affected
. We are proceeding with the construction of the
El Aguila
Project based on
estimates of mineralized material identified in our drilling program and
estimates of gold and silver recovery based on test work developed during our
scoping study. However, risks related to metallurgy are inherent when
working with extractable minerals. Sales of gold and silver, if any,
that we realize from future mining activity will be less than anticipated if the
mined material does not contain the concentration of gold and silver predicted
by our geological exploration. This risk may be increased since we
have not sought or obtained a feasibility study or reserve report with regard to
any of our properties. If sales of gold and silver are less than
anticipated, we may not be able to recover our investment in our property and
our operations may be adversely affected.
We may require
significant additional capital to fund our business plan
. We
will require additional capital for exploration of one or more of our existing
properties or to acquire additional properties. It may be the case
that we will require additional capital in addition to the funds already raised
in our private placements to fund the completion of construction of the mill and
startup of the
El
Aguila
Project. We will be required to hire additional
staff. In addition, we may require additional working capital to
continue to fund operations pending sale of any gold or other
metals. Our ability to obtain necessary funding for these purposes,
in turn, depends upon a number of factors, including the status of the national
and worldwide economy and the price of gold and other precious
metals. Capital markets worldwide have been adversely affected by
substantial losses by financial institutions, in turn caused by investments in
asset-backed securities. We may not be successful in obtaining the
required financing, or if we can obtain such financing, such financing may not
be on terms that are favorable to us. Failure to obtain such
additional financing could result in delay or indefinite postponement of further
exploration or development and the possible, partial or total loss of our
potential interest in our properties.
5
Estimates of
mineralized material are based on interpretation and assumptions and may yield
less mineral production under actual conditions than is currently
estimated
. Unless otherwise indicated, mineralized material
presented in our filings with securities regulatory authorities, including the
SEC, press releases and other public statements that may be made from time to
time are based upon estimates made by our consultants. When making
determinations about whether to advance any of our projects to development, we
must rely upon such estimated calculations as to the mineralized material on our
properties. Until mineralized material is actually mined and
processed, it must be considered an estimate only.
These
estimates are imprecise and depend on geological interpretation and statistical
inferences drawn from drilling and sampling analysis, which may prove to be
unreliable. We cannot assure you that these mineralized material
estimates will be accurate or that this mineralized material can be mined or
processed profitably.
Any
material changes in estimates of mineralized material will affect the economic
viability of placing a property into production and such property’s return on
capital. There can be no assurance that minerals recovered in small
scale tests will be recovered at production scale.
The
mineralized material estimates have been determined and valued based on assumed
future prices, cut-off grades and operating costs that may prove
inaccurate. Extended declines in market prices for gold and silver
may render portions of our mineralized material uneconomic and adversely affect
the commercial viability of one or more of our properties and could have a
material adverse effect on our results of operations or financial
condition.
Should we
successfully commence mining operations at our El Aguila Project, our ability to
remain profitable long-term will depend on our ability to identify, explore, and
develop additional properties
. Gold and silver properties are
wasting assets. They eventually become depleted or uneconomical to
continue mining. The acquisition of gold and silver properties and
their exploration and development are subject to intense
competition. Companies with greater financial resources, larger
staff, more experience and more equipment for exploration and development may be
in a better position than us to compete for such mineral
properties. If we are unable to identify, develop, and economically
mine new properties, we most likely will not be able to be profitable on a long
term basis.
The construction
of our mine and mill are subject to all of the risks inherent in
construction
. These risks include potential delays, cost
overruns, shortages of material or labor, construction defects, and injuries to
persons and property. While we anticipate taking all measures which
we deem reasonable and prudent in connection with construction of the mill,
there is no assurance that the risks described above will not cause delays or
cost overruns in connection with such construction. Any delay would
postpone our anticipated receipt of revenue and adversely affect our
operations. Cost overruns would likely require that we obtain
additional capital in order to commence production. Any of these
occurrences may adversely affect our ability to generate revenues and the price
of our stock.
Our operations
are subject to permitting requirements which could require us to delay, suspend
or terminate our operations
. Our operations, including our
ongoing exploration drilling program and proposed production plan at the
El Aguila
Project, require
permits from the government. We may be unable to obtain these permits
in a timely manner, on reasonable terms, or at all. If we cannot
obtain or maintain the necessary permits, or if there is a delay in receiving
these permits, our timetable and business plan for exploration of our property
or commercial production will be adversely affected.
6
Our properties
are located in Mexico and are subject to changes in political conditions and
regulations in that country
. Our existing properties are
located in Mexico. In the past, Mexico has been subject to political
and social instability, changes and uncertainties which may cause changes to
existing government regulations affecting mineral exploration and mining
activities. Civil or political unrest could disrupt our operations at
any time. Our mineral exploration and mining activities in Mexico may
be adversely affected in varying degrees by changing governmental regulations
relating to the mining industry or shifts in political conditions that increase
the costs related to our activities or maintaining our
properties. Finally, Mexico's status as a developing country may make
it more difficult for us to obtain required financing for our
project.
Our business
operations may be adversely affected by social and political unrest in
Oaxaca.
The properties which we are currently exploring for
mineralization and the mill we are building are located in the State of Oaxaca,
Mexico. Oaxaca City, the capital of the State of Oaxaca, experienced
a period of social and political unrest in 2006. Certain civilian
groups seeking political reform staged protests and demonstrations in various
locations in Oaxaca City, including schools, government offices and major
roadways. Although our property is roughly a 90 minute drive from
Oaxaca City and the civil disturbances appear to have dissipated, our business
operations could be negatively impacted if Oaxaca experiences another such
event. Our exploration and construction program may be interrupted if
we are unable to hire qualified personnel or if we are denied access to the site
where our property is located. We may also be required to make
additional expenditures to provide increased security in order to protect
property or personnel located at our exploration and construction
sites. Significant delays in exploration or increases in expenditures
will likely have a material adverse affect on our financial condition and
results of operations.
Our ability to
continue exploration and extract any minerals that we discover is subject to
payment of concession fees and if we fail to make these payments, we may lose
our interest in the properties
. Mining concessions in Mexico
are subject to payment of concession fees to the federal government or lease
payments to the owner of the concessions. The payments are based on
the size of the property we are exploring. Our failure or inability
to pay the concession fees to the government may cause us to lose our interest
in one or more of our properties.
Our primary
exploration target is subject to a lease in favor of a third party which
provides for royalties on production
. We lease our
El Aguila
property from a
third party. Our lease for the
El Aguila
property is subject
to a net smelter return royalty of 4% where production is sold in the form of
gold/silver dorè and 5% where production is sold in concentrate
form. The requirement to pay royalties to the owner of the
concessions at our
El
Aguila
property will reduce our profitability, if any, if we commence
commercial production of gold or other precious metals.
Legislation has
been proposed that would significantly affect the mining
industry.
Currently, Mexican mining law does not require
payment of finder’s fees or royalties to the government, except in limited
circumstances. However, the PRI, which is the main opposition political
party, with the support of other opposition parties has introduced in the
Mexican Chamber of Deputies a 4% mining royalty on production. The
opposition parties collectively have a majority in both the Chamber of Deputies
and the Senate, with the governing PAN currently a minority. The
opposition numbers are sufficient (over 2/3) to override a Presidential veto in
the Chamber but not in the Senate. To date, the government has been
silent on the royalty proposal, however, if such royalty is implemented, it may
increase the cost of our mining operations.
Our ability to
develop our property is subject to the rights of the Ejido (local inhabitants)
to surface use for agricultural purposes
. Our ability to mine
minerals is subject to making satisfactory arrangements with the
Ejido
for access and surface
disturbances.
Ejidos
are groups of local
inhabitants who were granted rights to conduct agricultural activities on the
property. We must negotiate and maintain a satisfactory arrangement
with these inhabitants in order to disturb or discontinue their rights to
farm. While we have successfully negotiated and signed such
agreements to enable us to begin construction at the
El Aguila
Project, our
inability to maintain these agreements could impair or impede our ability to
successfully mine the properties.
7
The volatility of
the price of gold and silver could adversely affect our future operations and,
if warranted, our ability to develop our properties
. The
potential for profitability of our operations, the value of our properties, the
market price of our common stock and our ability to raise funding to conduct
continued exploration and development, if warranted, are directly related to the
market price of gold, silver and other precious metals. Our decision
to put a mine into production and to commit the funds necessary for that purpose
must be made long before the first revenue from production would be
received. A decrease in the price of gold and silver may prevent our
property from being economically mined or result in the writeoff of assets whose
value is impaired as a result of lower gold and silver prices. The
price of gold and silver is affected by numerous factors beyond our control,
including inflation, fluctuation of the U.S. dollar and foreign currencies,
global and regional demand, the sale of gold and silver by central banks, and
the political and economic conditions of major gold and silver producing
countries throughout the world.
The
volatility in gold and silver prices is illustrated by the following table,
which sets forth, for the periods indicated (calendar year), the average annual
market prices in U.S. dollars per ounce of gold and silver, based on the daily
London P.M. fix, as shown in the table below:
|
Mineral
|
2005
|
2006
|
2007
|
2008
|
2009
|
|||||
|
Gold
|
$445.00
|
$604.00
|
$696.00
|
$872.00
|
$972.00
|
|||||
|
Silver
|
$
7.32
|
$ 11.54
|
$ 13.38
|
$ 14.99
|
$ 14.67
|
The
volatility of mineral prices represents a substantial risk which no amount of
planning or technical expertise can fully eliminate. In the event
gold prices decline or remain low for prolonged periods of time, we might be
unable to develop our properties, which may adversely affect our results of
operations, financial performance and cash flows.
Competition in
the mining industry is intense, and we have limited financial and personnel
resources with which to compete
. Competition in the mining
industry for desirable properties, investment capital and personnel is
intense. Numerous companies headquartered in the United States,
Canada and elsewhere throughout the world compete for properties on a global
basis. We are an insignificant participant in the gold mining
industry due to our limited financial and personnel resources. We
presently operate with a limited number of personnel and we anticipate that we
will compete with other companies in our industry to hire additional qualified
personnel which will be required to successfully operate our mine and mill
site. We may be unable to attract the necessary investment capital or
personnel to fully explore and if warranted, develop our properties and be
unable to acquire other desirable properties.
An adequate
supply of water may not be available to undertake mining and production at our
property
. Water rights are owned by the Mexican nation and are
administered by a Mexican government agency. This agency has granted
water concessions to private parties throughout the area defined as the Oaxaca
Hydrologic Basin, however there is no assurance that we will be granted such
concessions. We have purchased water rights which we believe will be
sufficient for our anticipated production needs. However, we have no
assurance these water rights will continue to produce enough water for our
activities. Accordingly, we may not have access to the amount of
water needed to operate a mine at the property.
8
Since most of our
expenses are paid in Mexican pesos, and we anticipate selling any production
from our properties in United States dollars, we are subject to adverse changes
in currency values that will be difficult to prevent
. Our
operations in the future could be affected by changes in the value of the
Mexican peso against the United States dollar. At the present time,
since we have no production, we have no plans or policies to utilize forward
sales contracts or currency options to minimize this exposure. If and
when these measures are implemented, there is no assurance they will be cost
effective or be able to fully offset the effect of any currency
fluctuations.
Our activities in
Mexico are subject to significant environmental regulations, which could raise
the cost of doing business
. Mining operations are subject to
environmental regulation by SEMARNAT, the environmental protection agency of
Mexico. Regulations require that an environmental impact statement,
known in Mexico as a
Manifiestacion de Impacto
Ambiental
, be prepared by a third party contractor for submission to
SEMARNAT. Studies required to support this impact statement include a
detailed analysis of many subject areas, including soil, water, vegetation,
wildlife, cultural resources and socio-economic impacts. We may also
be required to submit proof of local community support for a project to obtain
final approval. Significant environmental legislation exists in
Mexico, including fines and penalties for spills, release of emissions into the
air, seepage and other environmental damage.
The nature of
mineral exploration and production activities involves a high degree of risk and
the possibility of uninsured losses
. Exploration for and the
production of minerals is highly speculative and involves greater risk than many
other businesses. Many exploration programs do not result in the
discovery of mineralization, and any mineralization discovered may not be of
sufficient quantity or quality to be profitably mined. Our operations
are, and any future development or mining operations we may conduct will be,
subject to all of the operating hazards and risks normally incident to exploring
for and development of mineral properties, such as, but not limited
to:
|
·
|
economically
insufficient mineralized material;
|
|
·
|
fluctuation
in production costs that make mining
uneconomical;
|
|
·
|
labor
disputes;
|
|
·
|
unanticipated
variations in grade and other geologic
problems;
|
|
·
|
environmental
hazards;
|
|
·
|
water
conditions;
|
|
·
|
difficult
surface or underground conditions;
|
|
·
|
industrial
accidents;
|
|
·
|
metallurgic
and other processing problems;
|
|
·
|
mechanical
and equipment performance problems;
|
|
·
|
failure
of pit walls or dams;
|
|
·
|
unusual
or unexpected rock formations;
|
|
·
|
personal
injury, fire, flooding, cave-ins and landslides;
and
|
|
·
|
decrease
in the value of mineralized material due to lower gold and silver
prices.
|
Any of
these risks can materially and adversely affect, among other things, the
development of properties, production quantities and rates, costs and
expenditures, potential revenues and production dates. We currently
have no insurance to guard against any of these risks. If we
determine that capitalized costs associated with any of our mineral interests
are not likely to be recovered, we would incur a writedown of our investment in
these interests. All of these factors may result in losses in
relation to amounts spent which are not recoverable.
9
We depend upon a
limited number of personnel and the loss of any of these individuals could
adversely affect our business
. If any of our current executive
employees, our principal consultant in Mexico or our principal financial
consultant were to die, become disabled or leave the company, we would be forced
to identify and retain individuals to replace
them. Messrs. William, David and Jason Reid and Mr. Jorge
Sanchez del Toro are our critical employees at this time. Frank L.
Jennings is a financial consultant who provides services to us as chief
financial officer. There is no assurance that we can find suitable
individuals to replace them or to add to our employee base if that becomes
necessary. We are entirely dependent on these individuals as our
critical personnel at this time. We have no life insurance on any
individual, and we may be unable to hire a suitable replacement for them on
favorable terms, should that become necessary.
In the event of a
dispute regarding title to our property or any facet of our operations, it will
likely be necessary for us to resolve the dispute in Mexico, where we would be
faced with unfamiliar laws and procedures
. The resolution of
disputes in foreign countries can be costly and time consuming, similar to the
situation in the United States. However, in a foreign country, we
face the additional burden of understanding unfamiliar laws and
procedures. We may not be entitled to a jury trial, as we might be in
the United States. Further, to litigate in any foreign country, we
would be faced with the necessity of hiring lawyers and other professionals who
are familiar with the foreign laws. For these reasons, we may incur
unforeseen losses if we are forced to resolve a dispute in Mexico or any other
foreign country.
We are required
to annually evaluate our internal control over financial reporting under Section
404 of the Sarbanes-Oxley Act of 2002 and any adverse results from such
evaluation could result in a loss of investor confidence in our financial
reports and have a material adverse effect on the price of our common
stock
. Under Section 404 of the Sarbanes-Oxley Act of 2002, we
are required to furnish a report by our management on internal control over
financial reporting. Such a report must contain, among other matters,
an assessment of the effectiveness of our internal control over financial
reporting, including a statement as to whether or not our internal control over
financial reporting is effective. This assessment must include
disclosure of any material weaknesses in our internal control over financial
reporting identified by our management. In addition, our evaluation
of the effectiveness of our internal controls will be subject to an annual audit
by our independent registered public accounting firm and there is no assurance
that they will agree with our assessment. If we are unable to
maintain and to assert that our internal control over financial reporting is
effective, or if we disclose material weaknesses in our internal control over
financial reporting, or if our independent registered public accounting firm
does not agree with our assessment, investors could lose confidence in the
accuracy and completeness of our financial reports, which could have a material
adverse effect on our stock price.
We are not
registered under the Securities Exchange Act of 1934
. Our
common stock is presently registered with the SEC only under the Securities Act
of 1933, as amended. Because we have not registered our common stock
under the Securities Exchange Act of 1934, as amended (the “Exchange Act”), we
are not required to file information reports with the
SEC. Additionally, our directors and officers are not required to
file reports under Section 16 of the Exchange Act. As a result, there
is less information available to the public regarding our corporate affairs and
insider transactions in our common stock than other companies that have
registered common stock under the Exchange Act. In the future, we
could cease filing information reports with the SEC at any time.
The laws of the
State of Colorado and our Articles of Incorporation may protect our directors
from certain types of lawsuits
. The laws of the State of
Colorado provide that our directors will not be liable to us or our shareholders
for monetary damages for all but certain types of conduct as directors of the
company. Our Articles of Incorporation permit us to indemnify our
directors and officers against all damages incurred in connection with our
business to the fullest extent provided or allowed by law. The
exculpation provisions may have the effect of preventing shareholders from
recovering damages against our directors caused by their negligence, poor
judgment or other circumstances. The indemnification provisions may
require us to use our limited assets to defend our directors and officers
against claims, including claims arising out of their negligence, poor judgment,
or other circumstances.
10
Risks
Related to Our Common Stock
Our stock price
may be volatile and as a result you could lose all or part of your
investment
. In addition to volatility associated with over the
counter securities in general, the value of your investment could decline due to
the impact of any of the following factors upon the market price of our common
stock:
|
·
|
Changes
in the worldwide price for gold;
|
|
·
|
Disappointing
results from our exploration
efforts;
|
|
·
|
Failure
to reach commercial production or producing at rates lower than those
targeted;
|
|
·
|
Failure
to meet our revenue or profit goals or operating
budget;
|
|
·
|
Decline
in demand for our common stock;
|
|
·
|
Downward
revisions in securities analysts' estimates or changes in general market
conditions;
|
|
·
|
Technological
innovations by competitors or in competing
technologies;
|
|
·
|
Investor
perception of our industry or our prospects;
and
|
|
·
|
General
economic trends.
|
In
addition, stock markets have experienced extreme price and volume fluctuations
and the market prices of securities have been highly volatile. These
fluctuations are often unrelated to operating performance and may adversely
affect the market price of our common stock. As a result, investors
may be unable to resell their shares at a fair price.
We have a limited
number of common shares available for future issuance which could adversely
affect our ability to raise capital or consummate
acquisitions.
We are authorized to issue 60,000,000 shares of
common stock. As a consequence, we currently have remaining available for
issuance 7,494,716 shares of common stock after giving effect to the exercise of
all outstanding stock options. Due to the limited number of authorized shares
available for issuance, our ability to raise additional capital or complete any
potential acquisitions we may identify may be limited. We would be
required to seek shareholder approval to increase the number of our authorized
shares of common stock, and we can provide no assurance that we will be
successful in obtaining the necessary shareholder approval to increase the
number of shares of common stock we are authorized to issue. If we
are unable to raise additional funds through the issuance of securities and no
alternative source of funds is available, we may be required to delay, reduce
the scope of or eliminate our mining and exploration activities and we may be
unable to continue our operations.
Since there is
presently a limited trading market for our common stock, purchasers of our
common stock may have difficulty selling their shares, should they desire to do
so
. Due to a number of factors, including the lack of listing
of our common stock on a national securities exchange, the trading volume in our
common stock is limited. Our trading volume on the OTC Bulletin Board
over the past three months has averaged approximately 114,000 shares per
day. As a result, the sale of a significant amount of common stock by
the selling shareholders may depress the price of our common stock and you may
lose all or a portion of your investment.
A small number of
existing shareholders own a significant amount of our common stock, which could
limit your ability to influence the outcome of any shareholder
vote
. Our executive officers and directors beneficially own
approximately 21% of our common stock and our largest shareholder owns
approximately 29% of our common stock as of the date of this
report. Under our Articles of Incorporation and Colorado law, the
vote of a majority of the shares outstanding is generally required to approve
most shareholder action. As a result, this group may be able to
influence the outcome of shareholder votes for the foreseeable future, including
votes concerning the election of directors, amendments to our Articles of
Incorporation or proposed mergers or other significant corporate
transactions. We have no existing agreements or plans for mergers or
other corporate transactions that would require a shareholder vote at this
time. However, shareholders should be aware that they may have
limited ability to influence the outcome of any vote in the
future.
See
"
Item 12. Security Ownership of
Certain Beneficial Owners and Management and Related Stockholder Matters
"
for additional information.
11
Since our common
stock is not presently listed on a national securities exchange, trading in our
shares may be subject to rules governing "penny stocks," which will impair
trading activity in our shares
. Our common stock may be
subject to rules adopted by the SEC regulating broker-dealer practices in
connection with transactions in penny stocks. Those disclosure rules
applicable to penny stocks require a broker-dealer, prior to a transaction in a
penny stock not otherwise exempt from the rules, to deliver a standardized
disclosure document required by the SEC. These rules also require a
cooling off period before the transaction can be finalized. These
requirements may have the effect of reducing the level of trading activity in
any secondary market for our common stock. Many brokers may be
unwilling to engage in transactions in our common stock because of the added
disclosure requirements, thereby making it more difficult for stockholders to
dispose of their shares.
Issuances of our
stock in the future could dilute existing shareholders and adversely affect the
market price of our common stock
. We have the authority to
issue up to 60,000,000 shares of common stock, 5,000,000 shares of preferred
stock, and to issue options and warrants to purchase shares of our common stock
without stockholder approval. Because our common stock is not
currently listed on an exchange, we are not required to solicit shareholder
approval prior to issuing large blocks of our stock. These future
issuances could be at values substantially below the price paid for our common
stock by our current shareholders. In addition, we could issue large
blocks of our common stock to fend off unwanted tender offers or hostile
takeovers without further stockholder approval. Because we believe
that trading in our common stock is limited, the issuance of our stock may have
a disproportionately large impact on its price compared to larger
companies.
We have never
paid dividends on our common stock
. We have not paid dividends
on our common stock to date, and we may not be in a position to pay dividends
for the foreseeable future. Our ability to pay dividends will depend
on our ability to successfully develop one or more properties and generate
earnings from operations. Further, our initial earnings, if any, will
likely be retained to finance our operations. Any future dividends
will depend upon our earnings, our then-existing financial requirements and
other factors, and will be at the discretion of our Board of
Directors.
None.
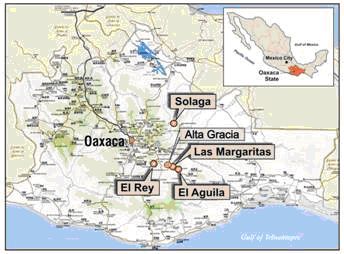
We
currently have an interest in five properties, the
El Aguila
property, the
Las Margaritas
property, the
El Rey
property, the
Solaga
property and the
Alta Gracia
property. We lease claims comprising the
El Aguila
property and the
Las Margaritas
property
from an individual who formerly served as our consultant in Mexico and the
Solaga
property from an
entity partially owned by the same individual. We own mining
concessions for the
El
Rey
property and the
Alta Gracia
property. All of these properties are in the exploration stage and
have no proven or probable reserves. The map below shows the general
location of our five properties in the State of Oaxaca, Mexico:
12
The
El Aguila
Project
Background.
Effective
October 14, 2002, we leased three mining concessions,
El Aguila
,
El Aire
and
La Tehuana,
totaling 1,896
hectares, from a former consultant to our company. The lease
agreement is subject to a 4% net smelter return royalty where production is sold
in the form of gold/silver dore and 5% for production sold in concentrate
form. We have made periodic advance royalty payments under the lease
totaling $260,000 and no further advance royalty payments are
due. Subject to minimum exploration requirements, there is no
expiration term for the lease. We may terminate it at any time upon
written notice to the lessor and the lessor may terminate it if we fail to
fulfill any of our obligations. The
El Aguila
and
El Aire
concessions make up
the
El Aguila
Project
and the
La Tehuana
concession makes up the
Las
Margaritas
property.
We have
filed for and received additional concessions for the
El Aguila
Project that total
an additional 8,492 hectares. These additional concessions are not
part of the concessions leased from our former consultant, and bring our
interest in the
El
Aguila
Project to an aggregate of 9,463 hectares. The mineral
concessions making up the
El
Aguila
Project are located within the
San Pedro Totolapam
Ejido
.
Location and
Access.
The
El Aguila
Project is located
in the
Sierra Madre del
Sur
of southern Mexico, in the central part of the State of
Oaxaca. Access to the property is by way of the Pan American Highway
(Highway # 190), approximately 120 kilometers (75 miles) southeast of Oaxaca
City, the state's capital city. At the village of
San Jose de Gracia
, a gravel
road goes approximately four kilometers northwest to the property. We
have completed construction to upgrade this road to make it better suited for
our construction and mining activities.
13
The
climate of the
El
Aguila
area is dry and warm to very warm with most rainfall occurring in
the summer and annual precipitation averaging only 423.7 mm (17
inches). The average yearly temperature is 26.6 degrees centigrade
(80° F). The area is very rocky with scarce
vegetation. Subsistence farming occurs and the main agricultural crop
is agave cactus that is cultivated for the production of mescal.
Exploration
Activities
. The early history of activity at the
El Aguila
property, as known
by us, is prospecting and limited mining for gold and silver from the early
1900's to the mid 1960's. In 1998, the concessions were leased to
Apex Silver Corporation of Denver, Colorado. Apex carried out an
exploration program involving geologic mapping, surface sampling and an 11-hole
drilling program (1,242 meters, or 4,074 feet). The results did not
meet Apex's expectations so it cancelled its lease on the property in
2002. We leased the property from our former consultant in October
2002.
In August
2003, we commenced an initial drilling and exploration program. The
drilling program was completed in 2004 and included approximately 3,900 meters
(12,795 feet) of drilling in 69 holes focused on one target area of the
property.
We have
carried out more recent exploration on the
El Aguila
Project that has
included geologic mapping, surface sampling, geochemical sampling, a geomagnetic
survey and exploratory drilling. Since inception, we have drilled a
total of 383 holes equaling 60,044 meters (196,946 feet) at our
El Aguila
property, including
12 holes for 7,242 meters (23,754 feet) in 2009. Our 2009 drilling program
continued to explore a relatively new area of mineralization at the
El Aguila
Project known as the
La Arista
vein, approximately two kilometers
from the mill site.
Construction
Activities
. We made a decision in April 2007 to undertake
efforts to place the
El
Aguila
Project into commercial production. Toward that end, we
have constructed a mill and other infrastructure. The mill is
designed to process 850 to 1100 tonnes of ore per day through a flotation
section and 150 to 250 tonnes of ore per day through an agitated leach
section. The flotation process produces a mineral concentrate through
the use of chemical conditioning agents to float or depress certain minerals
from a mineral rich foam concentrate created by agitation. The
flotation circuit is complete and we began commissioning the mill in December
2009. In February 2010, we produced concentrate for the first time
and hope we will achieve commercial production at the mill in March or
April.
See
“
Item 7. Management's
Discussion and Analysis of Financial Condition and Results of Operation
”
for more information.
We
received the permit granting permission to construct the mill in June 2008 and
completed the mill in late 2009. We have also completed construction
of a large and small dam for our tailings impoundment after receiving a federal
permit for the tailings facility in October 2008. We began
pre-stripping activity at the near-surface open pit area in conjunction with
construction of the tailings impoundment. In August 2009, we received
the necessary permit from the Mexican federal agency granting us approval to
begin mining the mineralized material and mining is now underway.
During
our first year of anticipated production, we expect that we will conduct open
pit mining at the
El
Aguila
near-surface mineralized material area and have commenced mining
operations in this area. We are targeting the
La Arista
vein area for
mining during our second year of production, which would require construction of
an underground mine. We have constructed surface facilities in this
area associated with the underground mine. In early 2010, we
contracted with a local Mexican firm to construct the decline ramp and
additional developments at the
La Arista
vein. Construction of the decline ramp is presently
underway.
We are
generating our own electrical power for the mill through diesel generators,
although the federal power grid, located along the Pan American Highway, may be
utilized in certain aspects of operations. We purchased a permitted
water well to supply water for our mining activities, however the water will
require pumping to the site approximately 4 kilometers away.
14
In
October 2007, we acquired an additional parcel of land which is approximately
five hectares in size and adjacent to the community of
San Jose de
Gracia
. The land cost us $152,522. We have
completed construction of an employee housing facility on this parcel that
includes 10 buildings and will house approximately 50 people.
Geology and
Mineralization
. The
El Aguila
Project is located
in the
San Jose de
Gracia
Mining District in the
Sierra Madre del Sur
of
southern Mexico. Multiple volcanic domes of various scales, and
probably non-vented intrusive domes, dominate the district
geology. These volcanogenic features are imposed on a pre-volcanic
basement of sedimentary rocks. Gold and silver mineralization in this
district is related to the manifestations of this classic volcanogenic system
and is considered epithermal in character.
Certain
deposits on the
El
Aguila
property are primarily hosted in a quartz rich, stratiform zone
(manto). The main manto drilled to date that forms our initial
El Aguila
shallow
mineralization, which we hope to mine by an open pit, is conformable with the
ryholitic volcanic rock above and below the manto. It varies in
thickness from less than two meters (6.6 feet) to more than 30 meters (98.4
feet). The gold and silver mineralization is considered low
sulfidation, epithermal in character. There appear to be several
other prospective manto units on the property.
Surface
sampling yielded anomalous gold and silver values from early district-wide
exploration where silicified zones were encountered. In addition, a
small, shallow adit and winze provided limited sampling underground, yielding
indications of gold values in a silicified, sub-horizontal
manto. Based on these early anomalous exploration samples, a drilling
program was carried out by us that in fact resulted in defining a central zone
of continuous, shallow, sub-horizontal mineralized material. The fact
that the mineralization is relatively shallow will make mining less difficult
and less expensive from an open pit mine compared to an underground
mine. This mineralized material at the
El Aguila
is near surface and
lends itself to open pit mining.
Our 2009
drilling program continued to explore a relatively new area of mineralization at
the
El Aguila
Project
that we call the
La
Arista
vein area, approximately two kilometers from the mill
site. We anticipate that the mineralized material we located would be
mined underground and mining activity in this area is targeted for year two and
beyond of our production plan and have contracted with a local firm to begin
construction of the underground mine. In addition, we discovered
another area of mineralization at the
El Aguila
Project that we
refer to as the
La
Escondida
vein. This area is approximately two kilometers west
of the mill site.
The
El Rey
Property
We have
acquired claims in another area in the state of Oaxaca by filing concessions
under the Mexican mining laws, referred to by us as the
El Rey
property. These concessions total 892 hectares. Certain of
the claims comprising this property are subject to a 2% net smelter return
royalty. We have conducted minimal exploration and drilling on this
property to date.
The
El Rey
property is an
exploration stage property with no known reserves. It is
approximately 64.4 kilometers (40 miles) from the
El Aguila
Project. There is no plant or equipment on the
El Rey
property. If exploration is successful, any mining would
probably require an underground mine but any mineralized material could be
processed at the
El
Aguila
Project mill.
15
Limited
drilling at
El Rey
has
encountered gold and silver mineralization up to 1 meter of 132.5 g/tonne gold
(4.25 ounces/tonne) and 1.5 meters of 958 g/tonne silver. To date, we
have drilled 48 holes for a total of 5,293 meters (14,008 feet) at the
El Rey
property. Additional exploration drilling is planned.
The
Las Margaritas
Property
The
Las Margaritas
property is
made up of the
La
Tehuana
concession. We leased this in October 2002 from our
former consultant. It is comprised of approximately 925 hectares
located adjacent to the
El
Aguila
property. To date, we have conducted limited surface
sampling, but no other significant exploration activities at the
property.
The
Solaga
Property
In
February 2007, we leased a 100% interest in a property known as the
Solaga
property, which totals
618 hectares, and is located approximately 120 kilometers (75 miles) from the
El Aguila
project. A dormant silver mine is located on the
Solaga
property which was in
production as recently as the 1980's. However, we cannot estimate if
or when we will reopen the mine. The lease requires us to perform
$25,000 in additional work and is subject to a 4% net smelter return royalty on
any production. We have not conducted any exploration activities at
the property.
The
Alta Gracia
Property
In August
2009, we acquired claims adjacent to the
Las Margaritas
property in
the
Alta Gracia
Mining
District by filing concessions under the Mexican mining laws. We
refer to this property as the
Alta Gracia
property. These concessions are comprised of three mining claims, the
David 1
, the
David 2
and
La Hurradura
. The
concessions total 5,175 hectares, and the acquisition of these claims extended
our land position along what is known as the
San Jose
structural corridor
to just over 16 kilometers. To date, we have not conducted
significant exploration activities at the property.
Mineral
Concessions
Mineral
rights in Mexico belong to the Mexican government and are administered pursuant
to Article 27 of the Mexican Constitution. Exploitation concessions
may be granted or transferred to Mexican citizens and
corporations. Our leases or concessions are held by our Mexican
subsidiaries. Exploitation concessions have a term of 50 years and
can be renewed for another 50 years. Concessions grant the holder the
right to explore and exploit all minerals found in the
ground. Maintenance of concessions requires the semi-annual payment
of mining duties (due in January and July) and the performance of assessment
work, on a calendar year basis, with assessment work reports required to be
filed in the month of May for the preceding calendar year. The amount
of mining duties and annual assessment are set by regulation and may increase
over the life of the concession and include periodic adjustments for
inflation. Mining concessions are registered at the Public Registry
of Mining in Mexico City and in regional offices in Mexico.
Mining
Regulations
Mexican
mining law does not require payment of finder’s fees or royalties to the
government, except for a discovery premium in connection with national mineral
reserves, concessions and claims or allotments contracted directly from the
Mexican Geological Survey. None of the claims held by any of our
subsidiaries are under such a discovery premium regime. However, the PRI, which
is the main opposition party, with the support of other opposition parties, has
introduced in the Chamber of Deputies a 4% mining royalty on
production. The opposition parties collectively have a majority in
both the Chamber of Deputies and the Senate, with the governing PAN a
minority. The opposition numbers are sufficient (over 2/3) to
override a Presidential veto in the Chamber but not in the Senate. To
date, the Mexican government has been silent on the royalty
proposal.
16
Ejido
Lands and Surface Right
Acquisitions
Surface
lands at the
El Aguila
Project area are
Ejido
lands (agrarian cooperative lands granted by the federal government to groups of
Campesinos
pursuant to
Article 27 of the Mexican Constitution of 1917). Prior to January 1,
1994,
Ejidos
could not
transfer
Ejido
lands
into private ownership. Amendments to Article 27 of the Mexican
Constitution in 1994 now allow individual property ownership within
Ejidos
and allow
Ejidos
to enter into
commercial ventures with individuals or entities, including foreign
corporations. We have an agreement with the local
San Pedro Totolapam
Ejido
allowing exploration
and exploitation of mineralization at the
El Aguila
Project.
Mexican
law recognizes mining as a land use generally superior to
agricultural. However, the law also recognizes the rights of the
Ejidos
to compensation
in the event mining activity interrupts or discontinues their use of the
agricultural lands. Compensation is typically made in the form of a
cash payment to the holder of the agricultural rights. The amount of
such compensation is generally related to the perceived value of the
agricultural rights as negotiated in the first instance between the
Ejidos
and the owner of the
mineral rights. If the parties are unable to reach agreement on the
amount of the compensation, the decision will be referred to the
government.
We have
established surface rights agreements with the
San Pedro Totolapam
Ejido
and the individuals
impacted by our proposed operations which allow disturbance of the surface where
necessary for our proposed mining operations.
Office
Facilities
Effective
October 1, 2005, we leased approximately 1,000 square feet of office space under
a three year agreement with an independent third party. In May 2007, we amended
the lease to add approximately 300 square feet and extended the lease term
through April 30, 2010. Monthly rent payments under this lease, including
parking and operating expenses, will average $2,470 per month through
April 30, 2010, when the lease expires. We are currently negotiating to
extend the term of this lease on a month to month basis. We believe
this space is adequate for our needs for the foreseeable future and that
substitute space would be readily available, if needed.
Glossary
|
Adit:
|
A
more or less horizontal drive (walk-in mine) into a hill that is usually
driven for the purpose of intersecting or mining an ore
body. An adit may also be driven into a hill to intersect or
connect a shaft for the purpose of dewatering. Adits were
commonly driven on a slight incline to enable loaded mine trucks to have
the advantage of a downhill run out, while the empty (lighter) truck was
pushed uphill back into the hill. The incline also allows water
to drain out of the adit. An adit only becomes a tunnel if it
comes out again on the hill somewhere, like a train tunnel.
|
|
Doré:
|
Unrefined
gold and silver bars usually containing more than 90% precious
metal.
|
17
|
Epithermal:
|
Used
to describe gold deposits found on or just below the surface close to
vents or volcanoes, formed at low temperature and pressure.
|
|
Gram:
|
A
metric unit of weight and mass, equal to 1/1000
th
of a kilogram. One gram equals .035 ounces. One
ounce equals 31.103 grams.
|
|
Hectare:
|
Another
metric unit of measurement, for surface area. One hectare
equals 1/200
th
of a square kilometer, 10,000 square meters, or 2.47 acres. A
hectare is approximately the size of a soccer field.
|
|
Kilometer:
|
Another
metric unit of measurement, for distance. The prefix "kilo"
means 1000, so one kilometer equals 1,000 meters, one kilometer equals
3,280.84 feet, which equals 1,093.6 yards, which equals 0.6214
miles.
|
|
Manto:
|
A
mineralogy term meaning a layer or stratum.
|
|
Mineralized
Material:
|
Minerals
or any mass of host rock in which minerals of potential commercial value
occur.
|
|
Net
Smelter Return Royalty:
|
A
share of the net revenue generated from the sale of metal produced by the
mine.
|
|
Ore
or Ore Deposit:
|
Rocks
that contain economic amounts of minerals in them and that are expected to
be profitably mined.
|
|
Silicified:
|
Is
combined or impregnated with silicon or silica.
|
|
Tonne:
|
A
metric ton. One tonne equals 1000 kg
.
It
is approximately equal to 2,204.62 pounds.
|
|
Volcanogenic:
|
Of
volcanic origin.
|
|
Volcanic
domes:
|
These
are mounds that form when viscous lava is erupted slowly and piles up over
the vent, rather than moving away as lava flow. The sides of
most domes are very steep and typically are mantled with unstable rock
debris formed during or shortly after dome emplacement. Most
domes are composed of silica-rich lava which may contain enough
pressurized gas to cause explosions during dome extrusion.
|
|
Winze:
|
Secondary
or tertiary vertical or near-vertical opening sunk from a point inside a
mine for the purpose of connecting with a lower level or of exploring the
ground for a limited depth below a
level.
|
|
Conversion
Table
|
|
|
Metric
System
|
Imperial
System
|
|
1
metre (m)
|
3.2808
feet (ft)
|
|
1
kilometer (km)
|
0.6214
mile (mi)
|
|
1
square kilometer (km
2
)
|
0.3861
square mile (mi
2
)
|
|
1
square kilometer (km
2
)
|
100
hectares (has)
|
|
1
hectare (ha)
|
2.471
acres (ac)
|
|
1
gram (g)
|
0.0322
troy ounce (oz)
|
|
1
kilogram (kg)
|
2.2046
pounds (lbs)
|
|
1
tonne (t)
|
1.1023
tons (t)
|
|
1
gram/tonne (g/t)
|
0.0292
ounce/ton (oz/t)
|
18
We are
not currently subject to any legal proceedings, and to the best of our
knowledge, no such proceeding is threatened, the results of which would have a
material impact on our properties, results of operation, or financial
condition. Nor, to the best of our knowledge, are any of our officers
or directors involved in any legal proceedings in which we are an adverse
party.
|
MARKET
FOR COMMON EQUITY, RELATED STOCKHOLDER MATTERS AND PURCHASES OF EQUITY
SECURITIES
|
Market
Information
Our
common stock trades over-the-counter and is quoted on the OTC Bulletin Board
under the symbol "GORO." The table below sets forth the high and low bid prices
for our common stock as reflected on the OTC Bulletin Board for the last two
fiscal years. Quotations represent prices between dealers, do not
include retail markups, markdowns or commissions, and do not necessarily
represent prices at which actual transactions were effected.
|
Year
Ending
|
High
|
Low
|
||||||
|
December 31, 2009
|
||||||||
|
First
Quarter
|
$ | 5.75 | $ | 3.15 | ||||
|
Second
Quarter
|
5.45 | 3.85 | ||||||
|
Third
Quarter
|
7.47 | 4.13 | ||||||
|
Fourth
Quarter
|
11.15 | 7.00 | ||||||
|
December 31, 2008
|
||||||||
|
First
Quarter
|
$ | 4.70 | $ | 3.27 | ||||
|
Second
Quarter
|
6.09 | 4.28 | ||||||
|
Third
Quarter
|
5.65 | 2.36 | ||||||
|
Fourth
Quarter
|
3.88 | 2.00 | ||||||
On March
12, 2010, the high and low sales price of our common stock on the OTC Bulletin
Board were $10.40 and $10.25, respectively, and we had approximately 91 holders
of record of our common stock.
Penny
Stock Rules
Due to
the fact that our common stock is not listed on a national securities
exchange, our stock may be characterized as a “penny stock” under applicable
securities regulations. If our stock is or becomes a penny stock, we
will be subject to rules adopted by the SEC regulating broker-dealer practices
in connection with transactions in penny stocks. The broker or dealer
proposing to effect a transaction in a penny stock must furnish his customer a
document containing information prescribed by the SEC and obtain from the
customer an executed acknowledgment of receipt of that document. The
broker or dealer must also provide the customer with pricing information
regarding the security prior to the transaction and with the written
confirmation of the transaction. The broker or dealer must also
disclose the aggregate amount of any compensation received or receivable by him
in connection with such transaction prior to consummating the transaction and
with the written confirmation of the trade. The broker or dealer must
also send an account statement to each customer for which he has executed a
transaction in a penny stock each month in which such security is held for the
customer's account. The existence of these rules may have an effect
on the price of our stock, and the willingness of certain brokers to effect
transactions in our stock.
19
Transfer
Agent
We have
appointed Corporate Stock Transfer, Inc. ("CST") as the transfer agent for our
common stock. The principal office of CST is located at 3200 Cherry
Creek Drive South, Suite 430, Denver, CO 80209 and its telephone
number is (303) 282-4800.
Dividend
Policy
We have never declared or paid
dividends on our common stock. Payment of future dividends, if any,
will be at the discretion of our Board of Directors after taking into account
various factors, including the terms of any credit arrangements, our financial
condition, operating results, current and anticipated cash needs and plans for
expansion. At the present time, we are not party to any agreement
that would limit our ability to pay dividends.
Performance
Graph
Not required.
The
following selected financial data sets forth our summary historical financial
data as of and for the years ended December 31, 2009, 2008, 2007, 2006 and 2005.
This information was derived from our audited consolidated financial statements
for each period. Our selected historical financial data is qualified
in its entirety by, and should be read in conjunction with, “
Item 7. Management’s Discussion and
Analysis of Financial Condition and Results of Operations
” and the
financial statements and the notes thereto included elsewhere in this report.
For additional information relating to our operations, see “
Item 1. Business
” and “
Item 2.
Properties
.”
|
Year
Ended December 31,
|
||||||||||||||||||||
|
2009
|
2008
|
2007
|
2006
|
2005
|
||||||||||||||||
|
Operating
Data
|
||||||||||||||||||||
|
Net
loss from operations
|
$ | (34,183,804 | ) | $ | (26,348,812 | ) | $ | (8,318,855 | ) | $ | (2,743,851 | ) | $ | (1,224,085 | ) | |||||
|
Other
income
|
54,497 | 333,609 | 242,513 | 57,089 | 6,174 | |||||||||||||||
|
Net
loss
|
(34,129,307 | ) | (26,015,203 | ) | (8,076,342 | ) | (2,686,762 | ) | (1,217,711 | ) | ||||||||||
|
Basic
& diluted loss per share
|
(0.78 | ) | (0.76 | ) | (0.28 | ) | (0.13 | ) | (0.08 | ) | ||||||||||
|
Weighted
average shares
|
43,764,703 | 34,393,854 | 28,645,038 | 20,218,659 | 16,164,715 | |||||||||||||||
|
Balance
Sheet Data
|
||||||||||||||||||||
|
Cash
and cash equivalents
|
$ | 6,752,325 | $ | 3,534,578 | $ | 22,007,216 | $ | 7,660,258 | $ | 176,182 | ||||||||||
|
Total
current assets
|
20,701,405 | 3,737,468 | 22,051,156 | 7,866,370 | 191,159 | |||||||||||||||
|
Property
and equipment, net
|
1,726,278 | 812,219 | 352,429 | 96,279 | 54,352 | |||||||||||||||
|
Land
and mineral rights
|
226,610 | 226,610 | 152,522 | -- | -- | |||||||||||||||
|
Total
assets
|
22,664,758 | 4,781,018 | 22,557,576 | 7,964,118 | 246,980 | |||||||||||||||
|
Current
liabilities
|
724,439 | 1,753,285 | 768,452 | 451,163 | 33,607 | |||||||||||||||
|
Long-term
obligations
|
1,991,987 | -- | -- | -- | -- | |||||||||||||||
|
Shareholders’
equity
|
19,948,332 | 3,027,733 | 21,789,124 | 7,512,955 | 213,373 | |||||||||||||||
20
|
MANAGEMENT'S
DISCUSSION AND ANALYSIS OF FINANCIAL CONDITION AND RESULTS OF
OPERATION
|
Except
for the historical information, the following discussion contains
forward-looking statements that are subject to risks and
uncertainties. We caution you not to put undue reliance on any
forward-looking statements, which speak only as of the date of this
report. Our actual results or actions may differ materially from
these forward-looking statements for many reasons, including the risks described
in “Risk Factors” and elsewhere in this annual report. Our discussion
and analysis of our financial condition and results of operations should be read
in conjunction with the consolidated financial statements and related notes and
with the understanding that our actual future results may be materially
different from what we currently expect.
Introduction
The
following discussion analyzes our operating results for the three fiscal years
ended December 31, 2009 and our financial condition at December 31, 2009
and 2008, with a particular emphasis on the year ended December 31,
2009.
We expect
to commence commercial production at our Mexico facility during
2010. Prior to 2010, none of our properties were in production, and
consequently, we have never produced revenue or cash flow from the sale of
minerals and have relied on equity financing to fund our operations to
date.
Since
August 2006, we raised capital through various sales of common stock, yielding
gross proceeds of approximately $85,000,000. Our most recent
financings were part of a strategic alliance with Hochschild Mining Holdings
Limited (Hochschild), a mid tier gold and silver producer headquartered in Lima,
Peru and listed on the London Stock Exchange. Pursuant to a series of
agreements, Hochschild purchased 1,670,000 shares of our common stock for gross
proceeds of $5,010,000 in December 2008; 4,330,000 shares of our common stock
for $12,990,000 in February 2009; 5,000,000 shares of our common stock for gross
proceeds of $20,000,000 in June 2009; 1,954,795 shares of common stock for gross
proceeds of $16,000,000 in December 2009; and 600,000 shares of common stock for
gross proceeds of $5,172,000 in March 2010. Hochschild has invested a
total of $59,172,000 in private placements with our company for a 27.8%
ownership share and has purchased an additional 1% share in the open market for
a total ownership of 28.7%. We have used the funds primarily to fund
exploration and construction at the
El Aguila
Project. In 2007, we commenced activities that we hope will allow us
to successfully mine the deposits at
El Aguila
, including the
construction of a processing mill and other infrastructure.
During
2009, we continued efforts to construct our mine and mill and complete other
activities necessary to place our
El Aguila
Project into
production. We began commissioning those facilities in late 2009 and
anticipate generating revenue from the sale of precious metals in
2010.
We continue to refine our initial and
ongoing capital requirements. As an exploration stage company, there
is significant uncertainty in our estimates regarding both future costs and
future revenue. We may require additional capital resources to
complete our plans.
21
Exploration Stage
Company
. We are considered an exploration stage company since
we have not demonstrated the existence of proven or probable reserves in
accordance with certain regulatory requirements that would be costly for us to
meet. At this time, we do not believe that meeting those requirements
is the best use of our limited capital resources. In accordance with
accounting principles generally accepted in the United States, all expenditures
for exploration and evaluation of our properties have been expensed as
incurred. Furthermore, unless mineralized material is classified as
proven or probable reserves, substantially all expenditures for mine and mill
construction have been or will be expensed as incurred. Certain
expenditures, such as for rolling stock or other general purpose equipment, may
be capitalized, subject to our evaluation of the possible impairment of the
asset. Since substantially all of our expenditures to date, including
construction of the mill, have been expensed and we expect to expense additional
expenditures during 2010, most of our investment in mining properties and
equipment does not appear as an asset on our balance sheet. Our
accounting treatment, regarding the classification of construction expenditures
as an operating expense rather than as a capital asset has caused us to report
large losses during the last two years. Although the majority of
expenditures for the
El
Aguila
Project were completed during 2009, we expect underground mine
construction to continue in future years. In comparison to other
mining companies that capitalize development expenditures because they have
exited the exploration stage, we will report larger losses or lesser profits
during periods of construction. In our financial statements we
provide additional information that presents operating expenses differentiated
from construction expenses to provide for a better understanding of our
operations.
Exploration
of our properties accelerated in late 2006 and continued throughout
2009. From inception to December 31, 2009, we expensed approximately
$24,485,000 on the exploration and evaluation of our various properties,
substantially all of which has been spent on the currently active properties
known as
El
Aguila
. In addition, we have expensed, from inception to
December 31, 2009, approximately $35,496,000 in design, engineering, and
construction costs, all of which apply to the
El Aguila
Project.
A more
detailed breakdown of the
El
Aguila
Project construction costs is as follows:
|
Original
Design Construction Costs
|
||||
|
Permits
|
$ | 264,000 | ||
|
Mill
|
||||
|
Equipment
and Transportation
|
10,489,000 | |||
|
Installation
and Buildings
|
10,690,000 | |||
|
Engineering
Design and Construction Management
|
5,568,000 | |||
|
Infrastructure
|
||||
|
Roads
|
850,000 | |||
|
Waterline
and system
|
1,234,000 | |||
|
Tailings
Impoundment Phase I
|
2,717,000 | |||
|
Subtotal
|
31,812,000 | |||
|
Other
Construction Costs
|
||||
|
Community
Relations
|
539,000 | |||
|
Employee Housing
|
1,880,000 | |||
|
Tailings
Impoundment Phase II
|
1,265,000 | |||
|
Subtotal
|
3,684,000 | |||
|
Total
Construction Costs
|
$ | 35,496,000 | ||
22
Plan
of Operation
In April
2007, we decided to move forward with construction at the
El Aguila
property in an
effort to commence commercial production. Our decision was made based
upon drilling data that we believe provides evidence of mineralized material in
amounts sufficient to proceed with construction activities. However,
we have not commenced a feasibility study that would allow us to classify any of
our mineralized material as proven or probable reserves, as those terms are
defined by the SEC in
Industry
Guide 7
, "Description of Property by Issuers Engaged or to Be Engaged in
Significant Mining Operations." The SEC definition of "reserve" is
"that part of a mineral deposit which could be economically and legally
extracted or produced at the time of the reserve determination.”
Our
ability to demonstrate the existence of proven or probable reserves would
require us to continue exploration drilling that demonstrated the existence of
sufficient mineralized material and to complete a positive feasibility
study. A feasibility study must demonstrate with reasonable certainty
that the deposit can be legally and economically extracted and
produced. At this time, we have neither undertaken these additional
activities nor implemented plans to undertake these activities in the
future. Accordingly, the mineralized material identified by us should
not be considered proven or probable mineral reserves. Additionally,
the assumptions used by us in our decision to undertake construction of the mill
and mine may prove to be inaccurate. Thus, we may never be able to
recover sufficient mineralized material to become profitable.
Anticipated
Production
. In 2008 we engaged Lyntek, Inc. of Denver,
Colorado, to design and build the mill at the
El Aguila
Project. The mill is designed to process 850 to 1,100 tonnes of ore
per day, depending on ore type, through a flotation section, and 150 to 250
tonnes of ore per day, depending upon ore type, through an agitated leach
section. Mining by open pit methods is accomplished under contract
with a third party contractor. In December 2009, we began
commissioning the
El
Aguila
mill. We produced our first concentrate in February
2010. As of March 10, 2010 we are in the process of ramping up and
optimizing mill production.
Our
immediate goal is to reach “commercial production” in the first quarter of
2010. Commercial production for our purposes is achieved when the
mill throughput and recoveries are 80% of design. Prior to achieving
commercial production, any sales of concentrates are applied against costs and
are not considered revenue.
If
commercial production is achieved from the open pit gold ore, any silver
contained in the mineralization will be produced as a by-product, revenue from
which will help offset the costs of producing the gold. In the
following year, if activities go as planned, we intend to undertake production
of gold from an underground mine at the nearby
La Arista
vein
.
As of March 15,
2010 construction of the decline ramp related to our proposed underground mine
is underway. A portion of the proceeds from our equity financing in
December 2009 is dedicated for this purpose, and those funds are part of our
restricted cash. Since we believe the
La Arista
Vein
area also contains base
metals such as copper, lead, and zinc, we intend to produce those metals as
by-products, any revenue from which would help offset the costs of producing
gold and silver. We expect that the ore from both the near-surface
deposit and the anticipated underground mine will be processed at the
El Aguila
mill.
In
October 2007, we acquired an additional parcel of land which comprises
approximately five hectares and is located adjacent to the community of
San Jose de
Gracia
. We completed construction of an employee housing
facility for the
El
Aguila
Project, as well as a health clinic which will be available to
employees and local residents. The facility encompasses 10 buildings,
including a cafeteria, and can house approximately 50 people.
23
Construction at the La Arista
Vein.
We have begun development of the underground
La Arista
vein. A
third party contractor has been hired and is presently driving a decline haulage
ramp, a second ventilation and emergency ramp and additional
developments. We plan to construct a surface facility to service this
underground mine.
A portion
of the proceeds of the most recent private placement, in the amount of
$8,000,000, have been reserved for construction of this underground mine and
facilities. However, since we are still in the process of planning
the design and construction of those facilities, we have not yet determined
whether that amount will be sufficient to complete the necessary work to begin
mining of the underground mineralization. If we are successful in
completing the underground facilities and commencing mining at this portion of
our property, we expect that the ore will be processed at our nearby
mill.
Mexico Income
Taxes
. On October 1, 2007, Mexico enacted changes to its tax
system that generally took effect beginning January 1, 2008. Those
changes include the creation of a “flat tax” (so-called because the computation
of income subject to the tax excludes a number of the deductions generally
included in a more traditional determination of taxable income). The
Mexican tax system continues to include a “regular” income tax. In
general, enterprises operating in Mexico will be required to pay the greater of
the tax computed under the regular tax and the flat tax. The tax is
new and some of its provisions are ambiguous. While we do not expect
the flat tax to have an effect on us for either the 2008 or 2009 tax years, we
estimate that we could incur flat tax liability beginning in tax year
2010. The flat tax computation excludes certain deductions for
operating loss carry-forwards and amortization, depletion, and depreciation
expense. Therefore, the new tax law may limit the future tax benefit
that would have otherwise been available from our investment in mineral
properties.
Liquidity
and Capital Resources
As of
December 31, 2009, we had working capital of $19,976,966, consisting of current
assets of $20,701,405 and current liabilities of $724,439. This
represents an increase of $17,992,783 from the working capital balance of
$1,984,183 as of December 31, 2008 and reflects the proceeds of recently
completed equity sales. Our current assets consist primarily of cash
which is deposited in short term, interest bearing
accounts. Consistent with our plans, we continued to consume working
capital to fund our exploration and construction activities and other operating
expenses, and we replenished our working capital through the sale of common
stock.
We have
never received revenue from gold or other mineral sales. We currently
expect to commence sales of gold and silver upon reaching commercial production
of our
El Aguila
processing facility during 2010, but we cannot guarantee that we will meet our
expected timetable. Any revenue generated from the sale of gold or
silver will be used to pay for operating costs first and then to supplement our
existing cash for construction of the underground mine, additional exploration
and other working capital needs.
We have
historically primarily relied on equity financings to fund our
operations. From inception through December 31, 2009, we received
$95,740,373 in cash, services, stock options, and other consideration through
issuance of our common stock. As of December 31, 2009, we did not
have any outstanding debt. We believe that we will continue to fund
our future working capital requirements through the sale of equity, and
eventually through cash flow from operations, and we have not made arrangements
to borrow funds for working capital requirements. However, we may
consider debt financing if market conditions allow.
24
In
December 2008, we entered into a strategic alliance agreement with
Hochschild. Pursuant to the strategic alliance agreement, Hochschild
was granted an option to purchase shares of our restricted common stock and a
first right of refusal to participate in any equity financing transactions we
undertake until such time as we produce at least 4,000 ounces of gold in a
45-day period. Following that production benchmark, Hochschild may
participate in equity financing transactions to the extent of their ownership
interest. Hochschild exercised its option in February 2009, and we
sold 4,330,000 shares of restricted common stock to Hochschild at a price of
$3.00 per share for total proceeds of $12,990,000. Hochschild also
exercised its first right of refusal to provide us with additional equity
financing, and on June 30, 2009, we entered into a subscription agreement with
Hochschild to sell 5,000,000 additional shares of restricted common stock at a
price of $4.00 per share, or a total of $20,000,000. That transaction
was completed in two tranches, the last of which closed in July
2009. We agreed to reserve $4,000,000 of the proceeds for exploration
activities, and the $4,000,000 was deposited into a restricted cash
account. Also pursuant to the right of first refusal, on December 17,
2009, we sold 1,954,795 shares of restricted common stock at $8.185 per share to
Hochschild for gross proceeds of $16,000,000. We agreed to reserve
$8,000,000 of the proceeds for underground mining expenses at the
La Arista
vein. Subsequent to the year ended December 31, 2009, we conducted a
new financing transaction with Hochschild whereby we sold 600,000 shares of
restricted common stock at $8.62 per share for gross proceeds of
$5,172,000.
During
the year ended December 31, 2009, we spent $7,811,371 on the exploration and
evaluation of our properties, predominantly at our
El Aguila
Project. This compares to $8,171,396 spent during the year ended
December 31, 2008. While we continued our exploration program to
further delineate the area of mineralized material, our emphasis has shifted to
construction of the mine and mill. Our most significant expenditures
for 2009 were for the construction of the mill and associated
infrastructure. During the year ended December 31, 2009, we spent
$20,994,436 on engineering and construction activities. This compares
to $14,501,461 spent during the year ended December 31, 2008, and reflects the
acceleration of construction.
Our most
significant expenditures for 2010 are expected to be costs associated with the
second phase of our tailings facility, achieving ramp up and optimization to
commercial production, the continued development of the underground mine and
exploration. Furthermore, we continue to incur operating expenses
approximating $200,000 per month for salaries and other overhead expenses at our
Denver and Oaxaca locations. We expect to continue depleting our
working capital until such time, if ever, we successfully reach commercial
production and generate cash flow from the production and sale of gold and other
metals.
Although
we expect to commence gold production during 2010, it is uncertain if we will be
successful. Furthermore, the amount of revenue generated during the
start-up phase of a mining operation is difficult to predict and tends to be
highly variable. Our costs to enter the production phase may be
greater than we anticipate. We may require additional funding to
complete our existing plans and we would be dependent upon additional financing
to expand our exploration efforts. We may seek additional funding
during the next twelve months.
Net cash
used in operating activities was $44,875,201 during the year ended December 31,
2009, compared to $23,005,822 during 2008, an increase of
$21,869,379. We accelerated our operating expenditures consistent
with our plan to commence production during 2010.
Net cash
used in investing activities for the year ended December 31, 2009 was
$1,204,253, compared to $657,816 for the year ended December 31, 2008, all
representing capital expenditures. Although most of our exploration
stage expenditures are recorded as an expense rather than an investment, we
capitalize the acquisition cost of land and mineral rights and certain equipment
that has alternative future uses or significant salvage value, including rolling
stock, furniture, and electronics. During 2009, we acquired
additional vehicles and capital equipment, and we filed mineral concessions with
the Mexican government. During 2008, our capital expenditures
primarily included rolling stock and earth moving equipment.
25
Net cash
provided by financing activities for the year ended December 31, 2009 was
$49,174,000, consisting of proceeds from the Hochschild financings previously
discussed and proceeds of $184,000 from the exercise of stock options. For the
year ended December 31, 2008, financing activities provided cash of $5,191,000,
consisting of $5,010,000 proceeds from the Hochschild strategic alliance
discussed above and proceeds of $181,000 from the exercise of stock
options.
The
balance of cash and equivalents increased to $6,752,325 as of December 31, 2009
from $3,534,578 as of December 31, 2008, a net increase in cash of
$3,217,747. We expect to continue our plan of raising funds from
equity sales if necessary and to expend our cash for exploration stage
activities until such time, if ever, we successfully commence production and
generate cash flow from the production and sale of gold and other
metals.
December 31, 2008
.
At December 31, 2008, we had working capital of $1,984,183, consisting of
current assets of $3,737,468 and current liabilities of
$1,753,285. Our current assets consisted primarily of
cash.
During
the year ended December 31, 2008, our cash decreased by $18,472,638 as a
result of our exploration, construction and investment activities.
Operating expenses totaled $26,348,812, which, reduced by non-cash expenses such
as stock-based compensation, amortization of equipment, and changes in assets
and liabilities, resulted in $23,005,822 of net cash used in operating
activities. The significant amount of cash used in operating activities is
attributable to our decision to begin constructing the mill and related
facilities at our
El Aguila
Project. Cash used in investing activities totaled $657,816
resulting solely from capital expenditures. We received $5,191,000 as a
result of financing activities in 2008.
Results
of Operations – Year Ended December 31, 2009 Compared to Year Ended December 31,
2008
For the
year ended December 31, 2009, we reported a net loss of $34,129,307, or $0.78
per share, compared to a net loss of $26,015,203, or $0.76 per share for the
year ended December 31, 2008. In neither year did we report any
revenue from the sale of gold or other minerals. Our only revenue
since inception has consisted of interest income. We currently expect
to commence sales of gold and silver upon commissioning of our
El Aguila
processing facility
during 2010, but we cannot guarantee that we will meet our expected
timetable.
Total
costs and expenses in the year ended December 31, 2009 were $34,183,804 compared
to $26,348,812 in the comparable period of 2008, an increase of $7,834,992 or
29.7%. The additional expenditures reflect our increasing activities
at the
El Aguila
Project. Total mineral property costs increased $6,132,950 or 27%,
for the year ended December 31, 2009 to $28,805,807 from $22,672,857 for the
comparable period in 2008. The property exploration and evaluation component
decreased $360,025 or 4.4 %, from $8,171,396 for the year ended December 31,
2008 to $7,811,371 for the year ended December 31, 2009. Our
exploration and other drilling activity temporarily decreased as we focused our
efforts on engineering and construction.
The
engineering and construction cost component during the year ended December 31,
2009 was $20,994,436, compared to $14,501,461 during the comparable period in
2008. As more fully described in the preceding discussions of our
liquidity and capital resources, we accelerated construction of the mine and
mill site and infrastructure during 2009.
26
General
and administrative expenses increased $1,658,997 or 46.7% to $5,211,004 for the
fiscal year ended December 31, 2009 as compared to $3,552,007 for the comparable
period last year. The component of general and administrative expense
representing stock option compensation expense was $2,843,506 for the year ended
December 31, 2009, compared to $1,956,806 for the comparable period in
2008. We use an option pricing model to estimate the value of stock
options granted to officers, directors, employees and consultants. It
is difficult to estimate the value of options that we grant. The
options are subject to significant restrictions and cannot be purchased or sold
on the open market. Therefore, there is no objective and independent
valuation measurement for them. We use the Black-Scholes-Merton
model, which requires considerable judgment selecting the subjective assumptions
that are critical to the results produced by the model, to calculate the
estimated fair value. We record the estimated fair value as an
expense on a pro-rata basis over the vesting period of the options.
During
2009, we granted options to officers and directors to purchase an aggregate of
1,000,000 shares of common stock at an exercise price of $3.95 per share, all of
which vested immediately. The estimated value of those options using
the Black-Scholes-Merton model was $2,575,000. We also granted
options to an employee to purchase 75,000 shares of common stock at an exercise
price of $7.00 per share. The estimated value of those options using the
Black-Scholes-Merton model was $331,787 which will be recognized on a pro-rata
basis over the three year vesting period. During 2009, we also recognized a
portion of the fair value of options issued during previous periods, pro-rated
over the vesting period.
During
the year ended December 31, 2008, we granted a total of 1,320,000 stock options
with an estimated value of $2,508,114 using the Black-Scholes-Merton model. We
granted options to officers and directors to purchase an aggregate of 1,000,000
shares of common stock at an exercise price of $3.40 per share, all of which
vested immediately. We also granted stock options to an investor
relations consultant to purchase 50,000 shares of common stock at an exercise
price of $4.45 per share, all of which vested immediately. We granted
stock options to employees covering 270,000 shares of common stock at a weighted
average price of $3.91. Those options will vest over the next three
years. During 2008, we also recognized a portion of the fair value of
options issued during previous periods, pro-rated over the vesting
period.
We also
record share-based compensation for shares of common stock issued in exchange
for goods and services. During the year ended December 31, 2009, we
did not grant any shares of common stock as compensation. During the
year ended December 31, 2008, we issued 10,000 shares of common stock valued at
$42,470 as partial compensation for investor relations services.
The other
components of general and administrative expense, including salaries and
benefits, professional fees, investor relations, and travel, increased to
$1,688,569 during the twelve months ended December 31, 2009 from $1,344,284
during the comparable period in 2008, an increase of $344,285 or
26%. There were no significant changes in this component of our cost
structure, although we increased activity levels as we prepare the
El Aguila
Project for
production. We anticipate these costs may further increase if we
commence commercial production.
Interest
income for the year ended December 31, 2009 decreased to $54,497 compared to
$333,609 for the comparable period of 2008, a decrease of $279,112 or 83.8%,
primarily representing lower interest rates and decreased deposits in short term
interest bearing accounts.
Our
mining operations are located in Mexico and we primarily transact business in
Mexican pesos. Our reporting currency is the US
dollar. Changes in the rate of currency exchange between the Mexican
peso and the US dollar create translation gains and losses, which are reported
as a component of other comprehensive income. For the years ended
December 31, 2009 and 2008, we recorded a currency translation loss of $967,600
and a gain of $63,536, respectively.
27
Results
of Operations – Year Ended December 31, 2008 Compared to Year Ended December 31,
2007
For the
year ended December 31, 2008 we reported a net loss of $26,015,203, or $0.76 per
share, compared to a net loss of $8,076,342, or $0.28 per share for 2007. We
expect to incur losses until such time, if ever, we begin generating significant
revenue from operations.
In
neither year did we report any revenue from the sale of gold or other
minerals. Our only income since inception has consisted of interest
income.
Total
costs and expenses were $26,348,812 in 2008 compared to $8,318,855 in 2007, an
increase of $18,029,957 or 217%. The additional expenditures reflect
our increasing activities at the El Aguila project. Mineral property costs,
including exploration and evaluation, increased $2,439,625 from $5,731,771 for
the year ended December 31, 2007 to $8,171,396 for the year ended December 31,
2008. We continued our exploration of the
El Aguila
property in
2008. We conducted limited exploration on the El Rey
property.
Engineering
and construction costs were $14,501,461 in 2008 compared to nil in
2007. As more fully described in the preceding discussions of our
expenditures, we commenced construction of the mine and mill site and other
infrastructure during 2008.
General
and administrative expense for the year ended December 31, 2008 increased to
$3,552,007 compared to $2,539,604 during 2007, an increase of $1,012,403 or
40%. As explained below, there was a significant increase in non-cash
stock option compensation, partially reduced by decreases in other
items.
The
component of general and administrative expense representing non-cash stock
option compensation expense was $1,956,806 for the year ended December 31, 2008,
compared to $99,482 for 2007. We use the Black-Scholes-Merton model
to estimate the value of stock options granted to officers, directors, employees
and consultants.
During
2008, we granted a total of 1,320,000 stock options with an estimated value of
$2,508,114. We granted options to officers and directors to purchase
1,000,000 shares of common stock at an exercise price of $3.40 per share, all of
which vested immediately. We also granted stock options to an
investor relations consultant to purchase 50,000 shares of common stock at an
exercise price of $4.45 per share, all of which vested
immediately. We also granted options to employees covering 270,000
shares of common stock at a weighted average price of $3.91. Those
options will vest over the next three years.
During
the year ended December 31, 2007, we granted stock options to a public relations
consultant to purchase 50,000 shares of common stock at an exercise price of
$3.68 per share, all of which vested in 2007. The estimated fair
value of those options was $83,192.
The
component of general and administrative expense representing a non-cash expense
for grants of common stock was $42,470 for the year ended December 31, 2008,
compared to $630,968 for 2007. Shares of common stock issued by us in
exchange for services are recorded as an expense, the amount of which is
determined by reference to the market prices of our stock reported by the OTC
Bulletin Board.
During
the year ended December 31, 2008, we issued 10,000 restricted shares of common
stock valued at $42,470 as partial compensation for investor relations
services. During the year ended December 31, 2007, we issued 185,000
restricted shares of common stock valued at $630,968 as partial compensation for
consulting services.
28
Cash
compensation costs included in general and administrative expense decreased to
$716,057 during 2008 from $880,098 during 2007. Certain cash
compensation attributed to 2007 was replaced by non-cash compensation during
2008. Professional fees increased to $368,975 in 2008 compared to
$234,154 in 2007, an increase of $134,821, which reflects our increasing
corporate and administrative activities. Investor relations expenses decreased
to $167,732 during 2008 from $342,083 during 2007. There were finders
fees associated with the private placement in December 2007 that were not
repeated in 2008.
Interest
income increased to $333,609 for the year ended December 31, 2008 compared to
$242,513 for 2007, an increase of $91,096, or 38%, representing higher deposits
in short term interest bearing accounts pending utilization in our exploration,
construction and operating activities.
For the
years ended December 31, 2008 and 2007, we recorded currency translation gains
(losses) of $63,536 and ($89,939), respectively.
Off-Balance
Sheet Arrangements
As of and
subsequent to December 31, 2009, we have no off-balance sheet
arrangements.
Contractual
Obligations
Our known
obligations at fiscal year end are set forth in the table below:
|
Contractual
Obligations
|
Total
|
Less
than 1
year
|
1-3
years
|
3-5
years
|
More
than 5
years
|
|||||||||||||||
|
Purchase
Obligations(1)
|
$ | 662,000 | $ | 662,000 | -- | -- | -- | |||||||||||||
|
Total
|
$ | 662,000 | $ | 662,000 | -- | -- | -- | |||||||||||||
________________________________
(1) Represents
amounts due to our executive officers pursuant to their respective employment
agreements with our company.
Critical
Accounting Policies
We
believe that application of the following accounting policies, which are
critical to our financial position and results of operations, requires
significant judgments and estimates on the part of management.
Use of
Estimates.
The preparation of financial statements
in conformity with US GAAP requires management to make estimates and assumptions
that affect the reported amount of assets and liabilities and disclosure of
contingent assets and liabilities at the date of the financial statements and
the reported amounts of revenues and expenses during the reporting
period. Management routinely makes judgments and estimates about the
effects of matters that are inherently uncertain. Estimates that are
critical to the accompanying consolidated financial statements include the
identification and valuation of proven and probable reserves, obligations for
environmental, reclamation, and closure matters, estimates related to asset
impairments of long lived assets and investments, classification of expenditures
as either an asset or an expense, valuation of deferred tax assets, and the
likelihood of loss contingencies Management bases its estimates and
judgements on historical experience and on various other factors that are
believed to be reasonable under the circumstances, the results of which form the
basis for making judgments about the carrying values of assets and liabilities
that are not readily apparent from other sources. Estimates and
assumptions are revised periodically and the effects of revisions are reflected
in the financial statements in the period it is determined to be
necessary. Actual results could differ from these
estimates.
29
Proven and Probable
Reserves.
The definition of proven and probable
reserves is set forth in SEC Industry Guide 7. Proven reserves are
reserves for which (a) quantity is computed from dimensions revealed in
outcrops, trenches, workings or drill holes; grade and/or quality are computed
from the results of detailed sampling and (b) the sites for inspection, sampling
and measurement are spaced so closely and the geologic character is so well
defined that size, shape, depth and mineral content of reserves are
well-established. Probable reserves are reserves for which quantity
and grade and/or quality are computed from information similar to that used for
proven reserves, but the sites for inspection, sampling, and measurement are
farther apart or are otherwise less adequately spaced. The degree of
assurance, although lower than that for proven reserves, is high enough to
assume continuity between points of observation. In addition,
reserves cannot be considered proven and probable until they are supported by a
feasibility study, indicating that the reserves have had the requisite geologic,
technical and economic work performed and are economically and legally
extractable at the time of the reserve determination.
Mineral Acquisition
Costs.
The costs of acquiring land and mineral
rights are considered tangible assets. Significant acquisition
payments are capitalized. General, administrative and holding costs
to maintain an exploration property are expensed as incurred. If a
mineable ore body is discovered, such costs are amortized when production begins
using the units-of-production method. If no mineable ore body is
discovered or such rights are otherwise determined to have diminished value,
such costs are expensed in the period in which the determination is
made.
Exploration
Costs.
Exploration costs are charged to expense as
incurred. Costs to identify new mineral resources, to evaluate
potential resources, and to convert mineral resources into proven and probable
reserves are considered exploration costs.
Design, Construction, and
Development Costs.
Certain costs to design and
construct mine and processing facilities may be incurred prior to establishing
proven and probable reserves. Under these circumstances, we classify
the project as an exploration stage project and expense substantially all costs,
including design, engineering, construction, and installation of
equipment. Certain types of equipment, which have alternative uses or
significant salvage value, may be capitalized. If a project is
determined to contain proven and probable reserves, costs incurred in
anticipation of production can be capitalized. Such costs include
development drilling to further delineate the ore body, removing overburden
during the pre-production phase, building access ways, constructing facilities,
and installing equipment. Interest costs, if any, incurred during the
development phase, would be capitalized until the assets are ready for their
intended use. The cost of start-up activities and on-going costs to
maintain production are expensed as incurred. Costs of abandoned
projects are charged to operations upon abandonment.
If a
project commences commercial production, amortization and depletion of
capitalized costs is computed on a unit-of–production basis over the expected
reserves of the project based on estimated recoverable gold equivalent
ounces.
Impairment of Long-Lived
Assets.
We
evaluate our long-lived assets for impairment. If impairment
indicators exist, we perform additional analysis to quantify the amount by which
capitalized costs exceed recoverable value. The periodic evaluation
of capitalized costs is based upon expected future cash flows, including
estimated salvage values. As of December 31, 2009, our mineral
resources do not meet the definition of proven or probable reserves or value
beyond proven and probable reserves and any potential revenue has been excluded
from the cash flow assumptions. Accordingly, recoverability of
capitalized cost is based primarily on estimated salvage values, or alternative
future uses.
30
Asset Retirement
Obligation
. All items of property and equipment
are carried at cost not in excess of their estimated net realizable
value. Normal maintenance and repairs are charged to earnings while
expenditures for major maintenance and betterments are
capitalized. Gains or losses on disposition are recognized in
operations.
Stock Based
Compensation
. We record compensation expense for
the fair value of stock options that are granted. Expense is
recognized on a pro-rata basis over the vesting periods, if any, of the options.
The fair value of stock options at their grant date is estimated by using the
Black-Scholes-Merton option pricing model.
Foreign Currency
Translation
. The local currency where our properties are
located, the Mexican peso, is the functional currency for our
subsidiaries. Assets and liabilities are translated using the
exchange rate in effect at the balance sheet date. Intercompany
equity accounts are translated using historical rates. Revenues and
expenses are translated at the average exchange rate for the
year. Translation adjustments are not included in the determination
of net loss for the period and are reported as a separate component of
shareholders' equity.
Income
Taxes.
Income taxes are computed using the liability
method. Deferred income taxes reflect the net tax effects of
temporary differences between the carrying amounts of assets and liabilities for
financial and tax reporting purposes and the effect of net operating loss
carry-forwards. Deferred tax assets are evaluated to determine if it
is more likely than not that they will be realized. Valuation
allowances have been established to reduce the carrying value of deferred tax
assets in recognition of significant uncertainties regarding their ultimate
realization. Further, the evaluation has determined that there are no
uncertain tax positions required to be disclosed.
Recent
Accounting Pronouncements
Recently Adopted Accounting
Standards.
We evaluate the pronouncements of various
authoritative accounting organizations, primarily the Financial Accounting
Standards Board (“FASB”), the SEC, and the Emerging Issues Task Force (“EITF”),
to determine the impact of new pronouncements on US GAAP and the impact on
us. We adopted the following new accounting standards during
2009:
Accounting Standards Codification
-
In June, 2009, FASB established the Accounting Standards
Codification (“ASC”) as the single source of authoritative US GAAP to be applied
by nongovernmental entities. Rules and interpretive releases of the
SEC under authority of federal securities laws are also sources of authoritative
US GAAP for SEC registrants. The ASC is a new structure which took
existing accounting pronouncements and organized them by accounting
topic. The ASC did not change current US GAAP, but was intended to
simplify user access to all authoritative US GAAP by providing all the relevant
literature related to a particular topic in one place. All previously
existing accounting standards were superseded and all other accounting
literature not included in the ASC is considered
non-authoritative. New accounting standards issued subsequent to June
30, 2009 will be communicated by the FASB through Accounting Standards Updates
(ASU’s). The ASC was effective during the period ended September 30,
2009. Adoption of the ASC did not have an impact on our consolidated
financial position, results of operations or cash flows.
31
Subsequent Events
- In
May, 2009, the ASC guidance for subsequent events was updated to establish
accounting and reporting standards for events that occur after the balance sheet
date but before financial statements are issued. The guidance was
amended in February, 2010. The update sets forth: (i) the period
after the balance sheet date during which management of a reporting entity
should evaluate events or transactions that may occur for potential recognition
or disclosure in the financial statements, (ii) the circumstances under
which an entity should recognize events or transactions occurring after the
balance sheet in its financial statements, and (iii) the disclosures that
an entity should make about events or transactions occurring after the balance
sheet date in its financial statements. We adopted the updated
guidance in 2009. The adoption had no impact on our consolidated
financial position, results of operations or cash flows.
Recently Issued Accounting Standards
Updates.
The following accounting standards
updates were recently issued and have not yet been adopted by
us. These standards are currently under review to determine their
impact on our consolidated financial position, results of operations, or cash
flows.
ASU 2010-6
amends existing disclosure requirements about fair value measurements by adding
required disclosures about items transferring into and out of levels 1 and 2 in
the fair value hierarchy; adding separate disclosures about purchase, sales,
issuances, and settlements relative to level 3 measurements; and clarifying,
among other things, the existing fair value disclosures about the level of
disaggregation. This ASU will be effective for the first quarter of
2010.
ASU
2009-17 revises the consolidation guidance for variable-interest entities. The
modifications include the elimination of the exemption for qualifying special
purpose entities, a new approach for determining who should consolidate a
variable-interest entity, and changes to when it is necessary to reassess who
should consolidate a variable-interest entity. This standard will be effective
January 1, 2010.
There
were various other updates recently issued, most of which represented technical
corrections to the accounting literature or application to specific
industries. None of the updates are expected to a have a material
impact on our consolidated financial position, results of operations or cash
flows.
Our
exposure to market risks includes, but is not limited to, the following risks:
changes in foreign currency exchange rates, changes in interest rates, equity
price risks, commodity price fluctuations, and country risk. We do not use
derivative financial instruments as part of an overall strategy to manage market
risk; however, we may consider such arrangements in the future as we evaluate
our business and financial strategy.
Foreign
Currency Risk
We
transact a significant amount of our business in Mexican pesos. As a
result, currency exchange fluctuations may impact our operating
costs. The appreciation of non-US dollar currencies such as the peso
against the US dollar increases expenses and the cost of purchasing capital
assets in US dollar terms in Mexico, which can adversely impact our operating
results and cash flows. Conversely, a depreciation of non-US dollar
currencies usually decreases operating costs and capital asset purchases in US
dollar terms.
The value
of cash and cash equivalents denominated in foreign currencies also fluctuates
with changes in currency exchange rates. Appreciation of non-US
dollar currencies results in a foreign currency gain on such investments and a
decrease in non-US dollar currencies results in a loss. We have not
utilized market risk sensitive instruments to manage our exposure to foreign
currency exchange rates but may in the future actively manage our exposure to
foreign currency exchange rate risk. We also hold portions of our
cash reserves in non-US dollar currencies.
32
Interest
Rate Risk
We have
no debt outstanding nor do we have any investment in debt instruments other than
highly liquid short-term investments. Accordingly, we consider our interest rate
risk exposure to be insignificant at this time.
Equity
Price Risk
We have
in the past sought and may in the future seek to acquire additional funding by
sale of common stock and other equity. Movements in the price of our common
stock have been volatile in the past and may also be volatile in the future. As
a result, there is a risk that we may not be able to sell our common stock at an
acceptable price should the need for new equity funding arise.
Commodity
Price Risk
We
currently do not have any production but expect to produce gold and silver in
the near future. If we commence production and sales, changes in the
price of gold and other minerals could significantly affect our results of
operations and cash flows in the future. We do not presently expect
to hedge the sale of any of our anticipated production.
Country
Risk
All of
our mineral properties are located in Mexico. In the past, that country
has been subject to political instability, changes and uncertainties which may
cause changes to existing government regulations affecting mineral exploration
and mining activities. Civil or political unrest could disrupt our
operations at any time. Our exploration and mining activities may be
adversely affected in varying degrees by changing government regulations
relating to the mining industry or shifts in political conditions that could
increase the costs related to our activities or maintaining our
properties. Finally, Mexico’s status as a developing country may make it
more difficult for us to obtain required financing for our
properties.
33
GOLD
RESOURCE CORPORATION
MANAGEMENT'S
REPORT ON INTERNAL CONTROLS OVER FINANCIAL REPORTING
Our
management is responsible for establishing and maintaining adequate internal
control over financial reporting.
The
Securities Exchange Act of 1934 defines internal control over financial
reporting in Rules 13a-15(f) and 15d-15(f) as a process designed to provide
reasonable assurance regarding the reliability of financial reporting and the
preparation of financial statements for external purposes in accordance with
generally accepted accounting principles and includes those policies and
procedures that:
|
-
|
Pertain
to the maintenance of records that in reasonable detail accurately and
fairly reflect the transactions and disposition of
assets;
|
|
-
|
Provide
reasonable assurance that transactions are recorded as necessary to permit
preparation of financial statements in accordance with generally accepted
accounting principles, and that our receipts and expenditures are being
made only in accordance with authorizations of management and our
directors; and
|
|
-
|
Provide
reasonable assurance regarding prevention and timely detection of
unauthorized acquisition, use or disposition of our assets that could have
a material effect on our financial
statements.
|
Internal
control systems, no matter how well designed, have inherent
limitations. Therefore, even those systems that are determined to be
effective provide only reasonable assurance with respect to financial statement
preparation and presentation. Also, projections of any evaluation of
effectiveness to future periods are subject to the risk that controls may become
inadequate because of changes in conditions, or that the degree of compliance
with the policies or procedures may deteriorate.
Management
assessed the effectiveness of our internal control over financial reporting
based on criteria for effective internal control over financial reporting
described in Internal Control – Integrated Framework issued by the Committee of
Sponsoring Organizations of the Treadway Commission.
Based on
its assessment, management concluded that we maintained effective internal
control over financial reporting as of December 31, 2009.
34
REPORT OF
INDEPENDENT REGISTERED PUBLIC ACCOUNTING FIRM
Board of
Directors and Shareholders
Gold
Resource Corporation
Denver,
Colorado
We have
audited the accompanying consolidated balance sheets of Gold Resource
Corporation as of December 31, 2009 and 2008, and the related consolidated
statements of operations, changes in shareholders’ equity and cash flows for
each of the years in the three year period ended December 31, 2009, and the
period August 24, 1998 (inception) to December 31, 2009. We also have
audited Gold Resource Corporation’s internal control over financial reporting as
of December 31, 2009, based on criteria established in
Internal Control – Integrated
Framework
issued by the Committee of Sponsoring Organizations of the
Treadway Commission (COSO). Gold Resource Corporation’s management is
responsible for these financial statements, for maintaining effective internal
control over financial reporting, and for its assessment of the effectiveness of
internal control over financial reporting, including in the accompanying
Management’s Report on Internal Control over Financial Reporting. Our
responsibility is to express an opinion on these consolidated financial
statements and an opinion on the Company’s internal control over financial
reporting based on our audits.
We
conducted our audits in accordance with the standards of the Public Company
Accounting Oversight Board (United States). Those standards require that we plan
and perform the audits to obtain reasonable assurance about whether the
consolidated financial statements are free of material misstatement and whether
effective internal control over financial reporting was maintained in all
material respects. Our audits of the financial statements included
examining, on a test basis, evidence supporting the amounts and disclosures in
the consolidated financial statements, assessing the accounting principles used
and significant estimates made by management, and evaluating the overall
financial statement presentation. Our audit of internal control over financial
reporting included obtaining an understanding of internal control over financial
reporting, assessing the risk that a material weakness exists, and testing and
evaluating the design and operating effectiveness of internal control based on
the assessed risk. Our audits also included performing such other
procedures as we considered necessary in the circumstances. We
believe that our audits provide a reasonable basis for our
opinions.
A
company’s internal control over financial reporting is a process designed to
provide reasonable assurance regarding the reliability of financial reporting
and the preparation of financial statements for external purposes in accordance
with generally accepted accounting principles. A company’s internal
control over financial reporting includes those policies and procedures that (1)
pertain to the maintenance of records that, in reasonable detail, accurately and
fairly reflect the transactions and dispositions of the assets of the company;
(2) provide reasonable assurance that transactions are recorded as necessary to
permit preparation of financial statements in accordance with generally accepted
accounting principles, and that receipts and expenditures of the company are
being made only in accordance with authorizations of management and directors of
the company; and (3) provide reasonable assurance regarding prevention or timely
detection of unauthorized acquisition, use, or disposition of the company’s
assets that could have a material effect on the financial
statements.
Because
of its inherent limitations, internal control over financial reporting may not
prevent or detect misstatements. Also, projections of any evaluation
of effectiveness to future periods are subject to the risk that controls may
become inadequate because of changes in conditions, or that the degree of
compliance with the policies or procedures may deteriorate.
In our
opinion, the consolidated financial statements referred to above present fairly,
in all material respects, the financial position of Gold Resource Corporation as
of December 31, 2009 and 2008, and the results of its operations and its cash
flows for each of the years in the three year period ended December 31, 2009,
and the period August 24, 1998 (inception) to December 31, 2009, in conformity
with accounting principles generally accepted in the United States of
America. Also in our opinion, Gold Resource Corporation maintained,
in all material respects, effective internal control over financial reporting as
of December 31, 2009, based on criteria established in
Internal Control – Integrated
Framework
issued by the Committee of Sponsoring Organizations of the
Treadway Commission (COSO).

March 12,
2010
Denver,
Colorado

35
|
GOLD RESOURCE CORPORATION AND
SUBSIDIARIES
|
||||||||
|
(An Exploration Stage
Company)
|
||||||||
|
|
||||||||
|
as
of December 31, 2009 and 2009
|
||||||||
|
2009
|
2008
|
|||||||
|
ASSETS
|
||||||||
|
Current
assets:
|
||||||||
|
Cash
and cash equivalents
|
$ | 6,752,325 | $ | 3,534,578 | ||||
|
Restricted
cash
|
11,436,074 | - | ||||||
|
Prepaid
and refundable taxes
|
2,132,495 | - | ||||||
|
Other
current assets
|
380,511 | 202,890 | ||||||
|
Total
current assets
|
20,701,405 | 3,737,468 | ||||||
|
Land
and mineral rights
|
226,610 | 226,610 | ||||||
|
Property
and equipment - net
|
1,726,278 | 812,219 | ||||||
|
Other
assets
|
10,465 | 4,721 | ||||||
|
Total
assets
|
$ | 22,664,758 | $ | 4,781,018 | ||||
|
LIABILITIES AND SHAREHOLDERS'
EQUITY
|
||||||||
|
Current
liabilities:
|
||||||||
|
Accounts
payable and accrued expenses
|
$ | 724,439 | $ | 1,753,285 | ||||
|
Total
current liabilities
|
724,439 | 1,753,285 | ||||||
|
Asset
retirement obligation
|
1,991,987 | - | ||||||
|
Shareholders'
equity:
|
||||||||
|
Preferred
stock - $0.001 par value, 5,000,000 shares authorized:
|
||||||||
|
no
shares issued and outstanding
|
- | - | ||||||
|
Common
stock - $0.001 par value, 60,000,000 shares authorized:
|
||||||||
|
48,100,284
and 36,087,556 shares issued and outstanding, respectively
|
48,100 | 36,088 | ||||||
|
Additional
paid-in capital
|
95,692,273 | 43,686,779 | ||||||
|
(Deficit)
accumulated during the exploration stage
|
(74,817,721 | ) | (40,688,414 | ) | ||||
|
Other
comprehensive income (loss):
|
||||||||
|
Currency
translation adjustment
|
(974,320 | ) | (6,720 | ) | ||||
|
Total
shareholders' equity
|
19,948,332 | 3,027,733 | ||||||
|
Total
liabilities and shareholders' equity
|
$ | 22,664,758 | $ | 4,781,018 | ||||
The accompanying notes are an integral part of these financial statements
36
|
GOLD RESOURCE CORPORATION AND
SUBSIDIARIES
|
||||||||||||||||
|
(An Exploration Stage
Company)
|
||||||||||||||||
|
CONSOLIDATED STATEMENTS OF
OPERATIO
NS
|
||||||||||||||||
|
for
the years ended December 31, 2009, 2008, and 2007
|
||||||||||||||||
|
and
for the period from Inception (August 24, 1998) to December 31,
2009
|
||||||||||||||||
|
Inception
|
||||||||||||||||
|
(August
24, 1998) to
|
||||||||||||||||
|
2009
|
2008
|
2007
|
December
31, 2009
|
|||||||||||||
|
Revenue:
|
||||||||||||||||
|
Gold
sales
|
$ | - | $ | - | $ | - | $ | - | ||||||||
|
Costs
and Expenses:
|
||||||||||||||||
|
Property
exploration and evaluation
|
7,811,371 | 8,171,396 | 5,731,771 | 24,485,210 | ||||||||||||
|
Engineering
and construction
|
20,994,436 | 14,501,461 | - | 35,495,897 | ||||||||||||
|
Management
contract - US Gold, related party
|
- | - | - | 752,191 | ||||||||||||
|
General
and administrative
|
5,211,004 | 3,552,007 | 2,539,604 | 14,416,382 | ||||||||||||
|
Depreciation
|
166,993 | 123,948 | 47,480 | 363,708 | ||||||||||||
|
Total
costs and expenses
|
34,183,804 | 26,348,812 | 8,318,855 | 75,513,388 | ||||||||||||
|
Operating
(loss)
|
(34,183,804 | ) | (26,348,812 | ) | (8,318,855 | ) | (75,513,388 | ) | ||||||||
|
Other
income:
|
||||||||||||||||
|
Interest
income
|
54,497 | 333,609 | 242,513 | 695,667 | ||||||||||||
|
(Loss)
before income taxes
|
(34,129,307 | ) | (26,015,203 | ) | (8,076,342 | ) | (74,817,721 | ) | ||||||||
|
Provision
for income taxes
|
- | - | - | - | ||||||||||||
|
Net
(loss)
|
(34,129,307 | ) | (26,015,203 | ) | (8,076,342 | ) | (74,817,721 | ) | ||||||||
|
Other
comprehensive income:
|
||||||||||||||||
|
Currency
translation gain (loss)
|
(967,600 | ) | 63,536 | (89,939 | ) | (974,320 | ) | |||||||||
|
Net
comprehensive (loss)
|
$ | (35,096,907 | ) | $ | (25,951,667 | ) | $ | (8,166,281 | ) | $ | (75,792,041 | ) | ||||
|
Net
(loss) per common share:
|
||||||||||||||||
|
Basic
and Diluted
|
$ | (0.78 | ) | $ | (0.76 | ) | $ | (0.28 | ) | |||||||
|
Weighted
average shares outstanding:
|
||||||||||||||||
|
Basic
and Diluted
|
43,764,703 | 34,393,854 | 28,645,038 | |||||||||||||
The accompanying notes are an integral part of these financial
statements
37
|
GOLD
RESOURCE CORPORATION
|
||||||||||||||||||||||||
|
(An
Exploration Stage Company)
|
||||||||||||||||||||||||
|
CONSOLIDATED
STATEMENT OF CHANGES IN SHAREHOLDERS' EQUITY (DEFICIT)
|
||||||||||||||||||||||||
|
For
the period from Inception (August 24, 1998) to December 31,
2009
|
||||||||||||||||||||||||
|
Number
of
|
Par
Value of
|
Additional
|
Comprehensive
|
Total
|
||||||||||||||||||||
|
Common
|
Common
|
Paid
- in
|
Accumulated
|
Income
|
Shareholders'
|
|||||||||||||||||||
|
Shares
|
Shares
|
Capital
|
(Deficit)
|
(Loss)
|
Equity
(Deficit)
|
|||||||||||||||||||
|
Balance
at Inception, August 24, 1998
|
- | $ | - | $ | - | $ | - | $ | - | $ | - | |||||||||||||
|
Shares
for contributed capital at
|
||||||||||||||||||||||||
|
$0.005
per share - related parties
|
2,800,000 | 2,800 | (1,400 | ) | - | - | 1,400 | |||||||||||||||||
|
Net
(loss)
|
- | - | - | (1,657 | ) | - | (1,657 | ) | ||||||||||||||||
|
Balance,
December 31, 1998
|
2,800,000 | 2,800 | (1,400 | ) | (1,657 | ) | - | (257 | ) | |||||||||||||||
|
Shares
for contributed capital at
|
||||||||||||||||||||||||
|
$0.005
per share - related parties
|
1,000,000 | 1,000 | (500 | ) | - | - | 500 | |||||||||||||||||
|
Net
(loss)
|
- | - | - | (663 | ) | - | (663 | ) | ||||||||||||||||
|
Balance,
December 31, 1999
|
3,800,000 | 3,800 | (1,900 | ) | (2,320 | ) | - | (420 | ) | |||||||||||||||
|
Shares
issued for management contract
|
||||||||||||||||||||||||
|
at
$0.17 per share - related party
|
1,226,666 | 1,226 | 202,578 | - | - | 203,804 | ||||||||||||||||||
|
Net (loss)
|
- | - | - | (205,110 | ) | - | (205,110 | ) | ||||||||||||||||
|
Balance,
December 31, 2000
|
5,026,666 | 5,026 | 200,678 | (207,430 | ) | - | (1,726 | ) | ||||||||||||||||
|
Shares
issued for management contract
|
||||||||||||||||||||||||
|
at
$0.14 per share - related party
|
1,333,334 | 1,334 | 187,053 | - | - | 188,387 | ||||||||||||||||||
|
Conversion
of debentures at
|
||||||||||||||||||||||||
|
$0.25
per share - related parties
|
200,000 | 200 | 49,800 | - | - | 50,000 | ||||||||||||||||||
|
Sale
of shares for cash at $0.25 per share
|
204,180 | - | - | 205,000 | ||||||||||||||||||||
|
Net
(loss)
|
- | - | - | (346,498 | ) | - | (346,498 | ) | ||||||||||||||||
|
Balance,
December 31, 2001
|
7,380,000 | 7,380 | 641,711 | (553,928 | ) | - | 95,163 | |||||||||||||||||
|
Shares
issued for cash at $0.25 per share
|
97,608 | - | - | 98,000 | ||||||||||||||||||||
|
Shares
issued for cash at $0.17 per share
|
223,322 | - | - | 224,673 | ||||||||||||||||||||
|
Net
(loss)
|
- | - | - | (788,629 | ) | (17 | ) | (788,646 | ) | |||||||||||||||
|
Balance,
December 31, 2002
|
9,123,352 | 9,123 | 962,641 | (1,342,557 | ) | (17 | ) | (370,810 | ) | |||||||||||||||
38
|
Shares
issued for cash at $0.25 per share
|
143,673 | - | - | 144,250 | ||||||||||||||||||||
|
Share
issuance costs forgiven
|
- | - | 25,327 | - | - | 25,327 | ||||||||||||||||||
|
Net
(loss)
|
- | - | - | (496,046 | ) | 29 | (496,017 | ) | ||||||||||||||||
|
Balance,
December 31, 2003
|
9,700,352 | 9,700 | 1,131,641 | (1,838,603 | ) | 12 | (697,250 | ) | ||||||||||||||||
|
Shares
issued for cash at $0.25 per share
|
151,392 | - | - | 152,000 | ||||||||||||||||||||
|
Shares
issued in repayment of loan related
|
||||||||||||||||||||||||
|
to
exploration agreement at
|
||||||||||||||||||||||||
|
$0.42
per share
|
1,200,000 | 1,200 | 498,800 | - | - | 500,000 | ||||||||||||||||||
|
Shares
issued as stock grant at
|
||||||||||||||||||||||||
|
$0.25
per share
|
600,000 | 600 | 149,400 | - | - | 150,000 | ||||||||||||||||||
|
Net
(loss)
|
- | - | - | (853,593 | ) | (73 | ) | (853,666 | ) | |||||||||||||||
|
Balance,
December 31, 2004
|
12,108,352 | 12,108 | 1,931,233 | (2,692,196 | ) | (61 | ) | (748,916 | ) | |||||||||||||||
|
Stock
grant at $0.25 per share
|
1,750,000 | 1,750 | 435,750 | - | - | 437,500 | ||||||||||||||||||
|
Stock
option exercised at $0.25 per share
|
2,490 | - | - | 2,500 | ||||||||||||||||||||
|
Stock
issued for cash at $0.25 per share
|
68,724 | - | - | 69,000 | ||||||||||||||||||||
|
Stock
issued for satisfaction of payables
|
||||||||||||||||||||||||
|
at
$0.25 per share
|
1,280,000 | 1,280 | 318,720 | - | - | 320,000 | ||||||||||||||||||
|
Shares
issued for cash at $0.47 per share
|
1,272,271 | - | - | 1,275,000 | ||||||||||||||||||||
|
Shares
issued for cash at $0.50 per share
|
60,878 | - | - | 61,000 | ||||||||||||||||||||
|
Shares
issued for cash at $0.50 per share
|
14,970 | - | - | 15,000 | ||||||||||||||||||||
|
Net
(loss)
|
- | - | - | (1,217,911 | ) | 200 | (1,217,711 | ) | ||||||||||||||||
|
Balance,
December 31, 2005
|
18,304,852 | 18,305 | 4,105,036 | (3,910,107 | ) | 139 | 213,373 | |||||||||||||||||
|
Stock
options exercised at $0.25 per share
|
59,760 | - | - | 60,000 | ||||||||||||||||||||
|
Stock
options granted
|
- | - | 147,050 | - | - | 147,050 | ||||||||||||||||||
|
Director
stock grant at $1.00 per share
|
100,000 | 100 | 99,900 | - | - | 100,000 | ||||||||||||||||||
|
Shares
issued for cash at $1.00 per share,
|
||||||||||||||||||||||||
|
net
of issue costs
|
4,600,000 | 4,600 | 4,346,600 | - | - | 4,351,200 | ||||||||||||||||||
|
Shares
issued for investor relations
|
||||||||||||||||||||||||
|
services
at $1.14 per share
|
280,000 | 280 | 319,720 | - | - | 320,000 | ||||||||||||||||||
|
Shares
issued for cash at $1.20 per share,
|
||||||||||||||||||||||||
|
net
of issue costs
|
4,322,000 | 4,322 | 4,924,378 | - | - | 4,928,700 | ||||||||||||||||||
|
Shares
issued for investment banking
|
||||||||||||||||||||||||
|
services
at $1.20 per share
|
257,700 | 257 | (257 | ) | - | - | - | |||||||||||||||||
|
Employee
stock grants at $1.71 per share
|
59,815 | - | - | 59,850 | ||||||||||||||||||||
|
Net
(loss)
|
- | - | - | (2,686,762 | ) | 19,544 | (2,667,218 | ) | ||||||||||||||||
|
Balance,
December 31, 2006
|
28,139,552 | 28,139 | 14,062,002 | (6,596,869 | ) | 19,683 | 7,512,955 | |||||||||||||||||
39
|
Shares
issued for investor relations
|
||||||||||||||||||||||||
|
services
at weighted average price
|
||||||||||||||||||||||||
|
of
$3.39 per share
|
170,000 | 170 | 575,598 | - | - | 575,768 | ||||||||||||||||||
|
Shares
issued for consulting services in
|
||||||||||||||||||||||||
|
Mexico
at $3.68 per share
|
15,000 | 15 | 55,185 | - | - | 55,200 | ||||||||||||||||||
|
Stock
options granted
|
- | - | 99,482 | - | - | 99,482 | ||||||||||||||||||
|
Shares
issued for cash at $4.00 per share,
|
||||||||||||||||||||||||
|
net
of issue costs
|
5,558,500 | 5,559 | 21,706,441 | - | - | 21,712,000 | ||||||||||||||||||
|
Shares
issued for investment banking
|
||||||||||||||||||||||||
|
services
|
263,900 | 264 | (264 | ) | - | - | - | |||||||||||||||||
|
Net
(loss)
|
- | - | - | (8,076,342 | ) | (89,939 | ) | (8,166,281 | ) | |||||||||||||||
|
Balance,
December 31, 2007
|
34,146,952 | 34,147 | 36,498,444 | (14,673,211 | ) | (70,256 | ) | 21,789,124 | ||||||||||||||||
|
Stock
options granted
|
- | - | 1,956,806 | - | - | 1,956,806 | ||||||||||||||||||
|
Shares
issued for investor relations
|
||||||||||||||||||||||||
|
services
at $4.25 per share
|
10,000 | 10 | 42,460 | - | - | 42,470 | ||||||||||||||||||
|
Stock
options exercised at $1.00 per share
|
260,604 | 261 | 180,739 | - | - | 181,000 | ||||||||||||||||||
|
Shares
issued for cash at $3.00 per share
|
1,670,000 | 1,670 | 5,008,330 | - | - | 5,010,000 | ||||||||||||||||||
|
Net
(loss)
|
- | - | - | (26,015,203 | ) | 63,536 | (25,951,667 | ) | ||||||||||||||||
|
Balance,
December 31, 2008
|
36,087,556 | 36,088 | 43,686,779 | (40,688,414 | ) | (6,720 | ) | 3,027,733 | ||||||||||||||||
|
Stock
options granted
|
- | - | 2,843,506 | - | - | 2,843,506 | ||||||||||||||||||
|
Stock
options exercised, cashless exercise
|
677,933 | 677 | (677 | ) | - | - | - | |||||||||||||||||
|
Shares
issued for cash at $3.00 per share
|
4,330,000 | 4,330 | 12,985,670 | - | - | 12,990,000 | ||||||||||||||||||
|
Shares
issued for cash at $4.00 per share
|
5,000,000 | 5,000 | 19,995,000 | - | - | 20,000,000 | ||||||||||||||||||
|
Shares
issued for cash at $8.185 per share
|
1,954,795 | 1,955 | 15,998,045 | - | - | 16,000,000 | ||||||||||||||||||
|
Stock
options exercised at $3.68 per share
|
50,000 | 50 | 183,950 | - | - | 184,000 | ||||||||||||||||||
|
Net
(loss)
|
- | - | - | (34,129,307 | ) | (967,600 | ) | (35,096,907 | ) | |||||||||||||||
|
Balance,
December 31, 2009
|
48,100,284 | $ | 48,100 | $ | 95,692,273 | $ | (74,817,721 | ) | $ | (974,320 | ) | $ | 19,948,332 | |||||||||||
The accompanying notes are an integral part of these financial
statements
40
|
GOLD RESOURCE CORPORATION AND
SUBSIDIARIES
|
||||||||||||||||
|
(An Exploration Stage
Company)
|
||||||||||||||||
|
|
||||||||||||||||
|
for
the years ended December 31, 2009, 2008, and 2007
|
||||||||||||||||
|
and
for the period from Inception (August 24, 1998) to December 31,
2009
|
||||||||||||||||
|
Inception
|
||||||||||||||||
|
(August
24, 1998) to
|
||||||||||||||||
|
2009
|
2008
|
2007
|
December
31, 2009
|
|||||||||||||
|
Cash
flows from operating activities:
|
||||||||||||||||
|
Net
(loss)
|
$ | (34,129,307 | ) | $ | (26,015,203 | ) | $ | (8,076,342 | ) | $ | (74,817,721 | ) | ||||
|
Adjustments
to reconcile net (loss) to net cash
|
||||||||||||||||
|
(used
in) operating activities:
|
||||||||||||||||
|
Depreciation
|
166,993 | 123,948 | 47,480 | 363,708 | ||||||||||||
|
Asset
retirement obligation
|
1,991,987 | - | - | 1,991,987 | ||||||||||||
|
Stock
compensation
|
2,843,506 | 1,999,276 | 730,450 | 6,787,632 | ||||||||||||
|
Management
fee paid in stock
|
- | - | - | 392,191 | ||||||||||||
|
Related
party payable paid in stock
|
- | - | - | 320,000 | ||||||||||||
|
Foreign
currency translation adjustment
|
(967,600 | ) | 63,536 | (89,939 | ) | (974,320 | ) | |||||||||
|
Issuance
cost forgiven
|
- | - | - | 25,327 | ||||||||||||
|
Changes
in operating assets and liabilities:
|
||||||||||||||||
|
Restricted
cash
|
(11,436,074 | ) | - | - | (11,436,074 | ) | ||||||||||
|
Prepaid
and refundable taxes
|
(2,132,495 | ) | - | - | (2,132,495 | ) | ||||||||||
|
Other
current assets
|
(174,359 | ) | (162,212 | ) | 162,172 | (380,511 | ) | |||||||||
|
Accounts
payable and accrued liabilities
|
(1,028,846 | ) | 984,833 | 317,289 | 724,439 | |||||||||||
|
Other
|
(9,006 | ) | - | - | (13,575 | ) | ||||||||||
|
Total
adjustments
|
(10,745,894 | ) | 3,009,381 | 1,167,452 | (4,331,691 | ) | ||||||||||
|
Net
cash (used in) operating activities
|
(44,875,201 | ) | (23,005,822 | ) | (6,908,890 | ) | (79,149,412 | ) | ||||||||
|
Cash
flows from investing activities:
|
||||||||||||||||
|
Capital
expenditures
|
(1,204,253 | ) | (657,816 | ) | (456,152 | ) | (2,439,787 | ) | ||||||||
|
Net
cash (used in) investing activities
|
(1,204,253 | ) | (657,816 | ) | (456,152 | ) | (2,439,787 | ) | ||||||||
|
Cash
flows from financing activities:
|
||||||||||||||||
|
Proceeds
from initial public stock offering
|
- | - | - | 4,351,200 | ||||||||||||
|
Proceeds
from other sales of stock
|
48,990,000 | 5,010,000 | 21,712,000 | 82,889,623 | ||||||||||||
|
Proceeds
from exercise of options
|
184,000 | 181,000 | - | 427,500 | ||||||||||||
|
Proceeds
from debentures - founders
|
- | - | - | 50,000 | ||||||||||||
|
Proceeds
from exploration
funding
agreement - Canyon Resources
|
- | - | - | 500,000 | ||||||||||||
|
Net
cash provided by financing activities
|
49,174,000 | 5,191,000 | 21,712,000 | 88,218,323 | ||||||||||||
|
Effect
of exchange rates on cash and equivalents:
|
123,201 | - | - | 123,201 | ||||||||||||
|
Net
increase (decrease) in cash and equivalents
|
3,217,747 | (18,472,638 | ) | 14,346,958 | 6,752,325 | |||||||||||
|
Cash
and equivalents at beginning of period
|
3,534,578 | 22,007,216 | 7,660,258 | - | ||||||||||||
|
Cash
and equivalents at end of period
|
$ | 6,752,325 | $ | 3,534,578 | $ | 22,007,216 | $ | 6,752,325 | ||||||||
|
Supplemental
Cash Flow Information
|
||||||||||||||||
|
Interest
paid
|
$ | - | $ | - | $ | - | $ | - | ||||||||
|
Income
taxes paid
|
$ | - | $ | - | $ | - | $ | - | ||||||||
|
Non-cash
investing and financing activities:
|
||||||||||||||||
|
Conversion
of Canyon Resources funding into
|
||||||||||||||||
|
common
stock
|
$ | - | $ | - | $ | - | $ | 500,000 | ||||||||
|
Conversion
of founders debentures into
|
||||||||||||||||
|
common
stock
|
$ | - | $ | - | $ | - | $ | 50,000 | ||||||||
The accompanying notes are an integral part of these financial
statements
41
GOLD
RESOURCE CORPORATION AND SUBSIDIARIES
(An
Exploration Stage Company)
NOTES
TO CONSOLIDATED FINANCIAL STATEMENTS
December
31, 2009, 2008 and 2007
1. Summary
of Significant Accounting Policies
Basis of
Presentation.
Gold Resource Corporation (the
"Company") was organized under the laws of the State of Colorado on
August 24, 1998. The Company has been engaged in the exploration
for precious and base metals, primarily in Mexico, as an exploration stage
company. It plans to develop mineral properties and ultimately become
a producer of gold, silver, and base metals. The Company has not
generated any revenues from operations. The consolidated financial
statements included herein are expressed in United States dollars, the Company's
reporting currency. The accounting policies conform to accounting
principles generally accepted in the United States of America (“US
GAAP”).
Basis of
Consolidation.
The consolidated financial
statements include the accounts of the Company and its wholly owned Mexican
corporation subsidiaries. The significant subsidiaries are Don David
Gold S.A. de C.V. and Golden Trump Resources S.A. de C.V. The
expenditures of Don David Gold and Golden Trump Resources are generally incurred
in Mexican pesos. Significant intercompany accounts and transactions
have been eliminated.
Reclassifications
: Certain
amounts previously presented for prior periods have been reclassified to conform
with the current presentation. The reclassifications had no effect on
net loss, total assets, or total shareholders’ equity.
Restricted
Cash:
Pursuant to the terms of two subscription
agreements that were closed during 2009, the Company agreed to reserve cash
proceeds of $12,000,000, for specific purposes. Under the first
agreement, $4,000,000 was restricted for the purpose of additional exploration
at the
El Aguila
Project. Under the second agreement, $8,000,000 was restricted for
the purpose of constructing a decline ramp, drifts and crosscuts, and associated
surface facilities to support underground development and mining of the
La Arista
vein.
The
restricted cash balances were placed in separate interest bearing bank
accounts. Transfer of funds from the restricted bank accounts
requires the approval of Hochschild Mining Holdings Limited (“Hochschild”). The
approval process includes the presentation of documentation that demonstrates
use of the funds for the intended purpose.
Use of
Estimates.
The preparation of financial statements
in conformity with US GAAP requires management to make estimates and assumptions
that affect the reported amount of assets and liabilities and disclosure of
contingent assets and liabilities at the date of the financial statements and
the reported amounts of revenues and expenses during the reporting
period. Management routinely makes judgments and estimates about the
effects of matters that are inherently uncertain. Estimates that are
critical to the accompanying consolidated financial statements include the
identification and valuation of proven and probable reserves, obligations for
environmental, reclamation, and closure matters, estimates related to asset
impairments of long lived assets and investments, classification of expenditures
as either an asset or an expense, valuation of deferred tax assets, and the
likelihood of loss contingencies. Management bases its estimates and
judgements on historical experience and on various other factors that are
believed to be reasonable under the circumstances, the results of which form the
basis for making judgments about the carrying values of assets and liabilities
that are not readily apparent from other sources. Estimates and
assumptions are revised periodically and the effects of revisions are reflected
in the financial statements in the period it is determined to be
necessary. Actual results could differ from these
estimates.
42
Cash and Cash
Equivalents.
Cash and cash equivalents consists of
all cash balances and highly liquid investments with a remaining maturity of
three months or less when purchased and carried at cost, which approximates fair
value.
Proven and Probable
Reserves.
The definition of proven and probable
reserves is set forth in SEC Industry Guide 7. Proven reserves are
reserves for which (a) quantity is computed from dimensions revealed in
outcrops, trenches, workings or drill holes; grade and/or quality are computed
from the results of detailed sampling and (b) the sites for inspection, sampling
and measurement are spaced so closely and the geologic character is so well
defined that size, shape, depth and mineral content of reserves are
well-established. Probable reserves are reserves for which quantity
and grade and/or quality are computed from information similar to that used for
proven reserves, but the sites for inspection, sampling, and measurement are
farther apart or are otherwise less adequately spaced. The degree of
assurance, although lower than that for proven reserves, is high enough to
assume continuity between points of observation. In addition,
reserves cannot be considered proven and probable until they are supported by a
feasibility study, indicating that the reserves have had the requisite geologic,
technical and economic work performed and are economically and legally
extractable at the time of the reserve determination.
As of
December 31, 2009, none of the Company’s mineralized material met the definition
of proven or probable reserves.
Mineral Acquisition
Costs.
The costs of acquiring land and mineral
rights are considered tangible assets. Significant acquisition
payments are capitalized. General, administrative and holding costs
to maintain an exploration property are expensed as incurred. If a
mineable ore body is discovered, such costs are amortized when production begins
using the units-of-production method. If no mineable ore body is
discovered or such rights are otherwise determined to have diminished value,
such costs are expensed in the period in which the determination is
made.
Exploration
Costs.
Exploration costs are charged to expense as
incurred. Costs to identify new mineral resources, to evaluate
potential resources, and to convert mineral resources into proven and probable
reserves are considered exploration costs.
Design, Construction, and Development
Costs.
Certain costs to design and construct mine
and processing facilities may be incurred prior to establishing proven and
probable reserves. Under these circumstances, the Company classifies
the project as an exploration stage project and expenses substantially all
costs, including design, engineering, construction, and installation of
equipment. Certain types of equipment, which have alternative uses or
significant salvage value, may be capitalized. If a project is
determined to contain proven and probable reserves, costs incurred in
anticipation of production can be capitalized. Such costs include
development drilling to further delineate the ore body, removing overburden
during the pre-production phase, building access ways, constructing facilities,
and installing equipment. Interest costs, if any, incurred during the
development phase, would be capitalized until the assets are ready for their
intended use. The cost of start-up activities and on-going costs to
maintain production are expensed as incurred. Costs of abandoned
projects are charged to operations upon abandonment.
If a
project commences commercial production, amortization and depletion of
capitalized costs is computed on a unit-of–production basis over the expected
reserves of the project based on estimated recoverable gold equivalent
ounces.
43
Impairment of Long-Lived
Assets.
The Company evaluates its long-lived
assets for impairment. If impairment indicators exist, the Company
performs additional analysis to quantify the amount by which capitalized costs
exceed recoverable value. The periodic evaluation of capitalized
costs is based upon expected future cash flows, including estimated salvage
values. As of December 31, 2009, the Company’s mineral resources do
not meet the definition of proven or probable reserves or value beyond proven
and probable reserves and any potential revenue has been excluded from the cash
flow assumptions. Accordingly, recoverability of capitalized cost is
based primarily on estimated salvage values, or alternative future
uses.
Property and
Equipment.
All items of property and equipment are
carried at cost not in excess of their estimated net realizable
value. Normal maintenance and repairs are charged to operations while
expenditures for major maintenance and betterments are
capitalized. Gains or losses on disposition are recognized in
operations.
Depreciation.
Depreciation
of property and equipment is computed using straight-line methods over the
estimated economic lives, as follows:
|
Trucks
and autos
|
4
to 5 years
|
|
Office
furniture and equipment
|
5
to 10 years
|
|
Computer
hardware and software
|
3
to 6 years
|
|
Exploration
equipment
|
6
to 8 years
|
Asset Retirement
Obligations.
The Company’s mining and exploration
activities are subject to various laws and regulations, including legal and
contractual obligations to reclaim, remediate, or otherwise restore properties
at the time the property is removed from service. A liability is
initially recorded at the estimated present value for an obligation associated
with the retirement of tangible long-lived assets in the period in which it is
incurred if a reasonable estimate of fair value can be made. For
exploration stage properties that do not qualify for asset capitalization, the
costs associated with the obligation are charged to operations. For
development and production stage properties, the costs are added to the
capitalized costs of the property and amortized using the unit of production
method.
Stock Based
Compensation
. The Company records compensation
expense for the fair value of stock options that are granted. Expense
is recognized on a pro-rata basis over the vesting periods, if any, of the
options. The fair value of stock options at their grant date is estimated by
using the Black-Scholes-Merton option pricing model.
Net Earnings (Loss) Per
Share.
Basic earnings (loss) per share is computed
by dividing net loss by the weighted average number of common shares outstanding
during each period. Diluted earnings (loss) per share reflects the
potential dilution that could occur if potentially dilutive securities are
converted into common shares. Potentially dilutive securities, such
as stock options and warrants, are excluded from the calculation when their
inclusion would be anti-dilutive, such as periods when a net loss is reported or
when the exercise price of the instrument exceeds the fair market
value. During the years ended December 31, 2009, 2008, and 2007, the
calculation excluded potential dilution of 3,745,000, 3,683,000, and 2,650,000
shares, respectively, because the effect would have been
anti-dilutive.
Income
Taxes.
Income taxes are computed using the
liability method. Deferred income taxes reflect the net tax effects
of temporary differences between the carrying amounts of assets and liabilities
for financial and tax reporting purposes and the effect of net operating loss
carry-forwards. Deferred tax assets are evaluated to determine if it
is more likely than not that they will be realized. Valuation
allowances have been established to reduce the carrying value of deferred tax
assets in recognition of significant uncertainties regarding their ultimate
realization. Further, the evaluation has determined that there are no
uncertain tax positions required to be disclosed.
44
Comprehensive
Income.
Total comprehensive income and the
components of accumulated other comprehensive income (loss) are presented in the
Consolidated Statement of Changes in Equity. Accumulated other
comprehensive income (loss) is composed of foreign currency translation
effects.
Fair Value of Financial
Instruments
.
ASC
825, “Disclosures About Fair Value of Financial Instruments,” requires
disclosure of fair value information about financial
instruments. ASC 820, “Fair Value Measurements” (“ASC 820”) defines
fair value, establishes a framework for measuring fair value in generally
accepted accounting principals, and expands disclosures about fair value
measurements. Fair value estimates discussed herein are based upon
certain market assumptions and pertinent information available to management as
of December 31, 2009.
The
respective carrying value of certain on-balance-sheet financial instruments
approximate their fair values. These financial instruments include
cash, cash equivalents, restricted cash, prepaid and refundable taxes, accounts
payable and accrued liabilities. Fair values were assumed to
approximate carrying values for these financial instruments since they are short
term in nature and their carrying amounts approximate fair value, or they are
receivable or payable on demand.
Concentration of Credit
Risk.
Some of the Company's operating cash
balances are maintained in accounts that currently exceed federally insured
limits. The Company believes that the financial strength of
depositing institutions mitigate the underlying risk of loss. To
date, these concentrations of credit risk have not had a significant impact on
the Company’s financial position or results of operations.
Foreign
Operations.
The Company's present mining
activities are in Mexico. As with all types of international business
operations, currency fluctuations, exchange controls, restrictions on foreign
investment, changes to tax regimes, political action and political instability
could impair the value of the Company's investments.
Foreign Currency
Translation.
The local currency where the
Company’s properties are located, the Mexican peso, is the functional currency
for the Company's subsidiaries. Assets and liabilities are translated
using the exchange rate in effect at the balance sheet
date. Intercompany equity accounts are translated using historical
rates. Revenues and expenses are translated at the average exchange
rate for the year. Translation adjustments are not included in the
determination of net loss for the period and are reported as a separate
component of shareholders' equity.
Prepaid and Refundable
Taxes.
In
Mexico, value added taxes (IVA) are assessed on purchases of materials and
services. Businesses are generally entitled to recover the taxes they
have paid, either as a refund or as a credit against future taxes
payable. For the period from inception through 2008, substantially
all of the Company’s refund claims were initially denied by the tax
authorities. Accordingly, the Company provided a full valuation
allowance for potentially refundable IVA. During 2009, the Company
was successful in establishing the validity of its claims and received IVA
refunds in the amount of $1,075,266. Furthermore, it appears that the
tax authorities will honor the Company’s claims for substantially all of the IVA
paid during 2009. Amounts recorded as prepaid and refundable taxes in
the consolidated financial statements represent the estimated recoverable
payments made during 2009. Although the taxing authorities may
reconsider claims filed for previous years, significant uncertainties regarding
ultimate recovery preclude recognition of an asset for taxes paid in prior
years.
Recently Adopted Accounting
Standards.
The Company evaluates the pronouncements of various
authoritative accounting organizations, primarily the Financial Accounting
Standards Board (“FASB”), the SEC, and the Emerging Issues Task Force (“EITF”),
to determine the impact of new pronouncements on US GAAP and the impact on the
Company. The Company has adopted the following new accounting
standards during 2009:
45
Accounting Standards Codification
-
In June, 2009, FASB established the Accounting Standards
Codification (“ASC”) as the single source of authoritative US GAAP to be applied
by nongovernmental entities. Rules and interpretive releases of the
SEC under authority of federal securities laws are also sources of authoritative
US GAAP for SEC registrants. The ASC is a new structure which took
existing accounting pronouncements and organized them by accounting
topic. The ASC did not change current US GAAP, but was intended to
simplify user access to all authoritative US GAAP by providing all the relevant
literature related to a particular topic in one place. All previously
existing accounting standards were superseded and all other accounting
literature not included in the ASC is considered
non-authoritative. New accounting standards issued subsequent to June
30, 2009 will be communicated by the FASB through Accounting Standards Updates
(ASUs). The ASC was effective during the period ended September 30,
2009. Adoption of the ASC did not have an impact on the Company’s
consolidated financial position, results of operations or cash
flows.
Subsequent Events
- In
May, 2009, the ASC guidance for subsequent events was updated to establish
accounting and reporting standards for events that occur after the balance sheet
date but before financial statements are issued. The guidance was
amended in February, 2010. The update sets forth: (i) the period
after the balance sheet date during which management of a reporting entity
should evaluate events or transactions that may occur for potential recognition
or disclosure in the financial statements, (ii) the circumstances under
which an entity should recognize events or transactions occurring after the
balance sheet in its financial statements, and (iii) the disclosures that
an entity should make about events or transactions occurring after the balance
sheet date in its financial statements. The Company adopted the
updated guidance in 2009. The adoption had no impact on the Company’s
consolidated financial position, results of operations or cash
flows.
Recently Issued Accounting Standards
Updates.
The following accounting standards
updates were recently issued and have not yet been adopted by the
Company. These standards are currently under review to determine
their impact on the Company’s consolidated financial position, results of
operations, or cash flows.
ASU 2010-6
amends existing disclosure requirements about fair value measurements by adding
required disclosures about items transferring into and out of levels 1 and 2 in
the fair value hierarchy; adding separate disclosures about purchase, sales,
issuances, and settlements relative to level 3 measurements; and clarifying,
among other things, the existing fair value disclosures about the level of
disaggregation. This ASU will be effective for the first quarter of
2010.
ASU
2009-17 revises the consolidation guidance for variable-interest entities. The
modifications include the elimination of the exemption for qualifying special
purpose entities, a new approach for determining who should consolidate a
variable-interest entity, and changes to when it is necessary to reassess who
should consolidate a variable-interest entity. This standard will be effective
January 1, 2010.
There
were various other updates recently issued, most of which represented technical
corrections to the accounting literature or application to specific
industries. None of the updates are expected to a have a material
impact on the Company's consolidated financial position, results of operations
or cash flows.
46
2. Mineral
Properties
The
Company currently has an interest in five properties, the
El Aguila
project, the
El Rey
property, the
Las Margaritas
property, the
Solaga
property, and
the
Alta Gracia
property.
The
El
Aguila
Project
. Effective October 14, 2002, the Company leased three
mining concessions,
El Aguila
,
El Aire
, and
La Tehuana
from a
shareholder. The lease agreement is subject to a 4% net smelter
return royalty where production is sold in the form of gold/silver dore and 5%
for production sold in concentrate form. The Company has made
periodic advance royalty payments under the lease totaling $260,000 and no
further advance royalty payments are due. Subject to minimum
exploration requirements, there is no expiration term for the
lease. The Company may terminate it at any time upon written notice
to the lessor and the lessor may terminate it if the Company fails to fulfill
any of its obligations. The
El Aguila
and
El Aire
concessions make up
the
El Aguila
project
and the
La Tehuana
concession makes up the
Las
Margaritas
property.
The
Company has filed for and received additional concessions for the
El Aguila
project that total
an additional 8,492 hectares. These additional concessions are not
part of the concessions leased from the shareholder, and bring the Company’s
interest in the
El
Aguila
project to an aggregate of 9,463 hectares. The mineral
concessions making up the
El
Aguila
project are located within the Mexican State of
Oaxaca.
The 2009
drilling program continued to explore a relatively new area of mineralization at
the
El Aguila
Project
known as the
La Arista
vein area, approximately two kilometers from the mill site. The
mineralized material in this area is targeted to be mined using underground
methods.
The
El
Rey
Property
. The Company has acquired claims in another area in
the state of Oaxaca by filing concessions under the Mexican mining laws,
referred to by the Company as the
El Rey
property. These concessions total 892 hectares and are subject to a
2% royalty on production payable to a shareholder. The Company has
conducted minimal exploration and drilling on this property to
date.
The
El Rey
property is an
exploration stage property with no known reserves. It is
approximately 64 kilometers (40 miles) from the
El Aguila
project. There is no plant or equipment on the
El Rey
property. If exploration is successful, any mining would probably
require an underground mine but any mineralized material could be processed at
the
El Aguila
project
mill.
The
Las
Margaritas
Property
. The
Las Margaritas
property is
made up of the
La
Tehuana
concession. The Company leased this property in
October 2002 from a shareholder. It is comprised of approximately 925
hectares located adjacent to the
El Aguila
property. To date, the Company has conducted limited surface
sampling, but no other significant exploration activities at the
property.
The
Solaga
Property
. In
February 2007, the Company leased a 100% interest in a property known as the
Solaga
property from an
entity partially owned by a shareholder. The property totals 618
hectares, and is located approximately 120 kilometers (75 miles) from the
El Aguila
project. A dormant silver mine is located on the
Solaga
property which was in
production as recently as the 1980’s, however the Company cannot estimate if or
when the mine will reopen. The lease requires the Company to perform
$25,000 in additional work and is subject to a 4% net smelter return royalty on
any production. The Company has not conducted any exploration
activities at the property.
The
Alta Gracia
Property.
In
August 2009, the Company acquired claims adjacent to the
Las
Margaritas
property in the
Alta
Gracia
mining district by
filing concessions under the Mexican mining laws. The Company refers
to this property as the
Alta
Gracia
property. These concessions are comprised of three mining claims, the
David
1
, the
David 2
and
La
Hurradura
. The
concessions total 5,175 hectares, and the acquisition of these claims extended
the Company’s land position along what is known as the
San Jose
structural corridor to
just over 16 kilometers. To date, the Company has not conducted
significant exploration activities at the property
.
47
As of
December 31, 2009, none of the mineralized material at the Company’s properties
met the SEC’s definition of proven or probable reserves.
3. Property
and Equipment
At
December 31, 2009 and 2008, property and equipment consisted of the
following:
|
2009
|
2008
|
|||||||
|
Trucks
and autos
|
$ | 424,527 | $ | 291,876 | ||||
|
Office
furniture and equipment
|
491,447 | 137,678 | ||||||
|
Exploration
equipment
|
916,879 | 570,794 | ||||||
|
Other
support equipment
|
228,110 | -- | ||||||
|
Subtotal
|
2,060,963 | 1,000,348 | ||||||
|
Accumulated
depreciation
|
(334,685 | ) | (188,129 | ) | ||||
|
Total
|
$ | 1,726,278 | $ | 812,219 | ||||
Depreciation
expense for the years ended December 31, 2009, 2008, and 2007 was $166,993,
$123,948, and $47,480, respectively. The Company evaluates the
recoverability of property and equipment when events and circumstances indicate
that such assets might be impaired.
4. Income
Taxes
Income
(Loss) before income taxes, segregated as to the U. S. and foreign components,
is as follows:
| 2009 |
2008
|
2007
|
|
||||||||||
|
U.
S.
|
$ | (2,947,251 | ) | $ | (12,697,644 | ) | $ | (3,002,018 | ) | ||||
|
Foreign
|
(31,182,056 | ) | (13,317,559 | ) | (5,074,324 | ) | |||||||
|
Total
|
$ | (34,129,307 | ) | $ | (26,015,203 | ) | $ | (8,076,342 | ) | ||||
At
December 31, 2009, the Company has tax loss carry-forwards for U. S. tax
purposes approximating $6,260,000, which primarily expire from 2026 to 2029. The
principal difference between the net loss reported for financial reporting
purposes and the taxable loss reported for tax purposes relates to the taxation
of foreign subsidiaries. Secondly, stock based compensation expenses
are generally deductible for tax purposes in different periods and in different
amounts than the expense recognized for financial reporting
purposes. Finally, certain expenditures for property and equipment
are capitalized for tax purposes, but not for financial reporting
purposes.
The tax
effects of temporary differences that give rise to significant portions of the
deferred tax assets at December 31, 2009 and 2008 are presented
below:
|
2009
|
2008
|
|||||||
|
Deferred
tax assets:
|
||||||||
|
Tax
loss carryforward – U. S.
|
$ | 2,129,000 | $ | 2,996,000 | ||||
|
Tax
loss carryforward – Foreign
|
19,321,000 | 7,877,000 | ||||||
|
Stock
based compensation
|
350,000 | 814,000 | ||||||
|
Property
and equipment
|
3,700,000 | 2,188,000 | ||||||
|
Total
deferred tax assets
|
25,500,000 | 13,875,000 | ||||||
|
Valuation
allowance
|
(25,500,000 | ) | (13,875,000 | ) | ||||
|
Net
deferred tax asset
|
$ | -- | $ | -- | ||||
48
At this
time, the Company is unable to determine if it will be able to benefit from its
deferred tax asset. There are limitations on the utilization of net
operating loss carry-forwards, including a requirement that losses be offset
against future taxable income, if any. In addition, there are
limitations imposed by certain transactions which are deemed to be ownership
changes. Accordingly, a valuation allowance has been established for
the entire deferred tax asset. The change in the valuation allowance
was approximately $11,625,000 during 2009.
A reconciliation of taxes reported
at the Company’s effective tax rate and the U. S. federal statutory tax rate is
comprised of the following components:
|
2009
|
2008
|
2007
|
||||||||||
|
Tax
at statutory rates
|
$ | ( 11,604,000 | ) | $ | (8,845,000 | ) | $ | (2,746,000 | ) | |||
|
Increase
(reduction) in taxes
due
to:
|
||||||||||||
|
Stock
based compensation
|
-- | -- | 34,000 | |||||||||
|
Valuation
allowance
|
11,604,000 | 8,845,000 | 2,712,000 | |||||||||
|
Tax
provision
|
$ | -- | $ | -- | $ | -- | ||||||
5. Shareholders'
Equity
Effective
February 21, 2005, the Company declared and effected a 100% forward stock
split where one additional share of common stock, par value $0.001, was issued
for each common share outstanding as of that date. All of the financial
information in this report has been adjusted to reflect the effect of this
two-for-one stock split.
The
Company was formed August 24, 1998 by William W. Reid and David C. Reid
(the "Founders"). During 1998 and 1999, the Founders received
3,800,000 shares of common stock valued at $1,900 for administrative and
organization expenses. The Company remained generally inactive
through 1999.
Commencing
July 1, 2000, the Company and US Gold, a publicly traded Colorado
corporation, entered into a management contract whereby US Gold provided general
management of the business activities of the Company through December 31,
2001. Under this management contract, US Gold was issued 2,560,000
shares of common stock of the Company. The 2,560,000 shares were
valued at $392,191 or approximately $0.15 per share. Through this
arrangement the Company benefited from experienced management without the
need to raise cash funding for the related cost of such management and
administration. The Company was, however, responsible for all
additional funding needed.
During
2001, the Founders made convertible debenture loans to the Company and then
converted $50,000 in convertible debentures into 200,000 shares of common stock
of the Company at a conversion price of $0.25 per share.
49
In
September 2001, the Company commenced the sale of its common shares under
exemptions offered by federal and state securities
regulations. During 2001 the Company sold 820,000 shares at $0.25 per
share (total $205,000).
During
2002, the Company sold 392,000 shares at $0.25 per share ($98,000) to various
parties and 1,351,352 shares at approximately $0.17 per share ($224,673) to an
institutional investor, RMB International (Dublin) Limited ("RMB").
During
2003, the Company sold 577,000 shares at $0.25 per share raising net proceeds of
$144,250. Effective September 30, 2003, U.S. Gold acquired the
RMB shares in exchange for U.S. Gold shares, and terminated the obligation of
the Company to pay RMB approximately $25,327 in transaction costs, which was
added back into paid-in-capital.
During
2004, the Company sold 608,000 shares at $0.25 per share raising net proceeds of
$152,000. Also during 2004, the Company issued 1,200,000 shares
valued at approximately $0.42 per share to Canyon Resource Corporation for
repayment of a loan for funding of exploration cost at the
El Aguila
property. Also during 2004, the Company made a stock grant of 600,000
shares at $0.25 per share or $150,000 to a consultant of the
Company.
Effective
January 2, 2005, the Company made common stock awards to its two executive
officers and a consultant of an aggregate 1,750,000 shares for services
performed during 2004 and 2005. The shares were valued at $437,500
(or $0.25 per share) which was recorded as stock based compensation expense of
$350,000 in 2004 and $87,500 in 2005. In this issuance of common
stock, William W. Reid received 1,000,000 shares, David C. Reid received
500,000 shares and William F. Pass received 250,000 shares. Also
effective January 2, 2005, a stock option issued to William F. Pass
covering 400,000 shares of common stock at exercise price of $0.25 per share was
reduced by 250,000 shares leaving 150,000 shares remaining subject to
option.
During
2005 an individual exercised stock options for 10,000 shares for
$2,500. In June 2005, the Company issued 1,280,000 shares to U.S.
Gold Corporation in satisfaction of $320,000 owed for a prior year management
contract.
During
2005, the Company sold 428,000 shares to individual investors for cash proceeds
of $145,000 (276,000 shares at $0.25 per share and 152,000 shares at $0.50 per
share).
In
addition, during July and August 2005, the Company closed transactions under a
Subscription Agreement and Stock Purchase Option Agreement with Heemskirk
Consolidated Limited ("Heemskirk"), an Australian global mining house, whereby
Heemskirk purchased 2,000,000 shares of common stock of the Company at $0.50 per
share. A finder’s fee of 140,000 shares was paid to a third party (resulting in
a net value of $0.47 per share). Heemskirk had previously purchased
(in April, 2005) 150,000 shares of common stock at $0.50 per share and the
Company had paid a finder’s fee of 10,500 shares. The Company agreed
to give Heemskirk a first right of offer for any financings, including sale of
equity, the Company may pursue. In a similar transaction during
August 2005, the Company sold 400,000 shares to another investor raising
$200,000 and paid a finder’s fee to a third party of 28,000
shares. These transactions resulted in the issuance of 2,728,500
shares for net cash proceeds of $1,275,000 ($0.47 per share).
During
2006, the Company sold 4,600,000 shares of common stock at $1.00 per share in a
public offering under a Form SB-2 registration statement that was declared
effective on May 15, 2006. The Company received cash proceeds of
$4,351,200 (net of finders’ fees of $248,800).
50
During
2006, the Company completed a private placement of 4,322,000 shares of common
stock at $1.20 per share, and received net cash proceeds of $4,928,700, after
deducting finders’ fees of $257,700. The Company also issued 257,700
shares of common stock as finders’ fees in connection with this private
placement.
During
2006, the Company received cash proceeds of $60,000 pursuant to the exercise of
options to purchase 240,000 shares at $0.25 per share.
In May,
2006, the Company made a common stock award of 100,000 shares to a director.
These shares were valued at $100,000. In December, 2006, the Company
made a common stock award of 35,000 shares to two employees. These
shares were valued at $59,850. In October, 2006, the Company issued
250,000 shares of restricted common stock in exchange for investor relations
services. These shares were valued at $275,000.
Pursuant
to a contract effective November 1, 2006, the Company agreed to issue shares of
common stock to a consultant performing investor relations work on its
behalf. The 30,000 shares issued in 2006 were valued at $1.50 per
share, or $45,000. The 30,000 shares issued in February 2007 were
valued at $2.428 per share, or $72,840. The 30,000 shares issued in
May 2007 were valued at $3.39 per share or $101,670. In November,
2007, 30,000 shares were issued at a value of $4.14 per share or $124,310, and
20,000 shares were issued at a value of $4.235 per share or
$84,703. The Company agreed to issue an additional 10,000 shares for
services performed during December 2007 valued at $4.375 per share or
$43,745.
On May 1,
2007, the Company entered into an investor relations contract for international
investors that required the issuance of 50,000 shares of restricted common stock
during the second quarter of 2007. These shares were valued at fair
market value of $148,500.
On
October 2, 2007, the Company agreed to issue 15,000 shares of common stock for
consulting services performed in Mexico. These shares were valued at
$3.68 per share or $55,200 and were recorded as stock compensation during the
year ended December 31, 2007.
On
December 5, 2007, the Company completed the sale of 5,558,500 shares of common
stock in a private placement for a price of $4.00 per share, for aggregate gross
proceeds of $22,234,000. The sales were made pursuant to a
subscription agreement between the Company and each subscriber. In
connection with the private placement, the Company agreed to pay finders’ fees
of $522,000 cash and 263,900 shares of common stock.
Effective
January 13, 2008, the Company agreed to issue 10,000 restricted shares of common
stock for investor relations consulting services. The 10,000 shares
were valued at $4.247 per share or $42,470.
During
the year ended December 31, 2008, a Director of the Company exercised options to
purchase 100,000 shares of the Company's common stock at the exercise price of
$1.00 per share for total cash proceeds of $100,000.
Effective
July 28, 2008, an officer exercised options to purchase 87,000 shares of common
stock at $1.00 per share. The officer elected the “cashless exercise”
method for payment, under which he immediately surrendered 19,333 shares of
common stock that he would have otherwise been entitled to
receive. These shares were valued at $4.50 per share, for a total
valuation of $87,000. The transaction resulted in a net increase of
67,667 common shares outstanding.
51
Effective
October 12, 2008, a consultant exercised options to purchase 81,000 shares of
restricted common stock at $1.00 per share for cash proceeds of
$81,000. In addition, the consultant exercised options to purchase
19,000 shares using the “cashless exercise” method of payment, under which he
immediately surrendered 7,063 shares of common stock that he would have
otherwise been entitled to receive. The 7,063 shares were valued at
$2.69 per share, for a total valuation of $19,000 and resulting in a net
issuance of 11,937 shares. As a result of both transactions, common
shares outstanding increased by 92,937 shares.
On
December 5, 2008, the Company entered into a subscription agreement and a
strategic alliance agreement with Hochschild Mining Holdings Limited
(Hochschild). Under the terms of the subscription agreement, the
Company sold 1,670,000 restricted shares of its common stock to Hochschild at
$3.00 per share for total cash proceeds of $5,010,000. Under the
terms of the strategic alliance agreement the Company granted Hochschild an
option to purchase an additional 4,330,000 shares of its restricted common stock
at a price of $3.00 per share for total cash proceeds of
$12,990,000. The option was exercised on February 25,
2009. The strategic alliance agreement also contains a number of
additional covenants between the parties.
On June
30, 2009, the Company entered into a subscription agreement with Hochschild to
sell 5,000,000 shares of its restricted common stock at a price of $4.00 per
share, or a total of $20,000,000. The transaction was completed in
two tranches. Simultaneously with the execution of the subscription agreement,
the Company sold 1,250,000 shares of common stock for gross proceeds of
$5,000,000. The closing for the remaining 3,750,000 shares of common
stock was held on July 20, 2009. The Company agreed to reserve $4,000,000 of the
gross proceeds for exploration activities.
Effective
October 2, 2009, a consultant exercised options to purchase 50,000 shares of
restricted common stock at $3.68 per share for total cash proceeds of
$184,000.
On
December 17, 2009, the Company entered into a subscription agreement with
Hochschild to sell 1,954,795 shares of restricted common stock at $8.185 per
share for gross proceeds of $16,000,000. A portion of the proceeds
will be used to continue the development of the mill and mine at the El Aquila
project. The Company agreed to reserve $8,000,000 of the proceeds for
underground mining expenses at the
La Arista Vein
.
During
the year ended December 31, 2009, the Company issued 677,933 shares of common
stock pursuant to the exercise of stock options by officers and
directors. Two option-holders exercised 913,000 options using the
“cashless exercise” method for payment, whereby each option-holder immediately
surrendered shares of common stock that he would have otherwise been entitled to
receive. In the aggregate, the option-holders exercised 913,000
options and immediately surrendered 235,067 shares of common stock, resulting in
a net issuance of 677,933 shares of common stock. The Company
received no cash proceeds in the transactions.
6. Stock
Options
The
Company has a non-qualified stock option and stock grant plan under which equity
awards may be granted to key employees, directors and others (the
"Plan"). The Plan is administered by the Board of Directors which
determines the terms pursuant to which any option is granted. The
maximum number of common shares subject to grant under the Plan is
6,000,000.
The fair
value of each option award is estimated on the date of grant using the
Black-Scholes-Merton option pricing model. The option pricing model
requires the input of subjective assumptions which are based on several
different criteria. Expected volatility is based on the historical
price volatility of the Company’s common stock. Expected dividend
yield is assumed to be nil, as the Company has not paid dividends since
inception. Based on historical experience, forfeitures and cancellations are not
significant. The expected life is estimated in accordance with Staff
Accounting Bulletin No. 107, “Share-Based Payment” for plain vanilla
options. Risk free interest rates are based on US government
obligations with a term approximating the expected life of the
option.
52
The fair
value of stock option grants is amortized over the respective vesting period.
Total non-cash compensation expense related to stock options included in general
and administrative expense for the years ended December 31, 2009, 2008, and 2007
was $ 2,843,506, $1,956,806, and $99,482 respectively. The estimated
unrecognized compensation cost from unvested options as of December 31, 2009 was
approximately $614,588, which is expected to be recognized over the remaining
vesting period of 2.4 years.
During
the year ended December 31, 2007, the Company granted stock options to a public
relations consultant to purchase 50,000 shares of common stock at an exercise
price of $3.68 per share and a term of two years. The options vested
upon issuance. The grant date fair value was calculated as $83,192
($1.66 per option) using the following assumptions: expected life of
two years, stock price of $3.68 at date of grant, dividend yield of 0%, interest
rate of 4%, and volatility of 80%.
Effective
February 22, 2008, grants covering 1,000,000 shares were issued to officers and
directors at an exercise price of $3.40 and a term of ten years. The options
vested upon issuance. The grant date fair value was calculated as
$1,803,400 ($1.80 per option) using the following
assumptions: expected life of five years, stock price of $3.40 at
date of grant, dividend yield of 0%, interest rate of 2.1%, and volatility of
61%.
During
the year ended December 31, 2008, the Company granted options to employees
covering 270,000 shares of common stock at exercise prices ranging from $3.74 to
$4.51 and terms of ten years. The options vest over a three year
period. The grant date fair value was calculated as $637,434 ($2.36
per option) using the following assumptions: expected life of six
years, stock price equal to exercise price at date of grant, dividend yield of
0%, interest rate of 3.38%, and volatility of 61%.
Effective
January 9, 2008, the Company entered into an investor relations consulting
services contract which included the issuance of options to purchase 50,000
shares of common stock at an exercise price of $4.45 and a term of eighteen
months. The options vested upon issuance. The grant date
fair value was calculated as $67,280 ($1.35 per option) using the following
assumptions: expected life of eighteen months, stock price of $4.45
at date of grant, dividend yield of 0%, interest rate of 2.1%, and volatility of
61%.
Effective
April 23, 2009, grants covering 1,000,000 shares were issued to officers and
directors at an exercise price of $3.95 and a term of ten years. The
options vested upon issuance. The grant date fair value was
calculated as $2,575,000 ($2.575 per option) using the following
assumptions: expected life of five years, stock price of $3.95 at
date of grant, dividend yield of 0%, interest rate of 1.9%, and volatility of
81%.
Effective
September 23, 2009, grants covering 75,000 shares of common stock were issued to
an employee at an exercise price of $7.00 and a term of ten
years. The options vest over a three year period. The
grant date fair value was calculated as $331,787 ($4.423 per option) using the
following assumptions: expected life of five years, stock price of
$7.00 at date of grant, dividend yield of 0%, interest rate of 1.5%, and
volatility of 78%.
53
The
weighted average grant date fair value of options granted was $2.70 per option
during 2009 and $1.90 per option during 2008. The weighted average
grant date fair value of options vested was $2.56 per option during 2009 and
$1.78 per option during 2008.
The
following table summarizes annual activity for all stock options for each of the
three years ended December 31, 2009:
|
Number
of Shares
|
Weighted
Average Exercise Price
|
Aggregate
Intrinsic Value
|
Number
of Shares Exercisable
|
||||||||||||
|
Outstanding,
January 1, 2007
|
2,600,000 | $0.60 | $3,130,000 | 2,550,000 | |||||||||||
|
Granted
|
50,000 | $3.68 | -- | -- | |||||||||||
|
Outstanding,
December 31, 2007
|
2,650,000 | $0.65 | $10,058,500 | 2,650,000 | |||||||||||
|
Granted
|
1,320,000 | $3.54 | -- | -- | |||||||||||
|
Exercised
|
(287,000 | ) | $1.00 | $717,500 | -- | ||||||||||
|
Outstanding,
December 31, 2008
|
3,683,000 | $1.66 | $6,932,500 | 3,413,000 | |||||||||||
|
Granted
|
1,075,000 | $4.16 | -- | -- | |||||||||||
|
Exercised
|
(963,000 | ) | $1.14 | $2,901,456 | -- | ||||||||||
|
Expired
|
(50,000 | ) | $4.45 | -- | -- | ||||||||||
|
Outstanding,
December 31, 2009
|
3,745,000 | $2.48 | $32,850,250 | 3,500,000 | |||||||||||
The
following table summarizes information about outstanding stock options as of
December 31, 2009:
|
Options
Outstanding
|
Options
Exercisable
|
|||||||||||
|
Exercise
Prices
|
Number
of Shares
|
Remaining
Contractual Life (in
years)
|
Weighted
Average Exercise
Price
|
Number
Exercisable
|
Weighted Average
Exercise
Price
|
Aggregate
Intrinsic
Value
|
||||||
|
$0.25
|
1,400,000
|
4.0
|
$0.25
|
1,400,000
|
$0.25
|
$15,400,000
|
||||||
|
$3.40
|
1,000,000
|
8.2
|
$3.40
|
1,000,000
|
$3.40
|
$7,850,000
|
||||||
|
$3.74
-$4.51
|
270,000
|
8.6
|
$3.91
|
100,000
|
$3.91
|
$727,900
|
||||||
|
$3.95
|
1,000,000
|
9.3
|
$3.95
|
1,000,000
|
$3.95
|
$7,300,000
|
||||||
|
$7.00
|
75,000
|
9.7
|
$7.00
|
--
|
--
|
|||||||
|
3,745,000
|
$2.48
|
3,500,000
|
$2.20
|
$31,277,900
|
||||||||
7. Asset
Retirement Obligations
During
the year ended December 31, 2009, the Company incurred an obligation for its
El Aguila
project which
includes estimated reclamation, remediation and closure costs based on local
government requirements. The estimated present value of the
obligation is $1,991,987, all of which was charged to
operations. There were no other liability additions, liability
settlements, revision in estimated cash flows or accretion expense for the
current period.
54
8. Commitments
and Contingencies
The
Company leases office space in Denver, Colorado under an agreement that expires
in April 2010. Required payments approximate $2,500 per
month. Remaining minimum lease obligations for future calendar years
will be $10,000 in 2010. Rent expense for 2009, 2008, and 2007 was
$34,800, $29,900 and $27,000, respectively.
Effective
January 1, 2008, the Company entered into amended employment agreements
with William W. Reid, President and Chief Executive Officer, and David C. Reid,
Vice President. The employment agreements have a three year term and
increase William Reid’s base salary to $300,000 annually and increase David
Reid’s base salary to $212,000 annually. In addition, the period for
severance payments under certain circumstances was increased to 35
months. The Company also executed a formal written employment
agreement with Jason D. Reid, who will serve as Vice President of Corporate
Development for a three year term at an annual base salary of $150,000. The
employment agreements all provide that the officers are each eligible to receive
incentive compensation such as stock options or bonuses solely in the discretion
of the Board of Directors. Each officer is entitled to certain
payments in the event his employment is terminated under certain
circumstances. If the Company terminates the agreement "without
cause," or the officer terminates the agreement "with good reason," the Company
would be obligated to pay 35 months of compensation in accordance with its
regular pay periods. Termination of the employment contract by an
officer “with good reason” includes a change in control.
9. Related
Party Transactions
The
Company has certain contractual agreements with Jose Perez Reynoso, a
shareholder of the Company. Mr. Reynoso served as the general manager
of the Company’s Mexico operations on a consulting basis and was paid $162,500,
$140,000, and $113,000, for the years ended December 31, 2009, 2008, and 2007,
respectively. In addition, the Company leased three mining
concessions from Mr. Reynoso,
El Aguila
,
El Aire
, and
La Tehuana
. The
lease required advance royalty payments of $260,000, all of which have been
paid, and will require a 4% net smelter return royalty when production is sold
in the form of gold/silver doré and 5% for production sold in concentrate
form. Mr. Reynoso is also a part owner in an entity from which the
Company leased its interest in the Solaga property.
10. Subsequent
Events
On March
8, 2010 the Company completed a sale of stock pursuant to a subscription
agreement with Hochschild for 600,000 restricted shares of the Company’s common
stock at $8.62 per share for total cash proceeds of
$5,172,000.
[REMAINDER
OF PAGE INTENTIONALLY BLANK]
55
|
CHANGES
IN AND DISAGREEMENTS WITH ACCOUNTANTS ON ACCOUNTING AND FINANCIAL
DISCLOSURE
|
There
have been no changes in our accountants during the last two fiscal years, and we
have not had any disagreements with our existing accountants during that
time.
|
CONTROLS
AND PROCEDURES
|
(a) We
maintain a system of controls and procedures designed to ensure that information
required to be disclosed by us in reports that we file or submit under the
Securities Exchange Act of 1934, as amended, is recorded, processed, summarized
and reported, within time periods specified in the SEC’s rules and forms and to
ensure that information required to be disclosed by us in the reports that we
file or submit under the Securities Exchange Act of 1934, as amended, is
accumulated and communicated to our management, including our Chief Executive
Officer and Principal Financial Officer, or persons performing similar
functions, as appropriate to allow timely decisions regarding required
disclosure. As of December 31, 2009, under the supervision and with
the participation of our Chief Executive Officer and Principal Financial
Officer, management has evaluated the effectiveness of the design and operation
of our disclosure controls and procedures. Based on that evaluation,
the Chief Executive Officer and the Principal Financial Officer concluded that
our disclosure controls and procedures were effective.
(b) There
were no changes in our internal control over financial reporting during the
quarter ended December 31, 2009 that materially affected, or are reasonably
likely to materially affect, our internal controls over financial
reporting.
None.
Directors
and Executive Officers
The
following individuals serve as our officers and directors as of March 12,
2010:
|
Name
|
Age
|
Positions
With the Company
|
Board
Position
Held
Since
|
|||
|
William
W. Reid
|
61
|
President,
Chief Executive Officer and Director
|
1998
|
|||
|
David
C. Reid
|
60
|
Vice
President, Secretary, Treasurer and Director
|
1998
|
|||
|
Bill
M. Conrad
|
53
|
Director
|
2006
|
|||
|
Isac
Burstein
|
42
|
Director
|
2009
|
|||
|
Frank
L. Jennings
|
59
|
Chief
Financial Officer
|
N/A
|
|||
|
Jason
D. Reid
|
37
|
Vice
President of Corporate Development
|
N/A
|
56
Each of
our directors is serving a term which expires at the next annual meeting of
shareholders and until his successor is elected and qualified or until he
resigns or is removed. Our officers serve at the will of our Board of
Directors.
Messrs.
William and David Reid should be considered founders of our company, as each has
taken initiative in the organization of our business. William Reid
and David Reid are brothers. Jason Reid is the son of William
Reid.
The
following information summarizes the business experience of each of our officers
and directors for at least the last five years:
William W.
Reid
. William Reid has served as a director and our President
and Chief Executive Officer since our inception in 1998. Since August
2005, Mr. Reid has devoted all of his business time to our
affairs. From 1977 to August 18, 2005, he served as the president,
chief executive officer and chairman of the board of directors of US Gold
Corporation, a Colorado corporation engaged in the exploration of gold mining
properties (“US Gold”). During his tenure with US Gold, that entity
acquired, developed and produced gold from five different mines, but has not
produced any revenue since 1990. The securities of US Gold are traded
on the NYSE Amex. Our Board believes that Mr. Reid’s 38 years in the
mining business, including experience as a geologist, mine finder, mine
developer, mine financier and mine operator provide the appropriate experience
and qualifications to serve as a member of our Board. With the
exception of US Gold, Mr. Reid has not served on the boards of any other public
companies or registered investment companies in the past five
years. Mr. Reid received a Bachelor of Science in physics in 1970 and
a Master's Degree in Economic Geology in 1972 from Purdue
University.
David C.
Reid
. David Reid has served as a director and our Vice
President since our inception in 1998. Since August 2005, he has
devoted all of his time to our business and affairs. From 1977 to
August 18, 2005, he was the vice president and a director of US Gold during the
time that it acquired, developed and produced gold. Our Board
believes that David Reid's 38 years in the mining business, including
experience as a geologist, mine finder, mine developer, mine financier and mine
operator, provides him with the appropriate experience and qualifications to
serve as a member of our Board. With the exception of US Gold, Mr.
Reid has not served on the boards of any other public companies or registered
investment companies in the past five years. Mr. Reid received a
Bachelor of Science degree in geology from Ball State University in
1972.
Bill M.
Conrad
. Mr. Conrad was elected to the Board of Directors on
June 1, 2006. From May 2005 until September 2008, Mr. Conrad served
as the vice-president and secretary of Brishlin Resources, Inc., now known as
Synergy Resources Corporation, a Colorado corporation engaged in the oil and gas
industry. Mr. Conrad continues to serve as a director of Synergy
Resources, a position he has held since the company’s inception in
2005. From February 2002 until June 2005, Mr. Conrad served as
president and a director of Wyoming Oil & Minerals, Inc., and from May 2000
until April 2003, he served as vice president and a director of New Frontier
Energy, Inc. The securities of Wyoming Oil & Minerals, now known
as Sun Motor International Inc., New Frontier Energy, and Synergy Resources are
quoted on the OTC Bulletin Board. In 1990, Mr. Conrad co-founded MCM
Capital Management Inc. and has served as vice president since that time
. Our Board believes that the
management and corporate finance experience developed by Mr. Conrad over many
years serving as an executive officer and director of numerous publicly traded
companies, as well as his familiarity with relevant accounting principles and
financial statement presentation, make him well-qualified to be a director of
our company.
57
Isac
Burstein.
Isac Burstein was appointed to the Board of
Directors on April 1, 2009. Mr. Burstein is presently the Corporate
Manager of Business Development for Hochschild Mining Plc. Prior to
his current position, Mr. Burstein served Hochschild in various capacities,
including as Manager for Project Evaluation, Exploration Manager for Mexico from
July 2000 to May 2009 and Exploration Geologist from January 1996 to July
2000. Mr. Burstein was nominated as a director by Hochschild and
appointed to the Board pursuant to the terms of our strategic alliance agreement
with Hochschild. The Board believes that Mr. Burstein’s geological
and mining background and his experience in various management positions with
Hochschild provide him with the requisite skills and necessary understanding of
our industry to serve as a member of our Board of Directors. Mr.
Burstein has not served on the board of directors of any other public companies
during the past five years. He holds a BSc in Geological Engineering
from the Universidad Nacional de Ingenieria, an MSc in Geology from the
University of Missouri and an MBA from Krannert School of Management, Purdue
University.
Frank L.
Jennings
. Mr. Jennings was appointed to serve as our principal
financial officer on June 1, 2006. He is primarily responsible for
financial reporting of our company and with our CEO, oversight of our internal
controls. Mr. Jennings serves our company on a part-time basis as his
services are deemed necessary. Since 2001, Mr. Jennings has been a
financial consultant and provides management and financial consulting services
primarily to smaller public companies. From April 2001 to December
2005, he served as the chief financial officer and a director of Global Casinos,
Inc., a publicly traded Utah corporation, and from April 2001 to April 2005, he
served as the chief financial officer and a director of OnSource Corporation,
now known as Ceragenix Pharmaceuticals, Inc., a publicly traded Delaware
corporation. During his tenure with Global Casinos and Ceragenix
Pharmaceuticals, each company was engaged in the gaming industry and each had
common stock quoted on the OTC Bulletin Board. Mr. Jennings received
a Bachelor’s degree in economics from Austin College and an MBA degree in
Finance from Indiana University.
Jason D. Reid
. Mr.
Reid was promoted to Vice President of Corporate Development effective January
2, 2008. He is responsible for formulating corporate growth
strategies, retail and institutional promotion of our company, assisting the CEO
with oversight of our financing requirements and overseeing our investor
relations programs. Mr. Reid joined our company in May 2006 as the
Corporate Development Assistant. Mr. Reid received a Bachelor of
Science degree in Anthropology with an emphasis on Archaeology in 1995 from Fort
Lewis College. From January 1996 until he joined our company in May
2006, Mr. Reid served as president of Reid Farrier, Inc., formerly known as Reid
Fencing, Inc., a business he founded which focused operations in the equine and
construction industries.
Other
Significant Employees or Consultants
In
addition to our officers and directors, we also utilize the services of the
following significant consultant:
Jorge Luis Sanchez Del
Toro
. In August 2008, Mr. Sanchez, a Mexican national,
accepted a position with our Mexican subsidiary, Golden Trump Resources, to
serve as the Project Manager for the
El Aguila
Project. Mr. Sanchez has over 33 years of experience in the mining
industry and is responsible for overseeing the entire
El Aguila
Project, including
our labor relations and construction progress. From 2001 until he
joined our company, Mr. Sanchez was the general manager for Ingenieria Y
Trituracion, a company that consulted with various companies regarding open pit
and underground mining operations and crushing plants. Mr. Sanchez
graduated from the University of Autonoma of Mexico with a degree in mining
engineering in 1975.
Section
16(a) Beneficial Ownership Reporting Compliance
We are
not registered under the Securities Exchange Act of 1934, as amended, and are
not subject to the reporting requirements of Section 16(a).
58
Code
of Ethics
In 2009,
we adopted a written Code of Ethics that applies to our executive officers,
directors and employees. A copy of the Code of Ethics is filed as an
exhibit to this report.
Changes
in Procedures by which Security Holders May Recommend Nominees to the
Board
There
have been no changes to the procedures by which a security holder may recommend
a nominee to the Board. The Board will consider, but is not bound by,
shareholder recommendations and is not required to nominate such individuals for
positions on the Board. Any security holder who wishes to recommend a
prospective director nominee should do so in writing by sending a letter to the
Board of Directors. The letter should be signed, dated and include
the name and address of the security holder making the recommendation,
information to enable the Board to verify that the security holder was the
holder of record or beneficial owner of the company's securities as of the date
of the letter, and the name, address and resume of the potential
nominee. Specific minimum qualifications for directors and director
nominees which the Board believes must be met in order to be so considered
include, but are not limited to, management experience, exemplary personal
integrity and reputation, sound judgment, and sufficient time to devote to the
discharge of his or her duties.
Audit
Committee
The Audit
Committee, comprised of Bill Conrad as chairman, Isac Burstein and William Reid,
recommends the selection and appointment of our independent registered public
accounting firm to the Board of Directors and reviews the proposed scope,
content and results of the audit performed by the accountants and any reports
and recommendations made by them. Messrs. Conrad and Burstein meet
the definition of “independent” as defined in Rule 5605 of the NYSE Amex LLC
Rules (“Amex Rules”). William Reid, who also serves as our Chairman
and Chief Executive Officer, is not considered independent under the Amex
Rules.
Our Board
of Directors has determined that Bill Conrad, the chairman of the Audit
Committee, qualifies as an audit committee financial expert in that he has (i)
an understanding of generally accepted accounting principles and financial
statements; (ii) the ability to assess the general application of such
principles in connection with the accounting for estimates, accruals and
reserves; (iii) experience preparing, auditing, analyzing or evaluating
financial statements that present a breadth and level of complexity of
accounting issues that are generally comparable to the breadth and complexity of
issues that can reasonably be expected to be raised by our financial statements,
or experience actively supervising one or more persons engaged in such
activities; (iv) an understanding of internal controls over financial reporting;
and (v) an understanding of the audit committee functions. Mr. Conrad
acquired these attributes through experience in analyzing financial statements
of companies, and through his experience as an executive officer of other
publicly traded companies.
Compensation
Discussion and Analysis
The
individuals who served as our principal executive officer and principal
financial officer during the year ended December 31, 2009, as well as the other
individuals included on the Summary Compensation Table below, are referred to as
“named executive officers” throughout this Compensation Discussion and
Analysis.
59
Overview of Compensation Philosophy,
Objectives and Policies
. We attempted to meet two main
objectives when we designed our executive and employee
compensation. First, the program is intended to be fully competitive
so that we may attract, motivate and retain talented executives and key
employees. Second, the program is intended to create an alignment of
interests between our executives and key employees, on the one hand, and our
shareholders, on the other, such that a portion of each executive’s or key
employee’s compensation consists of equity awards. In this manner, if
the price of our stock increases over time, our executive officers, key
employees and our shareholders will benefit. The compensation program
is designed to reward performance that supports our principles of building
shareholder value, and may also recognize individual performance from time to
time. The Compensation Committee is vested with the authority to
review and recommend the compensation program structure and level of
compensation for the executive officers, directors and key employees of our
company.
Our
present compensation structure for the named executive officers generally
consists of salary and incentive compensation. The incentive
component consists of a short-term cash portion and a long-term equity
portion. We believe the present structure achieves our compensation
objectives; however, the Compensation Committee is presently exploring
additional ways to ensure consistency and enhance our company’s compensation
program and may add additional components or policies in order to assist our
company in achieving its compensation goals more effectively or
efficiently. We believe that the present compensation structure
appropriately aligns the interests of the executives and key employees with our
shareholders by encouraging equity ownership through awards of stock options and
stock grants to executive officers and key employees and to motivate our named
executive officers and other key employees to contribute to an increase in
shareholder value. While equity ownership is highly encouraged, we do
not presently have a policy that requires our named executive officers or
directors to own shares of our stock.
Each
January, the Compensation Committee reviews and recommends to the Board the
level of compensation for the named executive officers and key
employees. Our Chief Executive Officer reports to the Committee
regarding the individual performance of the other named executive
officers. Additionally, the Committee considers recommendations from
the named executive officers regarding incentive compensation for key employees
who report to that executive officer.
Elements and Mix of
Compensation
. Our consideration of base salary ranges for the
named executive officers is primarily based upon a review of publicly disclosed
compensation information of companies we believe are in our peer
group. The Committee also takes into account work experience,
performance, level of responsibility, impact on the business, tenure and
potential for advancement within the organization when making decisions about
individual compensation packages. Annual salaries for newly-hired
executives are determined at the time of hire taking into account the above
factors other than tenure.
Cash
bonuses are a form of short-term incentive compensation which may be recommended
by the Compensation Committee in its discretion, based on individual and overall
company performance. There is no specific bonus plan or policy in
place setting forth timing of awards or establishing specific performance
objectives. The Compensation Committee, in its discretion, determines
and recommends the amounts and timing of any bonus awards. If
applicable and in the sole discretion of the Committee, a “merit-based” bonus
may be recommended based on criteria such as exceptional performance, assuming
additional responsibility without an increase in base compensation, or such
other criteria which the Committee may determine from time to time.
60
The
long-term equity compensation component of our compensation program is comprised
of equity awards and makes up a significant part of our named executive
officers’ compensation package. Under our Non-Qualified Stock Option
and Stock Grant Plan (“Plan”), we are authorized to issue non-qualified stock
options, to make grants of stock and award grants of restricted stock to the
officers, directors and key employees of our company, including the named
executive officers. There is no specific policy or procedure in place
setting forth timing or amount of awards, although the outstanding awards and
future compensation are reviewed at least annually. The Compensation
Committee, in its discretion, determines and recommends the amounts and timing
of any equity awards. The stock options are priced based on the
closing market price of our common stock on the grant date, which is the date
the Board approves the award. Due to our status as an exploration
stage company with no revenue, and our need to conserve working capital, we
believe our compensation structure is weighted more toward equity compensation
and less toward salary and other forms of cash compensation, with the exception
of our current Chief Financial Officer, who we contract with on an hourly basis
and who does not receive equity compensation.
Additional
benefits provided to executive officers and key employees as part of their
compensation packages include health, life and disability
insurance. To the extent the named executive officers participate in
these programs, they do so generally on the same basis as our other
employees. Our named executive officers do not receive perquisites
and we do not maintain any non-equity incentive plans or deferred compensation
plans.
The
compensation for our directors is structured similar to that of our named
executive officers. Specifically, the directors receive a combination
of cash and equity incentives in the form of stock grants or options to purchase
our common stock. The Compensation Committee reviews the form and
amount of such compensation periodically to insure that it is competitive and
meeting our objectives discussed above.
Specific Compensation
Decisions.
Each of our named executive officers except our
Chief Financial Officer receives an annual salary under their terms of his
respective employment agreements. In addition, each of our named
executive officers except our Chief Financial Officer has received stock options
as part of their current compensation package.
In 2008,
our Compensation Committee recommended that we increase the base salaries of our
President and Chief Executive Officer and our Vice Presidents to remain
competitive with our peer group. As a result of this decision,
William Reid’s base salary increased from $240,000 to $300,000, David Reid’s
base salary increased from $170,000 to $212,000 and Jason Reid’s base salary
increased from $100,000 to $150,000. This was due primarily to a
sizeable increase in their responsibilities and workload due to the acceleration
of our commercial production timetable. The Compensation Committee
considered these increased demands and recommended we further compensate these
individuals with cash bonuses and equity compensation in the form of stock
options. The base salaries of the named executive officers (except
our Chief Financial Officer) are fixed pursuant to employment agreements with
the individuals and remained unchanged in 2009. No cash bonuses were
awarded during 2009.
On April
23, 2009, the Board approved the Compensation Committee’s recommendation of
additional equity compensation to the named executive officers in response to
the individuals’ efforts, as well as to further motivate them to increase
shareholder value. William Reid received 300,000 stock options, David
Reid received 250,000 stock options and Jason Reid received 200,000 stock
options. All of the 2009 awards consisted of non-qualified stock
options which vested immediately and expire 10 years from the date of
grant.
We
believe that these compensation packages, consisting of cash and equity
incentive compensation, will meet the objectives set forth
above. Specifically, we believe that the cash salary is competitive
and will serve to retain the individuals for the foreseeable
future. The stock options are designed to reward the individuals and
the inherent value in the options will help motivate him to further the
interests of our shareholders. The Compensation Committee also has
the ability to award discretionary cash incentive compensation in the form of
bonuses to the named executive officers.
61
Executive
Compensation
The
following table summarizes the total compensation of our named executive
officers for the three fiscal years ended December 31, 2009:
2009
Summary Compensation Table
|
Name and
Principal Position
|
Year
|
Salary
|
Bonus
|
Stock
Awards
|
Option
Awards
(2)
|
Non-Equity
Incentive
Plan
Compensation
|
All
Other
Compensation
|
Total
|
||||||||||||||||||||||
|
William
W. Reid,
|
2009
|
$ | 300,000 | $ | — | $ | — | $ | 772,551 | $ | — | $ | — | $ | 1,072,551 | |||||||||||||||
|
Chairman,
CEO
|
2008
|
300,000 | 100,000 | — | 450,848 | — | — | 850,848 | ||||||||||||||||||||||
|
and
President
(1)
|
2007
|
240,000 | 150,000 | — | — | — | — | 390,000 | ||||||||||||||||||||||
|
Frank
L. Jennings,
|
2009
|
$ | — | $ | — | $ | — | $ | — | $ | — | $ | 115,117 | $ | 115,117 | |||||||||||||||
|
CFO
|
2008
|
— | — | — | — | — | 82,256 | 82,256 | ||||||||||||||||||||||
|
2007
|
— | — | — | — | — | 49,185 | 49,185 | |||||||||||||||||||||||
|
David
C. Reid,
|
2009
|
$ | 212,000 | $ | — | $ | — | $ | 643,793 | $ | — | $ | — | $ | 855,793 | |||||||||||||||
|
Vice
President and
|
2008
|
212,000 | 100,000 | — | 450,848 | — | — | 762,848 | ||||||||||||||||||||||
|
Director
(1)
|
2007
|
170,000 | 100,000 | — | — | — | — | 270,000 | ||||||||||||||||||||||
|
Jason
D. Reid
|
2009
|
$ | 150,000 | $ | — | $ | — | $ | 515,034 | $ | — | $ | — | $ | 665,034 | |||||||||||||||
|
Vice
President,
|
2008
|
150,000 | 100,000 | — | 721,357 | — | — | 971,357 | ||||||||||||||||||||||
|
Corp.
Develop.
|
2007
|
100,000 | 75,000 | — | — | — | — | 175,000 | ||||||||||||||||||||||
|
|
___________________
|
|
(1)
|
The
executive officer did not receive additional compensation for his service
as a director of our company.
|
|
(2)
|
Valued
using the Black-Scholes-Merton option pricing model. All
of the options awarded in 2009 and 2008 vested
immediately. Please refer to Note 6 of the consolidated
financial statements dated December 31, 2009, 2008 and 2007 included
herein for certain assumptions made in connection with these
estimates.
|
Effective
January 1, 2008, in light of our progress to that date and the additional
workload required as a result of our company’s construction and financing
activities, we amended our employment agreements with Messrs. William and David
Reid, and memorialized our employment arrangement with Jason Reid into a written
agreement. Each employment agreement is effective for a three-year
term. Pursuant to the terms of the agreements, William Reid is
entitled to an annual salary of $300,000, David Reid is entitled to an annual
salary of $212,000 and Jason Reid is entitled to an annual salary of $150,000.
Each individual
also participates in health and other insurance programs that we
maintain. The employment agreements are automatically renewable for
one-year terms on each successive anniversary of the expiration date unless
either party gives notice to the other that they do not wish to renew the
agreement, not less than 120 days prior to expiration.
Pursuant
to the terms of the employment agreements, the employee would be entitled to
certain payments in the event their employment is terminated under certain
circumstances. If we terminate the agreement without cause, or if the
executive officer terminates the agreement “with good reason,” we would be
obligated to pay thirty-five months’ of compensation in accordance with our
regular pay schedule. Termination by an executive officer with good
reason includes a “change in control.”
In 2008
and 2007, each of our executive officers was awarded a cash bonus. No
cash bonuses were awarded in 2009. We do not maintain a bonus plan
and the awards were granted at the discretion of the Board of
Directors. The Compensation Committee of the Board recommended that
bonuses were merited primarily because each officer made a significant
individual contribution in an effort to advance our property toward production
and to secure the requisite funding. The awards for each of Messrs.
William and David Reid were approved by the disinterested members of the
Board.
62
On April
23, 2009, we granted non-qualified stock options to each of our executive
officers in accordance with our Plan. William Reid received 300,000
options, David Reid received 250,000 options and Jason Reid received 200,000
options to purchase shares of our common stock for $3.95 per
share. All of the 2009 awards vested immediately and expire 10 years
from the date of grant. Non-qualified stock options were also awarded
to our executive officers on February 22, 2008. William and David
Reid each received 250,000 options and Jason Reid received 400,000 options to
purchase shares of our common stock for $3.40 per share. Those
options also vested immediately and expire 10 years from the date of
grant. The value of these awards, determined using the
Black-Scholes-Merton option pricing model, is included in each officer’s total
compensation as set forth in the table above.
In
addition to our executive officers, we engage Frank Jennings, our financial
consultant, who is paid on an hourly basis. We do not have a written
agreement with Mr. Jennings.
2009
Grants of Plan-Based Awards
We do not
maintain a non-equity incentive plan, thus those columns are omitted from the
table below. The grants of plan-based equity awards under our Plan to
each named executive officer during the year ended December 31, 2009 are as
follows:
|
Name
|
Grant
Date
|
Estimated
Future Payouts
Under
Equity Incentive
Plan
Awards
|
All
Other
Stock
Awards:
Number
of
Shares
of
Stocks
or
Units
|
All
Other
Option
Awards:
Number
of
Securities
Underlying
Options
|
Exercise
or
Base
Price
of
Option
Awards
|
Grant
Date
Fair
Value
of
Stock
and
Option
Awards(2)
|
||||||||||
|
Threshold(1)
|
Target
|
Maximum
|
||||||||||||||
|
(#)
|
(#)
|
(#)
|
(#)
|
(#)
|
($/sh)
|
($)
|
||||||||||
|
William
W. Reid
|
4/23/2009
|
300,000
|
300,000
|
—
|
—
|
—
|
3.95
|
772,551
|
||||||||
|
David
C. Reid
|
4/23/2009
|
250,000
|
250,000
|
—
|
—
|
—
|
3.95
|
643,793
|
||||||||
|
Jason
D. Reid
|
4/23/2009
|
200,000
|
200,000
|
—
|
—
|
—
|
3.95
|
515,034
|
||||||||
___________________
|
(1)
|
All
of the options granted in 2009 vested
immediately.
|
|
(2)
|
Calculated
using the Black-Scholes-Merton option pricing model based on the maximum
number of options that may vest under the award. Please see
Note 6 to the consolidated financial statements dated
December 31, 2009, 2008 and 2007 included herein for a description of
certain assumptions made in connection with the valuation of these option
awards.
|
As
discussed above, each named executive officer was awarded stock options during
2009 to purchase shares of our common stock for $3.95 per share. The
options vested immediately and expire 10 years from the date of
grant.
63
Outstanding
Equity Awards at 2009 Fiscal Year-End
The
following table summarizes the amount of our executive officers' equity-based
compensation outstanding at the fiscal year ended December 31,
2009:
|
Option
Awards
|
Stock
Awards
|
|||||||||||||||||
|
Name
|
Number
of Securities Underlying Unexercised Options Exercisable
(1)
|
Number
of Securities Underlying Unexercised Options
Unexercisable
|
Equity
Incentive Plan Awards: Number of Securities Underlying Unexercised
Unearned Options
|
Option
Exercise Price
|
Option
Expiration Date
|
Number
of
Shares
or
Units
of
Stock
That
Have
Not
Vested
|
Market
Value
of
Shares
Or
Units That Have Not Vested
|
Equity
Incentive Plan Awards: Number of Unearned Shares, Units or Other Rights
That Have Not Vested
|
Equity
Incentive Plan Awards: Market or Payout Value of Unearned Shares, Units or
Other Rights That Have Not Vested
|
|||||||||
|
(#)
|
(#)
|
(#)
|
($)
|
(#)
|
(#)
|
(#)
|
($)
|
|||||||||||
|
William
W. Reid
|
400,000
|
0
|
0
|
0.25
|
10/9/2013
|
—
|
—
|
—
|
—
|
|||||||||
|
William
W. Reid
|
400,000
|
0
|
0
|
0.25
|
4/22/2014
|
—
|
—
|
—
|
—
|
|||||||||
|
William
W. Reid
|
250,000
|
0
|
0
|
3.40
|
2/22/2018
|
—
|
—
|
—
|
—
|
|||||||||
|
William
W. Reid
|
300,000
|
0
|
0
|
3.95
|
4/23/2019
|
—
|
—
|
—
|
—
|
|||||||||
|
David
C. Reid
|
400,000
|
0
|
0
|
0.25
|
10/9/2013
|
—
|
—
|
—
|
—
|
|||||||||
|
David
C. Reid
|
200,000
|
0
|
0
|
0.25
|
4/22/2014
|
—
|
—
|
—
|
—
|
|||||||||
|
David
C. Reid
|
250,000
|
0
|
0
|
3.40
|
2/22/2018
|
—
|
—
|
—
|
—
|
|||||||||
|
David
C. Reid
|
250,000
|
0
|
0
|
3.95
|
4/23/2019
|
—
|
—
|
—
|
—
|
|||||||||
|
Jason
D. Reid
|
400,000
|
0
|
0
|
3.40
|
2/22/2018
|
—
|
—
|
—
|
—
|
|||||||||
|
Jason
D. Reid
|
200,000
|
0
|
0
|
3.95
|
4/23/2019
|
—
|
—
|
—
|
—
|
|||||||||
|
|
___________________
|
|
(1)
|
The
options vested immediately as of the date of
grant.
|
In 2003,
William and David Reid each received a stock option award of 400,000 options to
purchase shares of common stock for $0.25 per share. The options
vested immediately and expire 10 years from the date of grant. In
2004, William Reid received a stock option award of 400,000 additional options
and David Reid received a stock option award of 200,000 additional options to
purchase common stock for $0.25 per share. Each option award vested
immediately and expires 10 years from the date of grant. Messrs.
William and David Reid have not exercised any of these options.
On May
30, 2006, Jason Reid was granted 600,000 options to purchase our common stock
for $1.00 per share prior to March 3, 2009 upon accepting employment as
Corporate Development Assistant. The options vested
immediately. Jason Reid exercised 87,000 options during 2008 and the
remainder of these options in 2009.
On
February 22, 2008, we granted stock options to each of our executive
officers. William and David Reid each received 250,000 options and
Jason Reid received 400,000 options to purchase shares of our common stock for
$3.40 per share. The options vested immediately and expire 10 years
from the date of grant. These options were given as additional compensation to
these individuals in recognition of their efforts to build value for the
company.
On April
23, 2009, we granted stock options to each executive officer. William
Reid received 300,000 options, David Reid received 250,000 options and Jason
Reid received 200,000 options to purchase shares of our common stock for $3.95
per share. All of the 2009 awards consisted of non-qualified stock
options which vested immediately and expire 10 years from the date of
grant.
64
2009
Option Exercises and Stock Vested
The
following table summarizes the option exercises by and stock awards vested for
the benefit of the named executive officers during the fiscal year ended
December 31, 2009:
|
Name
|
Option
Awards
|
Stock
Awards
|
||||||
|
Number
of Shares Acquired on Exercise
|
Value
Realized
on Exercise
|
Number
of Shares Acquired on Vesting
|
Value
Realized
on Vesting
|
|||||
|
(#)
|
($)
|
(#)
|
($)
|
|||||
|
Jason
D. Reid
|
513,000
|
1,796,956
|
—
|
—
|
||||
2009
Director Compensation
In June
2006, we retained Bill Conrad to serve on our Board of Directors. At
the time of his appointment, Mr. Conrad received a stock grant of 100,000 shares
of unrestricted common stock valued at $1.00 per share and options to acquire up
to 500,000 shares of stock exercisable on or before March 3, 2009 for $1.00 per
share, all of which immediately vested. Mr. Conrad exercised 100,000
options during 2008 and exercised the remaining options in 2009. In
April 2009, Isac Burstein was appointed to our Board. In connection
with his appointment, we granted 100,000 options to Mr. Burstein to purchase
shares of our common stock for $3.95 per share. The options were
immediately vested and expire 10 years from the grant date.
We pay
our directors who are not also one of our executive officers a monthly cash
retainer fee. Mr. Conrad receives $5,000 per month and Mr. Burstein
receives $3,000 per month. On April 23, 2009, we also granted to Mr.
Conrad 150,000 stock options to purchase shares of our common stock for $3.95
per share. The options vested immediately and expire 10 years from
the date of grant. This option was awarded to Mr. Conrad in
recognition of his significant contribution to building value for the
company. No cash bonuses were awarded to our directors during
2009.
The table
below summarizes the compensation of our directors who are not also one of our
executive officers and whose compensation is not disclosed in the Summary
Compensation Table, for the fiscal year ended December 31, 2009:
|
Name
|
Fees
Earned or Paid
in
Cash
|
Stock
Awards
|
Option Awards
(1)
|
Non-Equity
Incentive Plan Compensation
|
All
Other
Compensation
|
Total
|
||||||||||||||||||
|
Bill
M. Conrad
|
$ | 60,000 | $ | — | $ | 386,276 | $ | — | $ | — | $ | 446,276 | ||||||||||||
|
Isac
Burstein
|
27,000 | — | 257,517 | — | — | 284,517 | ||||||||||||||||||
|
|
___________________
|
|
(1)
|
Valued
using the Black-Scholes-Merton option pricing model. Please
refer to Note 6 to the consolidated financial statements dated
December 31, 2009, 2008 and 2007 included herein for certain
assumptions made in connection with these
estimates.
|
All
directors are reimbursed for reasonable and necessary expenses incurred in their
capacities as such.
|
SECURITY
OWNERSHIP OF CERTAIN BENEFICIAL OWNERS AND MANAGEMENT AND RELATED
STOCKHOLDER MATTERS
|
As of
March 12, 2010, there are a total of 48,700,284 shares of our common stock
outstanding, our only class of voting securities currently
outstanding. The following table describes the ownership of our
voting securities by: (i) each of our officers and directors; (ii) all of our
officers and directors as a group; and (iii) each shareholder known to us to own
beneficially more than 5% of our common stock. Unless otherwise
stated, the address of each of the individuals is our address, 222 Milwaukee
Street, Suite 301, Denver, Colorado 80206. All ownership is direct,
unless otherwise stated.
65
In
calculating the percentage ownership for each shareholder, we assumed that any
options owned by an individual exercisable within 60 days is exercised, but not
the options owned by any other individual. Certain information
regarding the ownership of shareholders believed to beneficially own more than
5% of our common stock has been obtained from reports filed by these
shareholders with the SEC.
|
Shares
Beneficially Owned
|
||||||||
|
Name and Address of Beneficial
Owner
|
Number
|
Percentage (%)
|
||||||
|
William
W. Reid
(1)
|
4,565,352 | (4)(5) | 9.1 | % | ||||
|
David
C. Reid
(1)
|
4,548,694 | (6) | 9.1 | % | ||||
|
Bill
M. Conrad
(2)
|
462,360 | (7) | * | |||||
|
Isac
Burstein
(2)
Calle
La Colonia 180
Surco,
Lima 33, Peru
|
100,000 | (8) | * | |||||
|
Frank
Jennings
(3)
|
0 | * | ||||||
|
Jason
Reid
(3)
|
1,031,152 | (9)(10) | 2.1 | % | ||||
|
Beth
Reid
|
4,565,352 | (11) | 9.1 | % | ||||
|
Tocqueville
Asset Management, L.P.
40
West 57th Street, 19th Floor
New
York, NY 10019
|
3,698,980 | 7.6 | % | |||||
|
Hochschild
Mining Holdings Limited
Calle
La Colonia 180
Surco,
Lima 33, Peru
|
13,995,295 | 28.7 | % | |||||
|
All
officers and directors as a group (6 persons)
|
10,707,558 | (4)(5)(6)(7)(8)(9)(10) | 20.6 | % | ||||
___________________
|
*
|
Less
than 1%
|
|
(1)
|
Officer
and director.
|
|
(2)
|
Director.
|
|
(3)
|
Officer.
|
|
(4)
|
Includes
options to purchase 1,350,000 shares which are currently
exercisable.
|
|
(5)
|
Includes
1,039,486 shares owned by the reporting person's spouse, of which he
disclaims beneficial ownership.
|
|
(6)
|
Includes
options to purchase 1,100,000 shares which are currently
exercisable.
|
|
(7)
|
Includes
options to purchase 250,000 shares which are currently
exercisable.
|
|
(8)
|
Includes
options to purchase 100,000 shares which are currently
exercisable.
|
|
(9)
|
Includes
options to purchase 600,000 shares which are currently
exercisable.
|
|
(10)
|
Includes
112,102 shares owned by the reporting person's spouse, of which he
disclaims beneficial ownership.
|
|
(11)
|
Includes
2,175,866 shares and 1,350,000 shares underlying options owned by the
reporting person's spouse, of which she disclaims beneficial
ownership.
|
Equity
Incentive Plan
Our
Non-Qualified Stock Option and Stock Grant Plan (also as referred to as the
“Plan”) was adopted by us effective March 4, 1999. The Plan, as
amended, terminates by its terms on February 28, 2019. Under the
Plan, as approved by shareholders on March 4, 2005, a total of 6,000,000 shares
of common stock are reserved for issuance thereunder. Set forth below
is information as of December 31, 2009 with respect to compensation plans
(including individual compensation arrangements) under which our equity
securities are authorized for issuance.
66
Non-Qualified
Stock Option and Stock Grant Plan Information
|
Plan Category
|
Number of
securities to be
issued upon
exercise of
outstanding
options, warrants
and rights
(a)
|
Weighted-
average exercise
price of
outstanding
options,
warrants and
rights
(b)
|
Number of
securities remaining
available for future
issuance under
equity compensation
plans (excluding
securities reflected
in column (a))
(c)
|
||||||||
|
Equity
compensation plans approved by shareholders
|
3,745,000 | $2.40 | 755,000 | ||||||||
|
Equity
compensation plans not approved by shareholders
|
0 | 0 | |||||||||
|
TOTAL
|
3,745,000 | 755,000 | |||||||||
Under the
Plan, non-qualified stock options and/or grants of our common stock may be
issued to key persons. Key persons include officers, directors,
employees, consultants and others providing service to us. The Plan
was established to advance the interests of our company and our stockholders by
affording key persons, upon whose judgment, initiative and efforts we may rely
for the successful conduct of our businesses, an opportunity for investment in
our company and the incentive advantages inherent in stock ownership in our
company. This Plan gives our Board of Directors broad authority to
grant options and make stock grants to key persons selected by the Board while
considering criteria such as employment position or other relationship with us,
duties and responsibilities, ability, productivity, length of service or
association, morale, interest in us, recommendations by supervisors, and other
matters, and to set the option price, term of option, and other broad
authorities. Options may not be granted at less than the fair market
value at the date of grant and may not have a term in excess of 10
years.
Options
granted under the Plan do not generally give rise to taxable income to the
recipient or any tax consequence to us, since the Plan requires that the options
be issued at a price not less than the fair market value of the common stock on
the date of grant. However, when an option is exercised, the holder
is subject to tax on the difference between the exercise price of the option and
the fair market value of the stock on the date of exercise. We
receive a corresponding deduction for income tax purposes. Recipients
of stock grants are subject to tax on the fair market value of the stock on the
date of grant and we receive a corresponding deduction. The foregoing
is intended as a summary of the income tax consequences to an individual
recipient of an option or stock grant, and should not be construed as tax
advice. Holders of stock options or common stock should consult their
own tax advisors.
Shares
issued upon exercise of options or upon stock grants under the Plan are
"restricted securities" as defined under the Securities Act unless a
registration statement covering such shares is effective. Restricted
shares cannot be freely sold and must be sold pursuant to an exemption from
registration (such as Rule 144) which exemptions typically impose conditions on
the sale of the shares.
|
|
Changes
in Control
|
We
entered into a Strategic Alliance Agreement with Hochschild, a significant
shareholder of our company, in 2008. We also agreed to appoint up to
two nominees of Hochschild to our Board of Directors, depending upon its level
of ownership. Hochschild has certain rights of first refusal to
participate in future financing transactions, and after the expiration in
February 2011 of a standstill provision which prevents Hochschild from acquiring
more than 40% of our common stock through purchases in the market or directly
from us, Hochschild may acquire additional shares of our common stock, which may
result in a change in control of our company.
67
|
CERTAIN
RELATIONSHIPS AND RELATED TRANSACTIONS, AND DIRECTOR
INDEPENDENCE
|
Certain
Relationships and Related Transactions
None.
Director
Independence
Bill
Conrad and Isac Burstein are the members of our Board of Directors who are
“independent” under the definition set forth in Rule 5605 of the Amex
Rules. William Reid, our chief executive officer, is a member of the
Audit Committee and the Nominating Committee, and does not meet the independence
standards for committee members set forth in the Amex Rules. David
Reid, our executive vice president, is a member of the Nominating Committee and
Compensation Committee, and does not meet the independence standards for
committee members set forth in the Amex Rules.
|
PRINCIPAL
ACCOUNTING FEES AND SERVICES
|
The
following table sets forth fees paid to (or accrued to) our principal accounting
firm of Stark Winter Schenkein & Co., LLP for the two years ended
December 31, 2009:
|
2009
|
2008
|
|||||||
|
Audit
Fees
|
$ | 33,000 | $ | 31,750 | ||||
|
Audit
Related Fees
|
18,550 | 6,030 | ||||||
|
Tax
Fees
|
5,520 | 6,900 | ||||||
|
All
Other Fees
|
— | — | ||||||
|
Total
Fees
|
$ | 57,070 | $ | 44,680 | ||||
It is the
policy of the Audit Committee to engage the principal accounting firm selected
to conduct the financial audit for our company and to confirm, prior to such
engagement, that such principal accounting firm is independent of our
company. All services of the independent registered accounting firm
reflected above were approved by the Audit Committee.
68
The
following exhibits are filed with or incorporated by referenced in this
report:
|
Item No.
|
Description
|
|
3.1
|
Articles
of Incorporation of the Company as filed with the Colorado Secretary of
State on August 24, 1998 (incorporated by reference from our registration
statement on Form SB-2 filed on October 28, 2005, Exhibit 3.1, File No.
333-129321).
|
|
3.1.1
|
Articles
of Amendment to the Articles of Incorporation as filed with the Colorado
Secretary of State on September 16, 2005 (incorporated by reference from
our registration statement on Form SB-2 filed on October 28, 2005, Exhibit
3.1.1, File No. 333-129321).
|
|
3.2
|
Bylaws
of the Company dated August 28, 1998 (incorporated by reference from our
registration statement on Form SB-2 filed on October 28, 2005, Exhibit
3.2, File No. 333-129321).
|
|
4
|
Specimen
stock certificate (incorporated by reference from our amended registration
statement on Form SB-2/A filed on March 27, 2006, Exhibit 4, File No.
333-129321).
|
|
10.1
|
Exploitation
and Exploration Agreement between the Company and Jose Perez Reynoso dated
October 14, 2002 (incorporated by reference from our registration
statement on Form SB-2 filed on October 28, 2005, Exhibit 10.1, File No.
333-129321).
|
|
10.2
|
Non-Qualified
Stock Option and Stock Grant Plan (incorporated by reference from our
registration statement on Form SB-2 filed on October 28, 2005, Exhibit
10.2, File No. 333-129321).
|
|
10.3
|
Form
of Stock Option Agreement (incorporated by reference from our registration
statement on Form SB-2 filed on October 28, 2005, Exhibit 10.3, File No.
333-129321).
|
|
10.4
|
Employment
Agreement between the Company and William W. Reid (incorporated by
reference from our amended registration statement on Form SB-2/A filed on
March 27, 2006, Exhibit 10.8, File No. 333-129321).
|
|
10.5
|
Employment
Agreement between the Company and David C. Reid (incorporated by reference
from our amended registration statement on Form SB-2/A filed on March 27,
2006, Exhibit 10.9, File No. 333-129321).
|
|
10.6
|
Form
of Subscription Agreement between the Company and investors in the
December 2007 private placement (incorporated by reference from our report
on Form 8-K dated December 5, 2007, Exhibit 10.1, File No.
333-129321).
|
|
10.7
|
Amended
Employment Agreement between the Company and William W. Reid (incorporated
by reference from our report on Form 10-Q filed on November 19,2008,
Exhibit 10.1, File No. 333-129321).
|
69
|
10.8
|
Amended
Employment Agreement between the Company and David C. Reid (incorporated
by reference from our report on Form 10-Q filed on November 19,2008,
Exhibit 10.2, File No. 333-129321).
|
|
10.9
|
Employment
Agreement between the Company and Jason D. Reid (incorporated by reference
from our report on Form 10-Q filed on November 19,2008, Exhibit 10.3, File
No. 333-129321).
|
|
10.10
|
Strategic
Alliance Agreement between the Company and Hochschild Mining Holdings
Limited (incorporated by reference from our report on Form 8-K dated
December 5, 2008, Exhibit 10.1, File No. 333-129321).
|
|
10.11
|
Subscription
Agreement between the Company and Hochschild Mining Holdings Limited dated
December 5, 2008 (incorporated by reference from our report on Form 8-K
dated December 5, 2008, Exhibit 10.2, File No. 333-129321).
|
|
10.12
|
Subscription
Agreement between the Company and Hochschild Mining Holdings Limited dated
February 25, 2009 (incorporated by reference from our report on Form 8-K
dated February 25, 2009, Exhibit 10.2, File No. 333-129321).
|
|
10.13
|
Subscription
Agreement between the Company and Hochschild Mining Holdings Limited dated
June 30, 2009 (incorporated by reference from our report on Form 8-K dated
July 6, 2009, Exhibit 10.1, File No. 333-129321).
|
|
10.14
|
Subscription
Agreement between the Company and Hochschild Mining Holdings Limited dated
December 17, 2009 (incorporated by reference from our report on Form 8-K
dated December 23, 2009, Exhibit 10.1, File No. 333-129321).
|
|
10.15
|
Subscription
Agreement between the Company and Hochschild Mining Holdings Limited dated
March 8, 2010 (incorporated by reference from our report on Form 8-K dated
March 10, 2010, Exhibit 10.1, File No. 333-129321).
|
| 14 * |
|
|
21
|
Subsidiaries
of the Company (incorporated by reference from our amended registration
statement on Form SB-2/A filed on January 20, 2006, Exhibit 21, File No.
333-129321).
|
| 23.1 * |
|
|
|
|
|
|
|
|
|
* filed
herewith
70
In
accordance with Section 13 or 15(d) of the Exchange Act of 1934, the registrant
caused this report to be signed on its behalf by the undersigned, thereunto duly
authorized.
|
GOLD
RESOURCE CORPORATION
|
|
|
/s/
William W. Reid
|
|
|
Dated:
March 15, 2010
|
By:
William W. Reid, Chairman of the Board, President and Chief Executive
Officer
|
In
accordance with the Exchange Act, this Report has been signed below by the
following persons on behalf of the Company and in the capacities and on the
dates indicated.
|
/s/
William W. Reid
|
Chairman
of the Board,
President
and
Principal
Executive Officer
|
March
15, 2010
|
|
|
William
W. Reid
|
|
||
|
|
|||
|
/s/
Frank L. Jennings
|
Principal
Financial
Officer
and Principal
Accounting
Officer
|
March
15, 2010
|
|
|
Frank
L. Jennings
|
|
||
|
|
|||
|
/s/
Isac Burstein
|
Director
|
March
15, 2010
|
|
|
Isac
Burstein
|
|||
|
/s/
Bill M. Conrad
|
Director
|
March
15, 2010
|
|
|
Bill
M. Conrad
|
|||
71
EXHIBIT
INDEX
|
Item No.
|
Description
|
|
3.1
|
Articles
of Incorporation of the Company as filed with the Colorado Secretary of
State on August 24, 1998 (incorporated by reference from our registration
statement on Form SB-2 filed on October 28, 2005, Exhibit 3.1, File No.
333-129321).
|
|
3.1.1
|
Articles
of Amendment to the Articles of Incorporation as filed with the Colorado
Secretary of State on September 16, 2005 (incorporated by reference from
our registration statement on Form SB-2 filed on October 28, 2005, Exhibit
3.1.1, File No. 333-129321).
|
|
3.2
|
Bylaws
of the Company dated August 28, 1998 (incorporated by reference from our
registration statement on Form SB-2 filed on October 28, 2005, Exhibit
3.2, File No. 333-129321).
|
|
4
|
Specimen
stock certificate (incorporated by reference from our amended registration
statement on Form SB-2/A filed on March 27, 2006, Exhibit 4, File No.
333-129321).
|
|
10.1
|
Exploitation
and Exploration Agreement between the Company and Jose Perez Reynoso dated
October 14, 2002 (incorporated by reference from our registration
statement on Form SB-2 filed on October 28, 2005, Exhibit 10.1, File No.
333-129321).
|
|
10.2
|
Non-Qualified
Stock Option and Stock Grant Plan (incorporated by reference from our
registration statement on Form SB-2 filed on October 28, 2005, Exhibit
10.2, File No. 333-129321).
|
|
10.3
|
Form
of Stock Option Agreement (incorporated by reference from our registration
statement on Form SB-2 filed on October 28, 2005, Exhibit 10.3, File No.
333-129321).
|
|
10.4
|
Employment
Agreement between the Company and William W. Reid (incorporated by
reference from our amended registration statement on Form SB-2/A filed on
March 27, 2006, Exhibit 10.8, File No. 333-129321).
|
|
10.5
|
Employment
Agreement between the Company and David C. Reid (incorporated by reference
from our amended registration statement on Form SB-2/A filed on March 27,
2006, Exhibit 10.9, File No. 333-129321).
|
|
10.6
|
Form
of Subscription Agreement between the Company and investors in the
December 2007 private placement (incorporated by reference from our report
on Form 8-K dated December 5, 2007, Exhibit 10.1, File No.
333-129321).
|
|
10.7
|
Amended
Employment Agreement between the Company and William W. Reid (incorporated
by reference from our report on Form 10-Q filed on November 19,2008,
Exhibit 10.1, File No. 333-129321).
|
72
|
10.8
|
Amended
Employment Agreement between the Company and David C. Reid (incorporated
by reference from our report on Form 10-Q filed on November 19,2008,
Exhibit 10.2, File No. 333-129321).
|
|
10.9
|
Employment
Agreement between the Company and Jason D. Reid (incorporated by reference
from our report on Form 10-Q filed on November 19,2008, Exhibit 10.3, File
No. 333-129321).
|
|
10.10
|
Strategic
Alliance Agreement between the Company and Hochschild Mining Holdings
Limited (incorporated by reference from our report on Form 8-K dated
December 5, 2008, Exhibit 10.1, File No. 333-129321).
|
|
10.11
|
Subscription
Agreement between the Company and Hochschild Mining Holdings Limited dated
December 5, 2008 (incorporated by reference from our report on Form 8-K
dated December 5, 2008, Exhibit 10.2, File No. 333-129321).
|
|
10.12
|
Subscription
Agreement between the Company and Hochschild Mining Holdings Limited dated
February 25, 2009 (incorporated by reference from our report on Form 8-K
dated February 25, 2009, Exhibit 10.2, File No. 333-129321).
|
|
10.13
|
Subscription
Agreement between the Company and Hochschild Mining Holdings Limited dated
June 30, 2009 (incorporated by reference from our report on Form 8-K dated
July 6, 2009, Exhibit 10.1, File No. 333-129321).
|
|
10.14
|
Subscription
Agreement between the Company and Hochschild Mining Holdings Limited dated
December 17, 2009 (incorporated by reference from our report on Form 8-K
dated December 23, 2009, Exhibit 10.1, File No. 333-129321).
|
|
10.15
|
Subscription
Agreement between the Company and Hochschild Mining Holdings Limited dated
March 8, 2010 (incorporated by reference from our report on Form 8-K dated
March 10, 2010, Exhibit 10.1, File No. 333-129321).
|
| 14 * |
|
|
21
|
Subsidiaries
of the Company (incorporated by reference from our amended registration
statement on Form SB-2/A filed on January 20, 2006, Exhibit 21, File No.
333-129321).
|
| 23.1 * |
|
|
|
|
|
|
|
|
|
* filed
herewith
73
TABLE OF CONTENTS
Part IItem 1. BusinessItem 2. PropertiesItem 7. Management's Discussion and Analysis Of Financial Condition and Results Of OperationItem 1A. Risk FactorsItem 12. Security Ownership Of Certain Beneficial Owners and Management and Related Stockholder MattersItem 1B . Unresolved Staff CommentsItem 2 . PropertiesItem 3 . Legal ProceedingsItem 4. ReservedPart IIItem 5. Market For Common Equity, Related Stockholder Matters and Purchases Of Equity SecuritiesItem 6. Selected Financial DataItem 7. Management S Discussion and Analysis Of Financial Condition and Results Of OperationsItem 7A. Quantitative and Qualitative Disclosures About Market RiskItem 8. Financial Statements and Supplementary DataItem 9. Changes in and Disagreements with Accountants on Accounting and Financial DisclosureItem 9A. Controls and ProceduresItem 9B. Other InformationPart IIIItem 10. Directors, Executive Officers and Corporate GovernanceItem 11. Executive and Director CompensationItem 13. Certain Relationships and Related Transactions, and Director IndependenceItem 14. Principal Accounting Fees and ServicesPart IVItem 15. Exhibits, Financial Statement SchedulesItem No. Description