GENUINE PARTS CO
10-Ks and 10-Qs
|
|
|
|
|
|
|
|
|
|
|
|
|
|
|
|
|
|
|
|
|
|
|
|
|
|
|
|
|
|
|
|
|
|
|
|
|
|
|
|
|
|
|
|
|
|
|
|
|
|
|
|
|
|
|
|
UNITED STATES SECURITIES AND EXCHANGE COMMISSION
Washington, D.C. 20549
Form 10-K
|
|
þ
|
ANNUAL REPORT PURSUANT TO SECTION 13 OR 15(d) OF THE SECURITIES EXCHANGE ACT OF 1934
|
For the fiscal year ended
December 31, 2018
Or
|
|
¨
|
TRANSITION REPORT PURSUANT TO SECTION 13 OR 15(d) OF THE SECURITIES EXCHANGE ACT OF 1934
|
For the transition period from to
Commission file number: 1-5690
GENUINE PARTS COMPANY
(Exact name of registrant as specified in its charter)
|
Georgia
|
|
58-0254510
|
|
(State or other jurisdiction of
incorporation or organization)
|
|
(I.R.S. Employer
Identification No.)
|
|
2999 Wildwood Parkway, Atlanta, Georgia
|
|
30339
|
|
(Address of principal executive offices)
|
|
(Zip Code)
|
678-934-5000
(Registrant’s telephone number, including area code)
Securities registered pursuant to Section 12(b) of the Act:
|
Title of Each Class
|
|
Name of Each Exchange on Which Registered
|
|
Common Stock, $1 par value per share
|
|
New York Stock Exchange
|
Securities registered pursuant to Section 12(g) of the Act:
None
Indicate by check mark if the registrant is a well-known seasoned issuer, as defined in Rule 405 of the Securities Act. Yes
þ
No
¨
Indicate by check mark if the registrant is not required to file reports pursuant to Section 13 or Section 15(d) of the Exchange Act. Yes
¨
No
þ
Indicate by check mark whether the registrant (1) has filed all reports required to be filed by Section 13 or 15(d) of the Securities Exchange Act of 1934 during the preceding 12 months (or for such shorter period that the registrant was required to file such reports), and (2) has been subject to such filing requirements for the past 90 days. Yes
þ
No
¨
Indicate by check mark whether the registrant has submitted electronically every Interactive Data File required to be submitted pursuant to Rule 405 of Regulation S-T during the preceding 12 months (or for such shorter period that the registrant was required to submit such files). Yes
þ
No
¨
Indicate by check mark if disclosure of delinquent filers pursuant to Item 405 of Regulation S-K is not contained herein, and will not be contained, to the best of registrant’s knowledge, in definitive proxy or information statements incorporated by reference in Part III of this Form 10-K or any amendment to this Form 10-K.
¨
Indicate by check mark whether the registrant is a large accelerated filer, an accelerated filer, a non-accelerated filer, or a smaller reporting company. See the definitions of “large accelerated filer,” “accelerated filer,” “smaller reporting company” and "emerging growth company" in Rule 12b-2 of the Exchange Act.
|
Large accelerated filer
þ
|
|
Accelerated filer
o
|
|
Non-accelerated filer
o
|
|
Smaller reporting company
o
|
Emerging growth company
o
|
|||
If an emerging growth company, indicate by check mark if the registrant has elected not to use the extended transition period for complying with any new or revised financial accounting standards provided pursuant to Section 13(a) of the Exchange Act.
¨
Indicate by check mark whether the registrant is a shell company (as defined in Rule 12b-2 of the Exchange Act). Yes
¨
No
þ
As of June 30, 2018, the aggregate market value of the registrant’s common stock held by non-affiliates of the registrant was approximately
$12,685,700,000
based on the closing sale price as reported on the New York Stock Exchange.
Indicate the number of shares outstanding of each of the issuer’s classes of common stock, as of the latest practicable date.
|
Class
|
|
Outstanding at February 13, 2019
|
|
Common Stock, $1 par value per share
|
|
145,943,765 shares
|
Specifically identified portions of the Company’s definitive Proxy Statement for the Annual Meeting of Shareholders to be held on April 22, 2019 are incorporated by reference into Part III of this Form 10-K.
|
Table of Contents
|
||
|
Page
|
||
|
|
|
|
|
|
|
|
|
|
|
|
|
|
|
|
|
|
|
|
|
|
|
|
|
|
|
|
PART I.
ITEM 1
.
BUSINESS.
Genuine Parts Company, a Georgia corporation incorporated on May 7, 1928, is a leading service organization engaged in the distribution of automotive replacement parts, industrial parts and materials, and business products, each described in more detail below. In 2018, business was conducted from more than 3,100 locations throughout North America, Europe, Australia and New Zealand ("Australasia") via an offering of best in class operating and distribution efficiencies, industry leading coverage of consumable/replacement parts, outstanding just-in-time service and enhanced technology solutions. At December 31, 2018, the Company employed approximately 50,000 people worldwide.
As used in this report, the “Company” refers to Genuine Parts Company and its subsidiaries, except as otherwise indicated by the context; and the terms “automotive parts” and “industrial parts” refer to replacement parts in each respective category.
For financial information regarding segments as well as our geographic areas of operation, refer to Note 14, Segment Data, of Notes to Consolidated Financial Statements beginning on page F-1.
The Company’s website can be found at www.genpt.com. The Company makes available, free of charge through its website, access to the Company’s Annual Reports on Form 10-K, quarterly reports on Form 10-Q, current reports on Form 8-K, proxy statements and other reports, and any amendments to these documents, as soon as reasonably practicable after such material is filed with or furnished to the Securities and Exchange Commission (“SEC”). Additionally, our corporate governance guidelines, codes of conduct and ethics, and charters of the Audit Committee and the Compensation, Nominating and Governance Committee of our Board of Directors, as well as information regarding our procedure for shareholders and other interested parties to communicate with our Board of Directors, are available on our website.
In Part III of this Form 10-K, we incorporate certain information by reference to our proxy statement for our 2019 annual meeting of shareholders. We expect to file that proxy statement with the SEC on or about March 5, 2019, and we will make it available online at the same time at http://www.proxydocs.com/gpc. Please refer to the proxy statement for the information incorporated by reference into Part III of this Form 10-K when it is available.
AUTOMOTIVE PARTS GROUP
The Automotive Parts Group, the largest segment of the Company, distributes automotive parts and accessory items in the United States ("U.S."), Canada, Mexico, Europe and Australasia. The Automotive Parts Group offers complete inventory, cataloging, marketing, training and other programs to the automotive aftermarket in each of these regions to distinguish itself from the competition.
During
2018
, the Company’s Automotive Parts Group included NAPA automotive parts distribution centers and automotive parts stores (“auto parts stores” or “NAPA AUTO PARTS stores”) owned and operated in the U.S. by the Company; NAPA and Traction automotive parts distribution centers and auto parts stores in the U.S. and Canada owned and operated by the Company and NAPA Canada/UAP Inc. (“NAPA Canada/UAP”), a wholly-owned subsidiary of the Company; auto parts stores and distribution centers in the U.S. operated by corporations in which the Company owned either a noncontrolling or controlling interest; auto parts stores in Canada operated by corporations in which NAPA Canada/UAP owns a 50% interest; Repco and other automotive parts distribution centers, branches and auto parts stores in Australia and New Zealand owned and operated by GPC Asia Pacific, a wholly-owned subsidiary of the Company; automotive parts distribution centers and auto parts stores in Europe, owned and operated by Alliance Automotive Group (“AAG”), a wholly-owned subsidiary of the Company; an import automotive parts distribution center in the U.S. owned by the Company and operated by its Altrom America division; import automotive parts distribution centers in Canada owned and operated by Altrom Canada Corporation (“Altrom Canada”), a wholly-owned subsidiary of the Company; distribution centers in the U.S. owned by Balkamp, Inc. (“Balkamp”), a wholly-owned subsidiary of the Company; distribution facilities in the U.S. owned by the Company and operated by its Rayloc division; automotive parts distribution centers and auto parts stores in Mexico, owned and operated by Grupo Auto Todo, S.A. de C.V. (“Auto Todo”), a wholly-owned subsidiary of the Company; and an automotive parts distribution center and auto parts stores in Mexico, owned and operated by Autopartes NAPA Mexico ("NAPA Mexico"), a wholly-owned subsidiary of the Company.
The Company’s automotive parts distribution centers distribute replacement parts (other than body parts) for substantially all motor vehicle makes and models in service in the U.S., including imported vehicles, trucks, SUVs, buses, motorcycles, recreational vehicles and farm vehicles. In addition, the Company distributes replacement parts for small engines, farm equipment and heavy duty equipment. The Company’s inventories also include accessory items for such vehicles and equipment, and supply items used by a wide variety of customers in the automotive aftermarket, such as repair shops, service stations, fleet operators, automobile and truck dealers, leasing companies, bus and truck lines, mass merchandisers, farms, industrial concerns and individuals who perform their own maintenance and parts installation.
2
The Company's automotive parts network was expanded in
2018
via the acquisition of various store groups and automotive operations in North America, Europe and Australasia.
In the U.S., the Company added two store groups, the Asia Pacific business made one acquisition and the NAPA Canada/UAP business added three store groups. Collectively, the new store groups and acquired automotive operations in the U.S., Australasia and Canada are expected to generate annual revenues of approximately $35 million.
AAG added 14 acquisitions to their automotive operations in 2018, including three in France and 11 in the United Kingdom ("U.K."). These acquisitions include the addition of several small tuck-in businesses and two larger ones. Platinum International Group ("Platinum"), headquartered in Manchester, England, is a leading value-added battery distributor in the automotive, industrial, and leisure markets, and operates nine U.K. locations and one Netherlands location. In addition, AAG expanded its footprint into Scotland with the acquisition of TMS Motor Spares ("TMS"). TMS, which is headquartered in Carlisle, England, is a leading automotive parts distributor and operates 17 locations in Scotland and seven in England. In total, AAG's acquisitions in 2018 are expected to generate annual revenues of approximately $150 million.
The Company has a 15% interest in Mitchell Repair Information Corporation (“MRIC”), a subsidiary of Snap-on Incorporated. MRIC is a leading automotive diagnostic and repair information company that links North American subscribers to its services and information databases. MRIC’s core product, “Mitchell ON-DEMAND,” is a premier electronic repair information source in the automotive aftermarket.
Distribution System
.
In
2018
, the Company operated 57 domestic NAPA automotive parts distribution centers located in 40 states and approximately 1,100 domestic company-owned NAPA AUTO PARTS stores located in 46 states. The Company also operated domestically two TW Distribution heavy duty parts distribution centers which serve 23 company-owned and four independently owned Traction Heavy Duty parts stores located in eight states. The Traction operations are discussed further below in Related Operations. At
December 31, 2018
, the Company had either a noncontrolling, controlling or other interest in 8 corporations, which operated approximately 226 auto parts stores in 14 states. The Company’s domestic automotive operations have access to approximately 534,000 different parts and related supply items. These items are purchased from more than 100 different suppliers, with approximately 49% of 2018 automotive parts inventories purchased from 10 major suppliers. Since 1931, the Company's domestic operations have had return privileges with most of its suppliers, which have protected the Company from inventory obsolescence.
The Company’s domestic distribution centers serve approximately 4,800 independently owned NAPA AUTO PARTS stores located throughout the U.S. NAPA AUTO PARTS stores, in turn, sell to a wide variety of customers in the automotive aftermarket. Collectively, sales to these independent automotive parts stores account for approximately 59% of the Company’s total U.S. Automotive sales and 20% of the Company’s total sales.
NAPA Canada/UAP, founded in 1926, is a leader in the distribution and marketing of replacement parts and accessories for automobiles and trucks and is also a significant supplier to the mining and forestry industries in Canada. NAPA Canada/UAP operates a network of nine NAPA automotive parts distribution centers, three heavy duty parts distribution centers and one fabrication/remanufacturing facility supplying 588 NAPA stores and 116 Traction wholesalers. The NAPA stores and Traction wholesalers in Canada include 199 company-owned stores, 11 joint ventures and 21 progressive owners in which NAPA Canada/UAP owns a 50% interest and 473 independently owned stores. NAPA and Traction operations supply bannered installers and independent installers in all provinces of Canada, as well as networks of service stations and repair shops operating under the banners of national accounts. NAPA Canada/UAP is a licensee of the NAPA
®
name in Canada.
In Canada, Altrom Canada operates two import automotive parts distribution centers and 26 branches. In the U.S., Altrom America operates one import automotive parts distribution center and eight branches.
In Australia and New Zealand, GPC Asia Pacific, originally established in 1922, is a leading distributor of automotive replacement parts and accessories. GPC Asia Pacific operates 12 distribution centers, 475 auto parts stores, primarily under the Repco banner, and 87 locations associated with the Ashdown Ingram, Motospecs, AMX/McLeod and RDA Brakes operations.
In Mexico, Auto Todo owns and operates 11 distribution centers, one auto parts store and one tire center. NAPA Mexico owns and operates one distribution center and serves 16 company-owned and 26 independently-owned auto parts stores. Auto Todo and NAPA Mexico are licensees of the NAPA
®
name in Mexico.
AAG, founded in 1989, is a leading European distributor of vehicle parts, tools, and workshop equipment with its primary operations in four countries in Europe. In France, AAG operates 15 distribution centers and serves 1,060 stores, of which 225 are company-owned, under the banners GROUPAUTO France, Precisium Group, Partner's, and GEF Auto. In the U.K., AAG operates 35 distribution centers (with one of these in the Netherlands) and serves 810 stores, of which 196 are company-owned, under the banners GROUPAUTO UK & Ireland and UAN. In Germany, AAG operates nine distribution centers and 29 company-owned stores under the banner Alliance Automotive Group Germany. In Poland, AAG serves 210 affiliated outlets under the banner GROUPAUTO Polska.
3
Products
.
The Company’s automotive distribution network provides access to hundreds of thousands of different parts and related supply items. Each item is cataloged and numbered for identification and accessibility. Significant inventories are carried to provide for fast and frequent deliveries to customers. The majority of orders are filled and shipped the same day they are received. The Company does not manufacture any of the products it distributes. The majority of products are distributed in North America under the NAPA
®
name, a mark licensed to the Company by NAPA, which is important to the sales and marketing of these products. Traction sales also include products distributed under the HD Plus name, a proprietary line of automotive parts for the heavy duty truck market. In Australasia and Europe, products are distributed under several brand names, including many of the national brands.
Related Operations
.
The Company's North American automotive business is supported by several operations that form its Automotive Supply Group. Balkamp, a wholly-owned subsidiary of the Company, distributes a wide variety of replacement parts and accessory items for passenger cars, heavy-duty vehicles, motorcycles and farm equipment. In addition, Balkamp distributes service items such as testing equipment, lubricating equipment, gauges, cleaning supplies, chemicals and supply items used by repair shops, fleets, farms and institutions. Balkamp packages many of the 42,000 products, which constitute the “Balkamp” line of products that are distributed through the NAPA system. These products are categorized into over 238 different product categories purchased from approximately 500 domestic suppliers and over 100 foreign manufacturers. Balkamp operates from four locations that provide the NAPA system with over 1,300 SKUs of oils and chemicals. BALKAMP
®
, a federally registered trademark, is important to the sales and marketing promotions of the Balkamp organization.
The Company's Rayloc division operates four facilities focused on providing cost effective, quality service in engineering, cataloging, global sourcing, and distribution. With over 10,000 part numbers, including brake pads, brake drums, chassis, and bearings, Rayloc delivers products through a nationwide distribution network of four transfer and shipping facilities. Products are distributed through the NAPA system under the NAPA
®
brand name. Rayloc
®
is a mark licensed to the Company by NAPA.
Finally, the Company’s Heavy Vehicle Parts Group operates as TW Distribution, with two heavy vehicle automotive parts distribution centers and 27 Traction Heavy Duty parts stores in the U.S. This group distributes heavy vehicle parts through the NAPA system and direct to small and large fleet owners and operators.
Service to NAPA AUTO PARTS Stores
.
The Company believes that the quality and the range of services provided to its North American automotive parts customers constitute a significant advantage for its automotive parts distribution system. Such services include fast and frequent delivery, parts cataloging (including the use of electronic NAPA AUTO PARTS catalogs) and stock adjustment through a continuing parts classification system which, as initiated by the Company from time to time, allows independent retailers (“jobbers”) to return certain merchandise on a scheduled basis. The Company offers its NAPA AUTO PARTS store customers various management aids, marketing aids and service on topics such as inventory control, cost analysis, accounting procedures, group insurance and retirement benefit plans, as well as marketing conferences and seminars, sales and advertising manuals and training programs.
The Company has developed and refined an inventory classification system to determine optimum distribution center and auto parts store inventory levels for automotive parts stocking based on automotive registrations, usage rates, production statistics, technological advances, including predictive analytics, and other similar factors. This system, which undergoes continuous analytical review, is an integral part of the Company’s inventory control procedures and comprises an important feature of the inventory management services that the Company makes available to its NAPA AUTO PARTS store customers. Over the last 25 years, losses to the Company from obsolescence have been insignificant and the Company attributes this to the successful operation of its classification system, which involves product return privileges with most of its suppliers.
NAPA
.
The Company is the sole member of the National Automotive Parts Association, LLC a voluntary association formed in 1925 to promote the distribution of automotive parts for its members. NAPA, which neither buys nor sells automotive parts, functions as a trade association whose sole member in 2018 owned and operated 57 distribution centers located throughout the U.S. NAPA develops marketing concepts and programs that may be used by its members which, at
December 31, 2018
, includes only the Company. It is not involved in the chain of distribution.
Among the automotive products purchased by the Company from various manufacturers for distribution are certain lines designated, cataloged, advertised and promoted as “NAPA” lines. Generally, the Company is not required to purchase any specific quantity of parts so designated and it may, and does, purchase competitive lines from the same as well as other supply sources.
The Company uses the federally registered trademark NAPA
®
as part of the trade name of its distribution centers and parts stores. The Company funds NAPA’s national advertising program, which is designed to increase public recognition of the NAPA name and to promote NAPA product lines.
The Company is a party, together with the former members of NAPA, to a consent decree entered by the Federal District Court in Detroit, Michigan, on May 4, 1954. The consent decree enjoins certain practices under the federal antitrust laws, including the use of exclusive agreements with manufacturers of automotive parts, allocation or division of territories among the Company and former NAPA members, fixing of prices or terms of sale for such parts among such members, and agreements to adhere to
4
any uniform policy in selecting parts customers or determining the number and location of, or arrangements with, auto parts customers.
Competition
.
The automotive parts distribution business is highly competitive. The Company competes with automobile manufacturers (some of which sell replacement parts for vehicles built by other manufacturers as well as those that they build themselves), automobile dealers, warehouse clubs and large automotive parts retail chains. In addition, the Company competes with the distributing outlets of parts manufacturers, oil companies, mass merchandisers (including national retail chains), and with other parts distributors and retailers, including online retailers. The Automotive Parts Group competes primarily on product offering, service, brand recognition and price. Further information regarding competition in the industry is set forth in “Item 1A. Risk Factors — We face substantial competition in the industries in which we do business.”
INDUSTRIAL PARTS GROUP
The Industrial Parts Group is operated as Motion Industries, Inc. (“Motion”), a wholly-owned subsidiary of the Company headquartered in Birmingham, Alabama. Motion distributes industrial replacement parts and related supplies such as bearings, mechanical and electrical power transmission products, industrial automation, hose, hydraulic and pneumatic components, industrial and safety supplies and material handling products to MRO (maintenance, repair and operation) and OEM (original equipment manufacturer) customers throughout the U.S., Canada and Mexico. Effective January 1, 2018, EIS, Inc. (“EIS”), a wholly-owned subsidiary of the Company, became the Electrical Specialties Group of Motion and is therefore included in the Industrial Parts Group.
In Canada, industrial parts are distributed by Motion Industries (Canada), Inc. (“Motion Canada”). The Mexican market is served by Motion Mexico S de RL de CV (“Motion Mexico”).
In
2018
, the Industrial Parts Group served approximately 200,000 customers in all types of industries located throughout North America, including the equipment and machinery, food and beverage, forest products, primary metals, pulp and paper, mining, automotive, oil and gas, petrochemical and pharmaceutical industries; as well as strategically targeted specialty industries such as power generation, alternative energy, government, transportation, ports, and others. Motion services all manufacturing and processing industries with access to a database of 7.6 million parts. Additionally, Motion provides U.S. government agencies access to approximately 365,000 products and replacement parts through a Government Services Administration (GSA) schedule. The Industrial Parts Group, through its Electrical Specialties Group, also distributes materials to more than 20,000 electrical and electronic manufacturers, as well as to industrial assembly and specialty wire and cable markets in North America. This division distributes over 110,000 items including wire, cable and connectivity solutions, insulating and conductive materials, assembly tools and test equipment.
In 2018, the Company expanded its industrial operations with two tuck-in acquisitions as well as the purchase of Hydraulic Supply Company ("HSC"). HSC, based in Sunrise, Florida, is a leading full-service fluid power distributor with a broad product offering of hydraulic, pneumatic and industrial components and systems. HSC operates one distribution center and 30 branches primarily in the southeastern U.S. In total, the Company's three industrial acquisitions in 2018 are expected to generate annual revenues of approximately $100 million.
The Company also continues to maintain its 35% investment in Inenco Group ("Inenco"). Inenco, headquartered in Sydney, Australia, is a leading distributor of industrial replacement parts and accessories in Australasia, with current annual revenues of approximately $400 million and a network of 174 locations across Australia, New Zealand and Asia. In accordance with the purchase agreement signed in 2017, the Company has an option to acquire the remaining 65% interest in Inenco at a later date, contingent upon Inenco meeting certain financial conditions. In 2018, the Company accounted for this investment under the equity method of accounting.
The Industrial Parts Group provides customers with supply chain efficiencies achieved through the Company’s On-Site Solutions offering. This service provides inventory management, asset repair and tracking, vendor managed inventory commonly referred to as VMI, as well as radio frequency identification, or RFID, asset management of the customer’s inventory. Motion’s Energy Services Team routinely performs in-plant surveys and assessments, helping customers reduce their energy consumption and finding opportunities for improved sustainability, ultimately helping customers operate more profitably. Motion also provides a wide range of services and repairs such as: gearbox and fluid power assembly repair, process pump assembly and repair, hydraulic drive shaft repair, electrical panel assembly and repair, hose and gasket manufacture and assembly, as well as many other value-added services. A highly developed supply chain with vendor partnerships and connectivity are enhanced by Motion’s leading e-business capabilities, such as MiSupplierConnect, which provides integration between the Company’s information technology network and suppliers’ systems, creating numerous benefits for both the supplier and customer. These services and supply chain efficiencies assist Motion in providing the cost savings that many of its customers require and expect.
Distribution System
.
In North America, the Industrial Parts Group operated 559 branches, 15 distribution centers, 42 service centers and four fabrication facilities as of
December 31, 2018
. The distribution centers stock and distribute more than 140,000 different items purchased from more than 950 different suppliers. The service centers provide hydraulic, hose and mechanical repairs for customers. The fabrication facilities operated as part of the Electrical Specialities Group and provide custom fabricated
5
part and specialty coated materials to customers. Approximately 35% of total industrial product purchases in
2018
were made from 10 major suppliers. Sales are generated from the Industrial Parts Group’s facilities located in 49 states, Puerto Rico, nine provinces in Canada, Mexico and the Dominican Republic.
Most branches have warehouse facilities that stock significant amounts of inventory representative of the products used by customers in the respective market areas served.
Products
.
The Industrial Parts Group distributes a wide variety of parts and products to its customers, which are primarily industrial concerns. Products include such items as hoses, belts, bearings, pulleys, pumps, valves, chains, gears, sprockets, speed reducers, electric motors, industrial supplies, magnet wire, conductive materials, electrical wire and cable, cable assemblies, insulating and shielding materials, assembly tools, test equipment, adhesives and chemicals, pressure sensitive tapes, solder, anti-static products, thermal management products and coated films. In recent years, Motion expanded its offering to include systems and automation products in response to the increasing sophistication of motion control and process automation for full systems integration of plant equipment. Partnering with its strategic suppliers, Motion has expanded into energy-efficient product markets, focusing on product offerings such as energy-efficient motors and drives and recyclable and environmentally friendly parts and supplies. The nature of Motion's business demands the maintenance of adequate inventories and the ability to promptly meet demanding delivery requirements. Virtually all of the products distributed are installed by the customer or used in plant and facility maintenance activities. Most orders are filled immediately from existing stock and deliveries are normally made within 24 hours of receipt of order. The majority of all sales are on open account. Motion has ongoing purchase agreements with many of its national account customers which, collectively, represent approximately 50% of the annual sales volume.
Supply Agreements
.
Non-exclusive distributor agreements are in effect with most of the Industrial Parts Group’s suppliers. The terms of these agreements vary; however, it has been the experience of the Industrial Parts Group that the custom of the trade is to treat such agreements as continuing until breached by one party or until terminated by mutual consent. The Industrial Parts Group has certain return privileges with its suppliers, which helps protect the Company from inventory obsolescence. The Electrical Specialties Group maintains integrated supply programs as part of the marketing strategy to provide its customers, and in particular its national account customers, the opportunity to participate in this low-cost, high-service capability. This group has developed Advanced Inventory Management Solutions ("AIMS"), a totally integrated, highly automated suite of solutions for inventory management. Finally, its integrated supply offering also includes AIMS Dispense, an electronic vending dispenser used to eliminate costly tool cribs and in-house stores at customer warehouse facilities.
Competition
.
The industrial parts distribution business is highly competitive and fragmented. The Industrial Parts Group competes with other distributors specializing in the distribution of such items, general line distributors and others who provide similar services. To a lesser extent, the Industrial Parts Group competes with manufacturers that sell directly to the customer. The Industrial Parts Group competes primarily on the breadth of product offerings, service and price. Further information regarding competition in the industry is set forth in “Item 1A. Risk Factors — We face substantial competition in the industries in which we do business.”
BUSINESS PRODUCTS GROUP
The Business Products Group, operated through S.P. Richards Company (“S.P. Richards” or "SPR"), is a wholly-owned subsidiary of the Company headquartered in Atlanta, Georgia. S.P. Richards is engaged in the wholesale distribution of a broad line of office and other business related products through a diverse customer base of resellers. These products are used in businesses, schools, offices, and other institutions. Business products fall into the general categories of office furniture, technology products, general office, school supplies, cleaning, janitorial and breakroom supplies, safety and security items, healthcare products and disposable food service products.
The Business Products Group is represented in Canada through S.P. Richards Canada, a wholly-owned subsidiary of the Company headquartered near Toronto, Ontario. S.P. Richards Canada services office product resellers throughout Canada from locations in Vancouver, Toronto, Calgary and Edmonton.
Distribution System
.
The Business Products Group distributes more than 98,000 items to over 9,700 resellers and distributors throughout the U.S. and Canada from a network of 52 distribution centers. In addition, the group has an electronic, non-stock ordering system that can seamlessly deliver thousands of additional SKUs to customers in a timely fashion. This group’s network of strategically located distribution centers provides overnight delivery of the Company’s comprehensive product offering. Approximately 45% of the Company’s total office products purchases in
2018
were made from 10 major suppliers.
The Business Products Group sells to a wide variety of resellers. These resellers include independently owned office product dealers, national office product superstores and mass merchants, large contract stationers, mail order companies, internet resellers, college bookstores, military base stores, office furniture dealers, value-add technology resellers, business machine dealers, janitorial and sanitation supply distributors, safety product resellers and food service distributors. Resellers are offered comprehensive marketing programs, which include print and electronic catalogs, flyers, digital content and email campaigns for reseller websites, as well as an array of education and training resources. In addition, world-class market analytics programs are made available to qualified resellers.
6
Products
.
The Business Products Group distributes technology products and consumer electronics including storage media, printer supplies, tablets and computer accessories, calculators, shredders, laminators, copiers, printers, fitness trackers and digital cameras; office furniture including desks, credenzas, chairs, adjustable height desks, chair mats, office suites, panel systems, file, mobile and storage cabinets and computer workstations; office supplies including desk accessories, accounting supplies, binders, filing supplies, report covers, writing instruments, envelopes, note pads, business forms, copy paper, mailroom and shipping supplies, drafting and audiovisual supplies; school and educational products including bulletin boards, teaching aids and art supplies; healthcare products including first aid supplies, gloves, exam room supplies and furnishings, cleaners and waste containers; janitorial and cleaning supplies; safety supplies; disposable food service products; and breakroom supplies including napkins, utensils, snacks and beverages. S.P. Richards, including S.P. Richards Canada, has return privileges with most of its suppliers, which have protected the Company from inventory obsolescence.
While the Company’s inventory includes products from nearly 850 of the industry’s leading manufacturers worldwide, S.P. Richards also markets products under a number of proprietary brand names. These brands include: Business Source
®
, a line of value priced, high volume office products; Compucessory
®
, a line of computer accessories; Lorell
®
, a line of office furniture; NatureSaver
®
, an offering of recycled products; Elite Image
®
, a line of remanufactured toner cartridges, premium papers and labels; Integra
™
, a line of writing instruments; Genuine Joe
®
, a line of cleaning and breakroom products; Sparco™, a targeted line to add depth to key office supply categories. Through the Company’s FurnitureAdvantage
™
program, S.P. Richards provides resellers with an additional 16,000 furniture items made available to consumers in seven to ten business days.
The Company’s Impact Products, The Safety Zone and Garland C. Norris businesses also offer an additional series of proprietary brands including ProGuard
®
, ProMax
®
, Lighthouse
®
and The Safety Zone
®
, products that are janitorial and sanitation based, as well as solution-specific.
Competition
.
The business products distribution business is highly competitive. In the distribution of its product offering to resellers, S.P. Richards competes with many other wholesale distributors, as well as with certain manufacturers of office products. S.P. Richards competes primarily on product offerings, service, marketing programs, brand recognition and price. Further information regarding competition in the industry is set forth in “Item 1A. Risk Factors — we face substantial competition in the industries in which we do business.”
ITEM 1A
.
RISK FACTORS
.
FORWARD-LOOKING STATEMENTS
Some statements in this report, as well as in other materials we file with the SEC or otherwise release to the public and in materials that we make available on our website, constitute forward-looking statements that are subject to the safe harbor provisions of the Private Securities Litigation Reform Act of 1995. Senior officers may also make verbal statements to analysts, investors, the media and others that are forward-looking. Forward-looking statements may relate, for example, to future operations, including the anticipated synergies and benefits of any acquisitions, as well as prospects, strategies, financial condition, economic performance (including growth and earnings), industry conditions and demand for our products and services. The Company cautions that its forward-looking statements involve risks and uncertainties, and while we believe that our expectations for the future are reasonable in view of currently available information, you are cautioned not to place undue reliance on our forward-looking statements. Actual results or events may differ materially from those indicated in our forward-looking statements as a result of various important factors. Such factors include, but are not limited to, those discussed below.
Forward-looking statements are only as of the date they are made, and the Company undertakes no duty to update its forward-looking statements except as required by law. You are advised, however, to review any further disclosures we make on related subjects in our subsequent Forms 10-Q, 8-K and other reports filed with the SEC.
Set forth below are the material risks and uncertainties that, if they were to occur, could materially and adversely affect our business or could cause our actual results to differ materially from the results contemplated by the forward-looking statements in this report and in the other public statements we make. Please be aware that these risks may change over time and other risks may prove to be important in the future. New risks may emerge at any time, and we cannot predict such risks or estimate the extent to which they may affect our business, financial condition, results of operations or the trading price of our securities.
We may not be able to successfully implement our business initiatives in each of our three business segments to grow our sales and earnings, which could adversely affect our business, financial condition, results of operations and cash flows.
We have implemented numerous initiatives in each of our three business segments to grow sales and earnings, including the introduction of new and expanded product lines, strategic acquisitions, geographic expansion (including through acquisitions), sales to new markets, enhanced customer marketing programs and a variety of gross margin and cost savings initiatives. If we are unable to implement these initiatives efficiently and effectively, or if these initiatives are unsuccessful, our business, financial condition, results of operations and cash flows could be adversely affected.
7
Successful implementation of these initiatives also depends on factors specific to the automotive parts industry and the other industries in which we operate and numerous other factors that may be beyond our control. In addition to the other risk factors contained in this “Item 1A. Risk Factors”, adverse changes in the following factors could undermine our business initiatives and have a material adverse effect on our business, financial condition, results of operations and cash flows:
|
•
|
the competitive environment in our end markets may force us to reduce prices below our desired pricing level or to increase promotional spending;
|
|
•
|
our ability to anticipate changes in consumer preferences and to meet customers’ needs for our products in a timely manner;
|
|
•
|
our ability to successfully enter new markets, including by successfully identifying and acquiring suitable acquisition targets in these new markets;
|
|
•
|
our ability to effectively manage our costs;
|
|
•
|
our ability to continue to grow through acquisitions and successfully integrate acquired businesses in our existing operations, including in particular the challenges associated with the integration of foreign operations to ensure the adequacy of internal controls;
|
|
•
|
our ability to identify and successfully implement appropriate technological, digital and e-commerce solutions;
|
|
•
|
the occurrence of unusually severe weather events, which can disrupt our operations (forcing temporary closure of retail and distribution centers, prohibiting shipment of inventory and products) and negatively impact our results in the affected geographies;
|
|
•
|
volatility in oil prices, which could have a negative impact on the U.S. economy and, in particular, the economies of energy-dominant states in which we operate;
|
|
•
|
the adequacy of our disclosure controls and procedures and internal controls over financial reporting; and
|
|
•
|
the economy in general, including the monetary policies of the Federal Reserve, which are influenced by various factors, including inflation, unemployment and short-term and long-term changes in the international trade balance and the fiscal policies of the U.S. government.
|
Our business will be adversely affected if demand for our products slows.
Our business depends on customer demand for the products that we distribute. Demand for these products depends on many factors.
With respect to our automotive group, the primary factors are:
|
•
|
the number of miles vehicles are driven annually, as higher vehicle mileage increases the need for maintenance and repair;
|
|
•
|
the number of vehicles in the automotive fleet, a function of new vehicle sales and vehicle scrappage rates, as a steady or growing total vehicle population supports the continued demand for maintenance and repair;
|
|
•
|
the quality of the vehicles manufactured by the original vehicle manufacturers and the length of the warranty or maintenance offered on new vehicles;
|
|
•
|
the number of vehicles in current service that are six years old and older, as these vehicles are typically no longer under the original vehicle manufacturers’ warranty and will need more maintenance and repair than newer vehicles;
|
|
•
|
the addition of electric vehicles, hybrid vehicles, ride sharing services, alternative transportation means and autonomously driven vehicles and future legislation related thereto;
|
|
•
|
gas prices, as increases in gas prices may deter consumers from using their vehicles;
|
|
•
|
changes in travel patterns, which may cause consumers to rely more on other transportation;
|
|
•
|
restrictions on access to diagnostic tools and repair information imposed by the original vehicle manufacturers or by governmental regulation, as consumers may be forced to have all diagnostic work, repairs and maintenance performed by the vehicle manufacturers’ dealer networks; and
|
|
•
|
the economy generally, which in declining conditions may cause consumers to defer vehicle maintenance and repair and defer discretionary spending.
|
With respect to our industrial parts group, the primary factors are:
|
•
|
the level of industrial production and manufacturing capacity utilization, as these indices reflect the need for industrial replacement parts;
|
8
|
•
|
changes in manufacturing reflected in the level of the Institute for Supply Management’s Purchasing Managers Index, as an index reading of 50 or more implies an expanding manufacturing economy, while a reading below 50 implies a contracting manufacturing economy;
|
|
•
|
the consolidation of certain of our manufacturing customers and the trend of manufacturing operations being moved overseas, which subsequently reduces demand for our products;
|
|
•
|
changes in legislation or government regulations or policies which could impact international trade among our multi-national customer base and cause reduced demand for our products; and
|
|
•
|
the economy in general, which in declining conditions may cause reduced demand for industrial output.
|
With respect to our business products group, the primary factors are:
|
•
|
the increasing digitization of the workplace, as this negatively impacts the need for certain office products;
|
|
•
|
the level of unemployment, especially as it relates to white collar and service jobs, as high unemployment reduces the need for office products;
|
|
•
|
the level of office vacancy rates, as high vacancy rates reduces the need for office products;
|
|
•
|
consolidation of customers and consolidation of the industry; and
|
|
•
|
the economy in general, which in declining conditions may cause reduced demand for business products consumption.
|
Changes in legislation or government regulations or policies could have a significant impact on our results of operations.
Certain political developments, including, among others: (i) the results of elections in the U.S. and globally and the impact of such results on political decision-making, and (ii) unrest in the U.K. and Europe, have resulted in increased economic uncertainty for multi-national companies operating within the U.K. and Europe. These developments may result in economic and trade policy actions that could impact economic conditions in many countries and change the landscape of international trade. Our business is global, so changes to existing international trade agreements, blocking of foreign trade or imposition of tariffs on foreign goods could result in decreased revenues and/or increases in pricing, either of which could have an adverse impact on our business, results of operations, financial condition and cash flows in future periods. In addition, the Tax Cuts and Jobs Act (the "Act") was signed into law on December 22, 2017. The Act, which reduces the U.S. corporate tax rate to 21 percent from 35 percent for taxable years beginning after December 31, 2017, requires companies to pay a one-time transition tax on earnings of certain foreign subsidiaries that were previously tax deferred and creates new taxes on certain foreign sourced earnings.
The U.K.'s referendum to exit from the European Union (“E.U.”) will continue to have uncertain effects and could adversely impact our business, results of operations and financial condition.
On June 23, 2016, the U.K. voted to exit from the E.U. (commonly referred to as “Brexit”). The terms of Brexit and the resulting U.K./E.U. relationship are uncertain for companies doing business both in the U.K. and the overall global economy. The U.K. vote has impacted global markets, including various currencies, and resulted in a sharp decline in the value of the British Pound as compared to the U.S. dollar and other major currencies. The fluctuation of currency exchange rates may expose us to gains and losses on non-U.S. currency transactions. Volatility in the securities markets and in currency exchange rates may continue as the U.K. negotiates its exit from the E.U. While we have not experienced any material financial impact from Brexit on our business to date, we cannot predict its future implications. Any impact from Brexit on our business and operations over the long term will depend, in part, on the outcome of tariff, tax treaties, trade, regulatory, and other negotiations the U.K. conducts.
Uncertainty and/or deterioration in general macro-economic conditions domestically and globally, including unemployment, inflation or deflation, changes in tax policies, changes in energy costs, uncertain credit markets, or other economic conditions, could have a negative impact on our business, financial condition, results of operations and cash flows.
Our business and operating results have been and may in the future be adversely affected by uncertain global economic conditions, including domestic outputs, political uncertainty and unrest, employment rates, inflation or deflation, changes in tax policies, instability in credit markets, declining consumer and business confidence, fluctuating commodity prices, interest rates, volatile exchange rates, and other challenges that could affect the global economy. Both our commercial and retail customers may experience deterioration of their financial resources, which could result in existing or potential customers delaying or canceling plans to purchase our products. Our vendors could experience similar negative conditions, which could impact their ability to fulfill their financial obligations to us. Future weakness in the global economy could adversely affect our business, results of operations, financial condition and cash flows.
We face substantial competition in the industries in which we do business.
The sale of automotive parts, industrial parts and business products is highly competitive and impacted by many factors, including name recognition, product availability, customer service, changing customer preferences, store location, and pricing
9
pressures. Because we seek to offer competitive prices, if our competitors reduce their prices, we may be forced to reduce our prices, which could result in a material decline in our revenues and earnings. Increased competition among distributors of automotive, industrial parts and office products, including increased availability among digital and e-commerce providers across the markets in which we do business, could cause a material adverse effect on our results of operations. The Company anticipates no decline in competition in any of its three business segments in the foreseeable future.
In particular, the market for replacement automotive parts is highly competitive and subjects us to a wide variety of competitors. We compete primarily with national, international and regional auto parts chains, independently owned regional and local automotive parts and accessories stores, automobile dealers that supply manufacturer replacement parts and accessories, mass merchandisers, internet providers and wholesale clubs that sell automotive products and regional and local full service automotive repair shops, both new and established.
Furthermore, both the automotive aftermarket and the office supply industries continue to experience consolidation. Consolidation among our competitors could further enhance their financial position, provide them with the ability to offer more competitive prices to customers for whom we compete, and allow them to achieve increased efficiencies in their consolidated operations that enable them to more effectively compete for customers. If we are unable to continue to develop successful competitive strategies or if our competitors develop more effective strategies, we could lose customers and our sales and profits may decline.
In addition, the loss of a major customer in the business products group could significantly impact its results of operations.
We depend on our relationships with our vendors, and a disruption of our vendor relationships or a disruption in our vendors’ operations could harm our business.
As a distributor of automotive parts, industrial parts and business products, our business depends on developing and maintaining close and productive relationships with our vendors. We depend on our vendors to sell us quality products at favorable prices. Many factors outside our control, including, without limitation, raw material shortages, inadequate manufacturing capacity, labor disputes, tariff legislation, transportation disruptions, tax and other legislative uncertainties and/or weather conditions, could adversely affect our vendors’ ability to deliver to us quality merchandise at favorable prices in a timely manner.
Furthermore, financial or operational difficulties with a particular vendor could cause that vendor to increase the cost of the products or decrease the quality of the products we purchase from it. Vendor consolidation could also limit the number of suppliers from which we may purchase products and could materially affect the prices we pay for these products. In addition, we would suffer an adverse impact if our vendors limit or cancel the return privileges that currently protect us from inventory obsolescence.
We recognize the growing demand for business-to-business and business-to-customer digital and e-commerce options and solutions, and we could lose business if we fail to provide the digital and e-commerce options and solutions our customers wish to use.
Our success in digital and e-commerce depends on our ability to accurately identify the products to make available through digital and e-commerce platforms across our business segments, and to establish and maintain such platforms to provide an efficient on-line experience with the highest level of data security to our customers on and through the platforms our customers wish to use (including mobile) with rapidly changing technology in a highly competitive environment.
If we experience a security breach, if our internal information systems fail to function properly or if we are unsuccessful in implementing, integrating or upgrading our information systems, our business operations could be materially affected.
We depend on information systems to process customer orders, manage inventory and accounts receivable collections, purchase products, manage accounts payable processes, ship products to customers on a timely basis, maintain cost effective operations, provide superior service to customers and accumulate financial results, among many other things. Despite our implementation of security measures, our IT systems and operations could be subject to damages or interruptions from computer viruses, natural disasters, unauthorized physical or electronic access, power outages, telecommunications failure, computer system or network failures, wire transfer failure, employee error/malfeasance, cyber-attacks, security breaches, and other similar disruptions. Additionally, the techniques and sophistication used to conduct cyber-attacks and breaches of IT systems change frequently and have the potential to not be recognized until such attacks are launched or have been in place for a period of time. Maintaining, operating, and protecting these systems and related personal information about our employees, customers and suppliers requires continuous investments in physical and technological security measures, employee training, and third-party services which the Company has made and will continue to make. A security breach could result in, among other things, sensitive and confidential data being lost, manipulated or exposed to unauthorized persons or to the public or delay our ability to process customer orders and manage inventory. While we also seek to obtain assurances from third parties with whom we interact to protect confidential information, there are risks that the confidentiality or accessibility of data held or utilized by such third parties may be compromised.
10
A serious prolonged disruption of our information systems for any of the above reasons could materially impair fundamental business processes and increase expenses, decrease sales or otherwise impact earnings and cash flows. Furthermore, such a breach may harm our reputation and business prospects and subject us to legal claims if there is loss, disclosure or misappropriation of or access to our customers’ information. As the regulatory environment related to information security, data collection and use, and privacy becomes increasingly rigorous, compliance with these requirements could also result in significant additional costs. As threats related to cybersecurity breaches grow more sophisticated and frequent, it may become more difficult to timely detect and protect our data and infrastructure.
Because we are involved in litigation from time to time and are subject to numerous laws and governmental regulations, we could incur substantial judgments, fines, legal fees and other costs.
We are sometimes the subject of complaints or litigation from customers, employees or other third parties for various reasons. The damages sought against us in some of these litigation proceedings are substantial. Although we maintain liability insurance for some litigation claims, if one or more of the claims were to greatly exceed our insurance coverage limits or if our insurance policies do not cover a claim, this could have a material adverse effect on our business, financial condition, results of operations and cash flows.
Additionally, we are subject to numerous laws in the various jurisdictions in which we operate as well as governmental regulations relating to taxes, environmental protection, product quality standards, building and zoning requirements, and employment law matters. If we fail to comply with existing or future laws or regulations, we may be subject to governmental or judicial fines or sanctions, while incurring substantial legal fees and costs. In addition, our capital expenses could increase due to remediation measures that may be required if we are found to be noncompliant with any existing or future laws or regulations.
We are dependent on key personnel and the loss of one or more of those key persons could harm our business.
Our future success significantly depends on the continued services and performance of our key management personnel. We believe our management team’s depth and breadth of experience in our industry is integral to executing our business plan. We also will need to continue to attract, motivate and retain other key personnel. The loss of services of members of our senior management team or other key employees, the inability to attract additional qualified personnel as needed or failure to plan for the succession of senior management and key personnel could have a material adverse effect on our business.
Our debt levels could adversely affect our cash flow and prevent us from fulfilling our obligations.
We have an unsecured revolving credit facility and unsecured senior notes, which could have important consequences to our financial health. For example, our level of indebtedness could, among other things:
•
make it more difficult to satisfy our financial obligations, including those relating to the senior unsecured notes and our credit facility;
•
increase our vulnerability to adverse economic and industry conditions;
•
limit our flexibility in planning for, or reacting to, changes and opportunities in our industry, which may place us at a competitive disadvantage;
•
require us to dedicate a substantial portion of our cash flows to service the principal and interest on the debt, reducing the funds available for other business purposes, such as working capital, capital expenditures or other cash requirements;
•
limit our ability to incur additional debt with acceptable terms; and
•
expose us to fluctuations in interest rates.
In addition, the terms of our financing obligations include restrictions, such as affirmative, negative and financial covenants, conditions on borrowing and subsidiary guarantees. A failure to comply with these restrictions could result in a default under our financing obligations or could require us to obtain waivers from our lenders for failure to comply with these restrictions. The occurrence of a default that remains uncured or the inability to secure a necessary consent or waiver could have a material adverse effect on our business, financial condition, results of operations and cash flows.
Our stock price is subject to fluctuations, and the value of your investment may decline.
The trading price of our common stock is subject to fluctuations during certain periods, and may be subject to fluctuations in the future based upon external economic and market conditions. The stock market in general has experienced significant price and volume fluctuations that sometimes have been unrelated or disproportionate to the operating performance of listed companies. These broad market, geopolitical and industry factors may harm the market price of our common stock, regardless of our operating performance and growth outlook, and the value of your investment may decline.
11
We may be affected by global climate change or legal, regulatory, or market responses to such change.
The concern over climate change has led to legislative and regulatory initiatives aimed at reducing greenhouse gas emissions (“GHG”). For example, proposals that would impose mandatory requirements related to GHG continue to be considered by policy makers in the U.S. and elsewhere. Laws enacted to reduce GHG could directly or indirectly affect our suppliers and could adversely affect our business, financial condition, results of operations and cash flows. Changes in automotive technology and compliance with any new or more stringent laws or regulations, or stricter interpretations of existing laws, could require additional expenditures by us or our suppliers all of which could adversely impact the demand for our products and our business, financial condition, results of operations or cash flows.
If we fail to maintain an effective system of internal controls over financial reporting there is a reasonable possibility that a material misstatement of our annual or interim financial statements will not be prevented or detected on a timely basis, which could result in a loss of investor confidence and negatively impact our business, results of operations, financial condition and stock price.
Effective internal controls are necessary for us to provide reliable and accurate financial statements and to effectively prevent fraud. As further described in Part II Item 9A “Controls and Procedures” of this Annual Report, management has concluded that, because of a material weakness in internal controls within AAG, which we acquired on November 2, 2017 and which operates as a business unit of our Automotive segment our disclosure controls and procedures were not effective as of December 31, 2018. Specifically, AAG failed to adequately identify, design and implement appropriate process controls and information technology controls. We will continue to enhance our controls at AAG. The material weakness will not be considered remediated until the applicable remedial controls operate for a sufficient period of time and management has concluded, through testing, that these controls are operating effectively. We cannot be certain that these measures will be successful or that we will be able to prevent future significant deficiencies or material weaknesses. Any remediation efforts additionally may require us to incur unanticipated costs for various professional fees and services. Material inaccuracies in our financial statements would impair their value to management and our Board of Directors in making decisions as to the operation of our business, could impair our reputation and cause investors to lose confidence in our reported financial information.
ITEM 1B
.
UNRESOLVED STAFF COMMENTS
.
Not applicable.
ITEM 2
.
PROPERTIES
.
The Company’s corporate and U.S. Automotive Parts Group headquarters are located in two office buildings owned by the Company in Atlanta, Georgia.
The Company’s Automotive Parts Group currently operates 57 NAPA Distribution Centers in the U.S. distributed among eight geographic divisions. Approximately 96% of the distribution center properties are owned by the Company. At
December 31, 2018
, the Company operated approximately 1,100 NAPA AUTO PARTS stores located in 46 states, and the Company had either a noncontrolling, controlling or other interest in 226 additional auto parts stores in 14 states. Other than NAPA AUTO PARTS stores located within company-owned distribution centers, the majority of the auto parts stores in which the Company has an ownership interest are operated in leased facilities. In addition, NAPA Canada/UAP operates 12 distribution centers, one fabrication/remanufacturing facility and approximately 210 auto parts and Traction stores in Canada. In Mexico, Auto Todo operates 11 distribution centers, one automotive parts store, and one tire center, and NAPA Mexico operates one distribution center and 16 auto parts stores. These operations in Canada and Mexico are conducted in leased facilities. GPC Asia Pacific operates throughout Australia and New Zealand with 12 distribution centers, 475 auto parts stores, primarily under the Repco banner, and 87 facilities associated with the Ashdown Ingram, Motospecs, AMX/McLeod and RDA Brakes operations. These distribution centers, stores and facilities are conducted in leased facilities. In Europe, AAG operates 15 distribution centers and 225 company-owned stores in France. In the U.K., the Company operates 35 distribution centers and 196 company-owned stores. In Germany, the Company operates nine distribution centers and 29 company-owned stores. AAG also serves affiliated outlets in Poland, but has no company-owned operations in that country. AAG's locations are operated in leased facilities, other than three distribution centers and the U.K. country office, which are company-owned.
The Company’s Automotive Parts Group also operates four Balkamp distribution and redistribution centers, four Rayloc distribution facilities and four transfer and shipping facilities. Two of the Balkamp distribution centers and the four Rayloc distribution facilities are operated in facilities owned by the Company. Altrom Canada operates two import automotive parts distribution centers and 26 branches, and Altrom America operates one import automotive parts distribution center and eight branches. The Heavy Vehicle Parts Group operates two TW distribution centers, which serve 27 Traction stores, of which 23 are company-owned and located in the U.S. These operations are all conducted in leased facilities.
The Company’s Industrial Parts Group, operating through Motion and Motion Canada, and including its Electrical Specialties Division, operates 15 distribution centers, 559 branches, 42 service centers, four fabrication facilities and six sales offices. Approximately 90% of these locations are operated in leased facilities and the remainder are company-owned.
12
The Company’s Business Products Group operates 48 facilities in the U.S. and four facilities in Canada. Approximately 75% of these facilities are operated in leased buildings and the remainder are company-owned.
We believe that our facilities on the whole are in good condition, are adequately insured, are fully utilized and are suitable and adequate to conduct the business of our current operations.
For additional information regarding rental expense on leased properties, see Note 7, Leased Properties, of Notes to Consolidated Financial Statements beginning on page F-1.
ITEM 3
.
LEGAL PROCEEDINGS
.
The Company is subject to various legal and governmental proceedings, many involving routine litigation incidental to the businesses, including approximately 2,071 product liability lawsuits resulting from its national distribution of automotive parts and supplies. Many of these involve claims of personal injury allegedly resulting from the use of automotive parts distributed by the Company. While litigation of any type contains an element of uncertainty, the Company believes that its defense and ultimate resolution of pending and reasonably anticipated claims will continue to occur within the ordinary course of the Company’s business and that resolution of these claims will not have a material effect on the Company’s business, results of operations or financial condition.
ITEM 4
.
MINE SAFETY DISCLOSURES.
Not applicable.
13
PART II.
|
ITEM 5
.
|
MARKET FOR REGISTRANT’S COMMON EQUITY, RELATED STOCKHOLDER MATTERS AND ISSUER PURCHASES OF EQUITY SECURITIES
.
|
Market Information Regarding Common Stock
The Company’s common stock is traded on the New York Stock Exchange under the ticker symbol “GPC”.
Stock Performance Graph
Set forth below is a line graph comparing the yearly dollar change in the cumulative total shareholder return on the Company’s common stock against the cumulative total shareholder return of the Standard and Poor’s ("S&P") 500 Stock Index and a peer group composite index structured by the Company as set forth below for the five year period that commenced December 31, 2013 and ended
December 31, 2018
. This graph assumes that $100 was invested on December 31, 2013 in Genuine Parts Company common stock, the S&P 500 Stock Index (the Company is a member of the S&P 500 Stock Index, and its cumulative total shareholder return went into calculating the S&P 500 Stock Index results set forth in the graph) and the peer group composite index as set forth below and assumes reinvestment of all dividends.
Comparison of five year cumulative total shareholder return
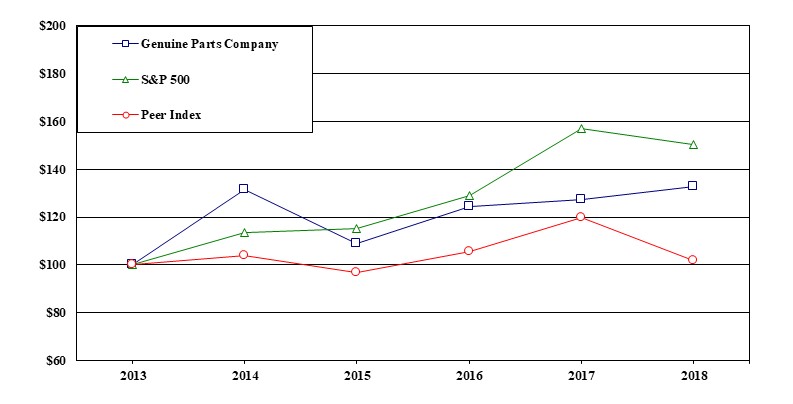
Genuine Parts Company, S&P 500 Stock Index and peer group composite index
|
Cumulative Total Shareholder Return $ at Fiscal Year End
|
2013
|
2014
|
2015
|
2016
|
2017
|
2018
|
||||||
|
Genuine Parts Company
|
$100.00
|
$131.43
|
$108.89
|
$124.46
|
$127.51
|
$132.75
|
||||||
|
S&P 500 Stock Index
|
$100.00
|
$113.69
|
$115.26
|
$129.04
|
$157.21
|
$150.33
|
||||||
|
Peer Index
|
$100.00
|
$103.92
|
$96.75
|
$105.43
|
$119.90
|
$101.64
|
||||||
In constructing the peer group composite index (“Peer Index”) for use in the stock performance graph above, the Company used the shareholder returns of various publicly held companies (weighted in accordance with each company’s stock market capitalization at December 31, 2013 and including reinvestment of dividends) that compete with the Company in three industry segments: automotive parts, industrial parts and business products (each group of companies included in the Peer Index as competing with the Company in a separate industry segment is hereinafter referred to as a “Peer Group”). Included in the automotive parts Peer Group are those companies making up the Dow Jones U.S. Auto Parts Index (the Company is a member of such industry group, and its individual shareholder return was included when calculating the Peer Index results set forth in the performance graph). Included in the industrial parts Peer Group are Applied Industrial Technologies, Inc. and Kaman Corporation and included in the business products Peer Group is Essendant, Inc.
14
In determining the Peer Index, each Peer Group was weighted to reflect the Company’s annual net sales in each industry segment. Each industry segment of the Company comprised the following percentages of the Company’s net sales for the fiscal years shown:
|
Industry Segment
|
2013
|
|
2014
|
|
2015
|
|
2016
|
|
2017
|
|
2018
|
|
||||||
|
Automotive Parts
|
53
|
%
|
53
|
%
|
52
|
%
|
53
|
%
|
53
|
%
|
56
|
%
|
||||||
|
Industrial Parts
|
35
|
%
|
36
|
%
|
35
|
%
|
34
|
%
|
35
|
%
|
34
|
%
|
||||||
|
Business Products
|
12
|
%
|
11
|
%
|
13
|
%
|
13
|
%
|
12
|
%
|
10
|
%
|
||||||
Holders
As of
December 31, 2018
, there were 4,335 holders of record of the Company’s common stock. The number of holders of record does not include beneficial owners of the common stock whose shares are held in the names of various dealers, clearing agencies, banks, brokers and other fiduciaries.
Issuer Purchases of Equity Securities
The following table provides information about the purchases of shares of the Company’s common stock during the three month period ended
December 31, 2018
:
|
Period
|
Total
Number of
Shares
Purchased(1)
|
Average
Price Paid
per Share
|
Total Number of Shares Purchased as Part of Publicly Announced Plans or Programs(2)
|
Maximum Number of Shares That May Yet be Purchased Under the Plans or Programs
|
|||||||||
|
October 1, 2018 through October 31, 2018
|
318,277
|
|
$
|
98.48
|
|
300,000
|
|
17,051,915
|
|
||||
|
November 1, 2018 through November 30, 2018
|
274,670
|
|
$
|
97.94
|
|
222,000
|
|
16,829,915
|
|
||||
|
December 1, 2018 through December 31, 2018
|
468,564
|
|
$
|
96.31
|
|
409,772
|
|
16,420,143
|
|
||||
|
Totals
|
1,061,511
|
|
$
|
97.38
|
|
931,772
|
|
16,420,143
|
|
||||
|
(1)
|
Includes shares surrendered by employees to the Company to satisfy tax withholding obligations in connection with the vesting of shares of restricted stock, the exercise of stock options and/or tax withholding obligations.
|
|
(2)
|
On November 17, 2008, and August 21, 2017, the Board of Directors announced that it had authorized the repurchase of 15 million shares and 15 million shares, respectively. The authorization for these repurchase plans continues until all such shares have been repurchased or the repurchase plan is terminated by action of the Board of Directors. Approximately 1.4 million shares authorized in the 2008 plan and 15.0 million shares authorized in the 2017 plan remain available to be repurchased by the Company. There were no other repurchase plans announced as of
December 31, 2018
.
|
15
ITEM 6
.
SELECTED FINANCIAL DATA
.
The following table sets forth certain selected historical financial and operating data of the Company as of the dates and for the periods indicated. The following selected financial data are qualified by reference to, and should be read in conjunction with, the consolidated financial statements, related notes and other financial information beginning on page F-1, as well as in “Item 7. Management’s Discussion and Analysis of Financial Condition and Results of Operations” of this report.
|
Year Ended December 31,
|
||||||||||||||||||||
|
(In thousands, except per share data)
|
2018
|
2017
|
2016
|
2015
|
2014
|
|||||||||||||||
|
Net sales
|
$
|
18,735,073
|
|
$
|
16,308,801
|
|
$
|
15,339,713
|
|
$
|
15,280,044
|
|
$
|
15,341,647
|
|
|||||
|
Cost of goods sold
|
$
|
12,751,286
|
|
$
|
11,402,403
|
|
$
|
10,740,106
|
|
$
|
10,724,192
|
|
$
|
10,747,886
|
|
|||||
|
Operating and non-operating expenses, net
|
$
|
4,908,175
|
|
$
|
3,897,130
|
|
$
|
3,525,267
|
|
$
|
3,432,171
|
|
$
|
3,476,022
|
|
|||||
|
Income before taxes
|
$
|
1,075,612
|
|
$
|
1,009,268
|
|
$
|
1,074,340
|
|
$
|
1,123,681
|
|
$
|
1,117,739
|
|
|||||
|
Income taxes
|
$
|
265,138
|
|
$
|
392,511
|
|
$
|
387,100
|
|
$
|
418,009
|
|
$
|
406,453
|
|
|||||
|
Net income
|
$
|
810,474
|
|
$
|
616,757
|
|
$
|
687,240
|
|
$
|
705,672
|
|
$
|
711,286
|
|
|||||
|
Weighted average common shares outstanding during year — assuming dilution
|
147,241
|
|
147,701
|
|
149,804
|
|
152,496
|
|
154,375
|
|
||||||||||
|
Per common share:
|
||||||||||||||||||||
|
Diluted net income
|
$
|
5.50
|
|
$
|
4.18
|
|
$
|
4.59
|
|
$
|
4.63
|
|
$
|
4.61
|
|
|||||
|
Dividends declared
|
$
|
2.88
|
|
$
|
2.70
|
|
$
|
2.63
|
|
$
|
2.46
|
|
$
|
2.30
|
|
|||||
|
December 31 closing stock price
|
$
|
96.02
|
|
$
|
95.01
|
|
$
|
95.54
|
|
$
|
85.89
|
|
$
|
106.57
|
|
|||||
|
Total debt, less current maturities
|
$
|
2,432,133
|
|
$
|
2,550,020
|
|
$
|
550,000
|
|
$
|
250,000
|
|
$
|
500,000
|
|
|||||
|
Total equity
|
$
|
3,471,991
|
|
$
|
3,464,156
|
|
$
|
3,207,356
|
|
$
|
3,159,242
|
|
$
|
3,312,364
|
|
|||||
|
Total assets
|
$
|
12,683,040
|
|
$
|
12,412,381
|
|
$
|
8,859,400
|
|
$
|
8,144,771
|
|
$
|
8,246,238
|
|
|||||
|
ITEM 7
.
|
MANAGEMENT’S DISCUSSION AND ANALYSIS OF FINANCIAL CONDITION AND RESULTS OF OPERATIONS
.
|
OVERVIEW
Genuine Parts Company is a service organization engaged in the distribution of automotive replacement parts, industrial parts and electrical specialty materials and business products. We have a long tradition of growth dating back to 1928, the year we were founded in Atlanta, Georgia. The Company conducted business in
2018
throughout the North America, Australia, New Zealand, the U.K., France, Germany, Poland, and Puerto Rico from approximately 3,100 locations.
For the periods presented, the Company operates in three business segments: Automotive, Industrial, and Business Products. Effective in 2018, EIS, Inc., formerly our Electrical and Electronic business segment, was combined with Motion Industries and is now identified as the Electrical Specialties Group of Motion Industries. As a result, the Industrial segment is comprised of Motion Industries and EIS, Inc. and the results from prior periods have been combined, accordingly. The combination of these two segments provides strong economies of scale and greater operating efficiencies, which we intend to leverage. The opportunity to build synergies by sharing talent, physical resources, greater size and scale, and value-added expertise in each respective market channel is highly compelling.
We recorded consolidated net sales of
$18.7 billion
for the year ended
December 31, 2018
, an increase of
14.9%
compared to sales in
2017
. Consolidated net income for the year ended
December 31, 2018
was
$810.5 million
and diluted net income per share was
$5.50
. Adjusted net income was
$836.1 million
for the year ended
December 31, 2018
, and adjusted diluted net income per share was
$5.68
. Adjusted net income and adjusted diluted net income per share, both non-GAAP measures, exclude the impact of transaction and other costs primarily related to the Company's acquisition of AAG and the attempted transaction to spin-off the Business Products Group, net of a termination fee received. See "Non-GAAP Measures."
In
2018
, our growth strategy centered around plans and initiatives to position the Company for sustained long term sales and earnings growth. Specifically, we executed on our initiatives to maximize revenues and improve our operating performance across each of our businesses. Additionally, we were focused on our plans for creating a lower cost, but highly effective infrastructure. These efforts included ongoing steps to accelerate the integration of our acquisitions, investments to enhance our productivity and innovative strategies to offset rising costs.
Total sales of $16.3 billion in 2017 increased 6.3% compared to sales in
2016
. Net income in
2017
was $617 million and diluted net income per share was $4.18. Adjusted net income was $696 million and adjusted diluted net income per share was $4.71. Adjusted net income and adjusted diluted net income per share exclude the impact of transaction and other costs primarily
16
related to the Company's acquisition of AAG and the transition tax associated with foreign earnings and the revaluation of deferred tax assets and liabilities as required by the Tax Cuts and Jobs Act of 2017. In
2016
, sales were essentially flat with the prior year and net income was down by 3%. These results primarily reflect the impact of a challenging sales environment that persisted in the U.S. throughout the year. Over the three year period of
2016
through
2018
, our financial performance reflects a variety of initiatives the Company implemented to grow sales and earnings across our businesses. Examples of such initiatives include strategic acquisitions, the introduction of new and expanded product lines, including those carried by acquired companies, geographic expansion, sales to new markets, enhanced customer marketing programs and a variety of gross margin and cost savings initiatives. We discuss these initiatives further below.
With regard to the
December 31, 2018
consolidated balance sheet, the Company’s cash balance of
$334 million
compares to cash of $315 million at
December 31, 2017
. The Company continues to maintain a strong cash position, supported by the increase in net income and effective working capital management. Accounts receivable increased
3%
, which related directly to our sales increase in the fourth quarter of 2018, and inventory is down by approximately
4%
due primarily to a change in classification of certain estimated merchandise returns in connection with adopting Accounting Standards Update ("ASU") ASU 2014-09,
Revenue from Contracts with Customers
. Accounts payable increased
10%
from the prior year, due primarily to improved payment terms with certain suppliers. Total debt outstanding at
December 31, 2018
was
$3.1 billion
, a decrease from total debt of
$3.2 billion
at
December 31, 2017
.
RESULTS OF OPERATIONS
Our results of operations are summarized below for the three years ended
December 31, 2018
, 2017 and 2016.
|
|
Year Ended December 31,
|
|||||||||||
|
(In thousands except per share data)
|
2018
|
2017
|
2016
|
|||||||||
|
Net sales
|
$
|
18,735,073
|
|
$
|
16,308,801
|
|
$
|
15,339,713
|
|
|||
|
Gross margin
|
5,983,787
|
|
$
|
4,906,398
|
|
$
|
4,599,607
|
|
||||
|
Net income
|
810,474
|
|
$
|
616,757
|
|
$
|
687,240
|
|
||||
|
Diluted net income per common share
|
5.50
|
|
$
|
4.18
|
|
$
|
4.59
|
|
||||
Net Sales
Consolidated net sales for the year ended
December 31, 2018
totaled
$18.7 billion
, up
14.9%
from
2017
.
2018
net sales included an approximate 11.2% contribution from acquisitions, net of store closures, and an approximate 3.6% increase in core sales. Core sales growth, which represents the Company's comparable sales, included both the increase in sales volume and product inflation. The impact of product inflation varied by business in
2018
, with prices up approximately 1.8% in the U.S. Automotive segment, all of which was effective over the second half of the year, up approximately 3.8% in the Industrial segment and up approximately 1.8% in the Business Products segment. Due to the Company's global initiatives to grow revenues and create a lower cost, but highly effective infrastructure, we believe it is well positioned for sustainable long-term growth.
Consolidated net sales for the year ended
December 31, 2017
totaled $16.3 billion, up 6.3% from
2016
.
2017
net sales included a 4.4% contribution from acquisitions, net of store closures, an approximate 1.5% increase in core sales and an approximate 0.4% positive impact of currency translation. Core sales growth, which represents the Company's comparable sales, included an approximate 0.6% increase in sales volume and product inflation of approximately 0.9%. The impact of product inflation varied by business in
2017
, as prices were up approximately 0.3% in the Automotive segment, up approximately 2.0% in the Industrial segment and up approximately 0.6% in the Business Products segment.
Automotive Group
Net sales for the Automotive Group (“Automotive”) were $10.5 billion in
2018
, a 22.6% increase from
2017
. The increase in sales for the year consists of an approximate 20% contribution from acquisitions, a 2.5% comparable sales increase and a slight negative impact of currency translation associated with our automotive businesses in Canada, Australasia, Europe and Mexico. Automotive sales were positively impacted by product inflation of 1.8% in the U.S. operations, although the majority of these supplier price increases became effective in the fourth quarter of 2018 and would not be reflected in our comparable sales increase. In
2018
, total Automotive revenues were up approximately 30% in the first quarter, up 28% in the second quarter, up 23% in the third quarter and up 11% in the fourth quarter, with the lower fourth quarter increase due to the impact of the AAG acquisition, which anniversaried on November 2, 2018. In
2018
, the sales environment for the automotive aftermarket was condusive to growth. Our international markets, including Europe, Australasia, Canada and Mexico, remained steady, and conditions in the U.S. aftermarket gradually improved during the year. In our view, the underlying fundamentals in the automotive aftermarket, including trends related to the overall number and age of the vehicle population as well as the continued increase in miles driven, remain supportive of sustained demand for automotive aftermarket maintenance and supply items across the markets we serve. We expect these fundamentals as well as key sales initiatives to drive sales growth for the Automotive business in 2019.
17
Net sales for Automotive were $8.6 billion in
2017
, a 6.8% increase from
2016
. The increase in sales for the year consists of an approximate 5% contribution from acquisitions, a 1% comparable sales increase and an approximate 1% positive impact of currency translation associated with our automotive businesses in Canada, Australasia and Mexico. Automotive sales were also positively impacted by product inflation of 0.3%, which is included in the comparable sales increase. In
2017
, Automotive revenues were up approximately 3% in the first quarter, up 4% in the second and third quarters and up 17% in the fourth quarter. The fourth quarter sales increase reflects two months of sales for AAG.
Industrial Parts Group
Net sales for the Industrial Parts Group (“Industrial”), were $6.3 billion in
2018
, up 8.5% from
2017
. The increase in sales for the year reflects an approximate 6.5% comparable sales increase and an approximate 2% contribution from acquisitions. Total Industrial sales were also positively impacted by product inflation of 3.8%, as a portion of this increase, depending on its effective date, is passed through to customers and is included in the comparable sales increase. Industrial revenues were up approximately 8% in the first quarter of 2018, up 9% in the second quarter, up 8% in the third quarter and up 9% in the fourth quarter. These strong quarterly increases correlate to the ongoing strength in the industrial economy throughout the year. This was evidenced by favorable economic indicators such as Manufacturing Industrial Production, the Purchasing Managers Index, the level of exports and the continued stabilization of the energy sector. We believe the Industrial business is well positioned for ongoing profitable growth in 2019.
Net sales for Industrial were $5.8 billion in
2017
, up 7.5% from
2016
. The increase in sales for the year reflects an approximate 4% comparable sales increase, a 3.3% contribution from acquisitions and a slight positive impact of currency translation associated with our Canadian and Mexican operations. Industrial's sales were also positively impacted by product inflation of 1.9%, as a portion of this increase is passed through to customers and is included in the comparable sales increase. Industrial revenues were up approximately 6% in the first quarter of
2017
and up 8% in the second, third and fourth quarters, which correlates to the strength in the industrial economy throughout the year.
Business Products Group
Net sales for S.P. Richards, our Business Products Group (“Business Products”), were $1.9 billion in
2018
, a decrease of 0.5% from
2017
. The decrease in sales is driven by the decline in core sales and is the result of a slow first quarter relative to the balance of the year. Sales were down approximately 5% in the first quarter, flat in the second quarter, up 1% in the third quarter and up 2% in the fourth quarter of
2018
. While the business products industry continues to face significant challenges, our strategy to diversify our traditional product offering into the large and growing Facilities, Breakroom and Safety Supplies ("FBS") category has proven beneficial. In addition, sales in our general office supplies category were improved in the second half of 2018. Looking ahead, we remain focused on our core growth initiatives and maximizing the growth prospects for our diversified business, but will also continue to evaluate all opportunities that may help us more effectively navigate the evolving industry dynamics in which this group competes.
Net sales for Business Products were $1.9 billion in
2017
, an increase of 1.1% from
2016
. The increase in sales reflects an approximate 5% contribution from acquisitions, offset by an approximate 4% decrease in comparable sales, inclusive of a 0.6% increase in higher transaction values associated with price inflation. Sales were up approximately 8% in the first quarter, up 4% in the second quarter, down 5% in the third quarter and down 2% in the fourth quarter of
2017
.
Cost of Goods Sold
The Company includes in cost of goods sold the actual cost of merchandise, which represents the vast majority of this line item. Other items in cost of goods sold include warranty costs and in-bound freight from the suppliers, net of any vendor allowances and incentives. Cost of goods sold was
$12.75 billion
in
2018
, $11.40 billion in
2017
and $10.74 billion in
2016
. Cost of goods sold in
2018
and
2017
changed from the prior year periods in accordance with the related percentage change in sales for the same periods. The increases for these periods were partially offset by the favorable impact of the lower cost of goods sold model at AAG as well as at certain other acquired companies and the improvement in the automotive and industrial businesses. Primarily, the improvement in these businesses relates to the change in supplier incentives associated with higher purchasing volumes and product mix. Cost of goods sold represented
68.1%
of net sales in
2018
, 69.9% of net sales in
2017
and 70.0% of net sales in
2016
and thus, as a percent of net sales, decreased in both
2018
and
2017
.
In
2018
and
2017
, each of the Company's business segments experienced vendor price increases, while in
2016
, only the Industrial and Business Products segments experienced vendor price increases. In any year where we experience price increases, we are able to work with our customers to pass most of these increases along to them.
Operating Expenses
The Company includes in selling, administrative and other expenses (“SG&A”) all personnel and personnel-related costs at its headquarters, distribution centers, stores and branches, which accounts for approximately 65% of total SG&A. Additional costs in SG&A include our facilities, delivery, marketing, advertising, technology, digital, legal and professional costs.
18
SG&A of
$4.6 billion
in
2018
increased by
$889 million
or approximately
23.9%
from
2017
. This represents 24.6% of net sales in 2018 compared to 22.8% of net sales in
2017
. The increase in SG&A expenses from the prior year reflect a combination of factors, including the impact of increased sales for the year. In addition, our expenses reflect the impact of higher cost, and higher gross margin, models at select acquisitions, including AAG. We also experienced rising costs in areas such as labor, freight and delivery, technology and warehousing. Further, we incurred incremental costs associated with our 23 acquisitions during the year and, in addition, recorded $30.3 million in transaction and other costs primarily associated with the acquisition of AAG and the attempted transaction to spin-off the Company's Business Products Group, net of the favorable impact of a termination fee received. The increase in SG&A expenses as a percentage of net sales in 2018 from the prior year reflect the increases in costs described above as well as the loss of leverage associated with the first half and full year comparable sales growth in the automotive and business products businesses, respectively. To improve on our SG&A expense levels, we continue to work towards a lower cost, but highly effective infrastructure. These efforts include steps to accelerate the integration of our acquisitions, investments to enhance our productivity and innovative strategies to unlock greater savings and efficiencies across our operations.
Depreciation and amortization expense was
$242 million
in
2018
, an increase of approximately
$74 million
or
44%
from
2017
, due primarily to the impact of acquisitions and the increase in capital expenditures relative to the prior year. The provision for doubtful accounts was
$17 million
in
2018
, a
$3 million
increase from
2017
. We believe the Company is adequately reserved for bad debts at
December 31, 2018
.
SG&A of $
3.73
billion in
2017
increased by $334 million or approximately 10% from
2016
. This represents 22.8% of net sales compared to 22.1% of net sales in
2016
. The increase in SG&A expenses from the prior year reflect a combination of factors, including the impact of increased sales for the year. We also experienced rising costs in areas such as labor, freight, technology, warehousing, insurance, healthcare and other employee benefits. Further, we incurred incremental costs associated with our 15 acquisitions during the year and, in addition, recorded $43.5 million in transaction-related costs primarily associated with the acquisition of AAG. Finally, our SG&A expenses reflect the impact of higher cost, and higher gross margin, models at select acquisitions, including AAG. The increase in SG&A expenses as a percentage of net sales from the prior year reflect the increases in costs described above as well as the loss of leverage associated with the Company's 1.5% consolidated comparable sales growth.
Depreciation and amortization expense was $
168 million
in
2017
, an increase of approximately $20 million or 14% from
2016
. The provision for doubtful accounts was $14 million in
2017
, an increase of $2 million from
2016
.
Total share-based compensation expense for the years ended
December 31, 2018
,
2017
and
2016
was
$20.7 million
, $16.9 million and $19.7 million, respectively. Refer to the share-based compensation footnote in the Consolidated Financial Statements for further information regarding share-based compensation.
Non-Operating Expenses and Income
Non-operating expenses consist primarily of interest. Interest expense was
$102 million
in
2018
, $41 million in
2017
and $21 million in
2016
. The
$60.4 million
increase in interest expense in
2018
reflects the combination of higher debt levels throughout the year, primarily related to the increase in debt associated with the AAG acquisition on November 2, 2017, and rising interest rates on certain variable interest debt instruments. To offset these rising interest rates, the Company has entered into interest hedge products to increase our fixed interest rate debt relative to total debt. In 2017, the $20 million increase in interest expense reflects the combination of higher debt levels relative to the prior year, including the increase in debt for AAG described above, and rising interest rates on certain variable interest debt instruments.
In “Other”, the net benefit of interest income, equity method investment income, investment dividends, noncontrolling interests and pension income in
2018
was
$68 million
, a
$16 million
increase from the prior year. The increase in Other reflects higher interest income, pension income and investments income earned in 2018 relative to 2017. These items totaled $52 million in
2017
, a $5 million increase from
2016
due to higher investment income and interest income relative to the prior year.
Income Before Income Taxes
Income before income taxes was
$1.1 billion
in
2018
, up
7%
from
2017
. As a percentage of net sales, income before income taxes, which we refer to as operating margin, was
5.7%
in
2018
compared to 6.2% in
2017
. Adjusted for $36.1 million in transaction and other costs primarily associated with the Company's acquisition of AAG on November 2, 2017 and the attempted transaction to spin-off the Company's Business Products Group, net of the favorable impact of a termination fee received, income before income taxes was 5.9% of net sales. In
2017
, income before income taxes was $1.0 billion, down 6% from
2016
and as a percentage of net sales was 6.2% compared to 7.0% in
2016
. Adjusted for $49.1 million in transaction-related costs primarily associated with the Company's acquisition of AAG described above, income before income taxes was 6.5% of net sales.
19
Automotive Group
Automotive income before income taxes increased 18.6% in 2018 from 2017 and operating margin was 8.1% in
2018
as compared to 8.4% in
2017
. The decrease in operating margin reflects the loss of expense leverage due to the 2.5% growth in comparable sales for Automotive, as this group requires approximately 3% comparable sales growth to leverage its fixed costs. In addition, rising costs in several areas as described above negatively impacted Automotive's operating margin. To improve Automotive's operating margin, this group is focused on several initiatives to grow sales and has also enhanced its cost management initiatives to drive savings in 2019 and the years ahead.
Automotive’s income before income taxes increased 0.7% in 2017 and operating margin of 8.4% was down from 8.8% in
2016
. The decrease in operating margin primarily reflects the loss of expense leverage due to 1% growth in comparable sales for Automotive.
Industrial Group
Industrial’s income before income taxes increased 10.6% in 2018 from 2017 and operating margin was 7.7%, an increase from 7.6% in
2017
. The improvement in operating margin for this group primarily reflects the continued benefit of strong sales growth throughout the year, as gross margins benefited from the increase in supplier incentives and rebates and operating expenses were better leveraged. We believe that Industrial enters 2019 in position to further expand their operating margin.
Industrial’s income before income taxes increased 10.9% in 2017 and operating margin was 7.6%, which was up from 7.4% in
2016
. The improvement in operating margin for this group primarily reflects the positive impact of stronger sales growth in
2017
relative to
2016
, driven by an improved industrial economy.
Business Products Group
Business Product's income before income tax was down 10.2% in 2018 from 2017 and operating margin decreased to 4.6% from 5.1%. The decrease in operating margin reflects the gross margin pressures associated with lower supplier incentives as well as increased costs and the deleveraging of expenses due to comparable sales declines. The Business Products Group enters 2019 focused on its core growth initiatives, the further diversification of its business and the evaluation of options for new and enhanced opportunities to maximize the growth prospects for this business.
Business Product's income before income taxes was down 15.5% in 2017 from 2016 and operating margin decreased to 5.1% from 5.9%, as gross margin pressures, rising costs and the deleveraging of expenses negatively impacted the operating margin for this business.
Income Taxes
The Tax Cuts and Jobs Act ("the Act") was enacted December 22, 2017. While not all inclusive, certain provisions of the Act materially impact the Company. The Act reduces the U.S. federal corporate tax rate from 35% to 21% for taxable years starting after December 31, 2017, required companies to pay a one-time transition tax on earnings of certain foreign subsidiaries that were not previously subject to U.S. Federal income tax and creates new taxes on certain foreign sourced earnings.
The effective income tax rate of
24.6%
in
2018
decreased from 38.9% in
2017
. The decrease in rate primarily reflects the positive impact of the lower U.S. federal tax rate described above and the comparative benefit associated with the transition tax expense in 2017, as required by the the Act.
The effective income tax rate of
38.9%
in
2017
increased from 36.0% in
2016
. The increase in the 2017 rate reflects the $51 million tax expense related to the transition tax associated with foreign earnings and the revaluation of deferred tax assets and liabilities as required by the Act, offset by a favorable mix of U.S. and foreign earnings, including earnings from AAG.
Net Income
Net income was
$810.5 million
in
2018
, an increase of
31.4%
from $617 million in
2017
. On a per share diluted basis, net income was
$5.50
in
2018
, up
31.6%
compared to $4.18 in
2017
. Net income was
4.3%
of net sales in
2018
compared to 3.8% of net sales in
2017
. Adjusted net income was
$836.1 million
in
2018
, up 20.2% from adjusted net income in
2017
. On a per share diluted basis, adjusted net income was
$5.68
, a 20.6% increase compared to adjusted diluted net income per share of $4.71 in
2017
. Adjusted net income and adjusted diluted net income per share, both non-GAAP measures, in 2018 and 2017 exclude the impact of transaction and other costs primarily related to the Company's acquisition of AAG and the attempted transaction to spin-off the Business Products Group, net of the favorable impact of a termination fee received. In 2017, adjusted net income also excludes the impact of the one-time transition tax associated with foreign earnings and the revaluation of deferred tax assets and liabilities as required by the Tax Cuts and Jobs Act of 2017.
Net income was $617 million in
2017
, a decrease of 10.3% from $687 million in
2016
. On a per share diluted basis, net income was $4.18 in
2017
, down 8.9% compared to $4.59 in
2016
. Net income was 3.8% of net sales in
2017
compared to 4.5% of net sales in
2016
.
20
Non-GAAP Measures
The following table sets forth a reconciliation of net income and diluted net income per common share to adjusted net income and adjusted diluted net income per common share to account for the impact of these adjustments. The Company believes that the presentation of adjusted net income and adjusted net income per common share, which are not calculated in accordance with generally accepted accounting principles in the U.S. (“GAAP”), provide meaningful supplemental information to both management and investors that is indicative of the Company's core operations. The Company does not, nor does it suggest investors should, consider such non-GAAP financial measures in isolation from, or as a substitute for, GAAP financial information.
|
Year Ended December 31,
|
||||||||||||
|
(In thousands, except per share data)
|
2018
|
2017
|
2016
|
|||||||||
|
GAAP net income
|
$
|
810,474
|
|
$
|
616,757
|
|
$
|
687,240
|
|
|||
|
Diluted net income per common share
|
$
|
5.50
|
|
$
|
4.18
|
|
$
|
4.59
|
|
|||
|
Add after-tax adjustments:
|
||||||||||||
|
Provisional transition tax and deferred tax revaluation
|
$
|
—
|
|
$
|
50,986
|
|
$
|
—
|
|
|||
|
Transaction and other costs
|
34,653
|
|
28,039
|
|
—
|
|
||||||
|
Termination fee
|
(9,045
|
)
|
—
|
|
—
|
|
||||||
|
Adjusted net income
|
$
|
836,082
|
|
$
|
695,782
|
|
$
|
687,240
|
|
|||
|
Adjusted diluted net income per common share
|
$
|
5.68
|
|
$
|
4.71
|
|
$
|
4.59
|
|
|||
FINANCIAL CONDITION
The Company’s cash balance of
$334 million
at
December 31, 2018
compares to cash of $315 million at
December 31, 2017
, as discussed further below. For the year ended December 31, 2018, the Company used
$278 million
for acquisitions and other investing activities,
$416 million
for dividends paid to the Company’s shareholders, and
$232 million
for investments in the Company via capital expenditures. These items were offset by the Company’s earnings and net cash provided by operating activities.
Accounts receivable at
December 31, 2018
increased by approximately
3%
from the prior year, which is due to the Company's higher sales volume in the three month period ended December 31, 2018 as compared to the fourth quarter of 2017. Inventory at
December 31, 2018
decreased from the prior year by approximately
4%
due primarily to a change in classification of certain estimated merchandise returns in connection with adopting ASU 2014-09. Accounts payable increased
10%
from the prior year primarily due to more favorable payment terms negotiated with the Company's vendors as well as more normalized levels of purchasing volumes relative to the fourth quarter of the prior year.
LIQUIDITY AND CAPITAL RESOURCES
The Company’s sources of capital consist primarily of cash flows from operations, supplemented as necessary by private issuances of debt and bank borrowings. Currently, we believe that our cash on hand and available short-term and long-term sources of capital are sufficient to fund the Company’s operations, including working capital requirements, scheduled debt payments, interest payments, capital expenditures, benefit plan contributions, income tax obligations, dividends, share repurchases and contemplated acquisitions.
The ratio of current assets to current liabilities was
1.3
to 1 at both
December 31, 2018
and
2017
, and our liquidity position remains solid. We continue to negotiate extended payment dates with our vendors. Certain vendors participate in financing arrangements with financial institutions that allow the vendors to receive payment earlier while we pay the financial institution based on the underlying vendor invoice amounts and due dates. The Company’s total debt outstanding at
December 31, 2018
decreased by
$102 million
or
3%
from
December 31, 2017
, due primarily to improvements in working capital.
Sources and Uses of Cash
A summary of the Company’s consolidated statements of cash flows is as follows:
|
|
Year Ended December 31,
|
||||||||||||||
|
(In thousands)
|
2018
|
2017
|
$ Change
|
% Change
|
|||||||||||
|
Operating activities
|
$
|
1,145,164
|
|
$
|
815,043
|
|
$
|
330,121
|
|
40.5
|
%
|
||||
|
Investing activities
|
$
|
(496,124
|
)
|
$
|
(1,630,280
|
)
|
$
|
1,134,156
|
|
(69.6
|
)%
|
||||
|
Financing activities
|
$
|
(608,830
|
)
|
$
|
872,059
|
|
$
|
(1,480,889
|
)
|
(169.8
|
)%
|
||||
21
|
|
Year Ended December 31,
|
||||||||||||||
|
(In thousands)
|
2017
|
2016
|
$ Change
|
% Change
|
|||||||||||
|
Operating activities
|
$
|
815,043
|
|
$
|
946,078
|
|
$
|
(131,035
|
)
|
(13.9
|
)%
|
||||
|
Investing activities
|
$
|
(1,630,280
|
)
|
$
|
(593,999
|
)
|
$
|
(1,036,281
|
)
|
174.5
|
%
|
||||
|
Financing activities
|
$
|
872,059
|
|
$
|
(322,406
|
)
|
$
|
1,194,465
|
|
(370.5
|
)%
|
||||
Operating Activities
The Company continues to generate cash, and in
2018
, net cash provided by operating activities totaled
$1.1 billion
. This reflects a
$330 million
or
41%
increase from
2017
, and is primarily related to the Company’s ongoing working capital initiatives and the increase in the Company’s net income during 2018. The primary source of cash relates to the Company’s increased payables that are a result of ongoing strategic negotiations with key suppliers. In addition, the Company achieved a
$194 million
increase in net income or
31%
increase from 2017.
Net cash provided by operating activities was
$815 million
in
2017
, a 14% decrease from
2016
, and represents the lower source of cash from trade accounts receivable, merchandise inventories, trade accounts payable and other short term assets and liabilities, collectively, relative to
2016
. Other changes in operating activities were essentially offsetting.
Investing Activities
Net cash used in investing activities was
$496 million
in
2018
compared to
$1.6 billion
in
2017
, a
$1.1 billion
or
70%
decrease. Cash used for acquisitions of businesses and other investing activities in
2018
was
$278 million
, or
$1.2 billion
less than in
2017
. The decrease in 2018 reflects the Company's smaller acquisitions as compared to the purchase of AAG in 2017. Capital expenditures of
$232 million
in
2018
compare to $157 million in
2017
and were higher than our original estimate of $200 to $220 million for the year due to the timing of certain capitalized investments. We estimate that cash used for capital expenditures in 2019 will be approximately $300 to $325 million.
Net cash used in investing activities was $1.63 billion in
2017
compared to
$594 million
in
2016
, a
$1.0 billion
or
174%
increase. Cash used for acquisitions of businesses and other investing activities in
2017
was
$1.5 billion
, or $1.0 billion more than in
2016
. Primarily, this increase reflects the Company's purchase of AAG. Capital expenditures of $157 million in
2017
compare to $161 million in
2016
and were within the range of our original estimate of $145 to $165 million for the year.
Financing Activities
Net cash used in financing activities in
2018
totaled
$609 million
, a decrease of
$1.5 billion
or
170%
from the
$872 million
in cash provided by financing activities in
2017
. The decrease reflects no new debt issuance in 2018 and the paying down of our credit facilities. Net cash provided by financing activities in
2017
was up
370%
from the
$322 million
used in
2016
, and primarily reflects the new debt issued in 2017 associated with the purchase of AAG. For the three years presented, the Company's financing activities included the use of cash for dividends paid to shareholders and repurchases of the Company’s common stock. The Company paid dividends to shareholders of
$416 million
, $395 million and $387 million during
2018
,
2017
and
2016
, respectively. The Company expects this trend of increasing dividends to continue in the foreseeable future. During
2018
,
2017
and
2016
, the Company repurchased
$92 million
, $174 million and $181 million, respectively, of the Company’s common stock. We expect to remain active in our share repurchase program, but the amount and value of shares repurchased will vary.
Notes and Other Borrowings
The Company maintains a $2.6 billion multi-currency Syndicated Facility Agreement (the "Syndicated Facility") with a consortium of financial institutions, which matures in October 2022 and bears interest at London Inter-bank Offered Rate ("LIBOR") plus a margin, which is based on the Company’s debt to earnings before interest, tax, depreciation and amortization ("EBITDA") ratio. The Company also has the option to increase the borrowing capacity up to an additional $1 billion, as well as an option to decrease the borrowing capacity or terminate the facility with appropriate notice. At
December 31, 2018
, approximately $1.6 billion was outstanding under this line of credit. Due to the workers’ compensation and insurance reserve requirements in certain states, the Company also had unused letters of credit of approximately
$64 million
and $62 million outstanding at
December 31, 2018
and
2017
, respectively.
At
December 31, 2018
, the Company had unsecured Senior Notes outstanding under financing arrangement as follows: $50 million series G senior unsecured notes, 2.64% fixed, due 2021; $250 million series F senior unsecured notes, 3.24% fixed, due 2023; €225 million series J senior unsecured notes, 1.40% fixed, maturing on October 30, 2024; $250 million series H senior unsecured notes, 3.24% fixed, due 2026; €250 million series K senior unsecured notes, 1.81% fixed, maturing on October 30, 2027; $120 million series I senior unsecured notes, 3.70% fixed, maturing on October 30, 2027; €125 million series L senior unsecured notes, 2.02% fixed, maturing on October 30, 2029; and €100 million series M senior unsecured notes, 2.32% fixed, maturing on October 30, 2032. These borrowings contain covenants related to a maximum debt to EBITDA ratio and certain
22
limitations on additional borrowings. At
December 31, 2018
, the Company was in compliance with all such covenants. The weighted average interest rate on the Company’s total outstanding borrowings was approximately 2.71% at
December 31, 2018
and 2.70% at
December 31, 2017
. Total interest expense, net of interest income, for all borrowings was $92.1 million, $38.7 million and $19.5 million in
2018
,
2017
and
2016
, respectively.
Contractual and Other Obligations
The following table shows the Company’s approximate obligations and commitments, including interest due on credit facilities, to make future payments under specified contractual obligations as of
December 31, 2018
:
Contractual Obligations
|
|
Payment Due by Period
|
|||||||||||||||||||
|
(In thousands)
|
Total
|
Less Than
1 Year
|
1-3 Years
|
3-5 Years
|
Over
5 Years
|
|||||||||||||||
|
Credit facilities
|
$
|
3,427,974
|
|
$
|
747,974
|
|
$
|
371,531
|
|
$
|
1,034,070
|
|
$
|
1,274,399
|
|
|||||
|
Operating leases
|
1,115,725
|
|
305,257
|
|
412,748
|
|
204,858
|
|
192,862
|
|
||||||||||
|
Total contractual cash obligations
|
$
|
4,543,699
|
|
$
|
1,053,231
|
|
$
|
784,279
|
|
$
|
1,238,928
|
|
$
|
1,467,261
|
|
|||||
Due to the uncertainty of the timing of future cash flows associated with the Company’s unrecognized tax benefits at
December 31, 2018
, the Company is unable to make reasonably reliable estimates of the period of cash settlement with the respective taxing authorities. Therefore, $21 million of unrecognized tax benefits and the remaining $30 million one-time transition tax related to the Tax Cuts and Jobs Act have been excluded from the contractual obligations table above. Refer to the income taxes footnote in the Consolidated Financial Statements for a discussion on income taxes.
Purchase orders or contracts for the purchase of inventory and other goods and services are not included in our estimates. We are not able to determine the aggregate amount of such purchase orders that represent contractual obligations, as purchase orders may represent authorizations to purchase rather than binding agreements. Our purchase orders are based on our current distribution needs and are fulfilled by our vendors within short time horizons. The Company does not have significant agreements for the purchase of inventory or other goods specifying minimum quantities or set prices that exceed our expected requirements.
The Company guarantees the borrowings of certain independently owned automotive parts stores (independents) and certain other affiliates in which the Company has a noncontrolling equity ownership interest (affiliates). The Company’s maximum exposure to loss as a result of its involvement with these independents and affiliates is generally equal to the total borrowings subject to the Company’s guarantee. To date, the Company has had no significant losses in connection with guarantees of independents’ and affiliates’ borrowings. The following table shows the Company’s approximate commercial commitments as of
December 31, 2018
:
Other Commercial Commitments
|
|
|
Amount of Commitment Expiration per Period
|
|||||||||||||||||
|
(In thousands)
|
Total Amounts
Committed
|
Less Than
1 Year
|
1-3 Years
|
3-5 Years
|
Over
5 Years
|
||||||||||||||
|
Standby letters of credit
|
$
|
63,504
|
|
$
|
63,504
|
|
$
|
—
|
|
$
|
—
|
|
$
|
—
|
|
||||
|
Guaranteed borrowings of independents and affiliates
|
759,726
|
|
4,861
|
|
746,857
|
|
8,008
|
|
—
|
|
|||||||||
|
Total commercial commitments
|
$
|
823,230
|
|
$
|
68,365
|
|
$
|
746,857
|
|
$
|
8,008
|
|
$
|
—
|
|
||||
In addition, the Company sponsors defined benefit pension plans that may obligate us to make contributions to the plans from time to time. Contributions in
2018
were
$57.5 million
. We expect to make
$6.0 million
in cash contributions to our qualified defined benefit plans in 2019, however, contributions required for 2019 and future years will depend on a number of unpredictable factors including the market performance of the plans’ assets and future changes in interest rates that affect the actuarial measurement of the plans’ obligations.
Share Repurchases
In
2018
, the Company repurchased approximately
1.0 million
shares of its common stock and the Company had remaining authority to purchase approximately 16.4 million shares of its common stock at
December 31, 2018
.
23
CRITICAL ACCOUNTING POLICIES
General
Management’s Discussion and Analysis of Financial Condition and Results of Operations is based upon our consolidated financial statements, which have been prepared in accordance with U.S. GAAP. The preparation of our consolidated financial statements requires management to make estimates, assumptions and judgments that affect the reported amounts of assets, liabilities, net sales and expenses and related disclosure of contingent assets and liabilities. Management bases its estimates on historical experience and on various other assumptions that are believed to be reasonable under the circumstances, the results of which form the basis for making judgments about the carrying values of assets and liabilities that are not readily apparent from other sources. Actual results may differ from these estimates under different assumptions or conditions.
We describe in this section certain critical accounting policies that require us to make significant estimates, assumptions and judgments. An accounting policy is deemed to be critical if it requires an accounting estimate to be made based on assumptions about matters that are uncertain at the time the estimate is made and if different estimates that reasonably could have been used, or changes in the accounting estimates that are reasonably likely to occur periodically, could materially impact the consolidated financial statements. Management believes the following critical accounting policies reflect its most significant estimates and assumptions used in the preparation of the consolidated financial statements. For further information on the critical accounting policies, see the summary of significant accounting policies footnote in the Consolidated Financial Statements.
Inventories — Provisions for Slow Moving and Obsolescence
The Company identifies slow moving or obsolete inventories and estimates appropriate provisions related thereto. Historically, these losses have not been significant as the vast majority of the Company’s inventories are not highly susceptible to obsolescence and a majority are eligible for return under various vendor return programs. While the Company has no reason to believe its inventory return privileges will be discontinued in the future, its risk of loss associated with obsolete or slow moving inventories would increase if such were to occur.
Allowance for Doubtful Accounts — Methodology
The Company evaluates the collectability of trade accounts receivable based on a combination of factors. The Company estimates an allowance for doubtful accounts as a percentage of net sales based on historical bad debt experience and periodically adjusts this estimate when the Company becomes aware of a specific customer’s inability to meet its financial obligations (e.g., bankruptcy filing) or as a result of changes in the overall aging of accounts receivable. While the Company has a large customer base that is geographically dispersed, a general economic downturn in any of the industry segments in which the Company operates could result in higher than expected defaults and, therefore, the need to revise estimates for bad debts. For the years ended
December 31, 2018
,
2017
and
2016
, the Company recorded provisions for doubtful accounts of approximately
$17.1 million
, $13.9 million, and $11.5 million, respectively.
Consideration Received from Vendors
The Company may enter into agreements at the beginning of each year with many of its vendors that provide for inventory purchase incentives. Generally, the Company earns inventory purchase incentives upon achieving specified volume purchasing levels or other criteria. The Company accrues for the receipt of these incentives as part of its inventory cost based on cumulative purchases of inventory to date and projected inventory purchases through the end of the year. While management believes the Company will continue to receive consideration from vendors in 2019 and beyond, there can be no assurance that vendors will continue to provide comparable amounts of incentives in the future or that we will be able to achieve the specified volumes necessary to take advantage of such incentives.
Impairment of Property, Plant and Equipment and Goodwill and Other Intangible Assets
At least annually, the Company evaluates property, plant and equipment, goodwill and other intangible assets for potential impairment indicators. The Company’s judgments regarding the existence of impairment indicators are based on market conditions and operational performance, among other factors. Future events could cause the Company to conclude that impairment indicators exist and that assets associated with a particular operation are impaired. Evaluating for impairment also requires the Company to estimate future operating results and cash flows which requires judgment by management. Any resulting impairment loss could have a material adverse impact on the Company’s financial condition and results of operations.
Employee Benefit Plans
The Company’s benefit plan committees in the U.S. and Canada establish investment policies and strategies and regularly monitor the performance of the Company’s pension plan assets. The plans in Europe are unfunded and therefore there are no plan assets. The pension plan investment strategy implemented by the Company’s management is to achieve long-term objectives and invest the pension assets in accordance with the applicable pension legislation in the U.S. and Canada, as well as fiduciary standards. The long-term primary objectives for the pension plan funds are to provide for a reasonable amount of long-term growth of capital
24
without undue exposure to risk, protect the assets from erosion of purchasing power and provide investment results that meet or exceed the pension plans’ actuarially assumed long-term rates of return. The Company’s investment strategy with respect to pension plan assets is to generate a return in excess of the passive portfolio benchmark (47% S&P 500 Index, 5% Russell Mid Cap Index, 7% Russell 2000 Index, 5% MSCI EAFE Index, 5% DJ Global Moderate Index, 3% MSCI Emerging Market Net, and 28% BarCap U.S. Govt/Credit).
We make several critical assumptions in determining our pension plan assets and liabilities and related pension income. We believe the most critical of these assumptions are the expected rate of return on plan assets and the discount rate. Other assumptions we make relate to employee demographic factors such as rate of compensation increases, mortality rates, retirement patterns and turnover rates. Refer to Note 10 of the Consolidated Financial Statements for more information regarding these assumptions.
Based on the investment policy for the pension plans, as well as an asset study that was performed based on the Company’s asset allocations and future expectations, the Company’s expected rate of return on plan assets for measuring 2019 pension income is 7.12% for the plans. The asset study forecasted expected rates of return for the approximate duration of the Company’s benefit obligations, using capital market data and historical relationships.
The discount rate is chosen as the rate at which pension obligations could be effectively settled and is based on capital market conditions as of the measurement date. We have matched the timing and duration of the expected cash flows of our pension obligations to a yield curve generated from a broad portfolio of high-quality fixed income debt instruments to select our discount rate. Based upon this cash flow matching analysis, we selected a weighted average discount rate for the plans of 4.36% at
December 31, 2018
.
Net periodic benefit income for our defined benefit pension plans was
$15.8 million
, $12.6 million, and $13.4 million for the years ended
December 31, 2018
,
2017
and
2016
, respectively. The income associated with the pension plans in
2018
,
2017
and
2016
reflects the impact of the hard freeze effective December 31, 2013. No further benefits were provided after this date for additional credited service or earnings and all participants became fully vested as of December 31, 2013. Refer to Note 10 of the Consolidated Financial Statements for more information regarding employee benefit plans.
Business Combinations
From time to time, the Company may enter into business combinations. The Company generally recognizes the identifiable assets acquired, the liabilities assumed, and any noncontrolling interests in an acquiree at their fair values as of the date of acquisition. The Company measures goodwill as the excess of consideration transferred, which the Company also measures at fair value, over the net of the acquisition date fair values of the identifiable assets acquired and liabilities assumed. The acquisition method of accounting requires the Company to make significant estimates and assumptions regarding the fair values of the elements of a business combination as of the date of acquisition, including the fair values of identifiable intangible assets, deferred tax asset valuation allowances, liabilities, including those related to debt, pensions and other postretirement plans, uncertain tax positions, contingent consideration and contingencies. This method also requires the Company to refine these estimates over a measurement period not to exceed one year to reflect new information obtained about facts and circumstances that existed as of the acquisition date that, if known, would have affected the measurement of the amounts recognized as of that date. If the Company is required to adjust provisional amounts that it has recorded for the fair values of assets and liabilities in connection with acquisitions, these adjustments could have a material impact on the the Company's financial condition and results of operations.
Significant estimates and assumptions in estimating the fair value of acquired customer relationships and other identifiable intangible assets include future cash flows that the Company expects to generate from the acquired assets. If the subsequent actual results and updated projections of the underlying business activity change compared with the assumptions and projections used to develop these values, the Company could record impairment charges. In addition, the Company has estimated the economic lives of certain acquired tangible and intangible assets and these lives are used to calculate depreciation and amortization expense. If the Company's estimates of the economic lives change, depreciation or amortization expenses could be increased or decreased, or the acquired asset could be impaired.
Self Insurance
The Company is self-insured for the majority of group health insurance costs. A reserve for claims incurred but not reported is developed by analyzing historical claims data provided by the Company’s claims administrators. These reserves are included in accrued expenses in the accompanying consolidated balance sheets as the expenses are expected to be paid within one year.
Long-term insurance liabilities consist primarily of reserves for the workers’ compensation program. In addition, the Company carries various large risk deductible workers’ compensation policies for the majority of workers’ compensation liabilities. The Company records the workers’ compensation reserves based on an analysis performed by an independent actuary. The analysis calculates development factors, which are applied to total reserves as provided by the various insurance companies who underwrite the program. While the Company believes that the assumptions used to calculate these liabilities are appropriate, significant differences in actual experience or significant changes in these assumptions may materially affect workers’ compensation costs.
25
Income Taxes
The Company accounts for income taxes under the asset and liability method. Under this method, deferred tax assets and liabilities are determined based on the differences between the financial statement carrying amount and the tax basis of assets and liabilities using enacted tax rates in effect for the year in which the differences are expected to reverse. Deferred tax assets and liabilities are recorded net as noncurrent deferred income taxes. In addition, valuation allowances are recorded to reduce deferred tax assets to the amount that will more likely than not be realized. In making this determination, the Company considers all available positive and negative evidence including projected future taxable income, future reversals of existing temporary differences, recent financial operations and tax planning strategies.
The Company recognizes a tax benefit from uncertain tax positions when it is more likely than not that the position will be sustained upon examination, including resolutions of any related appeals or litigation processes, based on the technical merits.
RECENTLY ISSUED ACCOUNTING PRONOUNCEMENTS
Refer to the summary of significant accounting policies footnote in the Consolidated Financial Statements for information on recent accounting pronouncements.
QUARTERLY RESULTS OF OPERATIONS
The following is a summary of the quarterly results of operations for the years ended
December 31, 2018
and
2017
:
|
|
Three Months Ended
|
|||||||||||||||
|
(In thousands except per share data)
|
March 31, 2018
|
June 30, 2018
|
Sept. 30, 2018
|
Dec. 31, 2018
|
||||||||||||
|
Net sales
|
$
|
4,586,294
|
|
$
|
4,822,065
|
|
$
|
4,722,922
|
|
$
|
4,603,792
|
|
||||
|
Gross profit
|
$
|
1,435,807
|
|
$
|
1,521,586
|
|
$
|
1,484,235
|
|
$
|
1,542,159
|
|
||||
|
Net income
|
$
|
176,576
|
|
$
|
226,972
|
|
$
|
220,227
|
|
$
|
186,699
|
|
||||
|
Earnings per share:
|
||||||||||||||||
|
Basic
|
$
|
1.20
|
|
$
|
1.55
|
|
$
|
1.50
|
|
$
|
1.28
|
|
||||
|
Diluted
|
$
|
1.20
|
|
$
|
1.54
|
|
$
|
1.49
|
|
$
|
1.27
|
|
||||
|
|
Three Months Ended
|
|||||||||||||||
|
(In thousands except per share data)
|
March 31, 2017
|
June 30, 2017
|
Sept. 30, 2017
|
Dec. 31, 2017
|
||||||||||||
|
Net sales
|
$
|
3,905,641
|
|
$
|
4,100,178
|
|
$
|
4,095,906
|
|
$
|
4,207,076
|
|
||||
|
Gross profit
|
$
|
1,155,721
|
|
$
|
1,239,712
|
|
$
|
1,226,890
|
|
$
|
1,284,075
|
|
||||
|
Net income
|
$
|
160,160
|
|
$
|
189,972
|
|
$
|
158,442
|
|
$
|
108,183
|
|
||||
|
Earnings per share:
|
||||||||||||||||
|
Basic
|
$
|
1.08
|
|
$
|
1.29
|
|
$
|
1.08
|
|
$
|
0.74
|
|
||||
|
Diluted
|
$
|
1.08
|
|
$
|
1.29
|
|
$
|
1.08
|
|
$
|
0.73
|
|
||||
We recorded the quarterly earnings per share amounts as if each quarter was a discrete period. As a result, the sum of the basic and diluted earnings per share will not necessarily total the annual basic and diluted earnings per share.
The preparation of interim consolidated financial statements requires management to make estimates and assumptions for the amounts reported in the interim condensed consolidated financial statements. Specifically, the Company makes estimates and assumptions in its interim condensed consolidated financial statements for inventory adjustments, the accrual of bad debts, the accrual of insurance reserves, customer sales returns and volume incentives earned, among others. Inventory adjustments (including adjustments for a majority of inventories that are valued under the last-in, first-out ("LIFO") method) are accrued on an interim basis and adjusted in the fourth quarter based on the annual book to physical inventory adjustment and LIFO valuation, which is performed each year-end. Reserves for bad debts, insurance and customer sales returns are estimated and accrued on an interim basis based upon historical experience. Volume incentives are estimated based upon cumulative and projected purchasing levels. Income taxes are estimated on an interim basis to reflect the impact of tax reform assumptions and other considerations. The estimates and assumptions for interim reporting may change upon final determination at year-end, and such changes may be significant. The effect of these adjustments in
2018
and
2017
was not significant.
26
ITEM 7A
.
QUANTITATIVE AND QUALITATIVE DISCLOSURES ABOUT MARKET RISK
.
Although the Company does not face material risks related to commodity prices, the Company is exposed to changes in interest rates and in foreign currency rates with respect to foreign currency denominated operating revenues and expenses.
Foreign Currency
The Company has translation gains or losses that result from translation of the results of operations of an operating unit’s foreign functional currency into U.S. dollars for consolidated financial statement purposes. For the periods presented, the Company’s principal foreign currency exchange exposure is the Canadian dollar, the functional currency of our Canadian operations, the Australian dollar, the functional currency of our Australasian operations and, to a lesser extent, and the Mexican peso, the functional currency of our Mexican operations. Effective in November 2017, the Company increased its foreign currency exchange exposure to include the Euro, the functional currency of our European operations. Foreign currency exchange exposure, particularly in regard to the Canadian and Australian dollar and, to a lesser extent, the Euro and Mexican peso, positively impacted our results for the year ended
December 31, 2018
.
During
2018
and
2017
, it was estimated that a 10% shift in exchange rates between those foreign functional currencies and the U.S. dollar would have impacted translated net sales by approximately $486 million and $287 million, respectively. A 15% shift in exchange rates between those functional currencies and the U.S. dollar would have impacted translated net sales by approximately $729 million in
2018
and $430 million in
2017
. A 20% shift in exchange rates between those functional currencies and the U.S. dollar would have impacted translated net sales by approximately $972 million in
2018
and $574 million in
2017
.
Interest Rates
Primarily as a result of the new debt issued in 2017 associated with the purchase of AAG, the Company is subject to interest rate volatility with regard to existing and future issuances of debt. We monitor our mix of fixed-rate and variable-rate debt as well as our mix of short-term debt and long-term debt. From time to time, we enter into interest rate swap agreements to manage our exposure to interest rate fluctuations. Based on the Company's variable-rate debt and derivative instruments outstanding as of December 31, 2018, we estimate that a 100 basis point increase in interest rates would have increased interest expense by $12 million in 2018. However, this increase in interest expense would have been partially offset by the increase in interest income related to higher interest rates.
ITEM 8
.
FINANCIAL STATEMENTS AND SUPPLEMENTARY DATA
.
The information required by this Item 8 is set forth in a separate section of this report. See “Index to Consolidated Financial Statements” beginning on page F-1.
|
ITEM 9
.
|
CHANGES IN AND DISAGREEMENTS WITH ACCOUNTANTS ON ACCOUNTING AND FINANCIAL DISCLOSURE
.
|
Not applicable.
ITEM 9A
.
CONTROLS AND PROCEDURES
.
Management’s conclusion regarding the effectiveness of disclosure controls and procedures
As of the end of the period covered by this report, an evaluation was performed under the supervision and with the participation of the Company’s management, including the Chief Executive Officer ("CEO") and Chief Financial Officer ("CFO"), of the effectiveness of the Company’s disclosure controls and procedures, as such term is defined in SEC Rule 13a-15(e). Based on that evaluation, the Company’s management, including the CEO and CFO, concluded that due to a material weakness in internal control over financial reporting, the Company’s internal control over financial reporting was not effective as of December 31, 2018. A material weakness is a deficiency, or combination of deficiencies, in internal control over financial reporting, such that there is a reasonable possibility that a material misstatement of the company’s annual or interim financial statements will not be prevented or detected on a timely basis.
There were no material errors in the financial results or balances identified as a result of the control deficiencies, and there were no restatements of prior period financial statements and no change in previously released financial results were required as the result of these control deficiencies.
Notwithstanding the identified material weakness, management, including our CEO (principal executive officer) and CFO (principal financial officer), believes the consolidated financial statements included in this Annual Report on Form 10-K fairly represent in all material respects our financial condition, results of operations and cash flows at and for the periods presented in accordance with the United States Generally Accepted Accounting Principles ("U.S. GAAP").
27
Management’s report on internal control over financial reporting
The management of Genuine Parts Company and its Subsidiaries (the “Company”) is responsible for establishing and maintaining adequate internal control over financial reporting as defined in Rule 13a-15(f) under the Securities Exchange Act of 1934.
The Company’s internal control system was designed to provide reasonable assurance to the Company’s management and to the board of directors regarding the preparation and fair presentation of the Company’s published consolidated financial statements. The Company’s internal control over financial reporting includes those policies and procedures that:
i. pertain to the maintenance of records that, in reasonable detail, accurately and fairly reflect the transactions and dispositions of the assets of the Company;
ii. provide reasonable assurance that transactions are recorded as necessary to permit preparation of financial statements in accordance with U.S. generally accepted accounting principles, and that receipts and expenditures of the Company are being made only in accordance with authorizations of management and directors of the Company; and
iii. provide reasonable assurance regarding prevention or timely detection of unauthorized acquisition, use or disposition of the Company’s assets that could have a material effect on the financial statements.
All internal control systems, no matter how well designed, have inherent limitations and may not prevent or detect misstatements. Therefore, even those systems determined to be effective can provide only reasonable assurance with respect to financial statement preparation and presentation. Also, projections of any evaluation of effectiveness to future periods are subject to the risk that controls may become inadequate because of changes in conditions or that the degree of compliance with the policies or procedures may deteriorate.
The Company’s management, including our CEO and CFO, assessed the effectiveness of the Company’s internal control over financial reporting as of December 31, 2018. In making this assessment, it used the criteria set forth by the Committee of Sponsoring Organizations of the Treadway Commission (2013 framework) ("COSO") in “Internal Control-Integrated Framework.” Based on this assessment, management concluded that due to a material weakness in internal control over financial reporting, the Company’s internal control over financial reporting was not effective as of December 31, 2018.
Alliance Automotive Group ("AAG") was acquired on November 2, 2017 and generated approximately 10% of the Company’s total net sales for the year ended December 31, 2018. AAG is headquartered in London, U.K. and is organized in approximately 220 legal entities across France, Germany, the U.K. and Poland. AAG’s financial reporting processes rely upon numerous information technology applications. The internal control environment is structured in decentralized accounting and reporting locations across Europe. Prior to the Company’s November 2017 acquisition, AAG was not required to file reports with the Securities and Exchange Commission ("SEC"). AAG also was not previously required to prepare consolidated financial statements in accordance with accounting principles generally accepted in the United States of America (“US GAAP”) in any prior reporting period. Prior to 2018, AAG was not included in the Company's assessment of the effectiveness of our internal control over financial reporting, as the SEC rules provide companies one year to assess controls at an acquired entity. Accordingly, within this period, we performed our first comprehensive assessment of the design and effectiveness of internal controls at AAG and determined that AAG’s internal control over financial reporting was ineffective as of December 31, 2018.
Specifically, AAG did not adequately identify, design and maintain internal controls at the transaction level that mitigate the risk of material misstatement in financial reporting processes nor did it maintain appropriate information technology controls. Financial reporting processes include i) the financial statement closing process, ii) the processing and accounting for revenue, purchasing, merchandise inventory, treasury and payroll transactions and iii) the related information technology applications. In certain instances, proper controls were identified, but they did not operate for a sufficient period of time for management to conclude, through testing, that controls were designed and operating effectively.
Ernst & Young LLP has issued a report expressing an adverse opinion on the effectiveness of the Company's internal control over financial reporting as of December 31, 2018. Ernst & Young LLP's report on our internal control over financial reporting is set forth below.
Remediation efforts to address material weakness
Management has and will continue to enhance the risk assessment process and design and implementation of internal control over financial reporting at AAG. This includes initiation of compensating controls and enhanced and revised design of existing financial reporting controls, information technology applications and procedures at AAG. The material weakness will not be considered remediated until the applicable controls operate for a sufficient period of time and management has concluded, through testing, that these controls are operating effectively.
28
Changes in internal control over financial reporting
Other than with respect to the remediation efforts described above, there have been no changes in the Company’s internal control over financial reporting during the Company’s fourth fiscal quarter ended
December 31, 2018
that have materially affected, or are reasonably likely to materially affect, the Company’s internal control over financial reporting.
29
Report of Independent Registered Public Accounting Firm
To the Shareholders and the Board of Directors of Genuine Parts Company and Subsidiaries
Opinion on Internal Control over Financial Reporting
We have audited Genuine Parts Company and Subsidiaries’ internal control over financial reporting as of December 31, 2018, based on criteria established in Internal Control-Integrated Framework issued by the Committee of Sponsoring Organizations of the Treadway Commission (2013 framework) (the COSO criteria). In our opinion, because of the effect of the material weakness described below on the achievement of the objectives of the control criteria, Genuine Parts Company and Subsidiaries (the Company) has not maintained effective internal control over financial reporting as of December 31, 2018, based on the COSO criteria.
A material weakness is a deficiency, or combination of deficiencies, in internal control over financial reporting, such that there is a reasonable possibility that a material misstatement of the company’s annual or interim financial statements will not be prevented or detected on a timely basis. The following material weakness has been identified and included in management’s assessment. The Company’s European subsidiary, Alliance Automotive Group, did not adequately identify, design and maintain internal controls at the transaction level that mitigate the risk of material misstatement in financial reporting processes nor did it maintain appropriate information technology controls for its information technology systems. Financial reporting processes include i) the financial statement closing process, ii) the processing and accounting for revenue, purchasing, merchandise inventory, treasury and payroll transactions and iii) the related information technology applications.
We also have audited, in accordance with the standards of the Public Company Accounting Oversight Board (United States) (PCAOB), the consolidated balance sheets of Genuine Parts Company and Subsidiaries as of December 31, 2018 and 2017, the related consolidated statements of income and comprehensive income, equity and cash flows for each of the three years in the period ended December 31, 2018, and the related notes. This material weakness was considered in determining the nature, timing and extent of audit tests applied in our audit of the 2018 consolidated financial statements, and this report does not affect our report dated February 25, 2019, which expressed an unqualified opinion thereon.
Basis of Opinion
The Company’s management is responsible for maintaining effective internal control over financial reporting and for its assessment of the effectiveness of internal control over financial reporting included in the accompanying Management’s Report on Internal Control over Financial Reporting. Our responsibility is to express an opinion on the Company’s internal control over financial reporting based on our audit. We are a public accounting firm registered with the PCAOB and are required to be independent with respect to the Company in accordance with the U.S. federal securities laws and the applicable rules and regulations of the Securities and Exchange Commission and the PCAOB.
We conducted our audit in accordance with the standards of the PCAOB. Those standards require that we plan and perform the audit to obtain reasonable assurance about whether effective internal control over financial reporting was maintained in all material respects.
Our audit included obtaining an understanding of internal control over financial reporting, assessing the risk that a material weakness exists, testing and evaluating the design and operating effectiveness of internal control based on the assessed risk, and performing such other procedures as we considered necessary in the circumstances. We believe that our audit provides a reasonable basis for our opinion.
Definition and Limitations of Internal Control Over Financial Reporting
A company’s internal control over financial reporting is a process designed to provide reasonable assurance regarding the reliability of financial reporting and the preparation of financial statements for external purposes in accordance with generally accepted accounting principles. A company’s internal control over financial reporting includes those policies and procedures that (1) pertain to the maintenance of records that, in reasonable detail, accurately and fairly reflect the transactions and dispositions of the assets of the company; (2) provide reasonable assurance that transactions are recorded as necessary to permit preparation of financial statements in accordance with generally accepted accounting principles, and that receipts and expenditures of the company are being made only in accordance with authorizations of management and directors of the company; and (3) provide reasonable assurance regarding prevention or timely detection of unauthorized acquisition, use, or disposition of the company’s assets that could have a material effect on the financial statements.
30
Because of its inherent limitations, internal control over financial reporting may not prevent or detect misstatements. Also, projections of any evaluation of effectiveness to future periods are subject to the risk that controls may become inadequate because of changes in conditions, or that the degree of compliance with the policies or procedures may deteriorate.
/s/ Ernst & Young LLP
Atlanta, Georgia
February 25, 2019
31
ITEM 9B
.
OTHER INFORMATION
.
Not applicable.
32
PART III.
ITEM 10.
DIRECTORS, EXECUTIVE OFFICERS AND CORPORATE GOVERNANCE
.
EXECUTIVE OFFICERS OF THE COMPANY.
Executive officers of the Company are elected by the Board of Directors and each serves at the pleasure of the Board of Directors until his or her successor has been elected and qualified, or until his or her earlier death, resignation, removal, retirement or disqualification. The current executive officers of the Company are:
Paul
D. Donahue
, age 62, was appointed Chief Executive Officer of the Company in May 2016. Mr. Donahue has been President of the Company since January 2012 and a director of the Company since April 2012. Previously, Mr. Donahue served as President of the Company’s U.S. Automotive Parts Group from July 2009 to February 1, 2016. Mr. Donahue served as Executive Vice President of the Company from August 2007 until his appointment as President in 2012. Previously, Mr. Donahue was President and Chief Operating Officer of S.P. Richards Company from 2004 to 2007 and was Executive Vice President-Sales and Marketing in 2003, the year he joined the Company.
Carol
B. Yancey
, age 55, has been Executive Vice President and Chief Financial Officer of the Company since March 2013, and also held the additional title of Corporate Secretary of the Company up to February 2015. Ms. Yancey was Senior Vice President — Finance and Corporate Secretary from 2005 until her appointment as Executive Vice President — Finance in November 2012. Previously, Ms. Yancey was named Vice President of the Company in 1999 and Corporate Secretary in 1995. Prior to that, she served as Assistant Corporate Secretary from 1994 to 1995, Director of Shareholder Relations from 1992 to1994, and Director of Investor Relations in 1991, when she joined the Company.
Scott
A. Sonnemaker
, age 55, joined the Company on February 1, 2019 as Group President, North American Automotive. Prior to this, he was Senior Vice President, International Americas at Sysco Corporation from 2016 to 2019. Previously, Mr. Sonnemaker served as Sysco's Chief Customer Officer and Senior Vice President of Sales from 2010 to 2016.
James
R. Neill
, age 57, was appointed Senior Vice President of Human Resources of the Company in April 2014. Mr. Neill was Senior Vice President of Employee Development and HR Services from April 2013 until his appointment as Senior Vice President of Human Resources of the Company. Previously, Mr. Neill served as the Senior Vice President of Human Resources at Motion Industries from 2008 to 2013. Mr. Neill joined Motion in 2006 as Vice President of Human Resources and served in that role from 2006 to 2007.
Randall
P. Breaux
, age 56, was appointed President of Motion Industries on January 1, 2019. Mr. Breaux was Executive Vice President of Marketing, Distribution, and Strategic Planning at Motion from January 2018 until his appointment to President. Previously, he served as Senior Vice President of Marketing, Distribution, and Purchasing from 2015 to 2017. Mr. Breaux joined Motion in 2011 as Senior Vice President of Marketing, Product Management, and Strategic Planning.
Kevin
E. Herron
, age 56, was appointed President of the U.S. Automotive Parts group on January 1, 2019. Mr. Herron previously served as Executive Vice President - U.S. Automotive Parts Group from 2018 to 2019, and previous to that role, he was Group Senior Vice President of the U.S. Automotive Parts Group from 2014 to 2018. From 2010 to 2014 he was Division Vice President for the Midwest of the U.S. Automotive Parts Group, and prior to that he was Regional Vice President for UAP, the Canadian division of the Automotive Parts Group. He held that role from 2006 to 2010. Prior to that, Mr. Herron served as Regional Vice President of Corporate Stores from 2004 to 2006, and previously he was District Manager in Maine from 1995 to 2003 and held the same title in Vermont during 1994. Prior to those roles, he was Area Manager in Syracuse, New York from 1991 to 1993. Mr. Herron began his career at the Company as a management trainee in Syracuse and served in that role from 1989 to 1990.
Further information required by this item is set forth under the heading “Nominees for Director”, under the heading “Corporate Governance — Code of Conduct and Ethics”, under the heading “Corporate Governance — Board Committees — Audit Committee”, under the heading “Corporate Governance — Director Nominating Process” and under the heading “Section 16(a) Beneficial Ownership Reporting Compliance” of the Proxy Statement and is incorporated herein by reference.
ITEM 11
.
EXECUTIVE COMPENSATION
.
Information required by this item is set forth under the headings “Executive Compensation”, “Additional Information Regarding Executive Compensation”, “
2018
Grants of Plan-Based Awards”, “
2018
Outstanding Equity Awards at Fiscal Year-End”, “
2018
Option Exercises and Stock Vested”, “
2018
Pension Benefits”, “
2018
Nonqualified Deferred Compensation”, “Post Termination Payments and Benefits”, “Compensation, Nominating and Governance Committee Report”, “Compensation, Nominating and Governance Committee Interlocks and Insider Participation” and “Compensation of Directors” of the Proxy Statement and is incorporated herein by reference.
33
|
ITEM 12
.
|
SECURITY OWNERSHIP OF CERTAIN BENEFICIAL OWNERS AND MANAGEMENT AND RELATED STOCKHOLDER MATTERS
.
|
Certain information required by this item is set forth below. Additional information required by this item is set forth under the headings “Security Ownership of Certain Beneficial Owners” and “Security Ownership of Management” of the Proxy Statement and is incorporated herein by reference.
Equity Compensation Plan Information
The following table gives information as of
December 31, 2018
about the common stock that may be issued under all of the Company’s existing equity compensation plans:
|
Plan Category
|
(a)
Number of Securities to be Issued upon Exercise of Outstanding Options, Warrants and Rights(1) |
|
(b)
Weighted Average Exercise Price of Outstanding Options, Warrants and Rights |
(c)
Number of Securities Remaining Available for Future Issuance Under Equity Compensation Plans (Excluding Securities Reflected in Column (a)) |
|
|||||
|
Equity Compensation Plans Approved by Shareholders:
|
1,857,768
|
|
(2)
|
$
|
77.32
|
|
—
|
|
|
|
|
1,791,931
|
|
(3)
|
$
|
94.80
|
|
8,134,991
|
|
(5)
|
||
|
Equity Compensation Plans Not Approved by Shareholders:
|
103,779
|
|
(4)
|
n/a
|
|
896,221
|
|
|
||
|
Total
|
3,753,478
|
|
|
—
|
|
9,031,212
|
|
|
||
|
(1)
|
Reflects the maximum number of shares issuable pursuant to the exercise or conversion of stock options, stock appreciation rights, restricted stock units and common stock equivalents. The actual number of shares issued upon exercise of stock appreciation rights is calculated based on the excess of fair market value of our common stock on date of exercise and the grant price of the stock appreciation rights.
|
|
(2)
|
Genuine Parts Company 2006 Long-Term Incentive Plan
|
|
(3)
|
Genuine Parts Company 2015 Incentive Plan
|
|
(4)
|
Genuine Parts Company Directors' Deferred Compensation Plan, as amended
|
|
(5)
|
All of these shares are available for issuance pursuant to grants of full-value stock awards.
|
ITEM 13
.
CERTAIN RELATIONSHIPS AND RELATED TRANSACTIONS, AND DIRECTOR INDEPENDENCE
.
Information required by this item is set forth under the headings “Corporate Governance — Independent Directors” and “Transactions with Related Persons” of the Proxy Statement and is incorporated herein by reference.
ITEM 14
.
PRINCIPAL ACCOUNTANT FEES AND SERVICES
.
Information required by this item is set forth under the heading “Proposal 3. Ratification of Selection of Independent Auditors” of the Proxy Statement and is incorporated herein by reference.
34
PART IV
.
ITEM 15
.
EXHIBITS AND FINANCIAL STATEMENT SCHEDULES
.
(a) Documents filed as part of this report
(1) Financial Statements
The following consolidated financial statements of Genuine Parts Company and Subsidiaries are included in this Annual Report on Form 10-K. See Index to Consolidated Financial Statements on Page F-1.
Report of independent registered public accounting firm on the financial statements
Consolidated balance sheets —
December 31, 2018
and
2017
Consolidated statements of income and comprehensive income — Years ended
December 31, 2018
,
2017
and
2016
Consolidated statements of equity — Years ended
December 31, 2018
,
2017
and
2016
Consolidated statements of cash flows — Years ended
December 31, 2018
,
2017
and
2016
Notes to consolidated financial statements —
December 31, 2018
(2) Financial Statement Schedules
Schedules are omitted because the information is not required or because the information required is included in the financial statements or notes thereto.
(3) Exhibits
The following exhibits are filed as part of or incorporated by reference in this report. Exhibits that are incorporated by reference to documents filed previously by the Company under the Securities Exchange Act of 1934, as amended, are filed with the Securities and Exchange Commission under File No. 1-5690. The Company will furnish a copy of any exhibit upon request to the Company’s Corporate Secretary.
Instruments with respect to long-term debt where the total amount of securities authorized there under does not exceed 10% of the total assets of the Registrant and its subsidiaries on a consolidated basis have not been filed. The Registrant agrees to furnish to the Commission a copy of each such instrument upon request.
|
Exhibit Number
|
Description
|
|
|
Exhibit 2.1
|
||
|
Exhibit 3.1
|
|
|
|
Exhibit 3.2
|
|
|
|
Exhibit 4.2
|
|
Specimen Common Stock Certificate. (Incorporated herein by reference from the Company’s Registration Statement on Form S-1, Registration No. 33-63874.)
|
35
|
Exhibit 10.2*
|
|
|
|
Exhibit 10.3*
|
|
|
|
Exhibit 10.4*
|
|
|
|
Exhibit 10.5*
|
|
|
|
Exhibit 10.6*
|
|
|
|
Exhibit 10.7*
|
|
|
|
Exhibit 10.8*
|
|
|
|
Exhibit 10.9*
|
|
|
|
Exhibit 10.10*
|
|
|
|
Exhibit 10.11*
|
|
|
|
Exhibit 10.12*
|
|
|
|
Exhibit 10.13*
|
|
|
|
Exhibit 10.14*
|
|
|
|
Exhibit 10.15*
|
|
|
|
Exhibit 10.16*
|
|
|
36
|
Exhibit 10.17*
|
|
|
|
Exhibit 10.18*
|
|
|
|
Exhibit 10.19*
|
|
|
|
Exhibit 10.20*
|
|
|
|
Exhibit 10.21*
|
|
|
|
Exhibit 10.22*
|
|
|
|
Exhibit 10.23*
|
||
|
Exhibit 10.24*
|
|
|
|
Exhibit 10.25*
|
|
|
|
Exhibit 10.26*
|
|
|
|
Exhibit 10.27
|
||
|
Exhibit 10.28
|
||
|
Exhibit 10.29
|
||
|
Exhibit 10.30*
|
||
|
Exhibit 10.31*
|
||
|
*
|
Indicates management contracts and compensatory plans and arrangements.
|
37
|
Exhibit 21
|
|
|
|
Exhibit 23
|
|
|
|
Exhibit 31.1
|
|
|
|
Exhibit 31.2
|
|
|
|
Exhibit 32.1
|
|
|
|
Exhibit 32.2
|
|
|
|
Exhibit 101
|
|
Interactive data files pursuant to Rule 405 of Regulation S-T:
|
|
|
(i) the Consolidated Balance Sheets as of December 31, 2018 and 2017; (ii) the Consolidated Statements of Income and Comprehensive Income for the Years ended December 31, 2018, 2017 and 2016; (iii) the Consolidated Statements of Equity for the Years ended December 31, 2018, 2017 and 2016; (iv) the Consolidated Statements of Cash Flows for Years ended December 31, 2018, 2017 and 2016; (v) the Notes to the Consolidated Financial Statements, tagged as blocks of text.
|
|
ITEM 16
.
FORM 10-K SUMMARY.
Not applicable.
38
SIGNATURES
.
Pursuant to the requirements of Section 13 or 15(d) of the Securities Exchange Act of 1934, the Registrant has duly caused this Report to be signed on its behalf by the undersigned, thereunto duly authorized.
GENUINE PARTS COMPANY
|
/s/ Paul D. Donahue
|
|
2/25/2019
|
|
|
/s/ Carol B. Yancey
|
|
2/25/2019
|
|
|
|
Paul D. Donahue
|
|
(Date)
|
|
|
Carol B. Yancey
|
|
(Date)
|
|
|
|
President and Chief Executive Officer
|
|
|
Executive Vice President and Chief Financial and Accounting Officer
|
|
|||||
39
Pursuant to the requirements of the Securities Exchange Act of 1934, this Report has been signed below by the following persons on behalf of the Registrant and in the capacities and on the dates indicated.
|
/s/ Paul D. Donahue
|
|
2/18/2019
|
|
|
/s/ Carol B. Yancey
|
|
2/18/2019
|
|
|
|
Paul D. Donahue
|
|
(Date)
|
|
|
Carol B. Yancey
|
|
(Date)
|
|
|
|
Director
President and Chief Executive Officer (Principal Executive Officer)
|
|
Executive Vice President and Chief Financial and Accounting Officer (Principal Financial and Accounting Officer)
|
|||||||
|
/s/ Thomas C. Gallagher
|
|
2/18/2019
|
|
|
/s/ Elizabeth W. Camp
|
|
2/18/2019
|
|
|
|
Thomas C. Gallagher
|
|
(Date)
|
|
|
Elizabeth W. Camp
|
|
(Date)
|
|
|
|
Director and Chairman
|
|
Director
|
|||||||
|
/s/ Gary P. Fayard
|
|
2/18/2019
|
|
|
/s/ P. Russell Hardin
|
2/18/2019
|
|
||
|
Gary P. Fayard
|
|
(Date)
|
|
|
P. Russell Hardin
|
|
|||
|
Director
|
|
Director
|
|||||||
|
/s/ John R. Holder
|
|
2/18/2019
|
|
|
/s/ Donna W. Hyland
|
|
2/18/2019
|
|
|
|
John R. Holder
|
|
(Date)
|
|
|
Donna W. Hyland
|
|
(Date)
|
|
|
|
Director
|
|
Director
|
|||||||
|
/s/ John D. Johns
|
|
2/18/2019
|
|
|
/s/ Robert C. Loudermilk, Jr.
|
2/18/2019
|
|
||
|
John D. Johns
|
|
(Date)
|
|
|
Robert C. Loudermilk, Jr.
|
|
(Date)
|
|
|
|
Director
|
|
Director
|
|||||||
|
/s/ Wendy B. Needham
|
|
2/18/2019
|
|
|
/s/ E. Jenner Wood, III
|
|
2/18/2019
|
|
|
|
Wendy B. Needham
|
|
(Date)
|
|
|
E. Jenner Wood, III
|
|
(Date)
|
|
|
|
Director
|
|
Director
|
|||||||
|
|
|
|
|||||||
|
|
|
|
|
||||||
|
|
|||||||||
40
ANNUAL REPORT ON FORM 10-K
INDEX TO CONSOLIDATED FINANCIAL STATEMENTS
|
|
Page
|
F-1
Report of Independent Registered Public Accounting Firm
To the Shareholders and the Board of Directors of Genuine Parts Company and Subsidiaries
Opinion on the Financial Statements
We have audited the accompanying consolidated balance sheets of Genuine Parts Company and Subsidiaries (the Company) as of December 31, 2018 and 2017, the related consolidated statements of income and comprehensive income, equity and cash flows for each of the three years in the period ended December 31, 2018, and the related notes (collectively referred to as the “consolidated financial statements”). In our opinion, the consolidated financial statements present fairly, in all material respects, the financial position of the Company at December 31, 2018 and 2017, and the results of its operations and its cash flows for each of the three years in the period ended December 31, 2018, in conformity with U.S. generally accepted accounting principles.
We also have audited, in accordance with the standards of the Public Company Accounting Oversight Board (United States) (PCAOB), the Company’s internal control over financial reporting as of December 31, 2018, based on criteria established in Internal Control-Integrated Framework issued by the Committee of Sponsoring Organizations of the Treadway Commission (2013 framework) and our report dated February 25, 2019 expressed an adverse opinion thereon.
Basis for Opinion
These financial statements are the responsibility of the Company's management. Our responsibility is to express an opinion on the Company’s financial statements based on our audits. We are a public accounting firm registered with the PCAOB and are required to be independent with respect to the Company in accordance with the U.S. federal securities laws and the applicable rules and regulations of the Securities and Exchange Commission and the PCAOB.
We conducted our audits in accordance with the standards of the PCAOB. Those standards require that we plan and perform the audit to obtain reasonable assurance about whether the financial statements are free of material misstatement, whether due to error or fraud. Our audits included performing procedures to assess the risks of material misstatement of the financial statements, whether due to error or fraud, and performing procedures that respond to those risks. Such procedures included examining, on a test basis, evidence regarding the amounts and disclosures in the financial statements. Our audits also included evaluating the accounting principles used and significant estimates made by management, as well as evaluating the overall presentation of the financial statements. We believe that our audits provide a reasonable basis for our opinion.
/s/ Ernst & Young LLP
We have served as the Company’s auditor since 1948.
Atlanta, Georgia
February 25, 2019
F-2
Genuine Parts Company and Subsidiaries
Consolidated Balance Sheets
(In Thousands, Except Share Data and per Share Amounts)
|
|
As of December 31,
|
||||||
|
|
2018
|
|
2017
|
||||
|
Assets
|
|||||||
|
Current assets:
|
|||||||
|
Cash and cash equivalents
|
$
|
333,547
|
|
$
|
314,899
|
|
|
|
Trade accounts receivable, net
|
2,493,636
|
|
2,421,563
|
|
|||
|
Merchandise inventories, net
|
3,609,389
|
|
3,771,089
|
|
|||
|
Prepaid expenses and other current assets
|
1,139,118
|
|
805,342
|
|
|||
|
Total current assets
|
7,575,690
|
|
7,312,893
|
|
|||
|
Goodwill
|
2,128,776
|
|
2,153,988
|
|
|||
|
Other intangible assets, less accumulated amortization
|
1,411,642
|
|
1,400,392
|
|
|||
|
Deferred tax assets
|
29,509
|
|
40,158
|
|
|||
|
Other assets
|
510,192
|
|
568,248
|
|
|||
|
Property, plant, and equipment, net
|
1,027,231
|
|
936,702
|
|
|||
|
$
|
12,683,040
|
|
$
|
12,412,381
|
|
||
|
Liabilities and equity
|
|||||||
|
Current liabilities:
|
|||||||
|
Trade accounts payable
|
$
|
3,995,789
|
|
$
|
3,634,859
|
|
|
|
Current portion of debt
|
711,147
|
|
694,989
|
|
|||
|
Other current liabilities
|
1,088,428
|
|
1,045,177
|
|
|||
|
Dividends payable
|
105,369
|
|
99,000
|
|
|||
|
Total current liabilities
|
5,900,733
|
|
5,474,025
|
|
|||
|
Long-term debt
|
2,432,133
|
|
2,550,020
|
|
|||
|
Pension and other post-retirement benefit liabilities
|
235,228
|
|
229,868
|
|
|||
|
Deferred tax liabilities
|
196,843
|
|
193,308
|
|
|||
|
Other long-term liabilities
|
446,112
|
|
501,004
|
|
|||
|
Equity:
|
|||||||
|
Preferred stock, par value $1 per share — authorized 10,000,000 shares; none issued
|
—
|
|
—
|
|
|||
|
Common stock, par value $1 per share - authorized 450,000,000 shares; issued and outstanding - 2018 - 145,936,613 shares and 2017 - 146,652,615 shares
|
145,937
|
|
146,653
|
|
|||
|
Additional paid-in capital
|
78,380
|
|
68,126
|
|
|||
|
Accumulated other comprehensive loss
|
(1,115,078
|
)
|
(852,592
|
)
|
|||
|
Retained earnings
|
4,341,212
|
|
4,049,965
|
|
|||
|
Total parent equity
|
3,450,451
|
|
3,412,152
|
|
|||
|
Noncontrolling interests in subsidiaries
|
21,540
|
|
52,004
|
|
|||
|
Total equity
|
3,471,991
|
|
3,464,156
|
|
|||
|
$
|
12,683,040
|
|
$
|
12,412,381
|
|
||
See accompanying notes.
F-3
Genuine Parts Company and Subsidiaries
Consolidated Statements of Income and Comprehensive Income
(In Thousands, Except per Share Amounts)
|
|
Year Ended December 31,
|
||||||||||
|
|
2018
|
|
2017
|
|
2016
|
||||||
|
Net sales
|
$
|
18,735,073
|
|
$
|
16,308,801
|
|
$
|
15,339,713
|
|
||
|
Cost of goods sold
|
12,751,286
|
|
11,402,403
|
|
10,740,106
|
|
|||||
|
Gross margin
|
5,983,787
|
|
4,906,398
|
|
4,599,607
|
|
|||||
|
Operating expenses:
|
|||||||||||
|
Selling, administrative, and other expenses
|
4,615,290
|
|
3,726,233
|
|
3,391,971
|
|
|||||
|
Depreciation and amortization
|
241,635
|
|
167,691
|
|
147,487
|
|
|||||
|
Provision for doubtful accounts
|
17,147
|
|
13,932
|
|
11,515
|
|
|||||
|
Total operating expenses
|
4,874,072
|
|
3,907,856
|
|
3,550,973
|
|
|||||
|
Non-operating expenses (income):
|
|||||||||||
|
Interest expense
|
101,925
|
|
41,486
|
|
21,084
|
|
|||||
|
Other
|
(67,822
|
)
|
(52,212
|
)
|
(46,790
|
)
|
|||||
|
Total non-operating expenses (income)
|
34,103
|
|
(10,726
|
)
|
(25,706
|
)
|
|||||
|
Income before income taxes
|
1,075,612
|
|
1,009,268
|
|
1,074,340
|
|
|||||
|
Income taxes
|
265,138
|
|
392,511
|
|
387,100
|
|
|||||
|
Net income
|
$
|
810,474
|
|
$
|
616,757
|
|
$
|
687,240
|
|
||
|
Basic net income per common share
|
$
|
5.53
|
|
$
|
4.19
|
|
$
|
4.61
|
|
||
|
Diluted net income per common share
|
$
|
5.50
|
|
$
|
4.18
|
|
$
|
4.59
|
|
||
|
Weighted average common shares outstanding
|
146,657
|
|
147,140
|
|
149,051
|
|
|||||
|
Dilutive effect of stock options and nonvested restricted stock awards
|
584
|
|
561
|
|
753
|
|
|||||
|
Weighted average common shares outstanding — assuming dilution
|
147,241
|
|
147,701
|
|
149,804
|
|
|||||
|
Net income
|
$
|
810,474
|
|
$
|
616,757
|
|
$
|
687,240
|
|
||
|
Other comprehensive (loss) income, net of tax:
|
|||||||||||
|
Foreign currency translation adjustment
|
(233,235
|
)
|
137,694
|
|
(8,957
|
)
|
|||||
|
Net gain (loss) on cash flow and net investment hedges, net of income taxes of 2018 — $10,398; 2017 — $9,711
|
28,114
|
|
(17,388
|
)
|
—
|
|
|||||
|
Pension and postretirement benefit adjustments, net of income taxes of 2018 — $21,297; 2017 — $20,539; 2016 — $50,144
|
(57,365
|
)
|
40,123
|
|
(73,446
|
)
|
|||||
|
Other comprehensive (loss) income, net of tax
|
(262,486
|
)
|
160,429
|
|
(82,403
|
)
|
|||||
|
Comprehensive income
|
$
|
547,988
|
|
$
|
777,186
|
|
$
|
604,837
|
|
||
See accompanying notes.
F-4
Genuine Parts Company and Subsidiaries
Consolidated Statements of Equity
(In Thousands, Except Share Data and per Share Amounts)
|
|
Common Stock
|
Additional
Paid-In
Capital
|
Accumulated
Other
Comprehensive
Loss
|
Retained
Earnings
|
Total
Parent
Equity
|
Non-
controlling
Interests in
Subsidiaries
|
Total
Equity
|
||||||||||||||||||||||||
|
Shares
|
Amount
|
||||||||||||||||||||||||||||||
|
Balance at January 1, 2016
|
150,081,474
|
|
$
|
150,081
|
|
$
|
41,353
|
|
$
|
(930,618
|
)
|
$
|
3,885,751
|
|
$
|
3,146,567
|
|
$
|
12,675
|
|
$
|
3,159,242
|
|
||||||||
|
Net income
|
—
|
|
—
|
|
—
|
|
—
|
|
687,240
|
|
687,240
|
|
—
|
|
687,240
|
|
|||||||||||||||
|
Other comprehensive loss, net of tax
|
—
|
|
—
|
|
—
|
|
(82,403
|
)
|
—
|
|
(82,403
|
)
|
—
|
|
(82,403
|
)
|
|||||||||||||||
|
Cash dividends declared, $2.63 per share
|
—
|
|
—
|
|
—
|
|
—
|
|
(391,852
|
)
|
(391,852
|
)
|
—
|
|
(391,852
|
)
|
|||||||||||||||
|
Share-based awards exercised, including tax benefit of $12,021
|
340,703
|
|
341
|
|
(4,467
|
)
|
—
|
|
—
|
|
(4,126
|
)
|
—
|
|
(4,126
|
)
|
|||||||||||||||
|
Share-based compensation
|
—
|
|
—
|
|
19,719
|
|
—
|
|
—
|
|
19,719
|
|
—
|
|
19,719
|
|
|||||||||||||||
|
Purchase of stock
|
(2,011,755
|
)
|
(2,012
|
)
|
—
|
|
—
|
|
(179,405
|
)
|
(181,417
|
)
|
—
|
|
(181,417
|
)
|
|||||||||||||||
|
Noncontrolling interest activities
|
—
|
|
—
|
|
—
|
|
—
|
|
—
|
|
—
|
|
953
|
|
953
|
|
|||||||||||||||
|
Balance at December 31, 2016
|
148,410,422
|
|
148,410
|
|
56,605
|
|
(1,013,021
|
)
|
4,001,734
|
|
3,193,728
|
|
13,628
|
|
3,207,356
|
|
|||||||||||||||
|
Net income
|
—
|
|
—
|
|
—
|
|
—
|
|
616,757
|
|
616,757
|
|
—
|
|
616,757
|
|
|||||||||||||||
|
Other comprehensive income, net of tax
|
—
|
|
—
|
|
—
|
|
160,429
|
|
—
|
|
160,429
|
|
—
|
|
160,429
|
|
|||||||||||||||
|
Cash dividends declared, $2.70 per share
|
—
|
|
—
|
|
—
|
|
—
|
|
(396,891
|
)
|
(396,891
|
)
|
—
|
|
(396,891
|
)
|
|||||||||||||||
|
Share-based awards exercised, including tax benefit of $3,134
|
131,232
|
|
132
|
|
(5,371
|
)
|
—
|
|
—
|
|
(5,239
|
)
|
—
|
|
(5,239
|
)
|
|||||||||||||||
|
Share-based compensation
|
—
|
|
—
|
|
16,892
|
|
—
|
|
—
|
|
16,892
|
|
—
|
|
16,892
|
|
|||||||||||||||
|
Purchase of stock
|
(1,889,039
|
)
|
(1,889
|
)
|
—
|
|
—
|
|
(171,635
|
)
|
(173,524
|
)
|
—
|
|
(173,524
|
)
|
|||||||||||||||
|
Noncontrolling interest activities
|
—
|
|
—
|
|
—
|
|
—
|
|
—
|
|
—
|
|
38,376
|
|
38,376
|
|
|||||||||||||||
|
Balance at December 31, 2017
|
146,652,615
|
|
146,653
|
|
68,126
|
|
(852,592
|
)
|
4,049,965
|
|
3,412,152
|
|
52,004
|
|
3,464,156
|
|
|||||||||||||||
|
Net income
|
—
|
|
—
|
|
—
|
|
—
|
|
810,474
|
|
810,474
|
|
—
|
|
810,474
|
|
|||||||||||||||
|
Other comprehensive loss, net of tax
|
—
|
|
—
|
|
—
|
|
(262,486
|
)
|
—
|
|
(262,486
|
)
|
—
|
|
(262,486
|
)
|
|||||||||||||||
|
Cash dividends declared, $2.88 per share
|
—
|
|
—
|
|
—
|
|
—
|
|
(422,352
|
)
|
(422,352
|
)
|
—
|
|
(422,352
|
)
|
|||||||||||||||
|
Share-based awards exercised, including tax benefit of $4,232
|
235,058
|
|
235
|
|
(10,462
|
)
|
—
|
|
—
|
|
(10,227
|
)
|
—
|
|
(10,227
|
)
|
|||||||||||||||
|
Share-based compensation
|
—
|
|
—
|
|
20,716
|
|
—
|
|
—
|
|
20,716
|
|
—
|
|
20,716
|
|
|||||||||||||||
|
Purchase of stock
|
(951,060
|
)
|
(951
|
)
|
—
|
|
—
|
|
(91,032
|
)
|
(91,983
|
)
|
—
|
|
(91,983
|
)
|
|||||||||||||||
|
Cumulative effect from adoption of ASU 2014-09, net of tax
|
—
|
|
—
|
|
—
|
|
—
|
|
(5,843
|
)
|
(5,843
|
)
|
—
|
|
(5,843
|
)
|
|||||||||||||||
|
Noncontrolling interest activities
|
—
|
|
—
|
|
—
|
|
—
|
|
—
|
|
—
|
|
(30,464
|
)
|
(30,464
|
)
|
|||||||||||||||
|
Balance at December 31, 2018
|
145,936,613
|
|
$
|
145,937
|
|
$
|
78,380
|
|
$
|
(1,115,078
|
)
|
$
|
4,341,212
|
|
$
|
3,450,451
|
|
$
|
21,540
|
|
$
|
3,471,991
|
|
||||||||
See accompanying notes.
F-5
Genuine Parts Company and Subsidiaries
Consolidated Statements of Cash Flows
(In Thousands)
|
|
Year Ended December 31
|
||||||||||
|
|
2018
|
2017
|
2016
|
||||||||
|
Operating activities
|
|||||||||||
|
Net income
|
$
|
810,474
|
|
$
|
616,757
|
|
$
|
687,240
|
|
||
|
Adjustments to reconcile net income to net cash provided by operating activities:
|
|||||||||||
|
Depreciation and amortization
|
241,635
|
|
167,691
|
|
147,487
|
|
|||||
|
Excess tax benefits from share-based compensation
|
(4,232
|
)
|
(3,134
|
)
|
(12,021
|
)
|
|||||
|
Loss (gain) on sale of property, plant, and equipment
|
1,579
|
|
(3,989
|
)
|
(15,237
|
)
|
|||||
|
Deferred income taxes
|
3,891
|
|
65,990
|
|
33,226
|
|
|||||
|
Share-based compensation
|
20,716
|
|
16,892
|
|
19,719
|
|
|||||
|
Foreign exchange gain
|
—
|
|
(14,051
|
)
|
—
|
|
|||||
|
Changes in operating assets and liabilities:
|
|||||||||||
|
Trade accounts receivable, net
|
(72,041
|
)
|
(19,273
|
)
|
(53,544
|
)
|
|||||
|
Merchandise inventories, net
|
(73,173
|
)
|
(9,923
|
)
|
(64,214
|
)
|
|||||
|
Trade accounts payable
|
364,639
|
|
61,474
|
|
240,717
|
|
|||||
|
Other short-term assets and liabilities
|
(97,864
|
)
|
(1,544
|
)
|
37,271
|
|
|||||
|
Other long-term assets and liabilities
|
(50,460
|
)
|
(61,847
|
)
|
(74,566
|
)
|
|||||
|
334,690
|
|
198,286
|
|
258,838
|
|
||||||
|
Net cash provided by operating activities
|
1,145,164
|
|
815,043
|
|
946,078
|
|
|||||
|
Investing activities
|
|||||||||||
|
Purchases of property, plant and equipment
|
(232,422
|
)
|
(156,760
|
)
|
(160,643
|
)
|
|||||
|
Proceeds from sale of property, plant, and equipment
|
14,665
|
|
21,275
|
|
28,811
|
|
|||||
|
Acquisition of businesses and other investing activities
|
(278,367
|
)
|
(1,494,795
|
)
|
(462,167
|
)
|
|||||
|
Net cash used in investing activities
|
(496,124
|
)
|
(1,630,280
|
)
|
(593,999
|
)
|
|||||
|
Financing activities
|
|||||||||||
|
Proceeds from debt
|
5,064,291
|
|
6,630,294
|
|
4,350,000
|
|
|||||
|
Payments on debt
|
(5,124,265
|
)
|
(4,350,222
|
)
|
(4,100,000
|
)
|
|||||
|
Payments on acquired debt
|
—
|
|
(833,775
|
)
|
—
|
|
|||||
|
Share-based awards exercised
|
(10,227
|
)
|
(5,239
|
)
|
(16,147
|
)
|
|||||
|
Excess tax benefits from share-based compensation
|
—
|
|
—
|
|
12,021
|
|
|||||
|
Dividends paid
|
(415,983
|
)
|
(395,475
|
)
|
(386,863
|
)
|
|||||
|
Purchase of stock
|
(91,983
|
)
|
(173,524
|
)
|
(181,417
|
)
|
|||||
|
Other financing activities
|
(30,663
|
)
|
—
|
|
—
|
|
|||||
|
Net cash (used in) provided by financing activities
|
(608,830
|
)
|
872,059
|
|
(322,406
|
)
|
|||||
|
Effect of exchange rate changes on cash
|
(21,562
|
)
|
15,198
|
|
1,575
|
|
|||||
|
Net increase in cash and cash equivalents
|
18,648
|
|
72,020
|
|
31,248
|
|
|||||
|
Cash and cash equivalents at beginning of year
|
314,899
|
|
242,879
|
|
211,631
|
|
|||||
|
Cash and cash equivalents at end of year
|
$
|
333,547
|
|
$
|
314,899
|
|
$
|
242,879
|
|
||
|
Supplemental disclosures of cash flow information
|
|||||||||||
|
Cash paid during the year for:
|
|||||||||||
|
Income taxes
|
$
|
236,536
|
|
$
|
298,827
|
|
$
|
374,865
|
|
||
|
Interest
|
$
|
102,131
|
|
$
|
38,401
|
|
$
|
19,043
|
|
||
See accompanying notes.
F-6
Genuine Parts Company and Subsidiaries
Notes to Consolidated Financial Statements
December 31, 2018
(in thousands, except per share data)
1. Summary of Significant Accounting Policies
Business
Genuine Parts Company and all of its majority-owned subsidiaries (the "Company") is a distributor of automotive replacement parts, industrial parts and materials and business products. The Company serves a diverse customer base through approximately
3,100
locations in North America, Australasia and Europe and, therefore, has limited exposure from credit losses to any particular customer, region, or industry segment. The Company performs periodic credit evaluations of its customers’ financial condition and generally does not require collateral. The Company has evaluated subsequent events through the date the financial statements were issued.
Principles of Consolidation
The consolidated financial statements include all of the accounts of the Company. The net income attributable to noncontrolling interests is not material to the Company’s consolidated net income. Intercompany accounts and transactions have been eliminated in consolidation.
Use of Estimates
The preparation of the consolidated financial statements, in conformity with U.S. generally accepted accounting principles, requires management to make estimates and assumptions that affect the amounts reported in the consolidated financial statements and accompanying notes. Actual results may differ from those estimates and the differences could be material.
Revenue Recognition
Refer to the revenue recognition footnote for additional information related to the Company's revenue recognition policy.
Foreign Currency Translation
The consolidated balance sheets and statements of income and comprehensive income of the Company’s foreign subsidiaries have been translated into U.S. dollars at the current and average exchange rates, respectively. The foreign currency translation adjustment is included as a component of accumulated other comprehensive loss.
Cash and Cash Equivalents
The Company considers all highly liquid investments with original maturities of three months or less when purchased to be cash equivalents.
Trade Accounts Receivable and the Allowance for Doubtful Accounts
The Company evaluates the collectability of trade accounts receivable based on a combination of factors. The Company estimates an allowance for doubtful accounts as a percentage of net sales based on historical bad debt experience and periodically adjusts this estimate when the Company becomes aware of a specific customer’s inability to meet its financial obligations (e.g., bankruptcy filing) or as a result of changes in the overall aging of accounts receivable. While the Company has a large customer base that is geographically dispersed, a general economic downturn in any of the industry segments in which the Company operates could result in higher than expected defaults and, therefore, the need to revise estimates for bad debts. For the years ended
December 31, 2018
,
2017
, and
2016
, the Company recorded provisions for doubtful accounts of approximately
$17,147
,
$13,932
, and
$11,515
, respectively. At
December 31, 2018
and
2017
, the allowance for doubtful accounts was approximately
$21,888
and
$17,612
, respectively.
Merchandise Inventories, Including Consideration Received From Vendors
Merchandise inventories are valued at the lower of cost or net realizable value. Cost is determined by the last-in, first-out ("LIFO") method for a majority of U.S. automotive and industrial parts, and by the first-in, first-out ("FIFO") method for business products and certain non-U.S. and other inventories. If the FIFO method had been used for all inventories, cost would have been approximately
$479,500
and
$440,550
higher than reported at
December 31, 2018
and
2017
, respectively. During
2017
and 2016, reductions in industrial parts inventories resulted in liquidations of LIFO inventory layers, which reduced cost of goods sold by approximately
$2,000
and
$6,000
, respectively. There were
no
LIFO liquidations in 2018.
F-7
Genuine Parts Company and Subsidiaries
Notes to Consolidated Financial Statements
December 31, 2018
The Company identifies slow moving or obsolete inventories and estimates appropriate provisions related thereto. Historically, these losses have not been significant as the vast majority of the Company’s inventories are not highly susceptible to obsolescence and are eligible for return under various vendor return programs. While the Company has no reason to believe its inventory return privileges will be discontinued in the future, its risk of loss associated with obsolete or slow moving inventories would increase if such were to occur.
The Company enters into agreements at the beginning of each year with many of its vendors that provide for inventory purchase incentives. Generally, the Company earns inventory purchase incentives upon achieving specified volume purchasing levels or other criteria. The Company accrues for the receipt of these incentives as part of its inventory cost based on cumulative purchases of inventory to date and projected inventory purchases through the end of the year. While management believes the Company will continue to receive consideration from vendors in
2019
and beyond, there can be no assurance that vendors will continue to provide comparable amounts of incentives in the future.
Prepaid Expenses and Other Current Assets
Prepaid expenses and other current assets consist primarily of amounts due from vendors, prepaid expenses, and income and other taxes receivable. Upon adoption of Accounting Standards Update ("ASU") 2014-09,
Revenue from Contracts with Customers
("ASU 2014-09"), the Company also began classifying its estimate of merchandise returns expected in the next twelve months, which was
$233,192
as of
December 31, 2018
, in prepaid expenses and other current assets. This estimate was historically classified in merchandise inventories, net and the amount was
$203,589
as of December 31, 2017.
Goodwill
The Company reviews its goodwill annually in the fourth quarter, or sooner if circumstances indicate that the carrying amount may exceed fair value. The Company tests goodwill for impairment at the reporting unit level, which is an operating segment or a level below an operating segment (a component). A component is a reporting unit if the component constitutes a business for which discrete financial information is available and management regularly reviews the operating results of that component. However, two or more components of an operating segment are aggregated and deemed a single reporting unit if the components have similar economic characteristics.
To review goodwill for impairment, the Company first assesses qualitative factors to determine whether it is more likely than not that the fair value of a single reporting unit is less than its carrying amount. If the Company concludes that it is more likely than not that the fair value of the intangible asset is less than its carrying value, then a two-step quantitative goodwill impairment test is performed.
The first step is to compare the fair value of a reporting unit to its carrying value. The Company typically uses discounted cash flow models to determine the fair value of its reporting units. The assumptions used in these models are consistent with those the Company believes hypothetical marketplace participants would use. If the fair value of a reporting unit is less than its carrying amount, then the second step of the impairment test must be performed in order to determine the amount of impairment loss (if any). The second step compares the implied fair value of the reporting unit's goodwill with the carrying amount of that goodwill. If the carrying amount of the reporting unit's goodwill exceeds its implied fair value, an impairment charge is recognized in an amount equal to that excess.
The Company completed both qualitative and quantitative assessments for the year ended December 31, 2018. Based on these analyses, the Company determined that the fair value of its reporting units are in excess of their carrying amounts and that there were no indicators that goodwill was impaired. Therefore,
no
impairments were recognized for the years ended
December 31, 2018
,
2017
, or
2016
.
No events or changes in circumstances have occurred since the date of the Company's most recent annual impairment test that would more likely than not reduce the fair value of the reporting unit below its carrying amount.
Long-Lived Assets Other Than Goodwill
The Company assesses its long-lived assets other than goodwill for impairment whenever facts and circumstances indicate that the carrying amount may not be fully recoverable. To analyze recoverability, the Company projects undiscounted net future cash flows over the remaining life of such assets. If these projected cash flows are less than the carrying amount, an impairment would be recognized, resulting in a write-down of assets with a corresponding charge to earnings. Impairment losses, if any, are measured based upon the difference between the carrying amount and the fair value of the assets.
F-8
Genuine Parts Company and Subsidiaries
Notes to Consolidated Financial Statements
December 31, 2018
Other Assets
Other assets consist primarily of cash surrender value of life insurance policies, equity method investments, guarantee fees receivable, and deferred compensation benefits.
Property, Plant, and Equipment
Property, plant, and equipment are stated at cost. Depreciation and amortization are primarily determined on a straight-line basis over the following estimated useful lives of each asset: buildings and improvements,
10
to
40
years; machinery and equipment,
5
to
15
years.
Other Current Liabilities
Other current liabilities consist primarily of reserves for sales returns expected within the next year, accrued compensation, accrued customer incentives, accrued income and other taxes, and other reserves for expenses incurred.
Other Long-term Liabilities
Other long-term liabilities consist primarily of reserves for sales returns expected after the next year, guarantee obligations, accrued taxes, deferred rent and other non-current obligations.
Self-Insurance
The Company is self-insured for the majority of group health insurance costs. A reserve for claims incurred but not reported is developed by analyzing historical claims data provided by the Company’s claims administrators. These reserves are included in accrued expenses in the accompanying consolidated balance sheets as the expenses are expected to be paid within one year.
Long-term insurance liabilities consist primarily of reserves for the workers’ compensation program. In addition, the Company carries various large risk deductible workers’ compensation policies for the majority of workers’ compensation liabilities. The Company records the workers’ compensation reserves based on an analysis performed by an independent actuary. The analysis calculates development factors, which are applied to total reserves as provided by the various insurance companies who underwrite the program. While the Company believes that the assumptions used to calculate these liabilities are appropriate, significant differences in actual experience or significant changes in these assumptions may materially affect workers’ compensation costs.
Accumulated Other Comprehensive Loss
Accumulated other comprehensive loss is comprised of the following:
|
|
December 31,
|
|||||||
|
2018
|
2017
|
|||||||
|
Foreign currency translation
|
$
|
(499,482
|
)
|
$
|
(266,247
|
)
|
||
|
Unrealized gain (loss) on cash flow and net investment hedges, net of tax
|
10,726
|
|
(17,388
|
)
|
||||
|
Unrecognized net actuarial loss, net of tax
|
(623,363
|
)
|
(566,876
|
)
|
||||
|
Unrecognized prior service cost, net of tax
|
(2,959
|
)
|
(2,081
|
)
|
||||
|
Total accumulated other comprehensive loss
|
$
|
(1,115,078
|
)
|
$
|
(852,592
|
)
|
||
F-9
Genuine Parts Company and Subsidiaries
Notes to Consolidated Financial Statements
December 31, 2018
The following table presents the changes in accumulated other comprehensive loss by component for the years ended on
December 31, 2018
and
2017
:
|
|
Changes in Accumulated Other Comprehensive
Loss by Component
|
|||||||||||||||||||
|
Pension
Benefits
|
Other Post-Retirement Benefits
|
Cash Flow and Net Investment Hedges
|
Foreign
Currency
Translation
|
Total
|
||||||||||||||||
|
Beginning balance, January 1, 2017
|
$
|
(607,468
|
)
|
$
|
(1,612
|
)
|
$
|
—
|
|
$
|
(403,941
|
)
|
$
|
(1,013,021
|
)
|
|||||
|
Other comprehensive income (loss) before reclassifications, net of tax
|
16,640
|
|
307
|
|
(17,388
|
)
|
137,694
|
|
137,253
|
|
||||||||||
|
Amounts reclassified from accumulated other comprehensive loss, net of tax
|
23,385
|
|
(209
|
)
|
—
|
|
—
|
|
23,176
|
|
||||||||||
|
Net current period other comprehensive income (loss)
|
40,025
|
|
98
|
|
(17,388
|
)
|
137,694
|
|
160,429
|
|
||||||||||
|
Ending balance, December 31, 2017
|
(567,443
|
)
|
(1,514
|
)
|
(17,388
|
)
|
(266,247
|
)
|
(852,592
|
)
|
||||||||||
|
Other comprehensive (loss) income before reclassifications, net of tax
|
(85,677
|
)
|
20
|
|
26,563
|
|
(233,235
|
)
|
(292,329
|
)
|
||||||||||
|
Amounts reclassified from accumulated other comprehensive loss, net of tax
|
28,581
|
|
(289
|
)
|
1,551
|
|
—
|
|
29,843
|
|
||||||||||
|
Net current period other comprehensive (loss) income
|
(57,096
|
)
|
(269
|
)
|
28,114
|
|
(233,235
|
)
|
(262,486
|
)
|
||||||||||
|
Ending balance, December 31, 2018
|
$
|
(624,539
|
)
|
$
|
(1,783
|
)
|
$
|
10,726
|
|
$
|
(499,482
|
)
|
$
|
(1,115,078
|
)
|
|||||
The accumulated other comprehensive loss components related to the pension benefits are included in the computation of net periodic benefit income in the employee benefit plans footnote and related to the cash flow and net investment hedges are included in the derivatives and hedging footnote.
Business Combinations
From time to time, the Company enters into business combinations. The Company recognizes the identifiable assets acquired, the liabilities assumed, and any noncontrolling interests in an acquiree at their fair values as of the date of acquisition. The Company measures goodwill as the excess of consideration transferred, which the Company also measures at fair value, over the net of the acquisition date fair values of the identifiable assets acquired and liabilities assumed. The acquisition method of accounting requires the Company to make significant estimates and assumptions regarding the fair values of the elements of a business combination as of the date of acquisition, including the fair values of identifiable intangible assets, deferred tax asset valuation allowances, liabilities including those related to debt, pensions and other postretirement plans, uncertain tax positions, contingent consideration and contingencies. This method also requires the Company to refine these estimates over a measurement period not to exceed one year to reflect new information obtained about facts and circumstances that existed as of the acquisition date that, if known, would have affected the measurement of the amounts recognized as of that date. If the Company is required to adjust provisional amounts that were recorded for the fair values of assets and liabilities in connection with acquisitions, these adjustments could have a material impact on the Company's consolidated financial statements.
Significant estimates and assumptions in estimating the fair value of acquired customer relationships and other identifiable intangible assets include future cash flows that the Company expects to generate from the acquired assets. If the subsequent actual results and updated projections of the underlying business activity change compared with the assumptions and projections used to develop these values, the Company could record impairment charges. In addition, the Company has estimated the economic lives of certain acquired assets and these lives are used to calculate depreciation and amortization expense. If the Company estimates the economic lives change, depreciation or amortization expenses could be increased or decreased, or the acquired asset could be impaired.
F-10
Genuine Parts Company and Subsidiaries
Notes to Consolidated Financial Statements
December 31, 2018
Fair Value of Financial Instruments
The carrying amounts reflected in the consolidated balance sheets for cash and cash equivalents, trade accounts receivable, trade accounts payable, and borrowings under the line of credit and term loan approximate their respective fair values based on the short-term nature of these instruments. At
December 31, 2018
and
2017
, the fair value of fixed rate debt was approximately
$1,427,381
and
$1,497,179
, respectively. The fair value of fixed rate debt is designated as Level 2 in the fair value hierarchy (i.e., significant observable inputs) and is based primarily on the discounted value of future cash flows using current market interest rates offered for debt of similar credit risk and maturity. At
December 31, 2018
and
2017
, the carrying value of fixed rate debt, net of debt issuance costs, was
$1,466,803
and
$1,506,400
, respectively, and is included in long-term and short-term debt in the consolidated balance sheets.
Derivatives and Hedging
The Company is exposed to various risks arising from business operations and market conditions, including fluctuations in interest rates and certain foreign currencies. When deemed appropriate, the Company uses derivative and non-derivative instruments as risk management tools to mitigate the potential impact of interest rate and foreign exchange rate risks. The objective of using these tools is to reduce fluctuations in the Company’s earnings and cash flows associated with changes in these rates. Derivative financial instruments are not used for trading or other speculative purposes. The Company has not historically incurred, and does not expect to incur in the future, any losses as a result of counterparty default related to derivative instruments.
The Company formally documents relationships between hedging instruments and hedged items, as well as the risk management objective and strategy for undertaking various hedge transactions. This process includes linking cash flow hedges to specific forecasted transactions or variability of cash flow to be paid. The Company also formally assesses, both at the hedge’s inception and on an ongoing basis, whether the designated derivative and non-derivative instruments that are used in hedging transactions are highly effective in offsetting changes in the cash flows of the hedged items. When a designated instrument is determined not to be highly effective as a hedge or the underlying hedged transaction is no longer probable, hedge accounting is discontinued prospectively.
Shipping and Handling Costs
Shipping and handling costs are classified as selling, administrative and other expenses in the accompanying consolidated statements of income and comprehensive income and totaled approximately
$390,000
,
$290,000
, and
$230,000
, for the years ended
December 31, 2018
,
2017
, and
2016
, respectively.
Advertising Costs
Advertising costs are expensed as incurred and totaled
$204,700
,
$166,000
, and
$153,100
in the years ended
December 31, 2018
,
2017
, and
2016
, respectively.
Accounting for Legal Costs
The Company’s legal costs expected to be incurred in connection with loss contingencies are expensed as such costs are incurred.
Share-Based Compensation
The Company maintains various long-term incentive plans, which provide for the granting of stock options, stock appreciation rights ("SARs"), restricted stock, restricted stock units ("RSUs"), performance awards, dividend equivalents and other share-based awards. SARs represent a right to receive upon exercise an amount, payable in shares of common stock, equal to the excess, if any, of the fair market value of the Company’s common stock on the date of exercise over the base value of the grant. The terms of such SARs require net settlement in shares of common stock and do not provide for cash settlement. RSUs represent a contingent right to receive one share of the Company’s common stock at a future date. The majority of awards previously granted vest on a pro-rata basis for periods ranging from
one
to
five
years and are expensed accordingly on a straight-line basis. Forfeitures are accounted for as they occur. The Company issues new shares upon exercise or conversion of awards under these plans.
Income Taxes
The Company accounts for income taxes under the asset and liability method. Under this method, deferred tax assets and liabilities are determined based on the differences between the financial statement carrying amount and the tax basis of assets and liabilities using enacted tax rates in effect for the year in which the differences are expected to reverse. Deferred tax assets and liabilities are recorded net as noncurrent deferred income taxes. In addition, valuation allowances are recorded to reduce deferred tax assets to the amount that will more likely than not be realized. In making this determination, the Company considers all available positive
F-11
Genuine Parts Company and Subsidiaries
Notes to Consolidated Financial Statements
December 31, 2018
and negative evidence including projected future taxable income, future reversals of existing temporary differences, recent financial operations and tax planning strategies.
The Company recognizes a tax benefit from uncertain tax positions when it is more likely than not that the position will be sustained upon examination, including resolutions of any related appeals or litigation processes, based on the technical merits.
Net Income per Common Share
Basic net income per common share is computed by dividing net income by the weighted average number of common shares outstanding during the year. The computation of diluted net income per common share includes the dilutive effect of stock options, stock appreciation rights and nonvested restricted stock awards options. Options to purchase approximately
1,490
,
1,920
, and
1,290
shares of common stock ranging from
$85
—
$100
per share were outstanding at
December 31, 2018
,
2017
, and
2016
, respectively. These options were excluded from the computation of diluted net income per common share because the options’ exercise prices were greater than the average market prices of common stock in each respective year.
Recent Accounting Pronouncements
Revenue from Contracts with Customers (Topic 606)
In May 2014, the Financial Accounting Standards Board ("FASB") issued ASU 2014-09, which creates a single, comprehensive revenue recognition model for recognizing revenue from contracts with customers. The Company adopted ASU 2014-09 and its amendments on January 1, 2018. The core principle of the new standard is that a company should recognize revenue to depict the transfer of promised goods or services to customers in an amount that reflects the consideration to which the company expects to be entitled in exchange for those goods or services. ASU 2014-09 defines a five-step process to achieve this core principle and, in doing so, it is possible more judgment and estimates may be required within the revenue recognition process than were required under previously existing guidance, including identifying performance obligations in the contract, estimating the amount of variable consideration to include in the transaction price and allocating the transaction price to each separate performance obligation, among others. ASU 2014-09 did not result in a significant change in the judgment or timing associated with the recognition of revenue from the sale of the Company’s products or services. See the revenue recognition footnote for additional information.
Leases (Topic 842)
In February 2016, the FASB issued ASU 2016-02, Leases ("ASU 2016-02"), which, among other things, requires an entity to recognize a right-of-use asset and a lease liability on the balance sheet for substantially all leases, including operating leases. Expanded disclosures with additional qualitative and quantitative information will also be required. ASU 2016-02 and its amendments are effective for interim and annual reporting periods beginning after December 15, 2018 and early adoption is permitted. The standard should be applied using a retrospective transition approach. In July 2018, the FASB issued amendments in ASU 2018-11, which provide a transition election to not restate comparative periods for the effects of applying the new standard. This transition election permits entities to change the date of initial application to the beginning of the year of adoption and to recognize the effects of applying the new standard as a cumulative-effect adjustment to the opening balance of retained earnings.
The Company will adopt ASU 2016-02 as of January 1, 2019 and apply the transition election. The Company also will elect the package of practical expedients permitted under the transition guidance within the new standard, which among other things, will allow the Company to carryforward its historical lease classifications. In addition, the Company is not electing the hindsight practical expedient to determine the reasonably certain lease term for existing leases. The Company will make an accounting policy election to keep leases with an initial term of 12 months or less off of the balance sheet. The Company will recognize those lease payments in the consolidated statements of income and comprehensive income on a straight-line basis over the lease term.
The Company estimates an increase in lease-related assets and liabilities, ranging between
$920,000
and
$1,110,000
, in the consolidated balance sheets when it adopts ASU 2016-02 and its amendments effective January 1, 2019. The Company estimates that the cumulative effect adjustment to retained earnings upon adoption will not be material. The Company does not believe the standard will materially affect consolidated net income and does not believe it will have a material impact on liquidity. The standard will have no impact on debt-covenant compliance under the Company's current debt agreements.
Income Statement - Reporting Comprehensive Income (Topic 220)
In February 2018, the FASB issued ASU 2018-02,
Reclassification of Certain Tax Effects from Accumulated Other Comprehensive Income
("ASU 2018-02"). The ASU provides that a company can make a one-time election to reclassify stranded tax effects caused by the Tax Cuts and Jobs Act from accumulated other comprehensive income to retained earnings. ASU 2018-02 is effective for periods beginning after December 15, 2018, with an election to adopt early. The Company expects to adopt the standard in 2019,
F-12
Genuine Parts Company and Subsidiaries
Notes to Consolidated Financial Statements
December 31, 2018
and estimates on a preliminary basis that it will recognize an adjustment to increase retained earnings by approximately
$125,000
on January 1, 2019.
Income Tax Reform
The Tax Cuts and Jobs Act (the "Act") was enacted December 22, 2017. The Act reduces the U.S. federal corporate tax rate from 35% to 21% for taxable years starting after December 31, 2017, and requires companies to pay a one-time transition tax on earnings of certain foreign subsidiaries that were not previously subject to U.S. Federal income tax and creates new taxes on certain foreign sourced earnings. Refer to the income taxes footnote for additional information on the Act.
Compensation-Retirement Benefits (Topic 715)
In March 2017, the FASB issued ASU 2017-07, Improving the Presentation of Net Periodic Pension Cost and Net Periodic Postretirement Benefit Cost (ASU 2017-07), which requires an entity to report the service cost component of net periodic benefit cost in the same line item as other compensation costs (selling, administrative and other expenses) and the remaining components in non-operating expense in the consolidated statements of income and comprehensive income. The Company adopted ASU 2017-07 retrospectively on January 1, 2018 and it did not have a material impact on the Company's consolidated financial statements or related disclosures. See the employee benefit plans footnote for additional information. The Company elected to use the amounts disclosed in the employee benefit plans footnote for the prior comparative period as the basis for applying the retrospective presentation.
Derivatives and Hedging (Topic 815)
In August 2017, the FASB issued ASU 2017-12,
Targeted Improvements to Accounting for Hedging Activities
("ASU 2017-12"), which eliminates the requirement to separately measure and report hedge ineffectiveness and requires companies to recognize all elements of hedge accounting that impact earnings in the same line item in the statement of income where the hedged item resides. The amendments also ease the requirements for effectiveness testing, hedge documentation and applying the critical terms match method, among other things. ASU 2017-12 is effective for interim and annual reporting periods beginning after December 15, 2018 and early adoption is permitted. The standard must be applied using a modified retrospective transition approach. The Company early adopted ASU 2017-12 as of July 1, 2018 and it did not have a material impact on the Company’s consolidated financial statements or related disclosures.
2. Revenue Recognition
The Company applied ASU 2014-09, using the modified retrospective method effective January 1, 2018. The cumulative effect of initially applying ASU 2014-09 and its amendments resulted in a reduction to the opening retained earnings balance of
$8,000
prior to the tax adjustment, at January 1, 2018 and a related adjustment to other current liabilities as of that date. Revenue for periods prior to January 1, 2018 have not been adjusted and continue to be reported under Accounting Standards Codification ("ASC"),
Revenue Recognition (Topic 605)
. Upon adoption of ASU 2014-09, the Company also began classifying its estimate of merchandise returns expected in the next twelve months, which was
$233,192
as of
December 31, 2018
, in prepaid expenses and other current assets. This estimate was historically classified in merchandise inventories, net and the amount was
$203,589
as of December 31, 2017.
The Company primarily recognizes revenue at the point the customer obtains control of the products or services and at an amount that reflects the consideration expected to be received for those products or services. Contracts with customers may include multiple performance obligations. For such arrangements, the Company allocates revenue to each performance obligation based on its relative standalone selling price and recognizes revenue upon delivery or as services are rendered.
Revenue is recognized net of allowances for returns, variable consideration and any taxes collected from customers that will be remitted to governmental authorities. Revenue recognized over time is not significant. Payment terms with customers vary by the type and location of the customer and the products or services offered. The Company does not adjust the promised amount of consideration for the effects of significant financing components based on the expectation that the period between when the Company transfers a promised good or service to a customer and when the customer pays for that good or service will be one year or less. Arrangements with customers that include payment terms extending beyond one year are not significant. Liabilities for customer incentives, discounts, or rebates are included in other current liabilities in the consolidated balance sheets.
Product Distribution Revenues
The Company generates revenue primarily by distributing products through wholesale and retail channels. For wholesale customers, revenue is recognized when title and control of the goods has passed to the customer. Retail revenue is recognized at the point of sale when the goods are transferred to customers and consideration is received. Shipping and handling activities are performed
F-13
Genuine Parts Company and Subsidiaries
Notes to Consolidated Financial Statements
December 31, 2018
prior to the customer obtaining control of the products. Costs associated with shipping and handling are considered costs to fulfill a contract and are included in selling, administrative and other expenses in the period they are incurred.
Other Revenues
The Company offers software support, product cataloging, marketing, training and other membership program and support services to certain customers. This revenue is recognized as services are performed. Revenue from these services is recognized over a short duration and the impact to our consolidated financial statements is not significant.
Variable Consideration
The Company’s products are generally sold with a right of return and may include variable consideration in the form of incentives, discounts, credits or rebates. The Company estimates variable consideration based on historical experience to determine the expected amount to which the Company will be entitled in exchange for transferring the promised goods or services to a customer. The Company recognizes estimated variable consideration as an adjustment to the transaction price when control of the related product or service is transferred. The realization of variable consideration occurs within a short period of time from product delivery; therefore, the time value of money effect is not significant.
3. Goodwill and Other Intangible Assets
The changes in the carrying amount of goodwill during the years ended
December 31, 2018
and
2017
by reportable segment, as well as other identifiable intangible assets, are summarized as follows:
|
|
Goodwill
|
||||||||||||||||||
|
|
Automotive
|
Industrial
|
Business Products
|
Total
|
Other
Intangible Assets, Net |
||||||||||||||
|
Balance as of January 1, 2017
|
$
|
607,558
|
|
$
|
266,495
|
|
$
|
82,100
|
|
$
|
956,153
|
|
$
|
618,510
|
|
||||
|
Additions
|
1,089,767
|
|
39,419
|
|
—
|
|
1,129,186
|
|
796,544
|
|
|||||||||
|
Amortization
|
—
|
|
—
|
|
—
|
|
—
|
|
(51,993
|
)
|
|||||||||
|
Foreign currency translation
|
68,183
|
|
577
|
|
(111
|
)
|
68,649
|
|
37,331
|
|
|||||||||
|
Balance as of December 31, 2017
|
1,765,508
|
|
306,491
|
|
81,989
|
|
2,153,988
|
|
1,400,392
|
|
|||||||||
|
Additions
|
55,371
|
|
19,213
|
|
—
|
|
74,584
|
|
164,348
|
|
|||||||||
|
Amortization
|
—
|
|
—
|
|
—
|
|
—
|
|
(88,972
|
)
|
|||||||||
|
Foreign currency translation
|
(99,056
|
)
|
(707
|
)
|
(33
|
)
|
(99,796
|
)
|
(64,126
|
)
|
|||||||||
|
Balance as of December 31, 2018
|
$
|
1,721,823
|
|
$
|
324,997
|
|
$
|
81,956
|
|
$
|
2,128,776
|
|
$
|
1,411,642
|
|
||||
The gross carrying amounts and accumulated amortization relating to other intangible assets at
December 31, 2018
and
2017
is as follows:
|
|
2018
|
2017
|
|||||||||||||||||||||
|
|
Gross
Carrying
Amount
|
Accumulated
Amortization
|
Net
|
Gross
Carrying
Amount
|
Accumulated
Amortization
|
Net
|
|||||||||||||||||
|
Customer relationships
|
$
|
1,356,353
|
|
$
|
(267,818
|
)
|
$
|
1,088,535
|
|
$
|
1,251,783
|
|
$
|
(199,741
|
)
|
$
|
1,052,042
|
|
|||||
|
Trademarks
|
355,117
|
|
(32,755
|
)
|
322,362
|
|
369,512
|
|
(23,056
|
)
|
346,456
|
|
|||||||||||
|
Non-competition agreements
|
5,009
|
|
(4,264
|
)
|
745
|
|
6,946
|
|
(5,052
|
)
|
1,894
|
|
|||||||||||
|
$
|
1,716,479
|
|
$
|
(304,837
|
)
|
$
|
1,411,642
|
|
$
|
1,628,241
|
|
$
|
(227,849
|
)
|
$
|
1,400,392
|
|
||||||
F-14
Genuine Parts Company and Subsidiaries
Notes to Consolidated Financial Statements
December 31, 2018
Amortization expense for other intangible assets totaled
$88,972
,
$51,993
, and
$40,870
for the years ended
December 31, 2018
,
2017
, and
2016
, respectively. Estimated other intangible assets amortization expense for the succeeding five years is as follows:
|
2019
|
$
|
88,299
|
|
|
2020
|
87,329
|
|
|
|
2021
|
87,062
|
|
|
|
2022
|
87,106
|
|
|
|
2023
|
86,567
|
|
|
|
$
|
436,363
|
|
|
4. Property, Plant & Equipment
Property, Plant & Equipment as of
December 31, 2018
and
December 31, 2017
, consisted of the following:
|
2018
|
2017
|
|||||||
|
Land
|
$
|
105,960
|
|
$
|
104,049
|
|
||
|
Buildings
|
725,781
|
|
689,389
|
|
||||
|
Machinery, equipment and other
|
1,404,184
|
|
1,187,617
|
|
||||
|
Property, plant and equipment, at cost
|
2,235,925
|
|
1,981,055
|
|
||||
|
Less: accumulated depreciation
|
1,208,694
|
|
1,044,353
|
|
||||
|
Property, plant and equipment, net
|
$
|
1,027,231
|
|
$
|
936,702
|
|
||
5. Credit Facilities
The principal amounts of the Company’s borrowings subject to variable rates totaled approximately
$1,176,477
and
$1,690,000
at
December 31, 2018
and
2017
, respectively. The weighted average interest rate on the Company’s outstanding borrowings was approximately
2.71%
and
2.70%
at
December 31, 2018
and
2017
, respectively.
On October 30, 2017, the Company entered into a multi-currency Syndicated Facility Agreement (the "Syndicated Facility") with a consortium of financial institutions. The Syndicated Facility amended the
$1,200,000
unsecured Revolving Credit Facility dated September 11, 2012 that was scheduled to mature in September 2022. The Syndicated Facility is for
$2,600,000
and expires October 30, 2022. The Syndicated Facility includes a
$1,500,000
multi-currency revolving credit facility and a
$1,100,000
Term Loan A, which requires quarterly principal payments. The Syndicated Facility interest rate is based on LIBOR plus a margin based on the Company's debt to earnings before interest, tax, depreciation and amortization ("EBITDA") ratio (
2.70
at
December 31, 2018
). The Syndicated Facility contains an uncommitted option to increase the borrowing capacity up to an additional
$1,000,000
, as well as an option to decrease the borrowing capacity or terminate the Syndicated Facility with appropriate notice. At
December 31, 2018
, the amounts outstanding under the Syndicated Facility and Term Loan A were
$604,383
and
$1,045,000
, respectively. In addition to the Syndicated Facility, the Company has
eight
Senior Fixed Rate Notes with a number of investors. The notes vary in maturity with
$50,000
maturing on July 29, 2021,
$250,000
maturing on December 2, 2023,
€225,000
maturing on October 30, 2024,
$250,000
maturing on November 30, 2026,
€250,000
maturing on October 30, 2027,
$120,000
maturing on October 30, 2027,
€125,000
maturing on October 30, 2029, and
€100,000
maturing on October 30, 2032.
Certain borrowings require the Company to comply with a financial covenant with respect to a maximum debt to EBITDA ratio. At
December 31, 2018
, the Company was in compliance with all such covenants. Due to the workers’ compensation and insurance reserve requirements in certain states, the Company also had unused letters of credit of approximately
$63,504
and
$62,019
outstanding at
December 31, 2018
and
2017
, respectively.
F-15
Genuine Parts Company and Subsidiaries
Notes to Consolidated Financial Statements
December 31, 2018
Amounts outstanding under the Company’s credit facilities, net of debt issuance cost, consist of the following:
|
|
December 31,
|
|||||||
|
2018
|
2017
|
|||||||
|
Unsecured Revolving Credit Facility, $1,500,000, LIBOR plus 1.375% variable, due October 30, 2022
|
$
|
604,383
|
|
$
|
590,000
|
|
||
|
Unsecured Term Loan A, $1,100,000, LIBOR plus 1.375% variable, due October 30, 2022
|
1,045,000
|
|
1,100,000
|
|
||||
|
Unsecured term notes:
|
||||||||
|
July 29, 2016, Series G Senior Unsecured Notes, $50,000, 2.64% fixed, due July 29, 2021
|
50,000
|
|
50,000
|
|
||||
|
December 2, 2013, Series F Senior Unsecured Notes, $250,000, 3.24% fixed, due December 2, 2023
|
250,000
|
|
250,000
|
|
||||
|
October 30, 2017, Series J Senior Unsecured Notes, €225,000, 1.40% fixed, due October 30, 2024
|
257,468
|
|
269,955
|
|
||||
|
November 30, 2016, Series H Senior Unsecured Notes, $250,000, 3.24% fixed, due November 30, 2026
|
250,000
|
|
250,000
|
|
||||
|
October 30, 2017, Series K Senior Unsecured Notes, €250,000, 1.81% fixed, due October 30, 2027
|
286,075
|
|
299,950
|
|
||||
|
October 30, 2017, Series I Senior Unsecured Notes, $120,000, 3.70% fixed, due October 30, 2027
|
120,000
|
|
120,000
|
|
||||
|
October 30, 2017, Series L Senior Unsecured Notes, €125,000, 2.02% fixed, due October 30, 2029
|
143,038
|
|
149,975
|
|
||||
|
October 30, 2017, Series M Senior Unsecured Notes, €100,000, 2.32% fixed, due October 30, 2032
|
114,430
|
|
119,980
|
|
||||
|
Other unsecured debt
|
27,093
|
|
49,990
|
|
||||
|
Total unsecured debt
|
3,147,487
|
|
3,249,850
|
|
||||
|
Unamortized debt issuance costs
|
(4,207
|
)
|
(4,841
|
)
|
||||
|
Total debt
|
3,143,280
|
|
3,245,009
|
|
||||
|
Less debt due within one year
|
711,147
|
|
694,989
|
|
||||
|
Long-term debt, excluding current portion
|
$
|
2,432,133
|
|
$
|
2,550,020
|
|
||
Approximate maturities under the Company’s credit facilities, net of debt issuance costs, are as follows:
|
2019
|
$
|
711,147
|
|
|
2020
|
111,562
|
|
|
|
2021
|
186,866
|
|
|
|
2022
|
714,366
|
|
|
|
2023
|
249,654
|
|
|
|
Thereafter
|
1,169,685
|
|
|
|
$
|
3,143,280
|
|
|
6. Derivatives and Hedging
Cash Flow Hedge
In July 2018, the Company entered into an interest rate swap to mitigate variability in forecasted interest payments on
$500,000
of the Company’s U.S. dollar-denominated unsecured variable rate debt. The interest rate swap effectively converts a portion of the floating rate interest payment into a fixed rate interest payment. The Company designated the interest rate swap as a qualifying hedging instrument and is accounting for this derivative as a cash flow hedge. The fair value of the interest rate cash flow hedge
F-16
Genuine Parts Company and Subsidiaries
Notes to Consolidated Financial Statements
December 31, 2018
was not material as of
December 31, 2018
. Gains or losses related to the interest rate cash flow hedge were not material during the year ended
December 31, 2018
.
Hedges of Net Investments in Foreign Operations
In July 2018, concurrent with the cash flow hedge described above, the Company entered into a cross-currency swap agreement to effectively convert
$500,000
of the U.S. dollar-denominated unsecured variable rate debt to fixed-rate Euro-denominated debt. The risk management objective of this transaction is to manage foreign currency risk relating to a European subsidiary and reduce the variability in the functional currency equivalent cash flows of the unsecured variable rate debt. The Company designated the cross-currency swap as a qualifying hedging instrument and is accounting for this derivative as a hedge of the foreign currency exchange rate exposure of an equal amount to the Company's Euro-denominated net investment in a European subsidiary. The fair value of the cross currency hedge was not material as of
December 31, 2018
. Gains or losses related to the cross-currency swap agreement were not material during the year ended
December 31, 2018
.
As of
December 31, 2018
, the Company had designated
€700,000
of the face value of Euro-denominated debt, a non-derivative financial instrument, as a hedge of the foreign currency exchange rate exposure of an equal amount to the Company's euro-denominated net investment in certain European subsidiaries. As of
December 31, 2018
, the euro-denominated debt has a total carrying value of
$801,010
, which is included in long-term debt in the Company’s consolidated balance sheet. For the year ended
December 31, 2018
, the Company recorded a gain, net of tax, of approximately
$28,360
in the net investment hedge section of the accumulated other comprehensive loss in the Company’s consolidated balance sheet.
The Company did not reclassify any gains or losses related to net investment hedges from accumulated other comprehensive loss into earnings during the year ended
December 31, 2018
. Amounts would only be reclassified into earnings if the European subsidiary were liquidated, or otherwise disposed.
7. Leased Properties
The Company primarily leases certain retail stores, branches, distribution centers, office space, land, vehicles, information technology and equipment.
Most leases include one or more options to renew, with renewal terms that can extend the lease term from
one
to
20 years
or more. The exercise of lease renewal options is at the Company's discretion. The depreciable life of assets and leasehold improvements are limited by the expected lease term, unless there is a transfer of title or purchase option reasonably certain of exercise. Certain of the lease agreements include rental payments adjusted periodically for inflation. Lease agreements do not contain any material residual value guarantees or material restrictive covenants.
Future minimum payments, by year and in the aggregate, under the noncancelable operating leases with initial or remaining terms of one year or more were approximately the following at
December 31, 2018
:
|
2019
|
$
|
305,257
|
|
|
2020
|
239,629
|
|
|
|
2021
|
173,119
|
|
|
|
2022
|
121,918
|
|
|
|
2023
|
82,940
|
|
|
|
Thereafter
|
192,862
|
|
|
|
Total minimum lease payments
|
$
|
1,115,725
|
|
Rental expense for operating leases was approximately
$366,000
,
$306,000
, and
$278,000
for
2018
,
2017
, and
2016
, respectively.
F-17
Genuine Parts Company and Subsidiaries
Notes to Consolidated Financial Statements
December 31, 2018
8. Share-Based Compensation
At
December 31, 2018
, total compensation cost related to nonvested awards not yet recognized was approximately
$36,500
. The weighted-average period over which this compensation cost is expected to be recognized is approximately
two
years. The aggregate intrinsic value for SARs and RSUs outstanding at
December 31, 2018
and
2017
was approximately
$97,800
and
$95,400
, respectively. The aggregate intrinsic value for SARs and RSUs vested totaled approximately
$41,300
and
$52,900
at
December 31, 2018
and
2017
, respectively. At
December 31, 2018
, the weighted-average contractual life for outstanding and exercisable SARs and RSUs was
five
years. Share-based compensation costs of
$20,716
,
$16,892
, and
$19,719
, were recorded for the years ended
December 31, 2018
,
2017
, and
2016
, respectively. The total income tax benefits recognized in the consolidated statements of income and comprehensive income for share-based compensation arrangements were approximately
$5,600
,
$4,600
, and
$7,900
for
2018
,
2017
, and
2016
, respectively. There have been no modifications to valuation methodologies or methods during the years ended
December 31, 2018
,
2017
, or
2016
.
The fair value of RSUs is based on the price of the Company’s stock on the date of grant. The total fair value of RSUs vested during the years ended
December 31, 2018
,
2017
, and
2016
were
$20,800
,
$15,500
, and
$18,200
, respectively. The Company did not grant SARs for the year ended December 31, 2018. For the years ended December 31, 2017 and
2016
, the fair values for SARs granted were estimated using a Black-Scholes option pricing model with the following weighted-average assumptions, respectively: risk-free interest rate of
2.3%
, and
1.6%
; dividend yield of
2.8%
, and
2.7%
; annual historical volatility factor of the expected market price of the Company’s common stock of
19%
for each of the two years and an average expected life of approximately
six
years.
A summary of the Company’s share-based compensation activity and related information is as follows:
|
|
2018
|
||||||
|
Shares (1)
|
Weighted Average Exercise Price (2)
|
||||||
|
Outstanding at beginning of year
|
4,200
|
|
$
|
82
|
|
||
|
Granted
|
360
|
|
$
|
—
|
|
||
|
Exercised
|
(772
|
)
|
$
|
70
|
|
||
|
Forfeited
|
(138
|
)
|
$
|
94
|
|
||
|
Outstanding at end of year (3)
|
3,650
|
|
$
|
85
|
|
||
|
Exercisable at end of year
|
2,477
|
|
$
|
82
|
|
||
|
Shares available for future grants
|
8,135
|
|
|||||
|
(1)
|
Shares include Restricted Stock Units ("RSUs").
|
|
(2)
|
The weighted average exercise price excludes RSUs.
|
|
(3)
|
The exercise prices for SARs outstanding as of
December 31, 2018
ranged from approximately
$43
to
$100
. The weighted average remaining contractual life of all SARs outstanding is approximately
five
years.
|
The weighted average grant date fair value of SARs granted during the years
2017
and
2016
was
$13.89
and
$13.52
, respectively. The aggregate intrinsic value of SARs and RSUs exercised during the years ended
December 31, 2018
,
2017
, and
2016
was
$32,600
,
$16,800
, and
$48,200
, respectively.
In
2018
, the Company granted approximately
360
RSUs. In
2017
, the Company granted approximately
746
SARs and
171
RSUs. In
2016
, the Company granted approximately
724
SARs and
170
RSUs.
A summary of the Company’s nonvested share awards activity is as follows:
|
Nonvested Share Awards (RSUs)
|
Shares
|
Weighted Average Grant Date Fair Value
|
||||
|
Nonvested at January 1, 2018
|
406
|
|
$
|
91
|
|
|
|
Granted
|
360
|
|
$
|
89
|
|
|
|
Vested
|
(140
|
)
|
$
|
88
|
|
|
|
Forfeited
|
(63
|
)
|
$
|
89
|
|
|
|
Nonvested at December 31, 2018
|
563
|
|
$
|
91
|
|
|
F-18
Genuine Parts Company and Subsidiaries
Notes to Consolidated Financial Statements
December 31, 2018
9. Income Taxes
The Tax Cuts and Jobs Act was enacted December 22, 2017. The Act reduces the U.S. federal corporate tax rate from 35% to 21% for taxable years beginning after December 31, 2017, required companies to pay a one-time transition tax on earnings of certain foreign subsidiaries that were not previously subject to U.S. Federal income tax and creates new taxes on certain foreign sourced earnings. In 2017 and for the nine months ended September 30, 2018, the Company recorded provisional amounts for these enactment-date effects of the Act by applying the guidance in U.S. Securities and Exchange Commission Staff Accounting Bulletin No. 118 ("SAB 118") because the Company had not yet completed its accounting for these effects. As of December 22, 2018, the Company has completed its accounting for all of the enactment-date income tax effects of the Act. As further discussed below, the Company recognized adjustments totaling
$5,299
at December 31, 2018 to the provisional amounts recorded at December 31, 2017 and each interim reporting period of 2018. These adjustments are included as a component of income tax expense. The changes to 2017 enactment-date provisional amounts did not have a material effect on the effective tax rate in 2018.
Deferred tax assets and liabilities
As of December 31, 2017, the Company remeasured U.S. deferred tax assets and liabilities based on the rates at which they were expected to reverse in the future, which is generally 21% for federal income tax purposes. The provisional amount recorded related to the remeasurement of the deferred tax balance was
$13,854
at December 31, 2017. Upon further analysis of certain aspects of the Act and refinement of our calculations during the 12 month period ended December 31, 2018, the Company adjusted its provisional amount by approximately
$424
, which is included as a component of income tax expense.
International tax effects
The one-time transition tax is based on the Company's total post-1986 earnings and profits ("E&P") which the Company has previously deferred from U.S. income taxes pursuant to the provisions of the Internal Revenue Code prior to the Act. The Company recorded a provisional U.S. tax liability for the transition tax in the amount of
$37,132
at December 31, 2017. Upon further analysis of the Act and notices and regulations issued by the U.S. Department of the Treasury and the Internal Revenue Service, the Company finalized its calculations of the transition tax liability during the 12 month period ended December 31, 2018. The provisional amount increased by
$4,875
at December 31, 2018, which is included as a component of income tax expense. The Company has elected to pay the tax over the eight year period provided by the Act. No additional income taxes, where applicable (i.e., U.S. Federal, U.S. State, foreign withholding, or similar taxes under foreign law), have been provided on any remaining outside basis difference inherent in the Company's foreign subsidiaries. The cumulative undistributed earnings from the Company's foreign subsidiaries continue to be indefinitely reinvested in foreign operations. The gross tax cost to the Company associated with its outside basis difference is not material. Determining the amount of net unrecognized deferred tax liability related to any additional outside basis difference in these entities (i.e., basis difference other than those subject to the one-time transition tax) is not practicable. This is due to the complexities associated with the hypothetical calculation to determine residual taxes on the undistributed earnings, including the availability of foreign tax credits, applicability of any additional local withholding tax and other indirect tax consequence that may arise due to the distribution of these earnings.
Global Intangible Low-Taxed Income ("GILTI")
The Act subjects a U.S. shareholder to tax on GILTI earned by certain foreign subsidiaries. The FASB Staff Q&A, Topic 740, No. 5,
Accounting for GILTI
, states that an entity can make an accounting policy election to either recognize deferred taxes for temporary basis differences expected to reverse as GILTI in future years or provide for the tax expense related to GILTI in the year the tax is incurred. The Company has elected to account for GILTI in the year the tax is incurred as a period cost.
F-19
Genuine Parts Company and Subsidiaries
Notes to Consolidated Financial Statements
December 31, 2018
Significant components of the Company’s deferred tax assets and liabilities are as follows:
|
|
2018
|
2017
|
||||||
|
Deferred tax assets related to:
|
||||||||
|
Expenses not yet deducted for tax purposes
|
$
|
266,628
|
|
$
|
256,728
|
|
||
|
Pension liability not yet deducted for tax purposes
|
277,929
|
|
257,766
|
|
||||
|
Net operating loss
|
29,785
|
|
31,046
|
|
||||
|
574,342
|
|
545,540
|
|
|||||
|
Deferred tax liabilities related to:
|
||||||||
|
Employee and retiree benefits
|
218,124
|
|
210,429
|
|
||||
|
Inventory
|
95,280
|
|
93,067
|
|
||||
|
Other intangible assets
|
296,736
|
|
287,018
|
|
||||
|
Property, plant, and equipment
|
72,463
|
|
66,727
|
|
||||
|
Other
|
32,978
|
|
35,859
|
|
||||
|
715,581
|
|
693,100
|
|
|||||
|
Net deferred tax liability before valuation allowance
|
(141,239
|
)
|
(147,560
|
)
|
||||
|
Valuation allowance
|
(26,095
|
)
|
(5,590
|
)
|
||||
|
Total net deferred tax liability
|
$
|
(167,334
|
)
|
$
|
(153,150
|
)
|
||
The Company currently holds approximately
$125,013
in net operating losses, of which approximately
$89,710
will carry forward indefinitely. The remaining net operating losses of approximately
$35,303
will begin to expire in 2024.
The components of income before income taxes are as follows:
|
2018
|
2017
|
2016
|
||||||||||
|
United States
|
$
|
790,592
|
|
$
|
813,078
|
|
$
|
934,476
|
|
|||
|
Foreign
|
285,020
|
|
196,190
|
|
139,864
|
|
||||||
|
Income before income taxes
|
$
|
1,075,612
|
|
$
|
1,009,268
|
|
$
|
1,074,340
|
|
|||
The components of income tax expense are as follows:
|
|
2018
|
2017
|
2016
|
|||||||||
|
Current:
|
||||||||||||
|
Federal
|
$
|
144,615
|
|
$
|
252,337
|
|
$
|
284,199
|
|
|||
|
State
|
39,326
|
|
29,288
|
|
41,083
|
|
||||||
|
Foreign
|
77,306
|
|
44,896
|
|
28,593
|
|
||||||
|
Deferred:
|
||||||||||||
|
Federal
|
15,167
|
|
71,238
|
|
26,684
|
|
||||||
|
State
|
5,770
|
|
13,663
|
|
3,857
|
|
||||||
|
Foreign
|
(17,046
|
)
|
(18,911
|
)
|
2,684
|
|
||||||
|
$
|
265,138
|
|
$
|
392,511
|
|
$
|
387,100
|
|
||||
F-20
Genuine Parts Company and Subsidiaries
Notes to Consolidated Financial Statements
December 31, 2018
The reasons for the difference between total tax expense and the amount computed by applying the statutory Federal income tax rate to income before income taxes are as follows:
|
|
2018
|
2017
|
2016
|
|||||||||
|
Statutory rate applied to income (1)
|
$
|
225,879
|
|
$
|
353,259
|
|
$
|
376,019
|
|
|||
|
Plus state income taxes, net of Federal tax benefit
|
35,626
|
|
27,918
|
|
29,211
|
|
||||||
|
Taxation of foreign operations, net (2)
|
(7,639
|
)
|
(33,984
|
)
|
(18,057
|
)
|
||||||
|
U.S. tax reform - transition tax
|
4,875
|
|
37,132
|
|
—
|
|
||||||
|
U.S. tax reform - deferred tax remeasurement
|
424
|
|
13,854
|
|
—
|
|
||||||
|
Foreign rate change - deferred tax remeasurement
|
(1,461
|
)
|
(9,338
|
)
|
—
|
|
||||||
|
Book tax basis difference in investment
|
(11,944
|
)
|
—
|
|
—
|
|
||||||
|
Valuation allowance
|
20,505
|
|
1,273
|
|
371
|
|
||||||
|
Other
|
(1,127
|
)
|
2,397
|
|
(444
|
)
|
||||||
|
$
|
265,138
|
|
$
|
392,511
|
|
$
|
387,100
|
|
||||
|
(1)
|
U.S. statutory rates applied to income are as follows: 2018 at
21%
, 2017 and 2016 at
35%
.
|
|
(2)
|
The Company's effective tax rate reflects the net benefit of having operations outside of the U.S. which are taxed at statutory rates different from the U.S. statutory rate, with some income being fully or partially exempt from income taxes due to various operating and financing activities.
|
The Company, or one of its subsidiaries, files income tax returns in the U.S., various states, and foreign jurisdictions. With few exceptions, the Company is no longer subject to federal, state and local tax examinations by tax authorities for years before 2014 or subject to non-United States income tax examinations for years ended prior to 2012. The Company is currently under audit in the U.S. and some of its foreign jurisdictions. Some audits may conclude in the next 12 months and the unrecognized tax benefits recorded in relation to the audits may differ from actual settlement amounts. It is not possible to estimate the effect, if any, of the amount of such change during the next 12 months to previously recorded uncertain tax positions in connection with the audits. The Company does not anticipate that total unrecognized tax benefits will significantly change in the next 12 months.
A reconciliation of the beginning and ending amounts of unrecognized tax benefits is as follows:
|
2018
|
2017
|
2016
|
||||||||||
|
Balance at beginning of year
|
$
|
14,697
|
|
$
|
15,190
|
|
$
|
15,815
|
|
|||
|
Additions based on tax positions related to the current year
|
2,034
|
|
2,644
|
|
2,184
|
|
||||||
|
Additions for tax positions of prior years
|
4,787
|
|
1,511
|
|
1,317
|
|
||||||
|
Reductions for tax positions for prior years
|
(725
|
)
|
(430
|
)
|
(1,369
|
)
|
||||||
|
Reduction for lapse in statute of limitations
|
(2,338
|
)
|
(3,917
|
)
|
(2,516
|
)
|
||||||
|
Settlements
|
(27
|
)
|
(301
|
)
|
(241
|
)
|
||||||
|
Balance at end of year
|
$
|
18,428
|
|
$
|
14,697
|
|
$
|
15,190
|
|
|||
The amount of gross unrecognized tax benefits, including interest and penalties, as of
December 31, 2018
and
2017
was approximately
$20,669
and
$16,919
, respectively, of which approximately
$14,760
and
$10,847
, respectively, if recognized, would affect the effective tax rate.
During the years ended
December 31, 2018
,
2017
, and
2016
, the Company paid or received refunds of interest and penalties of approximately
$18
,
$(3,384)
, and
$5
, respectively. The Company had approximately
$2,242
and
$2,151
of accrued interest and penalties at
December 31, 2018
and
2017
, respectively. The Company recognizes potential interest and penalties related to unrecognized tax benefits as a component of income tax expense.
F-21
Genuine Parts Company and Subsidiaries
Notes to Consolidated Financial Statements
December 31, 2018
10. Employee Benefit Plans
The Company’s defined benefit pension plans cover employees in the U.S., Canada, and Europe who meet eligibility requirements. The plan covering U.S. employees is noncontributory and the Company implemented a hard freeze for the U.S. qualified defined benefit plan as of December 31, 2013. No further benefits were provided after this date for additional credited service or earnings and all participants became fully vested as of December 31, 2013. The Canadian plan is contributory and benefits are based on career average compensation. The Company’s funding policy is to contribute an amount equal to the minimum required contribution under applicable pension legislation. For the plans in the U.S. and Canada, the Company may increase its contribution above the minimum, if appropriate to its tax and cash position and the plans’ funded position. For the plans in Europe, these plans will be funded in accordance with local regulations.
The Company also sponsors supplemental retirement plans covering employees in the U.S. and Canada. The Company uses a measurement date of December 31 for its pension and supplemental retirement plans.
Several assumptions are used to determine the benefit obligations, plan assets, and net periodic income. The discount rate for the pension plans is calculated using a bond matching approach to select specific bonds that would satisfy the projected benefit payments. The bond matching approach reflects the process that would be used to settle the pension obligations. The expected return on plan assets is based on a calculated market-related value of plan assets, where gains and losses on plan assets are amortized over a
five
year period and accumulate in other comprehensive income. Other non-investment unrecognized gains and losses are amortized in future net income based on a “corridor” approach, where the corridor is equal to
10%
of the greater of the benefit obligation or the market-related value of plan assets at the beginning of the year. The unrecognized gains and losses in excess of the corridor criteria are amortized over the average future lifetime or service of plan participants, depending on the plan. These assumptions are updated at each annual measurement date.
Changes in benefit obligations for the years ended
December 31, 2018
and
2017
were:
|
|
2018
|
2017
|
||||||
|
Changes in benefit obligation
|
||||||||
|
Benefit obligation at beginning of year
|
$
|
2,435,765
|
|
$
|
2,306,859
|
|
||
|
Service cost
|
10,410
|
|
8,459
|
|
||||
|
Interest cost
|
88,247
|
|
96,651
|
|
||||
|
Plan participants’ contributions
|
2,466
|
|
2,454
|
|
||||
|
Actuarial (gain) loss
|
(122,556
|
)
|
94,546
|
|
||||
|
Foreign currency exchange rate changes
|
(18,416
|
)
|
15,073
|
|
||||
|
Gross benefits paid
|
(118,643
|
)
|
(106,885
|
)
|
||||
|
Plan amendments
|
—
|
|
4,768
|
|
||||
|
Acquired plans
|
770
|
|
13,840
|
|
||||
|
Benefit obligation at end of year
|
$
|
2,278,043
|
|
$
|
2,435,765
|
|
||
The benefit obligations for the Company’s U.S. pension plans included in the above were
$2,055,701
and
$2,187,700
at
December 31, 2018
and
2017
, respectively. The total accumulated benefit obligation for the Company’s defined benefit pension plans in the U.S., Canada and Europe was approximately
$2,247,013
and
$2,409,091
at
December 31, 2018
and
2017
, respectively.
The assumptions used to measure the pension benefit obligations for the plans at
December 31, 2018
and
2017
, were:
|
2018
|
2017
|
||||
|
Weighted average discount rate
|
4.36
|
%
|
3.70
|
%
|
|
|
Rate of increase in future compensation levels
|
3.14
|
%
|
3.11
|
%
|
|
F-22
Genuine Parts Company and Subsidiaries
Notes to Consolidated Financial Statements
December 31, 2018
Changes in plan assets for the years ended
December 31, 2018
and
2017
were:
|
2018
|
2017
|
|||||||
|
Changes in plan assets
|
||||||||
|
Fair value of plan assets at beginning of year
|
$
|
2,206,479
|
|
$
|
1,965,502
|
|
||
|
Actual return on plan assets
|
(86,418
|
)
|
277,650
|
|
||||
|
Foreign currency exchange rate changes
|
(18,054
|
)
|
14,449
|
|
||||
|
Employer contributions
|
57,549
|
|
53,309
|
|
||||
|
Plan participants’ contributions
|
2,466
|
|
2,454
|
|
||||
|
Benefits paid
|
(118,643
|
)
|
(106,885
|
)
|
||||
|
Fair value of plan assets at end of year
|
$
|
2,043,379
|
|
$
|
2,206,479
|
|
||
The fair values of plan assets for the Company’s U.S. pension plans included in the above were
$1,831,513
and
$1,969,196
at
December 31, 2018
and
2017
, respectively.
For the years ended
December 31, 2018
and
2017
, the aggregate benefit obligation and aggregate fair value of plan assets for plans with benefit obligations in excess of plan assets were as follows:
|
|
2018
|
2017
|
||||||
|
Aggregate benefit obligation
|
$
|
2,106,348
|
|
$
|
2,241,690
|
|
||
|
Aggregate fair value of plan assets
|
1,863,245
|
|
2,003,831
|
|
||||
For the years ended
December 31, 2018
and
2017
, the aggregate accumulated benefit obligation and aggregate fair value of plan assets for plans with accumulated benefit obligations in excess of plan assets were as follows:
|
|
2018
|
2017
|
||||||
|
Aggregate accumulated benefit obligation
|
$
|
2,070,183
|
|
$
|
2,210,590
|
|
||
|
Aggregate fair value of plan assets
|
1,855,714
|
|
1,996,017
|
|
||||
The asset allocations for the Company’s funded pension plans at
December 31, 2018
and
2017
, and the target allocation for
2019
, by asset category were:
|
|
Target Allocation
|
Percentage of Plan Assets at December 31
|
||||||
|
|
2019
|
2018
|
2017
|
|||||
|
Asset Category
|
||||||||
|
Equity securities
|
72
|
%
|
67
|
%
|
71
|
%
|
||
|
Debt securities
|
28
|
%
|
33
|
%
|
29
|
%
|
||
|
100
|
%
|
100
|
%
|
100
|
%
|
|||
The Company’s benefit plan committees in the U.S. and Canada establish investment policies and strategies and regularly monitor the performance of the funds. The plans in Europe are unfunded and, therefore, there are no plan assets. The pension plan strategy implemented by the Company’s management is to achieve long-term objectives and invest the pension assets in accordance with the applicable pension legislation in the U.S. and Canada as well as fiduciary standards. The long-term primary investment objectives for the pension plans are to provide for a reasonable amount of long-term growth of capital, without undue exposure to risk, protect the assets from erosion of purchasing power, and provide investment results that meet or exceed the pension plans’ actuarially assumed long-term rates of return. The Company’s investment strategy with respect to pension plan assets is to generate a return in excess of the passive portfolio benchmark (
47%
S&P 500 Index,
5%
Russell Midcap Index,
7%
Russell 2000 Index,
5%
MSCI EAFE Index,
5%
DJ Global Moderate Index,
3%
MSCI Emerging Market Net, and
28%
Barclays U.S. Govt/Credit).
The fair values of the plan assets as of
December 31, 2018
and
2017
, by asset category, are shown in the tables below. Various inputs are considered when determining the value of the Company’s pension plan assets. The inputs or methodologies used for valuing securities are not necessarily an indication of the risk associated with investing in these securities. Level 1 represents observable market inputs that are unadjusted quoted prices for identical assets or liabilities in active markets. Level 2 represents
F-23
Genuine Parts Company and Subsidiaries
Notes to Consolidated Financial Statements
December 31, 2018
other significant observable inputs (including quoted prices for similar securities, interest rates, credit risk, etc.). Level 3 represents significant unobservable inputs (including the Company’s own assumptions in determining the fair value of investments). Certain investments are measured at fair value using the net asset value ("NAV") per share as a practical expedient and have not been classified in the fair value hierarchy.
The valuation methods may produce a fair value calculation that may not be indicative of net realizable value or reflective of future fair values. Furthermore, while the Company believes its valuation methods are appropriate and consistent with other market participants, the use of different methodologies or assumptions to determine the fair value of certain financial instruments could result in a different fair value measurement at the reporting date. Equity securities are valued at the closing price reported on the active market on which the individual securities are traded on the last day of the calendar plan year. Debt securities including corporate bonds, U.S. Government securities, and asset-backed securities are valued using price evaluations reflecting the bid and/or ask sides of the market for an investment as of the last day of the calendar plan year.
|
|
2018
|
|||||||||||||||||||
|
Total
|
Assets Measured at NAV
|
Quoted Prices
in Active
Markets for
Identical
Assets
(Level 1)
|
Significant
Observable
Inputs
(Level 2)
|
Significant
Unobservable
Inputs
(Level 3)
|
||||||||||||||||
|
Equity Securities
|
||||||||||||||||||||
|
Common stocks — mutual funds — equity
|
$
|
457,567
|
|
$
|
166,045
|
|
$
|
291,522
|
|
$
|
—
|
|
$
|
—
|
|
|||||
|
Genuine Parts Company common stock
|
193,810
|
|
—
|
|
193,810
|
|
—
|
|
—
|
|
||||||||||
|
Other stocks
|
713,924
|
|
—
|
|
713,882
|
|
—
|
|
42
|
|
||||||||||
|
Debt Securities
|
||||||||||||||||||||
|
Short-term investments
|
30,855
|
|
—
|
|
30,855
|
|
—
|
|
—
|
|
||||||||||
|
Cash and equivalents
|
14,583
|
|
—
|
|
14,583
|
|
—
|
|
—
|
|
||||||||||
|
Government bonds
|
223,750
|
|
—
|
|
159,483
|
|
64,267
|
|
—
|
|
||||||||||
|
Corporate bonds
|
227,616
|
|
—
|
|
—
|
|
227,616
|
|
—
|
|
||||||||||
|
Asset-backed and mortgage-backed securities
|
8,866
|
|
—
|
|
—
|
|
8,866
|
|
—
|
|
||||||||||
|
Other-international
|
29,471
|
|
—
|
|
29,126
|
|
345
|
|
—
|
|
||||||||||
|
Municipal bonds
|
8,747
|
|
—
|
|
—
|
|
8,747
|
|
—
|
|
||||||||||
|
Mutual funds—fixed income
|
131,755
|
|
86,443
|
|
—
|
|
45,312
|
|
—
|
|
||||||||||
|
Other
|
||||||||||||||||||||
|
Cash surrender value of life insurance policies
|
2,435
|
|
—
|
|
|
|
—
|
|
2,435
|
|
||||||||||
|
Total
|
$
|
2,043,379
|
|
$
|
252,488
|
|
$
|
1,433,261
|
|
$
|
355,153
|
|
$
|
2,477
|
|
|||||
F-24
Genuine Parts Company and Subsidiaries
Notes to Consolidated Financial Statements
December 31, 2018
|
|
2017
|
|||||||||||||||||||
|
Total
|
Assets Measured at NAV
|
Quoted Prices
in Active
Markets for
Identical
Assets
(Level 1)
|
Significant
Observable
Inputs
(Level 2)
|
Significant
Unobservable
Inputs
(Level 3)
|
||||||||||||||||
|
Equity Securities
|
||||||||||||||||||||
|
Common stocks — mutual funds — equity
|
$
|
536,609
|
|
$
|
193,628
|
|
$
|
342,981
|
|
$
|
—
|
|
$
|
—
|
|
|||||
|
Genuine Parts Company common stock
|
191,771
|
|
—
|
|
191,771
|
|
—
|
|
—
|
|
||||||||||
|
Other stocks
|
838,694
|
|
—
|
|
838,659
|
|
—
|
|
35
|
|
||||||||||
|
Debt Securities
|
||||||||||||||||||||
|
Short-term investments
|
47,745
|
|
—
|
|
47,745
|
|
—
|
|
—
|
|
||||||||||
|
Cash and equivalents
|
13,530
|
|
—
|
|
13,530
|
|
—
|
|
—
|
|
||||||||||
|
Government bonds
|
180,838
|
|
—
|
|
121,834
|
|
59,004
|
|
—
|
|
||||||||||
|
Corporate bonds
|
207,978
|
|
—
|
|
—
|
|
207,978
|
|
—
|
|
||||||||||
|
Asset-backed and mortgage-backed securities
|
9,725
|
|
—
|
|
—
|
|
9,725
|
|
—
|
|
||||||||||
|
Convertible securities
|
211
|
|
—
|
|
—
|
|
211
|
|
—
|
|
||||||||||
|
Other-international
|
29,431
|
|
—
|
|
29,221
|
|
210
|
|
—
|
|
||||||||||
|
Municipal bonds
|
7,346
|
|
—
|
|
—
|
|
7,346
|
|
—
|
|
||||||||||
|
Mutual funds—fixed income
|
139,801
|
|
92,248
|
|
—
|
|
47,553
|
|
—
|
|
||||||||||
|
Other
|
||||||||||||||||||||
|
Options and futures
|
38
|
|
—
|
|
38
|
|
—
|
|
—
|
|
||||||||||
|
Cash surrender value of life insurance policies
|
2,762
|
|
—
|
|
—
|
|
—
|
|
2,762
|
|
||||||||||
|
Total
|
$
|
2,206,479
|
|
$
|
285,876
|
|
$
|
1,585,779
|
|
$
|
332,027
|
|
$
|
2,797
|
|
|||||
Equity securities include Genuine Parts Company common stock in the amounts of
$193,810
(
9%
of total plan assets) and
$191,771
(
9%
of total plan assets) at
December 31, 2018
and
2017
, respectively. Dividend payments received by the plan on Company stock totaled approximately
$5,813
and
$5,450
in
2018
and
2017
, respectively. Fees paid during the year for services rendered by parties in interest were based on customary and reasonable rates for such services.
The changes in the fair value measurement of plan assets using significant unobservable inputs (Level 3) during
2018
and
2017
were not material.
Based on the investment policy for the pension plans, as well as an asset study that was performed based on the Company’s asset allocations and future expectations, the Company’s expected rate of return on plan assets for measuring
2019
pension income is
7.12%
for the plans. The asset study forecasted expected rates of return for the approximate duration of the Company’s benefit obligations, using capital market data and historical relationships.
The following table sets forth the funded status of the plans and the amounts recognized in the consolidated balance sheets at December 31:
|
2018
|
2017
|
|||||||
|
Other long-term asset
|
$
|
8,440
|
|
$
|
8,573
|
|
||
|
Other current liability
|
(9,213
|
)
|
(9,280
|
)
|
||||
|
Pension and other post-retirement liabilities
|
(233,891
|
)
|
(228,579
|
)
|
||||
|
$
|
(234,664
|
)
|
$
|
(229,286
|
)
|
|||
F-25
Genuine Parts Company and Subsidiaries
Notes to Consolidated Financial Statements
December 31, 2018
Amounts recognized in accumulated other comprehensive loss consist of:
|
2018
|
2017
|
|||||||
|
Net actuarial loss
|
$
|
1,014,794
|
|
$
|
941,063
|
|
||
|
Prior service cost
|
5,939
|
|
5,773
|
|
||||
|
$
|
1,020,733
|
|
$
|
946,836
|
|
|||
The following table reflects the total benefits expected to be paid from the pension plans’ or the Company’s assets. Of the pension benefits expected to be paid in
2019
, approximately
$9,215
is expected to be paid from employer assets. Expected employer contributions below reflect amounts expected to be contributed to funded plans. Information about the expected cash flows for the pension plans follows:
|
Employer contribution
|
|||
|
2019 (expected)
|
$
|
6,034
|
|
|
Expected benefit payments:
|
|||
|
2019
|
$
|
118,340
|
|
|
2020
|
122,253
|
|
|
|
2021
|
127,460
|
|
|
|
2022
|
132,988
|
|
|
|
2023
|
137,669
|
|
|
|
2024 through 2028
|
734,372
|
|
|
Net periodic benefit income included the following components:
|
|
2018
|
2017
|
2016
|
|||||||||
|
Service cost
|
$
|
10,410
|
|
$
|
8,459
|
|
$
|
7,746
|
|
|||
|
Interest cost
|
88,247
|
|
96,651
|
|
104,485
|
|
||||||
|
Expected return on plan assets
|
(154,006
|
)
|
(155,432
|
)
|
(156,832
|
)
|
||||||
|
Amortization of prior service credit
|
(147
|
)
|
(350
|
)
|
(432
|
)
|
||||||
|
Amortization of actuarial loss
|
39,721
|
|
38,034
|
|
31,641
|
|
||||||
|
Net periodic benefit income
|
$
|
(15,775
|
)
|
$
|
(12,638
|
)
|
$
|
(13,392
|
)
|
|||
Service cost is recorded in selling, administrative and other expenses in the consolidated statements of income and comprehensive income while all other components are recorded within other non-operating expenses (income).
Other changes in plan assets and benefit obligations recognized in other comprehensive income (loss) are as follows:
|
2018
|
2017
|
2016
|
||||||||||
|
Current year actuarial loss (gain)
|
$
|
117,867
|
|
$
|
(27,672
|
)
|
$
|
152,415
|
|
|||
|
Recognition of actuarial loss
|
(39,721
|
)
|
(38,034
|
)
|
(31,641
|
)
|
||||||
|
Current year prior service cost
|
—
|
|
4,768
|
|
2,063
|
|
||||||
|
Recognition of prior service credit
|
147
|
|
350
|
|
432
|
|
||||||
|
Total recognized in other comprehensive income (loss)
|
$
|
78,293
|
|
$
|
(60,588
|
)
|
|
$
|
123,269
|
|
||
|
Total recognized in net periodic benefit income and other comprehensive income (loss)
|
$
|
62,518
|
|
$
|
(73,226
|
)
|
$
|
109,877
|
|
|||
The estimated amounts that will be amortized from accumulated other comprehensive loss into net periodic benefit income in
2019
are as follows:
|
Actuarial loss
|
$
|
30,944
|
|
|
Prior service credit
|
(66
|
)
|
|
|
Total
|
$
|
30,878
|
|
F-26
Genuine Parts Company and Subsidiaries
Notes to Consolidated Financial Statements
December 31, 2018
The assumptions used in measuring the net periodic benefit income for the plans follow:
|
2018
|
2017
|
2016
|
||||||
|
Weighted average discount rate
|
3.70
|
%
|
4.26
|
%
|
4.82
|
%
|
||
|
Rate of increase in future compensation levels
|
3.11
|
%
|
3.15
|
%
|
3.12
|
%
|
||
|
Expected long-term rate of return on plan assets
|
7.14
|
%
|
7.80
|
%
|
7.83
|
%
|
||
The Company has
one
defined contribution plan in the U.S. that covers substantially all of its domestic employees. Employees receive a matching contribution of
100%
of the first
5%
of the employees’ salary. Total plan expense was approximately
$62,335
in
2018
,
$58,186
in
2017
, and
$56,975
in
2016
.
The Company has a defined contribution plan that covers full-time Canadian employees after six months of employment and part-time employees upon meeting provincial minimum standards. Employees receive a matching contribution of
100%
of the first
5%
of the employees’ salary. Total plan expense was approximately
$4,108
in 2018 and
$2,600
in 2017.
11. Guarantees
The Company guarantees the borrowings of certain independently controlled automotive parts stores (independents) and certain other affiliates in which the Company has a noncontrolling equity ownership interest (affiliates). Presently, the independents are generally consolidated by unaffiliated enterprises that have a controlling financial interest through ownership of a majority voting interest in the independent. The Company has no voting interest or other equity conversion rights in any of the independents. The Company does not control the independents or the affiliates, but receives a fee for the guarantee. The Company has concluded that the independents are variable interest entities, but that the Company is not the primary beneficiary. Specifically, the equity holders of the independents have the power to direct the activities that most significantly impact the entity’s economic performance including, but not limited to, decisions about hiring and terminating personnel, local marketing and promotional initiatives, pricing and selling activities, credit decisions, monitoring and maintaining appropriate inventories, and store hours. Separately, the Company concluded the affiliates are not variable interest entities. The Company’s maximum exposure to loss as a result of its involvement with these independents and affiliates is generally equal to the total borrowings subject to the Company’s guarantee. While such borrowings of the independents and affiliates are outstanding, the Company is required to maintain compliance with certain covenants, including a maximum debt to EBITDA ratio and certain limitations on additional borrowings. At
December 31, 2018
, the Company was in compliance with all such covenants.
At
December 31, 2018
, the total borrowings of the independents and affiliates subject to guarantee by the Company were approximately
$759,726
. These loans generally mature over periods from
one
to
six
years. In the event that the Company is required to make payments in connection with guaranteed obligations of the independents or the affiliates, the Company would obtain and liquidate certain collateral (e.g., accounts receivable and inventory) to recover all or a portion of the amounts paid under the guarantee. When it is deemed probable that the Company will incur a loss in connection with a guarantee, a liability is recorded equal to this estimated loss. To date, the Company has had no significant losses in connection with guarantees of independents’ and affiliates’ borrowings.
The Company has recognized certain assets and liabilities amounting to
$78,000
and
$65,000
for the guarantees related to the independents’ and affiliates’ borrowings at
December 31, 2018
and
2017
, respectively. These assets and liabilities are included in other assets and other long-term liabilities in the consolidated balance sheets.
12. Legal Matter
On April 17, 2017, a jury awarded damages against the Company of
$81,500
in a litigated automotive product liability dispute.
Through post-trial motions and offsets from previous settlements, the initial verdict has been reduced to
$77,100
. The Company believes the verdict is not supported by the facts or the law and is contrary to the Company’s role in the automotive parts industry.
The Company is challenging the verdict through an appeal to a higher court. At the time of the filing of these financial statements, based upon the Company’s legal defenses, insurance coverage, and reserves, the Company does not believe this matter will have a material impact to the consolidated financial statements.
13. Acquisitions and Divestitures
Acquisitions
The Company acquired several businesses and equity investments for approximately
$283,000
,
$1,457,000
, and
$420,000
, net of cash acquired, during the years ended
December 31, 2018
,
2017
, and
2016
, respectively.
F-27
Genuine Parts Company and Subsidiaries
Notes to Consolidated Financial Statements
December 31, 2018
2018
In
2018
, a significant portion of the businesses acquired included
20
businesses in the Automotive Parts Group and
three
businesses in the Industrial Parts Group.
The
20
Automotive Parts Group acquisitions generate annual unaudited revenues of approximately
$180,000
. The acquisitions included TMS Motor Spares ("TMS") in August 2018 and Platinum International Group ("Platinum") in October 2018. TMS is a leading automotive parts distributor and operates
17
locations in Scotland and
seven
locations in England. Platinum is a leading value-added battery distributor in the automotive, industrial, and leisure markets and operates
nine
locations in the U.K. and
one
location in the Netherlands.
The
three
Industrial Parts Group acquisitions generate annual unaudited revenues of approximately
$100,000
. The largest acquisition was Hydraulic Supply Company ("HSC") in October 2018, which operates
30
locations in the U.S. HSC is a full-service fluid power distributor, with a product offering of hydraulic, pneumatic and industrial components and systems.
For each acquisition, the Company allocated the purchase price to the assets acquired and the liabilities assumed based on their fair values as of their respective acquisition dates. The results of operations for the acquired companies were included in the Company’s consolidated statements of income and comprehensive income beginning on their respective acquisition dates. The Company recorded approximately
$167,000
of goodwill and other intangible assets associated with the 2018 acquisitions. Other intangible assets acquired consisted of customer relationships of
$76,000
with weighted average amortization lives of
15
years.
2017 and 2016
In
2017
, a significant portion of the businesses acquired included
12
businesses in the Automotive Parts Group and
three
businesses in the Industrial Parts Group. The aggregate purchase price for these
15
acquisitions was approximately
$1,334,000
, net of cash acquired. The acquisitions of Alliance Automotive Group (“AAG”) and the Inenco equity method investment are described further below. In
2016
, a significant portion of the businesses acquired included
11
businesses in the Automotive Parts Group,
six
businesses in the Industrial Group and
two
businesses in the Business Products Group. The purchase price for these
19
acquisitions was approximately
$370,000
, net of cash acquired.
For each 2017 and 2016 acquisition, the Company allocated the purchase price to the assets acquired and the liabilities assumed based on their fair values as of their respective acquisition dates. The results of operations for the acquired companies were included in the Company’s consolidated statements of income and comprehensive income beginning on their respective acquisition dates. The Company recorded approximately
$1,926,000
and
$260,000
of goodwill and other intangible assets associated with the 2017 and 2016 acquisitions, respectively. Other intangible assets acquired in 2017, excluding AAG, consisted of customer relationships of
$69,000
with weighted average amortization lives of
15
years. Other intangible assets acquired in 2016 consisted of customer relationships of
$112,000
and trademarks of
$28,000
, with weighted average amortization lives of
17
and
35
years, respectively.
Alliance Automotive Group
The Company acquired all of the equity interests in AAG for approximately
$1,067,000
in cash on November 2, 2017. The net cash consideration transferred of approximately
$1,067,000
is net of the cash acquired of approximately
$123,000
. AAG, which is headquartered in London, is the second largest parts distribution platform in Europe, based on revenues, with a focus on light and commercial vehicle replacement parts distributed to the independent aftermarket in France, Germany, the U.K., and Poland.
Coincident with the transaction, GPC repaid a majority of AAG’s debt including publicly held notes and a revolving credit facility with a banking group, including accrued interest, for approximately
$825,000
. The acquisition and subsequent redemption of substantially all acquired debt, was financed using a combination of new borrowings under a term loan, five private placement notes, and borrowings under increased credit facilities.
The following table summarizes the preliminary, estimated fair values of the assets acquired and liabilities assumed at the acquisition date as well as the adjustments made when finalizing the acquisition accounting during the year ended December 31, 2018 (referred to as the "measurement period adjustments”). The measurement period adjustments primarily resulted from revisions to the valuation of certain tangible and intangible assets. The adjustments to current period earnings that would have been recognized in previous periods if the acquisition accounting had been completed on the acquisition date were not material.
F-28
Genuine Parts Company and Subsidiaries
Notes to Consolidated Financial Statements
December 31, 2018
|
November 2, 2017
|
Measurement Period Adjustments
|
As Adjusted
|
||||||||||
|
Trade accounts receivable
|
$
|
380,000
|
|
$
|
6,000
|
|
$
|
386,000
|
|
|||
|
Merchandise inventories
|
374,000
|
|
4,000
|
|
378,000
|
|
||||||
|
Prepaid expenses and other current assets
|
213,000
|
|
10,000
|
|
223,000
|
|
||||||
|
Intangible assets
|
727,000
|
|
86,000
|
|
813,000
|
|
||||||
|
Deferred tax assets
|
4,000
|
|
(2,000
|
)
|
2,000
|
|
||||||
|
Property and equipment
|
93,000
|
|
(1,000
|
)
|
92,000
|
|
||||||
|
Other assets
|
25,000
|
|
(11,000
|
)
|
14,000
|
|
||||||
|
Total identifiable assets acquired
|
1,816,000
|
|
92,000
|
|
1,908,000
|
|
||||||
|
Current liabilities
|
(768,000
|
)
|
(50,000
|
)
|
(818,000
|
)
|
||||||
|
Long-term debt
|
(769,000
|
)
|
—
|
|
(769,000
|
)
|
||||||
|
Pension and other post-retirement benefit liabilities
|
(14,000
|
)
|
—
|
|
(14,000
|
)
|
||||||
|
Deferred tax liabilities
|
(151,000
|
)
|
(21,000
|
)
|
(172,000
|
)
|
||||||
|
Other long-term liabilities
|
(32,000
|
)
|
(2,000
|
)
|
(34,000
|
)
|
||||||
|
Total liabilities assumed
|
(1,734,000
|
)
|
(73,000
|
)
|
(1,807,000
|
)
|
||||||
|
Net identifiable assets acquired
|
82,000
|
|
19,000
|
|
101,000
|
|
||||||
|
Noncontrolling interests in subsidiaries
|
(38,000
|
)
|
1,000
|
|
(37,000
|
)
|
||||||
|
Goodwill
|
1,036,000
|
|
(33,000
|
)
|
1,003,000
|
|
||||||
|
Net assets acquired
|
$
|
1,080,000
|
|
$
|
(13,000
|
)
|
$
|
1,067,000
|
|
|||
The acquired intangible assets of approximately
$813,000
were assigned to customer relationships of
$630,133
, trademarks of
$181,702
, and other intangibles of
$1,165
, with weighted average amortization lives of
20
,
28
and
2
years, respectively, for a total weighted average amortizable life of
22
years.
The goodwill recognized as part of the acquisition is not tax deductible and has been assigned to the Automotive segment. The goodwill was attributable primarily to expected synergies and the assembled work-force. The fair values of the non-controlling interests in subsidiaries were valued using income approaches.
The amounts of net sales and earnings of AAG included in the Company’s consolidated statements of income and comprehensive income from November 2, 2017 to December 31, 2017 were approximately
$256,400
in net sales and net income of
$0.07
on a per share diluted basis, respectively.
The unaudited pro forma consolidated statements of income and comprehensive income of the Company as if AAG had been included in the consolidated results of the Company for the years ended December 31, 2017 and 2016 would be estimated at
$17,627,000
and
$16,575,000
in net sales, respectively, and net income of
$4.56
and
$4.55
on a per share diluted basis, respectively. The pro forma information is not necessarily indicative of the results of operations that the Company would have reported had the transaction actually occurred at the beginning of these periods, nor is it necessarily indicative of future results.
The adjustments to the pro forma amounts include, but are not limited to, applying the Company’s accounting policies, amortization related to fair value adjustments to intangible assets, one-time purchase accounting adjustments, interest expense on acquisition related debt, and any associated tax effects.
Inenco
Effective April 3, 2017, the Company acquired a
35%
investment in the Inenco Group for approximately
$72,100
from Conbear Holdings Pty Limited ("Conbear"). The equity investment was funded with the Company’s cash on hand. The Inenco Group, which is headquartered in Sydney, Australia, is an industrial distributor of bearings, power transmissions, and seals in Australasia, with annual revenues of approximately
$400,000
and
174
locations across Australia and New Zealand, as well as an emerging presence in Asia.The Company and Conbear both have an option to acquire or sell, respectively, the remaining
65%
of Inenco at a later date contingent upon certain conditions being satisfied. However, there can be no guarantee that such conditions will be met or, if they are met, whether either company would exercise its option.
F-29
Genuine Parts Company and Subsidiaries
Notes to Consolidated Financial Statements
December 31, 2018
Divestitures
Business Products Group
On April 12, 2018, the Company entered into a definitive agreement with Essendant, Inc. ("Essendant") for Essendant to combine with the Company's Business Products Group in a business combination transaction. The transaction was to be structured as a Reverse Morris Trust, in which the Company would separate the Business Products Group into a standalone company and spin off that standalone company to the Company's shareholders, immediately followed by the merger of a subsidiary of Essendant and the spun-off company.
On September 14, 2018, the definitive agreement with Essendant was terminated by Essendant, so that Essendant could enter into a merger agreement with another party. Concurrently with the termination, the Company received a termination fee of
$12,000
. The termination fee is classified as an offset to the transaction and other costs incurred related to the merger agreement within selling, administrative and other expenses in the consolidated statements of income and comprehensive income.
Grupo Auto Todo
On December 13, 2018, the Company entered into a definitive agreement to sell all of the equity of a Mexican subsidiary in the Automotive Parts Group, Grupo Auto Todo, to a group of investors for approximately
$12,000
. Grupo Auto Todo contributed approximately
$93,000
of revenues
for the year ended December 31, 2018.
The transaction is expected to close in 2019. The Company estimates that it will recognize a charge of approximately
$30,000
when the transaction closes, primarily from accumulated foreign currency losses.
14. Segment Data
The Company’s reportable segments consist of automotive and industrial parts and business products. Within the reportable segments, certain of the Company’s operating segments are aggregated since they have similar economic characteristics, products and services, type and class of customers, and distribution methods.
The Company’s automotive segment distributes replacement parts (other than body parts) for substantially all makes and models of automobiles, trucks, and other vehicles.
The Company’s industrial segment distributes a wide variety of industrial bearings, mechanical and fluid power transmission equipment, including hydraulic and pneumatic products, material handling components, electrical specialties materials, including insulating and conductive materials for use in electrical apparatus, and related parts and supplies.
The Company’s business products segment distributes a wide variety of office products, computer supplies, office furniture, and business electronics.
Inter-segment sales are not significant. Operating profit for each industry segment is calculated as net sales less operating expenses excluding general corporate expenses, interest expense, and equity in income from investees, amortization, and noncontrolling interests. Approximately
$285,020
,
$196,190
and
$139,864
of income before income taxes was generated in jurisdictions outside the U.S. for the years ended
December 31, 2018
,
2017
, and
2016
, respectively. Net sales and net property, plant and equipment by country relate directly to the Company’s operations in the respective country. Corporate assets are principally cash and cash equivalents and headquarters’ facilities and equipment.
F-30
Genuine Parts Company and Subsidiaries
Notes to Consolidated Financial Statements
December 31, 2018
|
2018
|
2017
|
2016
|
||||||||||
|
Net sales: (1)
|
||||||||||||
|
Automotive
|
$
|
10,526,520
|
|
$
|
8,583,317
|
|
$
|
8,040,407
|
|
|||
|
Industrial (2)
|
6,298,584
|
|
5,805,012
|
|
5,399,416
|
|
||||||
|
Business products
|
1,909,969
|
|
1,920,472
|
|
1,899,890
|
|
||||||
|
Total net sales
|
$
|
18,735,073
|
|
$
|
16,308,801
|
|
$
|
15,339,713
|
|
|||
|
Operating profit:
|
||||||||||||
|
Automotive
|
$
|
854,389
|
|
$
|
720,465
|
|
$
|
715,154
|
|
|||
|
Industrial (2)
|
487,360
|
|
440,454
|
|
397,147
|
|
||||||
|
Business products
|
88,756
|
|
98,882
|
|
117,035
|
|
||||||
|
Total operating profit
|
1,430,505
|
|
1,259,801
|
|
1,229,336
|
|
||||||
|
Interest expense, net
|
(92,093
|
)
|
(38,677
|
)
|
(19,525
|
)
|
||||||
|
Corporate expense (3)
|
(173,828
|
)
|
(159,863
|
)
|
(94,601
|
)
|
||||||
|
Intangible asset amortization
|
(88,972
|
)
|
(51,993
|
)
|
(40,870
|
)
|
||||||
|
Income before income taxes
|
$
|
1,075,612
|
|
$
|
1,009,268
|
|
$
|
1,074,340
|
|
|||
|
Assets:
|
||||||||||||
|
Automotive
|
$
|
6,246,911
|
|
$
|
6,140,829
|
|
$
|
4,601,150
|
|
|||
|
Industrial (2)
|
1,790,410
|
|
1,645,271
|
|
1,495,397
|
|
||||||
|
Business products
|
860,279
|
|
859,335
|
|
907,119
|
|
||||||
|
Corporate
|
245,022
|
|
212,566
|
|
281,071
|
|
||||||
|
Goodwill and other intangible assets
|
3,540,418
|
|
3,554,380
|
|
1,574,663
|
|
||||||
|
Total assets
|
$
|
12,683,040
|
|
$
|
12,412,381
|
|
$
|
8,859,400
|
|
|||
F-31
Genuine Parts Company and Subsidiaries
Notes to Consolidated Financial Statements
December 31, 2018
|
|
2018
|
2017
|
2016
|
|||||||||
|
Depreciation and amortization:
|
||||||||||||
|
Automotive
|
$
|
105,238
|
|
$
|
71,405
|
|
$
|
65,372
|
|
|||
|
Industrial (2)
|
14,518
|
|
13,446
|
|
13,338
|
|
||||||
|
Business products
|
10,472
|
|
11,262
|
|
11,398
|
|
||||||
|
Corporate
|
22,435
|
|
19,585
|
|
16,509
|
|
||||||
|
Intangible asset amortization
|
88,972
|
|
51,993
|
|
40,870
|
|
||||||
|
Total depreciation and amortization
|
$
|
241,635
|
|
$
|
167,691
|
|
$
|
147,487
|
|
|||
|
Capital expenditures:
|
||||||||||||
|
Automotive
|
$
|
198,910
|
|
$
|
118,181
|
|
$
|
73,339
|
|
|||
|
Industrial (2)
|
21,783
|
|
28,566
|
|
33,093
|
|
||||||
|
Business products
|
7,320
|
|
6,726
|
|
12,072
|
|
||||||
|
Corporate
|
4,409
|
|
3,287
|
|
42,139
|
|
||||||
|
Total capital expenditures
|
$
|
232,422
|
|
$
|
156,760
|
|
$
|
160,643
|
|
|||
|
Net sales:
|
||||||||||||
|
United States
|
$
|
13,927,091
|
|
$
|
13,246,619
|
|
$
|
12,779,971
|
|
|||
|
Europe
|
1,860,912
|
|
256,364
|
|
—
|
|
||||||
|
Canada
|
1,624,890
|
|
1,525,421
|
|
1,368,743
|
|
||||||
|
Australasia
|
1,193,148
|
|
1,162,122
|
|
1,083,779
|
|
||||||
|
Mexico
|
129,032
|
|
118,275
|
|
107,220
|
|
||||||
|
Total net sales
|
$
|
18,735,073
|
|
$
|
16,308,801
|
|
$
|
15,339,713
|
|
|||
|
Net property, plant, and equipment:
|
||||||||||||
|
United States
|
$
|
726,068
|
|
$
|
647,386
|
|
$
|
561,164
|
|
|||
|
Europe
|
110,184
|
|
96,857
|
|
—
|
|
||||||
|
Canada
|
91,387
|
|
90,857
|
|
81,260
|
|
||||||
|
Australasia
|
95,578
|
|
95,299
|
|
79,413
|
|
||||||
|
Mexico
|
4,014
|
|
6,303
|
|
6,287
|
|
||||||
|
Total net property, plant, and equipment
|
$
|
1,027,231
|
|
$
|
936,702
|
|
$
|
728,124
|
|
|||
|
(1)
|
The net effect of discounts, incentives, and freight billed to customers has been allocated to their respective segments for the current and prior periods. Previously, the net effect of such items were captured and presented separately in a line item entitled “Other.”
|
|
(2)
|
Effective January 1, 2018, the electrical materials segment became a division of the industrial segment. These two reporting segments became a single reporting segment, the Industrial Parts Group. The change in segment reporting is presented retrospectively.
|
|
(3)
|
Includes
$36,105
of expense for the year ended
December 31, 2018
, respectively, from transaction and other costs related to the AAG acquisition and the attempted Business Products Group spin-off, net of a
$12,000
termination fee received in the third quarter of 2018. See the acquisitions and divestitures footnote for additional information.
|
The year ended December 31, 2017 includes
$49,141
in transaction and other costs primarily related to the AAG acquisition.
F-32
Genuine Parts Company and Subsidiaries
Notes to Consolidated Financial Statements
December 31, 2018
The following table presents disaggregated geographical net sales from contracts with customers by reportable segment. Automotive is the only reportable segment with operations in Australasia and Europe. The Company believes this presentation best depicts how the nature, amount, timing and uncertainty of net sales and cash flows are affected by economic factors:
|
2018
|
2017
|
2016
|
|||||||||
|
North America:
|
|||||||||||
|
Automotive
|
$
|
7,472,460
|
|
$
|
7,164,831
|
|
$
|
6,956,628
|
|
||
|
Industrial
|
6,298,584
|
|
5,805,012
|
|
5,399,416
|
|
|||||
|
Business products
|
1,909,969
|
|
1,920,472
|
|
1,899,890
|
|
|||||
|
Total North America
|
$
|
15,681,013
|
|
$
|
14,890,315
|
|
$
|
14,255,934
|
|
||
|
Australasia - Automotive
|
$
|
1,193,148
|
|
$
|
1,162,122
|
|
$
|
1,083,779
|
|
||
|
Europe - Automotive
|
$
|
1,860,912
|
|
$
|
256,364
|
|
$
|
—
|
|
||
|
Total net sales
|
$
|
18,735,073
|
|
$
|
16,308,801
|
|
$
|
15,339,713
|
|
||
F-33

TABLE OF CONTENTS
Part IItem 1. BusinessPart and Specialty Coated Materials To Customers. Approximately 35% Of Total Industrial Product Purchases inItem 1A. Risk FactorsItem 1B. Unresolved Staff CommentsItem 2. PropertiesItem 3. Legal ProceedingsItem 4. Mine Safety DisclosuresPart IIItem 5. Market For Registrant S Common Equity, Related Stockholder Matters and Issuer Purchases Of Equity SecuritiesItem 6. Selected Financial DataItem 7. Management S Discussion and Analysis Of Financial Condition and Results Of OperationsItem 7A. Quantitative and Qualitative Disclosures About Market RiskItem 8. Financial Statements and Supplementary DataItem 9. Changes in and Disagreements with Accountants on Accounting and Financial DisclosureItem 9A. Controls and ProceduresItem 9B. Other InformationPart IIIItem 10. Directors, Executive Officers and Corporate GovernanceItem 11. Executive CompensationItem 12. Security Ownership Of Certain Beneficial Owners and Management and Related Stockholder MattersItem 13. Certain Relationships and Related Transactions, and Director IndependenceItem 14. Principal Accountant Fees and ServicesPart IVItem 15. Exhibits and Financial Statement SchedulesItem 16. Form 10-k Summary