GRAPHIC PACKAGING HOLDING CO
10-Ks and 10-Qs
|
|
|
|
|
|
|
|
|
|
|
|
|
|
|
|
|
|
|
|
|
|
|
|
|
|
|
|
|
|
|
|
|
|
|
|
|
|
|
|
|
|
|
|
|
|
|
|
|
|
|
|
|
|
|
|
UNITED STATES SECURITIES AND EXCHANGE COMMISSION
WASHINGTON, D.C. 20549
FORM 10-Q
|
þ
|
QUARTERLY REPORT PURSUANT TO SECTION 13 OR 15(d) OF THE SECURITIES
EXCHANGE ACT OF 1934
|
For the quarterly period ended
September 30, 2018
or
|
o
|
TRANSITION REPORT PURSUANT TO SECTION 13 OR 15(d) OF THE SECURITIES
EXCHANGE ACT OF 1934
|
For the transition period from to
COMMISSION FILE NUMBER: 001-33988
Graphic Packaging Holding Company
(Exact name of registrant as specified in its charter)
|
Delaware
|
26-0405422
|
|
(State or other jurisdiction of
|
(I.R.S. employer
|
|
incorporation or organization)
|
identification no.)
|
|
1500 Riveredge Parkway, Suite 100
|
|
|
Atlanta, Georgia
|
30328
|
|
(Address of principal executive offices)
|
(Zip Code)
|
(770) 240-7200
(Registrant’s telephone number, including area code)
Indicate by check mark whether the registrant (1) has filed all reports required to be filed by Section 13 or 15(d) of the Securities Exchange Act of 1934 during the preceding 12 months (or for such shorter period that the registrant was required to file such reports), and (2) has been subject to such filing requirements for the past 90 days. Yes
þ
No
o
Indicate by check mark whether the registrant has submitted electronically and posted on its corporate Web site, if any, every Interactive Data File required to be submitted and posted pursuant to Rule 405 of Regulation S-T (§232.405 of this chapter) during the preceding 12 months (or for such shorter period that the registrant was required to submit and post such files). Yes
þ
No
o
Indicate by check mark whether the registrant is a large accelerated filer, an accelerated filer, a non-accelerated filer, a smaller reporting company or an emerging growth company. See the definitions of “large accelerated filer,” “accelerated filer,” “smaller reporting company” and "emerging growth company" in Rule 12b-2 of the Exchange Act. (Check one):
|
Large accelerated filer
þ
|
Accelerated filer
o
|
Smaller reporting company
o
|
|||
|
Non-accelerated filer
o
(Do not check if a smaller reporting company)
|
Emerging growth company
o
|
||||
If an emerging growth company, indicate by check mark if the registrant has elected not to use the extended transition period for complying with any new or revised financial accounting standards provided pursuant to Section 13(a) of the Exchange Act.
o
Indicate by check mark whether the registrant is a shell company (as defined in Rule 12b-2 of the Exchange Act). Yes
o
No
þ
As of
October 19, 2018
, there were
310,369,818
shares of the registrant’s Common Stock, par value $0.01 per share, outstanding.
Information Concerning Forward-Looking Statements
Certain statements regarding the expectations of Graphic Packaging Holding Company (“GPHC” and, together with its subsidiaries, the “Company”), including, but not limited to, the availability of net operating losses to offset U.S. federal income taxes and the timing related to the Company's future U.S. federal income tax payments, the reclassification of gains on derivative instruments, capital investment, depreciation and amortization, interest expense, and pension plan contributions, in this report constitute “forward-looking statements” as defined in the Private Securities Litigation Reform Act of 1995. Such statements are based on currently available operating, financial and competitive information and are subject to various risks and uncertainties that could cause actual results to differ materially from the Company’s historical experience and its present expectations. These risks and uncertainties include, but are not limited to, inflation of and volatility in raw material and energy costs, changes in consumer buying habits and product preferences, competition with other paperboard manufacturers and product substitution, the Company’s ability to implement its business strategies, including strategic acquisitions, productivity initiatives and cost reduction plans, the Company's ability to successfully integrate acquisitions, including the North America Consumer Packaging business of International Paper Company (the "NACP Combination"), the Company’s debt level, currency movements and other risks of conducting business internationally, and the impact of regulatory and litigation matters, including those that could impact the Company’s ability to utilize its net operating losses to offset taxable income and those that impact the Company's ability to protect and use its intellectual property. Undue reliance should not be placed on such forward-looking statements, as such statements speak only as of the date on which they are made and the Company undertakes no obligation to update such statements, except as may be required by law. Additional information regarding these and other risks is contained in Part I, “Item 1A., Risk Factors” of the Company’s
2017
Annual Report on Form 10-K, and in other filings with the Securities and Exchange Commission.
2
TABLE OF CONTENTS
|
EX-31.1
|
|
|
EX-31.2
|
|
|
EX-32.1
|
|
|
EX-32.2
|
|
|
XBRL Content
|
|
3
GRAPHIC PACKAGING HOLDING COMPANY
(Unaudited)
|
Three Months Ended
|
Nine Months Ended
|
|||||||||||||
|
September 30,
|
September 30,
|
|||||||||||||
|
In millions, except per share amounts
|
2018
|
2017
|
2018
|
2017
|
||||||||||
|
Net Sales
|
$
|
1,530.0
|
|
$
|
1,137.6
|
|
$
|
4,515.3
|
|
$
|
3,293.8
|
|
||
|
Cost of Sales
|
1,273.5
|
|
949.2
|
|
3,800.4
|
|
2,759.7
|
|
||||||
|
Selling, General and Administrative
|
116.8
|
|
91.4
|
|
352.6
|
|
267.6
|
|
||||||
|
Other Expense, Net
|
0.7
|
|
2.0
|
|
4.1
|
|
1.4
|
|
||||||
|
Business Combinations, (Gain) on Sale of Assets and Shutdown and Other Special Charges, Net
|
(27.4
|
)
|
3.6
|
|
7.5
|
|
18.3
|
|
||||||
|
Income from Operations
|
166.4
|
|
91.4
|
|
350.7
|
|
246.8
|
|
||||||
|
Nonoperating Pension and Postretirement Benefit Income
|
4.1
|
|
4.0
|
|
12.4
|
|
11.7
|
|
||||||
|
Interest Expense, Net
|
(31.0
|
)
|
(22.6
|
)
|
(90.1
|
)
|
(66.4
|
)
|
||||||
|
Loss on Modification or Extinguishment of Debt
|
—
|
|
—
|
|
(1.9
|
)
|
—
|
|
||||||
|
Income before Income Taxes and Equity Income of Unconsolidated Entity
|
139.5
|
|
72.8
|
|
271.1
|
|
192.1
|
|
||||||
|
Income Tax Expense
|
(17.8
|
)
|
(25.9
|
)
|
(41.4
|
)
|
(67.1
|
)
|
||||||
|
Income before Equity Income of Unconsolidated Entity
|
121.7
|
|
46.9
|
|
229.7
|
|
125.0
|
|
||||||
|
Equity Income of Unconsolidated Entity
|
0.3
|
|
0.4
|
|
1.0
|
|
1.3
|
|
||||||
|
Net Income
|
122.0
|
|
47.3
|
|
230.7
|
|
126.3
|
|
||||||
|
Net Income Attributable to Noncontrolling Interest
|
(27.7
|
)
|
—
|
|
(57.1
|
)
|
—
|
|
||||||
|
Net Income Attributable to Graphic Packaging Holding Company
|
$
|
94.3
|
|
$
|
47.3
|
|
$
|
173.6
|
|
$
|
126.3
|
|
||
|
Net Income Per Share Attributable to Graphic Packaging Holding Company — Basic
|
$
|
0.30
|
|
|
$
|
0.15
|
|
$
|
0.56
|
|
|
$
|
0.41
|
|
|
Net Income Per Share Attributable to Graphic Packaging Holding Company — Diluted
|
$
|
0.30
|
|
|
$
|
0.15
|
|
$
|
0.56
|
|
|
$
|
0.40
|
|
|
Cash Dividends Declared Per Share
|
$
|
0.075
|
|
$
|
0.075
|
|
$
|
0.225
|
|
$
|
0.225
|
|
||
The accompanying notes are an integral part of the Condensed Consolidated Financial Statements.
4
GRAPHIC PACKAGING HOLDING COMPANY
CONDENSED CONSOLIDATED STATEMENTS OF COMPREHENSIVE INCOME
(Unaudited)
|
Three Months Ended
|
Three Months Ended
|
|||||||||||||||
|
September 30,
|
September 30,
|
|||||||||||||||
|
In millions
|
2018
|
2017
|
||||||||||||||
|
Graphic Packaging Holding Company
|
Noncontrolling Interest
|
Redeemable Noncontrolling Interest
|
Total
|
Graphic Packaging Holding Company
|
||||||||||||
|
Net Income
|
$
|
94.3
|
|
$
|
21.3
|
|
$
|
6.4
|
|
$
|
122.0
|
|
$
|
47.3
|
|
|
|
Other Comprehensive Income (Loss), Net of Tax:
|
||||||||||||||||
|
Derivative Instruments
|
1.3
|
|
—
|
|
—
|
|
1.3
|
|
(0.6
|
)
|
||||||
|
Pension and Postretirement Benefit Plans
|
0.7
|
|
—
|
|
—
|
|
0.7
|
|
0.7
|
|
||||||
|
Currency Translation Adjustment
|
1.2
|
|
0.8
|
|
0.2
|
|
2.2
|
|
10.8
|
|
||||||
|
Total Other Comprehensive Income, Net of Tax
|
3.2
|
|
0.8
|
|
0.2
|
|
4.2
|
|
10.9
|
|
||||||
|
Total Comprehensive Income
|
$
|
97.5
|
|
$
|
22.1
|
|
$
|
6.6
|
|
$
|
126.2
|
|
$
|
58.2
|
|
|
|
Nine Months Ended
|
Nine Months Ended
|
|||||||||||||||
|
September 30,
|
September 30,
|
|||||||||||||||
|
In millions
|
2018
|
2017
|
||||||||||||||
|
Graphic Packaging Holding Company
|
Noncontrolling Interest
|
Redeemable Noncontrolling Interest
|
Total
|
Graphic Packaging Holding Company
|
||||||||||||
|
Net Income
|
$
|
173.6
|
|
$
|
44.0
|
|
$
|
13.1
|
|
$
|
230.7
|
|
$
|
126.3
|
|
|
|
Other Comprehensive Income (Loss), Net of Tax:
|
||||||||||||||||
|
Derivative Instruments
|
2.7
|
|
0.2
|
|
0.1
|
|
3.0
|
|
(4.5
|
)
|
||||||
|
Pension and Postretirement Benefit Plans
|
2.0
|
|
0.2
|
|
0.1
|
|
2.3
|
|
2.2
|
|
||||||
|
Currency Translation Adjustment
|
(7.6
|
)
|
(0.7
|
)
|
(0.3
|
)
|
(8.6
|
)
|
46.9
|
|
||||||
|
Total Other Comprehensive (Loss) Income, Net of Tax
|
(2.9
|
)
|
(0.3
|
)
|
(0.1
|
)
|
(3.3
|
)
|
44.6
|
|
||||||
|
Total Comprehensive Income
|
$
|
170.7
|
|
$
|
43.7
|
|
$
|
13.0
|
|
$
|
227.4
|
|
$
|
170.9
|
|
|
The accompanying notes are an integral part of the Condensed Consolidated Financial Statements.
5
GRAPHIC PACKAGING HOLDING COMPANY
(Unaudited)
|
In millions, except share and per share amounts
|
September 30,
2018 |
|
December 31, 2017
|
||||
|
ASSETS
|
|||||||
|
Current Assets:
|
|||||||
|
Cash and Cash Equivalents
|
$
|
39.7
|
|
$
|
67.4
|
|
|
|
Receivables, Net
|
816.0
|
|
422.8
|
|
|||
|
Inventories, Net
|
1,030.7
|
|
634.0
|
|
|||
|
Other Current Assets
|
65.6
|
|
45.7
|
|
|||
|
Total Current Assets
|
1,952.0
|
|
1,169.9
|
|
|||
|
Property, Plant and Equipment, Net
|
3,151.7
|
|
1,867.2
|
|
|||
|
Goodwill
|
1,561.9
|
|
1,323.0
|
|
|||
|
Intangible Assets, Net
|
551.5
|
|
436.5
|
|
|||
|
Other Assets
|
89.5
|
|
66.4
|
|
|||
|
Total Assets
|
$
|
7,306.6
|
|
$
|
4,863.0
|
|
|
|
LIABILITIES
|
|||||||
|
Current Liabilities:
|
|||||||
|
Short-Term Debt and Current Portion of Long-Term Debt
|
$
|
51.9
|
|
$
|
61.3
|
|
|
|
Accounts Payable
|
642.7
|
|
516.5
|
|
|||
|
Compensation and Employee Benefits
|
162.8
|
|
113.4
|
|
|||
|
Other Accrued Liabilities
|
311.9
|
|
160.2
|
|
|||
|
Total Current Liabilities
|
1,169.3
|
|
851.4
|
|
|||
|
Long-Term Debt
|
2,880.7
|
|
2,213.2
|
|
|||
|
Deferred Income Tax Liabilities
|
460.4
|
|
321.8
|
|
|||
|
Accrued Pension and Postretirement Benefits
|
73.6
|
|
80.0
|
|
|||
|
Other Noncurrent Liabilities
|
168.7
|
|
104.7
|
|
|||
|
|
|
||||||
|
Redeemable Noncontrolling Interest (Note 12)
|
292.2
|
|
—
|
|
|||
|
SHAREHOLDERS’ EQUITY
|
|||||||
|
Preferred Stock, par value $.01 per share; 100,000,000 shares authorized; no shares issued or outstanding
|
—
|
|
—
|
|
|||
|
Common Stock, par value $.01 per share; 1,000,000,000 shares authorized; 310,344,923 and 309,715,624 shares issued and outstanding at September 30, 2018 and December 31, 2017, respectively
|
3.1
|
|
3.1
|
|
|||
|
Capital in Excess of Par Value
|
2,079.4
|
|
1,683.6
|
|
|||
|
Retained Earnings (Accumulated Deficit)
|
47.8
|
|
(56.0
|
)
|
|||
|
Accumulated Other Comprehensive Loss
|
(341.7
|
)
|
(338.8
|
)
|
|||
|
Total Graphic Packaging Holding Company Shareholders' Equity
|
1,788.6
|
|
1,291.9
|
|
|||
|
Noncontrolling Interest
|
473.1
|
|
—
|
|
|||
|
Total Equity
|
2,261.7
|
|
1,291.9
|
|
|||
|
Total Liabilities and Shareholders' Equity
|
$
|
7,306.6
|
|
$
|
4,863.0
|
|
|
The accompanying notes are an integral part of the Condensed Consolidated Financial Statements.
6
GRAPHIC PACKAGING HOLDING COMPANY
(Unaudited)
|
Nine Months Ended
|
|||||||
|
September 30,
|
|||||||
|
In millions
|
2018
|
2017
|
|||||
|
CASH FLOWS FROM OPERATING ACTIVITIES:
|
|||||||
|
Net Income
|
$
|
230.7
|
|
$
|
126.3
|
|
|
|
Adjustments to Reconcile Net Income to Net Cash Used in Operating Activities:
|
|||||||
|
Depreciation and Amortization
|
331.8
|
|
237.2
|
|
|||
|
Deferred Income Taxes
|
19.9
|
|
51.2
|
|
|||
|
Amount of Postretirement Expense Less Than Funding
|
(2.6
|
)
|
(39.6
|
)
|
|||
|
Gain on the Sale of Assets
|
(38.6
|
)
|
—
|
|
|||
|
Other, Net
|
31.6
|
|
(3.1
|
)
|
|||
|
Changes in Operating Assets and Liabilities
|
(872.8
|
)
|
(490.3
|
)
|
|||
|
Net Cash Used in Operating Activities
|
(300.0
|
)
|
(118.3
|
)
|
|||
|
CASH FLOWS FROM INVESTING ACTIVITIES:
|
|||||||
|
Capital Spending
|
(258.6
|
)
|
(185.8
|
)
|
|||
|
Packaging Machinery Spending
|
(11.4
|
)
|
(12.0
|
)
|
|||
|
Acquisition of Businesses, Net of Cash Acquired
|
(89.0
|
)
|
(120.9
|
)
|
|||
|
Proceeds Received from the Sale of Assets, Net of Selling Costs
|
49.4
|
|
—
|
|
|||
|
Beneficial Interest on Sold Receivables
|
902.8
|
|
440.4
|
|
|||
|
Beneficial Interest Obtained in Exchange for Proceeds
|
(226.9
|
)
|
(15.6
|
)
|
|||
|
Other, Net
|
(6.0
|
)
|
(0.4
|
)
|
|||
|
Net Cash Provided by Investing Activities
|
360.3
|
|
105.7
|
|
|||
|
CASH FLOWS FROM FINANCING ACTIVITIES:
|
|||||||
|
Repurchase of Common Stock
|
—
|
|
(62.1
|
)
|
|||
|
Payments on Debt
|
(143.3
|
)
|
(18.8
|
)
|
|||
|
Borrowings under Revolving Credit Facilities
|
1,297.5
|
|
814.0
|
|
|||
|
Payments on Revolving Credit Facilities
|
(1,148.5
|
)
|
(695.8
|
)
|
|||
|
Repurchase of Common Stock related to Share-Based Payments
|
(4.1
|
)
|
(10.1
|
)
|
|||
|
Debt Issuance Costs
|
(7.9
|
)
|
—
|
|
|||
|
Dividends and Distributions Paid
|
(82.1
|
)
|
(70.2
|
)
|
|||
|
Other, Net
|
1.2
|
|
11.4
|
|
|||
|
Net Cash Used in Financing Activities
|
(87.2
|
)
|
(31.6
|
)
|
|||
|
Effect of Exchange Rate Changes on Cash
|
(0.8
|
)
|
2.3
|
|
|||
|
Net Decrease in Cash and Cash Equivalents
|
(27.7
|
)
|
(41.9
|
)
|
|||
|
Cash and Cash Equivalents at Beginning of Period
|
67.4
|
|
59.1
|
|
|||
|
CASH AND CASH EQUIVALENTS AT END OF PERIOD
|
$
|
39.7
|
|
$
|
17.2
|
|
|
|
Non-cash Investing Activities:
|
|||||||
|
Beneficial Interest Obtained in Exchange for Trade Receivables
|
$
|
874.6
|
|
$
|
430.4
|
|
|
|
Non-cash Investment in NACP Combination
|
1,235.7
|
|
—
|
|
|||
|
Non-cash Investing Activities
|
$
|
2,110.3
|
|
|
$
|
430.4
|
|
|
Non-cash Financing Activities:
|
|||||||
|
Non-cash Financing of NACP Combination
|
$
|
660.0
|
|
$
|
—
|
|
|
|
Non-Cash Financing Activities
|
$
|
660.0
|
|
|
$
|
—
|
|
The accompanying notes are an integral part of the Condensed Consolidated Financial Statements.
7
GRAPHIC PACKAGING HOLDING COMPANY
NOTES TO CONDENSED CONSOLIDATED FINANCIAL STATEMENTS
(Unaudited)
Nature of Business and Basis of Presentation
Graphic Packaging Holding Company (“GPHC” and, together with its subsidiaries, the “Company”) is committed to providing consumer packaging that makes a world of difference. The Company is a leading provider of paper-based packaging solutions for a wide variety of products to food, beverage, foodservice and other consumer products companies. The Company operates on a global basis, is one of the largest producers of folding cartons in the United States ("U.S.") and holds leading market positions in coated unbleached kraft paperboard ("CUK"), coated-recycled paperboard ("CRB") and solid bleached sulfate paperboard ("SBS").
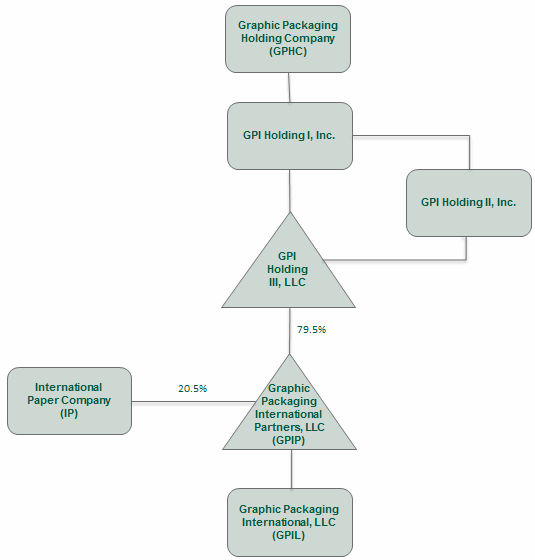
On January 1, 2018, GPHC, a Delaware corporation, International Paper Company, a New York corporation (“IP”), Graphic Packaging International Partners, LLC, a Delaware limited liability company formerly known as Gazelle Newco LLC and a wholly owned subsidiary of the Company (“GPIP”), and Graphic Packaging International, LLC, a Delaware limited liability company formerly known as Graphic Packaging International, Inc. and a subsidiary of GPIP (“GPIL”), completed a series of transactions pursuant to an agreement dated October 23, 2017, among the foregoing parties (the “Transaction Agreement”). Pursuant to the Transaction Agreement (i) a wholly owned subsidiary of the Company transferred its ownership interest in GPIL to GPIP; (ii) IP transferred its North America Consumer Packaging (“NACP”) business to GPIP, which was then subsequently transferred to GPIL; (iii) GPIP issued membership interests to IP, and IP was admitted as a member of GPIP; and (iv) GPIL assumed certain indebtedness of IP (the "NACP Combination").
GPI Holding III, LLC, an indirect wholly-owned subsidiary of the Company (“GPI Holding”), is the managing member of GPIP.
At closing of the NACP Combination, GPIP issued
309,715,624
common units or
79.5%
of the membership interests in GPIP to GPI Holding and
79,911,591
common units or
20.5%
of the membership interests in GPIP to IP. Subject to certain restrictions, the common units held by IP are exchangeable into shares of common stock of GPHC or cash.
The following diagram illustrates the organization of the Company immediately subsequent to the transactions described above (not including subsidiaries of GPIL):
8
GRAPHIC PACKAGING HOLDING COMPANY
NOTES TO CONDENSED CONSOLIDATED FINANCIAL STATEMENTS
(Unaudited)
The Company’s customers include many of the world’s most widely recognized companies and brands with prominent market positions in beverage, food, foodservice, and other consumer products. The Company strives to provide its customers with packaging solutions designed to deliver marketing and performance benefits at a competitive cost by capitalizing on its low-cost paperboard mills and converting facilities, its proprietary carton and packaging designs, and its commitment to quality and service.
GPHC, GPI Holding I, Inc., GPI Holding II, Inc. and GPI Holding III, LLC conduct no significant business operations and have no independent assets or operations other than intercompany transactions and their direct and indirect ownership of
79.5%
of GPIP's membership interests, except for deferred tax assets held by GPHC.
The Company’s Condensed Consolidated Financial Statements include all subsidiaries in which the Company has the ability to exercise direct or indirect control over operating and financial policies. Intercompany transactions and balances are eliminated in consolidation.
In the Company’s opinion, the accompanying Condensed Consolidated Financial Statements contain all normal recurring adjustments necessary to present fairly the financial position, results of operations and cash flows for the interim periods. The Company’s year end Condensed Consolidated Balance Sheet data was derived from audited financial statements. The accompanying unaudited Condensed Consolidated Financial Statements have been prepared in accordance with instructions to Form 10-Q and Rule 10-01 of Regulation S-X and do not include all the information required by accounting principles generally accepted in the United States of America (“U.S. GAAP”) for complete financial statements. Therefore, these Condensed Consolidated Financial Statements should be read in conjunction with GPHC’s Form 10-K for the year ended
December 31, 2017
. In addition, the preparation of the Condensed Consolidated Financial Statements in conformity with U.S. GAAP requires management to make estimates and assumptions that affect the reported amounts of assets and liabilities and disclosure of contingent assets and liabilities at the date of the Condensed Consolidated Financial Statements and the reported amounts of revenues and expenses during the reporting period. Actual amounts could differ from those estimates and changes in these estimates are recorded when known.
For a summary of the Company’s significant accounting policies, please refer to GPHC’s Form 10-K for the year ended
December 31, 2017
.
Revenue Recognition
The Company has
two
primary activities from which it generates revenue from contracts with customers, and revenue is disaggregated primarily by geography and type of activity as further explained in "
Note 10-Segments.
"
All reportable segments and the Australia and Pacific Rim operating segments recognize revenue under the same method, allocate transaction price using similar methods, and have similar economic factors impacting the uncertainty of revenue and related cash flows.
Revenue is recognized on the Company's annual and multi-year supply contracts when the Company satisfies the performance obligation by transferring control over the product or service to a customer, which is generally based on shipping terms and passage of title under the point-in-time method of recognition. For the three months ended September 30, 2018 and 2017, the Company recognized
$1,525.7 million
and
$1,132.0 million
, respectively, of revenue from contracts with customers. For the
nine months ended
September 30, 2018
and
2017
, the Company recognized
$4,502.7 million
and
$3,277.8 million
, respectively, of revenue from contracts with customers.
The transaction price allocated to each performance obligation consists of the stand alone selling price, estimates of rebates and other sales or contract renewal incentives, and cash discounts and sales returns ("Variable Consideration"). Estimates are made for Variable Consideration based on contract terms and historical experience of actual results and are applied to the performance obligations as they are settled. Purchases by the Company’s principal customers are manufactured and shipped with minimal lead time, therefore performance obligations are generally settled shortly after manufacturing and shipment.
The Company's contract assets consist primarily of contract renewal incentive payments to customers which are amortized over the period in which performance obligations related to the contract renewal are satisfied. As of
September 30, 2018
and
December 31, 2017
contract assets were
$21.7 million
and
$11.7 million
, respectively. The Company's contract liabilities consist principally of rebates, and as of
September 30, 2018
and
December 31, 2017
were
$47.7 million
and
$28.6 million
, respectively.
The Company did not have a material amount relating to backlog orders at
September 30, 2018
or
December 31, 2017
.
9
GRAPHIC PACKAGING HOLDING COMPANY
NOTES TO CONDENSED CONSOLIDATED FINANCIAL STATEMENTS
(Unaudited)
Accounts Receivable and Allowances
The Company has entered into agreements to sell, on a revolving basis, certain trade accounts receivable to third party financial institutions. Transfers under these agreements meet the requirements to be accounted for as sales in accordance with the
Transfers and Servicing
topic of the Financial Accounting Standards Board ("FASB") Accounting Standards Codification (the "Codification"). The loss on sale is not material and is included in
Other Expense, Net
on the Condensed Consolidated Statement of Operations. The following table summarizes the activity under these programs as of
September 30, 2018
and
2017
, respectively:
|
Nine Months Ended
|
|||||||
|
September 30,
|
|||||||
|
In millions
|
2018
|
2017
|
|||||
|
Receivables Sold and Derecognized
|
$
|
2,507.2
|
|
$
|
1,027.9
|
|
|
|
Proceeds Collected on Behalf of Financial Institutions
|
2,449.8
|
|
962.9
|
|
|||
|
Net Proceeds (Paid to) Received From Financial Institutions
|
(121.7
|
)
|
65.0
|
|
|||
|
Deferred Purchase Price
(a)
|
282.3
|
|
26.3
|
|
|||
(a)
Included in Receivables, Net and represents receivables from the financial institution which have purchasing and servicing of receivable agreements, which is a Level 3 fair value measure.
The Company has also entered into various factoring and supply chain financing arrangements, which also qualify for sale accounting in accordance with the
Transfers and Servicing
topic of the FASB Codification. For the
nine months ended
September 30, 2018
and
2017
, the Company sold receivables of approximately
$86 million
and
$43 million
, respectively, related to these factoring arrangements.
Receivables sold under all programs subject to continuing involvement, which consist principally of collection services, at
September 30, 2018
and
December 31, 2017
, were approximately
$641 million
and
$583 million
, respectively.
Capital Allocation Plan
During the first nine months of 2018, the Company's board of directors declared three regular quarterly dividends of
$0.075
per share of common stock to shareholders of record as follows:
|
Date Declared
|
Record Date
|
Payment Date
|
|
February 22, 2018
|
March 15, 2018
|
April 5, 2018
|
|
May 23, 2018
|
June 15, 2018
|
July 5, 2018
|
|
July 26, 2018
|
September 15, 2018
|
October 5, 2018
|
On January 10, 2017, the Company's board of directors authorized an additional share repurchase program to allow the Company to purchase up to $
250 million
of the Company's issued and outstanding shares of common stock through open market purchases, privately negotiated transactions and Rule 10b5-1 plans (the "2017 share repurchase program"). The original
$250 million
share repurchase program was authorized on February 4, 2015 (the "2015 share repurchase program"). During the first
nine months
of
2018
, the Company did
no
t repurchase any shares of its common stock. The Company repurchased approximately
4.5 million
shares at an average price of
$13.08
during the
nine months
ended
September 30, 2017
, including approximately
1.4 million
shares repurchased under the 2015 share repurchase program thereby completing that program. As of
September 30, 2018
, the Company has approximately
$210 million
available for additional repurchases under the 2017 share repurchase program.
10
GRAPHIC PACKAGING HOLDING COMPANY
NOTES TO CONDENSED CONSOLIDATED FINANCIAL STATEMENTS
(Unaudited)
Business Combinations, Gain on Sale of Assets and Shutdown and Other Special Charges, Net
The following table summarizes the transactions recorded in
Business Combinations, (Gain) on Sale of Assets and Shutdown and Other Special Charges, Net
in the Condensed Consolidated Statements of Operations:
|
Three Months Ended
|
Nine Months Ended
|
||||||||||||||
|
September 30,
|
September 30,
|
||||||||||||||
|
In millions
|
2018
|
2017
|
2018
|
2017
|
|||||||||||
|
Charges Associated with Business Combinations
|
$
|
8.3
|
|
$
|
2.3
|
|
$
|
41.9
|
|
$
|
10.0
|
|
|||
|
Shutdown and Other Special Charges
|
1.4
|
|
1.3
|
|
4.2
|
|
8.3
|
|
|||||||
|
Gain on Sale of Assets
|
(37.1
|
)
|
—
|
|
(38.6
|
)
|
—
|
|
|||||||
|
Total
|
$
|
(27.4
|
)
|
$
|
3.6
|
|
$
|
7.5
|
|
$
|
18.3
|
|
|||
2018
On September 30, 2018, the Company acquired substantially all the assets of the foodservice business of Letica Corporation, a subsidiary of RPC Group PLC ("Letica Foodservice"), a producer of paperboard-based cold and hot cups and cartons. The acquisition includes
two
facilities located in Clarksville, Tennessee and Pittston, Pennsylvania. Letica Foodservice is included in the Americas Paperboard Packaging reportable segment.
On August 31, 2018, the Company sold its previously closed coated recycled paperboard mill site in Santa Clara, California, resulting in a gain on sale of assets of
$37.1 million
.
On June 12, 2018, the Company acquired substantially all the assets of PFP, LLC and its related entity, PFP Dallas Converting, LLC (collectively, "PFP"), a converter focused on the production of paperboard based air filter frames. The acquisition includes
two
facilities located in Lebanon, Tennessee and Lancaster, Texas. PFP is included in the Americas Paperboard Packaging reportable segment.
On January 1, 2018, the Company completed the NACP Combination. The NACP business produces SBS paperboard and paper-based foodservice products. The NACP business includes
two
SBS mills located in Augusta, Georgia and Texarkana, Texas (included in Paperboard Mills reportable segment),
three
converting facilities in the U.S. (included in Americas Paperboard Packaging reportable segment) and
one
in the United Kingdom ("U.K.") (included in the Europe Paperboard Packaging reportable segment).
2017
On December 1, 2017, the Company acquired the assets of Seydaco Packaging Corp. and its affiliates National Carton and Coating Co., and Groupe Ecco Boites Pliantes Ltée (collectively, "Seydaco"), a folding carton producer focused on the foodservice, food, personal care, and household goods markets. The acquisition includes
three
folding carton facilities located in Mississauga, Ontario, St.-Hyacinthe, Québec, and Xenia, Ohio.
On December 1, 2017, the Company closed its coated recycled paperboard mill in Santa Clara, California. This decision was made as a result of a thorough assessment of the facility's manufacturing capabilities and associated costs in the context of the Company's overall mill operating capabilities and cost structure. The financial impact is reflected in Shutdown and Other Special Charges in the table above.
On October 4, 2017, the Company acquired Norgraft Packaging, S.A., ("Norgraft"), a leading folding carton producer in Spain focused on the food and household goods markets. The acquisition includes
two
folding carton facilities located in Miliaño and Requejada, Spain.
On July 10, 2017, the Company acquired substantially all the assets of Carton Craft Corporation and its affiliate Lithocraft, Inc (collectively, "Carton Craft"). The acquisition includes
two
folding carton facilities located in New Albany, Indiana, focused on the production of paperboard based air filter frames and folding cartons.
The Seydaco, Norgraft, and Carton Craft transactions are referred to collectively as the "2017 Acquisitions." Seydaco and Carton Craft are included in the Americas Paperboard Packaging Segment. Norgraft is included in the Europe Paperboard Packaging Segment.
Charges associated with the NACP Combination, the PFP and Letica Foodservice acquisitions, and 2017 Acquisitions are reflected in Charges Associated with Business Combinations in the above table.
For more information regarding the above acquisitions see "
Note 3 - Business Combinations
."
11
GRAPHIC PACKAGING HOLDING COMPANY
NOTES TO CONDENSED CONSOLIDATED FINANCIAL STATEMENTS
(Unaudited)
Adoption of New Accounting Standards
Effective January 1, 2018, the Company adopted Accounting Standards Update ("ASU") No. 2017-09,
Compensation - Stock Compensation (Topic 718); Scope of Modification Accounting.
The amendments in this ASU provide guidance that clarifies when changes to the terms or conditions of a share-based payment award must be accounted for as modifications. If the value, vesting conditions or classification of the award changes, modification accounting will apply. The adoption of this standard did not have a material impact on the Company’s financial position, results of operations and cash flows.
Effective January 1, 2018, the Company adopted ASU No. 2017-07,
Compensation - Retirement Benefits (Topic 715); Improving the Presentation of Net Periodic Pension Cost and Net Periodic Postretirement Benefit Cost
. The amendments in this ASU require the service cost component of net periodic benefit cost be reported in the same income statement line or lines as other compensation costs for employees. The other components of net periodic benefit cost are required to be reported separately from service costs and outside a subtotal of income from operations. Only the service cost component is eligible for capitalization. The adoption of this ASU was applied retrospectively for the reclassification of net periodic benefit expense, excluding service costs, in the Condensed Consolidated Statement of Operations. The adoption of this ASU did not have a material impact on the Company’s financial position, results of operations and cash flows.
Effective January 1, 2018, the Company adopted ASU No. 2017-01,
Business Combinations (Topic 805); Clarifying the Definition of a Business
. The amendments in this ASU provide guidance in evaluating whether transactions should be accounted for as acquisitions (or disposals) of assets or businesses. The definition of a business affects many areas of accounting including acquisitions, disposals, goodwill and consolidation. This ASU was adopted prospectively and did not have a material impact on the Company’s financial position, results of operations and cash flows.
Effective January 1, 2018, the Company adopted ASU No. 2016-15,
Statement of Cash Flows (Topic 230); Classification of Certain Cash Receipts and Cash Payments
. The amendments in this ASU provide guidance on how certain cash receipts and payments should be presented in the statement of cash flows and was applied retrospectively. This ASU requires the Company to classify consideration received for beneficial interest obtained for selling trade receivables as investing instead of operating activities. The retrospective impact on the Company's consolidated statement of cash flows for the
nine months ended
September 30, 2017 was a
$424.8 million
decrease to cash provided by operating activities and a corresponding increase to cash provided by investing activities.
Effective January 1, 2018, the Company adopted ASU No. 2014-09,
Revenue from Contracts with Customers (Topic 606),
using the modified retrospective approach. Adoption of ASU No. 2014-09 requires that an entity recognize revenue to depict the transfer of goods or services to customers in an amount that reflects the consideration to which the entity expects to be entitled in exchange for those goods or services. The Company considered whether the adoption may require acceleration of revenue for products produced by the Company without an alternative use and when the Company would have a legally enforceable right of payment. The Company has determined that it does not have an enforceable right of payment for products produced but not yet shipped and recognizes all revenue under the point in time method. The adoption of ASU No. 2014-09 did not have a material impact on the Company's financial position, results of operations and cash flows.
Accounting Standards Not Yet Adopted
In August 2017, the FASB issued ASU No. 2017-12,
Derivatives and Hedging (Topic 815); Targeted Improvements to Accounting for Hedging Activities.
The amendments in this ASU better align the risk management activities and financial reporting for these hedging relationships through changes to both the designation and measurement guidance for qualifying hedging relationships and presentation of hedge results. The guidance is effective for fiscal years beginning after December 15, 2018, and interim periods within those fiscal years. The Company does not expect the adoption of this standard to have a material impact on the Company’s financial position, results of operations and cash flows.
In January 2017, the FASB issued ASU No. 2017-04
Intangibles - Goodwill and Other (Topic 350); Simplifying the Test for Goodwill Impairment
which simplifies how an entity is required to test goodwill for impairment by eliminating Step 2 of the goodwill impairment model. Step 2 measures a goodwill impairment loss by comparing the implied value of a reporting unit’s goodwill with the carrying amount of that goodwill. An entity would recognize an impairment charge for the amount by which the carrying amount of a reporting unit exceeds its fair value; however, the loss recognized is limited to the amount of goodwill allocated to that reporting unit. The guidance is effective for fiscal years beginning after December 15, 2019. Early adoption is permitted for any impairment tests performed after January 1, 2017.
In February 2016, the FASB issued ASU No. 2016-02,
Leases (Topic 842)
. The amendments in this ASU require an entity to recognize a right-of-use asset and lease liability for all leases with terms of more than 12 months. Recognition, measurement and presentation of expenses will depend on classification as a finance or operating lease. The amendments also require certain quantitative and qualitative disclosures about leasing arrangements. The amendments are effective for fiscal years beginning after December 15, 2018, including interim periods within those fiscal years. Early adoption is permitted. The updated guidance allows a modified retrospective adoption, which the Company plans to adopt. The Company has formed an implementation team including representatives from finance, information technology and supply chain to assist in the implementation of this standard. A software solution has been determined, and is being populated as the Company is gathering information on all of its leases. The adoption of this standard is expected to have a material impact on the Company’s financial position, but currently is not expected to have a material impact on the results of operations and cash flows.
12
GRAPHIC PACKAGING HOLDING COMPANY
NOTES TO CONDENSED CONSOLIDATED FINANCIAL STATEMENTS
(Unaudited)
Inventories, Net by major class:
|
In millions
|
September 30,
2018 |
December 31, 2017
|
|||||
|
Finished Goods
|
$
|
429.8
|
|
$
|
240.5
|
|
|
|
Work in Progress
|
104.5
|
|
74.1
|
|
|||
|
Raw Materials
|
332.7
|
|
229.4
|
|
|||
|
Supplies
|
163.7
|
|
90.0
|
|
|||
|
Total
|
$
|
1,030.7
|
|
$
|
634.0
|
|
|
On January 1, 2018, the Company completed the NACP Combination. The NACP business produces SBS paperboard and paper-based foodservice products. The NACP business includes
two
SBS mills located in Augusta, Georgia and Texarkana, Texas,
three
converting facilities in the U.S. and
one
in the U.K.
Total consideration for the NACP Combination, including debt assumed of
$660 million
, was
$1.9 billion
. Management believes that the purchase price attributable to goodwill represents the benefits expected as the acquisition was made to continue to expand the Company's product offering, integrate paperboard from the Company's mills and to further optimize the Company's supply chain footprint.
In conjunction with the NACP Combination, the Company executed a Tax Receivable Agreement ("TRA") with IP. Pursuant to elections under Section 754 of the Internal Revenue Code, the Company expects to obtain an increase with respect to the tax basis in the assets of GPIP and certain of its subsidiaries when IP exchanges or redeems any of its membership interests. The Company generally expects to treat redemptions or exchanges of membership interests by IP as direct purchases of membership interests for U.S. federal income tax purposes. Increases in tax basis may reduce the amounts that we would otherwise pay in the future to various tax authorities. The TRA provides for the payment by the Company to IP of
50%
of the amount of any tax benefits projected to be realized by the Company upon IP's exchange of the partnership units into GPHC common stock.
13
GRAPHIC PACKAGING HOLDING COMPANY
NOTES TO CONDENSED CONSOLIDATED FINANCIAL STATEMENTS
(Unaudited)
On September 30, 2018, the Company completed the Letica Foodservice acquisition. The acquisition includes
two
facilities in Clarksville, Tennessee and Pittston, Pennsylvania, focused on the production of paperboard-based cold and hot cups and cartons. The Company paid approximately
$95 million
using existing cash and borrowings under its revolving credit facility.
On June 12, 2018, the Company completed the PFP acquisition. The Company paid approximately
$34 million
using existing cash and borrowings under its revolving credit facility. The acquisition includes
two
manufacturing facilities in Lebanon, Tennessee and Lancaster, Texas, focused on the production of paperboard-based air filter frames.
The Company expects that goodwill related to the NACP Combination will
no
t be deductible for tax purposes. The Company expects that goodwill related to the Letica Foodservice and the PFP acquisitions will be deductible for tax purposes.
The acquisition accounting for the NACP Combination and the Letica Foodservice and PFP acquisitions are preliminary based on the estimated fair values as of the combination date and are subject to adjustments in subsequent periods once the third party valuations are finalized. The preliminary acquisition accounting for the NACP Combination and the Letica Foodservice and PFP acquisitions is as follows:
|
In millions
|
Amounts Recognized as of Acquisition Dates
|
Measurement Period Adjustments
|
Amounts Recognized as of Acquisition Dates (as adjusted)
|
||||||||
|
Purchase Price
|
$
|
1,365.2
|
|
$
|
(41.3
|
)
|
$
|
1,323.9
|
|
||
|
Assumed Debt
|
660.0
|
|
—
|
|
660.0
|
|
|||||
|
Total Purchase Consideration
|
$
|
2,025.2
|
|
$
|
(41.3
|
)
|
$
|
1,983.9
|
|
||
|
Receivables, Net
|
145.3
|
|
—
|
|
145.3
|
|
|||||
|
Inventories, Net
|
314.2
|
|
0.8
|
|
315.0
|
|
|||||
|
Other Current Assets
|
20.9
|
|
(5.6
|
)
|
15.3
|
|
|||||
|
Property, Plant and Equipment, Net
|
1,242.6
|
|
13.4
|
|
1,256.0
|
|
|||||
|
Intangible Assets, Net
(a)
|
136.6
|
|
22.0
|
|
158.6
|
|
|||||
|
Other Assets
|
6.0
|
|
—
|
|
6.0
|
|
|||||
|
Total Assets Acquired
|
1,865.6
|
|
30.6
|
|
1,896.2
|
|
|||||
|
Accounts Payable
|
112.6
|
|
—
|
|
112.6
|
|
|||||
|
Compensation and Employee Benefits
|
21.0
|
|
—
|
|
21.0
|
|
|||||
|
Current Liabilities
|
12.5
|
|
—
|
|
12.5
|
|
|||||
|
Other Noncurrent Liabilities
|
10.1
|
|
—
|
|
10.1
|
|
|||||
|
Total Liabilities Assumed
|
156.2
|
|
—
|
|
156.2
|
|
|||||
|
Net Assets Acquired
|
1,709.4
|
|
30.6
|
|
1,740.0
|
|
|||||
|
Goodwill
|
315.8
|
|
(71.9
|
)
|
243.9
|
|
|||||
|
Total Estimated Fair Value of Net Assets Acquired
|
$
|
2,025.2
|
|
$
|
(41.3
|
)
|
$
|
1,983.9
|
|
||
(a)
Intangible Assets, Net consists of customer relationships which are generally amortized using an accelerated method over approximately
20 years
. The value of customer relationships was determined using a discounted cash flow model, which includes an approximate
5%
attrition rate. Beyond the twenty year life, the present value of cash flows were not meaningful.
14
GRAPHIC PACKAGING HOLDING COMPANY
NOTES TO CONDENSED CONSOLIDATED FINANCIAL STATEMENTS
(Unaudited)
The following unaudited pro forma consolidated results of operations data assumes that the NACP Combination occurred as of the beginning of the period presented. This pro forma data is based on historical information and does not necessarily reflect the actual results that would have occurred, nor is it indicative of future results of operations.
|
|
Three Months Ended
|
Nine Months Ended
|
|||||
|
September 30,
|
September 30,
|
||||||
|
In millions, except per share data
|
2017
|
2017
|
|||||
|
Net Sales
|
$
|
1,521.0
|
|
$
|
4,420.6
|
|
|
|
Net Income Attributable to Graphic Packaging Holding Company
|
60.7
|
|
128.9
|
|
|||
|
Income Per Share — Basic
|
0.25
|
|
0.52
|
|
|||
|
Income Per Share — Diluted
|
0.25
|
|
0.52
|
|
|||
Net Sales and Income from Operations from the NACP Combination was
$352.7 million
and
$44.6 million
, respectively, for the three months ended September 30, 2018. Net Sales and Income from Operations from the NACP Combination was
$1,072.3 million
and
$100.5 million
, respectively, for the
nine months ended
September 30, 2018
.
Total Assets increased as a result of the NACP Combination for the Paperboard Mills and Americas Paperboard Packaging reportable segments by approximately
$1.5 billion
and
$0.6 billion
, respectively, as compared to
December 31, 2017
.
In connection with the NACP Combination, the Company entered into agreements with IP for transition services, fiber procurement and corrugated products and ink supply. Payments to IP for the
nine months ended
September 30, 2018
under these agreements were
$20.1 million
,
$12.4 million
and
$21.8 million
, respectively. In addition, approximately
$5 million
of payments were made for purchases unrelated to these agreements.
As disclosed in "
Note 1 - General Information,
"
in 2017, the Company acquired Seydaco, Norgraft, and Carton Craft, which are referred to collectively as the "
2017 Acquisitions
." Seydaco and Carton Craft are included in the Americas Paperboard Packaging Segment. Norgraft is included in the Europe Paperboard Packaging Segment. The Company paid approximately
$189 million
, net of cash acquired, for the 2017 Acquisitions using existing cash and borrowings under its revolving line of credit, and assumed debt of approximately
$14 million
. During the second quarter of 2018, the Company made valuation adjustments of
$0.5 million
for Carton Craft, which was recorded to goodwill. For the nine months ended September 30, 2018, the Company paid an additional
$2.4 million
related to the working capital true-up and recorded valuation adjustments of $7.3 million for Seydaco, which in aggregate was recorded to goodwill.
For more information regarding the Company’s debt, see “
Note 5
—
Debt
”
of the Notes to Consolidated Financial Statements of the Company’s
2017
Form 10-K.
Long-Term Debt is comprised of the following:
|
In millions
|
September 30, 2018
|
December 31, 2017
|
|||||
|
Senior Notes with interest payable semi-annually at 4.125%, effective rate of 4.18%, payable in 2024
|
$
|
300.0
|
|
$
|
300.0
|
|
|
|
Senior Notes with interest payable semi-annually at 4.875%, effective rate of 4.92%, payable in 2022
|
250.0
|
|
250.0
|
|
|||
|
Senior Notes with interest payable semi-annually at 4.75%, effective rate of 4.78%, payable in 2021
|
425.0
|
|
425.0
|
|
|||
|
Senior Secured Term Loan Facilities with interest payable at various dates at floating rates (3.59% at September 30, 2018) payable through 2023
|
1,441.8
|
|
925.0
|
|
|||
|
Senior Secured Revolving Facilities with interest payable at floating rates (3.24% at September 30, 2018) payable in 2023
|
457.6
|
|
319.0
|
|
|||
|
Capital Lease Obligations
|
28.1
|
|
30.0
|
|
|||
|
Other
|
28.0
|
|
28.9
|
|
|||
|
Total Long-Term Debt
|
2,930.5
|
|
2,277.9
|
|
|||
|
Less: Current Portion
|
38.5
|
|
52.2
|
|
|||
|
2,892.0
|
|
2,225.7
|
|
||||
|
Less: Unamortized Deferred Debt Issuance Costs
|
11.3
|
|
12.5
|
|
|||
|
Total
|
$
|
2,880.7
|
|
$
|
2,213.2
|
|
|
15
GRAPHIC PACKAGING HOLDING COMPANY
NOTES TO CONDENSED CONSOLIDATED FINANCIAL STATEMENTS
(Unaudited)
At
September 30, 2018
, the Company and its U.S. and international subsidiaries had the following commitments, amounts outstanding and amounts available under revolving credit facilities:
|
In millions
|
Total
Commitments
|
Total
Outstanding
|
Total Available
|
||||||||
|
Senior Secured Domestic Revolving Credit Facility
(a)
|
$
|
1,450.0
|
|
$
|
362.0
|
|
$
|
1,064.9
|
|
||
|
Senior Secured International Revolving Credit Facility
|
182.6
|
|
95.6
|
|
|
87.0
|
|
||||
|
Other International Facilities
|
63.9
|
|
37.6
|
|
26.3
|
|
|||||
|
Total
|
$
|
1,696.5
|
|
$
|
495.2
|
|
$
|
1,178.2
|
|
||
|
(a)
|
In accordance with its debt agreements, the Company’s availability under its revolving credit facilities has been reduced by the amount of standby letters of credit issued of
$23.1 million
as of
September 30, 2018
. These letters of credit are primarily used as security against its self-insurance obligations and workers’ compensation obligations. These letters of credit expire at various dates through 2019 unless extended.
|
In connection with the consummation of the NACP Combination, GPIL entered into a Third Amended and Restated Credit Agreement dated January 1, 2018 (the “Amended and Restated Credit Agreement”). The Amended and Restated Credit Agreement effected an “amend and extend” transaction with respect to the Company’s existing senior credit facility by which, among other things: (i) the maturity date thereof was extended to January 1, 2023, (ii) the U.S. dollar commitment portion increased by
$75 million
, (iii) the applicable margin interest rate pricing grid levels were changed from those set forth in the prior credit facility, (iv) certain negative covenants contained in the prior credit facility were relaxed, and (v) certain amendments were effected so as to accommodate the transactions with IP.
In addition to the Amended and Restated Credit Agreement, on January 1, 2018 the Company assumed the term loan indebtedness previously incurred by IP (the “Term Loan Credit Agreement”) in an aggregate amount of
$660 million
, repayable pursuant to the same amortization schedule (expressed as a percentage of the principal amount thereof) as the Term Loan A under the Amended and Restated Credit Agreement and has the same maturity date of January 1, 2023. The applicable margin interest rate pricing grid, covenants and other terms are substantially equivalent to those contained in the Amended and Restated Credit Agreement. The Term Loan Credit Agreement is secured by a lien and security interest in substantially all of the assets of GPIL on a pari passu basis with the liens and security interests securing the Amended and Restated Credit Agreement pursuant to the terms of a customary intercreditor agreement among the parties. The Amended and Restated Credit Agreement and Term Loan Credit Agreement are collectively referred to as the "Credit Agreement."
The Credit Agreement is guaranteed by GPIP and certain domestic subsidiaries, and the
4.75%
Senior Notes due 2021,
4.875%
Senior Notes due 2022 and
4.125%
Senior Notes due 2024 are guaranteed by GPHC. For additional information on the financial statements of GPIP, see "
Note 13 - Guarantor Consolidating Financial Statements
”
of the Notes to the Consolidated Financial Statements of GPIL in its Quarterly Report on Form 10-Q for the quarter ended September 30, 2018 filed with the Securities and Exchange Commission.
The Credit Agreement and the indentures governing the
4.75%
Senior Notes due 2021,
4.875%
Senior Notes due 2022 and
4.125%
Senior Notes due 2024 (the “Indentures”) limit the Company's ability to incur additional indebtedness. Additional covenants contained in the Credit Agreement and the Indentures may, among other things, restrict the ability of the Company to dispose of assets, incur guarantee obligations, prepay other indebtedness, repurchase stock, pay dividends and make other restricted payments, create liens, make equity or debt investments, make acquisitions, modify terms of the Indenture, engage in mergers or consolidations, change the business conducted by the Company and its subsidiaries, and engage in certain transactions with affiliates. Such restrictions could limit the Company’s ability to respond to changing market conditions, fund its capital spending program, provide for unexpected capital investments or take advantage of business opportunities.
As of
September 30, 2018
, the Company was in compliance with the covenants in the Credit Agreement and the Indentures.
The Company has
one
active equity compensation plan from which new grants may be made, the Graphic Packaging Holding Company 2014 Omnibus Stock and Incentive Compensation Plan (the “2014 Plan”). Under the 2014 Plan, the Company may grant stock options, stock appreciation rights, restricted stock, restricted stock units (“RSUs”) and other types of stock-based and cash awards. Awards under the 2014 Plan generally vest and expire in accordance with terms established at the time of grant. Shares issued pursuant to awards under the 2014 Plan are from the Company’s authorized but unissued shares. Compensation costs are recognized on a straight-line basis over the requisite service period of the award.
Stock Awards, Restricted Stock and Restricted Stock Units
Under the 2014 Plan, all RSUs generally vest and become payable in
three
years from date of grant. RSUs granted to employees generally contain either performance conditions based on various financial targets or service requirements that must be met for the shares to vest.
16
GRAPHIC PACKAGING HOLDING COMPANY
NOTES TO CONDENSED CONSOLIDATED FINANCIAL STATEMENTS
(Unaudited)
Data concerning RSUs granted in the first
nine months
of
2018
is as follows:
|
RSUs
|
Weighted Average
Grant Date Fair
Value Per Share
|
|||||
|
RSUs — Employees
|
1,511,893
|
|
$
|
14.81
|
|
|
|
Stock Awards — Board of Directors
|
51,226
|
|
$
|
15.03
|
|
|
During the
nine months ended
September 30, 2018
and
2017
,
$9.7 million
and
$5.5 million
, respectively, were charged to compensation expense for stock incentive plans.
During the
nine months ended
September 30, 2018
and
2017
, approximately
0.6 million
and
1.0 million
shares were issued, respectively. The shares issued were primarily related to RSUs granted during 2015 and 2014, respectively.
The Company maintains both defined benefit pension plans and postretirement health care plans that provide medical and life insurance coverage to eligible salaried and hourly retired employees in North America and their dependents. The Company maintains international defined benefit pension plans which are either noncontributory or contributory and are funded in accordance with applicable local laws. Pension or termination benefits are based primarily on years of service and the employee's compensation.
Pension and Postretirement Expense
The pension and postretirement expenses related to the Company’s plans consisted of the following:
|
Pension Benefits
|
Postretirement Health Care Benefits
|
||||||||||||||||||||||||||||||
|
Three Months Ended
|
Nine Months Ended
|
Three Months Ended
|
Nine Months Ended
|
||||||||||||||||||||||||||||
|
September 30,
|
September 30,
|
September 30,
|
September 30,
|
||||||||||||||||||||||||||||
|
In millions
|
2018
|
2017
|
2018
|
2017
|
2018
|
2017
|
2018
|
2017
|
|||||||||||||||||||||||
|
Components of Net Periodic Cost:
|
|||||||||||||||||||||||||||||||
|
Service Cost
|
$
|
4.6
|
|
$
|
2.3
|
|
$
|
13.8
|
|
$
|
6.8
|
|
$
|
0.2
|
|
$
|
0.2
|
|
$
|
0.5
|
|
$
|
0.6
|
|
|||||||
|
Interest Cost
|
10.4
|
|
10.7
|
|
31.4
|
|
31.9
|
|
0.3
|
|
0.3
|
|
0.9
|
|
1.0
|
|
|||||||||||||||
|
Administrative Expenses
|
0.1
|
|
—
|
|
0.3
|
|
—
|
|
—
|
|
—
|
|
—
|
|
—
|
|
|||||||||||||||
|
Expected Return on Plan Assets
|
(15.9
|
)
|
(16.1
|
)
|
(47.8
|
)
|
(48.0
|
)
|
—
|
|
—
|
|
—
|
|
—
|
|
|||||||||||||||
|
Amortization:
|
|||||||||||||||||||||||||||||||
|
Prior Service Cost (Credit)
|
0.1
|
|
0.1
|
|
0.3
|
|
0.4
|
|
—
|
|
(0.1
|
)
|
(0.1
|
)
|
(0.2
|
)
|
|||||||||||||||
|
Actuarial Loss (Gain)
|
1.4
|
|
1.6
|
|
4.2
|
|
4.8
|
|
(0.5
|
)
|
(0.5
|
)
|
(1.4
|
)
|
(1.6
|
)
|
|||||||||||||||
|
Net Periodic Cost (Benefit)
|
$
|
0.7
|
|
$
|
(1.4
|
)
|
$
|
2.2
|
|
$
|
(4.1
|
)
|
$
|
—
|
|
$
|
(0.1
|
)
|
$
|
(0.1
|
)
|
$
|
(0.2
|
)
|
|||||||
Employer Contributions
The Company made contributions of
$2.8 million
and
$33.6 million
to its pension plans during the first
nine months
of
2018
and
2017
, respectively. The Company expects to make contributions of
$5 million
to
$10 million
for the full year
2018
. During
2017
, the Company made
$119.1 million
of contributions to its pension plans.
The Company made postretirement health care benefit payments of
$1.8 million
and
$1.7 million
during the first
nine months
of
2018
and
2017
, respectively. The Company estimates its postretirement health care benefit payments for the full year
2018
to be approximately
$3 million
. During
2017
, the Company made postretirement health care benefit payments of
$2.2 million
.
17
GRAPHIC PACKAGING HOLDING COMPANY
NOTES TO CONDENSED CONSOLIDATED FINANCIAL STATEMENTS
(Unaudited)
The Company enters into derivative instruments for risk management purposes only, including derivatives designated as hedging instruments under the
Derivatives and Hedging
topic of the FASB Codification and those not designated as hedging instruments under this guidance. The Company uses interest rate swaps, natural gas swap contracts, and forward exchange contracts. These derivative instruments are designated as cash flow hedges and, to the extent they are effective in offsetting the variability of the hedged cash flows, changes in the derivatives’ fair value are not included in current earnings but are included in Accumulated Other Comprehensive Loss. These changes in fair value will subsequently be reclassified to earnings, contemporaneously with and offsetting changes in the related hedged exposure.
For more information regarding the Company’s financial instruments and fair value measurement, see “
Note 9 — Financial Instruments, Derivatives and Hedging Activities
”
and
“
Note 10 — Fair Value Measurement
” of the Notes to Consolidated Financial Statements of the Company’s
2017
Form 10-K.
Interest Rate Risk
The Company uses interest rate swaps to manage interest rate risks on future interest payments caused by interest rate changes on its variable rate term loan facility. Changes in fair value will subsequently be reclassified into earnings as a component of
Interest Expense, Net
as interest is incurred on amounts outstanding under the term loan facility. The following table summarizes the Company's current interest rate swap positions for each period presented as of
September 30, 2018
:
|
Start
|
End
|
(In Millions)
Notional Amount |
Weighted Average Interest Rate
|
|
|
12/01/2017
|
10/01/2018
|
$250.0
|
1.16%
|
|
|
04/03/2018
|
01/01/2019
|
$150.0
|
2.03%
|
|
|
04/03/2018
|
01/01/2020
|
$150.0
|
2.25%
|
|
|
04/03/2018
|
10/01/2020
|
$150.0
|
2.36%
|
|
|
12/03/2018
|
01/01/2022
|
$120.0
|
2.92%
|
|
|
12/03/2018
|
01/04/2022
|
$80.0
|
2.79%
|
|
Ineffectiveness measured in the hedging relationship is recorded in earnings in the period it occurs. During the first
nine months
of
2018
and
2017
, there were
no
amounts of ineffectiveness related to changes in the fair value of interest rate swap agreements. Additionally, there were
no
amounts excluded from the measure of effectiveness.
Commodity Risk
To manage risks associated with future variability in cash flows and price risk attributable to purchases of natural gas, the Company enters into natural gas swap contracts to hedge prices for a designated percentage of its expected natural gas usage. Such contracts are designated as cash flow hedges. The contracts are carried at fair value with changes in fair value recognized in Accumulated Other Comprehensive Loss, the resulting gain or loss reclassified into Cost of Sales concurrently with the recognition of the commodity consumed, and the ineffective portion of the swap contracts’ change in fair value recognized immediately in earnings. The Company has hedged approximately
40%
and
20%
of its expected natural gas usage for the remainder of
2018
and the first quarter of 2019, respectively.
During the first
nine months
of
2018
and
2017
, there were minimal amounts of ineffectiveness related to changes in the fair value of natural gas swap contracts. Additionally, there were
no
amounts excluded from the measure of effectiveness.
Foreign Currency Risk
The Company enters into forward exchange contracts to manage risks associated with foreign currency transactions and future variability of cash flows arising from those transactions that may be adversely affected by changes in exchange rates. The contracts are carried at fair value with changes in fair value recognized in Accumulated Other Comprehensive Loss and gains/losses related to these contracts are recognized in
Other Expense, Net
or
Net Sales
, when appropriate.
At
September 30, 2018
, multiple forward exchange contracts existed that expire on various dates through the remainder of
2018
. Those purchased forward exchange contracts outstanding at
September 30, 2018
and
December 31, 2017
, when aggregated and measured in U.S. dollars at contractual rates at
September 30, 2018
and
December 31, 2017
, had notional amounts totaling
$14.1 million
and
$66.1 million
, respectively.
No
amounts were reclassified to earnings during the first
nine months
of
2018
or during
2017
in connection with forecasted transactions that were considered probable of not occurring and there was
no
amount of ineffectiveness related to changes in the fair value of foreign currency forward contracts. Additionally, there were
no
amounts excluded from the measure of effectiveness.
18
GRAPHIC PACKAGING HOLDING COMPANY
NOTES TO CONDENSED CONSOLIDATED FINANCIAL STATEMENTS
(Unaudited)
Derivatives not Designated as Hedges
The Company enters into forward exchange contracts to effectively hedge substantially all of its accounts receivables resulting from sales transactions and intercompany loans denominated in foreign currencies in order to manage risks associated with variability in cash flows that may be adversely affected by changes in exchange rates. At
September 30, 2018
and
December 31, 2017
, multiple foreign currency forward exchange contracts existed, with maturities ranging up to
eighteen
months. Those foreign currency exchange contracts outstanding at
September 30, 2018
and
December 31, 2017
, when aggregated and measured in U.S. dollars at exchange rates at
September 30, 2018
and
December 31, 2017
, had net notional amounts totaling
$99.1 million
and
$90.1 million
, respectively. Unrealized gains and losses resulting from these contracts are recognized in
Other Expense, Net
and approximately offset corresponding recognized but unrealized gains and losses on the remeasurement of these accounts receivable.
Fair Value of Financial Instruments
The Company’s derivative instruments are carried at fair value. The Company has determined that the inputs to the valuation of these derivative instruments are Level 2 in the fair value hierarchy. Level 2 inputs are defined as quoted prices for similar assets and liabilities in active markets or inputs that are observable for the asset or liability, either directly or indirectly through market corroboration, for substantially the full term of the financial instrument. The Company uses valuation techniques based on discounted cash flow analyses, which reflect the terms of the derivatives and use observable market-based inputs, including forward rates, and uses market price quotations obtained from independent derivatives brokers, corroborated with information obtained from independent pricing service providers.
As of
September 30, 2018
, the Company had a gross derivative asset of
$4.9 million
and a gross derivative liability of
$1.7 million
, related to interest rate, foreign currency and commodity contracts. As of
September 30, 2018
, there has not been any significant impact to the fair value of the Company’s derivative liabilities due to its own credit risk. Similarly, there has not been any significant adverse impact to the Company’s derivative assets based on evaluation of the Company’s counterparties’ credit risks.
The fair values of the Company’s other financial assets and liabilities at
September 30, 2018
and
December 31, 2017
approximately equal the carrying values reported on the Condensed Consolidated Balance Sheets except for Long-Term Debt. The fair value of the Company’s Long-Term Debt (excluding capital leases and deferred financing fees) was
$2,896.1 million
and
$2,299.1 million
as compared to the carrying amounts of
$2,902.4 million
and
$2,247.9 million
as of
September 30, 2018
and
December 31, 2017
, respectively. The fair value of the Company’s Total Debt, including the Senior Notes, are based on quoted market prices (Level 2 inputs). Level 2 valuation techniques for Long-Term Debt are based on quotations obtained from independent pricing service providers.
The following is a rollforward of pre-tax Accumulated Other Comprehensive (Loss) Income pertaining to derivative instruments:
|
In millions
|
|||
|
Balance at December 31, 2017
|
$
|
(0.3
|
)
|
|
Reclassification to Earnings
|
(0.1
|
)
|
|
|
Current Period Change in Fair Value
|
3.9
|
|
|
|
Balance at September 30, 2018
|
$
|
3.5
|
|
At
September 30, 2018
, the Company expects to reclassify approximately
$2.7 million
of gains in the next twelve months from Accumulated Other Comprehensive Loss to earnings, contemporaneously with and offsetting changes in the related hedged exposure. The actual amount that will be reclassified to future earnings may vary from this amount as a result of changes in market conditions.
Substantially all of the Company’s operations are held through its majority investment in GPIP, a subsidiary that is classified as a partnership for U.S. income tax purposes and is generally not subject to domestic income tax expense. As a result, the consolidated financial statements exclude the domestic tax effect of the earnings attributable to the minority partner’s interest in GPIP.
During the
nine months ended
September 30, 2018
, the Company recognized Income Tax Expense of
$41.4 million
on
Income before Income Taxes and Equity Income of Unconsolidated Entity
of
$271.1 million
. The effective tax rate for the
nine months ended
September 30, 2018
is lower than the statutory rate primarily due to the tax effect of income attributable to noncontrolling interests as well as the mix and levels of earnings between foreign and domestic tax jurisdictions. In addition, during the
nine months ended
September 30, 2018
, the Company recorded discrete benefits of approximately
$4 million
,
$11 million
and
$2 million
associated with the indirect impacts of the NACP Combination, an adjustment to the estimated tax effects of the Tax Cuts and Jobs Act (“the Act”) and the release of a valuation allowance against the net deferred tax assets of the Company’s wholly-owned subsidiary in France, respectively.
19
GRAPHIC PACKAGING HOLDING COMPANY
NOTES TO CONDENSED CONSOLIDATED FINANCIAL STATEMENTS
(Unaudited)
As disclosed in the Company’s financial statements in “
Note 8 - Income Taxes
” of the Notes to the Consolidated Financial Statements of the Company’s 2017 Annual Report on Form 10-K, the Company recorded provisional amounts in its 2017 financial statements to reflect the federal, state and foreign impacts of The Tax Cuts and Jobs Act (“The Act”) as well as to the balance of the Company’s deferred tax assets and liabilities. These amounts remain provisional and subject to the Securities and Exchange Commission's Staff Accountant Bulletin 118 as of
September 30, 2018
. The Company recorded an additional tax benefit of approximately
$11 million
during the nine months ended September 30, 2018 related to the one-time transition tax on earnings of certain foreign subsidiaries. The estimate still remains provisional as the Company is still analyzing certain provisions of The Act and guidance issued by Treasury and the Internal Revenue Service associated with the one-time transition tax. The Company will file its 2017 U.S. federal income tax return reflecting the one-time transition tax during the fourth quarter of 2018.
No
other changes to the provisional amounts recorded in the 2017 financial statements were made during the
nine months ended
September 30, 2018
.
During the three months ended September 30, 2018, the Company assessed the need to maintain a valuation allowance on the net deferred tax assets of one of its foreign subsidiaries in France and, based on new evidence, has determined that it is more likely than not that the net deferred tax assets will be realized through the generation of future taxable income. Appropriate consideration was given to all available evidence, both positive and negative, in assessing the need for a valuation allowance. The Company concluded that the net deferred tax assets would be realized in future years and recorded a discrete benefit during the three months ended September 30, 2018 of approximately
$2 million
.
During the
nine months ended
September 30, 2017
, the Company recognized Income Tax Expense of
$67.1 million
on
Income before Income Taxes and Equity Income of Unconsolidated Entity
of
$192.1 million
. The effective tax rate for the
nine months ended
September 30, 2017
was lower than the statutory rate due to the mix and levels of earnings between foreign and domestic tax jurisdictions. In addition, the Company recorded a discrete benefit of approximately
$3 million
during the nine months ended September 30, 2017, of which approximately
$2 million
related to the excess benefit associated with share based payments to employees that vested during the period in accordance with the guidance in ASU No. 2016-09,
Compensation-Stock Compensation (Topic 718)
, which requires entities to recognize all income tax effects of excess tax benefits and tax deficiencies in the income statement during the period in which the awards vest or are settled. In addition, approximately
$1 million
was recorded as a result of statutory rate changes, income tax credits and other discrete items.
As of
December 31, 2017
, the Company had approximately
$327 million
of Net Operating Losses (“NOLs”) for U.S. federal income tax purposes which may be used to offset future taxable income. Based on these NOLs and other tax benefits, the Company does not expect to be a meaningful U.S. federal cash taxpayer until 2021.
Environmental Matters
The Company is subject to a broad range of foreign, federal, state and local environmental, health and safety laws and regulations, including those governing discharges to air, soil and water, the management, treatment and disposal of hazardous substances, solid waste and hazardous wastes, the investigation and remediation of contamination resulting from historical site operations and releases of hazardous substances, and the health and safety of employees. Compliance initiatives could result in significant costs, which could negatively impact the Company’s consolidated financial position, results of operations or cash flows. Any failure to comply with environmental or health and safety laws and regulations or any permits and authorizations required thereunder could subject the Company to fines, corrective action or other sanctions.
Some of the Company’s current and former facilities are the subject of environmental investigations and remediations resulting from historic operations and the release of hazardous substances or other constituents. Some current and former facilities have a history of industrial usage for which investigation and remediation obligations may be imposed in the future or for which indemnification claims may be asserted against the Company. Also, closures or sales of facilities may necessitate investigation and may result in remediation activities at those facilities.
The Company has established reserves for those facilities or issues where a liability is probable and the costs are reasonably estimable. The Company believes that the amounts accrued for its loss contingencies, and the reasonably possible loss beyond the amounts accrued, are not material to the Company’s consolidated financial position, results of operations or cash flows. The Company cannot estimate with certainty other future compliance, investigation or remediation costs. Some costs relating to historic usage that the Company considers to be reasonably possible of resulting in liability are not quantifiable at this time. The Company will continue to monitor environmental issues at each of its facilities, as well as regulatory developments, and will revise its accruals, estimates and disclosures relating to past, present and future operations, as additional information is obtained.
Legal Matters
The Company is a party to a number of lawsuits arising in the ordinary conduct of its business. Although the timing and outcome of these lawsuits cannot be predicted with certainty, the Company does not believe that disposition of these lawsuits will have a material adverse effect on the Company’s consolidated financial position, results of operations or cash flows.
20
GRAPHIC PACKAGING HOLDING COMPANY
NOTES TO CONDENSED CONSOLIDATED FINANCIAL STATEMENTS
(Unaudited)
The Company reports its results in
three
reportable segments as follows:
Paperboard Mills
includes the
eight
North American paperboard mills which produce primarily CUK, CRB, and SBS, which is consumed internally to produce paperboard packaging for the Americas and Europe Paperboard Packaging segments. The remaining paperboard is sold externally to a wide variety of paperboard packaging converters and brokers. The Paperboard Mills segment Net Sales represent the sale of paperboard only to external customers. The effect of intercompany transfers to the paperboard packaging segments has been eliminated from the Paperboard Mills segment to reflect the economics of the integration of these segments.
Americas Paperboard Packaging
includes paperboard packaging folding cartons and cups, lids and food containers sold primarily to consumer packaged goods and foodservice companies serving the food, beverage, and consumer product markets in the Americas.
Europe Paperboard Packaging
includes paperboard packaging folding cartons and cups, lids and food containers sold primarily to consumer packaged goods companies serving the food, beverage and consumer product markets in Europe.
The Company allocates certain mill and corporate costs to the reportable segments to appropriately represent the economics of these segments. The Corporate and Other caption includes the Pacific Rim and Australia operating segments and unallocated corporate and one-time costs.
These segments are evaluated by the chief operating decision maker based primarily on Income from Operations, as adjusted for depreciation and amortization. The accounting policies of the reportable segments are the same as those described above in "
Note 1 - General Information.
"
Segment information is as follows:
|
Three Months Ended
|
Nine Months Ended
|
||||||||||||||
|
September 30,
|
September 30,
|
||||||||||||||
|
In millions
|
2018
|
2017
|
2018
|
2017
|
|||||||||||
|
NET SALES:
|
|||||||||||||||
|
Paperboard Mills
|
$
|
274.3
|
|
$
|
105.1
|
|
$
|
819.1
|
|
$
|
300.1
|
|
|||
|
Americas Paperboard Packaging
|
1,040.8
|
|
833.2
|
|
3,053.5
|
|
2,438.7
|
|
|||||||
|
Europe Paperboard Packaging
|
166.8
|
|
152.6
|
|
526.0
|
|
431.0
|
|
|||||||
|
Corporate/Other/Eliminations
(a)
|
48.1
|
|
46.7
|
|
116.7
|
|
124.0
|
|
|||||||
|
Total
|
$
|
1,530.0
|
|
$
|
1,137.6
|
|
$
|
4,515.3
|
|
$
|
3,293.8
|
|
|||
|
INCOME (LOSS) FROM OPERATIONS:
|
|||||||||||||||
|
Paperboard Mills
|
$
|
10.0
|
|
$
|
(13.4
|
)
|
$
|
(5.1
|
)
|
$
|
(36.0
|
)
|
|||
|
Americas Paperboard Packaging
|
128.0
|
|
101.3
|
|
354.3
|
|
281.2
|
|
|||||||
|
Europe Paperboard Packaging
|
12.8
|
|
10.2
|
|
40.3
|
|
26.2
|
|
|||||||
|
Corporate and Other
(b)
|
15.6
|
|
(6.7
|
)
|
(38.8
|
)
|
(24.6
|
)
|
|||||||
|
Total
|
$
|
166.4
|
|
$
|
91.4
|
|
$
|
350.7
|
|
$
|
246.8
|
|
|||
|
DEPRECIATION AND AMORTIZATION:
|
|||||||||||||||
|
Paperboard Mills
|
$
|
53.6
|
|
$
|
39.5
|
|
$
|
162.3
|
|
$
|
101.3
|
|
|||
|
Americas Paperboard Packaging
|
40.7
|
|
31.6
|
|
119.0
|
|
91.3
|
|
|||||||
|
Europe Paperboard Packaging
|
11.7
|
|
10.4
|
|
36.5
|
|
30.3
|
|
|||||||
|
Corporate and Other
|
4.7
|
|
5.5
|
|
14.0
|
|
14.3
|
|
|||||||
|
Total
|
$
|
110.7
|
|
$
|
87.0
|
|
$
|
331.8
|
|
$
|
237.2
|
|
|||
|
(a)
|
Includes Revenue from contracts with customers for the Australia and Pacific Rim operating segments, which is
no
t material.
|
|
(b)
|
Includes expenses related to acquisitions, integration activities and shutdown costs and gain on sale of assets.
|
For more information regarding the Company’s business segments, see “
Note 14 — Business Segment and Geographic Area Information
”
of the Notes to Consolidated Financial Statements of the Company’s
2017
Form 10-K.
21
GRAPHIC PACKAGING HOLDING COMPANY
NOTES TO CONDENSED CONSOLIDATED FINANCIAL STATEMENTS
(Unaudited)
|
Three Months Ended
|
Nine Months Ended
|
||||||||||||||
|
September 30,
|
September 30,
|
||||||||||||||
|
In millions, except per share data
|
2018
|
2017
|
2018
|
2017
|
|||||||||||
|
Net Income Attributable to Graphic Packaging Holding Company
|
$
|
94.3
|
|
$
|
47.3
|
|
$
|
173.6
|
|
$
|
126.3
|
|
|||
|
Weighted Average Shares:
|
|||||||||||||||
|
Basic
|
310.8
|
|
|
310.4
|
|
|
310.7
|
|
|
311.3
|
|
||||
|
Dilutive Effect of RSUs
|
0.7
|
|
0.5
|
|
0.6
|
|
0.6
|
|
|||||||
|
Diluted
|
311.5
|
|
|
310.9
|
|
|
311.3
|
|
|
311.9
|
|
||||
|
Income Per Share — Basic
|
$
|
0.30
|
|
$
|
0.15
|
|
$
|
0.56
|
|
$
|
0.41
|
|
|||
|
Income Per Share — Diluted
|
$
|
0.30
|
|
$
|
0.15
|
|
$
|
0.56
|
|
$
|
0.40
|
|
|||
As disclosed in "
Note 1 - General Information,
" on January 1, 2018, the Company combined its business with IP's NACP business. Under the terms of the Transaction Agreement, GPIP issued
79,911,591
common units to IP which are exchangeable into shares of common stock of GPHC or cash following the second anniversary of the combination. In connection with the closing, the Company, GPIP, GPI Holding and IP entered into an Exchange Agreement (“Exchange Agreement”), which sets forth, among other things, the circumstances in which IP may exchange its common units for shares of common stock of the Company or the right to receive cash. Under the Exchange Agreement, the Company may not issue shares of common stock in exchange for more than
61,638,409
common units. Accordingly, the remaining
18,273,182
of common units are reflected as Redeemable Noncontrolling Interest on the Condensed Consolidated Balance Sheets.
At
September 30, 2018
, the redeemable noncontrolling interest was determined as follows:
|
In millions
|
|||
|
Balance at December 31, 2017
|
$
|
—
|
|
|
Issuance of Redeemable Noncontrolling Interest at January 1, 2018
|
283.4
|
|
|
|
Net Income Attributable to Redeemable Noncontrolling Interest
|
13.1
|
|
|
|
Other Comprehensive Loss, Net of Tax
|
(0.1
|
)
|
|
|
Distributions of Membership Interest
|
(4.2
|
)
|
|
|
Balance at September 30, 2018
|
$
|
292.2
|
|
Redeemable noncontrolling interest is recorded at the greater of carrying amount or redemption value at the end of each period. The redemption value is determined by the closing stock price of the Company.
22
GRAPHIC PACKAGING HOLDING COMPANY
NOTES TO CONDENSED CONSOLIDATED FINANCIAL STATEMENTS
(Unaudited)
The following is a summary of the changes in total equity for the
nine months ended
September 30, 2018
:
|
In millions
|
Graphic Packaging Holding Company Shareholders Equity
|
Noncontrolling Interest
(a)
|
Total Shareholders' Equity
|
||||||
|
Balance at December 31, 2017
|
$
|
1,291.9
|
|
$
|
—
|
|
$
|
1,291.9
|
|
|
NACP Combination
|
390.2
|
|
443.6
|
|
833.8
|
|
|||
|
Net Income
|
173.6
|
|
44.0
|
|
217.6
|
|
|||
|
Other Comprehensive Loss, Net of Tax
|
(2.9
|
)
|
(0.3
|
)
|
(3.2
|
)
|
|||
|
Dividends Declared
|
(69.8
|
)
|
—
|
|
(69.8
|
)
|
|||
|
Compensation Expense Under Share-Based Plans
|
9.7
|
|
—
|
|
9.7
|
|
|||
|
Repurchase of Common Stock related to Share-Based Payments
|
(4.1
|
)
|
—
|
|
(4.1
|
)
|
|||
|
Distributions of Membership Interest
|
—
|
|
(14.2
|
)
|
(14.2
|
)
|
|||
|
Balance at September 30, 2018
|
$
|
1,788.6
|
|
$
|
473.1
|
|
$
|
2,261.7
|
|
(a)
Excludes amounts related to redeemable noncontrolling interest which is separately classified outside of permanent equity in the mezzanine section of the Condensed Consolidated Balance Sheets. See "
Note 12 - Redeemable Noncontrolling Interest.
"
The changes in the components of
Accumulated Other Comprehensive (Loss) Income
attributable to GPHC for the
nine months ended
September 30, 2018
are as follows
(a)
:
|
In millions
|
Derivative Instruments
|
Pension and Postretirement Benefit Plans
|
Currency Translation Adjustment
|
Total
|
|||||||||||
|
Balance at December 31, 2017
|
$
|
(10.3
|
)
|
$
|
(226.7
|
)
|
$
|
(101.8
|
)
|
$
|
(338.8
|
)
|
|||
|
Other Comprehensive Income (Loss) before Reclassifications
|
3.1
|
|
—
|
|
(8.6
|
)
|
(5.5
|
)
|
|||||||
|
Amounts Reclassified from Accumulated Other Comprehensive Income (Loss)
(b)
|
(0.1
|
)
|
2.3
|
|
—
|
|
2.2
|
|
|||||||
|
Net Current-period Other Comprehensive Income (Loss)
|
3.0
|
|
2.3
|
|
(8.6
|
)
|
(3.3
|
)
|
|||||||
|
Less:
|
|||||||||||||||
|
Net Current-period Other Comprehensive (Loss) Income Attributable to Noncontrolling Interest
(c)
|
(0.3
|
)
|
(0.3
|
)
|
1.0
|
|
0.4
|
|
|||||||
|
Balance at September 30, 2018
|
$
|
(7.6
|
)
|
$
|
(224.7
|
)
|
$
|
(109.4
|
)
|
$
|
(341.7
|
)
|
|||
(a)
All amounts are net of income taxes.
(b)
See following table for details about these reclassifications.
(c)
Includes amounts related to redeemable noncontrolling interest which are separately classified outside of permanent equity in the mezzanine section of the Condensed Consolidated Balance Sheets.
23
GRAPHIC PACKAGING HOLDING COMPANY
NOTES TO CONDENSED CONSOLIDATED FINANCIAL STATEMENTS
(Unaudited)
The following represents reclassifications out of
Accumulated Other Comprehensive (Loss) Income
for the
nine months ended
September 30, 2018
:
|
In millions
|
||||||
|
Details about Accumulated Other Comprehensive Income Components
|
Amount Reclassified from Accumulated Other Comprehensive Income (Loss)
|
Affected Line Item in the Statement Where Net Income is Presented
|
||||
|
Derivatives Instruments:
|
||||||
|
Commodity Contracts
|
$
|
(0.4
|
)
|
Cost of Sales
|
||
|
Foreign Currency Contracts
|
1.2
|
|
Other Expense, Net
|
|||
|
Interest Rate Swap Agreements
|
(0.9
|
)
|
Interest Income, Net
|
|||
|
(0.1
|
)
|
Total before Tax
|
||||
|
—
|
|
Tax Benefit
|
||||
|
$
|
(0.1
|
)
|
Net of Tax
|
|||
|
Amortization of Defined Benefit Pension Plans:
|
||||||
|
Prior Service Costs
|
$
|
0.3
|
|
(a)
|
||
|
Actuarial Losses
|
4.2
|
|
(a)
|
|||
|
4.5
|
|
Total before Tax
|
||||
|
(0.9
|
)
|
Tax Benefit
|
||||
|
$
|
3.6
|
|
Net of Tax
|
|||
|
Amortization of Postretirement Benefit Plans:
|
||||||
|
Prior Service Credits
|
$
|
(0.2
|
)
|
(a)
|
||
|
Actuarial Gains
|
(1.4
|
)
|
(a)
|
|||
|
(1.6
|
)
|
Total before Tax
|
||||
|
0.3
|
|
Tax Expense
|
||||
|
$
|
(1.3
|
)
|
Net of Tax
|
|||
|
Total Reclassifications for the Period
|
$
|
2.2
|
|
|||
|
(a)
|
These accumulated other comprehensive income components are included in the computation of net periodic pension cost (see “
|
24
INTRODUCTION
This management’s discussion and analysis of financial conditions and results of operations is intended to provide investors with an understanding of the Company's past performance, financial condition and prospects. The following will be discussed and analyzed:
|
Ø
|
Overview of Business
|
|
Ø
|
Overview of 2018 Results
|
|
Ø
|
Results of Operations
|
|
Ø
|
Financial Condition, Liquidity and Capital Resources
|
|
Ø
|
Critical Accounting Policies
|
|
Ø
|
New Accounting Standards
|
|
Ø
|
Business Outlook
|
OVERVIEW OF BUSINESS
The Company’s objective is to strengthen its position as a leading provider of paper-based packaging solutions. To achieve this objective, the Company offers customers its paperboard, cartons, cups, lids, foodservice containers and packaging machines, either as an integrated solution or separately. Cartons and carriers are designed to protect and contain products. Product offerings include a variety of laminated, coated and printed packaging structures that are produced from the Company’s coated unbleached kraft (“CUK”), coated recycled board (“CRB”), and solid bleached sulfate ("SBS"). Innovative designs and combinations of paperboard, films, foils, metallization, holographics and embossing are customized to the individual needs of the customers.
The Company is implementing strategies (i) to expand market share in its current markets and to identify and penetrate new markets; (ii) to capitalize on the Company’s customer relationships, business competencies, and mills and folding carton assets; (iii) to develop and market innovative, sustainable products and applications; and (iv) to continue to reduce costs by focusing on operational improvements. The Company’s ability to fully implement its strategies and achieve its objectives may be influenced by a variety of factors, many of which are beyond its control, such as inflation of raw material and other costs, which the Company cannot always pass through to its customers, and the effect of overcapacity in the worldwide paperboard packaging industry.
Significant Factors That Impact The Company’s Business
Impact of Inflation/Deflation.
The Company’s cost of sales consists primarily of energy (including natural gas, fuel oil and electricity), pine pulpwood, chemicals, secondary fibers, purchased paperboard, aluminum foil, ink, plastic films and resins, depreciation expense and labor. Costs increased in the first
nine months
of
2018
by $53.1 million, compared to the first
nine months
of
2017
. The higher costs in the
nine months ended
September 30, 2018
were due to freight ($24.5 million), labor and benefit costs ($15.7 million), chemicals ($15.3 million), and external board ($12.7 million), partially offset by lower secondary fiber cost ($14.7 million) and other costs, net ($0.4 million).
Because the price of natural gas experiences significant volatility, the Company has entered into contracts designed to manage risks associated with future variability in cash flows caused by changes in the price of natural gas. The Company has entered into natural gas swap contracts to hedge prices for a portion of its expected usage for the remainder of
2018
and the first quarter of 2019. Since negotiated sales contracts and the market largely determine the pricing for its products, the Company is at times limited in its ability to raise prices and pass through to its customers any inflationary or other cost increases that the Company may incur.
Commitment to Cost Reduction
. In light of increasing margin pressure throughout the packaging industry, the Company has programs in place that are designed to reduce costs, improve productivity and increase profitability. The Company utilizes a global continuous improvement initiative that uses statistical process control to help design and manage many types of activities, including production and maintenance. This includes a Six Sigma process focused on reducing variable and fixed manufacturing and administrative costs. The Company has expanded the continuous improvement initiative to include the deployment of Lean Sigma principles into manufacturing and supply chain services.
The Company’s ability to continue to successfully implement its business strategies and to realize anticipated savings and operating efficiencies is subject to significant business, economic and competitive uncertainties and contingencies, many of which are beyond the Company’s control. If the Company cannot successfully implement the strategic cost reductions or other cost savings plans, it may not be able to continue to compete successfully against other manufacturers. In addition, any failure to generate the anticipated efficiencies and savings could adversely affect the Company’s financial results.
25
Competition and Market Factors.
As some products can be packaged in different types of materials, the Company’s sales are affected by competition from other manufacturers’ CUK, CRB, SBS, folding box board, and recycled clay-coated news. Additional substitute products also include plastic, shrink film and corrugated containers. In addition, while the Company has long-term relationships with many of its customers, the underlying contracts may be re-bid or renegotiated from time to time, and the Company may not be successful in renewing on favorable terms or at all. The Company works to maintain market share through efficiency, product innovation and strategic sourcing to its customers; however, pricing and other competitive pressures may occasionally result in the loss of a customer relationship.
In addition, the Company’s sales historically are driven by consumer buying habits in the markets its customers serve. Changes in consumer dietary habits and preferences, increases in the costs of living, unemployment rates, access to credit markets, as well as other macroeconomic factors, may negatively affect consumer spending behavior. New product introductions and promotional activity by the Company’s customers and the Company’s introduction of new packaging products also impact its sales.
Debt Obligations
. The Company had an aggregate principal amount of
$2,943.9 million
of outstanding debt obligations as of
September 30, 2018
. This debt has consequences for the Company, as it requires a portion of cash flow from operations to be used for the payment of principal and interest, exposes the Company to the risk of increased interest rates and may restrict the Company’s ability to obtain additional financing. Covenants in the Company's Amended and Restated Credit Agreement, the Term Loan Credit Agreement and Indentures may, among other things, restrict the ability of the Company to dispose of assets, incur guarantee obligations, prepay other indebtedness, repurchase stock, pay dividends, make other restricted payments and make acquisitions or other investments. The Amended and Restated Credit Agreement and the Term Loan Credit Agreement also require compliance with a maximum consolidated leverage ratio and a minimum consolidated interest coverage ratio. The Company’s ability to comply in future periods with the financial covenants will depend on its ongoing financial and operating performance, which in turn will be subject to many other factors, many of which are beyond the Company’s control. See "Covenant Restrictions" in “Financial Condition, Liquidity and Capital Resources — Liquidity and Capital Resources” for additional information regarding the Company’s debt obligations.
The debt and the restrictions under the Amended and Restated Credit Agreement, the Term Loan Credit Agreement and the Indentures could limit the Company’s flexibility to respond to changing market conditions and competitive pressures. The outstanding debt obligations and the restrictions may also leave the Company more vulnerable to a downturn in general economic conditions or its business, or unable to carry out capital expenditures that are necessary or important to its growth strategy and productivity improvement programs.
OVERVIEW OF THIRD QUARTER 2018 RESULTS
This management’s discussion and analysis contains an analysis of
Net Sales
,
Income from Operations
and other information relevant to an understanding of the Company's results of operations. On a Consolidated basis:
|
•
|
Net Sales
for the
three months ended
September 30, 2018
,
increased
$392.4 million
or
34.5%
to
$1,530.0 million
from
$1,137.6 million
for the
three months ended
September 30, 2017
, due to the NACP Combination, 2017 and PFP Acquisitions discussed below, and higher selling prices, partially offset by unfavorable foreign currency exchange rates.
|
|
•
|
Income from Operations
for the
three months ended
September 30, 2018
increased
$75.0 million
or
82.1%
to
$166.4 million
from
$91.4 million
for the
three months ended
September 30, 2017
due to the NACP Combination, 2017 and PFP Acquisitions, gain on the sale of assets, the higher selling prices and cost savings through continuous improvement and other programs, partially offset by higher inflation.
|
Acquisitions and Dispositions
|
•
|
On September 30, 2018, the Company acquired substantially all the assets of the foodservice business of Letica Corporation, a subsidiary of RPC Group PLC ("Letica Foodservice"), a producer of paperboard-based cold and hot cups and cartons. The acquisition includes two facilities located in Clarksville, Tennessee and Pittston, Pennsylvania. Letica Foodservice is included in the Americas Paperboard Packaging reportable segment.
|
|
•
|
On August 31, 2018, the Company sold its previously closed coated recycled paperboard mill site in Santa Clara, California, resulting in a gain on sale of assets of
$37.1 million
.
|
|
•
|
On June 12, 2018, the Company acquired substantially all the assets of PFP, LLC and its related entity, PFP Dallas Converting, LLC (collectively, "PFP"), a converter focused on the production of paperboard-based air filter frames. The acquisition includes two facilities located in Lebanon, Tennessee and Lancaster, Texas.
|
|
•
|
On January 1, 2018, the Company combined its business with the North America Consumer Packaging business ("NACP") of International Paper Company ("IP"), referred to as the NACP Combination. NACP was a leading producer of SBS paperboard and paper-based foodservice products. The NACP business included two SBS mills located in Augusta, Georgia and Texarkana, Texas, three converting facilities in the U.S. and one in the United Kingdom.
|
|
•
|
During 2017, the Company acquired Seydaco Packaging Corp. ("Seydaco"), Norgraft Packaging, S.A. ("Norgraft"), and Carton Craft Corporation ("Carton Craft"). These transactions are referred to collectively as the "2017 Acquisitions."
|
26
Capital Allocations
|
•
|
On July 26, 2018, the Company's board of directors declared a quarterly dividend of
$0.075
per share of common stock paid on October 5, 2018 to shareholders of record as of September 15, 2018.
|
|
•
|
On January 10, 2017, the Company's board of directors authorized an additional share repurchase program to allow the Company to purchase up to $
250 million
of the Company's issued and outstanding shares of common stock through open market purchases, privately negotiated transactions and Rule 10b5-1 plans (the "2017 share repurchase program"). The original
$250 million
share repurchase program was authorized on February 4, 2015 (the "2015 share repurchase program"). During the first
nine months
of
2018
, the Company did not repurchase any shares of its common stock. The Company repurchased approximately
4.5 million
shares at an average price of
$13.08
during the
nine months
ended
September 30, 2017
, including approximately
1.4 million
shares repurchased under the 2015 share repurchase program thereby completing that program. As of
September 30, 2018
, the Company has approximately
$210 million
available for additional repurchases under the 2017 share repurchase program.
|
RESULTS OF OPERATIONS
|
Three Months Ended
|
Nine Months Ended
|
||||||||||||||
|
September 30,
|
September 30,
|
||||||||||||||
|
In millions
|
2018
|
2017
|
2018
|
2017
|
|||||||||||
|
Net Sales
|
$
|
1,530.0
|
|
$
|
1,137.6
|
|
$
|
4,515.3
|
|
$
|
3,293.8
|
|
|||
|
Income from Operations
|
166.4
|
|
91.4
|
|
350.7
|
|
246.8
|
|
|||||||
|
Nonoperating Pension and Postretirement Benefit Income
|
4.1
|
|
4.0
|
|
12.4
|
|
11.7
|
|
|||||||
|
Interest Expense, Net
|
(31.0
|
)
|
(22.6
|
)
|
(90.1
|
)
|
(66.4
|
)
|
|||||||
|
Loss on Modification or Extinguishment of Debt
|
—
|
|
—
|
|
(1.9
|
)
|
—
|
|
|||||||
|
Income before Income Taxes and Equity Income of Unconsolidated Entity
|
139.5
|
|
72.8
|
|
271.1
|
|
192.1
|
|
|||||||
|
Income Tax Expense
|
(17.8
|
)
|
(25.9
|
)
|
(41.4
|
)
|
(67.1
|
)
|
|||||||
|
Income before Equity Income of Unconsolidated Entity
|
121.7
|
|
46.9
|
|
229.7
|
|
125.0
|
|
|||||||
|
Equity Income of Unconsolidated Entity
|
0.3
|
|
0.4
|
|
1.0
|
|
1.3
|
|
|||||||
|
Net Income
|
$
|
122.0
|
|
$
|
47.3
|
|
$
|
230.7
|
|
$
|
126.3
|
|
|||
THIRD
QUARTER
2018
COMPARED WITH
THIRD
QUARTER
2017
Net Sales
|
Three Months Ended September 30,
|
||||||||||||||
|
In millions
|
2018
|
2017
|
Increase
|
Percent
Change
|
||||||||||
|
Consolidated
|
$
|
1,530.0
|
|
$
|
1,137.6
|
|
$
|
392.4
|
|
34.5
|
%
|
|||
The components of the change in Net Sales are as follows:
|
Three Months Ended September 30,
|
|||||||||||||||||||||||
|
Variances
|
|||||||||||||||||||||||
|
In millions
|
2017
|
Price
|
Volume/Mix
|
Exchange
|
Total
|
2018
|
|||||||||||||||||
|
Consolidated
|
$
|
1,137.6
|
|
$
|
17.6
|
|
$
|
380.9
|
|
$
|
(6.1
|
)
|
$
|
392.4
|
|
$
|
1,530.0
|
|
|||||
27
The Company’s
Net Sales
for the
three months ended
September 30, 2018
increased
by
$392.4 million
or
34.5%
to
$1,530.0 million
from
$1,137.6 million
for the
three months ended
September 30, 2017
, due to Net Sales of $378.2 million from the NACP Combination, and 2017 and PFP Acquisitions and higher selling prices. These increases were offset by unfavorable currency exchange rates, primarily the Australian and Canadian Dollars and Euro and lower open market volumes as the Company internalized more paperboard due to the shutdown of the Santa Clara mill in the fourth quarter of 2017. Core converting volumes were stable due to new product introductions offset by lower beverage volumes, primarily beer.
Income from Operations
|
Three Months Ended September 30,
|
|||||||||||||
|
In millions
|
2018
|
2017
|
Increase
|
Percent
Change
|
|||||||||
|
Consolidated
|
$
|
166.4
|
|
$
|
91.4
|
|
$
|
75.0
|
|
82.1%
|
|||
The components of the change in
Income from Operations
are as follows:
|
Three Months Ended September 30,
|
||||||||||||||||||||||||||||||||
|
Variances
|
||||||||||||||||||||||||||||||||
|
In millions
|
2017
|
Price
|
Volume/Mix
|
Inflation
|
Exchange
|
Other
(a)
|
Total
|
2018
|
||||||||||||||||||||||||
|
Consolidated
|
$
|
91.4
|
|
$
|
17.6
|
|
$
|
20.0
|
|
$
|
(18.0
|
)
|
$
|
(1.0
|
)
|
$
|
56.4
|
|
$
|
75.0
|
|
$
|
166.4
|
|
||||||||
(a)
Includes the Company's cost reduction initiatives and expenses related to acquisitions and integration activities, gain on sale of assets and shutdown and other special charges.
Income from Operations
for the
three months ended
September 30, 2018
increased
$75.0 million
or
82.1%
to
$166.4 million
from
$91.4 million
for the
three months ended
September 30, 2017
due to the NACP Combination and 2017 and PFP Acquisitions, a gain of $37.1 million from the sale of the Santa Clara mill site, the higher selling prices and cost savings through continuous improvement and other programs. These increases were partially offset by inflation. Inflation for the three months ended September 30, 2018 increased primarily due to chemicals ($5.9 million), freight ($5.7 million), labor and benefit costs ($5.3 million), external board ($4.7 million), wood ($2.0 million) and other costs, net ($1.1 million), partially offset by lower secondary fiber cost ($6.7 million).
Interest Expense, Net
Interest Expense, Net
was
$31.0 million
and
$22.6 million
for the
three months ended
September 30, 2018
and
2017
, respectively. Interest Expense, Net
increased
due primarily to higher average debt balances and interest rates as compared to the same period in the prior year. As of
September 30, 2018
, approximately
42%
of the Company’s total debt was subject to floating interest rates.
Income Tax Expense
During the
three months ended
September 30, 2018
, the Company recognized Income Tax Expense of
$17.8 million
on
Income before Income Taxes and Equity Income of Unconsolidated Entity
of
$139.5 million
. The effective tax rate for the three months ended September 30, 2018 is different than the statutory rate primarily due to the tax effect of income attributable to noncontrolling interests as well as the mix and levels of earnings between foreign and domestic tax jurisdictions. In addition, during the three months ended September 30, 2018, the Company recorded discrete benefits of approximately $11 million and $2 million associated with the adjustment to the estimated tax effects of the Tax Cuts and Jobs Act (“the Act”) and the release of a valuation allowance against the net deferred tax assets of the Company’s wholly-owned subsidiary in France, respectively.
During the
three months ended
September 30, 2017
, the Company recognized Income Tax Expense of
$25.9 million
on
Income before Income Taxes and Equity Income of Unconsolidated Entity
of
$72.8 million
. The effective tax rate for the
three months ended
September 30, 2017
was different than the statutory rate primarily due to the mix and levels of earnings between foreign and domestic tax jurisdictions. In addition, approximately $1 million was recorded as a result of statutory rate changes, income tax credits and other discrete items.
As of
December 31, 2017
, the Company had approximately
$327 million
of Net Operating Losses (“NOLs”) for U.S. federal income tax purposes which may be used to offset future taxable income. Based on these NOLs and other tax benefits, the Company does not expect to be a meaningful U.S. federal cash taxpayer until 2021.
28
FIRST NINE MONTHS
2018
COMPARED WITH FIRST NINE MONTHS
2017
Net Sales
|
Nine Months Ended September 30,
|
||||||||||||||
|
In millions
|
2018
|
2017
|
Increase
|
Percent
Change
|
||||||||||
|
Consolidated
|
$
|
4,515.3
|
|
$
|
3,293.8
|
|
$
|
1,221.5
|
|
37.1
|
%
|
|||
The components of the change in Net Sales are as follows:
|
Nine Months Ended September 30,
|
|||||||||||||||||||||||
|
Variances
|
|||||||||||||||||||||||
|
In millions
|
2017
|
Price
|
Volume/Mix
|
Exchange
|
Total
|
2018
|
|||||||||||||||||
|
Consolidated
|
$
|
3,293.8
|
|
$
|
31.1
|
|
$
|
1,163.0
|
|
$
|
27.4
|
|
$
|
1,221.5
|
|
$
|
4,515.3
|
|
|||||
The Company’s
Net Sales
for the
nine months ended
September 30, 2018
increased
by
$1,221.5 million
or
37.1%
to
$4,515.3 million
from
$3,293.8 million
for the
nine months ended
September 30, 2017
, due to Net Sales of $1,172.0 million from the NACP Combination and 2017 and PFP Acquisitions, higher selling prices and favorable currency exchange rates, primarily the Euro and the Great Britain Pound. These increases were offset by lower open market volumes as the Company internalized more paperboard due to the shutdown of the Santa Clara mill site in the fourth quarter of 2017. Core volumes were stable due to new product introductions offset by lower beverage volumes. The higher selling prices are the result of announced price increases which benefit open market sales as well as inflation pass through in the converting businesses.
Income from Operations
|
Nine Months Ended September 30,
|
|||||||||||||
|
In millions
|
2018
|
2017
|
Increase
|
Percent
Change
|
|||||||||
|
Consolidated
|
$
|
350.7
|
|
$
|
246.8
|
|
$
|
103.9
|
|
42.1%
|
|||
The components of the change in
Income from Operations
are as follows:
|
Nine Months Ended September 30,
|
||||||||||||||||||||||||||||||||
|
Variances
|
||||||||||||||||||||||||||||||||
|
In millions
|
2017
|
Price
|
Volume/Mix
|
Inflation
|
Exchange
|
Other
(a)
|
Total
|
2018
|
||||||||||||||||||||||||
|
Consolidated
|
$
|
246.8
|
|
$
|
31.1
|
|
$
|
33.4
|
|
$
|
(53.1
|
)
|
$
|
3.8
|
|
$
|
88.7
|
|
$
|
103.9
|
|
$
|
350.7
|
|
||||||||
(a)
Includes the Company's cost reduction initiatives and expenses related to acquisitions and integration activities, gain on sale of assets and shutdown and other special charges.
Income from Operations
for the
nine months ended
September 30, 2018
increased
$103.9 million
or
42.1%
to
$350.7 million
from
$246.8 million
for the
nine months ended
September 30, 2017
due to the NACP Combination and 2017 and PFP Acquisitions, a gain of $37.1 million from the sale of the Santa Clara mill, the higher selling prices, cost savings through continuous improvement and other programs and the impact related to planned downtime taken in 2017 to upgrade a paper machine in West Monroe, LA. These increases were partially offset by inflation and expenses related to the NACP Combination and integration activities. Inflation for the
nine months ended
September 30, 2018
increased primarily due to freight ($24.5 million), labor and benefit costs ($15.7 million), chemicals ($15.3 million), and external board ($12.7 million), partially offset by lower secondary fiber cost ($14.7 million) and other costs, net ($0.4 million).
Interest Expense, Net
Interest Expense, Net
was
$90.1 million
and
$66.4 million
for the
nine months ended
September 30, 2018
and
2017
, respectively. Interest Expense, Net
increased
due primarily to higher average debt balances and interest rates as compared to the same period in the prior year.
29
Income Tax Expense
During the
nine months ended
September 30, 2018
, the Company recognized Income Tax Expense of
$41.4 million
on
Income before Income Taxes and Equity Income of Unconsolidated Entity
of
$271.1 million
. The effective tax rate for the nine months ended September 30, 2018 is different than the statutory rate primarily due to the tax effect of income attributable to noncontrolling interests as well as the mix and levels of earnings between foreign and domestic tax jurisdictions. In addition, during the nine months ended September 30, 2018, the Company recorded discrete benefits of approximately $4 million, $11 million and $2 million associated with the indirect impacts of the NACP Combination, an adjustment to the estimated tax effects of the Act and the release of a valuation allowance against the net deferred tax assets of the Company’s wholly-owned subsidiary in France, respectively.
During the
nine months ended
September 30, 2017
, the Company recognized Income Tax Expense of
$67.1 million
on
Income before Income Taxes and Equity Income of Unconsolidated Entity
of
$192.1 million
. The effective tax rate for the
nine months ended
September 30, 2017
was lower than the statutory rate due to the mix and levels of earnings between foreign and domestic tax jurisdictions. In addition, during the nine months ended September 30, 2017, the Company recorded a discrete benefit of approximately $2 million related to the excess tax benefit associated with share based payments to employees that vested during the period in accordance with the new guidance in ASU No. 2016-09,
Compensation-Stock Compensation (Topic 718)
, which requires entities to recognize all income tax effects of excess tax benefits and tax deficiencies in the income statement during the period in which the awards vest or are settled. In addition, approximately $1 million was recorded as a result of statutory rate changes, income tax credits and other discrete items.
Segment Reporting
The Company reports its results in
three
reportable segments as follows:
Paperboard Mills
includes the
eight
North American paperboard mills which produce primarily CUK, CRB, and SBS, which is consumed internally to produce paperboard packaging for the Americas and Europe Paperboard Packaging segments. The remaining paperboard is sold externally to a wide variety of paperboard packaging converters and brokers. The Paperboard Mills segment Net Sales represent the sale of paperboard only to external customers. The effect of intercompany transfers to the paperboard packaging segments has been eliminated from the Paperboard Mills segment to reflect the economics of the integration of these segments.
Americas Paperboard Packaging
includes paperboard packaging folding cartons and cups, lids, and food containers sold primarily to consumer packaged goods and foodservice companies serving the food, beverage, and consumer product markets in the Americas.
Europe Paperboard Packaging
includes paperboard packaging folding cartons, and cups, lids and food containers sold primarily to consumer packaged goods companies serving the food, beverage and consumer product markets in Europe.
The Company allocates certain mill and corporate costs to the reportable segments to appropriately represent the economics of these segments. The Corporate and Other caption includes the Pacific Rim and Australia operating segments and unallocated corporate and one-time costs.
30
These segments are evaluated by the chief operating decision maker based primarily on Income from Operations, as adjusted for depreciation and amortization. The accounting policies of the reportable segments are the same as those described above in "
Note 1 - General Information.
"
|
Three Months Ended
|
Nine Months Ended
|
||||||||||||||
|
September 30,
|
September 30,
|
||||||||||||||
|
In millions
|
2018
|
2017
|
2018
|
2017
|
|||||||||||
|
NET SALES:
|
|||||||||||||||
|
Paperboard Mills
|
$
|
274.3
|
|
$
|
105.1
|
|
$
|
819.1
|
|
$
|
300.1
|
|
|||
|
Americas Paperboard Packaging
|
1,040.8
|
|
833.2
|
|
3,053.5
|
|
2,438.7
|
|
|||||||
|
Europe Paperboard Packaging
|
166.8
|
|
152.6
|
|
526.0
|
|
431.0
|
|
|||||||
|
Corporate/Other/Eliminations
(a)
|
48.1
|
|
46.7
|
|
116.7
|
|
124.0
|
|
|||||||
|
Total
|
$
|
1,530.0
|
|
$
|
1,137.6
|
|
$
|
4,515.3
|
|
$
|
3,293.8
|
|
|||
|
INCOME (LOSS) FROM OPERATIONS:
|
|||||||||||||||
|
Paperboard Mills
|
$
|
10.0
|
|
$
|
(13.4
|
)
|
$
|
(5.1
|
)
|
$
|
(36.0
|
)
|
|||
|
Americas Paperboard Packaging
|
128.0
|
|
101.3
|
|
354.3
|
|
281.2
|
|
|||||||
|
Europe Paperboard Packaging
|
12.8
|
|
10.2
|
|
40.3
|
|
26.2
|
|
|||||||
|
Corporate and Other
(b)
|
15.6
|
|
(6.7
|
)
|
(38.8
|
)
|
(24.6
|
)
|
|||||||
|
Total
|
$
|
166.4
|
|
$
|
91.4
|
|
$
|
350.7
|
|
$
|
246.8
|
|
|||
|
(a)
|
Includes Revenue from contracts with customers for the Australia and Pacific Rim operating segments, which is not material.
|
|
(b)
|
Includes expenses related to acquisitions, integration activities and shutdown costs.
|
2018
COMPARED WITH
2017
Third Quarter 2018 Compared to Third Quarter 2017
Paperboard Mills
Net Sales
increased
due to the NACP Combination and increased selling prices, partially offset by lower open market volume of CRB and SUS as the Company internalized more paperboard due to the closure of the Santa Clara Mill in the fourth quarter of 2017.
Income from Operations increased due to the NACP Combination, the increased selling prices and productivity improvements, partially offset by higher inflation. The higher inflation was primarily due to chemicals, freight, and labor and benefits offset by lower prices for secondary fiber and energy.
Americas Paperboard Packaging
Net Sales
increased
due to the NACP Combination, 2017 and PFP Acquisitions, and higher selling prices. Core volumes were stable due to new product introductions, offset by lower volume for beverage, primarily beer, and for certain consumer products, primarily dry food and frozen pizza.
Income from Operations
increased
due to the NACP Combination, 2017 and PFP Acquisitions and the higher selling prices, partially offset by higher inflation, primarily for freight, labor and benefits, and external board.
Europe Paperboard Packaging
Net Sales
increased
due to the Norgraft acquisition and NACP Combination, increased volumes for beverage, consumer and convenience products and higher selling prices, partially offset by unfavorable foreign currency exchange rates. The increased volumes are with current customers as well as volume related to new customers.
Income from Operations
increased
due to the same factors increasing Net Sales as well as, continuous improvement and other cost savings programs, partially offset by higher inflation, primarily external paperboard.
31
First Nine Months 2018 Compared to First Nine Months 2017
Paperboard Mills
Net Sales
increased
due to the NACP Combination and increased selling prices, partially offset by lower open market volume of CRB and SUS as the Company internalized more paperboard due to the closure of the Santa Clara Mill in the fourth quarter of 2017. During 2018, the Company has announced a series of price increases related to its CRB, SUS and SBS open market paperboard.
Loss from Operations decreased due to the NACP Combination, the impact of the 2017 maintenance cold outage in West Monroe, LA, productivity improvements and the higher selling prices, partially offset by higher inflation. Inflation increased primarily for chemicals, freight and labor and benefits, partially offset by lower secondary fiber and energy costs.
Americas Paperboard Packaging
Net Sales
increased
due to the NACP Combination, 2017 and PFP Acquisitions, higher selling prices and new product introductions, partially offset by lower volume for beverage and certain consumer products. The higher selling prices are inflation pass throughs related to announced paperboard price increases.
Income from Operations
increased
due to the NACP Combination, 2017 and PFP Acquisitions, the higher selling prices and cost savings through continuous improvement programs, partially offset by higher inflation, primarily for freight, labor and benefits and external board.
Europe Paperboard Packaging
Net Sales
increased
due to the Norgraft acquisition and NACP Combination, favorable foreign currency exchange rates, increased volumes for beverage, consumer and convenience products and higher selling prices. The higher selling prices are related to board inflation pass throughs.
Income from Operations
increased
due to the same factors increasing Net Sales as well as, continuous improvement and other cost savings programs, partially offset by higher inflation, primarily external paperboard.
FINANCIAL CONDITION, LIQUIDITY AND CAPITAL RESOURCES
The Company broadly defines liquidity as its ability to generate sufficient funds from both internal and external sources to meet its obligations and commitments. In addition, liquidity includes the ability to obtain appropriate debt and equity financing and to convert into cash those assets that are no longer required to meet existing strategic and financial objectives. Therefore, liquidity cannot be considered separately from capital resources that consist of current or potentially available funds for use in achieving long-range business objectives and meeting debt service commitments.
Cash Flows
|
Nine Months Ended
|
|||||||
|
September 30,
|
|||||||
|
In millions
|
2018
|
2017
|
|||||
|
Net Cash Used in Operating Activities
|
$
|
(300.0
|
)
|
$
|
(118.3
|
)
|
|
|
Net Cash Provided by Investing Activities
|
$
|
360.3
|
|
$
|
105.7
|
|
|
|
Net Cash Used in Financing Activities
|
$
|
(87.2
|
)
|
$
|
(31.6
|
)
|
|
Effective January 1, 2018, the Company adopted ASU No. 2016-15,
Statement of Cash Flows (Topic 230); Classification of Certain Cash Receipts and Cash Payments,
which required the Company to classify consideration received for beneficial interest obtained for transferring trade receivables as investing activities instead of operating activities. The retrospective impact on the Company's consolidated statement of cash flows for the
nine months ended
September 30, 2017
was a
$424.8 million
decrease to cash provided by operating activities and a corresponding increase to cash provided by investing activities.
Net cash used in operating activities for the first
nine months
of
2018
totaled
$300.0 million
, compared to
$118.3 million
for the same period in
2017
. The increase was due to an increase in receivables sold during the period and higher inventory. Pension contributions for the first
nine months
of
2018
and
2017
were
$2.8 million
and
$33.6 million
, respectively.
Net cash provided by investing activities for the first
nine months
of
2018
totaled
$360.3 million
, compared to
$105.7 million
for the same period in
2017
. Capital spending was
$270.0 million
and
$197.8 million
in
2018
and
2017
, respectively. In
2018
, the Company paid $89.0 million for acquisitions, which included cash received for the working capital settlement for the NACP Combination. In 2017, the Company paid $120.9 million for the Carton Craft acquisition. Net cash receipts related to the accounts receivable securitization and sale programs were $675.9 million and
$424.8 million
in 2018 and 2017, respectively.
32
Net cash used in financing activities for the first
nine months
of
2018
totaled
$87.2 million
, compared to
$31.6 million
used in financing activities for the same period in
2017
. Current year activities include net borrowings under revolving credit facilities of
$149.0 million
, primarily for capital spending, and repaid debt of
$143.3 million
. The Company also paid dividends and distributions of
$82.1 million
and withheld
$4.1 million
of restricted stock units to satisfy tax withholding payments related to the payout of restricted stock units. In the prior year period, the Company had net borrowings under revolving credit facilities of
$118.2 million
and made payments on debt of
$18.8 million
. In addition, the Company paid dividends of
$70.2 million
, repurchased
$62.1 million
of its common stock and withheld
$10.1 million
of restricted stock units to satisfy tax withholding payments related to the payout of restricted stock units.
Liquidity and Capital Resources
The Company's liquidity needs arise primarily from debt service on its indebtedness, the funding of its capital expenditures, ongoing operating costs, working capital, share repurchases and dividend payments. Principal and interest payments under the term loan facilities and the revolving credit facilities, together with principal and interest payments on the Company's
4.75%
Senior Notes due 2021,
4.875%
Senior Notes due 2022 and
4.125%
Senior Notes due 2024 (the “Notes”), represent liquidity requirements for the Company. Based upon current levels of operations, anticipated cost savings and expectations as to future growth, the Company believes that cash generated from operations and investing activities, together with amounts available under its revolving credit facilities and other available financing sources, will be adequate to permit the Company to meet its debt service obligations, necessary capital expenditure program requirements and ongoing operating costs and working capital needs, although no assurance can be given in this regard. The Company's future financial and operating performance, ability to service or refinance its debt and ability to comply with the covenants and restrictions contained in its debt agreements (see “Covenant Restrictions” below) will be subject to future economic conditions, including conditions in the credit markets, and to financial, business and other factors, many of which are beyond the Company's control, and will be substantially dependent on the selling prices and demand for the Company's products, raw material and energy costs, and the Company's ability to successfully implement its overall business and profitability strategies.
The Company has entered into agreements to sell, on a revolving basis, certain trade accounts receivable to third party financial institutions. Transfers under these agreements meet the requirements to be accounted for as sales in accordance with the
Transfers and Servicing
topic of the Financial Accounting Standards Board ("FASB") Accounting Standards Codification (the "Codification"). The loss on sale is not material and is included in
Other Expense, Net
line item on the Condensed Consolidated Statement of Operations. The following table summarizes the activity under these programs as of
September 30, 2018
and
September 30, 2017
, respectively:
|
Nine Months Ended
|
|||||||
|
September 30,
|
|||||||
|
In millions
|
2018
|
2017
|
|||||
|
Receivables Sold and Derecognized
|
$
|
2,507.2
|
|
$
|
1,027.9
|
|
|
|
Proceeds Collected on Behalf of Financial Institutions
|
2,449.8
|
|
962.9
|
|
|||
|
Net Proceeds (Paid to) Received From Financial Institutions
|
(121.7
|
)
|
65.0
|
|
|||
|
Deferred Purchase Price
(a)
|
282.3
|
|
26.3
|
|
|||
(a)
Included in Receivables, Net and represents receivables from the financial institution which have purchasing and servicing of receivable agreements, which is a Level 3 fair value measure.
The Company has also entered into various factoring and supply chain financing arrangements which also qualify for sale accounting in accordance with the
Transfers and Servicing
topic of the FASB Codification. For the
nine months ended
September 30, 2018
and
2017
, the Company sold receivables of approximately
$86 million
and
$43 million
, respectively, related to these factoring arrangements.
Receivables sold under all programs subject to continuing involvement, which consist principally of collection services, at
September 30, 2018
and
December 31, 2017
, were approximately
$641 million
and $
583 million
, respectively.
Covenant Restrictions
Covenants contained in the Amended and Restated Credit Agreement, the Term Loan Credit Agreement (collectively, the "Credit Agreement") and the Indentures may, among other things, limit the ability to incur additional indebtedness, restrict the ability of the Company to dispose of assets, incur guarantee obligations, prepay other indebtedness, repurchase shares, pay dividends and make other restricted payments, create liens, make equity or debt investments, make acquisitions, modify terms of the indentures under which the Notes are issued, engage in mergers or consolidations, change the business conducted by the Company and its subsidiaries, and engage in certain transactions with affiliates. Such restrictions, together with disruptions in the credit markets, could limit the Company's ability to respond to changing market conditions, fund its capital spending program, provide for unexpected capital investments or take advantage of business opportunities.
Under the terms of the Credit Agreement, the Company must comply with a maximum Consolidated Total Leverage Ratio covenant and a minimum Consolidated Interest Expense Ratio covenant. The Third Amended and Restated Credit Agreement, which contains the definitions of these covenants, was filed as an exhibit to the Company's Form 8-K filed on January 2, 2018.
33
The Company must maintain a maximum Consolidated Total Leverage Ratio of less than 4.25 to 1.00. At
September 30, 2018
, the Company was in compliance with the Consolidated Total Leverage Ratio covenant in the Credit Agreement and the ratio was 2.84 to 1.00.
The Company must also comply with a minimum Consolidated Interest Expense Ratio of 3.00 to 1.00. At
September 30, 2018
, the Company was in compliance with the minimum Consolidated Interest Expense Ratio covenant in the Credit Agreement and the ratio was 9.65 to 1.00.
As of
September 30, 2018
, the Company's credit was rated BB+ by Standard & Poor's and Ba1 by Moody's Investor Services. Standard & Poor's and Moody's Investor Services' ratings on the Company included a stable outlook.
Capital Investment
The Company’s capital investment in the first
nine months
of
2018
was
$270.0 million
compared to
$197.8 million
in the first
nine months
of
2017
. The capital investments were primarily due to planned asset upgrades at the U.S.-based mills and continued investments made as part of the integration of acquisitions.
Environmental Matters
Some of the Company’s current and former facilities are the subject of environmental investigations and remediations resulting from historical operations and the release of hazardous substances or other constituents. Some current and former facilities have a history of industrial usage for which investigation and remediation obligations may be imposed in the future or for which indemnification claims may be asserted against the Company. Also, closures or sales of facilities may necessitate further investigation and may result in remediation at those facilities. The Company has established reserves for those facilities or issues where liability is probable and the costs are reasonably estimable.
For further discussion of the Company’s environmental matters, see "
Note 9 - Environmental and Legal Matters
" in the Notes to Condensed Consolidated Financial Statements.
CRITICAL ACCOUNTING POLICIES
The preparation of financial statements in conformity with U.S. GAAP requires management to make estimates and assumptions that affect the reported amounts of assets and liabilities at the date of the financial statements and the reported amounts of net sales and expenses during the reporting period. Actual results could differ from these estimates, and changes in these estimates are recorded when known. The critical accounting policies used by management in the preparation of the Company’s condensed consolidated financial statements are those that are important both to the presentation of the Company’s financial condition and results of operations and require significant judgments by management with regard to estimates used.
The Company’s most critical accounting policies, which require significant judgment or involve complex estimations, are described in GPHC’s Form 10-K for the year ended
December 31, 2017
.
NEW ACCOUNTING STANDARDS
For a discussion of recent accounting pronouncements impacting the Company, see "
Note 1 - General Information
"
in the Notes to Condensed Consolidated Financial Statements.
BUSINESS OUTLOOK
Total capital investment for
2018
is expected to be approximately $390 million and is expected to relate principally to the Company’s maintenance and process capability improvements (approximately $350 million), acquiring capital spares (approximately $30 million), and producing packaging machinery (approximately $10 million).
The Company also expects the following in
2018
:
|
•
|
Depreciation and amortization expense between $430 million and $450 million, excluding approximately $6 million of pension amortization.
|
|
•
|
Interest expense of $120 million to $130 million, including approximately $6 million to $7 million of non-cash interest expense associated with amortization of debt issuance costs.
|
|
•
|
Pension plan contributions of $5 million to $10 million.
|
For a discussion of certain market risks related to the Company, see Part II, “
Item 7A, Quantitative and Qualitative Disclosure about Market Risk
”, in GPHC’s Form 10-K for the year ended
December 31, 2017
. There have been no significant developments with respect to derivatives or exposure to market risk during the first
nine months
of
2018
. For a discussion of the Company’s Financial Instruments, Derivatives and Hedging Activities, see GPHC’s Form 10-K for the year ended
December 31, 2017
and “
Management’s Discussion and Analysis of Financial Condition and Results of Operations — Financial Condition, Liquidity and Capital Resources
.”
34
Disclosure Controls and Procedures
The Company’s management has carried out an evaluation, with the participation of its Chief Executive Officer and Chief Financial Officer, of the effectiveness of the Company’s disclosure controls and procedures pursuant to Rule 13a-15 of the Securities Exchange Act of 1934, as amended. Based upon such evaluation, management has concluded that the Company’s disclosure controls and procedures were effective as of
September 30, 2018
.
Changes in Internal Control over Financial Reporting
There was no change in the Company’s internal control over financial reporting that occurred during the fiscal quarter ended
September 30, 2018
that has materially affected, or is likely to materially affect, the Company’s internal control over financial reporting.
The Company is a party to a number of lawsuits arising in the ordinary conduct of its business. Although the timing and outcome of these lawsuits cannot be predicted with certainty, the Company does not believe that disposition of these lawsuits will have a material adverse effect on the Company’s consolidated financial position, results of operations or cash flows. For more information see "
Note 9 - Environmental and Legal Matters
" in the Notes to Condensed Consolidated Financial Statements.
There have been no material changes from the risk factors previously disclosed in GPHC’s Form 10-K for the year ended
December 31, 2017
.
On January 10, 2017, the Company's board of directors authorized an additional share repurchase program to allow the Company to purchase up to
$250 million
of the Company's issued and outstanding shares of common stock through open market purchases, privately negotiated transactions and Rule 10b5-1 plans. During the
third
quarter of
2018
, the Company did not repurchase any shares of its common stock. As of
September 30, 2018
, 22.3 million shares had been repurchased. The maximum number of shares that may be purchased under the share repurchase program described above in the future is 15.0 million based on the closing price of the Company's common stock as of September 28, 2018.
None.
35
|
Exhibit Number
|
Description
|
|
31.1
|
|
|
31.2
|
|
|
32.1
|
|
|
32.2
|
|
|
101.INS
|
XBRL Instance Document
|
|
101.SCH
|
XBRL Taxonomy Extension Schema
|
|
101.CAL
|
XBRL Taxonomy Extension Calculation Linkbase
|
|
101.DEF
|
XBRL Taxonomy Extension Definition Linkbase
|
|
101.LAB
|
XBRL Taxonomy Extension Label Linkbase
|
|
101.PRE
|
XBRL Taxonomy Extension Presentation Linkbase
|
36
SIGNATURES
Pursuant to the requirements of Section 13 or 15(d) of the Securities Exchange Act of 1934, the Registrant has duly caused this report to be signed on its behalf by the undersigned, thereunto duly authorized.
GRAPHIC PACKAGING HOLDING COMPANY
|
(Registrant)
|
|
|
/s/ STEPHEN R. SCHERGER
|
Executive Vice President and Chief Financial Officer (Principal Financial Officer)
|
October 23, 2018
|
|
Stephen R. Scherger
|
||
|
/s/ DEBORAH R. FRANK
|
Senior Vice President and Chief Accounting Officer (Principal Accounting Officer)
|
October 23, 2018
|
|
Deborah R. Frank
|
||
37
TABLE OF CONTENTS
Part IItem 1. Financial StatementsNote 1 General InformationNote 10-segmentsNote 3 - Business CombinationsNote 2 Inventories, NetNote 3 Business CombinationsNote 1 - General Information,Note 4 DebtNote 13 - Guarantor Consolidating Financial StatementsNote 5 Stock Incentive PlansNote 6 Pensions and Other Postretirement BenefitsNote 7 Financial Instruments and Fair Value MeasurementNote 9 Financial Instruments, Derivatives and Hedging ActivitiesNote 10 Fair Value MeasurementNote 8 Income TaxesNote 8 - Income TaxesNote 9 Environmental and Legal MattersNote 10 Segment InformationNote 1 - General InformationNote 14 Business Segment and Geographic Area InformationNote 11 Earnings Per ShareNote 12 Redeemable Noncontrolling InterestNote 13 EquityNote 12 - Redeemable Noncontrolling InterestNote 14 Accumulated Other Comprehensive (loss) IncomeItem 2. Management S Discussion and Analysis Of Financial Condition and Results Of OperationsItem 2. Management S Discussion and Analysis Of Financial Condition and ResultsNote 9 - Environmental and Legal MattersItem 3. Quantitative and Qualitative Disclosure About Market RiskItem 7a, Quantitative and Qualitative Disclosure About Market RiskItem 4. Controls and ProceduresPart II Other InformationItem 1. Legal ProceedingsItem 1A. Risk FactorsItem 2. Unregistered Sales Of Equity Securities and Use Of ProceedsItem 4. Mine Safety DisclosuresItem 6. Exhibits