GOPRO, INC.
10-Ks and 10-Qs
|
|
|
|
|
|
|
|
|
|
|
|
|
|
|
|
|
|
|
|
|
|
|
|
|
|
|
|
|
|
|
|
|
|
|
|
|
|
|
|
|
UNITED STATES
SECURITIES AND EXCHANGE COMMISSION
WASHINGTON, D.C. 20549
FORM 10-K
|
þ
|
ANNUAL REPORT PURSUANT TO SECTION 13 OR 15(d) OF THE SECURITIES EXCHANGE ACT OF 1934
|
|
For the fiscal year ended December 31, 2015
|
|
|
OR
|
|
|
¨
|
TRANSITION REPORT PURSUANT TO SECTION 13 OR 15(d) OF THE SECURITIES EXCHANGE ACT OF 1934
|
|
For the transition period from ________________ to ________________
|
|
Commission file number: 001-36514

GOPRO, INC.
(Exact name of registrant as specified in its charter)
|
Delaware
|
77-0629474
|
|
|
(State or other jurisdiction of incorporation or organization)
|
(I.R.S. Employer Identification No.)
|
|
|
3000 Clearview Way
San Mateo, California |
94402
|
|
|
(Address of principal executive offices)
|
(Zip Code)
|
|
(650) 332-7600
(Registrant’s telephone number, including area code)
Securities registered pursuant to Section 12(b) of the Act:
|
Class A Common Stock, par value $0.0001
(Title of each class)
|
The NASDAQ Stock Market LLC
(Name of each exchange on which registered)
|
|
Securities registered pursuant to section 12(g) of the Act: None
Indicate by check mark if the Registrant is a well-known seasoned issuer, as defined in Rule 405 of the Securities Act. Yes
þ
No
¨
Indicate by check mark if the Registrant is not required to file reports pursuant to Section 13 or Section 15(d) of Act. Yes
¨
No
þ
Indicate by check mark whether the Registrant (1) has filed all reports required to be filed by Section 13 or 15(d) of the Securities Exchange Act of 1934 during the preceding 12 months (or for such shorter period that the registrant was required to file such reports), and (2) has been subject to such filing requirements for the past 90 days. Yes
þ
No
¨
Indicate by check mark whether the Registrant has submitted electronically and posted on its corporate Website, if any, every Interactive Data File required to be submitted and posted pursuant to Rule 405 of Regulation S-T during the preceding 12 months (or for such shorter period that the Registrant was required to submit and post such files). Yes
þ
No
¨
Indicate by check mark if disclosure of delinquent filers pursuant to Item 405 of Regulation S-K (§229.405 of this chapter) is not contained herein, and will not be contained, to the best of Registrant’s knowledge, in definitive proxy or information statements incorporated by reference in Part III of this Form 10-K or any amendment to this Form 10-K.
¨
Indicate by check mark whether the registrant is a large accelerated filer, an accelerated filer, a non-accelerated filer, or a smaller reporting company. See the definitions of “large accelerated filer,” “accelerated filer” and “smaller reporting company” in Rule 12b-2 of the Exchange Act.
|
Large accelerated filer
þ
|
Accelerated filer
¨
|
Non accelerated filer
¨
|
Smaller reporting company
¨
|
|
(Do not check if a smaller reporting company)
|
|||
Indicate by check mark whether the registrant is a shell company (as defined in Rule 12b-2 of the Exchange Act). Yes
¨
No
þ
The aggregate market value of the voting stock held by non-affiliates of the registrant as of June 30, 2015, the last business day of the registrant's most recently completed second fiscal quarter, was approximately $5,005,600,000 based upon the closing price reported for such date on the NASDAQ Global Select Market.
On
January 31, 2016
, the registrant had
100,761,057
shares of Class A common stock and
36,104,708
shares of Class B common stock outstanding.
DOCUMENTS INCORPORATED BY REFERENCE
Portions of the registrant’s definitive proxy statement for its 2016 Annual Meeting of Stockholders (the “Proxy Statement”), to be filed within 120 days of the registrant’s fiscal year ended December 31, 2015, are incorporated by reference in Part II and Part III of this Annual Report on Form 10-K. Except with respect to information specifically incorporated by reference in this Annual Report on Form 10-K, the Proxy Statement is not deemed to be filed as part of this Annual Report on Form 10-K.
GoPro, Inc.
Index
|
Page
|
||
|
PART I
|
||
|
Item 1B.
|
Unresolved Staff Comments
|
|
|
PART II
|
||
|
Selected Consolidated Financial Data
|
||
|
PART III
|
||
|
PART IV
|
||
Special note regarding forward-looking statements
The discussions set forth in this Annual Report on Form 10-K contain statements concerning potential future events. Such forward-looking statements are based upon assumptions by the Company’s management, as of the date of this Annual Report on Form 10-K, including assumptions about risks and uncertainties faced by the Company. In addition, management may make forward-looking statements orally or in other writings, including, but not limited to, in press releases, in the annual report to stockholders and in the Company’s other filings with the Securities and Exchange Commission. Readers can identify these forward-looking statements by their use of such words as “expect," “anticipate," “believe," "may," "will," "estimate," "continue," "intend," "target," "goal," "plan," or variations of such words and similar expressions. Forward-looking statements include plans to include new product offerings in "Item 1. Business" and other sections of this Annual Report on Form 10-K, projections of results of operations, and any discussion of the trends and other factors that drive our business and future results in “Item 7. Management’s Discussion and Analysis of Financial Condition and Results of Operations,” including the discussion appearing there under "Looking Ahead to 2016," and other sections of this Annual Report on Form 10-K. Readers are cautioned not to place undue reliance on these forward-looking statements, which speak only as of their date. If any of management's assumptions prove incorrect or should unanticipated circumstances arise, the Company's actual results could materially differ from those anticipated by such forward-looking statements. The differences could be caused by a number of factors or combination of factors including, but not limited to, those factors identified under Item 1A. Risk Factors.” Readers are strongly encouraged to consider those factors when evaluating any forward-looking statements concerning the Company. The Company does not undertake to update any forward-looking statements in this Annual Report on Form 10-K to reflect future events or developments.
Company overview
GoPro, Inc. (“GoPro” or “we” or “the Company”) is transforming the way people visually capture and share their lives. We do this by enabling people to capture compelling, immersive photo and video content of themselves in their day to day life as well as participating in their favorite activities. Our consumers include some of the world’s most active and passionate people. The volume and quality of their shared GoPro content, coupled with their enthusiasm for our brand, are driving awareness and demand for our products. To date, our cameras (capture devices) and mountable and wearable accessories have generated substantially all of our revenue. We have been expanding the distribution of our GoPro originally produced content that we collectively refer to as GoPro Entertainment, to engage and build relationships with consumers. We believe this strategy will result in new GoPro capture device purchases and provide us long term opportunities to monetize our GoPro Entertainment efforts.
What began as an idea to help athletes self-document themselves engaged in their sport, GoPro has become a standard for how people capture themselves engaged in their interests, whatever they may be. From extreme to mainstream, professional to consumer, GoPro enables the world to capture and share its passions in the form of immersive and engaging content.
Our business focus
Enabling immersive and engaging content is at the core of our business. We develop product solutions to enable consumers to capture, manage, share and enjoy some of the most important moments in their lives
.
Capture
Our capture devices enable professional quality capture and exceptional versatility at affordable prices. Our products’ small, lightweight, waterproof, and durable designs make them easy to use even in highly challenging situations. In addition, our seamless integration with mobile devices via the GoPro App, enables engaging self-capture during virtually any activity. Through 2015, we have shipped approximately 20 million cumulative capture devices and there have been approximately 24 million cumulative downloads of the GoPro App.
3
Manage
We seek to eliminate the pain point of managing content by making it easy for our consumers to transfer footage from their cameras to a system that efficiently organizes their content and facilitates convenient editing and sharing. GoPro Studio and the GoPro App, available at no charge from our website, reflect the early stages of our content management platform strategy.
Share
By facilitating the capture, management and editing of engaging photos and videos, we are ultimately helping our consumers share more compelling personal content. GoPro Studio and the GoPro App facilitate the posting of photos and videos directly to leading social networks and content platforms, including Facebook, Instagram, Pinterest, Twitter, Vimeo and YouTube. Every day, GoPro users share tens of thousands of hours of video and innumerable photos on social media, driving awareness and enthusiasm for this content, as well as for GoPro’s own brand and products.
Enjoy
GoPro enables the production of entertaining and inspiring content, both in the form of our consumers’ user-generated content (UGC), as well as GoPro Entertainment. This content often features professional athletes, celebrities and entertainers, as well as everyday people engaged in their favorite activities.
We believe that increasing our consumers’ enjoyment of their content enhances the value proposition of capturing and sharing their lives with our products and has led to our aspiration of GoPro becoming one of the world's leading activity capture companies. Also, having recognized the role GoPro content plays in attracting and exciting consumers, we are expanding the distribution of GoPro Entertainment to engage and build relationships with consumers who do not currently own a GoPro capture device.
We distribute GoPro Entertainment through what we refer to as the GoPro Network, a collection of GoPro Channels hosted on a variety of online destinations and partner platforms, including Facebook, Instagram, Pinterest, Twitter and YouTube and distribution partners, including Amazon Fire TV, Comcast Watchable, LG Smart TVs, Microsoft Xbox entertainment systems, PlayStation
®
Network, Roku, SkyQ, Vessel Entertainment and Virgin America. The revenue earned from GoPro Channel advertising and sponsorship opportunities was not material to us in 2015, 2014 and 2013. Long-term, we seek to monetize GoPro Entertainment.
The virtuous cycle
We believe our business focus results in a virtuous cycle and a self-reinforcing consumer acquisition model that fuels our growth. Our products in the hands of our consumers enable compelling, authentic content that organically increases awareness for GoPro and drives demand for our products. As a result, we have historically achieved significant growth. In 2015, 2014 and 2013, we generated revenue of
$1,620.0 million
,
$1,394.2 million
and
$985.7 million
, and reported net income of
$36.1 million
,
$128.1 million
and
$60.6 million
, respectively.
Our strategy
We intend to continue building our existing capture device business while also launching complementary new device categories including unmanned aircraft systems (drones) and devices to enable virtual reality content capturing. In addition, we expect to release new content management, editing and sharing solutions that will provide increased value to our consumers, introduce new revenue streams and further differentiate us from competitors. Key components of our strategy include the following:
Continue to introduce innovative capture devices, mounts and accessories
We relentlessly pursue our goal of developing the world’s most versatile capture devices and enabling self-capture during any activity. To stay at the forefront of our industry, we are focused on continued product innovation and leadership. For example, we develop our own digital signal processing technologies and other areas of innovation include image science, mechanical design, device firmware, computer vision and audio, battery and accessory design. In 2015, we introduced the HERO4 Session to our line of HERO4 capture devices and we plan to launch our next-generation HERO5 capture devices in 2016. We will seek to leverage our brand strength and product
4
expertise to opportunistically enter new device categories, including the planned launch in 2016 of GoPro's drone, Karma, as well as devices to enable virtual reality content capturing.
Develop seamless content management, editing and sharing solutions
We have increased our focus on the development of solutions that simplify the organizing, editing and sharing of engaging content. To that end, we are developing an integrated content management platform. In 2016, we expect to release the initial piece of this content management platform with the introduction of GoPro for Desktop, which will enable consumers to more easily offload, access and edit content.
Scale GoPro as an entertainment brand
We believe GoPro Entertainment is a significant media asset which we also leverage to promote the sale of our capture devices. We continue to invest in GoPro Entertainment and are seeking new revenue opportunities by increasing production of GoPro originally produced content while simultaneously increasing the aggregation and redistribution of our consumers’ “best of” UGC. Additionally, we continue to invest in developing, distributing and promoting GoPro Entertainment programming on our own and additional partner platforms.
In 2015, we launched GoPro Awards and anticipate granting up to $5 million annually to creators of unique and compelling GoPro content. Through February 2016, GoPro users have submitted over 90,000 content submissions and we have awarded over $250,000 for video and photo content.
Expand our total addressable market
We believe the total market for enabling people to self-capture compelling, immersive photo and video content of their everyday activities is large. To date, our product development and sales and marketing strategies have enabled us to be a leader in vertical markets such as travel, snowsports, surfing, motorsports, music, hunting and fishing, and we continue to target other vertical markets. We believe that our future growth will come from continuing to reach and expand vertical markets and from broadening our user base to include consumers seeking to capture their day-to-day lives. To grow our market share and revenue, we are investing to provide both innovative and easy-to-use capture devices as well as intuitive and simple software tools in the future that enable seamless sharing of personal experiences on desktop and mobile platforms for a variety of social media networks and content sharing platforms.
Expand in international markets
We believe that international markets represent a significant growth opportunity for GoPro. Sales to customers outside the U.S. were more than 50% of our 2015 revenue and have increased from 43% in 2014. We plan to capitalize on the strength of our brand and continue to increase our presence worldwide, both with our capture devices and the new products we expect to introduce in the upcoming years.
Expand in-store brand and sales footprint
We continue to invest heavily to produce GoPro-branded, video-enabled point of purchase (POP) merchandising displays that we make available to nearly all of the retail outlets through which our products are sold. These displays showcase engaging GoPro content and attractively present our cameras and accessories. Having recognized our success in these stores, coupled with our expanding product portfolio, we have been successful working with our retailers to further expand the footprint of our POP displays.
Extend strategic marketing relationships
We form relationships with marketing partners that use our products and services to promote their own brands and properties. GoPro benefits not only from the expanded brand awareness that comes with such marketing partnerships, but also being recognized as our partners’ technology enabler. We will continue developing and leveraging strategic marketing relationships to increase GoPro brand awareness.
Expand brand awareness through increased advertising
We expect to increase our product marketing efforts in 2016. Notwithstanding the visibility we have garnered in the consumer markets where we have historically focused through our product adoption and UGC and GoPro Entertainment, we believe consumers in many emerging markets are not familiar with our brand and products. We believe there is a significant opportunity for GoPro to expand awareness through increased advertising on television,
5
in print, online, and on billboards and other out of home advertising while continuing to scale our promotional marketing efforts and trade show presence.
Products
Our core products are our HERO line of capture devices, the first HD version of which we introduced in 2009. Since then, we have focused on continued innovation and development of our products and subsequently launched the following cameras: the HERO2 in 2011, the HERO3 in 2012, the HERO3+ in 2013, the HERO4 and HERO in 2014, and HERO+LCD, HERO4 Session and HERO+ in 2015. All products introduced prior to 2014 have been discontinued and in January 2016 we announced our decision to end-of-life the entry-level HERO, HERO+ and HERO+LCD products. As a result, we have simplified our product line to a good-better-best offering of our HERO4 Session, Silver and Black performance cameras. Our products are waterproof either out of the box or with the included protective waterproof housing, and include select mounting accessories and have built-in Wi-Fi and Bluetooth providing connectivity with a mobile device to enable remote control, content viewing and sharing functionality. We offer the HERO4 Session, Silver and Black editions with increasingly better image quality, enhanced capture features and accessory bundles from model to model at different price points.
We also offer a wide range of mounts and accessories, either bundled with a capture device or sold separately, that enhance the functionality and versatility of our devices and enable our consumers to self-capture their experiences during a variety of activities and from different viewpoints. Our mounts are designed to enable consumers to capture content while engaged in a wide range of activities. These include equipment-based mounts, such as the helmet, handlebar, roll bar, as well as grip and tripod mounts, such as the 3-way, a 3-in-1 mount that can be used as a camera grip, extension arm or tripod. We also enable consumers to wear mounts on their bodies, such as our wrist housing, chest harness and head strap. Our accessories include the LCD Touch BacPac, Battery BacPac, Smart Remote and Floaty Backdoor, which expand the features, versatility and convenience of our cameras. Additionally, we offer spare batteries, charging accessories, cables to connect our GoPro cameras to television monitors, video transmitters and external microphones, flotation devices, dive filters, and anti-fogging solutions.
In addition, we currently make available two applications to all consumers at no charge that help our users manage, edit and share their content. GoPro Studio is a video editing tool that allows our users to create professional quality videos from their content. GoPro App allows users to control their GoPro cameras remotely using a smartphone or tablet. In February 2016, we entered into definitive agreements to acquire two mobile video editing application companies to further enhance our software offerings. In 2016, we plan to launch GoPro for Desktop, the initial piece of our content management platform that will enable consumers to more easily offload, access and edit content.
Seasonality
Our sales are subject to seasonal fluctuation. Historically, we have experienced the highest levels of revenue in the fourth quarter of the year, coinciding with the holiday shopping season in the United States and Europe. Our fourth quarter revenue comprised 27%, 45% and 37% of our 2015, 2014 and 2013 revenue, respectively. Sales of consumer products are also heavily influenced by the timing of the release of new products, and in 2015, we launched most of our products earlier in the year than in prior years. Fourth quarter 2015 revenue reflected global retail sell-through that was weaker than the prior year. Additionally, fourth quarter 2014 revenue benefited from the launch of our HERO4 Black and Silver capture devices just prior to the holiday season and there was no significant corresponding product launch in 2015. Neither historical seasonal patterns nor historical patterns of product introductions should be considered reliable indicators of our future pattern of product introductions, future revenue or financial performance.
Segment information and geographic data
We operate as one reportable segment. Financial information about geographic areas is presented in Note 11 to the Notes to Consolidated Financial Statements of this Annual Report on Form 10-K.
Backlog
We do not believe that our backlog is meaningful as of any particular date or indicative of future sales, as our customers can change or cancel orders with limited or no penalty and limited advance notice prior to shipment.
6
Research and development
We are passionate about developing new and innovative products that inspire our consumers and enhance our brand. We are constantly innovating to deliver better performance, expanded functionality and increased convenience to enhance the appeal of our products. In particular, we have increased our investment in software application development to facilitate convenient content management, editing and sharing. We strive to remain a market leader by consistently introducing innovative products that offer optimal performance and better software functionality at affordable price points.
We have a user experience-driven approach to product development and our CEO leads product design. By engaging with customers, consumers and opinion leaders in our core markets around the world, our development team strives to introduce meaningful and empowering new features that expand the versatility and performance of our products. In addition to our core product development team, we benefit from input received from our in-house media production team that regularly travels the world capturing GoPro originally produced content using our capture devices. We believe leveraging this content team to help refine existing products and influence future products gives us a competitive advantage.
Our engineering team, which supports the development of capture devices, drones, firmware and software, has grown from 250 in 2013 to
676
engineers on December 31, 2015. Our hardware engineering team is responsible for developing technologies to support the concepts proposed by our product team. These core technologies include new image silicon processors, image sensors and lenses, as well as the core algorithms that enable the systems to operate and provide optimal performance and features. The hardware engineering team also integrates these innovations and firmware into our product designs and develops our capture devices, drones, mounts and accessories. The software engineering team is developing applications that enhance the functionality of our products and facilitate the management, editing, sharing and viewing of media. These applications are being developed for mobile, desktop and web-based platforms and powered by server-side services. The core technologies include rendering engines to enable video editing, video encoding and decoding for smooth playback and algorithms for moment identification.
Our research and development expense was
$241.7 million
,
$151.9 million
and
$73.7 million
for 2015, 2014 and 2013, respectively.
Manufacturing, logistics and fulfillment
While our products are designed in California, we outsource a significant majority of our manufacturing to contract manufacturers located in China. We believe that using outsourced manufacturing enables greater scale and flexibility than establishing our own manufacturing facilities. We periodically evaluate the need and advisability of adding manufacturers to support our operations.
We have established a strategic commodity team that manages the pricing and supply of the key components of our capture devices, including digital signal processors, sensors and lenses. Several key strategic parts are purchased from the supplier by us and then consigned to our manufacturers, while the vast majority of parts are procured directly by our contract manufacturers. We seek to use our commodity team to achieve competitive pricing on the largest value-add components, and leverage our contract manufacturers’ volume purchases for best pricing on common parts.
We have third-party fulfillment centers in California, China, Hong Kong, Brazil, and the Netherlands that deliver our products from multiple locations worldwide. These facilities are either warehouse/fulfillment centers or full service postponement centers (that perform light assembly in addition to warehouse/fulfillment). In addition, we have third-party centers in California, Czech Republic, and China that perform in-region final packaging services. Cameras are typically air freighted while accessories and packaging are generally regionally procured or shipped via ocean freighter from our manufacturers in China to these fulfillment centers, where the products are packaged for retail sale. Our fulfillment strategy allows us to reduce shipping costs, reduce custom levies, customize products for local languages and improve inventory flexibility.
Sales channels and customers
We offer our products in over 40,000 retail outlets and in over 100 countries through our direct sales channel and
7
indirectly through our distribution channel. In 2015 and 2014, our direct sales accounted for
52%
and
59%
of our revenue, respectively, and our distributors accounted for
48%
and
41%
of our revenue, respectively.
Direct sales
We sell directly to large and small retailers in the United States and EMEA, and directly to consumers around the world through our e-commerce channels, as follows:
|
•
|
Independent specialty retailers.
We use a network of location-based independent manufacturer representatives to sell our products to independent specialty retailers focused on sports and consumer activity capture markets. Our representatives provide highly personalized service to these retailers, including assisting with product mix planning, channel marketing and in-store merchandising, taking orders and providing clinics to educate retail sales personnel about GoPro products. We also have an internal, regionally focused sales team that provides a secondary level of service to both the manufacturer representatives and these retailers. Independent specialty retailers generally carry our higher end products, targeting their core customers who we believe tend to be early adopters of new technologies. Independent specialty retailers outside of the United States represent a similarly important sales channel for us, and we reach these customers indirectly through our network of international distributors.
|
|
•
|
Big box retailers.
We sell to large retailers with a national presence, including Amazon.com, Inc., Best Buy, Inc., Target Corporation and Wal-Mart, Inc. We support these retailers with a dedicated and experienced sales management team that we believe enables us to reduce channel conflict. These large retailers generally carry a varied subset of our products targeting their particular end-user customers. This helps us maintain in-store product differentiation between sales channels and protects our brand image in our specialty retail markets. Best Buy accounted for
14%
,
20%
and
17%
, of our total revenue in 2015, 2014 and 2013, respectively, and Amazon accounted for
12%
of our total revenue in 2015.
|
|
•
|
Mid-market retailers.
We also sell to retailers with a large regional or national presence, often focused on specific verticals such as consumer electronics, sporting goods, military, hunting and fishing and motor sports. In the U.S., we sell directly to these mid-market retailers through our experienced sales teams assigned to particular accounts and regions. Mid-market retailers generally carry a smaller subset of our products targeted toward their end-user customers.
|
|
•
|
E-commerce channel.
We sell our full line of products directly to consumers around the world through our online store at gopro.com, which we market through online and offline advertising. Sales through gopro.com provide us insights into our consumer shopping behaviors, and serves as a platform for us to educate and inform our consumers on our brand, products, and services.
|
We believe that our diverse direct sales channels are a key differentiator for GoPro and we differentiate our products among these channels.
Distributors
We sell to over 50 distributors who resell our products to retailers in international markets and to certain specific verticals in the United States. We have dedicated sales personnel focused on providing a high level of service to these distributors, including assisting with product mix planning, channel marketing and in-store merchandising, development of marketing materials, order assistance and educating the distributors’ sales personnel about GoPro products. During 2015, we converted portions of our distributor sales into direct sales.
In-store merchandising
Our in-store merchandising strategy focuses on our POP displays that continuously show GoPro content on a large video monitor and present our capture devices and accessories in an attractive manner. We provide our POP display in sizes ranging from two to four feet wide by five feet tall to retailers at no cost. We also have installed POP displays that are 12 feet wide by seven feet tall. Our capture devices are attractively arranged on the displays and the breadth of our offerings, combined with the associated content, communicate the wide range of uses for our products. As of December 31, 2015, we had over 25,000 POP displays in retail outlets.
8
Marketing and advertising
Our marketing and advertising programs are focused on engaging consumers by exposing them to compelling GoPro content. We believe this approach enhances our brand while demonstrating the performance, durability and versatility of our products. Our marketing and advertising efforts span a wide range of consumer interests and leverage both traditional consumer marketing and lifestyle marketing strategies.
Consumer marketing.
Social media plays an important role in our consumer marketing strategy. Our consumers capture and share personal GoPro content on social media and content sharing platforms like Facebook, Instagram, Pinterest, Twitter, Vimeo and YouTube.
We also integrate UGC and GoPro originally produced content into advertising campaigns across various platforms including television commercials, print, online, billboards and other out of home advertising, and at consumer and trade facing events. This content also supports our in-store channel marketing efforts, appearing on our POP displays and other in-store marketing materials.
Lifestyle marketing.
Our lifestyle marketing programs focus on expanding GoPro brand awareness by engaging consumers through relationships with key influencers, event promotions and other outreach efforts. We cultivate strong relationships with influential athletes, celebrities, entertainers and brands, all of whom use our products to create and share engaging content with their own fans and consumers. We also work directly with these partners to create compelling content that we leverage to our mutual benefit across the GoPro Network.
Competition
The market for cameras and camcorders is highly competitive and characterized by frequent product introductions and rapid technological advances. We believe the principal competitive factors impacting the market for our products include quality, reliability and user experience, price and performance, design innovation, brand recognition, marketing and distribution capability, service and support, and corporate reputation.
We compete against established, well-known camera manufacturers such as Canon Inc., Fujifilm Corporation, Nikon Corporation, Olympus Corporation, Rollei GmbH & Co. KG and Vivitar Corporation, as well as large, diversified electronics companies such as, Panasonic Corporation, Polaroid Corporation, Samsung Electronics Co., Sony Corporation and VTech Technologies, and specialty companies such as Garmin Ltd. We believe we compete favorably with these companies’ products. Our durable and versatile product design facilitates increased functionality and wearability and we offer a variety of mounts and other accessories that enable a wide range of consumer use cases that are difficult for other competing products to address. Further, we offer many professional-grade features at attractive consumer price points, including our SuperView mode, which allows a user to capture an immersive wide-angle perspective, and super high resolution video capability. We also provide users with a suite of free desktop and mobile applications that enhance the overall GoPro experience. Moreover, we believe we have achieved significant brand recognition in our target vertical markets. We believe our years of experience working with active and influential consumers contributes to our ability to develop attractive products and establishes the authenticity of our brand, thereby differentiating us from current and potential competitors.
Smartphones and tablets with photo and video functionality have significantly displaced traditional camera sales. We believe that our capture devices enable differentiated use cases from mobile devices. In particular, we allow users to self-capture their experiences in even the most challenging of environments, such as on and in water and in other environments where mobile devices would be damaged, and to do so with their hands free to focus on the activity and not the capture device. We believe that the small, rugged form factor coupled with the professional quality video enabled by our capture devices makes them ideal for uniquely capturing important moments of our users' lives. However, it is possible that in the future the manufacturers of these devices may design them for use in a range of scenarios and conditions. In addition, new companies may emerge and offer competitive products directly in our category.
We expect to enter the consumer drone market in 2016 and face significant competition from other companies promoting their own drone and related products. These include established and start up drone manufacturers, such as DJI Technology Co., Parrot SA, Yuneec and 3DR, who currently have or are attempting to gain a substantial share of the emerging international drone market.
9
Intellectual property
Intellectual property is an important aspect of our business, and our practice is to seek protection for our intellectual property as appropriate. Our trademarks, including “GoPro,” “HERO,” “Be a HERO,” “Session,” “Karma,” among others, are a critical component of the value of our business. In addition, we hold many issued and pending utility and design patents for various aspects of our capture devices and the applications that helps our consumers manage, share and enjoy their content. Our patents cover areas that include physical structures, image processing, operational firmware and software, post-processing software, distribution software, mount and accessory structures, as well as the ornamental aspects of our capture devices. As of February 23, 2016, we had 114 issued patents and 247 patent applications pending in the United States, and 87 corresponding issued patents and 105 patent applications pending in foreign countries. We cannot be certain that our patent applications will be issued or that any issued patents will provide us with any competitive advantage or will not be challenged by third parties. Our issued U.S. patents will expire between 2024 and 2035 and our issued foreign patents will expire between 2022 and 2040. We continually review our development efforts to assess our innovations, including their patentability. We take active measures to protect our intellectual property against unauthorized third party use, including misuse of our patents, copyrights, and trademarks, and other proprietary rights.
In addition to the foregoing protections, we generally control access to and use of our proprietary and other confidential information through the use of internal and external controls, including contractual protections with employees, contract manufacturers, distributors and others. Despite these protections, we may be unable to prevent third parties from using our intellectual property without our authorization, breaching any nondisclosure agreements with us, or independently developing products that are similar to ours, particularly in those countries where the laws do not protect our proprietary and intellectual property rights as fully as in the United States.
Employees
As of December 31, 2015 we had
1,539
employees. None of our employees are currently covered by a collective bargaining agreement, and we have experienced no work stoppages. We consider our relationship with our employees to be good.
Corporate Information
We were incorporated as Woodman Labs, Inc. in California and began doing business as GoPro in February 2004. We reincorporated in Delaware in December 2011 and in February 2014 we changed our name to GoPro, Inc. Our principal executive offices are located at 3000 Clearview Way, San Mateo, California 94402, and our telephone number is (650) 332-7600. We completed our initial public offering in July 2014 and our Class A common stock is listed on the NASDAQ Global Select Market under the symbol “GPRO”.
We have registered and applied to register with the U.S. Patent and Trademark Office and the trademark offices of other countries a number of trademarks including “GOPRO,” “HERO,” and the GoPro logo and GoPro Be a Hero logo, as well as "KARMA." This Annual Report on Form 10-K also includes references to trademarks and service marks of other entities, and those trademarks and service marks are the property of their respective owners.
Available Information
Our website address is www.gopro.com. Through a link on the Investor Relations section of our website, we make available the following filings as soon as reasonably practicable after they are electronically filed with or furnished to the Securities and Exchange Commission (SEC): our Annual Report on Form 10-K, Quarterly Reports on Form 10-Q, Current Reports on Form 8-K, and any amendments to those reports filed or furnished pursuant to Section 13(a) or 15(d) of the Exchange Act. All such filings are available free of charge. The information posted on our website is not incorporated into this report. Further, a copy of this Annual Report on Form 10-K is located at the SEC’s Public Reference Room at 100 F Street, N.E., Washington, D.C. 20549. Information on the operation of the Public Reference Room can be obtained by calling the SEC at 1-800-SEC-0330. The SEC maintains a website that contains reports, proxy and information statements and other information regarding our filings at www.sec.gov.
10
You should carefully consider the risks described below and all other information contained in this Annual Report on Form 10-K before making an investment decision. Our business, financial condition and results of operations could be materially and adversely affected if any of the following risks, or other risks and uncertainties that are not yet identified or that we currently think are immaterial, actually occur. In that event, the trading price of our shares may decline, and you may lose part or all of your investment.
Risks related to our business and industry
We depend on sales of our capture devices for substantially all of our revenue, and any decrease in the sales of these products would harm our business.
We expect to continue to derive the substantial majority of our revenue from sales of cameras, mounts and accessories for the foreseeable future. A decline in the price or unit demand for these products, whether due to macroeconomic conditions, competition or otherwise, or our inability to increase sales of these products, would harm our business and operating results more seriously than it would if we derived significant revenue from a variety of product lines and services.
For example, although our annual revenue in 2015 of
$1,620.0 million
was up
16%
from 2014, our fourth quarter revenue of
$436.6 million
was down
31%
year-over-year. Fourth quarter 2015 revenue reflected global sell-through at retailers that was seasonally weaker than the prior year and the lack of a major new product launch in the fourth quarter of 2015. Demand for our new HERO4 Session was less than expected, and our revenues and operating results were negatively impacted by price reductions and corresponding price protection related charges of approximately $40 million. We believed these price reductions were needed to stimulate sell-through for this product. Additionally, we announced an end-of-life for our entry-level HERO line of capture devices in order to simplify our product offerings. As a result, we recorded product realignment charges of approximately $57 million to cost of revenue in the fourth quarter of 2015. In future periods, we could again experience a decline in revenue, or revenue could grow more slowly than we expect, which could have a material negative effect on our future gross margins and operating results. Specifically, we anticipate our revenue to decline by over 50% in the first quarter of 2016 on a year-over-year basis. In addition, we anticipate our full year 2016 revenue to decline as compared to 2015. If sales of our capture devices continue to decline in future periods, our financial condition, operating results and cash flows will be materially affected.
Changes in product mix may harm our financial results. If there is a shift in consumer demand from our higher-priced to lower-priced capture devices in any or all of our market segments without a significant increase in units sold, our revenues and gross profit would decrease. For example, in 2015, the average selling price of units shipped decreased due to a higher mix of our lower-priced cameras, including the price reduced HERO4 Session and entry-level HERO cameras, which adversely impacted our revenue and gross profit.
While we are pursuing additional products and services to add to our offerings, as described in the risk factors that follow, we may not be successful in identifying or executing on such opportunities. For example, the consumer drone market remains relatively new and the launch of our drone product may not result in long term success or significant revenue for us. In addition, we do not have significant experience deriving revenue from the distribution of GoPro content, and we cannot be assured that our investments in the development of software and entertainment related initiatives will result in increased revenue. Also, pursuing these new markets requires substantial operating expense investment and even if we do generate significant incremental revenue, we may not be able to do so profitably.
As a result, our future growth and financial performance may depend heavily on our ability to develop and sell enhanced versions of our capture devices. If we fail to deliver product enhancements, new releases or new products that appeal to consumers, our future financial condition, operating results and cash flows will be materially affected.
Our growth depends in part on further penetrating our total addressable market, and we may not be successful in doing so.
Our growth historically has largely been fueled by the adoption of our products by people looking to self-capture images of themselves participating in exciting physical activities. We believe that our future growth depends not only on continuing to reach and expand this core demographic, but also broadening our user base to include a more diverse group of consumers seeking to capture their daily lives. We believe that in order to expand our market, we
11
must provide both innovative and easy-to-use capture devices as well as intuitive and simple software tools in the future that enable the seamless sharing of content, and we may not be able to do this on a timely basis and we may not be successful in providing tools that are easy to use. Our growth also depends on expanding the market with new capture perspectives, including spherical and aerial. While we are investing resources, including in sales and marketing, to reach these expanded and new consumer markets, we cannot be assured that we will be successful in doing so. If we are not successful in penetrating additional markets, we might not be able to grow our revenue and we may not recognize benefits from our investment in new areas.
To remain competitive and stimulate consumer demand, we must manage frequent product introductions and transitions.
We believe that we must continually develop and introduce new products, enhance our existing products and effectively stimulate customer demand for new and upgraded products to maintain or increase our revenue.
The success of new product introductions depends on a number of factors including, but not limited to, timely and successful research and development, pricing, market and consumer acceptance, the effective forecasting and management of product demand, purchase commitments and inventory levels, the management of manufacturing and supply costs, and the risk that new products may have quality or other defects in the early stages of introduction. In addition, the introduction or announcement of new products or product enhancements may shorten the life cycle of our existing products or reduce demand for our current products, thereby offsetting any benefits of successful product introductions and potentially lead to challenges in managing inventory of existing products. Failure to complete product transitions effectively or in a timely manner could harm our brand and lead to, among other things, lower revenue and excess inventory.
For example, demand for our new HERO4 Session was less than expected and our revenues and operating results were negatively impacted by price reductions and corresponding price protection related charges of approximately $40 million. We believed these price reductions were needed to stimulate sell-through for this product. Additionally, we announced the end-of-life for our entry-level HERO line of capture devices in order to simplify our product offering. As a result, we recorded product realignment charges of approximately $57 million to cost of revenue in the fourth quarter of 2015. If we fail to effectively manage new product introductions and transitions in the future, including our next generation capture devices, drones and content-management software solutions, our revenue and profitability will be materially affected.
If we are unable to anticipate consumer preferences and successfully develop desirable products, we might not be able to maintain or increase our revenue and profitability.
Our success depends on our ability to identify and originate product trends as well as to anticipate and react to changing consumer demands in a timely manner. All of our products are subject to changing consumer preferences that cannot be predicted with certainty. If we are unable to introduce appealing new products or novel technologies in a timely manner, or our new products or technologies are not accepted by consumers, our competitors may increase their market share, which could hurt our competitive position.
Our research and development efforts are complex and require us to incur substantial expenses to support the development of our next generation capture devices, drones, content-management software solutions, and other new products and services. Our research and development expense was
$241.7 million
,
$151.9 million
and
$73.7 million
for 2015, 2014 and 2013, respectively. We anticipate that research and development expense will continue to increase in 2016. Unanticipated problems in developing products could also divert substantial resources, which may impair our ability to develop new products and enhancements of existing products, and could further increase our costs. We may not be able to achieve an acceptable return, if any, on our research and development efforts, and our business may be adversely effected.
As we continually seek to enhance our products, we will incur additional costs to incorporate new or revised features. We might not be able to, or determine that it is not in our interests to, raise prices to compensate for these additional costs.
Our expected entrance into the consumer drone market is subject to numerous risks and uncertainties.
We plan to launch our first drone for recreational use in 2016. We have no experience in the consumer drone market and expect to face significant competition from other companies promoting their own drone and related products.
12
These include established and start up drone manufacturers, such as DJI Technology Co., Parrot SA, Yuneec and 3DR, who currently have or are attempting to gain a substantial share of the emerging international drone market. Failure to timely launch a cost effective drone and/or failure to effectively compete in this new market could damage our reputation, limit our growth and negatively affect our operating results.
Regulations and legislation relating to the use of consumer drones in the United States and other countries where we plan to sell our drones are evolving and may be subject to future changes that could negatively impact our sales of such products. Effective December 21, 2015, U.S. consumers who own a drone over a certain weight threshold must register with the Federal Aviation Administration's registry before they fly outdoors. It is possible that further regulations in the United States or other countries could restrict the use of recreational drones and/or require specific certification, qualifications or design modifications, which could have an unfavorable impact on our future business, financial position and operating results.
In addition, our drones and related product offerings present new and difficult technology challenges, and we may be subject to claims if users experience failures or other quality issues. If our drones malfunction or contain errors or defects, collisions or crashes could occur resulting in property damage, personal injury or death. If any of these events occurs, we could be subject to significant liability for personal injury and property damage.
We operate in a highly competitive market and the size and resources of some of our competitors may allow them to compete more effectively than we can, which could result in a loss of our market share and a decrease in our revenue and profitability.
The market for capture devices, including cameras and camcorders, is highly competitive. Further, we expect competition to intensify in the future as existing competitors introduce new and more competitive offerings alongside their existing products, and as market entrants introduce new products into our markets. Our products are discretionary items for consumers subject to changing preferences that cannot be predicted with certainty. Increased competition and changing consumer preferences may result in pricing pressures and reduced profit margins and may impede our ability to continue to increase the sales of our products or cause us to lose market share, any of which could substantially harm our business and results of operations.
We compete against established, well-known camera manufacturers such as Canon Inc., Fujifilm Corporation, Nikon Corporation, Olympus Corporation, Rollei GmbH & Co. KG and Vivitar Corporation, as well as large, diversified electronics companies such as, Panasonic Corporation, Polaroid Corporation, Samsung Electronics Co., Sony Corporation and VTech Technologies, and specialty companies such as Garmin Ltd.
Many of our current competitors have substantial market share, diversified product lines, well-established supply and distribution systems, strong worldwide brand recognition and greater financial, marketing, research and development and other resources than we do. In addition, many of our existing and potential competitors enjoy substantial competitive advantages, such as longer operating histories; the capacity to leverage their sales efforts and marketing expenditures across a broader portfolio of products; broader distribution and established relationships with channel partners; access to larger established customer bases; greater resources to make acquisitions; larger intellectual property portfolios; and the ability to bundle competitive offerings with other products and services.
Moreover, smartphones and tablets with photo and video functionality have significantly displaced the market for traditional camera sales. It is possible that, in the future, the manufacturers of these devices, such as Apple Inc. and Samsung, may design them for use in a range of conditions, including challenging physical environments, or develop products with features similar to ours
.
In addition to competition or potential competition from large, established companies, new companies may emerge and offer competitive products. Further, we are aware that certain companies have developed cameras designed and packaged to appear similar to our products, which may confuse consumers or distract consumers from purchasing GoPro products.
Additionally, we expect to enter the consumer drone market in 2016 and face significant competition from other companies promoting their own drone and related products. These include established and start up drone manufacturers, such as DJI Technology Co., Parrot SA, Yuneec and 3DR, who currently have or are attempting to gain a substantial share of the emerging international drone market. Failure to effectively compete in this new market could negatively affect our operating results and financial position.
13
We do not expect to continue to grow in the future at the same rate as we have in the past and profitability in recent periods might not be indicative of future performance.
From 2013 to 2015, our annual revenue grew rapidly from
$986 million
to
$1,620 million
, which represents a compounded annual growth rate of approximately 45%. As our revenue has increased, our annual growth rate has slowed, and our historical growth should not be considered as indicative of our future performance. Although our annual revenue in 2015 was up
16%
compared to 2014, our fourth quarter revenue declined
31%
on a year-over-year basis. In future periods, we could again experience a decline in revenue, or revenue could grow more slowly than we expect, which could have a material negative effect on our future operating results. Specifically, we anticipate our first quarter and full year 2016 revenue to decline on a year-over-year basis. Lower levels of revenue and higher levels of operating expense investment may result in limited profitability or losses. For example, we expect to record a substantial net loss in the first quarter of 2016, as compared to the net income we recorded in the first quarter of 2015.
We may incur significant losses in the future for a number of reasons, including other risks described in this Annual Report on Form 10-K, and we may encounter unforeseen expenses, difficulties, complications, delays and other unknown factors.
If our sales fall below our forecasts, especially during the holiday season, our overall financial condition and results of operations could be adversely affected.
Seasonal consumer shopping patterns significantly affect our business. We have traditionally experienced greater revenues in the fourth quarter of each year due to demand related to the holiday season, and in some years, the launch of new products heading into the holiday season. Fourth quarter revenue comprised 27%, 45% and 37% of our 2015, 2014 and 2013 revenue, respectively. Given the strong seasonal nature of our sales, appropriate forecasting is critical to our operations. We anticipate that this seasonal impact on our net sales is likely to continue and any shortfalls in expected fourth quarter net sales, due to macroeconomic conditions, product release patterns, a decline in the effectiveness of our promotional activities, supply chain disruptions, or for any other reason, could cause our annual results of operations to suffer significantly. For example, in the fourth quarter of 2015, our revenue declined on a year-over-year basis, which had a material negative impact on our annual operating results for 2015. In addition, we typically experience lower revenue in the first quarter. In the first quarter of 2015 and 2014 our revenue declined sequentially by 43% and 35%, respectively. In the first quarter of 2016, we expect our seasonal decline in revenue to be greater than what we have experienced historically. Specifically, we anticipate our revenue to decline by over 50% in the first quarter of 2016 on a year-over-year basis.
In contrast, a substantial portion of our expenses are personnel related and include salaries, stock-based compensation, benefits and incentive-based compensation plan expenses, which are not seasonal in nature. Accordingly, in the event of revenue shortfalls, we are generally unable to mitigate a negative impact on operating margins in the short term. To the extent such revenue shortfalls recur in future periods, our operating results would be harmed. For example, we expect to record a substantial net loss in the first quarter of 2016 due to lower levels of revenue and higher levels of operating expense investment.
An economic downturn or economic uncertainty in our key U.S. and international markets may adversely affect consumer discretionary spending and demand for our products.
Our products are discretionary items for consumers. Factors affecting the level of consumer spending for such discretionary items include general market conditions, macroeconomic conditions, fluctuations in foreign exchange rates and interest rates, and other factors such as consumer confidence, the availability and cost of consumer credit, levels of unemployment and tax rates. For example, while much of our revenue is derived from markets outside the U.S., the substantial majority of our sales occur in U.S. dollars and an increase in the value of the dollar against foreign currencies increases the real cost of our products to consumers in those local markets. As global economic conditions continue to be volatile or if economic conditions further deteriorate, consumers may delay or reduce purchases of our products. Consumer demand for our products may not reach our sales targets, or may decline, when there is an economic downturn or economic uncertainty. Our sensitivity to economic cycles and any related fluctuation in consumer demand could adversely affect our business, financial condition and operating results.
14
We face substantial risks related to inventory, purchase commitments and long-lived assets, and we could incur material charges related to these items that adversely affect our operating results.
To ensure adequate inventory supply and meet the demands of our retailers and distributors, we must forecast inventory needs and place orders with our contract manufacturers and component suppliers based on our estimates of future demand for particular products as well as accurately track the level of product inventory in the channel to ensure we are not in an over or under supply situation. In addition, as we develop or introduce new products and services, our older products and services will reach the end of their respective lifecycles. To the extent we discontinue the manufacturing and sales of any products and services, we must manage the inventory liquidation, supplier commitments and customer expectations. For example, in the fourth quarter of 2015, we recorded product realignment charges of $57 million to cost of revenue for excess purchase order commitments, excess inventory, and obsolete tooling, relating to the end-of-life of our entry-level HERO products and slower than anticipated overall demand.
No assurance can be given that we will not incur additional charges in future periods related to our inventory management or that we will not underestimate or overestimate forecast sales in a future period. Our ability to accurately forecast demand for our products is affected by many factors, including product introductions by us and our competitors, channel inventory levels, unanticipated changes in general market demand, macroeconomic conditions or consumer confidence. If we do not accurately forecast customer demand for our products, we may in future periods be unable to meet customer, retailer or distributor demand for our products, or may be required to incur higher costs to secure the necessary production capacity and components, and our business and operating results could be adversely affected.
We have experienced rapid growth in recent periods. If we fail to manage our expansion effectively, our financial performance may suffer.
We have experienced rapid growth over the last several years which has placed a strain on our operations. As of December 31, 2015, approximately 45% of our employees had been with us for less than one year and approximately 68% for less than two years. Additionally, because of our growth, we have significantly expanded our operating lease commitments. At December 31, 2015, our future non-cancelable operating lease commitments through 2027 were $152.2 million. If our business and headcount do not grow resulting in excess leased facility capacity and we are unable to sublease our facilities, our financial results could be adversely affected.
Our success will depend in part upon our ability to manage our expansion effectively. To do so, we must continue to increase the productivity of our existing employees and hire, train and manage new employees as needed. To manage the growth of our operations and personnel, we will need to continue to improve our operational, financial and management controls and our reporting processes and procedures, and implement more extensive and integrated financial and business information systems. These additional investments have increased our operating costs, which will make it more difficult for us to offset any future revenue shortfalls by reducing expenses in the short term. Moreover, if we fail to scale our operations or manage our growth successfully, our business, financial condition and operating results could be adversely affected.
In addition, in response to unfavorable market conditions or consumer demand, we may be required to strategically realign our resources, adjust our product line and/or enact price reductions in order to stimulate demand, and implement workforce reductions. Any such actions may result in the recording of special charges including, inventory-related write-offs, workforce reductions, or other restructuring costs. Additionally, our estimates with respect to the useful life or ultimate recoverability of our assets, including purchased intangible assets and tooling, could also change and result in impairment charges.
For example, in January 2016, we adopted a restructuring plan that provided for a 7% reduction in our global workforce. The implementation of this restructuring plan may be disruptive to our business, and following completion of the restructuring plan our business may not be more efficient or effective than prior to implementation of the plan. Our restructuring activities, including any related charges and the impact of the related headcount reduction, could have a material adverse effect on our business, operating results, and financial condition.
15
We may acquire other businesses or receive offers to be acquired, which could require significant management attention, disrupt our business, dilute stockholder value and adversely affect our operating results.
As part of our business strategy, we have completed several acquisitions, and we expect to evaluate additional acquisitions of, or strategic investments in other companies, products or technologies that we believe are complementary to our business. For example, in February 2016, we entered into definitive agreements to acquire two mobile video editing application companies for cash consideration of approximately $105 million to further enhance our future software offerings.
We may not be able to find suitable acquisition candidates and we may not be able to complete acquisitions on favorable terms, if at all. If we do complete acquisitions, we may not ultimately strengthen our competitive position or achieve our goals, and any acquisitions we complete could be viewed negatively by users or investors. In addition, if we fail to integrate successfully such acquisitions, or the technologies associated with such acquisitions, into our company, the revenue and operating results of the combined company could be adversely affected. Acquisitions may disrupt our ongoing operations, divert management from their primary responsibilities, subject us to additional liabilities, increase our expenses and adversely impact our business, financial condition, operating results and cash flows. We may not successfully evaluate or utilize the acquired technology and accurately forecast the financial impact of an acquisition transaction, and consequently, we may be required to take impairment charges, which would adversely affect our results of operations.
We may have to pay cash, incur debt or issue equity securities to pay for any such acquisition, each of which could affect our financial condition or the value of our capital stock. The sale of equity to finance any such acquisitions could result in dilution to our stockholders. If we incur debt it would result in increased fixed obligations and could also subject us to covenants or other restrictions that would impede our ability to manage our operations. In addition, our future operating results may be impacted by performance earnouts or contingent payments. Furthermore, acquisitions may require large one-time charges and can result in increased debt or contingent liabilities, adverse tax consequences, additional stock-based compensation expense and the recording and subsequent amortization or impairments of amounts related to certain purchased intangible assets, any of which could negatively impact our future results of operations. We may also record goodwill in connection with an acquisition and incur goodwill impairment charges in the future. In the future, if our acquisitions do not yield expected revenue, we may be required to take charges to our operating results based on this impairment assessment process, which could adversely affect our results of operations.
We may not be able to secure additional financing on favorable terms, or at all, to meet our future capital needs.
In the future, we may require additional capital to respond to business opportunities, challenges, acquisitions or unforeseen circumstances and may determine to engage in equity or debt financings or enter into credit facilities for other reasons. We may not be able to timely secure additional debt or equity financing on favorable terms, or at all. If we raise additional funds through the issuance of equity or convertible debt or other equity-linked securities, our existing stockholders could suffer significant dilution. Any debt financing obtained by us in the future could involve restrictive covenants relating to our capital raising activities and other financial and operational matters, which may make it more difficult for us to obtain additional capital and to pursue business opportunities, including potential acquisitions. If we are unable to obtain adequate financing or financing on terms satisfactory to us, when we require it, our ability to grow or support our business and to respond to business challenges could be significantly limited.
Our success depends on our ability to maintain the value and reputation of our brand.
Our success depends on the value and reputation of our brand, including our primary trademarks “GOPRO” and “HERO”, as well as the GoPro logo and the GoPro "Be a Hero" logo. The GoPro brand is integral to the growth of our business and expansion into new vertical markets. Maintaining, promoting and positioning our brand will largely depend on the success of our marketing and merchandising efforts, our ability to provide consistent, high quality products, and our consumers' satisfaction with the technical support and software updates we provide. Failure to grow and maintain our brand or negative publicity related to our products, our consumers’ user-generated content, the athletes we sponsor, the celebrities we are associated with, or the labor policies of any of our suppliers or manufacturers could adversely impact our brand, business and operating results. Maintaining and enhancing our
16
brand will also require us to make substantial investments, although there is no guarantee that these investments will increase sales of our products or positively impact our operating results.
We rely on third-party suppliers, some of which are sole-source suppliers, to provide components for our products.
Our ability to meet customer demand depends, in part, on our ability to obtain timely and adequate delivery of components for our products. All of the components that go into the manufacturing of our cameras and accessories are sourced from third-party suppliers, and some of these components are provided by a single supplier or by a supplier that could potentially become a competitor.
If we lose access to components from a particular supplier, or experience a significant disruption in the supply of products and components from a current supplier, we may be unable to locate alternative suppliers of comparable quality at an acceptable price, or at all, and our business could be materially and adversely affected. In addition, if we experience a significant increase in demand for our products, our suppliers might not have the capacity or elect to meet our needs as they allocate components to other customers. Identifying a suitable supplier is an involved process that requires us to become satisfied with the supplier’s quality control, responsiveness and service, financial stability and labor and other ethical practices, and if we seek to source materials from new suppliers there can be no assurance that we could do so in a manner that does not disrupt the manufacture and sale of our products. Our reliance on single source, or a small number of, suppliers involves a number of additional risks, including risks related to: supplier capacity constraints; price increases; timely delivery; component quality; failure of a key supplier to remain in business and adjust to market conditions; delays in, or the inability to execute on, a supplier roadmap for components and technologies; and natural disasters, fire, acts of terrorism or other catastrophic events.
In particular, we incorporate video compression and image processing semiconductors from one provider, Ambarella, Inc., into all of our cameras, and we do not currently have an alternative supplier for these key components. If Ambarella stopped supplying components on acceptable terms, or at all, or we experienced delays in receipt of components from Ambarella, we would experience a significant disruption in our ability to produce our products, and our business would be materially and adversely affected.
Any significant disruption of our information systems, and our reliance on Software-as-a-Service (SaaS) technologies from third parties, could adversely affect our business operations and financial results.
We are increasingly dependent on information systems to operate our e-commerce website, process transactions, respond to consumer inquiries, manage our supply chain and inventory, ship goods on a timely basis, maintain cost-efficient operations, and complete timely and accurate financial reporting.
Our information systems and those of third parties we use in our operations are vulnerable to cybersecurity risk, including cyber-attacks such as computer viruses, physical or electronic break-ins and similar disruptions. These systems periodically experience directed attacks intended to lead to interruptions and delays in our operations as well as loss, misuse or theft of data. We have implemented certain systems and processes to restrict unauthorized access and protect our data and systems. To date, unauthorized users have not had a material impact on our systems; however, there can be no assurance that hackers may not be successful in the future. Any material disruption or slowdown of our systems, including a disruption or slowdown caused by our failure to successfully upgrade our systems, system failures, viruses, computer hackers or other causes, could affect our financial systems and operations, and could cause delays in our supply chain or cause information, including data related to customer orders, to be lost or delayed which could result in delays in the delivery of merchandise to our stores and customers or lost sales, especially if the disruption or slowdown occurred during our seasonally strong fourth quarter. Any of these events could reduce demand for our products, impair our ability to complete sales through our e-commerce channels and cause our revenue to decline. If changes in technology cause our information systems to become obsolete, or if our information systems are inadequate to handle our growth, we could lose customers or our business and operating results could be adversely affected.
In particular, we are heavily reliant on SaaS enterprise resource planning systems to conduct our order and inventory management, e-commerce and financial transactions and reporting. In addition, we utilize third-party cloud computing services in connection with our business operations. Problems faced by us or our third-party hosting/cloud computing providers, or content delivery network providers, including technological or business-related disruptions, as well as cybersecurity threats, could adversely impact our business and operating results, our ability to accurately report our
17
financial results, as well as the experience of our consumers, which in turn could adversely affect our business and operating results.
As we expand our operations, we expect to utilize additional systems and service providers that may also be essential to managing our business. Although the systems and services that we require are typically available from a number of providers, it is time consuming and costly to qualify and implement these relationships. Therefore, our ability to manage our business would suffer if one or more of our providers suffer an interruption in their business, or experience delays, disruptions or quality control problems in their operations, or we have to change or add systems and services. We may not be able to control the quality of the systems and services we receive from third-party service providers, which could impair our ability to maintain appropriate internal controls over financial reporting and complete timely and accurate financial reporting, and may impact our business, operating results and financial condition.
Failure to adequately protect business and consumer data could harm our brand and our reputation in the marketplace.
Changing regulations and laws governing the Internet, data privacy, data protection and e-commerce transactions (including taxation, pricing and electronic communications) could impede the growth of our e-commerce business, increase our cost of doing business and limit our ability to collect and use information collected from our users. Further, new regulations limiting our ability to collect, use and disclose consumer data, or imposing additional requirements with respect to the retention and security of consumer data, could limit our marketing activities and could adversely affect our business and financial condition.
In our e-commerce services, we process, store and transmit consumer data. We also collect user data through certain marketing activities. Failure to prevent or mitigate data loss or other security breaches, including breaches of our vendors’ technology and systems, could expose us or our customers and consumers to a risk of loss or misuse of such information, adversely affect our operating results, result in litigation or potential liability for us and otherwise harm our business. Further, we are subject to general business regulations and laws, as well as regulations and laws specifically governing the Internet, e-commerce and electronic devices. Existing and future laws and regulations, or new interpretations of these laws, may adversely affect our ability to conduct our e-commerce business.
We depend on key personnel to grow and operate our business. If we are unable to retain, attract and integrate qualified personnel, our ability to develop and successfully grow our business could be harmed.
We believe that our future success is highly dependent on the contributions of our CEO and our executive officers, as well as our ability to attract and retain highly skilled and experienced research and development, sales and marketing and other personnel in the United States and abroad.
All of our employees, including our executive officers, are free to terminate their employment relationship with us at any time, and their knowledge of our business and industry may be difficult to replace. We recently announced the resignation of our Chief Financial Officer, and while he will be replaced by our existing Vice President of Finance, this change in our executive management team could be disruptive to our operations. In addition, our Senior Vice President of GoPro Entertainment recently resigned from his employment position with us and was appointed to our board of directors. While he has been replaced by a new Vice President of GoPro Entertainment to assume his responsibilities, this change in leadership could be disruptive to our business.
If more of our executive officers or other key employees leave, we may not be able to fully integrate new personnel or replicate the prior working relationships, and our operations could suffer. Furthermore, in the case of Nick Woodman, our founder and CEO, his departure could affect our ability to continue to attract other top executives and potentially negatively impact the view of our brand. Qualified individuals are in high demand, and we may incur significant costs to attract them. While we utilize competitive salary, bonus and long-term incentive packages to recruit new executives, many of the companies with which we compete for experienced personnel also have greater resources than we do. Competition for qualified personnel is particularly intense in the San Francisco Bay Area, where our headquarters are located. Fluctuations in the price of our Class A common stock may make it more difficult or costly to use equity compensation to motivate, incentivize and retain our employees. If we are unable to attract and retain highly skilled personnel, we may not be able to achieve our strategic objectives, and our business, financial condition and operating results could be adversely affected.
18
If we do not effectively maintain and further develop our sales channels, including developing and supporting our retail sales channel and distributors, our business could be harmed.
As a consumer-facing company, we depend upon effective sales channels to reach the consumers who are the ultimate purchasers of our products. In the United States, we primarily sell our products directly through a mix of retail channels, including big box, mid-market and specialty retailers, and we reach certain U.S. markets through distributors. In international markets, we primarily sell through distributors who in turn sell to local retailers; however we also retain some direct sales relationships with certain customers. We depend on retailers to provide adequate and attractive space for our products and POP displays in their stores. We further depend on our retailers to employ, educate and motivate their sales personnel to effectively sell our products. If our retailers do not adequately display our products, choose to promote competitors’ products over ours or do not effectively explain to customers the advantages of our products, our sales could decrease and our business could be harmed. Similarly, our business could be adversely affected if any of our large retail customers were to experience financial difficulties, or change the focus of their businesses in a way that deemphasized the sale of our products. We also continue to invest heavily in providing new retailers with POP displays and expanding the footprint of our POP displays in existing stores, and there can be no assurance that this investment will lead to increased sales
We currently depend on our distributors to reach certain market segments in the United States and to reach many of our international retailers. Our distributors generally offer products from several different manufacturers. Accordingly, we are at risk that these distributors may give higher priority to selling other companies’ products. We have consolidated our distributor channels in certain regions, and if we were to lose the services of a distributor, we might need to find another distributor in that area and there can be no assurance of our ability to do so in a timely manner or on favorable terms. Further, our distributors build inventory in anticipation of future sales, and if such sales do not occur as rapidly as they anticipate, our distributors will decrease the size of their future product orders. We are also subject to the risks of our distributors encountering financial difficulties, which could impede their effectiveness and also expose us to financial risk if they are unable to pay for the products they purchase from us. Additionally, our international distributors buy from us in U.S. dollars and generally sell to retailers in local currency so significant currency fluctuations could impact their profitability, and in turn, affect their ability to buy future products from us.
We have converted portions of our distributors' business into direct sales, and if we were to do this on a larger scale, it could create significant disruptions to our distribution channel and the associated revenue. Any reduction in sales by our current distributors, loss of key distributors or decrease in revenue from our distributors could adversely affect our revenue, operating results and financial condition.
A small number of retailers and distributors account for a substantial portion of our revenue, and if our relationships with any of these retailers or distributors were to be terminated or the level of business with them significantly reduced, our business could be harmed.
Our ten largest customers, measured by the revenue we derive from them, accounted for
52%
, 50% and 51% of our revenue for the years ended December 31, 2015, 2014 and 2013, respectively. One retailer accounted for
14%
, 20% and 17% of our revenue for 2015, 2014 and 2013, respectively. A second retailer accounted for
12%
of our revenue in 2015. The loss of a small number of our large customers, or the reduction in business with one or more of these customers, could have a significant adverse impact on our operating results. While we have agreements with these large customers, these agreements do not require them to purchase any meaningful amount of our products annually.
If we encounter problems with our distribution system, our ability to deliver our products to the market and to meet customer expectations could be harmed.
We rely on third-party distribution facilities for substantially all of our product distribution to distributors and directly to retailers. Our distribution facilities include computer controlled and automated equipment, which means their operations may be vulnerable to computer viruses or other security risks, the proper operation of software and hardware, electronic or power interruptions or other system failures. Further, because substantially all of our products are distributed from only a few locations and by a small number of companies, our operations could be interrupted by labor difficulties, extreme or severe weather conditions, or floods, fires or other natural disasters near our distribution centers, or port shutdowns or other transportation-related interruptions along our distribution routes. Additionally, we use one primary supplier for the third party distribution and if this supplier were to incur financial difficulties, it could adversely affect our business.
19
Our international business operations account for a significant portion of our revenue and are subject to challenges and risks.
Revenue from outside the United States comprised
52%
,
43%
and
49%
of our revenue in the years ended December 31, 2015, 2014 and 2013, respectively, and we expect this portion to continue to be significant in the future. Further, our supply chain partners have operations in countries including China, Brazil, Singapore, Czech Republic, and the Netherlands. We intend to expand our relationships in these countries and may establish additional relationships in other countries as we continue to expand our international operations. Operating in foreign countries requires significant resources and considerable management attention, and we may enter new geographic markets where we have limited or no experience in marketing, selling, and deploying our products. International expansion has required and will continue to require us to invest significant funds and other resources and we cannot be assured our efforts will be successful. International sales and operations may be subject to risks such as:
|
•
|
difficulties in staffing and managing foreign operations;
|
|
•
|
burdens of complying with a wide variety of laws and regulations including product labeling;
|
|
•
|
adverse tax effects and foreign exchange controls making it difficult to repatriate earnings and cash;
|
|
•
|
the impact of foreign currency exchange rates and interest rates;
|
|
•
|
political and economic instability;
|
|
•
|
terrorist activities and natural disasters;
|
|
•
|
trade restrictions;
|
|
•
|
differing employment practices and laws and labor disruptions;
|
|
•
|
the imposition of government controls;
|
|
•
|
lesser degrees of intellectual property protection;
|
|
•
|
tariffs and customs duties and the classifications of our goods by applicable governmental bodies;
|
|
•
|
a legal system subject to undue influence or corruption; and
|
|
•
|
a business culture in which illegal sales practices may be prevalent.
|
The occurrence of any of these risks could negatively affect our international business and consequently our business, operating results and financial condition.
We may be subject to warranty claims that could result in significant direct or indirect costs, or we could experience greater returns from retailers than expected, which could harm our business and operating results.
We generally provide a 12-month warranty on all of our products, except in the European Union, or EU, where we provide a two-year warranty on all of our products. Additionally, we anticipate introducing our drone product in 2016 and we have no historical experience related to warranty claims for this product. The occurrence of any material defects in our products could make us liable for damages and warranty claims in excess of our current reserves. In addition, we could incur significant costs to correct any defects, warranty claims or other problems, including costs related to product recalls. Any negative publicity related to the perceived quality and safety of our products could affect our brand image, decrease retailer, distributor and consumer demand, and adversely affect our operating results and financial condition. Also, while our warranty is limited to repairs and returns, warranty claims may result in litigation, the occurrence of which could adversely affect our business and operating results.
Consumers may be injured while engaging in activities with our products, and we may be exposed to claims, or regulations could be imposed, which could adversely affect our brand, operating results and financial condition.
Consumers use our capture devices, and we anticipate in 2016 our drones, to self-capture their participation in a wide variety of physical activities, including extreme sports, which in many cases carry the risk of significant injury. Consumers may also use our drones for a wide range of flight activity, including aerial data collection, videography,
20
and photography. We may be subject to claims that users have been injured or harmed by or while using our products, including false claims or erroneous reports relating to safety, security or privacy issues, or that personal property has been damaged as a result of use of our drone. Although we maintain insurance to help protect us from the risk of such claims, such insurance may not be sufficient or may not apply to all situations. Similarly, proprietors of establishments at which consumers engage in challenging physical activities could seek to ban the use of our products in their facilities to limit their own liability. In addition, if lawmakers or governmental agencies were to determine that the use of our products increased the risk of injury to all or a subset of our users, they may pass laws or adopt regulations that limit the use of our products or increase our liability associated with the use of our products. Any of these events could adversely affect our brand, operating results and financial condition.
Our intellectual property and proprietary rights may not adequately protect our products, and our business may suffer if it is alleged or determined that our technology, products, or another aspect of our business infringes third party intellectual property or if third parties infringe our rights.
We own patents, trademarks, copyrights, trade secrets, and other intellectual property (collectively “intellectual property”) related to aspects of our products, software, services, and designs. Our commercial success may depend in part on our ability to obtain and maintain these rights in the United States and abroad.
We regularly file patent applications to protect innovations arising from our research, development and design as we deem appropriate. We may fail to apply for patents on important products, services, technologies or designs in a timely fashion, or at all. We may not have intellectual property rights in all countries where unauthorized third party copying or use of our technology occurs and the scope of our intellectual property might be more limited in some countries. Our existing and future patents may not be sufficient to protect our products, services, technologies, or designs and/or may not prevent others from developing competing products, services, technologies, or designs. As a result, we cannot predict the validity and enforceability of our patents and other intellectual property with certainty.
We have registered, and applied to register, certain of our trademarks in several jurisdictions worldwide. In some of those jurisdictions, other filings exist for the same, similar or otherwise related products or services, which could block the registration of our marks. Even if we are able to register our marks, competitors may adopt or file similar marks to ours, register domain names that mimic or incorporate our marks, or otherwise infringe upon our trademark rights. Although we police our trademark rights carefully, there can be no assurance that we are aware of or that we will prevail in all such instances. Any of these negative outcomes could impact the strength, value and effectiveness of our brand, as well as our ability to market our products.
Litigation may be necessary to enforce our intellectual property rights. Initiating infringement proceedings against third parties can be expensive, take significant time, and divert management’s attention from other business concerns. We may not prevail in litigation to enforce our intellectual property against unauthorized use.
Third parties have brought intellectual property infringement claims against us. We expect to continue to receive such intellectual property claims in the future and will defend the Company vigorously against any such existing and future legal proceedings. The occurrence of any of these events may adversely affect our business, financial condition and operating results. For example, patent holding companies and practicing entities, including our competitors, have alleged infringement of patent or other intellectual property infringement. We may not prevail against such allegations. We may seek licenses from third parties where appropriate, but they could refuse to grant us a license or demand commercially unreasonable terms. An adverse ruling in an intellectual property infringement proceedings could force us to suspend or permanently cease the production or sale of products/services, face a temporary or permanent injunction, redesign our products/services, rebrand our products/services, pay significant settlement costs, pay third party license fees or damage awards, or give up our intellectual property.
If we encounter issues with our manufacturers or suppliers, our business, brand, and results of operations could be harmed and we could lose sales.
We do not have internal manufacturing capabilities and for 2015 relied on various contract manufacturers, including Chicony Electronics Co. Ltd., Jabil Circuit Limited, and Sky Light Digital Limited/Sky Light Industrial Limited to manufacture our products. We cannot be certain that we will not experience operational difficulties with our manufacturers, including reductions in the availability of production capacity, errors in complying with product specifications, insufficient quality control, failures to meet production deadlines, increases in manufacturing costs and increased lead times. Additionally, our manufacturers may experience disruptions in their manufacturing
21
operations due to equipment breakdowns, labor strikes or shortages, natural disasters, component or material shortages, cost increases or other similar problems. Further, in order to minimize their inventory risk, our manufacturers might not order components from third-party suppliers with adequate lead time, thereby impacting our ability to meet our demand forecast. Therefore, if we fail to manage our relationship with our manufacturers effectively, or if they experience operational difficulties, our ability to ship products to our retailers and distributors could be impaired and our competitive position and reputation could be harmed.
In the event that we receive shipments of products that fail to comply with our technical specifications or that fail to conform to our quality control standards, and we are not able to obtain replacement products in a timely manner, we risk revenue losses from the inability to sell those products, increased administrative and shipping costs, and lower profitability. Additionally, if defects are not discovered until after consumers purchase our products, they could lose confidence in the technical attributes of our products and our business could be harmed.
We do not control our contract manufacturers or suppliers, including their labor, environmental or other practices. We require our contract manufacturers and suppliers to comply with our formal supplier code of conduct and relevant standards and have ongoing audit programs in place to assess our suppliers' compliance with our requirements. We periodically conduct audits of our contract manufacturers’ and suppliers’ compliance with our code of conduct, applicable laws and good industry practices. However, these audits may not be frequent or thorough enough to detect non-compliance. Deliberate violations of labor, environmental or other laws by our contract manufacturers or suppliers, or a failure of these parties to follow ethical business practices, could lead to negative publicity and harm our reputation or brand.
We continue to invest in the further development of a content management platform and the acquisition and distribution of content for GoPro Entertainment, and we might not be successful in doing so.
We believe that enabling consumers to easily capture, manage, share and enjoy their GoPro content will increase consumer interest in our products, and we continue to invest in improving our software offerings and the further development of our content management platform to assist consumers with these tasks. The development of these software offerings and other tools needed for these purposes requires different skills from our historical core focus of developing capture devices.
We also continue to invest to scale GoPro Entertainment and develop new revenue opportunities by increasing production of GoPro originally produced content while simultaneously increasing the aggregation and redistribution of our consumers’ “best of” UGC and developing the GoPro content management platform. Additionally, we are investing to develop and distribute the GoPro Channel on more partner platforms. We do not have significant experience deriving revenue from the distribution of GoPro content and the execution of this business strategy requires different skills from our historical core focus of developing capture devices.
To achieve our goals, we have continued to hire key personnel who we believe have the requisite skills and experience to manage and execute on these plans. We cannot be assured of our ability to organize, manage and execute these relatively new functions within our business. If we are not successful, we may not achieve our goals of facilitating greater consumer use of their content and scaling GoPro Entertainment, and we might not recover the investments we make in these efforts, which could adversely affect our business.
If we are unable to maintain or acquire rights to include intellectual property owned by others in the content distributed by us, our marketing, sales or future business strategy could be affected or we could be subject to lawsuits relating to our use of this content.
The distribution of GoPro content helps to market our brand and our products. If we cannot continue to acquire rights to distribute UGC or acquire rights to use and distribute music, athlete and celebrity names and likenesses or other content for our original productions or our entertainment distribution channels or for our software products, our marketing efforts could be diminished, our sales could be harmed and our future content strategy could be adversely affected. In addition, third-party content providers may allege that we have violated their intellectual property rights. If we are unable to obtain sufficient rights, successfully defend our use of or otherwise alter our business practices on a timely basis in response to claims of infringement, misappropriation, misuse or other violation of third-party intellectual property rights, our business may be adversely affected. As a distributor of content, we face potential liability for negligence, copyright, or trademark infringement or other claims based on the nature and content of materials that we distribute. If we are found to be liable for infringement, then our business may suffer.
22
Failure to obtain new, and maintain existing, high-quality event, venue, athlete and celebrity sponsorships could harm our business.
Establishing relationships with high profile sporting and entertainment events, venues, sports leagues and sports associations, athletes and celebrity personalities to evaluate, promote and establish product credibility with consumers, including entering into sponsorship and licensing agreements, has and will continue to be a key element of our marketing strategy. However, as competition in our markets has increased, the costs of obtaining and retaining event, venue, athlete and celebrity sponsorships and licensing agreements have increased. Additionally, we may be forced to sign longer term sponsorships in order to retain relationships. If we are unable to maintain our current associations with our event, venue, athlete and celebrity partners, or to do so at a reasonable cost, we could lose the benefits of these relationships, and we may be required to modify and substantially increase our marketing investments. In addition, actions taken by endorsers of our products that harm their reputations could also harm our brand image with consumers. The failure to correctly identify high impact events and venues or build partnerships with those who develop and promote those events and venues, promising athletes or other appealing personalities to use and endorse our products, or poor performance by our endorsers, could adversely affect our brand and result in decreased sales of our products.
We could be adversely affected by violations of the U.S. Foreign Corrupt Practices Act, the U.K. Bribery Act or similar anti-bribery laws in other jurisdictions in which we operate.
The global nature of our business and the significance of our international revenue create various domestic and local regulatory challenges and subject us to risks associated with our international operations. The U.S. Foreign Corrupt Practices Act (FCPA), the U.K. Bribery Act 2010, or the U.K. Bribery Act, and similar anti-bribery and anticorruption laws in other jurisdictions generally prohibit U.S.-based companies and their intermediaries from making improper payments to non-U.S. officials for the purpose of obtaining or retaining business, directing business to another, or securing an advantage. In addition, U.S. public companies are required to maintain records that accurately and fairly represent their transactions and have an adequate system of internal accounting controls. Under the FCPA, U.S. companies may be held liable for the corrupt actions taken by directors, officers, employees, agents, or other strategic or local partners or representatives. As such, if we or our intermediaries fail to comply with the requirements of the FCPA or similar legislation, governmental authorities in the United States and elsewhere could seek to impose substantial civil and/or criminal fines and penalties which could have a material adverse effect on our business, reputation, operating results and financial condition.
We operate in areas of the world that experience corruption by government officials to some degree and, in certain circumstances, compliance with anti-bribery and anticorruption laws may conflict with local customs and practices. Our global operations require us to import and export to and from several countries, which geographically expands our compliance obligations. In addition, changes in such laws could result in increased regulatory requirements and compliance costs which could adversely affect our business, financial condition and results of operations. We cannot be assured that our employees or other agents will not engage in prohibited conduct and render us responsible under the FCPA or the U.K. Bribery Act. If we are found to be in violation of the FCPA, the U.K. Bribery Act or other anti-bribery or anticorruption laws (either due to acts or inadvertence of our employees, or due to the acts or inadvertence of others), we could suffer criminal or civil penalties or other sanctions, which could have a material adverse effect on our business.
We are subject to governmental export and import controls and economic sanctions laws that could subject us to liability and impair our ability to compete in international markets.
The U.S. and various foreign governments have imposed controls, export license requirements and restrictions on the import or export of some technologies. Our products are subject to U.S. export controls, and exports of our products must be made in compliance with various economic and trade sanctions laws. Furthermore, U.S. export control laws and economic sanctions prohibit the provision of products and services to countries, governments, and persons targeted by U.S. sanctions. Even though we take precautions to prevent our products from being provided to targets of U.S. sanctions, our products, including our firmware updates, could be provided to those targets or provided by our customers despite such precautions. Any such provision could have negative consequences, including government investigations, penalties and reputational harm. Our failure to obtain required import or export approval for our products could harm our international and domestic sales and adversely affect our revenue.
23
In 2014, we determined that we may have shipped some products to international customers that, prior to shipment, may have required either a one-time product review or application for an encryption registration number in lieu of such product review. We also determined that we provided controlled technology to our offshore manufacturing partners without the required export licenses. We subsequently acquired the appropriate encryption number and obtained an export license for the export of controlled technology to our offshore manufacturing partners. Additionally, in 2014, we discovered our failure to file an annual self-classification report and comply with record keeping requirements of the Export Administration Regulations of the U.S. Department of Commerce's Bureau of Industry and Security and believe that we have now become compliant with the reporting and recordkeeping requirements. We also identified possible firmware downloads for cameras to persons in embargoed countries. We self-reported these potential violations to the Department of Commerce’s Bureau of Industry and Security and also submitted a related supplemental disclosure and have taken, and continue to take, remedial measures to prevent similar export control violations from occurring in the future. In October 2015, the Department of Commerce notified us that it had completed its investigation of the potential export violations we had reported and issued a cautionary letter, without imposing any penalties or restrictions.
In 2014, we also discovered potential sanctions violations involving transactions with sanctioned parties, the provision of support services to persons in an embargoed country, and firmware updates to persons in several embargoed countries. We have self-reported these potential violations to the U.S. Department of Treasury’s Office of Foreign Assets Control and have also submitted a related supplemental disclosure and have taken and continue to take remedial measures to prevent similar export control violations from occurring in the future. In February 2015, the Treasury Department notified us that it had completed its review of the transactions we had reported and issued a cautionary letter, without imposing any penalties or restrictions.
We could be subject to future enforcement action with respect to compliance with governmental export and import controls and economic sanctions laws that result in penalties, costs, and restrictions on export privileges that could have a material effect on our business and operating results.
Our effective tax rate and the intended tax benefits of our corporate structure and intercompany arrangements depend on the application of the tax laws of various jurisdictions and on how we operate our business.
The application of the tax laws of various jurisdictions, including the United States, to our international business activities is subject to interpretation and depends on operating our business in a manner consistent with our corporate structure and intercompany arrangements. The taxing authorities of the jurisdictions in which we operate may challenge our methods for valuing technology, intercompany arrangements, including our transfer pricing, or our current or historical tax positions, including with respect to research and development tax credits. Any such challenge could be costly and time consuming to defend and may increase our worldwide effective tax rate, and consequently adversely affect our financial position and results of operations.
Our corporate structure includes legal entities located in jurisdictions with income tax rates lower than the U.S. statutory tax rate. Our intercompany arrangements result in income earned by such entities in accordance with arm’s-length principles and commensurate with functions performed, risks assumed and ownership of valuable corporate assets. We believe that income taxed in certain foreign jurisdictions at a lower rate relative to the U.S. statutory rate will have a long-term beneficial impact on our worldwide effective tax rate.
Significant judgment is required in evaluating our tax positions and determining our provision for income taxes. During the ordinary course of business, there are many transactions and calculations for which the ultimate tax determination is uncertain. For example, our effective tax rates could be adversely affected by earnings being lower than anticipated in countries where we have lower statutory rates and higher than anticipated in countries where we have higher statutory rates, by changes in foreign currency exchange rates or by changes in the relevant tax, accounting and other laws, regulations, principles and interpretations. As we operate in numerous taxing jurisdictions, the application of tax laws can be subject to diverging and sometimes conflicting interpretations by tax authorities of these jurisdictions. It is not uncommon for taxing authorities in different countries to have conflicting views, for instance, with respect to, among other things, the manner in which the arm’s-length standard is applied for transfer pricing purposes, or with respect to the valuation of intellectual property. In addition, tax laws are dynamic and subject to change as new laws are passed and new interpretations of the law are issued or applied. In particular, there is uncertainty in relation to the U.S. tax legislation in terms of the future corporate tax rate but also in terms of the U.S. tax consequences of income derived from intellectual property held in foreign jurisdictions.
24
Our existing corporate structure and intercompany arrangements have been implemented in a manner that we believe complies with current tax laws. However, our tax liabilities may be adversely affected if such structure and arrangements are challenged by a taxing authority or we are unable to appropriately adapt the manner in which we operate our business or if the United States or other jurisdictions in which we do business change their tax laws in a manner that adversely impacts our tax liabilities.
If we are unable to maintain effective internal controls in the future, we may not be able to produce timely and accurate financial statements, which could adversely impact our investors’ confidence and our stock price.
Pursuant to Section 404 of the Sarbanes-Oxley Act of 2002, we are required to evaluate and determine the effectiveness of our internal controls over financial reporting, and to include a management report assessing the effectiveness of our internal control over financial reporting. We expect that the requirements of these rules and regulations will continue to increase our legal, accounting and financial compliance costs, making some activities more time consuming and costly, placing significant demands on our financial and operational resources, as well as our IT systems.
While we have determined that our internal control over financial reporting was effective as of December 31, 2015, we must continue to monitor and assess our internal control over financial reporting. Our control environment may not be sufficient to remediate or prevent future material weaknesses or significant deficiencies from occurring. A control system, no matter how well designed and operated, can provide only reasonable assurance that the control system’s objectives will be met. Because of the inherent limitations in all control systems, no evaluation of controls can provide absolute assurance that misstatements due to error or fraud will not occur or that all control issues and all instances of fraud will be detected.
If we identify future material weaknesses in our internal control over financial reporting, if we are unable to continue to comply with the requirements of Section 404 of the Sarbanes-Oxley Act, if we are unable to assert that our internal control over financial reporting are effective, or if our independent registered public accounting firm is unable to express an opinion as to the effectiveness of our internal control over financial reporting, investors may lose confidence in the accuracy and completeness of our financial reports and the market price of our Class A common stock could be negatively affected, and we could become subject to investigations by the stock exchange on which our securities are listed, the SEC or other regulatory authorities.
We use open source software in our platform that may subject our technology to general release or require us to re-engineer our solutions, which may cause harm to our business.
We use open source software in connection with our services. From time to time, companies that incorporate open source software into their products have faced claims challenging the ownership of open source software and/or compliance with open source license terms. Therefore, we could be subject to suits by parties claiming ownership of what we believe to be open source software or noncompliance with open source licensing terms. Some open source software licenses require users who distribute or make available open source software as part of their software to publicly disclose all or part of the source code to such software and/or make available any derivative works of the open source code on unfavorable terms or at no cost. While we monitor our use of open source software and try to ensure that none is used in a manner that would require us to disclose the source code or that would otherwise breach the terms of an open source agreement, such use could nevertheless occur and we may be required to release our proprietary source code, pay damages for breach of contract, re-engineer our applications, discontinue sales in the event re-engineering cannot be accomplished on a timely basis or take other remedial action that may divert resources away from our development efforts, any of which could adversely affect our business, financial condition or operating results.
Any significant disruption to our e-commerce business could result in lost sales.
Online sales through gopro.com are subject to a number of risks. System interruptions or delays could cause potential consumers to fail to purchase our products and could harm our reputation and brand. The operation of our direct to consumer e-commerce business through gopro.com depends on the ability to maintain the efficient and uninterrupted operation of online order-taking and fulfillment operations. Our e-commerce operations subject us to certain risks that could have an adverse effect on our operating results, including risks related to the computer systems that operate our website and related support systems, such as system failures, viruses, computer hackers and similar
25
disruptions. If we or our designated third party contractors are unable to maintain and upgrade our e-commerce website or if we encounter system interruptions or delays, our operating results could be adversely impacted.
If our estimates or judgments relating to our critical accounting policies and estimates prove to be incorrect, our operating results could be adversely affected.
The preparation of financial statements in conformity with GAAP requires management to make estimates and assumptions that affect the amounts reported in the consolidated financial statements and accompanying notes. We base our estimates on historical experience and on various other assumptions that we believe to be reasonable under the circumstances, as provided in this Annual Report on Form 10-K in the section titled “Management’s discussion and analysis of financial condition and results of operations.” The results of these estimates form the basis for making judgments about the carrying values of assets, liabilities and equity, and the amount of revenue and expenses that are not readily apparent from other sources. Our operating results may be adversely affected if our assumptions change or if actual circumstances differ from those in our assumptions, which could cause our operating results to fall below the expectations of securities analysts and investors, resulting in a decline in our stock price. Significant assumptions and estimates used in preparing our consolidated financial statements include those related to revenue recognition, inventory valuation, stock-based compensation expense, warranty reserves, goodwill and acquired intangible assets, and accounting for income taxes including deferred tax assets and liabilities.
If we fail to comply with environmental requirements, our business, financial condition, operating results and reputation could be adversely affected.
We are subject to various environmental laws and regulations including laws governing the hazardous material content of our products and laws relating to the collection of and recycling of electrical and electronic equipment. Examples of these laws and regulations include the EU Restrictions of Hazardous Substances Directive, or the RoHS Directive, and the EU Waste Electrical and Electronic Equipment Directive, or the WEEE Directive, as well as the implementing legislation of the EU member states. Similar laws and regulations have been passed or are pending in China, South Korea, Norway and Japan and may be enacted in other regions, including in the United States, and we are, or may in the future be, subject to these laws and regulations.
The RoHS Directive and the similar laws of other jurisdictions ban the use of certain hazardous materials such as lead, mercury and cadmium in the manufacture of electrical equipment, including our products. Although we have policies and procedures in place requiring our contract manufacturers and major component suppliers to comply with the RoHS Directive requirements, we cannot assure you that our manufacturers and suppliers consistently comply with these requirements. In addition, if there are changes to these or other laws (or their interpretation) or if new similar laws are passed in other jurisdictions, we may be required to re-engineer our products to use components compatible with these regulations. This re-engineering and component substitution could result in additional costs to us or disrupt our operations or logistics.
The WEEE Directive requires electronic goods producers to be responsible for the collection, recycling and treatment of such products. Changes in interpretation of the directive may cause us to incur costs or have additional regulatory requirements to meet in the future in order to comply with this directive, or with any similar laws adopted in other jurisdictions. Our failure to comply with past, present and future similar laws could result in reduced sales of our products, substantial product inventory write-offs, reputational damage, penalties and other sanctions, which could harm our business and financial condition. We also expect that our products will be affected by new environmental laws and regulations on an ongoing basis. To date, our expenditures for environmental compliance have not had a material impact on our results of operations or cash flows and, although we cannot predict the future impact of such laws or regulations, they will likely result in additional costs and may increase penalties associated with violations or require us to change the content of our products or how they are manufactured, which could have a material adverse effect on our business and financial condition.
The SEC’s conflict minerals rule has caused us to incur additional costs, could limit the supply and increase the cost of certain minerals used in manufacturing our products, and could make us less competitive in our target markets.
The SEC’s conflict minerals rule requires disclosure by public companies of the origin, source and chain of custody of specified minerals, known as conflict minerals, that are necessary to the functionality or production of products manufactured or contracted to be manufactured. The rule requires companies to obtain sourcing data from suppliers,
26
engage in supply chain due diligence, and file annually with the SEC a specialized disclosure report on Form SD covering the prior calendar year. The rule could limit our ability to source at competitive prices and to secure sufficient quantities of certain minerals (or derivatives thereof) used in the manufacture of our products, specifically tantalum, tin, gold and tungsten, as the number of suppliers that provide conflict-free minerals may be limited. We have and will continue to incur costs associated with complying with the rule, such as costs related to the determination of the origin, source and chain of custody of the minerals used in our products, the adoption of conflict minerals-related governance policies, processes and controls, and possible changes to products or sources of supply as a result of such activities. Within our supply chain, we may not be able to sufficiently verify the origins of the relevant minerals used in our products through the data collection and due diligence procedures that we implement, which may harm our reputation. Furthermore, we may encounter challenges in satisfying those customers that require that all of the components of our products be certified as conflict-free, and if we cannot satisfy these customers, they may choose a competitor’s products. We continue to investigate the presence of conflict materials within our supply chain.
Catastrophic events or political instability could disrupt and cause harm to our business.
Our headquarters is located in the San Francisco Bay Area of California, an area susceptible to earthquakes. A major earthquake or other natural disaster, fire, act of terrorism or other catastrophic event in California or elsewhere that results in the destruction or disruption of any of our critical business operations or information technology systems could severely affect our ability to conduct normal business operations and, as a result, our future operating results could be harmed. Our key manufacturing, supply and distribution partners have global operations including in China, Singapore and the Netherlands as well as the United States. Political instability or catastrophic events in any of those countries could adversely affect our business in the future, our financial condition and operating results.
Risks related to Ownership of our Class A Common Stock
Our stock price has been and will likely continue to be volatile.
Since shares of our Class A common stock were sold in our IPO in July 2014 at a price of $24.00 per share, our stock price has ranged from
$16.89
to
$98.47
through December 31, 2015. Our stock price may fluctuate in response to a number of events and factors, such as quarterly operating results; changes in our financial projections provided to the public or our failure to meet those projections; the public's reaction to our press releases, other public announcements and filings with the SEC; significant transactions, or new features, products or services by us or our competitors; changes in financial estimates and recommendations by securities analysts; media coverage of our business and financial performance; the operating and stock price performance of, or other developments involving, other companies that investors may deem comparable to us; trends in our industry; any significant change in our management; and general economic conditions.
In addition, the stock market in general, and the market prices for companies in our industry, have experienced volatility that often has been unrelated to operating performance. These broad market and industry fluctuations may adversely affect the price of our stock, regardless of our operating performance. Price volatility over a given period may cause the average price at which we repurchase our own stock to exceed the stock’s price at a given point in time. Volatility in our stock price also impacts the value of our equity compensation, which affects our ability to recruit and retain employees. In addition, some companies that have experienced volatility in the market price of their stock have been subject to securities class action litigation. We have been the target of this type of litigation and may continue to be a target in the future. Securities litigation against us could result in substantial costs and divert our management’s attention from other business concerns, which could harm our business.
If we fail to meet expectations related to future growth, profitability, or other market expectations, our stock price may decline significantly, which could have a material adverse impact on investor confidence and employee retention. A sustained decline in our stock price and market capitalization could lead to impairment charges.
The dual class structure of our common stock has the effect of concentrating voting control with our CEO and other directors and their affiliates.
Our Class B common stock has 10 votes per share, and our Class A common stock has one vote per share. Stockholders who hold shares of Class B common stock hold approximately 78% of the voting power of our outstanding capital stock as of December 31, 2015 with Mr. Woodman, our CEO, holding approximately 77% of the outstanding voting power. Mr. Woodman is able to control all matters submitted to our stockholders, including the election of
27
directors, amendments of our organizational documents and any merger, consolidation, sale of all or substantially all of our assets or other major corporate transaction. This concentrated control could delay, defer, or prevent a change of control, merger, consolidation, or sale of all or substantially all of our assets that our other stockholders support, or conversely this concentrated control could result in the consummation of such a transaction that our other stockholders do not support. This concentrated control could also discourage a potential investor from acquiring our Class A common stock due to the limited voting power of such stock relative to the Class B common stock and might harm the trading price of our Class A common stock.
If securities analysts do not publish research or publish inaccurate or unfavorable research about our business, our stock price and trading volume could decline.
The trading market for our Class A common stock depends in part on the research and reports that securities or industry analysts publish about us or our business. If one or more of the analysts who cover us downgrade our stock or publish inaccurate or unfavorable research about our business, our stock price would likely decline. If one or more of these analysts cease coverage of our company or fail to publish reports on us regularly, demand for our stock could decrease, which might cause our stock price and trading volume to decline.
Delaware law and provisions in our restated certificate of incorporation and amended and restated bylaws could make a merger, tender offer or proxy contest difficult, thereby depressing the trading price of our Class A common stock.
Our status as a Delaware corporation and the anti-takeover provisions of the Delaware General Corporation Law may discourage, delay or prevent a change in control by prohibiting us from engaging in a business combination with an interested stockholder for a period of three years after the person becomes an interested stockholder, even if a change in control would be beneficial to our existing stockholders. In addition, our restated certificate of incorporation and amended and restated bylaws contain provisions that may make the acquisition of our company more difficult without the approval of our board of directors, or otherwise adversely affect the rights of the holders of our Class A and Class B common stock, including the following:
|
•
|
our board of directors is not currently classified, but at such time as all shares of our Class B common stock have been converted into shares of our Class A common stock, our board of directors will be classified into three classes of directors with staggered three-year terms;
|
|
•
|
so long as any shares of our Class B common stock are outstanding, special meetings of our stockholders may be called by the holders of 10% of the outstanding voting power of all then outstanding shares of stock, a majority of our board of directors, the chairman of our board of directors, our chief executive office or our president,
|
|
•
|
when no shares of our Class B common stock are outstanding, only the chairman of our board of directors, our chief executive officer, our president or a majority of our board of directors will be authorized to call a special meeting of stockholders;
|
|
•
|
our stockholders may only take action at a meeting of stockholders and not by written consent;
|
|
•
|
vacancies on our board of directors may be filled only by our board of directors and not by stockholders;
|
|
•
|
directors may be removed from office with or without cause so long as our board of directors is not classified, and thereafter directors may be removed from office only for cause;
|
|
•
|
our restated certificate of incorporation provides for a dual class common stock structure in which holders of our Class B common stock have the ability to control the outcome of matters requiring stockholder approval, even if they own significantly less than a majority of the outstanding shares of our Class A and Class B common stock, including the election of directors and significant corporate transactions, such as a merger or other sale of our company or its assets;
|
|
•
|
our restated certificate of incorporation authorizes undesignated preferred stock, the terms of which may be established, and shares of which may be issued, by our board of directors without stockholder approval and which may contain voting, liquidation, dividend and other rights superior to those of our Class A and Class B common stock; and
|
28
|
•
|
advance notice procedures apply for stockholders to nominate candidates for election as directors or to bring matters before an annual meeting of stockholders.
|
We do not intend to pay dividends in the foreseeable future.
We currently intend to retain any future earnings to finance the operation and expansion of our business, and we do not expect to declare or pay any dividends in the foreseeable future. As a result, you may only receive a return on your investment in our Class A common stock if the trading price of our Class A common stock increases.
None.
As of December 31, 2015, we leased office facilities around the world totaling approximately 475,000 square feet, including approximately 250,000 square feet for our corporate headquarters in San Mateo, California.
All of our properties are currently leased. We believe our existing facilities are adequate to meet our current requirements. If we were to require additional space, we believe we will be able to obtain such space on acceptable, commercially reasonable terms. See Note 10 to the Notes to Consolidated Financial Statements of this Annual Report on Form 10-K for more information about our lease commitments.
On January 13, 2016, a purported shareholder class action lawsuit was filed in the United States District Court for the Northern District of California against the Company and certain of our officers. Similar complaints were filed on January 21, 2016, February 4, 2016 and February 19, 2016. Each of the complaints purports to bring suit on behalf of shareholders who purchased our publicly traded securities between July 21, 2015 and January 13, 2016 for the first three complaints and between November 26, 2014 and January 13, 2016 for the last filed complaint. Each complaint purports to allege that defendants made false and misleading statements about our business, operations and prospects in violation of Sections 10(b) and 20(a) of the Securities Exchange Act of 1934. The complaint seeks unspecified compensatory damages, fees and costs.
On January 25, 2016, a purported shareholder class action lawsuit was filed in the Superior Court of the State of California, County of San Mateo, against the Company, certain of our current and former directors and executive officers and underwriters of our IPO. The complaint purports to bring suit on behalf of shareholders who purchased our stock pursuant or traceable to the Registration Statement and Prospectus issued in connection with our IPO and purports to allege claims under Sections 11, 12(a)(2) and 15 of the Securities Act of 1933. The complaint seeks unspecified damages and other relief.
Due to inherent uncertainties of litigation, we cannot accurately predict the ultimate outcome of these matters. We are unable at this time to determine whether the outcome of the litigation would have a material impact on our results of operations, financial condition or cash flow.
We are currently and in the future may continue to be subject to litigation, claims and assertions incidental to our business, including patent infringement litigation and product liability claims, as well as other litigation of a non-material nature in the ordinary course of business. We believe that the outcome of any existing litigation, either individually or in the aggregate, will not have a material impact on our business, financial condition, results of operations or cash flows.
None.
29
Our Class A common stock is listed on the NASDAQ Global Select Market ("NASDAQ") under the symbol “GPRO”. Our Class B common stock is not listed nor traded on any stock exchange. The following table sets forth the high and low closing sale price per share of our Class A common stock, as reported on the NASDAQ for the periods indicated:
|
2015
|
2014
|
||||||
|
High
|
Low
|
High
|
Low
|
||||
|
First Quarter
|
$66.87
|
$37.95
|
—
|
—
|
|||
|
Second Quarter
(1)
|
$59.41
|
$40.89
|
$41.19
|
$28.65
|
|||
|
Third Quarter
|
$64.74
|
$29.67
|
$96.45
|
$36.10
|
|||
|
Fourth Quarter
|
$30.65
|
$16.89
|
$98.47
|
$53.64
|
|||
(1)
The period reported for the second quarter of 2014 is from June 26, 2014 through June 30, 2014.
Holders
As of January 31, 2016, there were 49 holders of record of our Class A common stock and 67 holders of record of our Class B common stock.
Dividends
We have not declared or paid any cash dividends on our capital stock in the two most recent fiscal years. We do not currently intend to pay any cash dividends on our Class A or Class B common stock in the foreseeable future.
Securities Authorized for Issuance under Equity Compensation Plans
The information required by this item will be included in an amendment to this Annual Report on Form 10-K or incorporated by reference from our Proxy Statement to be filed with the SEC for our 2016 Annual Meeting of Stockholders within 120 days after the end of our fiscal year ended
December 31, 2015
.
Performance Graph
The graph below compares the cumulative total return on our Class A common stock with that of the S&P 500 Index and the S&P 500 Consumer Durables Index. The graph assumes $100 was invested (with reinvestment of all dividends, as applicable) at the close of market on June 26, 2014 in the Class A common stock of GoPro, Inc., the S&P 500 Index and the S&P 500 Consumer Durables Index, and its relative performance is tracked through December 31, 2015. Note that historic stock price performance is not intended to be indicative of future stock price performance.
30
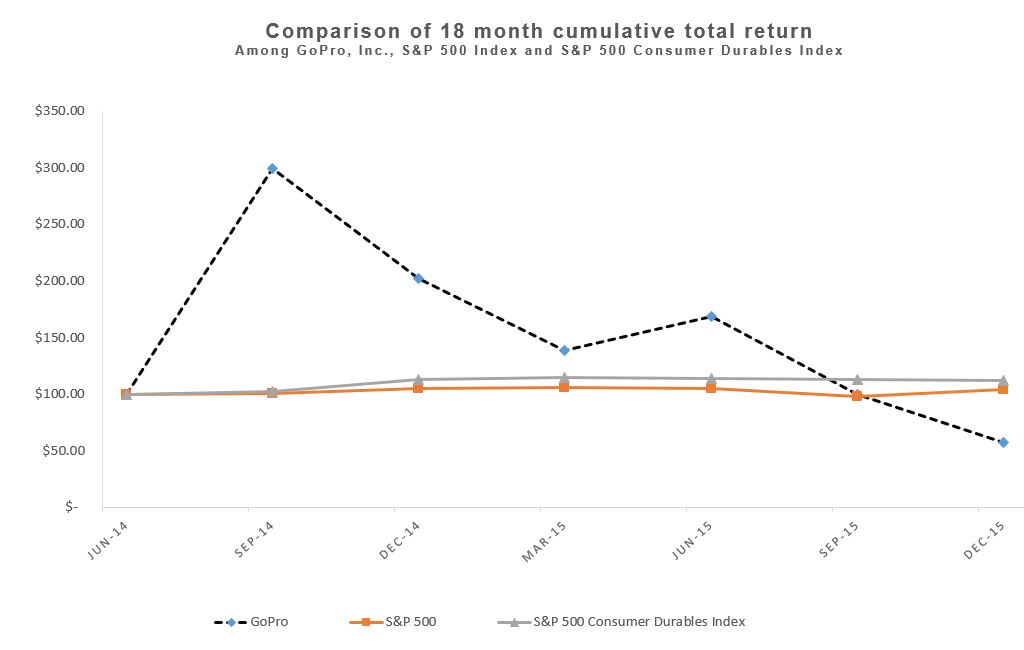
Sales of Unregistered Securities
Not applicable.
Use of Proceeds from Registered Securities
On June 25, 2014, the SEC declared our registration statement on Form S-1 (File No. 333-196083) effective for our IPO. On November 19, 2014, the SEC declared our registration statement on Form S-1 (File No. 333-200038) effective for our follow-on offering. There has been no material change in the planned use of proceeds from our initial public offering or our follow-on offering as described in our final prospectuses filed with the SEC on June 26, 2014 and November 17, 2014, respectively.
Issuer Purchases of Equity Securities
Share repurchase activity for our Class A and Class B common stock during the three months ended December 31, 2015 was as follows (in thousands, except per share amounts):
|
Period
|
Total Number of Shares Repurchased
(1)
|
Average Price Paid per Share
(2)
|
Total Number of Shares Purchased as Part of Publicly Announced Plans
|
Approximate Dollar Value of Shares that May Yet Be Purchased Under the Plans
(1)
|
||||||||||
|
October 1 - 31, 2015
|
—
|
|
$
|
—
|
|
—
|
|
$
|
300,000
|
|
||||
|
November 1 - 30, 2015
|
1,545
|
|
$
|
23.05
|
|
1,545
|
|
$
|
264,387
|
|
||||
|
December 1 - 31, 2015
|
—
|
|
$
|
—
|
|
—
|
|
$
|
264,387
|
|
||||
|
Total
|
1,545
|
|
$
|
23.05
|
|
1,545
|
|
|||||||
(1)
Represents shares repurchased pursuant to the stock repurchase program approved by our board of directors on September 30, 2015, authorizing the Company to repurchase up to $300.0 million of common stock.
(2)
Represents the average price paid per share, exclusive of commissions.
31
You should read the selected consolidated financial data below in conjunction with “Management’s Discussion and Analysis of Financial Condition and Results of Operations” and the consolidated financial statements, related notes and other financial information included elsewhere in this Annual Report on Form 10-K. The consolidated statements of operations data and the balance sheet data for the years ended, and as of, December 31, 2015, 2014, 2013, 2012, and 2011 are derived from our audited consolidated financial statements.
|
(in thousands, except per share amounts)
|
Year ended December 31,
|
||||||||||||||||||
|
Consolidated statements of operations data:
|
2015
|
2014
|
2013
|
2012
|
2011
|
||||||||||||||
|
Revenue
|
$
|
1,619,971
|
|
$
|
1,394,205
|
|
$
|
985,737
|
|
$
|
526,016
|
|
$
|
234,238
|
|
||||
|
Gross profit
|
673,214
|
|
627,235
|
|
361,784
|
|
227,486
|
|
122,555
|
|
|||||||||
|
Gross margin
|
41.6
|
%
|
45.0
|
%
|
36.7
|
%
|
43.2
|
%
|
52.3
|
%
|
|||||||||
|
Operating income
|
54,748
|
|
187,035
|
|
98,703
|
|
53,617
|
|
38,779
|
|
|||||||||
|
Net income
|
36,131
|
|
128,088
|
|
60,578
|
|
32,262
|
|
24,612
|
|
|||||||||
|
Net income per share:
|
|||||||||||||||||||
|
Basic
|
$
|
0.27
|
|
$
|
1.07
|
|
$
|
0.54
|
|
$
|
0.07
|
|
$
|
0.26
|
|
||||
|
Diluted
|
$
|
0.25
|
|
$
|
0.92
|
|
$
|
0.47
|
|
$
|
0.07
|
|
$
|
0.24
|
|
||||
|
Other financial information:
|
|||||||||||||||||||
|
Adjusted EBITDA
(1)
|
$
|
179,309
|
|
$
|
293,380
|
|
$
|
133,726
|
|
$
|
75,288
|
|
$
|
52,873
|
|
||||
|
Non-GAAP net income
(2)
|
$
|
111,564
|
|
$
|
188,913
|
|
$
|
68,826
|
|
-
|
|
-
|
|
||||||
|
Non-GAAP diluted earnings per share
(2)
|
$
|
0.76
|
|
$
|
1.32
|
|
$
|
0.50
|
|
-
|
|
-
|
|
||||||
|
(1)
|
We define adjusted EBITDA as net income (loss) adjusted to exclude the impact of: provision for income taxes, interest income, interest expense, depreciation and amortization, POP display amortization, and stock-based compensation.
|
|
(2)
|
We define non-GAAP net income as net income (loss) adjusted to exclude stock-based compensation, acquisition-related costs, and taxes related to the tax effect of these adjustments. Acquisition-related costs include the amortization of acquired intangible assets, as well as third-party transaction costs for legal and other professional services. Non-GAAP earnings per share considers the conversion of the redeemable convertible preferred stock into shares of common stock as though the conversion had occurred at the beginning of the period and the initial public offering shares issued July 2014 as if they had been outstanding since the beginning of the period.
|
See "Non-GAAP Financial Measures" in Item 7. MD&A below for additional information and a reconciliation of net income to Adjusted EBITDA and net income to non-GAAP net income, and a reconciliation of the shares used in the calculation of non-GAAP diluted earnings per share.
|
As of December 31,
|
|||||||||||||||||||
|
(in thousands)
|
2015
|
2014
|
2013
|
2012
|
2011
|
||||||||||||||
|
Consolidated balance sheet data:
|
|||||||||||||||||||
|
Cash, cash equivalents and marketable securities
|
$
|
474,058
|
|
$
|
422,256
|
|
$
|
101,410
|
|
$
|
36,485
|
|
$
|
29,098
|
|
||||
|
Inventory
|
188,232
|
|
153,026
|
|
111,994
|
|
60,412
|
|
18,649
|
|
|||||||||
|
Working capital
|
538,066
|
|
564,274
|
|
57,446
|
|
69,618
|
|
44,252
|
|
|||||||||
|
Total assets
|
1,102,976
|
|
917,691
|
|
439,671
|
|
246,665
|
|
104,416
|
|
|||||||||
|
Total indebtedness
|
—
|
|
—
|
|
113,612
|
|
129,395
|
|
380
|
|
|||||||||
|
Redeemable convertible preferred stock
|
—
|
|
—
|
|
77,198
|
|
77,138
|
|
91,146
|
|
|||||||||
|
Total stockholders’ equity (deficit)
|
772,033
|
|
641,204
|
|
(5,366)
|
|
(79,741)
|
|
(24,095
|
)
|
|||||||||
32
The following discussion and analysis of our financial condition and results of operations should be read in conjunction with our consolidated financial statements, related notes and other financial information appearing elsewhere in this Annual Report on Form 10-K. In addition to historical consolidated financial information, the following discussion contains forward-looking statements that reflect our plans, estimates and beliefs. Our actual results could differ materially from those discussed in the forward-looking statements as a result of a variety of factors, including but not limited to, those discussed in “Risk Factors” and elsewhere in this Annual Report on Form 10-K. Our MD&A is organized as follows:
|
•
|
Overview
. Discussion of our business and overall analysis of financial and other highlights affecting the company in order to provide context for the remainder of MD&A.
|
|
•
|
Components of Our Results of Operations.
Description of the items contained in each operating revenue and expense caption in the consolidated statements of operations.
|
|
•
|
Results of Operations
. Analysis of our financial results comparing 2015 to 2014 and 2014 to 2013.
|
|
•
|
Liquidity and Capital Resources
. Analysis of changes in our balance sheets and cash flows, and discussion of our financial condition and potential sources of liquidity.
|
|
•
|
Contractual Commitments
. Overview of contractual obligations, including expected payment schedule, off-balance sheet arrangements and indemnifications as of December 31, 2015.
|
|
•
|
Critical Accounting Policies and Estimates
. Accounting estimates that we believe are most important to understanding the assumptions and judgments incorporated in our reported financial results and forecasts.
|
|
•
|
Non-GAAP Financial Measures
. A presentation of results reconciling GAAP to non-GAAP adjusted measures.
|
Overview
GoPro is transforming the way people visually capture and share their lives. We do this by enabling people to capture compelling, immersive photo and video content of themselves participating in their day to day life as well as their favorite activities. Our consumers include some of the world’s most active and passionate people. The volume and quality of their shared GoPro content, coupled with their enthusiasm for our brand, drive awareness and demand for our products. To date, our cameras (capture devices) and mountable and wearable accessories have generated substantially all of our revenue. We sell our products globally through retailers, wholesale distributors, and on our website. As of
December 31, 2015
, our products were sold to customers in more than 100 countries and through more than 40,000 retail outlets.
The following is a summary of measures presented in our consolidated financial statements and key metrics used to evaluate our business, measure our performance, develop financial forecasts, and make strategic decisions.
33
|
Three months ended December 31,
|
Year ended December 31,
|
||||||||||||||||||||
|
(dollars in thousands, except per share amounts)
|
2015
|
2014
|
Change
|
2015
|
2014
|
Change
|
|||||||||||||||
|
Revenue
|
$
|
436,603
|
|
$
|
633,913
|
|
(31
|
)%
|
$
|
1,619,971
|
|
$
|
1,394,205
|
|
16
|
%
|
|||||
|
Gross margin
(1)
|
29.4%
|
47.9%
|
(1,850) bps
|
|
41.6%
|
45.0%
|
(340) bps
|
|
|||||||||||||
|
Operating expenses
|
$
|
169,805
|
|
$
|
130,125
|
|
30
|
%
|
$
|
618,466
|
|
$
|
440,200
|
|
40
|
%
|
|||||
|
Operating income (loss)
|
$
|
(41,294
|
)
|
$
|
173,688
|
|
(124
|
)%
|
$
|
54,748
|
|
$
|
187,035
|
|
(71
|
)%
|
|||||
|
Net income (loss)
|
$
|
(34,451
|
)
|
$
|
122,260
|
|
(128
|
)%
|
$
|
36,131
|
|
$
|
128,088
|
|
(72
|
)%
|
|||||
|
Diluted net income (loss) per share
|
$
|
(0.25
|
)
|
$
|
0.83
|
|
(130
|
)%
|
$
|
0.25
|
|
$
|
0.92
|
|
(73
|
)%
|
|||||
|
Cash flow from operations
|
$
|
20,848
|
|
$
|
43,190
|
|
(52
|
)%
|
$
|
157,611
|
|
$
|
96,922
|
|
63
|
%
|
|||||
|
Key business metrics:
|
|||||||||||||||||||||
|
Units shipped
(2)
|
2,002
|
|
2,385
|
|
(16
|
)%
|
6,584
|
|
5,180
|
|
27
|
%
|
|||||||||
|
Adjusted EBITDA
(3)
|
$
|
(9,268
|
)
|
$
|
202,854
|
|
(105
|
)%
|
$
|
179,309
|
|
$
|
293,380
|
|
(39
|
)%
|
|||||
|
Non-GAAP net income (loss)
(4)
|
$
|
(11,396
|
)
|
$
|
144,898
|
|
(108
|
)%
|
$
|
111,564
|
|
$
|
188,913
|
|
(41
|
)%
|
|||||
|
Non-GAAP diluted earnings (loss) per share
(4)
|
$
|
(0.08
|
)
|
$
|
0.99
|
|
(108
|
)%
|
$
|
0.76
|
|
$
|
1.32
|
|
(42
|
)%
|
|||||
(1)
One basis point (bps) is equal to 1/100th of 1%
(2)
Represents the number of individually packaged capture device units that are shipped during a reporting period, net of any returns. We monitor units shipped on a daily basis as it is a key indicator of revenue trends for a reporting period. We use units shipped to help optimize our fulfillment operations and shipment allocations in order to better maintain operating efficiencies and improve customer satisfaction.
(3)
We define adjusted EBITDA as net income (loss) adjusted to exclude the impact of: provision for income taxes, interest income, interest expense, depreciation and amortization, POP display amortization, and stock-based compensation.
(4)
We define non-GAAP net income as net income (loss) adjusted to exclude stock-based compensation, acquisition-related costs, and taxes related to the tax effect of these adjustments. Acquisition-related costs include the amortization of acquired intangible assets, as well as third-party transaction costs for legal and other professional services. Non-GAAP earnings per share considers the conversion of the redeemable convertible preferred stock into shares of common stock as though the conversion had occurred at the beginning of the period.
Reconciliations of non-GAAP adjusted measures are presented under "Non-GAAP Financial Measures" below.
Fourth quarter 2015 snapshot
For the fourth quarter of 2015, we recorded revenue of
$436.6 million
, down
31%
year-over-year, operating loss of
$41.3 million
, down
124%
year-over-year, and diluted net loss per share of
$0.25
, down
130%
year-over-year. We shipped
2.0 million
capture devices in the fourth quarter of 2015, compared to
2.4 million
in the same period in 2014. Fourth quarter 2015 revenue reflected global retail sell-through trends for our capture devices that were weaker than fourth quarter 2014, as well as price protection related charges of approximately $21 million incurred in connection with the reduction of the HERO4 Session selling price in December. In addition, our stronger fourth quarter revenue in 2014 benefited from the introduction of our HERO4 Black and Silver capture devices just prior to the holiday season, while in 2015 our new product introductions occurred earlier in the year. Gross margin of
29.4%
and operating loss of
$41.3 million
were negatively impacted by lower units shipped year-over-year, the repricing of HERO4 Session, and product realignment charges of approximately $57 million to cost of revenue related to excess purchase commitments, inventory and obsolete tooling assets in connection with our decision to end-of-life our entry level HERO line of capture devices to simplify our product offering.
2015 compared to 2014 highlights
For full year 2015, we achieved revenue of
$1,620 million
, up
16%
year-over-year, operating income of
$54.7 million
, down
71%
year-over-year, and diluted net income per share of
$0.25
, down
73%
year-over-year. We shipped
6.6 million
capture devices in 2015, up
27%
year-over-year, for approximately
20 million
cumulative devices shipped. Our year-over-year revenue growth was enabled by the overall expanded distribution of our products internationally in EMEA and APAC. Sales outside of the United States represented
52%
of our revenue in 2015 compared to
43%
in 2014. Full year revenue also reflected charges of approximately $40 million for price protection and marketing development funds issued in connection with reductions of the HERO4 Session selling price in September and December. Full year gross margin of
41.6%
and operating income were adversely impacted by decreased unit
34
volumes in the latter part of the year, the repricing of HERO4 Session, and the product realignment charges of $57 million described above. A substantial portion of our year-over-year growth in operating expenses was primarily attributable to higher cash-based personnel-related expenses of approximately $65.7 million, resulting from an approximate 60% growth in our global headcount, and higher advertising and promotional activity costs of
$30.8 million
.
We generated cash flows from operating activities of
$157.6 million
for 2015. We ended the year with cash and cash equivalents and marketable securities of
$474.1 million
, up
12%
from a year ago. We purchased
$51.2 million
of property and equipment, up
88%
year-over-year, and completed acquisitions amounting to
$70.2 million
. On September 30, 2015, our board of directors authorized a program to repurchase up to $300 million of our common stock. During the fourth quarter of 2015, we spent
$35.6 million
to repurchase shares of our Class A common stock. The stock repurchase program will expire in September 2016 and is subject to termination or extension at any time.
Looking Ahead to 2016
We currently estimate our full year 2016 revenue to be in the range of $1.35 billion to $1.5 billion. We expect our revenue and gross margin percentage in the first quarter of 2016 to decrease year-over-year compared to the first quarter of 2015. Gross margin will fluctuate in future periods based upon product, distributor, and geographical mix. We expect total operating expenses will grow sequentially throughout the year, with a majority of this growth occurring in research and development, as well as marketing.
In January 2016, we adopted a restructuring plan designed to better align the Company's resources to key growth initiatives and reduced our global workforce by approximately 7%. We estimate that aggregate restructuring expenses of approximately $5 million to $10 million will be incurred in the first quarter of 2016, substantially all of which will be cash-based severance costs. We intend to reinvest savings related to the restructuring into our most important priorities to drive future revenue growth.
On February 25, 2016, we entered into definitive agreements to acquire two privately-held companies whose mobile video editing applications complement our strategy of enabling content managing, editing and sharing across platforms. These applications enable editing solutions ranging from high quality automatically created edits to advanced manual edits for both customers of our capture devices and also smartphone users who may be fans of our brand but have yet to purchase a GoPro product or benefit from a GoPro content-enabling solution. The aggregate purchase price of these acquisitions includes cash consideration of approximately $105 million as well as certain deferred consideration subject to specified future employment conditions. The transactions are expected to close in the first half of 2016 subject to the satisfaction of customary closing conditions.
Factors affecting performance
We believe that our future success will be dependent on many factors, including those further discussed below. While these areas represent opportunities for us, they also represent challenges and risks that we must successfully address in order to continue the growth of our business and improve our results of operations.
Investing in research and development.
We believe that our performance is significantly dependent on the investments we make in research and development and that we must continually develop and introduce innovative new products, enhance existing products and effectively stimulate customer demand for existing and future products. If we fail to innovate and enhance our product offerings, our brand, market position and revenue may be adversely affected. Further, if our research and development efforts are not successful, we will not recover the investments that we make in this aspect of our business.
Investing in sales and marketing.
We intend to continue investing significant resources in our marketing, advertising and brand management efforts. Sales and marketing investments will often occur in advance of any sales benefits from these activities, and it may be difficult for us to determine if we are efficiently allocating our resources in this area.
Leveraging software, services, and entertainment content.
We intend to continue to increase our investment in the development of software and services, as well as entertainment related initiatives. We believe we have significant opportunities to establish new revenue streams from these software, services and entertainment investments. However, we do not have significant experience deriving revenue from the distribution of GoPro content, and we
35
cannot be assured that these ongoing investments, which will occur before any material revenue contribution is received, will result in increased revenue or profitability.
Expanding our total addressable market and growing internationally.
Our long-term growth will depend in part on our continued ability to expand our customer base and our presence in international markets. We intend to broaden our user base to include a more diverse group of consumers by investing to provide both innovative and easy-to-use capture devices as well as intuitive and simple software tools in the future that enable the seamless sharing of content. We plan to increase our presence globally through the active promotion of our brand, the formation of strategic partnerships, the introduction of new products and the growth of our international sales channel.
Seasonality.
Historically, we have experienced the highest levels of revenue in the fourth quarter of the year, coinciding with the holiday shopping season in the United States and Europe. Timely and effective product introductions and forecasting, whether just prior to the holiday season or otherwise, are critical to our operations and financial performance.
Components of Our Results of Operations
Revenue.
Our revenue is primarily comprised of product revenue, net of returns and sales incentives. Product revenue is derived from the sale of our capture devices (cameras) and accessories directly to retailers, as well as through our network of domestic and international distributors, and through gopro.com. We grant limited rights to return product for certain large retailers and distributors. Upon shipment of our product to customers with such rights, we reduce revenue equal to the estimated future returns related to the current period product revenue. Additionally, we offer price protection discounts to certain customers when new capture devices are released. We record price protection discounts, as a reduction to revenue, based on shipments subject to price protection. Discounts recorded are based on an evaluation of inventory held by the customer at the time the price protection offer is extended.
See "Critical Accounting Policies and Estimates" below and Note 2 to the consolidated financial statements for information regarding our revenue recognition policy.
Cost of revenue.
Our cost of revenue primarily consists of product costs, including costs of contract manufacturing for production, third-party logistics and procurement costs, warranty repair costs, tooling equipment depreciation, excess and obsolete inventory write-downs, amortization of acquired developed technology, and certain allocated costs related to manufacturing management, facilities, and personnel-related expenses.
Operating expenses.
We classify our operating expenses into three categories: research and development, sales and marketing and general and administrative.
Research and development
. Our research and development expense consists primarily of personnel-related costs, including salaries, stock-based compensation and employee benefits. Research and development expense also includes consulting and outside professional services costs, materials, depreciation and other supporting overhead expenses associated with the development of our product and service offerings, as well as the amortization of certain acquired intangible assets. All research and development costs are expensed as incurred.
Sales and marketing
. Our sales and marketing expense represents the largest component of our operating expense and consists primarily of advertising and marketing promotions of our products and services and personnel-related costs, as well as POP display expenses and related amortization, sales commissions, trade show and event costs, sponsorship costs, consulting and contractor expenses, and allocated overhead costs.
General and administrative.
Our general and administrative expense consists primarily of personnel-related costs, including salaries, stock-based compensation and employee benefits for our finance, legal, human resources, information technology, and administrative personnel. The expense also includes professional service costs related to accounting, tax, legal services, and allocated facilities, depreciation, and other supporting overhead expenses.
36
Results of Operations
The following table sets forth the components of our consolidated statements of operations for each of the periods presented and each of the periods presented as a percentage of revenue:
|
Year ended December 31,
|
||||||||||||||||||||
|
(dollars in thousands)
|
2015
|
2014
|
2013
|
|||||||||||||||||
|
Dollars
|
% of Revenue
|
Dollars
|
% of Revenue
|
Dollars
|
% of Revenue
|
|||||||||||||||
|
Revenue
|
$
|
1,619,971
|
|
100
|
%
|
$
|
1,394,205
|
|
100
|
%
|
$
|
985,737
|
|
100
|
%
|
|||||
|
Cost of revenue
(1)
|
946,757
|
|
58
|
|
766,970
|
|
55
|
|
623,953
|
|
63
|
|
||||||||
|
Gross profit
|
673,214
|
|
42
|
|
627,235
|
|
45
|
|
361,784
|
|
37
|
|
||||||||
|
Operating expenses:
|
||||||||||||||||||||
|
Research and development
(1)
|
241,694
|
|
15
|
|
151,852
|
|
11
|
|
73,737
|
|
7
|
|
||||||||
|
Sales and marketing
(1)
|
268,939
|
|
17
|
|
194,377
|
|
14
|
|
157,771
|
|
16
|
|
||||||||
|
General and administrative
(1)
|
107,833
|
|
7
|
|
93,971
|
|
7
|
|
31,573
|
|
4
|
|
||||||||
|
Total operating expenses
|
618,466
|
|
38
|
|
440,200
|
|
32
|
|
263,081
|
|
27
|
|
||||||||
|
Operating income
|
54,748
|
|
3
|
|
187,035
|
|
13
|
|
98,703
|
|
10
|
|
||||||||
|
Other expense, net
|
(2,163
|
)
|
—
|
|
(6,060
|
)
|
—
|
|
(7,374
|
)
|
(1
|
)
|
||||||||
|
Income before income taxes
|
52,585
|
|
3
|
|
180,975
|
|
13
|
|
91,329
|
|
9
|
|
||||||||
|
Income tax expense
|
16,454
|
|
1
|
|
52,887
|
|
4
|
|
30,751
|
|
3
|
|
||||||||
|
Net income
|
$
|
36,131
|
|
2
|
%
|
$
|
128,088
|
|
9
|
%
|
$
|
60,578
|
|
6
|
%
|
|||||
|
(1)
Includes stock-based compensation expense as follows:
|
||||||||||||||||||||
|
Cost of revenue
|
$
|
1,492
|
|
$
|
835
|
|
$
|
690
|
|
|||||||||||
|
Research and development
|
18,024
|
|
11,640
|
|
3,003
|
|
||||||||||||||
|
Sales and marketing
|
13,762
|
|
10,428
|
|
5,670
|
|
||||||||||||||
|
General and administrative
|
47,402
|
|
48,496
|
|
1,524
|
|
||||||||||||||
|
Total stock-based compensation expense
|
$
|
80,680
|
|
$
|
71,399
|
|
$
|
10,887
|
|
|||||||||||
Revenue
|
Year ended December 31,
|
2015 vs 2014
|
2014 vs 2013
|
||||||||||||||||
|
(in thousands)
|
2015
|
2014
|
2013
|
% Change
|
% Change
|
|||||||||||||
|
Units shipped
|
6,584
|
|
5,180
|
|
3,849
|
|
27
|
%
|
35
|
%
|
||||||||
|
Americas
|
$
|
868,772
|
|
$
|
890,352
|
|
$
|
557,285
|
|
(2
|
)%
|
60
|
%
|
|||||
|
Percentage of revenue
|
54
|
%
|
64
|
%
|
56
|
%
|
||||||||||||
|
EMEA
|
535,260
|
|
371,197
|
|
322,226
|
|
44
|
%
|
15
|
%
|
||||||||
|
Percentage of revenue
|
33
|
%
|
27
|
%
|
33
|
%
|
||||||||||||
|
APAC
|
215,939
|
|
132,656
|
|
106,226
|
|
63
|
%
|
25
|
%
|
||||||||
|
Percentage of revenue
|
13
|
%
|
9
|
%
|
11
|
%
|
||||||||||||
|
Total revenue
|
$
|
1,619,971
|
|
$
|
1,394,205
|
|
$
|
985,737
|
|
16
|
%
|
41
|
%
|
|||||
2015 Compared to 2014.
The year-over-year growth in revenues and units shipped during 2015 compared to 2014 was primarily driven by the transition from our prior generation products to the HERO4 line of capture devices, including HERO4 Session, and the entry-level HERO capture devices. The year-over-year increase in the EMEA and APAC regions resulted from the continued expansion of our business and distribution networks in international markets. The year-over-year decrease in the Americas region resulted primarily from the launch of new products in
37
2014 just prior to the holiday shopping season, which were initially shipped to this region. The average selling price of units shipped, defined as total revenue divided by unit shipments, decreased approximately 9% in 2015 due primarily to a slight change in product mix toward the entry-level HERO capture devices, as well as increased charges of approximately $73 million for price protection and marketing development funds, of which approximately $40 million related to reductions of the HERO4 Session selling price.
2014 Compared to 2013.
The year-over-year growth in revenues and units shipped during 2014 compared to 2013 was primarily due to increased demand for our HERO3+ capture devices and the release of our HERO4 capture devices in the third quarter of 2014. The average selling price of units shipped increased 5% in 2014 due to a favorable shift in mix to the HERO4 Silver and Black edition capture devices. Our revenue in 2014 also increased, to a lesser extent, as a result of an increase in stand-alone accessory shipments.
Cost of revenue and gross margin
|
Year ended December 31,
|
2015 vs 2014
|
2014 vs 2013
|
|||||||||||||||
|
(dollars in thousands)
|
2015
|
2014
|
2013
|
% Change
|
% Change
|
||||||||||||
|
Cost of revenue
|
$
|
944,304
|
|
$
|
765,247
|
|
$
|
623,321
|
|
23
|
%
|
23
|
%
|
||||
|
Stock-based and acquisition-related costs
|
2,453
|
|
1,723
|
|
632
|
|
42
|
%
|
173
|
%
|
|||||||
|
Total cost of revenue
|
$
|
946,757
|
|
$
|
766,970
|
|
$
|
623,953
|
|
23
|
%
|
23
|
%
|
||||
|
Gross profit
|
$
|
673,214
|
|
$
|
627,235
|
|
$
|
361,784
|
|
7
|
%
|
73
|
%
|
||||
|
Gross margin
|
41.6
|
%
|
45.0
|
%
|
36.7
|
%
|
(340) bps
|
|
830 bps
|
|
|||||||
2015 Compared to 2014.
Gross margin decreased by 340 basis points (bps) compared with 2014. The year-over-year decrease in gross margin was primarily attributable to a 260 bps charge for product realignment costs of approximately $57 million in the fourth quarter of 2015 for excess purchase commitments, inventory and obsolete tooling assets. In addition, gross margin decreased due to a shift in product mix toward lower margin entry-level HERO capture devices partially offset by continued improvements in production and supply chain costs. The year-over-year effect of stock-based compensation and acquisition-related costs on gross margin was insignificant.
2014 Compared to 2013.
Gross margin increased by 830 basis points compared with 2013. The year-over-year increase in gross margin was primarily due to an 11% decrease in the unit costs of our HERO3+ and HERO4 capture devices compared to our HERO3 capture devices, and to a lesser extent, a 5% increase in the average selling price of units shipped due to a favorable shift in mix to our HERO4 Black and Silver capture devices.
Operating expenses
Research and development
|
Year ended December 31,
|
2015 vs 2014
|
2014 vs 2013
|
|||||||||||||||
|
(dollars in thousands)
|
2015
|
2014
|
2013
|
% Change
|
% Change
|
||||||||||||
|
Research and development
|
$
|
220,516
|
|
$
|
140,315
|
|
$
|
70,631
|
|
57
|
%
|
99
|
%
|
||||
|
Stock-based and acquisition-related costs
|
21,178
|
|
11,537
|
|
3,106
|
|
84
|
%
|
271
|
%
|
|||||||
|
Total research and development expenses
|
$
|
241,694
|
|
$
|
151,852
|
|
$
|
73,737
|
|
59
|
%
|
106
|
%
|
||||
|
Percentage of revenue
|
14.9
|
%
|
10.9
|
%
|
7.5
|
%
|
|||||||||||
2015 Compared to 2014.
The year-over-year growth of
$89.8 million
in R&D expense in 2015 compared to 2014 was primarily attributable to higher cash-based personnel-related costs of
$35.8 million
, resulting from a
63%
growth in global headcount from
December 31, 2014
to
December 31, 2015
, as well as increases in consulting and outside professional service costs of
$27.1 million
and increases in materials, depreciation, and other supporting overhead expenses of
$16.4 million
. Stock-based compensation increased
$6.4 million
in 2015 due to higher employee headcount. Acquisition-related costs increased
$3.1 million
from intangible asset amortization associated with acquisitions completed during 2015. The growth in R&D expense in absolute terms, and as a percentage of revenue, was primarily driven by investments to support the development of our next generation capture devices, drone-
38
related products, content-management software solutions, and entertainment related initiatives.
2014 Compared to 2013.
The year-over-year growth of $78.1 million in R&D expense in 2014 compared to 2013 was primarily attributable to higher cash-based personnel-related costs of $31.3 million, resulting from a
66%
increase in headcount from December 31, 2013 to December 31, 2014, as well as increases in consulting and outside professional service costs of $18.0 million and increases in materials, depreciation, and other supporting overhead expenses of $17.5 million. Stock-based compensation increased $8.6 million due to higher employee headcount. Higher expenses in 2014 were primarily driven by investments in the development of our HERO4 and HERO line of capture devices, our software and services platform development, and research and development related to future products.
Sales and marketing
|
Year ended December 31,
|
2015 vs 2014
|
2014 vs 2013
|
|||||||||||||||
|
(dollars in thousands)
|
2015
|
2014
|
2013
|
% Change
|
% Change
|
||||||||||||
|
Sales and marketing
|
$
|
255,045
|
|
$
|
183,807
|
|
$
|
151,959
|
|
39
|
%
|
21
|
%
|
||||
|
Stock-based and acquisition-related costs
|
13,894
|
|
10,570
|
|
5,812
|
|
31
|
%
|
82
|
%
|
|||||||
|
Total sales and marketing expenses
|
$
|
268,939
|
|
$
|
194,377
|
|
$
|
157,771
|
|
38
|
%
|
23
|
%
|
||||
|
Percentage of revenue
|
16.6
|
%
|
13.9
|
%
|
16.0
|
%
|
|
||||||||||
2015 Compared to 2014.
The year-over-year growth of
$74.6 million
in sales and marketing expense in 2015 compared to 2014 was primarily attributable to higher advertising and promotional activity costs of
$30.8 million
associated with expanded corporate branding campaigns initiated in the second half of 2015, as well as increases in cash-based personnel-related costs of
$24.4 million
, resulting from a
67%
growth in global headcount from
December 31, 2014
to
December 31, 2015
, increases in allocated facilities, depreciation and other supporting overhead expenses of
$7.5 million
and increases in consulting and outside professional service costs of
$6.2 million
. Stock-based compensation increased
$3.3 million
in 2015 due to higher employee headcount.
2014 Compared to 2013.
The year-over-year growth of $36.6 million in sales and marketing expense in 2014 compared to 2013 was primarily attributable to higher cash-based personnel-related costs of $16.8 million, resulting from a
45%
increase in headcount from December 31, 2013 to December 31, 2014, as well as increases in facility and information technology support costs of $5.8 million and increases in advertising and promotional activity costs of $2.1 million. Stock-based compensation increased $4.8 million due to higher employee headcount.
General and administrative
|
Year ended December 31,
|
2015 vs 2014
|
2014 vs 2013
|
|||||||||||||||
|
(dollars in thousands)
|
2015
|
2014
|
2013
|
% Change
|
% Change
|
||||||||||||
|
General and administrative
|
$
|
59,308
|
|
$
|
45,475
|
|
$
|
30,049
|
|
30
|
%
|
51
|
%
|
||||
|
Stock-based and acquisition-related costs
|
48,525
|
|
48,496
|
|
1,524
|
|
—
|
%
|
3,082
|
%
|
|||||||
|
Total general and administrative expenses
|
$
|
107,833
|
|
$
|
93,971
|
|
$
|
31,573
|
|
15
|
%
|
198
|
%
|
||||
|
Percentage of revenue
|
6.7
|
%
|
6.7
|
%
|
3.2
|
%
|
|||||||||||
2015 Compared to 2014.
The year-over-year growth of
$13.9 million
in general and administrative expense in 2015 compared to 2014 was primarily attributable to increases in consulting and outside professional service costs of
$5.9 million
, as well as an increase in cash-based personnel-related costs of
$5.5 million
resulting from a
41%
growth in global headcount from
December 31, 2014
to
December 31, 2015
and increases in allocated facilities, depreciation and other supporting overhead expenses of
$2.3 million
. Stock-based compensation expenses decreased $1.1 million in 2015 due to a decrease in expense attributable to CEO RSUs of $9.0 million, partially offset by increases of $7.9 million for long-term incentive awards. (See Note 6 to the Notes to Consolidated Financial Statements of this Annual Report on Form 10-K.) Acquisition-related costs increased
$1.1 million
due to increased acquisition activity in 2015.
39
2014 Compared to 2013.
The year-over-year growth of
$62.4 million
in general and administrative expense in 2014 compared to 2013 was primarily attributable to higher cash-based personnel-related costs of $10.2 million, resulting from a
41%
increase in headcount from December 31, 2013 to December 31, 2014, as well as increases in allocated facilities, depreciation and other supporting overhead expenses of $2.4 million and increases in consulting and outside professional service costs of $1.5 million. Stock-based compensation increased $47.0 million, of which $38.3 million was attributable to the vesting of CEO RSUs and the remainder was due to higher employee headcount. (See Note 6 to the Notes to Consolidated Financial Statements of this Annual Report on Form 10-K.)
Other expense, net
Other expense, net for 2015 of
$2.2 million
decreased $3.9 million from 2014, primarily due to lower interest expense and debt related costs of $4.5 million as a result of our repayment of outstanding debt in 2014, coupled with a $1.3 million increase in interest income associated with higher cash equivalents and marketable securities throughout 2015, partially offset by losses of $1.9 million associated with foreign exchange rate movements and other expenses. There were no material changes to other expense, net in 2014 as compared to 2013.
Provision for income taxes
|
Year ended December 31,
|
2015 vs 2014
|
2014 vs 2013
|
|||||||||||||||
|
(dollars in thousands)
|
2015
|
2014
|
2013
|
% Change
|
% Change
|
||||||||||||
|
Income tax expense
|
$
|
16,454
|
|
$
|
52,887
|
|
$
|
30,751
|
|
(69
|
)%
|
72
|
%
|
||||
|
Effective tax rate
|
31.3
|
%
|
29.2
|
%
|
33.7
|
%
|
|||||||||||
2015 compared to 2014.
Income tax expense for 2015 of
$16.5 million
decreased
$36.4 million
from 2014, primarily due to lower pre-tax income. Our higher effective tax rate for 2015 compared to 2014 was due to higher U.S. taxable income and lower international taxable income, which resulted from incurring a higher proportion of our 2015 operating expenses in foreign jurisdictions. Additionally, our effective tax rate for 2015 was lower than the federal statutory rate of 35% primarily due to benefits from research and development tax credits. (See Note 8 to the Notes to Consolidated Financial Statements of this Annual Report on Form 10-K.)
2014 compared to 2013.
Income tax expense for 2014 was $52.9 million compared to $30.8 million for 2013. Our effective tax rate for 2014 was lower than for 2013 and the federal statutory rate of 35% primarily due to the expansion of our operations into international jurisdictions that have lower overall statutory and withholding rates, and increased benefit from research and development tax credits in federal and state jurisdictions.
40
Quarterly results of operations
The following table sets forth our unaudited quarterly consolidated results of operations for each of the eight quarterly periods ended
December 31, 2015
. These unaudited quarterly results of operations have been prepared on the same basis as our audited consolidated financial statements and, in our opinion, reflect all normal recurring adjustments necessary for the fair statement of the results of operations for these periods. You should read the following tables in conjunction with our consolidated financial statements and the
related
notes included elsewhere in this Annual Report on Form 10-K. The results of operations for any quarter are not necessarily indicative of the results of operations for a full year or any future periods.
|
Three months ended
|
|||||||||||||||||||||||||||||||
|
(in thousands, except per share amounts)
|
Dec. 31, 2015
|
Sept. 30,
2015 |
June 30,
2015
|
March 31,
2015 |
Dec. 31, 2014
|
Sept. 30,
2014 |
June 30,
2014
|
March 31,
2014 |
|||||||||||||||||||||||
|
Consolidated statement of operations data:
|
|||||||||||||||||||||||||||||||
|
Revenue
(2)
|
$
|
436,603
|
|
$
|
400,340
|
|
$
|
419,919
|
|
$
|
363,109
|
|
$
|
633,913
|
|
$
|
279,971
|
|
$
|
244,605
|
|
$
|
235,716
|
|
|||||||
|
Cost of revenue
(1)(3)
|
308,092
|
|
213,710
|
|
225,579
|
|
199,376
|
|
330,100
|
|
155,932
|
|
141,736
|
|
139,202
|
|
|||||||||||||||
|
Gross profit
|
128,511
|
|
186,630
|
|
194,340
|
|
163,733
|
|
303,813
|
|
124,039
|
|
102,869
|
|
96,514
|
|
|||||||||||||||
|
Operating expenses:
|
|||||||||||||||||||||||||||||||
|
Research and development
(1)
|
66,432
|
|
67,372
|
|
58,453
|
|
49,437
|
|
46,074
|
|
42,376
|
|
34,663
|
|
28,739
|
|
|||||||||||||||
|
Sales and marketing
(1)
|
82,649
|
|
66,427
|
|
63,494
|
|
56,369
|
|
61,226
|
|
48,109
|
|
43,701
|
|
41,341
|
|
|||||||||||||||
|
General and administrative
(1)(4)
|
20,724
|
|
25,195
|
|
26,255
|
|
35,659
|
|
22,825
|
|
20,097
|
|
41,171
|
|
9,878
|
|
|||||||||||||||
|
Total operating expenses
|
169,805
|
|
158,994
|
|
148,202
|
|
141,465
|
|
130,125
|
|
110,582
|
|
119,535
|
|
79,958
|
|
|||||||||||||||
|
Operating income (loss)
|
(41,294)
|
|
27,636
|
|
46,138
|
|
22,268
|
|
173,688
|
|
13,457
|
|
(16,666)
|
|
16,556
|
|
|||||||||||||||
|
Other income (expense), net
|
322
|
|
(363
|
)
|
122
|
|
(2,244
|
)
|
(1,115)
|
|
(1,784)
|
|
(1,536)
|
|
(1,625)
|
|
|||||||||||||||
|
Income (loss) before income taxes
|
(40,972)
|
|
27,273
|
|
46,260
|
|
20,024
|
|
172,573
|
|
11,673
|
|
(18,202)
|
|
14,931
|
|
|||||||||||||||
|
Income tax (benefit) expense
|
(6,521
|
)
|
8,474
|
|
11,229
|
|
3,272
|
|
50,313
|
|
(2,947)
|
|
1,639
|
|
3,882
|
|
|||||||||||||||
|
Net income (loss)
|
$
|
(34,451
|
)
|
$
|
18,799
|
|
$
|
35,031
|
|
$
|
16,752
|
|
$
|
122,260
|
|
$
|
14,620
|
|
$
|
(19,841
|
)
|
$
|
11,049
|
|
|||||||
|
Net income (loss) per share attributable to common stockholders:
|
|||||||||||||||||||||||||||||||
|
Basic
|
$
|
(0.25
|
)
|
$
|
0.14
|
|
$
|
0.26
|
|
$
|
0.13
|
|
$
|
0.96
|
|
$
|
0.12
|
|
$
|
(0.24
|
)
|
$
|
0.10
|
|
|||||||
|
Diluted
|
$
|
(0.25
|
)
|
$
|
0.13
|
|
$
|
0.24
|
|
$
|
0.11
|
|
$
|
0.83
|
|
$
|
0.10
|
|
$
|
(0.24
|
)
|
$
|
0.08
|
|
|||||||
|
(1)
Includes stock-based compensation expense as follows:
|
|||||||||||||||||||||||||||||||
|
Cost of revenue
|
$
|
449
|
|
$
|
410
|
|
350
|
|
$
|
283
|
|
$
|
280
|
|
$
|
233
|
|
$
|
154
|
|
$
|
168
|
|
||||||||
|
Research and development
|
5,907
|
|
4,872
|
|
3,710
|
|
3,535
|
|
6,154
|
|
2,428
|
|
1,657
|
|
1,401
|
|
|||||||||||||||
|
Sales and marketing
|
4,248
|
|
3,516
|
|
2,932
|
|
3,066
|
|
4,135
|
|
3,225
|
|
1,654
|
|
1,414
|
|
|||||||||||||||
|
General and administrative
|
7,516
|
|
9,072
|
|
11,197
|
|
19,617
|
|
8,687
|
|
8,027
|
|
30,728
|
|
1,054
|
|
|||||||||||||||
|
Total stock-based compensation expense
|
$
|
18,120
|
|
$
|
17,870
|
|
$
|
18,189
|
|
$
|
26,501
|
|
$
|
19.256
|
|
$
|
13,913
|
|
$
|
34,193
|
|
$
|
4,037
|
|
|||||||
|
(2)
|
Included in revenue for the quarters ended September 30, 2015 and December 31, 2015 was a reduction of approximately $19 million and $21 million, respectively, for price protection and marketing development funds incurred in connection with the reduction of the HERO4 Session selling price.
|
|
(3)
|
Included in cost of revenue for the quarter ended December 31, 2015 was a $57.0 million charge attributable to excess purchase order commitments, inventory and obsolete tooling resulting primarily from our decision to end-of-life our entry-level HERO capture devices.
|
|
(4)
|
Included in general and administrative expense for the quarters ended June 30, 2014 and March 31, 2015 was stock-based compensation cost of $28.9 million and $15.8 million, respectively, attributable to the issuance of 4.5 million RSUs to our CEO in June 2014.
|
41
Liquidity and Capital Resources
The following tables present selected financial information as of
December 31, 2015
and 2014 and during the fiscal years of 2015, 2014 and 2013:
|
(dollars in thousands)
|
December 31,
2015 |
December 31,
2014 |
|||||
|
Cash and cash equivalents
|
$
|
279,672
|
|
$
|
319,929
|
|
|
|
Marketable securities
|
194,386
|
|
102,327
|
|
|||
|
Total cash, cash equivalents and marketable securities
|
$
|
474,058
|
|
$
|
422,256
|
|
|
|
Percentage of total assets
|
43
|
%
|
46
|
%
|
|||
|
Year ended December 31,
|
2015 vs 2014
|
2014 vs 2013
|
|||||||||||||||
|
(in thousands)
|
2015
|
2014
|
2013
|
% Change
|
% Change
|
||||||||||||
|
Net cash provided by operating activities
|
$
|
157,611
|
|
$
|
96,922
|
|
$
|
102,477
|
|
63
|
%
|
(5
|
)%
|
||||
|
Net cash used in investing activities
|
$
|
(211,977
|
)
|
$
|
(133,904
|
)
|
$
|
(21,237
|
)
|
58
|
%
|
531
|
%
|
||||
|
Net cash provided by (used in) financing activities
|
$
|
15,665
|
|
$
|
255,501
|
|
$
|
(16,315
|
)
|
(94
|
%)
|
(1,666
|
)%
|
||||
We believe our existing cash, cash equivalents and marketable securities balances and cash flow from operations will be sufficient to meet our working capital needs, capital expenditures, outstanding commitments, and other liquidity requirements for at least the next 12 months and the foreseeable future.
Our future capital requirements may vary materially from those currently planned and will depend on many factors, including our rate of revenue growth, the timing and extent of spending on research and development efforts and other business initiatives, the expansion of sales and marketing activities, the timing of new product introductions, market acceptance of our products, and overall economic conditions. We have completed acquisitions in the past and we expect to evaluate additional possible acquisitions of, or strategic investments in, businesses, products, and technologies that are complementary to our business, which may require the use of cash. For example, in February 2016, we entered into definitive agreements to acquire two mobile video editing application companies for cash consideration of approximately $105 million to further enhance our future software offerings.
As of
December 31, 2015
,
$64.0 million
of cash was held by our foreign subsidiaries, a substantial portion of which we anticipate using to fund recent acquisitions that are expected to close in the first half of 2016. We do not presently intend to repatriate the remainder of these funds, if any, for use in our domestic operations, but if we were to do so, any such repatriated cash and cash equivalents could be subject to U.S. income taxes.
To the extent that current and anticipated future sources of liquidity are insufficient to fund our future business activities and requirements, we may be required to seek additional equity or debt financing. In the event additional financing is required from outside sources, we may not be able to raise it on terms acceptable to us or at all.
Cash flows from operating activities
Cash provided by operating activities of
$157.6 million
in 2015 was comprised of
$36.1 million
of net income, non-cash adjustments to net income of
$74.3 million
(including stock-based compensation expense of
$80.7 million
), and net cash inflow of
$47.2 million
from operating assets and liabilities. Cash inflow related to operating assets and liabilities consisted of an increase in accounts payable and other liabilities of $
68.5 million
, primarily related to excess purchase commitments, and a decrease of
$38.3 million
in accounts receivable due to lower fourth quarter 2015 revenue. These increases were partially offset by
$35.0 million
of higher inventory and an increase in prepaid expenses and other assets of
$23.3 million
due to higher income tax receivables. The increase in cash provided by operating activities of
$60.7 million
from 2014 to 2015 was primarily due to favorable changes in working capital accounts.
Cash provided by operating activities of $96.9 million in 2014 was comprised of $128.1
million of net income, non-cash adjustments to net income of $2.2
million, partially offset by $33.4 million in cash outflow from operating assets and liabilities. Non-cash expense in 2014 primarily consisted of depreciation and amortization and inventory-related
42
write-offs partially offset by deferred taxes and a net tax benefit from stock-based compensation. Cash outflow related to operating assets and liabilities in 2014 primarily consisted of decreases in cash of $62.3
million due to growth in accounts receivable from increased sales activity towards the end of the last quarter of the year, $45.1 million for inventory built and $30.3 million from increases in prepaid expenses and other assets, partially offset by a $98.4
million increase due to increased accrued liabilities and taxes and a $6.0 million increase in deferred revenue driven by increased sales activity.
Cash flows from investing activities
Our primary investing activities consisted of purchases and sales of marketable securities, business acquisitions, and purchases of property and equipment. Cash used in investing activities was
$212.0 million
during 2015 and resulted from
$220.1 million
for purchases of marketable securities,
$65.4 million
for acquisitions, and
$51.2 million
for net purchases of property and equipment, partially offset by
$124.7 million
for net sales and maturities of marketable securities. The increase in cash outflow in 2015 was primarily due to purchases of marketable securities and business acquisition activity.
Cash used in investing activities of $133.9
million in 2014 increased from cash used for investing activities of $21.2
million in 2013 due primarily to $103.8 million in purchases of marketable securities in 2014, a $9.2
million increase in capital expenditures and $4.0
million in payments related to two business combinations.
Cash flows from financing activities
Our primary financing activities consisted of issuances of securities under our common stock plans and repurchases of our Class A common stock. Cash provided by financing activities was
$15.7 million
in 2015 and resulted primarily from
$22.8 million
in net proceeds received from employee stock option exercises and stock purchases made through our employee stock purchase plan ("ESPP"), as well as
$29.3 million
of excess tax benefit related to stock-based compensation, partially offset by payments of
$35.6 million
from the repurchase of our Class A common stock.
Cash provided by financing activities of $255.5 million in 2014 increased from $16.3 million in 2013 due primarily to $294.0 million of proceeds received from our public offerings of common stock in 2014, after deducting underwriting discounts and commissions but before deducting offering costs, an increase of $76.9 million excess tax benefit related to stock-based compensation and a $7.1 million increase in proceeds from the issuance of stock due to exercises in connection with our equity plans, partially offset by an increase in the repayments of our debt of $68.0 million and payments of deferred offering costs of $4.6 million.
Contractual Commitments
Contractual obligations
The following table summarizes our contractual obligations as of
December 31, 2015
:
|
(in thousands)
|
Total
|
1 year
(fiscal
2016)
|
2-3 years
(fiscal 2017
and 2018)
|
4-5 years
(fiscal 2019
and 2020)
|
More than
5 years (beyond fiscal 2020) |
||||||||||||||
|
Operating leases
(1)
|
$
|
152,237
|
|
$
|
16,597
|
|
$
|
35,365
|
|
$
|
29,753
|
|
$
|
70,522
|
|
||||
|
Sponsorship commitments
(2)
|
19,186
|
|
9,889
|
|
6,577
|
|
2,720
|
|
—
|
|
|||||||||
|
Other contractual commitments
(3)
|
4,574
|
|
3,153
|
|
1,421
|
|
—
|
|
—
|
|
|||||||||
|
Capital equipment purchase commitments
(4)
|
5,086
|
|
5,086
|
|
—
|
|
—
|
|
—
|
|
|||||||||
|
Total contractual cash obligations
|
$
|
181,083
|
|
$
|
34,725
|
|
$
|
43,363
|
|
$
|
32,473
|
|
$
|
70,522
|
|
||||
|
(1)
|
We lease our facilities under long-term operating leases, which expire at various dates through 2027. The lease agreements frequently include leasehold improvement incentives, escalating lease payments, renewal provisions and other provisions which require us to pay taxes, insurance, maintenance costs or defined rent increases.
|
|
(2)
|
We sponsor events, resorts and athletes as part of our marketing efforts. In many cases, we enter into multi-year agreements with event organizers and athletes.
|
|
(3)
|
We purchase software licenses related to our financial and IT systems, which require payments over multiple years.
|
43
|
(4)
|
We enter into contracts to acquire equipment for tooling and molds as part of our manufacturing operations. In addition, we incur purchase commitments related to the manufacturing of our POP displays by third parties.
|
As of December 31, 2015, we recorded accrued liabilities for certain purchase commitments with contract manufacturers for quantities in excess of our future demand forecasts.
Off-balance sheet arrangements
During the periods presented, we did not have any relationships with unconsolidated organizations or financial partnerships, such as structured finance or special purpose entities, which would have been established for the purpose of facilitating off-balance sheet arrangements or other contractually narrow or limited purposes.
Indemnifications
We have entered into indemnification agreements with our directors and executive officers which require us to indemnify our directors and executive officers against liabilities that may arise by reason of their status or service. In addition, in the normal course of business, we enter into agreements that contain a variety of representations and warranties and provide for general indemnification. It is not possible to determine the maximum potential amount under these indemnification agreements due to our limited history with prior indemnification claims and the unique facts and circumstances involved in each particular agreement. To date, the payments we have made under these agreements have not had a material effect on our operating results, financial position or cash flows. However, we may record charges in the future as a result of these indemnification agreements.
Critical Accounting Policies and Estimates
We prepare our consolidated financial statements in accordance with GAAP. The preparation of these consolidated financial statements requires us to make estimates, assumptions and judgments that can significantly impact the amounts we report as assets, liabilities, revenue, costs and expenses and the related disclosures. Note 2 to the Notes to Consolidated Financial Statements of this Annual Report on Form 10-K describes the significant accounting policies and methods used in the preparation of the consolidated financial statements. We base our estimates on historical experience and other assumptions that we believe are reasonable under the circumstances. Our actual results could differ significantly from these estimates under different assumptions and conditions. We believe that the accounting policies discussed below are critical to understanding our historical and future performance as these policies involve a greater degree of judgment and complexity. Our senior management has reviewed these critical accounting policies and related disclosures with the Audit Committee of our board of directors.
Revenue recognition
Revenue is primarily derived from the sale of our capture devices and the related implied post contract support, or PCS. We recognize revenue when all of the following criteria have been met:
|
•
|
Persuasive evidence of an arrangement exists
. Contracts or sales orders from our distributors, resellers or online customers are generally used to determine the existence of an arrangement.
|
|
•
|
Delivery has occurred
. We consider delivery to have occurred once title and risk of loss has been transferred. Shipping documents and customer acceptance, when applicable, are used to verify delivery.
|
|
•
|
The sales price is fixed or determinable
. We assess whether the sales price is fixed or determinable based on the payment terms associated with the transaction and whether the sales price is subject to refund or adjustment.
|
|
•
|
Collectability is reasonably assured
. We assess collectability based primarily on the creditworthiness of the customer as determined by credit analysis, the customer’s payment history, and other relevant factors.
|
For most of our revenue, these criteria are met at the time the product is shipped. Our standard terms and conditions of sale for non-web based sales do not allow for product returns other than under warranty. However, we grant limited rights to return product for certain large retailers and distributors. Estimates of expected future product returns are recognized at the time of sale based on analyses of historical return trends by customer class. Upon recognition, we reduce revenue and cost of sales for the estimated returns. Return trends are influenced by product life cycles, new product introductions, market acceptance of products, product sell-through, the type of customer, seasonality, and other factors. Return rates can fluctuate over time, but are sufficiently predictable to allow us to estimate expected
44
future product returns. Actual returns in any future period could differ from our estimates, which could impact the revenue that we report.
Our products include multiple element arrangements that generally include the following two separate units of accounting: 1) the hardware component (camera and accessories) and the embedded firmware essential to the functionality of the camera delivered at the time of sale, and 2) the implied right for the customer to receive PCS. Judgment is required to properly identify the accounting units of multiple element arrangements and to determine the manner in which revenue should be allocated among the units. We believe that our best estimate of the selling price, or BESP, is the most appropriate methodology to determine the allocation of revenue. BESP reflects our best estimates of what the selling prices of elements would be if they were sold regularly on a stand-alone basis. Our process for determining BESP considers multiple factors that may vary over time depending upon the unique facts and circumstances related to each deliverable, including: the level of support provided to customers, estimated costs to provide our support, the amount of time and cost that is allocated to our efforts to develop the undelivered elements, and market trends in the pricing for similar offerings. While changes in the allocation of the estimated sales price between the units of accounting will not affect the amount of total revenue recognized for a particular sales arrangement, any material changes in these allocations could impact the timing of revenue recognition, which could have a material effect on our financial condition and results of operations.
In addition, we provide our customers with sales incentives including cooperative advertising and marketing development funds. Additionally, we have historically provided certain distributors and retailers price protection benefits for inventory on hand when we have reduced the recommended retail price of our products to the end customer. We record reductions to revenue for estimated commitments related to sales incentives when the related revenue is recognized or when a relevant event subsequently occurs. See Note 2 to the Notes to Consolidated Financial Statements of this Annual Report on Form 10-K.
Inventory valuation and liability for purchase commitments
Inventory consists of finished goods and component parts and is stated at the lower of cost or market on a first-in, first-out basis. Our inventory balances were
$188.2 million
and
$153.0 million
as of December 31, 2015 and 2014, respectively. Our assessment of market value requires the use of estimates regarding the net realizable value of our inventory balances, including an assessment of excess or obsolete inventory. We determine excess and obsolete inventory based on multiple factors, including an estimate of the future demand for our products within a specified time horizon, generally 12 months, product life cycle status, product development plans and current sales levels. We also record a liability for noncancelable purchase commitments with contract manufacturers for quantities in excess of our future demand forecasts consistent with the valuation of our excess and obsolete inventory. The estimates used for future demand are also used for near-term capacity planning and inventory purchases and are consistent with our revenue forecast assumptions. If our demand forecast is greater than the actual demand, the amount of our loss will be impacted by our contractual ability to reduce inventory purchases from our contract manufacturers. Our assumptions of future demand for our products are inherently uncertain, and if there were to be an abrupt and substantial decline in demand for one or more of our products or a change in our product development plans, we may be required to increase our inventory write-downs and our liability for purchase commitments that would adversely affect our results of operations in the period when such write-downs and/or excess commitments are recorded.
Warranty
We generally provide 12-month warranty coverage on all of our products except in the EU where we provide a two-year warranty. Our warranty provides for repair or replacement of the associated products during the warranty period. We establish a liability for estimated product warranty costs at the time product revenue is recognized. The warranty obligation is affected by product failure rates and the related use of materials, labor costs and freight incurred in correcting any product failure. Should actual product failure rates, use of materials or other costs differ from our estimates, additional warranty liabilities could be required, which could materially affect our results of operations.
Income taxes
We are subject to income taxes in the United States and multiple foreign jurisdictions. Our effective tax rates differ from the U.S. federal statutory rate, primarily due to the tax impact of state taxes, income earned in our foreign operations which are taxed at different rates than the U.S. federal statutory rate, R&D tax credits and nondeductible
45
stock-based compensation. Our effective tax rate was
31.3%
,
29.2%
and
33.7%
in 2015, 2014 and 2013, respectively. The calculation of our current provision for income taxes involves the use of estimates, assumptions and judgments while taking into account current tax laws, our interpretation of current tax laws and possible outcomes of future tax audits. We review our tax positions quarterly and adjust the balances as new information becomes available. Our income tax rate is materially affected by the tax rates that apply to our foreign earnings. As of December 31, 2015,
$129.1 million
of earnings had been indefinitely reinvested outside the U.S., primarily in active non-U.S. business operations. We do not intend to repatriate these earnings to fund U.S. operations and, accordingly, we do not provide for U.S. federal income and foreign withholding tax on these earnings.
Deferred tax assets.
Deferred tax assets arise because of temporary differences between the financial reporting and tax bases of assets and liabilities, as well as from net operating loss and tax credit carryforwards. We evaluate the recoverability of these future tax deductions and credits by assessing the adequacy of future expected taxable income from all sources, including reversal of taxable temporary differences, forecast operating earnings and available tax planning strategies. As of December 31, 2015, we had a valuation allowance on state tax credit carryforwards based on our assessment that it is more likely than not that the deferred tax asset will not be realized.
Uncertain tax positions.
We recognize tax benefits from uncertain tax positions only if it is more likely than not that the tax position will be sustained on examination by the taxing authorities, based on the technical merits of the position. We file annual income tax returns in multiple taxing jurisdictions around the world and a number of years may elapse before an uncertain tax position is audited by the relevant tax authorities and finally resolved. We have established reserves to address potential exposures related to tax positions that could be challenged by tax authorities. While it is often difficult to predict the final outcome or the timing of resolution of any particular uncertain tax position, we believe that our reserves reflect the most likely outcome.
Our future effective tax rates could be adversely affected by earnings being lower than anticipated in countries where we have lower statutory rates and higher than anticipated in countries where we have higher statutory rates, by changes in the valuation of our deferred tax assets or liabilities, outcomes resulting from income tax examinations, or by changes or interpretations in tax laws, regulations or accounting principles.
Goodwill and acquired intangible assets
When we acquire a business, we allocate the purchase price to the net tangible and identifiable intangible assets, with the residual of the purchase price recorded as goodwill. The determination of the fair value of the intangible assets acquired involves significant judgments and estimates. These judgments can include, but are not limited to, the cash flows that an asset is expected to generate in the future, technology obsolescence, and the appropriate weighted average cost of capital. Our estimate of the fair value of certain assets may differ materially from that determined by others who use different assumptions or utilize different business models.
We perform an annual assessment of our goodwill during the fourth quarter to determine if any events or circumstances exist, such as an adverse change in business climate or a decline in the overall industry demand, that would indicate that it is more likely than not that the fair value of our single reporting unit would be reduced below its carrying amount. If further testing is deemed necessary, we perform a two-step process. The first step involves comparing the fair value of our reporting unit to its carrying value. The second step, if necessary, measures the amount of impairment, if any, by comparing the carrying value of the goodwill to its implied fair value. As of December 31, 2015, we determined that no impairment of the carrying value of goodwill was required. See Note 4 to the Notes to Consolidated Financial Statements of this Annual Report on Form 10-K.
Stock-based compensation
We measure and recognize stock-based compensation based on the fair value measurement for all stock-based awards granted to employees and directors over the service period for awards expected to vest. See Note 6 to the Notes to Consolidated Financial Statements of this Annual Report on Form 10-K.
Determining the fair value of stock-based awards at the grant date requires judgment. The fair value of a restricted stock unit is equivalent to the market price of our common stock on the measurement date. The accounting grant date for employee restricted stock units with performance and market obligations is the date on which the performance and market goals have been defined and a mutual understanding of the terms has been reached. We use the Black-Scholes option-pricing model to determine the fair value of stock options, employee stock purchase plan options,
46
and restricted stock held by nonemployees. The determination of the grant date fair value of options using an option-pricing model is affected by our common stock fair value as well as assumptions regarding a number of other complex and subjective variables, which are estimated as follows:
|
•
|
Fair Value of our Common Stock. Because our stock was not publicly traded prior to our IPO, the fair value of our common stock underlying our stock options was determined by our board of directors, which intended all options granted to be exercisable at a price per share not less than the per share fair value of our common stock underlying those options on the date of grant. Upon completion of our IPO in July 2014, our Class A common stock was valued by reference to its publicly traded price.
|
|
•
|
Expected Term. Since we have undergone significant operational and structural changes, our historical exercise data do not provide a reasonable basis upon which to estimate expected term. As a result, we used the simplified method allowed under SEC guidance.
|
|
•
|
Volatility. As we do not have a significant trading history for our common stock, the expected stock price volatility for our common stock was estimated by taking the average historic price volatility for industry peers based on daily price observations over a period equivalent to the expected term.
|
|
•
|
Risk-Free Rate. The risk-free interest rate is based on the yields of U.S. Treasury securities with maturities similar to the expected term.
|
|
•
|
Dividend Yield. Our expected dividend yield is zero as we do not anticipate paying any recurring cash dividends in the foreseeable future.
|
The estimation of awards that will ultimately vest requires judgment, and to the extent actual results or updated estimates differ from our current estimates, such amounts will be recorded as a cumulative adjustment in the period estimates are revised.
Recent accounting pronouncements
Refer to “Recent Accounting Pronouncements” in Note 2 to Consolidated Financial Statements included in Part II, Item 8 of this Annual Report on Form 10-K.
Non-GAAP Financial Measures
In addition to the measures presented in our consolidated financial statements, we use the following non-GAAP financial metrics to evaluate our business, measure our performance, develop financial forecasts, and make strategic decisions.
Adjusted EBITDA
The following table presents a reconciliation of net income to adjusted EBITDA:
|
Three months ended December 31,
|
Year ended December 31,
|
||||||||||||||||||||||||||
|
(in thousands)
|
2015
|
2014
|
2015
|
2014
|
2013
|
2012
|
2011
|
||||||||||||||||||||
|
Net income (loss)
|
$
|
(34,451
|
)
|
$
|
122,260
|
|
$
|
36,131
|
|
$
|
128,088
|
|
$
|
60,578
|
|
$
|
32,262
|
|
$
|
24,612
|
|
||||||
|
Income tax expense (benefit)
|
(6,521
|
)
|
50,313
|
|
16,454
|
|
52,887
|
|
30,751
|
|
20,948
|
|
14,179
|
|
|||||||||||||
|
Interest (income) expense, net
|
(126
|
)
|
1,029
|
|
234
|
|
5,038
|
|
6,018
|
|
346
|
|
(12
|
)
|
|||||||||||||
|
Depreciation and amortization
|
9,596
|
|
5,176
|
|
28,981
|
|
17,945
|
|
12,034
|
|
3,975
|
|
1,517
|
|
|||||||||||||
|
POP display amortization
|
4,114
|
|
4,820
|
|
16,829
|
|
18,023
|
|
13,458
|
|
8,601
|
|
3,602
|
|
|||||||||||||
|
Stock-based compensation
|
18,120
|
|
19,256
|
|
80,680
|
|
71,399
|
|
10,887
|
|
9,156
|
|
8,975
|
|
|||||||||||||
|
Adjusted EBITDA
|
$
|
(9,268
|
)
|
$
|
202,854
|
|
$
|
179,309
|
|
$
|
293,380
|
|
$
|
133,726
|
|
$
|
75,288
|
|
$
|
52,873
|
|
||||||
Non-GAAP Net Income (Loss) and Earnings Per Share
The following table presents a reconciliation of net income to non-GAAP net income:
47
|
Three months ended
December 31, |
Year ended December 31,
|
||||||||||||||||||
|
(in thousands)
|
2015
|
2014
|
2015
|
2014
|
2013
|
||||||||||||||
|
Net income (loss)
|
$
|
(34,451
|
)
|
$
|
122,260
|
|
$
|
36,131
|
|
$
|
128,088
|
|
$
|
60,578
|
|
||||
|
Stock-based compensation
|
18,120
|
|
19,256
|
|
80,680
|
|
71,399
|
|
10,887
|
|
|||||||||
|
Acquisition-related costs
|
1,545
|
|
297
|
|
5,370
|
|
1,133
|
|
1,106
|
|
|||||||||
|
Income tax adjustments
|
3,390
|
|
3,085
|
|
(10,617
|
)
|
(11,707
|
)
|
(3,745
|
)
|
|||||||||
|
Non-GAAP net income (loss)
|
$
|
(11,396
|
)
|
$
|
144,898
|
|
$
|
111,564
|
|
$
|
188,913
|
|
$
|
68,826
|
|
||||
The following table presents a reconciliation of the shares used in the calculation of non-GAAP diluted earnings per share:
|
Three months ended
December 31, |
Year ended December 31,
|
||||||||||||||||||
|
(in thousands)
|
2015
|
2014
|
2015
|
2014
|
2013
|
||||||||||||||
|
GAAP shares for diluted net income (loss) per share
|
137,086
|
|
146,723
|
|
146,486
|
|
123,630
|
|
98,941
|
|
|||||||||
|
Add: preferred shares conversion
|
—
|
|
—
|
|
—
|
|
15,136
|
|
30,523
|
|
|||||||||
|
Add: initial public offering shares
|
—
|
|
—
|
|
—
|
|
4,414
|
|
8,900
|
|
|||||||||
|
Non-GAAP shares for diluted net income (loss) per share
|
137,086
|
|
146,723
|
|
146,486
|
|
143,180
|
|
138,364
|
|
|||||||||
|
Non-GAAP diluted net income (loss) per share
|
$
|
(0.08
|
)
|
$
|
0.99
|
|
$
|
0.76
|
|
$
|
1.32
|
|
$
|
0.50
|
|
||||
We use the non-GAAP financial measures of adjusted EBITDA, non-GAAP net income, and non-GAAP earnings per share to help us understand and evaluate our core operating performance and trends, to prepare and approve our annual budget, and to develop short-term and long-term operational plans. We believe that these measures provide useful information to investors and others in understanding and evaluating our operating results in the same manner as our management and board of directors.
These non-GAAP financial measures should not be considered in isolation from, or as an alternative to, measures prepared in accordance with GAAP, and are not based on any comprehensive set of accounting rules or principles. These non-GAAP financial measures have limitations in that they do not reflect all of the amounts associated with our results of operations as determined in accordance with GAAP. Some of these limitations are:
|
•
|
These non-GAAP financial measures exclude certain recurring, non-cash charges such as stock-based compensation and amortization of acquired intangible assets;
|
|
•
|
adjusted EBITDA does not does not reflect tax payments that reduce cash available to us
;
|
|
•
|
adjusted EBITDA excludes depreciation and amortization and, although these are non-cash charges, the assets, including POP displays, being depreciated and amortized often will have to be replaced in the future, and adjusted EBITDA does not reflect any cash requirements for such replacements; and
|
|
•
|
other companies may calculate these non-GAAP financial measures differently than we do, limiting their usefulness as comparative measures.
|
Because of these limitations, you should consider adjusted EBITDA, non-GAAP net income, and non-GAAP diluted earnings per share alongside other financial performance measures, including our financial results presented in accordance with GAAP.
We are exposed to market risks in the ordinary course of our business. These risks primarily include foreign currency and interest rate risks as follows:
48
Foreign currency risk
To date, a substantial majority of our product sales and inventory purchases have been denominated in U.S. dollars. We therefore have had insignificant foreign currency risk associated with these two activities. The functional currency of all of our entities is the U.S. dollar. Our operations outside of the United States incur a majority of their operating expenses in foreign currencies, principally the Euro and the Hong Kong Dollar. Our results of operations and cash flows are, therefore, subject to fluctuations due to changes in foreign currency exchange rates. However, we believe that the exposure to foreign currency fluctuation from operating expenses is immaterial at this time as the related costs do not constitute a significant portion of our total expenses. As we grow our operations, or if foreign currency held in our U.S. dollar functional currency entities increases, our exposure to foreign currency risk could become more significant. To date, we have not entered into any material foreign currency exchange contracts. For assets and liabilities denominated in other currencies, we do not believe that the effects of a 10% shift in exchange rates between those currencies and the U.S. dollar would have a material effect on our results of operations from such a shift.
Interest rate risk
Our exposure to market risk for changes in interest rates primarily relates to our cash and cash equivalents and marketable securities. Our cash equivalents and marketable securities are comprised primarily of money market funds, U.S. treasury securities, U.S. agency securities, commercial paper and corporate debt securities.
The primary objectives of our investment activities are to preserve principal and provide liquidity without significantly increasing risk. Our cash and cash equivalents are held for working capital purposes. We do not enter into investments for trading or speculative purposes. Due to the relatively short-term nature of our investment portfolio, we do not believe that an immediate 10% increase in interest rates would have a material effect on the fair value of our investment portfolio.
49
GoPro, Inc.
Index to consolidated financial statements
|
Page(s)
|
|
The supplementary financial information required by this Item 8, is included in Part II, Item 7 under the caption "Quarterly Results of Operations," which is incorporated herein by reference.
50
Report of Independent Registered Public Accounting Firm
To the Board of Directors and Stockholders of GoPro, Inc.
In our opinion, the accompanying consolidated balance sheets and the related consolidated statements of operations, of redeemable convertible preferred stock and stockholders’ equity (deficit) and of cash flows present fairly, in all material respects, the financial position of GoPro, Inc. and its subsidiaries at December 31, 2015 and December 31, 2014, and the results of their operations and their cash flows for each of the three years in the period ended December 31, 2015 in conformity with accounting principles generally accepted in the United States of America. Also in our opinion, the Company maintained, in all material respects, effective internal control over financial reporting as of December 31, 2015, based on criteria established in
Internal Control - Integrated Framework
(2013) issued by the Committee of Sponsoring Organizations of the Treadway Commission (COSO). The Company's management is responsible for these financial statements, for maintaining effective internal control over financial reporting and for its assessment of the effectiveness of internal control over financial reporting, included in Management's Report on Internal Control Over Financial Reporting appearing under Item 9A. Our responsibility is to express opinions on these financial statements and on the Company's internal control over financial reporting based on our audits (which was an integrated audit in 2015). We conducted our audits in accordance with the standards of the Public Company Accounting Oversight Board (United States). Those standards require that we plan and perform the audits to obtain reasonable assurance about whether the financial statements are free of material misstatement and whether effective internal control over financial reporting was maintained in all material respects. Our audits of the financial statements included examining, on a test basis, evidence supporting the amounts and disclosures in the financial statements, assessing the accounting principles used and significant estimates made by management, and evaluating the overall financial statement presentation. Our audit of internal control over financial reporting included obtaining an understanding of internal control over financial reporting, assessing the risk that a material weakness exists, and testing and evaluating the design and operating effectiveness of internal control based on the assessed risk. Our audits also included performing such other procedures as we considered necessary in the circumstances. We believe that our audits provide a reasonable basis for our opinions.
As discussed in Note 2 to the financial statements, the Company changed the manner in which it accounts for deferred taxes in 2015.
A company’s internal control over financial reporting is a process designed to provide reasonable assurance regarding the reliability of financial reporting and the preparation of financial statements for external purposes in accordance with generally accepted accounting principles. A company’s internal control over financial reporting includes those policies and procedures that (i) pertain to the maintenance of records that, in reasonable detail, accurately and fairly reflect the transactions and dispositions of the assets of the company; (ii) provide reasonable assurance that transactions are recorded as necessary to permit preparation of financial statements in accordance with generally accepted accounting principles, and that receipts and expenditures of the company are being made only in accordance with authorizations of management and directors of the company; and (iii) provide reasonable assurance regarding prevention or timely detection of unauthorized acquisition, use, or disposition of the company’s assets that could have a material effect on the financial statements.
Because of its inherent limitations, internal control over financial reporting may not prevent or detect misstatements. Also, projections of any evaluation of effectiveness to future periods are subject to the risk that controls may become inadequate because of changes in conditions, or that the degree of compliance with the policies or procedures may deteriorate.
/s/ PricewaterhouseCoopers LLP
San Jose, California
February 29, 2016
51
GoPro, Inc.
|
(in thousands, except par values)
|
December 31,
2015 |
December 31,
2014 |
|||||
|
Assets
|
|||||||
|
Current assets:
|
|||||||
|
Cash and cash equivalents
|
$
|
279,672
|
|
$
|
319,929
|
|
|
|
Marketable securities
|
194,386
|
|
102,327
|
|
|||
|
Accounts receivable, net
|
145,692
|
|
183,992
|
|
|||
|
Inventory
|
188,232
|
|
153,026
|
|
|||
|
Prepaid expenses and other current assets
|
25,261
|
|
63,769
|
|
|||
|
Total current assets
|
833,243
|
|
823,043
|
|
|||
|
Property and equipment, net
|
70,050
|
|
41,556
|
|
|||
|
Intangible assets, net
|
31,027
|
|
2,937
|
|
|||
|
Goodwill
|
57,095
|
|
14,095
|
|
|||
|
Other long-term assets
|
111,561
|
|
36,060
|
|
|||
|
Total assets
|
$
|
1,102,976
|
|
$
|
917,691
|
|
|
|
Liabilities and Stockholders' Equity
|
|||||||
|
Current liabilities:
|
|||||||
|
Accounts payable
|
$
|
89,989
|
|
$
|
126,240
|
|
|
|
Accrued liabilities
|
192,446
|
|
118,507
|
|
|||
|
Deferred revenue
|
12,742
|
|
14,022
|
|
|||
|
Total current liabilities
|
295,177
|
|
258,769
|
|
|||
|
Long-term taxes payable
|
21,770
|
|
13,266
|
|
|||
|
Other long-term liabilities
|
13,996
|
|
4,452
|
|
|||
|
Total liabilities
|
330,943
|
|
276,487
|
|
|||
|
Commitments, contingencies and guarantees (Note 10)
|
|
|
|||||
|
Stockholders’ equity:
|
|||||||
|
Preferred stock, $0.0001 par value, 5,000 shares authorized; none issued
|
—
|
|
—
|
|
|||
|
Common stock and additional paid-in capital, $0.0001 par value, 500,000 Class A shares authorized,100,596 and 52,091 shares issued and outstanding, respectively; 150,000 Class B shares authorized, 36,005 and 77,023 shares issued and outstanding, respectively
|
663,311
|
|
533,000
|
|
|||
|
Treasury stock, at cost, 1,545 shares and none, respectively
|
(35,613
|
)
|
—
|
|
|||
|
Retained earnings
|
144,335
|
|
108,204
|
|
|||
|
Total stockholders’ equity
|
772,033
|
|
641,204
|
|
|||
|
Total liabilities and stockholders’ equity
|
$
|
1,102,976
|
|
$
|
917,691
|
|
|
The accompanying notes are an integral part of these consolidated
financial statements.
52
GoPro, Inc.
|
Year ended December 31,
|
|||||||||||
|
(in thousands, except per share data)
|
2015
|
2014
|
2013
|
||||||||
|
Revenue
|
$
|
1,619,971
|
|
|
$
|
1,394,205
|
|
$
|
985,737
|
|
|
|
Cost of revenue
|
946,757
|
|
|
766,970
|
|
623,953
|
|
||||
|
Gross profit
|
673,214
|
|
627,235
|
|
361,784
|
|
|||||
|
Operating expenses:
|
|||||||||||
|
Research and development
|
241,694
|
|
|
151,852
|
|
73,737
|
|
||||
|
Sales and marketing
|
268,939
|
|
|
194,377
|
|
157,771
|
|
||||
|
General and administrative
|
107,833
|
|
|
93,971
|
|
31,573
|
|
||||
|
Total operating expenses
|
618,466
|
|
440,200
|
|
263,081
|
|
|||||
|
Operating income
|
54,748
|
|
187,035
|
|
98,703
|
|
|||||
|
Other expense, net
|
(2,163
|
)
|
|
(6,060
|
)
|
(7,374
|
)
|
||||
|
Income before income taxes
|
52,585
|
|
180,975
|
|
91,329
|
|
|||||
|
Income tax expense
|
16,454
|
|
|
52,887
|
|
30,751
|
|
||||
|
Net income
|
$
|
36,131
|
|
$
|
128,088
|
|
$
|
60,578
|
|
||
|
Less: net income allocable to participating securities
|
—
|
|
(16,512
|
)
|
(16,727
|
)
|
|||||
|
Net income attributable to common stockholders—basic
|
$
|
36,131
|
|
$
|
111,576
|
|
$
|
43,851
|
|
||
|
Add: net income allocable to dilutive participating securities
|
—
|
|
2,277
|
|
2,309
|
|
|||||
|
Net income attributable to common stockholders—diluted
|
$
|
36,131
|
|
$
|
113,853
|
|
$
|
46,160
|
|
||
|
Net income per share attributable to common stockholders:
|
|||||||||||
|
Basic
|
$
|
0.27
|
|
|
$
|
1.07
|
|
$
|
0.54
|
|
|
|
Diluted
|
$
|
0.25
|
|
|
$
|
0.92
|
|
$
|
0.47
|
|
|
|
Weighted-average shares used to compute net income per share attributable to common stockholders:
|
|||||||||||
|
Basic
|
134,595
|
|
|
104,453
|
|
81,018
|
|
||||
|
Diluted
|
146,486
|
|
|
123,630
|
|
98,941
|
|
||||
The accompanying notes are an integral part of these consolidated financial statements.
53
GoPro, Inc.
Consolidated Statements of Redeemable Convertible Preferred Stock and
Stockholders’ Equity (Deficit)
|
Redeemable
convertible preferred stock |
Common stock and additional paid-in capital
|
Treasury stock
|
Retained
earnings (accumulated
deficit)
|
Stockholders’
equity
(deficit) |
||||||||||||||||||
|
(in thousands)
|
Shares
|
|
Amount
|
|
Shares
|
|
Amount
|
|
Amount
|
|||||||||||||
|
Balances at December 31, 2012
|
30,523
|
|
$
|
77,138
|
|
80,714
|
|
$
|
479
|
|
$
|
—
|
|
$
|
(80,220
|
)
|
$
|
(79,741
|
)
|
|||
|
Accretion of preferred stock issuance costs
|
—
|
|
60
|
|
—
|
|
(60
|
)
|
—
|
|
—
|
|
(60)
|
|
||||||||
|
Exercise of stock options and vesting of restricted stock and early exercise stock options
|
—
|
|
—
|
|
613
|
|
1,148
|
|
—
|
|
—
|
|
1,148
|
|
||||||||
|
Stock-based compensation expense
|
—
|
|
—
|
|
—
|
|
10,887
|
|
—
|
|
—
|
|
10,887
|
|
||||||||
|
Retirement of common stock
|
—
|
|
—
|
|
(15)
|
|
—
|
|
—
|
|
(242)
|
|
(242)
|
|
||||||||
|
Issuance of common stock for acquisition
|
—
|
|
—
|
|
108
|
|
1,741
|
|
—
|
|
—
|
|
1,741
|
|
||||||||
|
Excess tax benefit from stock-based compensation
|
—
|
|
—
|
|
—
|
|
323
|
|
—
|
|
—
|
|
323
|
|
||||||||
|
Net income
|
—
|
|
—
|
|
—
|
|
—
|
|
—
|
|
60,578
|
|
60,578
|
|
||||||||
|
Balances at December 31, 2013
|
30,523
|
|
77,198
|
|
81,420
|
|
14,518
|
|
—
|
|
(19,884
|
)
|
(5,366)
|
|
||||||||
|
Issuance of common stock upon public offerings, net of offering costs
|
—
|
|
—
|
|
10,188
|
|
286,247
|
|
—
|
|
—
|
|
286,247
|
|
||||||||
|
Conversion of preferred stock to common stock upon initial public offering, net of issuance cost accretion
|
(30,523)
|
|
(77,198)
|
|
30,523
|
|
77,198
|
|
—
|
|
—
|
|
77,198
|
|
||||||||
|
Common stock issued under employee benefit plans, net of shares withheld for tax
|
—
|
|
—
|
|
8,414
|
|
7,681
|
|
—
|
|
—
|
|
7,681
|
|
||||||||
|
Retirement of common stock
|
—
|
|
—
|
|
(1,430)
|
|
(1,177
|
)
|
—
|
|
—
|
|
(1,177)
|
|
||||||||
|
Stock-based compensation expense
|
—
|
|
—
|
|
—
|
|
71,399
|
|
—
|
|
—
|
|
71,399
|
|
||||||||
|
Excess tax benefit from stock-based compensation
|
—
|
|
—
|
|
—
|
|
77,134
|
|
—
|
|
—
|
|
77,134
|
|
||||||||
|
Net income
|
—
|
|
—
|
|
—
|
|
—
|
|
—
|
|
128,088
|
|
128,088
|
|
||||||||
|
Balances at December 31, 2014
|
—
|
|
—
|
|
129,115
|
|
533,000
|
|
—
|
|
108,204
|
|
641,204
|
|
||||||||
|
Common stock issued under employee benefit plans, net of shares withheld for tax
|
—
|
|
—
|
|
14,249
|
|
36,413
|
|
—
|
|
—
|
|
36,413
|
|
||||||||
|
Taxes paid related to net share settlement of equity awards
|
—
|
|
—
|
|
—
|
|
(13,943
|
)
|
—
|
|
—
|
|
(13,943
|
)
|
||||||||
|
Retirement of common stock
|
—
|
|
—
|
|
(5,218
|
)
|
—
|
|
—
|
|
—
|
|
—
|
|
||||||||
|
Repurchase of outstanding common stock
|
—
|
|
—
|
|
(1,545
|
)
|
—
|
|
(35,613
|
)
|
—
|
|
(35,613
|
)
|
||||||||
|
Stock-based compensation expense
|
—
|
|
—
|
|
—
|
|
80,583
|
|
—
|
|
—
|
|
80,583
|
|
||||||||
|
Excess tax benefit from stock-based compensation
|
—
|
|
—
|
|
—
|
|
27,258
|
|
—
|
|
—
|
|
27,258
|
|
||||||||
|
Net income
|
—
|
|
—
|
|
—
|
|
—
|
|
—
|
|
36,131
|
|
36,131
|
|
||||||||
|
Balances at December 31, 2015
|
—
|
|
$
|
—
|
|
136,601
|
|
$
|
663,311
|
|
$
|
(35,613
|
)
|
$
|
144,335
|
|
$
|
772,033
|
|
|||
The accompanying notes are an integral part of these consolidated financial statements.
54
GoPro, Inc.
|
Year ended December 31,
|
|||||||||||
|
(in thousands)
|
2015
|
2014
|
2013
|
||||||||
|
Operating activities:
|
|||||||||||
|
Net income
|
$
|
36,131
|
|
$
|
128,088
|
|
$
|
60,578
|
|
||
|
Adjustments to reconcile net income to net cash provided by operating activities:
|
|||||||||||
|
Depreciation and amortization
|
28,981
|
|
17,945
|
|
12,034
|
|
|||||
|
Stock-based compensation
|
80,680
|
|
71,399
|
|
10,887
|
|
|||||
|
Excess tax benefit from stock-based compensation
|
(29,348
|
)
|
(77,134
|
)
|
(323
|
)
|
|||||
|
Deferred income taxes
|
(11,468
|
)
|
(16,920
|
)
|
(8,129
|
)
|
|||||
|
Accretion on investments
|
3,001
|
|
—
|
|
—
|
|
|||||
|
Other
|
2,426
|
|
1,865
|
|
1,224
|
|
|||||
|
Changes in operating assets and liabilities:
|
|||||||||||
|
Accounts receivable, net
|
38,313
|
|
(61,323
|
)
|
(42,453
|
)
|
|||||
|
Inventory
|
(35,005
|
)
|
(41,033
|
)
|
(51,583
|
)
|
|||||
|
Prepaid expenses and other assets
|
(23,281
|
)
|
(30,317
|
)
|
(15,355
|
)
|
|||||
|
Accounts payable and other liabilities
|
68,461
|
|
98,354
|
|
135,197
|
|
|||||
|
Deferred revenue
|
(1,280
|
)
|
5,998
|
|
400
|
|
|||||
|
Net cash provided by operating activities
|
157,611
|
|
96,922
|
|
102,477
|
|
|||||
|
Investing activities:
|
|||||||||||
|
Purchases of property and equipment, net
|
(51,245
|
)
|
(27,210
|
)
|
(18,325
|
)
|
|||||
|
Purchases of marketable securities
|
(220,055
|
)
|
(103,827
|
)
|
—
|
|
|||||
|
Maturities of marketable securities
|
94,680
|
|
1,083
|
|
—
|
|
|||||
|
Sales of marketable securities
|
30,048
|
|
—
|
|
—
|
|
|||||
|
Acquisitions, net of cash acquired
|
(65,405
|
)
|
(3,950
|
)
|
(2,912
|
)
|
|||||
|
Net cash used in investing activities
|
(211,977
|
)
|
(133,904
|
)
|
(21,237
|
)
|
|||||
|
Financing activities:
|
|||||||||||
|
Proceeds from issuance of common stock, net
|
22,833
|
|
300,097
|
|
527
|
|
|||||
|
Repurchases of outstanding Class A common stock
|
(35,613
|
)
|
—
|
|
—
|
|
|||||
|
Excess tax benefit from stock-based compensation
|
29,348
|
|
77,134
|
|
323
|
|
|||||
|
Payment of deferred acquisition-related consideration
|
—
|
|
(2,000
|
)
|
—
|
|
|||||
|
Payment of debt issuance costs and deferred public offering costs
|
(903
|
)
|
(5,730
|
)
|
(1,165
|
)
|
|||||
|
Proceeds from issuance of debt
|
—
|
|
—
|
|
30,000
|
|
|||||
|
Repayment of debt
|
—
|
|
(114,000
|
)
|
(46,000
|
)
|
|||||
|
Net cash provided by (used in) financing activities
|
15,665
|
|
255,501
|
|
(16,315
|
)
|
|||||
|
Effect of exchange rate changes on cash and cash equivalents
|
(1,556
|
)
|
—
|
|
—
|
|
|||||
|
Net increase (decrease) in cash and cash equivalents
|
(40,257
|
)
|
218,519
|
|
64,925
|
|
|||||
|
Cash and cash equivalents at beginning of period
|
319,929
|
|
101,410
|
|
36,485
|
|
|||||
|
Cash and cash equivalents at end of period
|
$
|
279,672
|
|
$
|
319,929
|
|
$
|
101,410
|
|
||
55
|
Supplementary cash flow disclosure:
|
|||||||||||
|
Interest paid in cash
|
$
|
—
|
|
$
|
1,853
|
|
$
|
4,904
|
|
||
|
Income taxes paid (refunded) in cash
|
$
|
(1,093
|
)
|
$
|
37,283
|
|
$
|
2,831
|
|
||
|
Non-cash investing and financing activities:
|
|||||||||||
|
Conversion of preferred stock to common stock, net of issuance cost accretion
|
$
|
—
|
|
$
|
77,198
|
|
$
|
—
|
|
||
|
Purchases of property and equipment included in accounts payable and accrued liabilities
|
$
|
5,153
|
|
$
|
2,474
|
|
$
|
2,937
|
|
||
|
Reclass of deferred public offering costs to additional paid-in capital
|
$
|
—
|
|
$
|
7,722
|
|
$
|
—
|
|
||
The accompanying notes are an integral part of these consolidated financial statements.
56
GoPro, Inc.
Notes to Consolidated Financial Statements
1. Business overview
GoPro, Inc. (GoPro or the Company) makes mountable and wearable cameras (capture devices) and accessories. The Company’s products are sold globally through retailers, wholesale distributors and on the Company’s website. The Company's global corporate headquarters are located in San Mateo, California.
2. Summary of significant accounting policies
Basis of presentation.
The accompanying consolidated financial statements have been prepared in accordance with U.S. generally accepted accounting principles (GAAP). The Company's fiscal year ends on December 31, and its fiscal quarters end on March 31, June 30, and September 30.
Principles of consolidation.
These consolidated financial statements include all the accounts of the Company and its wholly-owned subsidiaries. Unless otherwise specified, references to the Company are references to GoPro, Inc. and its consolidated subsidiaries. All intercompany balances and transactions have been eliminated in consolidation.
Use of estimates.
The preparation of financial statements in accordance with GAAP requires management to make estimates and assumptions that affect the amounts reported and disclosed in the Company’s consolidated financial statements and accompanying notes. The Company bases its estimates and assumptions on historical experience and on various other factors that it believes to be reasonable under the circumstances, the results of which form the basis for making judgments about the carrying values of assets and liabilities that are not readily apparent from other sources. Actual results could differ materially from management's estimates. To the extent there are material differences between the estimates and the actual results, future results of operations could be affected.
Comprehensive income.
For all periods presented, comprehensive income approximated net income. Therefore, the consolidated statements of comprehensive income have been omitted.
Prior period reclassifications.
Reclassifications of certain prior period amounts in the consolidated financial statements have been made to conform to the current period presentation.
Cash equivalents and marketable securities.
Cash equivalents primarily consist of investments in money market funds with maturities of three months or less from the date of purchase. Marketable securities consist of commercial paper, U.S. treasury securities, U.S. agency securities, and corporate debt securities, and are classified as available-for-sale securities. As the Company views these securities as available to support current operations, it has classified all available-for-sale securities as current assets. Available-for-sale securities are carried at fair value with unrealized gains and losses, if any, included in stockholders' equity. As of
December 31, 2015
, the Company's marketable securities were recorded at their amortized cost which approximated fair value. Unrealized losses are charged against other income (expense), net, for declines in fair value below the cost of an individual investment that is deemed to be other than temporary. The Company did not identify any marketable securities as other-than-temporarily impaired for the periods presented. The Company determines realized gains or losses on sale of marketable securities on a specific identification method, and records such gains or losses as other income (expense), net.
Accounts receivable and allowance for doubtful accounts.
Accounts receivable are stated at invoice value less estimated allowances for returns and doubtful accounts. The Company records allowances based upon its assessment of various factors, such as: historical experience, credit quality of its customers, age of the accounts receivable balances, geographic related risks, economic conditions and other factors that may affect a customer’s ability to pay. The allowance for doubtful accounts as of December 31, 2015 and 2014 was
$1.4 million
and
$1.3 million
, respectively.
Inventory.
Inventory consists of finished goods and component parts, which are purchased directly or from contract manufacturers. Inventory is stated at the lower of cost or market on a first-in, first-out basis. The Company writes down its inventory for estimated obsolescence or excess inventory equal to the difference between the cost of inventory and estimated market value. The Company’s assessment of market value is based upon assumptions around market conditions and estimated future demand for its products within a specified time horizon, generally
12
57
GoPro, Inc.
Notes to Consolidated Financial Statements
months
. Adjustments to reduce inventory to net realizable value are recognized in cost of revenue in the current period.
Point of purchase (POP) displays.
The Company provides retailers with POP displays, generally free of charge, in order to facilitate the marketing of the Company’s products within retail stores. The POP displays contain a display that broadcasts video images taken by GoPro cameras with product placement available for cameras and accessories. POP display costs, less any fees charged, are capitalized as long-term assets and charged to sales and marketing expense over the expected period of benefit, which generally ranges from
24
to
36 months
. POP amortization was
$16.8 million
,
$18.0 million
and
$13.5 million
in 2015, 2014 and 2013, respectively.
Property and equipment, net.
Property and equipment are stated at cost and are depreciated using the straight-line method over the estimated useful life of the assets, ranging from
one
to
ten
years. Leasehold improvements are amortized over the shorter of the lease term or their expected useful life. Property and equipment pending installation, configuration or qualification are classified as construction in progress. Costs of maintenance and repairs that do not improve or extend the lives of the respective assets are expensed as incurred.
Fair value measurements.
Fair value is defined as the price that would be received to sell an asset or paid to transfer a liability in an orderly transaction between market participants at the reporting date. The Company estimates and categorizes the fair value of its financial assets by applying the following hierarchy established by the FASB, which prioritizes the inputs to valuation techniques used to measure fair value:
|
Level 1
|
Valuations based on quoted prices in active markets for identical assets or liabilities that the Company has the ability to directly access.
|
|
Level 2
|
Valuations based on quoted prices for similar assets or liabilities; valuations for interest-bearing securities based on non-daily quoted prices in active markets; quoted prices in markets that are not active; or other inputs that are observable or can be corroborated by observable data for substantially the full term of the assets or liabilities.
|
|
Level 3
|
Valuations based on inputs that are supported by little or no market activity and that are significant to the fair value of the assets or liabilities.
|
A financial instrument's level within the fair value hierarchy is based on the lowest level of any input that is significant to the fair value measurement. The fair value of Level 2 financial instruments is obtained from an independent pricing service, which may use quoted market prices for identical or comparable instruments or model driven valuations using observable market data or inputs corroborated by observable market data.
Leases.
The Company leases its office space and facilities under cancelable and non-cancelable operating leases. For leases that contain rent escalation or rent concession provisions, the Company recognizes rent expense on a straight-line basis over the term of the lease. The Company does not assume renewals in its determination of the lease term unless the renewals are deemed to be reasonably assured at lease inception. Leasehold improvements are included in property and equipment, net.
Goodwill and other intangible assets
.
Goodwill represents the excess of the purchase price over the fair value of the net assets acquired in a business combination. Acquired intangible assets other than goodwill are amortized over their useful lives unless the lives are determined to be indefinite. For intangible assets acquired in a business combination, the estimated fair values of the assets received are used to establish their recorded values. Valuation techniques consistent with the market approach, income approach and/or cost approach are used to measure fair value.
Impairment of goodwill and long-lived assets.
The Company performs an annual assessment of its goodwill during the fourth quarter of each calendar year and in interim periods if certain events occur to determine if any events or circumstances exist, such as an adverse change in business climate or a decline in the overall industry demand, that would indicate it is more likely than not that the fair value of its single reporting unit is less than its carrying value. If further testing is deemed necessary, a two-step approach is applied. The first step involves comparing the fair value of the reporting unit with its carrying value. The second step, if necessary, measures the amount of impairment, if any, by comparing the carrying value of the goodwill to its implied fair value. Other indefinite-lived
58
GoPro, Inc.
Notes to Consolidated Financial Statements
intangible assets are assessed for impairment at least annually. If their value carrying value exceeds the estimated fair value, the difference is recorded as an impairment.
Long-lived assets, such as property and equipment and intangible assets subject to amortization, are reviewed for impairment whenever events or changes in circumstances indicate that the carrying amount of an asset or asset group may not be recoverable. Recoverability of assets to be held and used is measured by comparing the carrying amount to the estimated future undiscounted cash flows expected to be generated by the asset group. If it is determined that an asset group is not recoverable, an impairment charge is recognized for the amount by which the carrying amount of the asset group exceeds its fair value.
There was
no
material impairment of goodwill, indefinite-lived intangible assets or other long-lived assets for any periods presented.
Warranty.
The Company records a liability for estimated product warranty costs at the time product revenue is recognized. The Company's standard warranty obligation to its end-users generally provides a
12
-month warranty coverage on all of its products except in the European Union where the Company provides a
two
-year warranty. The Company's estimate of costs to service its warranty obligations is based on its historical experience of repair and replacement of the associated products and expectations of future conditions. The warranty obligation is affected by product failure rates and the related use of materials, labor costs and freight incurred in correcting any product failure.
Revenue recognition.
Revenue is primarily comprised of product revenue, net of returns and sales incentives. The Company derives substantially all of its revenue from the sale of capture devices and the related implied post contract support (PCS). The Company recognizes revenue when persuasive evidence of an arrangement exists, delivery has occurred, the sales price is fixed or determinable, and collectability is reasonably assured. Evidence of an arrangement consists of an order from its distributors, resellers, or online customers. The Company considers delivery to have occurred once title and risk of loss has been transferred. For most of the Company's revenue, these criteria are met at the time the product is shipped. For customers who purchase products directly from the Company’s website, the Company defers revenue until delivery to the customer's address because the Company retains a portion of the risk of loss on these sales during transit. Customer deposits are included in accrued liabilities on the consolidated balance sheet and are recognized as revenue when all the revenue recognition criteria are met.
The Company grants limited rights to return product for certain large retailers and distributors. The Company records reductions to revenue and cost of sales for expected future product returns at the time of sale based on analyses of historical return trends by customer class. Return trends are influenced by product life cycles, new product introductions, market acceptance of products, product sell-through, the type of customer, seasonality, and other factors. Return rates may fluctuate over time, but are sufficiently predictable to allow the Company to estimate expected future product returns.
The Company has determined its sales of capture devices are multiple element arrangements that generally include the following two units of accounting: a) the hardware component (camera and accessories) and the embedded firmware essential to the functionality of the camera delivered at the time of sale, and b) the implied right for the customer to receive PCS. PCS includes the right to receive, on a when and if available basis, future unspecified firmware upgrades and features as well as bug fixes, email and telephone support. The Company accounts for each element separately and allocates revenue based on their relative selling prices. The Company uses a hierarchy to determine the selling price to be used for allocating revenue to deliverables: (i) vendor-specific objective evidence of fair value (VSOE), (ii) third-party evidence of selling price (TPE) and (iii) best estimate of the selling price (BESP). The Company has neither VSOE nor TPE since the deliverables are not sold separately and there are not comparable deliverables sold by other companies. BESP reflects the Company’s best estimates of what the selling prices of elements would be if they were sold regularly on a stand-alone basis. The Company's process for determining BESP considers multiple factors that may vary over time depending upon the unique facts and circumstances related to each deliverable, including: the level of support provided to customers, estimated costs to provide the Company's support, the amount of time and cost that is allocated to the Company's efforts to develop the undelivered elements, and market trends in the pricing for similar offerings.
59
GoPro, Inc.
Notes to Consolidated Financial Statements
Revenue allocated to the delivered hardware and the related essential software is recognized at the time of sale provided the conditions for recognition of revenue have been met. Revenue allocated to PCS is deferred and recognized on a straight-line basis over the estimated term of the support period, which is estimated to be 15 months based on historical experience.
Sales incentives.
The Company offers sales incentives through various programs, consisting primarily of cooperative advertising and marketing development fund programs. The Company records cooperative advertising and marketing development fund programs with customers as a reduction to revenue unless it receives an identifiable benefit in exchange for credits claimed by the customer and can reasonably estimate the fair value of the identifiable benefit received, in which case the Company will record it as a marketing expense. Marketing development funds recorded as marketing expense were not material for the periods presented. In addition, the Company offers price protection discounts to certain customers when new capture device models are released or repriced and the customer has remaining inventory on hand. The Company calculates price protection discounts in the period that the price reduction goes into effect, and they are recorded as a reduction of revenue, based on the evaluation of inventory currently held by the customer subject to price protection.
Shipping costs.
Amounts billed to customers for shipping and handling are classified as revenue and the Company's related shipping and handling costs incurred are classified as cost of revenue.
Sales taxes.
Sales taxes collected from customers and remitted to respective governmental authorities are recorded as liabilities and not included in revenue.
Research and development.
Research and development expense includes internal and external costs. Internal costs include employee related expenses, equipment costs, depreciation expense and allocated facility costs. External research and development expenses consist of costs associated with consultants, tooling and prototype materials. Research and development expense is related to developing new products and services and the designing of significant improvements to existing products. Research and development costs to establish the technological feasibility of the Company’s internally developed software is expensed as incurred. To date, the period between achieving technological feasibility and the release of internally developed software to be sold, leased, or marketed has been short and development costs qualifying for capitalization have been insignificant.
Advertising costs.
Advertising costs consist of costs associated with print, television and ecommerce media advertisements and are expensed as incurred. The Company incurs promotional expenses resulting from payments under event, resort and athlete sponsorship contracts. These sponsorship arrangements are considered to be executory contracts and, as such, the costs are expensed as performance under the contract is received. The costs associated with preparation of sponsorship activities, including the supply of GoPro products, media team support, and activation fees are expensed as incurred. Prepayments made under sponsorship agreements are included in prepaid expenses or other long-term assets depending on the period to which the prepayment applies. Advertising costs were
$64.7 million
,
$47.2 million
and
$55.5 million
in 2015, 2014 and 2013, respectively.
Stock-based compensation.
The Company accounts for stock-based compensation in accordance with accounting guidance that requires all stock-based awards granted to employees and directors to be measured at fair value and recognized as an expense. The Company primarily issues restricted stock units. For service-based awards, stock-based compensation is recognized on a straight-line basis over the requisite service period, net of estimated forfeitures. For performance and market-based awards which also require a service period, the Company uses graded vesting over the longer of the derived service period or when the performance or market condition is satisfied.
The Company recognizes a benefit from stock-based compensation as additional paid-in capital if an excess tax benefit is realized by following the with-and-without approach. The indirect effects of stock-based compensation deductions are reflected in the income tax provision for purposes of measuring the excess tax benefit at settlement of awards.
Foreign currency.
The U.S. dollar is the functional currency of the Company's foreign subsidiaries. The Company remeasures monetary assets or liabilities denominated in currencies other than the U.S. dollar using exchange rates prevailing on the balance sheet date, and non-monetary assets and liabilities at historical rates. Foreign currency
60
GoPro, Inc.
Notes to Consolidated Financial Statements
remeasurement and transaction gains and losses are included in other expense, net and have not been material for any periods presented.
Income taxes.
The Company utilizes the asset and liability method for computing its income tax provision, under which deferred tax assets and liabilities are recognized for the expected future consequences of temporary differences between the financial reporting and tax bases of assets and liabilities using enacted tax rates. Management makes estimates, assumptions and judgments to determine the Company's provision for income taxes, deferred tax assets and liabilities, and any valuation losses recorded against deferred tax assets. The Company assesses the likelihood that its deferred tax assets will be recovered from future taxable income and, to the extent the Company believes recovery is not likely, establishes a valuation allowance.
The Company recognizes the tax benefit from an uncertain tax position only if it is more likely than not the tax position will be sustained on examination by the taxing authorities, based on the technical merits of the position. The tax benefits recognized from such positions are then measured based on the largest benefit that has a greater than 50% likelihood of being realized upon settlement. Interest and penalties related to unrecognized tax benefits are recognized within income tax expense.
Segment information.
The Company operates as one operating segment as it only reports financial information on an aggregate and consolidated basis to its CEO, who is the Company’s chief operating decision maker.
Recent accounting pronouncements
|
Standard
|
Description
|
Date of adoption
|
Effect on the financial statements or other significant matters
|
|||
|
Standards that are not yet adopted
|
||||||
|
ASU 2014-09, Revenue from Contracts with Customers (Topic 606)
|
This standard is based on principles that govern the recognition of revenue at an amount to which an entity expects to be entitled when products and services are transferred to customers. In August 2015, the FASB deferred the effective date by one year while providing the option to adopt the standard on the original effective date of January 1, 2017. The standard may be adopted either retrospectively to each prior reporting period presented or as a cumulative effect adjustment as of the date of adoption.
|
January 1, 2018
|
The Company is currently evaluating the impact the adoption of this standard will have on its consolidated financial statements and related disclosures.
|
|||
|
ASU 2015-16, Business Combinations (Topic 805): Simplifying the Accounting for Measurement Period Adjustments
|
Under the updated guidance, the acquirer in a business combination is required to recognize adjustments to provisional amounts that are identified during the measurement period in the reporting period in which the adjustment amounts are determined. This new standard will be applied prospectively to adjustments to provisional amounts that occur after the effective date of this update.
|
January 1, 2016
|
The Company does not believe the adoption of this standard will have a material impact to its consolidated financial statements.
|
|||
|
Standards that were adopted
|
||||||
|
ASU 2015-17, Income Taxes (Topic 740): Balance Sheet Classifications of Deferred Taxes
|
This standard requires that deferred tax liabilities and assets be classified as noncurrent in a classified statement of financial position. The new guidance becomes effective for the Company on January 1, 2017, with early adoption permitted.
|
December 31, 2015
|
The Company early adopted this standard, prospectively. Adoption resulted in a $22.2 million reduction to current assets and a corresponding increase in other long-term assets at December 31, 2015. Prior periods were not adjusted. Adoption had no impact on the Company’s results of operations.
|
|||
61
GoPro, Inc.
Notes to Consolidated Financial Statements
3. Fair value measurements
The Company’s assets that are measured at fair value on a recurring basis, by level, within the fair value hierarchy are summarized as follows:
|
December 31, 2015
|
December 31, 2014
|
|||||||||||||||||||||||
|
(in thousands)
|
Level 1
|
Level 2
|
Total
|
Level 1
|
Level 2
|
Total
|
||||||||||||||||||
|
Cash equivalents
(1)
:
|
||||||||||||||||||||||||
|
Money market funds
|
$
|
51,059
|
|
$
|
—
|
|
$
|
51,059
|
|
$
|
80,968
|
|
$
|
—
|
|
$
|
80,968
|
|
||||||
|
Corporate debt securities
|
—
|
|
—
|
|
—
|
|
—
|
|
2,000
|
|
2,000
|
|
||||||||||||
|
Total cash equivalents
|
$
|
51,059
|
|
$
|
—
|
|
$
|
51,059
|
|
$
|
80,968
|
|
$
|
2,000
|
|
$
|
82,968
|
|
||||||
|
Marketable securities:
|
||||||||||||||||||||||||
|
U.S. treasury securities
|
$
|
—
|
|
$
|
—
|
|
$
|
—
|
|
$
|
1,994
|
|
$
|
—
|
|
$
|
1,994
|
|
||||||
|
U.S. agency securities
|
—
|
|
14,451
|
|
14,451
|
|
—
|
|
7,020
|
|
7,020
|
|
||||||||||||
|
Commercial paper
|
—
|
|
2,197
|
|
2,197
|
|
—
|
|
2,497
|
|
2,497
|
|
||||||||||||
|
Corporate debt securities
|
—
|
|
165,825
|
|
165,825
|
|
—
|
|
90,816
|
|
90,816
|
|
||||||||||||
|
Municipal securities
|
—
|
|
11,913
|
|
11,913
|
|
—
|
|
—
|
|
—
|
|
||||||||||||
|
Total marketable securities
|
$
|
—
|
|
$
|
194,386
|
|
$
|
194,386
|
|
$
|
1,994
|
|
$
|
100,333
|
|
$
|
102,327
|
|
||||||
(1)
Included in “cash and cash equivalents” in the accompanying consolidated balance sheets as of
December 31, 2015
and 2014. Cash balances were
$228.6 million
and
$237.0 million
as of December 31, 2015 and 2014, respectively.
For the periods presented, the Company had no financial assets or liabilities that were classified as Level 3, and had no transfers of financial assets between levels.
The remaining contractual maturities of available-for-sale marketable securities as of the period-ends noted, are as follows:
|
December 31,
|
||||||||
|
(in thousands)
|
2015
|
2014
|
||||||
|
Less than one year
|
$
|
122,199
|
|
$
|
58,764
|
|
||
|
Greater than one year but less than two years
|
72,187
|
|
43,563
|
|
||||
|
Total
|
$
|
194,386
|
|
$
|
102,327
|
|
||
At
December 31, 2015
and 2014, the amortized cost of the Company's cash equivalents and marketable securities approximated their fair value and there were no material unrealized gains/(losses) either individually or in the aggregate.
4. Consolidated financial statement details
The following sections and tables provide details of selected balance sheet items.
Inventory
|
December 31,
|
|||||||
|
(in thousands)
|
2015
|
2014
|
|||||
|
Components
|
$
|
9,476
|
|
$
|
4,324
|
|
|
|
Finished goods
|
178,756
|
|
148,702
|
|
|||
|
Total inventory
|
$
|
188,232
|
|
$
|
153,026
|
|
|
Prepaid expenses and other current assets
62
GoPro, Inc.
Notes to Consolidated Financial Statements
|
December 31,
|
|||||||
|
(in thousands)
|
2015
|
2014
|
|||||
|
Prepaid expenses
|
$
|
6,132
|
|
$
|
3,905
|
|
|
|
Prepaid income taxes
|
4,696
|
|
26,504
|
|
|||
|
Tenant allowance receivable
|
4,249
|
|
—
|
|
|||
|
Prepaid licenses
|
2,818
|
|
2,053
|
|
|||
|
Current deferred tax assets
|
—
|
|
24,218
|
|
|||
|
Other current assets
|
7,366
|
|
7,089
|
|
|||
|
Prepaid expenses and other current assets
|
$
|
25,261
|
|
$
|
63,769
|
|
|
Property and equipment, net
|
(dollars in thousands)
|
Useful life
(in years)
|
December 31,
2015 |
December 31,
2014 |
||||||
|
Leasehold improvements
|
3–10
|
$
|
40,841
|
|
$
|
22,787
|
|
||
|
Production, engineering and other equipment
|
4
|
25,174
|
|
8,755
|
|
||||
|
Tooling
|
1–2
|
19,537
|
|
16,159
|
|
||||
|
Computers and software
|
2
|
14,581
|
|
9,731
|
|
||||
|
Furniture and office equipment
|
3
|
11,389
|
|
6,150
|
|
||||
|
Construction in progress
|
4,632
|
|
3,944
|
|
|||||
|
Tradeshow equipment and other
|
2-5
|
4,136
|
|
3,830
|
|
||||
|
Gross property and equipment
|
120,290
|
|
71,356
|
|
|||||
|
Less: Accumulated depreciation and amortization
|
(50,240
|
)
|
(29,800)
|
|
|||||
|
Property and equipment, net
|
$
|
70,050
|
|
$
|
41,556
|
|
|||
Depreciation expense was
$24.8 million
,
$16.8 million
and
$10.9 million
in 2015, 2014 and 2013, respectively.
Acquisitions and acquired intangible assets and goodwill
In 2015, the Company completed acquisitions qualifying as business combinations for aggregate consideration of
$70.2 million
, the substantial majority of which was cash consideration. These acquisitions were not material to the Company's consolidated financial statements, either individually or in the aggregate, and therefore actual and proforma disclosures under the applicable accounting guidance have not been presented.
The following table summarizes the allocation of the fair values of the assets acquired and liabilities assumed, and the related useful lives, where applicable:
|
(in thousands)
|
Estimated
useful life (in years) |
Fair value
|
|||
|
Purchased technology
|
4 - 6 years
|
$
|
25,676
|
|
|
|
In-process research and development (IPR&D)
|
6,600
|
|
|||
|
Net liabilities assumed
|
(353
|
)
|
|||
|
Deferred income tax liabilities
|
(4,676
|
)
|
|||
|
Net assets acquired
|
27,247
|
|
|||
|
Goodwill
|
43,000
|
|
|||
|
Total fair value consideration
|
$
|
70,247
|
|
||
63
GoPro, Inc.
Notes to Consolidated Financial Statements
Goodwill is primarily attributable to expected synergies in the technologies that can be leveraged by the Company in future product offerings related to device and software offerings. Goodwill is not expected to be deductible for tax purposes. The carrying amount of goodwill was
$57.1 million
and
$14.1 million
as of
December 31, 2015
and 2014, respectively. The increase in 2015 and 2014 was entirely attributable to goodwill acquired.
The following table summarizes the Company's acquired intangible assets:
|
December 31, 2015
|
|||||||||||
|
(in thousands)
|
Gross carrying value
|
Accumulated
amortization
|
Net carrying value
|
||||||||
|
Purchased technology and other amortizable assets
|
$
|
32,952
|
|
$
|
(8,540
|
)
|
$
|
24,412
|
|
||
|
IPR&D and other non-amortizable assets
|
6,615
|
|
—
|
|
6,615
|
|
|||||
|
Total intangible assets
|
$
|
39,567
|
|
$
|
(8,540
|
)
|
$
|
31,027
|
|
||
|
December 31, 2014
|
|||||||||||
|
(in thousands)
|
Gross carrying value
|
Accumulated
amortization |
Net carrying value
|
||||||||
|
Purchased technology and other amortizable assets
|
$
|
7,275
|
|
$
|
(4,353
|
)
|
$
|
2,922
|
|
||
|
Other non-amortizable assets
|
15
|
|
—
|
|
15
|
|
|||||
|
Total intangible assets
|
$
|
7,290
|
|
$
|
(4,353
|
)
|
$
|
2,937
|
|
||
As of
December 31, 2015
, technological feasibility has not been established for IPR&D assets; they have no alternative future use and, as such, continue to be accounted for as indefinite-lived intangible assets.
Amortization expense was
$4.2 million
,
$1.1 million
and
$1.1 million
in 2015, 2014 and 2013, respectively. At
December 31, 2015
, the estimated amortization expense of existing intangible assets for future periods is as follows:
|
(in thousands)
|
Total
|
|||
|
Year ending December 31,
|
||||
|
2016
|
$
|
5,956
|
|
|
|
2017
|
5,172
|
|
||
|
2018
|
4,780
|
|
||
|
2019
|
4,269
|
|
||
|
2020
|
3,365
|
|
||
|
Thereafter
|
870
|
|
||
|
$
|
24,412
|
|
||
Other long-term assets
|
December 31,
|
|||||||
|
(in thousands)
|
2015
|
2014
|
|||||
|
POP displays
|
$
|
27,989
|
|
$
|
18,743
|
|
|
|
Long-term deferred tax assets
|
41,936
|
|
8,611
|
|
|||
|
Income tax receivable
|
33,206
|
|
—
|
|
|||
|
Deposits and other
|
8,430
|
|
8,706
|
|
|||
|
Other long-term assets
|
$
|
111,561
|
|
$
|
36,060
|
|
|
64
GoPro, Inc.
Notes to Consolidated Financial Statements
Accrued liabilities
|
December 31,
|
|||||||
|
(in thousands)
|
2015
|
2014
|
|||||
|
Accrued payables
|
$
|
64,831
|
|
$
|
56,617
|
|
|
|
Excess purchase order commitments
|
38,477
|
|
447
|
|
|||
|
Accrued sales incentive
|
29,298
|
|
9,635
|
|
|||
|
Employee related liabilities
|
26,491
|
|
28,959
|
|
|||
|
Warranty liability
|
10,400
|
|
6,025
|
|
|||
|
Customer deposits
|
8,877
|
|
4,903
|
|
|||
|
Income taxes payable
|
7,536
|
|
2,732
|
|
|||
|
Other
|
6,536
|
|
9,189
|
|
|||
|
Accrued liabilities
|
$
|
192,446
|
|
$
|
118,507
|
|
|
5. Stockholders' equity (deficit) and redeemable convertible preferred stock
Initial public offering
In July 2014, the Company completed its IPO in which the Company issued and sold
8.9 million
shares of Class A common stock at a public offering price of
$24.00
per share and the selling stockholders sold
11.6 million
shares of Class A common stock, including
2.7 million
shares upon the underwriters' option to purchase additional shares. The Company did not receive any proceeds from the sale of shares by the selling stockholders. The total net proceeds received by the Company from the IPO were
$200.8 million
after deducting underwriting discounts and commissions of
$12.8 million
and other offering expenses of approximately
$6.2 million
.
Follow-on offering
In November 2014, the Company completed a follow-on offering in which the Company issued and sold
1.3 million
shares of Class A common stock at a public offering price of
$75.00
per share and the selling stockholders sold
10.6 million
shares of Class A common stock, including
1.6 million
shares upon the underwriters' option to purchase additional shares. The Company did not receive any proceeds from the sale of shares by the selling stockholders. The total net proceeds received by the Company from the follow-on offering were
$93.2 million
after deducting underwriting discounts and commissions of
$3.4 million
and other offering expenses of approximately
$1.5 million
.
Redeemable convertible preferred stock
Prior to the Company's IPO, the Company had
30.5 million
of Series A redeemable convertible preferred stock outstanding, which were convertible into shares of Class B common stock at a rate of
1-for-1
. Concurrent with the close of the IPO, those outstanding shares were converted into Class B common stock.
Preferred stock
Following the Company's IPO, the Company had
5.0 million
shares of preferred stock authorized,
none
of which was issued or outstanding at December 31, 2015 and 2014.
Common stock
Following the Company's IPO, the Company had two classes of authorized common stock: Class A common stock with
500.0 million
shares authorized and Class B common stock with
150.0 million
shares authorized. As of
December 31, 2015
,
100.6 million
shares of Class A stock were issued and outstanding and
36.0 million
shares of Class B stock were issued and outstanding. The rights of the holders of Class A and Class B common stock are identical, except with respect to voting power and conversion rights. Each share of Class A common stock is entitled to
one
vote per share and each share of Class B common stock is entitled to
ten
votes per share. Each share of Class B common stock is convertible at any time at the option of the stockholder into
one
share of Class A common
65
GoPro, Inc.
Notes to Consolidated Financial Statements
stock and has no expiration date. The Class B common stock is also convertible into Class A common stock on the same basis upon any transfer, whether or not for value, except for “permitted transfers” as defined in the Company’s restated certificate of incorporation. Each share of Class B common stock will convert automatically into
one
share of Class A common stock upon the date when the outstanding shares of Class B common stock represent less than
10%
of the aggregate number of shares of common stock then outstanding. As of December 31, 2015, the Class B stock continued to represent greater than
10%
of the overall outstanding shares.
The Company had the following shares of common stock reserved for issuance upon the exercise of equity instruments as of
December 31, 2015
:
|
(in thousands)
|
December 31, 2015
|
|
|
Stock options outstanding
|
13,081
|
|
|
Restricted stock units outstanding
|
4,638
|
|
|
Common stock available for future grants
|
20,084
|
|
|
Total common stock shares reserved for issuance
|
37,803
|
|
Stock repurchase program
On September 30, 2015, the Company's board of directors authorized a program to repurchase up to
$300.0 million
of the Company's Class A common stock. The repurchase program, which expires in September 2016, does not obligate the Company to acquire any specific number of shares and may be discontinued or extended at any time by the board of directors. Share repurchases under the program may be made from time-to-time through open market transactions, block trades, privately negotiated transactions or otherwise, including under plans complying with both Rule 10b-18 and Rule 10b5-1 under the Securities Exchange Act of 1934, as amended.
During the fourth quarter of 2015, under the program, the Company repurchased approximately
1.5 million
shares of its common stock at an average price of
$23.05
per share, for an aggregate purchase price of approximately
$35.6 million
. The Company currently intends to hold the repurchased shares as treasury stock.
CEO stock contributions
In 2015, the CEO contributed an aggregate
5.2 million
shares of Class B common stock to the Company without consideration per the terms of a Contribution Agreement dated December 28, 2011, and amended on May 11, 2015. Under the original Contribution Agreement, the CEO agreed to contribute back to the Company from time-to-time the same number of shares of common stock as are issued to a certain Company employee upon the exercise of certain stock options held by such employee. Pursuant to this agreement, the CEO contributed back to the Company
0.5 million
shares of Class B common stock from January 2015 through April 2015. In May 2015, the CEO contributed back to the Company
4.7 million
shares of Class B common stock pursuant to the amended agreement, representing all of the then remaining shares subject to the contribution obligations. All of the shares contributed by the CEO were retired during the year.
6. Employee benefit plans
Equity incentive plans
The Company has outstanding equity grants from its
three
stock-based employee compensation plans: the 2014 Equity Incentive Plan (2014 Plan), the 2010 Equity Incentive Plan (2010 Plan), and the 2014 Employee Stock Purchase Plan (ESPP). In the second quarter of 2014, the Company terminated the authority to grant new awards under the 2010 Plan and no new options or awards have been granted under the 2010 Plan since June 2014. Outstanding options and awards under the 2010 Plan continue to be subject to the terms and conditions of the 2010 Plan.
The 2014 Plan serves as the successor to the 2010 Plan and provides for the granting of incentive and nonqualified stock options, restricted stock awards (RSAs), restricted stock units (RSUs), stock appreciation rights, stock bonus awards, and performance awards to qualified employees, non-employee directors, and consultants. Options granted
66
GoPro, Inc.
Notes to Consolidated Financial Statements
under the 2014 Plan generally expire within
10
years from the date of grant and generally vest over
four
years and are exercisable for shares of the Company's Class A stock. Options with performance or market-based conditions are generally subject to a required service period along with the performance or market condition. RSUs granted under the 2014 Plan generally vest annually over a
four
year period based upon continued service and are settled at vesting in shares of the Company's Class A common stock.
The ESPP allows eligible employees to purchase shares of the Company's Class A common stock through payroll deductions at a price equal to
85%
of the lesser of the fair market values of the stock as of the first date or the ending date of each six-month offering period. The 2014 Plan and the ESPP also provides for automatic annual increases in the number of shares reserved for future issuance.
Employee retirement plan
The Company has a 401(k) defined contribution retirement plan (Retirement Plan) covering U.S. full-time employees. The Retirement Plan provides for voluntary employee contributions from
1%
to
86%
of annual compensation, subject to a maximum limit allowed by Internal Revenue Service guidelines. The Company matches 100% of each employee’s contributions up to a maximum of
4%
of the employee's eligible compensation. The Company's matching contribution to the plan was
$5.5 million
and
$2.7 million
in 2015 and 2014, respectively.
Stock option activity
A summary of the Company’s stock option activity in 2015 and related information is as follows:
|
Options outstanding
|
||||||||||||
|
(shares in thousands)
|
Shares
|
Weighted- average
exercise price |
Weighted-
average remaining contractual term (in years) |
Aggregate
intrinsic value (in thousands) |
||||||||
|
Outstanding at December 31, 2014:
|
25,134
|
|
$
|
6.62
|
|
7.09
|
$
|
1,425,339
|
|
|||
|
Granted
|
792
|
|
39.66
|
|
||||||||
|
Exercised
|
(12,375
|
)
|
2.01
|
|
||||||||
|
Forfeited/Cancelled
|
(470
|
)
|
38.84
|
|
||||||||
|
Outstanding at December 31, 2015:
|
13,081
|
|
$
|
11.82
|
|
6.70
|
$
|
108,846
|
|
|||
|
Exercisable at December 31, 2015
|
8,449
|
|
$
|
6.19
|
|
5.89
|
$
|
103,696
|
|
|||
|
Vested and expected to vest at December 31, 2015
|
12,858
|
|
$
|
11.62
|
|
6.67
|
$
|
108,681
|
|
|||
The weighted average grant date fair values of all options granted and assumed were
$18.40
,
$11.51
and
$8.45
per share in 2015, 2014 and 2013, respectively. The total fair value of all options vested were
$26.9 million
,
$16.0 million
, and
$5.2 million
in 2015, 2014 and 2013, respectively.
The aggregate intrinsic value of the stock options outstanding as of
December 31, 2015
was
$108.8 million
, which represents the value of the Company's closing stock price on
December 31, 2015
in excess of the weighted-average exercise price multiplied by the number of options outstanding. The total intrinsic values of options exercised were
$633.6 million
,
$253.3 million
and
$4.6 million
in 2015, 2014 and 2013, respectively.
At
December 31, 2015
, there was
$50.2 million
of unearned stock-based compensation expense related to unvested options, which is expected to be amortized over a weighted average period of
2.2 years
.
Restricted stock awards
A summary of the Company's RSA activity in 2015 is as follows:
67
GoPro, Inc.
Notes to Consolidated Financial Statements
|
Shares
(in thousands)
|
Weighted-
average grant date fair value |
Aggregate
intrinsic value
(in thousands)
|
||||||||
|
Non-vested shares at December 31, 2014
|
17
|
|
$
|
6.30
|
|
$
|
1,017
|
|
||
|
Vested
|
(17)
|
|
||||||||
|
Non-vested shares at December 31, 2015
|
—
|
|
||||||||
The total fair value of all restricted stock and early exercised stock options subject to repurchase vested was
zero
,
$11.2 million
and
$6.1 million
in 2015, 2014 and 2013, respectively.
Early exercised stock options were fully vested in 2014. At December 31, 2015, all RSAs were fully vested and there was no unearned stock-based compensation remaining.
Restricted stock units
A summary of the Company’s RSU activity in 2015 and 2014 is as follows:
|
(shares in thousands)
|
Shares
|
Weighted- average grant date fair value
|
||||
|
Non-vested shares at December 31, 2013
|
270
|
|
$
|
1.52
|
|
|
|
Granted
|
5,573
|
|
22.01
|
|
||
|
Vested
|
(1,533
|
)
|
18.42
|
|
||
|
Forfeited
|
(3
|
)
|
57.73
|
|
||
|
Non-vested shares at December 31, 2014
|
4,307
|
|
$
|
21.98
|
|
|
|
Granted
|
2,170
|
|
44.00
|
|
||
|
Vested
|
(1,735
|
)
|
19.84
|
|
||
|
Forfeited
|
(104
|
)
|
63.47
|
|
||
|
Non-vested shares at December 31, 2015
|
4,638
|
|
$
|
32.15
|
|
|
The total fair value of RSUs vested was
$34.4 million
in 2015 and
$28.2 million
in 2014. The intrinsic value of the non-vested RSUs was
$83.5 million
as of December 31, 2015. There were no RSUs granted during 2013.
In June 2014, the Company granted an award of
4.5 million
RSUs to the Company's CEO (CEO RSUs), which included
1.5 million
RSUs that vested immediately upon grant and
3.0 million
RSUs that were subject to both a market-based condition and a service condition. The market-based condition was achieved in January 2015. Stock-based compensation expense related to the CEO RSUs was
$29.4 million
in 2015 and
$38.3 million
in 2014.
At
December 31, 2015
, there was
$107.8 million
of unearned stock-based compensation related to RSUs (including
$7.0 million
related to the CEO RSUs), which is expected to be recognized over a weighted average period of
2.5 years
.
Employee stock purchase plan
In 2015, employees purchased an aggregate of
436,924
shares under the Company's ESPP at an average price of
$26.88
per share. At
December 31, 2015
, there was
$0.6 million
of unearned stock-based compensation related to the ESPP, which is expected to be recognized over
0.1
years. Of the
5.0 million
shares authorized for issuance,
4.5 million
shares were available for issuance at December 31, 2015.
The weighted-average fair value per share for purchase periods beginning in 2015 and 2014 were
$15.76
and
$7.16
, respectively. Cash proceeds from the issuance of shares under the ESPP were
$11.7 million
in 2015.
Fair value disclosures
The fair value of stock options granted and purchases under the Company's ESPP is estimated using the Black-Scholes option pricing model. Expected term of stock options granted was estimated based on the simplified method.
68
GoPro, Inc.
Notes to Consolidated Financial Statements
Expected stock price volatility was estimated by taking the average historic price volatility for industry peers based on daily price observations over a period equivalent to the expected term. Risk-free interest rate was based on the yields of U.S. Treasury securities with maturities similar to the expected term. Dividend yield was zero as the Company does not have any history of, nor plans to make, dividend payments.
The fair value of stock options granted was estimated as of the grant date using the following assumptions:
|
Year ended December 31,
|
|||||
|
2015
|
2014
|
2013
|
|||
|
Volatility
|
43%–54%
|
54%–56%
|
56%–60%
|
||
|
Expected term (years)
|
5.5–7.0
|
5.3–6.3
|
5.3–6.1
|
||
|
Risk-free interest rate
|
1.6%–2.0%
|
1.7%–2.0%
|
0.8%–2.4%
|
||
|
Dividend yield
|
—%
|
—%
|
—%
|
||
The fair value of stock purchase rights granted under the ESPP was estimated using the following assumptions:
|
Year ended December 31,
|
|||
|
2015
|
2014
|
||
|
Volatility
|
39%–45%
|
45.5%
|
|
|
Expected term (years)
|
0.5
|
0.6
|
|
|
Risk-free interest rate
|
0.1%–0.2%
|
0.1%
|
|
|
Dividend yield
|
—%
|
—%
|
|
During 2014, the Company used a Monte Carlo valuation model to calculate the fair value of the CEO RSUs subject to a market condition based on the following assumptions: expected term of
10 years
, expected volatility of
50.9%
, risk-free interest rate of
2.69%
, and a grant date fair value of
$18.40
for the underlying shares.
Stock-based compensation expense
The following table summarizes stock-based compensation included in the consolidated statements of operations:
|
Year ended December 31,
|
|||||||||||
|
(in thousands)
|
2015
|
2014
|
2013
|
||||||||
|
Cost of revenue
|
$
|
1,492
|
|
$
|
835
|
|
$
|
690
|
|
||
|
Research and development
|
18,024
|
|
11,640
|
|
3,003
|
||||||
|
Sales and marketing
|
13,762
|
|
10,428
|
|
5,670
|
||||||
|
General and administrative
|
47,402
|
|
48,496
|
|
1,524
|
||||||
|
Total stock-based compensation expense, before income taxes
|
80,680
|
|
71,399
|
|
10,887
|
|
|||||
|
Total tax benefit recognized
|
(27,971
|
)
|
(19,471
|
)
|
(1,104
|
)
|
|||||
|
Total stock-based compensation expense, net of income taxes
|
$
|
52,709
|
|
$
|
51,928
|
|
$
|
9,783
|
|
||
7. Net income per share attributable to common stockholders
Basic and diluted net income per common share is presented in conformity with the two-class method required for participating securities. The Company considers shares issued upon the early exercise of options subject to repurchase and non-vested restricted shares to be participating securities, because holders of such shares have a non-forfeitable right to dividends. Additionally, prior to the Company's IPO and their conversion, the Company considered its redeemable convertible preferred stock to be participating securities due to their non-cumulative dividend rights.
69
GoPro, Inc.
Notes to Consolidated Financial Statements
Basic net income per share attributable to common stockholders is computed by dividing the net income attributable to common stockholders by the weighted-average number of common shares outstanding during the period. All participating securities are excluded from basic weighted average common shares outstanding. Diluted net income per share attributable to common stockholders is computed by dividing the net income attributable to common stockholders by the weighted-average number of common shares outstanding, including all potentially dilutive common shares.
Undistributed earnings are allocated based on the contractual participation rights of Class A and Class B as if the earnings for the year have been distributed. As the liquidation and dividend rights are identical, the undistributed earnings are allocated on a proportionate basis. The computation of the diluted net income per share of Class A common stock assumes the conversion of Class B common stock.
The following table presents the calculations of basic and diluted net income per share attributable to common stockholders:
|
Year ended December 31,
|
|||||||||||||||||||
|
(in thousands, except per share data)
|
2015
|
2014
|
2013
|
||||||||||||||||
|
Class A
|
Class B
|
Class A
|
Class B
|
||||||||||||||||
|
Numerator:
|
|||||||||||||||||||
|
Allocation of net income
|
$
|
24,559
|
|
$
|
11,572
|
|
$
|
16,647
|
|
$
|
111,441
|
|
$
|
60,578
|
|
||||
|
Less: net income allocable to participating securities
|
—
|
|
—
|
|
(2,147
|
)
|
(14,365
|
)
|
(16,727
|
)
|
|||||||||
|
Net income attributable to common stockholders—basic
|
24,559
|
|
11,572
|
|
14,500
|
|
97,076
|
|
43,851
|
|
|||||||||
|
Add: net income allocable to dilutive participating securities
|
—
|
|
—
|
|
2,277
|
|
1,981
|
|
2,309
|
|
|||||||||
|
Reallocation of net income as a result of conversion of Class B to Class A shares
|
11,572
|
|
|
97,076
|
|
—
|
|
—
|
|
||||||||||
|
Reallocation of net income to Class B shares
|
—
|
|
1,974
|
|
—
|
|
2,237
|
|
—
|
|
|||||||||
|
Net income attributable to common stockholders—diluted
|
$
|
36,131
|
|
$
|
13,546
|
|
$
|
113,853
|
|
$
|
101,294
|
|
$
|
46,160
|
|
||||
|
Denominator:
|
|||||||||||||||||||
|
Weighted-average common shares—basic
|
91,486
|
|
43,109
|
|
13,575
|
|
90,878
|
|
81,018
|
|
|||||||||
|
Conversion of Class B to Class A common stock outstanding
|
43,109
|
|
—
|
|
90,878
|
|
—
|
|
—
|
|
|||||||||
|
Effect of potentially dilutive shares
|
11,891
|
|
11,810
|
|
19,177
|
|
19,115
|
|
17,923
|
|
|||||||||
|
Weighted-average common shares—diluted
|
146,486
|
|
54,919
|
|
123,630
|
|
109,993
|
|
98,941
|
|
|||||||||
|
Net income per share attributable to common stockholders:
|
|||||||||||||||||||
|
Basic
|
$
|
0.27
|
|
$
|
0.27
|
|
$
|
1.07
|
|
$
|
1.07
|
|
$
|
0.54
|
|
||||
|
Diluted
|
$
|
0.25
|
|
$
|
0.25
|
|
$
|
0.92
|
|
$
|
0.92
|
|
0.47
|
|
|||||
The following potentially dilutive shares were not included in the calculation of diluted shares outstanding as the effect would have been anti-dilutive:
|
Year ended December 31,
|
||||||||
|
(in thousands)
|
2015
|
2014
|
2013
|
|||||
|
Redeemable convertible preferred stock
|
—
|
|
15,136
|
|
30,523
|
|||
|
Stock options, ESPP shares, and RSUs
|
2,680
|
|
360
|
|
1,409
|
|||
|
Unvested restricted stock awards
|
1
|
|
425
|
|
380
|
|||
|
2,681
|
|
15,921
|
|
32,312
|
|
|||
70
GoPro, Inc.
Notes to Consolidated Financial Statements
8. Income taxes
Income before income taxes consisted of the following:
|
Year ended December 31,
|
|||||||||||
|
(in thousands)
|
2015
|
2014
|
2013
|
||||||||
|
Domestic
|
$
|
13,562
|
|
$
|
114,937
|
|
$
|
57,251
|
|
||
|
Foreign
|
39,023
|
|
66,038
|
|
34,078
|
||||||
|
$
|
52,585
|
|
$
|
180,975
|
|
$
|
91,329
|
|
|||
Income tax expense consisted of the following:
|
Year ended December 31,
|
|||||||||||
|
(in thousands)
|
2015
|
2014
|
2013
|
||||||||
|
Current:
|
|||||||||||
|
Federal
|
$
|
18,548
|
|
$
|
55,846
|
|
$
|
28,856
|
|
||
|
State
|
3,007
|
|
6,075
|
|
1,634
|
||||||
|
Foreign
|
6,539
|
|
8,219
|
|
8,058
|
||||||
|
Total current
|
28,094
|
|
70,140
|
|
38,548
|
||||||
|
Deferred:
|
|||||||||||
|
Federal
|
(11,211
|
)
|
(13,551
|
)
|
(7,268)
|
||||||
|
State
|
(204
|
)
|
(3,369
|
)
|
(861)
|
||||||
|
Foreign
|
(225
|
)
|
(333
|
)
|
332
|
||||||
|
Total deferred
|
(11,640
|
)
|
(17,253
|
)
|
(7,797)
|
||||||
|
Income tax expense
|
$
|
16,454
|
|
$
|
52,887
|
|
$
|
30,751
|
|
||
Income tax expense for 2015 of
$16.5 million
decreased
$36.4 million
from 2014, primarily due to lower pre-tax income.
As of December 31, 2015, undistributed earnings of
$129.1 million
of the Company’s foreign subsidiaries are considered to be indefinitely reinvested and, accordingly, no provision for federal and state income taxes have been provided thereon. The Company intends to reinvest these earnings indefinitely in its foreign subsidiaries. If these earnings were distributed to the United States in the form of dividends or otherwise or if the shares of the relevant foreign subsidiaries were sold or otherwise transferred the Company would be subject to additional U.S. income taxes (subject to adjustment for foreign tax credits) and foreign withholding taxes. We do not intend to repatriate these earnings to fund U.S. operations and, accordingly, we do not provide for U.S. federal income and foreign withholding tax on these earnings. Determination of the amount of unrecognized deferred income tax liability related to these earnings is not practical.
71
GoPro, Inc.
Notes to Consolidated Financial Statements
Income tax expense reconciles to the amount computed by applying the federal statutory rate of
35%
to income before income taxes as follows:
|
Year ended December 31,
|
||||||||||||||||||||
|
2015
|
2014
|
2013
|
||||||||||||||||||
|
(in thousands, except percentage)
|
$
|
%
|
$
|
%
|
$
|
%
|
||||||||||||||
|
Reconciliation to statutory rate:
|
||||||||||||||||||||
|
Tax at federal statutory rate
|
$
|
18,405
|
|
35.0
|
%
|
$
|
63,341
|
|
35.0
|
%
|
$
|
31,965
|
|
35.0
|
%
|
|||||
|
State taxes, net of federal benefit
|
1,454
|
|
2.8
|
|
4,911
|
|
2.7
|
|
2,344
|
|
2.6
|
|
||||||||
|
Impact of foreign operations
|
6,434
|
|
12.2
|
|
(13,305
|
)
|
(7.4
|
)
|
(113
|
)
|
(0.1
|
)
|
||||||||
|
Stock-based compensation
|
2,390
|
|
4.5
|
|
8,050
|
|
4.4
|
|
2,982
|
|
3.3
|
|
||||||||
|
Tax credits
|
(21,891
|
)
|
(41.6
|
)
|
(10,616
|
)
|
(5.9
|
)
|
(5,637
|
)
|
(6.2
|
)
|
||||||||
|
Change in valuation allowance
|
8,555
|
|
16.3
|
|
—
|
|
—
|
|
—
|
|
—
|
|
||||||||
|
Other
|
1,107
|
|
2.1
|
|
506
|
|
0.4
|
|
(790
|
)
|
(0.9
|
)
|
||||||||
|
$
|
16,454
|
|
31.3
|
%
|
$
|
52,887
|
|
29.2
|
%
|
$
|
30,751
|
|
33.7
|
%
|
||||||
The higher effective tax rate for 2015 compared to 2014 was due to higher U.S. taxable income and lower international taxable income, which resulted from incurring a higher proportion of our 2015 operating expenses in foreign jurisdictions. Additionally, the effective tax rate for 2015 was lower than the federal statutory rate of 35% primarily due to benefits from research and development tax credits.
Deferred income taxes reflect the net tax effects of temporary differences between the carrying amounts of assets and liabilities for financial reporting purposes and the amounts used for income tax purposes. Significant components of the Company’s deferred tax assets and liabilities were as follows:
|
December 31,
|
|||||||
|
(in thousands)
|
2015
|
2014
|
|||||
|
Deferred tax assets:
|
|||||||
|
Net operating loss carryforwards
|
$
|
339
|
|
$
|
—
|
|
|
|
Tax credit carryforwards
|
9,372
|
|
2,347
|
|
|||
|
Stock-based compensation
|
19,096
|
|
9,950
|
|
|||
|
Allowance for returns
|
8,812
|
|
9,466
|
|
|||
|
Accruals and reserves
|
20,398
|
|
14,484
|
|
|||
|
Total deferred tax assets
|
58,017
|
|
36,247
|
|
|||
|
Valuation allowance
|
(8,555
|
)
|
—
|
|
|||
|
Total deferred tax assets, net of valuation allowance
|
49,462
|
|
36,247
|
|
|||
|
Deferred tax liabilities:
|
|||||||
|
Depreciation and amortization
|
(6,937
|
)
|
(3,418
|
)
|
|||
|
Intangible assets
|
(2,904
|
)
|
—
|
|
|||
|
Total deferred tax liabilities
|
(9,841
|
)
|
(3,418
|
)
|
|||
|
Net deferred tax assets
|
$
|
39,621
|
|
$
|
32,829
|
|
|
Recognition of deferred tax assets is appropriate when realization of such assets is more likely than not. Based upon the weight of available evidence, which includes the Company’s historical operating performance and the U.S. cumulative net profits in prior periods and anticipated future earnings, the Company believes it is more likely than not that deferred tax assets, other than California research credit carryforwards, will be realized.
The Company's valuation allowance increased by
$8.6 million
during the year ended December 31, 2015. The change in the 2015 valuation allowance was primarily due to the addition of current year California research credit carryforwards.
72
GoPro, Inc.
Notes to Consolidated Financial Statements
As of
December 31, 2015
, the Company’s federal and state net operating loss carryforwards for income tax purposes were approximately
$395.5 million
and
$249.2 million
, and federal and state tax credit carryforwards were approximately
$24.2 million
and
$18.4 million
, respectively. All of the Company's federal loss, federal credit and state loss carryforwards and
$3.9 million
of the state tax credit carryforwards will be recorded to additional paid-in capital when realized. If not utilized, federal loss, federal credit and state loss carryforwards will begin to expire from 2019 to 2035, while the state tax credits may be carried forward indefinitely. If certain substantial changes in the entity's ownership occur, there could be an annual limitation on the amount of the carryforwards that can be utilized.
On December 18, 2015, The Consolidated Appropriations Act of 2016 was signed into law, which retroactively reinstated and made permanent the federal research tax credit provisions from January 1, 2015 through December 31, 2015. As a result, the Company recognized an income tax benefit of
$13.7 million
for federal research credits during the fourth quarter of 2015.
In November 2015, the FASB issued ASU 2015-17 which simplifies the presentation of deferred income taxes by requiring deferred tax assets and liabilities be classified as noncurrent on the balance sheet. The Company early-adopted this standard as of December 31, 2015 on a prospective basis. The impact to the Company's consolidated balance sheet at December 31, 2015 is a reclassification from current to non-current deferred tax assets of
$22.2 million
.
Uncertain income tax positions
As of December 31, 2015, the Company’s total amount of gross unrecognized tax benefits was
$36.3 million
, which represented an increase in unrecognized tax benefits of
$19.7 million
during 2015. If recognized,
$31.0 million
of these unrecognized income tax benefits (net of federal benefit) would be recorded as a reduction of future income tax provision.
A reconciliation of the beginning and ending amount of the unrecognized income tax benefits during the tax periods ending December 31, 2015, 2014 and 2013 are as follows:
|
December 31,
|
|||||||||||
|
(in thousands)
|
2015
|
2014
|
2013
|
||||||||
|
Gross balance at January 1
|
$
|
16,558
|
|
$
|
9,898
|
|
$
|
4,439
|
|
||
|
Gross increase related to current year tax positions
|
19,948
|
6,401
|
5,280
|
||||||||
|
Gross increase related to prior year tax positions
|
108
|
259
|
179
|
||||||||
|
Gross decrease related to prior year tax positions
|
(341)
|
—
|
|
0
|
|||||||
|
$
|
36,273
|
|
$
|
16,558
|
|
$
|
9,898
|
|
|||
The Company’s policy is to account for interest and penalties as income tax expense. As of
December 31, 2015
and
2014
, the Company had accrued interest and penalties of approximately
$0.2 million
and
$0.2 million
related to unrecognized tax benefits. There were
no
accrued interest and penalties as of December 31, 2013.
It is reasonably possible that the total amounts of unrecognized tax benefits will significantly increase within the next 12 months. However, the range of the reasonably possible change cannot be reliably estimated.
The Company files income tax returns in the U.S. and non-U.S. jurisdictions. The Company is subject to U.S. income tax examinations for calendar tax years ending 2011 through 2014, and foreign income tax examinations from 2013 through 2014. The U.S. federal and U.S. state taxing authorities may choose to audit tax returns for tax years beyond the statute of limitation period due to tax attribute carryforwards from prior years, making adjustments only to carryforward attributes.
The Company is currently under examination by the Internal Revenue Service for the 2012 through 2014 tax years and California Franchise Tax Board for the 2011 and 2012 tax years. At this time, the Company is not able to estimate the potential impact that the examination may have on income tax expense. If the examinations are resolved unfavorably, there is a possibility it may have a material negative impact on the Company's results of operations.
73
GoPro, Inc.
Notes to Consolidated Financial Statements
9. Related parties
The Company has agreements for certain contract manufacturing and engineering services with a vendor affiliated with one of the Company's investors. The Company made payments of
$0.2 million
,
$12.2 million
and
$3.6 million
in 2015, 2014 and 2013, respectively, for services rendered. As of December 31, 2015 and 2014, the Company had accounts payable associated with this vendor of
zero
and
$0.1 million
, respectively.
The Company incurs costs for company-related chartered aircraft fees for the use of the CEO’s private plane. The Company made payments of
$1.0 million
and
$0.5 million
in 2015 and 2014, respectively. As of December 31, 2015 and 2014, the Company had accounts payable associated with this vendor of
$0.1 million
and
$0.4 million
, respectively.
In May 2014, the Company amended the outstanding stock options granted to the former Chief Financial Officer to facilitate the net exercise of those options and subsequently repurchased
41,154
shares of common stock from the former Chief Financial Officer's estate at a purchase price of
$18.40
per share.
In June 2014, the CEO purchased
seven
automobiles from the Company for a total purchase price of
$0.3 million
, which was equal to the deemed fair value of the automobiles purchased. There have been no additional such purchases in 2015.
In 2013, the Company entered into a
three
-year agreement, which was amended in August 2015, with a company affiliated with the son of one of the members of the Company's board of directors to acquire certain naming rights to a kart racing facility. As consideration for these naming rights, the Company would pay a total of
$0.5 million
over the three year period. As of
December 31, 2015
, the Company has made cumulative payments of
$0.5 million
and has also provided
100
GoPro capture devices at no cost each year.
In the second quarter of 2013, the Company settled an outstanding legal matter with one of the CEO's family members for
$0.2 million
and loaned one of its executive officers
$0.2 million
pursuant to a demand payment loan that did not bear interest, which was fully repaid in March 2014.
See Notes 5 and 6 above for information regarding CEO RSUs and common stock contributed by the CEO back to the Company.
10. Commitments, contingencies and guarantees
The following table summarizes the Company’s contractual commitments as of
December 31, 2015
:
|
(in thousands)
|
Total
|
2016
|
2017
|
2018
|
2019
|
2020
|
Thereafter
|
||||||||||||||||||||
|
Operating leases
(1)
|
$
|
152,237
|
|
$
|
16,597
|
|
$
|
15,783
|
|
$
|
19,582
|
|
$
|
13,151
|
|
$
|
16,602
|
|
$
|
70,522
|
|
||||||
|
Sponsorship commitments
(2)
|
19,186
|
|
9,889
|
|
3,986
|
|
2,591
|
|
2,720
|
|
—
|
|
—
|
|
|||||||||||||
|
Other contractual commitments
(3)
|
4,574
|
|
3,153
|
|
1,421
|
|
—
|
|
—
|
|
—
|
|
—
|
|
|||||||||||||
|
Capital equipment purchase commitments
(4)
|
5,086
|
|
5,086
|
|
—
|
|
—
|
|
—
|
|
—
|
|
—
|
|
|||||||||||||
|
Total contractual cash obligations
|
$
|
181,083
|
|
$
|
34,725
|
|
$
|
21,190
|
|
$
|
22,173
|
|
$
|
15,871
|
|
$
|
16,602
|
|
$
|
70,522
|
|
||||||
|
(1)
|
The Company leases its facilities under long-term operating leases, which expire at various dates through 2027.
|
|
(2)
|
The Company sponsors events, resorts and athletes as part of its marketing efforts. In many cases, the Company enters into multi-year agreements with event organizers, resorts and athletes.
|
|
(3)
|
The Company purchases software licenses related to its financial and IT systems which require payments over multiple years.
|
|
(4)
|
The Company enters into contracts to acquire equipment for tooling and molds as part of its manufacturing operations. In addition, the Company incurs purchase commitments related to the manufacturing of its point-of-purchase (POP) displays by third parties.
|
Rent expense was
$12.2 million
,
$7.3 million
and
$3.9 million
in 2015,
2014
and 2013, respectively.
74
GoPro, Inc.
Notes to Consolidated Financial Statements
Legal proceedings
From time to time, the Company is involved in legal proceedings in the ordinary course of business. The Company believes that the outcome of any existing litigation, either individually or in the aggregate, will not have a material impact on the results of operations, financial condition or cash flows of the Company.
Indemnifications
In the normal course of business, the Company enters into agreements that contain a variety of representations and warranties and provide for general indemnification. The Company’s exposure under these agreements is unknown because it involves claims that may be made against the Company in the future, but have not yet been made. It is not possible to determine the maximum potential amount under these indemnification agreements due to the Company’s limited history with indemnification claims and the unique facts and circumstances involved in each particular agreement. As of
December 31, 2015
, the Company has not paid any claims or been required to defend any action related to its indemnification obligations. However, the Company may record charges in the future as a result of these indemnification obligations.
Product warranty
The following table summarizes the warranty liability activity:
|
Year ended December 31,
|
|||||||||||
|
(in thousands)
|
2015
|
2014
|
2013
|
||||||||
|
Beginning balances
|
$
|
6,405
|
|
$
|
3,870
|
|
$
|
1,937
|
|
||
|
Charged to cost of revenue
|
25,377
|
|
10,268
|
|
7,380
|
||||||
|
Settlements of warranty claims
|
(20,926
|
)
|
(7,733
|
)
|
(5,447)
|
||||||
|
Ending balances
|
$
|
10,856
|
|
$
|
6,405
|
|
$
|
3,870
|
|
||
At
December 31, 2015
,
$10.4 million
of the warranty liability was recorded as an element of accrued liabilities and
$0.5 million
was recorded as an element of other long-term liabilities. As of December 31, 2014,
$6.0 million
of the warranty liability was recorded as an element of accrued liabilities and
$0.4 million
was recorded as an element of other long-term liabilities.
11. Concentrations of risk and geographic information
Customer concentration
Financial instruments, which potentially subject the Company to concentrations of credit risk, consist principally of trade receivables. The Company believes that credit risk in its accounts receivable is mitigated by the Company’s credit evaluation process, relatively short collection terms and dispersion of its customer base. The Company generally does not require collateral and losses on trade receivables have historically been within management’s expectations.
The Company had the following customers who represented
10%
or more of its net accounts receivable balance as of the dates indicated:
|
December 31,
2015 |
December 31,
2014 |
||
|
Customer A
|
40%
|
17%
|
|
|
Customer B
|
18%
|
11%
|
|
|
Customer C
|
*
|
14%
|
|
* Less than 10% of total accounts receivable for the period indicated
The following table summarizes the Company's accounts receivables sold, without recourse, and factoring fees paid:
75
GoPro, Inc.
Notes to Consolidated Financial Statements
|
Year ended December 31,
|
|||||||||||
|
(in thousands)
|
2015
|
2014
|
2013
|
||||||||
|
Accounts receivable sold
|
$
|
194,223
|
|
$
|
250,437
|
|
$
|
71,066
|
|
||
|
Factoring fees
|
1,566
|
|
2,148
|
|
591
|
|
|||||
Customers with revenue greater than
10%
of the Company's total revenue were as follows:
|
Year ended December 31,
|
|||||
|
2015
|
2014
|
2013
|
|||
|
Customer D
|
14%
|
20%
|
17%
|
||
|
Customer A
|
12%
|
*
|
*
|
||
* Less than 10% of total revenue for the period indicated
Supplier concentration
The Company relies on third parties for
the supply and manufacture of its capture devices, some of which are sole-source suppliers. The Company believes that outsourcing manufacturing enables greater scale and flexibility. As demand and product lines change, the Company periodically evaluates the need and advisability of adding manufacturers to support its operations. In instances where a supply and manufacture agreement does not exist or suppliers fail to perform their obligations, the Company may be unable to find alternative suppliers or satisfactorily deliver its products to its customers on time, if at all. The Company also relies on third parties with whom it outsources supply chain activities related to inventory warehousing, order fulfillment, distribution and other direct sales logistics
.
Geographic and other information
Revenue by geographic region, based on ship-to destinations, was as follows:
|
Year ended December 31,
|
|||||||||||
|
(in thousands)
|
2015
|
2014
|
2013
|
||||||||
|
Americas
|
$
|
868,772
|
|
|
$
|
890,352
|
|
$
|
557,285
|
|
|
|
Europe, Middle East and Africa (EMEA)
|
535,260
|
|
|
371,197
|
|
322,226
|
|
||||
|
Asia and Pacific area countries (APAC)
|
215,939
|
|
|
132,656
|
|
106,226
|
|
||||
|
$
|
1,619,971
|
|
$
|
1,394,205
|
|
$
|
985,737
|
|
|||
Revenue in the United States, which is included in the Americas geographic region, was
$769.2 million
,
$796.0 million
and
$498.5 million
in 2015,
2014
and
2013
, respectively. In 2014, the Company reclassified
four
countries it had previously included in the APAC geographical region to be included in the EMEA geographical region. This caused
$19.3 million
and
$10.6 million
of revenue to be reclassified from the APAC region to the EMEA region in 2014 and 2013, respectively. The Company does not disclose revenue by product category as it does not track sales incentives and other revenue adjustments by product category to report such data.
As of
December 31, 2015
, 2014 and 2013, long-lived assets, which represent gross property and equipment, located outside the United States, primarily in China, were
$47.6 million
,
$25.4 million
and
$6.0 million
, respectively.
76
GoPro, Inc.
Notes to Consolidated Financial Statements
12. Subsequent events (unaudited)
On February 25, 2016, the Company entered into definitive agreements to acquire two privately-held companies that offer mobile video editing applications. The aggregate purchase consideration includes cash consideration of approximately
$105 million
as well as certain deferred consideration subject to specified future employment conditions. The transactions are expected to close in the first half of 2016, subject to the satisfaction of customary closing conditions.
Schedule II
GoPro, Inc.
VALUATION AND QUALIFYING ACCOUNTS
For the years ended December 31, 2015, 2014 and 2013
|
(in thousands)
|
Balance at Beginning of Year
|
Charges to Revenue
|
Charges to Expense
|
Deductions/Write-offs
|
Balance at End of Year
|
||||||||||||||
|
Allowance for doubtful accounts receivable:
|
|||||||||||||||||||
|
Year ended December 31, 2015
|
$
|
1,250
|
|
$
|
—
|
|
$
|
682
|
|
$
|
(532
|
)
|
$
|
1,400
|
|
||||
|
Year ended December 31, 2014
|
520
|
|
—
|
|
970
|
|
(240
|
)
|
1,250
|
|
|||||||||
|
Year ended December 31, 2013
|
262
|
|
—
|
|
663
|
|
(405
|
)
|
520
|
|
|||||||||
|
Allowance for sales returns:
|
|||||||||||||||||||
|
Year ended December 31, 2015
|
$
|
25,747
|
|
$
|
48,182
|
|
$
|
(47,649
|
)
|
$
|
—
|
|
$
|
26,280
|
|
||||
|
Year ended December 31, 2014
|
14,352
|
|
39,011
|
|
(27,616
|
)
|
—
|
|
25,747
|
|
|||||||||
|
Year ended December 31, 2013
|
9,077
|
|
24,156
|
|
(18,881
|
)
|
—
|
|
14,352
|
|
|||||||||
|
Valuation allowance for deferred tax assets:
|
|||||||||||||||||||
|
Year ended December 31, 2015
|
$
|
—
|
|
$
|
—
|
|
$
|
8,555
|
|
$
|
—
|
|
$
|
8,555
|
|
||||
None.
Evaluation of Disclosure Controls and Procedures
We maintain “disclosure controls and procedures,” as defined in Rules 13a-15(e) and 15d-15(e) under the Exchange Act, that are designed to ensure that information required to be disclosed by a company in the reports that it files or submits under the Exchange Act is recorded, processed, summarized and reported, within the time periods specified in the SEC’s rules and forms. Disclosure controls and procedures include, without limitation, controls and procedures designed to ensure that information required to be disclosed by a company in the reports that it files or submits under the Exchange Act is accumulated and communicated to the company’s management, including its principal executive and principal financial officers, as appropriate to allow timely decisions regarding required disclosure.
77
Our management, with the participation of our Chief Executive Officer and our Chief Financial Officer, evaluated the effectiveness of our disclosure controls and procedures as of December 31, 2015. Based on the evaluation of our disclosure controls and procedures as of December 31, 2015, our Chief Executive Officer and Chief Financial Officer concluded that, as of such date, our disclosure controls and procedures were effective at the reasonable assurance level.
Management’s Report on Internal Control Over Financial Reporting
Our management is responsible for establishing and maintaining adequate internal control over financial reporting (as defined in Rule 13a-15(f) under the Exchange Act). Our management conducted an assessment of the effectiveness of our internal control over financial reporting based on the criteria established in “Internal Control - Integrated Framework” (2013) issued by the Committee of Sponsoring Organizations of the Treadway Commission (COSO). Based on that assessment, our management has concluded that our internal control over financial reporting was effective as of December 31, 2015. The effectiveness of the Company’s internal control over financial reporting as of December 31, 2015 has been audited by PricewaterhouseCoopers LLP, an independent registered public accounting firm, as stated in their report which appears herein.
Changes in Internal Control over Financial Reporting
There was no change in our internal control over financial reporting identified in connection with the evaluation required by Rules 13a-15(d) and 15d-15(d) of the Exchange Act that occurred during the three months ended December 31, 2015 that has materially affected, or is reasonably likely to materially affect, our internal control over financial reporting.
Inherent Limitations on Effectiveness of Controls
Our management, including the CEO and CFO, recognizes that our disclosure controls and procedures or our internal control over financial reporting cannot prevent or detect all possible instances of errors and all fraud. A control system, no matter how well designed and operated, can provide only reasonable, not absolute, assurance that the control system's objectives will be met. The design of a control system must reflect the fact that there are resource constraints, and the benefits of controls must be considered relative to their costs.
None.
The information required for this Item is incorporated by reference from our Proxy Statement to be filed for our 2016 Annual Meeting of Stockholders within 120 days after the end of the fiscal year ended December 31, 2015.
The information required for this Item is incorporated by reference from our Proxy Statement to be filed for our 2016 Annual Meeting of Stockholders within 120 days after the end of the fiscal year ended December 31, 2015.
The information required for this Item is incorporated by reference from our Proxy Statement to be filed for our 2016 Annual Meeting of Stockholders within 120 days after the end of the fiscal year ended December 31, 2015.
78
The information required for this Item is incorporated by reference from our Proxy Statement to be filed for our 2016 Annual Meeting of Stockholders within 120 days after the end of the fiscal year ended December 31, 2015.
The information required for this Item is incorporated by reference from our Proxy Statement to be filed for our 2016 Annual Meeting of Stockholders within 120 days after the end of the fiscal year ended December 31, 2015.
|
1.
|
Financial Statements
|
The financial statements filed as part of this report are listed in the "Index to Financial Statements" under Part II, Item 8 of this report.
|
2.
|
Financial Statement Schedules
|
All schedules are omitted as the required information is inapplicable or the information is presented in the Consolidated Financial Statements or Notes to Consolidated Financial Statements under Item 8.
3.
Exhibits
The information required by this item is set forth on the exhibit index which follows the signature page of this report.
79
SIGNATURES
Pursuant to the requirements of Section 13 or Section 15(d) of the Securities Exchange Act of 1934, the registrant has duly caused this Annual Report on Form 10-K to be signed on its behalf by the undersigned, thereunto duly authorized.
|
GoPro, Inc.
|
||
|
(Registrant)
|
||
|
Dated:
|
February 29, 2016
|
By: /s/ Nicholas Woodman
|
|
Nicholas Woodman
Chief Executive Officer
(Principal Executive Officer)
|
||
POWER OF ATTORNEY
KNOW ALL PERSONS BY THESE PRESENTS
, that each person whose signature appears below hereby constitutes and appoints Nicholas Woodman and Jack Lazar, and each of them, as his true and lawful attorneys-in-fact, proxies and agents, each with full power of substitution, for him in any and all capacities, to sign any and all amendments to this Annual Report on Form 10-K, and to file the same, with all exhibits thereto and other documents in connection therewith, with the Securities and Exchange Commission, granting unto said attorneys-in-fact, proxies and agents full power and authority to do and perform each and every act and thing requisite and necessary to be done in connection therewith, as fully for all intents and purposes as he might or could do in person, hereby ratifying and confirming all that said attorneys-in-fact, proxies and agents, or their or his substitute or substitutes, may lawfully do or cause to be done by virtue hereof.
Pursuant to the requirements of the Securities Exchange Act of 1934, this report has been signed below by the following persons on behalf of the registrant and in the capacities and on the dates indicated.
80
|
Name
|
Title
|
Date
|
|||
|
By:
|
/s/ Nicholas Woodman
|
Chief Executive Officer and Chairman
|
February 29, 2016
|
||
|
Nicholas Woodman
|
(Principal Executive Officer)
|
||||
|
By:
|
/s/ Jack Lazar
|
Chief Financial Officer
|
February 29, 2016
|
||
|
Jack Lazar
|
(Principal Financial and Accounting Officer)
|
||||
|
By:
|
/s/ Anthony Bates
|
President and Director
|
February 29, 2016
|
||
|
Anthony Bates
|
|||||
|
By:
|
/s/ Michael Marks
|
Director
|
February 29, 2016
|
||
|
Michael Marks
|
|||||
|
By:
|
/s/ Peter Gotcher
|
Director
|
February 29, 2016
|
||
|
Peter Gotcher
|
|||||
|
By:
|
/s/ Edward Gilhuly
|
Director
|
February 29, 2016
|
||
|
Edward Gilhuly
|
|||||
|
By:
|
/s/ Kenneth Goldman
|
Director
|
February 29, 2016
|
||
|
Kenneth Goldman
|
|||||
|
By:
|
/s/ Zander Lurie
|
Director
|
February 29, 2016
|
||
|
Zander Lurie
|
|||||
81
EXHIBIT INDEX
|
Exhibit
|
Incorporated by Reference
|
Filed
|
|||||
|
Number
|
Exhibit Title
|
Form
|
File No.
|
Exhibit
|
Filing Date
|
Herewith
|
|
|
3.01
|
|
Restated Certificate of Incorporation of the Registrant.
|
S-1
|
333-200038
|
3.01
|
November 10, 2014
|
|
|
3.02
|
|
Amended and Restated Bylaws of the Registrant.
|
S-1
|
333-200038
|
3.02
|
November 10, 2014
|
|
|
4.01
|
|
Form of Registrant’s Class A common stock certificate.
|
S-1
|
333-196083
|
4.01
|
May 19, 2014
|
|
|
4.02
|
|
Investors’ Rights Agreement, dated as of February 26, 2011, by and among the Registrant and certain investors, as amended.
|
S-1
|
333-196083
|
4.02
|
May 19, 2014
|
|
|
10.01*
|
|
Form of Indemnity Agreement by and between the Registrant and each of its directors and executive officers.
|
S-1
|
333-196083
|
10.01
|
May 19, 2014
|
|
|
10.02*
|
|
2010 Equity Incentive Plan, as amended, and form of stock option agreement and restricted stock unit agreement.
|
S-1
|
333-196083
|
10.02
|
May 19, 2014
|
|
|
10.03*
|
|
2014 Equity Incentive Plan and forms thereunder.
|
S-1
|
333-196083
|
10.03
|
June 11, 2014
|
|
|
10.04*
|
|
2014 Employee Stock Purchase Plan and forms thereunder.
|
S-1
|
333-196083
|
10.04
|
June 11, 2014
|
|
|
10.05*
|
|
Offer Letter to Nina Richardson from the Registrant, dated February 8, 2013.
|
S-1
|
333-196083
|
10.05
|
May 19, 2014
|
|
|
10.06*
|
|
Offer Letter to Jack Lazar from the Registrant, dated January 17, 2014.
|
S-1
|
333-196083
|
10.07
|
May 19, 2014
|
|
|
10.07*
|
|
Offer Letter to Sharon Zezima from the Registrant, dated August 23, 2013.
|
S-1
|
333-196083
|
10.08
|
May 19, 2014
|
|
|
10.08*
|
Amended and Restated Offer Letter to Anthony Bates from the Registrant, effective as of October 23, 2014.
|
S-1
|
333-200038
|
10.16
|
November 10, 2014
|
||
|
10.09*
|
|
Form of Change in Control Severance Agreement.
|
S-1
|
333-196083
|
10.09
|
May 19, 2014
|
|
|
10.10*
|
|
Amended and Restated Change in Control Severance Agreement dated June 8, 2014, by and between Jack Lazar and the Registrant.
|
S-1
|
333-196083
|
10.1
|
June 11, 2014
|
|
|
10.11
|
|
Contribution Agreement dated December 28, 2011 by and between Nicholas Woodman and the Registrant.
|
S-1
|
333-196083
|
10.11
|
May 19, 2014
|
|
|
10.12
|
|
Office Lease Agreement, dated as of November 1, 2011, by and between Locon San Mateo, LLC and the Registrant, as amended, and other leases for the Registrant’s headquarters.
|
S-1
|
333-196083
|
10.12
|
May 19, 2014
|
|
|
10.13†
|
Design, Manufacturing and Supply Agreement, dated as of August 18, 2011, by and between Chicony Electronics Co. Ltd. and the Registrant.
|
S-1
|
333-196083
|
10.14
|
May 19, 2014
|
||
|
10.14*
|
|
Employment Letter to Nicholas Woodman from the Registrant, dated June 2, 2014.
|
S-1
|
333-196083
|
10.16
|
June 11, 2014
|
|
|
10.15*
|
|
Amended and Restated Change in Control Severance Agreement dated June 8, 2014 by and between Nina Richardson and the Registrant.
|
S-1
|
333-196083
|
10.18
|
June 11, 2014
|
|
|
10.16
|
Seventh amendment to Office Lease Agreement, by and between RAR2 - Clearview Business Park Owner QRS, LLC and the Registrant, dated November 23, 2015.
|
X
|
|||||
|
21.01
|
List of Subsidiaries
|
X
|
|||||
|
23.01
|
Consent of Independent Registered Public Accounting Firm
|
X
|
|||||
|
24.01
|
|
Power of Attorney (included on the signature page to this Annual Report on Form 10-K).
|
X
|
||||
82
|
31.01
|
Certification of Principal Executive Officer Required Under Rule 13a-14(a) and 15d-14(a) of the Securities Exchange Act of 1934, as amended.
|
X
|
|||||
|
31.02
|
Certification of Principal Financial Officer Required Under Rule 13a-14(a) and 15d-14(a) of the Securities Exchange Act of 1934, as amended.
|
X
|
|||||
|
32.01‡
|
Certification of the Chief Executive Officer Pursuant to 18 U.S.C. Section 1350
|
X
|
|||||
|
32.02‡
|
Certification of the Chief Financial Officer Pursuant to 18 U.S.C. Section 1350
|
X
|
|||||
|
101.INS
|
XBRL Instance Document
|
||||||
|
101.SCH
|
XBRL Taxonomy Extension Schema
|
||||||
|
101.CAL
|
XBRL Taxonomy Extension Calculation Linkbase
|
||||||
|
101.LAB
|
XBRL Taxonomy Extension Label Linkbase
|
||||||
|
101.PRE
|
XBRL Taxonomy Extension Presentation Linkbase
|
||||||
|
101.DEF
|
XBRL Taxonomy Extension Definition Linkbase
|
||||||
* Indicates a management contract or compensatory plan.
† Portions of this exhibit have been granted confidential treatment by the SEC.
‡ As contemplated by SEC Release No. 33-8212, these exhibits are furnished with this Annual Report on Form 10-K and are not deemed filed with the SEC and are not incorporated by reference in any filing of GoPro, Inc. under the Securities Act of 1933 or the Exchange Act of 1934, whether made before or after the date hereof and irrespective of any general incorporation language in such filings.
83
TABLE OF CONTENTS
Part I. Financial InformationItem 1. BusinessItem 1A. Risk FactorsItem 1B. Unresolved Staff CommentsItem 2. PropertiesItem 3. Legal ProceedingsItem 4. Mine Safety DisclosuresPart IIItem 5. Market For Registrant's Common Equity, Related Stockholder Matters and Issuer Purchases Of Equity SecuritiesItem 6. Selected Consolidated Financial DataItem 7. Management S Discussion and Analysis Of Financial Condition and Results Of OperationsItem 7A. Quantitative and Qualitative Disclosures About Market RiskItem 8. Financial Statements and Supplementary DataItem 9. Changes in and Disagreements with Accountants on Accounting and Financial DisclosureItem 9A. Controls and ProceduresItem 9B. Other InformationPart IIIItem 10. Directors, Executive Officers and Corporate GovernanceItem 11. Executive CompensationItem 12. Security Ownership Of Certain Beneficial Owners and Management and Related Stockholder MattersItem 13. Certain Relationships and Related Transactions, and Director IndependenceItem 14. Principal Accounting Fees and ServicesPart IVItem 15. Exhibits, Financial Statement Schedules