GAP INC
10-Ks and 10-Qs
|
|
|
|
|
|
|
|
|
|
|
|
|
|
|
|
|
|
|
|
|
|
|
|
|
|
|
|
|
|
|
|
|
|
|
|
|
|
|
|
|
|
|
|
|
|
|
|
|
|
|
|
|
|
|
|
|
|
|
UNITED STATES
SECURITIES AND EXCHANGE COMMISSION
Washington, D.C. 20549
FORM 10-K
(Mark One)
|
þ
|
Annual report pursuant to Section 13 or 15(d) of the Securities Exchange Act of 1934 For the Fiscal year ended February 1, 2014
|
|
¨
|
Transition report pursuant to Section 13 or 15(d) of the Securities Exchange Act of 1934 For the transition period from
to
|
Commission File Number 1-7562
THE GAP, INC.
(Exact name of registrant as specified in its charter)
|
Delaware
|
94-1697231
|
|
(State of Incorporation)
|
(I.R.S. Employer Identification No.)
|
|
Two Folsom Street, San Francisco, California
|
94105
|
|
(Address of principal executive offices)
|
(Zip code)
|
Registrant’s telephone number, including area code:
(415) 427-0100
Securities registered pursuant to Section 12(b) of the Act:
|
Common Stock, $0.05 par value
|
The New York Stock Exchange
|
|
(Title of class)
|
(Name of exchange where registered)
|
Securities registered pursuant to Section 12(g) of the Act:
None
Indicate by check mark if the registrant is a well-known seasoned issuer, as defined in Rule 405 of the Securities Act. Yes
þ
No
¨
Indicate by check mark if the registrant is not required to file reports pursuant to Section 13 or Section 15(d) of the Act. Yes
¨
No
þ
Indicate by check mark whether the registrant (1) has filed all reports required to be filed by Section 13 or 15(d) of the Securities Exchange Act of 1934 during the preceding 12 months (or for such shorter period that the registrant was required to file such reports), and (2) has been subject to such filing requirements for the past 90 days.
Yes
þ
No
¨
Indicate by check mark whether the registrant has submitted electronically and posted on its corporate Web site, if any, every Interactive Data File required to be submitted and posted pursuant to Rule 405 of Regulation S-T during the preceding 12 months (or for such shorter period that the registrant was required to submit and post such files). Yes
þ
No
¨
Indicate by check mark if disclosure of delinquent filers pursuant to Item 405 of Regulation S-K is not contained herein, and will not be contained, to the best of registrant’s knowledge, in definitive proxy or information statements incorporated by reference in Part III of this Form 10-K or any amendment to this Form 10-K.
þ
Indicate by check mark whether the registrant is a large accelerated filer, an accelerated filer, a non-accelerated filer, or a smaller reporting company. See the definitions of “large accelerated filer,” “accelerated filer” and “smaller reporting company” in Rule 12b-2 of the Exchange Act:
|
Large accelerated filer
þ
|
|
Accelerated filer
¨
|
|
Non-accelerated filer
¨
|
|
Smaller reporting company
¨
|
Indicate by check mark whether the registrant is a shell company (as defined in Rule 12b-2 of the Act). Yes
¨
No
þ
The aggregate market value of the voting and non-voting common equity held by non-affiliates of the registrant as of
August 2, 2013
was approximately
$14 billion
based upon the last price reported for such date in the NYSE-Composite transactions.
The number of shares of the registrant’s common stock outstanding as of
March 18, 2014
was
447,001,764
.
Documents Incorporated by Reference
Portions of the registrant’s Proxy Statement for the Annual Meeting of Shareholders to be held on
May 20, 2014
(hereinafter referred to as the “2014 Proxy Statement”) are incorporated into Part III.
Special Note on Forward-Looking Statements
This Annual Report on Form 10-K contains forward-looking statements within the “safe harbor” provisions of the Private Securities Litigation Reform Act of 1995. All statements other than those that are purely historical are forward-looking statements. Words such as “expect,” “anticipate,” “believe,” “estimate,” “intend,” “plan,” “project,” and similar expressions also identify forward-looking statements. Forward-looking statements include, but are not limited to, statements regarding the following:
|
•
|
optimizing our inventory levels and increasing the efficiency and responsiveness of our supply chain through strategic initiatives;
|
|
•
|
moving to a global brand structure and pursuing continued international expansion;
|
|
•
|
our ability to supplement near-term liquidity, if necessary, with our revolving credit facility;
|
|
•
|
target cash balance and ability to provide for our working capital needs and for unexpected business downturns;
|
|
•
|
our ability to maintain a strong financial profile with ample liquidity;
|
|
•
|
developing an omni-channel shopping experience for our customers through the integration of our store and digital shopping channels;
|
|
•
|
the outcome of proceedings, lawsuits, disputes, and claims;
|
|
•
|
growing sales;
|
|
•
|
managing our expenses in a disciplined manner;
|
|
•
|
delivering operating margin expansion and earnings per share growth;
|
|
•
|
returning excess cash to shareholders;
|
|
•
|
growing revenues through new brands, channels, and geographies;
|
|
•
|
opening additional stores in Asia, with a focus on Gap China, Old Navy China, and Old Navy Japan;
|
|
•
|
expanding our global outlet presence;
|
|
•
|
continuing to expand our franchise presence worldwide;
|
|
•
|
opening additional Athleta stores;
|
|
•
|
impact of foreign exchange rate fluctuations, including the impact on our net sales and gross margins for foreign subsidiaries;
|
|
•
|
diluted earnings per share in fiscal 2014;
|
|
•
|
the number of new store openings and store closings in fiscal 2014;
|
|
•
|
net square footage change in fiscal 2014;
|
|
•
|
the number of new franchise stores in fiscal 2014;
|
|
•
|
operating margin in fiscal 2014;
|
|
•
|
the effective tax rate in fiscal 2014;
|
|
•
|
current cash balances and cash flows being sufficient to support our business operations, including growth initiatives and planned capital expenditures;
|
|
•
|
depreciation and amortization in fiscal 2014;
|
|
•
|
cash spending for purchases of property and equipment in fiscal 2014;
|
|
•
|
our plan to increase our dividend in fiscal 2014;
|
|
•
|
the estimates and assumptions we use in our accounting policies;
|
|
•
|
the assumptions used to estimate the grant date fair value of stock options issued;
|
|
•
|
the expected impact of future lease payments associated with our lease loss reserves;
|
|
•
|
our intention to utilize undistributed earnings of our foreign subsidiaries;
|
|
•
|
total gross unrecognized tax benefits;
|
|
•
|
expected payments to International Business Machines Corporation (“IBM”); and
|
|
•
|
the impact of losses due to indemnification obligations.
|
Because these forward-looking statements involve risks and uncertainties, there are important factors that could cause our actual results to differ materially from those in the forward-looking statements. These factors include, without limitation, the following:
|
•
|
the risk that the adoption of new accounting pronouncements will impact future results;
|
|
•
|
the risk that changes in global economic conditions or consumer spending patterns could adversely impact our results of operations;
|
|
•
|
the highly competitive nature of our business in the United States and internationally;
|
|
•
|
the risk that we or our franchisees will be unsuccessful in gauging apparel trends and changing consumer preferences;
|
|
•
|
the risk that if we are unable to manage our inventory effectively, our gross margins will be adversely affected;
|
|
•
|
the risks to our efforts to expand internationally, including our ability to operate under a global brand structure, foreign exchange, and operating in regions where we have less experience;
|
|
•
|
the risks to our business, including our costs and supply chain, associated with global sourcing and manufacturing;
|
|
•
|
the risks associated with importing merchandise from foreign countries, including failure of our vendors to adhere to our Code of Vendor Conduct, could have a negative impact on our reputation or operations;
|
|
•
|
the risk that trade matters could increase the cost or reduce the supply of apparel available to us and adversely affect our business, financial condition, and results of operations;
|
|
•
|
the risk that our franchisees’ operation of franchise stores is not directly within our control and could impair the value of our brands;
|
|
•
|
the risk that we or our franchisees will be unsuccessful in identifying, negotiating, and securing new store locations and renewing, modifying, or terminating leases for existing store locations effectively;
|
|
•
|
the risk that comparable sales and margins will experience fluctuations;
|
|
•
|
the risk that changes in our credit profile or deterioration in market conditions may limit our access to the capital markets and adversely impact our financial results or our business initiatives;
|
|
•
|
the risk that the failure to attract and retain key personnel could have an adverse impact on our results of operations;
|
|
•
|
the risk that our investments in omni-channel shopping initiatives may not deliver the results we anticipate;
|
|
•
|
the risk that updates or changes to our information technology (“IT”) systems may disrupt our operations;
|
|
•
|
the risk that we are subject to data or other security breaches that may result in increased costs, violations of law, significant legal and financial exposure, and a loss of confidence in our security measures, which could have an adverse effect on our results of operations and our reputation;
|
|
•
|
the risk that natural disasters, public health crises, political crises, or other catastrophic events could adversely affect our operations and financial results, or those of our franchisees or vendors;
|
|
•
|
the risk that changes in the regulatory or administrative landscape could adversely affect our financial condition, strategies, and results of operations;
|
|
•
|
the risk that we do not repurchase some or all of the shares we anticipate purchasing pursuant to our repurchase program; and
|
|
•
|
the risk that we will not be successful in defending various proceedings, lawsuits, disputes, claims, and audits.
|
Additional information regarding factors that could cause results to differ can be found in this Annual Report on Form 10-K and our other filings with the U.S. Securities and Exchange Commission (“SEC”).
Future economic and industry trends that could potentially impact net sales and profitability are difficult to predict. These forward-looking statements are based on information as of
March 24, 2014
, and we assume no obligation to publicly update or revise our forward-looking statements even if experience or future changes make it clear that any projected results expressed or implied therein will not be realized.
THE GAP, INC.
2013
ANNUAL REPORT ON FORM 10-K
TABLE OF CONTENTS
|
|
|
Page
|
|
PART I
|
||
|
Item 1.
|
||
|
Item 1A.
|
||
|
Item 1B.
|
||
|
Item 2.
|
||
|
Item 3.
|
||
|
Item 4.
|
||
|
PART II
|
||
|
Item 5.
|
||
|
Item 6.
|
||
|
Item 7.
|
||
|
Item 7A.
|
||
|
Item 8.
|
||
|
Item 9.
|
||
|
Item 9A.
|
||
|
Item 9B.
|
||
|
PART III
|
||
|
Item 10.
|
||
|
Item 11.
|
||
|
Item 12.
|
||
|
Item 13.
|
||
|
Item 14.
|
||
|
PART IV
|
||
|
Item 15.
|
||
General
The Gap, Inc. (Gap Inc., the “Company,” “we,” and “our”) was incorporated in the State of California in July 1969 and was reincorporated under the laws of the State of Delaware in May 1988.
Gap Inc. is a leading global apparel retail company. We offer apparel, accessories, and personal care products for men, women, and children under the Gap, Banana Republic, Old Navy, Piperlime, Athleta, and Intermix brands. Our global portfolio of distinct brands across multiple channels and geographies gives us a competitive advantage in the global retail marketplace. We operate in the specialty, outlet, online, and franchise channels.
Gap Inc. has Company-operated stores in the United States, Canada, the United Kingdom, France, Ireland, Japan, Italy, China, Hong Kong, and beginning in March 2014, Taiwan. We also have franchise agreements with unaffiliated franchisees to operate Gap, Banana Republic, and Old Navy stores throughout Asia, Australia, Eastern Europe, Latin America, the Middle East, and Africa. Under these agreements, third parties operate, or will operate, stores that sell apparel and related products under our brand names. We have grown our franchise store base to
375
stores in 41 countries as of the end of
fiscal 2013
. Our products are also available to customers online through Company-owned websites and through the use of third parties that provide logistics and fulfillment services. Most of the products sold under our brand names are designed by us and manufactured by independent sources. We also sell products that are designed and manufactured by branded third parties, especially at our Piperlime and Intermix brands.
Gap.
Founded in 1969, Gap is our flagship brand and remains one of the most iconic apparel brands in the marketplace today. The brand stands for casual, American style and offers classic apparel at accessible price points to help customers express their individuality.
Gap entered the children’s apparel market in 1986 with GapKids and in 1989 with babyGap. Maternity apparel was later added to the collection. In 1998, we launched GapBody, which offers loungewear, sleepwear, intimates, and active apparel for women. Today, Gap products are available globally in our specialty and outlet stores, online, and in franchise stores.
Banana Republic.
Banana Republic is a global apparel and accessories brand that focuses on delivering modern, covetable workplace style for both men and women. The brand offers versatile workwear that can be styled for any occasion - from desk to dinner. Banana Republic also partners with notable fashion designers to offer exclusive limited-edition collections inspired by the designers' distinct styles and trends.
Acquired in 1983 with two stores, Banana Republic has evolved to offer collections that include apparel, handbags, shoes, jewelry, personal care products, and eyewear for men and women at higher price points than Gap. Today, customers can purchase Banana Republic products globally in our specialty and outlet stores, online, and in franchise stores.
Old Navy.
Old Navy opened its first store in 1994, making current American essentials accessible to every family. The brand offers customers on-trend clothing and accessories, as well as updated basics for adults and children at great prices in a unique and energizing shopping environment. Customers can purchase Old Navy products in stores and online, which includes online-exclusive items such as a plus-size line. In July 2012, the brand opened its first store outside of North America in Odaiba, Japan. In March 2014, the brand opened its first store in Shanghai, China and its first franchise location in the Philippines.
Piperlime.
Launched in 2006, Piperlime offers a mix of private-label and branded apparel and accessories, as well as leading brands in shoes and handbags. The brand inspires customers with a fresh and unique mix of products, brands, and price points, as well as favorite picks and tips on how to wear the season's trends from famous guest editors. Customers can shop online and in the brand's store, which opened in the SoHo neighborhood of New York in September 2012.
1
Athleta.
Acquired in September 2008, Athleta is Gap Inc.’s premier fitness and lifestyle brand in the rapidly growing women's active apparel market. Athleta offers high-quality, stylish, and functional apparel, footwear, and accessories across a wide variety of sports and fitness activities, including crossover apparel and casualwear. Customers can purchase Athleta products online, in stores, and through catalogs.
Intermix.
Acquired in December 2012, Intermix is known for its tasteful mixing of luxury and contemporary fashion and offers the most coveted existing and up-and-coming designer brands. In addition to its array of seasonal must-haves, Intermix also offers exclusive designer product. Customers can shop in stores in the United States and Canada, and online.
All sales to customers are tendered for cash, debit cards, credit cards, or personal checks. We also issue and redeem gift cards through our brands. Gap, Banana Republic, and Old Navy each have a private label credit card program and a co-branded credit card program through which frequent customers receive benefits. Private label and co-branded credit cards are provided by a third-party financing company.
The range of merchandise displayed in each store varies depending on the selling season and the size and location of the store. Stores are generally open seven days per week (where permitted by law) and most holidays.
We ended
fiscal 2013
with
3,539
Company-operated and franchise store locations. For more information on the number of stores by brand and region, see the table in “Management’s Discussion and Analysis of Financial Condition and Results of Operations” included in Part II, Item 7 of this Form 10-K.
Certain financial information about international operations is set forth under the heading "Segment Information" in Note 17 of Notes to Consolidated Financial Statements included in Part II, Item 8 of this Form 10-K.
Merchandise Vendors
We purchase private label and non-private label merchandise from over 1,000 vendors. Our vendors have factories in about 40 countries. No vendor accounted for more than 5 percent of the dollar amount of our total
fiscal 2013
purchases. Of our merchandise purchased during
fiscal 2013
, approximately 98 percent of purchases, by dollar value, were from factories outside the United States, while the remaining 2 percent of all purchases were from domestic factories. Approximately 28 percent of our purchases, by dollar value, were from factories in China. Product cost increases or events causing disruption of imports from China or other foreign countries, including the imposition of additional import restrictions or vendors potentially failing due to political, financial, or regulatory issues, could have an adverse effect on our operations. Substantially all of our foreign purchases of merchandise are negotiated and paid for in U.S. dollars. Also see the sections entitled “Risk Factors—Our business, including our costs and supply chain, is subject to risks associated with global sourcing and manufacturing," "Risk Factors—Risks associated with importing merchandise from foreign countries, including failure of our vendors to adhere to our Code of Vendor Conduct, could harm our business,” and “Risk Factors—Trade matters may disrupt our supply chain” in Item 1A of this Form 10-K.
Seasonal Business
Our business follows a seasonal pattern, with sales peaking over a total of about eight weeks during the end-of-year holiday period.
Brand Building
Our ability to develop and evolve our existing brands is a key to our success. We believe our distinct brands are among our most important assets. With the exception of Piperlime and Intermix, virtually all aspects of brand development, from product design and distribution to marketing, merchandising and shopping environments, are controlled by Gap Inc. employees. With respect to Piperlime and Intermix, we control all aspects of brand development except for product design related to third-party products. We continue to invest in our brands and enhance the customer experience through significant investments in marketing, enhancement of our online shopping sites, international expansion, remodeling of existing stores, and continued focus on customer service.
2
Trademarks and Service Marks
Gap, GapKids, babyGap, GapBody, Banana Republic, Old Navy, Piperlime, Athleta, and Intermix trademarks and service marks, and certain other trademarks, have been registered, or are the subject of pending trademark applications, with the United States Patent and Trademark Office and with the registries of many foreign countries and/or are protected by common law.
Franchising
We have franchise agreements with unaffiliated franchisees to operate Gap, Banana Republic, and Old Navy stores in a number of countries throughout Asia, Australia, Eastern Europe, Latin America, the Middle East, and Africa. Under these agreements, third parties operate, or will operate, stores that sell apparel and related products under our brand names. We continue to increase the number of countries in which we enter into these types of arrangements as part of our strategy to expand internationally. For additional information on risks related to our franchise business, see the sections entitled “Risk Factors—Our efforts to expand internationally may not be successful” and “Risk Factors—Our franchise business is subject to certain risks not directly within our control that could impair the value of our brands” in Item 1A of this Form 10-K.
Inventory
The nature of the retail business requires us to carry a significant amount of inventory, especially prior to peak holiday selling season when we, along with other retailers, generally build up inventory levels. We maintain a large part of our inventory in distribution centers. We review our inventory levels in order to identify slow-moving merchandise and broken assortments (items no longer in stock in a sufficient range of sizes or colors) and we primarily use promotions and markdowns to clear merchandise. Also see the sections entitled “Risk Factors—We must successfully gauge apparel trends and changing consumer preferences to succeed” and "Risk Factors—If we are unable to manage our inventory effectively, our gross margins could be adversely affected" in Item 1A of this Form 10-K.
Competitors
The global apparel retail industry is highly competitive. We compete with local, national, and global apparel retailers. We are also faced with competition in European, Japanese, Chinese, and Canadian markets from established regional and national chains, and our franchisees face significant competition in the markets in which they operate. Also see the section entitled “Risk Factors—Our business is highly competitive” in Item 1A of this Form 10-K.
Employees
As of
February 1, 2014
, we had a workforce of approximately
137,000
employees, which includes a combination of part-time and full-time employees. We also hire seasonal employees, primarily during the peak end-of-year holiday period.
To remain competitive in the apparel retail industry, we must attract, develop, and retain skilled employees in our design, merchandising, marketing, and other functions. Competition for such personnel is intense. Our success is dependent to a significant degree on the continued contributions of key employees. Also see the section entitled “Risk Factors—The failure to attract and retain key personnel could have an adverse impact on our results of operations” in Item 1A of this Form 10-K.
Available Information
We make available on our website, www.gapinc.com, under “Investors, Financial Information, SEC Filings,” free of charge, our annual reports on Form 10-K, quarterly reports on Form 10-Q, current reports on Form 8-K, and amendments to those reports as soon as reasonably practicable after we electronically file or furnish them to the SEC.
3
Our Board of Directors Committee Charters (Audit and Finance, Compensation and Management Development, and Governance and Nominating Committees) and Corporate Governance Guidelines are also available on our website under “Investors, Governance.” Our Code of Business Conduct can be found on our website under “Investors, Corporate Compliance, Code of Business Conduct.” Any amendments and waivers to the code will also be available on the website.
Executive Officers of the Registrant
The following are our executive officers:
Name, Age, Position, and Principal Occupation:
Michelle Banks
, 50, Executive Vice President, General Counsel, Corporate Secretary, and Chief Compliance Officer since March 2011; Senior Vice President, General Counsel, Corporate Secretary, and Chief Compliance Officer from March 2008 to March 2011; Senior Vice President and General Counsel from November 2006 to March 2008; Vice President from March 2005 to November 2006.
Jack Calhoun
, 49, Global President, Banana Republic since November 2012; President, Banana Republic North America from 2007 to November 2012; Executive Vice President, Merchandising and Marketing, Banana Republic North America from 2003 to 2007.
John T. (Tom) Keiser
, 48, Executive Vice President, Global Product Operations since November 2013; Executive Vice President and Chief Information Officer from January 2010 to November 2013; Executive Vice President and Chief Information Officer of The Limited Brands, Inc., an apparel company, from 2006 to 2009; Senior Vice President, INSIGHT Program of The Limited Brands, Inc. from 2004 to 2006.
Stefan Larsson
, 39, Global President, Old Navy since October 2012; Head of Global Sales, H&M Hennes & Mauritz AB, an apparel company, from 2010 to 2012; Head of Global Expansion, H&M Hennes & Mauritz AB from 2009 to 2010; Head of Operations, Global Expansion, H&M Hennes & Mauritz AB from 2007 to 2009; Regional Manager, U.S. West Coast, H&M Hennes & Mauritz AB from 2005 to 2007.
Glenn Murphy
, 52, Chairman and Chief Executive Officer since August 2007; Chief Executive Officer of Shoppers Drug Mart Corporation, a drug store chain, from 2001 to 2007.
Art Peck
, 58, President, Growth, Innovation and Digital division since November 2012; President, Gap North America from February 2011 to November 2012; Executive Vice President of Strategy and Operations from May 2005 to February 2011; President, Gap Inc. Outlet from October 2008 to February 2011; Acting President, Gap Inc. Outlet from February 2008 to October 2008; Senior Vice President of The Boston Consulting Group, a business consulting firm, from 1982 to 2005.
Sabrina Simmons
, 50, Executive Vice President and Chief Financial Officer since January 2008; Executive Vice President, Corporate Finance from September 2007 to January 2008; Senior Vice President, Corporate Finance and Treasurer from March 2003 to September 2007; Vice President and Treasurer from September 2001 to March 2003.
Stephen Sunnucks
, 56, Global President, Gap since November 2012; President, Gap Inc. International from April 2011 to November 2012; President, Gap Inc. Europe and International Strategic Alliances from April 2009 to April 2011; President, Gap Inc. Europe from June 2005 to April 2009.
Sonia Syngal
, 44, Executive Vice President, Global Supply Chain since November 2013; Senior Vice President
,
Old Navy International from February 2013 to November 2013; Senior Vice President and Managing Director, Europe from May 2011 to February 2013; Senior Vice President and General Manager
,
International Outlets from January 2010 to May 2011; Vice President of Global Production, Supply Chain
-
Outlet from July 2006 to January 2010; Vice President
,
Corporate Sourcing from July 2004 to July 2006.
4
Our past performance may not be a reliable indicator of future performance because actual future results and trends may differ materially depending on a variety of factors, including but not limited to the risks and uncertainties discussed below. In addition, historical trends should not be used to anticipate results or trends in future periods.
Global economic conditions and the impact on consumer spending patterns could adversely impact our results of operations.
The Company’s performance is subject to global economic conditions and their impact on levels of consumer spending worldwide. Some of the factors influencing consumer spending include high levels of unemployment, higher consumer debt levels, reductions in net worth based on market declines and uncertainty, home foreclosures and reductions in home values, fluctuating interest rates and credit availability, government austerity measures, fluctuating fuel and other energy costs, fluctuating commodity prices, and general uncertainty regarding the overall future economic environment. Consumer purchases of discretionary items, including our merchandise, generally decline during periods when disposable income is adversely affected or there is economic uncertainty.
Adverse economic changes in any of the regions in which we and our franchisees sell our products could reduce consumer confidence, and thereby could negatively affect earnings and have a material adverse effect on our results of operations. In challenging and uncertain economic environments, we cannot predict whether or when such circumstances may improve or worsen, or what impact, if any, such circumstances could have on our business, results of operations, cash flows, and financial position.
Our business is highly competitive.
The global apparel retail industry is highly competitive. We and our franchisees compete with local, national, and global department stores, specialty and discount store chains, independent retail stores, and online businesses that market similar lines of merchandise. We face a variety of competitive challenges including:
|
•
|
anticipating and quickly responding to changing apparel trends and customer demands;
|
|
•
|
attracting customer traffic both in stores and online;
|
|
•
|
competitively pricing our products and achieving customer perception of value;
|
|
•
|
maintaining favorable brand recognition and effectively marketing our products to customers in several diverse market segments and geographic locations;
|
|
•
|
developing innovative, high-quality products in sizes, colors, and styles that appeal to customers of varying age groups and tastes; and
|
|
•
|
sourcing merchandise efficiently.
|
If we or our franchisees are not able to compete successfully in the United States or internationally, our results of operations would be adversely affected.
We must successfully gauge apparel trends and changing consumer preferences to succeed.
Our success is largely dependent upon our ability to gauge the tastes of our customers and to provide merchandise that satisfies customer demand in a timely manner. However, lead times for many of our design and purchasing decisions may be long, which makes it more difficult for us to respond rapidly to new or changing apparel trends or consumer acceptance of our products. The global apparel retail business fluctuates according to changes in consumer preferences, dictated in part by apparel trends and season. To the extent we misjudge the market for our merchandise or the products suitable for local markets or fail to execute trends and deliver product to market as timely as our competitors, our sales will be adversely affected, and the markdowns required to move the resulting excess inventory will adversely affect our operating results.
5
If we are unable to manage our inventory effectively, our gross margins could be adversely affected.
Fluctuations in the global apparel retail markets impacts the levels of inventory owned by apparel retailers, as merchandise usually must be ordered well in advance of the season and frequently before apparel trends are confirmed by customer purchases. In addition, the nature of the global apparel retail business requires us to carry a significant amount of inventory, especially prior to the peak holiday selling season when we build up our inventory levels. We must enter into contracts for the purchase and manufacture of merchandise well in advance of the applicable selling season. As a result, we are vulnerable to demand and pricing shifts and to suboptimal selection and timing of merchandise purchases. In the past, we have not always predicted our customers’ preferences and acceptance levels of our trend items with accuracy. If sales do not meet expectations, too much inventory may cause excessive markdowns and, therefore, lower than planned margins.
We have key strategic initiatives designed to optimize our inventory levels and increase the efficiency and responsiveness of our supply chain, including our seamless inventory and responsive supply chain initiatives. Aspects of seamless inventory include more timely matching of product supply and demand across markets and channels to reduce stranded inventory. Aspects of responsive supply chain include more vendor fabric platforming, product demand testing, and in-season rapid response to demand. These initiatives involve significant systems and operational changes and we have limited experience operating in this manner. If we are unable to implement these initiatives successfully, we may not realize the return on our investments that we anticipate, and our operating results could be adversely affected.
Our efforts to expand internationally may not be successful.
Our current strategies include moving to a global brand structure and pursuing continued international expansion in a number of countries around the world through a number of channels. Beginning in fiscal 2013, we combined all channels and geographies under one global leader for each of the Gap, Banana Republic, and Old Navy brands. Each global brand president oversees their brand's specialty, outlet, online, and franchise operations. In addition, we currently plan to open additional Old Navy stores outside of North America, open additional Gap stores in China, open additional international outlet stores, and continue to grow online sales internationally. We have limited experience operating in some of these locations. In many of these locations, we face major, established competitors. In addition, in many of these locations, the real estate, employment and labor, transportation and logistics, regulatory, and other operating requirements differ dramatically from those in the places where we have experience. Moreover, consumer tastes and trends may differ in many of these locations, and as a result, the sales of our products may not be successful or result in the margins we anticipate. If our international expansion plans are unsuccessful or do not deliver an appropriate return on our investments, our operations and financial results could be materially, adversely affected.
In addition, we are exposed to foreign currency exchange rate risk with respect to our sales, profits, assets, and liabilities generated or incurred outside the U.S. Although we use instruments to hedge certain foreign currency risks, these measures may not succeed in offsetting all of the negative impact of foreign currency rate movements and generally only delay the impact of adverse foreign currency rate movements on our business and financial results.
Our business, including our costs and supply chain, is subject to risks associated with global sourcing and manufacturing.
Independent third parties manufacture all of our products for us. As a result, we are directly impacted by increases in the cost of those products
.
6
If we experience significant increases in demand or need to replace an existing vendor, there can be no assurance that additional manufacturing capacity will be available when required on terms that are acceptable to us or that any vendor would allocate sufficient capacity to us in order to meet our requirements. In addition, for any new manufacturing source, we may encounter delays in production and added costs as a result of the time it takes to train our vendors in our methods, products, quality control standards, and environmental, labor, health, and safety standards. Moreover, in the event of a significant disruption in the supply of the fabrics or raw materials used by our vendors in the manufacture of our products, our vendors might not be able to locate alternative suppliers of materials of comparable quality at an acceptable price. Any delays, interruption, or increased costs in the manufacture of our products could result in lower sales and net income. In addition, certain countries represent a larger portion of our global sourcing. For example, approximately 28 percent of our merchandise, by dollar value, is purchased from China. Accordingly, any delays in production and added costs in this country could have a more significant impact on our results of operations.
Because independent vendors manufacture all of our products outside of our principal sales markets, third parties must transport our products over large geographic distances. Delays in the shipment or delivery of our products due to the availability of transportation, work stoppages, port strikes, infrastructure congestion, or other factors, and costs and delays associated with transitioning between vendors, could adversely impact our financial performance. Manufacturing delays or unexpected demand for our products may require us to use faster, but more expensive, transportation methods such as aircraft, which could adversely affect our gross margins. In addition, the cost of fuel is a significant component in transportation costs, so increases in the price of petroleum products can adversely affect our gross margins.
Risks associated with importing merchandise from foreign countries, including failure of our vendors to adhere to our Code of Vendor Conduct, could harm our business.
We purchase nearly all merchandise from third-party vendors in many different countries and we require those vendors to adhere to a Code of Vendor Conduct which includes environmental, labor, health, and safety standards. From time to time, contractors or their subcontractors may not be in compliance with these standards or applicable local laws. Although we have implemented policies and procedures to facilitate our compliance with laws and regulations relating to doing business in foreign markets and importing merchandise into various countries, there can be no assurance that suppliers and other third parties with whom we do business will not violate such laws and regulations or our policies. Significant or continuing noncompliance with such standards and laws by one or more vendors could have a negative impact on our reputation, could subject us to liability, and could have an adverse effect on our results of operations.
Trade matters may disrupt our supply chain.
Trade restrictions, including increased tariffs or quotas, embargoes, safeguards, and customs restrictions against apparel items, as well as U.S. or foreign labor strikes, work stoppages, or boycotts, could increase the cost or reduce the supply of apparel available to us and adversely affect our business, financial condition, and results of operations. We cannot predict whether any of the countries in which our merchandise currently is manufactured or may be manufactured in the future will be subject to additional trade restrictions imposed by the United States and other foreign governments, including the likelihood, type, or effect of any such restrictions. In addition, we face the possibility of anti-dumping or countervailing duties lawsuits from U.S. domestic producers. We are unable to determine the impact of the changes to the quota system or the impact that potential tariff lawsuits could have on our global sourcing operations. Our sourcing operations may be adversely affected by trade limits or political and financial instability, resulting in the disruption of trade from exporting countries, significant fluctuation in the value of the U.S. dollar against foreign currencies, restrictions on the transfer of funds, and/or other trade disruptions.
7
Our franchise business is subject to certain risks not directly within our control that could impair the value of our brands.
We enter into franchise agreements with unaffiliated franchisees to operate stores in many countries around the world. Under these agreements, third parties operate, or will operate, stores that sell apparel and related products under our brand names. The effect of these arrangements on our business and results of operations is uncertain and will depend upon various factors, including the demand for our products in new markets internationally and our ability to successfully identify appropriate third parties to act as franchisees, distributors, or in a similar capacity. In addition, certain aspects of these arrangements are not directly within our control, such as franchisee financial stability and the ability of these third parties to meet their projections regarding store locations, store openings, and sales. Other risks that may affect these third parties include general economic conditions in specific countries or markets, foreign exchange rates, changes in diplomatic and trade relationships, restrictions on the transfer of funds, and political instability. Moreover, while the agreements we have entered into and plan to enter into in the future provide us with certain termination rights, the value of our brands could be impaired to the extent that these third parties do not operate their stores in a manner consistent with our requirements regarding our brand identities and customer experience standards. Failure to protect the value of our brands, or any other harmful acts or omissions by a franchisee, could have an adverse effect on our results of operations and our reputation.
The market for prime real estate is competitive.
Our ability to effectively obtain real estate - to open new stores, distribution centers, and corporate offices nationally and internationally - depends on the availability of real estate that meets our criteria for traffic, square footage, co-tenancies, lease economics, demographics, and other factors. We also must be able to effectively renew our existing store leases. In addition, from time to time, we may seek to downsize, consolidate, reposition, or close some of our real estate locations, which in most cases requires a modification of an existing store lease. Failure to secure adequate new locations or successfully modify existing locations, or failure to effectively manage the profitability of our existing fleet of stores, could have a material adverse effect on our results of operations.
Additionally, the economic environment may at times make it difficult to determine the fair market rent of real estate properties within the United States and internationally. This could impact the quality of our decisions to exercise lease options at previously negotiated rents and the quality of our decisions to renew expiring leases at negotiated rents. Any adverse effect on the quality of these decisions could impact our ability to retain real estate locations adequate to meet our targets or efficiently manage the profitability of our existing fleet of stores and could have a material adverse effect on our results of operations.
We experience fluctuations in our comparable sales and margins.
Our success depends in part on our ability to improve sales, in particular at our largest brands. A variety of factors affect comparable sales or margins, including apparel trends, competition, current economic conditions, the timing of new merchandise releases and promotional events, changes in our merchandise mix, the success of marketing programs, foreign currency fluctuations, and weather conditions. These factors may cause our comparable sales results to differ materially from prior periods and from expectations. Our comparable sales, including the associated comparable online sales, have fluctuated significantly in the past on an annual, quarterly, and monthly basis. Over the past 24 months, our reported monthly comparable sales have ranged from an increase of 10 percent in July 2012 to a decrease of 3 percent in September 2013. Over the past five years, our reported gross margins have ranged from a high of 40.3 percent in fiscal 2009 to a low of 36.2 percent in fiscal 2011. In addition, over the past five years, our reported operating margins have ranged from a high of 13.4 percent in fiscal 2010 to a low of 9.9 percent in fiscal 2011.
Our ability to deliver strong comparable sales results and margins depends in large part on accurately forecasting demand and apparel trends, selecting effective marketing techniques, providing an appropriate mix of merchandise for our broad and diverse customer base, managing inventory effectively, using effective pricing strategies, and optimizing store performance. Failure to meet the expectations of investors, securities analysts, or credit rating agencies in one or more future periods could reduce the market price of our common stock and cause our credit ratings to decline.
8
Changes in our credit profile or deterioration in market conditions may limit our access to the capital markets and adversely impact our financial results or our business initiatives.
In the first quarter of fiscal 2011, given favorable market conditions and our history of generating consistent and strong operating cash flow, we made the strategic decision to issue debt. In April 2011, we issued $
1.25 billion
aggregate principal amount of
5.95
percent notes due
April 12, 2021
. As a result, we have additional costs that include interest payable semiannually on the notes. We also entered into a
15 billion
Japanese yen ($147 million as of February 1, 2014), four-year term loan due January 2018.
Our cash flows from operations are the primary source of funds for these debt service payments. In this regard, we have generated annual cash flow from operations in excess of $1 billion per year for the past decade and ended
fiscal 2013
with
$1.5 billion
of cash and cash equivalents on our balance sheet. We are also able to supplement near-term liquidity, if necessary, with our $
500 million
revolving credit facility. We continue to target a cash balance of about $1.2 billion, which provides not only for our working capital needs, but also a reserve for unexpected business downturns. However, if our cash flows from operations decline significantly, we may be required to reprioritize our business initiatives to ensure that we can continue to service or refinance our debt with favorable rates and terms. In addition, any future reduction in our long-term senior unsecured credit ratings could result in reduced access to the credit and capital markets and higher interest costs on future financings.
We remain committed to maintaining a strong financial profile with ample liquidity.
For further information on our debt and credit facilities, see Part II, Item 8, Financial Statements and Supplementary Data, Notes 5 and 6 of Notes to Consolidated Financial Statements of this Form 10-K.
The failure to attract and retain key personnel could have an adverse impact on our results of operations.
Our ability to anticipate and effectively respond to changing apparel trends depends in part on our ability to attract and retain key personnel in our design, merchandising, marketing, and other functions. In addition, several of our strategic initiatives, including our technology initiatives and supply chain initiatives require that we hire and/or develop employees with appropriate experience. Competition for this personnel is intense, and we cannot be sure that we will be able to attract and retain a sufficient number of qualified personnel in future periods. If we are unable to retain, attract, and motivate talented employees with the appropriate skill sets, or if changes to our organizational structure, operating results, or business model adversely affect morale or retention, we may not achieve our objectives and our results of operations could be adversely impacted. In addition, the loss of one or more of our key personnel or the inability to effectively identify a suitable successor to a key role in our senior management positions could have a material adverse effect on our business.
Our investments in omni-channel shopping initiatives may not deliver the results we anticipate.
One of our strategic priorities is to further develop an omni-channel shopping experience for our customers through the integration of our store and digital shopping channels. Examples of our recent omni-channel initiatives include our ship-from-store and reserve-in-store programs, in which store inventory can be used to satisfy online demand. We continue to explore additional ways to develop an omni-channel shopping experience, including further digital integration and customer personalization. These initiatives involve significant investments in IT systems and significant operational changes. In addition, our competitors are also investing in omni-channel initiatives, some of which may be more successful than our initiatives
.
If the implementation of our omni-channel initiatives is not successful, or we do not realize the return on our omni-channel investments that we anticipate, our operating results would be adversely affected.
9
Updates or changes to our IT systems may disrupt operations.
We continue to evaluate and implement upgrades and changes to our IT systems, some of which are significant. Upgrades involve replacing existing systems with successor systems, making changes to existing systems, or cost-effectively acquiring new systems with new functionality. We are aware of inherent risks associated with replacing these systems, including accurately capturing data and system disruptions, and believe we are taking appropriate action to mitigate the risks through testing, training, and staging implementation, as well as ensuring appropriate commercial contracts are in place with third-party vendors supplying or supporting our IT initiatives. However, there can be no assurances that we will successfully launch these systems as planned or that they will occur without disruptions to our operations. IT system disruptions, if not anticipated and appropriately mitigated, or failure to successfully implement new or upgraded systems, could have a material adverse effect on our results of operations.
We are subject to data security risks, which could have an adverse effect on our results of operations and consumer confidence in our security measures.
As part of our normal operations, we receive and maintain confidential information about our customers, our employees, and other third parties. Our business employs systems and websites that allow for the secure storage and transmission of proprietary or confidential information regarding our customers, employees, job applicants, and others, including credit card information and personal identification information. Security breaches could expose us to a risk of loss or misuse of this information, litigation, and potential liability. Despite our safeguards and security processes and protections, we may not have the resources or technical sophistication to anticipate or prevent rapidly evolving types of cyber-attacks. Attacks may be targeted at us, our customers, or others who have entrusted us with information. Actual or anticipated attacks may cause us to incur increasing costs, including costs to deploy additional personnel and protection technologies, train employees, and engage third-party experts and consultants. Advances in computer capabilities, new technological discoveries, or other developments may result in the technology used by us to protect transaction or other data being breached or compromised. In addition, data and security breaches can also occur as a result of non-technical issues, including intentional or inadvertent breach by our employees or by persons with whom we have commercial relationships that result in the unauthorized release of personal or confidential information. Any compromise or breach of our security could result in a violation of applicable privacy and other laws, significant legal and financial exposure, and a loss of consumer confidence in our security measures, which could have an adverse effect on our results of operations and our reputation.
Our results could be adversely affected by natural disasters, public health crises, political crises, or other catastrophic events.
Natural disasters, such as hurricanes, tornadoes, floods, earthquakes, and other adverse weather and climate conditions; unforeseen public health crises, such as pandemics and epidemics; political crises, such as terrorist attacks, war, and other political instability; or other catastrophic events, such as disasters occurring at our vendors' manufacturing facilities, whether occurring in the United States or internationally, could disrupt our operations, the operations of our franchisees, or the operations of one or more of our vendors. In particular, these types of events could impact our product supply chain from or to the impacted region and could impact our ability or the ability of our franchisees or other third parties to operate our stores or websites. In addition, these types of events could negatively impact consumer spending in the impacted regions or depending upon the severity, globally. Disasters occurring at our vendors
’
manufacturing facilities could impact our reputation and our customers
’
perception of our brands. To the extent any of these events occur, our operations and financial results could be adversely affected.
10
Changes in the regulatory or administrative landscape could adversely affect our financial condition and results of operations.
Laws and regulations at the local, state, federal, and international levels frequently change, and the ultimate cost of compliance cannot be precisely estimated. In addition, we cannot predict the impact that may result from changes in the regulatory or administrative landscape. Any changes in regulations, the imposition of additional regulations, or the enactment of any new or more stringent legislation that impacts employment and labor, trade, product safety, transportation and logistics, health care, tax, privacy, operations, or environmental issues, among others, could have an adverse impact on our financial condition and results of operations.
None.
We have Company-operated stores in the United States, Canada, the United Kingdom, France, Ireland, Japan, Italy, China, Hong Kong, and beginning in March 2014, Taiwan. As of
February 1, 2014
, our Company-operated stores aggregated approximately
37.2 million
square feet. Almost all of these stores are leased, with one or more renewal options after our initial term. Economic terms vary by type of location.
We own approximately 1.2 million square feet of corporate office space located in San Francisco, San Bruno, and Rocklin, California, of which approximately 476,000 square feet is leased to and occupied by others. We lease approximately 1.1 million square feet of corporate office space located in San Francisco, Rocklin, Petaluma, Pleasanton, and Los Angeles, California; New York, New York; Albuquerque, New Mexico; and Toronto, Ontario, Canada. We also lease regional offices in North America and in various international locations. We own approximately 8.6 million square feet of distribution space located in Fresno, California; Fishkill, New York; Groveport, Ohio; Gallatin, Tennessee; Brampton, Ontario, Canada; and Rugby, England. Of the 8.6 million square feet of owned distribution space, 100,000 square feet is leased to others. We lease approximately 1.8 million square feet of distribution space located in Phoenix, Arizona; Grove City and Obetz, Ohio; Erlanger and Hebron, Kentucky; Bolton and Mississauga, Ontario, Canada; and Stafford, England. Third-party logistics companies provide logistics services to us through distribution warehouses in Chiba, Japan; Shanghai and Hong Kong, China; and Edison, New Jersey.
As a multinational company, we are subject to various proceedings, lawsuits, disputes, and claims (“Actions”) arising in the ordinary course of our business. Many of these Actions raise complex factual and legal issues and are subject to uncertainties. Actions filed against us from time to time include commercial, intellectual property, customer, employment, and data privacy claims, including class action lawsuits. The plaintiffs in some Actions seek unspecified damages or injunctive relief, or both. Actions are in various procedural stages and some are covered in part by insurance.
We cannot predict with assurance the outcome of Actions brought against us. Accordingly, developments, settlements, or resolutions may occur and impact income in the quarter of such development, settlement, or resolution. However, we do not believe that the outcome of any current Action would have a material effect on our Consolidated Financial Statements.
Not applicable.
11
The principal market on which our stock is traded is the New York Stock Exchange. The number of holders of record of our stock as of
March 18, 2014
was 7,545. The table below sets forth the market prices and dividends declared and paid for each of the fiscal quarters in fiscal 2013 and 2012.
|
|
Market Prices
|
Dividends Declared
and Paid
|
||||||||||||||||||||||
|
|
Fiscal 2013
|
Fiscal 2012
|
Fiscal Year
|
|||||||||||||||||||||
|
|
High
|
Low
|
High
|
Low
|
2013
|
2012
|
||||||||||||||||||
|
1st Quarter
|
$
|
39.13
|
|
$
|
31.19
|
|
$
|
28.77
|
|
$
|
18.53
|
|
$
|
0.15
|
|
$
|
0.125
|
|
||||||
|
2nd Quarter
|
$
|
46.56
|
|
$
|
38.28
|
|
$
|
30.17
|
|
$
|
25.02
|
|
0.15
|
|
0.125
|
|
||||||||
|
3rd Quarter
|
$
|
46.53
|
|
$
|
36.13
|
|
$
|
37.85
|
|
$
|
29.39
|
|
0.20
|
|
0.125
|
|
||||||||
|
4th Quarter
|
$
|
42.45
|
|
$
|
36.39
|
|
$
|
36.15
|
|
$
|
29.84
|
|
0.20
|
|
0.125
|
|
||||||||
|
$
|
0.70
|
|
$
|
0.50
|
|
|||||||||||||||||||
12
Stock Performance Graph
The graph below compares the percentage changes in our cumulative total stockholder return on our common stock for the five-year period ended
February 1, 2014
, with (i) the cumulative total return of the Dow Jones U.S. Retail Apparel Index and (ii) the S&P 500 Index. The total stockholder return for our common stock assumes quarterly reinvestment of dividends.
TOTAL RETURN TO STOCKHOLDERS
(Assumes $100 investment on 1/31/2009)
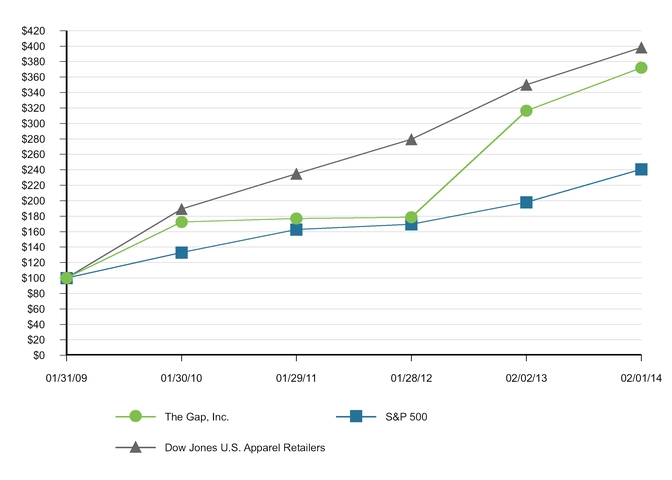
Total Return Analysis
|
1/31/2009
|
1/30/2010
|
1/29/2011
|
1/28/2012
|
2/2/2013
|
2/1/2014
|
|||||||||||||||||||
|
The Gap, Inc.
|
$
|
100.00
|
|
$
|
172.47
|
|
$
|
176.93
|
|
$
|
178.62
|
|
$
|
316.37
|
|
$
|
372.05
|
|
||||||
|
S&P 500
|
$
|
100.00
|
|
$
|
133.14
|
|
$
|
162.67
|
|
$
|
169.54
|
|
$
|
197.98
|
|
$
|
240.58
|
|
||||||
|
Dow Jones U.S. Apparel Retailers
|
$
|
100.00
|
|
$
|
189.38
|
|
$
|
234.92
|
|
$
|
279.66
|
|
$
|
350.19
|
|
$
|
398.21
|
|
||||||
Source: Research Data Group, Inc. (415) 643-6000 (www.researchdatagroup.com)
13
Purchases of Equity Securities by the Issuer and Affiliated Purchasers
The following table presents information with respect to purchases of common stock of the Company made during the thirteen weeks ended
February 1, 2014
by The Gap, Inc. or any affiliated purchaser, as defined in Exchange Act Rule 10b-18(a)(3):
|
Total Number
of Shares
Purchased
|
Average
Price Paid
Per Share
Including
Commissions
|
Total Number
of Shares
Purchased as
Part of Publicly
Announced
Plans or
Programs
|
Maximum Number
(or approximate
dollar amount) of
Shares that May
Yet be Purchased
Under the Plans or
Programs (1)
|
|||||||||
|
Month #1 (November 3 - November 30)
|
—
|
|
$
|
—
|
|
—
|
|
$1,100 million
|
||||
|
Month #2 (December 1 - January 4)
|
978,875
|
|
$
|
38.83
|
|
978,875
|
|
$1,062 million
|
||||
|
Month #3 (January 5 - February 1)
|
2,553,323
|
|
$
|
37.60
|
|
2,553,323
|
|
$966 million
|
||||
|
Total
|
3,532,198
|
|
$
|
37.94
|
|
3,532,198
|
|
|||||
__________
|
(1)
|
On January 3, 2013, we announced that the Board of Directors approved a $1 billion share repurchase authorization. This authorization was fully utilized by the end of January 2014. On November 21, 2013, we announced that the Board of Directors approved a new $1 billion share repurchase authorization. This authorization has no expiration date.
|
14
The following selected financial data are derived from the Consolidated Financial Statements of the Company. We have also included certain non-financial data to enhance your understanding of our business. The data set forth below should be read in conjunction with “Management’s Discussion and Analysis of Financial Condition and Results of Operations” in Item 7 and the Company’s Consolidated Financial Statements and related notes in Item 8.
|
|
Fiscal Year (number of weeks)
|
|||||||||||||||||||
|
|
2013 (52)
|
2012 (53)
|
2011 (52)
|
2010 (52)
|
2009 (52)
|
|||||||||||||||
|
Operating Results ($ in millions)
|
||||||||||||||||||||
|
Net sales
|
$
|
16,148
|
|
$
|
15,651
|
|
$
|
14,549
|
|
$
|
14,664
|
|
$
|
14,197
|
|
|||||
|
Gross margin
|
39.0
|
%
|
39.4
|
%
|
36.2
|
%
|
40.2
|
%
|
40.3
|
%
|
||||||||||
|
Operating margin
|
13.3
|
%
|
12.4
|
%
|
9.9
|
%
|
13.4
|
%
|
12.8
|
%
|
||||||||||
|
Net income
|
$
|
1,280
|
|
$
|
1,135
|
|
$
|
833
|
|
$
|
1,204
|
|
$
|
1,102
|
|
|||||
|
Cash dividends paid
|
$
|
321
|
|
$
|
240
|
|
$
|
236
|
|
$
|
252
|
|
$
|
234
|
|
|||||
|
Per Share Data (number of shares in millions)
|
||||||||||||||||||||
|
Basic earnings per share
|
$
|
2.78
|
|
$
|
2.35
|
|
$
|
1.57
|
|
$
|
1.89
|
|
$
|
1.59
|
|
|||||
|
Diluted earnings per share
|
$
|
2.74
|
|
$
|
2.33
|
|
$
|
1.56
|
|
$
|
1.88
|
|
$
|
1.58
|
|
|||||
|
Weighted-average number of shares—basic
|
461
|
|
482
|
|
529
|
|
636
|
|
694
|
|
||||||||||
|
Weighted-average number of shares—diluted
|
467
|
|
488
|
|
533
|
|
641
|
|
699
|
|
||||||||||
|
Cash dividends declared and paid per share
|
$
|
0.70
|
|
$
|
0.50
|
|
$
|
0.45
|
|
$
|
0.40
|
|
$
|
0.34
|
|
|||||
|
Balance Sheet Information ($ in millions)
|
||||||||||||||||||||
|
Merchandise inventory
|
$
|
1,928
|
|
$
|
1,758
|
|
$
|
1,615
|
|
$
|
1,620
|
|
$
|
1,477
|
|
|||||
|
Total assets
|
$
|
7,849
|
|
$
|
7,470
|
|
$
|
7,422
|
|
$
|
7,065
|
|
$
|
7,985
|
|
|||||
|
Working capital
|
$
|
1,985
|
|
$
|
1,788
|
|
$
|
2,181
|
|
$
|
1,831
|
|
$
|
2,533
|
|
|||||
|
Total long-term debt, less current maturities (1)
|
$
|
1,369
|
|
$
|
1,246
|
|
$
|
1,606
|
|
$
|
—
|
|
$
|
—
|
|
|||||
|
Stockholders’ equity
|
$
|
3,062
|
|
$
|
2,894
|
|
$
|
2,755
|
|
$
|
4,080
|
|
$
|
4,891
|
|
|||||
|
Other Data ($ and square footage in millions)
|
||||||||||||||||||||
|
Cash used for purchases of property and equipment
|
$
|
670
|
|
$
|
659
|
|
$
|
548
|
|
$
|
557
|
|
$
|
334
|
|
|||||
|
Acquisition of business, net of cash acquired (2)
|
$
|
—
|
|
$
|
129
|
|
$
|
—
|
|
$
|
—
|
|
$
|
—
|
|
|||||
|
Percentage increase (decrease) in comparable sales (3)
|
2
|
%
|
5
|
%
|
(4
|
)%
|
2
|
%
|
(3
|
)%
|
||||||||||
|
Number of Company-operated store locations open at year-end
|
3,164
|
|
3,095
|
|
3,036
|
|
3,068
|
|
3,095
|
|
||||||||||
|
Number of franchise store locations open at year-end
|
375
|
|
312
|
|
227
|
|
178
|
|
136
|
|
||||||||||
|
Number of store locations open at year-end (4)
|
3,539
|
|
3,407
|
|
3,263
|
|
3,246
|
|
3,231
|
|
||||||||||
|
Square footage of Company-operated store space at year-end
|
37.2
|
|
36.9
|
|
37.2
|
|
38.2
|
|
38.8
|
|
||||||||||
|
Percentage increase (decrease) in square footage of Company-operated store space at year-end
|
0.8
|
%
|
(0.8
|
)%
|
(2.6
|
)%
|
(1.5
|
)%
|
(1.8
|
)%
|
||||||||||
|
Number of employees at year-end
|
137,000
|
|
136,000
|
|
132,000
|
|
134,000
|
|
135,000
|
|
||||||||||
|
(1)
|
In April 2012, we made the first scheduled payment of $40 million related to our $400 million term loan and in August 2012, we repaid the remaining $360 million balance in full.
|
15
|
(2)
|
On December 31, 2012, we acquired all of the outstanding capital stock of Intermix, a multi-brand specialty retailer of luxury and contemporary apparel and accessories, for an aggregate purchase price of
$129 million
.
|
|
(3)
|
Beginning in fiscal 2011, we report comparable sales including the associated comparable online sales. Comparable sales for fiscal 2010 have been recalculated to include the associated comparable online sales. Comparable sales for fiscal 2009 exclude online sales.
|
|
(4)
|
Includes Company-operated and franchise store locations.
|
16
Overview
We are a global retailer offering apparel, accessories, and personal care products for men, women, and children under the Gap, Banana Republic, Old Navy, Piperlime, Athleta, and Intermix brands. We have Company-operated stores in the United States, Canada, the United Kingdom, France, Ireland, Japan, Italy, China, Hong Kong, and beginning in March 2014, Taiwan. We also have franchise agreements with unaffiliated franchisees to operate Gap, Banana Republic, and Old Navy stores in many other countries around the world. Under these agreements, third parties operate, or will operate, stores that sell apparel and related products under our brand names. In addition, our products are available to customers online through Company-owned websites and through the use of third parties that provide logistics and fulfillment services. Most of the products sold under our brand names are designed by us and manufactured by independent sources. We also sell products that are designed and manufactured by branded third parties, especially at our Piperlime and Intermix brands.
We identify our operating segments according to how our business activities are managed and evaluated. Prior to fiscal 2013, we had two reportable segments: Stores and Direct. The Stores reportable segment included the results of the retail stores for Gap, Old Navy, and Banana Republic. The Direct reportable segment included the results of our online brands, as well as Piperlime, Athleta, and Intermix.
Beginning in fiscal 2013, we combined all channels and geographies under one global leader for each of the Gap, Old Navy, and Banana Republic brands. Each global brand president oversees their brand's specialty, outlet, online, and franchise operations. Our newer brands, Piperlime, Athleta, and Intermix, are managed by the president of our Growth, Innovation, and Digital ("GID") division, who oversees those brands' store and online operations. Each of our brands serves customers through its store and online channels. We have determined that each of our operating segments (Gap Global, Old Navy Global, Banana Republic Global, and GID) share similar economic and other qualitative characteristics and, effective February 3, 2013, we have aggregated the results of our operating segments into one reportable segment.
We are pleased with our fiscal 2013 results. We continued to deliver against our priorities to grow sales with healthy merchandise margins, manage expenses in a disciplined manner, deliver operating margin expansion and earnings per share growth, and return excess cash to shareholders. We used a balanced approach to drive shareholder value even in the face of headwinds from foreign exchange and a shorter fiscal year calendar. We delivered positive comparable sales in each of the four quarters of fiscal 2013. We remained committed to our principle of returning excess cash to shareholders and distributed
$1.3 billion
through dividends and share repurchases.
As we transitioned to a global brand structure to drive long-term global growth, we opened 190 Company-operated stores, primarily through expansion in Asia, growth of our global outlets, and Athleta stores in the United States. Specifically, we expanded our Gap store base in China, opening 34 stores for a total of 81 specialty and outlet stores, and opened an additional 17 Old Navy stores in Japan for a total of 18 stores. We opened 58 global outlets for a total of 532 outlet stores. We also opened 30 Athleta stores, ending fiscal 2013 with 65 Athleta stores. Our franchisees added 72 new stores and five new markets.
Fiscal 2013 consisted of 52 weeks versus 53 weeks in fiscal 2012. Net sales and operating results for fiscal 2013 reflect the impact of one less selling week as well as the calendar shift, which positively impacted the results of the first quarter of fiscal 2013 and negatively impacted the results of the fourth quarter of 2013. In addition, due to the 53rd week in fiscal 2012, comparable ("Comp") sales for the fiscal year ended February 1, 2014 are compared to the 52-week period ended February 2, 2013.
Financial results for
fiscal 2013
are as follows:
|
•
|
Net sales for
fiscal 2013
increased
3 percent
to
$16.1 billion
compared with
$15.7 billion
for
fiscal 2012
. Excluding the impact of foreign exchange, our net sales increased 5 percent for fiscal 2013 compared with fiscal 2012. See Net Sales discussion for impact of foreign exchange.
|
17
|
•
|
Online sales for
fiscal 2013
increased
21 percent
to
$2.3 billion
compared with
$1.9 billion
for
fiscal 2012
and grew 2 percentage points, as a percentage of total net sales, to 14 percent compared with 12 percent for fiscal 2012.
|
|
•
|
Comparable sales for
fiscal 2013
increased
2 percent
compared with a
5 percent
increase last year.
|
|
•
|
Gross profit for
fiscal 2013
was
$6.3 billion
compared with
$6.2 billion
for
fiscal 2012
. Gross margin for
fiscal 2013
was
39.0 percent
compared with
39.4 percent
for
fiscal 2012
.
|
|
•
|
Operating margin for
fiscal 2013
was
13.3 percent
compared with
12.4 percent
for
fiscal 2012
. Operating margin is defined as operating income as a percentage of net sales.
|
|
•
|
Net income for
fiscal 2013
was
$1.3 billion
compared with
$1.1 billion
for
fiscal 2012
. Diluted earnings per share increased
18 percent
to
$2.74
for
fiscal 2013
compared with
$2.33
for
fiscal 2012
.
|
|
•
|
During
fiscal 2013
, we generated free cash flow of
$1.0 billion
compared with free cash flow of $1.3 billion for fiscal 2012. Free cash flow is defined as net cash provided by operating activities less purchases of property and equipment. For a reconciliation of free cash flow, a non-GAAP financial measure, from a GAAP financial measure, see Liquidity and Capital Resources section.
|
Our business and financial priorities for
fiscal 2014
are as follows:
|
•
|
grow sales;
|
|
•
|
manage our expenses in a disciplined manner;
|
|
•
|
deliver earnings per share growth; and
|
|
•
|
return excess cash to shareholders.
|
In addition to increasing sales within our existing business, we also plan to grow revenues through our newer brands, channels, and geographies, including the following:
|
•
|
growing global online sales, driven by continued investments in our omni-channel capabilities;
|
|
•
|
opening additional stores in Asia with a focus on Gap China, Old Navy China, and Old Navy Japan;
|
|
•
|
expanding our global outlet presence;
|
|
•
|
opening additional Athleta stores; and
|
|
•
|
continuing to expand our franchise presence worldwide.
|
In fiscal 2014, we expect foreign exchange rate fluctuations to have a meaningful negative impact on the results of our largest foreign subsidiaries in Canada and Japan. With the continuing depreciation of the Canadian dollar and Japanese yen, we expect net sales in Canadian dollars and Japanese yen translated into U.S. dollars will decrease and negatively impact our total Company net sales growth. In addition, we expect gross margins for our largest foreign subsidiaries to be negatively impacted as our merchandise purchases are primarily in U.S. dollars.
In
fiscal 2014
, we expect diluted earnings per share to be in the range of $2.90 to $2.95.
Results of Operations
Net Sales
Net sales primarily consist of retail sales from stores and online, and franchise revenues.
See Item 8, Financial Statements and Supplementary Data, Note 17 of Notes to Consolidated Financial Statements for net sales by brand and region.
18
Comparable Sales
Beginning in fiscal 2013, the Company reports Comp sales by global brand: Gap Global, Old Navy Global, and Banana Republic Global. Fiscal 2012 Comp sales have been conformed to the current year presentation.
The percentage change in Comp sales by global brand and for total Company, including the associated comparable online sales, as compared with the preceding year, is as follows:
|
|
Fiscal Year
|
|||||
|
|
2013
|
2012
|
||||
|
Gap Global
|
3
|
%
|
3
|
%
|
||
|
Old Navy Global
|
2
|
%
|
6
|
%
|
||
|
Banana Republic Global
|
(1
|
)%
|
5
|
%
|
||
|
The Gap, Inc.
|
2
|
%
|
5
|
%
|
||
Comparable online sales favorably impacted total Company Comp sales by 3 percent and 2 percent in fiscal 2013 and 2012, respectively.
Only Company-operated stores are included in the calculations of Comp sales. Gap and Banana Republic outlet Comp sales are reflected within the respective results of each global brand. The calculation of total Company Comp sales includes the results of Athleta stores and online, Intermix stores and online, and the Piperlime store, but excludes the results of our franchise business and Piperlime online.
A store is included in the Comp sales calculations when it has been open and operated by Gap, Inc. for at least one year and the selling square footage has not changed by 15 percent or more within the past year. A store is included in the Comp sales calculations on the first day it has comparable prior year sales. Stores in which the selling square footage has changed by 15 percent or more as a result of a remodel, expansion, or reduction are excluded from the Comp sales calculations until the first day they have comparable prior year sales.
A store is considered non-comparable (“Non-comp”) when it has been open and operated by Gap, Inc. for less than one year or has changed its selling square footage by 15 percent or more within the past year.
A store is considered “Closed” if it is temporarily closed for three or more full consecutive days or is permanently closed. When a temporarily closed store reopens, the store will be placed in the Comp/Non-comp status it was in prior to its closure. If a store was in Closed status for three or more days in the prior year, the store will be in Non-comp status for the same days the following year.
Online Comp sales are defined as sales through online channels in all countries where we have existing Comp store sales.
Current year foreign exchange rates are applied to both current year and prior year Comp sales to achieve a consistent basis for comparison.
Store Count and Square Footage Information
Net sales per average square foot is as follows:
|
|
Fiscal Year
|
|||||||||||
|
|
2013
|
2012
|
2011
|
|||||||||
|
Net sales per average square foot (1)
|
$
|
365
|
|
$
|
364
|
|
$
|
337
|
|
|||
__________
|
(1)
|
Excludes net sales associated with our online and franchise businesses.
|
19
Store count, openings, closings, and square footage for our stores are as follows:
|
|
February 2, 2013
|
Fiscal 2013
|
February 1, 2014
|
||||||||||||
|
|
Number of
Store Locations
|
Number of
Stores Opened
|
Number of
Stores Closed
|
Number of
Store Locations
|
Square Footage
(in millions)
|
||||||||||
|
Gap North America
|
990
|
|
38
|
|
60
|
|
968
|
|
10.1
|
|
|||||
|
Gap Europe
|
198
|
|
3
|
|
8
|
|
193
|
|
1.7
|
|
|||||
|
Gap Asia
|
191
|
|
40
|
|
3
|
|
228
|
|
2.3
|
|
|||||
|
Old Navy North America
|
1,010
|
|
27
|
|
33
|
|
1,004
|
|
17.2
|
|
|||||
|
Old Navy Asia
|
1
|
|
17
|
|
—
|
|
18
|
|
0.2
|
|
|||||
|
Banana Republic North America
|
590
|
|
21
|
|
15
|
|
596
|
|
5.0
|
|
|||||
|
Banana Republic Asia
|
38
|
|
6
|
|
1
|
|
43
|
|
0.2
|
|
|||||
|
Banana Republic Europe
|
10
|
|
1
|
|
—
|
|
11
|
|
0.1
|
|
|||||
|
Athleta North America
|
35
|
|
30
|
|
—
|
|
65
|
|
0.3
|
|
|||||
|
Piperlime North America
|
1
|
|
—
|
|
—
|
|
1
|
|
—
|
|
|||||
|
Intermix North America
|
31
|
|
7
|
|
1
|
|
37
|
|
0.1
|
|
|||||
|
Company-operated stores total
|
3,095
|
|
190
|
|
121
|
|
3,164
|
|
37.2
|
|
|||||
|
Franchise
|
312
|
|
72
|
|
9
|
|
375
|
|
N/A
|
|
|||||
|
Total
|
3,407
|
|
262
|
|
130
|
|
3,539
|
|
37.2
|
|
|||||
|
Increase over prior year
|
3.9
|
%
|
0.8
|
%
|
|||||||||||
|
|
January 28, 2012
|
Fiscal 2012
|
February 2, 2013
|
||||||||||||
|
|
Number of
Store Locations
|
Number of
Stores Opened
|
Number of
Stores Closed
|
Number of
Store Locations
|
Square Footage
(in millions)
|
||||||||||
|
Gap North America
|
1,043
|
|
30
|
|
83
|
|
990
|
|
10.2
|
|
|||||
|
Gap Europe
|
193
|
|
6
|
|
1
|
|
198
|
|
1.7
|
|
|||||
|
Gap Asia
|
152
|
|
45
|
|
6
|
|
191
|
|
1.9
|
|
|||||
|
Old Navy North America
|
1,016
|
|
26
|
|
32
|
|
1,010
|
|
17.6
|
|
|||||
|
Old Navy Asia
|
—
|
|
1
|
|
—
|
|
1
|
|
—
|
|
|||||
|
Banana Republic North America
|
581
|
|
22
|
|
13
|
|
590
|
|
4.9
|
|
|||||
|
Banana Republic Asia
|
31
|
|
9
|
|
2
|
|
38
|
|
0.2
|
|
|||||
|
Banana Republic Europe
|
10
|
|
—
|
|
—
|
|
10
|
|
0.1
|
|
|||||
|
Athleta North America
|
10
|
|
25
|
|
—
|
|
35
|
|
0.2
|
|
|||||
|
Piperlime North America
|
—
|
|
1
|
|
—
|
|
1
|
|
—
|
|
|||||
|
Intermix North America (1)
|
—
|
|
—
|
|
—
|
|
31
|
|
0.1
|
|
|||||
|
Company-operated stores total
|
3,036
|
|
165
|
|
137
|
|
3,095
|
|
36.9
|
|
|||||
|
Franchise
|
227
|
|
98
|
|
13
|
|
312
|
|
N/A
|
|
|||||
|
Total
|
3,263
|
|
263
|
|
150
|
|
3,407
|
|
36.9
|
|
|||||
|
Increase (decrease) over prior year
|
4.4
|
%
|
(0.8
|
)%
|
|||||||||||
__________
|
(1)
|
On December 31, 2012, we acquired all of the outstanding capital stock of Intermix. The 31 stores acquired were not included as store openings for fiscal 2012; however, they are included in the ending number of store locations as of February 2, 2013.
|
Gap and Banana Republic outlet stores are reflected in each of the respective brands. In addition, we have franchise agreements with unaffiliated franchisees to operate Gap, Banana Republic, and Old Navy stores throughout Asia, Australia, Eastern Europe, Latin America, the Middle East, and Africa.
20
In
fiscal 2014
, we expect net openings of about
115
Company-operated store locations. We expect square footage for Company-operated stores to increase about
2.5 percent
for
fiscal 2014
. We expect our franchisees to open about
75
franchise stores in
fiscal 2014
.
Net Sales Discussion
Our net sales for
fiscal 2013
increased
$497 million
, or
3 percent
, compared with
fiscal 2012
primarily due to an increase in net sales at Gap Global and our newer brands; partially offset by the unfavorable impact of foreign exchange of $240 million primarily due to the weakening of the Japanese yen and Canadian dollar against the U.S. dollar. The foreign exchange impact is the translation impact if net sales for fiscal 2012 were translated at exchange rates applicable during fiscal 2013. On this basis, our net sales for fiscal 2013 increased 5 percent compared with fiscal 2012. We believe this metric enhances the visibility of underlying business trends by excluding the impact of foreign currency exchange rate fluctuations. Fiscal 2013 consisted of 52 weeks compared with 53 weeks in fiscal 2012.
Our net sales for
fiscal 2012
increased $1.1 billion, or 8 percent, compared with
fiscal 2011
primarily due to an increase in net sales at Old Navy Global and Gap Global; partially offset by the unfavorable impact of foreign exchange of $43 million primarily due to the weakening of the Japanese yen and Euro against the U.S. dollar. The foreign exchange impact is the translation impact if net sales for
fiscal 2011
were translated at
fiscal 2012
exchange rates. Fiscal 2012 consisted of 53 weeks compared with 52 weeks in fiscal 2011.
Cost of Goods Sold and Occupancy Expenses
|
($ in millions)
|
Fiscal Year
|
|||||||||||
|
2013
|
2012
|
2011
|
||||||||||
|
Cost of goods sold and occupancy expenses
|
$
|
9,855
|
|
$
|
9,480
|
|
$
|
9,275
|
|
|||
|
Gross profit
|
$
|
6,293
|
|
$
|
6,171
|
|
$
|
5,274
|
|
|||
|
Cost of goods sold and occupancy expenses as a percentage of net sales
|
61.0
|
%
|
60.6
|
%
|
63.8
|
%
|
||||||
|
Gross margin
|
39.0
|
%
|
39.4
|
%
|
36.2
|
%
|
||||||
Cost of goods sold and occupancy expenses increased 0.4 percentage points in
fiscal 2013
compared with
fiscal 2012
.
|
•
|
Cost of goods sold increased 0.5 percentage points in
fiscal 2013
compared with
fiscal 2012
. The increase in cost of goods sold as a percentage of net sales was primarily driven by increased promotional activities.
|
|
•
|
Occupancy expenses decreased 0.1 percentage points in
fiscal 2013
compared with
fiscal 2012
. The decrease in occupancy expenses as a percentage of net sales was primarily driven by the increase in net sales.
|
Cost of goods sold and occupancy expenses decreased 3.2 percentage points in
fiscal 2012
compared with
fiscal 2011
.
|
•
|
Cost of goods sold decreased 2.0 percentage points in
fiscal 2012
compared with
fiscal 2011
. The decrease in cost of goods sold as a percentage of net sales was primarily driven by decreased cost of merchandise as well as improved product acceptance resulting in improved regular price margins.
|
|
•
|
Occupancy expenses decreased 1.2 percentage points in
fiscal 2012
compared with
fiscal 2011
. The decrease in occupancy expenses as a percentage of net sales was primarily driven by higher net sales without a corresponding increase in occupancy expenses.
|
21
Operating Expenses and Operating Margin
|
($ in millions)
|
Fiscal Year
|
||||||||||||
|
2013
|
2012
|
2011
|
|||||||||||
|
Operating expenses
|
$
|
4,144
|
|
$
|
4,229
|
|
$
|
3,836
|
|
||||
|
Operating expenses as a percentage of net sales
|
25.7
|
%
|
27.0
|
%
|
26.4
|
%
|
|||||||
|
Operating margin
|
13.3
|
%
|
12.4
|
%
|
9.9
|
%
|
|||||||
Operating expenses decreased
$85 million
, or
1.3
percentage points, in
fiscal 2013
compared with
fiscal 2012
. The decrease in operating expenses was primarily due to lower corporate overhead expenses and store payroll, as well as a decrease in marketing expenses.
Operating expenses increased $393 million, or 0.6 percentage points, in
fiscal 2012
compared with
fiscal 2011
. The increase in operating expenses was primarily due to higher marketing expenses, driven largely by investments in Gap brand marketing and customer relationship marketing, store payroll and other store-related expenses, and higher bonus expense.
In
fiscal 2014
, we expect operating margin to be about 13 percent, flat to fiscal 2013.
Interest Expense
|
($ in millions)
|
Fiscal Year
|
|||||||||||
|
2013
|
2012
|
2011
|
||||||||||
|
Interest expense
|
$
|
61
|
|
$
|
87
|
|
$
|
74
|
|
|||
Interest expense for
fiscal 2013
includes $75 million of interest on overall borrowings and obligations mainly related to our
$1.25 billion
long-term debt, offset by a net reversal of $14 million of interest expense resulting from the favorable resolution of tax matters in fiscal 2013.
Interest expense for
fiscal 2012
and
fiscal 2011
primarily consists of interest expense related to our
$1.25 billion
long-term debt, which was issued in
April 2011
, and
$400 million
term loan, which was funded in
May 2011
and repaid in full in
August 2012
.
Income Taxes
|
($ in millions)
|
Fiscal Year
|
|||||||||||
|
2013
|
2012
|
2011
|
||||||||||
|
Income taxes
|
$
|
813
|
|
$
|
726
|
|
$
|
536
|
|
|||
|
Effective tax rate
|
38.8
|
%
|
39.0
|
%
|
39.2
|
%
|
||||||
The decrease in the effective tax rate for
fiscal 2013
compared with
fiscal 2012
was primarily due to the favorable impact of changes in the mix of pre-tax income between our domestic and international operations, partially offset by higher federal and state tax credits recognized in fiscal 2012.
The decrease in the effective tax rate for
fiscal 2012
compared with
fiscal 2011
was primarily due to the higher federal and state tax credits recognized in fiscal 2012, partially offset by an increase in our state taxes as a result of changes in the mix of state pre-tax income in fiscal 2012.
We currently expect the fiscal 2014 effective tax rate to be about 38.5 percent. The actual rate will ultimately depend on several variables, including the mix of income between domestic and international operations, the overall level of income, the potential resolution of outstanding tax contingencies, and changes in tax laws and rates.
22
Liquidity and Capital Resources
Our largest source of cash flows is cash collections from the sale of our merchandise and proceeds from issuance of debt. Our primary uses of cash include merchandise inventory purchases, occupancy costs, personnel-related expenses, purchases of property and equipment, share repurchases, and payment of taxes.
In the first quarter of fiscal 2011, we made the strategic decision to issue debt in the aggregate amount of
$1.65 billion
. Given favorable market conditions and our history of generating consistent and strong operating cash flow, we took this step to provide a more optimal capital structure. We remain committed to maintaining a strong financial profile with ample liquidity. Proceeds from the debt issuance were available for general corporate purposes, including share repurchases. During fiscal 2012, we repaid our $400 million, five-year, unsecured term loan in full.
In the fourth quarter of fiscal 2013, we entered into a
15 billion
Japanese yen (
$147 million
as of
February 1, 2014
), four-year, unsecured term loan.
We consider the following to be measures of our liquidity and capital resources:
|
($ in millions)
|
February 1,
2014 |
February 2,
2013 |
January 28,
2012 |
|||||||||
|
Cash, cash equivalents, and short-term investments
|
$
|
1,510
|
|
$
|
1,510
|
|
$
|
1,885
|
|
|||
|
Debt
|
$
|
1,394
|
|
$
|
1,246
|
|
$
|
1,665
|
|
|||
|
Working capital
|
$
|
1,985
|
|
$
|
1,788
|
|
$
|
2,181
|
|
|||
|
Current ratio
|
1.81:1
|
|
1.76:1
|
|
2.02:1
|
|
||||||
As of
February 1, 2014
, about half of our cash and cash equivalents were held in the U.S. and are generally accessible without any limitations.
We believe that current cash balances and cash flows from our operations will be sufficient to support our business operations, including growth initiatives and planned capital expenditures, for the next 12 months and beyond. We are also able to supplement near-term liquidity, if necessary, with our
$500 million
revolving credit facility.
Cash Flows from Operating Activities
Net cash provided by operating activities during
fiscal 2013
decreased $231 million compared with
fiscal 2012
, primarily due to the following:
|
•
|
a decrease of $220 million related to income taxes payable, net of prepaid income taxes and other tax-related items, in fiscal 2013 compared with fiscal 2012 primarily due to the timing of tax payments;
|
|
•
|
a decrease of $73 million related to accrued expenses and other current liabilities primarily due to a higher bonus payout in fiscal 2013 compared with fiscal 2012;
|
|
•
|
a decrease of $71 million related to non-cash and other items primarily due to the realized gain related to our derivative financial instruments in fiscal 2013 compared with a realized loss in fiscal 2012;
|
|
•
|
a decrease of $67 million related to lease incentives and other long-term liabilities primarily due to the resolution of tax matters, including interest, and an increase in lease incentives in fiscal 2012 related to the relocation of our New York headquarter offices; and
|
|
•
|
a decrease of $50 million related to merchandise inventory primarily due to volume and timing of receipts; partially offset by
|
|
•
|
an increase in net income of $145 million; and
|
|
•
|
a deferred tax provision of $69 million in fiscal 2013 compared with a deferred tax benefit of $37 million in fiscal 2012.
|
23
Net cash provided by operating activities during
fiscal 2012
increased $573 million compared with
fiscal 2011
, primarily due to the following:
|
•
|
an increase in net income of $302 million in fiscal 2012 compared with fiscal 2011;
|
|
•
|
an increase of $237 million related to income taxes payable, net of prepaid income taxes and other tax-related items, in fiscal 2012 compared with fiscal 2011 primarily due to the timing of tax payments;
|
|
•
|
an increase of $113 million related to accrued expenses and other current liabilities in fiscal 2012 compared with fiscal 2011 primarily due to a higher bonus accrual in fiscal 2012 compared with fiscal 2011; and
|
|
•
|
an increase of $80 million related to accounts payable in fiscal 2012 compared with fiscal 2011 primarily due to the volume and timing of payments; partially offset by
|
|
•
|
an increase of $147 million related to merchandise inventory in fiscal 2012 compared with fiscal 2011 primarily due to the timing of inventory receipts.
|
We fund inventory expenditures during normal and peak periods through cash flows from operating activities and available cash. Our business follows a seasonal pattern, with sales peaking over a total of about eight weeks during the end-of-year holiday period. The seasonality of our operations may lead to significant fluctuations in certain asset and liability accounts between fiscal year-end and subsequent interim periods.
In
fiscal 2014
, we expect depreciation and amortization, net of amortization of lease incentives, to be about $520 million.
Cash Flows from Investing Activities
Our cash outflows from investing activities are primarily for capital expenditures and purchases of investments, while cash inflows are primarily proceeds from maturities of investments. Net cash used for investing activities during
fiscal 2013
decreased $220 million compared with
fiscal 2012
, primarily due to the following:
|
•
|
$129 million used for the acquisition of Intermix in fiscal 2012; and
|
|
•
|
$50 million of maturities of short-term investments in fiscal 2013 compared with $50 million of net purchases in fiscal 2012.
|
Net cash used for investing activities during
fiscal 2012
increased $390 million compared with
fiscal 2011
, primarily due to the following:
|
•
|
$50 million of net purchases of short-term investments in fiscal 2012 compared with $100 million of net maturities in fiscal 2011;
|
|
•
|
$129 million used for the acquisition of Intermix in fiscal 2012; and
|
|
•
|
$111 million more property and equipment purchases in fiscal 2012 compared with fiscal 2011.
|
In
fiscal 2013
, cash used for purchases of property and equipment was $
670 million
. In
fiscal 2014
, we expect cash spending for purchases of property and equipment to be about
$750 million
.
Cash Flows from Financing Activities
Our cash outflows from financing activities consist primarily of repurchases of our common stock, repayments of debt, and dividend payments. Cash inflows primarily consist of proceeds from the issuance of debt and proceeds from issuances under share-based compensation plans, net of withholding tax payments. Net cash used for financing activities during
fiscal 2013
decreased $477 million compared with
fiscal 2012
, primarily due to the following:
|
•
|
$419 million of payments of debt in fiscal 2012;
|
|
•
|
$144 million of proceeds from issuance of long-term debt in fiscal 2013; and
|
|
•
|
$51 million less repurchases of common stock in fiscal 2013 compared with fiscal 2012, partially offset by
|
|
•
|
$81 million more dividends paid in fiscal 2013 compared with fiscal 2012; and
|
24
|
•
|
$77 million less proceeds from issuances under share-based compensation plans, net of withholding taxes, in fiscal 2013 compared with fiscal 2012.
|
Net cash used for financing activities during
fiscal 2012
increased $879 million compared with
fiscal 2011
, primarily due to the following:
|
•
|
$1.6 billion of proceeds from our issuance of long-term debt in fiscal 2011; and
|
|
•
|
$400 million of payments of long-term debt in fiscal 2012; partially offset by
|
|
•
|
$1.1 billion less repurchases of common stock in fiscal 2012 compared with fiscal 2011.
|
Free Cash Flow
Free cash flow is a non-GAAP financial measure. We believe free cash flow is an important metric because it represents a measure of how much cash a company has available for discretionary and non-discretionary items after the deduction of capital expenditures, as we require regular capital expenditures to build and maintain stores and purchase new equipment to improve our business. We use this metric internally, as we believe our sustained ability to generate free cash flow is an important driver of value creation. However, this non-GAAP financial measure is not intended to supersede or replace our GAAP result.
The following table reconciles free cash flow, a non-GAAP financial measure, from a GAAP financial measure.
|
|
Fiscal Year
|
|||||||||||
|
($ in millions)
|
2013
|
2012
|
2011
|
|||||||||
|
Net cash provided by operating activities
|
$
|
1,705
|
|
$
|
1,936
|
|
$
|
1,363
|
|
|||
|
Less: Purchases of property and equipment
|
(670
|
)
|
(659
|
)
|
(548
|
)
|
||||||
|
Free cash flow
|
$
|
1,035
|
|
$
|
1,277
|
|
$
|
815
|
|
|||
In April 2011, we issued $1.25 billion aggregate principal amount of 5.95 percent notes (the “Notes”) due April 2021 and received proceeds of $1.24 billion in cash, net of underwriting and other fees. Interest is payable semi-annually on April 12 and October 12 of each year and commenced on October 12, 2011. We have an option to call the Notes in whole or in part at any time, subject to a make whole premium. The Notes agreement is unsecured and does not contain any financial covenants.
In January 2014, we entered into a
15 billion
Japanese yen ($147 million as of February 1, 2014), four-year, unsecured term loan ("Japan Term Loan") due January 2018. Repayments of
2.5 billion
Japanese yen are payable on January 15 of each year, commencing on January 15, 2015, with a final repayment of 7.5 billion Japanese yen due on January 15, 2018. In addition, interest is payable at least quarterly based on an interest rate equal to the Tokyo Interbank Offered Rate ("TIBOR") plus a fixed margin. The Japan Term Loan agreement contains certain requirements, including that the covenants in our $500 million, five-year, unsecured revolving credit facility are upheld. As of
February 1, 2014
, we were in compliance with all such covenants. Violation of these covenants would result in a default under the Japan Term Loan agreement, which, at the bank's discretion, could require the immediate repayment of outstanding amounts.
Credit Facilities
We have a $500 million, five-year, unsecured revolving credit facility (the "Facility"), which expires in May 2018. The Facility is available for general corporate purposes including working capital, trade letters of credit, and standby letters of credit. The Facility fees fluctuate based on our long-term senior unsecured credit ratings and our leverage ratio. If we were to draw on the Facility, interest would be a base rate, which is typically the London Interbank Offered Rate ("LIBOR"), plus a margin based on our long-term senior unsecured credit ratings and our leverage ratio on the unpaid principal amount. To maintain availability of funds under the Facility, we pay a facility fee on the full facility amount, regardless of usage. As of
February 1, 2014
, there were
no
borrowings under the Facility. The net availability of the Facility, reflecting
$23 million
of outstanding standby letters of credit, was
$477 million
as of
February 1, 2014
.
25
In April 2011, we obtained long-term senior unsecured credit ratings from Moody’s Investors Service (“Moody’s”) and Fitch Ratings (“Fitch”). Moody’s assigned a rating of Baa3, and Fitch assigned a rating of BBB-. In May 2013, Standard & Poor’s Rating Service (“Standard & Poor’s”) raised its rating of us to BBB- from BB+. As of
February 1, 2014
, there were no updates in these credit ratings. Any future change in the Moody’s or Standard & Poor’s ratings would change any future interest expense if we were to draw on the Facility. If a one notch reduction in our Moody’s or Standard & Poor’s ratings were to occur during
fiscal 2014
, the increase in our interest expense for
fiscal 2014
would be immaterial.
We maintain
two
separate agreements in China (the "China Facilities") to make unsecured revolving credit facilities available for our China operations. The 250 million Chinese yuan China Facilities (
$41 million
as of
February 1, 2014
) are uncommitted and are available for borrowings, overdraft borrowings, and the issuance of bank guarantees with no expiration date. As of
February 1, 2014
, there were
no
borrowings under the China Facilities. There were
42 million
Chinese yuan (
$7 million
as of
February 1, 2014
) in bank guarantees primarily related to store leases under the China Facilities as of
February 1, 2014
. The China Facility agreements do not contain any financial covenants.
We have a bilateral unsecured standby letter of credit agreement that is uncommitted and does not have an expiration date. As of
February 1, 2014
, we had $
50 million
in standby letters of credit issued under the agreement.
We also have a
$50 million
, two-year, unsecured committed letter of credit agreement with an expiration date of
September 2014
. As of
February 1, 2014
, we had
no
trade letters of credit issued under this letter of credit agreement.
The Facility and committed letter of credit agreement contain financial and other covenants including, but not limited to, limitations on liens and subsidiary debt, as well as the maintenance of two financial ratios—a minimum annual fixed charge coverage ratio of 2.00 and a maximum annual leverage ratio of 2.25. As of
February 1, 2014
, we were in compliance with all such covenants. Violation of these covenants could result in a default under the Facility and letter of credit agreement, which would permit the participating banks to terminate our ability to access the Facility for letters of credit and advances, terminate our ability to request letters of credit under the letter of credit agreement, require the immediate repayment of any outstanding advances under the Facility, and require the immediate posting of cash collateral in support of any outstanding letters of credit under the letter of credit agreement.
Dividend Policy
In determining whether and at what level to declare a dividend, we consider a number of factors including sustainability, operating performance, liquidity, and market conditions.
We increased our annual dividend from
$0.50
per share in
fiscal 2012
to $0.60 per share in
fiscal 2013
, and paid $0.30 per share during the first half of fiscal 2013. Beginning in the third quarter of fiscal 2013, we increased our annual dividend from $0.60 per share to $0.80 per share, resulting in $0.70 per share for fiscal 2013. We intend to increase our annual dividend to $0.88 per share for
fiscal 2014
.
Share Repurchases
In January 2013, the Board of Directors authorized $1 billion for share repurchases, which was fully utilized as of February 1, 2014. In November 2013, we announced that the Board of Directors approved a new
$1 billion
share repurchase authorization, of which
$966 million
was remaining as of
February 1, 2014
.
During
fiscal 2013
, we repurchased approximately
26 million
shares for
$1.0 billion
, including commissions, at an average price per share of
$38.42
.
26
Contractual Cash Obligations
We are party to many contractual obligations involving commitments to make payments to third parties. The following table provides summary information concerning our future contractual obligations as of
February 1, 2014
. These obligations impact our short-term and long-term liquidity and capital resource needs. Certain of these contractual obligations are reflected in the Consolidated Balance Sheet as of
February 1, 2014
, while others are disclosed as future obligations.
|
|
Payments Due by Period
|
|||||||||||||||||||
|
($ in millions)
|
Less than 1
Year
|
1-3 Years
|
3-5 Years
|
More Than 5
Years
|
Total
|
|||||||||||||||
|
Long-term debt (1)
|
$
|
25
|
|
$
|
49
|
|
$
|
73
|
|
$
|
1,250
|
|
$
|
1,397
|
|
|||||
|
Interest payments on long-term debt
|
75
|
|
151
|
|
150
|
|
186
|
|
562
|
|
||||||||||
|
Liabilities for unrecognized tax benefits (2)
|
4
|
|
—
|
|
—
|
|
—
|
|
4
|
|
||||||||||
|
Operating leases (3)
|
1,105
|
|
2,002
|
|
1,324
|
|
1,716
|
|
6,147
|
|
||||||||||
|
Purchase obligations and commitments (4)
|
3,519
|
|
137
|
|
47
|
|
15
|
|
3,718
|
|
||||||||||
|
Total contractual cash obligations
|
$
|
4,728
|
|
$
|
2,339
|
|
$
|
1,594
|
|
$
|
3,167
|
|
$
|
11,828
|
|
|||||
__________
|
(1)
|
Represents principal maturities, excluding interest. See Note 5 of Notes to Consolidated Financial Statements.
|
|
(2)
|
Excludes $68 million of long-term liabilities recorded in lease incentives and other long-term liabilities in the Consolidated Balance Sheet as of
February 1, 2014
, as the amount relates to uncertain tax positions and we are not able to reasonably estimate the timing of the payments or the amount by which the liability will increase or decrease over time.
|
|
(3)
|
Excludes maintenance, insurance, taxes, and contingent rent obligations. See Note 12 of Notes to Consolidated Financial Statements for discussion of our operating leases.
|
|
(4)
|
Represents estimated open purchase orders to purchase inventory as well as commitments for products and services used in the normal course of business.
|
Commercial Commitments
We have commercial commitments, not reflected in the table above, that were incurred in the normal course of business to support our operations, including standby letters of credit of
$73 million
(of which
$23 million
was issued under the Facility), surety bonds of
$37 million
, and bank guarantees of
$15 million
outstanding as of
February 1, 2014
.
Other Cash Obligations Not Reflected in the Consolidated Balance Sheet (Off-Balance Sheet Arrangements)
The majority of our contractual obligations relate to operating leases for our stores. Future minimum lease payments represent commitments under non-cancelable operating leases and are disclosed in the table above with additional information provided in Item 8, Financial Statements and Supplementary Data, Note 12 of Notes to Consolidated Financial Statements.
Our other off-balance sheet arrangements are disclosed in Item 8, Financial Statements and Supplementary Data, Note 16 of Notes to Consolidated Financial Statements.
Critical Accounting Policies and Estimates
The preparation of financial statements in accordance with GAAP requires management to adopt accounting policies and make significant judgments and estimates to develop amounts reflected and disclosed in the financial statements. In many cases, there are alternative policies or estimation techniques that could be used. We maintain a thorough process to review the application of our accounting policies and to evaluate the appropriateness of the many estimates that are required to prepare the financial statements of a large, global corporation. However, even under optimal circumstances, estimates routinely require adjustment based on changing circumstances and the receipt of new or better information.
27
Our significant accounting policies can be found in Item 8, Financial Statements and Supplementary Data, Note 1 of Notes to Consolidated Financial Statements. The policies and estimates discussed below include the financial statement elements that are either judgmental or involve the selection or application of alternative accounting policies and are material to our financial statements. Management has discussed the development and selection of these critical accounting policies and estimates with the Audit and Finance Committee of our Board of Directors, which has reviewed our disclosure relating to critical accounting policies and estimates in this annual report on Form 10-K.
Merchandise Inventory
We value inventory at the lower of cost or market (“LCM”), with cost determined using the weighted-average cost method. We review our inventory levels in order to identify slow-moving merchandise and broken assortments (items no longer in stock in a sufficient range of sizes or colors) and we primarily use promotions and markdowns to clear merchandise. We record an adjustment to inventory when future estimated selling price is less than cost. Our LCM adjustment calculation requires management to make assumptions to estimate the selling price and amount of slow-moving merchandise and broken assortments subject to markdowns, which is dependent upon factors such as historical trends with similar merchandise, inventory aging, forecasted consumer demand, and the promotional environment. In addition, we estimate and accrue shortage for the period between the last physical count and the balance sheet date. Our shortage estimate can be affected by changes in merchandise mix and changes in actual shortage trends. Historically, actual shortage has not differed materially from our estimates.
We do not believe there is a reasonable likelihood that there will be a material change in the future estimates or assumptions we use to calculate our LCM or inventory shortage adjustments. However, if estimates regarding consumer demand are inaccurate or actual physical inventory shortage differs significantly from our estimate, our operating results could be affected. We have not made any material changes in the accounting methodology used to calculate our LCM or inventory shortage adjustments in the past three fiscal years.
Impairment of Long-Lived Assets, Goodwill, and Intangible Assets
We review the carrying amount of long-lived assets for impairment whenever events or changes in circumstances indicate that the carrying amount of an asset or asset group may not be recoverable. Events that result in an impairment review include the decision to close a store, corporate facility, or distribution center, or a significant decrease in the operating performance of the long-lived asset. Long-lived assets are considered impaired if the estimated undiscounted future cash flows of the asset or asset group are less than the carrying amount. For impaired assets, we recognize a loss equal to the difference between the carrying amount of the asset or asset group and its estimated fair value. The estimated fair value of the asset or asset group is based on estimated discounted future cash flows of the asset or asset group using a discount rate commensurate with the risk. The asset group is defined as the lowest level for which identifiable cash flows are available and largely independent of the cash flows of other groups of assets. The asset group for our retail stores is reviewed for impairment primarily at the store level. Our estimate of future cash flows requires management to make assumptions and to apply judgment, including forecasting future sales and expenses and estimating useful lives of the assets. These estimates can be affected by factors such as future store results, real estate demand, and economic conditions that can be difficult to predict. We have not made any material changes in the methodology to assess and calculate impairment of long-lived assets in the past three fiscal years. We recorded a charge for the impairment of long-lived assets of
$1 million
,
$8 million
, and
$16 million
for
fiscal 2013
,
2012
, and
2011
, respectively.
We also review the carrying amount of goodwill and other indefinite-lived intangible assets for impairment annually and whenever events or changes in circumstances indicate that it is more likely than not that the carrying amount may not be recoverable. Events that result in an impairment review include significant changes in the business climate, declines in our operating results, or an expectation that the carrying amount may not be recoverable.
28
In connection with the acquisitions of Athleta in September 2008 and Intermix in December 2012, we allocated
$99 million
and
$81 million
of the respective purchase prices to goodwill. The carrying amount of goodwill was
$180 million
as of
February 1, 2014
. We review goodwill for impairment, as appropriate, by first assessing qualitative factors to determine whether it is more likely than not that the fair value of the reporting unit is less than its carrying amount, including goodwill, as a basis for determining whether it is necessary to perform the two-step goodwill impairment test. If it is determined that it is more likely than not that the fair value of the reporting unit is less than its carrying amount, the two-step test is performed to identify potential goodwill impairment. If it is determined that it is not more likely than not that the fair value of the reporting unit is less than its carrying amount, it is unnecessary to perform the two-step goodwill impairment test. Based on certain circumstances, we may elect to bypass the qualitative assessment and proceed directly to performing the first step of the two-step goodwill impairment test. The first step of the two-step goodwill impairment test compares the fair value of the reporting unit to its carrying amount, including goodwill. The second step includes hypothetically valuing all the tangible and intangible assets of the reporting unit as if the reporting unit had been acquired in a business combination. Then, the implied fair value of the reporting unit’s goodwill is compared to the carrying amount of that goodwill. If the carrying amount of the reporting unit’s goodwill exceeds the implied fair value of the goodwill, we recognize an impairment loss in an amount equal to the excess, not to exceed the carrying amount.
A reporting unit is an operating segment or a business unit one level below that operating segment, for which discrete financial information is prepared and regularly reviewed by segment management. We have deemed Athleta and Intermix to be the reporting units at which goodwill is tested for Athleta and Intermix, respectively. During the fourth quarter of fiscal 2013, we completed our annual impairment testing of goodwill and we did not recognize any impairment charges. We determined that the fair value of goodwill attributable to Athleta significantly exceeded its carrying amount as of the date of our annual impairment review. The fair value of goodwill attributed to Intermix exceeded its carrying amount by approximately 20 percent as of the date of our annual impairment review.
In connection with the acquisitions of Athleta in September 2008 and Intermix in December 2012, we allocated
$54 million
and
$38 million
of the respective purchase prices to trade names. The carrying amount of the trade names was
$92 million
as of
February 1, 2014
. A trade name is considered impaired if the estimated fair value of the trade name is less than the carrying amount. If a trade name is considered impaired, we recognize a loss equal to the difference between the carrying amount and the estimated fair value of the trade name. The fair value of the trade names is determined using the relief from royalty method. During the fourth quarter of fiscal 2013, we completed our annual impairment review of the trade names and we did not recognize any impairment charges. The fair values of the Athleta and Intermix trade names exceeded their respective carrying amounts as of the date of our annual impairment review.
These analyses require management to make assumptions and to apply judgment, including forecasting future sales and expenses, and selecting appropriate discount rates and royalty rates, which can be affected by economic conditions and other factors that can be difficult to predict.
We do not believe there is a reasonable likelihood that there will be a material change in the estimates or assumptions we use to calculate impairment losses of long-lived assets, goodwill, and intangible assets. However, if actual results are not consistent with our estimates and assumptions used in the calculations, we may be exposed to impairment losses that could be material.
Revenue Recognition
While revenue recognition for the Company does not involve significant judgment, it represents an important accounting policy. We recognize revenue and the related cost of goods sold at the time the products are received by the customers. For store sales, revenue is recognized when the customer receives and pays for the merchandise at the register. For sales from our online and catalog business, revenue is recognized at the time we estimate the customer receives the merchandise. We record an allowance for estimated returns based on our historical return patterns and various other assumptions that management believes to be reasonable.
29
We sell merchandise to franchisees under multi-year franchise agreements. We recognize revenue from sales to franchisees at the time merchandise ownership is transferred to the franchisee, which generally occurs when the merchandise reaches the franchisee’s pre-designated turnover point. We also receive royalties from franchisees based on a percentage of the total merchandise purchased by the franchisee, net of any refunds or credits due them. Royalty revenue is recognized when merchandise ownership is transferred to the franchisee.
We do not believe there is a reasonable likelihood that there will be a material change in the future estimates or assumptions we use to calculate our sales return allowance. However, if the actual rate of sales returns increases significantly, our operating results could be adversely affected. We have not made any material changes in the accounting methodology used to estimate future sales returns in the past three fiscal years.
Unredeemed Gift Cards, Gift Certificates, and Credit Vouchers
Upon issuance of a gift card, gift certificate, or credit voucher, a liability is established for its cash value. The liability is relieved and net sales are recorded upon redemption by the customer. Over time, some portion of these instruments is not redeemed (“breakage”). We determine breakage income for gift cards, gift certificates, and credit vouchers based on historical redemption patterns. Breakage income is recorded in other income, which is a component of operating expenses in the Consolidated Statements of Income, when we can determine the portion of the liability where redemption is remote, which is three years after the gift card, gift certificate, or credit voucher is issued. When breakage income is recorded, a liability is recognized for any legal obligation to remit the unredeemed portion to relevant jurisdictions. Substantially all of our gift cards, gift certificates, and credit vouchers have no expiration dates.
We do not believe there is a reasonable likelihood that there will be a material change in the future estimates or assumptions we use to calculate our breakage income. However, if the actual rate of redemption for gift cards, gift certificates, and credit vouchers increases significantly, our operating results could be adversely affected. We have not made any material changes in the accounting methodology used to estimate breakage income in the past three fiscal years.
Income Taxes
We record a valuation allowance against our deferred tax assets when it is more likely than not that some portion or all of such deferred tax assets will not be realized. In determining the need for a valuation allowance, management is required to make assumptions and to apply judgment, including forecasting future income, taxable income, and the mix of income or losses in the jurisdictions in which we operate. Our effective tax rate in a given financial statement period may also be materially impacted by changes in the mix and level of income or losses, changes in the expected outcome of audits, or changes in the deferred tax valuation allowance.
At any point in time, many tax years are subject to or in the process of being audited by various taxing authorities. To the extent our estimates of settlements change or the final tax outcome of these matters is different from the amounts recorded, such differences will impact the income tax provision in the period in which such determinations are made. Our income tax expense includes changes in our estimated liability for exposures associated with our various tax filing positions. Determining the income tax expense for these potential assessments requires management to make assumptions that are subject to factors such as proposed assessments by tax authorities, changes in facts and circumstances, issuance of new regulations, and resolution of tax audits.
We believe the judgments and estimates discussed above are reasonable. However, if actual results are not consistent with our estimates or assumptions, we may be exposed to losses or gains that could be material.
Recent Accounting Pronouncements
See Item 8, Financial Statements and Supplementary Data, Note 1 of Notes to Consolidated Financial Statements for recent accounting pronouncements, including the expected dates of adoption and estimated effects on our Consolidated Financial Statements.
30
Derivative Financial Instruments
We operate in foreign countries, which exposes us to market risk associated with foreign currency exchange rate fluctuations. Consistent with our risk management guidelines, we hedge the following using foreign exchange forward contracts: (1) a significant portion of forecasted merchandise purchases and related costs denominated primarily in U.S. dollars made by our international subsidiaries whose functional currencies are their local currencies; (2) forecasted intercompany royalty payments denominated in foreign currencies received by entities whose functional currencies are U.S. dollars; (3) forecasted intercompany revenue transactions related to merchandise sold from our regional purchasing entity, whose functional currency is the U.S. dollar, to certain international subsidiaries in their local currencies; and (4) intercompany obligations that bear foreign exchange risk. We also use foreign exchange forward contracts to hedge the net assets of international subsidiaries to offset the foreign currency translation and economic exposures related to our investment in the subsidiaries. These contracts are entered into with large, reputable financial institutions that are monitored for counterparty risk. The principal currencies hedged against changes in the U.S. dollar are British pounds, Canadian dollars, Euro, and Japanese yen. Our use of derivative financial instruments represents risk management; we do not enter into derivative financial contracts for trading purposes. Additional information is presented in Item 8, Financial Statements and Supplementary Data, Note 8 of Notes to Consolidated Financial Statements. Our derivative financial instruments are recorded in the Consolidated Balance Sheets at fair value as of the balance sheet dates. As of
February 1, 2014
, we had foreign exchange forward contracts outstanding related to our forecasted merchandise purchases for foreign operations, forecasted intercompany royalty payments, forecasted intercompany revenue transactions, and intercompany obligations that bear foreign exchange risk to buy the notional amounts of
$1.3 billion
. As of
February 1, 2014
, we had foreign exchange forward contracts outstanding to hedge the net assets of our subsidiaries in the notional amount of
8 million
Canadian dollars and
25 million
Euro.
We have performed a sensitivity analysis as of
February 1, 2014
based on a model that measures the impact of a hypothetical 10 percent adverse change in the level of foreign currency exchange rates to U.S. dollars (with all other variables held constant) on our underlying exposure, net of derivative financial instruments. The foreign currency exchange rates used in the model were based on the spot rates in effect as of
February 1, 2014
. The sensitivity analysis indicated that a hypothetical 10 percent adverse movement in foreign currency exchange rates would have an unfavorable impact on the underlying cash flow exposure, net of our foreign exchange derivative financial instruments, of $30 million as of
February 1, 2014
.
Long-Term Debt
In
April 2011
, we issued
$1.25 billion
aggregate principal amount of
5.95 percent
Notes due
April 2021
and received proceeds of
$1.24 billion
in cash, net of underwriting and other fees. Interest is payable semi-annually on April 12 and October 12 of each year and commenced on October 12, 2011. The Notes are not subject to interest rate risk, as they have a fixed interest rate.
In January 2014, we entered into a
15 billion
Japanese yen (
$147 million
as of
February 1, 2014
), four-year, unsecured Japan Term Loan due January 2018. Repayments of
2.5 billion
Japanese yen are payable on January 15 of each year, commencing on January 15, 2015, with a final repayment of 7.5 billion Japanese yen due on January 15, 2018. In addition, interest is payable at least quarterly based on TIBOR plus a fixed margin. The average interest rate during fiscal 2013 was
1 percent
.
Our interest rate risk associated with the Japan Term Loan as of February 1, 2014 is as follows:
|
Expected Maturity Date (Fiscal Year)
|
||||||||||||||||||||||||||||
|
(
¥
in billions)
|
2014
|
2015
|
2016
|
2017
|
2018
|
Total
|
Fair Value (1)
|
|||||||||||||||||||||
|
Principal payments
|
¥
|
2.5
|
|
¥
|
2.5
|
|
¥
|
2.5
|
|
¥
|
7.5
|
|
¥
|
—
|
|
¥
|
15
|
|
¥
|
15
|
|
|||||||
|
Average interest rate (2)
|
1
|
%
|
1
|
%
|
1
|
%
|
1
|
%
|
—
|
%
|
1
|
%
|
||||||||||||||||
__________
|
(1)
|
The carrying amount of the Japan Term Loan approximates its fair value, as the interest rate varies depending on market rates.
|
31
|
(2)
|
The average interest rate for all periods presented was calculated based on TIBOR plus a fixed margin as of
February 1, 2014
. As the interest rate for the term loan is variable, it is subject to change for all periods presented.
|
Cash Equivalents
We have highly liquid fixed and variable income investments classified as cash equivalents, which are placed primarily in money market funds, time deposits, and commercial paper. These investments are classified as held-to-maturity based on our positive intent and ability to hold the securities to maturity. We value these investments at their original purchase prices plus interest that has accrued at the stated rate. The value of our investments is not subject to material interest rate risk. However, changes in interest rates would impact the interest income derived from our investments. We earned interest income of
$5 million
in
fiscal 2013
.
32
THE GAP, INC.
INDEX TO CONSOLIDATED FINANCIAL STATEMENTS
|
|
Page
|
|
Consolidated Balance Sheets as of February 1, 2014 and
February 2, 2013
|
|
|
Consolidated Statements of Stockholders' Equity for the fiscal years ended
February 1, 2014, February 2, 2013, and January 28, 2012
|
|
|
Consolidated Statements of Cash Flows for the fiscal years ended
February 1, 2014, February 2, 2013, and January 28, 2012
|
|
33
Report of Independent Registered Public Accounting Firm
To the Board of Directors and Stockholders of The Gap, Inc.:
We have audited the accompanying consolidated balance sheets of The Gap, Inc. and subsidiaries (the “Company”) as of February 1, 2014 and February 2, 2013, and the related consolidated statements of income, comprehensive income, stockholders’ equity, and cash flows, for each of the three fiscal years in the period ended February 1, 2014. We also have audited the Company’s internal control over financial reporting as of February 1, 2014, based on criteria established in
Internal Control - Integrated Framework
(1992)
issued by the Committee of Sponsoring Organizations of the Treadway Commission. The Company’s management is responsible for these financial statements, for maintaining effective internal control over financial reporting, and for its assessment of the effectiveness of internal control over financial reporting, included in the accompanying Management’s Report on Internal Control over Financial Reporting. Our responsibility is to express an opinion on these financial statements and an opinion on the Company’s internal control over financial reporting based on our audits.
We conducted our audits in accordance with the standards of the Public Company Accounting Oversight Board (United States). Those standards require that we plan and perform the audit to obtain reasonable assurance about whether the financial statements are free of material misstatement and whether effective internal control over financial reporting was maintained in all material respects. Our audits of the financial statements included examining, on a test basis, evidence supporting the amounts and disclosures in the financial statements, assessing the accounting principles used and significant estimates made by management, and evaluating the overall financial statement presentation. Our audit of internal control over financial reporting included obtaining an understanding of internal control over financial reporting, assessing the risk that a material weakness exists, and testing and evaluating the design and operating effectiveness of internal control based on the assessed risk. Our audits also included performing such other procedures as we considered necessary in the circumstances. We believe that our audits provide a reasonable basis for our opinions.
A company’s internal control over financial reporting is a process designed by, or under the supervision of, the company’s principal executive and principal financial officers, or persons performing similar functions, and effected by the company’s board of directors, management, and other personnel to provide reasonable assurance regarding the reliability of financial reporting and the preparation of financial statements for external purposes in accordance with generally accepted accounting principles. A company’s internal control over financial reporting includes those policies and procedures that (1) pertain to the maintenance of records that, in reasonable detail, accurately and fairly reflect the transactions and dispositions of the assets of the company; (2) provide reasonable assurance that transactions are recorded as necessary to permit preparation of financial statements in accordance with generally accepted accounting principles, and that receipts and expenditures of the company are being made only in accordance with authorizations of management and directors of the company; and (3) provide reasonable assurance regarding prevention or timely detection of unauthorized acquisition, use, or disposition of the company’s assets that could have a material effect on the financial statements.
Because of the inherent limitations of internal control over financial reporting, including the possibility of collusion or improper management override of controls, material misstatements due to error or fraud may not be prevented or detected on a timely basis. Also, projections of any evaluation of the effectiveness of the internal control over financial reporting to future periods are subject to the risk that the controls may become inadequate because of changes in conditions, or that the degree of compliance with the policies or procedures may deteriorate.
In our opinion, the consolidated financial statements referred to above present fairly, in all material respects, the financial position of The Gap, Inc. and subsidiaries as of February 1, 2014 and February 2, 2013, and the results of their operations and their cash flows for each of the three fiscal years in the period ended February 1, 2014, in conformity with accounting principles generally accepted in the United States of America. Also, in our opinion, the Company maintained, in all material respects, effective internal control over financial reporting as of February 1, 2014, based on the criteria established in
Internal Control - Integrated Framework (1992)
issued by the Committee of Sponsoring Organizations of the Treadway Commission.
/s/ Deloitte & Touche LLP
San Francisco, California
March 24, 2014
34
THE GAP, INC.
|
($ and shares in millions except par value)
|
February 1,
2014 |
February 2,
2013 |
||||||
|
ASSETS
|
||||||||
|
Current assets:
|
||||||||
|
Cash and cash equivalents
|
$
|
1,510
|
|
$
|
1,460
|
|
||
|
Short-term investments
|
—
|
|
50
|
|
||||
|
Merchandise inventory
|
1,928
|
|
1,758
|
|
||||
|
Other current assets
|
992
|
|
864
|
|
||||
|
Total current assets
|
4,430
|
|
4,132
|
|
||||
|
Property and equipment, net
|
2,758
|
|
2,619
|
|
||||
|
Other long-term assets
|
661
|
|
719
|
|
||||
|
Total assets
|
$
|
7,849
|
|
$
|
7,470
|
|
||
|
LIABILITIES AND STOCKHOLDERS' EQUITY
|
||||||||
|
Current liabilities:
|
||||||||
|
Current maturities of debt
|
$
|
25
|
|
$
|
—
|
|
||
|
Accounts payable
|
1,242
|
|
1,144
|
|
||||
|
Accrued expenses and other current liabilities
|
1,142
|
|
1,092
|
|
||||
|
Income taxes payable
|
36
|
|
108
|
|
||||
|
Total current liabilities
|
2,445
|
|
2,344
|
|
||||
|
Long-term liabilities:
|
||||||||
|
Long-term debt
|
1,369
|
|
1,246
|
|
||||
|
Lease incentives and other long-term liabilities
|
973
|
|
986
|
|
||||
|
Total long-term liabilities
|
2,342
|
|
2,232
|
|
||||
|
Commitments and contingencies (see Notes 12 and 16)
|
||||||||
|
Stockholders' equity:
|
||||||||
|
Common stock $0.05 par value
|
||||||||
|
Authorized 2,300 shares and Issued 1,106 shares for all periods presented; Outstanding 446 and 463 shares
|
55
|
|
55
|
|
||||
|
Additional paid-in capital
|
2,899
|
|
2,864
|
|
||||
|
Retained earnings
|
14,218
|
|
13,259
|
|
||||
|
Accumulated other comprehensive income
|
135
|
|
181
|
|
||||
|
Treasury stock at cost (660 and 643 shares)
|
(14,245
|
)
|
(13,465
|
)
|
||||
|
Total stockholders' equity
|
3,062
|
|
2,894
|
|
||||
|
Total liabilities and stockholders' equity
|
$
|
7,849
|
|
$
|
7,470
|
|
||
See Accompanying Notes to Consolidated Financial Statements
35
THE GAP, INC.
|
|
Fiscal Year
|
|||||||||||
|
($ and shares in millions except per share amounts)
|
2013
|
2012
|
2011
|
|||||||||
|
Net sales
|
$
|
16,148
|
|
$
|
15,651
|
|
$
|
14,549
|
|
|||
|
Cost of goods sold and occupancy expenses
|
9,855
|
|
9,480
|
|
9,275
|
|
||||||
|
Gross profit
|
6,293
|
|
6,171
|
|
5,274
|
|
||||||
|
Operating expenses
|
4,144
|
|
4,229
|
|
3,836
|
|
||||||
|
Operating income
|
2,149
|
|
1,942
|
|
1,438
|
|
||||||
|
Interest expense
|
61
|
|
87
|
|
74
|
|
||||||
|
Interest income
|
(5
|
)
|
(6
|
)
|
(5
|
)
|
||||||
|
Income before income taxes
|
2,093
|
|
1,861
|
|
1,369
|
|
||||||
|
Income taxes
|
813
|
|
726
|
|
536
|
|
||||||
|
Net income
|
$
|
1,280
|
|
$
|
1,135
|
|
$
|
833
|
|
|||
|
Weighted-average number of shares—basic
|
461
|
|
482
|
|
529
|
|
||||||
|
Weighted-average number of shares—diluted
|
467
|
|
488
|
|
533
|
|
||||||
|
Earnings per share—basic
|
$
|
2.78
|
|
$
|
2.35
|
|
$
|
1.57
|
|
|||
|
Earnings per share—diluted
|
$
|
2.74
|
|
$
|
2.33
|
|
$
|
1.56
|
|
|||
See Accompanying Notes to Consolidated Financial Statements
36
THE GAP, INC.
CONSOLIDATED STATEMENTS OF COMPREHENSIVE INCOME
|
Fiscal Year
|
||||||||||||
|
($ in millions)
|
2013
|
2012
|
2011
|
|||||||||
|
Net income
|
$
|
1,280
|
|
$
|
1,135
|
|
$
|
833
|
|
|||
|
Other comprehensive income (loss), net of tax:
|
||||||||||||
|
Foreign currency translation, net of tax (tax benefit) of $5, $-, and $(2)
|
(51
|
)
|
(71
|
)
|
24
|
|
||||||
|
Change in fair value of derivative financial instruments, net of tax (tax benefit) of $30, $18, and $(8)
|
48
|
|
28
|
|
(11
|
)
|
||||||
|
Reclassification adjustment for realized (gains) losses on derivative financial instruments, net of (tax) tax benefit of $(27), $(4), and $20
|
(43
|
)
|
(5
|
)
|
31
|
|
||||||
|
Other comprehensive income (loss), net of tax
|
(46
|
)
|
(48
|
)
|
44
|
|
||||||
|
Comprehensive income
|
$
|
1,234
|
|
$
|
1,087
|
|
$
|
877
|
|
|||
See Accompanying Notes to Consolidated Financial Statements
37
THE GAP, INC.
CONSOLIDATED STATEMENTS OF STOCKHOLDERS’ EQUITY
|
|
Common Stock
|
Additional
Paid-in Capital |
Retained
Earnings |
Accumulated
Other Comprehensive Income |
Treasury Stock
|
|
||||||||||||||||||||||||
|
($ and shares in millions)
|
Shares
|
Amount
|
Shares
|
Amount
|
Total
|
|||||||||||||||||||||||||
|
Balance as of January 29, 2011
|
1,106
|
|
$
|
55
|
|
$
|
2,939
|
|
$
|
11,767
|
|
$
|
185
|
|
(518
|
)
|
$
|
(10,866
|
)
|
$
|
4,080
|
|
||||||||
|
Net income
|
833
|
|
833
|
|
||||||||||||||||||||||||||
|
Other comprehensive income, net of tax
|
44
|
|
44
|
|
||||||||||||||||||||||||||
|
Repurchases of common stock
|
(111
|
)
|
(2,096
|
)
|
(2,096
|
)
|
||||||||||||||||||||||||
|
Reissuance of treasury stock under share-based compensation plans, net of shares withheld for employee taxes
|
(140
|
)
|
8
|
|
202
|
|
62
|
|
||||||||||||||||||||||
|
Tax benefit from exercise of stock options and vesting of stock units
|
10
|
|
10
|
|
||||||||||||||||||||||||||
|
Share-based compensation, net of estimated forfeitures
|
58
|
|
58
|
|
||||||||||||||||||||||||||
|
Common stock cash dividends ($0.45 per share)
|
(236
|
)
|
(236
|
)
|
||||||||||||||||||||||||||
|
Balance as of January 28, 2012
|
1,106
|
|
55
|
|
2,867
|
|
12,364
|
|
229
|
|
(621
|
)
|
(12,760
|
)
|
2,755
|
|
||||||||||||||
|
Net income
|
1,135
|
|
1,135
|
|
||||||||||||||||||||||||||
|
Other comprehensive loss, net of tax
|
(48
|
)
|
(48
|
)
|
||||||||||||||||||||||||||
|
Repurchases of common stock
|
(34
|
)
|
(1,026
|
)
|
(1,026
|
)
|
||||||||||||||||||||||||
|
Reissuances of treasury stock under share-based compensation plans, net of shares withheld for employee taxes
|
(147
|
)
|
12
|
|
321
|
|
174
|
|
||||||||||||||||||||||
|
Tax benefit from exercise of stock options and vesting of stock units
|
33
|
|
33
|
|
||||||||||||||||||||||||||
|
Share-based compensation, net of estimated forfeitures
|
111
|
|
111
|
|
||||||||||||||||||||||||||
|
Common stock cash dividends ($0.50 per share)
|
(240
|
)
|
(240
|
)
|
||||||||||||||||||||||||||
|
Balance as of February 2, 2013
|
1,106
|
|
55
|
|
2,864
|
|
13,259
|
|
181
|
|
(643
|
)
|
(13,465
|
)
|
2,894
|
|
||||||||||||||
|
Net income
|
1,280
|
|
1,280
|
|
||||||||||||||||||||||||||
|
Other comprehensive loss, net of tax
|
(46
|
)
|
(46
|
)
|
||||||||||||||||||||||||||
|
Repurchases of common stock
|
(26
|
)
|
(1,009
|
)
|
(1,009
|
)
|
||||||||||||||||||||||||
|
Reissuance of treasury stock under share-based compensation plans, net of shares withheld for employee taxes
|
(132
|
)
|
9
|
|
229
|
|
97
|
|
||||||||||||||||||||||
|
Tax benefit from exercise of stock options and vesting of stock units
|
50
|
|
50
|
|
||||||||||||||||||||||||||
|
Share-based compensation, net of estimated forfeitures
|
117
|
|
117
|
|
||||||||||||||||||||||||||
|
Common stock cash dividends ($0.70 per share)
|
(321
|
)
|
(321
|
)
|
||||||||||||||||||||||||||
|
Balance as of February 1, 2014
|
1,106
|
|
$
|
55
|
|
$
|
2,899
|
|
$
|
14,218
|
|
$
|
135
|
|
(660
|
)
|
$
|
(14,245
|
)
|
$
|
3,062
|
|
||||||||
See Accompanying Notes to Consolidated Financial Statements
38
THE GAP, INC.
|
|
Fiscal Year
|
|||||||||||
|
($ in millions)
|
2013
|
2012
|
2011
|
|||||||||
|
Cash flows from operating activities:
|
||||||||||||
|
Net income
|
$
|
1,280
|
|
$
|
1,135
|
|
$
|
833
|
|
|||
|
Adjustments to reconcile net income to net cash provided by operating activities:
|
||||||||||||
|
Depreciation and amortization
|
536
|
|
559
|
|
592
|
|
||||||
|
Amortization of lease incentives
|
(66
|
)
|
(76
|
)
|
(86
|
)
|
||||||
|
Share-based compensation
|
116
|
|
113
|
|
58
|
|
||||||
|
Tax benefit from exercise of stock options and vesting of stock units
|
50
|
|
33
|
|
10
|
|
||||||
|
Excess tax benefit from exercise of stock options and vesting of stock units
|
(56
|
)
|
(34
|
)
|
(13
|
)
|
||||||
|
Non-cash and other items
|
(60
|
)
|
11
|
|
74
|
|
||||||
|
Deferred income taxes
|
69
|
|
(37
|
)
|
(11
|
)
|
||||||
|
Changes in operating assets and liabilities:
|
||||||||||||
|
Merchandise inventory
|
(193
|
)
|
(143
|
)
|
4
|
|
||||||
|
Other current assets and other long-term assets
|
(44
|
)
|
(44
|
)
|
(101
|
)
|
||||||
|
Accounts payable
|
105
|
|
91
|
|
11
|
|
||||||
|
Accrued expenses and other current liabilities
|
(5
|
)
|
68
|
|
(45
|
)
|
||||||
|
Income taxes payable, net of prepaid and other tax-related items
|
(74
|
)
|
146
|
|
(91
|
)
|
||||||
|
Lease incentives and other long-term liabilities
|
47
|
|
114
|
|
128
|
|
||||||
|
Net cash provided by operating activities
|
1,705
|
|
1,936
|
|
1,363
|
|
||||||
|
Cash flows from investing activities:
|
||||||||||||
|
Purchases of property and equipment
|
(670
|
)
|
(659
|
)
|
(548
|
)
|
||||||
|
Purchases of short-term investments
|
—
|
|
(200
|
)
|
(50
|
)
|
||||||
|
Maturities of short-term investments
|
50
|
|
150
|
|
150
|
|
||||||
|
Acquisition of business
|
—
|
|
(129
|
)
|
—
|
|
||||||
|
Other
|
(4
|
)
|
(6
|
)
|
(6
|
)
|
||||||
|
Net cash used for investing activities
|
(624
|
)
|
(844
|
)
|
(454
|
)
|
||||||
|
Cash flows from financing activities:
|
||||||||||||
|
Proceeds from issuance of short-term debt
|
—
|
|
—
|
|
16
|
|
||||||
|
Payments of short-term debt
|
—
|
|
(19
|
)
|
—
|
|
||||||
|
Proceeds from issuance of long-term debt
|
144
|
|
—
|
|
1,646
|
|
||||||
|
Payments of long-term debt issuance costs
|
—
|
|
—
|
|
(11
|
)
|
||||||
|
Payments of long-term debt
|
—
|
|
(400
|
)
|
—
|
|
||||||
|
Proceeds from issuances under share-based compensation plans, net of withholding tax payments
|
97
|
|
174
|
|
62
|
|
||||||
|
Repurchases of common stock
|
(979
|
)
|
(1,030
|
)
|
(2,092
|
)
|
||||||
|
Excess tax benefit from exercise of stock options and vesting of stock units
|
56
|
|
34
|
|
13
|
|
||||||
|
Cash dividends paid
|
(321
|
)
|
(240
|
)
|
(236
|
)
|
||||||
|
Other
|
(1
|
)
|
—
|
|
—
|
|
||||||
|
Net cash used for financing activities
|
(1,004
|
)
|
(1,481
|
)
|
(602
|
)
|
||||||
|
Effect of foreign exchange rate fluctuations on cash and cash equivalents
|
(27
|
)
|
(36
|
)
|
17
|
|
||||||
|
Net increase (decrease) in cash and cash equivalents
|
50
|
|
(425
|
)
|
324
|
|
||||||
|
Cash and cash equivalents at beginning of period
|
1,460
|
|
1,885
|
|
1,561
|
|
||||||
|
Cash and cash equivalents at end of period
|
$
|
1,510
|
|
$
|
1,460
|
|
$
|
1,885
|
|
|||
|
Non-cash investing activities:
|
||||||||||||
|
Purchases of property and equipment not yet paid at end of period
|
$
|
90
|
|
$
|
74
|
|
$
|
61
|
|
|||
|
Supplemental disclosure of cash flow information:
|
||||||||||||
|
Cash paid for interest during the period
|
$
|
77
|
|
$
|
83
|
|
$
|
45
|
|
|||
|
Cash paid for income taxes during the period
|
$
|
805
|
|
$
|
582
|
|
$
|
599
|
|
|||
See Accompanying Notes to Consolidated Financial Statements
39
Notes to Consolidated Financial Statements
For the Fiscal Years Ended
February 1, 2014
,
February 2, 2013
, and
January 28, 2012
Organization
The Gap, Inc., a Delaware Corporation, is a global retailer offering apparel, accessories, and personal care products for men, women, and children under the Gap, Banana Republic, Old Navy, Piperlime, Athleta, and Intermix brands. We have Company-operated stores in the United States, Canada, the United Kingdom, France, Ireland, Japan, Italy, China, Hong Kong, and beginning in March 2014, Taiwan. We also have franchise agreements with unaffiliated franchisees to operate Gap, Banana Republic, and Old Navy stores in many other countries around the world. In addition, our products are available to customers online through Company-owned websites and through use of third parties that provide logistics and fulfillment services.
Principles of Consolidation
The Consolidated Financial Statements include the accounts of The Gap, Inc. and its subsidiaries. All intercompany transactions and balances have been eliminated.
Fiscal Year and Presentation
Our fiscal year is a 52-week or 53-week period ending on the Saturday closest to January 31. The fiscal years ended
February 1, 2014
(
fiscal 2013
) and
January 28, 2012
(
fiscal 2011
) consisted of 52 weeks. The fiscal year ended
February 2, 2013
(
fiscal 2012
) consisted of 53 weeks.
Use of Estimates
The preparation of financial statements in conformity with U.S. GAAP requires management to make estimates and assumptions that affect the reported amounts of assets and liabilities and disclosure of contingent assets and liabilities at the date of the financial statements and the reported amounts of revenue and expenses during the reporting period. Actual results could differ from those estimates.
Cash and Cash Equivalents and Short-Term Investments
Cash includes funds deposited in banks as well as amounts in transit from banks for customer credit card and debit card transactions that process in less than seven days.
All highly liquid investments with original maturities of 91 days or less are classified as cash equivalents. Highly liquid investments with original maturities of greater than 91 days that will mature less than one year from the balance sheet date are classified as short-term investments. Our cash equivalents and short-term investments are placed primarily in money market funds, time deposits, and commercial paper and are classified as held-to-maturity based on our positive intent and ability to hold the securities to maturity. We value these investments at their original purchase prices plus interest that has accrued at the stated rate. Income related to these securities is recorded in interest income in the Consolidated Statements of Income.
Restricted Cash
Restricted cash consists primarily of cash that serves as collateral for our insurance obligations. Any cash that is legally restricted from use is classified as restricted cash. If the purpose of restricted cash relates to acquiring a long-term asset, liquidating a long-term liability, or is otherwise unavailable for a period longer than one year from the balance sheet date, the restricted cash is included in other long-term assets. Otherwise, restricted cash is included in other current assets in the Consolidated Balance Sheets.
40
Merchandise Inventory
We value inventory at the lower of cost or market, with cost determined using the weighted-average cost method. We record an adjustment when future estimated selling price is less than cost. We review our inventory levels in order to identify slow-moving merchandise and broken assortments (items no longer in stock in a sufficient range of sizes or colors) and use promotions and markdowns to clear merchandise. In addition, we estimate and accrue shortage for the period between the last physical count and the balance sheet date.
Derivative Financial Instruments
Derivative financial instruments are recorded at fair value in the Consolidated Balance Sheets as other current assets, other long-term assets, accrued expenses and other current liabilities, or lease incentives and other long-term liabilities.
For derivative financial instruments that are designated and qualify as cash flow hedges, the effective portion of the gain or loss on the derivative financial instruments is reported as a component of other comprehensive income (“OCI”) and is recognized in income in the period in which the underlying transaction impacts the income statement. For derivative financial instruments that are designated and qualify as net investment hedges, the effective portion of the gain or loss on the derivative financial instruments is reported as a component of OCI and is reclassified into income in the period or periods during which the hedged subsidiary is either sold or liquidated (or substantially liquidated). Gains and losses on the derivative financial instruments representing either hedge ineffectiveness or hedge components excluded from the assessment of effectiveness, if any, are recognized in current income. For derivative financial instruments not designated as hedging instruments, the gain or loss on the derivative financial instruments is recorded in operating expenses in the Consolidated Statements of Income. Cash flows from derivative financial instruments are classified as cash flows from operating activities in the Consolidated Statements of Cash Flows.
Property and Equipment
Depreciation is computed using the straight-line method over the estimated useful lives of the related assets. Estimated useful lives are as follows:
|
Category
|
|
Term
|
|
Leasehold improvements
|
|
Shorter of remaining lease term or economic life, up to 15 years
|
|
Furniture and equipment
|
|
Up to 15 years
|
|
Buildings and building improvements
|
|
Up to 39 years
|
|
Software
|
|
3 to 7 years
|
When assets are sold or retired, the cost and related accumulated depreciation are removed from the accounts, with any resulting gain or loss recorded in operating expenses in the Consolidated Statements of Income. Costs of maintenance and repairs are expensed as incurred.
Lease Rights, Key Money, and Favorable Lease Assets
Lease rights are costs incurred to acquire the right to lease a specific property. A majority of our lease rights are related to premiums paid to landlords, lease buy-out costs, and broker fees. Key money is the amount of funds paid to a landlord or tenant to acquire the rights of tenancy under a commercial property lease for a property located in France. These rights can be subsequently sold by us to a new tenant or the amount of key money paid can potentially be recovered from the landlord should the landlord refuse to allow the automatic right of renewal to be exercised. Lease rights and key money are recorded at cost and are amortized over the corresponding lease term. Lease rights and key money are recorded in other long-term assets in the Consolidated Balance Sheets, net of related amortization.
41
In connection with our acquisition of Intermix in December 2012, we acquired favorable lease assets as a result of leases with terms that were considered favorable relative to market terms for similar leases as of the date of acquisition. The favorable lease assets are recognized as rent expense in cost of goods sold and occupancy expenses in the Consolidated Statements of Income over the remaining term of the leases.
Insurance and Self-Insurance
We retain a portion of the risk for certain losses related to employee health and welfare, workers’ compensation, and general liability claims. Undiscounted liabilities associated with these programs are estimated based primarily on actuarially-determined amounts and are accrued in part by considering historical claims experience, demographic factors, severity factors, and other actuarial assumptions.
Asset Retirement Obligations
An asset retirement obligation represents a legal obligation associated with the retirement of a tangible long-lived asset that is incurred upon the acquisition, construction, development, or normal operation of that long-lived asset. The Company’s asset retirement obligations are primarily associated with leasehold improvements that we are contractually obligated to remove at the end of a lease to comply with the lease agreement. We recognize asset retirement obligations at the inception of a lease with such conditions if a reasonable estimate of fair value can be made. The asset retirement obligation is recorded in accrued expenses and other current liabilities and lease incentives and other long-term liabilities in the Consolidated Balance Sheets and is subsequently adjusted for changes in estimated asset retirement obligations. The associated estimated asset retirement costs are capitalized as part of the carrying amount of the long-lived asset and depreciated over its useful life.
Treasury Stock
We account for treasury stock under the cost method, using the first-in, first-out flow assumption, and we include treasury stock as a component of stockholders’ equity. In February 2014, the Board of Directors approved the retirement of all existing treasury stock effective March 1, 2014. All common stock repurchased subsequent to March 1, 2014 will be immediately retired and all shares related to stock options and other stock awards will be issued from authorized but unissued common stock.
Revenue Recognition
Revenue is recognized for store sales when the customer receives and pays for the merchandise at the register. For sales through online and catalog orders, revenue is recognized at the time we estimate the customer receives the product. Amounts related to shipping and handling that are billed to customers are recorded in net sales, and the related costs are recorded in cost of goods sold and occupancy expenses in the Consolidated Statements of Income. Revenues are presented net of estimated returns and any taxes collected from customers and remitted to governmental authorities. Allowances for estimated returns are recorded based on estimated margin using our historical return patterns.
We sell merchandise to franchisees under multi-year franchise agreements. We recognize revenue from sales to franchisees at the time merchandise ownership is transferred to the franchisee, which generally occurs when the merchandise reaches the franchisee’s pre-designated turnover point. These sales are recorded in net sales, and the related cost of goods sold is recorded in cost of goods sold and occupancy expenses in the Consolidated Statements of Income. We also receive royalties from franchisees based on a percentage of the total merchandise purchased by the franchisee, net of any refunds or credits due them. Royalty revenue is recognized when merchandise ownership is transferred to the franchisee and is recorded in net sales in the Consolidated Statements of Income.
Classification of Expenses
Cost of goods sold and occupancy expenses include the following:
|
•
|
the cost of merchandise;
|
|
•
|
inventory shortage and valuation adjustments;
|
42
|
•
|
freight charges;
|
|
•
|
shipping and handling costs;
|
|
•
|
costs associated with our sourcing operations, including payroll and related benefits;
|
|
•
|
production costs;
|
|
•
|
insurance costs related to merchandise; and
|
|
•
|
rent, occupancy, depreciation, and amortization related to our store operations, distribution centers, and certain corporate functions.
|
Operating expenses include the following:
|
•
|
payroll and related benefits (for our store operations, field management, distribution centers, and corporate functions);
|
|
•
|
marketing;
|
|
•
|
general and administrative expenses;
|
|
•
|
costs to design and develop our products;
|
|
•
|
merchandise handling and receiving in distribution centers;
|
|
•
|
distribution center general and administrative expenses;
|
|
•
|
rent, occupancy, depreciation, and amortization for our corporate facilities; and
|
|
•
|
other expenses (income).
|
The classification of expenses varies across the apparel retail industry. Accordingly, our cost of goods sold and occupancy expenses and operating expenses may not be comparable to those of other companies. Merchandise handling and receiving expenses and distribution center general and administrative expenses recorded in operating expenses were
$243 million
,
$231 million
, and
$224 million
in
fiscal 2013
,
2012
, and
2011
, respectively.
Rent Expense
Minimum rent expense is recognized over the term of the lease, starting when possession of the property is taken from the landlord, which normally includes a construction period prior to the store opening. When a lease contains a predetermined fixed escalation of the minimum rent, we recognize the related rent expense on a straight-line basis and record the difference between the recognized rent expense and the amounts payable under the lease as a short-term or long-term deferred rent liability. We also receive tenant allowances upon entering into certain leases, which are recorded as a short-term or long-term tenant allowance liability and amortized using the straight-line method as a reduction to rent expense over the term of the lease. A co-tenancy failure by our landlord during the lease term may result in a reduction of the required cash payments made to the landlord for the duration of the co-tenancy failure and is recorded as a reduction to rent expense as the reduced cash payments are made. Future payments for common area maintenance, insurance, real estate taxes, and other occupancy costs the Company is obligated to make are excluded from minimum lease payments.
Certain leases provide for contingent rents that are not measurable at inception. These contingent rents are primarily based on a percentage of sales that are in excess of a predetermined level and/or rent increase based on a change in the consumer price index or fair market value. These amounts are excluded from minimum rent and are included in the determination of rent expense when it is probable that the expense has been incurred and the amount can be reasonably estimated.
43
Impairment of Long-Lived Assets
We review the carrying amount of long-lived assets for impairment whenever events or changes in circumstances indicate that the carrying amount of an asset may not be recoverable. Events that result in an impairment review include the decision to close a store, corporate facility, or distribution center, or a significant decrease in the operating performance of the long-lived asset. Long-lived assets are considered impaired if the estimated undiscounted future cash flows of the asset or asset group are less than the carrying amount. For impaired assets, we recognize a loss equal to the difference between the carrying amount of the asset or asset group and its estimated fair value, which is recorded in operating expenses in the Consolidated Statements of Income. The estimated fair value of the asset or asset group is based on discounted future cash flows of the asset or asset group using a discount rate commensurate with the risk. The asset group is defined as the lowest level for which identifiable cash flows are available and largely independent of the cash flows of other groups of assets, which for our retail stores is primarily at the store level.
Goodwill and Intangible Assets
We review the carrying amount of goodwill and other indefinite-lived intangible assets for impairment annually and whenever events or changes in circumstances indicate that the carrying amount may not be recoverable. Events that result in an impairment review include significant changes in the business climate, declines in our operating results, or an expectation that the carrying amount may not be recoverable. We assess potential impairment by considering present economic conditions as well as future expectations.
We review goodwill for impairment, as appropriate, by first assessing qualitative factors to determine whether it is more likely than not that the fair value of the reporting unit is less than its carrying amount, including goodwill, as a basis for determining whether it is necessary to perform the two-step goodwill impairment test. If it is determined that it is more likely than not that the fair value of the reporting unit is less than its carrying amount, the two-step test is performed to identify potential goodwill impairment. If it is determined that it is not more likely than not that the fair value of the reporting unit is less than its carrying amount, it is unnecessary to perform the two-step goodwill impairment test. Based on certain circumstances, we may elect to bypass the qualitative assessment and proceed directly to performing the first step of the two-step goodwill impairment test. The first step of the two-step goodwill impairment test compares the fair value of the reporting unit to its carrying amount, including goodwill. The second step includes hypothetically valuing all the tangible and intangible assets of the reporting unit as if the reporting unit had been acquired in a business combination. Then, the implied fair value of the reporting unit’s goodwill is compared to the carrying amount of that goodwill. If the carrying amount of the reporting unit’s goodwill exceeds the implied fair value of the goodwill, we recognize an impairment loss in an amount equal to the excess, not to exceed the carrying amount.
A trade name is considered impaired if the estimated fair value of the trade name is less than the carrying amount. If a trade name is considered impaired, we recognize a loss equal to the difference between the carrying amount and the estimated fair value of the trade name. The fair value of a trade name is determined using the relief from royalty method, which requires management to make assumptions and to apply judgment, including forecasting future sales and expenses, and selecting appropriate discount rates and royalty rates.
Goodwill and other indefinite-lived intangible assets, including the trade names, are recorded in other long-term assets in the Consolidated Balance Sheets.
Lease Losses
The decision to close a store, corporate facility, or distribution center can result in accelerated depreciation and amortization over the revised remaining useful lives of the associated long-lived assets. In addition, upon exiting leased premises, we record a charge and corresponding lease loss reserve equal to the incremental amount of the present value of the net future obligation greater than the remaining rent-related deferred balances. The net future obligation is determined as the remaining contractual rent obligations less the amount for which we are able to or expect to be able to sublease the properties. We estimate the amount for which we expect to be able to sublease the properties based on the status of our efforts to sublease vacant office space and stores, a review of real estate market conditions, our projections for sublease income, and our assumptions regarding sublease commencement. Lease losses are recorded in operating expenses in the Consolidated Statements of Income.
44
Pre-Opening Costs
Pre-opening and start-up activity costs, which include rent and occupancy, supplies, advertising, and payroll expenses incurred prior to the opening of a new store or other facility, are expensed in the period in which they occur.
Advertising
Costs associated with the production of advertising, such as writing, copy, printing, and other costs, are expensed as incurred. Costs associated with communicating advertising that has been produced, such as television and magazine costs, are expensed when the advertising event takes place. Advertising expense was
$637 million
,
$653 million
, and
$548 million
in
fiscal 2013
,
2012
, and
2011
, respectively, and is recorded in operating expenses in the Consolidated Statements of Income.
Prepaid catalog expense consists of the cost to prepare, print, and distribute catalogs. Such costs are amortized over their expected period of future benefit, which is approximately one to eight months.
Share-Based Compensation
Share-based compensation expense for stock options and other stock awards is determined based on the grant-date fair value. We use the Black-Scholes-Merton option-pricing model to determine the fair value of stock options, which requires the input of subjective assumptions regarding the expected term, expected volatility, dividend yield, and risk-free interest rate. For units granted whereby one share of common stock is issued for each unit as the unit vests (“Stock Units”), the fair value is determined based on the Company’s stock price on the date of grant less future expected dividends during the vesting period. For stock options and Stock Units, we recognize share-based compensation cost net of estimated forfeitures and revise the estimates in subsequent periods if actual forfeitures differ from the estimates. We estimate the forfeiture rate based on historical experience as well as expected future behavior. Share-based compensation expense is recorded primarily in operating expenses in the Consolidated Statements of Income over the period during which the employee is required to provide service in exchange for stock options and Stock Units.
Unredeemed Gift Cards, Gift Certificates, and Credit Vouchers
Upon issuance of a gift card, gift certificate, or credit voucher, a liability is established for its cash value. The liability is relieved and net sales are recorded upon redemption by the customer. Over time, some portion of these instruments is not redeemed. We determine breakage income for gift cards, gift certificates, and credit vouchers based on historical redemption patterns. Breakage income is recorded in other income, which is a component of operating expenses in the Consolidated Statements of Income, when we can determine the portion of the liability where redemption is remote. Based on our historical information, three years after the gift card, gift certificate, or credit voucher is issued, we can determine the portion of the liability where redemption is remote. When breakage income is recorded, a liability is recognized for any legal obligation to remit the unredeemed portion to relevant jurisdictions. Substantially all of our gift cards, gift certificates, and credit vouchers have no expiration dates.
45
Credit Cards
We have credit card agreements (the “Agreements”) with third parties to provide our customers with private label credit cards and/or co-branded credit cards (collectively, the “Credit Cards”). Each private label credit card bears the logo of Gap, Banana Republic, or Old Navy and can be used at any of our U.S. or Canadian store locations and online. The co-branded credit card is a VISA credit card bearing the logo of Gap, Banana Republic, or Old Navy and can be used everywhere VISA credit cards are accepted. A third-party financing company is the sole owner of the accounts issued under the Credit Card programs, and this third party absorbs the losses associated with non-payment by the cardholder and a portion of any fraudulent usage of the accounts. We receive cash from the third-party financing company in accordance with the Agreements and based on usage of the Credit Cards. We also receive payment from Visa U.S.A. Inc. in accordance with the Agreements and based on specified transactional fees. We recognize income for such cash receipts when the amounts are fixed or determinable and collectibility is reasonably assured, which is generally the time at which the actual usage of the Credit Cards or specified transaction occurs. The income is recorded in other income, which is a component of operating expenses in our Consolidated Statements of Income. In February 2014, our agreement with the third-party financing company was amended and extended through May 2022.
The Credit Card programs offer incentives to cardholders in the form of reward certificates upon the cumulative purchase of an established amount. The cost associated with reward points and certificates is accrued as the rewards are earned by the cardholder and is recorded in cost of goods sold and occupancy expenses in the Consolidated Statements of Income. Other administrative costs related to the Credit Card programs, including payroll, marketing expenses, and other direct costs, are recorded in operating expenses in the Consolidated Statements of Income.
Earnings per Share
Basic earnings per share is computed as net income divided by the weighted-average number of common shares outstanding for the period. Diluted earnings per share is computed as net income divided by the weighted-average number of common shares outstanding for the period including common stock equivalents. Common stock equivalents consist of shares subject to share-based awards with exercise prices less than the average market price of our common stock for the period, to the extent their inclusion would be dilutive. Stock options and other stock awards that contain performance conditions are not included in the calculation of common stock equivalents until such performance conditions have been achieved.
Foreign Currency
Our international subsidiaries primarily use local currencies as their functional currency and translate their assets and liabilities at the current rate of exchange in effect at the balance sheet date. Revenue and expenses from their operations are translated using the monthly average exchange rates in effect during the period in which the transactions occur. The resulting gains and losses from translation are recorded in the Consolidated Statements of Comprehensive Income and in accumulated OCI in the Consolidated Statements of Stockholders’ Equity. Transaction gains and losses that arise from exchange rate fluctuations on transactions denominated in a currency other than the local functional currency are included in the Consolidated Statements of Income. There were no material transaction gains and losses recorded in the Consolidated Statements of Income for fiscal 2013, 2012, or 2011.
Comprehensive Income
Comprehensive income is comprised of net income and other gains and losses affecting equity that are excluded from net income. The components of OCI consist of foreign currency translation gains and losses, net of tax, changes in the fair value of derivative financial instruments, net of tax, and reclassification adjustments for realized gains and losses on derivative financial instruments, net of tax.
46
Income Taxes
Deferred income taxes are recorded for temporary differences between the tax basis of assets and liabilities and their reported amounts in the Consolidated Financial Statements. A valuation allowance is established against deferred tax assets when it is more likely than not that some portion or all of the deferred tax assets will not be realized.
Our income tax expense includes changes in our estimated liability for exposures associated with our various tax filing positions. At any point in time, many tax years are subject to or in the process of being audited by various taxing authorities. To the extent our estimates of settlements change or the final tax outcome of these matters is different from the amounts recorded, such differences will impact the income tax provision in the period in which such determinations are made.
The Company recognizes interest related to unrecognized tax benefits in interest expense and penalties related to unrecognized tax benefits in operating expenses in the Consolidated Statements of Income.
Recent Accounting Pronouncements
In July 2013, the Financial Accounting Standards Board issued Accounting Standards Update ("ASU") No. 2013-11, Income Taxes, to clarify the presentation of an unrecognized tax benefit when a net operating loss carryforward, a similar tax loss, or a tax credit carryforward exists. This ASU is effective prospectively for fiscal years and interim periods within those years beginning after December 15, 2013. We do not expect the adoption of the ASU to have a material impact on our consolidated financial statements.
Cash and Cash Equivalents and Short-Term Investments
Cash and cash equivalents and short-term investments consist of the following:
|
($ in millions)
|
February 1,
2014 |
February 2,
2013 |
||||||
|
Cash (1)
|
$
|
991
|
|
$
|
942
|
|
||
|
Bank certificates of deposit and time deposits
|
323
|
|
304
|
|
||||
|
Money market funds
|
196
|
|
189
|
|
||||
|
Domestic commercial paper
|
—
|
|
25
|
|
||||
|
Cash equivalents
|
519
|
|
518
|
|
||||
|
Cash and cash equivalents
|
$
|
1,510
|
|
$
|
1,460
|
|
||
|
Bank certificates of deposit and time deposits
|
$
|
—
|
|
$
|
50
|
|
||
|
Short-term investments
|
$
|
—
|
|
$
|
50
|
|
||
|
(1)
|
Cash includes
$64 million
and
$71 million
of amounts in transit from banks for customer credit card and debit card transactions as of
February 1, 2014
and
February 2, 2013
, respectively.
|
We did not record any impairment charges on our cash equivalents or short-term investments in
fiscal 2013
,
2012
, or
2011
.
47
Other Current Assets
Other current assets consist of the following:
|
($ in millions)
|
February 1,
2014 |
February 2,
2013 |
||||||
|
Accounts receivable
|
$
|
462
|
|
$
|
331
|
|
||
|
Current portion of deferred tax assets
|
179
|
|
220
|
|
||||
|
Prepaid minimum rent and occupancy expenses
|
155
|
|
147
|
|
||||
|
Prepaid income taxes
|
84
|
|
60
|
|
||||
|
Derivative financial instruments
|
58
|
|
49
|
|
||||
|
Prepaid catalog expenses
|
3
|
|
4
|
|
||||
|
Other
|
51
|
|
53
|
|
||||
|
Other current assets
|
$
|
992
|
|
$
|
864
|
|
||
Property and Equipment
Property and equipment are stated at cost less accumulated depreciation and consist of the following:
|
($ in millions)
|
February 1,
2014 |
February 2,
2013 |
||||||
|
Leasehold improvements
|
$
|
3,211
|
|
$
|
3,131
|
|
||
|
Furniture and equipment
|
2,493
|
|
2,464
|
|
||||
|
Software
|
1,173
|
|
1,078
|
|
||||
|
Land, buildings, and building improvements
|
1,106
|
|
1,101
|
|
||||
|
Construction-in-progress
|
176
|
|
136
|
|
||||
|
Property and equipment, at cost
|
8,159
|
|
7,910
|
|
||||
|
Less: Accumulated depreciation
|
(5,401
|
)
|
(5,291
|
)
|
||||
|
Property and equipment, net of accumulated depreciation
|
$
|
2,758
|
|
$
|
2,619
|
|
||
Depreciation expense for property and equipment was
$530 million
,
$554 million
, and
$586 million
for
fiscal 2013
,
2012
, and
2011
, respectively.
Interest of
$8 million
,
$6 million
, and
$4 million
related to assets under construction was capitalized in
fiscal 2013
,
2012
, and
2011
, respectively.
We recorded a charge for the impairment of long-lived assets of
$1 million
,
$8 million
, and
$16 million
for
fiscal 2013
,
2012
, and
2011
, respectively, which is recorded in operating expenses in the Consolidated Statements of Income.
48
Other Long-Term Assets
Other long-term assets consist of the following:
|
($ in millions)
|
February 1,
2014 |
February 2,
2013 |
||||||
|
Long-term income tax-related assets
|
$
|
185
|
|
$
|
244
|
|
||
|
Goodwill
|
180
|
|
184
|
|
||||
|
Trade names
|
92
|
|
92
|
|
||||
|
Deferred compensation plan assets
|
37
|
|
27
|
|
||||
|
Lease rights, key money, and favorable lease assets, net of accumulated amortization of $145 and $144
|
32
|
|
31
|
|
||||
|
Restricted cash
|
14
|
|
11
|
|
||||
|
Other indefinite-lived intangible assets
|
6
|
|
6
|
|
||||
|
Derivative financial instruments
|
6
|
|
2
|
|
||||
|
Intangible assets subject to amortization, net of accumulated amortization of $17 and $15
|
1
|
|
3
|
|
||||
|
Other
|
108
|
|
119
|
|
||||
|
Other long-term assets
|
$
|
661
|
|
$
|
719
|
|
||
Accrued Expenses and Other Current Liabilities
Accrued expenses and other current liabilities consist of the following:
|
($ in millions)
|
February 1,
2014 |
February 2,
2013 |
||||||
|
Accrued compensation and benefits
|
$
|
327
|
|
$
|
369
|
|
||
|
Unredeemed gift cards, gift certificates, and credit vouchers, net of breakage
|
238
|
|
232
|
|
||||
|
Short-term deferred rent and tenant allowances
|
93
|
|
93
|
|
||||
|
Insurance liabilities
|
69
|
|
72
|
|
||||
|
Accrued advertising
|
42
|
|
26
|
|
||||
|
Credit card reward points and certificates liability
|
29
|
|
18
|
|
||||
|
Sales return allowance
|
26
|
|
27
|
|
||||
|
Derivative financial instruments
|
14
|
|
14
|
|
||||
|
Short-term asset retirement obligations
|
8
|
|
6
|
|
||||
|
Short-term lease loss reserve
|
—
|
|
5
|
|
||||
|
Other
|
296
|
|
230
|
|
||||
|
Accrued expenses and other current liabilities
|
$
|
1,142
|
|
$
|
1,092
|
|
||
The activity related to short-term asset retirement obligations includes adjustments to the asset retirement obligation balance and fluctuations in foreign currency exchange rates. The activity was not material for
fiscal 2013
or
2012
.
No other individual items accounted for greater than five percent of total current liabilities as of
February 1, 2014
or
February 2, 2013
.
49
Lease Incentives and Other Long-Term Liabilities
Lease incentives and other long-term liabilities consist of the following:
|
($ in millions)
|
February 1,
2014 |
February 2,
2013 |
||||||
|
Long-term deferred rent, tenant allowances, and unfavorable lease liabilities
|
$
|
766
|
|
$
|
750
|
|
||
|
Long-term income tax-related liabilities
|
83
|
|
132
|
|
||||
|
Long-term asset retirement obligations
|
59
|
|
49
|
|
||||
|
Deferred compensation plan liabilities
|
37
|
|
27
|
|
||||
|
Long-term lease loss reserve
|
1
|
|
1
|
|
||||
|
Derivative financial instruments
|
1
|
|
—
|
|
||||
|
Other
|
26
|
|
27
|
|
||||
|
Lease incentives and other long-term liabilities
|
$
|
973
|
|
$
|
986
|
|
||
The activity related to long-term asset retirement obligations includes adjustments to the asset retirement obligation balance and fluctuations in foreign currency exchange rates. The activity was not material for
fiscal 2013
or
2012
.
Sales Return Allowance
A summary of activity in the sales return allowance account is as follows:
|
($ in millions)
|
February 1,
2014 |
February 2,
2013 |
January 28,
2012 |
|||||||||
|
Balance at beginning of fiscal year
|
$
|
27
|
|
$
|
21
|
|
$
|
22
|
|
|||
|
Additions
|
896
|
|
845
|
|
720
|
|
||||||
|
Returns
|
(897
|
)
|
(839
|
)
|
(721
|
)
|
||||||
|
Balance at end of fiscal year
|
$
|
26
|
|
$
|
27
|
|
$
|
21
|
|
|||
On December 31, 2012, we acquired all of the outstanding capital stock of Intermix Holdco Inc. ("Intermix"), a multi-brand retailer of luxury and contemporary women's apparel and accessories based in New York, New York, for an aggregate purchase price of
$129 million
in cash. The acquisition allows us to extend our portfolio of brands and further penetrate the higher-end apparel market with an established brand.
The results of operations for Intermix since the date of acquisition are not material to the Consolidated Statements of Income for
fiscal 2013
and
2012
. In addition, the impact of the acquisition on the Company's results of operations, as if the acquisition had been completed as of the beginning of the periods presented, is not significant.
50
During the fourth quarter of fiscal 2013, the valuation of assets acquired and liabilities assumed as of the acquisition date was completed. The following table summarizes the final purchase price allocation, as well as the measurement period adjustments made during fiscal 2013, to the amounts initially recognized as of the date of acquisition. The measurement period adjustments did not have a material impact on our Consolidated Financial Statements for any period reported, and therefore, we have not retrospectively adjusted our Consolidated Balance Sheet as of February 2, 2013.
|
($ in millions)
|
Purchase Price Allocation as of Acquisition Date (1)
|
Measurement Period Adjustments
|
Final Purchase Price Allocation
|
||||||||
|
Goodwill
|
$
|
85
|
|
$
|
(4
|
)
|
$
|
81
|
|
||
|
Trade name
|
38
|
|
—
|
|
38
|
|
|||||
|
Intangible assets subject to amortization
|
3
|
|
—
|
|
3
|
|
|||||
|
Net assets acquired
|
3
|
|
4
|
|
7
|
|
|||||
|
Total purchase price
|
$
|
129
|
|
$
|
—
|
|
$
|
129
|
|
||
__________
|
(1)
|
As previously reported in our Form 10-K for the year ended February 2, 2013.
|
See Note 4 of Notes to Consolidated Financial Statements for disclosures about goodwill and intangible assets.
Goodwill and other intangible assets consist of the following and are included in other long-term assets in the Consolidated Balance Sheets:
|
($ in millions)
|
February 1,
2014 |
February 2,
2013 |
||||||
|
Goodwill
|
$
|
180
|
|
$
|
184
|
|
||
|
Trade names
|
$
|
92
|
|
$
|
92
|
|
||
|
Other indefinite-lived intangible assets
|
$
|
6
|
|
$
|
6
|
|
||
|
Intangible assets subject to amortization
|
$
|
18
|
|
$
|
18
|
|
||
|
Less: Accumulated amortization
|
(17
|
)
|
(15
|
)
|
||||
|
Intangible assets subject to amortization, net
|
$
|
1
|
|
$
|
3
|
|
||
Goodwill
As discussed in Note 3 of Notes to Consolidated Financial Statements, the carrying amount of goodwill related to the acquisition of Intermix decreased by
$4 million
from
$85 million
to
$81 million
due to an adjustment of the initial fair values. During
fiscal 2013
,
2012
, and
2011
, there were
no
changes in the
$99 million
carrying amount of goodwill related to Athleta.
During the fourth quarter of
fiscal 2013
, we completed our annual impairment test of goodwill and we did not recognize any impairment charges.
Other Intangible Assets
Trade names consist of
$54 million
and
$38 million
related to Athleta and Intermix, respectively, as of
February 1, 2014
. During the fourth quarter of
fiscal 2013
, we completed our annual impairment test of trade names and we did not recognize any impairment charges.
The intangible assets subject to amortization consist of customer relationships and non-compete agreements related to Athleta and Intermix of
$15 million
and
$3 million
, respectively. Athleta's intangible assets subject to amortization were fully amortized in fiscal 2012. Intermix's non-compete agreements were fully amortized in fiscal 2013 and its customer relationships are being amortized over a period of
four
years.
51
There was
no
material amortization expense for intangible assets subject to amortization recorded in operating expenses in the Consolidated Statements of Income for
fiscal 2013
,
2012
, and
2011
.
Long-term debt consists of the following:
|
($ in millions)
|
February 1,
2014 |
February 2,
2013 |
||||||
|
Notes
|
$
|
1,247
|
|
$
|
1,246
|
|
||
|
Term loan
|
147
|
|
—
|
|
||||
|
Total long-term debt
|
1,394
|
|
1,246
|
|
||||
|
Less: Current portion
|
(25
|
)
|
—
|
|
||||
|
Total long-term debt, less current portion
|
$
|
1,369
|
|
$
|
1,246
|
|
||
In April 2011, we issued
$1.25 billion
aggregate principal amount of
5.95 percent
Notes due
April 2021
and received proceeds of
$1.24 billion
in cash, net of underwriting and other fees of
$11 million
. Interest is payable
semi-annually
on April 12 and October 12 of each year and commenced on October 12, 2011. We have an option to call the Notes in whole or in part at any time, subject to a make-whole premium. The Notes agreement is unsecured and does not contain any financial covenants. The amount recorded in long-term debt in the Consolidated Balance Sheets for the Notes is equal to the aggregate principal amount of the Notes, net of the unamortized discount. As of
February 1, 2014
and
February 2, 2013
, the estimated fair value of the Notes was
$1.39 billion
and
$1.41 billion
, respectively, and was based on the quoted market price of the Notes (level 1 inputs) as of the last business day of the respective fiscal year.
In January 2014, we entered into a
15 billion
Japanese yen (
$147 million
as of
February 1, 2014
), four-year, unsecured Japan Term Loan due
January 2018
. Repayments of
2.5 billion
Japanese yen (
$25 million
as of February 1, 2014) are payable on January 15 of each year, commencing on January 15, 2015, with a final repayment of
7.5 billion
Japanese yen due on January 15, 2018. In addition, interest is payable at least
quarterly
based on an interest rate equal to TIBOR plus a fixed margin. The average interest rate for fiscal 2013 was
1 percent
. The carrying amount of the Japan Term Loan as of
February 1, 2014
approximated its fair value, as the interest rate varies depending on quoted market rates (level 1 inputs). The Japan Term Loan agreement contains certain requirements, including that the covenants in our
$500 million
, five-year, unsecured revolving credit facility are upheld. As of
February 1, 2014
, we were in compliance with all such covenants. Violation of these covenants would result in a default under the Japan Term Loan agreement, which, at the bank's discretion, could require the immediate repayment of outstanding amounts.
We have a
$500 million
,
five
-year, unsecured revolving credit facility (the "Facility"), which was set to expire in April 2016. On May 1, 2013, the Facility was amended to extend the expiration date to
May 2018
and to improve the pricing structure. The Facility is available for general corporate purposes including working capital, trade letters of credit, and standby letters of credit. The Facility fees fluctuate based on our long-term senior unsecured credit ratings and our leverage ratio. If we were to draw on the Facility, interest would be a base rate (typically LIBOR) plus a margin based on our long-term senior unsecured credit ratings and our leverage ratio on the unpaid principal amount. To maintain availability of funds under the Facility, we pay a facility fee on the full facility amount, regardless of usage. As of
February 1, 2014
, there were
no
borrowings under the Facility. The net availability of the Facility, reflecting
$23 million
of outstanding standby letters of credit, was
$477 million
as of
February 1, 2014
.
In conjunction with our financings in April 2011 as discussed in Note 5 of Notes to Consolidated Financial Statements, we obtained long-term senior unsecured credit ratings from Moody’s and Fitch. Moody’s assigned a rating of
Baa3
, and Fitch assigned a rating of
BBB-
. In fiscal 2013, Standard & Poor’s raised its rating of us to BBB- from
BB+
. As of
February 1, 2014
, there were no updates in these credit ratings. Any future change in the Moody’s or Standard & Poor’s ratings would change any future interest expense if we were to draw on the Facility.
52
We maintain
two
separate agreements in China (the "China Facilities") to make unsecured revolving credit facilities available for our operations in China; they are uncommitted and are available for borrowings, overdraft borrowings, and the issuance of bank guarantees. The
196 million
Chinese yuan China Facilities expired in October 2012 and they were subsequently renewed with an increased availability of
250 million
Chinese yuan (
$41 million
as of
February 1, 2014
) and no expiration date. As of
February 1, 2014
, there were
no
borrowings under the China Facilities. There were
42 million
Chinese yuan (
$7 million
as of
February 1, 2014
) in bank guarantees primarily related to store leases under the China Facilities as of
February 1, 2014
. The China Facility agreements do not contain any financial covenants.
We have a bilateral unsecured standby letter of credit agreement that is uncommitted and does not have an expiration date. As of
February 1, 2014
, we had
$50 million
in standby letters of credit issued under the agreement. We also have a
$50 million
,
two
-year, unsecured committed letter of credit agreement with an expiration date of
September 2014
. As of
February 1, 2014
, we had
no
trade letters of credit issued under this letter of credit agreement.
The Facility and the unsecured committed letter of credit agreement contain financial and other covenants including, but not limited to, limitations on liens and subsidiary debt, as well as the maintenance of two financial ratios—a minimum annual fixed charge coverage ratio of
2.00
and a maximum annual leverage ratio of
2.25
. As of
February 1, 2014
, we were in compliance with all such covenants. Violation of these covenants could result in a default under the Facility and letter of credit agreement, which would permit the participating banks to terminate our ability to access the Facility for letters of credit and advances, terminate our ability to request letters of credit under the letter of credit agreement, require the immediate repayment of any outstanding advances under the Facility, and require the immediate posting of cash collateral in support of any outstanding letters of credit under the letter of credit agreement.
There were
no
purchases, sales, issuances, or settlements related to recurring level 3 measurements during
fiscal 2013
or
2012
. There were
no
transfers into or out of level 1 and level 2 during
fiscal 2013
or
2012
.
Financial Assets and Liabilities
Financial assets and liabilities measured at fair value on a recurring basis and cash equivalents and short-term investments held at amortized cost are as follows:
|
|
|
Fair Value Measurements at Reporting Date Using
|
||||||||||||||
|
($ in millions)
|
February 1, 2014
|
Quoted Prices in
Active Markets for
Identical Assets
(Level 1)
|
Significant Other
Observable Inputs
(Level 2)
|
Significant
Unobservable
Inputs
(Level 3)
|
||||||||||||
|
Assets:
|
||||||||||||||||
|
Cash equivalents
|
$
|
519
|
|
$
|
196
|
|
$
|
323
|
|
$
|
—
|
|
||||
|
Derivative financial instruments
|
64
|
|
—
|
|
64
|
|
—
|
|
||||||||
|
Deferred compensation plan assets
|
37
|
|
37
|
|
—
|
|
—
|
|
||||||||
|
Total
|
$
|
620
|
|
$
|
233
|
|
$
|
387
|
|
$
|
—
|
|
||||
|
Liabilities:
|
||||||||||||||||
|
Derivative financial instruments
|
$
|
15
|
|
$
|
—
|
|
$
|
15
|
|
$
|
—
|
|
||||
53
|
|
|
Fair Value Measurements at Reporting Date Using
|
||||||||||||||
|
($ in millions)
|
February 2, 2013
|
Quoted Prices in
Active Markets for
Identical Assets
(Level 1)
|
Significant Other
Observable Inputs
(Level 2)
|
Significant
Unobservable
Inputs
(Level 3)
|
||||||||||||
|
Assets:
|
||||||||||||||||
|
Cash equivalents
|
$
|
518
|
|
$
|
189
|
|
$
|
329
|
|
$
|
—
|
|
||||
|
Short-term investments
|
50
|
|
—
|
|
50
|
|
—
|
|
||||||||
|
Derivative financial instruments
|
51
|
|
—
|
|
51
|
|
—
|
|
||||||||
|
Deferred compensation plan assets
|
27
|
|
27
|
|
—
|
|
—
|
|
||||||||
|
Total
|
$
|
646
|
|
$
|
216
|
|
$
|
430
|
|
$
|
—
|
|
||||
|
Liabilities:
|
||||||||||||||||
|
Derivative financial instruments
|
$
|
14
|
|
$
|
—
|
|
$
|
14
|
|
$
|
—
|
|
||||
We have highly liquid investments classified as cash equivalents and short-term investments, which are placed primarily in money market funds, time deposits, and commercial paper. These investments are classified as held-to-maturity based on our positive intent and ability to hold the securities to maturity. We value these investments at their original purchase prices plus interest that has accrued at the stated rate.
Derivative financial instruments primarily include foreign exchange forward contracts. The principal currencies hedged against changes in the U.S. dollar are British pounds, Canadian dollars, Euro, and Japanese yen. The fair value of the Company’s derivative financial instruments is determined using pricing models based on current market rates. Derivative financial instruments in an asset position are recorded in other current assets or other long-term assets in the Consolidated Balance Sheets. Derivative financial instruments in a liability position are recorded in accrued expenses and other current liabilities or lease incentives and other long-term liabilities in the Consolidated Balance Sheets.
We maintain the Gap Inc. Deferred Compensation Plan (“DCP”), which allows eligible employees to defer compensation up to a maximum amount. Plan investments are recorded at market value and are designated for the DCP. The fair value of the Company’s DCP assets is determined based on quoted market prices, and the assets are recorded in other long-term assets in the Consolidated Balance Sheets.
Nonfinancial Assets
As discussed in Note 2 of Notes to Consolidated Financial Statements, we recorded a charge for the impairment of long-lived assets of
$1 million
,
$8 million
, and
$16 million
in
fiscal 2013
,
2012
, and
2011
, respectively. The impairment charge reduced the then carrying amount of the applicable long-lived assets of
$2 million
,
$11 million
, and
$21 million
to their fair value of
$1 million
,
$3 million
, and
$5 million
during
fiscal 2013
,
2012
, and
2011
, respectively. The fair value of the long-lived assets was determined using level 3 inputs and the valuation techniques discussed in Note 1 of Notes to Consolidated Financial Statements.
As discussed in Note 4 of Notes to Consolidated Financial Statements, there were
no
impairment charges recorded for goodwill or other indefinite-lived intangible assets for
fiscal 2013
,
2012
, or
2011
.
We operate in foreign countries, which exposes us to market risk associated with foreign currency exchange rate fluctuations. Consistent with our risk management guidelines, we hedge a portion of our transactions related to merchandise purchases for foreign operations and certain intercompany transactions using foreign exchange forward contracts. The principal currencies hedged against changes in the U.S. dollar are British pounds, Canadian dollars, Euro, and Japanese yen. We do not enter into derivative financial contracts for trading purposes.
54
Cash Flow Hedges
We designate the following foreign exchange forward contracts as cash flow hedges: (1) forward contracts used to hedge forecasted merchandise purchases and related costs denominated primarily in U.S. dollars made by our international subsidiaries whose functional currencies are their local currencies; (2) forward contracts used to hedge forecasted intercompany royalty payments denominated in foreign currencies received by entities whose functional currencies are U.S. dollars; and (3) forward contracts used to hedge forecasted intercompany revenue transactions related to merchandise sold from our regional purchasing entity, whose functional currency is the U.S. dollar, to certain international subsidiaries in their local currencies of British pounds and Euro. The foreign exchange forward contracts entered into to hedge forecasted merchandise purchases and related costs, intercompany royalty payments, and intercompany revenue transactions generally have terms of up to 18 months.
During fiscal 2011, we entered into and settled treasury rate lock agreements in anticipation of issuing our
5.95 percent
fixed-rate Notes of
$1.25 billion
in April 2011. Prior to the issuance of the Notes, we were subject to changes in interest rates, and we therefore locked into fixed-rate coupons to hedge against the interest rate fluctuations. The gain related to the treasury lock agreements is reported as a component of OCI and is recognized in income over the life of the Notes.
There were
no
material amounts recorded in income for
fiscal 2013
,
2012
, or
2011
as a result of hedge ineffectiveness, hedge components excluded from the assessment of effectiveness, or the discontinuance of cash flow hedges because the forecasted transactions were no longer probable.
Net Investment Hedges
We also use foreign exchange forward contracts to hedge the net assets of international subsidiaries to offset the foreign currency translation and economic exposures related to our investment in the subsidiaries.
There were
no
material amounts recorded in income for
fiscal 2013
,
2012
, or
2011
as a result of hedge ineffectiveness, hedge components excluded from the assessment of effectiveness, or the discontinuance of net investment hedges.
Other Derivatives Not Designated as Hedging Instruments
We use foreign exchange forward contracts to hedge our market risk exposure associated with foreign currency exchange rate fluctuations for certain intercompany balances denominated in currencies other than the functional currency of the entity with the intercompany balance. The gain or loss on the derivative financial instruments, as well as the remeasurement of the underlying intercompany balances, is recorded in operating expenses in the Consolidated Statements of Income in the same period and generally offset. We generally enter into foreign exchange forward contracts as needed to hedge intercompany balances that bear foreign exchange risk.
Outstanding Notional Amounts
As of
February 1, 2014
and
February 2, 2013
, we had foreign exchange forward contracts outstanding in the following notional amounts:
|
(notional amounts in millions)
|
February 1,
2014 |
February 2,
2013 |
|||||
|
U.S. dollars (1)
|
$
|
1,309
|
|
$
|
988
|
|
|
|
British pounds
|
£
|
—
|
|
£
|
31
|
|
|
|
Canadian dollars
|
C$
|
8
|
|
C$
|
—
|
|
|
|
Euro
|
€
|
25
|
|
€
|
25
|
|
|
|
(1)
|
The principal currencies hedged against changes in the U.S. dollar were British pounds, Canadian dollars, Euro, and Japanese yen.
|
Contingent Features
We had
no
derivative financial instruments with credit-risk-related contingent features underlying the agreements as of
February 1, 2014
or
February 2, 2013
.
55
Quantitative Disclosures about Derivative Financial Instruments
The fair values of foreign exchange forward contracts are as follows:
|
($ in millions)
|
February 1,
2014 |
February 2,
2013 |
|||||
|
Derivatives designated as cash flow hedges:
|
|||||||
|
Other current assets
|
$
|
48
|
|
$
|
41
|
|
|
|
Other long-term assets
|
$
|
6
|
|
$
|
2
|
|
|
|
Accrued expenses and other current liabilities
|
$
|
13
|
|
$
|
10
|
|
|
|
Lease incentives and other long-term liabilities
|
$
|
1
|
|
$
|
—
|
|
|
|
Derivatives designated as net investment hedges:
|
|||||||
|
Other current assets
|
$
|
1
|
|
$
|
—
|
|
|
|
Other long-term assets
|
$
|
—
|
|
$
|
—
|
|
|
|
Accrued expenses and other current liabilities
|
$
|
—
|
|
$
|
1
|
|
|
|
Lease incentives and other long-term liabilities
|
$
|
—
|
|
$
|
—
|
|
|
|
Derivatives not designated as hedging instruments:
|
|||||||
|
Other current assets
|
$
|
9
|
|
$
|
8
|
|
|
|
Other long-term assets
|
$
|
—
|
|
$
|
—
|
|
|
|
Accrued expenses and other current liabilities
|
$
|
1
|
|
$
|
3
|
|
|
|
Lease incentives and other long-term liabilities
|
$
|
—
|
|
$
|
—
|
|
|
|
Total derivatives in an asset position
|
$
|
64
|
|
$
|
51
|
|
|
|
Total derivatives in a liability position
|
$
|
15
|
|
$
|
14
|
|
|
Substantially all of the unrealized gains and losses from designated cash flow hedges as of
February 1, 2014
will be recognized in income within the next 12 months at the then-current values, which may differ from the fair values as of
February 1, 2014
shown above.
Effective February 3, 2013, we adopted requirements to disclose the potential effect of rights of setoff associated with our derivative financial instruments. Our foreign exchange forward contracts are subject to master netting arrangements with each of our counterparties and such arrangements are enforceable in the event of default or early termination of the contract. We do not elect to offset the fair values of our derivative financial instruments in the Consolidated Balance Sheets, and as such, the fair values shown above represent gross amounts. The amounts subject to enforceable master netting arrangements are
$1 million
and
$4 million
as of
February 1, 2014
and
February 2, 2013
, respectively. If we did elect to offset, the net amounts of our derivative financial instruments in an asset position would be
$63 million
and
$47 million
and the net amounts of the derivative financial instruments in a liability position would be
$14 million
and
$10 million
as of
February 1, 2014
and
February 2, 2013
, respectively.
See Note 7 of Notes to Consolidated Financial Statements for disclosures on the fair value measurements of our derivative financial instruments.
56
The effective portion of gains and losses on foreign exchange forward contracts in cash flow hedging and net investment hedging relationships recorded in OCI and the Consolidated Statements of Income, on a pre-tax basis, are as follows
:
|
Fiscal Year
|
|||||||||||
|
($ in millions)
|
2013
|
2012
|
2011
|
||||||||
|
Derivatives in cash flow hedging relationships:
|
|||||||||||
|
Gain (loss) recognized in other comprehensive income
|
$
|
78
|
|
$
|
46
|
|
$
|
(20
|
)
|
||
|
Gain (loss) reclassified into cost of goods sold and occupancy expenses
|
$
|
59
|
|
$
|
5
|
|
$
|
(46
|
)
|
||
|
Gain (loss) reclassified into operating expenses
|
$
|
11
|
|
$
|
4
|
|
$
|
(5
|
)
|
||
|
Derivatives in net investment hedging relationships:
|
|||||||||||
|
Gain (loss) recognized in other comprehensive income
|
$
|
17
|
|
$
|
—
|
|
$
|
(1
|
)
|
||
For
fiscal 2013
,
2012
, and
2011
, there were
no
amounts of gain or loss reclassified from OCI into income for derivative financial instruments in net investment hedging relationships, as we did not sell or liquidate (or substantially liquidate) any of our hedged subsidiaries during the periods.
During
fiscal 2011
, there was a gain of
$1 million
recognized in OCI related to treasury rate lock agreements, which is recognized in income over the life of the
5.95 percent
Notes.
Gains and losses on foreign exchange forward contracts not designated as hedging instruments recorded in the Consolidated Statements of Income, on a pre-tax basis are as follows:
|
Fiscal Year
|
|||||||||||
|
($ in millions)
|
2013
|
2012
|
2011
|
||||||||
|
Gain recognized in operating expenses
|
$
|
5
|
|
$
|
5
|
|
$
|
7
|
|
||
Common and Preferred Stock
The Company is authorized to issue
2.3 billion
shares of common stock. We are also authorized to issue
60 million
shares of Class B common stock, which is convertible into shares of common stock on a share-for-share basis. Transfer of the Class B shares is restricted. In addition, the holders of the Class B common stock have
six
votes per share on most matters and are entitled to a lower cash dividend.
No
Class B shares have been issued as of
February 1, 2014
.
The Company is authorized to issue
30 million
shares of one or more series of preferred stock, which has a par value of
$0.05
per share, and to establish at the time of issuance the issue price, dividend rate, redemption price, liquidation value, conversion features, and such other terms and conditions of each series (including voting rights) as the Board of Directors deems appropriate, without further action on the part of the stockholders.
No
preferred shares have been issued as of
February 1, 2014
.
Share Repurchases
Share repurchase activity is as follows:
|
|
Fiscal Year
|
|||||||||||
|
($ and shares in millions except average per share cost)
|
2013
|
2012
|
2011
|
|||||||||
|
Number of shares repurchased
|
26
|
|
34
|
|
111
|
|
||||||
|
Total cost
|
$
|
1,009
|
|
$
|
1,026
|
|
$
|
2,096
|
|
|||
|
Average per share cost including commissions
|
$
|
38.42
|
|
$
|
29.89
|
|
$
|
18.88
|
|
|||
57
Between August 2010 and January 2013, the Board of Directors authorized a total of
$5.25 billion
for share repurchases, all of which was completed by the end of January 2014. In November 2013, we announced that the Board of Directors approved a new
$1 billion
share repurchase authorization, of which
$966 million
was remaining as of
February 1, 2014
.
All except
$30 million
of total share repurchases in fiscal 2013 were paid for as of
February 1, 2014
. All of the share repurchases in
fiscal 2012
were paid for as of
February 2, 2013
.
Effective February 3, 2013, we adopted enhanced disclosure requirements for the reporting of reclassifications out of accumulated other comprehensive income.
Changes in accumulated other comprehensive income by component, net of tax, are as follows:
|
($ in millions)
|
Foreign Currency Translation
|
Cash Flow Hedges
|
Total
|
||||||||
|
Balance at February 2, 2013
|
$
|
158
|
|
$
|
23
|
|
$
|
181
|
|
||
|
Foreign currency translation
|
(51
|
)
|
—
|
|
(51
|
)
|
|||||
|
Change in fair value of derivative financial instruments
|
—
|
|
48
|
|
48
|
|
|||||
|
Amounts reclassified from accumulated other comprehensive income
|
—
|
|
(43
|
)
|
(43
|
)
|
|||||
|
Other comprehensive income (loss), net
|
(51
|
)
|
5
|
|
(46
|
)
|
|||||
|
Balance at February 1, 2014
|
$
|
107
|
|
$
|
28
|
|
$
|
135
|
|
||
See Note 8 of Notes to Consolidated Financial Statements for additional disclosures about reclassifications out of accumulated other comprehensive income and their corresponding effects on the respective line items in the Consolidated Statements of Income.
58
Share-based compensation expense is as follows:
|
|
Fiscal Year
|
|||||||||||
|
($ in millions)
|
2013
|
2012
|
2011
|
|||||||||
|
Stock units
|
$
|
99
|
|
$
|
92
|
|
$
|
39
|
|
|||
|
Stock options
|
12
|
|
17
|
|
15
|
|
||||||
|
Employee stock purchase plan
|
5
|
|
4
|
|
4
|
|
||||||
|
Share-based compensation expense
|
116
|
|
113
|
|
58
|
|
||||||
|
Less: Income tax benefit
|
(45
|
)
|
(44
|
)
|
(23
|
)
|
||||||
|
Share-based compensation expense, net of tax
|
$
|
71
|
|
$
|
69
|
|
$
|
35
|
|
|||
No material share-based compensation expense was capitalized in
fiscal 2013
,
2012
, or
2011
.
There were no material modifications made to our outstanding stock options and other stock awards in
fiscal 2013
,
2012
, or
2011
.
General Description of Stock Option and Other Stock Award Plans
The 1996 Stock Option and Award Plan (the “1996 Plan”) was established on March 26, 1996 and amended and restated on January 28, 2003. The 1996 Plan was further amended and restated on January 24, 2006 and renamed the 2006 Long-Term Incentive Plan (the “2006 Plan”). The 2006 Plan was amended and restated on August 20, 2008. The 2006 Plan was further amended and restated on May 17, 2011 and renamed the 2011 Long-Term Incentive Plan (the “2011 Plan”). The 2011 Plan was further amended and restated in February 2014. Under the 2011 Plan, nonqualified stock options and other stock awards are granted to officers, directors, eligible employees, and consultants at exercise prices or initial values equal to the fair market value of the Company’s common stock at the date of grant or as determined by the Compensation and Management Development Committee of the Board of Directors (the “Committee”).
The 2002 Stock Option Plan (the “2002 Plan”) was established on January 1, 1999. The 2002 Plan empowered the Committee to award nonqualified stock options to non-officer employees. On May 9, 2006, the 2002 Plan was discontinued, and those awards then outstanding continued to be subject to the terms of the 2002 Plan under which they were granted. Pursuant to the 2011 Plan, any shares (not to exceed
28,019,786
shares) that otherwise would have been returned to the 2002 Plan after May 9, 2006 on account of expiration, cancellation, or forfeiture of awards granted are available for grant under the 2011 Plan.
As of
February 1, 2014
, there were
216,586,781
shares that have been authorized for issuance under the 2011 Plan, including those shares available for issuance under the 2002 Plan, which have or may become available for issuance under the 2011 Plan.
All shares related to stock options and other stock awards are currently issued from treasury stock. As discussed in Note 1 of Notes to Consolidated Financial Statements, in February 2014, the Board of Directors approved the retirement of all existing treasury stock effective March 1, 2014. All common stock repurchased subsequent to March 1, 2014 will be immediately retired and all shares related to stock options and other stock awards will be issued from authorized but unissued common stock.
Stock Units
Under the 2011 Plan, Stock Units are granted to employees and members of the Board of Directors. Vesting generally occurs over a period of
three
to
four
years of continued service by the employee in equal annual installments. Vesting is immediate in the case of members of the Board of Directors. In some cases, vesting is subject to the attainment of a pre-determined financial target (“Performance Shares”). Performance Shares generally vest over a period of
three
to
four
years.
59
At the end of each reporting period, we evaluate the probability that the Performance Shares will vest. We record share-based compensation expense on an accelerated basis based on the grant-date fair value and the probability that the pre-determined financial target will be achieved.
A summary of Stock Unit activity under the 2011 Plan for
fiscal 2013
is as follows:
|
Shares
|
Weighted-Average
Grant-Date
Fair Value
|
||||||
|
Balance as of February 2, 2013
|
9,365,435
|
|
$
|
22.62
|
|
||
|
Granted
|
2,345,598
|
|
$
|
36.84
|
|
||
|
Granted, with vesting subject to performance conditions
|
1,602,859
|
|
$
|
35.15
|
|
||
|
Vested
|
(3,031,421
|
)
|
$
|
20.69
|
|
||
|
Forfeited
|
(1,621,836
|
)
|
$
|
29.10
|
|
||
|
Balance as of February 1, 2014
|
8,660,635
|
|
$
|
28.25
|
|
||
A summary of additional information about Stock Units is as follows:
|
|
Fiscal Year
|
|||||||||||
|
|
2013
|
2012
|
2011
|
|||||||||
|
Weighted-average fair value per share of Stock Units granted
|
$
|
36.15
|
|
$
|
24.95
|
|
$
|
20.19
|
|
|||
|
Grant-date fair value of Stock Units vested (in millions)
|
$
|
63
|
|
$
|
50
|
|
$
|
58
|
|
|||
The aggregate intrinsic value of unvested Stock Units as of
February 1, 2014
was
$330 million
.
As of
February 1, 2014
, there was
$108 million
(before any related tax benefit) of unrecognized share-based compensation, adjusted for estimated forfeitures, related to unvested Stock Units, which is expected to be recognized over a weighted-average period of
1.64 years
. Total unrecognized share-based compensation may be adjusted for future changes in estimated forfeitures.
Stock Units Granted Based on Performance Metrics
Under the 2011 Plan, some Stock Units are granted to certain employees only after the achievement of pre-determined performance metrics. Once the Stock Unit is granted, vesting is then subject to continued service by the employee, and expense is recognized over a period of three years on an accelerated basis.
At the end of each reporting period, we evaluate the probability that Stock Units will be granted. We record share-based compensation expense based on the probability that the performance metrics will be achieved, with an offsetting increase to current liabilities. We revalue the liability at the end of each reporting period and record an adjustment to share-based compensation expense as required, based on the probability that the performance metrics will be achieved. Upon achievement of the performance metrics, a Stock Unit is granted. At that time, the associated liability is reclassified to stockholders’ equity.
Out of
2,345,598
Stock Units granted in
fiscal 2013
,
419,501
Stock Units were granted based on satisfaction of performance metrics.
The liability related to potential Stock Units based on performance metrics, which is recorded in accrued expenses and other current liabilities in the Consolidated Balance Sheets, was
$2 million
and
$3 million
as of
February 1, 2014
and
February 2, 2013
, respectively.
Stock Options
We have stock options outstanding under the 2011 Plan and the 2002 Plan. Stock options generally expire
10 years
from the grant date, three months after employee termination, or one year after the date of an employee’s retirement or death, if earlier. Vesting generally occurs over a period of
four
years of continued service by the employee, with
25
percent vesting on each of the four anniversary dates.
60
The fair value of stock options issued during
fiscal 2013
,
2012
, and
2011
was estimated on the date of grant using the following assumptions:
|
|
Fiscal Year
|
||||||||
|
|
2013
|
2012
|
2011
|
||||||
|
Expected term (in years)
|
4.5
|
|
4.6
|
|
4.9
|
|
|||
|
Expected volatility
|
31.5
|
%
|
33.6
|
%
|
30.6
|
%
|
|||
|
Dividend yield
|
1.7
|
%
|
2.1
|
%
|
2.1
|
%
|
|||
|
Risk-free interest rate
|
0.7
|
%
|
1.0
|
%
|
2.3
|
%
|
|||
A summary of stock option activity under the 2011 Plan and the 2002 Plan for
fiscal 2013
is as follows:
|
Shares
|
Weighted-
Average
Exercise Price
|
||||||
|
Balance as of February 2, 2013
|
12,800,355
|
|
$
|
20.56
|
|
||
|
Granted
|
1,498,050
|
|
$
|
36.54
|
|
||
|
Exercised
|
(6,151,766
|
)
|
$
|
18.75
|
|
||
|
Forfeited/Expired
|
(746,817
|
)
|
$
|
24.77
|
|
||
|
Balance as of February 1, 2014
|
7,399,822
|
|
$
|
24.89
|
|
||
A summary of additional information about stock options is as follows:
|
|
Fiscal Year
|
|||||||||||
|
|
2013
|
2012
|
2011
|
|||||||||
|
Weighted-average fair value per share of stock options granted
|
$
|
8.25
|
|
$
|
6.35
|
|
$
|
5.28
|
|
|||
|
Aggregate intrinsic value of stock options exercised (in millions)
|
$
|
125
|
|
$
|
94
|
|
$
|
19
|
|
|||
|
Fair value of stock options vested (in millions)
|
$
|
14
|
|
$
|
15
|
|
$
|
15
|
|
|||
Information about stock options outstanding, vested or expected to vest, and exercisable as of
February 1, 2014
is as follows:
|
|
Options Outstanding
|
Options Exercisable
|
||||||||||||||
|
Range of Exercise Prices
|
Number of
Shares as of February 1, 2014 |
Weighted-
Average
Remaining
Contractual
Life (in years)
|
Weighted-
Average
Exercise Price
|
Number of
Shares as of February 1, 2014 |
Weighted-
Average
Exercise Price
|
|||||||||||
|
$11.77-$18.91
|
1,501,474
|
|
3.66
|
$
|
17.35
|
|
1,490,849
|
|
$
|
17.36
|
|
|||||
|
$19.00-$21.63
|
695,652
|
|
1.85
|
$
|
20.80
|
|
672,152
|
|
$
|
20.85
|
|
|||||
|
$21.79
|
1,481,784
|
|
7.10
|
$
|
21.79
|
|
474,487
|
|
$
|
21.79
|
|
|||||
|
$21.88-$25.09
|
1,970,612
|
|
7.14
|
$
|
24.37
|
|
443,425
|
|
$
|
23.48
|
|
|||||
|
$27.43-$43.31
|
1,750,300
|
|
9.04
|
$
|
36.17
|
|
89,800
|
|
$
|
34.97
|
|
|||||
|
7,399,822
|
|
6.38
|
$
|
24.89
|
|
3,170,713
|
|
$
|
20.12
|
|
||||||
|
Vested or expected to vest as of February 1, 2014
|
6,698,572
|
|
6.19
|
$
|
24.46
|
|
||||||||||
The aggregate intrinsic value of options outstanding, options vested or expected to vest, and options exercisable as of
February 1, 2014
was
$98 million
,
$91 million
, and
$57 million
, respectively. Stock options exercisable as of
February 1, 2014
had a weighted-average remaining contractual life of
2.02 years
.
61
Employee Stock Purchase Plan
Under our Employee Stock Purchase Plan (“ESPP”), eligible U.S. employees are able to purchase our common stock at 85 percent of the closing price on the New York Stock Exchange on the last day of the three-month purchase periods. Accordingly, compensation expense is recognized for an amount equal to the
15
percent discount. Employees pay for their stock purchases through payroll deductions at a rate equal to any whole percentage from
1
percent to
15
percent. There were
811,223
,
960,930
, and
1,357,769
shares issued under the ESPP in
fiscal 2013
,
2012
, and
2011
, respectively. As of
February 1, 2014
, there were
4,253,737
shares reserved for future issuances under the ESPP.
We lease most of our store premises and some of our corporate facilities and distribution centers. These operating leases expire at various dates through
2030
. Most store leases have a five-year base period and include options that allow us to extend the lease term beyond the initial base period, subject to terms agreed upon at lease inception. Some leases also include early termination options, which can be exercised under specific conditions.
The aggregate minimum non-cancelable annual lease payments under leases in effect on
February 1, 2014
are as follows:
|
($ in millions)
|
|
|||
|
Fiscal Year
|
|
|||
|
2014
|
$
|
1,105
|
|
|
|
2015
|
1,087
|
|
||
|
2016
|
915
|
|
||
|
2017
|
738
|
|
||
|
2018
|
586
|
|
||
|
Thereafter
|
1,716
|
|
||
|
Total minimum lease commitments
|
$
|
6,147
|
|
|
The total minimum lease commitment amount above does not include minimum sublease rent income of
$27 million
receivable in the future under non-cancelable sublease agreements.
Rent expense related to our store premises, corporate facilities, and distribution centers under operating leases is as follows:
|
|
Fiscal Year
|
|||||||||||
|
($ in millions)
|
2013
|
2012
|
2011
|
|||||||||
|
Minimum rent expense
|
$
|
1,162
|
|
$
|
1,104
|
|
$
|
1,072
|
|
|||
|
Contingent rent expense
|
121
|
|
123
|
|
123
|
|
||||||
|
Less: Sublease income
|
(4
|
)
|
(4
|
)
|
(8
|
)
|
||||||
|
Total
|
$
|
1,279
|
|
$
|
1,223
|
|
$
|
1,187
|
|
|||
There were
no
material lease loss reserves as of
February 1, 2014
and
February 2, 2013
. Based on our current assumptions as of
February 1, 2014
, we do not expect our lease payments associated with our lease loss reserves, net of sublease income, to be paid over the remaining terms through
2027
, to be material.
62
For financial reporting purposes, components of income before income taxes are as follows:
|
|
Fiscal Year
|
|||||||||||
|
($ in millions)
|
2013
|
2012
|
2011
|
|||||||||
|
United States
|
$
|
1,817
|
|
$
|
1,692
|
|
$
|
1,253
|
|
|||
|
Foreign
|
276
|
|
169
|
|
116
|
|
||||||
|
Income before income taxes
|
$
|
2,093
|
|
$
|
1,861
|
|
$
|
1,369
|
|
|||
The provision for income taxes consists of the following:
|
|
Fiscal Year
|
|||||||||||
|
($ in millions)
|
2013
|
2012
|
2011
|
|||||||||
|
Current:
|
||||||||||||
|
Federal
|
$
|
616
|
|
$
|
617
|
|
$
|
419
|
|
|||
|
State
|
65
|
|
56
|
|
37
|
|
||||||
|
Foreign
|
63
|
|
90
|
|
91
|
|
||||||
|
Total current
|
744
|
|
763
|
|
547
|
|
||||||
|
Deferred:
|
||||||||||||
|
Federal
|
76
|
|
(37
|
)
|
14
|
|
||||||
|
State
|
—
|
|
(6
|
)
|
(6
|
)
|
||||||
|
Foreign
|
(7
|
)
|
6
|
|
(19
|
)
|
||||||
|
Total deferred
|
69
|
|
(37
|
)
|
(11
|
)
|
||||||
|
Total provision
|
$
|
813
|
|
$
|
726
|
|
$
|
536
|
|
|||
Except as noted below and where required by U.S. tax law,
no
provision has been made for U.S. income taxes on the undistributed earnings of our foreign subsidiaries, as we intend to utilize those earnings in our foreign operations for an indefinite period of time. Such undistributed earnings and profits of foreign subsidiaries as of
February 1, 2014
and
February 2, 2013
were approximately
$1.6 billion
and
$1.7 billion
, respectively. Cash balances in these foreign subsidiaries are substantially lower than these undistributed earnings. If we had not intended to utilize the undistributed earnings in our foreign operations for an indefinite period of time, the deferred tax liability as of
February 1, 2014
and
February 2, 2013
would have been approximately
$203 million
and
$237 million
, respectively.
In
fiscal 2013
, we assessed the forecasted cash needs and overall financial position of our foreign subsidiaries. As a result, we determined that approximately
$211 million
of current year earnings was in excess of the amount we expect to utilize in certain foreign operations for an indefinite period of time, and accordingly, we have established a deferred tax liability for U.S. income taxes with respect to such earnings as of
February 1, 2014
and we have recorded related tax expense of
$38 million
in fiscal 2013.
The difference between the effective tax rate and the U.S. federal tax rate is as follows:
|
|
Fiscal Year
|
||||||||
|
|
2013
|
2012
|
2011
|
||||||
|
Federal tax rate
|
35.0
|
%
|
35.0
|
%
|
35.0
|
%
|
|||
|
State income taxes, less federal benefit
|
3.1
|
|
2.7
|
|
2.2
|
|
|||
|
Tax impact of foreign operations
|
0.8
|
|
2.0
|
|
2.1
|
|
|||
|
Other
|
(0.1
|
)
|
(0.7
|
)
|
(0.1
|
)
|
|||
|
Effective tax rate
|
38.8
|
%
|
39.0
|
%
|
39.2
|
%
|
|||
63
Deferred tax assets (liabilities) consist of the following:
|
($ in millions)
|
February 1,
2014 |
February 2,
2013 |
||||||
|
Gross deferred tax assets:
|
||||||||
|
Deferred rent
|
$
|
147
|
|
$
|
136
|
|
||
|
Accrued payroll and related benefits
|
127
|
|
124
|
|
||||
|
Nondeductible accruals
|
104
|
|
79
|
|
||||
|
Inventory capitalization and other adjustments
|
62
|
|
66
|
|
||||
|
Federal, State, and foreign net operating losses ("NOLs")
|
45
|
|
37
|
|
||||
|
Other
|
98
|
|
100
|
|
||||
|
Total gross deferred tax assets
|
583
|
|
542
|
|
||||
|
Valuation allowance
|
(85
|
)
|
(56
|
)
|
||||
|
Total deferred tax assets, net of valuation allowance
|
498
|
|
486
|
|
||||
|
Deferred tax liabilities:
|
||||||||
|
Depreciation
|
(71
|
)
|
(14
|
)
|
||||
|
Unremitted earnings of certain foreign subsidiaries
|
(38
|
)
|
(5
|
)
|
||||
|
Other
|
(33
|
)
|
(40
|
)
|
||||
|
Total deferred tax liabilities
|
(142
|
)
|
(59
|
)
|
||||
|
Net deferred tax assets
|
$
|
356
|
|
$
|
427
|
|
||
|
Current portion (included in other current assets)
|
$
|
179
|
|
$
|
220
|
|
||
|
Non-current portion (included in other long-term assets)
|
177
|
|
207
|
|
||||
|
Total
|
$
|
356
|
|
$
|
427
|
|
||
As of
February 1, 2014
, we had approximately
$6 million
federal,
$66 million
state, and
$162 million
foreign loss carryovers in multiple taxing jurisdictions that could be utilized to reduce the tax liabilities of future years. The tax-effected loss carryovers were approximately
$2 million
for federal,
$4 million
for state, and
$39 million
for foreign as of
February 1, 2014
. We provided a valuation allowance of approximately
$2 million
and
$36 million
against the deferred tax assets related to the state and foreign loss carryovers, respectively. We also provided a valuation allowance of approximately
$47 million
related to other federal, state, and foreign deferred tax assets. The federal losses expire between fiscal
2030
and fiscal
2033
, the state losses expire between fiscal
2019
and fiscal
2032
, approximately
$90 million
of the foreign losses expire between fiscal
2014
and fiscal
2024
, and
$72 million
of the foreign losses do not expire.
The activity related to our unrecognized tax benefits is as follows:
|
|
Fiscal Year
|
|||||||||||
|
($ in millions)
|
2013
|
2012
|
2011
|
|||||||||
|
Balance at beginning of fiscal year
|
$
|
109
|
|
$
|
102
|
|
$
|
67
|
|
|||
|
Increases related to current year tax positions
|
8
|
|
10
|
|
10
|
|
||||||
|
Prior year tax positions:
|
||||||||||||
|
Increases
|
8
|
|
10
|
|
31
|
|
||||||
|
Decreases
|
(47
|
)
|
(12
|
)
|
(2
|
)
|
||||||
|
Cash settlements
|
(5
|
)
|
(4
|
)
|
(2
|
)
|
||||||
|
Expiration of statute of limitations
|
—
|
|
3
|
|
(1
|
)
|
||||||
|
Foreign currency translation
|
(1
|
)
|
—
|
|
(1
|
)
|
||||||
|
Balance at end of fiscal year
|
$
|
72
|
|
$
|
109
|
|
$
|
102
|
|
|||
64
Of the
$72 million
,
$109 million
, and
$102 million
of total unrecognized tax benefits as of
February 1, 2014
,
February 2, 2013
, and
January 28, 2012
, respectively, approximately
$27 million
,
$29 million
, and
$25 million
(net of the federal benefit on state issues), respectively, represents the amount of unrecognized tax benefits that, if recognized, would favorably affect the effective income tax rate in future periods. The decrease in our unrecognized tax benefits during the year was primarily attributable to the favorable resolution of foreign tax matters.
During
fiscal 2013
, an interest expense reversal of
$18 million
was recognized in the Consolidated Statement of Income relating to the favorable resolution of foreign tax matters. This was partially offset by an additional interest expense of
$4 million
relating to tax liabilities. During
fiscal 2012
and 2011, interest expense of
$5 million
and
$6 million
, respectively, was recognized in the Consolidated Statements of Income relating to tax liabilities. As of
February 1, 2014
and
February 2, 2013
, the Company had total accrued interest related to the unrecognized tax benefits of
$17 million
and
$33 million
, respectively. There were
no
accrued penalties related to the unrecognized tax benefits as of
February 1, 2014
or
February 2, 2013
.
The Company conducts business globally, and as a result, files income tax returns in the U.S. federal jurisdiction and various state and foreign jurisdictions. In the normal course of business, we are subject to examination by taxing authorities throughout the world, including such major jurisdictions as the United States, Canada, France, Hong Kong, Japan, India, and the United Kingdom. We are no longer subject to U.S. federal income tax examinations for fiscal years before
2009
, and with few exceptions, we are also no longer subject to U.S. state, local, or non-U.S. income tax examinations for fiscal years before
2008
.
The Company engages in continual discussions with taxing authorities regarding tax matters in the various U.S. and foreign jurisdictions. As of
February 1, 2014
, it is reasonably possible that we will recognize a decrease in gross unrecognized tax benefits within the next 12 month of up to
$18 million
, primarily due to the possible completion of several advance pricing agreements and the closing of audits. If we do recognize such a decrease, the net impact on the Consolidated Statement of Income would not be material.
We have two qualified defined contribution retirement plans, the GapShare 401(k) Plan and the GapShare Puerto Rico Plan (the “Plans”), which are available to employees who meet the eligibility requirements. The Plans permit eligible employees to make contributions up to the maximum limits allowable under the applicable Internal Revenue Codes. Under the Plans, we match, in cash, all or a portion of employees’ contributions under a predetermined formula. Our contributions vest immediately. Our matching contributions to the Plans were
$37 million
,
$37 million
, and
$36 million
in
fiscal 2013
,
2012
, and
2011
, respectively.
We maintain the Gap Inc. DCP, which allows eligible employees and non-employee directors to defer compensation up to a maximum amount. Plan investments are recorded at market value and are designated for the DCP. The fair value of the Company’s DCP assets is determined based on quoted market prices. As of
February 1, 2014
and
February 2, 2013
, the assets related to the DCP were
$37 million
and
$27 million
, respectively, and were recorded in other long-term assets in the Consolidated Balance Sheets. As of
February 1, 2014
and
February 2, 2013
, the corresponding liabilities related to the DCP were
$37 million
and
$27 million
, respectively, and were recorded in lease incentives and other long-term liabilities in the Consolidated Balance Sheets. We match all or a portion of employees’ contributions under a predetermined formula. Plan investments are elected by the participants, and investment returns are not guaranteed by the Company. Our matching contributions to the DCP in
fiscal 2013
,
2012
, and
2011
were not material.
65
Weighted-average number of shares used for earnings per share is as follows:
|
|
Fiscal Year
|
||||||||
|
(shares in millions)
|
2013
|
2012
|
2011
|
||||||
|
Weighted-average number of shares—basic
|
461
|
|
482
|
|
529
|
|
|||
|
Common stock equivalents
|
6
|
|
6
|
|
4
|
|
|||
|
Weighted-average number of shares—diluted
|
467
|
|
488
|
|
533
|
|
|||
The above computations of weighted-average number of shares—diluted exclude
2 million
and
12 million
shares related to stock options and other stock awards for
fiscal 2013
and
2011
, respectively, as their inclusion would have an anti-dilutive effect on earnings per share. There were
no
material shares with an anti-dilutive effect on earnings per share for
fiscal 2012
.
Our future purchase obligations and commitments as of
February 1, 2014
are as follows:
|
|
Payments Due by Period
|
|||||||||||||||||||
|
($ in millions)
|
Less than 1
Year |
1-3 Years
|
3-5 Years
|
More Than 5
Years |
Total
|
|||||||||||||||
|
Purchase obligations and commitments (1)
|
$
|
3,519
|
|
$
|
137
|
|
$
|
47
|
|
$
|
15
|
|
$
|
3,718
|
|
|||||
__________
|
(1)
|
Represents estimated open purchase orders to purchase inventory as well as commitments for products and services used in the normal course of business.
|
In January 2006, we entered into a ten-year non-exclusive services agreement with IBM under which IBM operates certain significant aspects of our IT infrastructure. The service agreement was set to expire in March 2016. During the first quarter of fiscal 2013, we executed an amendment to extend the term of the agreement through
February 2018
and to reduce the scope of services provided by IBM as we opted to take back certain services related to our mainframe services, our data centers, and our corporate network. We pay IBM a combination of fixed and variable charges, with the variable charges fluctuating based on our actual consumption of services, and we have various options to terminate the agreement. IBM also has certain termination rights in the event of our material breach of the agreement and failure to cure. We paid
$64 million
,
$95 million
, and
$107 million
to IBM for fixed charges in
fiscal 2013
,
2012
, and
2011
, respectively. Based on the current projection of service needs, we expect to pay approximately
$152 million
to IBM over the remaining four years of the contract.
We are a party to a variety of contractual agreements under which we may be obligated to indemnify the other party for certain matters. These contracts primarily relate to our commercial contracts, operating leases, trademarks, intellectual property, financial agreements, and various other agreements. Under these contracts, we may provide certain routine indemnifications relating to representations and warranties (e.g., ownership of assets, environmental or tax indemnifications), or personal injury matters. The terms of these indemnifications range in duration and may not be explicitly defined. Generally, the maximum obligation under such indemnifications is not explicitly stated, and as a result, the overall amount of these obligations cannot be reasonably estimated. Historically, we have not made significant payments for these indemnifications. We believe that if we were to incur a loss in any of these matters, the loss would not have a material effect on our Consolidated Financial Statements taken as a whole.
66
As a multinational company, we are subject to various Actions arising in the ordinary course of our business. Many of these Actions raise complex factual and legal issues and are subject to uncertainties. As of
February 1, 2014
, Actions filed against us included commercial, intellectual property, customer, employment, and data privacy claims, including class action lawsuits. The plaintiffs in some Actions seek unspecified damages or injunctive relief, or both. Actions are in various procedural stages and some are covered in part by insurance. As of
February 1, 2014
and
February 2, 2013
, we recorded a liability for an estimated loss if the outcome of an Action is expected to result in a loss that is considered probable and reasonably estimable. The liability recorded as of
February 1, 2014
and
February 2, 2013
was not material for any individual Action or in total. Subsequent to
February 1, 2014
and through the filing date of
March 24, 2014
, no information has become available that indicates a material change to our estimate is required.
We cannot predict with assurance the outcome of Actions brought against us. Accordingly, developments, settlements, or resolutions may occur and impact income in the quarter of such development, settlement, or resolution. However, we do not believe that the outcome of any current Action would have a material effect on our Consolidated Financial Statements taken as a whole.
We identify our operating segments according to how our business activities are managed and evaluated. Prior to fiscal 2013, we had
two
reportable segments: Stores and Direct. The Stores reportable segment included the results of the retail stores for Gap, Old Navy, and Banana Republic. The Direct reportable segment included the results of our online brands, as well as Piperlime, Athleta, and Intermix.
Beginning in fiscal 2013, we combined all channels and geographies under one global leader for each of the Gap, Old Navy, and Banana Republic brands. Each global brand president oversees their brand's specialty, outlet, online, and franchise operations. Our newer brands, Piperlime, Athleta, and Intermix, are managed by the president of our Growth, Innovation, and Digital ("GID") division, who oversees those brands' store and online operations. Each of our brands serves customers through its store and online channels. We have determined that each of our operating segments (Gap Global, Old Navy Global, Banana Republic Global, and GID) share similar economic and other qualitative characteristics and, effective February 3, 2013, we have aggregated the results of our operating segments into
one
reportable segment.
Online sales are now reflected within the respective results of each brand and region in the net sales below. Fiscal 2012 and 2011 net sales have been conformed to the current year presentation.
67
Net sales by brand and region are as follows:
|
($ in millions)
|
Gap Global
|
Old Navy Global
|
Banana
Republic Global |
Other (2)
|
Total
|
Percentage
of Net Sales |
|||||||||||||||||
|
Fiscal 2013
|
|||||||||||||||||||||||
|
U.S. (1)
|
$
|
3,800
|
|
$
|
5,698
|
|
$
|
2,365
|
|
$
|
668
|
|
$
|
12,531
|
|
78
|
%
|
||||||
|
Canada
|
404
|
|
482
|
|
238
|
|
4
|
|
1,128
|
|
7
|
|
|||||||||||
|
Europe
|
809
|
|
—
|
|
82
|
|
—
|
|
891
|
|
5
|
|
|||||||||||
|
Asia
|
1,165
|
|
77
|
|
155
|
|
—
|
|
1,397
|
|
9
|
|
|||||||||||
|
Other regions
|
173
|
|
—
|
|
28
|
|
—
|
|
201
|
|
1
|
|
|||||||||||
|
Total
|
$
|
6,351
|
|
$
|
6,257
|
|
$
|
2,868
|
|
$
|
672
|
|
$
|
16,148
|
|
100
|
%
|
||||||
|
Sales growth (decline)
|
2
|
%
|
2
|
%
|
(1
|
)%
|
70
|
%
|
3
|
%
|
|
||||||||||||
|
($ in millions)
|
Gap Global
|
Old Navy Global
|
Banana
Republic Global |
Other (2)
|
Total
|
Percentage
of Net Sales |
|||||||||||||||||
|
Fiscal 2012
|
|||||||||||||||||||||||
|
U.S. (1)
|
$
|
3,783
|
|
$
|
5,630
|
|
$
|
2,386
|
|
$
|
395
|
|
$
|
12,194
|
|
78
|
%
|
||||||
|
Canada
|
384
|
|
473
|
|
238
|
|
—
|
|
1,095
|
|
7
|
|
|||||||||||
|
Europe
|
787
|
|
—
|
|
83
|
|
—
|
|
870
|
|
6
|
|
|||||||||||
|
Asia
|
1,138
|
|
9
|
|
163
|
|
—
|
|
1,310
|
|
8
|
|
|||||||||||
|
Other regions
|
162
|
|
—
|
|
20
|
|
—
|
|
182
|
|
1
|
|
|||||||||||
|
Total
|
$
|
6,254
|
|
$
|
6,112
|
|
$
|
2,890
|
|
$
|
395
|
|
$
|
15,651
|
|
100
|
%
|
||||||
|
Sales growth
|
6
|
%
|
8
|
%
|
9
|
%
|
31
|
%
|
8
|
%
|
|
||||||||||||
|
($ in millions)
|
Gap Global
|
Old Navy Global
|
Banana
Republic Global |
Other (2)
|
Total
|
Percentage
of Net Sales |
|||||||||||||||||
|
Fiscal 2011
|
|||||||||||||||||||||||
|
U.S. (1)
|
$
|
3,608
|
|
$
|
5,234
|
|
$
|
2,225
|
|
$
|
301
|
|
$
|
11,368
|
|
78
|
%
|
||||||
|
Canada
|
359
|
|
440
|
|
208
|
|
—
|
|
1,007
|
|
7
|
|
|||||||||||
|
Europe
|
795
|
|
—
|
|
68
|
|
—
|
|
863
|
|
6
|
|
|||||||||||
|
Asia
|
1,031
|
|
—
|
|
145
|
|
—
|
|
1,176
|
|
8
|
|
|||||||||||
|
Other regions
|
119
|
|
—
|
|
16
|
|
—
|
|
135
|
|
1
|
|
|||||||||||
|
Total
|
$
|
5,912
|
|
$
|
5,674
|
|
$
|
2,662
|
|
$
|
301
|
|
$
|
14,549
|
|
100
|
%
|
||||||
|
Sales growth (decline)
|
—
|
%
|
(4
|
)%
|
2
|
%
|
22
|
%
|
(1
|
)%
|
|
||||||||||||
__________
|
(1)
|
U.S. includes the United States, Puerto Rico, and Guam.
|
|
(2)
|
Includes Piperlime and Athleta, and fiscal 2013 net sales also include Intermix.
|
Total online sales were
$2.3 billion
,
$1.9 billion
, and
$1.6 billion
in fiscal 2013, 2012, and 2011, respectively.
Total franchise sales were
$359 million
,
$331 million
, and
$283 million
in fiscal 2013, 2012, and 2011, respectively.
Net sales by region are allocated based on the location in which the sale was originated. Store sales are allocated based on the location of the store, and online sales are allocated based on the location of the distribution center or store from which the products were shipped.
68
Long-lived assets, excluding long-term derivative financial instruments in an asset position and long-term deferred tax assets, by geographic location are as follows:
|
($ in millions)
|
February 1,
2014 |
February 2,
2013 |
||||||
|
U.S. (1)
|
$
|
2,548
|
|
$
|
2,488
|
|
||
|
Canada
|
176
|
|
196
|
|
||||
|
Total North America
|
2,724
|
|
2,684
|
|
||||
|
Other regions
|
513
|
|
445
|
|
||||
|
Total long-lived assets
|
$
|
3,237
|
|
$
|
3,129
|
|
||
__________
|
(1)
|
U.S. includes the United States, Puerto Rico, and Guam.
|
Selected quarterly and annual operating results are as follows:
|
|
13 Weeks Ended
|
13 Weeks Ended
|
13 Weeks Ended
|
13 Weeks Ended
|
52 Weeks Ended
|
|||||||||||||||
|
($ in millions except per share amounts)
|
May 4,
2013 |
August 3,
2013 |
November 2,
2013 |
February 1,
2014 |
February 1, 2014
(fiscal 2013) |
|||||||||||||||
|
Net sales
|
$
|
3,729
|
|
$
|
3,868
|
|
$
|
3,976
|
|
$
|
4,575
|
|
$
|
16,148
|
|
|||||
|
Gross profit
|
$
|
1,544
|
|
$
|
1,567
|
|
$
|
1,589
|
|
$
|
1,593
|
|
$
|
6,293
|
|
|||||
|
Net income
|
$
|
333
|
|
$
|
303
|
|
$
|
337
|
|
$
|
307
|
|
$
|
1,280
|
|
|||||
|
Earnings per share—basic (1)
|
$
|
0.72
|
|
$
|
0.65
|
|
$
|
0.73
|
|
$
|
0.69
|
|
$
|
2.78
|
|
|||||
|
Earnings per share—diluted (1)
|
$
|
0.71
|
|
$
|
0.64
|
|
$
|
0.72
|
|
$
|
0.68
|
|
$
|
2.74
|
|
|||||
|
|
13 Weeks Ended
|
13 Weeks Ended
|
13 Weeks Ended
|
14 Weeks Ended
|
53 Weeks Ended
|
|||||||||||||||
|
($ in millions except per share amounts)
|
April 28,
2012 |
July 28,
2012 |
October 27,
2012 |
February 2,
2013 |
February 2, 2013
(fiscal 2012) |
|||||||||||||||
|
Net sales
|
$
|
3,487
|
|
$
|
3,575
|
|
$
|
3,864
|
|
$
|
4,725
|
|
$
|
15,651
|
|
|||||
|
Gross profit
|
$
|
1,375
|
|
$
|
1,427
|
|
$
|
1,593
|
|
$
|
1,776
|
|
$
|
6,171
|
|
|||||
|
Net income
|
$
|
233
|
|
$
|
243
|
|
$
|
308
|
|
$
|
351
|
|
$
|
1,135
|
|
|||||
|
Earnings per share—basic (1)
|
$
|
0.48
|
|
$
|
0.50
|
|
$
|
0.64
|
|
$
|
0.74
|
|
$
|
2.35
|
|
|||||
|
Earnings per share—diluted (1)
|
$
|
0.47
|
|
$
|
0.49
|
|
$
|
0.63
|
|
$
|
0.73
|
|
$
|
2.33
|
|
|||||
__________
|
(1)
|
Earnings per share was computed individually for each of the periods presented; therefore, the sum of the earnings per share amounts for the quarters may not equal the total for the year.
|
69
None.
Evaluation of Disclosure Controls and Procedures
We carried out an evaluation, under the supervision and with the participation of management, including the Chief Executive Officer and Chief Financial Officer, of the effectiveness of the design and operation of our disclosure controls and procedures (as defined in Exchange Act Rule 13a-15(e)) as of the end of the period covered by this Annual Report on Form 10-K. Based upon that evaluation, the Chief Executive Officer and Chief Financial Officer concluded that the Company’s disclosure controls and procedures are effective.
Management’s Report on Internal Control over Financial Reporting
Our management is responsible for establishing and maintaining an adequate system of internal control over financial reporting, as defined in Exchange Act Rule 13a-15(f). Management conducted an assessment of our internal control over financial reporting based on the framework established by the Committee of Sponsoring Organizations of the Treadway Commission in
Internal Control—Integrated Framework
(released in 1992)
. Based on the assessment, management concluded that as of
February 1, 2014
, our internal control over financial reporting is effective. The Company’s internal control over financial reporting as of
February 1, 2014
has been audited by Deloitte & Touche LLP, an independent registered public accounting firm, as stated in their report which is included herein.
Changes in Internal Control over Financial Reporting
There was no change in the Company’s internal control over financial reporting that occurred during the Company’s
fourth
quarter of
fiscal 2013
that has materially affected, or is reasonably likely to materially affect, the Company’s internal control over financial reporting.
Not applicable.
The information required by this item is incorporated herein by reference to the sections entitled “Nominees for Election as Directors,” “Corporate Governance—Audit and Finance Committee,” and “Section 16(a) Beneficial Ownership Reporting Compliance” in the
2014
Proxy Statement. See also Part I, Item 1 in the section entitled “Executive Officers of the Registrant.”
The Company has adopted a code of ethics, our Code of Business Conduct, which applies to all employees including our principal executive officer, principal financial officer, controller, and persons performing similar functions. Our Code of Business Conduct is available on our website, gapinc.com, under “Investors, Corporate Compliance, Code of Business Conduct.” Any amendments and waivers to the code will also be available on the website.
The information required by this item is incorporated herein by reference to the sections entitled “Compensation of Directors,” “Corporate Governance—Compensation and Management Development Committee,” and “Executive Compensation and Related Information” in the
2014
Proxy Statement.
70
The information required by this item is incorporated herein by reference to the sections entitled “Executive Compensation and Related Information—Equity Compensation Plan Information” and “Beneficial Ownership of Shares” in the
2014
Proxy Statement.
The information required by this item is incorporated herein by reference to the sections entitled “Other Information” and “Corporate Governance—Director Independence” in the
2014
Proxy Statement.
The information required by this item is incorporated herein by reference to the section entitled “Principal Accounting Firm Fees” in the
2014
Proxy Statement.
71
|
1.
|
Financial Statements: See “Index to Consolidated Financial Statements” in Part II, Item 8 of this Form 10-K.
|
|
2.
|
Financial Statement Schedules: Schedules are included in the Consolidated Financial Statements or notes of this Form 10-K or are not required.
|
|
3.
|
Exhibits: The exhibits listed in the accompanying index to exhibits are filed or incorporated by reference as part of this Form 10-K.
|
72
SIGNATURES
Pursuant to the requirements of Section 13 or 15(d) of the Securities Exchange Act of 1934, the registrant has duly caused this report to be signed on its behalf by the undersigned, thereunto duly authorized.
|
|
|
THE GAP, INC.
|
||
|
Date:
|
March 24, 2014
|
|
By
|
/s/ GLENN K. MURPHY
|
|
|
Glenn K. Murphy
Chairman and Chief Executive Officer
(Principal Executive Officer)
|
|||
|
Date:
|
March 24, 2014
|
|
By
|
/s/ SABRINA L. SIMMONS
|
|
|
Sabrina L. Simmons
Executive Vice President and Chief Financial Officer
(Principal Financial and Accounting Officer)
|
|||
Pursuant to the requirements of the Securities Exchange Act of 1934, this report has been signed below by the following persons on behalf of the registrant and in the capacities and on the dates indicated.
|
Date:
|
March 24, 2014
|
|
By
|
/s/ ADRIAN D. P. BELLAMY
|
|
Adrian D. P. Bellamy, Director
|
||||
|
Date:
|
March 24, 2014
|
|
By
|
/s/ DOMENICO DE SOLE
|
|
Domenico De Sole, Director
|
||||
|
Date:
|
March 24, 2014
|
|
By
|
/s/ ROBERT J. FISHER
|
|
Robert J. Fisher, Director
|
||||
|
Date:
|
March 24, 2014
|
|
By
|
/s/ WILLIAM S. FISHER
|
|
William S. Fisher, Director
|
||||
|
Date:
|
March 24, 2014
|
|
By
|
/s/ ISABELLA D. GOREN
|
|
Isabella D. Goren, Director
|
||||
|
Date:
|
March 24, 2014
|
|
By
|
/s/ BOB L. MARTIN
|
|
Bob L. Martin, Director
|
||||
|
Date:
|
March 24, 2014
|
|
By
|
/s/ JORGE P. MONTOYA
|
|
Jorge P. Montoya, Director
|
||||
|
Date:
|
March 24, 2014
|
|
By
|
/s/ GLENN K. MURPHY
|
|
Glenn K. Murphy, Director
|
||||
|
Date:
|
March 24, 2014
|
|
By
|
/s/ MAYO A. SHATTUCK III
|
|
Mayo A. Shattuck III, Director
|
||||
|
Date:
|
March 24, 2014
|
|
By
|
/s/ KATHERINE TSANG
|
|
Katherine Tsang, Director
|
||||
|
Date:
|
March 24, 2014
|
|
By
|
/s/ PADMASREE WARRIOR
|
|
Padmasree Warrior, Director
|
||||
73
Exhibit Index
|
1.1
|
|
Underwriting Agreement, dated April 7, 2011 in connection with the offering of $1,250,000,000 aggregate principal amount of Registrant’s 5.95% Notes due 2021, filed as Exhibit 1.1 to Registrant’s Form 8-K on April 12, 2011, Commission File No. 1-7562.
|
|
3.1
|
|
Registrant’s Amended and Restated Certificate of Incorporation, filed as Exhibit 3.1 to Registrant’s Annual Report on Form 10-K for the year ended January 30, 1993, Commission File No. 1-7562.
|
|
3.2
|
|
Certificate of Amendment of Amended and Restated Certificate of Incorporation, filed as Exhibit 3.2 to Registrant’s Annual Report on Form 10-K for year ended January 29, 2000, Commission File No. 1-7562.
|
|
3.3
|
|
Amended and Restated Bylaws of the Company (effective February 26, 2014), filed as Exhibit 3(ii) to Registrant’s Form 8-K on February 27, 2014, Commission File No. 1-7562.
|
|
4.1
|
|
Indenture, dated as of April 12, 2011, by and between Registrant and Wells Fargo Bank, National Association, as Trustee, filed as Exhibit 4.1 to Registrant’s Form 8-K on April 12, 2011, Commission File No. 1-7562.
|
|
4.2
|
|
First Supplemental Indenture, dated as of April 12, 2011, relating to the issuance of $1,250,000,000 aggregate principal amount of Registrant’s 5.95% Notes due 2021, filed as Exhibit 4.2 to Registrant’s Form 8-K on April 12, 2011, Commission File No. 1-7562.
|
|
4.3
|
|
Form of Registrant’s 5.95% Notes due 2021, included as Exhibit A to First Supplemental Indenture, filed as Exhibit 4.2 to Registrant’s Form 8-K on April 12, 2011, Commission File No. 1-7562.
|
|
10.1
|
|
3-Year LC Agreement dated as of May 6, 2005 among The Gap, Inc., LC Subsidiaries, and HSBC Bank USA, National Association (formerly HSBC Bank USA), as LC Issuer, filed as Exhibit 10.2 to the Registrant’s Form 10-Q for the quarter ended May 1, 2010, Commission File No. 1-7562.
|
|
10.2
|
|
Letter Amendment No. 1 to the 3-Year Letter of Credit Agreement with HSBC Bank USA, National Association dated May 18, 2007, filed as Exhibit 10.3 to Registrant’s Form 8-K on May 24, 2007, Commission File No. 1-7562.
|
|
10.3
|
|
Letter Amendment No. 2 to the 3-Year Letter of Credit Agreement with HSBC Bank USA, National Association dated September 21, 2010, filed as Exhibit 10.1 to Registrant’s Form 10-Q for the quarter ended October 30, 2010, Commission File No. 1-7562.
|
|
10.4
|
|
Letter Amendment No. 3 to the 3-Year Letter of Credit Agreement with HSBC Bank USA, National Association dated August 24, 2012, filed as Exhibit 10.4 to Registrant’s Form 10-Q for the quarter ended October 27, 2012, Commission File No. 1-7562.
|
|
10.5
|
|
Letter Agreement dated April 1, 2008 regarding the 3-Year Letter of Credit Agreement with HSBC Bank USA, National Association, filed as Exhibit 10.8 to Registrant’s Form 10-Q for the quarter ended May 3, 2008, Commission File No. 1-7562.
|
|
10.6
|
|
Term Loan and Revolving Credit Agreement dated April 7, 2011, filed as Exhibit 10.1 to Registrant’s Form 8-K on April 7, 2011, Commission File No. 1-7562.
|
74
|
10.7
|
|
Amendment No. 1 to Term Loan and Revolving Credit Agreement dated April 25, 2011, filed as Exhibit 10.4 to Registrant’s Form 10-Q for the quarter ended April 30, 2011, Commission File No. 1-7562.
|
|
10.8
|
Amendment No. 2 to the Credit Agreement dated as of May 1, 2013, filed as Exhibit 10.1 to Registrant’s Form 8-K on May 1, 2013, Commission File No. 1-7562.
|
|
|
10.9
|
|
Second Amended and Restated Master Services Agreement between Registrant and IBM, dated as of March March 13, 2013, filed as Exhibit 10.1 to Registrant’s Form 10-Q for the quarter ended May 4, 2013, Commission File No. 1-7562. (1)
|
|
EXECUTIVE COMPENSATION PLANS AND ARRANGEMENTS
|
||
|
10.10
|
|
Executive Management Incentive Compensation Award Plan, filed as Appendix A to Registrant’s definitive proxy statement for its annual meeting of stockholders held on May 18, 2010, Commission File No. 1-7562.
|
|
10.11
|
|
The Gap, Inc. Executive Deferred Compensation Plan, filed as Exhibit 10.3 to Registrant’s Form 10-Q for the quarter ended October 31, 1998, Commission File No.1-7562.
|
|
10.12
|
|
Amendment to Executive Deferred Compensation Plan – Freezing of Plan Effective December 31, 2005, filed as Exhibit 10.1 to Registrant’s Form 8-K on November 8, 2005, Commission File No. 1-7562.
|
|
10.13
|
|
Amendment to Executive Deferred Compensation Plan – Merging of Plan into the Supplemental Deferred Compensation Plan, filed as Exhibit 10.29 to Registrant’s Form 10-K for the year ended January 31, 2009, Commission File No. 1-7562.
|
|
10.14
|
|
Amendment to Executive Deferred Compensation Plan – Suspension of Pending Merger into Supplemental Deferred Compensation Plan, filed as Exhibit 10.30 to Registrant’s Form 10-K for the year ended January 31, 2009, Commission File No. 1-7562.
|
|
10.15
|
|
Amendment to Executive Deferred Compensation Plan – Merging of Plan into the Deferred Compensation Plan, filed as Exhibit 10.1 to Registrant’s Form 10-Q for the quarter ended October 31, 2009, Commission File No. 1-7562.
|
|
10.16
|
|
Deferred Compensation Plan, amended and restated effective September 1, 2011, filed as Exhibit 10.1 to Registrant’s Form 10-Q for the quarter ended October 29, 2011, Commission File No. 1-7562.
|
|
10.17
|
|
Supplemental Deferred Compensation Plan, filed as Exhibit 4.1 to the Company’s Registration Statement on Form S-8, dated November 29, 2005, Commission File No. 333-129986.
|
|
10.18
|
|
First Amendment to Supplemental Deferred Compensation Plan, filed as Exhibit 10.32 to Registrant’s Form 10-K for the year ended January 31, 2009, Commission File No. 1-7562.
|
|
10.19
|
|
Second Amendment to Supplemental Deferred Compensation Plan – Merging of Executive Deferred Compensation Plan into the Plan and Name Change to Deferred Compensation Plan, filed as Exhibit 10.33 to Registrant’s Form 10-K for the year ended January 31, 2009, Commission File No. 1-7562.
|
75
|
10.20
|
|
Third Amendment to Supplemental Deferred Compensation Plan – Suspension of Pending Merging of Executive Deferred Compensation Plan into the Plan and Name Change to Deferred Compensation Plan, filed as Exhibit 10.34 to Registrant’s Form 10-K for the year ended January 31, 2009, Commission File No. 1-7562.
|
|
10.21
|
|
Fourth Amendment to Supplemental Deferred Compensation Plan – Merging of Executive Deferred Compensation Plan into the Plan and Name Change to Deferred Compensation Plan, filed as Exhibit 10.2 to Registrant’s Form 10-Q for the quarter ended October 31, 2009, Commission File No. 1-7562.
|
|
10.22
|
|
1981 Stock Option Plan, filed as Exhibit 4.1 to Registrant’s Registration Statement on Form S-8, Commission File No. 33-54690.
|
|
10.23
|
|
Management Incentive Restricted Stock Plan II, filed as Exhibit 4.1 to Registrant’s Registration Statement on Form S-8, Commission File No. 33-54686.
|
|
10.24
|
|
1996 Stock Option and Award Plan, filed as Exhibit A to Registrant’s definitive proxy statement for its annual meeting of stockholders held on May 21, 1996, Commission File No. 1-7562.
|
|
10.25
|
|
Amendment Number 1 to Registrant’s 1996 Stock Option and Award Plan, filed as Exhibit 10.1 to Registrant’s Form 10-Q for the quarter ended August 2, 1997, Commission File No. 1-7562.
|
|
10.26
|
|
Amendment Number 2 to Registrant’s 1996 Stock Option and Award Plan, filed as Exhibit 10.15 to Registrant’s Form 10-K for the year ended January 31, 1998, Commission File No. 1-7562.
|
|
10.27
|
|
Amendment Number 3 to Registrant’s 1996 Stock Option and Award Plan, filed as Exhibit 10.1 to Registrant’s Form 10-Q for the quarter ended October 31, 1998, Commission File No. 1-7562.
|
|
10.28
|
|
Amendment Number 4 to Registrant’s 1996 Stock Option and Award Plan, filed as Exhibit 10.3 to Registrant’s Form 10-Q for the quarter ended July 29, 2000, Commission File No. 1-7562.
|
|
10.29
|
|
Amendment Number 5 to Registrant’s 1996 Stock Option and Award Plan, filed as Exhibit 10.13 to Registrant’s Form 10-K for the year ended February 3, 2001, Commission File No. 1-7562.
|
|
10.30
|
|
Amendment Number 6 to Registrant’s 1996 Stock Option and Award Plan, filed as Exhibit 10.1 to Registrant’s Form 10-Q for the quarter ended May 5, 2001, Commission File No. 1-7562.
|
|
10.31
|
|
1996 Stock Option and Award Plan (As Amended and Restated Effective as of January 28, 2003), filed as Appendix C to Registrant’s definitive proxy statement for its annual meeting of stockholders held on May 14, 2003, Commission File No. 1-7562.
|
|
10.32
|
|
Form of Non-Qualified Stock Option Agreement for employees under Registrant’s 1996 Stock Option and Award Plan, filed as Exhibit 10.5 to Registrant’s Form 10-Q for the quarter ended August 2, 1997, Commission File No. 1-7562.
|
|
10.33
|
|
Form of Non-Qualified Stock Option Agreement for directors under Registrant’s 1996 Stock Option and Award Plan, filed as Exhibit 10.6 to Registrant’s Form 10-Q for the quarter ended August 2, 1997, Commission File No. 1-7562.
|
|
10.34
|
|
Form of Non-Qualified Stock Option Agreement for consultants under Registrant’s 1996 Stock Option and Award Plan, filed as Exhibit 10.4 to Registrant’s Form 10-Q for the quarter ended October 31, 1998, Commission File No. 1-7562.
|
76
|
10.35
|
|
Form of Non-Qualified Stock Option Agreement for employees in France under Registrant’s 1996 Stock Option and Award Plan, filed as Exhibit 10.5 to Registrant’s Form 10-Q for the quarter ended October 31, 1998, Commission File No. 1-7562.
|
|
10.36
|
|
Form of Non-Qualified Stock Option Agreement for international employees under Registrant’s 1996 Stock Option and Award Plan, filed as Exhibit 10.6 to Registrant’s Form 10-Q for the quarter ended October 31, 1998, Commission File No. 1-7562.
|
|
10.37
|
|
Form of Non-Qualified Stock Option Agreement for employees in Japan under Registrant’s 1996 Stock Option and Award Plan, filed as Exhibit 10.7 to Registrant’s Form 10-Q for the quarter ended October 31, 1998, Commission File No. 1-7562.
|
|
10.38
|
|
Form of Stock Option Agreement for employees under the UK Sub-plan to the U.S. Stock Option and Award Plan, filed as Exhibit 10.8 to Registrant’s Form 10-Q for the quarter ended October 31, 1998, Commission File No. 1-7562.
|
|
10.39
|
|
Form of Non-Qualified Stock Option Agreement for directors effective April 3, 2001 under Registrant’s 1996 Stock Option and Award Plan, filed as Exhibit 10.4 to Registrant’s Form 10-Q for the quarter ended May 5, 2001, Commission File No. 1-7562.
|
|
10.40
|
|
Form of Non-Qualified Stock Option Agreement under Registrant’s 1996 Stock Option and Award Plan, filed as Exhibit 10.3 to Registrant’s Form 10-Q for the quarter ended November 3, 2001, Commission File No. 1-7562.
|
|
10.41
|
|
Form of Stock Award Agreement under Registrant’s 1996 Stock Option and Award Plan filed as Exhibit 10.2 to Registrant’s Form 8-K on January 27, 2005, Commission File No. 1-7562.
|
|
10.42
|
|
Form of Stock Award Agreement under Registrant’s 1996 Stock Option and Award Plan, filed as Exhibit 10.2 to Registrant’s Form 8-K on March 16, 2005, Commission File No. 1-7562.
|
|
10.43
|
|
Form of Stock Award Agreement under Registrant’s 1996 Stock Option and Award Plan, filed as Exhibit 10.4 to Registrant’s Form 10-Q for the quarter ended October 29, 2005, Commission File No. 1-7562.
|
|
10.44
|
|
UK Employee Stock Purchase Plan, filed as Exhibit 4.1 to Registrant’s Registration Statement on Form S-8, Commission File No. 333-47508.
|
|
10.45
|
|
2002 Stock Option Plan, as amended, (formerly the 1999 Stock Option Plan as amended and Stock Up On Success, The Gap, Inc.’s Stock Option Bonus Program) filed as Exhibit 4.1 to Registrant’s Registration Statement on Form S-8, Commission File No. 333-103128.
|
|
10.46
|
|
Form of Non-Qualified Stock Option Agreement under Registrant’s 2002 Stock Option Plan (formerly the 1999 Stock Option Plan as amended), filed as Exhibit 4.6 to Registrant’s Registration Statement on Form S-8, Commission File No. 333-76523.
|
|
10.47
|
|
Form of Domestic Non-Qualified Stock Option Agreement under Registrant’s 2002 Stock Option Plan, as amended, filed as Exhibit 4.6 to Registrant’s Registration Statement on Form S-8, Commission File No. 333-72921.
|
|
10.48
|
|
Form of International Non-Qualified Stock Option Agreement under Registrant’s 2002 Stock Option Plan, as amended, filed as Exhibit 4.7 to Registrant’s Registration Statement on Form S-8, Commission File No. 333-72921.
|
77
|
10.49
|
|
Non-Employee Director Retirement Plan, dated October 27, 1992, filed as Exhibit 10.43 to Registrant’s Annual Report on Form 10-K for the year ended January 30, 1993, Commission File No. 1-7562.
|
|
10.50
|
|
Amendment, authorized as of August 20, 2008, to Nonemployee Director Retirement Plan, dated October 27, 1992, filed as Exhibit 10.2 to Registrant’s Form 10-Q for the quarter ended November 1, 2008, Commission File No. 1-7562.
|
|
10.51
|
|
Statement Regarding Non-Employee Director Retirement Plan, filed as Exhibit 10.25 to Registrant’s Form 10-K for the year ended January 31, 1998, Commission File No. 1-7562.
|
|
10.52
|
|
Nonemployee Director Deferred Compensation Plan, filed as Exhibit 4.1 to Registrant’s Registration Statement on Form S-8, Commission File No. 333-36265.
|
|
10.53
|
|
Amendment Number 1 to Registrant’s Nonemployee Director Deferred Compensation Plan, filed as Exhibit 10.2 to Registrant’s Form 10-Q for the quarter ended October 31, 1998, Commission File No. 1-7562.
|
|
10.54
|
|
Amendment Number 2 to Registrant’s Nonemployee Director Deferred Compensation Plan, filed as Exhibit 10.4 to Registrant’s Form 10-Q for the quarter ended July 29, 2000, Commission File No. 1-7562.
|
|
10.55
|
|
Amendment Number 3 to Registrant’s Nonemployee Director Deferred Compensation Plan, filed as Exhibit 10.2 to Registrant’s Form 10-Q for the quarter ended May 5, 2001, Commission File No. 1-7562.
|
|
10.56
|
|
Nonemployee Director Deferred Compensation Plan, as amended and restated on October 30, 2001, filed as Exhibit 10.1 to Registrant’s Form 10-Q for the quarter ended November 3, 2001, Commission File No. 1-7562.
|
|
10.57
|
|
Nonemployee Director Deferred Compensation Plan, as amended and restated on December 9, 2003, filed as Exhibit 10.35 to Registrant’s Form 10-K for the year ended January 31, 2004, Commission File No. 1-7562.
|
|
10.58
|
|
Form of Discounted Stock Option Agreement under the Nonemployee Director Deferred Compensation Plan, filed as Exhibit 4.5 to Registrant’s Registration Statement on Form S-8, Commission File No. 333-36265.
|
|
10.59
|
|
Form of Non-Qualified Stock Option Agreement for directors effective April 3, 2001 under Registrant’s Nonemployee Director Deferred Compensation Plan, filed as Exhibit 10.5 to Registrant’s Form 10-Q for the quarter ended May 5, 2001, Commission File No. 1-7562.
|
|
10.60
|
|
Nonemployee Director Deferred Compensation Plan – Suspension of Plan Effective January 6, 2005, filed as Exhibit 10.1 to Registrant’s Form 8-K on January 7, 2005, Commission File No. 1-7562.
|
|
10.61
|
|
Nonemployee Director Deferred Compensation Plan – Termination of Plan Effective September 27, 2005, filed as Exhibit 10.1 to Registrant’s Form 8-K on September 28, 2005, Commission File No. 1-7562.
|
|
10.62
|
|
2006 Long-Term Incentive Plan, filed as Appendix B to Registrant’s definitive proxy statement for its annual meeting of stockholders held on May 9, 2006, Commission File No. 1-7562.
|
78
|
10.63
|
|
2006 Long-Term Incentive Plan, as amended and restated effective August 20, 2008, filed as Exhibit 10.1 to Registrant’s Form 10-Q for the quarter ended November 1, 2008, Commission File No. 1-7562.
|
|
10.64
|
|
Amendment No. 1 to Registrant’s 2006 Long-Term Incentive Plan, filed as Exhibit 10.62 to Registrant’s Form 10-K for the year ended February 3, 2007, Commission File No. 1-7562.
|
|
10.65
|
|
2011 Long-Term Incentive Plan, filed as Appendix A to Registrant’s definitive proxy statement for its annual meeting of stockholders held on May 17, 2011, Commission File No. 1-7562.
|
|
10.66
|
Amended and Restated 2011 Long-Term Incentive Plan (effective February 26, 2014), filed as Exhibit 10.1 to Registrant’s Form 8-K on March 6, 2014, Commission File No. 1-7562.
|
|
|
10.67
|
|
Form of Non-Qualified Stock Option Agreement for Executives under the 2006 Long-Term Incentive Plan, filed as Exhibit 10.1 to Registrant’s Form 8-K on March 23, 2006, Commission File No. 1-7562.
|
|
10.68
|
|
Form of Non-Qualified Stock Option Agreement under the 2011 Long-Term Incentive Plan, filed as Exhibit 10.8 to Registrant’s Form 10-Q for the quarter ended April 30, 2011, Commission File No. 1-7562.
|
|
10.69
|
Form of Non-Qualified Stock Option Agreement under the 2011 Long-Term Incentive Plan, filed as Exhibit 10.9 to Registrant’s Form 10-Q for the quarter ended July 28, 2012, Commission File No. 1-7562.
|
|
|
10.70
|
Form of Non-Qualified Stock Option Agreement under the 2011 Long-Term Incentive Plan, filed as Exhibit 10.72 to Registrant's Form 10-K for the year ended February 2, 2013, Commission File No. 1-7562.
|
|
|
10.71
|
Form of Non-Qualified Stock Option Agreement under the 2011 Long-Term Incentive Plan, filed as Exhibit 10. 2 to Registrant's Form 8-K on March 6, 2014, Commission File No. 1-7562.
|
|
|
10.72
|
|
Form of Stock Award Agreement for Executives under the 2006 Long-Term Incentive Plan, filed as Exhibit 10.2 to Registrant’s Form 8-K on March 23, 2006, Commission File No. 1-7562.
|
|
10.73
|
|
Form of Non-Qualified Stock Option Agreement for Chief Executive Officer under the 2006 Long-Term Incentive Plan, filed as Exhibit 10.3 to Registrant’s Form 8-K on March 23, 2006, Commission File No. 1-7562.
|
|
10.74
|
|
Form of Stock Award Agreement for Chief Executive Officer under the 2006 Long-Term Incentive Plan, filed as Exhibit 10.4 to Registrant’s Form 8-K on March 23, 2006, Commission File No. 1-7562.
|
|
10.75
|
|
Form of Stock Unit Agreement and Stock Unit Deferral Election Form for Nonemployee Directors under the 2006 Long-Term Incentive Plan, filed as Exhibit 10.5 to Registrant’s Form 8-K on March 23, 2006, Commission File No. 1-7562.
|
|
10.76
|
|
Form of Stock Unit Agreement and Stock Unit Deferral Election Form for Nonemployee Directors under the 2006 Long-Term Incentive Plan, filed as Exhibit 10.2 to Registrant’s Form 10-Q for the quarter ended July 29, 2006, Commission File No. 1-7562.
|
|
10.77
|
|
Form of Performance Share Agreement for Executives under the 2006 Long-Term Incentive Plan, filed as Exhibit 10.2 to Registrant’s Form 8-K on July 26, 2007, Commission File No. 1-7562.
|
79
|
10.78
|
|
Form of Performance Share Agreement under the 2011 Long-Term Incentive Plan, filed as Exhibit 10.9 to Registrant’s Form 10-Q for the quarter ended April 30, 2011, Commission File No. 1-7562.
|
|
10.79
|
|
Form of Performance Share Agreement under the 2011 Long-Term Incentive Plan, filed as Exhibit 10.8 to Registrant’s Form 10-Q for the quarter ended July 28, 2012, Commission File No. 1-7562.
|
|
10.80
|
|
Form of Performance Unit Award Agreement under the 2006 Long-Term Incentive Plan, filed as Exhibit 10.2 to Registrant’s Form 10-Q for the quarter ended November 3, 2007, Commission File No. 1-7562.
|
|
10.81
|
|
Form of Performance Share Agreement under the 2006 Long-Term Incentive Plan, filed as Exhibit 10.3 to Registrant’s Form 10-Q for the quarter ended November 3, 2007, Commission File No. 1-7562.
|
|
10.82
|
|
Form of Performance Share Agreement under the 2006 Long-Term Incentive Plan, filed as Exhibit 10.5 to Registrant’s Form 10-Q for the quarter ended May 1, 2010, Commission File No. 1-7562
|
|
10.83
|
|
Form of Performance Share Agreement under the 2006 Long-Term Incentive Plan, filed as Exhibit 10.1 to Registrant’s Form 8-K on March 11, 2011, Commission File No. 1-7562.
|
|
10.84
|
Form of Performance Share Agreement under the 2011 Long-Term Incentive Plan., filed as Exhibit 10.85 to Registrant's Form 10-K for the year ended February 2, 2013, Commission File No. 1-7562.
|
|
|
10.85
|
Form of Performance Share Agreement under the 2011 Long-Term Incentive Plan, filed as Exhibit 10.4 to Registrant's form 8-K on March 6, 2014, Commission File No. 1.7562.
|
|
|
10.86
|
|
Form of Restricted Stock Unit Award Agreement under the 2006 Long-Term Incentive Plan, filed as Exhibit 10.1 to Registrant’s Form 10-Q for the quarter ended November 3, 2007, Commission File No. 1-7562.
|
|
10.87
|
|
Form of Restricted Stock Unit Award Agreement under the 2011 Long-Term Incentive Plan, filed as Exhibit 10.7 to Registrant’s Form 10-Q for the quarter ended April 30, 2011, Commission File No. 1-7562.
|
|
10.88
|
|
Form of Restricted Stock Unit Award Agreement under the 2011 Long-Term Incentive Plan, filed as Exhibit 10.10 to Registrant’s Form 10-Q for the quarter ended July 28, 2012, Commission File No. 1-7562.
|
|
10.89
|
Form of Restricted Stock Unit Award Agreement under the 2011 Long-Term Incentive Plan, filed as Exhibit 10.89 to Registrant's Form 10-K for the year ended February 2, 2013, Commission File No. 1-7562.
|
|
|
10.90
|
Form of Restricted Stock Unit Award Agreement under the 2011 Long-Term Incentive Plan, filed as Exhibit 10.3 to Registrant's Form 8-K on March 6, 2014, Commission File No. 1-7562.
|
|
|
10.91
|
|
Form of Director Stock Unit Agreement and Stock Unit Deferral Election Form under the 2006 Long-Term Incentive Plan, filed as Exhibit 10.4 to Registrant’s Form 10-Q for the quarter ended November 3, 2007, Commission File No. 1-7562.
|
|
10.92
|
|
Form of Director Stock Unit Agreement and Stock Unit Deferral Election Form under the 2011 Long-Term Incentive Plan, filed as Exhibit 10.10 to Registrant’s Form 10-Q for the quarter ended April 30, 2011, Commission File No. 1-7562.
|
80
|
10.93
|
|
Summary of Revised Timing of Annual Board Member Stock Unit Grants, effective August 20, 2008, filed as Exhibit 10.3 to Registrant’s Form 10-Q for the quarter ended November 1, 2008, Commission File No. 1-7562.
|
|
10.94
|
|
Agreement with Art Peck dated January 31, 2011, filed as Exhibit 10.2 to Registrant’s Form 10-Q for the quarter ended April 30, 2011, Commission File No, 1-7562.
|
|
10.95
|
|
Amendment to Agreement with Art Peck dated November 4, 2011, and confirmed on November 15, 2011, filed as Exhibit 10.91 to Registrant's Form 10-K for the year ended January 28, 2012, Commission File No. 1-7562.
|
|
10.96
|
Amendment to Post-Termination Benefits with Art Peck dated May 31, 2012, filed as Exhibit 10.4 to Registrant's Form 10-Q for the quarter ended April 28, 2012, Commission File No. 1-7562.
|
|
|
10.97
|
Agreement with Art Peck dated October 29, 2012, and confirmed on November 9, 2012. filed as Exhibit 10.96 to Registrant's Form 10-K for the year ended February 2, 2013, Commission File No. 1-7562.
|
|
|
10.98
|
|
Agreement with Eva Sage-Gavin dated March 16, 2007, and confirmed on March 27, 2007, filed as Exhibit 10.6 to Registrant’s Form 10-Q for the quarter ended May 5, 2007, Commission File No. 1-7562.
|
|
10.99
|
|
Amendment to Agreement with Eva Sage-Gavin dated November 23, 2008, and confirmed on November 10, 2008, filed as Exhibit 10.101 to Registrant’s Form 10-K for the year ended January 31, 2009, Commission File No. 1-7562.
|
|
10.100
|
|
Amendment to Agreement with Eva Sage-Gavin dated November 4, 2011, and confirmed on January 3, 2012, filed as Exhibit 10.94 to Registrant's Form 10-K for the year ended January 28, 2012, Commission File No. 1-7562.
|
|
10.101
|
Amendment to Post-Termination Benefits with Eva Sage-Gavin dated May 24, 2012, filed as Exhibit 10.8 to Registrant's Form 10-Q for the quarter ended April 28, 2012, Commission File No. 1-7562.
|
|
|
10.102
|
CEO Performance Share Agreement dated May 4, 2012, filed as Exhibit 10.1 to Registrant's Form 8-K on May 4, 2012, Commission File No. 1-7562.
|
|
|
10.103
|
|
Amended and Restated Employment Agreement by and between Glenn Murphy and the Company, dated December 1, 2008 and confirmed on December 1, 2008, filed as Exhibit 10.106 to Registrant’s Form 10-K for the year ended January 31, 2009, Commission File No. 1-7562.
|
|
10.104
|
|
Modification to Amended and Restated Employment Agreement by and between Glenn Murphy and the Company dated February 9, 2009, filed as Exhibit 10.2 to Registrant’s Form 10-Q for the quarter ended May 2, 2009, Commission File No. 1-7562.
|
|
10.105
|
|
Agreement with Sabrina L. Simmons dated February 4, 2008, and confirmed on February 6, 2008, filed as Exhibit 10.1 to Registrant’s Form 8-K on February 12, 2008, Commission File No. 1-7562.
|
|
10.106
|
|
Amendment to Agreement with Sabrina Simmons dated November 23, 2008, and confirmed on December 22, 2008, filed as Exhibit 10.110 to Registrant’s Form 10-K for the year ended January 31, 2009, Commission File No. 1-7562.
|
81
|
10.107
|
|
Amendment to Agreement with Sabrina L. Simmons dated November 4, 2011, and confirmed on January 5, 2012, filed as Exhibit 10.99 to Registrant's Form 10-K for the year ended January 28, 2012, Commission File No. 1-7562.
|
|
10.108
|
Agreement for Post-Termination Benefits with Sabrina Simmons dated May 31, 2012, filed as Exhibit 10.5 to Registrant's Form 10-Q for the quarter ended April 28, 2012, Commission File No. 1-7562.
|
|
|
10.109
|
|
Agreement with Tom Keiser dated November 18, 2009, and confirmed on November 20, 2009, filed as Exhibit 10.103 to Registrant's Form 10-K for the year ended January 28, 2012, Commission File No. 1-7562.
|
|
10.110
|
|
Amendment to Agreement with Tom Keiser dated November 4, 2011, and confirmed on December 7, 2011, filed as Exhibit 10.104 to Registrant's Form 10-K for the year ended January 28, 2012, Commission File No. 1-7562.
|
|
10.111
|
Agreement for Post-Termination Benefits with Tom Keiser dated May 31, 2012, filed as Exhibit 10.3 to Registrant's Form 10-Q for the quarter ended April 28, 2012, Commission File No. 1-7562.
|
|
|
10.112
|
Agreement with Stefan Larsson dated April 26, 2012, and confirmed on April 27, 2012, filed as Exhibit 10.1 to Registrant's Form 10-Q for the quarter ended October 27, 2012, Commission File No. 1-7562.
|
|
|
10.113
|
Amendment to Agreement with Stefan Larsson dated September 12, 2012, and confirmed on September 17, 2012, filed as Exhibit 10.2 to Registrant's Form 10-Q for the quarter ended October 27, 2012, Commission File No. 1-7562.
|
|
|
10.114
|
Amendment to Agreement with Stefan Larsson dated October 29, 2012, and confirmed on November 6, 2012, filed as Exhibit 10.3 to Registrant's Form 10-Q for the quarter ended October 27, 2012, Commission File No. 1-7562.
|
|
|
10.115
|
Amended Service Agreement with Stephen Sunnucks dated June 10, 2009, filed as Exhibit 10.117 to Registrant's Form 10-K for the year ended February 2, 2013, Commission File No. 1-7562.
|
|
|
10.116
|
Amendment to the Amended Service Agreement with Stephen Sunnucks dated August 25, 2011, filed as Exhibit 10.118 to Registrant's Form 10-K for the year ended February 2, 2013, Commission File No. 1-7562.
|
|
|
10.117
|
Amendment to the Amended Service Agreement with Stephen Sunnucks dated May 30, 2012, filed as Exhibit 10.119 to Registrant's Form 10-K for the year ended February 2, 2013, Commission File No. 1-7562.
|
|
|
10.118
|
Agreement with Stephen Sunnucks dated October 31, 2012, and confirmed on November 1, 2012, filed as Exhibit 10.120 to Registrant's Form 10-K for the year ended February 2, 2013, Commission File No. 1-7562.
|
|
|
10.119
|
Agreement for Post-Termination Benefits with Jack Calhoun dated June 9, 2012, filed as Exhibit 10.121 to Registrant's Form 10-K for the year ended February 2, 2013, Commission File No. 1-7562.
|
|
|
10.120
|
Agreement for Post-Termination Benefits with Michelle Banks dated May 23, 2012, filed as Exhibit 10.6 to Registrant's Form 10-Q for the quarter ended April 28, 2012, Commission File No. 1-7562.
|
|
|
10.121
|
Agreement for Post-Termination Benefits with Colin Funnell dated June 3, 2012, filed as Exhibit 10.7 to Registrant's Form 10-Q for the quarter ended April 28, 2012, Commission File No. 1-7562.
|
|
82
|
10.122
|
|
Summary of Changes to Non-employee Director Compensation effective February 15, 2008, filed as Exhibit 10.6 to Registrant’s Form 10-Q for the quarter ended May 3, 2008, Commission File No. 1-7562.
|
|
10.123
|
|
Summary of Changes to Non-employee Director Compensation, filed as Exhibit 10.5 to Registrant’s Form 10-Q for the quarter ended May 2, 2009, Commission File No. 1-7562.
|
|
10.124
|
|
Summary of Changes to Executive Compensation Arrangements, filed as Exhibit 10.5 to Registrant’s Form 10-Q for the quarter ended May 3, 2008, Commission File No. 1-7562.
|
|
10.125
|
|
Summary of Changes to Executive Compensation Arrangements, filed as Exhibit 10.6 to Registrant’s Form 10-Q for the quarter ended May 2, 2009, Commission File No. 1-7562.
|
|
10.126
|
|
Description of Arrangement with Glenn Murphy for Corporate Jet Usage and Reimbursement for Commercial Travel, filed as Exhibit 101 to Registrant’s Form 10-K for the year ended February 2, 2008, Commission File No. 1-7562.
|
|
10.127
|
Agreement with Sonia Syngal dated August 23, 2013, and confirmed on September 3, 2013, filed as Exhibit 10.1 to Registrant's Form 10-Q for the quarter ended November 2, 2013, Commission File No. 1-7562.
|
|
|
12*
|
|
Ratio of Earnings to Fixed Charges
|
|
14
|
|
Code of Business Conduct, filed as Exhibit 14 to Registrant’s Form 10-K for the year ended January 30, 2010, Commission File No. 1-7562.
|
|
21*
|
|
Subsidiaries of Registrant
|
|
23*
|
|
Consent of Independent Registered Public Accounting Firm
|
|
31.1*
|
|
Rule 13a-14(a)/15d-14(a) Certification of the Chief Executive Officer of The Gap, Inc. (Section 302 of the Sarbanes-Oxley Act of 2002)
|
|
31.2*
|
|
Rule 13a-14(a)/15d-14(a) Certification of the Chief Financial Officer of The Gap, Inc. (Section 302 of the Sarbanes-Oxley Act of 2002)
|
|
32.1*
|
|
Certification of the Chief Executive Officer of The Gap, Inc. pursuant to 18 U.S.C. Section 1350, as adopted pursuant to Section 906 of the Sarbanes-Oxley Act of 2002
|
|
32.2*
|
|
Certification of the Chief Financial Officer of The Gap, Inc. pursuant to 18 U.S.C. Section 1350, as adopted pursuant to Section 906 of the Sarbanes-Oxley Act of 2002
|
|
101*
|
|
The following materials from The Gap, Inc.’s Annual Report on Form 10-K for the year ended February 1, 2014, formatted in XBRL (eXtensible Business Reporting Language): (i) the Consolidated Balance Sheets, (ii) the Consolidated Statements of Income, (iii) the Consolidated Statements of Comprehensive Income, (iv) the Consolidated Statements of Stockholders’ Equity, (v) the Consolidated Statements of Cash Flows, and (vi) Notes to Consolidated Financial Statements.
|
__________
|
(1)
|
Pursuant to a request for confidential treatment, portions of this Exhibit have been redacted and have been provided separately to the Securities and Exchange Commission.
|
* Filed herewith
83
TABLE OF CONTENTS
Part IItem 1. BusinessItem 1A. Risk FactorsItem 1B. Unresolved Staff CommentsItem 2. PropertiesItem 3. Legal ProceedingsItem 4. Mine Safety DisclosuresPart IIItem 5. Market For Registrant S Common Equity, Related Stockholder Matters and Issuer Purchases Of Equity SecuritiesItem 6. Selected Financial DataItem 7. Management S Discussion and Analysis Of Financial Condition and Results Of OperationsItem 7A. Quantitative and Qualitative Disclosures About Market RiskItem 8. Financial Statements and Supplementary DataNote 1. Organization and Summary Of Significant Accounting PoliciesNote 2. Additional Financial Statement InformationNote 3. AcquisitionNote 4. Goodwill and Other Intangible AssetsNote 5. Long-term DebtNote 6. Credit FacilitiesNote 7. Fair Value MeasurementsNote 8. Derivative Financial InstrumentsNote 9. Common StockNote 10. Accumulated Other Comprehensive IncomeNote 11. Share-based CompensationNote 12. LeasesNote 13. Income TaxesNote 14. Employee Benefit PlansNote 15. Earnings Per ShareNote 16. Commitments and ContingenciesNote 17. Segment InformationNote 18. Quarterly Information (unaudited)Item 9. Changes in and Disagreements with Accountants on Accounting and Financial DisclosureItem 9A. Controls and ProceduresItem 9B. Other InformationPart IIIItem 10. Directors, Executive Officers and Corporate GovernanceItem 11. Executive CompensationItem 12. Security Ownership Of Certain Beneficial Owners and Management and Related Stockholder MattersItem 13. Certain Relationships and Related Transactions, and Director IndependenceItem 14. Principal Accounting Fees and ServicesPart IVItem 15. Exhibits, Financial Statement Schedules